Embed Size (px)
Citation preview

Accepted Manuscript
Title: Electrochemical degradation of specialty chemicalindustry effluent
Authors: C. Ahmed Basha, P.A. Soloman, M. Velan, LimaRose Miranda, N. Balasubramanian, R. Siva
PII: S0304-3894(09)01790-7DOI: doi:10.1016/j.jhazmat.2009.10.131Reference: HAZMAT 10874
To appear in: Journal of Hazardous Materials
Received date: 22-8-2009Revised date: 24-10-2009Accepted date: 31-10-2009
Please cite this article as: C.A. Basha, P.A. Soloman, M. Velan, L.R. Miranda, N.Balasubramanian, R. Siva, Electrochemical degradation of specialty chemical industryeffluent, Journal of Hazardous Materials (2008), doi:10.1016/j.jhazmat.2009.10.131
This is a PDF file of an unedited manuscript that has been accepted for publication.As a service to our customers we are providing this early version of the manuscript.The manuscript will undergo copyediting, typesetting, and review of the resulting proofbefore it is published in its final form. Please note that during the production processerrors may be discovered which could affect the content, and all legal disclaimers thatapply to the journal pertain.

Page 1 of 43
Accep
ted
Man
uscr
ipt
1
Electrochemical degradation of specialty chemical industry effluent
C. Ahmed Basha1a
, P. A. Solomanb, M. Velan
b, Lima Rose Miranda
b, N.
Balasubramanianb, R. Siva
b
aCentral Electrochemical Research Institute (CSIR), Karaikudi-630 006, Tamilnadu,
India.
bDepartment of Chemical Engineering, A.C. Tech Campus, Anna University-Chennai,
Chennai-600 025, India
Abstract
Conventional wastewater treatment techniques are inefficient to manage large
quantities of refractory organics discharged by specialty chemical industries. It is aimed
in the present investigation to the compare overall performance of the basic
electrochemical reactor configurations such as batch, batch recirculation and continuous
recycle reactors, in removing the organic part of wastewater from a medium-scale,
specialty chemical industry. The effects of current density, supporting electrolyte
concentration, electrolysis duration and fluid flow rate on the pollutant removal and
energy consumption performances were critically evaluated. Continuous recycle reactor
is found to be the better configuration, because of its flexibility of operation. Circulation
flow rate and withdrawal flow rate enable control on transfer coefficients and treatment
duration respectively. The ability of artificial neural network (ANN) in predicting the
performance of the batch electrochemical treatment has also been demonstrated.
Key words: Electrochemical; Specialty chemical industry; Wastewater; Artificial neural
network; Recycle reactor
1 Corresponding author: Tel +91 4565 227550; Fax: +91 4565 227713, Mobile: 9994221103
[email protected], [email protected], (C.Ahmed Basha)
*Revised Manuscript

Page 2 of 43
Accep
ted
Man
uscr
ipt
2
1. Introduction
Treatment and safe disposal of bio-refractory pollutants in an environmentally
acceptable manner is a topic of universal importance. Speciality chemical industries
require large volumes of water of high purity and discharge large quantities wastewater
containing number of refractory organics pollutants. The wastewater is complex and
highly variable with respect to its nature, containing high levels of chemical oxygen
demand (COD around 48000 mg L-1
), dissolved solids, a low level of biochemical
oxygen demand, a considerable amount of total organic halogen and intense colour. The
most extensively applied biological treatment often fail due to the fact that many organic
substances produced by the chemical and related industries are inhibitory, toxic or
resistant to biological treatment. Feasibility of the various advanced oxidation processes
based on ozone [1], hydrogen peroxide [2], hydrogen peroxide/ ferrous ion catalyst (the
so called Fenton’s reagent) [3], UV radiation [4], sonochemical [5], and their
combinations such as ozone/UV [6], Fenton /UV [7], ozone/UV/hydrogen peroxide [8]
etc., for handling such pollutants are in investigation and their application in large scale
operation in still questionable.
Various electrochemical treatments such as electro-coagulation, electro-oxidation
etc. has also been studied for handing these class of pollutants [9, 10]. The performance
comparison of the various electrochemical techniques and advanced oxidation processes
is of utmost interest of many researchers [11-13]. Electrochemical techniques have been
receiving greater attention in recent years due to their distinctive advantages such as,
environmental compatibility; (the main reactant is the electron which is a clean reagent)

Page 3 of 43
Accep
ted
Man
uscr
ipt
3
and versatility (a plethora of reactors and electrode materials, shapes, and configurations
can be utilized). It is noteworthy that the same reactor can be used frequently for different
electrochemical reactions with only minor changes and also the electrolytic processes can
be scaled easily from the laboratory to the plant, allowing treatment volumes ranging
from milliliters to millions of liters. Electrochemical methods are generally safe because
of the mild conditions and innocuous nature of the chemicals usually employed.
Electrodes and cells can be designed to minimize power losses due to poor current
distribution and voltage drops and making the processes more competitive in energy
consumption than the conventional techniques [14].
Development of phenomenological or empirical/semi-empirical equations is
always time consuming and usually has low accuracy in prediction. In this context, soft
computing technique like artificial neural network (ANN) provides an efficient
alternative. ANN has become increasingly recommended for applications where the
mechanistic description of the interdependence between variables is either unknown or
very complex. One of the characteristics of modeling based on ANN is that it does not
require the mathematical description of the phenomena involved in the process, and
might therefore prove useful in simulating and up-scaling complex electrochemical
systems. The fundamental element of ANN is the processing elements called neurons.
ANN can learn the latent relationships between the inputs and outputs without prior
knowledge about functional relationship between them. ANN is more effective in
expressing the nonlinear relationships between the dependent and the independent
variables. In addition to these, the elasticity of ANN enables updating the network with
new data. The processing style of neural network is parallel and there is no strict rule or
Page 4 of 43
Accep
ted
Man
uscr
ipt
4
algorithm to follow. Further, ANNs are known as universal function approximators and
they try to provide a tool that both programs learn on their own. Provision of model free
solutions, data error tolerance, built in dynamism and lack of any exogenous input
requirement makes ANN attractive [15].
In the present investigation electrochemical degradation methodology has been
applied in a batch, batch recirculation and continuous recycle modes in managing the
wastewater discharged by a typical medium scale speciality chemical industry. The
purpose behind the investigation is not to treat the effluent in the methodology
recommended, but to estimate the energy demanded by such a treatment so that a
protocol similar to the logical flow chart illustrated in Figure 1 can be devised with the
knowledge of specific energy/charge required for complete mineralization of this heavily
loaded effluent (This may not be economically viable if electrochemical degradation
methodology alone followed because of the energy consumption). The alternative
technique is integrating the electrochemical degradation (for improvement of
biodegradability [9]) with conventional techniques such as biological treatment might be
well accepted. The potential of ANN in predicting the performance of the batch
electrochemical treatment has also been demonstrated. It is possible to predict the extent
of removal of COD by feeding the factors such as current density, time and supporting
electrolyte concentration. This is useful in design and scale-up of the process.
2. Materials and methods
The effluent was collected from M/s Sanmar Speciality Chemicals Limited,
Berigai, Hosur, Tamil Nadu, India. This medium-scale unit manufactures performance
chemicals for flavours and fragrances, resins, polymers, elastomers and intermediates for

Page 5 of 43
Accep
ted
Man
uscr
ipt
5
complex phytochemicals extracted from plants such as aloe vera, sunflower etc. The unit
generates effluent around 35,000 L per day containing industrial solvents such as
benzene, ethylbenzene, toluene, xylene and hexane and sodium chloride (used for
cleaning the equipments and the processing units). Physicochemical characterization of
the effluent was carried out. The effluent was found dark brown colored and almost
neutral (pH: 7.3). Major portion of the solids were appeared in suspension, 6300 mg L-1
(dissolved solids: 156 mg L-1
) and found heavily loaded organic matter especially in
dissolved form (COD: 48000 mg L-1
). The low value of its BOD5 (1100 mg L-1
,
biodegradability index: 0.023) indicates the inappropriateness of the conventional
biological treatment.
The effluent was distilled at atmospheric pressure in a simple distillation set-up in
order to measure the contribution of volatile part in the pollution load (Being the case of
removal of volatile part, this operation can be practiced in a solar evaporation set-up).
The COD of distillate was measured 17750 mg L-1
with a distillate- residue weight ratio
of 4. BOD5 of the distillate is found almost zero. The semi solid appeared residue, after
removal of the crystallised salt, was so concentrated in organic matter that it can be
burned with the starting support of fuel. The electrochemical degradation of the distillate
is examined in the present investigation. All the chemicals used in the study were of
analytical reagent (AR) grade. COD of the samples was determined using the dichromatic
open reflux method, strictly following the APHA [16]. Experiments were repeated until
the difference found less than 3 %. Electrochemical experiments were carried out using
Ti/RuOx–TiOx coated titanium substrate insoluble anode (TSIA) [17] and stainless steel
cathode.

Page 6 of 43
Accep
ted
Man
uscr
ipt
6
2.1 Treatment in batch mode
Experimental set-up of the batch reactor used for electrochemical degradation
studies consists of a Perspex cylinder of 500 ml capacity (diameter: 8 cm, height: 11 cm)
with a PVC lid having the provision to fit a pair of electrodes. Provisions were also made
in the lid for periodic sampling. A rectangular, stainless steel flat plate and a rectangular
flat expanded mesh of titanium (catalytic oxide coated) of dimensions 5.5 cm x 6.5 cm,
were functioned as the cathode and the anode respectively. The plates were arranged
parallel to each other with an inter-electrode gap of 10 mm. The void fraction of the mesh
type anode was 20 % by area, which resulted in an effective area of 25.52 cm2 (dipped
area: 5.5 cm x 5.8 cm). The electrodes were connected to a 5 A, 10 V DC regulated
power supply, through an ammeter and a voltmeter. The preliminary batch experiments
on COD removal were conducted to find the influencing parameters and their
experimental domain. The wastewater was prepared for improvement of its ionic
conductivity by adding the required amount of sodium chloride. Since the pH of the
effluent was found to be less in influencing the response (comparatively better at neutral)
during the preliminary runs, no adjustment was done. The electrode plates were cleaned
manually by washing them in distilled water prior to every run. The electrodes were
placed in the required volume (200 mL) of wastewater taken in the cell such a way that
25.52 cm2 of active surface of the anode immersed. The solution was constantly stirred at
200 rpm using a magnetic stirrer in order to maintain uniform concentration. DC power
supply was given to the electrodes according to the required current density and the
experiments were carried out under constant current conditions. The efficiency of the
batch electrochemical reactor in removing the organic part of the effluent (measured

Page 7 of 43
Accep
ted
Man
uscr
ipt
7
through COD) was studied at various conditions of current density (up to 5.0 A dm−2
),
supporting electrolyte concentration (up to 6 g L-1
) and electrolysis duration (up to 10 h).
Separate experiments were conducted for the development of ANN model. Totally, 125
data were collected in random combination of factors within the experimental domain
(current density: 2- 7 A dm-2
; electrolysis time: 2- 10 h; and supporting electrolyte
concentration: 2- 7 g L-1
).
2.2 Treatment in batch recirculation mode
The experimental set-up of batch-recirculation/ recycle mode of operation used
for the electrochemical degradation studies is schematically represented in Figure 2. By
adjusting of the valves the same set-up can be operated either in batch recirculation or
recycle modes (i.e., for batch recirculation mode of operation, streams 10 and 12 will be
in closed condition). The electrochemical reactor is of filter press type of 700 mL
capacity. Two stainless steel rectangular flat plates and one rectangular flat expanded
mesh of Ti/RuOx–TiOx coated titanium substrate insoluble anode (TSIA) were functioned
as cathodes and anode respectively (see Figure 2). The plates were arranged parallel to
each other with a constant inter electrode gap of 12 mm, anode being at the centre. The
void fraction of the mesh type anode accounts 20 % by area, which resulted in an
effective anode area of 290 cm2 ( 25 cm × 14.5 cm). Electrodes were connected to a 10
A, 25 V DC regulated power supply in mono-polar mode, through an ammeter and a
voltmeter. The other components of the set-up being a reservoir of 5.0 L capacity, a
magnetically driven self-priming centrifugal pump and a rotameter, connected using
silicone rubber tubes.

Page 8 of 43
Accep
ted
Man
uscr
ipt
8
The batch effluent volume considered for every experimental runs was 2.0 L
adjusted with supporting electrolyte concentration (5 g L-1
). Required flow rate through
the reactor was established by pumping and adjusting the valves. The effluent enters the
cell through a bottom connection provided at the gap between the anode and one of the
cathode, passes through the perforations in the anode mesh plate to reach the other
chamber and leaves through the outlet connection situated at the top position of the
chamber. The flow rate of the effluent was measured by using a calibrated rotameter.
After reaching the steady-state flow, DC power supply was given to the electrodes
keeping constant current at the required level and for the set duration of electrolysis.
Samples were collected from the reservoir for estimation of COD. Experiments were
conducted for the cases of circulation flow rates varying from 20 to 100 L h-1
for two
current densities of 4 and 5 A dm-2
.
2.3 Treatment in recycle mode
The experimental set-up of the recycle mode of operation is schematically
represented in Figure 2. Wastewater dissolved with 5 g L-1
sodium chloride was filled in
the reservoir. The required recycle flow rate, Q and withdrawal flow rate (q) was
established by pumping and adjusting the valves. The wastewater inlet flow rate was
adjusted to reach steady state reservoir level. Keeping the recycle flow rate (Q) constant
20 L h−1
the inlet/discharge flow rate (q) was varied (1- 6 L h−1
). DC power supply was
connected to the electrodes keeping a constant current for the required current density of
4 A dm-2
. Samples were collected from the exit stream for each experimental condition
for estimation of COD.
2.4 Artificial Neural Network

Page 9 of 43
Accep
ted
Man
uscr
ipt
9
Most applications require networks that contain at least three normal types of
layers—input, hidden and the output. The number of the layers and processing elements
in the layers vary from one process to another. The user must determine the optimal
number of layers and neurons. Generally, the number of layers and processing elements
are defined by trial and error. Back-propagation method is a first order gradient method
of ANN. The training of back-propagation neural network consists of two phases: a
forward pass during which the processing of information occurs from the input layer to
output and a backward pass when the error from the output layer is propagated back to
the input layer and the interconnections are modified [18].
In the present study, feed-forward ANN model is designed in back-propagation
training algorithm using the Neural Network Toolbox of MATLAB 7. The number of
neurons in input and output layers depends on independent and dependent variables,
respectively. Since one dependent variable- percentage removal of COD; depend on three
variables- current density, electrolysis duration and supporting electrolyte concentration;
one and three neurons were devoted to output and input layers respectively. All inputs
and outputs were linearly normalized before entering in ANN, using the following
equation [19]:
minminmax
minmax
minii r)r(r
)X(X
)X(XA
(1)
where Xi is input or output of the network, Ai is the normalized value of Xi, Xmin and Xmax
are extreme values of Xi, and rmin and rmax define the limits of the range where Xi is
scaled. In this work, input and output data are normalized between –1 and 1; and 0.2 and
0.8 respectively. After modeling, results were converted to original state.

Page 10 of 43
Accep
ted
Man
uscr
ipt
10
Neural Network Toolbox of MATLAB 7 allows selecting the network type,
number of hidden layers and hidden layer neurons, iterations during the model training
and transfer functions. The non-linear function chosen was tan-sigmoid. The training
algorithm used was Levenberg- Marquart and other parameters for network were chosen
as the default values of the software. Weights were initialized with random values for
training. Optimal network topology was determined by developing several networks that
vary only with the size of hidden layer and simultaneously observing the change in the
standard error.
3. Theoretical approach- Electro-oxidation
The mechanism of electrochemical oxidation of wastewater is a complex
phenomenon involving the coupling of electron transfer reaction with a dissociate
chemisorption step. Basically two types of oxidative mechanism may occur at the anode;
in the case of an anode with high electro-catalytic activity, oxidation occurs at the
electrode surface, called direct electrolysis; in the other instances, for example metal
oxide electrode, oxidation occurs via the surface mediator generated continuously on the
anodic surface, called indirect electrolysis. In direct electrolysis, the rate of oxidation is
depending on electrode activity, pollutants diffusion rate and current density. The
electrochemical conversion/combustion of organics on noble oxide coated catalytic anode
(Ti/RuOx-TiOx) can be explained as follows. In the first step, H2O is discharged at the
anode to produce adsorbed hydroxyl radicals according to the reaction,
(RuOx-TiOx) + H2O (RuOx-TiOx)( OH) + H+
+ e- (2)

Page 11 of 43
Accep
ted
Man
uscr
ipt
11
In the second step, the adsorbed hydroxyl radicals may interact with the oxygen
already present in the oxide anode with possible transition of oxygen from the adsorbed
hydroxyl radical to the oxide to form the higher oxide (RuOx-TiOx+1).
(RuOx-TiOx)( OH) (RuOx-TiOx+1) + H+ + e
- (3)
At the anode surface, active oxygen can be present in two states, either as
physisorbed adsorbed hydroxyl radicals, ( OH) or/and as chemisorbed (oxygen in the
lattice, (RuOx-TiOx+1). In the absence of oxidizable organics, the active oxygen produces
dioxygen according to the following reactions:
(RuOx-TiOx)( OH) (RuOx-TiOx)+1/2O2+ H++e- (4)
(RuOx-TiOx+1) (RuOx-TiOx)+1/2O2 (5)
When NaCl is used as supporting electrolyte, chloride ion may anodically react
with (RuOx-TiOx)( OH) to form adsorbed -OCl radicals according to the following
reaction,
(RuOx-TiOx)( OH) + Cl- (RuOx-TiOx)( OCl) + H
++2e
- (6)
Further, in presence of chloride ion, the adsorbed hypochorite radicals may
interact with the oxygen already present in the oxide anode with the possible transition of
oxygen from the adsorbed hypochlorite radical to the oxide, to form the higher oxide
(RuOx-TiOx+1) according to the reaction given below. Simultaneously (RuOx-TiOx)( OCl)
can react with the chloride ion to generate active oxygen (dioxygen) and chlorine
according to the following reactions:
(RuOx-TiOx)( OCl) + Cl-
(RuOx-TiOx+1)+Cl2+e- (7)
(RuOx-TiOx)( OCl) + Cl-
(RuOx-TiOx)+½O2 + Cl2+e- (8)

Page 12 of 43
Accep
ted
Man
uscr
ipt
12
In the presence of oxidizable organics, the physisorbed active oxygen (.OH) can
cause predominantly the complete combustion of organics and chemisorbed will
participate in the formation of selective oxidation [20, 21] products according to the
following reactions:
½ R+ (RuOx-TiOx)(.OH) ½ ROO+ H
+ + e
- + (RuOx-TiOx) (9)
R+ (RuOx-TiOx+1) RO + (RuOx-TiOx) (10)
The physisorbed route of oxidation is the preferable way for waste treatment.
Since, the organic hydrogen peroxides formed are relatively unstable; decomposition of
such intermediates will lead to molecular breakdown and the formation of subsequent
intermediates with lower carbon numbers. These sequential reactions will continue until
the formation of carbon dioxide and water [22, 23]. In this case, the diffusion rate of
organics on the anode area controls the combustion rate [24, 25]. On the other hand,
temperature, pH and diffusion rate of generated oxidants determine the rate of oxidation
in indirect electrolysis. In the same way indirect electrochemical oxidation mechanism
has been proposed for metal oxide with chloride as the supporting electrolyte for
wastewater treatment [26-28]. The reactions of anodic oxidation of chloride ions to form
chlorine in bulk solution as given by equations (7) and (8) further proceeds as follows
2Cl- 1k
Cl2 + 2e- (11)
Cl2 + H2O 2kH
+ + Cl
- + HOCl (12)
HOCl 3
3'
k
k H
+ + OCl
-
(13)
Organic + OCl- 4k
CO2 + H2O + Cl- (14)

Page 13 of 43
Accep
ted
Man
uscr
ipt
13
Since organic compounds of the effluent are electrochemically inactive, the
primary reaction occurs at the anodes is chloride ion oxidation [equations (7) and (8)]
with the liberation of Cl2, which is a robust oxidizing agent. As regards the reactions in
bulk, gaseous Cl2 dissolves in the aqueous solutions due to ionization as indicated in
equation (12). In cathode the following reactions takes place
O2HH2eO2H 22
-
3 pH>7 (15)
-
2
-
2 2OHH2eO2H pH<7 (16)
The rate of bulk reaction is less in acidic solution due to OH- instability and
considerably more in basic solution due to the ready formation of OCl- (pKa 7.44) ion in
equation (13) implying that the basic or neutral pH conditions are more favorable for
conducting reactions involving chlorine. The rate of direct electro-oxidation of organic
pollutants depends on the catalytic activity of the anode, the diffusion rate of the organic
compounds in the active points of anode and applied current density. The indirect electro
oxidation rate of organic pollutants depends on the diffusion rate of the oxidants into the
solution, flow rate of the effluent, temperature and the pH. In moderate alkaline solutions,
a cycle of chloride-chlorine-hypochlorite-chloride takes place, which produces OCl-. The
pseudo-steady state theory can be applied to each of the intermediate products (HOCl and
OCl-) in the bulk solution. The rate of reaction of the components can be written as
][Clkr 22Cl2 (17)
0]][OCl[Hk[HOCl]k][Clkr ,
3322HOCl (18)
0]OCl[organic][k]][OCl[Hk[HOCl]kr 4
,
33OCl (19)
]OCl[organic][kr 4organic (20)

Page 14 of 43
Accep
ted
Man
uscr
ipt
14
Then using the above equations we can easily deduce the following expression:
]OCl[organic][krr 4organicCl2 (21)
Finally as regard to bulk solution it is also to be noted that -rCl2 = rCl- from equation (12),
that is
]OCl[organic][kr][Clkrr 4organic22ClCl2 (22)
Where the rate of reaction ri and the rate constants ki (i=2, 3 and 4) are defined with
respect to the bulk. The rate expression for main electrode reaction as per equation (11)
can be written as
][Clkrr 1
,
Cl
,
Cl 2 (23)
where k1 is the heterogeneous electrochemical rate constant.
In the following section an attempt is made to establish a relation between the
reacting species in bulk and at the electrode surface. The basic relationship applicable to
all electrochemical reactions is Faraday’s law that relates to the amount of substance
reacted on the surface to the charge (IAt) passed, MAIAt/nF (assuming 100% current
efficiency) and the characteristic measurable parameter, current density, iA (defined as
IA/Ae). Thus, the electrochemical reaction rate (for the disappearance of reactant A) can
be expressed as
nF
i
dt
d[A]
A
V A
e
R (24)
where IA is the current passed in time t, MA is the molecular weight, n is the number of
electrons transferred per mole of reaction, Ae electrode area, VR reactor volume and F is
the Faraday constant (96,485.3 Coulomb/mol). It has to be noted that -rA= -d [A]/dt = iAa
Page 15 of 43
Accep
ted
Man
uscr
ipt
15
/nF where a is specific electrode area (Ae/VR). Assuming the main electrode reaction,
governed by a simple Tafel type expression,
[A]exp(bE)knF
i
dt
d[A]
A
V ,A
e
R (25)
Or ]exp(bE)a[Clk][Clkrr ,
11
,
Cl
,
Cl 2 (26)
The reaction may be assumed to be under diffusion control as the reacting species,
Cl- in the electrolyte is dilute. The reactant Cl
- is transported from the bulk to electrode
surface where it undergoes electrochemical oxidation to Cl2 and it may be transported
back to the bulk by diffusion reaction in the bulk. Then,
)][Cl]([ClkzF
isL
A (27)
Elimination of [Cl-]s using equations (17) and (18),
][ClkzF
i1
A (28)
Where exp(bE)ak
1
k
1
k
1,
L1
(29)
From a material balance of species Cl- by taking note of equations (13) and (14) we can
write
][ClkzF
i2
,A (30)
]OCl[organic][kzF
i ,,A (31)
During electrolysis, if constant current is applied, the rate of generation of [OCl-] will
remain constant under a given set of experimental condition, but will vary if the applied
current is altered. Then,

Page 16 of 43
Accep
ted
Man
uscr
ipt
16
kCk[COD][organic]kzF
iobs
A (32)
3.1 Batch Reactor
Adopting the same classification for the reactors as for conventional reactors, the
electrochemical reaction rate (for removal of COD) in batch reactor can be expressed as
CkzF
i
dt
dC
A
VL
A
e
R (33)
at)kexp(CC Lo (34)
Or integrated form atkC
Cln L
o
In electrochemical conversion, the high molecular weight aromatic compounds
and aliphatic chains are broken to intermediate products for further processing. In
electrochemical combustion, the organics are completely oxidized to CO2 and H2O. The
progress of the destruction of the organic pollutant was monitored by COD estimation.
The potentials required for oxidation of organic pollutants are generally high and the
production of oxygen from the electrolysis of water molecules may determine the
reaction yield. The current efficiency of the electrolysis can be calculated using the
following expression.
x100
2F
16It
10ΔCV(CE)EfficiencyCurrent
3
R (35)
Where ΔCis the difference in COD in mg L-1
, due to the treatment by passing I
current for t seconds. VR is volume of the reactor (liters). Q represents the volumetric
flow rate in L s-1
and F, Faraday’s constant. Current efficiency can be defined as the ratio
of milligrams of oxygen demand removed by the passage of a given charge of electrical

Page 17 of 43
Accep
ted
Man
uscr
ipt
17
energy to the equivalent milligrams of oxygen predicted by Faraday’s law. During
electrochemical degradation of organic matter COD removal is not due to oxidation by
molecular oxygen alone. A number of other strong oxidizing agents (as explained before)
are generated in situ which play major role in the destruction of the organic matter. So it
is not possible to expect the current efficiency figures in the range of 0 to 100 %.
While current efficiency indicates the fraction of the total current passed for the
targeted reaction, the term, specific energy consumption (SEC) is the quantity of energy
consumed in the process for a kg of COD to get digested. The term (in kW h kg-1
) for
batch reactor can be obtained using the equation,
Specific Energy Consumption (SEC) = 6
R
3 10VΔC
1
106003
VIt
(36)
where V represents the applied cell voltage in volts and the remaining terms are as
defined above.
3.2 Batch Reactor with recirculation mode
As the flow through the reactor only in axial direction and the dispersion number
is very low, plug flow exists in the present in case of flow reactor. It was arrived based on
residence time distribution (RTD) tracer experiment. An approximate model may be
described by a plug flow reactor (PFR) in which the reactions take place. A dynamic
material balances to each of component or species can be written as
phenomenachemicalphysicogeneratedor
ddisappearespeciesofmassofrate
output
massofrate
input
massofrate
reactortheinspecies
ofmasschangeofrate
The concentration variation of organic in the differential volume of reactor (see Figure 2)
can be written as

Page 18 of 43
Accep
ted
Man
uscr
ipt
18
,
L
,,
C akΔx A Δxx
CQ
t
CΔxA -
(37)
LHS represents the rate of change of COD in the differential volume of reactor,
A x where A is the cross section area of the reactor. The first term of the RHS is the net
rate of change of COD due to the bulk flow in the differential volume and Q is the
volumetric flow rate through the reactor. The last term in the right-hand side represents
the rate of degradation of organic contaminants the solution due to reaction.
Considering the reservoir to be a perfectly back-mix system, the mass balance of
the species across the reservoir can be written as:
QCQCdt
dCV ,
(38)
Further it can also be assumed that the reactor is under steady state condition as
dC’/dt = 0, and rewrite the equation (33) as
Q
AkCexp)aτkCexp(C eL
RL
, (39)
where a is specific electrode area (Ae/VR) and R is the residence time (VR/Q) in the
reactor. The mass balance equation can be solved after substitution of the expression for
C’, knowing the initial COD, the resultant equation can be written as
Ak
exp1τ
texp))aτkexp(1(
τ
texp
C
C L
RL
o Q
e (40)
where Co is the initial value of COD of waste water and is the residence time (V/Q) in
the reservoir.
It should be noted that the extent of degradation is defined as X= (Co - C)/Co. The
unconverted species (1-X), (or C/Co), decreases exponentially with time. According to

Page 19 of 43
Accep
ted
Man
uscr
ipt
19
equation (40), the slope of the plot of -ln (1-X) versus t, gives the value
τ/Ak
exp1 L
Q
e from which the value of kL, the rate transfer coefficient, may be
computed.
The current efficiency (CE) and specific energy consumption (SEC) figures for
flow reactors are obtained using the following expressions.
x100
2F
16I
10ΔCQ(CE)EfficiencyCurrent
3
(41)
Specific Energy Consumption (SEC) = 63 10QΔC
1
103600
VI
(42)
3.3 Recycle Reactor
For the recycle reactor system, streams 10 and 12 will be present and the material
balance around the reservoir will give concentration of the reactant entering the reactor
as,
1R
CRC
QCqCC
,
0
,
0 (43)
where q is the volumetric inlet/discharge flow rate, and R is the ratio, defined as R=q/Q
and Q, the bulk flow rate of the effluent circulating and entering the reservoir all the time.
The material balance around the reactor,
AkCexp)aτkCexp(C eL
RL
, (44)
where Q+q is the total flow of effluent passing through the reactor. In Equation (40)
substituting for C’ from the above expression, we get

Page 20 of 43
Accep
ted
Man
uscr
ipt
20
1R
R)Q(1
AkCexpRC
C
eL0
(45)
The above equation can be rearranged in the following form.
RX)1)(1(R
X-1ln
R)Q(1
Ak eL (46)
According to equation (46), the slope of the plot RX)1)(1(R
X-1ln versus
1/(1+R)Q, gives the value kLAe from which the value of kL, the rate transfer coefficient,
may be computed for the given conversion in the recycle reactor.
4. Results and discussions
The results of the experiments carried out are presented in Figures 3 to 6.
Preliminary batch experiments show that the electrolysis time, supporting electrolyte
concentration and current density considerably influence the performance of the process.
Process performance is defined in two ways, one with respect to the extent of reaction
completion (X or % COD removal) of the process and the other with respect to the
specific energy consumption, SCE (kW h kg-1
) in the process. Rate of the process,
determined by the current density (equation 32), is evaluated in terms of the
heterogeneous rate constant kL (cm s-1
) by monitoring the extent of COD removal. The
energy consumption is also defined in two ways. The current efficiency (CE)
computation indicates the path and course of the targeted reaction by monitoring the
extent of COD removal (equation 35). The actual utilization of energy in fulfilling unit
quantity of the targeted reaction (specific energy consumption, SCE, k W h (kg COD)-1
),
is found by monitoring the cell voltage and extent of COD removal (equation 36). The
results of detailed batch experiments are reported in Figures 3 to 4. Batch studies were

Page 21 of 43
Accep
ted
Man
uscr
ipt
21
useful in determining the operating parameters such as electrolysis duration, supporting
electrolyte concentration and current density giving better rector performance.
Figure 3a indicates the variation of the extent of the removal of organic
contaminants (in terms of COD) with electrolysis duration for various supporting
electrolyte concentrations at a current density of 4.0 A dm-2
. It can be seen from the
figures that the rate of change of completion of the process decreases exponentially as the
process progresses especially at situations of higher salt levels. The expected increase in
pollutant removal performance beyond 8 hours of treatment is marginal. It can also be
observed from the figures that the supporting electrolyte plays a major role in the
degradation of the organic matter present in the wastewater. Even though the pollutant
removal performance of the system increases an increase in salt levels, the change in the
performance decreases as the salt concentration increases. As can be read from Figure 3b,
increase in supporting electrolyte concentration from 1 to 2 g L-1
resulted in an
improvement from 48.6% to 63.7% in COD removal after 10 h of treatment. But the
same improvement was very less (from 78.6% to 79.1%) due to an increase in the
supporting electrolyte concentrations at higher levels, i.e., from to 5 to 6 g L-1
. The
performance of the process due to salt concentration was found to improve only
marginally beyond 5 g L-1
. Since the post-treatment for removal of the dissolved
inorganic substances is cumbersome, the salt level in the wastewater has to be limited.
Moreover, current density is a direct measure of the energy consumption of the process
and thus, has to be limited for better overall economics of the process.
The trend of heterogeneous rate constant kL (cm s-1
) with respect to the variation
of current density and supporting electrolyte concentration was also studied in batch
Page 22 of 43
Accep
ted
Man
uscr
ipt
22
mode of operation. There is a marked improvement in the value of kL with an increase in
salt concentration, especially at lower salt levels (1.45×10⁻⁴
cm s-1
at 1 g L-1
to 2.21×10⁻⁴
cm s-1
at 2 g L-1
), probably due to the generation of more oxidizing agents from the
additional amount of salt added in the effluent. With the addition of extra salt, the
controlling step of the process might have changed over from a condition of limiting
oxidizing agents to any other limiting condition, such as limiting organic species. As can
be seen in Figure 3b, an increase in salt concentration improves the specific energy
consumption of the process, especially at lower salt concentrations. This may be due to
the improved ionic conductance of wastewater.
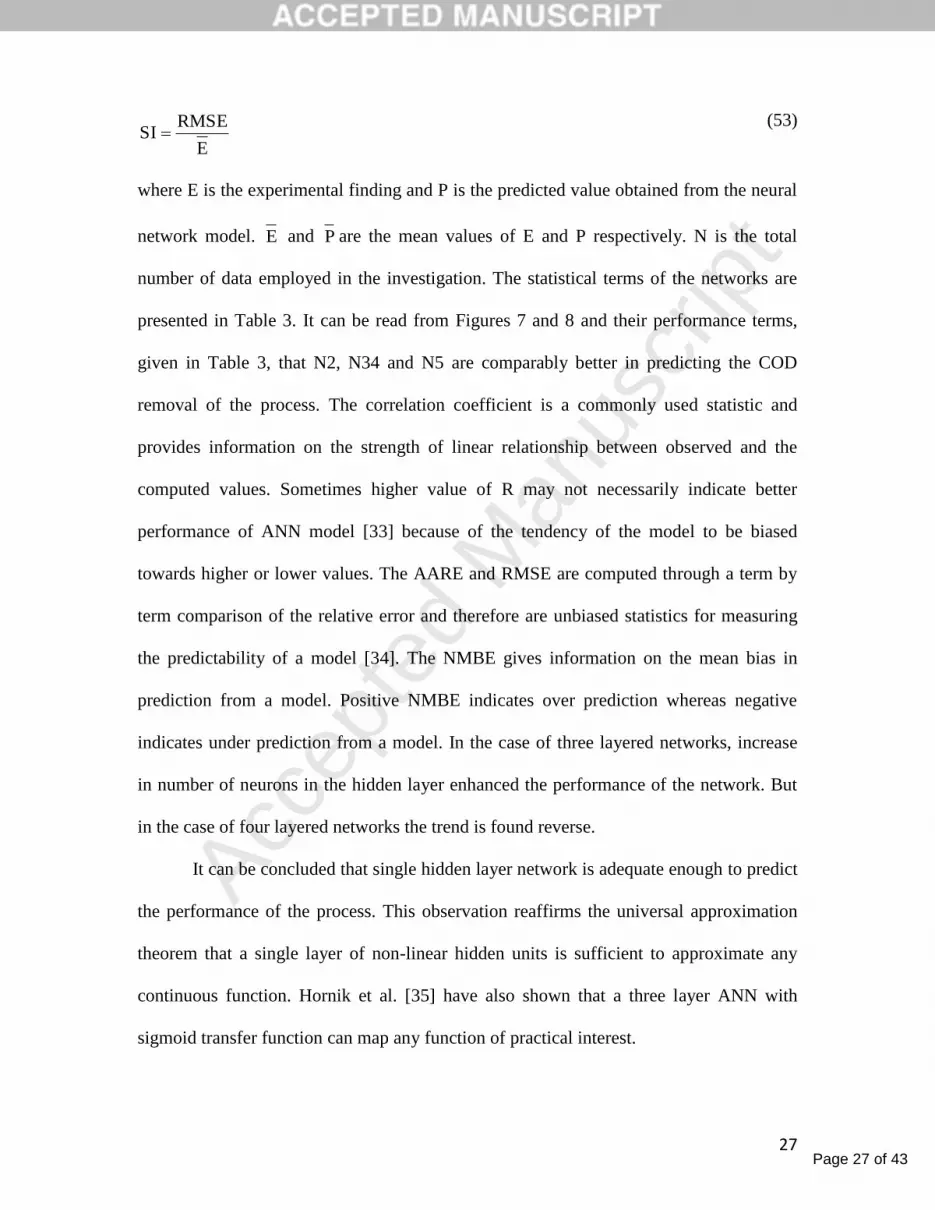
The effect of current density on the performance of the process is also studied; the
results are presented in Figure 4a and 4b. Both the figures shows that the improvement in
process performance is marginal for current density more than 4 A dm-2
. It was also
noticed that an increase in current density increases the specific energy consumption. The
possibility of loss of electrical energy in the form of heat and for unwanted reactions is
more at high levels of current density. Thus, in general, a higher current density operation
will give high capacity utilization, at the expense of more energy loss.
In this investigation, for indirect electrochemical degradation of organic
contaminants, the current efficiencies increased above 100%. In the electrochemical
degradation of pulp and paper mill wastewater, Mishra et al. [29] had reported current
efficiencies ranging from 400 to 500% and others [30] reported current efficiency
increases above 100%. Again it should be noted that COD is not a chemical compound to
follow Faraday’s law in a thermodynamic sense. These higher value efficiencies may
only indicate that there exists a large chemical reaction and physical processes such as
Page 23 of 43
Accep
ted
Man
uscr
ipt
23
adsorption to contribute to COD reduction. Here formation of such as chlorine (Cl2),
hypochlorite (OCl-), and chlorate (ClO3
-) may occur and these intermediate products may
chemically oxidize organic contaminants of effluent in a long period of electrolysis.
4.2 Batch Reactor with recirculation mode
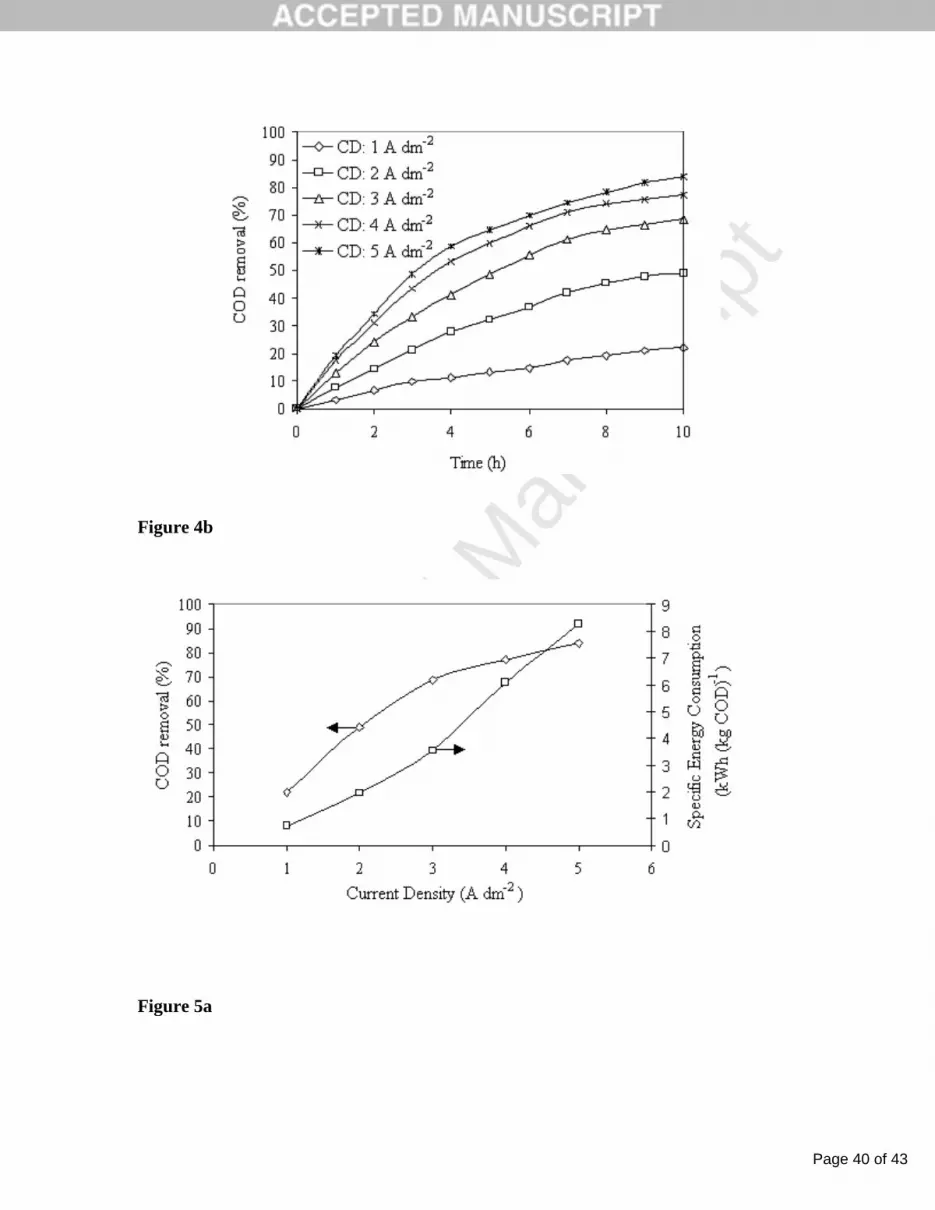
Dynamic response of the COD removal performance of the system was studied at
various flow rates, Q at constant conditions of current density (4 A dm-2
), supporting
electrolyte concentration (5 g L-1
) and initial COD (17750 mg L-1
); the result is presented
in Figure 5a and 5b. There is an increase in percentage of COD removal of the process
with respect to time as shown Figure 5a. The improvement in process performance after
7 hours of operation is marginal. It can also be seen in the figure that the pollutant
removal performance of the system improves considerably with an increase in the flow
rate. As can be seen in Figure 5b, the COD removal of the system after 7 h of operation
was found to be 65.3 % and 82.7 % at circulation flow rates of 20 L h-1
and 100 L h-1
respectively at a current density of 4 A dm-2
. This may because of the enhancement of
the transfer coefficient at higher flow rates. Pollutant removal performance and energy
consumption performance of the system was studied with respect to the variation of flow
rates for treatment duration of 7 hours at constant conditions as explained above; the
results are presented in Figure 5b.
The improvement in COD removal (65.3 to 82.7 %) resulted in considerable
improvement in current efficiency, CE (95.6 to 121.1 %) and specific energy
consumption, SCE (15.06 to 12.45 kW h kg-1
) figures of the system when the flow rate
(Q L h-1
) increased from 20 L h-1
to 100 L h-1
at a current density of 4 A dm-2
. This may
because of the improved ionic conductivity by bulk movement and with the reduction of

Page 24 of 43
Accep
ted
Man
uscr
ipt
24
resistance on the electrode surface. The quantity of pollutant removed as been improved
by 3.8 times; by this change in flow rate. It has been tried to correlate the mass transfer
coefficient with the velocity of effluent flowing through the reactor, in the form,
n
L umk (47)
By graphical solution of the above equation the values of m and n are obtained as
4.44 and 0.362 respectively for operation at a current density of 4 A dm-2
. This
observation indicates that the kL for the flow channel may be expressed theoretically
using a Leveque-type equation [31] in which kL is dependent on u0.33
.
4.3 Recycle Reactor
The pollutant removal and energy consumption performance of the recycle reactor
was studied for various influent/ withdrawal flow rates (q, L h-1
) at a recycle flow rates
(Q, L h-1
) of 20; the results are presented in Figure 6. An increase in withdrawal flow
rate decreases the COD removal. The percentage of COD removals reported at 1 L h-1
and 6 L h-1
are reported as 21 % and 5.3 % respectively. This may be due to the shorter
residence time at higher withdrawal flow rates. The improvement in the power
consumption at higher withdrawal flow rates can be seen in Figure 6. There is
considerable increase in the value of kL as the withdrawal flow rate increases (0.009 cm s-
1 at 1 L h
-1 to 0.056 cm s
-1 at 6 L h
-1). In general, the operation of the reactor at higher
withdrawal flow rates provides better capacity utilization with better energy figures, but
at the expense of poor completion of the process. When compared with batch
recirculation reactor, recycle reactor performance is found to be attractive on power
consumption figures and heterogeneous rate constant. Recycle reactor is found to be
better configuration, because of its flexibility of operation. Circulation flow rate and

Page 25 of 43
Accep
ted
Man
uscr
ipt
25
withdrawal flow rate enable control on transfer coefficients and treatment duration
respectively. Thus the recycle reactor is more apt for process integration.
4.4 Artificial Neural Network
In order to demonstrate use of ANN in predicting the performance of batch
electrochemical reactor, six numbers of back propagation neural networks, BPNN (see
Table 1) have been tested and the results are presented in Table 2 and 3 and Figures 7 and
8. Various neural networks were selected based on the number of weights to be
determined and the available number of data for training [32]. Table 1 shows the
configurations of the networks studied- three numbers of single hidden layer cases and
three numbers of double hidden layers cases were considered for the investigation.
Totally, 125 data were collected in random combination of factors in the experimental
domain for the development of ANN model. The one combination of variables, given
complete COD removal, was not considered for the ANN analysis. The remaining 124
experimental data were randomly divided into two sets. One set, 100 nos., was used for
training and the other, 24 data, was used for testing the model.
Several iterations were conducted with different numbers of neurons of hidden
layer in order to determine the best ANN structure. The trial started with the case of
single hidden layer. The number of neurons in the hidden layer is varied for 3, 7 and 9;
the corresponding networks are notated N1, N2 and N3 respectively. The least standard
error value and a good prediction of the outputs of both training and validation sets were
obtained with 7 neurons in the hidden layer (N2). The cases of 10 and more neurons in
the hidden layer were not giving consistent results.
Standard error is defined by

Page 26 of 43
Accep
ted
Man
uscr
ipt
26
2
2
2
)x(x
])y)(yx(x[)y(y
2)(n
1
(48)
The performance of ANN models of two hidden layer cases, 3-3-3-1, 3-3-5-1 and
3-3-7-1 (notated N4, N5 and N6 respectively) were also studied. The test results along
with their performance terms such as slope, intercept, R2 and standard error are presented
in Table 2. Each network is tested for its ability in predicting the performance of the
process by comparing prediction with 51 numbers of experimental observations. The
results for three and four layered networks are presented in Figure 7 and 8 respectively.
The predictability of the network is again quantified in terms of standard statistical
performance evaluation measures such as correlation coefficient (R), average absolute
relative error (AARE), average root mean square error (RMSE), normalized mean bias
error (NMBE) and scatter index (SI), expressed as:
N
1i
N
1i
2
i
2
i
N
1i
ii
)PP()EE(
)PP)(EE(
R
(49)
N
1i i
ii 100E
)PE(
N
1AARE(%)
(50)
2
1N
1i
2
ijij )E(PN
1RMSE
(51)
100
EN
1
)PE(N
1
(%)NMBEN
1i
i
N
1i
ii
(52)
Page 27 of 43
Accep
ted
Man
uscr
ipt
27
E
RMSESI
(53)
where E is the experimental finding and P is the predicted value obtained from the neural
network model. E and P are the mean values of E and P respectively. N is the total
number of data employed in the investigation. The statistical terms of the networks are
presented in Table 3. It can be read from Figures 7 and 8 and their performance terms,
given in Table 3, that N2, N34 and N5 are comparably better in predicting the COD
removal of the process. The correlation coefficient is a commonly used statistic and
provides information on the strength of linear relationship between observed and the
computed values. Sometimes higher value of R may not necessarily indicate better
performance of ANN model [33] because of the tendency of the model to be biased
towards higher or lower values. The AARE and RMSE are computed through a term by
term comparison of the relative error and therefore are unbiased statistics for measuring
the predictability of a model [34]. The NMBE gives information on the mean bias in
prediction from a model. Positive NMBE indicates over prediction whereas negative
indicates under prediction from a model. In the case of three layered networks, increase
in number of neurons in the hidden layer enhanced the performance of the network. But
in the case of four layered networks the trend is found reverse.
It can be concluded that single hidden layer network is adequate enough to predict
the performance of the process. This observation reaffirms the universal approximation
theorem that a single layer of non-linear hidden units is sufficient to approximate any
continuous function. Hornik et al. [35] have also shown that a three layer ANN with
sigmoid transfer function can map any function of practical interest.

Page 28 of 43
Accep
ted
Man
uscr
ipt
28
This work addresses an important problem of electrochemical wastewater
treatment. The process is a reasonably well behaved electrochemical system, and we have
calculated reaction rate constants as a function of current, (so it is electrochemical
reaction rate constant) and as a function of flow rate (mass transfer limited rate constant).
With this information, the model will be able to predict the effect of flow rate, current,
concentration etc. on the current and energy efficiencies. Therefore, one may think the
need for ANN is not justified. The intention of the ANN section in the paper is just to
indicate that as and when the real effluent was collected from industry, experiments were
carried out and concept of ANN was applied and updated independently well before the
process mathematical description of the phenomena of started. Therefore this
methodology might prove useful in simulating and up-scaling still more complex
electrochemical systems.
5. Conclusions
Electrochemical degradation of wastewater from a medium-scale, specialty
chemical industry was investigated using Ti/RuOx-TiOx anode in various types of reactor
configurations such as batch, batch recirculation and continuous recycle systems. The
effect of important operating parameters such as current density, electrolysis time and
supporting electrolyte concentration on the pollutant removal and energy consumption
performance of these systems are critically examined.
Batch studies show the operating parameters as current density: 4 A dm-2
,
electrolysis duration: 6 h, supporting electrolyte concentration: 5 gm L-1
, as optimal for
better overall performance of the system. The pollutant removal performance of the
batch recirculation system was to improve considerably with an increase in the

Page 29 of 43
Accep
ted
Man
uscr
ipt
29
circulation flow rate. The improvement in COD removal (65.3 to 82.7 %) resulted in
considerable improvement in current efficiency, CE and specific energy consumption,
SCE (15.06 to 12.45 kW h kg-1
) figures of the system when the flow rate (Q L h-1
)
increased from 20 L h-1
to 100 L h-1
at a current density of 4 A dm-2
. When compared
with batch recirculation reactor, recycle reactor performance is found to be attractive on
power consumption figures and rate constant. Recycle reactor is found to be better
configuration, because of its flexibility of operation. Circulation flow rate and withdrawal
flow rate enable control on transfer coefficients and treatment duration respectively. Thus
the recycle reactor is more apt for commercial applications. The performance of COD
removal in the batch reactor is predicted using ANN. Single hidden layer feed forward
back propagation neural network is found adequate enough to predict the performance of
the process. Complete mineralization such a heavily loaded organic effluent can’t
anyway, be economically viable. The present investigation is helpful in estimating and
comparing the energy demanded by the conventional reactor configurations in destructing
the organic part of a typical high strength organic waste. The integration this environment
friendly treatment technique with other similar treatments such as biological treatment,
connected multiple units alternatively in series, for improvement of biodegradability,
with a fraction of the energy demanded by the electrochemical treatment will a viable
technique.
References
[1] N.C. Shang, Y.H. Yu, Toxicity and color formation during ozonation of mono
substituted aromatic compounds. Environ Technol 23 (2002) 43–52.
[2] S. Ledakowicz, M. Solecka, R. Zylla, Biodegradation, decolourisation and
detoxification of textile wastewater enhanced by advanced oxidation processes. J
Biotechnol 89 (2001) 175–184.

Page 30 of 43
Accep
ted
Man
uscr
ipt
30
[3] E. Chamarro, A. Marco, S. Esplugas, Use of Fenton reagent to improve organic
chemical biodegradability. Water Res 35 (2001) 1047–1051.
[4] S. Parra, S. Malato, C. Pulgarin, New integrated photocatalytic–biological flow
system using supported TiO2 and fixed bacteria for the mineralization of
isoproturon. Appl Catal B-Environ 36 (2002) 131–144.
[5] M.H. Entezari, C. P´etrier, A combination of ultrasound and oxidative enzyme: sono-
biodegradation of substituted phenols. Ultrason Sonochem 10 (2003) 241–246.
[6] J.B. Rodr´ıguez, A. Mutis, M.C. Yeber, J. Freer, J. Baeza, H.D. Mansilla, Chemical
degradation of EDTA and DTPA in a totally chlorine free (TCF) effluent. Water Sci
Technol 40 (1999) 267–272.
[7] J. Bandara, C. Pulgarin, P. P´erigner, J. Kiwi, Chemical (photo-activated) coupled
biological homogeneous degradation of p-nitro-o-toluene-sulfonic acid in a flow
reactor. J Photochem Photobiol A-Chem 111 (1997) 253–263.
[8] P. H¨orsch, A. Speck, F.H. Frimmel, Combined advanced oxidation and
biodegradation of industrial effluents from the production of stilbene-based
fluorescent whitening agents. Water Res 37 (2003) 2748–2756
[9] C.A. Basha, E. Chithra, N.K. Sripriyalakshmi, Electro-degradation and biological
oxidation of non-biodegradable organic contaminants. Chem Eng J 149 (2009) 25-
34.
[10] P. Cañizares, C. Sáez, J. Lobato, M.A. Rodrigo, Electrochemical treatment of 2,4-
dinitrophenol aqueous wastes using boron-doped diamond anodes, Electrochimica
Acta, 26 (2004) 4641-4650.
[11] P. Cañizares, R. Paz, C. Sáez, M.A. Rodrigo, Electrochemical oxidation of alcohols
and carboxylic acids with diamond anodes: A comparison with other advanced
oxidation processes, Electrochimica Acta, 5 (2008) 2144-2153.
[12] Minghua Zhou, Jianjian He, Degradation of azo dye by three clean advanced
oxidation processes: Wet oxidation, electrochemical oxidation and wet
electrochemical oxidation—A comparative study, Electrochimica Acta, 4 (2007)
1902-1910.
[13] M. Faouzi, P. Cañizares, A. Gadri, J. Lobato, B. Nasr, R. Paz, M.A. Rodrigo, C.
Saez, Advanced oxidation processes for the treatment of wastes polluted with azoic
dyes
Electrochimica Acta, 1, 5 ( 2006) 325-331.

Page 31 of 43
Accep
ted
Man
uscr
ipt
31
[14] Krishnan Rajeshwar, Jorge G. Ibanez, Environmental Electrochemistry
fundamentals and applications in pollution abatement, Academic press, San Diego,
California, 1997. p. 362-363.
[15] S. Rao, S. Mandal, Hind casting of storm waves using neural networks, Ocean
Engineering, 32 (2005) 667–684.
[16] L. S. Clesceri, A. E. Greenberg, A. D. Eaton, Standard Methods for the Examination
of Water and Wastewater, 20th edn, APHA, Washington, DC 1998.
[17] Subbiah P, Krishnamurthy S, Asokan K, Subramanian K and Arumugam V, An
improved process for the preparation of insoluble non-precious metal oxide anode
doped with platinum group metal oxide to be used in electrochemical processes.
Indian Patent 178184 (1990).
[18] M.A. Hussain, M. Shafiur Rahman, C.W. Ng, Prediction of pores formation
(porosity) in foods during drying: generic models by the use of hybrid neural
network, Journal of Food Engineering, 51 (2002) 239–248.
[19] S. Aber, N. Daneshvar, S.M. Soroureddin, A. Chabok, K. Asadpour-Zeynali, Study
of acid orange 7 removal from aqueous solutions by powdered activated carbon and
modeling of experimental results by artificial neural network, Desalination, 211
(2007) 87–95.
[20] M. Panizza, A.P. Michaud, G. Cerisola, C. Comninellis, Electrochemical treatment
of wastewater containing organic pollutants on boron doped diamond electrode:
prediction of specific energy consumption and required electrode area. Electrochem.
Commun. 3(7) (2001) 336-339.
[21] O. Simond, V. Schaller, C. Comninellis, Theoretical model for the anodic oxidation
of organics on metal oxide electrodes. Electrochim. Acta, 42 (1997) 2009–2012.
[22] G.R.P. Malpass, A.J. Motheo, Electro-oxidation of formaldehyde methanol solutions
on Ti/Ru0.3Ti0.7O2 electrodes using a filter-press cell. J. Appl. Electrochem. 31
(2001) 1351–1357.
[23] K. Bindu, S. Velusamy, C.A. Basha, R. Vijayavalli, Mediated electrochemical
oxidation of organic pollutants in wastewater treatment. Indian J. Environ Health 4
(2000) 185-191.
[24] S. Raghu, C.A Basha, Electrochemical treatment of procion block 5B using
cylindrical flow reactor- a pilot plant study. J. Hazard. Mater. 139(2) (2007) 381-
390.
[25] A. Buso, L. Balbo, M. Giomo, G. Farnia, G Sandona, Electrochemical Removal of
Tannins from Aqueous Solutions. Ind. Eng. Chem. Res. 39 (2000) 494-499.

Page 32 of 43
Accep
ted
Man
uscr
ipt
32
[26] C. Comninellis, C. Pulgarin, Electrochemical oxidation of phenol for wastewater
treatment using SnO2 anodes. J. Appl. Electrochem. 23 (1993) 108–112.
[27] D. W. Miwa, G.R.P. Malpass S. A. S. Machado, A. J. Motheo, Electrochemical
degradation of carbaryl on oxide electrodes, Water Res. 40 (2006) 3281-3289.
[28] G.R.P. Malpass, D. W. Miwa, D.A. Mortari, S. A. S. Machado, A. J. Motheo,
Decolorisation of real textile waste using electrochemical techniques: Effect of the
chloride concentration. Water Res. 41 (2007) 2969– 2977.
[29] Mahesh, S.; Prasad, B.; Mall, I. D.; Mishra, I. M. Ind. Eng. Chem. Res. 2006, 45,
2830.
[30] Chen, G. Sep. Purif. Technol. 2004, 38, 11
[31] Robertson, P.; Cettou, P.; Matic, D.; Schwager, F.; Strorck, A.; Ibl, N. In Electro
organic Synthesis Technology. Krumpelt, M., Weissman, E. V., Alkire, R. C., Eds.;
AIChE Symposium Series No. 185; New York, 1979; p 115.
[32] W. Sha, Comments on the issues of statistical modeling with particular reference to
the use of artificial neural networks, Applied Catalysis A: General, 324 (2007) 87-89.
[33] M.
[33] P. Phaniraj, A. K. Lahiri, The applicability of neural network model to predict flow
stress for carbon steel, Journal of Material Processing and Technology, 141 (2003)
219–227.
[34] S. Srinivasulu, A. Jain, A comparative analysis of training methods for artificial
neural network rainfall-runoff models, Applied Soft Computing, 6 (2006) 295–306.
[35] K. Hornik, M. Stinchcombe, H. White, K. Hornik, M. Stinchcombe, H. White,
Multilayer feed forward networks are universal approximators, Neural Networks, 2
(5) (1989) 359–366.
Captions for Tables
Table 1 Configurations of the neural networks studied
Table 3 Test of the ANN models
Table 3 Standard statistical evaluation during validation of the model performance

Page 33 of 43
Accep
ted
Man
uscr
ipt
33
Captions for Figures
Figure 1 The logical flow chart illustrating the technique of integrating Electro
Oxidation (for improvement of biodegradability) with conventional techniques
such as biological treatment for complete mineralization.
Figure 2 Experimental set-up of flow reactor: 1. Reservoir, 2. Pump, 3. Rotameter, 4.
Flow cell, 5. Anode, 6. Cathode 7. Digital voltmeter, 8. Digital ammeter, 9. D.
C. Regulated Power supply, 10. Treated wastewater outlet, 11. Recirculation
stream, 12. Wastewater inlet reactor. 13. Mechanical agitator. For batch
recirculation system stream 10 and 12 will be absent
Figure 3
The effect of supporting electrolyte concentration on performance of the
process in batch reactor. Conditions: Current density of 4 A dm-2
, Initial COD
17750 mg L-1
, pH 7, Specific electrode surface 0.128 cm-1
, Duration 10 h,
Volume of effluent treated 200 mL. a) Variation of COD removal (%) and b)
Variation of COD removal (%) and specific energy consumption.
Figure 4
The effect of current density on performance of the process in batch reactor. a)
Variation of COD removal (%) b) Variation of COD removal (%) and specific
energy consumption. (All conditions are same as Figure 3 except Supporting
electrolyte concentration 5 g L-1
)
Figure 5
Effect of current density and flow rate on the performance of the process in
batch recirculation reactor. a) Variation of COD removal (%) and b) Variation
of COD removal (%) and specific energy consumption. Conditions: Supporting
electrolyte concentration 5 g L-1
, Initial COD 17750 mg L-1
, pH 7, Volume of
effluent treated 2000 mL, Specific electrode surface 0.145 cm-1
.
Figure 6
Effect of withdrawal flow rate on the performance of recycle reactor.
Conditions: Current density 4 A dm-2
, Recycle flow rate 20 L h-1
and other
relevant conditions as in Figure 5.
Figure 7
Number of data points in five percentage deviation ranges for the case of three
layered networks in predicting the COD removal (%) in batch reactor
Figure 8
Number of data points in six percentage deviation ranges for the case of four
layered networks in predicting the COD removal (%) in batch reactor

Page 34 of 43
Accep
ted
Man
uscr
ipt
Table 1
BPNN abbreviation Configuration
N1 3-5-1
N2 3-7-1
N3 3-9-1
N4 3-3-3-1
N5 3-3-5-1
N6 3-3-7-1
Table(s)

Page 35 of 43
Accep
ted
Man
uscr
ipt
Table 2
CD Time Salt Expt, N1 N2 N3 N4 N5 N6
4.5 4.5 4.5 66.74 67.24 66.87 66.65 67.70 67.58 67.23
4.5 7 5.75 82.57 82.75 82.79 82.27 82.77 81.93 81.66
2 3.25 2 12.37 13.65 13.37 13.36 14.14 12.85 15.72
3.25 2 5.75 32.48 32.68 32.54 32.77 32.98 32.51 32.52
2 3.25 5.75 32.52 32.20 32.65 32.55 32.47 32.34 32.98
2 4.5 2 25.19 26.19 25.13 25.77 26.41 25.22 27.66
5.75 2 3.25 40.96 40.18 40.11 40.50 39.93 40.57 39.14
4.5 2 7 44.14 44.59 45.00 44.63 44.67 45.00 46.79
4.5 4.5 5.75 70.14 70.09 69.85 70.29 70.21 70.07 69.64
5.75 5.75 3.25 76.03 76.16 76.62 75.56 76.21 75.69 74.95
3.25 7 7 70.41 71.28 71.06 71.36 70.68 71.25 71.14
3.25 4.5 2 40.89 40.84 40.05 41.06 40.75 41.02 40.95
5.75 3.25 5.75 65.18 65.98 66.31 65.91 65.59 65.65 66.51
4.5 2 5.75 43.94 44.36 44.24 44.34 44.48 44.36 44.74
3.25 4.5 7 58.73 58.98 58.84 58.19 58.81 59.04 58.29
7 5.75 7 85.41 84.27 83.98 84.44 84.77 84.35 84.73
4.5 2 2 22.88 22.96 22.57 23.64 22.35 22.11 21.29
3.25 3.25 4.5 44.50 44.30 44.20 43.55 44.52 44.59 42.40
7 5.75 2 70.38 70.34 70.31 70.77 70.41 70.25 70.32
3.25 4.5 3.25 49.58 50.19 49.62 50.22 49.98 50.31 49.88
7 4.5 3.25 70.12 70.13 69.61 69.93 70.20 69.98 68.85
2 5.75 5.75 53.11 52.28 52.55 51.91 52.14 51.66 53.03
5.75 4.5 5.75 76.75 76.58 76.77 76.52 76.35 76.73 76.74
5.75 2 7 51.34 51.53 51.58 51.46 51.46 51.53 51.52
Slope 1.009 1.005 1.013 1.011 1.005 1.024
Intercept -0.87 -0.47 -0.98 -0.93 -0.49 -1.57
R2 0.997 0.998 0.998 0.998 0.998 0.995
Standard error 0.93 0.86 0.89 0.95 0.90 1.41

Page 36 of 43
Accep
ted
Man
uscr
ipt
Table 3
N1 N2 N3 N4 N5 N6
R 0.9982 0.9977 0.9979 0.9982 0.9982 0.9960
AARE (%) 1.1934 1.2313 1.2695 1.2575 1.2621 1.6128
RMSE 0.7624 0.8378 0.8322 0.8629 0.8641 1.1703
NMBE (%) -0.1694 0.0105 -0.2732 -0.5857 -0.5450 0.4632
SI 0.0129 0.0142 0.0141 -0.5857 -0.5450 0.4632

Page 37 of 43
Accep
ted
Man
uscr
ipt
Figure 1
Figure(s)

Page 38 of 43
Accep
ted
Man
uscr
ipt
Figure 2
Figure 3a

Page 39 of 43
Accep
ted
Man
uscr
ipt
Figure 3b
Figure 4a
Page 40 of 43
Accep
ted
Man
uscr
ipt
Figure 4b
Figure 5a

Page 41 of 43
Accep
ted
Man
uscr
ipt
Figure 5b
Figure 6

Page 42 of 43
Accep
ted
Man
uscr
ipt
Figure 7

Page 43 of 43
Accep
ted
Man
uscr
ipt
Figure 8