Embed Size (px)
Citation preview

Company name
hfy
June 2021 Sector: Chemicals
Specialty Chemicals
Investors are advised to refer through important disclosures made at the last page of the Research Report. Motilal Oswal research is available on www.motilaloswal.com/Institutional-Equities, Bloomberg, Thomson Reuters, Factset and S&P Capital.
Swarnendu Bhushan- Research Analyst ([email protected]) Sarfraz Bhimani, CFA – Research Analyst ([email protected])
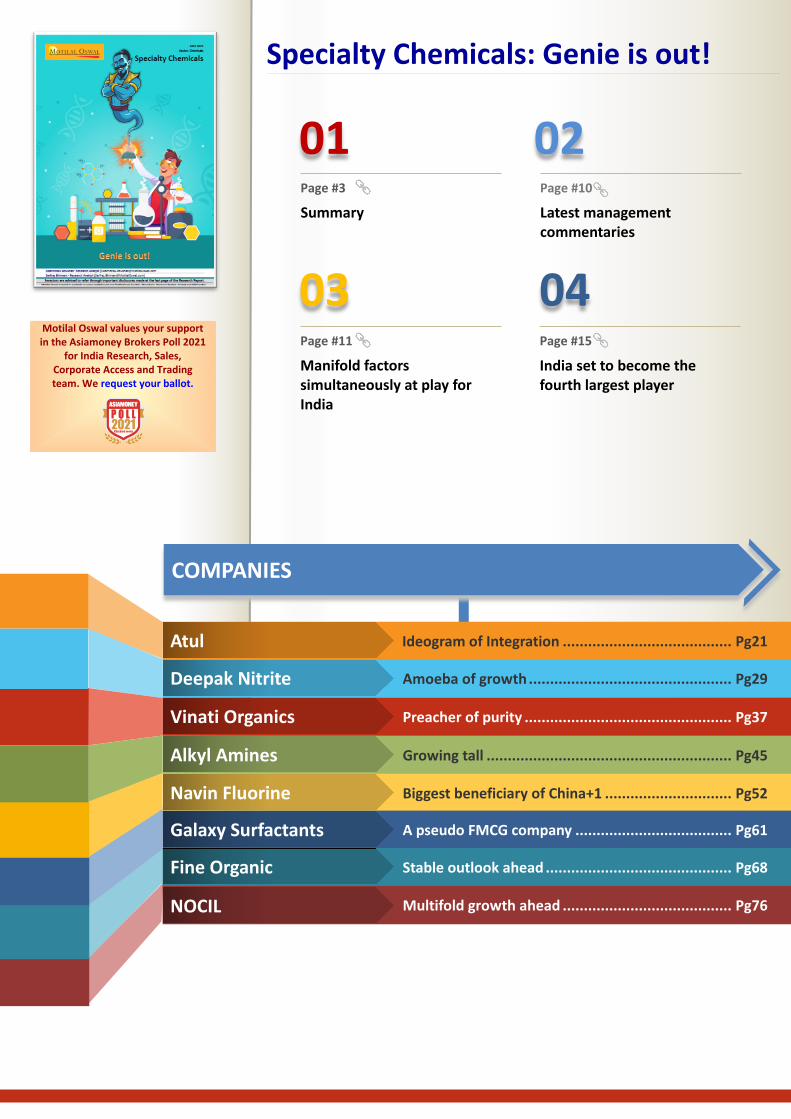
Page #3 Summary
Page #10 Latest management commentaries
Page #11
Manifold factors simultaneously at play for India
Page #15
India set to become the fourth largest player
01 02
03 04
Specialty Chemicals: Genie is out!
Ideogram of Integration ........................................ Pg21
Amoeba of growth ................................................ Pg29
Preacher of purity ................................................. Pg37
Growing tall .......................................................... Pg45
Biggest beneficiary of China+1 .............................. Pg52
Atul
Deepak Nitrite
Vinati Organics
Alkyl Amines
Navin Fluorine
A pseudo FMCG company ..................................... Pg61 Galaxy Surfactants
Stable outlook ahead ............................................ Pg68 Fine Organic
Multifold growth ahead ........................................ Pg76 NOCIL
COMPANIES
Motilal Oswal values your support in the Asiamoney Brokers Poll 2021
for India Research, Sales, Corporate Access and Trading team. We request your ballot.

June 2021 3
Specialty Chemicals
Genie is out! Initiating coverage with a positive outlook on the space
Globally, the Specialty Chemicals business accounts for ~20% of the USD4t Chemicalsindustry. From having an insignificant presence (4.5%) in this segment, India’s share inSpecialty Chemicals is expected to double over the next five years – at a ~12% CAGR toUSD64b by CY25.
Various factors favor the Specialty Chemicals industry in India, including 1) strongdomestic consumption – led by a young population (median age of 28 years), a highpercentage (~67%) of which forms the working age group, 2) favorable labor cost (one-third that of China / half that of Vietnam), and 3) government impetus.
In this sector initiation report, we propound our views on eight companies operatingin India’s Specialty Chemicals space: Atul (ATLP), Deepak Nitrite (DN), Vinati Organics(VO), Alkyl Amines (AACL), Navin Fluorine (NFIL), Galaxy Surfactants (GALSURF), FineOrganics (FINEORG), and NOCIL.
Capex plans of INR39b over FY22-24E (similar to FY19-21) would result in 52% revenuegrowth by FY24E (from FY21 levels), making these companies exciting plays. Weexpect 70bps EBITDAM expansion to 25% by FY24E (FY20/21 was 22.5/24.3%).
We initiate coverage with a positive outlook on the Specialty Chemicals space. DN isour top pick in the sector. We assign a Buy rating to DN, VO, GALSURF, and NOCIL; aNeutral rating to ATLP, AACL, NFIL, and FINEORG.
India Specialty Chemicals market in the right quadrant… The domestic Specialty Chemicals industry, which clocked double the global
CAGR (11.7%) over CY15-20, is valued at ~USD32b. India’s ranking in specialtychemicals is not available; it is the sixth largest producer of chemicals globally.
The India Specialty Chemicals industry is expected to deliver a 12.4% CAGRover the next five years (on a higher base), reaching USD64b by CY25 – drivenby the aforementioned macro factors. This growth would be led by a strongdemand CAGR of 10–20% in the export / end user industries.
To meet the global demand for specialty chemical products, China has quicklyscaled up its operations by establishing petrochemical hubs across the country.The proposed CY20–35 Petroleum, Chemicals and Petrochemicals InvestmentRegion (PCPIR) policy envisages an INR10t investment by CY25 and an INR20t byCY35 to further boost demand for specialty chemicals.
...benefitting from global supply chain diversification With 18% market share in global exports, China is the leading specialty
chemicals exporter – it exported ~USD35b worth of specialty chemicals in CY19(~4x that of India). As nations look for alternatives away from China, India standsto benefit from lower labor cost and a large consumer base.
Domestic players (such as NFIL, VO, and NOCIL) are benefitting from theChina+1 strategy with new orders and capex plans. The new projects wouldprimarily be export orders, which would enable Indian companies to capture alarger global market share in the Specialty Chemicals space.
Others players (such as DN) have quickly turned around their newlycommissioned plants, in line with the rise in domestic demand, which hasresulted in import substitution.
Specialty Chemicals
India’s manufacturing competence
Company covered Atul
Deepak Nitrite
Vinati Organics
Alkyl Amines
Navin Fluorine
Galaxy Surfactants
Fine Organic
NOCIL
Source: FICCI

June 2021 4
Specialty Chemicals
Capacity expansion to multiply growth… Our Coverage Universe has incurred an INR38b capex in the last three years
ended FY21, and would spend a similar amount (~INR39b) over the next three years ending FY24E. Along with an increase in the asset turnover rate, we estimate multiplicative growth in revenues (52% over FY21-24E).
AACL and NOCIL are well-placed to cater to sudden demand after their capex spree over FY19–21; VO and NFIL are likely to commission ongoing projects by end FY22-23, while DN is yet to announce new capex plans for its DPL business.
…translating to better financials Its growing niche in this product category and increasing share of exports are
likely to aid EBITDAM. DN, VO, and NFIL are venturing into new products, whileATLP is expanding its retail focus. We expect our Coverage Universe EBITDAMto expand by 70bps to 25% by FY24E (FY20/21 was 22.5%/24.3%).
R&D expenditure is also likely to double to 5–6% of revenue in FY24E (fromFY21), driving EBITDAM expansion.
We expect our Coverage Universe to post EBITDA/PBT CAGR of ~20%, withreturn ratios of 23–25% over FY22–24E (up from 22% in FY19 and FY21; weexclude FY20 in light of the tax rate revision).
Our Coverage Universe consists of net debt-free companies (excluding DN andGALSURF, which are expected to turn net debt-free by FY23E) that plan to incurcapex through internal accruals only. We expect total FCF generation of INR83b(v/s capex plans of ~INR39b) for our Coverage Universe over FY22–24E.
Initiating coverage with a positive outlook on Specialty Chemicals space Atul | Ideogram of integration: We forecast a 13% revenue CAGR over FY21–
24E (v/s 8% over FY15–20;-9% YoY in FY21) and a 14% PAT CAGR over FY21–24E. Deepak Nitrite | Amoeba of growth: Its valuation is the most attractive in this
space. We expect a 19% PAT CAGR (on a higher base) over FY21–24E. Vinati Organics | Preacher of purity: Its process efficiencies and market share
stand at over 99.5% and 65%. We expect a 33% PAT CAGR over FY21–24E. Alkyl Amines | Growing tall: Revenue could double over the next three years to
INR21.5b. We expect margins to normalize to ~30% (from FY21 highs of 35%). Navin Fluorine | Biggest beneficiary of China+1: It has announced two new
projects in the past year. We expect revenue to double by FY23E (39% CAGR). Galaxy Surfactants | Pseudo-FMCG company: We expect a ~10% volume CAGR
over FY22–24E, with management’s increased focus on high margin products. Fine Organics | Stable outlook ahead: Utilization ramp-up would boost growth.
We forecast an ~18% revenue CAGR over FY21–24E (v/s 10% over FY15-21). NOCIL | Multifold growth ahead: Asset turnover would increase to ~1.0x by
FY24E from 0.7x in FY21 (revenue/PAT CAGR of 25%/48% over FY21-24E).
Key risks These companies have been on a high growth trajectory and seen margin
expansion through backward integration as well as value-added products. Anyslowdown in either of the factors may result in the de-rating of the stocks.
As India improves its environmental norms, this may result in rising productioncost, ultimately impacting exports.

June 2021 5
Specialty Chemicals
End-user markets and their growth drivers to fuel demand for specialty chemicals in India - (USD b)
Sub-segment Growth driver User industry CY14-19 CAGR*
(%)
Current market
size
CY19-25 CAGR*
(%)
Potential market
size Dyes, Pigments, and Coatings Around 1.5x GDP growth rate Construction,
Automotive 7 7.0 10 12.4
Polymers Additives
Growth from increased usage in Packaging,Construction, and Automotive industries
Packaging,Automotive 13 1.3 10 2.3
Home Care Surfactants
Increased consumption and move towards highervalue products
Laundry Care,Dishwashing 6 2.0 11 3.7
Textile Chemicals
Industry had benefitted from currency depreciation; has strong growth potential
Apparel,Technical Textiles
10 1.8 12 3.5
Agro Chemicals
Strong growth in CRAMs and domestic Agrochemicalindustry as pesticide consumption is low in India
Agriculture,exports 10 9.2 12 18.2
Water Chemicals
Growing urbanization has led to a higher need for water purification and treatment
Industrial water,municipal water 15 0.8 15 1.9
Cosmetic Chemicals
Increasing awareness and evolving consumerneeds drive growth
Bath, shower,Hair Care 15 1.0 15 2.3
Construction Chemicals Rising demand for additives Infrastructure,
Real Estate 13 1.4 15 3.2
Flavors, Fragrances
Demand for higher value-added products inPackaged Foods and Personal Care
Food ProcessingPersonal Care 14 1.4 15 3.3
Nutraceuticals Huge demand from the US and Europe to drive growth (organized market)
Food Additives,Dietary Supplements
19 1.0 20 3.0
*Note: Growth estimates by leading institutions and companies in the industry. Source: FICCI, MOFSL
Massive opportunity for India to overtake China in specialty chemical exports to the world
Source: McKinsey, MOFSL
77 72 66 15 15 12 10 5 5
11% 17% 12% 8%
22% 19%
46%
27%
46%
4% 6% 5% 1% 0% 2% 2% 2% 12%
API Agrochem Dyes andPigments
Polymeradditives
Electronicchemicals
Food/Feedadditives
Nutra-ceuticals
Rubberchemicals
Flavours andFragrances
Global specialty chemical exports (USD bn) China's export India's export
MULTIFOLD OPPORTUNITY FOR INDIA IN THESE CHEMICALS
Expect India’s Specialty Chemicals market to grow 2x the global market rate over next five years
Source: Industry, MOFSL
India’s Specialty Chemical space serves broad range of sectors (%)
Source: Industry, MOFSL
Key thesis in charts: What are specialty chemicals and why invest in Indian companies?

June 2021 6
Specialty Chemicals
Atul (ATLP) (M-cap: USD3.6b, CMP: INR8,863, TP: INR9,850, Upside: 11%, Neutral) Background: ATLP operates in two major categories: Life Science Chemicals, and
Performance and Other Chemicals. Other sub-segments are Aromatics, BulkChemicals and Intermediates, Colors, Crop Protection, Pharmaceuticals, andPolymers. It also operates a network of 38,000+ retail outlets in India.
It has the potential to clock consolidated revenue of INR54b (at 90% capacityutilization) in the near term as it completes its INR5b capex. We forecast a 13%revenue CAGR over FY21–24E (v/s ~8% over FY15–20, down 9% YoY in FY21).With further debottlenecking and process cost optimization, we expect anEBITDA/PAT CAGR of 13%/14% over FY21–24E, with return ratios hovering at17–19% over this period.
The stock is trading at 30x FY23E EPS of INR299 and 21x FY23E EV/EBITDA. Wevalue ATLP at 33x FY23E EPS to arrive at TP of INR9,850. We initiate coveragewith a Neutral rating (owing to a limited upside).
Deepak Nitrite (DN) (M-cap: USD3.3b, CMP: INR1,760, TP: INR2,300, Upside: 31%, Buy) Background: DN is an intermediate chemicals company, with a diversified
business of Basic Chemicals, Fine and Specialty Chemicals, and PerformanceProducts. The company also manufactures phenol, acetone, and isopropylalcohol (IPA) through its wholly-owned subsidiary – Deepak Phenolics (DPL).
DN aims to expand its footprint in High-Value Intermediates to capitalize andsynergize with DPL, and has announced a new subsidiary called Deepak CleanTech. Capex plans of INR4-6b are likely each year, resulting in revenue growthof more than 60% over FY21–24E (CAGR of 17%).
The stock is trading at 21x FY23E EPS of INR82 and 14x FY23E EV/EBITDA, withreturn ratios of 29–31%. We expect a 19% PAT CAGR over FY21–24E. We valuethe company at 28x FY23E EPS to arrive at TP of INR2,300. We initiate coverageon DN with a Buy rating.
Vinati Organics (VO) (M-cap: USD2.6b, CMP: INR1,855, TP: INR2,170, Upside: 17%, Buy) Background: It is currently the largest producer of IBB and ATBS in the world,
with a dominant (~65%) domestic market share. VO has focused on excelling ina particular specialty chemical molecule through economies of scale, coupledwith further integration. As a result, the company has emerged as a leadingglobal manufacturer in the space.
We expect a 38% revenue CAGR over FY21–24E. In light of new capacityadditions, with lower margin products, we expect the EBITDAM to normalizeto ~34% (from ~37% in FY21), resulting in a 34% EBITDA CAGR. Theamalgamation of Veeral Additives (VAL) with VO would result in furtherforward integration.
The stock is trading at 36x FY23E EPS of INR50.5 and 26x FY23E EV/EBITDA, withattractive return ratios of ~25% (+600bps v/s FY21). It has a fixed asset turnoverof 1.3x, which is likely to double over next three years. We expect 33% PATCAGR during FY21-24E, and value the company at 43x FY23E EPS to arrive at ourTP of INR2,170. We initiate coverage with a Buy rating.
Capacity additions in subsidiaries would drive
major growth from FY22. The company spends
annually on debottlenecking and process efficiencies,
which present an upside risk to our estimates.
DN is yet to announce any growth capex in the
Phenolics business. DPL’s plants were operating at a
115% utilization rate in FY21. We believe
debottlenecking capex or additional expansion of
capacities would lead to huge growth.
We expect revenue to more than double by FY24E, with ~56% YoY growth in FY22E
(in line with the management guidance). VO is confident of being among
the top five global players for Butyl Phenol and AOs over the next 4–5 years.

June 2021 7
Specialty Chemicals
Alkyl Amines (AACL) (M-cap: USD2.5b, CMP: INR3,600, TP: INR3,825, Upside: 6%, Neutral) Background: AACL is the second largest player in the Indian Aliphatic Amines
industry, with close to 45% market share. It is present in three major categories:Amines and Derivatives, Other Specialty Chemicals, and Industrial Gases. LifeSciences (Pharma + Agri) constitutes ~70% of total demand.
It plans to spend ~INR5b over the next three years via internal accruals.Assuming asset turnover of 2x, revenue could double to INR21.5b over thenext three years. We believe (in line with the management guidance) thatEBITDAM would normalize to 30–33% – assuming a gross margin at 50%(maintained over the last decade) – as the conversion cost declines further.
The stock is trading at 42x FY23E EPS of INR85 and 30x FY23E EV/EBITDA. Wevalue the company at 45x FY23E EPS to arrive at TP of INR3,825. We initiatecoverage with a Neutral rating due to a limited upside. Although, capacityexpansions would facilitate the current high valuations as the company isexpected to generate ROEs of 35–37%, the best among peers.
Navin Fluorine (NFIL) (M-cap: USD2.5b, CMP: INR3,714, TP: INR3,960, Upside: 7%, Neutral) Background: NFIL operates in four segments: Refrigerants, Inorganic Fluorides,
Specialty Chemicals, and CRAMs. With India emerging as a fluorination hub(owing to the relocation of major downstream players from China), thecompany has announced two new projects as a part of its wholly-ownedsubsidiary (NFASL) over the past year.
Capex over FY22–24E is projected at ~INR7.3b; INR4.4b/INR1.95b would betoward the new HPP/MPP business and the rest toward ramping upproduction in existing segments. Funding would happen largely throughinternal accruals. We expect EBITDA/adj. PAT CAGR of 31%/29% over FY21–24E, with stable EBITDAM.
The stock is trading at 34x FY23E EPS of INR99 and 26x FY23E EV/EBITDA, withreturn ratios improving to ~23% (+600bps v/s FY21) despite massive capex. Wevalue the company at 40x FY23E EPS to arrive at TP of INR3,960. We initiatecoverage with a Neutral rating, highlighting downside risk to our estimates witheven a slightest of delay in execution/commissioning of the upcoming projects.
Galaxy Surfactants (GALSURF) (M-cap: USD1.4b, CMP: INR3,010, TP: INR3,520, Upside: 17%, Buy) Background: GALSURF is a leader in the Surfactants and Specialty Care
Ingredients categories. It exclusively focuses on catering to the Home andPersonal Care industry. GALSURF’s surfactants or specialty care ingredients arefound in 9 out of every 10 products used by Indian consumers.
We expect GALSURF to post a 12% EBITDA and PAT CAGR over FY21–24E, withEBITDA/kg improving to INR20 (assuming 5% YoY growth in FY23E – asspecialty products expansion at Jhagadia gets commissioned), led by newproduct launches on the back of strong R&D.
We expect the company to deliver volumes CAGR of ~10% over FY21–24E,higher than the management guidance of ~8%. The stock is trading at 28x FY23EEPS of INR107 and 18x FY23E EV/EBITDA. We value the stock at 33x FY23E EPSto arrive at TP of INR3,520. We initiate coverage with a Buy rating.
Closure of global capacities and higher-than-expected revenue CAGR present an
upside risk to our call, while there could be a downward
risk from increased domestic competition.
NFIL is building capacity in the high-performance
product segment and a multi-purpose plant, which
would add INR6.5b in annual revenue. Asset turnover
would increase to 0.9x in FY23E from 0.7x in FY21.
GALSURF has reduced its debt considerably from
FY14 levels. We expect it to turn net cash by FY23E despite capex of INR3b
planned over FY22–24E.
June 2021 8
Specialty Chemicals
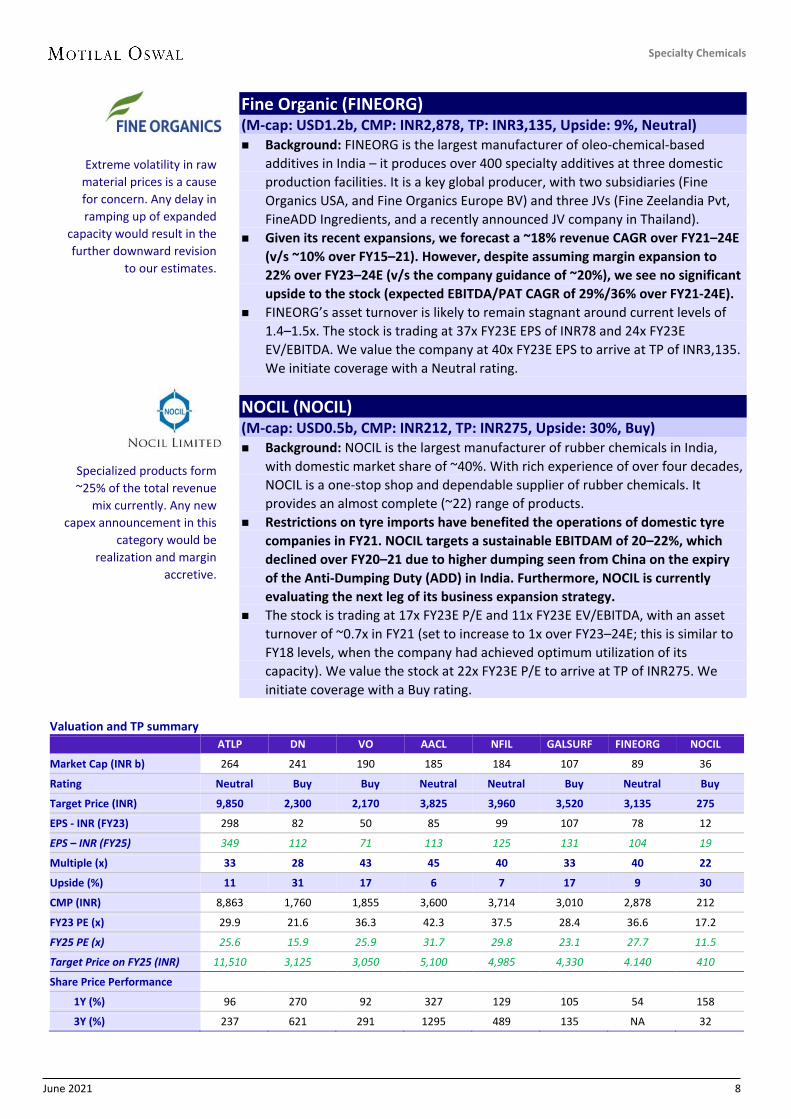
Fine Organic (FINEORG) (M-cap: USD1.2b, CMP: INR2,878, TP: INR3,135, Upside: 9%, Neutral) Background: FINEORG is the largest manufacturer of oleo-chemical-based
additives in India – it produces over 400 specialty additives at three domestic production facilities. It is a key global producer, with two subsidiaries (Fine Organics USA, and Fine Organics Europe BV) and three JVs (Fine Zeelandia Pvt, FineADD Ingredients, and a recently announced JV company in Thailand).
Given its recent expansions, we forecast a ~18% revenue CAGR over FY21–24E (v/s ~10% over FY15–21). However, despite assuming margin expansion to 22% over FY23–24E (v/s the company guidance of ~20%), we see no significant upside to the stock (expected EBITDA/PAT CAGR of 29%/36% over FY21-24E).
FINEORG’s asset turnover is likely to remain stagnant around current levels of 1.4–1.5x. The stock is trading at 37x FY23E EPS of INR78 and 24x FY23E EV/EBITDA. We value the company at 40x FY23E EPS to arrive at TP of INR3,135. We initiate coverage with a Neutral rating.
NOCIL (NOCIL) (M-cap: USD0.5b, CMP: INR212, TP: INR275, Upside: 30%, Buy) Background: NOCIL is the largest manufacturer of rubber chemicals in India,
with domestic market share of ~40%. With rich experience of over four decades, NOCIL is a one-stop shop and dependable supplier of rubber chemicals. It provides an almost complete (~22) range of products.
Restrictions on tyre imports have benefited the operations of domestic tyre companies in FY21. NOCIL targets a sustainable EBITDAM of 20–22%, which declined over FY20–21 due to higher dumping seen from China on the expiry of the Anti-Dumping Duty (ADD) in India. Furthermore, NOCIL is currently evaluating the next leg of its business expansion strategy.
The stock is trading at 17x FY23E P/E and 11x FY23E EV/EBITDA, with an asset turnover of ~0.7x in FY21 (set to increase to 1x over FY23–24E; this is similar to FY18 levels, when the company had achieved optimum utilization of its capacity). We value the stock at 22x FY23E P/E to arrive at TP of INR275. We initiate coverage with a Buy rating.
Valuation and TP summary ATLP DN VO AACL NFIL GALSURF FINEORG NOCIL
Market Cap (INR b) 264 241 190 185 184 107 89 36
Rating Neutral Buy Buy Neutral Neutral Buy Neutral Buy
Target Price (INR) 9,850 2,300 2,170 3,825 3,960 3,520 3,135 275
EPS - INR (FY23) 298 82 50 85 99 107 78 12
EPS – INR (FY25) 349 112 71 113 125 131 104 19
Multiple (x) 33 28 43 45 40 33 40 22
Upside (%) 11 31 17 6 7 17 9 30
CMP (INR) 8,863 1,760 1,855 3,600 3,714 3,010 2,878 212
FY23 PE (x) 29.9 21.6 36.3 42.3 37.5 28.4 36.6 17.2
FY25 PE (x) 25.6 15.9 25.9 31.7 29.8 23.1 27.7 11.5
Target Price on FY25 (INR) 11,510 3,125 3,050 5,100 4,985 4,330 4.140 410
Share Price Performance 1Y (%) 96 270 92 327 129 105 54 158
3Y (%) 237 621 291 1295 489 135 NA 32
Extreme volatility in raw material prices is a cause for concern. Any delay in ramping up of expanded
capacity would result in the further downward revision
to our estimates.
Specialized products form ~25% of the total revenue
mix currently. Any new capex announcement in this
category would be realization and margin
accretive.

June 2021 9
Specialty Chemicals
Relative financial performance of our Coverage Universe 1st 2nd 3rd 4th 5th 6th 7th 8th
Rev CAGR FY21-24E (%) VO (37.8)
NFIL (29.4)
NOCIL (25.3)
AACL (20)
FINEORG (18.2)
DN (17.0)
ATLP (13.2)
GALSURF (11.9)
EBITDA CAGR FY21-24E (%) NOCIL (46.5)
VO (33.9)
NFIL (30.6)
FINEORG (28.9)
AACL (17.5)
DN (14.9)
ATLP (13.0)
GALSURF (11.8)
PBT CAGR FY21-24E (%) NOCIL (53.5)
VO (36.1)
FINEORG (35.1)
NFIL (21.0)
DN (18.7)
AACL (18.6)
GALSURF (14.6)
ATLP (13.7)
Avg ROE FY22-24E (%) AACL
(35.6) DN
(30.9) VO
(24.4) FINEORG
(23.7) GALSURF
(21.9) NFIL
(20.5) ATLP (18.0)
NOCIL (14.7)
Avg ROCE FY22-24E (%) AACL (33.9)
DN (28.3)
VO (23.5)
FINEORG (22.9)
GALSURF (20.5)
NFIL (20.4)
ATLP (17.6)
NOCIL (13.8)
Capex FY22-24E (INR b) DN
(12.0) NFIL (7.3)
ATLP (7.0)
AACL (5.0)
VO (3.0)
GALSURF (3.0)
FINEORG (0.9)
NOCIL (0.6)
EV/EBITDA FY23E (x) AACL
(30.1x) NFIL
(26.4x) VO
(25.9x) FINEORG (23.9x)
ATLP (20.4x)
GALSURF (18.4x)
DN (14.3x)
NOCIL (11.0x)
PE FY23E (x) AACL (42.3x)
FINEORG (36.6x)
VO (36.3x)
NFIL (37.5x)
ATLP (29.9x)
GALSURF (28.4x)
DN (21.6x)
NOCIL (17.2x)
Source: Company, MOFSL
Comparative valuations of specialty chemical companies – as per Bloomberg consensus
Company M Cap EPS EPS CAGR RoE (%) PE (x)
(INR b) FY21 FY22E FY23E FY21-23 (%) FY21 FY22E FY23E FY21 FY22E FY23E Aarti Inds. 306 15 19 25 29 16 19 20 43.9 46.3 35.2 Atul 266 223 250 290 14 19 18 17 31.8 36.0 31.1 Deepak Nitrite 243 57 71 80 18 40 35 30 29.1 25.0 22.3 Vinati Organics 189 26 33 44 30 19 24 24 53.4 56.6 41.8 Alkyl Amines 185 58 60 73 12 44 34 33 39.4 60.3 49.7 Navin Fluo.Intl. 184 52 56 85 27 17 16 21 53.0 65.7 43.9 Gujarat Fluoroch 118 (20) 43 45 NM (6) 11 10 NM 25.1 23.9 BASF India 112 128 86 97 -13 35 19 18 16.2 30.1 26.8 Galaxy Surfact. 107 85 92 107 12 26 23 22 29.9 32.9 28.4 Fine Organic 90 39 61 82 44 18 23 25 58.2 47.7 35.8 Balaji Amines 88 74 85 100 17 31 26 24 23.9 31.8 27.1 Anupam Rasayan 74 8 16 24 70 7 10 13 89.5 45.2 30.9 Rossari Biotech 67 16 21 27 32 23 18 17 66.6 58.9 44.7 Laxmi Organic 59 5 5 5 4 17 12 11 46.4 46.4 42.8 Sudarshan Chem. 48 20 25 31 22 21 21 22 25.4 27.8 22.4 Phillips Carbon 39 18 23 27 21 17 18 18 10.5 9.8 8.6 NOCIL 36 5 9 12 48 7 10 13 32.9 25.2 18.4 Camlin Fine 22 4 8 11 68 10 18 20 35.1 22.3 15.4 Neogen Chemicals 20 13 20 29 46 18 23 26 64.0 41.6 29.4 Chemcon Special. 17 16 20 26 25 23 18 20 28.0 22.9 17.9
Source: Bloomberg, MOFSL

June 2021 10
Specialty Chemicals
Latest management commentaries of specialty chemical companies Maulik D. Mehta, CEO, Deepak Nitrite The growth trajectory would continue across product segments, fuelled by
increased capacity from brownfield expansions, new products at some greenfield capacities, and continued strong demand from our target end-segments.
As we enter FY22 – given the current challenges in the global and, specifically, the Indian economic environment – we are confident that DN is well-equipped to evaluate the emerging growth prospects in end user industries.
Vinati Saraf Mutreja, CEO, Vinati Organics Isobutyl Benzene (IBB) saw low business in FY21 as one of our largest customers
had halted operations. However, the company has now resumed operations, on the back of which IBB would continue to grow in the double digits in FY22 and FY23, led by strong demand for Ibuprofen.
We commenced operations at butyl-phenol plant a year ago; this is currently running at 50–60% of total capacity. The ramp-up in the butyl-phenol products would generate ~INR2.5b in revenue at peak capacity.
Radhesh R. Welling, MD, Navin Fluorine International We are leveraging our R&D capabilities and deep fluorination expertise to
strengthen the new opportunity pipeline, expand the product portfolio, and expand capacities through both greenfield and brownfield projects.
Current engagements with innovative pharma majors would help sustain future growth.
U. Shekhar, MD, Galaxy Surfactants The demand environment remains robust, clearly highlighting the resilience and
underlying strength in the company's business model. Despite the challenges, we remain confident and optimistic about the growth journey.
The new products emerging from its innovation funnel would form the bedrock of growth over the next decade. These are defined to cater to the emerging trends of non-toxicity, sulfate-free, green, and natural solutions.
S R Deo, MD, NOCIL Given that our capacities are in place, unutilized capacities would enable us to
continue on the growth trajectory next year as we work towards being valued as a reliable partner for the major tyre companies.
We aim to continue to ramp up our capacity utilization. If we are able to sustain these indicators, we are reasonably confident of achieving 100% utilization by Sep’23 (instead of Mar’24), as stated in the previous earnings call.

June 2021 11
Specialty Chemicals
Manifold factors simultaneously at play for India China+1, cost advantage, higher consumer base, and government impetus The global Specialty Chemicals market size is pegged at ~USD805b. It is expected to
post a ~6.4% CAGR to USD1,170b by CY25. Globally, ~25% of the total specialty chemicals production is exported, amounting to ~USD200b.
The EU and the US have historically been key global specialty chemical hubs. However, after CY08, the focus has shifted to China, facilitated by lower labor cost, government subsidies, and relaxed environmental norms.
China dominates with ~36% share in the global Specialty Chemicals space, with exports worth USD35b in CY19 (i.e., ~4x that of India). However, the high economic growth seen in China has come at a very heavy environmental cost. Investments in environmental protection have failed to keep pace with the rapid advancement in the economy. China has now issued various environmental protection norms and taken the necessary steps to ensure a sustainable environment – within which the economy could grow without damaging the environment.
Geopolitical issues: In Jun’18, the US announced the imposition of tariffs on Chinese imports. This event not only impacted the pricing of goods but also capital spending by chemical majors. The US–China trade war resulted in supply uncertainties in western countries. De-risking from a single concentrated source (i.e., China) presents an opportunity for countries such as India.
Focus shifting away from China Environmental concerns in China – various units shut down, others fined In CY11, when the US embassy in Beijing revealed data that the PM2.5
concentration was beyond the levels specified by the United States Environmental Protection Agency (US EPA)’s Air Quality Index, many international/national public concerns were raised.
In CY16, the Chinese government issued a development plan for the Yangtze River Delta Economic Belt, where pollution had reached dangerous levels. No Factories are now allowed within 1km of the river.
After a huge explosion in the industrial area of Yancheng in Mar'19, the Chinese government conducted heightened safety inspections at all chemical companies, which disrupted the supply of raw materials in the Chemicals space, resulting in the prices of certain specialty chemicals shooting up.
Exhibit 1: Location of CY17 blast site…
Source: Google, MOFSL
Exhibit 2: …leads to tough environmental norms
Source: BBC, MOFSL
In CY17 (after the Yangtze incident), ~40% of chemical
companies in China were shut down due to the Chemical
industry’s excessive contribution to environmental
pollution; a ‘green tax’ was levied on these companies,
increasing their costs.
610 805 1170
2014 2019 2025
USD b Global specialty chemicalsmarket size
1.
At this juncture, in terms of the future
outlook, India is poised for multi-fold growth – as the various factors at
play blend into the perfect recipe for
growth.

June 2021 12
Specialty Chemicals
Exhibit 3: Major air quality control strategies since CY12 – China strengthens cooperation on controlling heavy air pollution Type Issue/Execute date Measures Issued by* Plan CY11-15 12th Five-Year Plan State Council Law Executed Jul’12 Clean Production Promotion law NPC Plan Issued Oct’12 The 12th FYP on Prevention and Control of Air Pollution in Key Regions MEP, NDFC, MoF Plan Published Jun’13 National 10 measures State Council Plan Issued Sep’13 Air pollution prevention and control action plan State Council Law Amended Apr’14 Environmental protection law NPC Law Executed Jan’16 Air pollution prevention and control law NPC
Plan Issued Jul’14 Performance Assessment Measures for Air Pollution Prevention and Control Action Plan State Council
Standard Executed Jan’16 National Ambient Air Quality Standard MEP
Plan Executed Aug’17 Action Plan to Comprehensive Control Autumn and Winter Air Pollution in Beijing-Tianjin-Hebei and Surrounding Regions 2017–2018 MEP
Standard Varied Emission standard of air pollutants for industries MEP, AQSIQ Plan CY16-20 13th Five-Year Plan State Council
*Abbreviations: NPC – National People’s Congress; MEP – Ministry of Environmental Protection of the People’s Republic of China; MoF – Ministry of Finance; NDFC – National Development and Reform Commission; AQSIQ – General Administration of Quality Supervision, Inspection and Quarantine;.
Source: International Journal of Environmental Research and Public Health, MOFSL
Policy initiatives in India Vietnam – a case study (success based on reforms) Vietnam commenced the Doi Moi Reform process in CY86, way after China
begun its reform process in the late 70s, but before India, which kick-started the process in CY91. The country has since been on the path to growing its exports faster than India. Vietnam delivered total merchandise exports at an 18% CAGR in the last decade, excluding CY20 (v/s a meager 4% CAGR for India over this period). The country has also beaten India in exports to the EU – it posted a 4.4x jump (v/s 1.6x growth for India) in the last decade.
In Jun’20, the Vietnam government ratified its FTA with the EU. This would allow European companies to invest in the country and export to other markets in Asia-Pacific where it has preferential access agreements. Vietnam has also emerged as the preferred choice for electronics and mobile phone companies trying to move out of China. That said, Specialty chemical companies in India have an edge over Vietnam in terms of technology and niche expertise in respective chemical formulations.
Exhibit 4: Vietnam exports up 4x over last decade; now on par with India exports
Source: Industry, MOFSL
72 97 115 132 150 162 177 215 244 323 282 131
220
302 290 337 318
264 261 296
324 323 276
153
2010 2011 2012 2013 2014 2015 2016 2017 2018 2019 2020 2021'till may
USD b Vietnam India
According to recent data, of the 56 companies that have moved out of China since its
trade war with the US over the last two years, only 8 have
invested in India, while 26 have shifted base to Vietnam.
2.

June 2021 13
Specialty Chemicals
Production Linked Incentive scheme for Manufacturing to make India part of global supply chain The government intends to spend ~USD19.6b to
(a) build a competitive and efficient domestic manufacturing base, (b) enable economies of scale and exports, (c) attract investments in core sectors, and (d) introduce cutting-edge technologies.
It has also announced a production-linked incentive (PLI) scheme for the domestic manufacturing of key starting materials (KSMs), drug intermediates (DIs) and Active Pharmaceutical Ingredients (APIs), and medical devices.
Exhibit 5: PLI scheme for Manufacturing sector – potential game-changer
Source: DCPC, MOFSL
India’s R&D spends to triple over next 4–5 years Entry barriers in Specialty Chemicals to aid growth Companies in the Specialty Chemicals space face low risk from competitors due
to high entry barriers – given the complex nature of chemistries involved in producing these chemicals. Substantial R&D requirements, technical know-how, service capabilities, customer relationships, and adherence to required regulations create important entry barriers.
In addition to R&D investments, further barriers to entry include bespoke solutions/applications and long-term customer relationships. Switching costs for specialty chemical customers are high. As a result, they are reluctant to switch existing products for marginal gains – as specialty chemicals account for just a small proportion of the final product cost.
India would be the biggest beneficiary as the US and European companies face pressures from institutional investors and significant lenders to re-base their supply chain away from China. Downstream industries also seek alternative manufacturing options; thus, have been seeking lower cost locations over China.
China's share in the global chemical R&D spend has increased to 27.5% from 9.5% in the past decade. Over this period, it has clocked a 16.6% CAGR in R&D investments v/s the global R&D investment CAGR of 5.1%, thus driving growth. India's public investment in R&D stands at 0.7% of GDP, which the government
plans to increase to ~2% by FY25E. On similar lines, the Specialty Chemicals industry is likely to double its R&D spend to 5–6% of revenue over this period.
Indian companies are well-placed to achieve strong
growth over the next decade as they enhance their global
tie-ups, along with current capacity ramp-ups and further
capacity additions.
3.

June 2021 14
Specialty Chemicals
Exhibit 6: Comparative evaluation of various sub-segments of Indian Chemicals industry
Parameters Pharma Agrochemical Organic Chemical
Inorganic Chemical
Color Alkali
Dyes & Pigments
Specialty Chemicals
Entry barrier Very strong Very Strong Weak Weak Weak Weak Very Strong Regulatory approvals High High Low Low Low Low Low
Customer profile Toll manufacturing Toll/open
arrangements Open
Market Open
Market Open
Market Open Markets/
sticky customers Toll/open
arrangement Customer stickiness Very high Very high Low Low Low Moderate Very high
Pricing Fixed arrangements Fixed arrangements with pass on clause
Market driven
Market driven
Market driven
Fixed arrangements
Fixed arrangements with pass on clause
No. of suppliers for the same product
Limited (1-3) with key supplier catering to 2/3rd of the market
Limited (1-3) with key supplier catering to 2/3rd of the market
Many suppliers
Many suppliers
Many suppliers
Many suppliers
Limited (1-3) with key supplier catering to 2/3rd of the market
Source: Industry, MOFSL
Protection to India industry while facilitating benefits Various policy initiatives, along with investigation of ADD Anti-dumping duty (ADD) was first levied on Chinese chemical imports in CY14
as a safeguard against dumping. While several anti-dumping duties have not been extended on such imports in the past, due to the recent ‘Atmanirbhar Bharat’ initiative by the Indian government, India has once again begun imposing ADD on Chinese chemical imports – to make the country resilient to cheap imports and protect the interests of domestic players.
Policy initiatives by government in last two years: These include (a) the reduction of basic custom duty on naphtha to 2.5% (from 4%), (b) proposed PCPIR projects in Odisha/Gujarat, (c) export promotion schemes and FTAs, and (d) the public procurement policy for 28 chemicals/petrochemicals.
Exhibit 7: List of specialty chemicals on which ADD has been extended in last two years (ADD valid for five years) Chemical First imposed on Extension End user industry
Zeolite 4A Dec’18 Surfactants
Sulfonated Naphthalene Formaldehyde Mar’18 Surfactants
PX-13 Nov’17 Yes Automobiles, Tyres
Linear Alkyl Benzene Apr’17 Surfactants
Sodium citrate May’15 Yes Food, Pharma
Meta Phenylenediamine (MPDA) Mar’14 Yes Photography, Dyes
1-phenyl-3-methyl -5-pyrazolone Jan’21 Dye and Pharma industries
Phthalic anhydride Dec’15 Yes Plasticizers and pigments
Carbon Black Yes Rubber applications
Choline Chloride Yes Animal Feed and the Oil and Gas sector
Toluene DiIsocyanate (TDI) Under consideration Furniture, bedding and carpet underlay
Natural mica based pigments Under consideration Paint and Pigments
Polytetrafluoroethylene (PTFE) Under consideration Electrical, electronics, mechanical manufacture
Aniline Under consideration Dyes, drugs, plastics, and rubber chemicals
Source: Industry, MOFSL
4.

June 2021 15
Specialty Chemicals
India set to become the fourth largest player …key sectoral trends that would influence growth going forward
India is the sixth largest chemical producer globally, delivering ~11.7% CAGR over the last five years. Despite the strong CAGR, India accounts for ~4.5% of the USD4t global Chemical industry (v/s ~36% for China). Commodity Chemicals make up ~80% of the global Chemical industry, with Specialty Chemicals forming the balance.
The Specialty Chemical industry in India is worth ~USD32b, or ~18% of the USD180b domestic Chemical industry. Led by various factors, highlighted in the previous section, the domestic Specialty Chemical industry is expected to deliver 12.4% CAGR (on a higher base) and touch ~USD64b by CY25.
a. Growth in the Specialty Chemicals industry will be fueled by end-user industries such as Lifesciences, Healthcare, Food, Cosmetics, other consumer goods, etc.
b. Various domestic players are leading the path in forward/backward integration of their specialty chemical processes to open the door to new opportunities, earn better margins, and reduce dependence on imports. To give a classic example, VO started producing Butyl Phenols after DN commissioned their Phenolic plant (as Phenols were entirely imported earlier).
c. Import substitution: India is highly dependent (+USD13b annually) on petrochemical imports, led by a huge manufacturing deficit in most petrochemical intermediates. The proposed CY20-35 Petroleum, Chemicals & Petrochemicals Investment Region (PCPIR) policy envisages an investment of INR10t by CY25, rising to INR20t by CY35; which would boost feedstock availability, and thus production of specialty chemicals.
d. India is emerging as a key exporter as global players are reducing their dependence and outsourcing from China. This would help India increase its exports and capture incremental market share globally. The country is set to become the fourth largest chemical producer (from sixth currently) in the world in the current decade.
The Specialty Chemicals industry caters to a wide range of end-user markets like Pharmaceuticals, Automobiles and Tyres, Steel, Dyes and Pigments, Packaging, Flavors and Fragrances, Textiles, etc. Growth in end-user industries would drive growth of the Specialty Chemicals sector and take it to new heights.
Exhibit 8: Growth in Specialty Chemicals in coming years to be higher than the last five years (%)
Source: Industry, MOFSL
7
13
6
10 10
15 15 13
16
10 10 11 12 12
15 15 15 17
Dyes,Pigments and
Coatings
SpecialtyPolymers and
additives
Surfactants TextileChemicals
AgroChemicals
WaterChemicals
CosmeticChemicals
ConstructionChemicals
Flavours &Fragrances
2014-19 CAGR 2019-2025 CAGR
18 32
64
2014 2019 2025
USD b India specialty chemicalsmarket size
We discuss the key end-user markets below in detail, highlighting its
relevance/importance to our coverage
companies
Nutraceuticals

June 2021 16
Specialty Chemicals
India has the following tailwinds that would favor growth: Demographic dividend: India has one of the youngest populations in an aging
world, with the median age just ~28 years (v/s ~38 years in China and the US, ~42 years in Western Europe, and ~49 years in Japan).
Higher population in the working class: India’s working-age population (those between 15 years and 64 years) has been growing larger than its dependent population and constitutes ~67% of its total population.
Low per capita consumption across product categories: Current per capita consumption of chemical products in India is about one-tenth the world average, indicating huge headroom for growth.
Make in India – the biggest trigger for growth: The Government of India (GoI) has implemented several structural reforms such as GST and lower corporate tax rate, amended the Land Acquisition Act, and increased transparency to make the business environment conducive to invest and grow in India.
Exhibit 9: Global chemical value chain
Source: Duke, MOFSL
Exhibit 10: India’s trade flow as per segmental value chain
Source: FICCI, MOFSL
132 134 60
256 118
185
190 199 258
275 285
341
Viet
nam
Mex
ico
Indi
a
Thai
land
Indo
nesia
Chin
a
Labour rates per month (USD) – Lowest/Highest

June 2021 17
Specialty Chemicals
Structural transformations to drive the next leg of growth in the Indian Specialty Chemicals space API segment – India is the third largest market in APAC India is the third largest API market in the Asia-Pacific region, and China is its
main competitor. The GoI’s ‘Pharma Vision 2020’ aims to make India a global leader in end-to-end drug manufacturing, thus increasing private sector investments in R&D are driving the sector’s growth in India.
Recent management commentary from Healthcare companies suggests that the overall outlook for API manufacturers has improved due to lower supplies from Chinese companies.
This is a big positive for companies in the Specialty Chemicals space that cater to the Pharmaceutical industry, as higher API production domestically would mean higher demand of intermediate molecules. COVID-19 has increased the importance of R&D and prompted widespread investment in Healthcare.
Exhibit 11: India’s import of most regularly used drugs
Source: MDPI, MOFSL
Fluorochemicals – finding increasing use in Life Science and Pharma The global Fluorochemicals market is expected to touch USD30b by CY25,
recording 5% CAGR. The global Life Science industry (base on Fluorochemicals) is estimated to grow at ~6% CAGR to ~USD4.5b by CY25.
Fluorination is finding an increasing use in the Life science and Pharma space. For instance, the US Food and Drug Administration (FDA) approved 48 new drugs in the last year. More than a quarter (14 out of 48) of the drugs approved by the FDA contains fluorine.
Exhibit 12: Value chain for Fluorination containing Pharma
Source: FICCI, MOFSL
38,000
30,000 22,000
22,000 5,000
5,000
8,000 4,000 7,000
7,000 4,000
1,000 2,000 2,000 35%
100%
5%
100%
0%
100%
10% 5%
100%
20% 10%
100% 100% 100%
Para
ceta
mol
PAP
Met
form
in
DCDA
Rani
tidin
e
Cyst
eam
ine
HCI
Amox
icill
in
Ampi
cilli
n
6-AP
A
Ibup
rofe
n
Cipr
oflo
xaci
n
Cipr
oflo
xaci
nac
id Acet
oph
enon
e
Cycl
opro
-py
lam
ine
India consumption (tons per year) import (%)
Around 67% of all Pharma imports In India are from
China. As highlighted in the exhibit below, India imports most regular drug APIs, thus
presenting a huge opportunity for the domestic industry.
Organic Substrates
Fluorspar
HF
F2 Fluorination
Techniques to give F-Organic compound
F-Containing API
F-Containing Pharmaceutica
l Tablets
Formulation

June 2021 18
Specialty Chemicals
Rubber Chemical industry – replacement demand at rescue The Tyre industry constitutes ~65% of rubber chemical consumption.
Replacement demand accounts for 55% of total tyre volumes. India has been receiving a normal monsoon for the last two years and expects
a normal monsoon in CY21 as well, which should lead to better rural demand for new vehicles or replacement tyres once the economy open up post COVID.
The recent import restriction on various classes of tyres should aid domestic tyre companies’ operating rates. Domestic players like Apollo Tyres, CEAT, and MRF are planning to ramp up production as the Tyre industry is expected to witness considerable growth by FY23-end.
Exhibit 13: Global tyre investments over CY19-23 (%)
Source: Company, Bloomberg, MOFSL
Exhibit 14: Rising tyre demand (MT) in India
*Note FY21 data is not published yet Source: Industry, MOFSL
Surfactants industry (home care and personal care) Key trends which need to be monitored in coming years include: Fabric Care (laundry constitutes 70% of total home care demand) as a category
is expected to outperform over the next five years, with increasing penetration of washing machines (marking a shift to premium detergent from bar/powder).
The growing consciousness for hygiene due to the COVID-19 outbreak can act as a strong trigger for demand for disinfectants, and multi-purpose cleaners.
Younger population, the growing influence of social media, and rising share of e-commerce in home and personal care sales should ensure double-digit growth over the next five years.
In India, while 44% of consumers prefer premium home and personal care brands, 37% of consumers prefer premium ingredients over premium brands. ‘Free from claims’ based products are on the rise and the need of the hour, as it is milder, greener, cleaner, and safer products. Purchasing decisions of ~65% of Indian mothers for their kids are based on quality and safety of ingredients.
Flavors and Fragrances (F&F) and Nutraceutical ingredients Various key trends – growing demand for processed food, lifestyle changes,
rural penetration of FMCG products, etc. – would drive higher demand for flavors, fragrances, and other additives.
India, with its rich history in Ayurveda and related sciences, has become a meaningful player in natural nutraceutical ingredients. The emergence of various skin care brands would further drive demand for F&F and additives.
19
8
6 5
2 6 27
17
9 1 ChinaThailandIndiaVietnamIndonesiaRest of AsiaNorth AmericaEuropeAfrica/Middle EastOthers
1,0
06
1,0
84
1,1
66
1,1
44
1,1
71
1,2
34
1,3
63
1,3
22
529
486
534
594
631
744
835
701
1,535 1,570 1,700 1,738 1,802 1,978
2,198 2,024
FY13 FY14 FY15 FY16 FY17 FY18 FY19 FY20
Replacement OEM Total
Globally, Tyre manufacturers have lined up a capex of USD7b over
2019-23E (as highlighted in exhibit 15), which affirms
their confidence in the long-term growth of tyres

June 2021 19
Specialty Chemicals
Growing Digital Engagement Increasing number of Private Labels and
Startups in Niche Emerging Categories 3E’s - E-Commerce + Emerging Markets + Education = Higher Engagement +
Consumer Access and Spending
Exhibit 15: Factors driving strong demand growth for surfactants as well as additives and packaging industry
Source: Galaxy Surfactant, MOFSL
E-commerce a young business model Online sales of home and personal care products constitute just 6% of total
sales in India, whereas the same is 13%/34% in the US/China. The country is still taking baby steps as the per capita spending in India of USD205 is one-fifteenth that of the US and one-ninth of China.
Amid the COVID-19 outbreak, there has been a 9% increase in home deliveries from neighborhood stores as well as food aggregators over the last one year. Footfalls at various stores are down 10-25%. The same is down ~10%/~50% at neighboring stores/department stores and modern trade.
It would be fair to assume that even after the pandemic ends, the e-commerce sector can outgrow its previous levels; providing end-to-end shopping experience to customers – from the first to the last mile.
Higher e-commerce penetration to further boost Packaging industry The Indian Packaging market was valued at USD51b in CY19 and is expected to
touch USD205b by CY25, registering ~26% CAGR over CY19-25. Rapid growth in the market will be driven by Pharma and Foods and Beverages.
According to the Federation of Indian Chambers of Commerce & Industry (FICCI), the expenditure on packaged foods (is at an inflection point and) is increasing due to higher per capita income, urbanization, and an increase in the number of working women. The Ready-To-Cook Foods segment is seeing accelerated growth. Stand-up and pillow pouches are some of the most common types of pouches used in the country.
With internet penetration picking up in India, the next decade should see digitally-
influenced shoppers and a younger workforce willing to spend more on e-commerce.
By CY25, 25-30% of FMCG sales in India are expected to
be digitally-influenced
51 205
2019 2025
Indian Packaging industry(USD bn)
Since 2004-05, within the Female
Workforce, the percentage of women as salaried employees has increased from 3.7% to 10.5% in rural areas and from 35.6% to 52.1% in Urban Areas indicating more women moving from self employed jobs to regular salaried jobs. With literacy rates rising from 57% in 2004-05 to 69.6% in
2017-18 among females and female workers population ratio only being 16.5%, there is ample scope for growth in the coming decade (Source: PLFS 17-18)
17% of the Annual Income (average USD 6,000) of a working age Chinese female is spent on Personal Care Products, Apparels and services
By 2030, the global middle class is
expected to touch 5.3 Billion - additional 2 Billion people
from 2017 China and India together will account
for 59% of the Middle Class Consumption
India could be the World’s largest Middle Class consumer market surpassing both USA and China
Middle Class spending is expected to grow from USD 37 Trillion in 2017 to
USD 64 Trillion by 2030 accounting for 1/3rd GDP Growth globally (Source: EU Commission - Growing Consumerism)
Rising middle Class Female Employment Dynamics: India
Emerging Areas and Categories: Global Trends

June 2021 20
Specialty Chemicals
Specialty Chemicals: Genie is out!
Pg21 Ideogram of Integration
Pg29 Amoeba of growth
Pg52 Biggest beneficiary
of China+1
Pg45 Growing tall
Pg61 A pseudo FMCG company
Pg37 Preacher of purity
Pg68 Stable outlook ahead
Pg76 Multifold growth ahead

June 2021 21
Specialty Chemicals
Ideogram of Integration …subsidiaries and JVs to drive medium term growth
ATLP is the most integrated and a diversified Indian Specialty Chemicals company (present in both manufacturing and retail of over 900 products). It is the first private sector company of independent India, incorporated in CY47 and inaugurated by Mr. Jawaharlal Nehru (the first Prime Minister of the country).
It functions in two major categories: Life Science Chemicals and Performance and Other Chemicals. ATLP has ~13 operational subsidiaries and two joint ventures. It has 38,000+ retail outlets in India and also retails in neighboring countries.
Over FY20-21, ATLP incurred a capex of ~INR7b for capacity expansion/additions, which would result in a revenue potential of INR54b. We expect 13%/14% revenue/PAT CAGR over FY21-24E. We value the stock at 33x FY23E EPS to arrive at our TP of INR9,850. We initiate coverage with a Neutral rating.
Sheer focus on excellence and efficiencies The biggest advantage for ATLP is its capability of being backward
integrated, which has resulted in a decline in fixed costs, aiding margin. EBITDAM has grown to ~25% in FY21 from ~14% in FY15.
Continued focus on process cost efficiencies has led to a decrease in raw material consumption, improving yields on products.
The company has the potential to clock consolidated revenue of INR54b (at 90% capacity utilization) in the near term. We forecast 13% revenue CAGR over FY21-24E (v/s ~8% over FY15-20, FY21 saw a decline of 9% YoY).
Capacity additions in subsidiaries to drive major growth starting FY22 Atul Bioscience (100% stake) completed its first phase of investment of
INR1.1b at Ambernath, which has a revenue potential of INR2.7b, mainly from APIs and their intermediates.
Anaven, an equal JV with Nouryon, commenced the first phase of its manufacturing facility of monochloroacetic acid (MCA), built at an investment of INR2b in the latter part of FY21. The primary objective is to have sufficient capacity to meet the entire demand of MCA in India.
DPD (98% stake) completed at an investment of INR170m; has doubled capacity and now has a sales potential of INR500m.
Amal has shortlisted new expansion projects. Atul Rajasthan Date Palms further stabilized its operations. RACL strengthened its marketing presence (additional details about subsidiaries in the exhibit below).
Valuation and view – initiating coverage with a Neutral rating We assume EBITDAM to be ~25% (flat v/s FY21 levels) over next three years.
The company spends annually on debottlenecking and process efficiencies (as mentioned above), which presents an upside risk to our assumptions.
We built in a capex of INR7b over FY22-24E. ATLP turned net cash in FY21 and plans to fund capex via internal accruals only (FCF generation of INR18.7b over FY22-24E). Return ratios of 17-18% are likely going forward.
Initiating Coverage | Sector: Chemicals
Atul CMP: INR8,863 TP: INR9,850 (+11%) Neutral
BSE Sensex S&P CNX 52,550 15,748
Stock info Bloomberg ATLP IN Equity Shares (m) 30 M.Cap.(INRb)/(USDb) 262.3 / 3.5 52-Week Range (INR) 9132 / 4425 1, 6, 12 Rel. Per (%) -1/29/46
Financial Snapshot (INR b) Y/E March FY21 FY22E FY23E Sales 37,315 45,575 49,986 EBITDA 9,171 11,275 12,291 PAT 6,455 8,031 8,838 EPS (INR) 218.0 271.2 298.5 EPS Gr. (%) (2.3) 24.4 10.0 BV/Sh.(INR) 1,292.3 1,522.9 1,776.6 Ratios Net D:E (0.1) (0.1) (0.2) RoE (%) 18.5 19.3 18.1 RoCE (%) 17.8 18.6 17.7 Payout (%) 9.0 15.0 15.0 Valuations P/E (x) 40.6 32.6 29.6 P/BV (x) 6.8 5.8 5.0 EV/EBITDA (x) 28.3 22.8 20.5 Div. Yield (%) 0.2 0.5 0.5 FCF Yield (%) 1.5 1.5 2.7
Shareholding pattern (%) As On Mar-21 Dec-20 Mar-20 Promoter 44.9 44.8 44.8 DII 23.1 22.9 22.9 FII 9.5 9.4 9.4 Others 22.5 23.0 23.0 FII Includes depository receipts
Stock performance (one-year)

June 2021 22
Specialty Chemicals
Exhibit 1: Investment of INR4b in subsidiaries over the last two years to drive the growth
Source: Company, MOFSL
Exhibit 2: Retail portfolio primarily used in Auto, Agri, and Construction
Source: Company, MOFSL
Atul Bioscience (100% stake) will manufacture Pharma APIs at Ambernath. Capex of INR1.1b, sales potential of INR2.7b
ATLP spent INR170m in DPD (98% stake), potential sales of INR500m. It deals in Agri products and is based out of the UK.
Atul Rajasthan Date Palms is a 74:26 JV with the government of Rajasthan. It has commenced sales on a small scale.
ATLP holds a 50% stake in Amal, a listed company engaged in the manufacturing and marketing of sulfur-based products.
Rudolf Atul Chemicals (50% stake) offers a complete range of textile chemicals in the Indian market. Last year, it boosted its marketing efforts.
A 50:50 JV with Nouryon, it commenced operation to manufacture MCA in India in 2HFY21 at an investment of INR2b
LAPOX is an adhesive/solvent/mixture brand used for coating steel bars, bonding marble and granite, and fixing ply, glass, plastic, etc.
*POLYGRIP is a synthetic rubber based adhesive used in the Construction, Auto, Leather, and Footwear industry *LACARE is a lubricating and corrosion preventive spray
Crop Protection brands: It offers a complete range of herbicides, insecticides, and fungicides. ZURA and AMSAC are key products of ATLP in this category

June 2021 23
Specialty Chemicals
Life Science segment of ATLP The Crop Protection segment comprises of ~20 products and 70 formulations. Floods or famines may adversely affect demand. Fluctuations in foreign exchange may impact sales realizations. Caloric demand is estimated to increase by ~70%, with crop demand for human
consumption and animal feed likely to nearly double by CY50. Pharmaceuticals and Aromatics – API intermediates and ingredients This segment comprises ~76 products. Atul Bioscience (ABL) would contribute
to growth in this segment by increasing its R&D capabilities.
Aromatics – Intermediates, Perfumery, and others This segment comprises ~31 products. The world market for (a key product)
para-Cresol is estimated at 66ktpa. Earlier the product used to be manufactured in the UK, but now US, China, and India are major suppliers.
Performance and Other Chemicals segment of ATLP Bulk Chemicals and Intermediates: This segment comprises of ~23 products. Captive consumption of Bulk Chemicals is expected to grow as the company
expands manufacturing capacities for its various products.
Colors: This segment comprises of ~620 products and is used in the Textile, Paint and Coatings, and Paper industry. Rudolf Atul Chemicals (RACL), a joint venture formed in CY11-12, provides a
complete range of Textile Chemicals to the Indian market. ATLP, along with RACL, would participate in the growth by increasing its manufacturing and working capital efficiencies, and introducing new Dyes, Pigments, Textile Chemicals, and products for non-textile applications.
Treatment costs are expected to remain high because of stricter regulatory norms and increasing demand for cleaner/greener products from industries.
Polymers: This segment comprises ~96 synthetic products and 300 formulations. Cheaper imports and new entrants in the market would keep the market competitive and pressurize margin. Since the two main raw materials – Bisphenol-A and Epichlorohydrin – are imported, foreign exchange impacts margin.
Exhibit 3: Asia, Europe and North America (%)…
Source: Company, MOFSL
Exhibit 4: …remain key geographies (excluding India)
Source: Company, MOFSL
52
19
12
11 4 2 Revenue mix by geography (FY21)
India
Asia (ex- India)
Europe
N America
S America
Africa
20,211
7,385
4,664
4,275
1,555 777 Revenue by geography FY21 (INR m)
India
Asia (ex- India)
Europe
N America
S America
Africa
Key products manufactured in this segment are 2,4-D,
indoxacarb, and isoprothiolane
Dapsone, fluconazole, and metoprolol salts are key APIs.
Chloroformates and amino acid derivatives are key Intermediates
Few of the key products are para-Cresol, para-Anisic
aldehyde, and para-Cresidine
Mainly used for internal consumption, while Intermediates
are used by Cosmetic, Dyestuff, Pharma, and Tyre industries
Some of the key products are Pigment Red 168, Sulfur
Black 1, and Vat Green 1
B11, P62, and P101 are the key products used in Aerospace,
Auto, Construction, Defense, Electronics, Paper, Footwear,
Paint/Coatings, and Wind Energy

June 2021 24
Specialty Chemicals
Financial story in charts Leveraging legacy, continued process efficiencies, and subsidiaries to drive growth
Exhibit 5: Expect ~13% revenue CAGR over FY21-24E…
Source: Company, MOFSL
Exhibit 6: …with exports increasing by ~400bp to ~54%
Source: Company, MOFSL Exhibit 7: Expect EBITDAM to stabilize ~25%...
Source: Company, MOFSL
Exhibit 8: …along with PAT margin
Source: Company, MOFSL Exhibit 9: Capex for the next three years is ~INR7b…
Source: Company, MOFSL
Exhibit 10: …although the company to remain net cash
Source: Company, MOFSL
Exhibit 11: One year forward PE trades at 31.8x…
Source: Company, MOFSL
Exhibit 12: …with return ratios between 17%-19%
Source: Company, MOFSL
7 7 7 8 11 13 12 12 14 16 17 16 18 17 18 24 28 29 26 31 33 36 26
.1
28.3
27.6
30.0
35.6
42.1
42.1
38.9
45.6
50.0
54.2
FY14
FY15
FY16
FY17
FY18
FY19
FY20
FY21
FY22
E
FY23
E
FY24
E
Revenue INR b
Life Science chemicals PerformanceOthers Total
52 51 50 47 50 50 52 50 48 46 46
48 49 50 53 50 50 48 50 52 54 54
FY14
FY15
FY16
FY17
FY18
FY19
FY20
FY21
FY22
E
FY23
E
FY24
E
Revenue mix
Domestic Exports
3.6 4.0 4.6 5.1 5.1 7.7 9.0 9.2 11.3 12.3 13.3
14 14 17 17 15
19 22
25 25 25 24
FY14
FY15
FY16
FY17
FY18
FY19
FY20
FY21
FY22
E
FY23
E
FY24
E
INR b EBITDA Margin (%)
2.2 2.1 2.7 3.1 2.7 4.3 6.6 6.5 8.0 8.8 9.6
8 8 10 10
8 11
16 17 18 18 18 FY
14
FY15
FY16
FY17
FY18
FY19
FY20
FY21
FY22
E
FY23
E
FY24
E
INR b Adjusted PAT Margin (%)
13 43 10 61 72 66 172 134 130 235 265
1.1 1.8
3.7
2.1 1.4
2.1
3.7 3.2 3.0
2.0 2.0
FY14
FY15
FY16
FY17
FY18
FY19
FY20
FY21
FY22
E
FY23
E
FY24
E
FCF per share Capex (INR bn)4.2 3.6 3.5 1.8 0.6 1.2 1.0 1.0 0.5 0.3 0.1
4.0 3.3 3.3 1.7 0.1 0.7 0.6 -2.5 -5.0
-10.5 -16.8
FY14
FY15
FY16
FY17
FY18
FY19
FY20
FY21
FY22
E
FY23
E
FY24
E
INR b Debt Net Debt
31.8
14.4
31.8
3.7
21.8
7.0
2.0
12.0
22.0
32.0
42.0
Jun-
11
Jun-
12
Jun-
13
Jun-
14
Jun-
15
Jun-
16
Jun-
17
Jun-
18
Jun-
19
Jun-
20
Jun-
21
P/E (x) Avg (x) Max (x)Min (x) +1SD -1SD 26
18 18 18 13
17
22 18 19 18 17
19 15 15 16
12 16
21 18 19 18 17
FY14
FY15
FY16
FY17
FY18
FY19
FY20
FY21
FY22
E
FY23
E
FY24
E
RoE RoCE

June 2021 25
Specialty Chemicals
Valuation and view (TP: INR9,850; +11% upside) Initiate coverage with a Neutral rating
Owing to COVID-led challenges, demand is low for some of the company’s products. Projects under implementation are delayed by about six months. However, a recovery in demand for Colors and Polymers, along with a pick-up in Bulk Chemicals, is likely to boost volumes for the company in coming quarters.
ATLP plans to participate in the growth of the Crop Protection and Pharma segment by focusing on providing its customers with the best quality research and products, and securing access through additional registrations.
Fluctuations in foreign exchange may impact sales realizations. Thus, prices of some products may vary widely over the short-term.
The stock is trading at 30x FY23E EPS of INR299 and 21x FY23E EV/EBITDA. We expect 14% PAT CAGR over FY21-23E, with return ratios hovering at 17-19% over next three years. We value the company at 33x FY23E EPS to arrive at our TP of INR9,850. We initiate coverage on ATLP with a Neutral rating (owing to limited upside).
Delay in the recovery
of end-user industries would impact demand for chemicals
A further rise in raw material prices of phenol and methanol to impact current high margin.
Developing and growing its retail product portfolio to participate in the full value chain
Treatment costs (for chemicals) are expected to remain high because of stricter regulatory norms and increasing demand for cleaner/greener products
Demand and price of Bulk Chemicals are cyclical in nature. Fluctuations in foreign exchange may impact sales
Has investments in various subsidiaries, which are not operational and are loss making in nature
Increasing efficiency, productivity, and strengthening business processes each year drives EBITDAM improvement
Continues to broaden and deepen its presence in the marketplace
The company is also working to promote contract manufacturing
June 2021 26
Specialty Chemicals
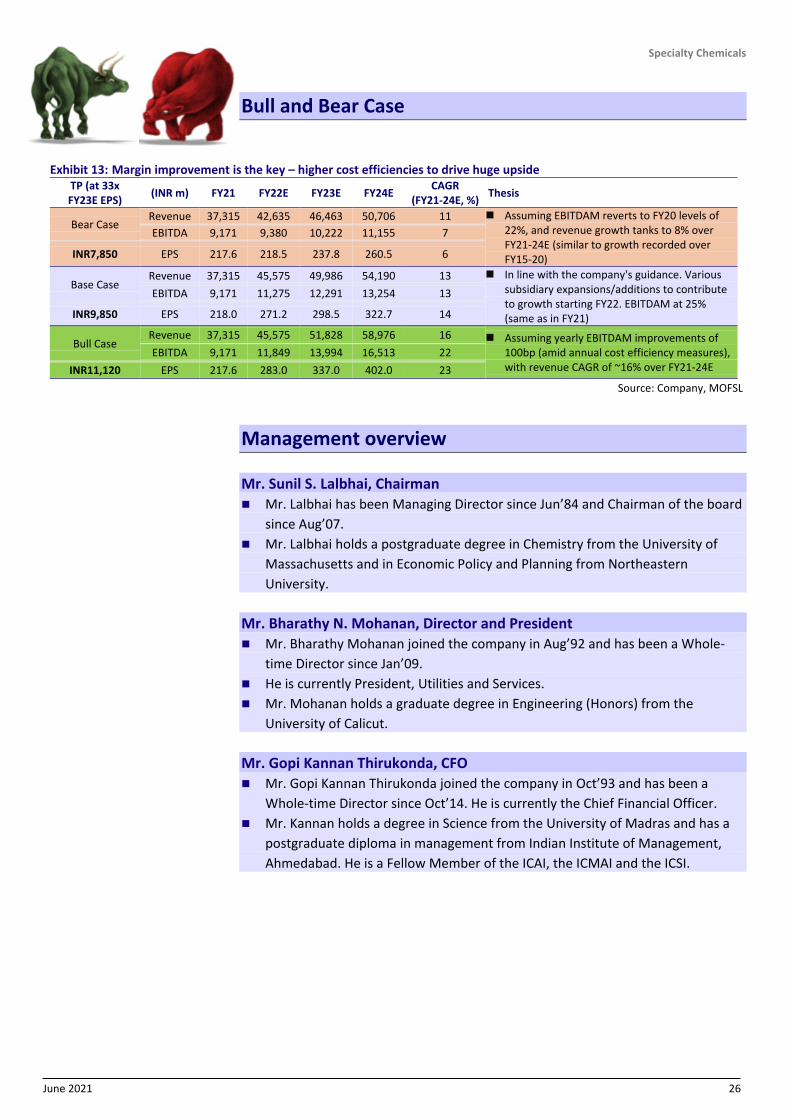
Bull and Bear Case
Exhibit 13: Margin improvement is the key – higher cost efficiencies to drive huge upside TP (at 33x FY23E EPS) (INR m) FY21 FY22E FY23E FY24E CAGR
(FY21-24E, %) Thesis
Bear Case Revenue 37,315 42,635 46,463 50,706 11 Assuming EBITDAM reverts to FY20 levels of
22%, and revenue growth tanks to 8% over FY21-24E (similar to growth recorded over FY15-20)
EBITDA 9,171 9,380 10,222 11,155 7
INR7,850 EPS 217.6 218.5 237.8 260.5 6
Base Case Revenue 37,315 45,575 49,986 54,190 13 In line with the company's guidance. Various
subsidiary expansions/additions to contribute to growth starting FY22. EBITDAM at 25% (same as in FY21)
EBITDA 9,171 11,275 12,291 13,254 13
INR9,850 EPS 218.0 271.2 298.5 322.7 14
Bull Case Revenue 37,315 45,575 51,828 58,976 16 Assuming yearly EBITDAM improvements of
100bp (amid annual cost efficiency measures), with revenue CAGR of ~16% over FY21-24E
EBITDA 9,171 11,849 13,994 16,513 22 INR11,120 EPS 217.6 283.0 337.0 402.0 23
Source: Company, MOFSL
Management overview Mr. Sunil S. Lalbhai, Chairman Mr. Lalbhai has been Managing Director since Jun’84 and Chairman of the board
since Aug’07. Mr. Lalbhai holds a postgraduate degree in Chemistry from the University of
Massachusetts and in Economic Policy and Planning from Northeastern University.
Mr. Bharathy N. Mohanan, Director and President Mr. Bharathy Mohanan joined the company in Aug’92 and has been a Whole-
time Director since Jan’09. He is currently President, Utilities and Services. Mr. Mohanan holds a graduate degree in Engineering (Honors) from the
University of Calicut.
Mr. Gopi Kannan Thirukonda, CFO Mr. Gopi Kannan Thirukonda joined the company in Oct’93 and has been a
Whole-time Director since Oct’14. He is currently the Chief Financial Officer. Mr. Kannan holds a degree in Science from the University of Madras and has a
postgraduate diploma in management from Indian Institute of Management, Ahmedabad. He is a Fellow Member of the ICAI, the ICMAI and the ICSI.

June 2021 27
Specialty Chemicals
Financials and valuations – ATLP
Consolidated – Income Statement (INR m) Y/E March FY16 FY17 FY18 FY19 FY20 FY21 FY22E FY23E FY24E Total Income from Operations 27,550 29,961 33,379 40,378 40,931 37,315 45,575 49,986 54,190 Change (%) -2.6 8.7 11.4 21.0 1.4 -8.8 22.1 9.7 8.4 Gross Margins (%) 51.8 52.1 46.0 47.8 51.9 54.6 52.3 51.3 50.4 EBITDA 4,592 5,095 5,052 7,668 9,020 9,171 11,275 12,291 13,254 Margin (%) 16.7 17.0 15.1 19.0 22.0 24.6 24.7 24.6 24.5 Depreciation 661 954 1,104 1,189 1,302 1,363 1,468 1,505 1,625 EBIT 3,932 4,140 3,948 6,479 7,718 7,808 9,807 10,787 11,629 Int. and Finance Charges 275 252 127 74 94 94 72 36 18 Other Income 344 526 259 349 780 1,030 1,094 1,157 1,255 PBT bef. EO Exp. 4,000 4,414 4,080 6,753 8,404 8,744 10,829 11,908 12,866 PBT after EO Exp. 4,000 4,414 4,080 6,753 8,404 8,744 10,829 11,908 12,866 Total Tax 1,302 1,227 1,310 2,443 1,745 2,217 2,726 2,997 3,238 Tax Rate (%) 32.6 27.8 32.1 36.2 20.8 25.3 25.2 25.2 25.2 Minority Interest 45 47 42 50 50 73 73 73 73 Reported PAT 2,743 3,234 2,812 4,360 6,709 6,600 8,031 8,838 9,555 Adjusted PAT 2,654 3,140 2,728 4,260 6,610 6,455 8,031 8,838 9,555 Change (%) 25.1 18.3 -13.1 56.2 55.2 -2.3 24.4 10.0 8.1 Margin (%) 9.6 10.5 8.2 10.5 16.1 17.3 17.6 17.7 17.6 Consolidated - Balance Sheet (INR m) Y/E March FY16 FY17 FY18 FY19 FY20 FY21 FY22E FY23E FY24E Equity Share Capital 297 297 297 297 297 296 296 296 296 Total Reserves 15,851 18,911 22,343 26,998 31,252 37,969 44,796 52,308 60,430 Net Worth 16,148 19,208 22,639 27,295 31,549 38,265 45,092 52,604 60,726 Total Loans 3,519 1,765 570 1,200 970 1,017 509 254 127 Deferred Tax Liabilities 794 998 1,296 1,395 1,148 1,351 1,351 1,351 1,351 Capital Employed 20,461 21,970 24,505 29,890 33,666 40,633 46,951 54,209 62,204 Gross Block 8,153 11,599 12,681 14,135 17,868 21,082 24,082 26,082 28,082 Less: Accum. Deprn. 658 1,608 2,678 3,643 4,946 6,309 7,777 9,281 10,906 Net Fixed Assets 7,495 9,990 10,003 10,491 12,922 14,773 16,306 16,801 17,176 Goodwill on Consolidation 0 0 238 323 291 291 291 291 291 Capital WIP 1,804 370 962 1,723 3,681 2,497 2,497 2,497 2,497 Total Investments 3,787 5,316 4,698 7,520 11,373 6,948 6,948 6,948 6,948 Curr. Assets, Loans&Adv. 11,704 10,522 14,234 15,382 13,236 24,863 31,583 39,379 47,983 Inventory 4,281 3,679 4,226 5,209 5,165 6,075 7,420 8,139 8,823 Account Receivables 4,414 5,071 7,234 6,985 7,197 7,332 8,955 9,822 10,648 Cash and Bank Balance 220 72 494 545 354 3,482 5,469 10,738 16,933 Cash 181 234 427 376 262 469 2,456 7,725 13,920 Bank Balance 39 49 67 169 92 3,013 3,013 3,013 3,013 Loans and Advances 2,789 1,700 2,280 2,644 520 7,973 9,738 10,681 11,579 Curr. Liability & Prov. 4,330 4,228 5,630 5,550 7,838 8,739 10,673 11,707 12,691 Account Payables 3,151 3,291 4,590 3,796 4,776 5,631 6,878 7,544 8,178 Other Current Liabilities 930 660 753 1,264 2,485 2,477 3,025 3,318 3,597 Provisions 248 277 287 490 577 631 770 845 916 Net Current Assets 7,374 6,294 8,604 9,832 5,398 16,124 20,909 27,672 35,292 Appl. of Funds 20,460 21,970 24,505 29,890 33,666 40,633 46,951 54,209 62,204 E: MOFSL Estimates

June 2021 28
Specialty Chemicals
Financials and valuations – ATLP
Ratios Y/E March FY16 FY17 FY18 FY19 FY20 FY21 FY22E FY23E FY24E Basic (INR) EPS 89.6 106.0 92.1 143.9 223.2 218.0 271.2 298.5 322.7 EPS Growth (%) 25.1 18.3 -13.1 56.2 55.2 -2.3 24.4 10.0 8.1 Cash EPS 111.9 138.3 129.4 184.0 267.2 264.0 320.8 349.3 377.6 BV/Share 545 649 765 922 1,065 1,292 1,523 1,777 2,051 DPS 9.1 12.5 13.0 13.4 37.8 20.0 40.7 44.8 48.4 Payout (%) 9.8 11.4 13.7 9.1 16.7 9.0 15.0 15.0 15.0 Valuation (x) P/E 98.8 83.5 96.1 61.5 39.6 40.6 32.6 29.6 27.4 Cash P/E 79.1 64.0 68.4 48.1 33.1 33.5 27.6 25.3 23.4 P/BV 16.2 13.6 11.6 9.6 8.3 6.8 5.8 5.0 4.3 EV/Sales 9.6 8.8 7.9 6.5 6.4 7.0 5.6 5.0 4.5 EV/EBITDA 57.8 51.8 51.9 34.3 29.1 28.3 22.8 20.5 18.5 Dividend Yield (%) 0.1 0.1 0.1 0.2 0.4 0.2 0.5 0.5 0.5 FCF per share 10.4 60.7 71.8 65.9 171.6 133.9 129.8 235.0 265.0 Return Ratios (%) RoE 17.6 17.8 13.0 17.1 22.5 18.5 19.3 18.1 16.9 RoCE 14.9 15.9 12.3 16.0 21.2 17.8 18.6 17.7 16.6 RoIC 19.5 19.4 15.5 21.5 31.9 25.4 24.6 24.4 24.9 Working Capital Ratios Fixed Asset Turnover (x) 4.3 3.4 3.3 3.9 3.5 2.7 2.9 3.0 3.2 Asset Turnover (x) 1.3 1.4 1.4 1.4 1.2 0.9 1.0 0.9 0.9 Inventory (Days) 57 45 46 47 46 59 59 59 59 Debtor (Days) 58 62 79 63 64 72 72 72 72 Creditor (Days) 42 40 50 34 43 55 55 55 55 Leverage Ratio (x) Current Ratio 2.7 2.5 2.5 2.8 1.7 2.8 3.0 3.4 3.8 Net Debt/Equity 0.2 0.1 0.0 0.0 0.0 -0.1 -0.1 -0.2 -0.3 Consolidated - Cash Flow Statement (INR m) Y/E March FY16 FY17 FY18 FY19 FY20 FY21 FY22E FY23E FY24E OP/(Loss) before Tax 4,045 4,461 4,122 6,803 8,454 8,817 10,829 11,908 12,866 Depreciation 661 954 1,104 1,189 1,302 1,363 1,468 1,505 1,625 Interest Expenses 275 252 127 74 94 94 72 36 18 Direct Taxes Paid -1,098 -820 -1,054 -2,541 -2,168 -2,023 -2,726 -2,997 -3,238 (Inc)/Dec in WC -2 -551 -594 -1,427 1,667 -246 -2,798 -1,495 -1,424 CF from Operations 4,010 3,918 3,557 4,036 8,813 7,179 6,845 8,957 9,846 (Inc)/Dec in FA -3,701 -2,120 -1,430 -2,084 -3,733 -3,214 -3,000 -2,000 -2,000 Free Cash Flow 309 1,797 2,127 1,953 5,080 3,965 3,845 6,957 7,846 Change in Investments -79 196 6 -1,994 -4,344 -3,900 0 0 0 CF from Investments -3,748 -1,732 -1,302 -4,075 -7,827 -6,464 -3,000 -2,000 -2,000 Inc/(Dec) in Debt 357 -1,429 -1,518 389 537 182 -509 -254 -127 Interest Paid -260 -273 -129 -74 -94 -87 -72 -36 -18 Dividend Paid -304 -357 -381 -412 -1,515 0 -1,205 -1,326 -1,433 CF from Fin. Activity -207 -2,059 -2,028 -98 -1,072 96 -1,785 -1,616 -1,578 Inc/Dec of Cash 55 126 228 -137 -86 811 2,060 5,341 6,268 Opening Balance 310 181 234 427 376 262 469 2,456 7,725 Closing Balance 364 307 462 290 290 1,073 2,529 7,797 13,992

June 2021 29
Specialty Chemicals
Ameoba of growth …most lucrative profile in the entire space
DN is an intermediate chemical company, with a diversified business of Basic Chemicals, Fine and Specialty Chemicals, and Performance Products. It has a wholly owned subsidiary called Deepak Phenolic Limited (DPL). Through DPL, it has substituted a majority of its imports of phenol and acetone, and reportedly attained ~65% market share in the country.
It further plans to expand its footprint in high-value intermediates to capitalize and synergize DN with DPL, and has announced a new subsidiary called Deepak Clean Tech. Deepak Clean Tech is a new division, with a new product range, which would be both growth and margin accretive.
Capex of INR4-6b is likely each year (the company has announced a capex of INR4b in DN), resulting in revenue growth of ~60% over FY21-24E (CAGR of 17%), with attractive return ratios of 29-31%. We value DN at 28x FY23E EPS to arrive at our TP of INR2,300. We initiate coverage with a Buy rating.
Achieved huge success with DPL DPL, a wholly-owned subsidiary of DN, began commercial production at its
mega phenol and acetone facility at Dahej, Gujarat in Nov’18. This facility has an installed capacity of 200ktpa/120ktpa of phenol/acetone and 260ktpa of cumene for captive consumption.
The clear objective of foraying into these products was to substitute imports. DN has achieved this objective by establishing itself as the most reliable player (domestic market share touched ~65% in the first year itself).
In line with its objective of moving into value-added downstream products, with captive raw material consumption, DPL is expanding its 30ktpa IPA manufacturing plant to 60ktpa (likely commissioning in 1HFY22).
Fine and Specialty Chemicals to drive growth for DN Backed by a diversified portfolio mix, DN continues to leverage export
demand for Fine and Specialty Chemicals as large global customers shift to high-quality products and diversify away from China.
Recently, DN launched two products in Pharmaceuticals and Agrochemicals, respectively. The management believes that the Fine and Specialty Chemical segment would continue to deliver stellar performance in coming years, realizing the solid gains accruing from further integration initiatives, and capacity expansion in established products. In Basic Chemicals, it would continue leveraging its cost leadership position to drive market share gains.
Valuation and view – initiating coverage with a Buy rating The company is planning further forward integration in its product portfolio,
based on photo-chlorination and fluorination platforms. Factoring in all of the above, we expect ~17%/19% revenue/PAT CAGR over
FY21-24E. We expect EBITDAM to normalize ~27% from current levels, resulting in 15% EBITDA CAGR over the same period.
Despite a capex of INR12b over the next three years, it is expected to turn net cash positive by FY23E, with FCF generation of INR23b over FY22-24E.
Initiating Coverage | Sector: Chemical
Deepak Nitrite CMP: INR1,760 TP: INR2,300 (+31%) Buy
BSE Sensex S&P CNX 52,550 15,748
Stock info Bloomberg DN IN Equity Shares (m) 136 M.Cap.(INRb)/(USDb) 240.5 / 3.2 52-Week Range (INR) 1989 / 474 1, 6, 12 Rel. Per (%) -4/86/206
Financial Snapshot (INR b) Y/E March FY21 FY22E FY23E Sales 43,598 53,695 61,270 EBITDA 12,470 13,911 16,490 PAT 7,758 9,200 11,204 EPS (INR) 56.9 67.4 82.1 EPS Gr. (%) 27.0 18.6 21.8 BV/Sh.(INR) 172.0 229.4 299.2 Ratios Net D:E 0.2 0.0 (0.1) RoE (%) 39.6 33.6 31.1 RoCE (%) 29.4 29.1 29.0 Payout (%) 9.7 15.0 15.0 Valuations P/E (x) 31.1 26.2 21.5 P/BV (x) 10.3 7.7 5.9 EV/EBITDA (x) 19.8 17.4 14.3 Div. Yield (%) 0.3 0.6 0.7 FCF Yield (%) 3.3 2.4 3.2
Shareholding pattern (%) As On Mar-21 Dec-20 Mar-20 Promoter 45.7 45.7 45.7 DII 11.6 10.5 10.5 FII 11.9 13.3 13.3 Others 30.8 30.5 30.5 FII Includes depository receipts
Stock Performance (1-year)

June 2021 30
Specialty Chemicals
Exhibit 14: Expect consolidated revenue CAGR of ~17%…
Source: Company, MOFSL
Exhibit 15: …with a stable export mix
Source: Company, MOFSL
Product segments for DN Basic Chemicals are typically manufactured in standard specifications. DN has cost leadership in this space, which drives growth and profitability for these high-volume and extremely price sensitive products. It manufactures nitrites, nitro toluidine, and fuel additives. The Fine and Specialty Chemicals segment produces specialized and niche compounds that require technical skills and technological competencies in handling potentially complex reactions. DN manufactures products (like xylidines, oximes, and cumidines) that are
specially customized as per the clients’ requirements. These are typically manufactured in lower volumes, but command higher value and profitability.
It has witnessed increased export demand on the back of the China+1 strategy. Performance Products: DN is a fully integrated manufacturer of Optical Brightening Agent (OBA), which is backward integrated from the basic building block up to the feedstock of toluene to PNT and further into DASDA. OBA has strengthened its competitive edge. These products have strict requirements in terms of performance and technical specifications. Over the years, the management has targeted and built a robust global customer network.
Exhibit 16: Achieved ~90% utilization rate in its Phenolics business in the first year (FY20), currently operating at 115%
Source: MOFSL
Exhibit 17: DPL constitutes over 50% of consolidated revenue, which is likely to stay at current levels
Source: Company, MOFSL
14 14 15 15 17 18 23 18 24 27 31 9 19 25
29 34 39
13.7
14.2
14.6
14.5
16.8
27.0
42.3
43.6
53.7
61.3
69.9
FY14
FY15
FY16
FY17
FY18
FY19
FY20
FY21
FY22
E
FY23
E
FY24
E
Revenue INR b
Deepak Nitrite Ltd. Deepak Phenolics Ltd. Total
63%
63%
60%
61%
58%
68%
72%
72%
72%
72%
72%
39%
39%
40%
39%
42%
32%
28%
28%
28%
28%
28%
FY14
FY15
FY16
FY17
FY18
FY19
FY20
FY21
FY22
E
FY23
E
FY24
E
Revenue INR b Domestic Exports
7 7 7 7 8 9 9 8 10 11 12 4 3 4 4 5 5 6 8 9 10 12 2 3 3 2 3 4 8 3 6 7 8
- 9
20 26 29
34 39
13 13 13 13 15
27
43 44 54
61 70
FY14
FY15
FY16
FY17
FY18
FY19
FY20
FY21
FY22
E
FY23
E
FY24
E
Revenue INR b
Basic Chemicals Fine & Specialty Chemicals Performance Products PhenolicsTotal revenue
58 56 50 55 50 33 22 17 18 17 17
28 24 29 29 30
20 14 17 16 17 17
14 20 20 16 20
15
18 7 11 11 11
32 47 58 55 55 56
FY14 FY15 FY16 FY17 FY18 FY19 FY20 FY21 FY22EFY23EFY24E
Revenue mix (%)
Basic Chemicals Fine & Specialty Chemicals Performance Products Phenolics
Basic Chemicals applications: Dyes and
Pigments, Pharma, Agro, concrete mixture, Water
Treatment, Rubber, Steel, and Glass industries
Fine and Specialty Chemicals applications: Agrochemicals,
Pigments, Pharma, and Personal Care segments
Performance Products applications: Paper,
Detergents, and Textiles.
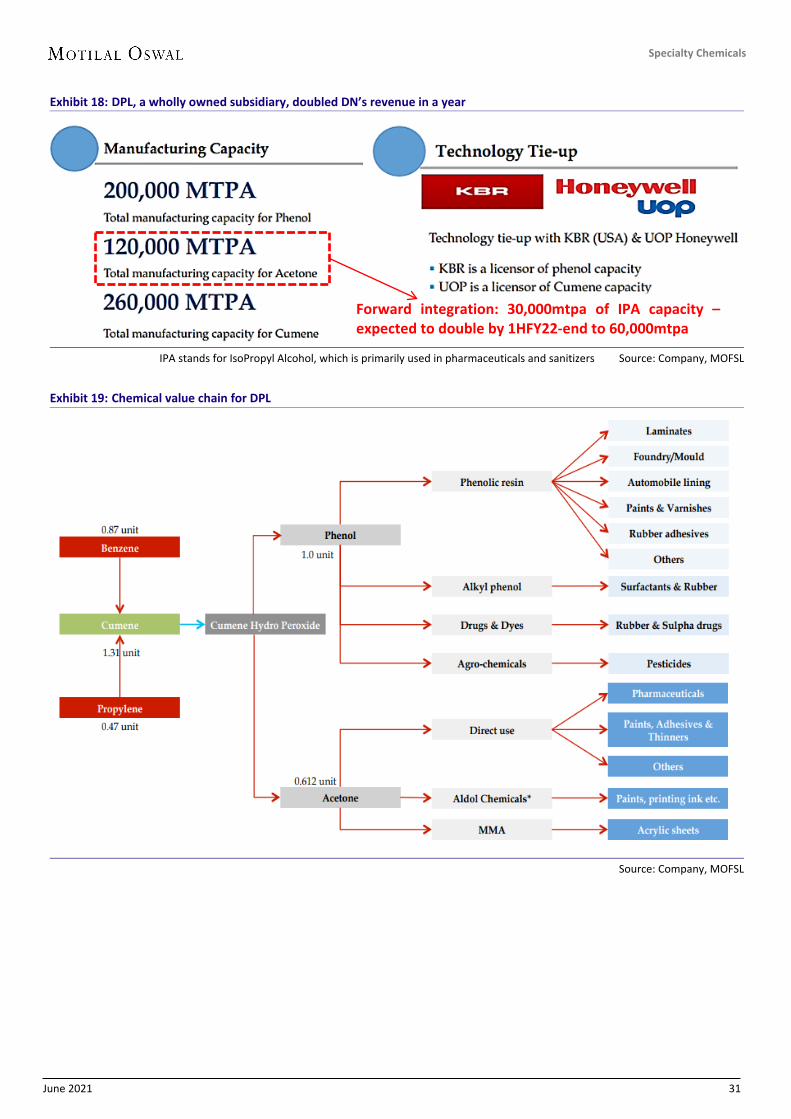
June 2021 31
Specialty Chemicals
Exhibit 18: DPL, a wholly owned subsidiary, doubled DN’s revenue in a year
IPA stands for IsoPropyl Alcohol, which is primarily used in pharmaceuticals and sanitizers Source: Company, MOFSL
Exhibit 19: Chemical value chain for DPL
Source: Company, MOFSL
Forward integration: 30,000mtpa of IPA capacity – expected to double by 1HFY22-end to 60,000mtpa

June 2021 32
Specialty Chemicals
Financial story in charts Focus on new business opportunities with cost leadership to continue
Exhibit 20: Expect EBIT CAGR of ~16% over FY21-24E (as per company’s segmental guidance)…
Source: Company, MOFSL
Exhibit 21: …with Fine and Specialty Chemicals enjoying the highest EBIT margin
Source: Company, MOFSL
Exhibit 22: EBITDAM to normalize from FY21 levels
Source: Company, MOFSL
Exhibit 23: Expect ~19% PAT CAGR over FY21-24E
Source: Company, MOFSL
Exhibit 24: DN to incur ~INR12b on capex over FY22-24…
Source: Company, MOFSL
Exhibit 25: …but is likely to turn net cash positive in FY23E
Source: Company, MOFSL
Exhibit 26: One year forward PE trades at 24.8x…
Source: Company, MOFSL
Exhibit 27: …with return ratios between 29%-31%
Source: Company, MOFSL
1 1 2 2 4 4 8 6 7 7 8 1
2 6 6 7
8
1.3
1.4 1.7
1.6 3.
7 4.5
9.9 11
.8
12.4
14.1
16.1
FY14
FY15
FY16
FY17
FY18
FY19
FY20
FY21
FY22
E
FY23
E
FY24
E
Normalised EBIT (INR b)
DNL DPL Total EBIT
0%
25%
50%
75%
FY14
FY15
FY16
FY17
FY18
FY19
FY20
FY21
FY22
E
FY23
E
FY24
E
EBIT margin Basic Chemicalsfine & Specialty Chemicals Performance ProductsPhenolics
1.1
1.4
1.7
1.4
2.0
4.1
10.3
12.5
13.9
16.5
18.9
8 10 11 9 12 15
24 29 26 27 27
FY14
FY15
FY16
FY17
FY18
FY19
FY20
FY21
FY22
E
FY23
E
FY24
E
EBITDA (INR b) Margin (%)
0.4
0.5
0.6
0.5
0.8
1.7
6.1
7.8
9.2
11.2
13.1
3 4 4 3 5 6
14 18 17 18 19
FY14
FY15
FY16
FY17
FY18
FY19
FY20
FY21
FY22
E
FY23
E
FY24
E
Adj. PAT (INR b) Margin (%)
-8
0 6
-14 -32 -13
26 58 41 57 70
1.0 1.0 0.9 2.4
6.2
2.4 4.2
2.1 4.0 4.0 4.0
FY14
FY15
FY16
FY17
FY18
FY19
FY20
FY21
FY22
E
FY23
E
FY24
E
FCF per share Capex (INR mn)
5.0 5.4 5.3 7.2 9.9
12.3 10.3 5.3
2.6 1.3 0.7 4.9 5.4 5.2 7.1
9.4 12.0 10.0
4.9 1.0
-5.0 -12.4
FY14
FY15
FY16
FY17
FY18
FY19
FY20
FY21
FY22
E
FY23
E
FY24
E
INR b Debt Net Debt
24.8
13.1
26.7
5.3
19.3
7.0 4.0
12.0
20.0
28.0
Jun-
11
Jun-
12
Jun-
13
Jun-
14
Jun-
15
Jun-
16
Jun-
17
Jun-
18
Jun-
19
Jun-
20
Jun-
21
P/E (x) Avg (x) Max (x)Min (x) +1SD -1SD
13 16 15 8 10
17
46 40
34 31 28
8 9 9 6 6 11
28 29
29 29 27
FY14
FY15
FY16
FY17
FY18
FY19
FY20
FY21
FY22
E
FY23
E
FY24
E
RoE RoCE

June 2021 33
Specialty Chemicals
Valuation and view (TP: INR2,300; +31% upside) Initiate coverage with a Buy rating
The company has manufacturing facilities at Nandesari and Dahej in Gujarat (Basic and Fine and Specialty Chemicals); Roha (intermediates for Agrochem, Dyes, and Specialty Chemicals) and Taloja (Synthetic Organic Chemicals and Fine and Specialty Chemicals) in Maharashtra; and Hyderabad (optical brightness intermediates and DADSA).
DPL’s plant is situated at Dahej. Development works are being undertaken on (127 acre) land parcel procured in CY20 in Dahej. Capex of INR3b spent on Phase II at Dahej, which would result in huge value unlocking for the company.
The Dyes segment of DN, which was recovering slower post the lifting of the COVID-led lockdowns, performed well in 4QFY21. A further recovery in demand for OBA and DASDA (i.e performance chemicals) is expected over FY22, while demand for Agrochemical and Personal Care products continues to be robust.
Huge opportunities ahead for DPL – as phenol plants in the US are facing challenges. China has also started importing phenols. Imports in India are growing strong due to lack of supply and higher freight rates (expect domestic demand CAGR of 10-12%).
Expansion of IPA would result in further import substitution for the company. DN has not announced any growth capex in the Phenolics business. DPL’s plants were operating at a 115% utilization rate in FY21. We believe debottlenecking capex or additional expansion of capacities would lead to huge growth in this segment.
We value the company at 28x FY23E EPS to arrive at our TP of INR2,300. We initiate coverage on DN with a Buy rating (one of the best ROE profile amongst our coverage).
Slowdown in basic and
performance chemicals would significantly impact DN’s business
Global competition is huge and the company may face problems in attracting new customers
Import substitution has been a key objective of the company over the years. Thus, further expansions would achieve higher domestic market share
Huge opportunity for phenols in India (even VO is expanding its Butyl Phenol plant – which uses phenol as feedstock from DN)
Any adverse movement in raw materials and foreign exchange risk could have an adverse impact on margin and profitability
Phenols saw stellar performance in FY21 on the back of increased realization – any drastic normalization would impact growth
Diversified product offerings, which meet niche customer requirements
The company undertakes expansion only after tying up its capacities or visibility from its customers
Presence in 30 nations and six continents aids global positioning

June 2021 34
Specialty Chemicals
Bull and Bear Case
Exhibit 28: Revival in DN’s businesses and growth in DPL remain key TP (at 28x FY23E EPS) (INR m) FY21 FY22E FY23E FY24E CAGR
(FY21-24E, %) Thesis
Bear Case Revenue 43,598 49,664 55,107 61,189 12 Much slower recovery in the Performance Products business, with flattish improvement in Phenolics as the sharp increase in realization falls to FY20 levels
EBITDA 12,470 11,388 12,500 13,722 3
INR1,765 EPS 59.4 56.1 63.0 70.1 6
Base Case Revenue 43,598 53,695 61,270 69,933 17 Estimate ~17% revenue CAGR over FY21-24E on the back of improved performance, with EBIT margin as per the company's guidance
EBITDA 12,470 13,911 16,490 18,942 15 INR2,300 EPS 56.9 67.4 82.1 95.7 19
Bull Case Revenue 43,598 55,357 65,470 77,510 21 Assuming EBIT margin sustains at FY21 levels
(~29%), with ~20% growth in Fine and Specialty Chemicals and quicker revival in Performance Products
EBITDA 12,470 15,990 19,480 23,101 23
INR2,890 EPS 59.4 82.6 103.3 124.3 28
Source: Company, MOFSL
Management overview Mr. Deepak C. Mehta, Chairman Mr. Mehta is a science graduate from the University of Mumbai and is at the
helm of affairs at DN for the last 48 years. An active participant in industry forums, he is the Chairman of Gujarat State
Council – The Federation of Indian Chambers of Commerce and Industry (FICCI). He is also the Chairman of National Chemicals Committee of FICCI.
Mr. Mehta has been a member of the Task Force on Chemical Industry, constituted by the government with an objective of creating a strategy for increasing competitiveness of the Indian Chemical industry.
Mr. Maulik D. Mehta, CEO Mr. Mehta has been appointed as the Executive Director and CEO of the
company with effect from 1st Jun’20. He has a Bachelor of Business Administration from the University of Liverpool,
UK. He holds a Masters in Industrial and Organizational Psychology from Columbia University, US. He is part of Harvard Business School’s prestigious Owner/President Management program.
He possesses around 12 years of experience. Over the years, he has built up a diversified profile and has served in varied capacities/functions in the organization, including Product Head, Profit Centre Head, Group SBU Head, and was till recently responsible for the day-to-day business of all verticals.
Mr. Sanjay Upadhyay, CFO Mr. Upadhyay is an Associate Member of The Institute of Cost Accountants of
India. He has completed an Advanced Management Program from Wharton, US. He has vast experience in the areas of finance, accounts, commercial, and secretarial functions.
He has been associated with the company since CY94. He has held important positions of Director-Finance and CFO in CY17 prior to joining the board.

June 2021 35
Specialty Chemicals
Financials and valuations – DN
Consolidated – Income Statement (INR m) Y/E March FY16 FY17 FY18 FY19 FY20 FY21 FY22E FY23E FY24E Total Income from Operations 14,571 14,547 16,762 26,999 42,297 43,598 53,695 61,270 69,933 Change (%) 3.0 -0.2 15.2 61.1 56.7 3.1 23.2 14.1 14.1 Gross Margins (%) 43.3 41.9 38.0 39.0 43.9 48.1 44.5 45.2 45.0 EBITDA 1,668 1,355 1,963 4,139 10,258 12,470 13,911 16,490 18,942 Margin (%) 11.4 9.3 11.7 15.3 24.3 28.6 25.9 26.9 27.1 Depreciation 395 480 526 778 1,397 1,526 1,515 1,604 1,693 EBIT 1,273 874 1,437 3,361 8,861 10,944 12,396 14,886 17,249 Int. and Finance Charges 397 341 451 832 1,149 742 316 158 79 Other Income 16 109 123 151 352 215 215 245 280 PBT bef. EO Exp. 891 642 1,109 2,680 8,064 10,417 12,294 14,972 17,450 EO Items 0 705 0 0 0 0 0 0 0 PBT after EO Exp. 891 1,347 1,109 2,680 8,064 10,417 12,294 14,972 17,450 Total Tax 262 382 318 943 1,954 2,659 3,095 3,769 4,392 Tax Rate (%) 29.4 28.4 28.7 35.2 24.2 25.5 25.2 25.2 25.2 Reported PAT 627 963 790 1,737 6,110 7,758 9,200 11,204 13,058 Adjusted PAT 627 458 790 1,737 6,110 7,758 9,200 11,204 13,058 Change (%) 18.6 -26.9 72.4 119.8 251.9 27.0 18.6 21.8 16.5 Margin (%) 4.3 3.2 4.7 6.4 14.4 17.8 17.1 18.3 18.7 Consolidated - Balance Sheet Y/E March FY16 FY17 FY18 FY19 FY20 FY21 FY22E FY23E FY24E Equity Share Capital 233 261 273 273 273 273 273 273 273 Total Reserves 4,496 6,887 8,949 10,443 15,446 23,194 31,014 40,537 51,636 Net Worth 4,729 7,149 9,221 10,716 15,719 23,467 31,286 40,810 51,909 Total Loans 5,288 7,239 9,866 12,286 10,279 5,271 2,636 1,318 659 Deferred Tax Liabilities 567 391 454 775 796 1,078 1,078 1,078 1,078 Capital Employed 10,583 14,778 19,541 23,776 26,794 29,816 35,000 43,206 53,646 Gross Block 8,842 6,106 6,403 17,749 20,460 22,304 26,304 30,304 34,304 Less: Accum. Deprn. 2,924 306 528 743 2,140 3,666 5,182 6,786 8,479 Net Fixed Assets 5,918 5,801 5,875 17,006 18,320 18,637 21,122 23,518 25,825 Capital WIP 319 3,492 9,545 339 1,723 2,068 2,068 2,068 2,068 Total Investments 866 1,198 318 24 24 1,893 1,893 1,893 1,893 Curr. Assets, Loans&Adv. 5,838 7,385 10,167 11,910 12,019 13,005 16,535 23,208 32,385 Inventory 1,210 1,671 3,272 4,107 3,945 3,827 4,899 5,514 6,279 Account Receivables 3,132 3,603 4,118 5,750 6,127 7,563 7,778 8,876 10,131 Cash and Bank Balance 65 145 482 258 314 334 1,785 6,453 13,276
Cash 48 58 94 30 21 89 1,539 6,207 13,030 Bank Balance 17 87 388 228 293 245 245 245 245
Loans and Advances 1,431 1,965 2,296 1,795 1,633 1,281 2,073 2,366 2,700 Curr. Liability & Prov. 2,358 3,097 6,364 5,502 5,292 5,787 6,617 7,481 8,525 Account Payables 1,331 2,146 5,953 4,724 3,643 4,367 4,523 5,091 5,797 Other Current Liabilities 776 832 280 587 1,385 1,144 1,758 2,006 2,290 Provisions 251 119 132 191 264 276 336 383 437 Net Current Assets 3,480 4,288 3,803 6,408 6,727 7,218 9,918 15,727 23,860 Appl. of Funds 10,583 14,779 19,541 23,776 26,794 29,816 35,000 43,206 53,646 E: MOFSL Estimates

June 2021 36
Specialty Chemicals
Financials and valuations – DN
Ratios Y/E March FY16 FY17 FY18 FY19 FY20 FY21 FY22E FY23E FY24E Basic (INR) EPS 4.6 3.4 5.8 12.7 44.8 56.9 67.4 82.1 95.7 Cash EPS 7.5 6.9 9.6 18.4 55.0 68.1 78.6 93.9 108.1 BV/Share 34.7 52.4 67.6 78.6 115.2 172.0 229.4 299.2 380.6 DPS 1.0 1.1 1.3 6.5 4.5 5.5 10.1 12.3 14.4 Payout (%) 26.8 19.6 27.0 61.6 12.1 9.7 15.0 15.0 15.0 Valuation (x) P/E 384.9 526.6 305.5 139.0 39.5 31.1 26.2 21.5 18.5 Cash P/E 236.1 257.2 183.4 96.0 32.2 26.0 22.5 18.8 16.4 P/BV 51.1 33.8 26.2 22.5 15.4 10.3 7.7 5.9 4.7 EV/Sales 16.9 17.1 15.0 9.4 5.9 5.7 4.5 3.9 3.3 EV/EBITDA 147.9 183.4 127.8 61.2 24.5 19.8 17.4 14.3 12.1 Dividend Yield (%) 0.1 0.1 0.1 0.4 0.3 0.3 0.6 0.7 0.8 FCF per share 5.9 -14.1 -32.1 -13.3 25.6 58.0 42.4 57.4 69.8 Return Ratios (%) RoE 15.3 7.7 9.7 17.4 46.2 39.6 33.6 31.1 28.2 RoCE 9.1 5.6 6.5 10.5 27.6 29.4 29.1 29.0 27.1 RoIC 9.9 6.5 10.7 13.5 28.0 32.4 33.9 35.9 37.3 Working Capital Ratios Fixed Asset Turnover (x) 2.6 2.5 2.9 2.4 2.4 2.4 2.7 2.7 2.8 Asset Turnover (x) 1.4 1.0 0.9 1.1 1.6 1.5 1.5 1.4 1.3 Inventory (Days) 30 42 71 56 34 32 33 33 33 Debtor (Days) 78 90 90 78 53 63 53 53 53 Creditor (Days) 33 54 130 64 31 37 31 30 30 Leverage Ratio (x) Current Ratio 2.5 2.4 1.6 2.2 2.3 2.2 2.5 3.1 3.8 Net Debt/Equity 1.1 1.0 1.0 1.1 0.6 0.2 0.0 -0.1 -0.2 Consolidated - Cash Flow Statement (INR m) Y/E March FY16 FY17 FY18 FY19 FY20 FY21 FY22E FY23E FY24E OP/(Loss) before Tax 891 1,347 1,109 2,680 8,064 10,417 12,294 14,972 17,450 Depreciation 395 480 528 778 1,397 1,526 1,515 1,604 1,693 Others 403 -403 481 829 1,262 853 316 158 79 Direct Taxes Paid -188 -162 -279 -561 -1,985 -2,365 -3,095 -3,769 -4,392 (Inc)/Dec in WC 171 -772 -9 -3,123 -1,092 -440 -1,249 -1,142 -1,310 CF from Operations 1,673 490 1,830 603 7,647 9,991 9,782 11,825 13,519 (Inc)/Dec in FA -865 -2,412 -6,206 -2,410 -4,160 -2,086 -4,000 -4,000 -4,000 Free Cash Flow 808 -1,922 -4,376 -1,808 3,487 7,905 5,782 7,825 9,519 CF from Investments -1,694 -3,526 -5,247 -1,626 -4,279 -3,962 -4,000 -4,000 -4,000 Inc/(Dec) in Debt -254 2,160 2,626 2,033 -1,088 -5,217 -2,636 -1,318 -659 Interest Paid -372 -342 -450 -841 -1,134 -736 -316 -158 -79 Dividend Paid -125 -167 -188 -213 -1,060 -4 -1,380 -1,681 -1,959 CF from Fin. Activity 51 3,046 3,453 958 -3,376 -5,962 -4,332 -3,157 -2,697 Inc/Dec of Cash 30 10 36 -64 -8 67 1,450 4,668 6,823 Opening Balance 17 47 58 94 30 22 89 1,540 6,208 Closing Balance 47 58 94 30 22 89 1,540 6,208 13,030
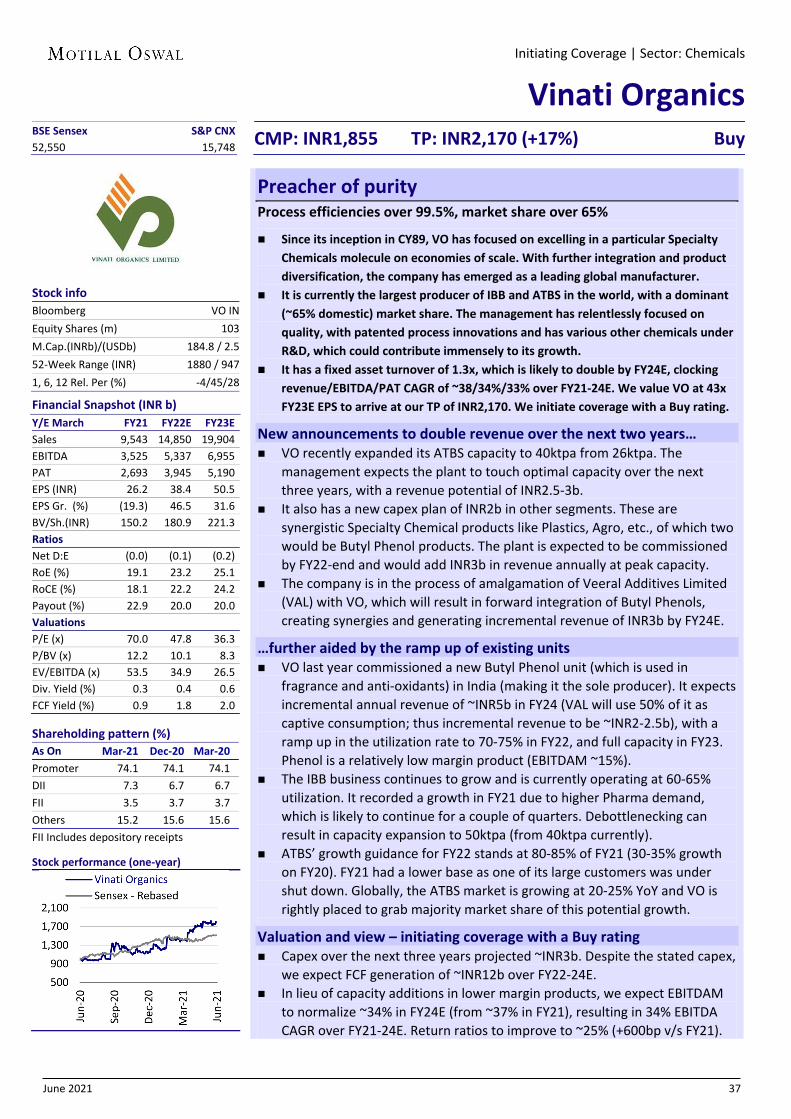
June 2021 37
Specialty Chemicals
Preacher of purity Process efficiencies over 99.5%, market share over 65%
Since its inception in CY89, VO has focused on excelling in a particular Specialty Chemicals molecule on economies of scale. With further integration and product diversification, the company has emerged as a leading global manufacturer.
It is currently the largest producer of IBB and ATBS in the world, with a dominant (~65% domestic) market share. The management has relentlessly focused on quality, with patented process innovations and has various other chemicals under R&D, which could contribute immensely to its growth.
It has a fixed asset turnover of 1.3x, which is likely to double by FY24E, clocking revenue/EBITDA/PAT CAGR of ~38/34%/33% over FY21-24E. We value VO at 43x FY23E EPS to arrive at our TP of INR2,170. We initiate coverage with a Buy rating.
New announcements to double revenue over the next two years… VO recently expanded its ATBS capacity to 40ktpa from 26ktpa. The
management expects the plant to touch optimal capacity over the next three years, with a revenue potential of INR2.5-3b.
It also has a new capex plan of INR2b in other segments. These are synergistic Specialty Chemical products like Plastics, Agro, etc., of which two would be Butyl Phenol products. The plant is expected to be commissioned by FY22-end and would add INR3b in revenue annually at peak capacity.
The company is in the process of amalgamation of Veeral Additives Limited (VAL) with VO, which will result in forward integration of Butyl Phenols, creating synergies and generating incremental revenue of INR3b by FY24E.
…further aided by the ramp up of existing units VO last year commissioned a new Butyl Phenol unit (which is used in
fragrance and anti-oxidants) in India (making it the sole producer). It expects incremental annual revenue of ~INR5b in FY24 (VAL will use 50% of it as captive consumption; thus incremental revenue to be ~INR2-2.5b), with a ramp up in the utilization rate to 70-75% in FY22, and full capacity in FY23. Phenol is a relatively low margin product (EBITDAM ~15%).
The IBB business continues to grow and is currently operating at 60-65% utilization. It recorded a growth in FY21 due to higher Pharma demand, which is likely to continue for a couple of quarters. Debottlenecking can result in capacity expansion to 50ktpa (from 40ktpa currently).
ATBS’ growth guidance for FY22 stands at 80-85% of FY21 (30-35% growth on FY20). FY21 had a lower base as one of its large customers was under shut down. Globally, the ATBS market is growing at 20-25% YoY and VO is rightly placed to grab majority market share of this potential growth.
Valuation and view – initiating coverage with a Buy rating Capex over the next three years projected ~INR3b. Despite the stated capex,
we expect FCF generation of ~INR12b over FY22-24E. In lieu of capacity additions in lower margin products, we expect EBITDAM
to normalize ~34% in FY24E (from ~37% in FY21), resulting in 34% EBITDA CAGR over FY21-24E. Return ratios to improve to ~25% (+600bp v/s FY21).
Initiating Coverage | Sector: Chemicals
Vinati Organics CMP: INR1,855 TP: INR2,170 (+17%) Buy
BSE Sensex S&P CNX 52,550 15,748
Stock info Bloomberg VO IN Equity Shares (m) 103 M.Cap.(INRb)/(USDb) 184.8 / 2.5 52-Week Range (INR) 1880 / 947 1, 6, 12 Rel. Per (%) -4/45/28
Financial Snapshot (INR b) Y/E March FY21 FY22E FY23E Sales 9,543 14,850 19,904 EBITDA 3,525 5,337 6,955 PAT 2,693 3,945 5,190 EPS (INR) 26.2 38.4 50.5 EPS Gr. (%) (19.3) 46.5 31.6 BV/Sh.(INR) 150.2 180.9 221.3 Ratios Net D:E (0.0) (0.1) (0.2) RoE (%) 19.1 23.2 25.1 RoCE (%) 18.1 22.2 24.2 Payout (%) 22.9 20.0 20.0 Valuations P/E (x) 70.0 47.8 36.3 P/BV (x) 12.2 10.1 8.3 EV/EBITDA (x) 53.5 34.9 26.5 Div. Yield (%) 0.3 0.4 0.6 FCF Yield (%) 0.9 1.8 2.0
Shareholding pattern (%) As On Mar-21 Dec-20 Mar-20 Promoter 74.1 74.1 74.1 DII 7.3 6.7 6.7 FII 3.5 3.7 3.7 Others 15.2 15.6 15.6 FII Includes depository receipts
Stock performance (one-year)

June 2021 38
Specialty Chemicals
Exhibit 29: Integration chart for the company
Source: Company, MOFSL
Product segments (and key products) Specialty Monomers (ATBS, NA-ATBS, and TBA) act like building blocks and are useful in designing unique polymer structures. They contain a low to high range of molecular weight and are low in volatility. Applications: Construction, Water Treatment, Textile, Adhesives and Paints, Oil
Drilling, Mining, Paper, Personal Care, Metal, and Antiscalants. Specialty Aromatics (IBB): These colorless liquids, with a characteristic smell, can be converted into many intermediates and polymers needed to produce an extensive range of everyday products. Applications: Pharmaceuticals, Specialty Solvents, Paints and Coatings, and
Agrochemicals. Other Specialty Chemical products (IB, PTBBA, methanol, HP MTBE, Tert-Butylamine): Also known as performance chemicals, these are used as ingredients in finished products to improve manufacturing processes. Applications: Pharmaceuticals, Specialty Solvent, Paints and Coatings,
Agrochemicals, Rubber and Tyre industry, Gasoline, Crop Protection, Personal Care, PVC Stabilizers, and Alkyd Resins.
These are Butyl Phenols, and 2,4 and 2,6 DTBP will be entirely used
as a feedstock for producing anti-oxidants (AOs),
resulting in forward
integration

June 2021 39
Specialty Chemicals
Antioxidants (AOs): The company is in the process of amalgamating VAL with VO (post which the promoter holding in VO will rise to 74.34% from 74.06%). VO will produce AOs from Butyl Phenol, thus resulting in further forward integration. VO would become the largest and only doubly integrated manufacturer of AO's. India/global AO demand stand at 12ktpa/300ktpa (VO’s capacity will be ~24ktpa). AOs are right now imported into the country and the domestic market is seeing huge demand for PP, LLDPE, etc. (which is expected to grow at 8% YoY).
Exhibit 30: AOs application chart: Global demand for AOs is ~300ktpa (India demand ~12ktpa); VO plans to achieve 50:50 export-to-domestic mix in AOs, which would also increase its access to varied/new Western customers
Source: Company, MOFSL:
Exhibit 31: Technological leverages – VO has an IP patent for ATBS in India and thus earns a higher margin on it
Product Institute tie up
IB Saipem SPA, Italy
IBB InstitutFrancais du Petrole (IFP), France
ATBS National Chemical Laboratories (NCL), Pune
PTBT, PTBBA IICT, Hyderabad
Source: Company, MOFSL:
Exhibit 32: Capacity expansion for VO across products Capacity (mtpa) FY16 FY17 FY18 FY19 FY20 FY21 FY22E FY23E FY24E ATBS 26,000 26,000 26,000 26,000 26,000 40,000 40,000 40,000 40,000 IBB 16,000 16,000 16,000 25,000 25,000 25,000 25,000 25,000 25,000 IB 12,000 15,000 15,000 15,000 15,000 15,000 15,000 15,000 15,000 Others (TBA) 21,500 21,500 21,500 21,500 21,500 21,500 21,500 21,500 21,500 Total capacity 75,500 78,500 78,500 87,500 87,500 1,01,500 1,01,500 1,01,500 1,01,500
Source: Company, MOFSL:
Products in the pipeline: Para Amino Phenol (PAP - an intermediate for Paracetamol) is imported largely from China. The government has offered some sops by including it under the PLI scheme. VO had dropped pilot plant trials about a year-and-a-half back, but because of the new PLI scheme it is again restarting trials. We expect around 6-9 months before an investment decision is made by the company.
VO has adopted a strategy of leveraging its technological tie ups to achieve purity of products and economies of scale, resulting in dominant
market share across products

June 2021 40
Specialty Chemicals
Financial story in charts Recent/ongoing expansions to fuel growth; product excellence to continue
Exhibit 33: Revenue to double over the next two years
Source: Company, MOFSL
Exhibit 34: AOs to normalize export share (%)
Source: Company, MOFSL Exhibit 35: Expect EBITDA and PAT margin to normalize…
Source: Company, MOFSL
Exhibit 36: …as share of Butyl Phenol in total mix increases
Source: Company, MOFSL Exhibit 37: Capex for the next three years is INR3b…
Source: Company, MOFSL
Exhibit 38: …which will be funded by internal accruals
Source: Company, MOFSL
Exhibit 39: One year forward PE trades at 43.1x…
Source: Company, MOFSL
Exhibit 40: …with return ratios improving to ~25%
Source: Company, MOFSL
2 2 2 2 2 3 3 2 4 6 8 5 5 4 5 5 8 8 7
11 14
17
7.0 7.7 6.3 6.8 7.4 11.3 10.3 9.5
14.9
19.9
25.0
FY14
FY15
FY16
FY17
FY18
FY19
FY20
FY21
FY22
E
FY23
E
FY24
E
Revenue INR b
Domestic Exports Total
33 32 33 31 29 27 26 24 27 30 31
67 68 67 69 71 73 74 76 73 70 69
FY14
FY15
FY16
FY17
FY18
FY19
FY20
FY21
FY22
E
FY23
E
FY24
E
Revenue mix
Domestic Exports
1.5 1.9 2.1 2.2 2.0 4.2 4.1 3.5 5.3 7.0 8.5
22 25 33 32
27
38 40 37 36 35 34
FY14
FY15
FY16
FY17
FY18
FY19
FY20
FY21
FY22
E
FY23
E
FY24
E
INR b EBITDA Margin (%)
0.9 1.2 1.3 1.4 1.4 2.8 3.3 2.7 3.9 5.2 6.3
12 15 21 21 19
25
32 28 27 26 25
FY14
FY15
FY16
FY17
FY18
FY19
FY20
FY21
FY22
E
FY23
E
FY24
E
INR b Adjusted PAT Margin (%)
10 7 9 2 9 15 10 17 33 36 48
0.3 0.4 0.7 1.1 0.4 0.5 3.1
0.5 1.0 1.0 1.0
FY14
FY15
FY16
FY17
FY18
FY19
FY20
FY21
FY22
E
FY23
E
FY24
E
FCF per share Capex (INR b)
1.6 0.7 0.4 0.0 0.2 0.0 0.0 0.0 0.0 0.0 0.0
1.2 0.4 -0.3 0.0 0.1 0.0 -0.5 0.0 -2.3
-4.5 -7.7
FY14
FY15
FY16
FY17
FY18
FY19
FY20
FY21
FY22
E
FY23
E
FY24
E
INR b Debt Net Debt
43.1
20.3
43.3
4.7
29.8
10.8
2.0
14.0
26.0
38.0
50.0
Jun-
11
Jun-
12
Jun-
13
Jun-
14
Jun-
15
Jun-
16
Jun-
17
Jun-
18
Jun-
19
Jun-
20
Jun-
21
P/E (x) Avg (x) Max (x)Min (x) +1SD -1SD
31 31
27 23
19
31 29
19 23 25 25
19 23 23
20 18
28 27
18 22 24 24
FY14
FY15
FY16
FY17
FY18
FY19
FY20
FY21
FY22
E
FY23
E
FY24
E
RoE RoCE

June 2021 41
Specialty Chemicals
Valuation and view (TP: INR2,170; +17% upside) Initiate coverage with a Buy rating
Disruption in various industries has led to demand concerns in ATBS, with slower than expected ramp-up post lifting of COVID-related lockdown/restrictions (lower demand from the Oil and Gas space; while demand for Water Treatment Chemicals has almost rebounded to pre-COVID levels). With a further rise in oil demand due to the opening up of economies, we expect demand for ATBS to grow at 80-85% of FY21 levels (30-35% on FY20 levels) in FY22 – in line with the management’s guidance.
A gradual ramp-up of expanded capacity over the next three years would drive huge growth for VO, with further development on product molecules currently under R&D. With new products like AO and Butyl Phenols resulting in import substitution, we expect the export mix to moderate to ~70% in FY23-24E (from 76% in FY21).
We expect revenue to grow 2.6x by FY24E (v/s FY21), with ~56% YoY growth in FY22E (in line with the management’s guidance). The company is confident it will be among the top five global players for Butyl Phenol and AOs over the next 4-5 years.
The stock is trading at 36x FY23E EPS of INR50.5 and 26x FY23E EV/EBITDA, with attractive return ratios of ~25% (+600bps v/s FY21). It has a fixed asset turnover of 1.3x, which is likely to double over next three years. We expect 34% EBITDA CAGR during FY21-24E, and value the company at 43x FY23E EPS to arrive at our TP of INR2,170. We initiate coverage with a Buy rating.
Disruption in the
global Oil and Gas industry could dampen profitability (as ATBS contributes ~48% to total revenue and the Oil sector constitutes 30% of ATBS)
Delay in ramp up of recently commissioned expansions could further dampen the growth
Forward integration of Butyl Phenols into AOs, with the amalgamation of VAL, will help capture domestic market share
The company plans on entering into the production of PAP – an intermediate for Paracetamol
VO faces continued pressure on its high market share and global dominance, which could result in margin suppression.
Development of lower margin products would result in lower blended EBITDAM in the future
VO lays great emphasis on synergic integration that helps the company gain dominant market share
The company has achieved the highest purity standards for its products like ATBS/IBB/IB/HP-MTBE of 99.7-99.97%

June 2021 42
Specialty Chemicals
Bull and Bear Case
Exhibit 41: Ramping up of capacities remains key – margin dilution a risk
TP (at 43x FY23 EPS) (INR m) FY21 FY22E FY23E FY24E CAGR
(FY21-24E, %) Thesis
Bear Case Revenue 9,543 12,095 16,484 21,560 31 Delay in commissioning of ongoing expansions,
while weakness in ATBS continues. Assuming ramp up in Butyl Phenols is impacted.
EBITDA 3,525 4,347 5,760 7,318 28 INR1,765 EPS 26.1 30.5 41.0 52.4 26
Base Case Revenue 9,543 14,850 19,904 24,980 38 In line with VO’s guidance, with ATBS recording
growth in FY22, Butyl Phenols ramping up, and AOs and the others segment contributing by FY22-end
EBITDA 3,525 5,337 6,955 8,479 34
INR2,170 EPS 26.2 38.4 50.5 61.6 33
Bull Case Revenue 9,543 16,378 22,098 27,174 42 Quicker ramp up and commissioning of
capacities with no margin dilution (as captive consumption of Butyl Phenols by AOs support margin)
EBITDA 3,525 6,050 8,164 10,039 42
INR2,555 EPS 26.1 43.7 59.5 73.0 41
Source: Company, MOFSL
Management overview Mr. Vinod Banwarilal Saraf, Chairman Mr. Saraf is the founder of VO. He has over 50 years of experience in the Indian
Chemical industry. Prior to VO, he was associated with Bhilwara Group, Modern Syntex (I), and
Grasim Industries. He was earlier Managing Director of Mangalore Refinery & Petrochemicals (MRPL).
He was awarded the CY19 HURUN India Self-Made Entrepreneur of the year.
Ms. Vinati Saraf Mutreja, Managing Director and CEO Ms. Saraf joined VO in CY06. She holds a Bachelor’s of Science in Economics
(Finance) from The Wharton School and Bachelors in Applied Science from the School of Engineering (University of Pennsylvania).
She has over 14 years of experience spearheading the Marketing, Finance, and Operation functions at VO.
She is named in the World Economic Forum’s Young Global Leader’s list and was also listed in The Economic Times annual India’s Top 40 under 40 for CY19.
Ms. Viral Saraf Mittal, Director Ms. Mittal joined VO in CY09. She holds a Bachelor’s of Science degree in Economics (Finance and
Management) from The Wharton School, University of Pennsylvania. She has volunteered at reputed non-profit organizations like Pratham and Dasra
and brings with her rich knowledge of the social sector to VO’s CSR activities. She is also a partner and volunteer at the Mumbai chapter of Social Venture
Partners (SVP).
Mr. N. K. Goyal, CFO Mr. Milind A Wagh, Company Secretary and Compliance officer

June 2021 43
Specialty Chemicals
Financials and valuations – VO
Standalone - Income Statement (INR M) Y/E March FY16 FY17 FY18 FY19 FY20 FY21 FY22E FY23E FY24E Total Income from Operations 6,309 6,813 7,422 11,279 10,289 9,543 14,850 19,904 24,980 Change (%) -18.2 8.0 8.9 52.0 -8.8 -7.3 55.6 34.0 25.5 Gross Margins (%) 53.0 55.9 49.1 53.4 58.3 59.4 57.6 56.8 56.4 EBITDA 2,068 2,170 1,973 4,234 4,139 3,525 5,337 6,955 8,479 Margin (%) 32.8 31.8 26.6 37.5 40.2 36.9 35.9 34.9 33.9 Depreciation 185 216 234 274 332 429 466 514 563 EBIT 1,883 1,953 1,739 3,960 3,808 3,096 4,872 6,441 7,916 Int. and Finance Charges 79 19 12 9 11 2 2 2 2 Other Income 62 125 307 302 450 259 402 498 550 PBT bef. EO Exp. 1,866 2,060 2,034 4,252 4,247 3,353 5,272 6,936 8,463 PBT after EO Exp. 1,866 2,060 2,034 4,252 4,247 3,353 5,272 6,936 8,463 Total Tax 550 657 595 1,428 908 659 1,327 1,746 2,130 Tax Rate (%) 29.5 31.9 29.3 33.6 21.4 19.7 25.2 25.2 25.2 Reported PAT 1,316 1,403 1,439 2,825 3,338 2,693 3,945 5,190 6,333 Adjusted PAT 1,316 1,403 1,439 2,825 3,338 2,693 3,945 5,190 6,333 Change (%) 13.6 6.6 2.6 96.3 18.2 -19.3 46.5 31.6 22.0 Margin (%) 20.9 20.6 19.4 25.0 32.4 28.2 26.6 26.1 25.4 Standalone - Balance Sheet (INR M) Y/E March FY16 FY17 FY18 FY19 FY20 FY21 FY22E FY23E FY24E Equity Share Capital 103 103 103 103 103 103 103 103 103 Total Reserves 5,305 6,697 7,864 10,410 12,691 15,331 18,487 22,640 27,706 Net Worth 5,408 6,800 7,967 10,513 12,794 15,434 18,590 22,742 27,809 Total Loans 421 23 152 37 3 20 20 20 20 Deferred Tax Liabilities 492 696 809 846 705 779 779 779 779 Capital Employed 6,321 7,519 8,927 11,395 13,502 16,234 19,390 23,542 28,608 Gross Block 4,851 4,892 5,023 5,473 8,551 9,045 10,045 11,045 12,045 Less: Accum. Deprn. 1,032 216 454 728 1,060 1,489 1,954 2,469 3,032 Net Fixed Assets 3,819 4,676 4,569 4,745 7,491 7,557 8,091 8,577 9,013 Capital WIP 248 74 349 1,912 310 547 547 547 547 Total Investments 27 618 1,317 965 2,274 2,887 4,303 4,303 4,303 Curr. Assets, Loans&Adv. 2,775 2,843 3,565 4,654 4,355 6,345 7,787 11,909 16,996 Inventory 447 651 822 924 932 1,219 1,345 1,802 2,262 Account Receivables 1,148 1,405 1,771 2,440 2,018 2,772 2,912 3,903 4,899 Cash and Bank Balance 722 48 52 38 537 68 2,276 4,523 7,726
Cash and liquid investments 35 621 1,318 492 1,586 1,762 2,276 4,523 7,726 Bank Balance 733 45 52 38 0 0 0 0 0
Loans and Advances 458 740 919 1,252 869 2,285 1,254 1,680 2,109 Curr. Liability & Prov. 549 693 872 881 927 1,102 1,339 1,794 2,252 Account Payables 223 327 635 531 557 664 803 1,077 1,351 Other Current Liabilities 209 338 174 211 213 391 308 413 518 Provisions 117 27 64 139 157 47 227 305 382 Net Current Assets 2,226 2,151 2,693 3,774 3,428 5,243 6,449 10,115 14,744 Appl. of Funds 6,321 7,519 8,927 11,395 13,502 16,234 19,390 23,542 28,608 E: MFOSL Estimates

June 2021 44
Specialty Chemicals
Financials and valuations – VO
Ratios Y/E March FY16 FY17 FY18 FY19 FY20 FY21 FY22E FY23E FY24E Basic (INR) EPS 12.8 13.6 14.0 27.5 32.5 26.2 38.4 50.5 61.6 EPS Growth (%) 13.6 6.6 2.6 96.3 18.2 -19.3 46.5 31.6 22.0 Cash EPS 14.6 15.7 16.3 30.1 35.7 30.4 42.9 55.5 67.1 BV/Share 52.6 66.2 77.5 102.3 124.5 150.2 180.9 221.3 270.6 DPS 2.0 0.3 0.3 2.3 5.5 6.0 7.7 10.1 12.3 Payout (%) 18.9 2.2 2.2 9.9 31.6 22.9 20.0 20.0 20.0 Valuation (x) P/E 143.3 134.5 131.1 66.8 56.5 70.0 47.8 36.3 29.8 Cash P/E 125.7 116.5 112.8 60.9 51.4 60.4 42.8 33.1 27.3 P/BV 34.9 27.7 23.7 17.9 14.7 12.2 10.1 8.3 6.8 EV/Sales 29.8 27.7 25.4 16.7 18.3 19.8 12.5 9.2 7.2 EV/EBITDA 91.1 86.9 95.7 44.5 45.4 53.5 34.9 26.5 21.3 Dividend Yield (%) 0.1 0.0 0.0 0.1 0.3 0.3 0.4 0.6 0.7 FCF per share 9.2 1.6 9.4 15.1 10.4 16.5 32.9 36.1 47.7 Return Ratios (%) RoE 27.0 23.0 19.5 30.6 28.6 19.1 23.2 25.1 25.1 RoCE 23.4 20.5 17.6 27.9 26.9 18.1 22.2 24.2 24.3 RoIC 26.0 22.0 17.6 33.5 31.7 21.5 29.2 36.5 39.2 Working Capital Ratios Fixed Asset Turnover (x) 1.8 1.6 1.6 2.4 1.7 1.3 1.9 2.4 2.8 Asset Turnover (x) 1.0 0.9 0.8 1.0 0.8 0.6 0.8 0.8 0.9 Inventory (Days) 26 35 40 30 33 47 33 33 33 Debtor (Days) 66 75 87 79 72 106 72 72 72 Creditor (Days) 13 18 31 17 20 25 20 20 20 Leverage Ratio (x) Current Ratio 5.1 4.1 4.1 5.3 4.7 5.8 5.8 6.6 7.5 Net Debt/Equity -0.1 0.0 0.0 0.0 0.0 0.0 -0.1 -0.2 -0.3 Standalone - Cash Flow Statement (INR m) Y/E March FY16 FY17 FY18 FY19 FY20 FY21 FY22E FY23E FY24E OP/(Loss) before Tax 1,866 2,060 2,034 4,252 4,247 3,353 5,272 6,936 8,463 Depreciation 185 216 254 274 332 429 466 514 563 Direct Taxes Paid -447 -535 -491 -1,262 -1,005 -607 -1,327 -1,746 -2,130 (Inc)/Dec in WC 73 -380 -316 -1,138 811 -874 -29 -993 -998 CF from Operations 1,674 1,304 1,384 2,003 4,159 2,190 4,384 4,713 5,901 (Inc)/Dec in FA -732 -1,136 -422 -450 -3,094 -490 -1,000 -1,000 -1,000 Free Cash Flow 942 168 962 1,553 1,065 1,700 3,384 3,713 4,901 Change in Investments 0 695 1 -442 -674 127 0 0 0 CF from Investments -722 -268 -388 -2,427 -1,975 -1,982 -1,385 -1,427 -1,429 Inc/(Dec) in Debt -231 -396 0 0 0 0 0 0 0 Interest Paid -33 -16 -11 -9 -11 -2 -2 -2 -2 Dividend Paid -217 -35 -32 -278 -1,046 -55 -789 -1,038 -1,267 CF from Fin. Activity -503 -451 -298 -403 -1,090 -31 -2,484 -1,040 -1,269 Inc/Dec of Cash 450 585 697 -826 1,094 176 515 2,247 3,203 Opening Balance 271 35 621 1,318 492 1,586 1,762 2,277 4,523 Closing Balance 721 621 1,318 491 1,585 1,762 2,277 4,523 7,727

June 2021 45
Specialty Chemicals
Growing tall Utilization ramp-up and margin sustainability key
AACL is the second largest player in the Indian Aliphatic Amines industry, with ~45% market share. It is present in three major categories: Amines and its derivatives, other Specialty Chemicals, and Industrial Gases. It has three manufacturing sites, two in Maharashtra (Patalganga and Kurkumbh), and one in Gujarat (Dahej).
It caters to ~14 end-user industries with over 100 different products. Life Sciences (Pharma + Agri.) constitutes ~70% of total demand. The company has a client base of over 600, with no single customer constituting more than 3-4% of revenue.
The management plans on spending ~INR5b over the next three years (all via internal accruals). Assuming an asset turnover of 2x, revenue could double in the next three years to INR21.5b. We value AACL at 45x FY23E EPS to arrive at our TP of INR3,825. We initiate coverage with a Neutral rating.
Opportune capacity expansion… Ongoing expansions will boost aliphatic amines capacity by ~30% by 3QFY22
(capex: INR3b) and take ACN capacity to 27ktpa (making it the largest producer, with ~25% of global capacity). Current capacity stands at 90ktpa for aliphatic amines, 35ktpa for its derivatives, and ~12ktpa for acetonitrile.
India’s demand for acetonitrile (ACN) stands at 35ktpa, of which ~60% is imported, presenting a huge import substitution opportunity for AACL. The expansion comes at a time when global capacities are shutting down owing to environmental challenges.
Over the last decade, the company has been growing ~17% revenue CAGR, while it has been growing ~20% over the last five years. Considering the same growth, on the back of recent capacity expansions, AACL is expected to double its revenue over the next three years.
…with margin to sustain around current levels EBITDAM expanded to ~35% in FY21 (up from 19%/26% in FY19/FY20), due to
higher realization of supply-constrained acrylonitrile (used in ABS as polymers), owing to the slowdown in the Auto industry. This has raised concerns about its sustainability among investors.
In line with the management’s guidance, EBITDAM would normalize ~30-33% – assuming gross margin at 50%, which AACL has maintained over the last one decade with agile pricing. Conversion cost would further reduce, with higher operating efficiencies, post completion of the ongoing expansions.
ACN prices have been stable around current (high) levels for more than a year now, which is likely to stay as per management’s guidance. An increase in the share of Specialty Chemicals (with expansion of ACN) would also aid margin.
Valuation and view – initiating coverage with a Neutral rating AACL has maintained dividend ~20-30% over FY18-21. With FCF generation of
~INR6.6b over FY22-24E, we expect dividend payout to remain strong ~30%. The company turned net cash in FY21 and would maintain the same despite
higher capex. We expect RoE at 35-37% over FY22-24E (best amongst its peers and our coverage universe), commanding higher multiple for the stock.
Initiating Coverage | Sector: Chemicals
Alkyl Amines CMP: INR3,600 TP: INR3,825 (+6%) Neutral
BSE Sensex S&P CNX 52,550 15,748
Stock info Bloomberg AACL IN Equity Shares (m) 51 M.Cap.(INRb)/(USDb) 181.1 / 2.4 52-Week Range (INR) 3987 / 780 1, 6, 12 Rel. Per (%) -5/114/260
Financial Snapshot (INR b) Y/E March FY21 FY22E FY23E Sales 12,424 14,909 17,891 EBITDA 4,291 4,737 6,029 PAT 2,953 3,357 4,337 EPS (INR) 57.9 65.8 85.0 EPS Gr. (%) 57.0 13.7 29.2 BV/Sh.(INR) 155.3 201.3 260.8 Ratios Net D:E (0.1) (0.1) (0.1) RoE (%) 44.4 36.9 36.8 RoCE (%) 39.5 34.7 35.1 Payout (%) 27.6 30.0 30.0 Valuations P/E (x) 62.1 54.6 42.3 P/BV (x) 23.1 17.8 13.8 EV/EBITDA (x) 42.5 38.6 30.2 Div. Yield (%) 0.4 0.5 0.7 FCF Yield (%) 1.1 0.3 1.2
Shareholding pattern (%) As On Mar-21 Dec-20 Mar-20 Promoter 74.1 74.1 74.2 DII 2.0 1.8 1.7 FII 0.9 1.0 0.7 Others 23.0 23.1 23.4 FII Includes depository receipts
Stock performance (one-year)

June 2021 46
Specialty Chemicals
Exhibit 42: AACL – company snapshot Description Aliphatic Amines Derivatives Specialty Chemicals
Brief features
Alkyl group with six carbons or less. Methyl alcohol + Ammonia = Methylamine. Ethyl Alcohol +
Ammonia = Ethylamine. These are hazardous chemicals in their gaseous form. It has 50% captive consumption
in all
Amines such as Methylamine and Ethylamine are used to make derivative products such as
dimethylamine hydrochloride (DMAHCL) and dimethylamine
propylamine (DMAPA)
Non-Amines based chemicals. ACN is more of a solvent.
Revenue mix 50% 20- 25% 25%-30%
Expected growth rate 15% 20-25% 20-25%
Major products Methylamine, Ethylamine, and 50 other additional products
DMAHCL, DMAPA, and 30-40 other products Acetonitrile
Major applications Used in Pharma and Agri industries as
a solvent, intermediary, and raw material
Animal Feed, drugs, Insecticide. DMAPA - Personal Care
DMAHCL - Water Treatment, polymer
Pharma, Agrichemicals, dyestuff. ACN is used in DNA synthesis,
production of insulin, and antibiotics
Competitive intensity
Methylamine – Balaji, RCF, and imports up to 3%
Ethylamine – Balaji and imports – 10-15% mix. Less difficult to enter
More competitive
Realizations fluctuate due to demand and supply mismatch.
More competitive
Capacity Currently – 90ktpa Post capex – 125ktpa 35ktpa Currently – 12ktpa
Post capex – 27ktpa
Source: Company, MOFSL
Exhibit 43: End-user industry: Amines are used as solvents…
Source: Company, MOFSL
Exhibit 44: …~70% used in Life Sciences (Pharma + Agro)
Source: Company, MOFSL
Exhibit 45: Product segmentation
Source: Company, MOFSL
44%
15% 8%
7%
7%
5% 4%
4% 6%
World consumption of Aliphatic Amines Solvents
Pesticides
Feed additives
Rubber
Water Treatment
Surfactants
Paper & textiles
Pharma
Others
61% 6%
5%
5% 4% 3%
3% 13%
India consumption of Aliphatic Amines Pharma
Agro
Trading
Water Treatment
Foundry chemicals
Dyes
Specialty chemicals
Others

June 2021 47
Specialty Chemicals
Financials story in charts Next leg of growth to facilitate current high valuations
Exhibit 46: Expect ~20% revenue CAGR over FY21-24E…
Source: Company, MOFSL
Exhibit 47: …with revenue mix remaining constant
Source: Company, MOFSL Exhibit 48: Expect EBITDAM to sustain ~32-34%...
Source: Company, MOFSL
Exhibit 49: …along with a normalization in PAT margin
Source: Company, MOFSL Exhibit 50: Expect strong FCF generation over FY22-24E…
Source: Company, MOFSL
Exhibit 51: Expect AACL to remain net cash positive
Source: Company, MOFSL
Exhibit 52: One year forward PE trades at 51.0x…
Source: Company, MOFSL
Exhibit 53: …with return ratios stabilizing ~35-37%
Source: Company, MOFSL
4.8 5.2 5.2 5.4 6.2 8.5 9.9 12.4 14.9 17.9 21.5
21
7 1 4
15
35
17 25
20 20 20
FY14
FY15
FY16
FY17
FY18
FY19
FY20
FY21
FY22
E
FY23
E
FY24
E
INR b Revenues Growth YoY (%)
78 81 80 78 80 79 81 82 81 80 80
22 19 20 22 20 21 19 18 19 20 20
FY14
FY15
FY16
FY17
FY18
FY19
FY20
FY21
FY22
E
FY23
E
FY24
E
Revenue mix
Domestic Exports
0.8 0.9 0.9 1.0 1.2 1.6 2.6 4.3 4.7 6.0 7.0
18 17 17 18 19 19 26
35 32 34 32
FY14
FY15
FY16
FY17
FY18
FY19
FY20
FY21
FY22
E
FY23
E
FY24
E
INR b EBITDA Margin (%)
0.4 0.5 0.5 0.5 0.6 0.8 1.9 3.0 3.4 4.3 5.0
9 9 10 9 10 10
19 24 23 24 23
FY14
FY15
FY16
FY17
FY18
FY19
FY20
FY21
FY22
E
FY23
E
FY24
E
INR b Adjusted PAT Margin (%)
4 4 13
0 -7
15 22 41 11 43 75
0.3 0.4 0.4 0.6 1.4
0.7 0.8 1.6
2.0 2.0
1.0
FY14
FY15
FY16
FY17
FY18
FY19
FY20
FY21
FY22
E
FY23
E
FY24
E
FCF per share Capex (INR bn)
1.5 1.3 1.1 1.2 1.8 1.7 0.9 0.2 0.2 0.2 0.2
1.3 1.3 1.1 1.2 1.8 1.5 0.5
-1.0 -0.6 -1.5
-3.8
FY14
FY15
FY16
FY17
FY18
FY19
FY20
FY21
FY22
E
FY23
E
FY24
E
INR b Debt Net Debt
51.0
11.0
51.5
3.1
19.0
3.0 0.0
16.0
32.0
48.0
64.0
Jun-
11
Jun-
12
Jun-
13
Jun-
14
Jun-
15
Jun-
16
Jun-
17
Jun-
18
Jun-
19
Jun-
20
Jun-
21
P/E (x) Avg (x) Max (x)Min (x) +1SD -1SD
35 29 27
23 24 25
42 44 37 37 33
17 16 17 15 15 17
32 40
35 35 32
FY14
FY15
FY16
FY17
FY18
FY19
FY20
FY21
FY22
E
FY23
E
FY24
E
RoE RoCE

June 2021 48
Specialty Chemicals
Valuation and view (TP INR3,825; +6% upside) Initiating coverage with a Neutral rating
The company recorded 25% revenue growth in FY21, a year of COVID-led disruption, with one-third growth led by an increase in volumes. The company was one of the prime beneficiaries of COVID-19 as demand for Aliphatic Amines increased as it is mainly used as solvents in the Pharmaceutical industry. Demand for its products is expected to remain strong in the aftermath of the pandemic.
EBITDAM, which stood ~35% in FY21, is likely to normalize ~32% next year, although expect it to climb back up with commissioning of ACN expansion. AACL is vulnerable to alcohol price volatility. Domestic alcohol prices are dependent on cyclicality in the Sugar industry and government policy on its use in the Oil sector – any change may have an adverse impact on the company.
Closure of global capacities and higher than expected revenue CAGR (of ~20%) presents an upside risk to our call, while downward risk could be from increase in domestic competition.
The stock is trading at 42x FY23E EPS of INR85 and 30x FY23E EV/EBITDA. We value the company at 45x FY23E EPS to arrive at our TP of INR3,825. We initiate coverage with a Neutral rating, owing to limited upside. Although, the capacity expansions would facilitate the current high valuations as even ROEs for the company are best amongst peers at ~35-37% in FY23E.
Increase in domestic
competition, with continuous expansion by its immediate competitor
With an increasing supply of ACN, margin may come off from the highs of FY21
Capturing the domestic Aliphatic Amines market, with a play on import substitution through expansion of capacities
CRAMs is a completely untapped area, where the company can foray into
Vulnerability to alcohol price volatility may have an adverse impact
Dependence on a single end-user industry (Life Sciences) as a major revenue source. Others contribute less than 10% each
Continuous expansion since FY16 has helped the company grow on the domestic front
Focus on Derivatives and Specialty Chemicals has led to margin expansion
New ACN plant to boost revenue in the Specialty Chemicals segment

June 2021 49
Specialty Chemicals
Bull and Bear Case
Exhibit 54: A play on sustaining healthy margin TP (at 45x FY23 EPS) (INR m) FY21 FY22E FY23E FY24E CAGR
(FY21-24E, %) Thesis
Bear Case Revenue 12,424 14,288 16,431 18,896 15 Assuming ~15% revenue CAGR over FY21-24E,
with a contraction in EBITDAM to 29-30% over the same period
EBITDA 4,291 4,122 4,762 5,681 10 INR2,860 EPS 57.9 56.0 63.6 76.2 10
Base Case Revenue 12,424 14,909 17,891 21,469 20 Assuming ~20% revenue CAGR over FY21-24E
(in line with last five-years), with normalization of EBITDAM at ~32-33% over the same period
EBITDA 4,291 4,737 6,029 6,967 18 INR3,825 EPS 57.9 65.8 85.0 98.1 19
Bull Case Revenue 12,424 15,530 19,413 24,266 25 Assuming ~25% revenue CAGR over FY21-24E
(similar to that in FY21 on the back of capacity expansion), with margin at ~34-35%
EBITDA 4,291 4,755 6,253 8,366 25 INR3,865 EPS 57.9 65.4 85.9 116.4 26
Source: Company, MOFSL
Management overview Mr. Yogesh M. Kothari, Chairman and Managing Director Mr. Kothari founded AACL and has been its CMD since CY82. He is a Chemical Engineer from the Institute of Chemical Technology, Mumbai.
He is also a Master of Management Science and Master of Science in Chemical Engineering from the University of Massachusetts, Lowell, USA.
Mr. Kirat Patel, Executive Director Mr. Patel has been working with the company since its inception. He holds a
B.Tech. in Mechanical Engineering from Indian Institute of Technology Bombay, and an M.M.S. (Finance) from Jamnalal Bajaj Institute of Management, Mumbai.
Mr. Suneet Kothari, Executive Director Mr. Kothari is the son of the CMD and has been working with AACL since CY01. He is a Chemical Engineer and Chemistry/Biochemistry Graduate from Cornell
University, USA. He has completed a one-year MBA course from INSEAD, France/Singapore.

June 2021 50
Specialty Chemicals
Financials and valuations – AACL
Standalone – Income statement (INR m) Y/E March FY16 FY17 FY18 FY19 FY20 FY21 FY22E FY23E FY24E Total Income from Operations 5,233 5,418 6,248 8,464 9,929 12,424 14,909 17,891 21,469 Change (%) 1.4 3.5 15.3 35.5 17.3 25.1 20.0 20.0 20.0 Gross Margins (%) 51.9 51.4 46.5 45.5 51.2 57.9 53.0 53.0 50.0 EBITDA 910 951 1,164 1,644 2,570 4,291 4,737 6,029 6,967 Margin (%) 17.4 17.6 18.6 19.4 25.9 34.5 31.8 33.7 32.5 Depreciation 129 143 157 233 269 291 316 333 393 EBIT 781 809 1,008 1,410 2,301 4,001 4,421 5,697 6,575 Int. and Finance Charges 80 81 81 148 103 63 25 25 25 Other Income 24 11 32 39 70 70 91 125 142 PBT bef. EO Exp. 725 739 958 1,302 2,269 4,007 4,486 5,796 6,692 EO Items 0 0 0 0 328 0 0 0 0 PBT after EO Exp. 725 739 958 1,302 2,597 4,007 4,486 5,796 6,692 Total Tax 226 236 315 464 444 1,054 1,129 1,459 1,684 Tax Rate (%) 31.2 31.9 32.9 35.7 17.1 26.3 25.2 25.2 25.2 Reported PAT 499 504 643 837 2,153 2,953 3,357 4,337 5,007 Adjusted PAT 499 504 643 837 1,881 2,953 3,357 4,337 5,007 Change (%) 9.8 1.0 27.6 30.3 124.5 57.0 13.7 29.2 15.5 Margin (%) 9.5 9.3 10.3 9.9 18.9 23.8 22.5 24.2 23.3 Standalone - Balance Sheet (INR m) Y/E March FY16 FY17 FY18 FY19 FY20 FY21 FY22E FY23E FY24E Equity Share Capital 102 102 102 102 102 102 102 102 102 Total Reserves 1,893 2,354 2,869 3,548 5,264 7,822 10,172 13,208 16,714 Net Worth 1,995 2,456 2,972 3,650 5,366 7,924 10,274 13,310 16,816 Total Loans 1,115 1,201 1,813 1,653 866 216 216 216 216 Deferred Tax Liabilities 286 327 405 507 404 414 414 414 414 Capital Employed 3,396 3,984 5,189 5,810 6,636 8,554 10,904 13,940 17,445 Gross Block 3,213 2,329 3,846 4,280 4,971 5,315 7,315 9,315 10,315 Less: Accum. Deprn. 1,342 129 295 515 736 1,026 1,342 1,675 2,067 Net Fixed Assets 1,871 2,201 3,552 3,764 4,235 4,288 5,973 7,640 8,247 Capital WIP 161 348 184 432 449 1,376 1,376 1,376 1,376 Total Investments 23 14 14 14 0 302 302 302 302 Curr. Assets, Loans&Adv. 2,008 2,559 2,621 3,275 3,150 5,486 5,052 6,781 10,111 Inventory 632 1,114 852 1,057 837 1,219 1,256 1,508 1,809 Account Receivables 903 973 1,238 1,526 1,642 2,280 2,466 2,959 3,551 Cash and Bank Balance 43 30 32 202 323 1,260 807 1,686 3,997
Cash 39 22 22 193 312 961 508 1,387 3,698 Bank Balance 3 8 10 8 10 299 299 299 299
Loans and Advances 431 442 499 490 349 727 524 628 754 Curr. Liability & Prov. 668 1,139 1,182 1,676 1,198 2,899 1,800 2,159 2,591 Account Payables 468 886 848 1,304 748 1,790 1,123 1,347 1,617 Other Current Liabilities 166 213 250 264 354 1,002 531 638 765 Provisions 34 41 84 107 97 107 146 175 210 Net Current Assets 1,340 1,421 1,439 1,599 1,952 2,587 3,253 4,621 7,519 Appl. of Funds 3,395 3,984 5,189 5,810 6,635 8,554 10,904 13,940 17,445 E: MOFSL Estimates

June 2021 51
Specialty Chemicals
Financials and valuations – AACL
Ratios Y/E March FY16 FY17 FY18 FY19 FY20 FY21 FY22E FY23E FY24E Basic (INR) EPS 9.8 9.9 12.6 16.4 36.9 57.9 65.8 85.0 98.1 EPS Growth (%) 9.8 1.0 27.6 30.3 124.5 57.0 13.7 29.2 15.5 Cash EPS 12.3 12.7 15.7 21.0 42.1 63.6 72.0 91.5 105.8 BV/Share 39.1 48.1 58.2 71.5 105.2 155.3 201.3 260.8 329.5 DPS 4.8 0.0 2.4 3.4 8.7 16.0 19.7 25.5 29.4 Payout (%) 49.2 0.0 19.1 20.6 20.6 27.6 30.0 30.0 30.0 Valuation (x) P/E 368 364 285 219 97 62 55 42 37 Cash P/E 292 284 229 171 85 57 50 39 34 P/BV 92 75 62 50 34 23 18 14 11 EV/Sales 35 34 30 22 19 15 12 10 8 EV/EBITDA 203 194 159 112 72 42 39 30 26 Dividend Yield (%) 0 0 0 0 0 0 1 1 1 FCF per share 13 0 -7 15 22 41 11 43 75 Return Ratios (%) RoE 27 23 24 25 42 44 37 37 33 RoCE 17 15 15 17 32 40 35 35 32 RoIC 18 16 16 18 35 51 47 45 44 Working Capital Ratios Fixed Asset Turnover (x) 3.1 2.7 2.2 2.3 2.5 2.9 2.9 2.6 2.7 Asset Turnover (x) 1.5 1.4 1.2 1.5 1.5 1.5 1.4 1.3 1.2 Inventory (Days) 44 75 50 46 31 36 31 31 31 Debtor (Days) 63 66 72 66 60 67 60 60 60 Creditor (Days) 33 60 50 56 27 53 27 27 27 Leverage Ratio (x) Current Ratio 3.0 2.2 2.2 2.0 2.6 1.9 2.8 3.1 3.9 Net Debt/Equity 0.5 0.5 0.6 0.4 0.1 -0.1 -0.1 -0.1 -0.2 Standalone - Cash Flow Statement (INR m) Y/E March FY16 FY17 FY18 FY19 FY20 FY21 FY22E FY23E FY24E OP/(Loss) before Tax 725 739 958 1,302 2,597 4,007 4,486 5,796 6,692 Depreciation 129 129 154 233 269 291 316 333 393 Interest Expenses 80 81 81 148 103 63 25 25 25 Direct Taxes Paid -148 -198 -198 -356 -581 -1,012 -1,129 -1,459 -1,684 (Inc)/Dec in WC 204 -105 26 64 -193 290 -1,119 -489 -587 CF from Operations 1,013 635 1,016 1,442 1,886 3,640 2,579 4,206 4,838 (Inc)/Dec in FA -352 -645 -1,350 -689 -771 -1,561 -2,000 -2,000 -1,000 Free Cash Flow 661 -10 -334 753 1,115 2,079 579 2,206 3,838 CF from Investments -352 -636 -1,340 -668 -407 -2,127 -2,000 -2,000 -1,000 Inc/(Dec) in Debt -242 39 547 -268 -797 -381 0 0 0 Interest Paid -80 -78 -83 -150 -107 -68 -25 -25 -25 Dividend Paid -344 0 -123 -172 -443 -408 -1,007 -1,301 -1,502 CF from Fin. Activity -681 -16 325 -603 -1,351 -864 -1,032 -1,326 -1,527 Inc/Dec of Cash -20 -17 1 171 128 649 -454 879 2,311 Opening Balance 59 39 22 22 193 312 961 508 1,387 Closing Balance 39 22 22 193 321 962 508 1,387 3,698

June 2021 52
Specialty Chemicals
Biggest beneficiary of China+1 …announced two new projects over the last one-year
NFIL is one of the world’s few pure-play Fluorochemicals companies and among the pioneers in the realm of fluorine chemistry in India. Fluorine is the most difficult molecule to handle, given its characteristic of being highly reactive, which also presents niche expertise of the company in this space.
NFIL operates in four segments: Refrigerants, Inorganic Fluorides, Specialty Chemicals, and CRAMs. With India emerging as a fluorination hub (owing to the relocation of major downstream players from China to India), NFIL has announced two new projects under a new wholly owned subsidiary in the last one year.
We expect 31% EBITDA CAGR during FY21-24E, and value the company at 40x FY23E EPS to arrive at our TP of INR3,960. We initiate coverage with a Neutral rating, highlighting huge downside risk to our estimates with even a slightest of delay in execution/commissioning of the upcoming projects.
Huge change in business mix with new businesses NFIL’s diversified portfolio is a big plus. Its share of revenue from the
Refrigerants business has fallen to ~18% in FY21 from ~55% in FY11, with other business segments gaining share in overall revenue.
Over the past five years (FY16-21), NFIL has delivered 11% revenue CAGR, with exports at 53% in FY21. Over FY21-24E, we expect NFIL to deliver 29% revenue CAGR, driven by growth in new businesses.
The company has announced new business such as HPP (commissioning in 4QFY22) and a multi-purpose plant (MPP) at Dahej (commissioning in 1HFY23), which would aid margin expansion. These would boost the share of exports for the company by 8-9% over FY21 levels to 61-62% in FY23-24E.
To continue leveraging its profound expertise With cGMP3 operational, the ability to handle large projects and complex
chemistries will significantly improve. NFIL is seeing a strong pipeline from global Pharma innovators and majors (~20% revenue CAGR over FY21-24E).
Growth in Refrigerants is likely to slow down further with the phasing out of R-22 gases and emerging demand for R-32 gases. NFIL plans on leveraging its refill market and is also looking for non-emissive applications, thus expects realization to improve going forward.
Improvement in operational efficiencies and product rationalization continues, with the de-risking of feedstock procurement, which would lead to margin improvement.
Valuation and view – initiating coverage with a Neutral rating Capex over FY22-24E projected ~INR7.3b, with INR4.4b/INR1.95b going
toward the new HPP/MPP business. The rest is to ramp up production in existing segments. The entire capex will be funded via internal accruals. Despite heavy capex, we expect FCF generation of ~INR5.7b over FY22-24E.
The company has been paying a dividend ~18% over the last couple of years. We expect dividends to remain around similar levels.
Initiating Coverage | Sector: Chemicals
Navin Fluorine CMP: INR3,714 TP: INR3,960 (+7%) Neutral
BSE Sensex S&P CNX 52,550 15,748
Stock info Bloomberg NFIL IN Equity Shares (m) 50 M.Cap.(INRb)/(USDb) 168.9 / 2.3 52-Week Range (INR) 3659 / 1542 1, 6, 12 Rel. Per (%) 3/19/58
Financial Snapshot (INR b) Y/E March FY21 FY22E FY23E Sales 11,331 13,608 21,894 EBITDA 3,108 3,739 6,138 Adj. PAT 2,508 2,951 4,851 EPS (INR) 51.2 60.2 99.0 EPS Gr. (%) (37.3) 17.7 64.4 BV/Sh.(INR) 336.7 386.0 467.0 Ratios Net D:E (0.2) (0.2) (0.2) RoE (%) 16.5 16.7 23.2 RoCE (%) 16.4 16.6 23.1 Payout (%) 18.2 18.2 18.2 Valuations P/E (x) 66.6 56.6 34.4 P/BV (x) 10.1 8.8 7.3 EV/EBITDA (x) 52.5 43.8 26.5 Div. Yield (%) 0.3 0.3 0.5 FCF Yield (%) 1.4 0.0 1.1
Shareholding pattern (%) As On Mar-21 Dec-20 Mar-20 Promoter 30.2 30.5 30.5 DII 15.8 16.9 16.9 FII 25.1 24.5 24.5 Others 28.9 28.1 28.1 FII Includes depository receipts
Stock performance (one-year)

June 2021 53
Specialty Chemicals
Exhibit 55: Expect ~29% revenue CAGR over FY21-24E, primarily led by HPP and MPP businesses…
Source: Company, MOFSL
Exhibit 56: …with Specialty Chemicals and CRAMs CAGR ~20% over the same period
Source: Company, MOFSL
Exhibit 57: Exports form ~53% of total revenue in FY21…
Source: Company, MOFSL
Exhibit 58: …which is set to grow to ~61-62% by FY23-24E
Source: Company, MOFSL
NFIL forms a wholly-owned subsidiary - Navin Fluorine Advanced Sciences (NFAS): The High Performance Product (HPP) segment The company has entered into a long-term contract (of USD410m) with a global
player in the US for manufacturing and supply in the Fluorochemicals space. The contract requires capex (of INR4.4b, with INR3.7b dedicated to the processing plant and the rest toward the captive power plant), which the company has guided to be a mix of debt and equity.
The contract is for seven years. The product is not part of NFIL’s existing product portfolio. The company would further leverage this new expertise for developing its own set of products going forward.
…and a Multi-Purpose Plant (MPP) NFIL is investing INR1.95b in setting up an MPP plant at Dahej, which will
commercialize new products in Life Science and Crop Science space. It will help enhance its product offerings and strengthen its customer relationships, providing building blocks for future growth. Company is developing five new products which are already placed with five different customers.
1.9 1.9 2.2 2.2 2.4 2.8 2.6 2.1 2.5 2.8 3.0 1.0 1.1 0.9 1.2 1.5 2.0 2.1 1.9 2.3 2.6 2.9 2.0 2.2 2.4 2.3 2.3 3.0 3.8 4.5 5.4 6.5 7.8
0.3 0.3 0.9 1.4 2.6 1.8 1.7 2.8 3.4
4.0 4.8
4.0 4.0 2.0 2.0
5.1 5.4 6.4 7.0 8.7 9.6 10.2 11.3
13.6
21.9 24.6
FY14
FY15
FY16
FY17
FY18
FY19
FY20
FY21
FY22
E
FY23
E
FY24
E
INR b
Refrigerants Inorganic FluoridesSpecialty Chemicals CRAMSHPP MPPTotal
36 35 34 31 28 29 26 18 18 13 12
20 20 15 17 17 21 20 17 17 12 12
39 40 38 33
26 31 37
40 40
30 32
5 6 14 20 29 19 17 25 25
18 20
18 16 9 8
FY14
FY15
FY16
FY17
FY18
FY19
FY20
FY21
FY22
E
FY23
E
FY24
E
Refrigerants Inorganic Fluorides Specialty ChemicalsCRAMS HPP MPP
4 4 4 4 5 5 6 5 6 8 10 1 2 3 3 4 4 5 6 7
13 15
5.1 5.4 6.4 7.0 8.7 9.6 10.2 11.3
13.6
21.9 24.6
FY14
FY15
FY16
FY17
FY18
FY19
FY20
FY21
FY22
E
FY23
E
FY24
E
INR b Domestic Exports Total
72 66 57 56 55 54 55 47 47 38 39
28 34 43 44 45 46 45 53 53 62 61
FY14
FY15
FY16
FY17
FY18
FY19
FY20
FY21
FY22
E
FY23
E
FY24
E
Domestic Exports
Expected completion: 4QFY22 Revenue potential:
INR4b annually
Manufacturing of both intermediates and final products
Expected completion: 1HFY23 Revenue potential:
INR2.5b annually
Enters into the next leg of Specialty Chemicals

June 2021 54
Specialty Chemicals
High value business drove growth over FY20-21. Remains the main focus of NFIL until NFAS projects are commissioned Specialty Chemicals NFIL has dedicated MPPs to process multi-step products and intermediates,
which are high on the value chain. It has capabilities to handle complex chemistries and delivers high-quality products in all forms.
It is one of the leading high-quality producers of boron trifluoride gas and it’s adducts. It has 48 products in this segment that caters to Pharmaceutical (40%), Crop Protection (40%), Hydrocarbon and Fragrance (20%) industries.
We see the company focusing more on this segment than the legacy businesses in the medium term. We expect 20% CAGR over FY21-24E in this segment as it caters largely to the Pharma industry.
CRAMs NFIL provides custom chemical synthesis of fluorinated compounds for
Pharmaceutical, Agro Chemicals, and Specialty Chemical industries. The company’s offerings and capabilities include basic research, library synthesis, process development, and scale up of small and large batch manufacturing.
Manchester Organics is based out of the UK and is a wholly-owned subsidiary of NFIL. The company entered into a JV with Manchester Organics when it only had a catalog business. It acquired a 51% stake in the company in FY11 and subsequently bought the entire stake. Manchester Organics is the prime location for its contract research activities. NFIL has access to Manchester Organics’ global clients, which gives it wide reach in this segment.
The CRAMs business has shown exponential (~26%) revenue CAGR over FY16-21 and we expect ~20% CAGR over FY21-24E (in line with management’s guidance). The company plans to widen its customer reach and relationships with various global Pharma companies. Customer audits by several Pharma majors have been successfully completed.
Stable growth in the legacy business Refrigerants The manufacturing plant in Surat is backward integrated to produce critical
intermediates – sulfuric and hydrofluoric acid, which are precursors to the company’s Mafron brand of refrigerants.
There are five products under the Refrigerants division: HCFC22, HCFC 22 PTFE Grade, HFC 134a, HFC 404a, and HFC 410a. All these products are sold under the Mafron brand name.
Following the government’s directive to phase out CFC gases, the company has already initiated production cuts in a phased manner.
We expect revenue from this segment to remain flat over the next two years owing to the impact of COVID-19 in FY21 and due to phasing out of R-22 gas by the company in forthcoming years. NFIL expects to leverage its superior quality and delivery predictability to strengthen its customer retention and engagement with new customers.

June 2021 55
Specialty Chemicals
Inorganic Fluorides NFIL has one of the largest anhydrous hydrofluoric (AHF) and aqueous
hydrofluoric acid manufacturing capacities in India. AHF is used for captive manufacture of various Inorganic Fluorides. The company has Potassium Fluoride (application in Pharma, Agro, and foundry intermediates) and Sodium Fluoride (application in tin plates, toothpastes, etc.) in its bouquet of products.
It has 26 products in the Inorganic Fluorides segment that caters to the Sugar, Oil, Steel, Pharma, and Auto industries. We expect ~15% CAGR over the next 2-3 years from this segment.
NFIL has de-risked fluorspar procurement Over the last few years, NFIL has diversified its fluorspar (feedstock)
procurement base away from China to other geographies. NFIL has also subscribed to 25% of the initial equity share capital of Swarnim
Gujarat Fluorspar Pvt. It is a joint venture with Gujarat Mineral Development Corporation (GMDC) and Gujarat Fluorochemicals (GFL) formed for the purpose of beneficiation of fluorspar ores to be supplied by GMDC from its mines. Although, the procurement of fluorspar from this entity has still not started.
The company holds minimum inventory to remain closer to market prices of all raw materials - thus increasing the possibility of passing on the cost disadvantages to its end-customers.
Exhibit 59: Process value chain for NFIL
Source: Company, MOFSL

June 2021 56
Specialty Chemicals
Financials story in charts Near-term growth from CRAMs and Specialty Chemicals, longer-term growth from HPP/MPP segments
Exhibit 60: Expect EBITDA CAGR of ~31% over FY21-24E...
Source: Company, MOFSL
Exhibit 61: …with PAT CAGR of ~29% over the same period
Source: Company, MOFSL
Exhibit 62: Capex for the next three years is INR7.3b…
Source: Company, MOFSL
Exhibit 63: …which will be funded by internal accruals
Source: Company, MOFSL
Exhibit 64: One year forward PE trades at 48.3x…
Source: Company, MOFSL
Exhibit 65: …with return ratios improving to ~22-23%
Source: Company, MOFSL
0.6 0.6 1.2 1.5 2.1 2.2 2.6 3.1 3.7 6.1 6.9
13 11
17 20
24 23 26 27 27 28 28
FY14
FY15
FY16
FY17
FY18
FY19
FY20
FY21
FY22
E
FY23
E
FY24
E
INR b EBITDA Margin (%)
0.5 0.5 0.9 1.3 1.8 1.5 4.0 2.5 3.0 4.9 5.4
10 8 13
18 20 16
39
22 22 22 22
FY14
FY15
FY16
FY17
FY18
FY19
FY20
FY21
FY22
E
FY23
E
FY24
E
INR b Adjusted PAT Margin (%)
0.4
-0.2
0.6
-0.8
1.3 0.3 0.6 2.6 0.0 2.0 3.7
0.2 0.7 0.1 1.8
0.5 0.6 1.0 0.4
3.3 2.0 2.0
FY14
FY15
FY16
FY17
FY18
FY19
FY20
FY21
FY22
E
FY23
E
FY24
E
INR b FCF Capex0.3 0.3 0.1 -0.3 -0.2 -0.2
-2.6 -3.9 -3.4
-4.4
-7.1
FY14
FY15
FY16
FY17
FY18
FY19
FY20
FY21
FY22
E
FY23
E
FY24
E
Net Debt (INR bn)
48.3 13.8
49.0
1.1
25.2
2.4 0.0
20.0
40.0
60.0
Sep-
15
Apr-
16
Oct
-16
Apr-
17
Oct
-17
May
-18
Nov
-18
May
-19
Nov
-19
May
-20
Dec-
20
Jun-
21
P/E (x) Avg (x) Max (x)Min (x) +1SD -1SD
10 9 13
17 20
15
33
17 17
23 22
9 8 12
16 20 14
32
16 17
23 22
FY14
FY15
FY16
FY17
FY18
FY19
FY20
FY21
FY22
E
FY23
E
FY24
ERoE RoCE

June 2021 57
Specialty Chemicals
Valuation and view (TP INR3,960; +7% upside) Initiating coverage with a Neutral rating
The Specialty Chemicals and CRAMs segments would continue to drive robust growth (15-20%) with increasing use of fluorine in the Pharma and Agrochemical space. Manchester Organics has also become a revenue generating facility.
Going forward, NFIL intends to leverage its R&D capabilities and deep fluorination expertise to partner with global companies, thus helping it grow further. It intends to launch a strong product pipeline over the next 2-3 years and scale approved molecules from the pilot and laboratory stage. Also, some of the MPP molecules will be sold (in smaller quantities) from Surat facility.
The company is looking at opportunities beyond traditional businesses and is eying the HPP segment now. It plans on developing new molecules in the HPP segment for various other players. It is looking to offer a full range of products in this category.
The Refrigerant Gas business is likely to remain flat, with no meaningful growth. The company expects to target the refill market and earn better realization in this space.
We estimate EBITDAM in line with company’s guidance of ~28%, although with improvement in refgas business (post suffering in FY21), more new projects in contract manufacturing and commencement of fluorspar supply from Swarnim Gujarat could result in an upward revision to our estimates.
The stock is trading at 34x FY23E EPS of INR99 and 27x FY23E EV/EBITDA, with an improvement in return ratios to ~23% (+600bps v/s FY21), despite a huge capex. We value the company at 40x FY23E EPS to arrive at our TP of INR3,960. Initiating coverage with a Neutral rating – owing to limited upside at CMP.
Phasing out of R-22
could yield flat revenue over the next few years in the Refrigerant Gas business
Delay in commissioning of the new businesses; or slower ramp up of the same could dampen growth for the company
Growing demand in the end-user industry
Innovation and technological developments continuously taking place
Entering the HPP and MPP segments would add huge value
Fluorochemicals (emissive category) are responsible for the depletion of the ozone layer, restricting its market growth
China is the largest producer of fluorspar and NFIL may face operational hindrances owing to its imports
One of India’s largest manufacturers of Fluorochemicals
Over five decades of experience in the fluorine chain
A portfolio of over 50 fluorine-based products

June 2021 58
Specialty Chemicals
Bull and Bear Case
Exhibit 66: Delay in project execution could lead to a huge de-rating
TP (at 40x FY23E EPS) (INR m) FY21 FY22E FY23E FY24E CAGR
(FY21-24E, %) Thesis
Bear case Revenue 11,331 13,608 14,969 22,966 12 Delay in commissioning of HPP and MPP units,
with ~10% CAGR in Specialty Chemicals and CRAMs business over the next three years
EBITDA 3,108 3,897 3,279 6,517 19 INR1,800 EPS 51.2 58.7 45.1 95.1 24
Base case Revenue 11,331 13,608 21,894 24,589 29 Timely completion of HPP and MPP units, with
~20% CAGR in Specialty Chemicals and CRAMs business over the next three years
EBITDA 3,108 3,739 6,138 6,936 31 INR3,960 EPS 51.2 60.2 99.0 111.1 29
Bull Case Revenue 11,331 13,888 23,279 28,132 23 Faster ramp up in HPP and MPP businesses,
with ~30% growth in CRAMs over next three years (as seen over the last five years).
EBITDA 3,108 4,045 7,457 8,986 40 INR4,470 EPS 51.2 61.1 111.7 134.6 48
Source: Company, MOFSL
Management overview Mr. Vishad P. Mafatlal, Chairman Mr. Mafatlal holds a Bachelor of Science Degree in Economics from the
University of Pennsylvania, Wharton School and has rich experience of more than two decades in the field of Textiles and Chemicals.
He is the Chairman of Shri Sadguru Seva Sangh Trust (est. CY68), a social and charitable trust in Uttar Pradesh/Madhya Pradesh, which provides services in the fields of Education and Healthcare to rural masses.
He is on the company’s Board as a Non-Executive Promoter Director since Jan’03. In the past, he was the Executive Vice-Chairman of Mafatlal Industries and the Non-Executive Promoter Director of NOCIL.
Mr. Radhesh R. Welling, Managing Director Mr. Welling has worked and handled many functions ranging from Innovation to
Sales and Marketing to Corporate Strategy to Manufacturing across multiple geographies.
In his previous role, he was the CEO and Executive Director of Laxmi Organic Industries. He has earlier worked with J.M. Huber Corporation for eight years and was based out of their head office in Atlanta, USA.
He has a Mechanical Engineering degree from the National Institute of Technology, India and has done his Masters in International Business from IIFT, New Delhi. He also has an MBA from IMD, Lausanne, Switzerland.
Mr. Ketan Sablok, CFO Mr. Sablok has 18 years of experience in Financial Planning and Analysis (FP&A),
Accounts, and MIS and Stakeholder Relationship Management. He is a Chartered Accountant and a Cost Accountant. He joined the company in
CY97 and has worked across various facets of Finance, Accounting, MIS, Systems Design and Integration, Business Planning and Analysis, and Acquisition during his tenure.

June 2021 59
Specialty Chemicals
Financials and valuations - NFIL
Standalone – Income Statement Y/E March FY16 FY17 FY18 FY19 FY20 FY21 FY22E FY23E FY24E Total Income from Operations 6,785 7,368 8,861 9,551 10,223 11,331 13,608 21,894 24,589 Change (%) 16.1 8.6 20.3 7.8 7.0 10.8 20.1 60.9 12.3 Gross Margins (%) 57.0 57.9 56.6 52.3 54.5 54.9 53.6 52.2 52.2 EBITDA 1,161 1,499 2,107 2,181 2,607 3,108 3,739 6,138 6,936 Margin (%) 17.1 20.3 23.8 22.8 25.5 27.4 27.5 28.0 28.2 Depreciation 209 284 382 259 337 407 461 554 674 EBIT 952 1,216 1,725 1,922 2,270 2,702 3,278 5,584 6,261 Int. and Finance Charges 32 5 7 5 16 14 14 14 14 Other Income 247 557 906 348 313 745 680 913 1,025 PBT bef. EO Exp. 1,167 1,768 2,625 2,265 2,567 3,433 3,944 6,483 7,272 EO Items 0 0 0 0 0 662 0 0 0 PBT after EO Exp. 1,167 1,768 2,625 2,265 2,567 4,095 3,944 6,483 7,272 Total Tax 302 441 835 780 -1,431 1,103 993 1,632 1,830 Tax Rate (%) 25.9 25.0 31.8 34.5 -55.7 26.9 25.2 25.2 25.2 Reported PAT 865 1,326 1,790 1,485 3,998 2,992 2,951 4,851 5,442 Adjusted PAT 865 1,326 1,790 1,485 3,998 2,508 2,951 4,851 5,442 Change (%) 75.1 53.4 34.9 -17.0 169.3 -37.3 17.7 64.4 12.2 Margin (%) 12.7 18.0 20.2 15.5 39.1 22.1 21.7 22.2 22.1 Standalone - Balance Sheet Y/E March FY16 FY17 FY18 FY19 FY20 FY21 FY22E FY23E FY24E Equity Share Capital 98 98 99 99 99 98 98 98 98 Total Reserves 7,132 8,137 9,601 10,493 13,790 16,402 18,817 22,786 27,238 Net Worth 7,230 8,235 9,700 10,592 13,889 16,500 18,915 22,884 27,336 Total Loans 299 0 0 0 0 0 0 0 0 Deferred Tax Liabilities 213 207 239 295 206 167 167 167 167 Capital Employed 7,742 8,443 9,939 10,887 14,096 16,667 19,082 23,051 27,503 Gross Block 4,304 4,377 3,232 3,511 4,643 4,937 8,237 10,237 12,237 Less: Accum. Deprn. 1,633 272 477 715 1,053 1,459 1,920 2,475 3,149 Net Fixed Assets 2,671 4,105 2,755 2,796 3,591 3,478 6,317 7,763 9,088 Capital WIP 139 168 201 393 389 365 365 365 365 Total Investments 2,909 3,157 5,219 5,267 3,387 4,503 4,503 4,503 4,503 Curr. Assets, Loans&Adv. 3,406 3,805 3,817 4,224 7,042 10,319 10,052 13,873 17,420 Inventory 627 989 924 929 1,361 1,543 1,763 2,815 3,154 Account Receivables 1,401 1,308 1,471 1,675 2,093 2,759 2,787 4,483 5,035 Cash and Bank Balance 152 297 219 224 2,641 3,889 3,375 4,448 7,104 Cash 93 224 136 127 1,692 761 247 1,320 3,976 Bank Balance 59 74 83 97 890 3,128 3,128 3,128 3,128 Loans and Advances 1,226 1,211 1,203 1,397 947 2,127 2,127 2,127 2,127 Curr. Liability & Prov. 1,383 2,793 2,053 1,794 1,644 1,998 2,156 3,454 3,874 Account Payables 759 760 889 679 922 1,027 1,195 1,908 2,138 Other Current Liabilities 547 1,941 1,056 1,005 590 824 786 1,265 1,420 Provisions 77 91 108 110 131 147 175 281 315 Net Current Assets 2,023 1,012 1,764 2,431 5,398 8,321 7,896 10,420 13,547 Appl. of Funds 7,742 8,443 9,939 10,887 14,096 16,667 19,082 23,051 27,503

June 2021 60
Specialty Chemicals
Financials and valuations – NFIL
Ratios Y/E March FY16 FY17 FY18 FY19 FY20 FY21 FY22E FY23E FY24E Basic (INR) EPS 17.6 27.1 36.5 30.3 81.6 51.2 60.2 99.0 111.1 EPS Growth (%) 75.1 53.4 34.9 -17.0 169.3 -37.3 17.7 64.4 12.2 Cash EPS 21.9 32.9 44.3 35.6 88.5 59.5 69.6 110.3 124.8 BV/Share 147.6 168.1 198.0 216.2 283.5 336.7 386.0 467.0 557.9 DPS 4.2 5.3 7.1 7.9 11.1 11.1 10.9 18.0 20.2 Payout (%) 28.6 26.2 19.9 41.7 17.9 18.2 18.2 18.2 18.2 Valuation (x) P/E 193.2 126.0 93.4 112.5 41.8 66.6 56.6 34.4 30.7 Cash P/E 155.6 103.8 77.0 95.8 38.5 57.3 49.0 30.9 27.3 P/BV 23.1 20.3 17.2 15.8 12.0 10.1 8.8 7.3 6.1 EV/Sales 24.6 22.6 18.8 17.5 16.1 14.4 12.0 7.4 6.5 EV/EBITDA 144.0 111.2 79.2 76.5 63.1 52.5 43.8 26.5 23.1 Dividend Yield (%) 0.1 0.2 0.2 0.2 0.3 0.3 0.3 0.5 0.6 FCF per share 11.8 -16.3 25.9 6.0 11.9 52.6 0.8 40.2 74.7 Return Ratios (%) RoE 13.4 17.2 20.0 14.6 32.7 16.5 16.7 23.2 21.7 RoCE 12.5 16.4 19.5 14.3 32.2 16.4 16.6 23.1 21.6 RoIC 17.7 19.5 25.8 27.1 55.7 25.3 26.2 34.0 32.0 Working Capital Ratios Fixed Asset Turnover (x) 2.8 2.2 2.6 3.4 3.2 3.2 2.8 3.1 2.9 Asset Turnover (x) 0.9 0.9 0.9 0.9 0.7 0.7 0.7 0.9 0.9 Inventory (Days) 34 49 38 35 49 50 47 47 47 Debtor (Days) 75 65 61 64 75 89 75 75 75 Creditor (Days) 41 38 37 26 33 33 32 32 32 Leverage Ratio (x) Current Ratio 2.5 1.4 1.9 2.4 4.3 5.2 4.7 4.0 4.5 Net Debt/Equity 0.0 0.0 0.0 0.0 -0.2 -0.2 -0.2 -0.2 -0.3 Standalone - Cash Flow Statement Y/E March FY16 FY17 FY18 FY19 FY20 FY21 FY22E FY23E FY24E OP/(Loss) before Tax 1,167 1,768 2,625 2,265 2,567 4,095 3,944 6,483 7,272 Depreciation 209 284 382 259 337 407 461 554 674 Others -73 -519 -694 -277 -210 -1,054 14 14 14 Direct Taxes Paid -261 -306 -496 -710 -456 -186 -993 -1,632 -1,830 (Inc)/Dec in WC -325 -275 -90 -637 -684 -305 -89 -1,451 -471 CF from Operations 717 951 1,727 900 1,555 2,958 3,337 3,969 5,660 Capex -137 -1,750 -457 -606 -972 -382 -3,300 -2,000 -2,000 Free Cash Flow 581 -800 1,270 294 582 2,576 37 1,969 3,660 Change in Investments 42 133 -1,338 190 1,706 -914 0 0 0 CF from Investments -314 -196 -1,489 -315 766 -3,452 -3,300 -2,000 -2,000 Inc/(Dec) in Debt -150 -299 0 0 0 0 0 0 0 Interest Paid -32 -5 -7 -5 -16 -14 -14 -14 -14 Dividend Paid -216 -343 -350 -611 -714 -394 -537 -882 -989 CF from Fin. Activity -392 -623 -326 -595 -756 -437 -551 -896 -1,004 Inc/Dec of Cash 11 131 -87 -9 1,565 -931 -513 1,073 2,656 Opening Balance 83 94 224 136 127 1,692 760 247 1,320 Closing Balance 94 224 136 127 1,692 760 247 1,320 3,976

June 2021 61
Specialty Chemicals
A pseudo FMCG company …higher growth ahead, and margins to rebound
GALSURF is one of the leading players in the world of Surfactants and Specialty Care Ingredients. It exclusively focuses on catering to the Home and Personal Care industry. It tends to be known as a ‘pseudo FMCG’ company due to its close association with the FMCG industry.
With a capacity of 436.5ktpa across seven plants, it is by far the largest manufacturer of oleo-chemical based surfactants in India. Around 9 out of 10 Indian consumers use products, which have GALSURF’s surfactants or specialty care ingredients, at least once in their daily routine.
Volumes have grown by ~8% CAGR over the last five years to 236kt in FY21. We expect the company to deliver ~10% CAGR over FY21-24E, in line with industry growth for Surfactants. It has 78 approved and 13 applied patents, which should drive higher growth. Valuing it at 33x FY23E P/E, we initiate coverage on GALSURF with a Buy rating and TP of INR3,520.
Industry at an inflection point… GALSURF is the largest player in growing Indian Surfactants market and has
huge growth opportunities (increase in middle income and working women). MNCs command a 60-65% share of the total market in India v/s 40% globally.
The company expects this share to reduce, with the increase in standalone brands, which provide solutions to end-customer rather than a normal product offering. E-commerce is expected to play a key role in the same.
Growth in the Middle East has been strong in the latter part of FY21; while sales from Tier III customers globally are likely to take some more time to revive (global Tier III share for company stands ~34%).
…GALSURF has its strategy and plans sketched GALSURF’s strategy is to develop its Specialty portfolio in developed markets
(the US, Europe, and APAC), where demand for mild surfactants, i.e. sulfate-free products, remains high.
Emerging markets are seeing huge demand for Performance Surfactants; while its Specialty portfolio is likely to grow on the back of an increase in affordability for premium products and standalone brands.
Valuation and view – initiating coverage with a Buy rating We expect 12% EBITDA and PAT CAGR over FY21-24E, with an improvement
in EBITDA/kg to INR20 (assuming 5% YoY growth in FY23 – as specialty products expansion at Jhagadia gets commissioned by end FY22), led by new product launches backed by strong R&D. RoEs are likely to stabilize going forward to 22% in FY22-24E v/s 24-25% in FY20-21.
Company has bought additional land at Jhagadia and is in the process of announcing a capex plan for the same. Any significant capex announced over next 1-2 years could further result in re-rating of the stock.
GALSURF has reduced its debt considerably from FY14 levels. We expect it to turn net cash by FY23E, despite capex plans of INR3b over FY22-24E.
Initiating Coverage | Sector: Chemicals
Galaxy Surfactants CMP: INR3,010 TP: INR3,520 (+17%) Buy
BSE Sensex S&P CNX 52,550 15,748
Stock info Bloomberg GALSURF IN Equity Shares (m) 35 M.Cap.(INRb)/(USDb) 107.6 / 1.4 52-Week Range (INR) 3350 / 1380 1, 6, 12 Rel. Per (%) -5/47/57
Financial Snapshot (INR b) Y/E March 2021 2022E 2023E Sales 27,841 31,192 35,518 EBITDA 4,488 4,937 5,702 PAT 3,021 3,163 3,782 EPS (INR) 85.2 89.2 106.7 EPS Gr. (%) 31.1 4.7 19.6 BV/Sh.(INR) 367.1 434.0 514.0 Ratios Net D:E 0.1 (0.0) (0.1) RoE (%) 25.5 22.3 22.5 RoCE (%) 21.1 19.9 21.3 Payout (%) 21.1 25.0 25.0 Valuations P/E (x) 35.4 33.9 28.3 P/BV (x) 8.2 7.0 5.9 EV/EBITDA (x) 24.1 21.7 18.5 Div. Yield (%) 0.6 0.7 0.9 FCF Yield (%) 2.4 2.0 2.4
Shareholding pattern (%) As On Mar-21 Dec-20 Mar-20 Promoter 70.9 70.9 70.9 DII 13.3 13.0 13.0 FII 3.4 3.5 3.5 Others 12.3 12.6 12.6 FII Includes depository receipts
Stock performance (one-year)

June 2021 62
Specialty Chemicals
Business segments – GALSURF has a robust portfolio of over 210 products Performance Surfactants (over 45 products) – 64% of total revenue Performance Surfactants do not need any special properties to be present in
products that are manufactured by the company. They can be categorized into two types: Anionic Surfactants and Non-Anionic Surfactants.
They are used as foam and dirt removal agents and as emulsifiers in Cosmetics and Personal Care products.
Specialty Care (over 165 products) – 36% of the total revenue These categories of products are more complex in nature and require more time
to produce than Performance Surfactants. For example, they are used as sunscreen agents to reduce toxicity, and have dermatological properties to reduce skin irritation.
They can be broken down into seven product categories such as Amphoteric Surfactants, Cationic Surfactants, UV filters, Preservatives and Preservative Blends, Specialty Ingredients, Fatty Alkanolamides (FA) and Fatty Acid Easters (FAE), and other care products.
Strong R&D capabilities GALSURF boasts of an in-house R&D team of 74 professionals comprising
doctorates, chemists, and engineers. It has a well-equipped R&D center, with a Product Application Center for proteins in Denville, US.
It has a collaborative product development approach with customers, which helps customers to choose the ‘right technology with the right application.’
The company is aiming to increase its R&D spends to ~2% of sales per year (from 1-1.5% currently), which would help them innovate and provide customers with unique solutions.
Exhibit 67: Manufacturing capacities of the company
Source: Company, MOFSL
Exhibit 68: Segmental product offerings
Source: Company, MOFSL
Strong R&D capabilities have led GALSURF to continuously
innovate, providing it with a sustainable and long-term
competitive advantage

June 2021 63
Specialty Chemicals
Financial story in charts Higher expected industry CAGR of ~11% till 2025 (v/s 6% over CY14-19) to drive growth…
Exhibit 69: Expect capacity utilization to ramp up…
Source: Company, MOFSL
Exhibit 70: …with higher volume growth in FY22-24E
Source: Company, MOFSL
Exhibit 71: Expect ~12% revenue CAGR over FY21-24E
Source: Company, MOFSL
Exhibit 72: EBITDA/MT is set to increase
Source: Company, MOFSL
Exhibit 73: Expect PAT margin to normalize further
Source: Company, MOFSL
Exhibit 74: GALSURF is likely to generate a FCF of INR7.9b…
Source: Company, MOFSL
Exhibit 75: …and become a net cash company by FY23E
Source: Company, MOFSL
Exhibit 76: One year forward PE trades at 32.4x…
Source: Company, MOFSL
294
302
351
359
368
436
436
436
436
436
194
191
208
251
265
266
266
306
327
327
66% 63% 59% 70% 72%
61% 61% 70% 75% 75%
FY15
FY16
FY17
FY18
FY19
FY20
FY21
FY22
E
FY23
E
FY24
E
tmt Capacity Production Utilisation (%)
153
158
177
197
215
224
236
260
286
314
3
12 11 9
4 5
10 10 10
FY15
FY16
FY17
FY18
FY19
FY20
FY21
FY22
E
FY23
E
FY24
E
Volumes sold (tmt) Increase (%)
12 11 14 16 17 16 18 17 20 21 8 8 8 8 10 10 10 14 16 18 19
.6
18.7
22.5
24.6
27.6
26.0
27.8
31.2
35.5
39.1
FY15
FY16
FY17
FY18
FY19
FY20
FY21
FY22
E
FY23
E
FY24
E
Revenue INR b Performance SurfactantsSpecialty ProductsTotal
1.9 2.4 2.7 2.9 3.5 3.7 4.5 4.9 5.7 6.3
12 15 15 15
16 16 19 19 20 20
FY15
FY16
FY17
FY18
FY19
FY20
FY21
FY22
E
FY23
E
FY24
E
EBITDA (INR b) EBITDA/mt
0.7 1.0 1.5 1.6 1.9 2.3 3.0 3.2 3.8 4.2
3 5 7 6 7
9 11 10 11 11
FY15
FY16
FY17
FY18
FY19
FY20
FY21
FY22
E
FY23
E
FY24
E
PAT (INR b) Margin (%)
0.7 0.7 0.9 1.1 1.7 2.6 2.1 2.6 3.2
1.0
0.4 0.6
1.7 1.4
1.1 1.0 1.0 1.0
FY16
FY17
FY18
FY19
FY20
FY21
FY22
E
FY23
E
FY24
E
INR bn FCF Capex
4.1 3.9 3.5 3.0 3.2 2.4 1.2 0.6 0.3 4.0 3.7 3.2 2.7 2.7
1.3 0.0
-1.6 -3.8
FY16
FY17
FY18
FY19
FY20
FY21
FY22
E
FY23
E
FY24
E
INR bn Debt Net Debt
32.4 20.9
32.4
15.0
25.6
16.2
12.0
22.0
32.0
42.0
Dec-
18Fe
b-19
Apr-
19
Jun-
19
Aug-
19
Oct
-19
Dec-
19
Feb-
20
Apr-
20
Jun-
20
Aug-
20
Oct
-20
Dec-
20Fe
b-21
Apr-
21
Jun-
21
P/E (x) Avg (x) Max (x)Min (x) +1SD -1SD
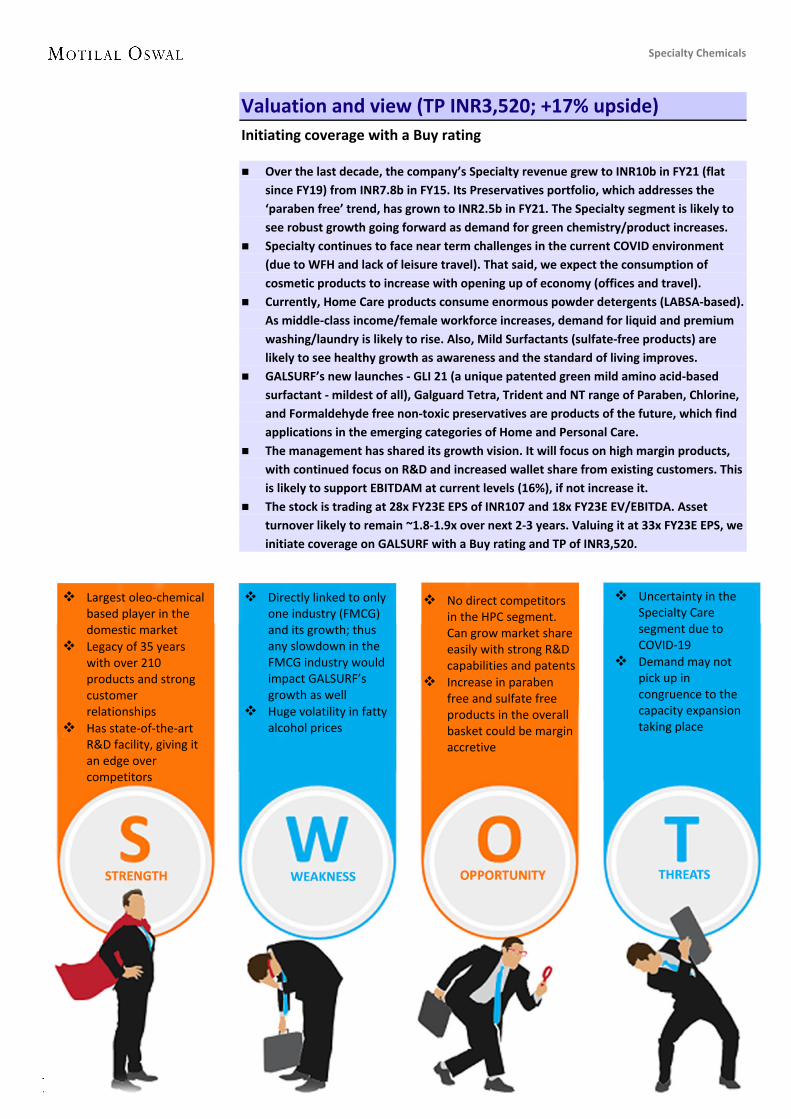
June 2021 64
Specialty Chemicals
Valuation and view (TP INR3,520; +17% upside) Initiating coverage with a Buy rating
Over the last decade, the company’s Specialty revenue grew to INR10b in FY21 (flat since FY19) from INR7.8b in FY15. Its Preservatives portfolio, which addresses the ‘paraben free’ trend, has grown to INR2.5b in FY21. The Specialty segment is likely to see robust growth going forward as demand for green chemistry/product increases.
Specialty continues to face near term challenges in the current COVID environment (due to WFH and lack of leisure travel). That said, we expect the consumption of cosmetic products to increase with opening up of economy (offices and travel).
Currently, Home Care products consume enormous powder detergents (LABSA-based). As middle-class income/female workforce increases, demand for liquid and premium washing/laundry is likely to rise. Also, Mild Surfactants (sulfate-free products) are likely to see healthy growth as awareness and the standard of living improves.
GALSURF’s new launches - GLI 21 (a unique patented green mild amino acid-based surfactant - mildest of all), Galguard Tetra, Trident and NT range of Paraben, Chlorine, and Formaldehyde free non-toxic preservatives are products of the future, which find applications in the emerging categories of Home and Personal Care.
The management has shared its growth vision. It will focus on high margin products, with continued focus on R&D and increased wallet share from existing customers. This is likely to support EBITDAM at current levels (16%), if not increase it.
The stock is trading at 28x FY23E EPS of INR107 and 18x FY23E EV/EBITDA. Asset turnover likely to remain ~1.8-1.9x over next 2-3 years. Valuing it at 33x FY23E EPS, we initiate coverage on GALSURF with a Buy rating and TP of INR3,520.
Uncertainty in the
Specialty Care segment due to COVID-19
Demand may not pick up in congruence to the capacity expansion taking place
No direct competitors in the HPC segment. Can grow market share easily with strong R&D capabilities and patents
Increase in paraben free and sulfate free products in the overall basket could be margin accretive
Directly linked to only one industry (FMCG) and its growth; thus any slowdown in the FMCG industry would impact GALSURF’s growth as well
Huge volatility in fatty alcohol prices
Largest oleo-chemical based player in the domestic market
Legacy of 35 years with over 210 products and strong customer relationships
Has state-of-the-art R&D facility, giving it an edge over competitors

June 2021 65
Specialty Chemicals
Bull and Bear Case
Exhibit 77: Product innovation and development for growth and margin expansion is key
TP (at 33x FY23E EPS) (INR m) FY21 FY22E FY23E FY24E CAGR
(FY21-24E, %) Thesis
Bear case Revenue 27,841 31,026 34,595 38,595 12 Assuming revenue growth of 8% over FY21-24E
(in line with its growth rate of the last five years) and EBITDAM normalization to ~15%
EBITDA 4,488 4,847 5,235 5,654 8 3,065 EPS (INR) 85.2 85.8 92.9 100.8 6
Base case Revenue 27,841 31,192 35,518 39,070 12 Assuming volume growth of 10% over FY21-24E
(in line with the industry growth rate) and EBITDAM sustaining around current levels
EBITDA 4,488 4,937 5,702 6,273 12 3,520 EPS (INR) 85.2 89.2 106.7 118.3 12
Bull Case Revenue 27,841 32,106 38,212 43,943 16 Assuming volume growth of 15% over FY21-24E,
as the dynamics for HPC changes post pandemic, and EBITDAM expansion to ~18%
EBITDA 4,488 5,678 6,856 7,884 21 4,335 EPS (INR) 85.2 104.9 131.3 152.9 22
Source: Company, MOFSL
Management overview
Mr. Unnathan Shekhar, promoter and Managing Director Mr. Shekhar has been associated with the company since 20th May’86. He holds a Bachelor’s Degree in Chemical Engineering from the University
Department of Chemical Technology, Mumbai and a Post Graduate Diploma in Management from the Indian Institute of Management, Calcutta.
He has over 30 years of experience in the Chemical Manufacturing industry and is a recipient of the ‘Distinguished Alumnus Award for CY98’ conferred by the University Department of Chemical Technology Alumni Association.
Mr. Kasargod Ganesh Kamath, Executive Director (Finance) and CFO Mr. Kamath has been associated with the company since 10th Sep’04. He is a
qualified Company Secretary from The Institute of Company Secretaries of India and a Cost Accountant from the Institute of Cost and Work Accountants of India.
In CY14, he was handed the responsibility of Special Projects and was designated as Vice President – Special Projects. He joined the board from 1st Apr’17. He has over 20 years of experience in the Banking and Financial sector.
Mr. K. Natarajan, Executive Director and COO Mr. Natarajan has been associated with GALSURF since 21st Apr’93. He is a Cost
Accountant from the Institute of Cost and Works Accountants of India and has completed an Advanced Management Program from Harvard Business School.
Since joining GALSURF in Apr’93, he has headed diverse functions including Finance, IT, Business Creation, Business Commercial, Global Sourcing, and Supply Chain, and was designated as Chief of Operations in Dec’09.
Mr. Shekhar Ravindranath, Chairman and Non-Executive Director Mr. Ravindranath has been associated with the company since 29th Jun’07. He was a fellow member of The Institute of Cost Accountants of India. He has
been associated with Hindustan Unilever in various capacities for over 30 years. He was the former Managing Director - Foods Division, Executive Director (Beverages), and Divisional Vice President Commercial for Detergents at Hindustan Unilever.

June 2021 66
Specialty Chemicals
Financials and valuations - GALSURF
Consolidated – Income Statement (INR m) Y/E March FY16 FY17 FY18 FY19 FY20 FY21 FY22E FY23E FY24E Total Income from Operations 18,715 22,480 24,625 27,630 25,964 27,841 31,192 35,518 39,070 Change (%) -4.3 20.1 9.5 12.2 -6.0 7.2 12.0 13.9 10.0 Gross Margins (%) 35.9 32.1 28.9 29.5 33.9 36.3 34.3 33.3 33.3 EBITDA 2,357 2,714 2,877 3,534 3,689 4,488 4,937 5,702 6,273 Margin (%) 12.6 12.1 11.7 12.8 14.2 16.1 15.8 16.1 16.1 Depreciation 452 472 485 512 622 740 747 807 867 EBIT 1,905 2,242 2,392 3,022 3,067 3,749 4,190 4,896 5,406 Int. and Finance Charges 339 272 306 300 238 134 86 43 21 Other Income 68 104 101 47 59 109 122 201 221 PBT bef. EO Exp. 1,635 2,074 2,188 2,769 2,888 3,723 4,226 5,053 5,605 PBT after EO Exp. 1,638 2,074 2,188 2,769 2,888 3,723 4,226 5,053 5,605 Total Tax 608 598 607 859 584 702 1,064 1,272 1,411 Tax Rate (%) 37.1 28.8 27.8 31.0 20.2 18.8 25.2 25.2 25.2 Reported PAT 1,030 1,476 1,580 1,910 2,304 3,021 3,163 3,782 4,194 Adjusted PAT 1,028 1,476 1,580 1,910 2,304 3,021 3,163 3,782 4,194 Change (%) 52.5 43.6 7.1 20.9 20.6 31.1 4.7 19.6 10.9 Margin (%) 5.5 6.6 6.4 6.9 8.9 10.9 10.1 10.6 10.7 Consolidated - Balance Sheet Y/E March FY16 FY17 FY18 FY19 FY20 FY21 FY22E FY23E FY24E Equity Share Capital 355 355 355 355 355 355 355 355 355 Total Reserves 4,123 5,395 6,833 8,413 10,323 12,660 15,032 17,868 21,013 Net Worth 4,478 5,749 7,188 8,767 10,678 13,014 15,386 18,222 21,368 Total Loans 4,117 3,929 3,480 2,978 3,196 2,374 1,187 594 297 Deferred Tax Liabilities 207 253 277 320 241 233 233 233 233 Capital Employed 8,802 9,930 10,944 12,065 14,115 15,621 16,806 19,049 21,898 Gross Block 7,743 8,183 8,548 9,722 11,525 11,945 12,945 13,945 14,945 Less: Accum. Deprn. 3,502 3,711 4,148 4,609 5,231 5,971 6,717 7,524 8,391 Net Fixed Assets 4,241 4,472 4,399 5,112 6,294 5,974 6,227 6,421 6,554 Goodwill on Consolidation 117 24 24 25 28 27 27 27 27 Capital WIP 508 103 249 826 660 1,240 1,240 1,240 1,240 Curr. Assets, Loans&Adv. 6,227 8,273 9,881 9,717 11,081 12,821 14,353 17,149 20,487 Inventory 2,358 3,174 3,456 3,513 3,250 4,278 4,810 5,462 6,008 Account Receivables 2,502 3,472 4,182 4,268 4,394 4,689 5,254 5,982 6,581 Cash and Bank Balance 160 261 276 257 542 1,114 1,221 2,211 4,056 Cash 147 257 271 250 477 815 923 1,913 3,757 Bank balance 14 4 5 7 65 299 299 299 299 Loans and Advances 1,208 1,366 1,966 1,680 2,894 2,740 3,068 3,493 3,842 Curr. Liability & Prov. 2,291 2,942 3,610 3,615 4,005 4,874 5,475 6,222 6,844 Account Payables 1,965 2,523 3,278 3,059 2,731 3,770 4,238 4,813 5,294 Other Current Liabilities 184 309 230 416 1,098 918 1,028 1,171 1,288 Provisions 142 110 102 140 176 186 209 238 262 Net Current Assets 3,937 5,331 6,271 6,102 7,075 7,947 8,878 10,928 13,643 Appl. of Funds 8,802 9,931 10,944 12,065 14,115 15,621 16,806 19,049 21,898

June 2021 67
Specialty Chemicals
Financials and valuations – GALSURF
Ratios Y/E March FY16 FY17 FY18 FY19 FY20 FY21 FY22E FY23E FY24E Basic (INR) EPS 29.0 41.6 44.6 53.9 65.0 85.2 89.2 106.7 118.3 EPS Growth (%) 52.5 43.6 7.1 20.9 20.6 31.1 4.7 19.6 10.9 Cash EPS 41.8 54.9 58.3 68.3 82.5 106.1 110.3 129.4 142.8 BV/Share 126.3 162.2 202.8 247.3 301.2 367.1 434.0 514.0 602.8 DPS 6.0 4.0 3.0 12.0 17.0 18.0 22.3 26.7 29.6 Payout (%) 24.9 11.6 8.1 26.9 31.5 21.1 25.0 25.0 25.0 Valuation (x) P/E 104.1 72.5 67.7 56.1 46.5 35.4 33.9 28.3 25.5 Cash P/E 72.3 55.0 51.8 44.2 36.6 28.5 27.4 23.3 21.2 P/BV 23.9 18.6 14.9 12.2 10.0 8.2 7.0 5.9 5.0 EV/Sales 5.9 4.9 4.5 4.0 4.2 3.9 3.4 3.0 2.6 EV/EBITDA 47.1 40.8 38.3 31.1 29.7 24.1 21.7 18.5 16.5 Dividend Yield (%) 0.2 0.1 0.1 0.4 0.6 0.6 0.7 0.9 1.0 FCF per share 19.6 18.9 25.1 32.4 49.2 72.7 61.2 72.5 90.6 Return Ratios (%) RoE 24.9 28.9 24.4 23.9 23.7 25.5 22.3 22.5 21.2 RoCE 14.3 17.8 17.3 18.4 19.1 21.1 19.9 21.3 20.6 RoIC 14.6 18.0 17.3 19.5 20.5 23.7 23.4 25.2 25.8 Working Capital Ratios Fixed Asset Turnover (x) 4.3 5.2 5.6 5.8 4.6 4.5 5.1 5.6 6.0 Asset Turnover (x) 2.1 2.3 2.3 2.3 1.8 1.8 1.9 1.9 1.8 Inventory (Days) 46 52 51 46 46 56 56 56 56 Debtor (Days) 49 56 62 56 62 61 61 61 61 Creditor (Days) 38 41 49 40 38 49 50 49 49 Leverage Ratio (x) Current Ratio 2.7 2.8 2.7 2.7 2.8 2.6 2.6 2.8 3.0 Net Debt/Equity 0.9 0.6 0.4 0.3 0.2 0.1 0.0 -0.1 -0.2 Consolidated - Cash Flow Statement Y/E March FY16 FY17 FY18 FY19 FY20 FY21 FY22E FY23E FY24E OP/(Loss) before Tax 1,638 2,074 2,188 2,769 2,888 3,723 4,226 5,053 5,605 Depreciation 452 472 485 512 622 740 747 807 867 Others 339 268 249 288 220 79 86 43 21 Direct Taxes Paid -608 -568 -583 -750 -686 -706 -1,064 -1,272 -1,411 (Inc)/Dec in WC -127 -1,135 -886 11 113 -186 -824 -1,059 -871 CF from Operations 1,694 1,111 1,454 2,830 3,157 3,651 3,171 3,572 4,212 Capex -1,000 -440 -562 -1,680 -1,414 -1,073 -1,000 -1,000 -1,000 Free Cash Flow 694 671 891 1,150 1,744 2,578 2,171 2,572 3,212 CF from Investments -1,000 -440 -562 -1,680 -1,414 -1,073 -1,000 -1,000 -1,000 Inc/(Dec) in Debt -393 -133 -485 -623 562 -951 -1,187 -594 -297 Interest Paid -339 -264 -285 -272 -226 -152 -86 -43 -21 Dividend Paid -256 -173 -127 -298 -940 -495 -791 -945 -1,049 CF from Fin. Activity -735 -570 -897 -1,192 -1,434 -1,650 -2,064 -1,582 -1,367 Inc/Dec of Cash -41 101 -6 -42 309 928 108 990 1,845 Opening Balance 188 147 257 271 250 477 815 923 1,913 Closing Balance 147 257 270 251 477 815 923 1,913 3,758

June 2021 68
Specialty Chemicals
Stable outlook ahead Utilization ramp-up and import substitution to compliment growth
FINEORG is the largest manufacturer of oleo-chemical based Additives in India, producing over 400 Specialty Additives. It is a key producer globally, with two subsidiaries – Fine Organics (USA), and Fine Organics Europe BV, and two JVs – Fine Zeelandia Pvt and FineADD Ingredients.
It recently commissioned its third facility at Ambernath (32ktpa capacity) and phase I at Patalganga (10ktpa) – taking its total capacity to 111ktpa. These new capacities are expected to reach optimal levels over the next three years, generating additional revenue of INR6-6.5b on an asset turnover of 2.5-3x.
In line with these expansions, we forecast ~18% revenue CAGR over FY21-24E v/s ~10% clocked over FY16-21. Despite assuming EBITDAM expansion to 22% in FY23-24E v/s the management’s guidance of ~20% (EBITDA/PAT CAGR of 29%/ 36%), we see no upside to the stock. We value the company at 40x FY23E EPS to arrive at our TP of INR3,135. We initiate coverage with a Neutral rating.
Demand to remain robust (ahead of industry growth)… The Indian Food Emulsifier/Polymer Additives market is expected to clock
~8%/10% CAGR till CY25 respectively. Strong R&D capabilities and development of new products in CosPha (expect 15% CAGR till CY25) will aid FINEORG (largest organized player in India) to achieve higher growth.
Entry barriers in this industry remain high on the back of complex technology (for green additives), and stringent quality parameters and regulation. With more than 450 products and over 750 direct customers, FINEORG has established itself as a trusted and preferred supplier.
The company has recently developed a green antimicrobial additive to make plastics safer for customers. The shift towards natural and organic Cosmetics, along with the eco-friendly products, is expected to lift this market in future.
…with a recovery in margin after a dip in FY21 The management expects to sustain EBITDAM at 18-20% (v/s ~17% in
FY21), with a normalization in feedstock cost. Prices of raw materials (vegetable oils for oleo-chemicals) touched a record high during the pandemic on the back of strong demand.
FINEORG has long-standing relationships with its suppliers, which enables it to source raw materials at competitive prices. However, any disruption in the supply chain can impact the company’s profitability.
Also, it has a team of 18 scientist, engineers, and technologists working on creating value for its customers – thus providing company an edge.
Valuation and view – initiating coverage with a Neutral rating The Cabinet has approved INR110b under the PLI scheme for the Food
Processing industry. It will provide incentives to MSMEs if they achieve a minimum growth of 6-7%. This would help FINEORG grow at a faster rate.
As per our assumptions, the company’s asset turnover is likely to remain stagnant around current levels of 1.4-1.5x over next 2-3 years.
Initiating Coverage | Sector: Chemicals
Fine Organics CMP: INR2,878 TP: INR3,135 (+9%) Neutral
BSE Sensex S&P CNX 52,550 15,748
Stock info Bloomberg FINEORG IN Equity Shares (m) 31 M.Cap.(INRb)/(USDb) 88.9 / 1.2 52-Week Range (INR) 3565 / 1852 1, 6, 12 Rel. Per (%) -21/6/1
Financial Snapshot (INR b) Y/E March FY21 FY22E FY23E Sales 11,213 13,450 16,133 EBITDA 1,921 2,413 3,537 PAT 1,149 1,548 2,402 EPS (INR) 37.5 50.5 78.3 EPS Gr. (%) (31.0) 34.7 55.2 BV/Sh.(INR) 241.0 276.3 331.2 Ratios Net D:E (0.3) (0.3) (0.4) RoE (%) 16.8 19.5 25.8 RoCE (%) 15.7 18.7 25.0 Payout (%) 37.3 30.0 30.0 Valuations P/E (x) 77.1 57.2 36.9 P/BV (x) 12.0 10.5 8.7 EV/EBITDA (x) 45.1 35.6 24.0 Div. Yield (%) 0.5 0.5 0.8 FCF Yield (%) 1.0 1.2 2.3
Shareholding pattern (%) As On Mar-21 Dec-20 Mar-20 Promoter 75.0 75.0 75.0 DII 14.2 14.1 14.1 FII 5.9 6.4 6.4 Others 4.9 4.5 4.5 FII Includes depository receipts
Stock performance (one-year)

June 2021 69
Specialty Chemicals
Exhibit 78: FINEORG’s capacity and project expansion details
Plant Capacity (tpa) Remarks
First Ambernath facility 49,500
Badlapur facility 6,400
Dombivli facility 8,400
Second Ambernath plant 5,000
Total 69,300 Running at optimal utilization in FY20
Third Ambernath plant 32,000 Commenced operation in 2QFY20
Patalganga facility 10,000 Phase I commissioned in the latter part of FY21
Total 42,000 Total 1,11,300
Source: Company, MOFSL
Exhibit 79: Oleo-chemicals value chain: oleo-chemicals have been replacing petrochemicals used in surfactants
Source: Mitsui, MOFSL
Market potential and opportunities in various segments Food Food Additives help in enhancing the quality of products (both visually as well
as in terms of end-properties. For example, smoothness, creamy consistency, and homogeneous texture of a chocolate). It also protects food via imparting anti-staling and anti-fungal properties, thus maintaining the quality and freshness of various bakery products.
Opportunities: The key contributors to growth are: 1) rise in consumption of processed foods – further accelerated by the COVID-19 pandemic; 2) increasing urbanization and growing affinity towards convenience products; 3) high growth rate of the Food and Beverage industry, and 4) increasing number of end-use applications due to multi-functional attributes of emulsifiers.

June 2021 70
Specialty Chemicals
Feed Nutrition These Additives are 100% bio-based, which offers benefits through improved
animal health and fertility, thus resulting in higher quality and more nutritious derived products such as milk and milk-based products.
These products provide natural nutritional replacements to synthetic chemical products for animals, and natural antimicrobials in feeds, facilitating the growth of birds and cattle.
Plastics/Polymer Plastic/Polymer Additives help prevent surface defects and offers superior
aesthetics (for example, films used in Food Packaging and Agricultural applications), make molding process more efficient through better mold release, reduces dust pick-up in the final product by dissipating static charge, enhances polymer processing and increases production rate by reducing surface friction.
The market for Plastic Additives is classified into: antioxidants, anti-blocks, UV stabilizers, fillers, catalysts, lubricants, processing aids, flow improvers, Slip Additives, Antistatic Additives, pigment wetting agents, Anti-Fog Additives, impact modifiers, and others.
Opportunities: The growth in e-commerce is propelling the Packaging industry, coupled with increased demand from the Retail industry. Replacement of conventional products and an increasing preference for non-toxic polymers to aid growth in this segment.
Cosmetics and Pharmaceuticals (CosPha) CosPha Additives are capable of offering excellent consistency (pearlescent
effect – which increases the consumer appeal) and aids in achieving long-term physical stability in creams, ointments, and lotions. They contribute in cleansing formulations as mild co-surfactant and antimicrobial components.
Opportunities: Rising disposable incomes, growing population (gaining popularity with millennials), increasing awareness, and products containing multiple benefits (such as those with anti-ageing properties, moisturizing care, and sunscreen protection in a single product) is driving growth for Cosmetics.
Coatings, rubber and other Specialty Additives Coatings Additives act as anti-settling agents, emulsifiers, thickening/anti-
sagging agents, wetting and dispersing agents, defoamers, biocides, and anti-mar waxes, thereby improving the appearance and performance of coatings.
Rubber Additives help improve compounding and processing of rubber via improved flow, easy release, and surface quality. They find wide applications across conveyor belts, automotive parts, hoses and shoe soles, etc.
Other Specialty Additives aid in the printing process (ensuring a high quality printed surface) and in road marking paint by offering excellent quality.
Opportunities: The growing e-commerce business (like packaging), increasing applications (use of plastics across industries, Automobiles, Durables etc.), and technological advancements are the future growth drivers for the industry.

June 2021 71
Specialty Chemicals
Financials story in charts Stable growth, but stagnant margin and expensive valuations
Exhibit 80: Expect ~18% revenue CAGR over FY21-24E…
Source: Company, MOFSL
Exhibit 81: …with constant export-to-domestic mix
Source: Company, MOFSL Exhibit 82: Expect EBITDAM to return to ~22%...
Source: Company, MOFSL
Exhibit 83: …along with an improvement in PAT margin
Source: Company, MOFSL Exhibit 84: Capex for the next three years stands at INR0.9b
Source: Company, MOFSL
Exhibit 85: FINEORG remains net cash positive
Source: Company, MOFSL
Exhibit 86: One year forward PE trades at 51x…
Source: Company, MOFSL
Exhibit 87: …with return ratios recovering to ~25-26%
Source: Company, MOFSL
2 3 3 3 4 5 5 5 6 7 8 4 4 4 5 5 6 6 6 7
9 10
5.9 6.5 6.9 8.1 8.7 10.4 10.3 11.2
13.4 16.1
18.6
FY14
FY15
FY16
FY17
FY18
FY19
FY20
FY21
FY22
E
FY23
E
FY24
E
Revenue INR b
Domestic Exports Total
41%
41%
46%
38%
43%
45%
45%
45%
45%
45%
45%
59%
59%
54%
62%
57%
55%
55%
55%
55%
55%
55%
FY14
FY15
FY16
FY17
FY18
FY19
FY20
FY21
FY22
E
FY23
E
FY24
E
Revenue mix
Domestic Exports
1.1 1.2 1.5 1.5 1.6 2.2 2.4 1.9 2.4 3.5 4.1
18 18 21
18 19 21 23
17 18 22 22
FY14
FY15
FY16
FY17
FY18
FY19
FY20
FY21
FY22
E
FY23
E
FY24
E
INR b EBITDA Margin (%)
0.6 0.5 0.8 0.8 1.0 1.3 1.7 1.1 1.5 2.4 2.9
11 8
11 10 12 12
16
10 12 15 16
FY14
FY15
FY16
FY17
FY18
FY19
FY20
FY21
FY22
E
FY23
E
FY24
E
INR b Adjusted PAT Margin (%)
-8
5 29 11 8 5 47 29 35 65 84
268
654
244 152 401
819 727 463
300 300 300
FY14
FY15
FY16
FY17
FY18
FY19
FY20
FY21
FY22
E
FY23
E
FY24
E
FCF per share Capex (INR mn)
1.1 1.0 1.0 0.4 0.5 1.1 0.9 0.6 0.5 0.4 0.3
1.0 1.0 0.6 0.3 0.5 0.1 (1.1)
(2.0) (2.6) (3.9)
(5.6)
FY14
FY15
FY16
FY17
FY18
FY19
FY20
FY21
FY22
E
FY23
E
FY24
E
Debt (INR b) Net Debt (INR b)
51.0 39.5
62.3
17.3
54.1 24.8
0.0
20.0
40.0
60.0
80.0
Dec-
18Fe
b-19
Apr-
19Ju
n-19
Aug-
19O
ct-1
9De
c-19
Feb-
20Ap
r-20
Jun-
20
Aug-
20O
ct-2
0De
c-20
Feb-
21Ap
r-21
Jun-
21
P/E (x) Avg (x) Max (x)Min (x) +1SD -1SD
49
30 34 27 27 28 29
17 20 26 26
29
20 25 23 25 24 25
16 19
25 25
FY14
FY15
FY16
FY17
FY18
FY19
FY20
FY21
FY22
E
FY23
E
FY24
E
RoE RoCE

June 2021 72
Specialty Chemicals
Valuation and view (TP INR3,135; +9% upside) Initiating coverage with a Neutral rating
FINEORG has been constantly enhancing its Food Emulsifiers through continued R&D and process integration for Biscuits and Bakery products, which witnessed a larger offtake during the pandemic. Growing awareness and demand for healthier and organic food products is expected to propel usage of emulsifiers in the country. Surging demand for malt drinks will further drive the market for Food Emulsifiers.
FINEORG will set up a new joint venture facility in Thailand, with the shareholding pattern as follows: Fine Organic Industries (FINEORG) – India: 45%; Oleofine Organics Thailand Co. (OFT): 45%; and Oleofine Organics Sdn. (OFM) – Malaysia: 10%. The project would enjoy the advantage of easier procurement of palm oil, with Indonesia, Malaysia, and Thailand being the major (88%) producers of palm oil globally.
On 23rd Dec’20, the Maharashtra Pollution Control (MPCB) issued a blanket order to close all facilities in the vicinity of Ambernath in violation of water and air norms. This also impacted FINEORG’s operations at its Ambernath facility, which was later allowed to restart on 11th Jan’21.
Despite building in aggressive numbers ahead of the company’s guidance (considering normalization in raw materials prices from its peak and cost efficiencies with a ramp up in production), our estimates do not result in significant upside from the CMP.
Any delay in ramp-up of the expanded capacity would further result in downward revision to our estimates. The stock is trading at 37x FY23E EPS of INR78 and 24x FY23E EV/EBITDA. We value the company at 40x FY23E EPS to arrive at our TP of INR3,135. We initiate coverage on FINEORG with a Neutral rating.
The slowdown in end-
user industries (like Paints, Coatings, and Construction Chemicals) could hamper growth in the near term
The cyclical nature of key raw materials (vegetable oils) could impact production as well as margin
In-house process design expertise in constructing production facilities significantly reduces capex v/s other players
Technological advancement to cater to need-based solutions as per the varied needs of clients
Long product approvals, especially for food and feed nutrients, could impact new customer procurement, and growth in volumes in the near term
The largest organized player in oleo-chemical based Green Additives in India
It is one of the top six global players in Specialty Food Emulsifiers
It is one of the top five global players in Polymer Additives

June 2021 73
Specialty Chemicals
Bull and Bear Case
Exhibit 88: End-user industry growth and recovery in margin remains key
TP (at 40x FY23 EPS) (INR m) FY21 FY22E FY23E FY24E CAGR
(FY21-24E, %) Thesis
Bear Case Revenue 11,213 12,558 14,065 15,753 12 Assuming volume growth at 12% CAGR over
FY21-24E, in line with end-user industry growth (assuming no legacy advantage for the company)
EBITDA 1,921 2,539 2,878 3,261 19 INR2,490 EPS 37.5 54.1 62.2 71.4 24
Base Case Revenue 11,213 13,450 16,133 18,553 18 Assuming 18% revenue CAGR over FY21-24E, in
line with the management's guidance, backed by recent expansion – with higher than guided margins
EBITDA 1,921 2,413 3,537 4,116 29
INR3,135 EPS 37.5 50.5 78.3 94.1 36
Bull Case Revenue 11,213 14,016 17,520 21,024 23 Assuming 23% revenue CAGR at over FY21-24E,
assuming faster ramp up of new capacities and meaningful contribution from Thailand JV
EBITDA 1,921 3,094 4,193 5,268 40 INR3,775 EPS 37.5 67.6 94.3 120.9 48
Source: Company, MOFSL
Management overview Mr. Prakash Kamat, Chairman He holds a master’s degree in science and technology (oils) from the Institute of
Chemical Technology (formerly UDCT). He has been associated with the group since inception. Mr. Kamat has varied
experience in product development, process technology, and R&D.
Mr. Mukesh Shah, Managing Director He holds a bachelor’s degree in science. He joined the company in CY73. He played a key role in establishing quality control and global sales and
marketing.
Mr. Jayen Shah, CEO He holds a master’s degree in science. He joined the company in CY86. Mr. Shah was instrumental in creating a strong vendor-partner network,
established Fine Zeelandia Pvt (a JV).
Mr. Tushar Shah, CFO He joined the company in CY89. He led several initiatives like ERP, CRM,
logistics, among others. He played a key role in the development of the first Slip Additives facility.

June 2021 74
Specialty Chemicals
Financials and valuations – FINEORG
Standalone – Income Statement (INR m) Y/E March FY16 FY17 FY18 FY19 FY20 FY21 FY22E FY23E FY24E Total Income from Operations 6,920 8,144 8,651 10,440 10,262 11,213 13,450 16,133 18,553 Change (%) 7.2 17.7 6.2 20.7 -1.7 9.3 19.9 20.0 15.0 Gross Margins (%) 44.0 38.8 35.6 37.3 40.9 35.2 35.0 38.0 38.0 EBITDA 1,469 1,467 1,640 2,223 2,361 1,921 2,413 3,537 4,116 Margin (%) 21.2 18.0 19.0 21.3 23.0 17.1 17.9 21.9 22.2 Depreciation 298 237 200 175 347 468 506 539 572 EBIT 1,171 1,230 1,440 2,048 2,014 1,453 1,907 2,997 3,543 Int. and Finance Charges 71 44 31 18 48 61 42 34 27 Other Income 76 43 164 202 205 170 204 246 340 PBT bef. EO Exp. 1,176 1,229 1,572 2,233 2,172 1,562 2,068 3,210 3,856 PBT after EO Exp. 1,175 1,229 1,572 2,233 2,172 1,562 2,068 3,210 3,856 Total Tax 407 429 559 942 507 413 521 808 971 Tax Rate (%) 34.6 34.9 35.5 42.2 23.3 26.4 25.2 25.2 25.2 Reported PAT 769 800 1,014 1,290 1,665 1,149 1,548 2,402 2,886 Adjusted PAT 769 800 1,014 1,290 1,665 1,149 1,548 2,402 2,886 Change (%) 44.9 4.0 26.7 27.3 29.0 -31.0 34.7 55.2 20.1 Margin (%) 11.1 9.8 11.7 12.4 16.2 10.3 11.5 14.9 15.6 Standalone - Balance Sheet Y/E March FY16 FY17 FY18 FY19 FY20 FY21 FY22E FY23E FY24E Equity Share Capital 51 51 153 153 153 153 153 153 153 Total Reserves 2,534 3,298 3,931 4,931 6,154 7,235 8,319 10,000 12,020 Net Worth 2,585 3,350 4,085 5,084 6,308 7,388 8,472 10,153 12,173 Total Loans 1,021 403 536 1,130 915 567 454 363 291 Capital Employed 3,577 3,752 4,621 6,219 7,222 7,956 8,926 10,516 12,464 Gross Block 2,343 2,290 2,395 2,464 4,192 4,453 4,753 5,053 5,353 Less: Accum. Deprn. 1,096 1,322 1,515 1,686 2,033 2,500 3,007 3,546 4,118 Net Fixed Assets 1,247 968 881 778 2,159 1,953 1,747 1,507 1,235 Capital WIP 57 28 317 1,063 58 263 263 263 263 Total Investments 54 143 143 167 442 437 437 437 437 Curr. Assets, Loans&Adv. 2,841 3,406 4,079 5,086 5,964 6,901 8,646 10,908 13,517 Inventory 737 885 833 790 1,195 1,089 2,033 2,439 2,805 Account Receivables 955 1,203 1,611 1,670 1,451 1,745 1,902 2,281 2,623 Cash and Bank Balance 387 142 71 1,031 2,056 2,612 3,065 4,228 5,846
Cash 367 103 54 1,020 2,009 2,564 3,017 4,180 5,799 Bank Balance 16 39 17 11 48 48 48 48 48
Loans and Advances 761 1,176 1,564 1,595 1,262 1,454 1,646 1,960 2,243 Curr. Liability & Prov. 622 793 799 875 1,401 1,598 2,166 2,599 2,988 Account Payables 532 676 693 523 843 1,084 1,434 1,721 1,979 Other Current Liabilities 82 117 84 307 526 473 689 827 951 Net Current Assets 2,219 2,613 3,280 4,211 4,563 5,303 6,479 8,309 10,529 Appl. of Funds 3,577 3,752 4,621 6,219 7,222 7,956 8,926 10,516 12,464

June 2021 75
Specialty Chemicals
Financials and valuations – FINEORG
Ratios Y/E March FY16 FY17 FY18 FY19 FY20 FY21 FY22E FY23E FY24E Basic (INR) EPS 25.1 26.1 33.1 42.1 54.3 37.5 50.5 78.3 94.1 Cash EPS 34.8 33.8 39.6 47.8 65.6 52.7 67.0 95.9 112.8 BV/Share 84.3 109.2 133.2 165.8 205.7 241.0 276.3 331.2 397.0 DPS 0.0 0.0 7.5 7.0 11.0 14.0 15.1 23.5 28.2 Payout (%) 0.0 0.0 27.3 20.0 24.4 37.3 30.0 30.0 30.0 Valuation (x) P/E 115.2 110.8 87.4 68.7 53.2 77.1 57.2 36.9 30.7 Cash P/E 83.0 85.5 73.0 60.5 44.0 54.8 43.1 30.1 25.6 P/BV 34.3 26.5 21.7 17.4 14.0 12.0 10.5 8.7 7.3 EV/Sales 12.9 10.9 10.3 8.5 8.5 7.7 6.4 5.3 4.5 EV/EBITDA 60.7 60.6 54.3 39.9 37.0 45.1 35.6 24.0 20.2 Dividend Yield (%) 0.0 0.0 0.3 0.2 0.4 0.5 0.5 0.8 1.0 FCF per share 28.8 11.0 7.9 5.0 47.3 28.7 35.0 65.5 84.3 Return Ratios (%) RoE 33.8 27.0 27.3 28.1 29.2 16.8 19.5 25.8 25.9 RoCE 24.9 22.6 24.7 24.0 25.3 15.7 18.7 25.0 25.3 RoIC 25.7 24.6 24.7 29.4 35.8 23.0 29.1 41.7 46.1 Working Capital Ratios Fixed Asset Turnover (x) 5.6 7.4 9.4 12.6 7.0 5.5 7.3 9.9 13.5 Asset Turnover (x) 1.9 2.2 1.9 1.7 1.4 1.4 1.5 1.5 1.5 Inventory (Days) 39 40 35 28 42 35 55 55 55 Debtor (Days) 50 54 68 58 52 57 52 52 52 Creditor (Days) 28 30 29 18 30 35 39 39 39 Leverage Ratio (x) Current Ratio 4.6 4.3 5.1 5.8 4.3 4.3 4.0 4.2 4.5 Net Debt/Equity 0.2 0.1 0.1 0.0 -0.2 -0.3 -0.3 -0.4 -0.5 Standalone - Cash Flow Statement (INR m) Y/E March FY16 FY17 FY18 FY19 FY20 FY21 FY22E FY23E FY24E OP/(Loss) before Tax 1,176 1,229 1,572 2,232 2,172 1,562 2,068 3,210 3,856 Depreciation 298 237 200 174 347 468 506 539 572 Others 70 1 -118 -158 -144 -106 42 34 27 Direct Taxes Paid -426 -495 -509 -855 -612 -415 -521 -808 -971 (Inc)/Dec in WC 7 -483 -503 -423 416 -167 -724 -667 -601 CF from Operations 1,126 490 643 972 2,178 1,343 1,372 2,308 2,884 (Inc)/Dec in FA -244 -152 -401 -819 -727 -463 -300 -300 -300 Free Cash Flow 882 338 242 153 1,451 880 1,072 2,008 2,584 Others 99 46 -118 -73 172 57 0 0 0 CF from Investments -198 -163 -521 -934 -842 -402 -300 -300 -300 Inc/(Dec) in Debt -47 -539 0 1,081 -14 -347 -113 -91 -73 Interest Paid 0 -38 -21 -33 -63 -52 -42 -34 -27 Dividend Paid -443 0 -277 -258 -407 -92 -464 -721 -866 Others -68 -15 125 139 137 106 0 0 0 CF from Fin. Activity -558 -592 -172 929 -346 -385 -620 -845 -965 Inc/Dec of Cash 370 -264 -49 966 989 555 452 1,163 1,619 Opening Balance 17 367 103 54 1,020 2,009 2,564 3,017 4,180 Closing Balance 387 103 53 1,020 2,009 2,564 3,017 4,180 5,798

June 2021 76
Specialty Chemicals
Multifold growth ahead …expected to see a cyclical revival
NOCIL is the largest manufacturer of rubber chemicals in India, with a domestic/global market share of ~40%/~5% respectively. With a rich experience of over four decades, it is a one-stop shop and a dependable supplier of rubber chemicals. It provides an almost complete (~22) range of products.
After a sluggish FY19-20, volumes for the company grew ~13% in FY21, while the same for the industry declined ~7%. This led to market share gains for NOCIL. Restriction on tyre imports has helped the companies to operate at a higher rate in 2HFY21. Also, ADD investigations are ongoing on various products.
We forecast revenue/PAT CAGR of 25%/48% over FY21-24E. Valuing NOCIL at 22x FY23E EPS, we initiate coverage with a Buy rating and TP of INR275.
Ready to compete with China China accounts for 75% of global rubber chemical production and is a major
exporter as it consumes only 35%. However, due to COVID-19 and strictercompliance of environmental norms in China, buyers are looking elsewherefor alternative supply sources.
Globally, NOCIL is recognized for its technical capabilities, and on this aspectalone it enjoys an edge over peers.
At the end of FY21, it had an average capacity of 90ktpa (~70% utilization).With the commissioning of Phase 2B, capacity has increased to 110ktpa,which the management has guided at achieving 95% utilization by Sep’23.
Huge potential both domestically and internationally NOCIL’s exports are likely to strengthen further as global consumers look for
an alternative to Chinese suppliers. Exports constitute ~35% of total revenue in FY21, which is expected to reach ~40% over the next two years.
China produces ~0.7mmt of rubber chemicals (with ~35% exports, ~0.25mmt). Any movement of consumers from China to India could fill NOCIL’s remaining capacity of ~50ktpa (i.e. a 20% of China’s current export).
Over FY21-24E, we expect NOCIL to deliver ~25% revenue CAGR, with EBITDAM expansion to 20-22%, led by better price realizations and improvement in process efficiencies, thus decreasing conversion cost.
Valuation and view – initiating coverage with a Buy rating NOCIL is currently evaluating its next leg of the strategy for business
expansion. Specialized products form ~25% of the total revenue mix rightnow. Any new capex announcement in this category would be bothrealization and margin accretive. Each process plant at the facility hassufficient elbow room and can support 20-25% expansion if required.
The company became debt free in FY19 and internal accruals would helpfund the next leg of capex (FCF generation of INR4.7b over FY22-24E).
We expect return ratios to recover to 17-18% in FY23-24E (up from 7% inFY21). NOCIL saw a strong dividend payout (last five year average at ~40%),and we assume a similar payout going forward as well.
Initiating Coverage | Sector: Chemicals
NOCIL CMP: INR212 TP: INR275 (+30%) Buy BSE Sensex S&P CNX
52,550 15,748
Stock info Bloomberg NOCIL IN Equity Shares (m) 166 M.Cap.(INRb)/(USDb) 35.7 / 0.5 52-Week Range (INR) 221 / 82 1, 6, 12 Rel. Per (%) -4/37/95
Financial Snapshot (INR b) Y/E March FY21 FY22E FY23E Sales 9,247 13,223 15,510 EBITDA 1,269 2,310 3,063 PAT 865 1,547 2,075 EPS (INR) 5.2 9.3 12.5 EPS Gr. (%) (34.0) 78.9 34.1 BV/Sh.(INR) 76.6 82.2 89.7 Ratios Net D:E (0.1) (0.1) (0.1) RoE (%) 7.1 11.7 14.5 RoCE (%) 6.6 11.0 13.7 Payout (%) 48.0 40.0 40.0 Valuations P/E (x) 41.3 23.1 17.2 P/BV (x) 2.8 2.6 2.4 EV/EBITDA (x) 27.5 15.1 11.1 Div. Yield (%) 1.2 1.7 2.3 FCF Yield (%) 1.8 2.2 4.6
Shareholding pattern (%) As On Mar-21 Dec-20 Mar-20 Promoter 33.9 34.0 34.0 DII 5.2 5.1 5.1 FII 2.2 2.1 2.1 Others 58.7 58.9 58.9 FII Includes depository receipts
Stock performance (one-year)
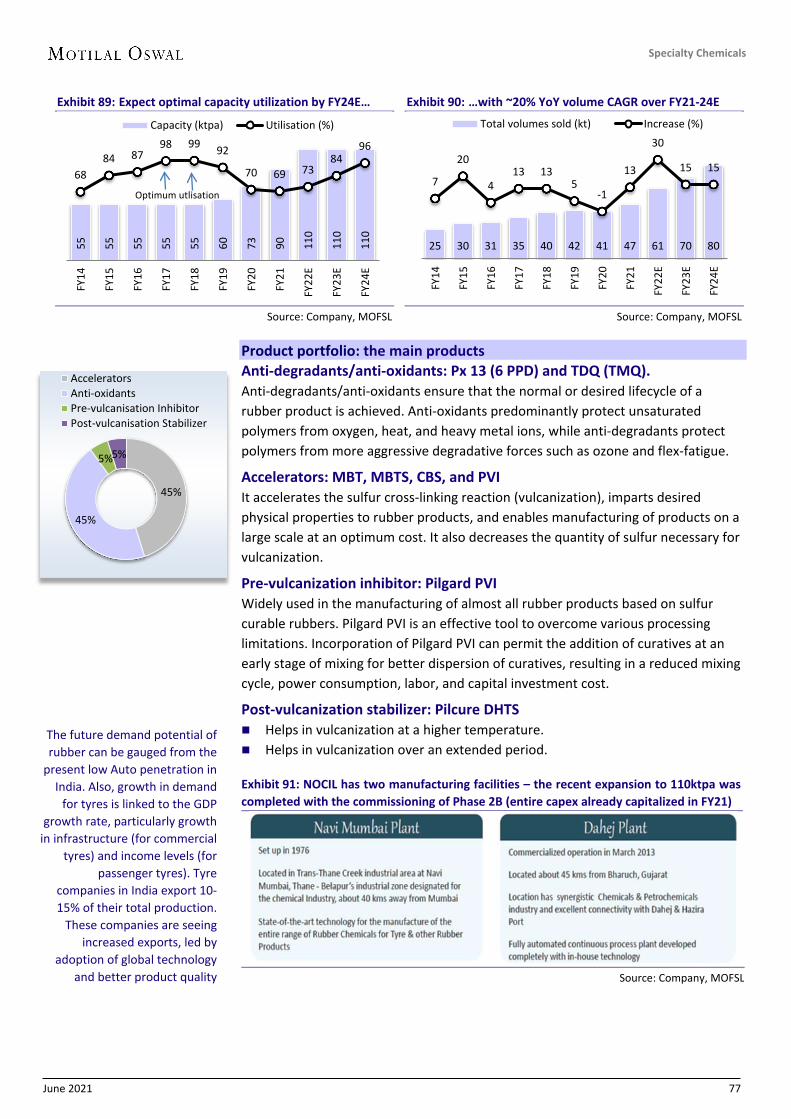
June 2021 77
Specialty Chemicals
Exhibit 89: Expect optimal capacity utilization by FY24E…
Source: Company, MOFSL
Exhibit 90: …with ~20% YoY volume CAGR over FY21-24E
Source: Company, MOFSL
Product portfolio: the main products Anti-degradants/anti-oxidants: Px 13 (6 PPD) and TDQ (TMQ). Anti-degradants/anti-oxidants ensure that the normal or desired lifecycle of a rubber product is achieved. Anti-oxidants predominantly protect unsaturated polymers from oxygen, heat, and heavy metal ions, while anti-degradants protect polymers from more aggressive degradative forces such as ozone and flex-fatigue.
Accelerators: MBT, MBTS, CBS, and PVI It accelerates the sulfur cross-linking reaction (vulcanization), imparts desired physical properties to rubber products, and enables manufacturing of products on a large scale at an optimum cost. It also decreases the quantity of sulfur necessary for vulcanization.
Pre-vulcanization inhibitor: Pilgard PVI Widely used in the manufacturing of almost all rubber products based on sulfur curable rubbers. Pilgard PVI is an effective tool to overcome various processing limitations. Incorporation of Pilgard PVI can permit the addition of curatives at an early stage of mixing for better dispersion of curatives, resulting in a reduced mixing cycle, power consumption, labor, and capital investment cost.
Post-vulcanization stabilizer: Pilcure DHTS Helps in vulcanization at a higher temperature. Helps in vulcanization over an extended period.
Exhibit 91: NOCIL has two manufacturing facilities – the recent expansion to 110ktpa was completed with the commissioning of Phase 2B (entire capex already capitalized in FY21)
Source: Company, MOFSL
55
55
55
55
55
60
73
90
110
110
110
68 84 87
98 99 92
70 69 73 84
96
FY14
FY15
FY16
FY17
FY18
FY19
FY20
FY21
FY22
E
FY23
E
FY24
E
Capacity (ktpa) Utilisation (%)
Optimum utlisation
25 30 31 35 40 42 41 47 61 70 80
7
20
4 13 13
5 -1
13
30
15 15
FY14
FY15
FY16
FY17
FY18
FY19
FY20
FY21
FY22
E
FY23
E
FY24
E
Total volumes sold (kt) Increase (%)
The future demand potential of rubber can be gauged from the
present low Auto penetration in India. Also, growth in demand
for tyres is linked to the GDP growth rate, particularly growth
in infrastructure (for commercial tyres) and income levels (for
passenger tyres). Tyre companies in India export 10-15% of their total production.
These companies are seeing increased exports, led by
adoption of global technology and better product quality
45%
45%
5% 5%
AcceleratorsAnti-oxidantsPre-vulcanisation InhibitorPost-vulcanisation Stabilizer

June 2021 78
Specialty Chemicals
Financials story in charts Capacity expansion comes at the right time, to drive multi fold growth
Exhibit 92: Exports to constitute ~40% of revenue…
Source: Company, MOFSL
Exhibit 93: …with a sustainable EBITDAM of 20-22%
Source: Company, MOFSL Exhibit 94: Forecast PAT to grow by 3x+ by FY24E…
Source: Company, MOFSL
Exhibit 95: …registering ~48% CAGR over FY21-24E
Source: Company, MOFSL
Exhibit 96: Expect dividend yield to grow…
Source: Company, MOFSL
Exhibit 97: …with a strong FCF yield of ~13% over FY22-24E
Source: Company, MOFSL Exhibit 98: One year forward PE trades at 20.8x…
Source: Company, MOFSL
Exhibit 99: …with return ratios improving
Source: Company, MOFSL
4 5 6 6 7 7 6 6 9 9 11 2 2 2 2 3 3 3 3
5 6
7
6.4 7.8 7.8 8.2 9.9 10.4
8.5 9.2
13.2 15.5
18.2
FY14
FY15
FY16
FY17
FY18
FY19
FY20
FY21
FY22
E
FY23
E
FY24
E
INR b Domestic Exports Total
0.6 1.1 1.4 1.6 2.6 2.9 1.8 1.3 2.3 3.1 4.0
9 14
18 19
27 28
21
14 17 20 22
FY14
FY15
FY16
FY17
FY18
FY19
FY20
FY21
FY22
E
FY23
E
FY24
E
EBITDA (INRb) Margin (%)
0.2 0.6 0.8 1.0 1.7 1.8 1.3 0.9 1.5 2.1 2.8
4 7
10 12
17 18 15
9 12
13 16
FY14
FY15
FY16
FY17
FY18
FY19
FY20
FY21
FY22
E
FY23
E
FY24
E
INR b Adjusted PAT Margin (%)
1.5 3.4 4.7 5.8
10.1 11.1
7.9 5.2
9.3 12.5
17.0 FY
14
FY15
FY16
FY17
FY18
FY19
FY20
FY21
FY22
E
FY23
E
FY24
E
EPS
1.4 1.4 0.2
-1.0 -0.2 -0.4 -0.1 -0.8 -1.0 -1.8
-2.9
0.3 0.4 0.5 0.6 0.8 1.2 2.1
1.2 1.7 2.3 3.2
FY14
FY15
FY16
FY17
FY18
FY19
FY20
FY21
FY22
E
FY23
E
FY24
E
Net Debt (INR b) Dividend Yield (%)
0.2 0.2 1.5 1.3 0.5
-0.7 0.0
0.6 0.8 1.6 2.3
FY14
FY15
FY16
FY17
FY18
FY19
FY20
FY21
FY22
E
FY23
E
FY24
E
INR b FCF
20.8
12.0
20.8
4.2
16.5
7.4
0.0
10.0
20.0
30.0
Jun-
11
Jun-
12
Jun-
13
Jun-
14
Jun-
15
Jun-
16
Jun-
17
Jun-
18
Jun-
19
Jun-
20
Jun-
21
P/E (x) Avg (x) Max (x)Min (x) +1SD -1SD
6.8
14.4 17.6
14.1 17.4 16.8
11.2 7.1
11.7 14.5
17.9
7
12 15
13 16 15
10 7
11 14
17
FY14
FY15
FY16
FY17
FY18
FY19
FY20
FY21
FY22
E
FY23
E
FY24
E
RoE RoCE

June 2021 79
Specialty Chemicals
Valuation and view (TP INR275; +30% upside) Initiating coverage with a Buy rating
In line with its geographic diversification strategy, the company has entered newerexport markets and is witnessing a higher share of inquiries. NOCIL’s capacityexpansion seems to have come at the right time.
APAC has emerged as the dominant market for rubber processing chemicals. Risingdemand from China, India, and Japan (due to a flourishing Auto and Constructionindustry), offers immense opportunities for rubber chemical manufacturers. Recoveryin the Auto sector should boost demand for tyres, thus benefitting NOCIL.
The recent import restriction on various classes of tyres into India should further help domestic tyre companies to operate at higher utilization rates (seen in 2HFY21). Domestic companies like Apollo Tyres, CEAT, and MRF are planning to ramp up production as the tyre industry is expected to witness considerable growth.
Over the past five years, NOCIL has delivered 3% revenue CAGR, with exports at 30%of total revenue. This was primarily due to increased Chinese dumping after the expiry of ADD in Jun’19, further impacted by a slowdown in the global Auto sector (in FY20). Tyre import restrictions and ongoing ADD investigation would support volume growth for NOCIL.
The stock is trading at 17x FY23E P/E and 11x FY23E EV/EBITDA, with an asset turnover of ~0.7x (which is set to increase to 1x in FY23-24E – similar to FY18 levels, when the company achieved optimal utilization of its then capacity). Valuing it at 22x FY23E EPS, we initiate coverage on NOCIL with a Buy rating and TP of INR275.
Delay in revival of Autoand Tyre demand,resulting in weakdemand for rubber andrubber chemicals
Lifting of currentrestriction on tyreimports and expiry ofADD (currentlyavailable only on oneproduct) could dampenvolumes and realization
Globally, Tyrecompanies haveearmarked a capex ofUSD7b, which wouldresult in higher demandfor rubber chemicals
EV disruption to notaffect NOCIL
Huge dependenceon Auto and Tyreindustries, which iscyclical in nature
Business is notdiversified as NOCILis predominantlyinto the rubberchemicals space
Market leader with40% domestic share
A trusted 40-year oldcompany with over22 products in itsportfolio
Has state-of-the-artR&D facility, givingits products atechnology edgeover competitors
Tire, 70%
Non- Tire, 30%
Global rubber chemicals market share
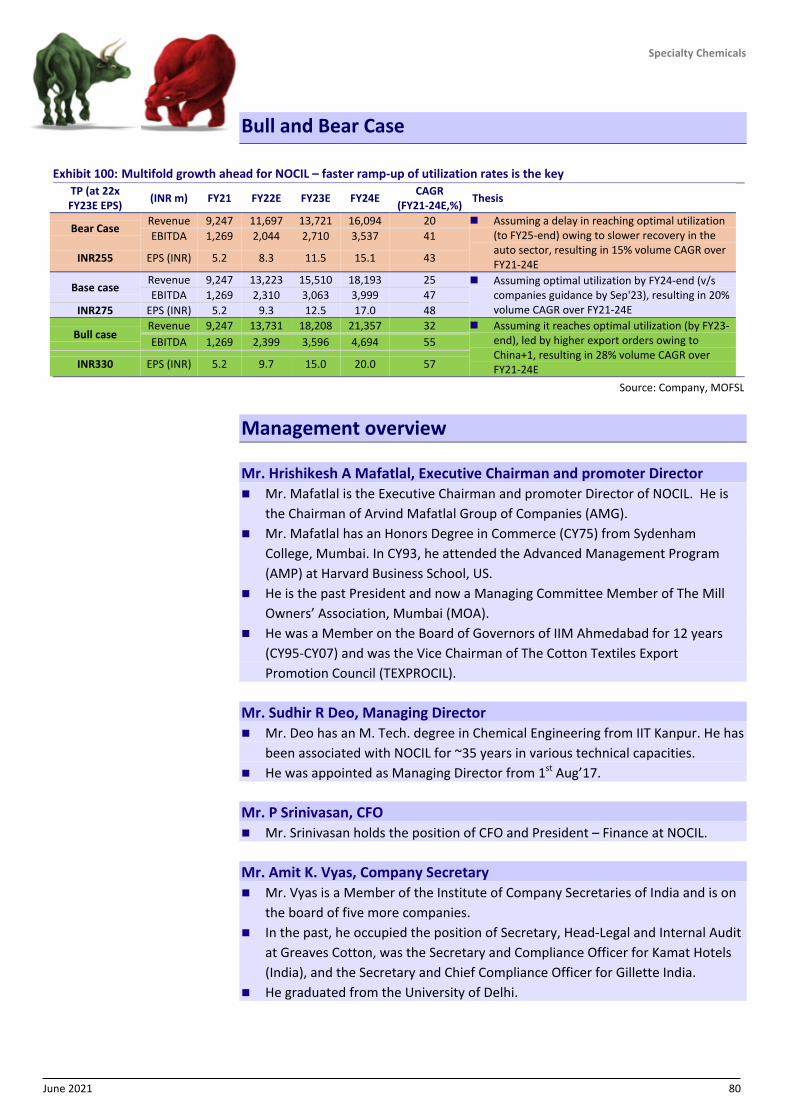
June 2021 80
Specialty Chemicals
Bull and Bear Case
Exhibit 100: Multifold growth ahead for NOCIL – faster ramp-up of utilization rates is the key TP (at 22x FY23E EPS) (INR m) FY21 FY22E FY23E FY24E CAGR
(FY21-24E,%) Thesis
Bear Case Revenue 9,247 11,697 13,721 16,094 20 Assuming a delay in reaching optimal utilization
(to FY25-end) owing to slower recovery in theauto sector, resulting in 15% volume CAGR overFY21-24E
EBITDA 1,269 2,044 2,710 3,537 41
INR255 EPS (INR) 5.2 8.3 11.5 15.1 43
Base case Revenue 9,247 13,223 15,510 18,193 25 Assuming optimal utilization by FY24-end (v/s
companies guidance by Sep'23), resulting in 20%volume CAGR over FY21-24E
EBITDA 1,269 2,310 3,063 3,999 47 INR275 EPS (INR) 5.2 9.3 12.5 17.0 48
Bull case Revenue 9,247 13,731 18,208 21,357 32 Assuming it reaches optimal utilization (by FY23-
end), led by higher export orders owing toChina+1, resulting in 28% volume CAGR overFY21-24E
EBITDA 1,269 2,399 3,596 4,694 55
INR330 EPS (INR) 5.2 9.7 15.0 20.0 57
Source: Company, MOFSL
Management overview
Mr. Hrishikesh A Mafatlal, Executive Chairman and promoter Director Mr. Mafatlal is the Executive Chairman and promoter Director of NOCIL. He is
the Chairman of Arvind Mafatlal Group of Companies (AMG). Mr. Mafatlal has an Honors Degree in Commerce (CY75) from Sydenham
College, Mumbai. In CY93, he attended the Advanced Management Program(AMP) at Harvard Business School, US.
He is the past President and now a Managing Committee Member of The MillOwners’ Association, Mumbai (MOA).
He was a Member on the Board of Governors of IIM Ahmedabad for 12 years(CY95-CY07) and was the Vice Chairman of The Cotton Textiles ExportPromotion Council (TEXPROCIL).
Mr. Sudhir R Deo, Managing Director Mr. Deo has an M. Tech. degree in Chemical Engineering from IIT Kanpur. He has
been associated with NOCIL for ~35 years in various technical capacities. He was appointed as Managing Director from 1st Aug’17.
Mr. P Srinivasan, CFO Mr. Srinivasan holds the position of CFO and President – Finance at NOCIL.
Mr. Amit K. Vyas, Company Secretary Mr. Vyas is a Member of the Institute of Company Secretaries of India and is on
the board of five more companies. In the past, he occupied the position of Secretary, Head-Legal and Internal Audit
at Greaves Cotton, was the Secretary and Compliance Officer for Kamat Hotels(India), and the Secretary and Chief Compliance Officer for Gillette India.
He graduated from the University of Delhi.

June 2021 81
Specialty Chemicals
Financials and valuations – NOCIL
Standalone - Income Statement (INR m) Y/E March FY16 FY17 FY18 FY19 FY20 FY21 FY22E FY23E FY24E Total Income from Operations 7,886 8,183 9,893 10,429 8,463 9,247 13,223 15,510 18,193 Change (%) 0.4 3.8 20.9 5.4 -18.9 9.3 43.0 17.3 17.3 Gross Margins (%) 54.4 56.1 55.5 55.2 54.2 45.4 45.4 46.3 47.2 EBITDA 1,381 1,580 2,629 2,903 1,765 1,269 2,310 3,063 3,999 Margin (%) 17.5 19.3 26.6 27.8 20.8 13.7 17.5 19.7 22.0 Depreciation 137 187 229 230 324 361 391 444 451 EBIT 1,244 1,393 2,400 2,673 1,440 909 1,919 2,620 3,547 Int. and Finance Charges 93 22 12 6 13 10 10 10 10 Other Income 30 91 143 100 97 143 158 163 232 PBT bef. EO Exp. 1,181 1,462 2,531 2,767 1,524 1,042 2,067 2,773 3,770 PBT after EO Exp. 1,181 1,462 2,531 2,767 1,524 1,042 2,067 2,773 3,770 Total Tax 404 494 845 926 214 177 520 698 949 Tax Rate (%) 34.2 33.8 33.4 33.5 14.1 17.0 25.2 25.2 25.2 Reported PAT 777 968 1,686 1,841 1,310 865 1,547 2,075 2,821 Adjusted PAT 777 968 1,686 1,841 1,310 865 1,547 2,075 2,821 Change (%) 37.0 24.6 74.1 9.2 -28.9 -34.0 78.9 34.1 36.0 Margin (%) 9.9 11.8 17.0 17.7 15.5 9.4 11.7 13.4 15.5
Standalone - Balance Sheet (INR m) Y/E March FY16 FY17 FY18 FY19 FY20 FY21 FY22E FY23E FY24E Equity Share Capital 1,608 1,636 1,645 1,654 1,656 1,662 1,662 1,662 1,662 Total Reserves 3,072 7,415 8,730 9,876 10,104 11,073 12,001 13,246 14,938 Net Worth 4,679 9,050 10,374 11,531 11,760 12,735 13,663 14,908 16,601 Total Loans 259 150 50 0 0 0 0 0 0 Deferred Tax Liabilities 462 1,025 1,003 1,054 887 956 956 956 956 Capital Employed 5,400 10,226 11,427 12,584 12,647 13,691 14,619 15,864 17,557 Gross Block 4,327 6,653 6,569 8,050 9,789 11,374 11,574 11,774 11,974 Less: Accum. Deprn. 1,430 1,509 1,576 1,787 2,111 2,472 2,863 3,307 3,758 Net Fixed Assets 2,898 5,144 4,994 6,263 7,678 8,902 8,710 8,467 8,216 Capital WIP 60 31 392 1,305 1,563 140 140 140 140 Total Investments 473 2,014 3,020 1,487 726 826 826 826 826 Curr. Assets, Loans&Adv. 3,354 4,291 4,750 5,223 4,312 6,122 7,494 9,424 11,885 Inventory 1,324 1,143 1,550 1,704 1,361 1,653 2,127 2,495 2,926 Account Receivables 1,511 1,665 2,434 2,322 2,032 3,086 3,175 3,724 4,369 Cash and Bank Balance 70 1,135 276 389 128 797 956 1,755 2,890
Cash 47 1,055 240 360 84 441 601 1,400 2,534 Bank Balance 24 81 36 29 44 356 356 356 356
Loans and Advances 449 347 491 808 791 587 1,236 1,450 1,700 Curr. Liability & Prov. 1,385 1,255 1,729 1,694 1,633 2,297 2,551 2,992 3,510 Account Payables 620 810 1,139 988 892 1,710 1,394 1,635 1,918 Other Current Liabilities 335 243 397 502 511 378 798 936 1,098 Provisions 430 202 193 204 230 210 359 421 493 Net Current Assets 1,968 3,036 3,022 3,529 2,680 3,824 4,943 6,432 8,376 Appl. of Funds 5,399 10,225 11,427 12,584 12,647 13,691 14,619 15,864 17,557 E: MOFSL Estimates

June 2021 82
Specialty Chemicals
Financials and valuations – NOCIL
Ratios Y/E March FY16 FY17 FY18 FY19 FY20 FY21 FY22E FY23E FY24E Basic (INR) EPS 4.7 5.8 10.1 11.1 7.9 5.2 9.3 12.5 17.0 EPS Growth (%) 37.0 24.6 74.1 9.2 -28.9 -34.0 78.9 34.1 36.0 Cash EPS 5.5 6.9 11.5 12.5 9.8 7.4 11.7 15.2 19.7 BV/Share 28.2 54.4 62.4 69.4 70.8 76.6 82.2 89.7 99.9 DPS 1.2 1.2 1.8 2.5 4.5 2.5 3.7 5.0 6.8 Payout (%) 29.9 24.0 21.0 27.0 76.0 48.0 40.0 40.0 40.0 Valuation (x) P/E 46.0 36.9 21.2 19.4 27.3 41.3 23.1 17.2 12.7 Cash P/E 39.1 30.9 18.7 17.3 21.9 29.2 18.4 14.2 10.9 P/BV 7.6 3.9 3.4 3.1 3.0 2.8 2.6 2.4 2.2 EV/Sales 4.6 4.2 3.6 3.4 4.2 3.8 2.6 2.2 1.8 EV/EBITDA 26.0 22.0 13.5 12.2 20.2 27.5 15.1 11.1 8.2 Dividend Yield (%) 0.5 0.6 0.8 1.2 2.1 1.2 1.7 2.3 3.2 FCF per share 9.1 7.8 3.1 -4.3 -0.1 3.9 4.7 9.9 13.7 Return Ratios (%) RoE 17.6 14.1 17.4 16.8 11.2 7.1 11.7 14.5 17.9 RoCE 14.7 12.6 15.6 15.4 10.5 6.6 11.0 13.7 16.9 RoIC 16.0 15.6 21.6 20.7 12.6 6.8 11.7 15.2 19.8 Working Capital Ratios Fixed Asset Turnover (x) 2.7 2.0 2.0 1.9 1.2 1.1 1.5 1.8 2.2 Asset Turnover (x) 1.5 0.8 0.9 0.8 0.7 0.7 0.9 1.0 1.0 Inventory (Days) 61 51 57 60 59 65 59 59 59 Debtor (Days) 70 74 90 81 88 122 88 88 88 Creditor (Days) 29 36 42 35 38 67 38 38 38 Leverage Ratio (x) Current Ratio 2.4 3.4 2.7 3.1 2.6 2.7 2.9 3.1 3.4 Net Debt/Equity 0.0 -0.1 0.0 0.0 0.0 -0.1 -0.1 -0.1 -0.2 Standalone - Cash Flow Statement (INR m) Y/E March FY16 FY17 FY18 FY19 FY20 FY21 FY22E FY23E FY24E OP/(Loss) before Tax 1,181 1,462 2,531 2,767 1,524 1,042 2,067 2,773 3,770 Depreciation 137 187 229 230 324 361 391 444 451 Direct Taxes Paid -306 -454 -802 -878 -510 -1 -520 -698 -949 (Inc)/Dec in WC 574 269 -901 -400 515 -372 -959 -690 -809 CF from Operations 1,649 1,402 984 1,638 1,772 904 988 1,838 2,473 (Inc)/Dec in FA -140 -106 -470 -2,351 -1,790 -262 -200 -200 -200 Free Cash Flow 1,509 1,296 514 -713 -18 642 788 1,638 2,273 Other investing activity 16 27 -908 1,334 746 -325 0 0 0 CF from Investments -124 -79 -1,379 -1,017 -1,044 -586 -200 -200 -200 Inc/(Dec) in Debt -1,214 -109 -100 -50 0 0 0 0 0 Interest Paid -101 -23 -13 -7 -9 -4 -10 -10 -10 Dividend Paid -192 -230 -350 -490 -980 -7 -619 -830 -1,128 Others 4 -9 2 41 -15 51 0 0 0 CF from Fin. Activity -1,504 -315 -420 -501 -1,004 40 -628 -839 -1,138 Inc/Dec of Cash 21 1,008 -814 120 -276 358 160 799 1,135 Opening Balance 26 47 1,055 240 360 84 441 601 1,400 Closing Balance 47 1,055 240 360 84 441 601 1,400 2,534

June 2021 83
Specialty Chemicals
THEMATIC/STRATEGY RESEARCH GALLERY

June 2021 84
Specialty Chemicals
N O T E S

June 2021 85
Specialty Chemicals
Disclosures: The following Disclosures are being made in compliance with the SEBI Research Analyst Regulations 2014 (herein after referred to as the Regulations). Motilal Oswal Financial Services Ltd. (MOFSL) is a SEBI Registered Research Analyst having registration no. INH000000412. MOFSL, the Research Entity (RE) as defined in the Regulations, is engaged in the business of providing Stock broking services, Investment Advisory Services, Depository participant services & distribution of various financial products. MOFSL is a subsidiary company of Passionate Investment Management Pvt. Ltd.. (PIMPL). MOFSL is a listed public company, the details in respect of which are available on www.motilaloswal.com. MOFSL (erstwhile Motilal Oswal Securities Limited - MOSL) is registered with the Securities & Exchange Board of India (SEBI) and is a registered Trading Member with National Stock Exchange of India Ltd. (NSE) and Bombay Stock Exchange Limited (BSE), Multi Commodity Exchange of India Limited (MCX) and National Commodity & Derivatives Exchange Limited (NCDEX) for its stock broking activities & is Depository participant with Central Depository Services Limited (CDSL) National Securities Depository Limited (NSDL),NERL, COMRIS and CCRL and is member of Association of Mutual Funds of India (AMFI) for distribution of financial products and Insurance Regulatory & Development Authority of India (IRDA) as Corporate Agent for insurance products. Details of associate entities of Motilal Oswal Financial Services Limited are available on the website at http://onlinereports.motilaloswal.com/Dormant/documents/Associate%20Details.pdf Details of pending Enquiry Proceedings of Motilal Oswal Financial Services Limited are available on the website at https://galaxy.motilaloswal.com/ResearchAnalyst/PublishViewLitigation.aspx MOFSL, it’s associates, Research Analyst or their relative may have any financial interest in the subject company. MOFSL and/or its associates and/or Research Analyst may have actual/beneficial ownership of 1% or more securities in the subject company in the past 12 months. MOFSL and its associate company(ies), their directors and Research Analyst and their relatives may; (a) from time to time, have a long or short position in, act as principal in, and buy or sell the securities or derivatives thereof of companies mentioned herein. (b) be engaged in any other transaction involving such securities and earn brokerage or other compensation or act as a market maker in the financial instruments of the company(ies) discussed herein or act as an advisor or lender/borrower to such company(ies) or may have any other potential conflict of interests with respect to any recommendation and other related information and opinions.; however the same shall have no bearing whatsoever on the specific recommendations made by the analyst(s), as the recommendations made by the analyst(s) are completely independent of the views of the associates of MOFSL even though there might exist an inherent conflict of interest in some of the stocks mentioned in the research report. Research Analyst may have served as director/officer, etc. in the subject company in the past 12 months. MOFSL and/or its associates may have received any compensation from the subject company in the past 12 months. In the past 12 months , MOFSL or any of its associates may have: a) managed or co-managed public offering of securities from subject company of this research report, b) received compensation for investment banking or merchant banking or brokerage services from subject company of this research report, c) received compensation for products or services other than investment banking or merchant banking or brokerage services from the subject company of this research report. d) Subject Company may have been a client of MOFSL or its associates in the past 12 months. MOFSL and it’s associates have not received any compensation or other benefits from the subject company or third party in connection with the research report. To enhance transparency, MOFSL has incorporated a Disclosure of Interest Statement in this document. This should, however, not be treated as endorsement of the views expressed in the report. MOFSL and / or its affiliates do and seek to do business including investment banking with companies covered in its research reports. As a result, the recipients of this report should be aware that MOFSL may have a potential conflict of interest that may affect the objectivity of this report. Compensation of Research Analysts is not based on any specific merchant banking, investment banking or brokerage service transactions. Above disclosures include beneficial holdings lying in demat account of MOFSL which are opened for proprietary investments only. While calculating beneficial holdings, It does not consider demat accounts which are opened in name of MOFSL for other purposes (i.e holding client securities, collaterals, error trades etc.). MOFSL also earns DP income from clients which are not considered in above disclosures. Above disclosures include beneficial holdings lying in demat account of MOFSL which are opened for proprietary investments only. While calculating beneficial holdings, It does not consider demat accounts which are opened in name of MOFSL for other purposes (i.e holding client securities, collaterals, error trades etc.). MOFSL also earns DP income from clients which are not considered in above disclosures. Terms & Conditions: This report has been prepared by MOFSL and is meant for sole use by the recipient and not for circulation. The report and information contained herein is strictly confidential and may not be altered in any way, transmitted to, copied or distributed, in part or in whole, to any other person or to the media or reproduced in any form, without prior written consent of MOFSL. The report is based on the facts, figures and information that are considered true, correct, reliable and accurate. The intent of this report is not recommendatory in nature. The information is obtained from publicly available media or other sources believed to be reliable. Such information has not been independently verified and no guaranty, representation of warranty, express or implied, is made as to its accuracy, completeness or correctness. All such information and opinions are subject to change without notice. The report is prepared solely for informational purpose and does not constitute an offer document or solicitation of offer to buy or sell or subscribe for securities or other financial instruments for the clients. Though disseminated to all the customers simultaneously, not all customers may receive this report at the same time. MOFSL will not treat recipients as customers by virtue of their receiving this report. Analyst Certification The views expressed in this research report accurately reflect the personal views of the analyst(s) about the subject securities or issues, and no part of the compensation of the research analyst(s) was, is, or will be directly or indirectly related to the specific recommendations and views expressed by research analyst(s) in this report. Disclosure of Interest Statement Companies where there is interest Analyst ownership of the stock No A graph of daily closing prices of securities is available at www.nseindia.com, www.bseindia.com. Research Analyst views on Subject Company may vary based on Fundamental research and Technical Research. Proprietary trading desk of MOFSL or its associates maintains arm’s length distance with Research Team as all the activities are segregated from MOFSL research activity and therefore it can have an independent view with regards to subject company for which Research Team have expressed their views. Regional Disclosures (outside India) This report is not directed or intended for distribution to or use by any person or entity resident in a state, country or any jurisdiction, where such distribution, publication, availability or use would be contrary to law, regulation or which would subject MOFSL & its group companies to registration or licensing requirements within such jurisdictions. For Hong Kong: This report is distributed in Hong Kong by Motilal Oswal capital Markets (Hong Kong) Private Limited, a licensed corporation (CE AYY-301) licensed and regulated by the Hong Kong Securities and Futures Commission (SFC) pursuant to the Securities and Futures Ordinance (Chapter 571 of the Laws of Hong Kong) “SFO”. As per SEBI (Research Analyst Regulations) 2014 Motilal Oswal Financial Services Limited(SEBI Reg No. INH000000412) has an agreement with Motilal Oswal capital Markets (Hong Kong) Private Limited for distribution of research report in Hong Kong. This report is intended for distribution only to “Professional Investors” as defined in Part I of Schedule 1 to SFO. Any investment or investment activity to which this document relates is only available to professional investor and will be engaged only with professional investors.” Nothing here is an offer or solicitation of these securities, products and services in any jurisdiction where their offer or sale is not qualified or exempt from registration. The Indian Analyst(s) who compile this report is/are not located in Hong Kong & are not conducting Research Analysis in Hong Kong. For U.S: Motilal Oswal Financial Services Limited (MOFSL) is not a registered broker - dealer under the U.S. Securities Exchange Act of 1934, as amended (the"1934 act") and under applicable state laws in the United States. In addition MOFSL is not a registered investment adviser under the U.S. Investment Advisers Act of 1940, as amended (the "Advisers Act" and together with the 1934 Act, the "Acts), and under applicable state laws in the United States. Accordingly, in the absence of specific exemption under the Acts, any brokerage and investment services provided by MOFSL, including the products and services described herein are not available to or intended for U.S. persons. This report is intended for distribution only to "Major Institutional Investors" as defined by Rule 15a-6(b)(4) of the Exchange Act and interpretations thereof by SEC (henceforth referred to as "major institutional investors"). This document must not be acted on or relied on by persons who are not major institutional investors. Any investment or investment activity to which this document relates is only available to major institutional investors and will be engaged in only with major institutional investors. In reliance on the exemption from registration provided by Rule 15a-6 of the U.S. Securities Exchange Act of 1934, as amended (the "Exchange Act") and interpretations thereof by the U.S. Securities and Exchange Commission ("SEC") in order to conduct business with Institutional Investors based in the U.S., MOFSL has entered into a chaperoning agreement with a U.S. registered broker-dealer, Motilal Oswal Securities International Private Limited. ("MOSIPL"). Any business interaction pursuant to this report will have to be executed within the provisions of this chaperoning agreement.

June 2021 86
Specialty Chemicals
The Research Analysts contributing to the report may not be registered /qualified as research analyst with FINRA. Such research analyst may not be associated persons of the U.S. registered broker-dealer, MOSIPL, and therefore, may not be subject to NASD rule 2711 and NYSE Rule 472 restrictions on communication with a subject company, public appearances and trading securities held by a research analyst account. For Singapore: In Singapore, this report is being distributed by Motilal Oswal Capital Markets Singapore Pte Ltd (“MOCMSPL”) (Co.Reg. NO. 201129401Z) which is a holder of a capital markets services license and an exempt financial adviser in Singapore, as per the approved agreement under Paragraph 9 of Third Schedule of Securities and Futures Act (CAP 289) and Paragraph 11 of First Schedule of Financial Advisors Act (CAP 110) provided to MOCMSPL by Monetary Authority of Singapore. Persons in Singapore should contact MOCMSPL in respect of any matter arising from, or in connection with this report/publication/communication. This report is distributed solely to persons who qualify as “Institutional Investors”, of which some of whom may consist of "accredited" institutional investors as defined in section 4A(1) of the Securities and Futures Act, Chapter 289 of Singapore (“the SFA”). Accordingly, if a Singapore person is not or ceases to be such an institutional investor, such Singapore Person must immediately discontinue any use of this Report and inform MOCMSPL. Disclaimer: The report and information contained herein is strictly confidential and meant solely for the selected recipient and may not be altered in any way, transmitted to, copied or distributed, in part or in whole, to any other person or to the media or reproduced in any form, without prior written consent. This report and information herein is solely for informational purpose and may not be used or considered as an offer document or solicitation of offer to buy or sell or subscribe for securities or other financial instruments. Nothing in this report constitutes investment, legal, accounting and tax advice or a representation that any investment or strategy is suitable or appropriate to your specific circumstances. The securities discussed and opinions expressed in this report may not be suitable for all investors, who must make their own investment decisions, based on their own investment objectives, financial positions and needs of specific recipient. This may not be taken in substitution for the exercise of independent judgment by any recipient. Each recipient of this document should make such investigations as it deems necessary to arrive at an independent evaluation of an investment in the securities of companies referred to in this document (including the merits and risks involved), and should consult its own advisors to determine the merits and risks of such an investment. The investment discussed or views expressed may not be suitable for all investors. Certain transactions -including those involving futures, options, another derivative products as well as non-investment grade securities - involve substantial risk and are not suitable for all investors. No representation or warranty, express or implied, is made as to the accuracy, completeness or fairness of the information and opinions contained in this document. The Disclosures of Interest Statement incorporated in this document is provided solely to enhance the transparency and should not be treated as endorsement of the views expressed in the report. This information is subject to change without any prior notice. The Company reserves the right to make modifications and alternations to this statement as may be required from time to time without any prior approval. MOFSL, its associates, their directors and the employees may from time to time, effect or have effected an own account transaction in, or deal as principal or agent in or for the securities mentioned in this document. They may perform or seek to perform investment banking or other services for, or solicit investment banking or other business from, any company referred to in this report. Each of these entities functions as a separate, distinct and independent of each other. The recipient should take this into account before interpreting the document. This report has been prepared on the basis of information that is already available in publicly accessible media or developed through analysis of MOFSL. The views expressed are those of the analyst, and the Company may or may not subscribe to all the views expressed therein. This document is being supplied to you solely for your information and may not be reproduced, redistributed or passed on, directly or indirectly, to any other person or published, copied, in whole or in part, for any purpose. This report is not directed or intended for distribution to, or use by, any person or entity who is a citizen or resident of or located in any locality, state, country or other jurisdiction, where such distribution, publication, availability or use would be contrary to law, regulation or which would subject MOFSL to any registration or licensing requirement within such jurisdiction. The securities described herein may or may not be eligible for sale in all jurisdictions or to certain category of investors. Persons in whose possession this document may come are required to inform themselves of and to observe such restriction. Neither the Firm, not its directors, employees, agents or representatives shall be liable for any damages whether direct or indirect, incidental, special or consequential including lost revenue or lost profits that may arise from or in connection with the use of the information. The person accessing this information specifically agrees to exempt MOFSL or any of its affiliates or employees from, any and all responsibility/liability arising from such misuse and agrees not to hold MOFSL or any of its affiliates or employees responsible for any such misuse and further agrees to hold MOFSL or any of its affiliates or employees free and harmless from all losses, costs, damages, expenses that may be suffered by the person accessing this information due to any errors and delays. Registered Office Address: Motilal Oswal Tower, Rahimtullah Sayani Road, Opposite Parel ST Depot, Prabhadevi, Mumbai-400025; Tel No.: 022 71934200/ 022-71934263; Website www.motilaloswal.com. CIN No.: L67190MH2005PLC153397.Correspondence Office Address: Palm Spring Centre, 2nd Floor, Palm Court Complex, New Link Road, Malad(West), Mumbai- 400 064. Tel No: 022 7188 1000.
Registration Nos.: Motilal Oswal Financial Services Limited (MOFSL)*: INZ000158836(BSE/NSE/MCX/NCDEX); CDSL and NSDL: IN-DP-16-2015; Research Analyst: INH000000412. AMFI: ARN - 146822; Investment Adviser: INA000007100; Insurance Corporate Agent: CA0579 ;PMS:INP000006712. Motilal Oswal Asset Management Company Ltd. (MOAMC): PMS (Registration No.: INP000000670); PMS and Mutual Funds are offered through MOAMC which is group company of MOFSL. Motilal Oswal Wealth Management Ltd. (MOWML): PMS (Registration No.: INP000004409) is offered through MOWML, which is a group company of MOFSL. Motilal Oswal Financial Services Limited is a distributor of Mutual Funds, PMS, Fixed Deposit, Bond, NCDs,Insurance Products and IPOs.Real Estate is offered through Motilal Oswal Real Estate Investment Advisors II Pvt. Ltd. which is a group company of MOFSL. Private Equity is offered through Motilal Oswal Private Equity Investment Advisors Pvt. Ltd which is a group company of MOFSL. Research & Advisory services is backed by proper research. Please read the Risk Disclosure Document prescribed by the Stock Exchanges carefully before investing. There is no assurance or guarantee of the returns. Investment in securities market is subject to market risk, read all the related documents carefully before investing. Details of Compliance Officer: Name: Neeraj Agarwal, Email ID: [email protected], Contact No.:022-71881085. * MOSL has been amalgamated with Motilal Oswal Financial Services Limited (MOFSL) w.e.f August 21, 2018 pursuant to order dated July 30, 2018 issued by Hon'ble National Company Law Tribunal, Mumbai Bench.