Embed Size (px)
Citation preview
28 October 2016
2QFY17 Results Update | Sector: Automobiles
Bajaj Auto
BSE SENSEX S&P CNX CMP: INR2,835 TP:INR3,544 (+25%) Buy 27,942 8,638 Bloomberg BJAUT IN Equity Shares (m) 289.4 M.Cap.(INR b)/(USD b) 820.4 / 12.3
52-Week Range (INR) 2,801/2,133 1, 6, 12 Rel. Per (%) -6/0/5 Avg Val. (INR m) 736 Free float (%) 50.7
Financials & Valuations (INR b)
Y/E Mar 2016 2017E 2018E Net Sales 225.9 242.4 288.3 EBITDA 47.8 50.9 61.1 PAT 38.1 42.6 51.5 EPS (INR) 131.8 147.3 177.9 Gr. (%) 25.1 11.7 20.8 BV/Sh (INR) 424.8 494.0 581.7 RoE (%) 33.2 32.1 33.1 RoCE (%) 32.3 31.2 32.1 P/E (x) 21.5 19.2 15.9 P/BV (x) 6.7 5.7 4.9
Estimate change TP change Rating change
Margin beat; strong product pipeline to aid growth Realizations up 1.5% QoQ on product mix, price hike: Net sales were flat
YoY (+5.3% QoQ) at INR64.3b (in-line) as 1.5% QoQ (flat YoY) increase in realizations was offset by volumes decline of 2.3% YoY (+3.7% QoQ). Realizations were driven by higher share of 3Ws and premium (>200 cc) motorcycles, as well as price hikes (INR500-1000) in domestic markets.
EBITDA margin surprises on lower staff costs, other expenses: Gross margin expanded 20bp QoQ (-30bp YoY) due to favorable product mix. Lower staff cost and other expenses boosted EBITDA margin by 90bp QoQ (-30bp YoY decline) to 21.4% (est. of 20.6%).
Management commentary: a) Management expects festive season growth for overall motorcycle segment to be in high-single-digit (v/s consensus anticipation of healthy double-digit growth). b) Maintains FY17 domestic volume guidance of ~2.6m units (+17.5% YoY). c) Product pipeline for 2HFY17 includes VS400 (Jan-17), Pulsar upgrades (4QFY17) and V15 variant (3QFY17). d) For exports, management maintained its target of 1.6m units for FY17. e) Price hike taken in domestic market in July (INR500 for 2W and INR1,000 for 3W). f) Management expects margins in H2 to be upward of 21% on benign commodity prices and improving product mix.
Valuation and view: We raise our FY17E EPS by 3.3%, building in higher margins, but cut FY18 estimates on higher tax assumption. Valuations at 15.9x/13.7x FY18/19E S/A EPS are attractive, considering a) scope of profitable market share gain, b) high visibility of sustenance of superior profitability and c) lower capex requirement driving return ratios. We value BJAUT at 18x Sep-18E EPS and add INR150/share for its KTM stake to arrive at a TP of INR3,544/share. Maintain Buy.
Favourable product mix aids realisation QoQ
Investors are advised to refer through important disclosures made at the last page of the Research Report. Motilal Oswal research is available on www.motilaloswal.com/Institutional-Equities, Bloomberg, Thomson Reuters, Factset and S&P Capital.
Jinesh Gandhi ([email protected]); +91 22 3982 5416 Venil Shah ([email protected]); +91 22 3982 5445 /Aditya Vora ([email protected]); +91 22 3078 4701
Bajaj Auto
28 October 2016 2
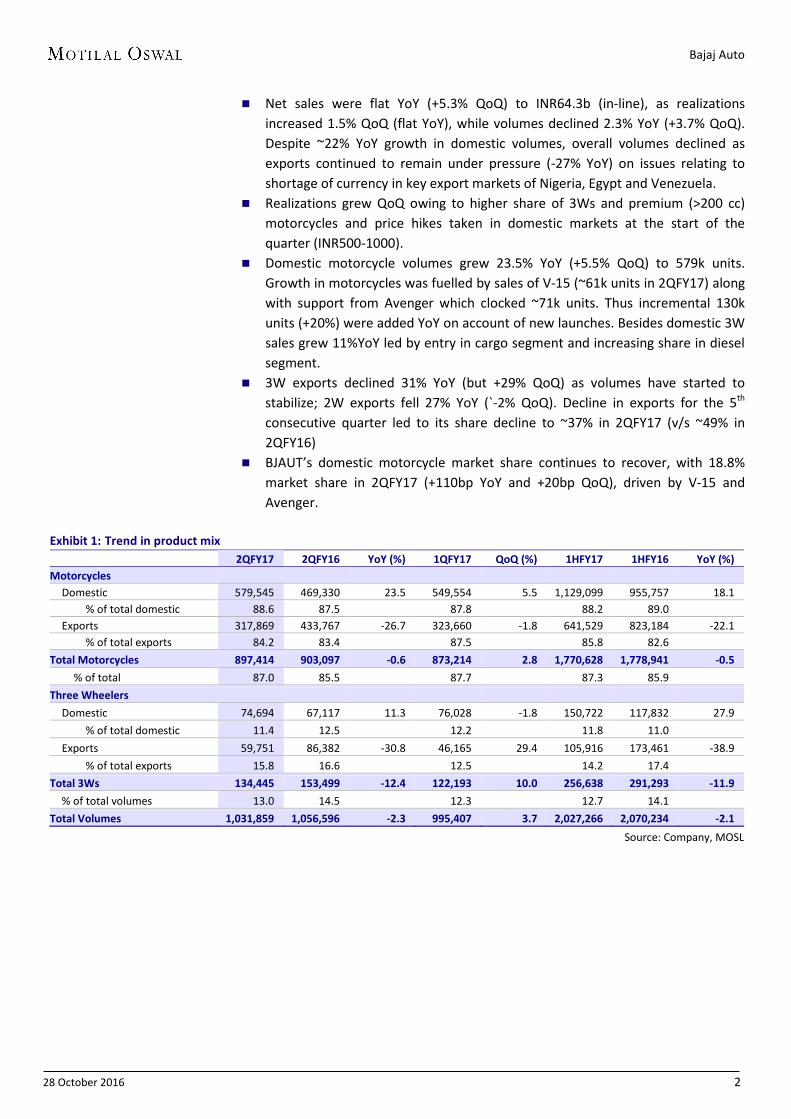
Net sales were flat YoY (+5.3% QoQ) to INR64.3b (in-line), as realizations increased 1.5% QoQ (flat YoY), while volumes declined 2.3% YoY (+3.7% QoQ). Despite ~22% YoY growth in domestic volumes, overall volumes declined as exports continued to remain under pressure (-27% YoY) on issues relating to shortage of currency in key export markets of Nigeria, Egypt and Venezuela.
Realizations grew QoQ owing to higher share of 3Ws and premium (>200 cc) motorcycles and price hikes taken in domestic markets at the start of the quarter (INR500-1000).
Domestic motorcycle volumes grew 23.5% YoY (+5.5% QoQ) to 579k units. Growth in motorcycles was fuelled by sales of V-15 (~61k units in 2QFY17) along with support from Avenger which clocked ~71k units. Thus incremental 130k units (+20%) were added YoY on account of new launches. Besides domestic 3W sales grew 11%YoY led by entry in cargo segment and increasing share in diesel segment.
3W exports declined 31% YoY (but +29% QoQ) as volumes have started to stabilize; 2W exports fell 27% YoY (`-2% QoQ). Decline in exports for the 5th consecutive quarter led to its share decline to ~37% in 2QFY17 (v/s ~49% in 2QFY16)
BJAUT’s domestic motorcycle market share continues to recover, with 18.8% market share in 2QFY17 (+110bp YoY and +20bp QoQ), driven by V-15 and Avenger.
Exhibit 1: Trend in product mix 2QFY17 2QFY16 YoY (%) 1QFY17 QoQ (%) 1HFY17 1HFY16 YoY (%) Motorcycles
Domestic 579,545 469,330 23.5 549,554 5.5 1,129,099 955,757 18.1 % of total domestic 88.6 87.5 87.8 88.2 89.0
Exports 317,869 433,767 -26.7 323,660 -1.8 641,529 823,184 -22.1 % of total exports 84.2 83.4 87.5 85.8 82.6
Total Motorcycles 897,414 903,097 -0.6 873,214 2.8 1,770,628 1,778,941 -0.5
% of total 87.0 85.5 87.7 87.3 85.9 Three Wheelers
Domestic 74,694 67,117 11.3 76,028 -1.8 150,722 117,832 27.9 % of total domestic 11.4 12.5 12.2 11.8 11.0
Exports 59,751 86,382 -30.8 46,165 29.4 105,916 173,461 -38.9 % of total exports 15.8 16.6 12.5 14.2 17.4
Total 3Ws 134,445 153,499 -12.4 122,193 10.0 256,638 291,293 -11.9
% of total volumes 13.0 14.5 12.3 12.7 14.1 Total Volumes 1,031,859 1,056,596 -2.3 995,407 3.7 2,027,266 2,070,234 -2.1
Source: Company, MOSL
Bajaj Auto
28 October 2016 3
Exhibit 2: Trend in market share (%) 2QFY17 2QFY16 YoY (bp) 1QFY17 QoQ (bp) 1HFY17 1HFY16 YoY (%) Segment Wise
Economy 35.1 37.3 -220 35.1 0 35.1 38.8 -370 Executive 1.6 4.2 -260 1.8 -30 1.7 4.1 -240
Executive 100 0.0 1.4 -140 0.0 0 0.0 2.5 -250 Executive 125 5.1 10.6 -550 5.9 -80 5.5 7.8 -230
Premium 40.5 34.8 570 42.4 -190 41.5 34.6 690 Premium excl RE 48.1 46.7 140 47.3 80 47.7 45.7 190
Dom. Motorcycles 18.8 17.7 110 18.6 20 18.7 17.8 90
Total Motorcycles 24.9 27.4 -250 25.2 -30 25.1 27.0 -200 Total Dom. 2W 11.4 11.1 30 11.9 -50 11.7 11.6 10 Total 2W (incl exports) 16.0 18.6 -250 17.1 -100 16.5 18.8 -230 Dom. 3W 50.4 47.7 270 54.5 -410 52.4 46.3 620
3W (incl exports) 57.9 57.8 0 59.5 -160 58.7 58.2 50
Source: Company, MOSL
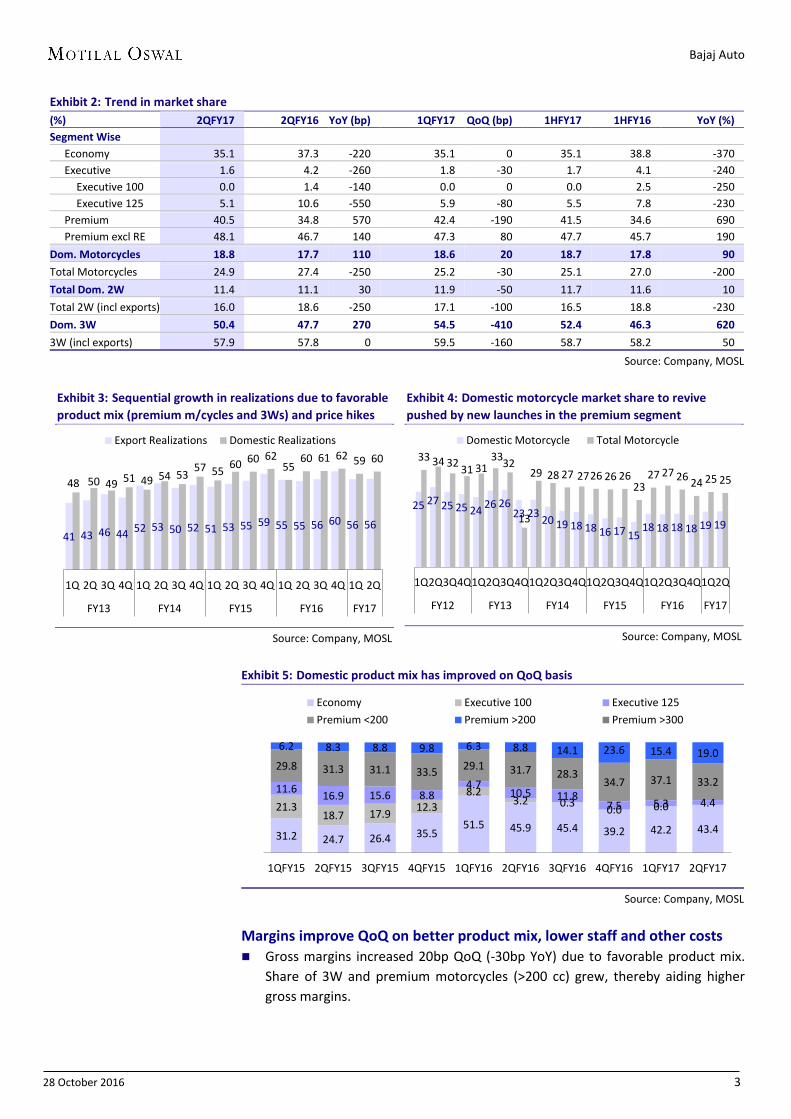
Exhibit 3: Sequential growth in realizations due to favorable product mix (premium m/cycles and 3Ws) and price hikes
Source: Company, MOSL
Exhibit 4: Domestic motorcycle market share to revive pushed by new launches in the premium segment
Source: Company, MOSL
Exhibit 5: Domestic product mix has improved on QoQ basis
Source: Company, MOSL
Margins improve QoQ on better product mix, lower staff and other costs Gross margins increased 20bp QoQ (-30bp YoY) due to favorable product mix.
Share of 3W and premium motorcycles (>200 cc) grew, thereby aiding higher gross margins.
41 43 46 44 52 53 50 52 51 53 55 59 55 55 56 60 56 56
48 50 49 51 49 54 53 57 55 60 60 62 55
60 61 62 59 60
1Q 2Q 3Q 4Q 1Q 2Q 3Q 4Q 1Q 2Q 3Q 4Q 1Q 2Q 3Q 4Q 1Q 2Q
FY13 FY14 FY15 FY16 FY17
Export Realizations Domestic Realizations
25 27 25 25 24 26 26 23 23 20 19 18 18 16 17 15
18 18 18 18 19 19
33 34 32 31 31 33 32
13
29 28 27 27 26 26 26 23
27 27 26 24 25 25
1Q2Q3Q4Q1Q2Q3Q4Q1Q2Q3Q4Q1Q2Q3Q4Q1Q2Q3Q4Q1Q2Q
FY12 FY13 FY14 FY15 FY16 FY17
Domestic Motorcycle Total Motorcycle
31.2 24.7 26.4 35.5 51.5 45.9 45.4 39.2 42.2 43.4
21.3 18.7 17.9 12.3
8.2 3.2 0.3 0.0 0.0
11.6 16.9 15.6 8.8 4.7
10.5 11.8 7.5 5.3 4.4
29.8 31.3 31.1 33.5 29.1 31.7 28.3 34.7 37.1 33.2
6.2 8.3 8.8 9.8 6.3 8.8 14.1 23.6 15.4 19.0
1QFY15 2QFY15 3QFY15 4QFY15 1QFY16 2QFY16 3QFY16 4QFY16 1QFY17 2QFY17
Economy Executive 100 Executive 125Premium <200 Premium >200 Premium >300
Bajaj Auto
28 October 2016 4
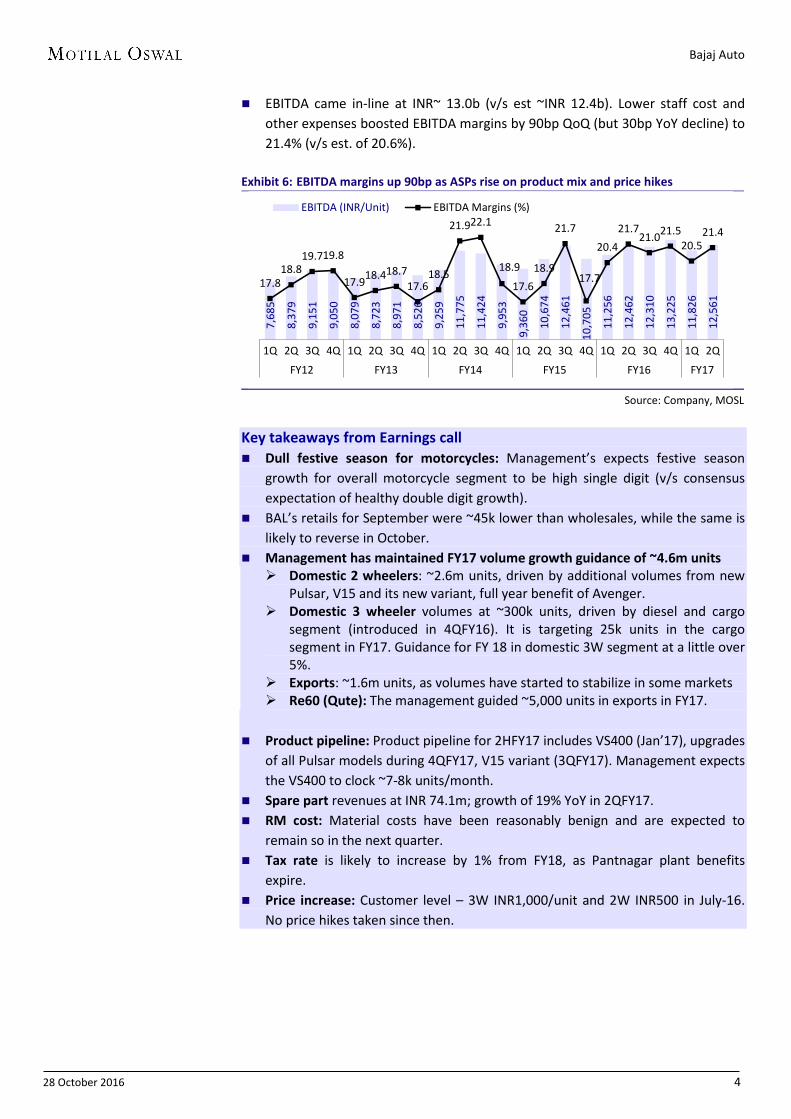
EBITDA came in-line at INR~ 13.0b (v/s est ~INR 12.4b). Lower staff cost and other expenses boosted EBITDA margins by 90bp QoQ (but 30bp YoY decline) to 21.4% (v/s est. of 20.6%).
Exhibit 6: EBITDA margins up 90bp as ASPs rise on product mix and price hikes
Source: Company, MOSL
Key takeaways from Earnings call Dull festive season for motorcycles: Management’s expects festive season
growth for overall motorcycle segment to be high single digit (v/s consensus expectation of healthy double digit growth).
BAL’s retails for September were ~45k lower than wholesales, while the same is likely to reverse in October.
Management has maintained FY17 volume growth guidance of ~4.6m units Domestic 2 wheelers: ~2.6m units, driven by additional volumes from new
Pulsar, V15 and its new variant, full year benefit of Avenger. Domestic 3 wheeler volumes at ~300k units, driven by diesel and cargo
segment (introduced in 4QFY16). It is targeting 25k units in the cargo segment in FY17. Guidance for FY 18 in domestic 3W segment at a little over 5%.
Exports: ~1.6m units, as volumes have started to stabilize in some markets Re60 (Qute): The management guided ~5,000 units in exports in FY17.
Product pipeline: Product pipeline for 2HFY17 includes VS400 (Jan’17), upgrades
of all Pulsar models during 4QFY17, V15 variant (3QFY17). Management expects the VS400 to clock ~7-8k units/month.
Spare part revenues at INR 74.1m; growth of 19% YoY in 2QFY17. RM cost: Material costs have been reasonably benign and are expected to
remain so in the next quarter. Tax rate is likely to increase by 1% from FY18, as Pantnagar plant benefits
expire. Price increase: Customer level – 3W INR1,000/unit and 2W INR500 in July-16.
No price hikes taken since then.
7,6
85
8,3
79
9,1
51
9,0
50
8,0
79
8,7
23
8,9
71
8,5
26
9,2
59
11,
775
11,
424
9,9
53
9,3
60
10,
674
12,
461
10,
705
11,
256
12,
462
12,
310
13,
225
11,
826
12,
561
17.8 18.8
19.7 19.8
17.9 18.4 18.7 17.6
18.5
21.9 22.1
18.9
17.6 18.9
21.7
17.7
20.4 21.7
21.0 21.5 20.5
21.4
1Q 2Q 3Q 4Q 1Q 2Q 3Q 4Q 1Q 2Q 3Q 4Q 1Q 2Q 3Q 4Q 1Q 2Q 3Q 4Q 1Q 2Q
FY12 FY13 FY14 FY15 FY16 FY17
EBITDA (INR/Unit) EBITDA Margins (%)
Bajaj Auto
28 October 2016 5
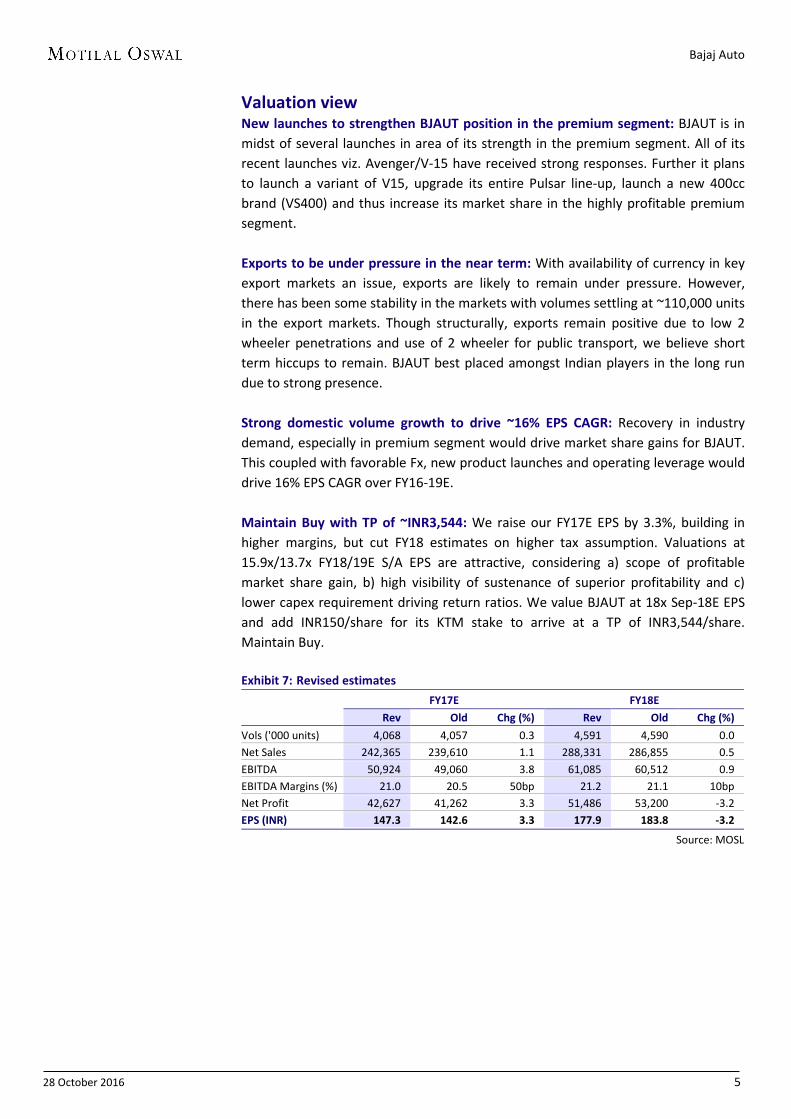
Valuation view New launches to strengthen BJAUT position in the premium segment: BJAUT is in midst of several launches in area of its strength in the premium segment. All of its recent launches viz. Avenger/V-15 have received strong responses. Further it plans to launch a variant of V15, upgrade its entire Pulsar line-up, launch a new 400cc brand (VS400) and thus increase its market share in the highly profitable premium segment. Exports to be under pressure in the near term: With availability of currency in key export markets an issue, exports are likely to remain under pressure. However, there has been some stability in the markets with volumes settling at ~110,000 units in the export markets. Though structurally, exports remain positive due to low 2 wheeler penetrations and use of 2 wheeler for public transport, we believe short term hiccups to remain. BJAUT best placed amongst Indian players in the long run due to strong presence. Strong domestic volume growth to drive ~16% EPS CAGR: Recovery in industry demand, especially in premium segment would drive market share gains for BJAUT. This coupled with favorable Fx, new product launches and operating leverage would drive 16% EPS CAGR over FY16-19E. Maintain Buy with TP of ~INR3,544: We raise our FY17E EPS by 3.3%, building in higher margins, but cut FY18 estimates on higher tax assumption. Valuations at 15.9x/13.7x FY18/19E S/A EPS are attractive, considering a) scope of profitable market share gain, b) high visibility of sustenance of superior profitability and c) lower capex requirement driving return ratios. We value BJAUT at 18x Sep-18E EPS and add INR150/share for its KTM stake to arrive at a TP of INR3,544/share. Maintain Buy. Exhibit 7: Revised estimates
FY17E FY18E
Rev Old Chg (%) Rev Old Chg (%)
Vols ('000 units) 4,068 4,057 0.3 4,591 4,590 0.0 Net Sales 242,365 239,610 1.1 288,331 286,855 0.5 EBITDA 50,924 49,060 3.8 61,085 60,512 0.9 EBITDA Margins (%) 21.0 20.5 50bp 21.2 21.1 10bp Net Profit 42,627 41,262 3.3 51,486 53,200 -3.2 EPS (INR) 147.3 142.6 3.3 177.9 183.8 -3.2
Source: MOSL
Bajaj Auto
28 October 2016 6
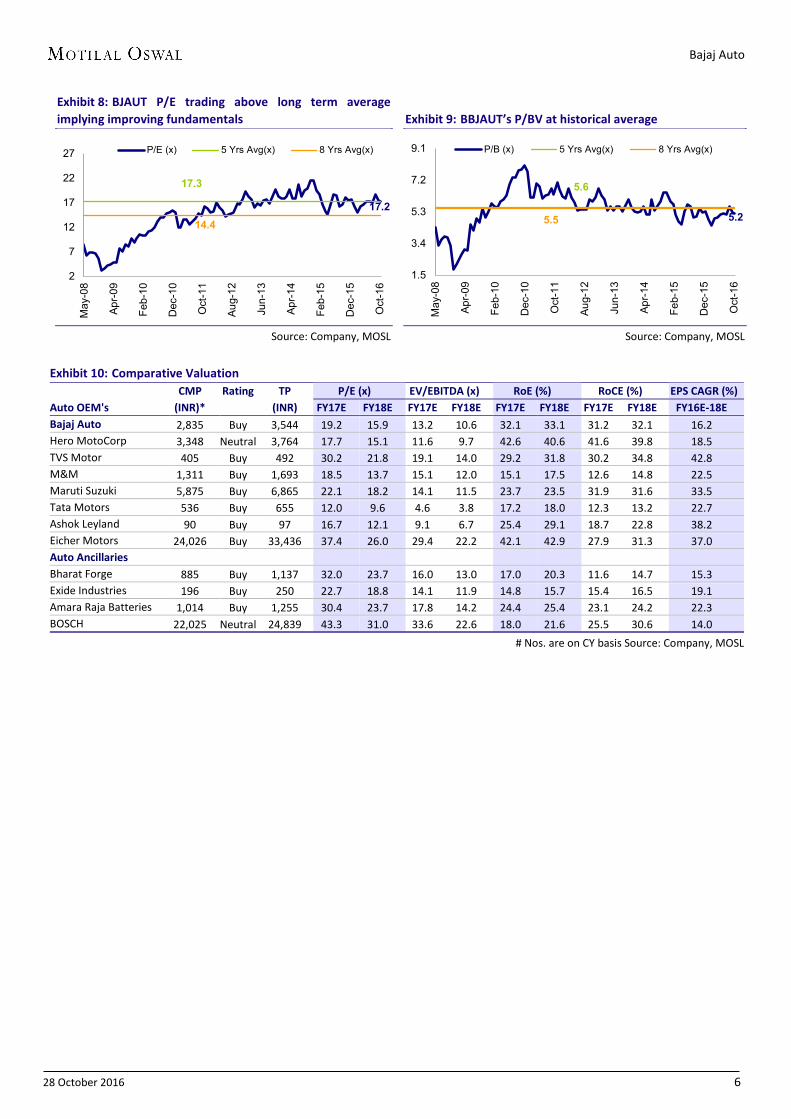
Exhibit 8: BJAUT P/E trading above long term average implying improving fundamentals
Source: Company, MOSL
Exhibit 9: BBJAUT’s P/BV at historical average
Source: Company, MOSL
Exhibit 10: Comparative Valuation CMP Rating TP P/E (x) EV/EBITDA (x) RoE (%) RoCE (%) EPS CAGR (%) Auto OEM's (INR)*
(INR) FY17E FY18E FY17E FY18E FY17E FY18E FY17E FY18E FY16E-18E
Bajaj Auto 2,835 Buy 3,544 19.2 15.9 13.2 10.6 32.1 33.1 31.2 32.1 16.2 Hero MotoCorp 3,348 Neutral 3,764 17.7 15.1 11.6 9.7 42.6 40.6 41.6 39.8 18.5 TVS Motor 405 Buy 492 30.2 21.8 19.1 14.0 29.2 31.8 30.2 34.8 42.8 M&M 1,311 Buy 1,693 18.5 13.7 15.1 12.0 15.1 17.5 12.6 14.8 22.5 Maruti Suzuki 5,875 Buy 6,865 22.1 18.2 14.1 11.5 23.7 23.5 31.9 31.6 33.5 Tata Motors 536 Buy 655 12.0 9.6 4.6 3.8 17.2 18.0 12.3 13.2 22.7 Ashok Leyland 90 Buy 97 16.7 12.1 9.1 6.7 25.4 29.1 18.7 22.8 38.2 Eicher Motors 24,026 Buy 33,436 37.4 26.0 29.4 22.2 42.1 42.9 27.9 31.3 37.0 Auto Ancillaries
Bharat Forge 885 Buy 1,137 32.0 23.7 16.0 13.0 17.0 20.3 11.6 14.7 15.3 Exide Industries 196 Buy 250 22.7 18.8 14.1 11.9 14.8 15.7 15.4 16.5 19.1 Amara Raja Batteries 1,014 Buy 1,255 30.4 23.7 17.8 14.2 24.4 25.4 23.1 24.2 22.3 BOSCH 22,025 Neutral 24,839 43.3 31.0 33.6 22.6 18.0 21.6 25.5 30.6 14.0
# Nos. are on CY basis Source: Company, MOSL
17.2
17.3
14.4
2
7
12
17
22
27
May
-08
Apr-0
9
Feb-
10
Dec
-10
Oct
-11
Aug-
12
Jun-
13
Apr-1
4
Feb-
15
Dec
-15
Oct
-16
P/E (x) 5 Yrs Avg(x) 8 Yrs Avg(x)
5.2
5.6
5.5
1.5
3.4
5.3
7.2
9.1
May
-08
Apr-0
9
Feb-
10
Dec
-10
Oct
-11
Aug-
12
Jun-
13
Apr-1
4
Feb-
15
Dec
-15
Oct
-16
P/B (x) 5 Yrs Avg(x) 8 Yrs Avg(x)
Bajaj Auto
28 October 2016 7
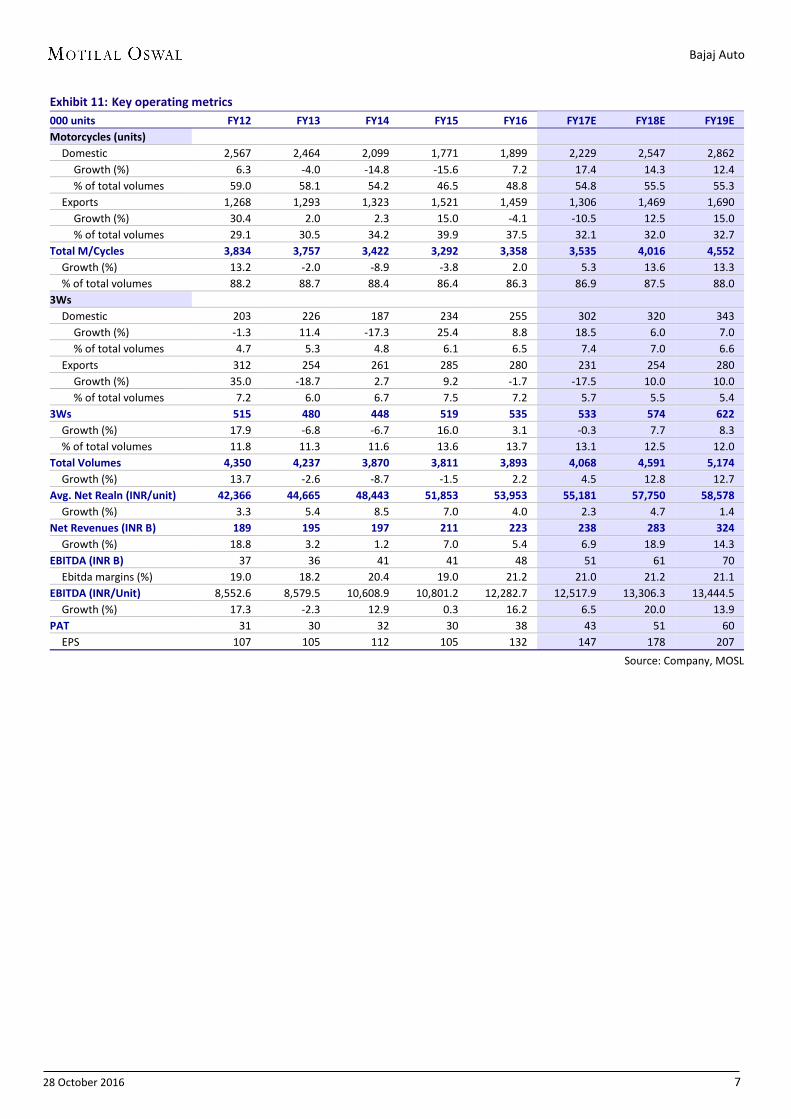
Exhibit 11: Key operating metrics 000 units FY12 FY13 FY14 FY15 FY16 FY17E FY18E FY19E Motorcycles (units)
Domestic 2,567 2,464 2,099 1,771 1,899 2,229 2,547 2,862 Growth (%) 6.3 -4.0 -14.8 -15.6 7.2 17.4 14.3 12.4 % of total volumes 59.0 58.1 54.2 46.5 48.8 54.8 55.5 55.3
Exports 1,268 1,293 1,323 1,521 1,459 1,306 1,469 1,690 Growth (%) 30.4 2.0 2.3 15.0 -4.1 -10.5 12.5 15.0 % of total volumes 29.1 30.5 34.2 39.9 37.5 32.1 32.0 32.7
Total M/Cycles 3,834 3,757 3,422 3,292 3,358 3,535 4,016 4,552 Growth (%) 13.2 -2.0 -8.9 -3.8 2.0 5.3 13.6 13.3 % of total volumes 88.2 88.7 88.4 86.4 86.3 86.9 87.5 88.0
3Ws Domestic 203 226 187 234 255 302 320 343
Growth (%) -1.3 11.4 -17.3 25.4 8.8 18.5 6.0 7.0 % of total volumes 4.7 5.3 4.8 6.1 6.5 7.4 7.0 6.6
Exports 312 254 261 285 280 231 254 280 Growth (%) 35.0 -18.7 2.7 9.2 -1.7 -17.5 10.0 10.0 % of total volumes 7.2 6.0 6.7 7.5 7.2 5.7 5.5 5.4
3Ws 515 480 448 519 535 533 574 622 Growth (%) 17.9 -6.8 -6.7 16.0 3.1 -0.3 7.7 8.3 % of total volumes 11.8 11.3 11.6 13.6 13.7 13.1 12.5 12.0
Total Volumes 4,350 4,237 3,870 3,811 3,893 4,068 4,591 5,174 Growth (%) 13.7 -2.6 -8.7 -1.5 2.2 4.5 12.8 12.7
Avg. Net Realn (INR/unit) 42,366 44,665 48,443 51,853 53,953 55,181 57,750 58,578 Growth (%) 3.3 5.4 8.5 7.0 4.0 2.3 4.7 1.4
Net Revenues (INR B) 189 195 197 211 223 238 283 324 Growth (%) 18.8 3.2 1.2 7.0 5.4 6.9 18.9 14.3
EBITDA (INR B) 37 36 41 41 48 51 61 70 Ebitda margins (%) 19.0 18.2 20.4 19.0 21.2 21.0 21.2 21.1
EBITDA (INR/Unit) 8,552.6 8,579.5 10,608.9 10,801.2 12,282.7 12,517.9 13,306.3 13,444.5 Growth (%) 17.3 -2.3 12.9 0.3 16.2 6.5 20.0 13.9
PAT 31 30 32 30 38 43 51 60 EPS 107 105 112 105 132 147 178 207
Source: Company, MOSL
Bajaj Auto
28 October 2016 8
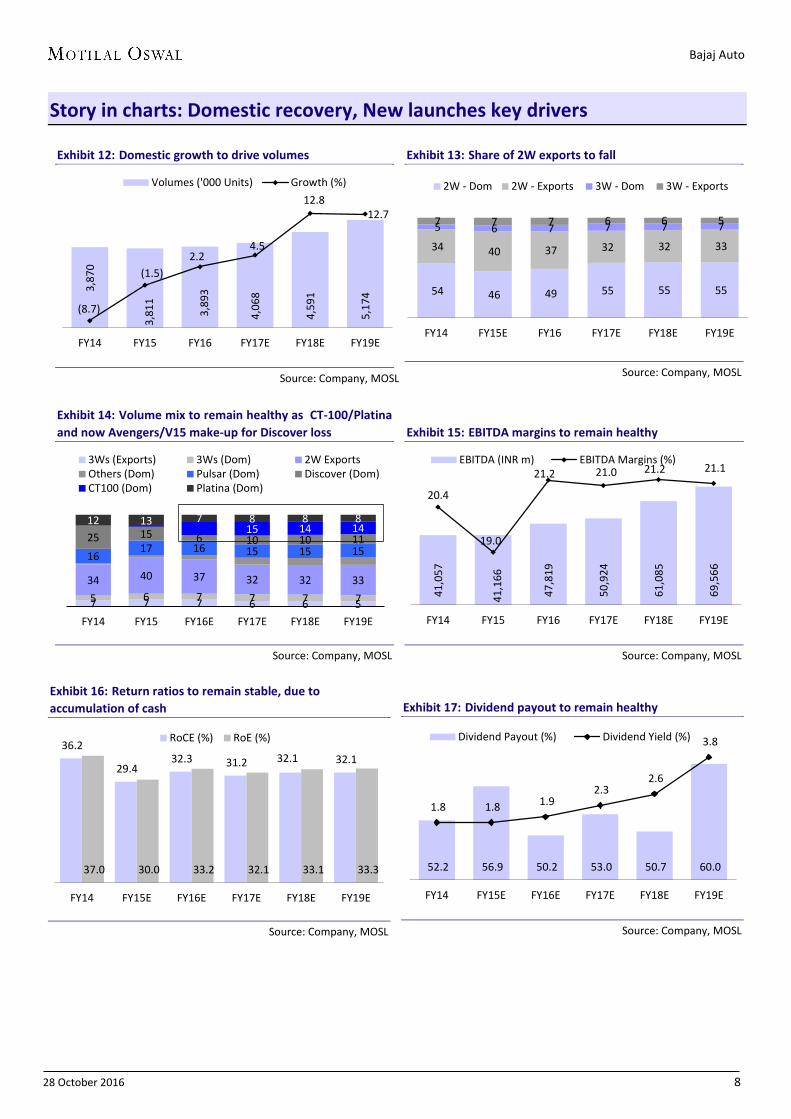
Story in charts: Domestic recovery, New launches key drivers
Exhibit 12: Domestic growth to drive volumes
Source: Company, MOSL
Exhibit 13: Share of 2W exports to fall
Source: Company, MOSL
Exhibit 14: Volume mix to remain healthy as CT-100/Platina and now Avengers/V15 make-up for Discover loss
Source: Company, MOSL
Exhibit 15: EBITDA margins to remain healthy
Source: Company, MOSL
Exhibit 16: Return ratios to remain stable, due to accumulation of cash
Source: Company, MOSL
Exhibit 17: Dividend payout to remain healthy
Source: Company, MOSL
3,87
0
3,81
1
3,89
3
4,06
8
4,59
1
5,17
4
(8.7)
(1.5) 2.2
4.5
12.8 12.7
FY14 FY15 FY16 FY17E FY18E FY19E
Volumes ('000 Units) Growth (%)
54 46 49 55 55 55
34 40 37 32 32 33
5 6 7 7 7 7 7 7 7 6 6 5
FY14 FY15E FY16 FY17E FY18E FY19E
2W - Dom 2W - Exports 3W - Dom 3W - Exports
7 7 7 6 6 5 5 6 7 7 7 7 34 40 37 32 32 33
16 17 16 15 15 15
25 15 6 10 10 11 15 14 14
12 13 7 8 8 8
FY14 FY15 FY16E FY17E FY18E FY19E
3Ws (Exports) 3Ws (Dom) 2W ExportsOthers (Dom) Pulsar (Dom) Discover (Dom)CT100 (Dom) Platina (Dom)
41,0
57
41,1
66
47,8
19
50,9
24
61,0
85
69,5
66
20.4
19.0
21.2 21.0 21.2 21.1
FY14 FY15 FY16 FY17E FY18E FY19E
EBITDA (INR m) EBITDA Margins (%)
36.2
29.4 32.3 31.2 32.1 32.1
37.0 30.0 33.2 32.1 33.1 33.3
FY14 FY15E FY16E FY17E FY18E FY19E
RoCE (%) RoE (%)
52.2 56.9 50.2 53.0 50.7 60.0
1.8 1.8 1.9 2.3
2.6
3.8
FY14 FY15E FY16E FY17E FY18E FY19E
Dividend Payout (%) Dividend Yield (%)
Bajaj Auto
28 October 2016 9
Financials and Valuations
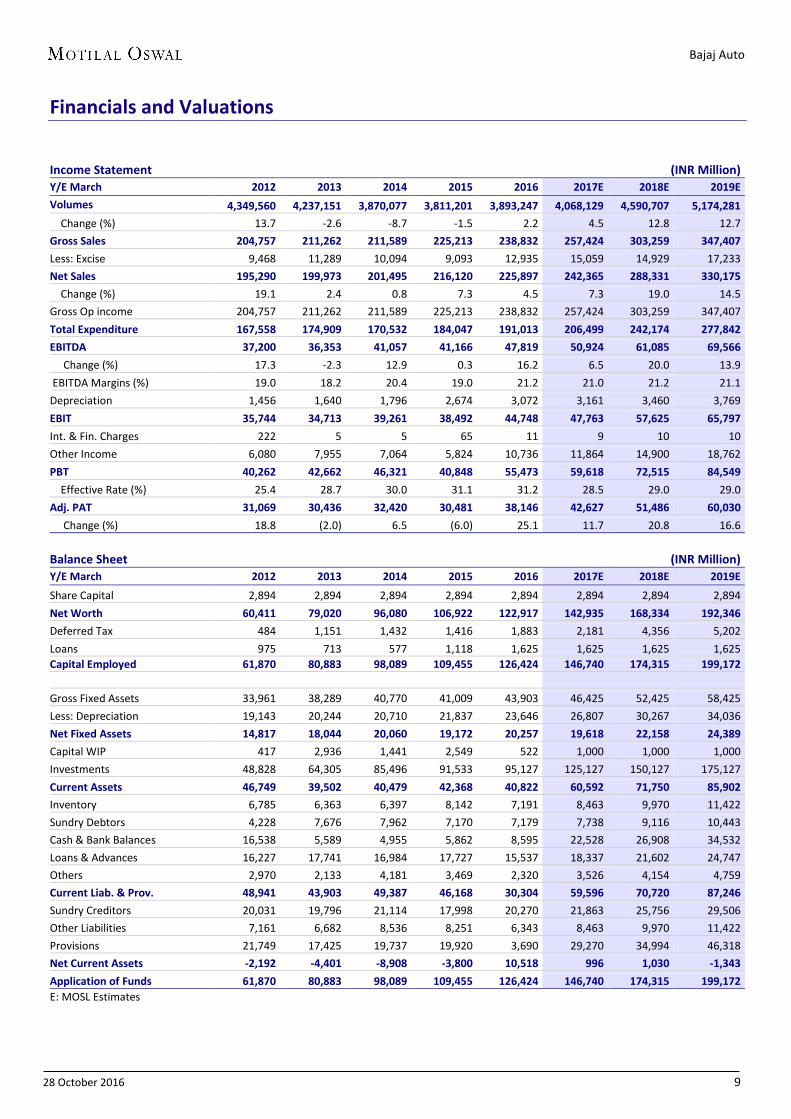
Income Statement
(INR Million) Y/E March 2012 2013 2014 2015 2016 2017E 2018E 2019E
Volumes 4,349,560 4,237,151 3,870,077 3,811,201 3,893,247 4,068,129 4,590,707 5,174,281
Change (%) 13.7 -2.6 -8.7 -1.5 2.2 4.5 12.8 12.7 Gross Sales 204,757 211,262 211,589 225,213 238,832 257,424 303,259 347,407
Less: Excise 9,468 11,289 10,094 9,093 12,935 15,059 14,929 17,233 Net Sales 195,290 199,973 201,495 216,120 225,897 242,365 288,331 330,175
Change (%) 19.1 2.4 0.8 7.3 4.5 7.3 19.0 14.5 Gross Op income 204,757 211,262 211,589 225,213 238,832 257,424 303,259 347,407 Total Expenditure 167,558 174,909 170,532 184,047 191,013 206,499 242,174 277,842
EBITDA 37,200 36,353 41,057 41,166 47,819 50,924 61,085 69,566
Change (%) 17.3 -2.3 12.9 0.3 16.2 6.5 20.0 13.9 EBITDA Margins (%) 19.0 18.2 20.4 19.0 21.2 21.0 21.2 21.1 Depreciation 1,456 1,640 1,796 2,674 3,072 3,161 3,460 3,769 EBIT 35,744 34,713 39,261 38,492 44,748 47,763 57,625 65,797
Int. & Fin. Charges 222 5 5 65 11 9 10 10 Other Income 6,080 7,955 7,064 5,824 10,736 11,864 14,900 18,762 PBT 40,262 42,662 46,321 40,848 55,473 59,618 72,515 84,549
Effective Rate (%) 25.4 28.7 30.0 31.1 31.2 28.5 29.0 29.0 Adj. PAT 31,069 30,436 32,420 30,481 38,146 42,627 51,486 60,030
Change (%) 18.8 (2.0) 6.5 (6.0) 25.1 11.7 20.8 16.6
Balance Sheet
(INR Million) Y/E March 2012 2013 2014 2015 2016 2017E 2018E 2019E
Share Capital 2,894 2,894 2,894 2,894 2,894 2,894 2,894 2,894 Net Worth 60,411 79,020 96,080 106,922 122,917 142,935 168,334 192,346
Deferred Tax 484 1,151 1,432 1,416 1,883 2,181 4,356 5,202 Loans 975 713 577 1,118 1,625 1,625 1,625 1,625 Capital Employed 61,870 80,883 98,089 109,455 126,424 146,740 174,315 199,172
Gross Fixed Assets 33,961 38,289 40,770 41,009 43,903 46,425 52,425 58,425 Less: Depreciation 19,143 20,244 20,710 21,837 23,646 26,807 30,267 34,036 Net Fixed Assets 14,817 18,044 20,060 19,172 20,257 19,618 22,158 24,389
Capital WIP 417 2,936 1,441 2,549 522 1,000 1,000 1,000 Investments 48,828 64,305 85,496 91,533 95,127 125,127 150,127 175,127 Current Assets 46,749 39,502 40,479 42,368 40,822 60,592 71,750 85,902
Inventory 6,785 6,363 6,397 8,142 7,191 8,463 9,970 11,422 Sundry Debtors 4,228 7,676 7,962 7,170 7,179 7,738 9,116 10,443 Cash & Bank Balances 16,538 5,589 4,955 5,862 8,595 22,528 26,908 34,532 Loans & Advances 16,227 17,741 16,984 17,727 15,537 18,337 21,602 24,747 Others 2,970 2,133 4,181 3,469 2,320 3,526 4,154 4,759 Current Liab. & Prov. 48,941 43,903 49,387 46,168 30,304 59,596 70,720 87,246
Sundry Creditors 20,031 19,796 21,114 17,998 20,270 21,863 25,756 29,506 Other Liabilities 7,161 6,682 8,536 8,251 6,343 8,463 9,970 11,422 Provisions 21,749 17,425 19,737 19,920 3,690 29,270 34,994 46,318 Net Current Assets -2,192 -4,401 -8,908 -3,800 10,518 996 1,030 -1,343
Application of Funds 61,870 80,883 98,089 109,455 126,424 146,740 174,315 199,172 E: MOSL Estimates
Bajaj Auto
28 October 2016 10
Financials and Valuations
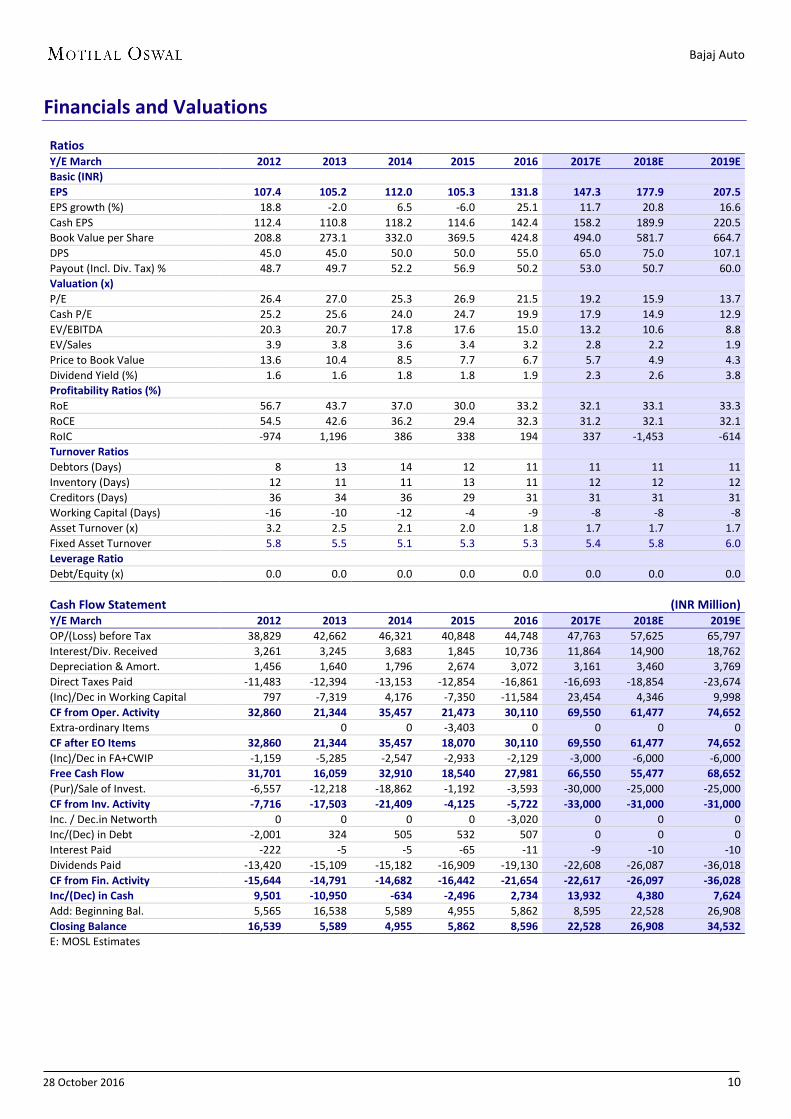
Ratios
Y/E March 2012 2013 2014 2015 2016 2017E 2018E 2019E Basic (INR)
EPS 107.4 105.2 112.0 105.3 131.8 147.3 177.9 207.5 EPS growth (%) 18.8 -2.0 6.5 -6.0 25.1 11.7 20.8 16.6 Cash EPS 112.4 110.8 118.2 114.6 142.4 158.2 189.9 220.5 Book Value per Share 208.8 273.1 332.0 369.5 424.8 494.0 581.7 664.7 DPS 45.0 45.0 50.0 50.0 55.0 65.0 75.0 107.1 Payout (Incl. Div. Tax) % 48.7 49.7 52.2 56.9 50.2 53.0 50.7 60.0 Valuation (x)
P/E 26.4 27.0 25.3 26.9 21.5 19.2 15.9 13.7 Cash P/E 25.2 25.6 24.0 24.7 19.9 17.9 14.9 12.9 EV/EBITDA 20.3 20.7 17.8 17.6 15.0 13.2 10.6 8.8 EV/Sales 3.9 3.8 3.6 3.4 3.2 2.8 2.2 1.9 Price to Book Value 13.6 10.4 8.5 7.7 6.7 5.7 4.9 4.3 Dividend Yield (%) 1.6 1.6 1.8 1.8 1.9 2.3 2.6 3.8 Profitability Ratios (%)
RoE 56.7 43.7 37.0 30.0 33.2 32.1 33.1 33.3 RoCE 54.5 42.6 36.2 29.4 32.3 31.2 32.1 32.1 RoIC -974 1,196 386 338 194 337 -1,453 -614 Turnover Ratios
Debtors (Days) 8 13 14 12 11 11 11 11 Inventory (Days) 12 11 11 13 11 12 12 12 Creditors (Days) 36 34 36 29 31 31 31 31 Working Capital (Days) -16 -10 -12 -4 -9 -8 -8 -8 Asset Turnover (x) 3.2 2.5 2.1 2.0 1.8 1.7 1.7 1.7 Fixed Asset Turnover 5.8 5.5 5.1 5.3 5.3 5.4 5.8 6.0 Leverage Ratio
Debt/Equity (x) 0.0 0.0 0.0 0.0 0.0 0.0 0.0 0.0
Cash Flow Statement
(INR Million) Y/E March 2012 2013 2014 2015 2016 2017E 2018E 2019E OP/(Loss) before Tax 38,829 42,662 46,321 40,848 44,748 47,763 57,625 65,797 Interest/Div. Received 3,261 3,245 3,683 1,845 10,736 11,864 14,900 18,762 Depreciation & Amort. 1,456 1,640 1,796 2,674 3,072 3,161 3,460 3,769 Direct Taxes Paid -11,483 -12,394 -13,153 -12,854 -16,861 -16,693 -18,854 -23,674 (Inc)/Dec in Working Capital 797 -7,319 4,176 -7,350 -11,584 23,454 4,346 9,998 CF from Oper. Activity 32,860 21,344 35,457 21,473 30,110 69,550 61,477 74,652 Extra-ordinary Items 0 0 -3,403 0 0 0 0 CF after EO Items 32,860 21,344 35,457 18,070 30,110 69,550 61,477 74,652 (Inc)/Dec in FA+CWIP -1,159 -5,285 -2,547 -2,933 -2,129 -3,000 -6,000 -6,000 Free Cash Flow 31,701 16,059 32,910 18,540 27,981 66,550 55,477 68,652 (Pur)/Sale of Invest. -6,557 -12,218 -18,862 -1,192 -3,593 -30,000 -25,000 -25,000 CF from Inv. Activity -7,716 -17,503 -21,409 -4,125 -5,722 -33,000 -31,000 -31,000 Inc. / Dec.in Networth 0 0 0 0 -3,020 0 0 0 Inc/(Dec) in Debt -2,001 324 505 532 507 0 0 0 Interest Paid -222 -5 -5 -65 -11 -9 -10 -10 Dividends Paid -13,420 -15,109 -15,182 -16,909 -19,130 -22,608 -26,087 -36,018 CF from Fin. Activity -15,644 -14,791 -14,682 -16,442 -21,654 -22,617 -26,097 -36,028 Inc/(Dec) in Cash 9,501 -10,950 -634 -2,496 2,734 13,932 4,380 7,624 Add: Beginning Bal. 5,565 16,538 5,589 4,955 5,862 8,595 22,528 26,908 Closing Balance 16,539 5,589 4,955 5,862 8,596 22,528 26,908 34,532 E: MOSL Estimates
Bajaj Auto
28 October 2016 11
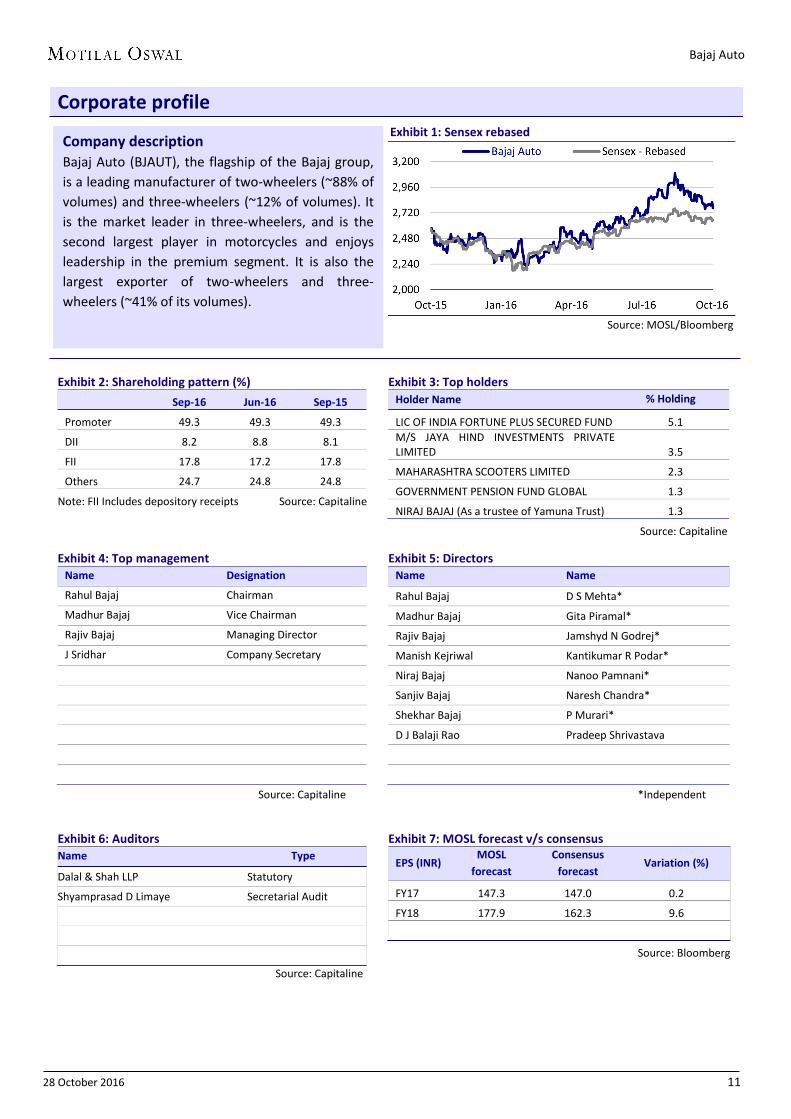
Corporate profile Exhibit 1: Sensex rebased
Source: MOSL/Bloomberg
Exhibit 2: Shareholding pattern (%)
Sep-16 Jun-16 Sep-15
Promoter 49.3 49.3 49.3
DII 8.2 8.8 8.1
FII 17.8 17.2 17.8
Others 24.7 24.8 24.8
Note: FII Includes depository receipts Source: Capitaline
Exhibit 3: Top holders Holder Name % Holding
LIC OF INDIA FORTUNE PLUS SECURED FUND 5.1 M/S JAYA HIND INVESTMENTS PRIVATE LIMITED 3.5
MAHARASHTRA SCOOTERS LIMITED 2.3
GOVERNMENT PENSION FUND GLOBAL 1.3
NIRAJ BAJAJ (As a trustee of Yamuna Trust) 1.3
Source: Capitaline Exhibit 4: Top management
Name Designation
Rahul Bajaj Chairman
Madhur Bajaj Vice Chairman
Rajiv Bajaj Managing Director
J Sridhar Company Secretary
Source: Capitaline
Exhibit 5: Directors Name Name
Rahul Bajaj D S Mehta*
Madhur Bajaj Gita Piramal*
Rajiv Bajaj Jamshyd N Godrej*
Manish Kejriwal Kantikumar R Podar*
Niraj Bajaj Nanoo Pamnani*
Sanjiv Bajaj Naresh Chandra*
Shekhar Bajaj P Murari*
D J Balaji Rao Pradeep Shrivastava
*Independent
Exhibit 6: Auditors Name Type
Dalal & Shah LLP Statutory
Shyamprasad D Limaye Secretarial Audit
Source: Capitaline
Exhibit 7: MOSL forecast v/s consensus
EPS (INR) MOSL
forecast Consensus
forecast Variation (%)
FY17 147.3 147.0 0.2
FY18 177.9 162.3 9.6
Source: Bloomberg
Company description Bajaj Auto (BJAUT), the flagship of the Bajaj group, is a leading manufacturer of two-wheelers (~88% of volumes) and three-wheelers (~12% of volumes). It is the market leader in three-wheelers, and is the second largest player in motorcycles and enjoys leadership in the premium segment. It is also the largest exporter of two-wheelers and three-wheelers (~41% of its volumes).
Bajaj Auto
28 October 2016 12
Disclosures
This document has been prepared by Motilal Oswal Securities Limited (hereinafter referred to as Most) to provide information about the company (ies) and/sector(s), if any, covered in the report and may be distributed by it and/or its affiliated company(ies). This report is for personal information of the selected recipient/s and does not construe to be any investment, legal or taxation advice to you. This research report does not constitute an offer, invitation or inducement to invest in securities or other investments and Motilal Oswal Securities Limited (hereinafter referred as MOSt) is not soliciting any action based upon it. This report is not for public distribution and has been furnished to you solely for your general information and should not be reproduced or redistributed to any other person in any form. This report does not constitute a personal recommendation or take into account the particular investment objectives, financial situations, or needs of individual clients. Before acting on any advice or recommendation in this material, investors should consider whether it is suitable for their particular circumstances and, if necessary, seek professional advice. The price and value of the investments referred to in this material and the income from them may go down as well as up, and investors may realize losses on any investments. Past performance is not a guide for future performance, future returns are not guaranteed and a loss of original capital may occur. MOSt and its affiliates are a full-service, integrated investment banking, investment management, brokerage and financing group. We and our affiliates have investment banking and other business relationships with a some companies covered by our Research Department. Our research professionals may provide input into our investment banking and other business selection processes. Investors should assume that MOSt and/or its affiliates are seeking or will seek investment banking or other business from the company or companies that are the subject of this material and that the research professionals who were involved in preparing this material may educate investors on investments in such business . The research professionals responsible for the preparation of this document may interact with trading desk personnel, sales personnel and other parties for the purpose of gathering, applying and interpreting information. Our research professionals are paid on twin parameters of performance & profitability of MOSt. MOSt generally prohibits its analysts, persons reporting to analysts, and members of their households from maintaining a financial interest in the securities or derivatives of any companies that the analysts cover. Additionally, MOSt generally prohibits its analysts and persons reporting to analysts from serving as an officer, director, or advisory board member of any companies that the analysts cover. Our salespeople, traders, and other professionals or affiliates may provide oral or written market commentary or trading strategies to our clients that reflect opinions that are contrary to the opinions expressed herein, and our proprietary trading and investing businesses may make investment decisions that are inconsistent with the recommendations expressed herein. In reviewing these materials, you should be aware that any or all of the foregoing among other things, may give rise to real or potential conflicts of interest. MOSt and its affiliated company(ies), their directors and employees and their relatives may; (a) from time to time, have a long or short position in, act as principal in, and buy or sell the securities or derivatives thereof of companies mentioned herein. (b) be engaged in any other transaction involving such securities and earn brokerage or other compensation or act as a market maker in the financial instruments of the company(ies) discussed herein or act as an advisor or lender/borrower to such company(ies) or may have any other potential conflict of interests with respect to any recommendation and other related information and opinions.; however the same shall have no bearing whatsoever on the specific recommendations made by the analyst(s), as the recommendations made by the analyst(s) are completely independent of the views of the affiliates of MOSt even though there might exist an inherent conflict of interest in some of the stocks mentioned in the research report Reports based on technical and derivative analysis center on studying charts company's price movement, outstanding positions and trading volume, as opposed to focusing on a company's fundamentals and, as such, may not match with a report on a company's fundamental analysis. In addition MOST has different business segments / Divisions with independent research separated by Chinese walls catering to different set of customers having various objectives, risk profiles, investment horizon, etc, and therefore may at times have different contrary views on stocks sectors and markets. Unauthorized disclosure, use, dissemination or copying (either whole or partial) of this information, is prohibited. The person accessing this information specifically agrees to exempt MOSt or any of its affiliates or employees from, any and all responsibility/liability arising from such misuse and agrees not to hold MOSt or any of its affiliates or employees responsible for any such misuse and further agrees to hold MOSt or any of its affiliates or employees free and harmless from all losses, costs, damages, expenses that may be suffered by the person accessing this information due to any errors and delays. The information contained herein is based on publicly available data or other sources believed to be reliable. Any statements contained in this report attributed to a third party represent MOSt’s interpretation of the data, information and/or opinions provided by that third party either publicly or through a subscription service, and such use and interpretation have not been reviewed by the third party. This Report is not intended to be a complete statement or summary of the securities, markets or developments referred to in the document. While we would endeavor to update the information herein on reasonable basis, MOSt and/or its affiliates are under no obligation to update the information. Also there may be regulatory, compliance, or other reasons that may prevent MOSt and/or its affiliates from doing so. MOSt or any of its affiliates or employees shall not be in any way responsible and liable for any loss or damage that may arise to any person from any inadvertent error in the information contained in this report. MOSt or any of its affiliates or employees do not provide, at any time, any express or implied warranty of any kind, regarding any matter pertaining to this report, including without limitation the implied warranties of merchantability, fitness for a particular purpose, and non-infringement. The recipients of this report should rely on their own investigations. This report is intended for distribution to institutional investors. Recipients who are not institutional investors should seek advice of their independent financial advisor prior to taking any investment decision based on this report or for any necessary explanation of its contents. Most and it’s associates may have managed or co-managed public offering of securities, may have received compensation for investment banking or merchant banking or brokerage services, may have received any compensation for products or services other than investment banking or merchant banking or brokerage services from the subject company in the past 12 months. Most and it’s associates have not received any compensation or other benefits from the subject company or third party in connection with the research report. Subject Company may have been a client of Most or its associates during twelve months preceding the date of distribution of the research report MOSt and/or its affiliates and/or employees may have interests/positions, financial or otherwise of over 1 % at the end of the month immediately preceding the date of publication of the research in the securities mentioned in this report. To enhance transparency, MOSt has incorporated a Disclosure of Interest Statement in this document. This should, however, not be treated as endorsement of the views expressed in the report. Motilal Oswal Securities Limited is registered as a Research Analyst under SEBI (Research Analyst) Regulations, 2014. SEBI Reg. No. INH000000412 Pending Regulatory inspections against Motilal Oswal Securities Limited: SEBI pursuant to a complaint from client Shri C.R. Mohanraj alleging unauthorized trading, issued a letter dated 29th April 2014 to MOSL notifying appointment of an Adjudicating Officer as per SEBI regulations to hold inquiry and adjudge violation of SEBI Regulations; MOSL replied to the Show Cause Notice whereby SEBI granted us an opportunity of Inspection of Documents. Since all the documents requested by us were not covered we have requested to SEBI vide our letter dated June 23, 2015 to provide pending list of documents for inspection. List of associate companies of Motilal Oswal Securities Limited -Click here to access detailed report Analyst Certification The views expressed in this research report accurately reflect the personal views of the analyst(s) about the subject securities or issues, and no part of the compensation of the research analyst(s) was, is, or will be directly or indirectly related to the specific recommendations and views expressed by research analyst(s) in this report. The research analysts, strategists, or research associates principally responsible for preparation of MOSt research receive compensation based upon various factors, including quality of research, investor client feedback, stock picking, competitive factors and firm revenues Disclosure of Interest Statement BAJAJ AUTO Analyst ownership of the stock No Served as an officer, director or employee - No A graph of daily closing prices of securities is available at www.nseindia.com and http://economictimes.indiatimes.com/markets/stocks/stock-quotes Regional Disclosures (outside India) This report is not directed or intended for distribution to or use by any person or entity resident in a state, country or any jurisdiction, where such distribution, publication, availability or use would be contrary to law, regulation or which would subject MOSt & its group companies to registration or licensing requirements within such jurisdictions. For Hong Kong: This report is distributed in Hong Kong by Motilal Oswal capital Markets (Hong Kong) Private Limited, a licensed corporation (CE AYY-301) licensed and regulated by the Hong Kong Securities and Futures Commission (SFC) pursuant to the Securities and Futures Ordinance (Chapter 571 of the Laws of Hong Kong) “SFO”. As per SEBI (Research Analyst Regulations) 2014 Motilal Oswal Securities (SEBI Reg No. INH000000412) has an agreement with Motilal Oswal capital Markets (Hong Kong) Private Limited for distribution of research report in Kong Kong. This report is intended for distribution only to “Professional Investors” as defined in Part I of Schedule 1 to SFO. Any investment or investment activity to which this document relates is only available to professional investor and will be engaged only with professional investors.” Nothing here is an offer or solicitation of these securities, products and services in any jurisdiction where their offer or sale is not qualified or exempt from registration. The Indian Analyst(s) who compile this report is/are not located in Hong Kong & are not conducting Research Analysis in Hong Kong. For U.S. Motilal Oswal Securities Limited (MOSL) is not a registered broker - dealer under the U.S. Securities Exchange Act of 1934, as amended (the"1934 act") and under applicable state laws in the United States. In addition MOSL is not a registered investment adviser under the U.S. Investment Advisers Act of 1940, as amended (the "Advisers Act" and together with the 1934 Act, the "Acts), and under applicable state laws in the United States. Accordingly, in the absence of specific exemption under the Acts, any brokerage and investment services provided by MOSL, including the products and services described herein are not available to or intended for U.S. persons. This report is intended for distribution only to "Major Institutional Investors" as defined by Rule 15a-6(b)(4) of the Exchange Act and interpretations thereof by SEC (henceforth referred to as "major institutional investors"). This document must not be acted on or relied on by persons who are not major institutional investors. Any investment or investment activity to which this document relates is only available to major institutional investors and will be engaged in only with major institutional investors. In reliance on the exemption from registration provided by Rule 15a-6 of the U.S. Securities Exchange Act of 1934, as amended (the "Exchange Act") and interpretations thereof by the U.S. Securities and Exchange Commission ("SEC") in order to conduct business with Institutional Investors based in the U.S., MOSL has entered into a chaperoning agreement with a U.S. registered broker-dealer, Motilal Oswal Securities International Private Limited. ("MOSIPL"). Any business interaction pursuant to this report will have to be executed within the provisions of this chaperoning agreement. The Research Analysts contributing to the report may not be registered /qualified as research analyst with FINRA. Such research analyst may not be associated persons of the U.S. registered broker-dealer, MOSIPL, and therefore, may not be subject to NASD rule 2711 and NYSE Rule 472 restrictions on communication with a subject company, public appearances and trading securities held by a research analyst account. For Singapore Motilal Oswal Capital Markets Singapore Pte Limited is acting as an exempt financial advisor under section 23(1)(f) of the Financial Advisers Act(FAA) read with regulation 17(1)(d) of the Financial Advisors Regulations and is a subsidiary of Motilal Oswal Securities Limited in India. This research is distributed in Singapore by Motilal Oswal Capital Markets Singapore Pte Limited and it is only directed in Singapore to accredited investors, as defined in the Financial Advisers Regulations and the Securities and Futures Act (Chapter 289), as amended from time to time. In respect of any matter arising from or in connection with the research you could contact the following representatives of Motilal Oswal Capital Markets Singapore Pte Limited: Varun Kumar Kadambari Balachandran [email protected] [email protected] Contact : (+65) 68189232 (+65) 68189233 / 65249115 Office Address:21 (Suite 31),16 Collyer Quay,Singapore 04931
Motilal Oswal Securities Ltd
Motilal Oswal Tower, Level 9, Sayani Road, Prabhadevi, Mumbai 400 025 Phone: +91 22 3982 5500 E-mail: [email protected]


