Embed Size (px)
Citation preview

0
LSC
MBAFinance-Semester2
Financial Markets and Investment Analysis
Assigment & Report of the given questions
Module Leader: Palan Ambikai
Written by: Yhlas Sovbetov
Student ID: L0072KEKE0212
December-2012
1
Q1. Why distinctions between Debt & Equity are disappearing?
According to the theory and traditional view of debt - equity relations, there are
significant distinctions between Debt financing and Equity such as:
Debt is a loan that is borrowed from investors via non-relational contract between firm
and investors, that promises an annual fixed payment (interest) to pay back the loan
amount within agreed period.
Whereas, the Equity is relational contract between equity holders and firm, that makes
the equity holders part of the firm ownership and gives a claim on current and future
earnings of the firm as dividend. But dividends are not fixed, and sometimes it can be
reduced or suspended as well. In addition to this, the stock market returns are higher than
bond markets, but otherwise if in any trouble cases of the firm, the debt holders will be
paid first, and equity holders will be in the end of the queue. Therefore, due to higher
risk, these securities are generally expensive than debt bonds. However, this security
gives to its holder, the voting rights and decision making on how to employ the assets.
The firms can increase their capital by 2 ways: issuing bonds or issuing shares. The
relation between them determines the leverage of the firm. Till recent years, firms were
considering the leverage balance while they planned to increase the capital. But in recent years,
asset financing with debt has exceeded the equity one. The reasons of this, can be pointed as new
innovations in the financial markets and new understanding of the capital structure theory. The
main understanding was high geared companies have high risk of capital structure, so that
shareholders will require risk premium for the extra risks. But the modern understanding of the
capital structure by Modigliani and Miller which makes the leverage risk irrelevant was the
first challenge against the distinctions between debt and equity. The theory says that financing
with debt or equity won't affect the cost of capital. (Kopcke & Rosengren, 1989)
Secondly, the taxation regulations led the bond markets to be more attractive. Paying
high corporate tax always was main consideration for the firms. In the debt financing, firms pay
interest to the investors that is tax deductible. Whereas, in equity financing, the firms cannot
seize the taxation advantage, and also shareholder will pay income tax on the dividend they got.
Thirdly, with new innovations of the financial instruments in the bond market, such as
convertible bonds that are convertible to the ordinary share at a specific price; dated bonds that
can be bought back by the firm at specific date and price; undated bonds that are not redeemable,
secured bonds that are backed by mortgages such as CMO, CARD, CAR, CLEO, and FRENDs;
unsecured bonds, debt with equity warrants, and etc, the significant distinctions between
borrowed capital and equity are blurred. These developments in the bond market provided more
flexibility to the firms as well as to investors. For instance; If the firm issues the callable bonds
(redeemable) at % 10 interest rate, and in future when the interest rates fall down to % 6, the firm
2
will collect all bonds back, and will re-issue them at % 6. Due to these flexibilities the bond
markets have become more preferable than stock markets. (Kopcke & Rosengren, 1989)
Moreover, the potential risk and return of these new financial instruments, were
mitigated by new hedging instruments such as Butterfly spread, Cancelable Forward
Exchange Contracts, Synthetic instruments, Carrots and Stick bonds, Convertible Premium Puts,
Dual-Currency bonds, COP (Covered Options), ECU (European Currency Unit) bonds, ICON
(Indexed Options), PERL (Principal Exchange Rate Linked), FRN (Floating Rate Notes), Swap
Agreements, Certificated Securities and etc.
Lastly, beside the bond market, the developments in the stock markets such as auctions
(MMP, CAMPS, CMPS, DARTS, STARS, PIK), options and resets, in its turn, contributed to
the distinctions between stocks and bonds be melted.
In conclusion, with the new progresses and diversifications in the financial instruments,
the debt bonds start to include more equity characteristics. On other hand, the tax deductibility
and flexibility advantages of the financial products make the bond markets more attractive with
the consideration of the modern theory of capital structure of leverage irrelevancy.
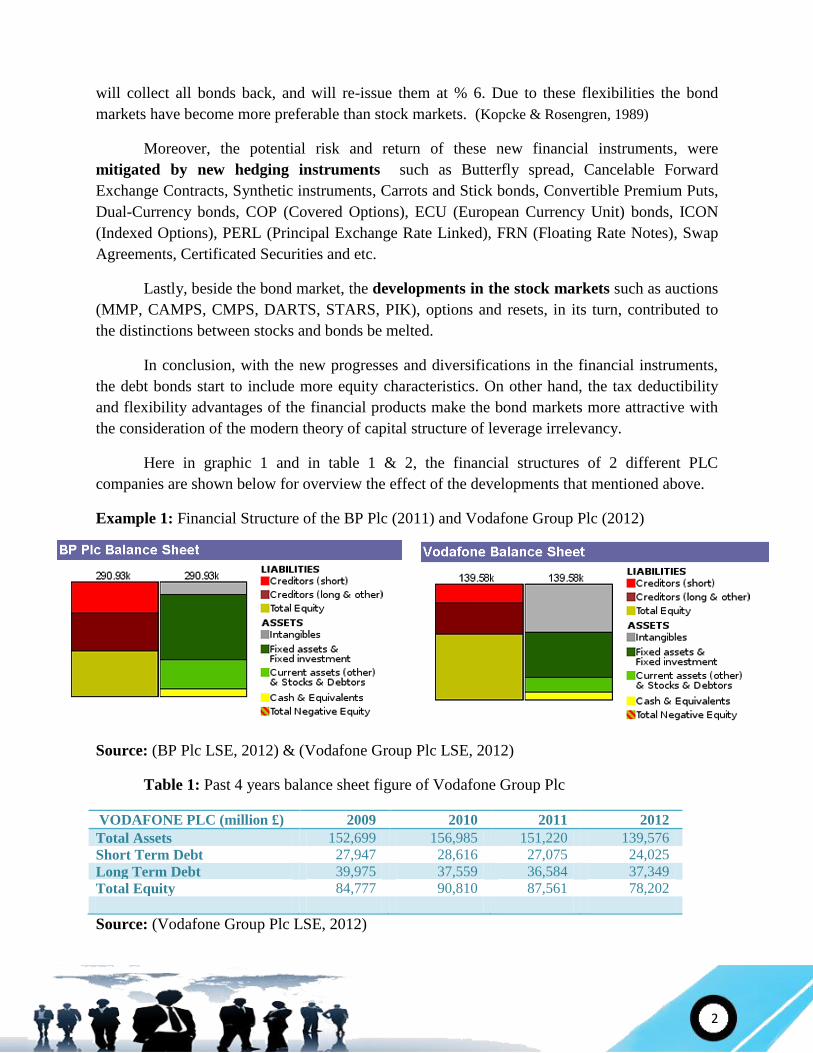
Here in graphic 1 and in table 1 & 2, the financial structures of 2 different PLC
companies are shown below for overview the effect of the developments that mentioned above.
Example 1: Financial Structure of the BP Plc (2011) and Vodafone Group Plc (2012)
Source: (BP Plc LSE, 2012) & (Vodafone Group Plc LSE, 2012)
Table 1: Past 4 years balance sheet figure of Vodafone Group Plc
VODAFONE PLC (million £) 2009 2010 2011 2012
Total Assets 152,699 156,985 151,220 139,576
Short Term Debt 27,947 28,616 27,075 24,025
Long Term Debt 39,975 37,559 36,584 37,349
Total Equity 84,777 90,810 87,561 78,202
Source: (Vodafone Group Plc LSE, 2012)
3
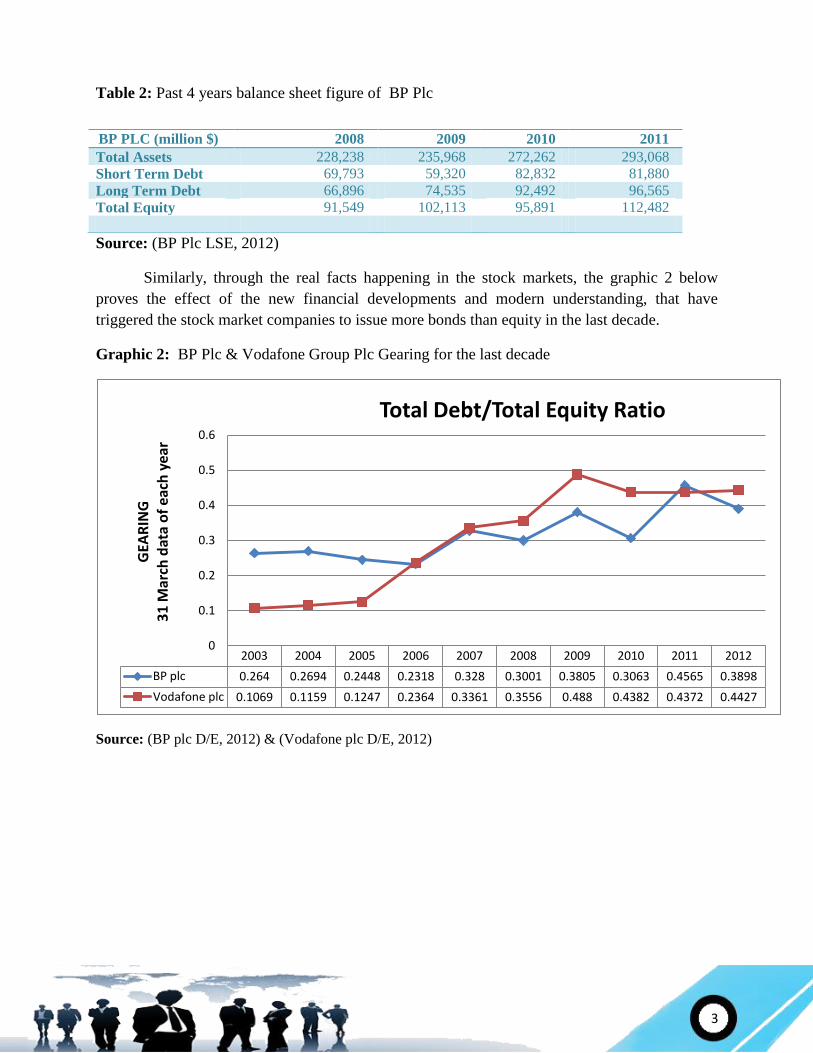
Table 2: Past 4 years balance sheet figure of BP Plc
Source: (BP Plc LSE, 2012)
Similarly, through the real facts happening in the stock markets, the graphic 2 below
proves the effect of the new financial developments and modern understanding, that have
triggered the stock market companies to issue more bonds than equity in the last decade.
Graphic 2: BP Plc & Vodafone Group Plc Gearing for the last decade
Source: (BP plc D/E, 2012) & (Vodafone plc D/E, 2012)
2003 2004 2005 2006 2007 2008 2009 2010 2011 2012
BP plc 0.264 0.2694 0.2448 0.2318 0.328 0.3001 0.3805 0.3063 0.4565 0.3898
Vodafone plc 0.1069 0.1159 0.1247 0.2364 0.3361 0.3556 0.488 0.4382 0.4372 0.4427
0
0.1
0.2
0.3
0.4
0.5
0.6
GEA
RIN
G
31
Mar
ch d
ata
of
each
yea
r
Total Debt/Total Equity Ratio
BP PLC (million $) 2008 2009 2010 2011
Total Assets 228,238 235,968 272,262 293,068
Short Term Debt 69,793 59,320 82,832 81,880
Long Term Debt 66,896 74,535 92,492 96,565
Total Equity 91,549 102,113 95,891 112,482
4
London School of Commerce
MBA Finance
Financial Markets Investment Analysis
Assignment Question No.3
REPORT: Overview of foreign exchange markets for a small local company
TO: Company "Z"
FROM: Ihlas Sovbetov Nobatovich
DATE: December 11, 2012
Abstract
This is a report for the company "Z" about foreign exchange markets due to their first
international contract. In the case, company can face with four types of risks such as translation,
transaction, economic, and political risks. But as it was asked in particular the exchange rate risk
that company can face within the contract period, only the transaction risk management
techniques will be considered in this report. More briefly, as it is the company's first international
contract, the internal hedging tools will be ignored, and only the external one, especially forward
and money market hedging tools will be analyzed.
1. Introduction
Transaction risk occurs when sellers agree to get the payment of their products or
services, within specific period of future time in different currency units. Here the involved risk
is currency movements against the seller company. Some reasons of these movements can be
pointed as a change in demand & supply of the currency, a change in balance trade of the
country, as well as the differentiation of interest and inflation rates. To eliminate or mitigate
the risk of these currency fluctuations, the hedging tools are used. Basically, here, the main focus
will be on forward and money markets hedging tools, others (Swap, Options) won't be discussed.
2. Money Market Hedging Techniques
The main idea behind this tool is to lock the current spot rate of payables or receivables
by matching the assets or liabilities in trading currency, then convert and invest it to the home
currency. Accordingly to this, if the company sells to overseas, then company will have
receivable that is an asset. To lock the spot rate of the receivables, the company should create a
liability to match. On contrast, if the company buys from overseas on credit, then the company
will have payable that is a liability. To hedge it, the company should create an asset to match.

5
2.1. How it works?
Detail of the contract is not mentioned in the question, therefore, here two different
scenarios will be assumed with these base assumptions:
Base Assumption
£ interest = %12 - %14 (annual)
$ interest = %8 - %10 (annual)
Spot Market Rate $/£ = 1.60 - 1.62
Forward Market Rate (6 months) $/£ = 1.54 - 1.56
Assumption 1: UK based company "Z" sold products to a US customer for $10m on
credit that is receivable after 6 months time.
In this scenario, the company "Z" has receivables, and to hedge it they should create an
equivalent liability ($10m) in US currency unit that is payable in 6 months time, then they should
convert it to sterling and invest it to the sterling money market.
Step 1: Borrowing $10m, payable in 6 months time ($ borrowing interest = %10 annual)
x=? $10m
Now 6 months from today
x * (1+ 0.10/2) = $10m (6 months interest = annual / 2)
x = $9.5238m
(If the firm borrows this amount today, after half year debt will be $10m)
Step 2: Convert it to the home currency
$9.5238/ 1.60 = £5.9524m (The firm needs to buy $, therefore 1.60 is used)
Step 3: Invest it to the home money market
£5.9524m * (1+ 0.12/2) = £6.31m (Receivable in 6 months time)
Assumption 2: UK based company "Z" purchased products from a US supplier for
$10m on credit that is payable after 6 months time.
In this scenario, the company "Z" has payables, and to hedge it they should invest an
equivalent asset in US currency unit to match the $10m in 6 months time. To create the asset,
they should borrow a loan from home money market.

6
Step 1: Investing asset to match $10m in 6 months time ($ deposit interest = % 8 annual)
x=? $10m
Now 6 months from today
x * (1+ 0.08/2) = $10m (6 months interest = annual / 2)
x = $9.6154m
(If the firm invests this amount today, after half year it will be $10m)
Step 2: Convert it to the home currency to calculate how much the firm needs
$9.6154m / 1.60 = £6.01m (The firm needs to buy $, therefore 1.60 is used)
(If the firm borrow this amount today, to invest it in $ money market)
Step 3: The firm pays interest for the loan in 6 months time
£6.01m * (1+ 0.14/2) = £6.4307m (net cost in 6 months time)
In both scenarios above, the company "Z" will lock the current spot rate, and will now
what exact amount they will get or pay after 6 months time. It means that the transaction risk is
eliminated.
3. Forward Market Hedging Techniques
Meanwhile, the company has another option to hedge the transaction risk. It can be done
through forward markets. Basically, here, the firm buys a forward contract that gives a right to
buy written foreign currency in a written future time with written fixed rates. But generally
forward rates are lower than spot ones.
3.1. How it works?
Within the same assumption made above, the company should do the forward market
hedging as well, to compare and choice the best hedging option.
Assumption 1: (same above)
$10m / 1.56 = £6.41m
(In 6 months time, the firm will get $10m, then they will sell it to get sterling)
Assumption 2: (same above)
$10m / 1.54 = £6.49m
(In 6 months time, the firm should pay $10m, so that they should buy $)

7
4. Comparison & Conclusion
In 6 month time Money Market Forward Market
Assumption 1: Receivable £6.31m £6.41m
Assumption 2: Payable £6.4307m £6.49m
If the forward contract prices are ignored, in assumption 1, the firm should choice the
highest receivable. But in assumption 2, the firm should choice lowest payable.
8
Q4. Criticism of Thatcher's Privatization Policy
British commanding heights privatization movement started in 1981, under the Thatcher
government. The most of the common public monopoly utilities such as rail and airways, gas and
oil, water, coal, telecommunications, electricity and energy which were under state control, are
sold off and privatized. The main objectives of this process were increase the incentive,
efficiency, and competitive power of the companies. All these utilities were 25-30 times
oversubscribed when they offered to the public sector, which mean they were under valuated.
1. Earnings Based Valuation
At that time main concern was accurate valuation of these monopoly state-owned
companies. Because, from the viewpoint of the earnings based valuation method, it was difficult
to find suitable PE ratio which would best represent these companies, because they were
monopoly utilities in the market. Also the adjustment of PE ratio that would be applied due to
restriction of shares and structural differences, was based on the assumptions and estimations.
Moreover, it was the first valuation process of the state-owned utilities without past experience
of such a comparable event in UK market. Another assumption is can be addressed to the
earnings (PAT). The state-owned companies don’t pay tax. So that, their PBIT is always equal to
PAT. With consideration of the taxpaying companies, here there PAT of the state holding
companies should be diluted. Furthermore, as it is known that the state holding companies are
not incentive because lack of competition, and it means the capital is not employed efficiently.
Even, maximizing the share value was not the main objective of these companies. Their
objectives were contribute to the treasury, survive and meet the public needs. Therefore, the PAT
of state-owned companies are generally under their potential capacity. These all difficulties led
the Thatcher government to undervalue the state-owned utility equities.
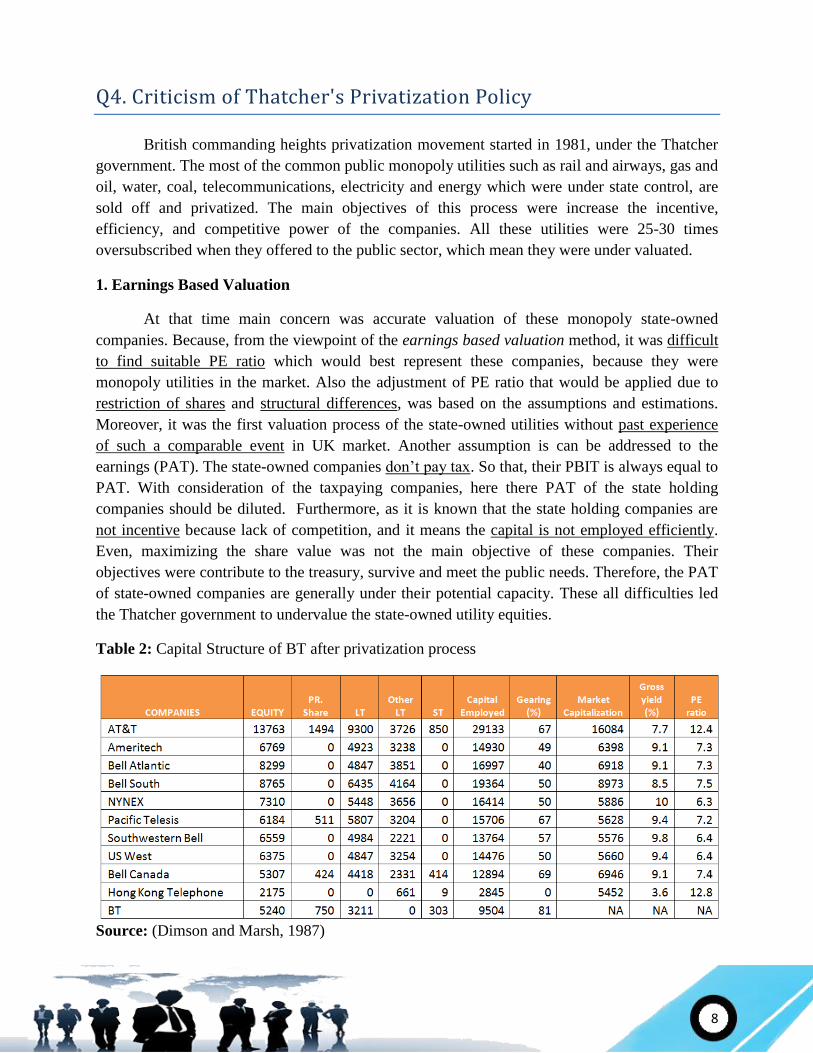
Table 2: Capital Structure of BT after privatization process
Source: (Dimson and Marsh, 1987)
9
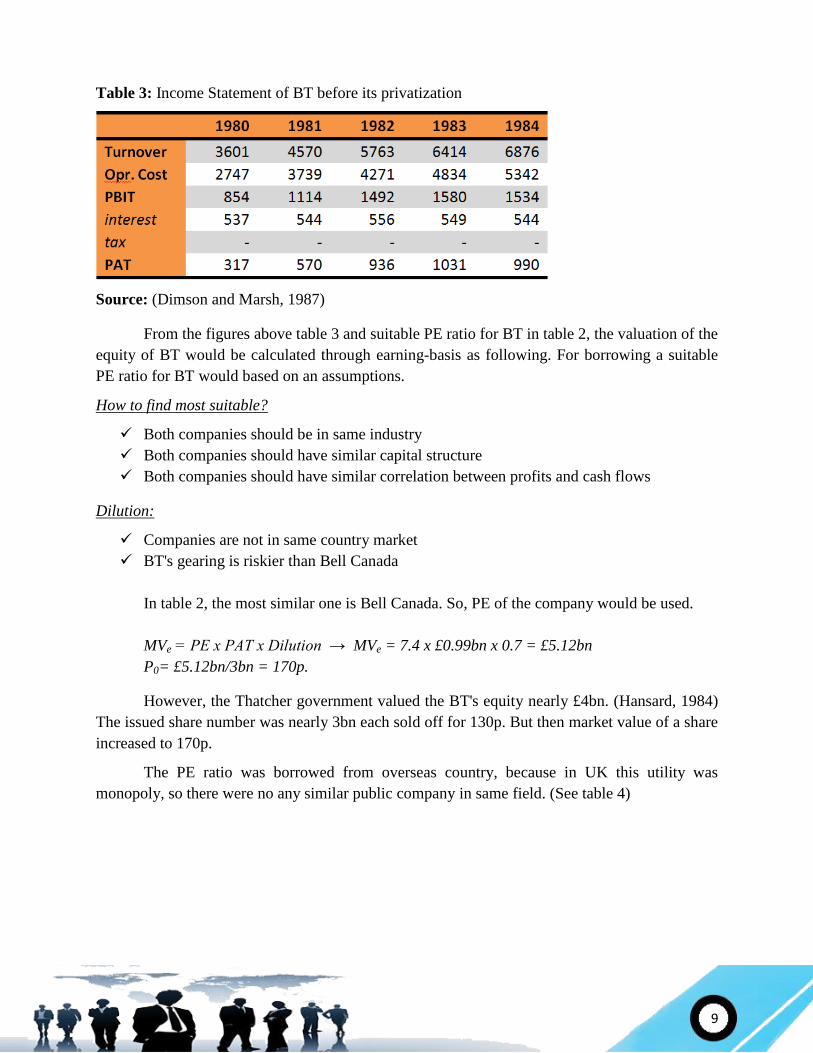
Table 3: Income Statement of BT before its privatization
Source: (Dimson and Marsh, 1987)
From the figures above table 3 and suitable PE ratio for BT in table 2, the valuation of the
equity of BT would be calculated through earning-basis as following. For borrowing a suitable
PE ratio for BT would based on an assumptions.
How to find most suitable?
Both companies should be in same industry
Both companies should have similar capital structure
Both companies should have similar correlation between profits and cash flows
Dilution:
Companies are not in same country market
BT's gearing is riskier than Bell Canada
In table 2, the most similar one is Bell Canada. So, PE of the company would be used.
MVe = PE x PAT x Dilution → MVe = 7.4 x £0.99bn x 0.7 = £5.12bn
P0= £5.12bn/3bn = 170p.
However, the Thatcher government valued the BT's equity nearly £4bn. (Hansard, 1984)
The issued share number was nearly 3bn each sold off for 130p. But then market value of a share
increased to 170p.
The PE ratio was borrowed from overseas country, because in UK this utility was
monopoly, so there were no any similar public company in same field. (See table 4)
10
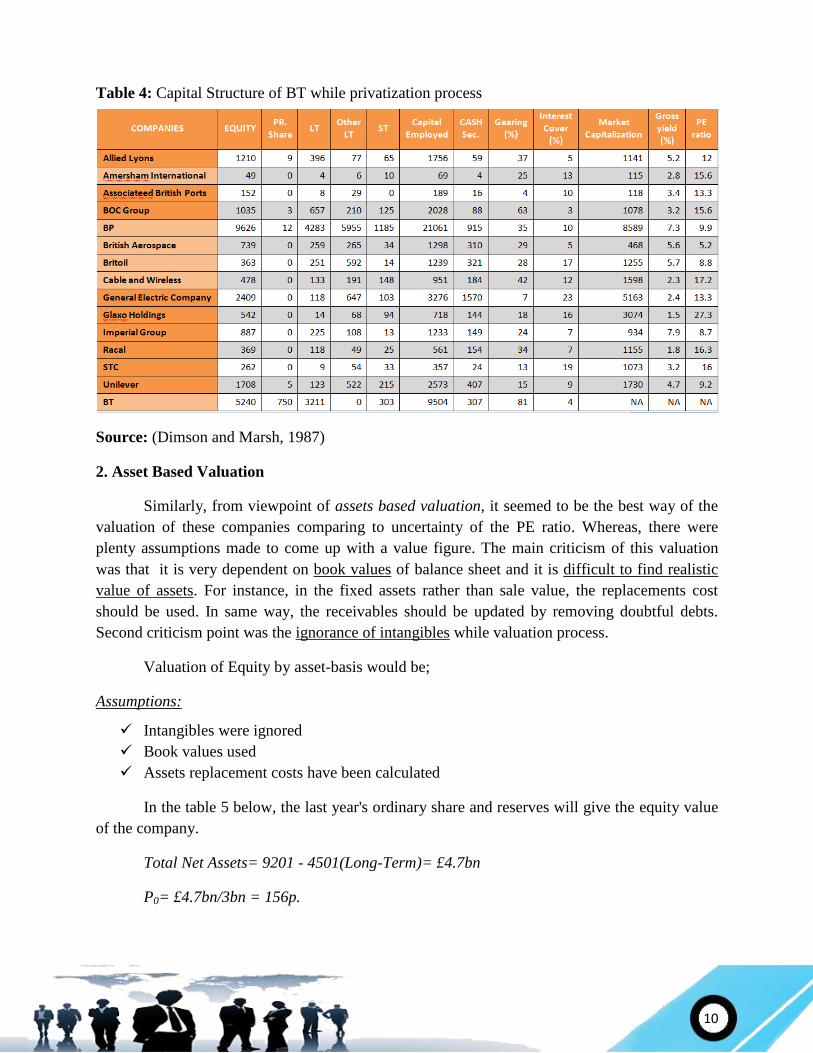
Table 4: Capital Structure of BT while privatization process
Source: (Dimson and Marsh, 1987)
2. Asset Based Valuation
Similarly, from viewpoint of assets based valuation, it seemed to be the best way of the
valuation of these companies comparing to uncertainty of the PE ratio. Whereas, there were
plenty assumptions made to come up with a value figure. The main criticism of this valuation
was that it is very dependent on book values of balance sheet and it is difficult to find realistic
value of assets. For instance, in the fixed assets rather than sale value, the replacements cost
should be used. In same way, the receivables should be updated by removing doubtful debts.
Second criticism point was the ignorance of intangibles while valuation process.
Valuation of Equity by asset-basis would be;
Assumptions:
Intangibles were ignored
Book values used
Assets replacement costs have been calculated
In the table 5 below, the last year's ordinary share and reserves will give the equity value
of the company.
Total Net Assets= 9201 - 4501(Long-Term)= £4.7bn
P0= £4.7bn/3bn = 156p.

11
Table 5: Balance Sheet of BT before its privatization
Source: (Dimson and Marsh, 1987)
3. Dividend-Cash Flow Valuation
On other hand, from viewpoint of dividend-cash flow based valuation, this method would
not give fair value, due to it is generally used to value a small percentage of equity. In state-
owned companies this method is barely possible due to no shares and dividends at all. But still
with some assumptions such as all PAT will distributed as dividend and future dividends will
grow with a percentage based on past growth figure, and estimation of Ke, valuation will be
possible.
Assumptions:
All PAT distributed as dividend
Past dividend growth (g) applied for future dividend stream
Ke is estimated (%14)
Calculation g → (table 3) 1982PAT and 1984PAT will be considered, because others are
fluctuating too much. 990 = 936 * (1+g)2 → g=% 2.84
→ P= £9.1bn → P0= £9.1bn/3bn = 303p.
Because of irrelevant assumptions, the result calculated to high rather than other methods.
Due to that other two methods can be more reliabile than with one. Basically, this method won't
taken into account in comparison.
In conclusion, aftermath the calculations, it showed that the BT was under valuated,
more accurate share value at that time, should be between 156p - 170p. It means, the government
lose and shareholders gain the miscalculated profit for each share.
[WordLimit:2500 excluding cover page, abstract, reference page]

12
REFERENCE
Kopcke, R. and Rosengren, E.; (1989), Are the Distinctions between Debt and Equity
Disappearing?, Federal Reserve Bank of Boston, Vol.x, No.x, Conference Series No.33, New
Hampshire
Mulyono, P.; Suhardianto, M. and Sihotang, R.; (2009), Hedging Transaction and Economic
Exposure, Journal of Applied Finance and Accounting, vol. 1 no.2, p.231
Dimson, E. and Marsh, P.; (1987), British Telecom, London Business School, pp.202-221
Hansard (1984), British Telecom (Privatisation), HC Deb, vol.59, p.354
BP plc (2012), ADVFN, [online], Available:
<http://uk.advfn.com/p.php?pid=financials&symbol=L%5EBP.> (10 December, 2012)
Vodafone Group plc (2012), ADVFN, [online], Available:
<http://uk.advfn.com/p.php?pid=financials&symbol=L%5EVOD> (09 December, 2012)
BP plc D/E (2012), YCHARTS, [online], Available:
<http://ycharts.com/companies/BP/debt_equity_ratio> (09 December, 2012)
Vodafone plc D/E (2012), YCHARTS, [online], Available:
<http://ycharts.com/companies/VOD/debt_equity_ratio> (09 December, 2012)