Embed Size (px)
Citation preview
MD Q4Q4OMDOCOMMERCIAL / MULTIFAMILY
MORTGAGE DEBT OUTSTANDING | Q4 2016
This data is provided by MBA solely for use as a reference. No part of the survey or data may be reproduced, stored in a retrieval system, transmitted or redistributed in any form or by any means, electronic, mechanical, photocopying, recording or otherwise, without MBA’s prior written consent.
mba.org/research16480
© 2016 Mortgage Bankers Association (MBA). All rights reserved, except as explicitly granted. 1919 M Street NW, 5th Floor, Washington, DC 20036 | (202) 557-2700
This data is provided by MBA solely for use as a reference. No part of the survey or data may be reproduced, stored in a retrieval system, transmitted or redistributed in any form or by any means, electronic, mechanical, photocopying, recording or otherwise, without MBA’s prior written consent.
DisclaimerAlthough the MBA takes great care in producing this and all related data products, the MBA does not guarantee that the information is accurate, current or suitable for any particular purpose. The referenced data are provided on an “as is” basis, with no warranties of any kind whatsoever, either express or implied, including, but not limited to, any warranties of title or accuracy or any implied warranties of merchantability or fitness for a particular purpose. Use of the data is at the user’s sole risk. In no event will MBA be liable for any damages whatsoever arising out of or related to the data, including, but not limited to direct, indirect, incidental, special, consequential or punitive damages, whether under a contract, tort or any other theory of liability, even if MBA is aware of the possibility of such damages.
COMMERCIAL / MULTIFAMILY REAL ESTATE MORTGAGE DEBT OUTSTANDING Q4 2016
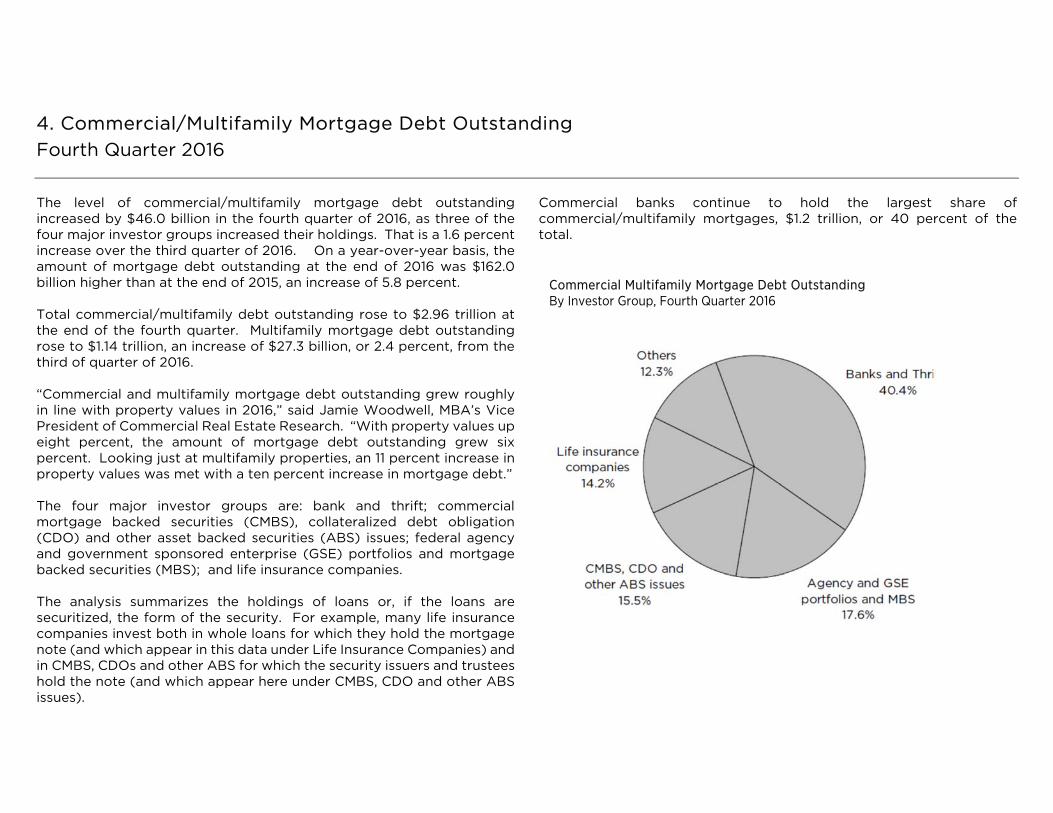
4. Commercial/Multifamily Mortgage Debt Outstanding Fourth Quarter 2016 The level of commercial/multifamily mortgage debt outstanding increased by $46.0 billion in the fourth quarter of 2016, as three of the four major investor groups increased their holdings. That is a 1.6 percent increase over the third quarter of 2016. On a year-over-year basis, the amount of mortgage debt outstanding at the end of 2016 was $162.0 billion higher than at the end of 2015, an increase of 5.8 percent. Total commercial/multifamily debt outstanding rose to $2.96 trillion at the end of the fourth quarter. Multifamily mortgage debt outstanding rose to $1.14 trillion, an increase of $27.3 billion, or 2.4 percent, from the third of quarter of 2016. “Commercial and multifamily mortgage debt outstanding grew roughly in line with property values in 2016,” said Jamie Woodwell, MBA’s Vice President of Commercial Real Estate Research. “With property values up eight percent, the amount of mortgage debt outstanding grew six percent. Looking just at multifamily properties, an 11 percent increase in property values was met with a ten percent increase in mortgage debt.” The four major investor groups are: bank and thrift; commercial mortgage backed securities (CMBS), collateralized debt obligation (CDO) and other asset backed securities (ABS) issues; federal agency and government sponsored enterprise (GSE) portfolios and mortgage backed securities (MBS); and life insurance companies. The analysis summarizes the holdings of loans or, if the loans are securitized, the form of the security. For example, many life insurance companies invest both in whole loans for which they hold the mortgage note (and which appear in this data under Life Insurance Companies) and in CMBS, CDOs and other ABS for which the security issuers and trustees hold the note (and which appear here under CMBS, CDO and other ABS issues).
Commercial banks continue to hold the largest share of commercial/multifamily mortgages, $1.2 trillion, or 40 percent of the total.
Commercial Multifamily Mortgage Debt Outstanding By Investor Group, Fourth Quarter 2016
Agency and GSE portfolios and MBS are the second largest holders of commercial/multifamily mortgages, holding $521 billion, or 18 percent of the total. CMBS, CDO and other ABS issues hold $459 billion, or 16 percent of the total, and life insurance companies hold $420 billion, or 14 percent of the total. Many life insurance companies, banks and the GSEs purchase and hold CMBS, CDO and other ABS issues. These loans appear in the “CMBS, CDO and other ABS” category. MULTIFAMILY MORTGAGE DEBT OUTSTANDING Looking solely at multifamily mortgages, agency and GSE portfolios and MBS hold the largest share, with $521 billion, or 46 percent of the total multifamily debt outstanding. They are followed by banks and thrifts with $383 billion, or 34 percent of the total. State and local government hold $92 billion, or 8 percent of the total; life insurance companies hold $66 billion, or 6 percent of the total; CMBS, CDO and other ABS issues hold $47 billion, or 4 percent of the total, and nonfarm noncorporate business holds $13 billion, or one percent of the total. CHANGES IN COMMERCIAL/MULTIFAMILY MORTGAGE DEBT OUTSTANDING In the fourth quarter of 2016, banks and thrifts saw the largest increase in dollar terms in their holdings of commercial/multifamily mortgage debt – an increase of $26.8 billion, or 2.3 percent. Agency and GSE portfolios and MBS increased their holdings by $21.3 billion, or 4.3 percent, and life insurance companies increased their holdings by $6.5 billion, or 1.6 percent. CMBS, CDO and other ABS issues saw the largest decrease at $8.4 billion, or down 1.8 percent. In percentage terms, other insurance companies saw the largest increase in their holdings of commercial/multifamily mortgages, an increase of 6.5 percent. REITs saw their holdings decrease 4.8 percent. CHANGES IN MULTIFAMILY MORTGAGE DEBT OUTSTANDING The $27.3 billion increase in multifamily mortgage debt outstanding between the third and fourth quarters of 2016 represents a 2.4 percent increase. In dollar terms, agency and GSE portfolios and MBS saw the largest increase in their holdings of multifamily mortgage debt, an increase of $21.3 billion, or 4.3 percent. Commercial banks increased their holdings of multifamily mortgage debt by $8.5 billion, or 2.3 percent. Life
insurance companies increased by $953 million, or 1.5 percent. CMBS, CDO and other ABS issues saw the largest decline in their holdings of multifamily mortgage debt, by $4.1 billion, or down 8.0 percent. In percentage terms, REITs recorded the largest increase in holdings of multifamily mortgages, at 5.2 percent. CMBS, CDO and other ABS issues saw the biggest decrease at 8.0 percent. CHANGES IN COMMERCIAL/MULTIFAMILY MORTGAGE DEBT OUTSTANDING DURING 2016 Between December 2015 and December 2016, commercial banks and thrifts saw the largest increase in dollar terms in their holdings of commercial/multifamily mortgage debt - an increase of $115 billion, or 11 percent. CMBS, CDO and other ABS issues decreased their holdings of commercial/multifamily mortgages by $56.5 billion, or 11 percent. In percentage terms, other insurance companies saw the largest increase in their holdings of commercial/multifamily mortgages, an increase of 28 percent. State and local government retirement funds saw the largest decrease, at 30 percent. CHANGES IN MULTIFAMILY MORTGAGE DEBT OUTSTANDING DURING 2016 The $99.6 billion increase in multifamily mortgage debt outstanding during 2016 represents a 9.6 percent increase. In dollar terms, Agency and GSE portfolios and MBS saw the largest increase in their holdings of multifamily mortgage debt - an increase of $67.6 billion, or 15 percent. CMBS, CDO and other ABS issues saw a decrease of $14.7 billion in their holdings, or 24 percent. In percentage terms, REITs recorded the largest increase in their holdings of multifamily mortgages, 19 percent, while state and local government retirement funds saw the largest decrease, 34 percent. MBA’s complete Commercial/Multifamily Mortgage Debt Outstanding report can be downloaded here. MBA’s analysis is based on data from the Federal Reserve Board’s Financial Accounts of the United States, the Federal Deposit Insurance Corporation’s Quarterly Banking Profile and
data from Wells Fargo Securities. More information on this data series is contained in Appendix A.
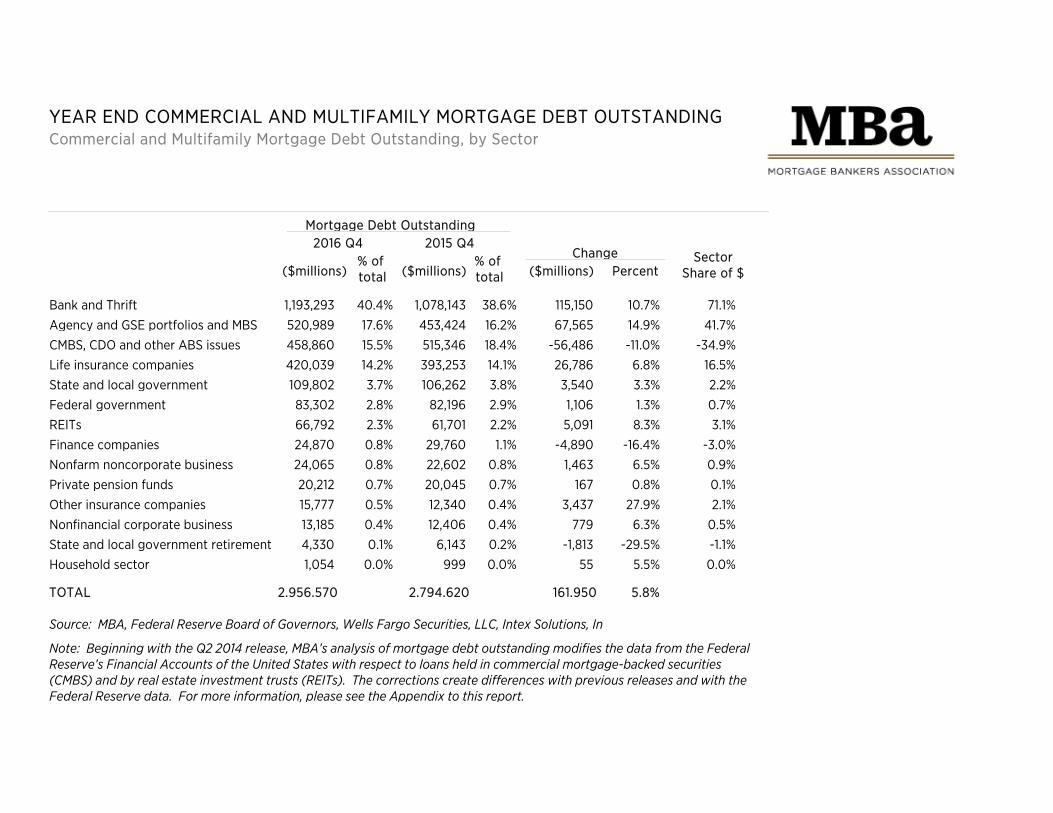
YEAR END COMMERCIAL AND MULTIFAMILY MORTGAGE DEBT OUTSTANDINGCommercial and Multifamily Mortgage Debt Outstanding, by Sector
Mortgage Debt Outstanding2016 Q4
($millions) Percent
2015 Q4Change
($millions)% of total ($millions)
% of total
Sector Share of $
Bank and Thrift 1,193,293 1,078,143 115,150 10.7%40.4% 38.6% 71.1%
Agency and GSE portfolios and MBS 520,989 453,424 67,565 14.9%17.6% 16.2% 41.7%CMBS, CDO and other ABS issues 458,860 515,346 -56,486 -11.0%15.5% 18.4% -34.9%Life insurance companies 420,039 393,253 26,786 6.8%14.2% 14.1% 16.5%State and local government 109,802 106,262 3,540 3.3%3.7% 3.8% 2.2%Federal government 83,302 82,196 1,106 1.3%2.8% 2.9% 0.7%REITs 66,792 61,701 5,091 8.3%2.3% 2.2% 3.1%Finance companies 24,870 29,760 -4,890 -16.4%0.8% 1.1% -3.0%Nonfarm noncorporate business 24,065 22,602 1,463 6.5%0.8% 0.8% 0.9%Private pension funds 20,212 20,045 167 0.8%0.7% 0.7% 0.1%
Other insurance companies 15,777 12,340 3,437 27.9%0.5% 0.4% 2.1%Nonfinancial corporate business 13,185 12,406 779 6.3%0.4% 0.4% 0.5%State and local government retirement 4,330 6,143 -1,813 -29.5%0.1% 0.2% -1.1%Household sector 1,054 999 55 5.5%0.0% 0.0% 0.0%
2,956,570 2,794,620TOTAL 161,950 5.8%
Source: MBA, Federal Reserve Board of Governors, Wells Fargo Securities, LLC, Intex Solutions, In
Note: Beginning with the Q2 2014 release, MBA’s analysis of mortgage debt outstanding modifies the data from the Federal Reserve’s Financial Accounts of the United States with respect to loans held in commercial mortgage-backed securities (CMBS) and by real estate investment trusts (REITs). The corrections create differences with previous releases and with the Federal Reserve data. For more information, please see the Appendix to this report.
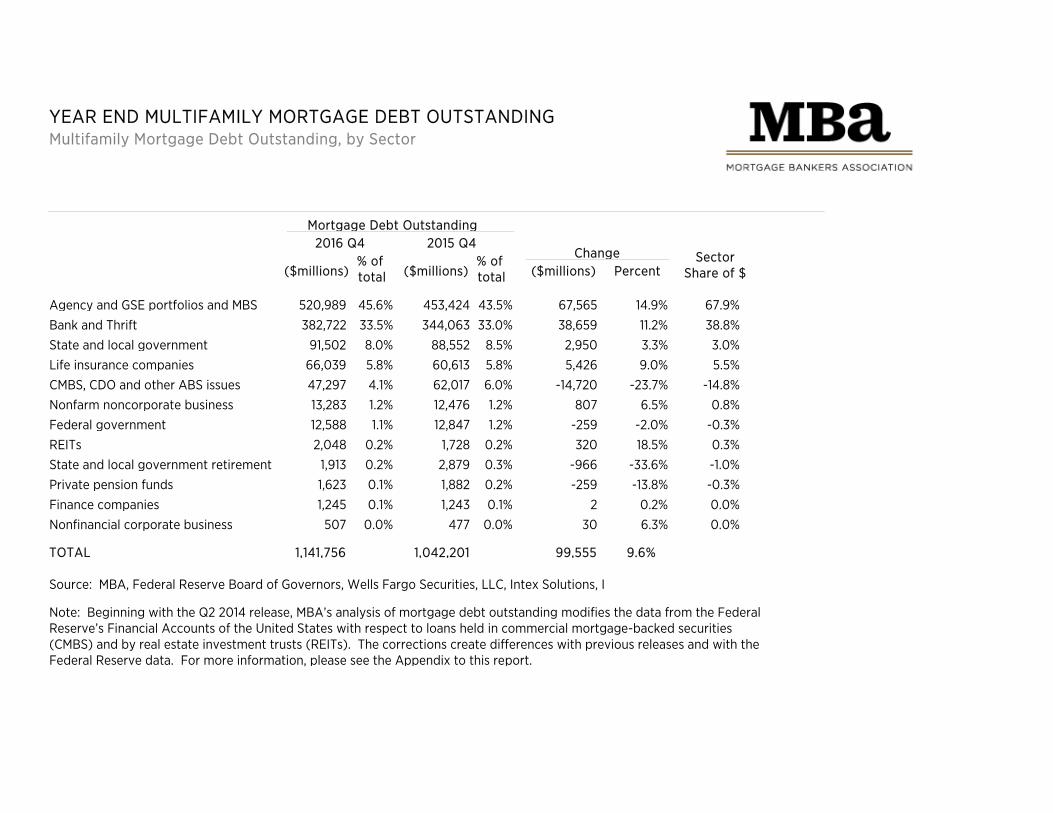
YEAR END MULTIFAMILY MORTGAGE DEBT OUTSTANDINGMultifamily Mortgage Debt Outstanding, by Sector
Mortgage Debt Outstanding2016 Q4
($millions) Percent
2015 Q4Change
($millions)% of total ($millions)
% of total
Sector Share of $
Agency and GSE portfolios and MBS 520,989 453,424 67,565 14.9%45.6% 43.5% 67.9%
Bank and Thrift 382,722 344,063 38,659 11.2%33.5% 33.0% 38.8%State and local government 91,502 88,552 2,950 3.3%8.0% 8.5% 3.0%Life insurance companies 66,039 60,613 5,426 9.0%5.8% 5.8% 5.5%CMBS, CDO and other ABS issues 47,297 62,017 -14,720 -23.7%4.1% 6.0% -14.8%Nonfarm noncorporate business 13,283 12,476 807 6.5%1.2% 1.2% 0.8%Federal government 12,588 12,847 -259 -2.0%1.1% 1.2% -0.3%REITs 2,048 1,728 320 18.5%0.2% 0.2% 0.3%State and local government retirement 1,913 2,879 -966 -33.6%0.2% 0.3% -1.0%Private pension funds 1,623 1,882 -259 -13.8%0.1% 0.2% -0.3%
Finance companies 1,245 1,243 2 0.2%0.1% 0.1% 0.0%Nonfinancial corporate business 507 477 30 6.3%0.0% 0.0% 0.0%
1,141,756 1,042,201TOTAL 99,555 9.6%
Source: MBA, Federal Reserve Board of Governors, Wells Fargo Securities, LLC, Intex Solutions, I
Note: Beginning with the Q2 2014 release, MBA’s analysis of mortgage debt outstanding modifies the data from the Federal Reserve’s Financial Accounts of the United States with respect to loans held in commercial mortgage-backed securities (CMBS) and by real estate investment trusts (REITs). The corrections create differences with previous releases and with the Federal Reserve data. For more information, please see the Appendix to this report.
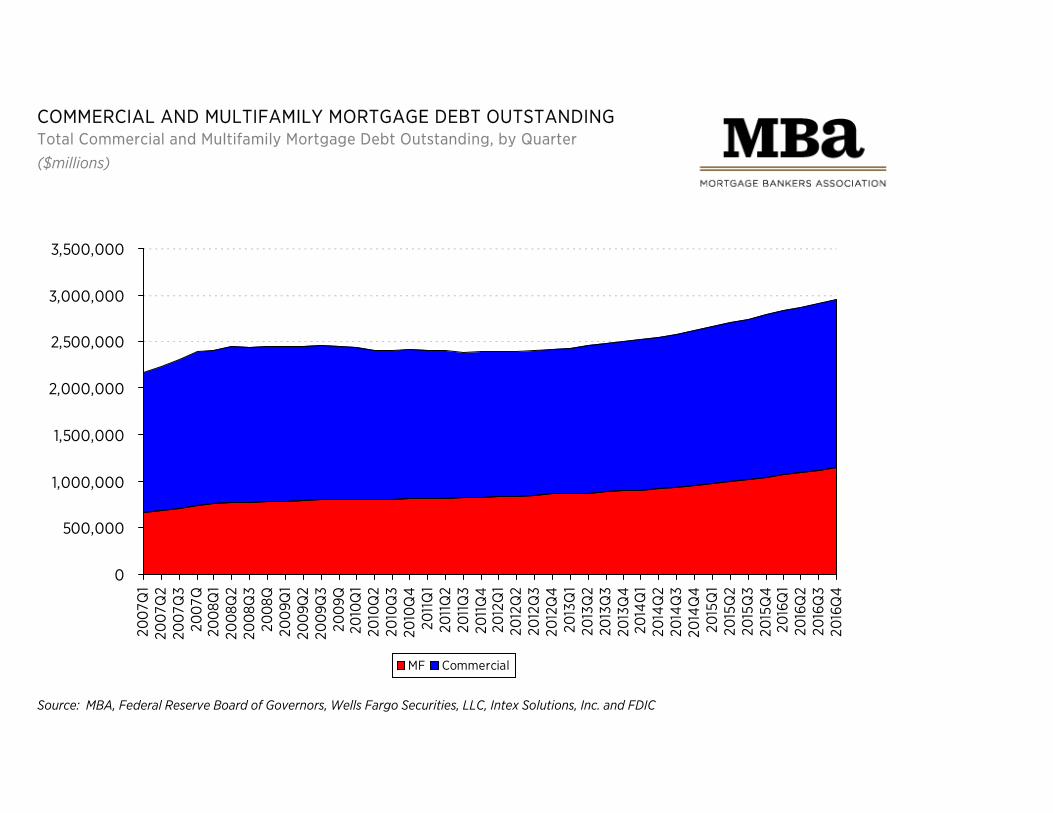
COMMERCIAL AND MULTIFAMILY MORTGAGE DEBT OUTSTANDINGTotal Commercial and Multifamily Mortgage Debt Outstanding, by Quarter($millions)
0
500,000
1,000,000
1,500,000
2,000,000
2,500,000
3,000,000
3,500,000
200
7Q1
2007
Q2
2007
Q3
2007
Q20
08Q
120
08Q
220
08Q
320
08Q
200
9Q1
2009
Q2
2009
Q3
2009
Q20
10Q
120
10Q
220
10Q
320
10Q
420
11Q
120
11Q
220
11Q
320
11Q
420
12Q
120
12Q
220
12Q
320
12Q
420
13Q
120
13Q
220
13Q
320
13Q
420
14Q
120
14Q
220
14Q
320
14Q
420
15Q
120
15Q
220
15Q
320
15Q
420
16Q
120
16Q
220
16Q
320
16Q
4
MF Commercial
Source: MBA, Federal Reserve Board of Governors, Wells Fargo Securities, LLC, Intex Solutions, Inc. and FDIC
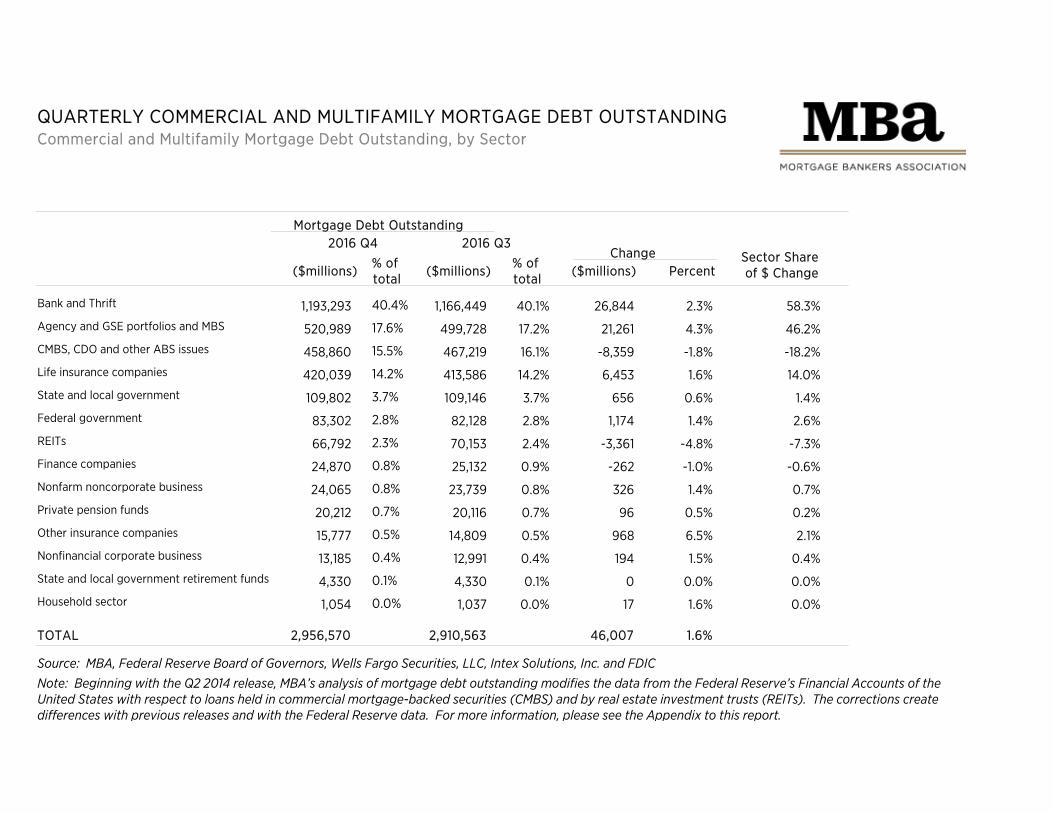
QUARTERLY COMMERCIAL AND MULTIFAMILY MORTGAGE DEBT OUTSTANDINGCommercial and Multifamily Mortgage Debt Outstanding, by Sector
Mortgage Debt Outstanding2016 Q4
($millions) Percent
2016 Q3Change
($millions) % of total ($millions) % of
total
Sector Share of $ Change
Bank and Thrift 1,193,293 1,166,449 26,844 2.3%40.4% 40.1% 58.3%Agency and GSE portfolios and MBS 520,989 499,728 21,261 4.3%17.6% 17.2% 46.2%CMBS, CDO and other ABS issues 458,860 467,219 -8,359 -1.8%15.5% 16.1% -18.2%Life insurance companies 420,039 413,586 6,453 1.6%14.2% 14.2% 14.0%State and local government 109,802 109,146 656 0.6%3.7% 3.7% 1.4%Federal government 83,302 82,128 1,174 1.4%2.8% 2.8% 2.6%REITs 66,792 70,153 -3,361 -4.8%2.3% 2.4% -7.3%Finance companies 24,870 25,132 -262 -1.0%0.8% 0.9% -0.6%Nonfarm noncorporate business 24,065 23,739 326 1.4%0.8% 0.8% 0.7%Private pension funds 20,212 20,116 96 0.5%0.7% 0.7% 0.2%Other insurance companies 15,777 14,809 968 6.5%0.5% 0.5% 2.1%Nonfinancial corporate business 13,185 12,991 194 1.5%0.4% 0.4% 0.4%State and local government retirement funds 4,330 4,330 0 0.0%0.1% 0.1% 0.0%Household sector 1,054 1,037 17 1.6%0.0% 0.0% 0.0%
2,956,570 2,910,563TOTAL 46,007 1.6%
Source: MBA, Federal Reserve Board of Governors, Wells Fargo Securities, LLC, Intex Solutions, Inc. and FDICNote: Beginning with the Q2 2014 release, MBA’s analysis of mortgage debt outstanding modifies the data from the Federal Reserve’s Financial Accounts of the United States with respect to loans held in commercial mortgage-backed securities (CMBS) and by real estate investment trusts (REITs). The corrections create differences with previous releases and with the Federal Reserve data. For more information, please see the Appendix to this report.
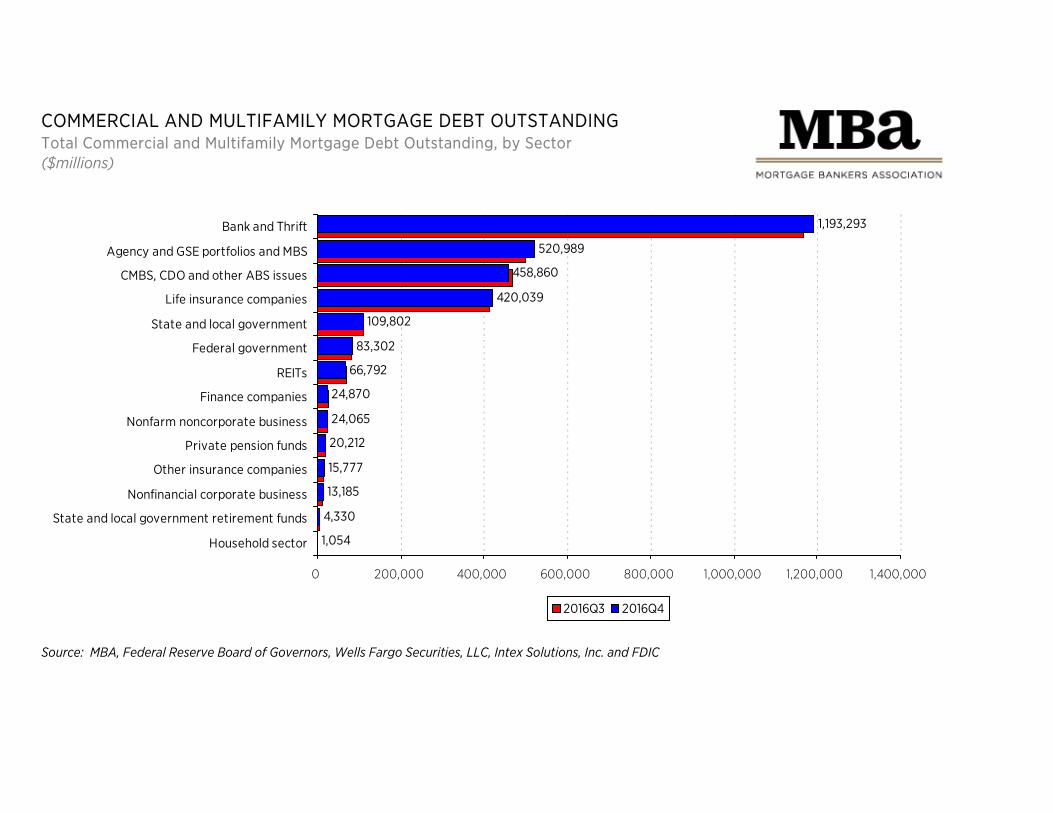
COMMERCIAL AND MULTIFAMILY MORTGAGE DEBT OUTSTANDINGTotal Commercial and Multifamily Mortgage Debt Outstanding, by Sector($millions)
Source: MBA, Federal Reserve Board of Governors, Wells Fargo Securities, LLC, Intex Solutions, Inc. and FDIC
1,054
4,330
13,185
15,777
20,212
24,065
24,870
66,792
83,302
109,802
420,039
458,860
520,989
1,193,293
0 200,000 400,000 600,000 800,000 1,000,000 1,200,000 1,400,000
Household sector
State and local government retirement funds
Nonfinancial corporate business
Other insurance companies
Private pension funds
Nonfarm noncorporate business
Finance companies
REITs
Federal government
State and local government
Life insurance companies
CMBS, CDO and other ABS issues
Agency and GSE portfolios and MBS
Bank and Thrift
2016Q3 2016Q4
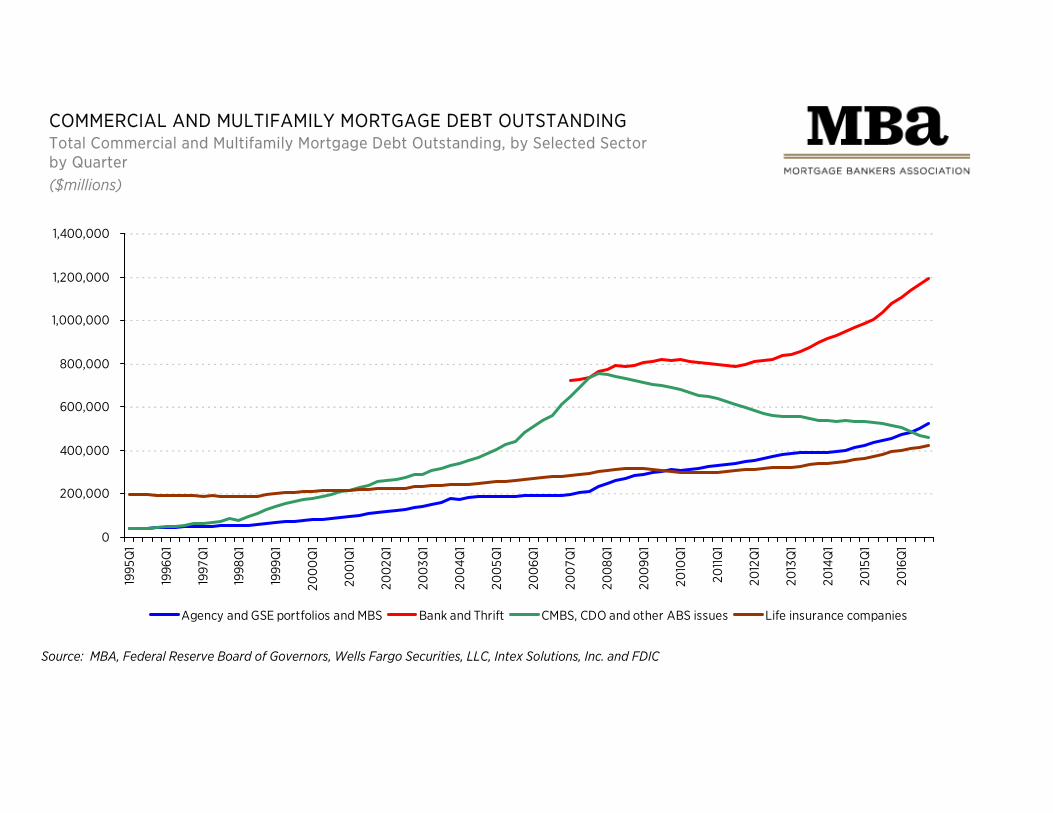
COMMERCIAL AND MULTIFAMILY MORTGAGE DEBT OUTSTANDINGTotal Commercial and Multifamily Mortgage Debt Outstanding, by Selected Sectorby Quarter($millions)
Source: MBA, Federal Reserve Board of Governors, Wells Fargo Securities, LLC, Intex Solutions, Inc. and FDIC
0
200,000
400,000
600,000
800,000
1,000,000
1,200,000
1,400,000
1995
Q1
1996
Q1
1997
Q1
1998
Q1
1999
Q1
200
0Q
1
200
1Q1
200
2Q1
200
3Q1
200
4Q1
200
5Q1
200
6Q1
200
7Q1
200
8Q1
200
9Q1
2010
Q1
2011
Q1
2012
Q1
2013
Q1
2014
Q1
2015
Q1
2016
Q1
Agency and GSE portfolios and MBS Bank and Thrift CMBS, CDO and other ABS issues Life insurance companies
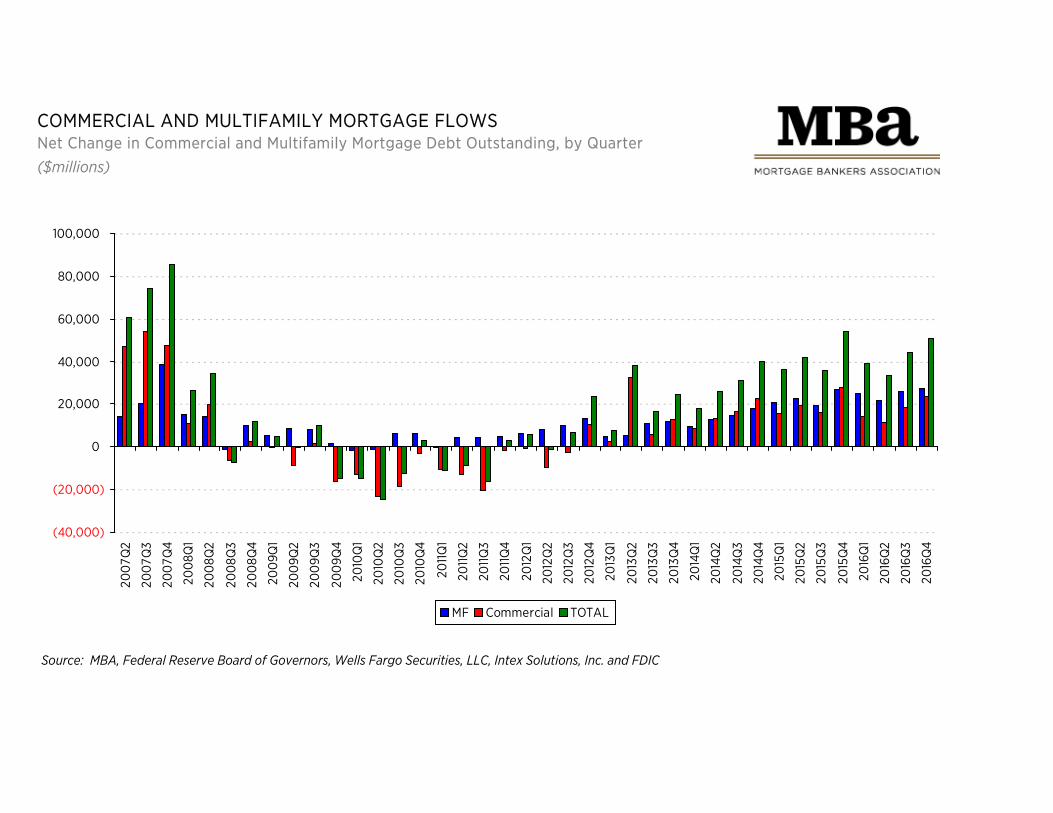
COMMERCIAL AND MULTIFAMILY MORTGAGE FLOWSNet Change in Commercial and Multifamily Mortgage Debt Outstanding, by Quarter($millions)
Source: MBA, Federal Reserve Board of Governors, Wells Fargo Securities, LLC, Intex Solutions, Inc. and FDIC
(40,000)
(20,000)
0
20,000
40,000
60,000
80,000
100,000
200
7Q2
200
7Q3
200
7Q4
200
8Q1
200
8Q2
200
8Q3
200
8Q4
200
9Q1
200
9Q2
200
9Q3
200
9Q4
2010
Q1
2010
Q2
2010
Q3
2010
Q4
2011
Q1
2011
Q2
2011
Q3
2011
Q4
2012
Q1
2012
Q2
2012
Q3
2012
Q4
2013
Q1
2013
Q2
2013
Q3
2013
Q4
2014
Q1
2014
Q2
2014
Q3
2014
Q4
2015
Q1
2015
Q2
2015
Q3
2015
Q4
2016
Q1
2016
Q2
2016
Q3
2016
Q4
MF Commercial TOTAL
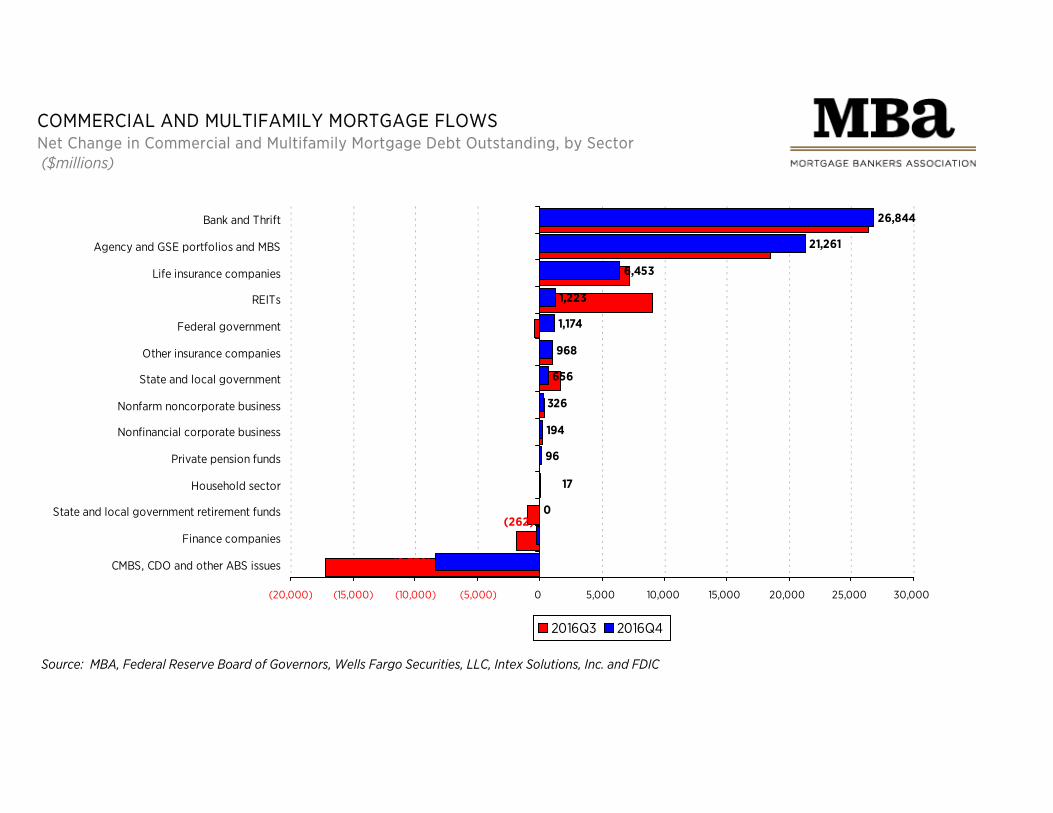
COMMERCIAL AND MULTIFAMILY MORTGAGE FLOWSNet Change in Commercial and Multifamily Mortgage Debt Outstanding, by Sector($millions)
Source: MBA, Federal Reserve Board of Governors, Wells Fargo Securities, LLC, Intex Solutions, Inc. and FDIC
(8,359)
0
96
194
326
656
968
1,174
1,223
6,453
21,261
26,844
(262)
17
(20,000) (15,000) (10,000) (5,000) 0 5,000 10,000 15,000 20,000 25,000 30,000
CMBS, CDO and other ABS issues
Finance companies
State and local government retirement funds
Household sector
Private pension funds
Nonfinancial corporate business
Nonfarm noncorporate business
State and local government
Other insurance companies
Federal government
REITs
Life insurance companies
Agency and GSE portfolios and MBS
Bank and Thrift
2016Q3 2016Q4
MULTIFAMILY MORTGAGE DEBT OUTSTANDING
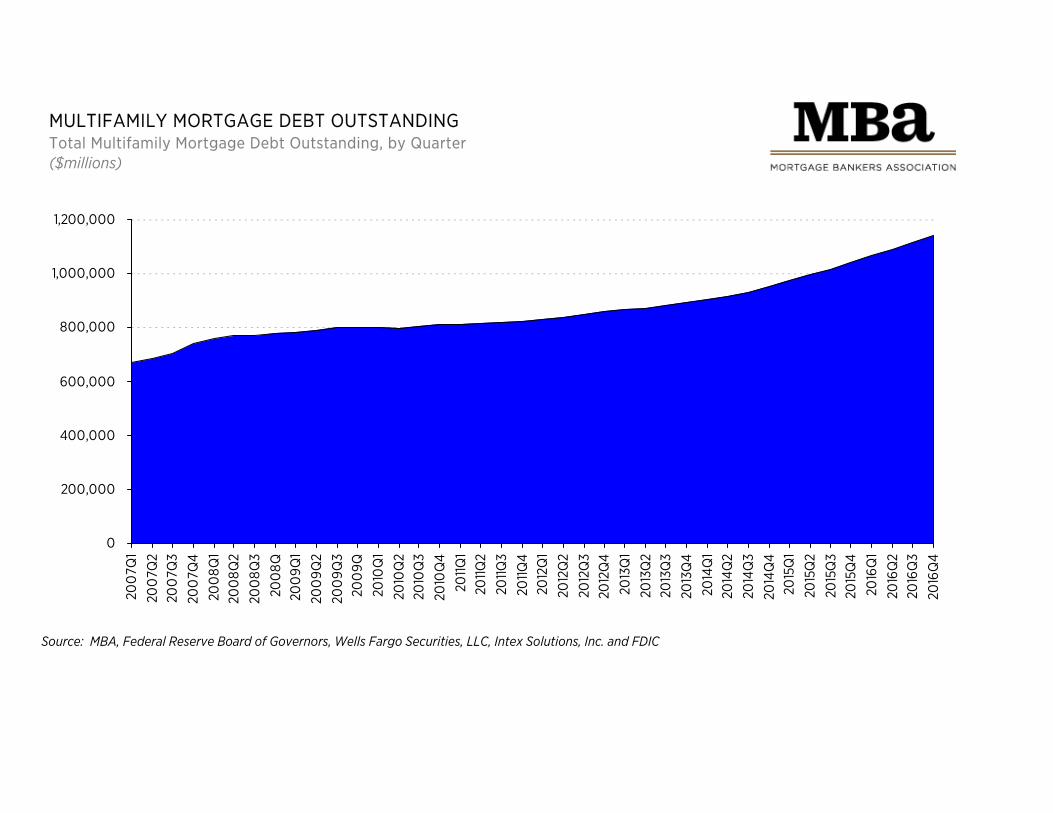
MULTIFAMILY MORTGAGE DEBT OUTSTANDINGTotal Multifamily Mortgage Debt Outstanding, by Quarter($millions)
Source: MBA, Federal Reserve Board of Governors, Wells Fargo Securities, LLC, Intex Solutions, Inc. and FDIC
0
200,000
400,000
600,000
800,000
1,000,000
1,200,000
200
7Q1
200
7Q2
200
7Q3
200
7Q4
200
8Q1
200
8Q2
200
8Q3
200
8Q20
09Q
120
09Q
220
09Q
320
09Q
2010
Q1
2010
Q2
2010
Q3
2010
Q4
2011Q
120
11Q2
2011Q
320
11Q4
2012
Q1
2012
Q2
2012
Q3
2012
Q4
2013
Q1
2013
Q2
2013
Q3
2013
Q4
2014
Q1
2014
Q2
2014
Q3
2014
Q4
2015
Q1
2015
Q2
2015
Q3
2015
Q4
2016
Q1
2016
Q2
2016
Q3
2016
Q4
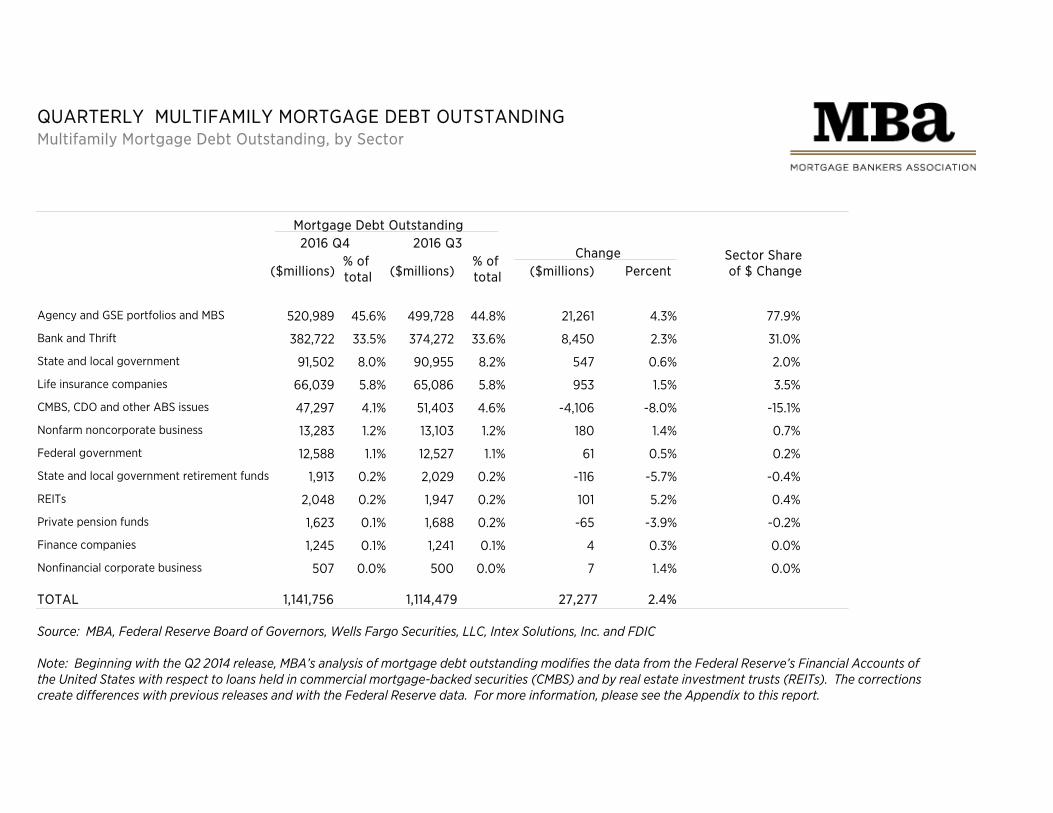
QUARTERLY MULTIFAMILY MORTGAGE DEBT OUTSTANDINGMultifamily Mortgage Debt Outstanding, by Sector
Mortgage Debt Outstanding2016 Q4
($millions) Percent
2016 Q3Change
($millions)% of total ($millions)
% of total
Sector Share of $ Change
Agency and GSE portfolios and MBS 520,989 499,728 21,261 4.3%45.6% 44.8% 77.9%
Bank and Thrift 382,722 374,272 8,450 2.3%33.5% 33.6% 31.0%
State and local government 91,502 90,955 547 0.6%8.0% 8.2% 2.0%
Life insurance companies 66,039 65,086 953 1.5%5.8% 5.8% 3.5%
CMBS, CDO and other ABS issues 47,297 51,403 -4,106 -8.0%4.1% 4.6% -15.1%
Nonfarm noncorporate business 13,283 13,103 180 1.4%1.2% 1.2% 0.7%
Federal government 12,588 12,527 61 0.5%1.1% 1.1% 0.2%
State and local government retirement funds 1,913 2,029 -116 -5.7%0.2% 0.2% -0.4%
REITs 2,048 1,947 101 5.2%0.2% 0.2% 0.4%
Private pension funds 1,623 1,688 -65 -3.9%0.1% 0.2% -0.2%
Finance companies 1,245 1,241 4 0.3%0.1% 0.1% 0.0%
Nonfinancial corporate business 507 500 7 1.4%0.0% 0.0% 0.0%
1,141,756 1,114,479TOTAL 27,277 2.4%
Source: MBA, Federal Reserve Board of Governors, Wells Fargo Securities, LLC, Intex Solutions, Inc. and FDIC
Note: Beginning with the Q2 2014 release, MBA’s analysis of mortgage debt outstanding modifies the data from the Federal Reserve’s Financial Accounts of the United States with respect to loans held in commercial mortgage-backed securities (CMBS) and by real estate investment trusts (REITs). The corrections create differences with previous releases and with the Federal Reserve data. For more information, please see the Appendix to this report.
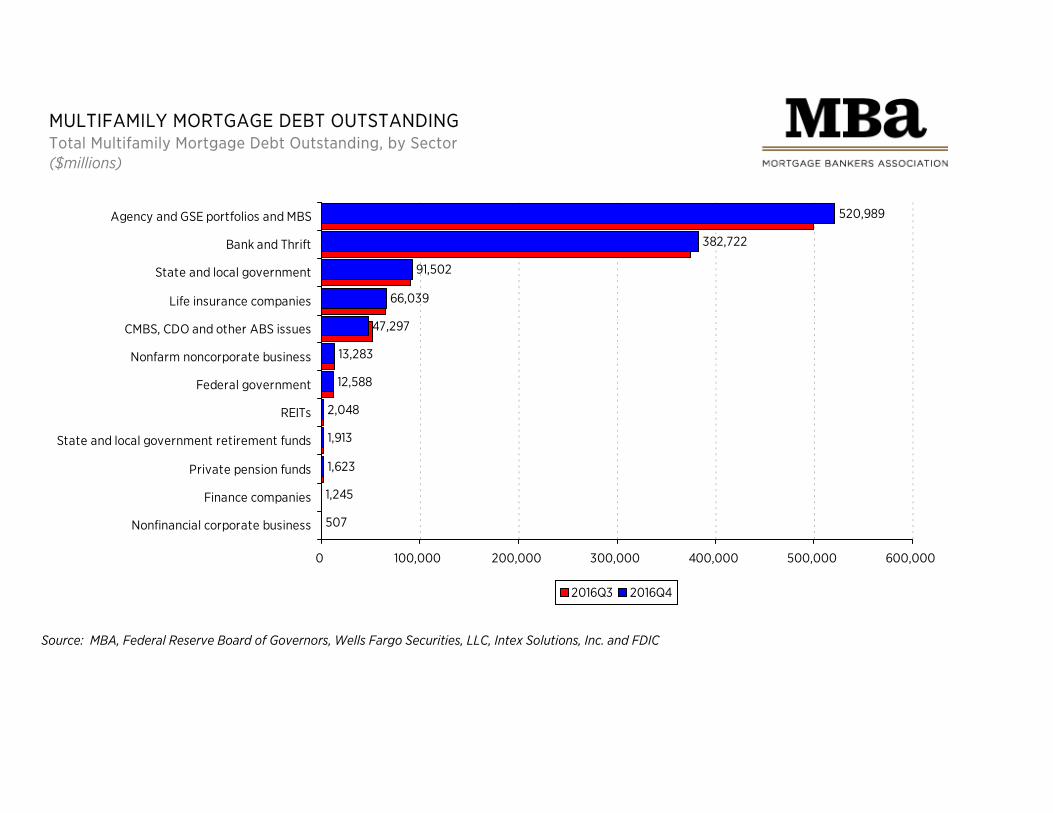
MULTIFAMILY MORTGAGE DEBT OUTSTANDINGTotal Multifamily Mortgage Debt Outstanding, by Sector($millions)
Source: MBA, Federal Reserve Board of Governors, Wells Fargo Securities, LLC, Intex Solutions, Inc. and FDIC
507
1,245
1,623
1,913
2,048
12,588
13,283
47,297
66,039
91,502
382,722
520,989
0 100,000 200,000 300,000 400,000 500,000 600,000
Nonfinancial corporate business
Finance companies
Private pension funds
State and local government retirement funds
REITs
Federal government
Nonfarm noncorporate business
CMBS, CDO and other ABS issues
Life insurance companies
State and local government
Bank and Thrift
Agency and GSE portfolios and MBS
2016Q3 2016Q4
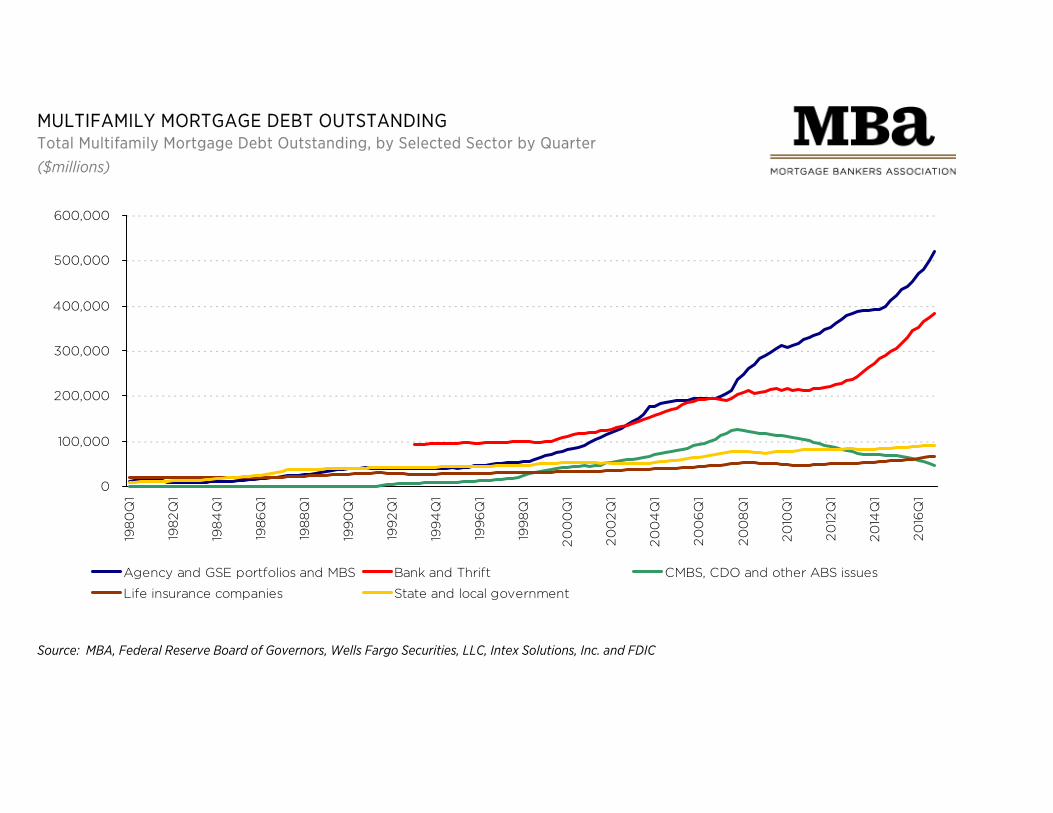
MULTIFAMILY MORTGAGE DEBT OUTSTANDINGTotal Multifamily Mortgage Debt Outstanding, by Selected Sector by Quarter($millions)
Source: MBA, Federal Reserve Board of Governors, Wells Fargo Securities, LLC, Intex Solutions, Inc. and FDIC
0
100,000
200,000
300,000
400,000
500,000
600,000
198
0Q
1
198
2Q
1
198
4Q
1
198
6Q
1
198
8Q
1
199
0Q
1
199
2Q
1
199
4Q
1
199
6Q
1
199
8Q
1
20
00
Q1
20
02
Q1
20
04
Q1
20
06
Q1
20
08
Q1
20
10Q
1
20
12Q
1
20
14Q
1
20
16Q
1
Agency and GSE portfolios and MBS Bank and Thrift CMBS, CDO and other ABS issues
Life insurance companies State and local government
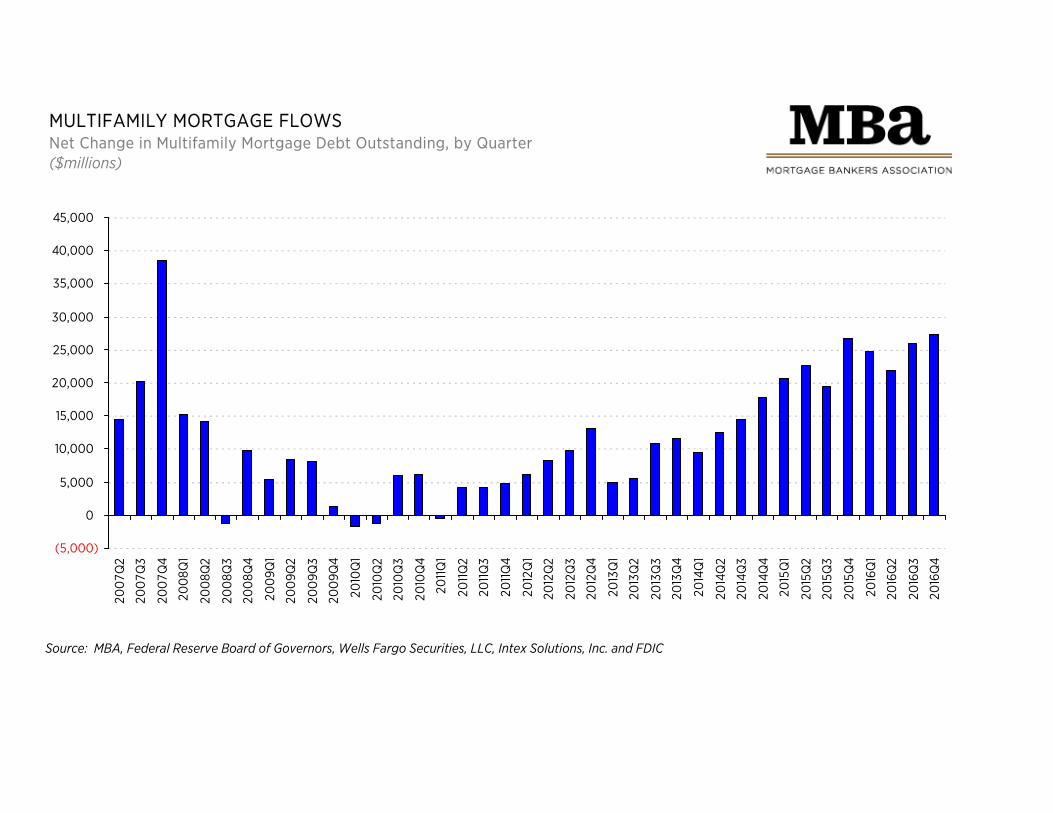
MULTIFAMILY MORTGAGE FLOWSNet Change in Multifamily Mortgage Debt Outstanding, by Quarter($millions)
Source: MBA, Federal Reserve Board of Governors, Wells Fargo Securities, LLC, Intex Solutions, Inc. and FDIC
(5,000)
0
5,000
10,000
15,000
20,000
25,000
30,000
35,000
40,000
45,000
200
7Q2
200
7Q3
200
7Q4
200
8Q1
200
8Q2
200
8Q3
200
8Q4
200
9Q1
200
9Q2
200
9Q3
200
9Q4
2010
Q1
2010
Q2
2010
Q3
2010
Q4
2011
Q1
2011
Q2
2011
Q3
2011
Q4
2012
Q1
2012
Q2
2012
Q3
2012
Q4
2013
Q1
2013
Q2
2013
Q3
2013
Q4
2014
Q1
2014
Q2
2014
Q3
2014
Q4
2015
Q1
2015
Q2
2015
Q3
2015
Q4
2016
Q1
2016
Q2
2016
Q3
2016
Q4
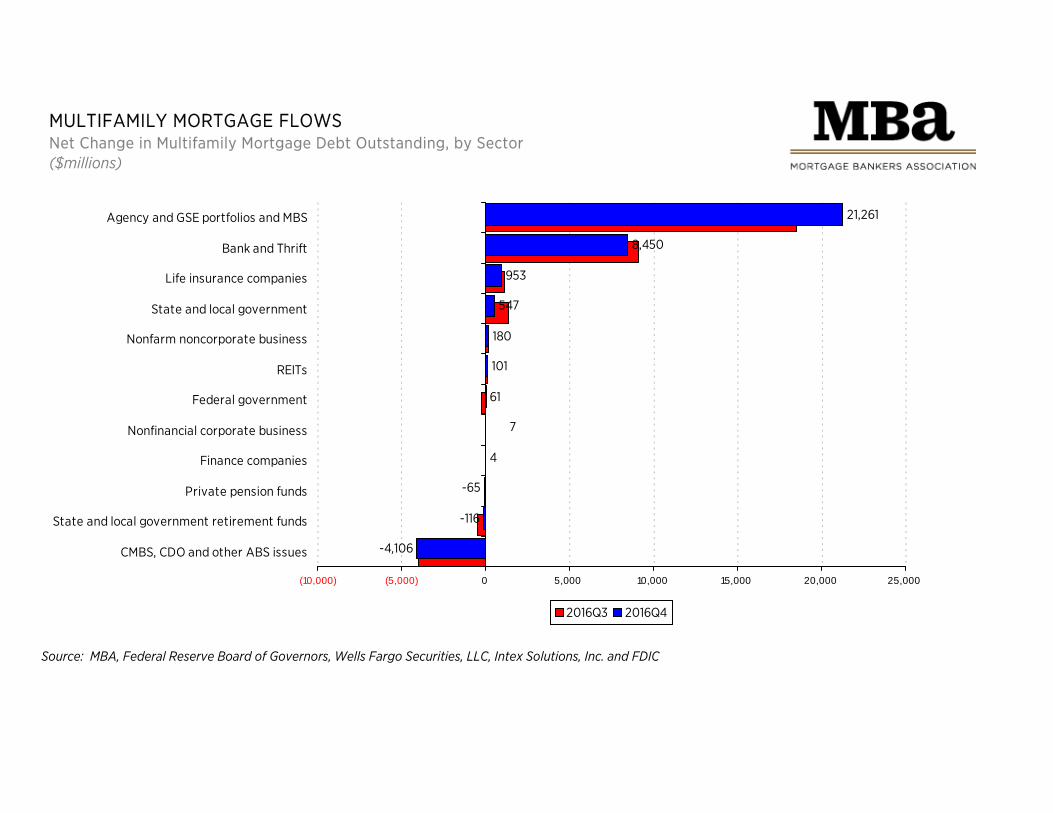
MULTIFAMILY MORTGAGE FLOWSNet Change in Multifamily Mortgage Debt Outstanding, by Sector($millions)
Source: MBA, Federal Reserve Board of Governors, Wells Fargo Securities, LLC, Intex Solutions, Inc. and FDIC
-4,106
-116
-65
4
61
101
180
547
953
8,450
21,261
7
(10,000) (5,000) 0 5,000 10,000 15,000 20,000 25,000
CMBS, CDO and other ABS issues
State and local government retirement funds
Private pension funds
Finance companies
Nonfinancial corporate business
Federal government
REITs
Nonfarm noncorporate business
State and local government
Life insurance companies
Bank and Thrift
Agency and GSE portfolios and MBS
2016Q3 2016Q4
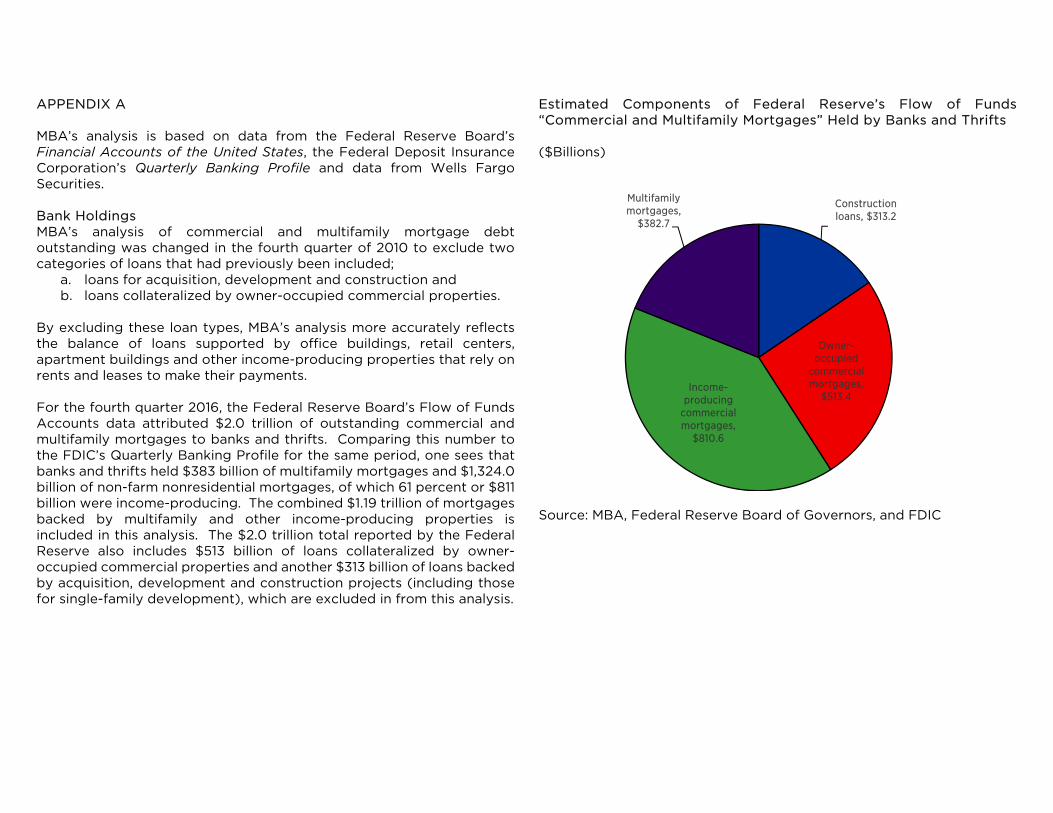
APPENDIX A MBA’s analysis is based on data from the Federal Reserve Board’s Financial Accounts of the United States, the Federal Deposit Insurance Corporation’s Quarterly Banking Profile and data from Wells Fargo Securities. Bank Holdings MBA’s analysis of commercial and multifamily mortgage debt outstanding was changed in the fourth quarter of 2010 to exclude two categories of loans that had previously been included;
a. loans for acquisition, development and construction and b. loans collateralized by owner-occupied commercial properties.
By excluding these loan types, MBA’s analysis more accurately reflects the balance of loans supported by office buildings, retail centers, apartment buildings and other income-producing properties that rely on rents and leases to make their payments. For the fourth quarter 2016, the Federal Reserve Board’s Flow of Funds Accounts data attributed $2.0 trillion of outstanding commercial and multifamily mortgages to banks and thrifts. Comparing this number to the FDIC’s Quarterly Banking Profile for the same period, one sees that banks and thrifts held $383 billion of multifamily mortgages and $1,324.0 billion of non-farm nonresidential mortgages, of which 61 percent or $811 billion were income-producing. The combined $1.19 trillion of mortgages backed by multifamily and other income-producing properties is included in this analysis. The $2.0 trillion total reported by the Federal Reserve also includes $513 billion of loans collateralized by owner-occupied commercial properties and another $313 billion of loans backed by acquisition, development and construction projects (including those for single-family development), which are excluded in from this analysis.
Estimated Components of Federal Reserve’s Flow of Funds “Commercial and Multifamily Mortgages” Held by Banks and Thrifts ($Billions)
Source: MBA, Federal Reserve Board of Governors, and FDIC
Construction loans, $313.2
Owner-occupied
commercial mortgages,
$513.4 Income-
producing commercial mortgages,
$810.6
Multifamily mortgages,
$382.7
Mortgages in CMBS and held by REITs Beginning with its Q2 2014 release, the Federal Reserve’s Financial Accounts of the United States adjusted its balance of commercial mortgages held in CMBS and by REITs to reflect the impact of FAS 167 and its implications for how entities report certain securitized mortgages on their balance sheets. The effect of this change was to inflate the balance of mortgages appearing under REITs by approximately $130 billion and to reduce the balance appearing under CMBS by the same amount. From an accounting perspective, such changes are required, but the changes lead to a significant distortion of the size of the CMBS and REIT markets. For CMBS, MBA corrects for this by relying on data from Wells Fargo Securities to size the balance of commercial and multifamily mortgages in CMBS. (The analysis continues to rely on the Financial Accounts of the United States to size multifamily balances held in CMBS, as the FAS 167 adjustments did not affect them.) For REIT balances, MBA uses Fed data to reverse the FAS 167 inclusions and thus to report the mortgages, and not securitized assets, that REITs hold. The full corrected series are available as a part of MBA’s CREF Database. Contact [email protected] for more information.
Purchase ground-breaking, comprehensive mortgage origination information.Commercial Real Estate / Multifamily Finance Database Annual Subscription Member $4,250 / nonmember $6,500
Commercial / Multifamily Annual Origination Volumes Rankings All Firms (member $250 / nonmember $350)
Commercial / Multifamily Annual Origination Volume Summation Member $150 / nonmember $250
Commercial / Multifamily Loan Maturity Volumes Member $150 / nonmember $250
To purchase these products please visit: http://store.mba.org and view under Market and Research Data.
To subscribe, order or participate, call (800) 348-8653, or visit mba.org/research