Embed Size (px)
Citation preview
1
Fault slip source models for the 2011 M7.1 Van earthquake in Turkey from SAR interferometry, pixel offset tracking, GPS and seismic waveform analysis Eric J. Fielding1, Paul R. Lundgren1, Tuncay Taymaz2, Seda Yolsal-Çevikbilen2, Susan E. Owen1 1 Jet Propulsion Laboratory, California Institute of Technology, Pasadena, California, USA 2 Department of Geophysical Engineering, The Faculty of Mines, Istanbul Technical University, Maslak-34469, Istanbul, Turkey Uncorrected final text of paper published in Seismological Research Letters, v. 84, no. 4, p. 579-593, doi: 10.1785/0220120164. http://srl.geoscienceworld.org/content/84/4/579.short © 2012. All rights reserved. Keywords: Eastern Turkey, earthquake, slip distribution, waveform modeling, SAR interferometry, GPS, pixel offset tracking In an electronic supplement, we show additional point-source mechanisms for the mainshock and aftershocks that are listed in Table 2 of the main text. The fault slip evolution of our bodywave finite-fault model is shown as snapshots and as a movie. Additional information on the source modeling is also shown in the supplement. Available online at http://www-radar.jpl.nasa.gov/CrustalDef/Van/SRL-D-12-00164-esupp.html
2
Introduction
A large Mw 7.1 earthquake struck the area north of the city of Van in easternmost
Turkey on 23 October 2011. The main shock epicenter and most of the aftershocks were
located south of the eastern arm of Lake Van (Figure 1), and extensive damage was
reported in the city of Van, the city of Erciş, and many smaller towns nearby. The Lake
Van region has suffered from a large number of historical earthquakes, with many
causing significant damage in the last 2000 years (Table 1; Albini et al., 2012,
Ambraseys and Jackson, 1998, Ergin et al., 1967). The region is near the center of the
elevated Turkish-Iranian Plateau (also called the Anatolian Plateau) in the collision zone
between the Arabian and Eurasian Plates, and is well to the east of the escape tectonics
exhibited along the major strike-slip North Anatolian and East Anatolian Faults (e.g.,
Jackson and McKenzie, 1984, Taymaz et al., 1991, Taymaz et al., 2007, Yolsal-
Çevikbilen et al., 2012). The plateau has an average elevation around 2000 m (Copley
and Jackson, 2006, Tan and Taymaz, 2006, Podgorski et al., 2007), and Lake Van has an
elevation of about 1650 m above sea level. The Moho depth in the Van area, inferred
from receiver function and surface wave analysis, is approximately 43 km, in the middle
of a Moho gradient from about 40 km in the south to 50 km under the Pontides
Mountains at the northern edge of the plateau (Gök et al., 2011, Vanacore et al., 2013).
There are many Quaternary mafic volcanoes in the area (Figure 1) that likely result from
elevated temperatures in the upper mantle and possible delamination of part of the
subducted Arabian lithosphere (Şengör et al., 2003, Maggi and Priestley, 2005, Barazangi
et al., 2006, Gök et al., 2011). The uppermost mantle has extremely low seismic
velocities (Bakırcı et al., 2012, Zor et al., 2003) and blockage of Sn propagation (Al-
3
Damegh et al., 2004, Gök et al., 2003), indicating the complete lack of a mantle lid
(Barazangi et al., 2006).
Geodetic studies with Global Positioning System (GPS) data measure the northward
motion of the Arabian plate relative to Eurasia at about 18 mm/year in eastern Turkey
(Reilinger et al., 2006). The GPS data also shows ongoing N-S compressional strain
within this area of the Turkish-Iranian Plateau. Several authors have interpreted systems
of strike-slip faults as absorbing most of this N-S contraction (Jackson and McKenzie,
1984, Taymaz et al., 1991, Koçyiğit et al., 2001, Şengör et al., 2003, Copley and
Jackson, 2006). Many of the earthquakes within the plateau that were large enough for
focal mechanism analysis showed predominantly strike-slip motion (Jackson and
McKenzie, 1988, Jackson et al., 2002, Örgülü et al., 2003, Copley and Jackson, 2006,
Tan and Taymaz, 2006), including the large Mw 7.0 Çaldıran-Muradiye earthquake of 24
November 1976 that was about 90 km to the northeast of the 2011 Van earthquake
(Figure 1; Taymaz, 1996).
In this study we compare coseismic source models for the Van earthquake derived
from surface deformation measurements and seismic waveform modeling. We analyze
geodetic data for the coseismic surface deformation from interferometric synthetic
aperture radar (InSAR) and GPS data to constrain finite fault slip models. InSAR data
include interferograms from two European Space Agency Envisat Advanced Synthetic
Aperture Radar (ASAR) descending-track pairs and one Italian Space Agency COSMO-
SkyMed (CSK) descending-track pair, along with pixel offset tracking (sub-pixel
correlation) along-track displacements from the CSK pair. Continuous GPS data posted
to the Group on Earth Observations (GEO) Geohazards Supersite by the Turkish
government were analyzed to estimate the three-component station coseismic
4
displacements. We also analyze teleseismic P- and SH-waveforms to estimate the source
parameters of a point-source that best matches the waveforms, and a finite-fault slip
distribution that is consistent with the point-source parameters. Finally we compare the
source models to each other and to seismicity and field observations.
Seismic Waveform Inversion
We performed point-source inversions using teleseismic long-period P- and SH- and
broad-band P-waveforms recorded by the International Federation of Digital
Seismograph Networks (FDSN) and the Global Digital Seismograph Network (GDSN)
stations (Taymaz, 1993, Tan and Taymaz, 2006, Taymaz et al., 2007, Yolsal-Çevikbilen
and Taymaz, 2012) in order to determine source parameters of the 2011 Van earthquake
and its aftershocks (Figure 2). We used the MT5 algorithm of the body-waveform
inversion method provided by McCaffrey et al. (1991) and Zwick et al. (1994). Velocity
responses were deconvolved from the records and then we re-convolved them with the
response of the old WWSSN 15-100 s long-period instruments. We compared the shapes
and amplitudes of long-period P- and SH- and broad-band P- waves recorded in the
distance range of 30–90 degrees. Synthetic waveforms were formed by the combination
of direct (P or SH) and reflected (pP and sP, or sS) phases from a point source embedded
in a given velocity structure. We used a half-space source velocity model consisting of P-
wave velocity (Vp) = 6.8 km/s, S-wave velocity (Vs) = 3.9 km/s and density (ρ) = 2.9
g/cm3 given by Zwick et al. (1994) and Tan and Taymaz (2006), a simplified crustal
model for teleseismic waveform modeling with the MT5 algorithm. Receiver structures
are assumed to be homogeneous half-spaces. Seismograms were weighted according to
the azimuthal distribution of stations.
5
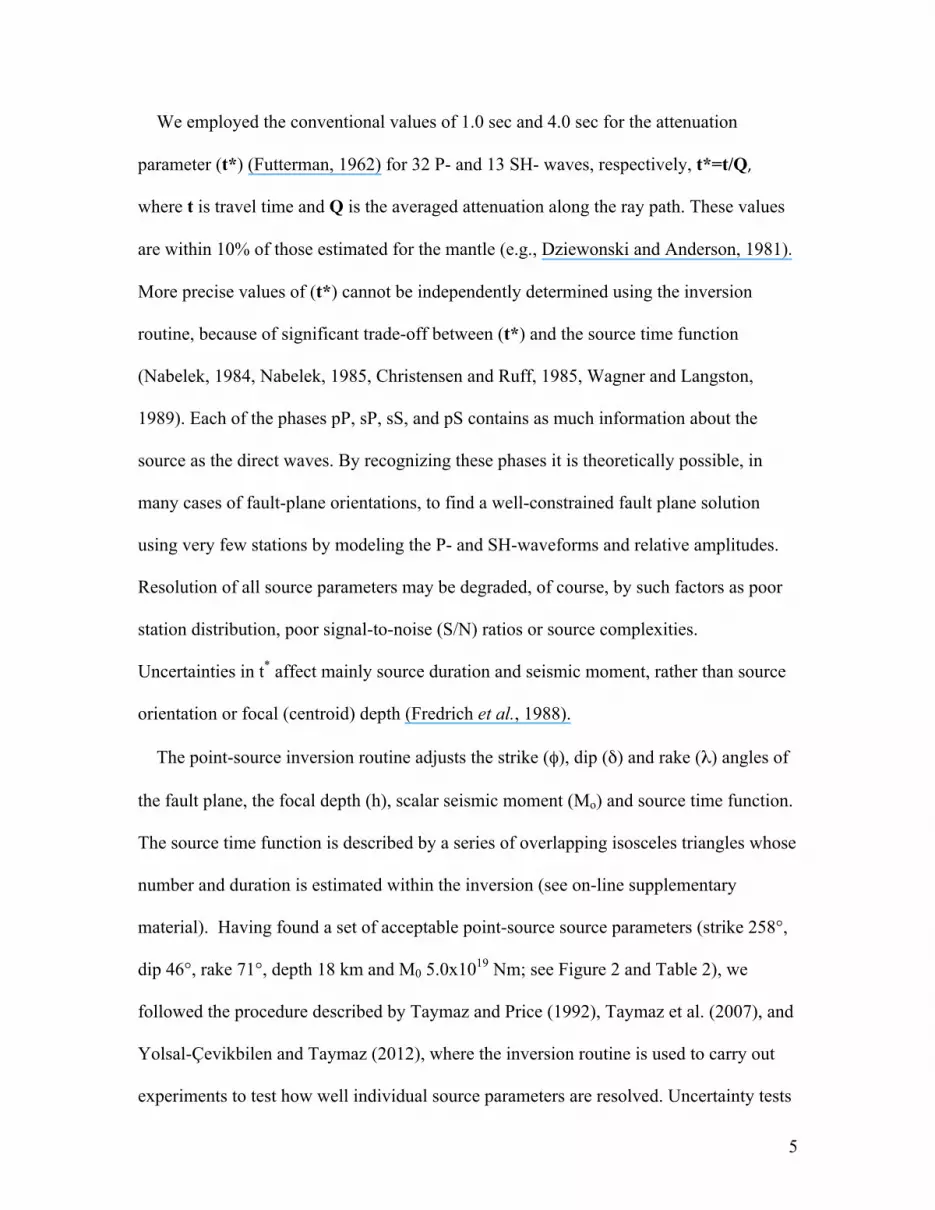
We employed the conventional values of 1.0 sec and 4.0 sec for the attenuation
parameter (t*) (Futterman, 1962) for 32 P- and 13 SH- waves, respectively, t*=t/Q,
where t is travel time and Q is the averaged attenuation along the ray path. These values
are within 10% of those estimated for the mantle (e.g., Dziewonski and Anderson, 1981).
More precise values of (t*) cannot be independently determined using the inversion
routine, because of significant trade-off between (t*) and the source time function
(Nabelek, 1984, Nabelek, 1985, Christensen and Ruff, 1985, Wagner and Langston,
1989). Each of the phases pP, sP, sS, and pS contains as much information about the
source as the direct waves. By recognizing these phases it is theoretically possible, in
many cases of fault-plane orientations, to find a well-constrained fault plane solution
using very few stations by modeling the P- and SH-waveforms and relative amplitudes.
Resolution of all source parameters may be degraded, of course, by such factors as poor
station distribution, poor signal-to-noise (S/N) ratios or source complexities.
Uncertainties in t* affect mainly source duration and seismic moment, rather than source
orientation or focal (centroid) depth (Fredrich et al., 1988).
The point-source inversion routine adjusts the strike (φ), dip (δ) and rake (λ) angles of
the fault plane, the focal depth (h), scalar seismic moment (Mo) and source time function.
The source time function is described by a series of overlapping isosceles triangles whose
number and duration is estimated within the inversion (see on-line supplementary
material). Having found a set of acceptable point-source source parameters (strike 258°,
dip 46°, rake 71°, depth 18 km and M0 5.0x10¹⁹ Nm; see Figure 2 and Table 2), we
followed the procedure described by Taymaz and Price (1992), Taymaz et al. (2007), and
Yolsal-Çevikbilen and Taymaz (2012), where the inversion routine is used to carry out
experiments to test how well individual source parameters are resolved. Uncertainty tests
6
show the robustness of the minimum misfit solutions revealing that the error limits of
strike, dip and rake angles are approximately ± 5°–10°, and of focal depths is ± 2 km. In
this case, the slip vector at the hypocenter plunges at 43o towards 14o. The detailed point-
source parameters of October 2011 Lake Van earthquake and major aftershocks (Mw ≥
5.0) obtained from teleseismic P- and SH-waveform modeling are listed in Table 2.
Our preferred best fitting waveform point-source solution (Figure 2) obtained by using
FDSN-GDSN teleseismic stations shows a reverse faulting mechanism with a small strike
slip component. The two nodal planes in this point-source solution dip steeply to the
north and south and have a small amount of oblique slip. The along-track (roughly N-S)
displacements from the CSK data (described below) show the area to the south of the
epicenter moved southward, which requires that the main rupture dips to the north, so we
take the north-dipping plane (strike 258°±5°, dip 46°±5°, rake 71°±5°) as the fault plane,
with uncertainties estimated by using the inversion routine to carry out a variety of
experiments (Taymaz et al., 2007). The centroid depth is 18±2 km [although this does not
include uncertainty related to the simplified velocity structure], and seismic moment Mo=
5.0x10¹⁹ Nm (Mw 7.07) in the preferred waveform fit using a shear modulus of 44 GPa,
given by the velocity model (see Figure 2).
An alternative point-source solution is shown in the Electronic Supplement (Figure
S1)[SUPPLEMENT] using broadband P waveforms alone. That solution has a seismic
moment of 6.88x10¹⁹ Nm (using the same velocity model), but is less reliable than our
preferred solution using the P- and SH- waveforms. In Figure S2 [SUPPLEMENT], we
show selected waveform fits for the Global Centroid Moment Tensor (GCMT), USGS
body-wave, USGS W-phase, and USGS CMT solutions compared to our preferred point
source mechanism. These waveforms were chosen near nodal planes to enhance
7
information about the mechanism, and our preferred point-source fits the waveforms
better overall. Figures S3-S7 [SUPPLEMENT] and Table 2 show point-source solutions
for three large aftershocks (Mw5.6 to Mw5.8) of the Mw7.1 Van mainshock.
For finite-fault slip distributions, we used an inversion scheme developed by Yoshida
(1992) and Yagi and Kikuchi (2000) with the Jeffreys-Bullen velocity-depth model
(Jeffreys and Bullen, 1940, 1958; in Table S1)[SUPPLEMENT] and FDSN-GDSN
teleseismic broad-band P-waveforms made available through the Data Management
Center of the Incorporated Research Institutions for Seismology (IRIS-DMC). At this
time, the slip inversion code for the Yagi and Kikuchi (2000) algorithm is less stable
when SH-waveforms are included, so we used only the P-waveforms (Yagi et al., 2012a,
Yagi et al., 2012b). Teleseismic waveforms were windowed for 60 sec, starting 10 sec
before the origin time (to). After band-pass filtering between 0.01 Hz and 0.8 Hz, they
were converted into ground displacement with a sampling rate of 0.20 sec. A numerical
method for the standard waveform inversion scheme given by Hartzell and Heaton (1983)
and Yoshida (1992) was used to construct the earthquake source model. We assumed that
faulting occurs on a single fault plane, and that rake remains unchanged during the
rupture. The rupture process was then presented as a spatio-temporal slip distribution on a
fault plane which was divided into M x N sub-faults with length dx and width dy. Then,
the source time function on each sub fault was described by a series of triangle functions
with an assumed rise time (τ=1sec). Green's functions were calculated using the method
of Kikuchi and Kanamori (1991). We also applied smoothing constraints to the slip
distribution with respect to time and space to prevent instabilities that may occur as a
result of increasing the number of model parameters in the inversions (e.g., Hartzell and
Heaton, 1983, Yoshida, 1992, Yoshida et al., 1996, Yagi and Kikuchi, 2000, Taymaz et
8
al., 2007). No constraint was placed on the total moment (see on-line supplementary
material for further details).
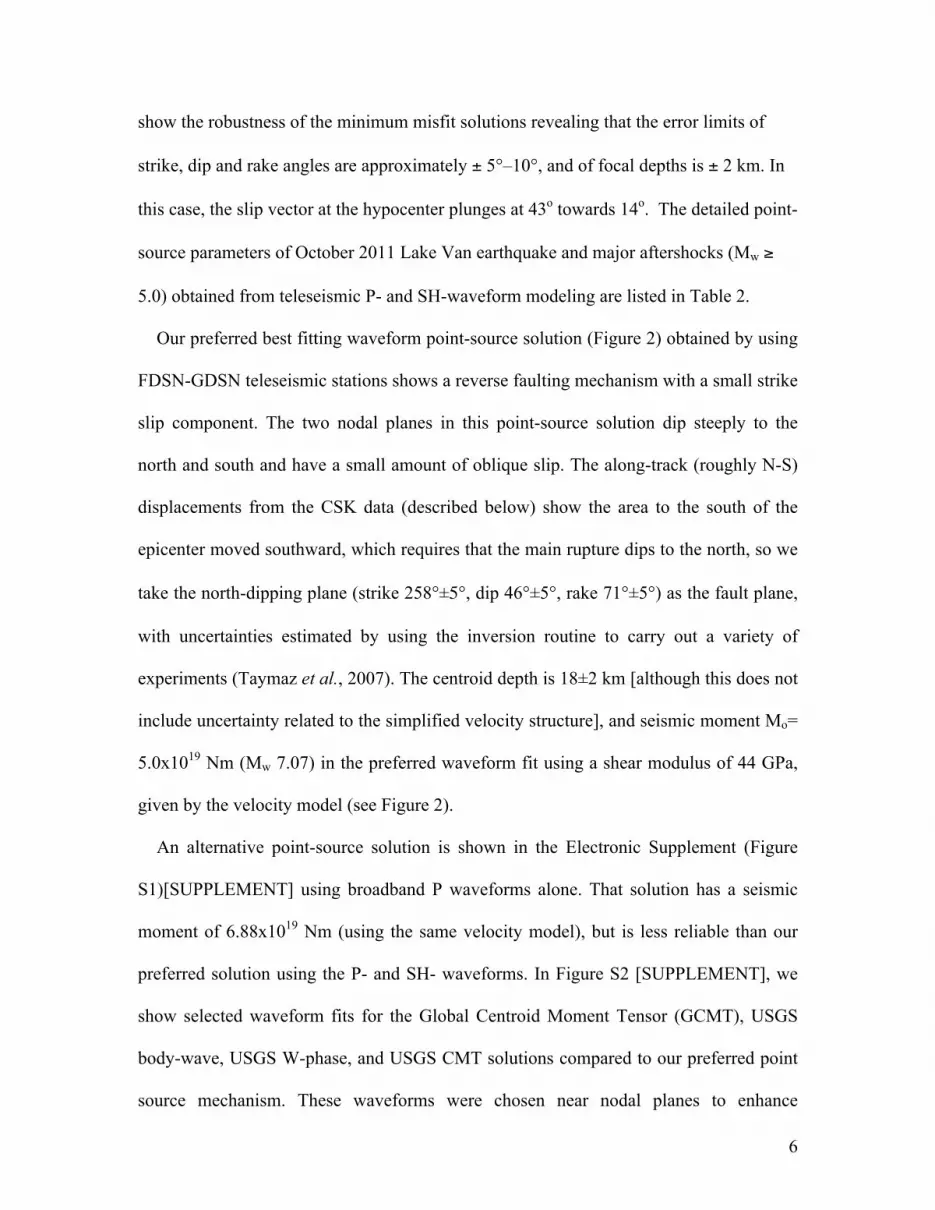
The finite-fault model from the inversion of 39 teleseismic broadband P-waveforms is
shown in Figure 3. The fault plane was fixed to the best fitting point-source solution and
was then divided into 8 × 16 sub-faults with dimensions of 5 × 5 km2. The source-time
(slip-rate) function of each sub-fault is expanded in a series of 3 overlapping triangle
functions each with a rise time (τ) of 1.0 sec. The rupture front velocity (Vr) is 3.2
km/sec. Our preferred teleseismic slip model has most of the fault slip close to the
hypocenter. As described above, the rake was constrained to be constant, and the
optimum value for the rake was estimated to be 71° based on our point source solution.
Maximum displacement was found to be ~ 3.5 m at a depth of about 20 km (Figure 3).
The slip model shows that rupture propagated along the dip direction of the fault. The
maximum slip is close to the hypocenter, as expected from the peak in the moment rate
function less than 4 seconds after the origin time of the earthquake. Our preferred finite-
fault model has a second area of strong slip to the southwest and shallower than the
hypocenter. Other areas of up to 1 m of slip far to the northwest and southwest of the
hypocenter are less well constrained. The source time function reveals that the earthquake
duration was ~ 16 sec, but the main moment release was in the first 7–8 sec. The total
moment of the finite-fault model is 5.37x10¹⁹ Nm. The effective rupture area, stress drop,
maximum slip and average slip were also estimated by using equations of Aki (1972) and
Kanamori (1994) to be ~ 900 km2, 5 MPa, 3.5 m and 1.85 m, respectively. The stress
drop was estimated with the equation below based on the assumption of a circular crack
(Aki, 1972, Kanamori, 1994):
9
2/3
2/3
167
SMo
××
=Δπ
σ
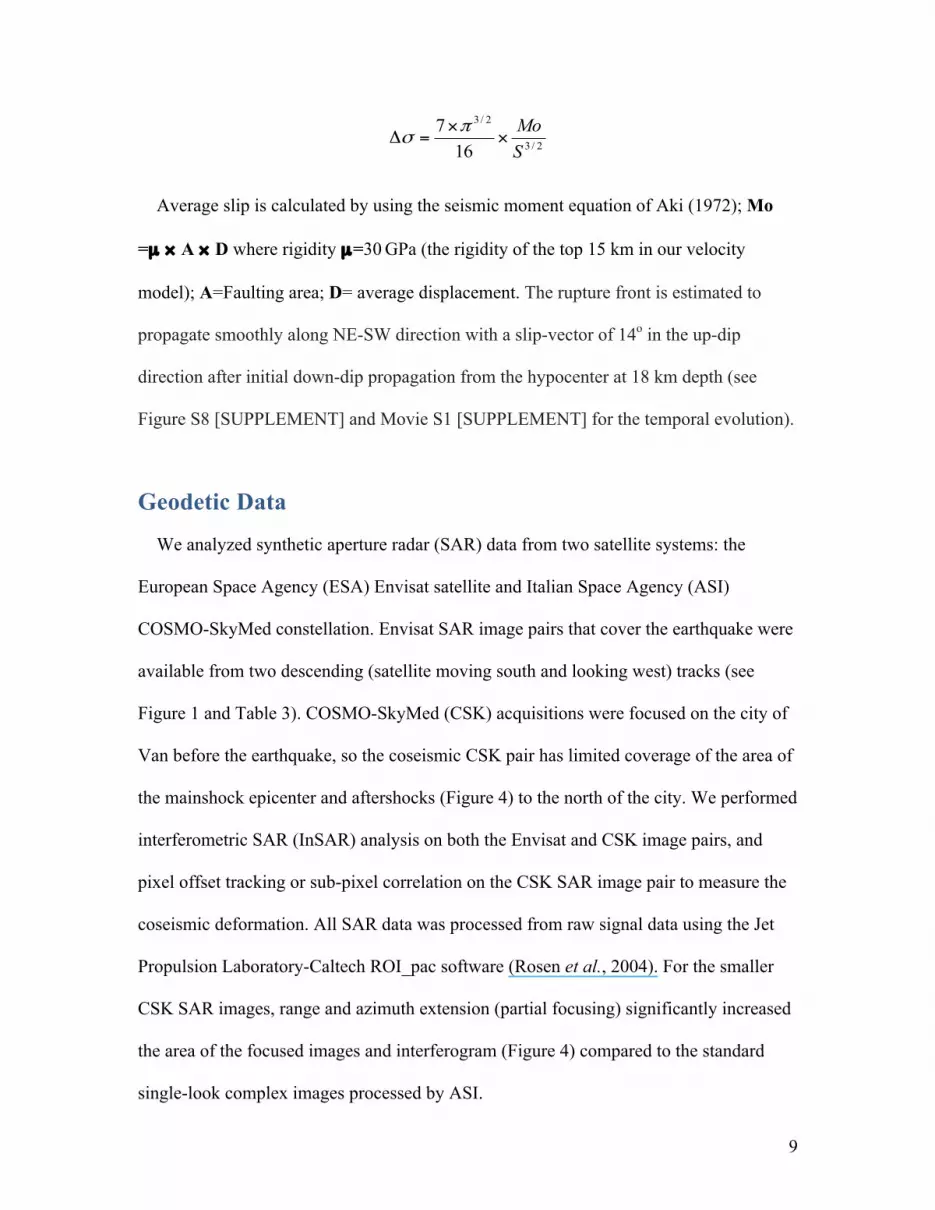
Average slip is calculated by using the seismic moment equation of Aki (1972); Mo
=µ × A × D where rigidity µ=30 GPa (the rigidity of the top 15 km in our velocity
model); A=Faulting area; D= average displacement. The rupture front is estimated to
propagate smoothly along NE-SW direction with a slip-vector of 14o in the up-dip
direction after initial down-dip propagation from the hypocenter at 18 km depth (see
Figure S8 [SUPPLEMENT] and Movie S1 [SUPPLEMENT] for the temporal evolution).
Geodetic Data
We analyzed synthetic aperture radar (SAR) data from two satellite systems: the
European Space Agency (ESA) Envisat satellite and Italian Space Agency (ASI)
COSMO-SkyMed constellation. Envisat SAR image pairs that cover the earthquake were
available from two descending (satellite moving south and looking west) tracks (see
Figure 1 and Table 3). COSMO-SkyMed (CSK) acquisitions were focused on the city of
Van before the earthquake, so the coseismic CSK pair has limited coverage of the area of
the mainshock epicenter and aftershocks (Figure 4) to the north of the city. We performed
interferometric SAR (InSAR) analysis on both the Envisat and CSK image pairs, and
pixel offset tracking or sub-pixel correlation on the CSK SAR image pair to measure the
coseismic deformation. All SAR data was processed from raw signal data using the Jet
Propulsion Laboratory-Caltech ROI_pac software (Rosen et al., 2004). For the smaller
CSK SAR images, range and azimuth extension (partial focusing) significantly increased
the area of the focused images and interferogram (Figure 4) compared to the standard
single-look complex images processed by ASI.
10
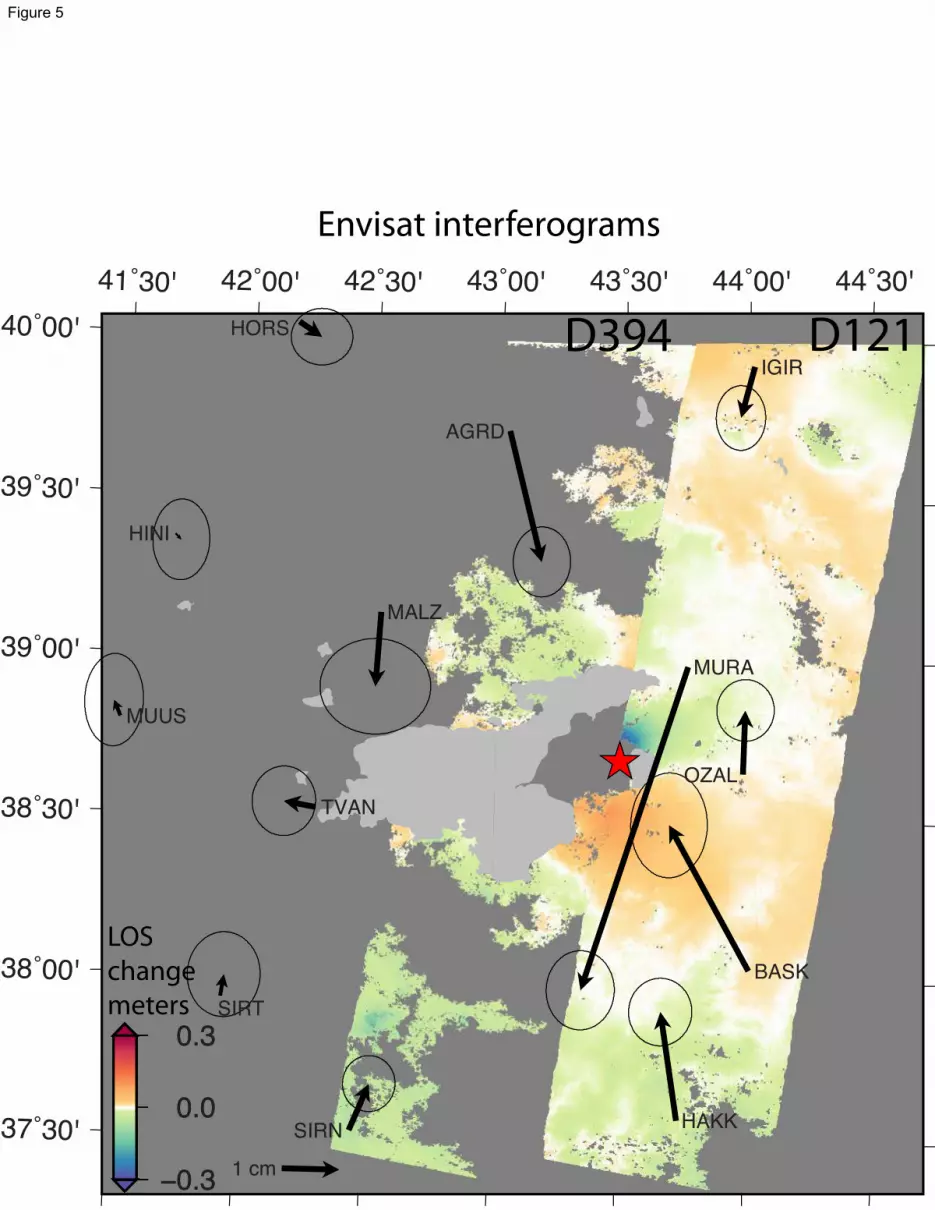
Because of the large strain and strong surface displacement gradients close to the
earthquake rupture, phase unwrapping was more challenging in that area. In addition, it
probably snowed before the acquisition of the post-earthquake Envisat scene on track
D394 (see Figure 5), so InSAR coherence was low in most of the higher elevations for
that pair. We used two iterations of the processing and model inversion to improve the
phase unwrapping. First we unwrapped the standard differential interferograms and
derived a simple fault model slip inversion with an assumed fault geometry based on the
USGS finite-fault model (Hayes, 2011,
http://earthquake.usgs.gov/earthquakes/eqinthenews/2011/usb0006bqc/finite_fault.php
last accessed January 29, 2013). We then used the predicted surface displacement field
from the preliminary model to subtract the main part of the coseismic deformation from
the interferograms, and repeated the phase unwrapping using the Statistical-Cost,
Network-Flow Algorithm for Phase Unwrapping (SNAPHU) software (Chen and Zebker,
2002). After unwrapping with the model removed and masking low-coherence areas, we
added back the model displacements to make the final interferogram. For the Envisat
track D121 interferogram, we also estimated a new effective orbital baseline to remove a
long-wavelength ramp that is probably due to atmospheric water vapor variations, but is
similar to orbit error (Figure 5 shows the corrected interferogram).
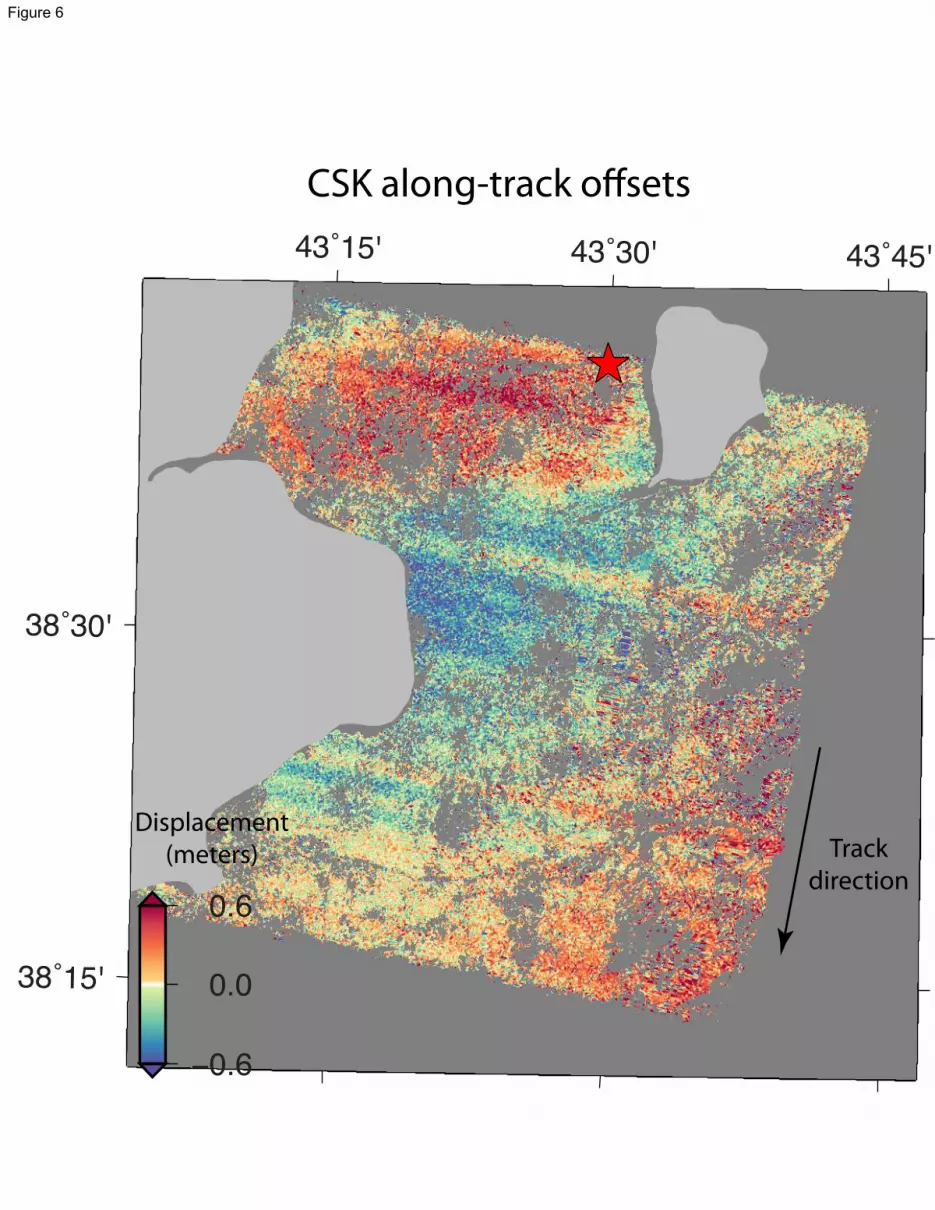
The SAR pixel offset tracking (or subpixel correlation) was performed by matching the
CSK amplitude images using the ROI_pac “ampcor” program (Pathier et al., 2006). This
involves cross-correlation of 64 by 64 pixel windows from the full-resolution (single-
look complex) amplitude images to estimate the offset or distortion of the post-
earthquake radar image relative to the pre-earthquake image to a fraction of the pixel
size. Measurements are done in the SAR image geometry so they have components in the
11
slant-range and along-track directions. We use the along-track offsets (Figure 6) to
provide an estimate of displacements in the 190° E direction (roughly south). Because of
the high spatial resolution of the CSK images (~2 m along-track), the pixel offsets can be
measured with a precision of about 10 cm, but various noise effects degrade the accuracy
to about 20 cm, so these offset measurements are only useful where the displacements are
large. The along-track offsets are only consistent with the north-dipping planes of the
point-source focal mechanisms and moment tensors because the surface around the
epicenter moved southward.
Global Positioning System (GPS) data from the Continuously Operating Reference
Stations (CORS) network called TUSAGA, operated by the Turkish government, were
made available online for this earthquake
(http://www.hgk.msb.gov.tr/van_depremi_metin.htm accessed on 12 September 2012).
We analyzed the GPS data using JPL’s GIPSY-OASIS software and JPL GPS orbit and
clock products, applying the single station bias-fixing strategy described in (Bertiger et
al., 2010). This analysis strategy results in absolute positions in the IGS08 reference
frame that have several mm accuracy in the horizontal component and approximately 1
cm accuracy in the vertical component for stations with high quality data. Coseismic
offsets (Figure 5) were computed by differencing a pre- and post- earthquake position at
each site, using approximately two months of data prior to the earthquake and 18 days of
data after the earthquake. The average positions were calculated by fitting a linear
velocity model to the pre- and post-earthquake position time series, and then using this
linear velocity model to estimate the station position on October 22, 2011 (the day before
the earthquake) and October 24, 2011 (the day after the earthquake). Since formal errors
from the positions are usually an underestimate of the actual accuracy, the errors for the
12
coseismic offsets were calculated by first estimating the root mean square (RMS) of the
residuals to the linear velocity models to generate pre- and post- earthquake error
estimates for the positions in north, east, and up, and then by applying the standard
propagation of errors formula to calculate the coseismic offset errors in the individual
north, east, and up components.
Geodetic Source Inversion
We use the SAR and GPS data described above to constrain a Bayesian inference
method with Markov-chain Monte Carlo (MCMC) sampling to resolve the fault rupture
location, size, and final slip distribution with posterior probability distribution estimates
for the geometric parameters. The Bayesian inference method is based on Fukuda and
Johnson (2008). We use a single planar fault embedded in a homogeneous elastic half-
space for the earthquake slip geodetic inversion. We fixed only the depth to the top of the
fault at 100 m beneath the surface and allowed the other fault geometry parameters to
vary: horizontal location of the top center of the fault, dip, strike, width down-dip, and
length of the fault. The depth of the top was fixed to avoid trade-offs between the
horizontal position and the depth of the top of the model fault. Because we solve for
distributed slip at each iteration of the MCMC inversion, the extent of the model fault is
not very important as the inversion can put insignificant slip on patches at the edges.
At each step of the Markov-chain sampling, the geometric parameters were changed
and then the distribution of slip was inverted using singular-value decomposition (SVD)
with Laplacian smoothing regularization imposed on the strike-slip and dip-slip
components of slip on each fault patch. Note that the SVD inversion does not include a
positivity constraint. The gamma factors controlling the strength of smoothing for the two
13
components and the two weighting factors for the SAR and GPS datasets were also
varied at each step of the Markov-chain sampling. After each Markov-chain step, the
weighted RMS error of the new fit to the observations was compared to the previous kept
fit and the new model is kept if it is better than the previous model or if the exponential
of the difference between the previous and current misfits is greater than a random
number between zero and one (Fukuda and Johnson, 2008). Note that a new kept model
in our MCMC inversion may have slightly worse misfits to the observations than
previous kept models because the RMS errors are a combination of the observation and
model errors, unlike other types of inversions that try to converge on a single best-fit
solution. The set of kept solutions after a large number of steps forms an estimate of the
posterior probability distribution function for the fault geometric parameters and the most
probable values for each parameter are the values that have the greatest number of kept
solutions (Fukuda and Johnson, 2008).
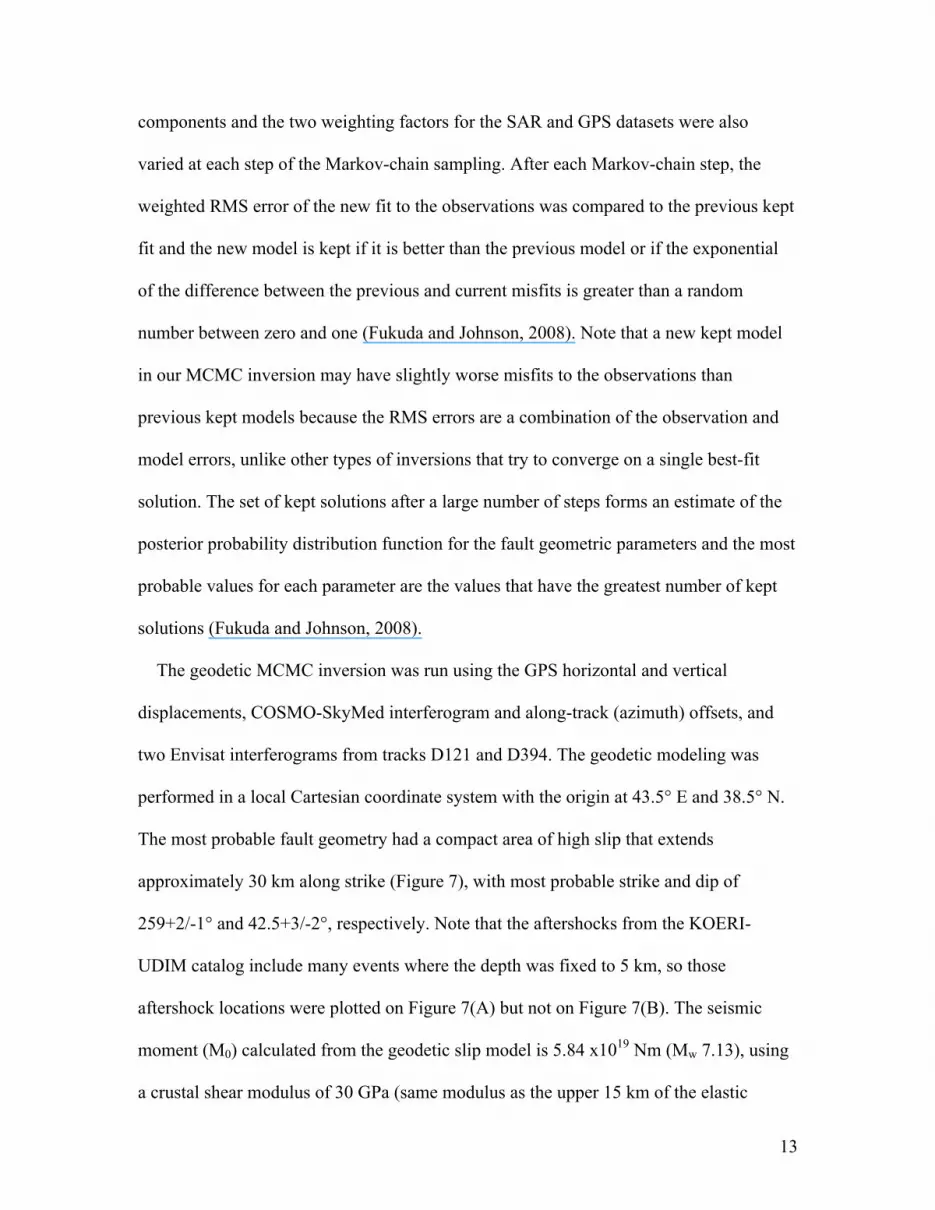
The geodetic MCMC inversion was run using the GPS horizontal and vertical
displacements, COSMO-SkyMed interferogram and along-track (azimuth) offsets, and
two Envisat interferograms from tracks D121 and D394. The geodetic modeling was
performed in a local Cartesian coordinate system with the origin at 43.5° E and 38.5° N.
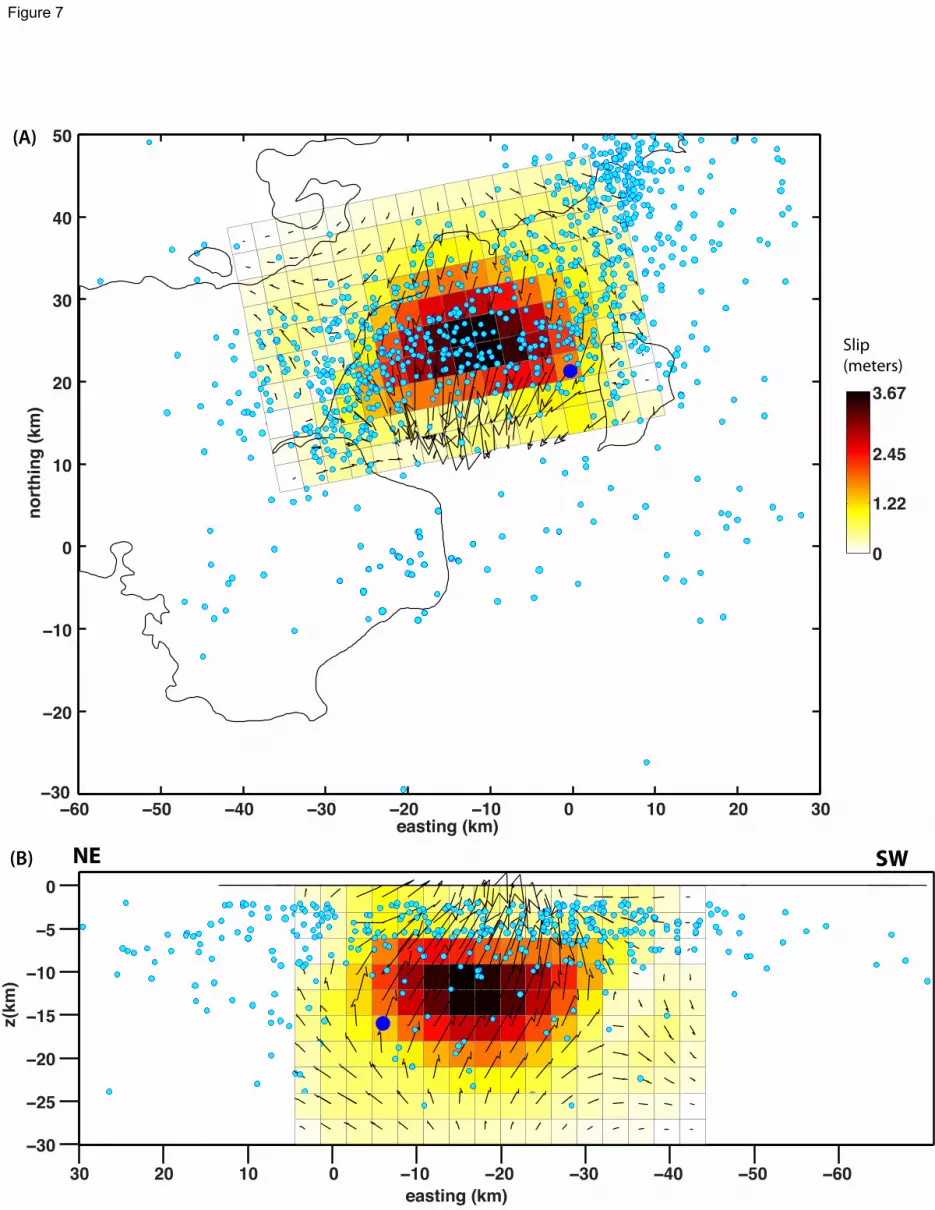
The most probable fault geometry had a compact area of high slip that extends
approximately 30 km along strike (Figure 7), with most probable strike and dip of
259+2/-1° and 42.5+3/-2°, respectively. Note that the aftershocks from the KOERI-
UDIM catalog include many events where the depth was fixed to 5 km, so those
aftershock locations were plotted on Figure 7(A) but not on Figure 7(B). The seismic
moment (M0) calculated from the geodetic slip model is 5.84 x10¹⁹ Nm (Mw 7.13), using
a crustal shear modulus of 30 GPa (same modulus as the upper 15 km of the elastic
14
model for our waveform finite-fault inversion). The M0 would be 8.57 x10¹⁹ Nm (Mw
7.22) with the shear modulus of 44 GPa that was used for the point-source seismic
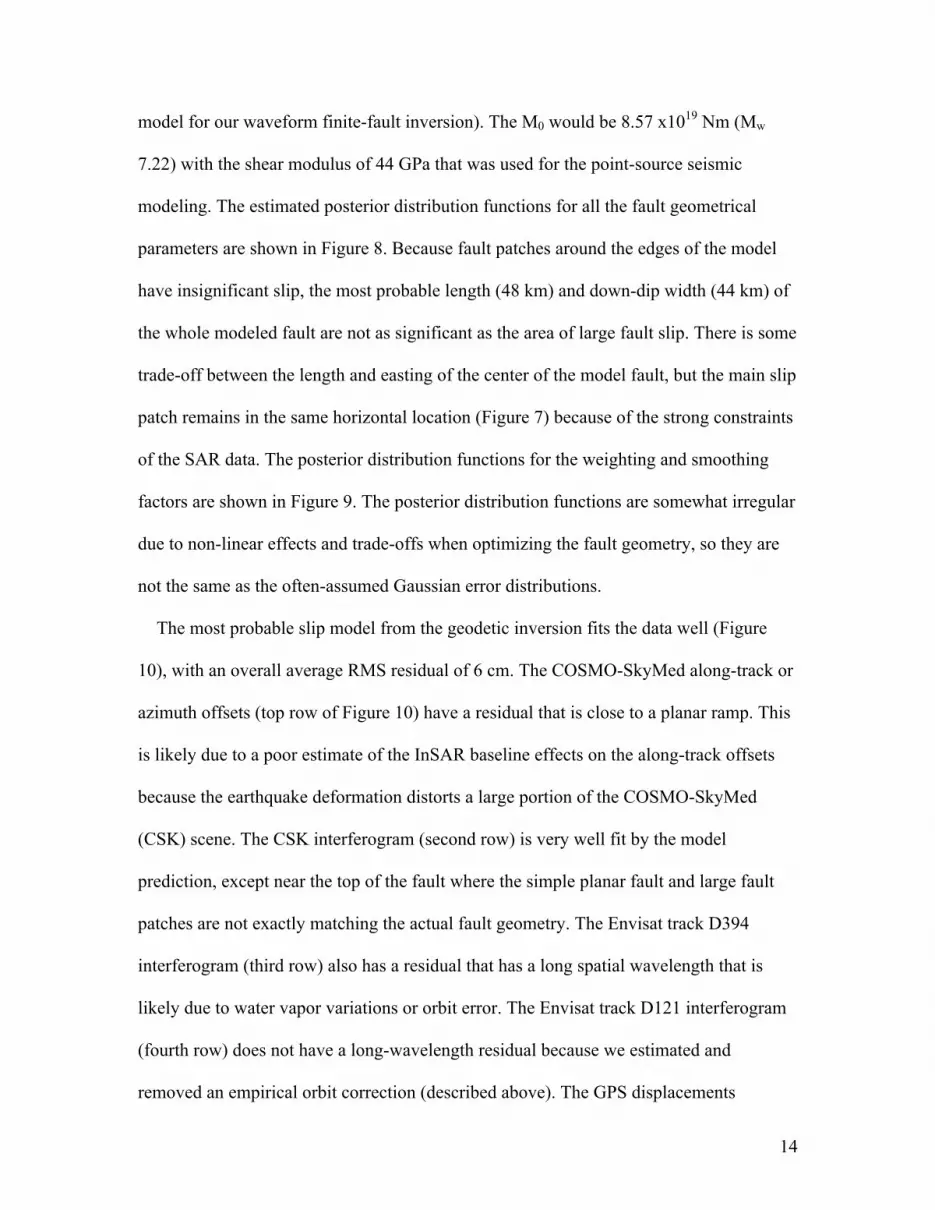
modeling. The estimated posterior distribution functions for all the fault geometrical
parameters are shown in Figure 8. Because fault patches around the edges of the model
have insignificant slip, the most probable length (48 km) and down-dip width (44 km) of
the whole modeled fault are not as significant as the area of large fault slip. There is some
trade-off between the length and easting of the center of the model fault, but the main slip
patch remains in the same horizontal location (Figure 7) because of the strong constraints
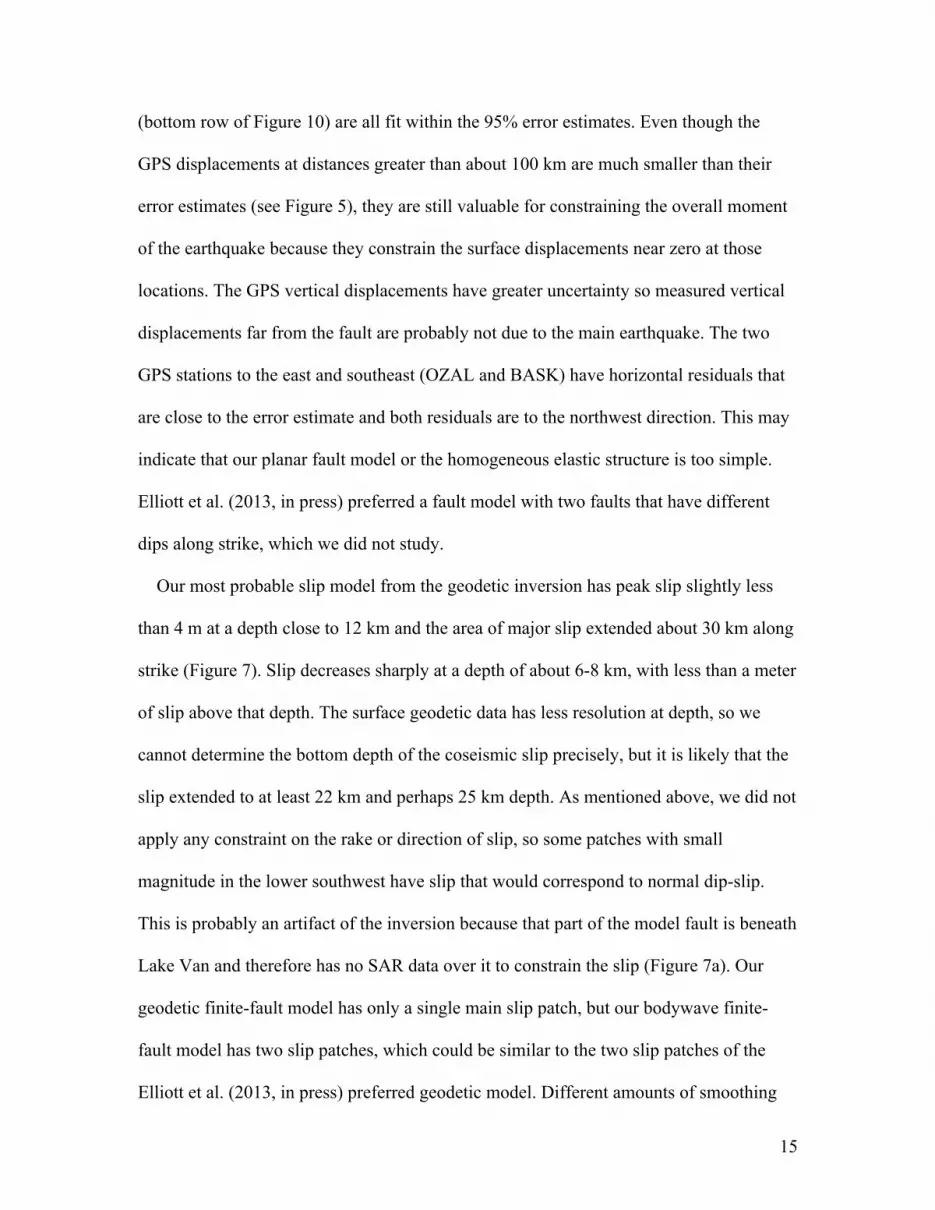
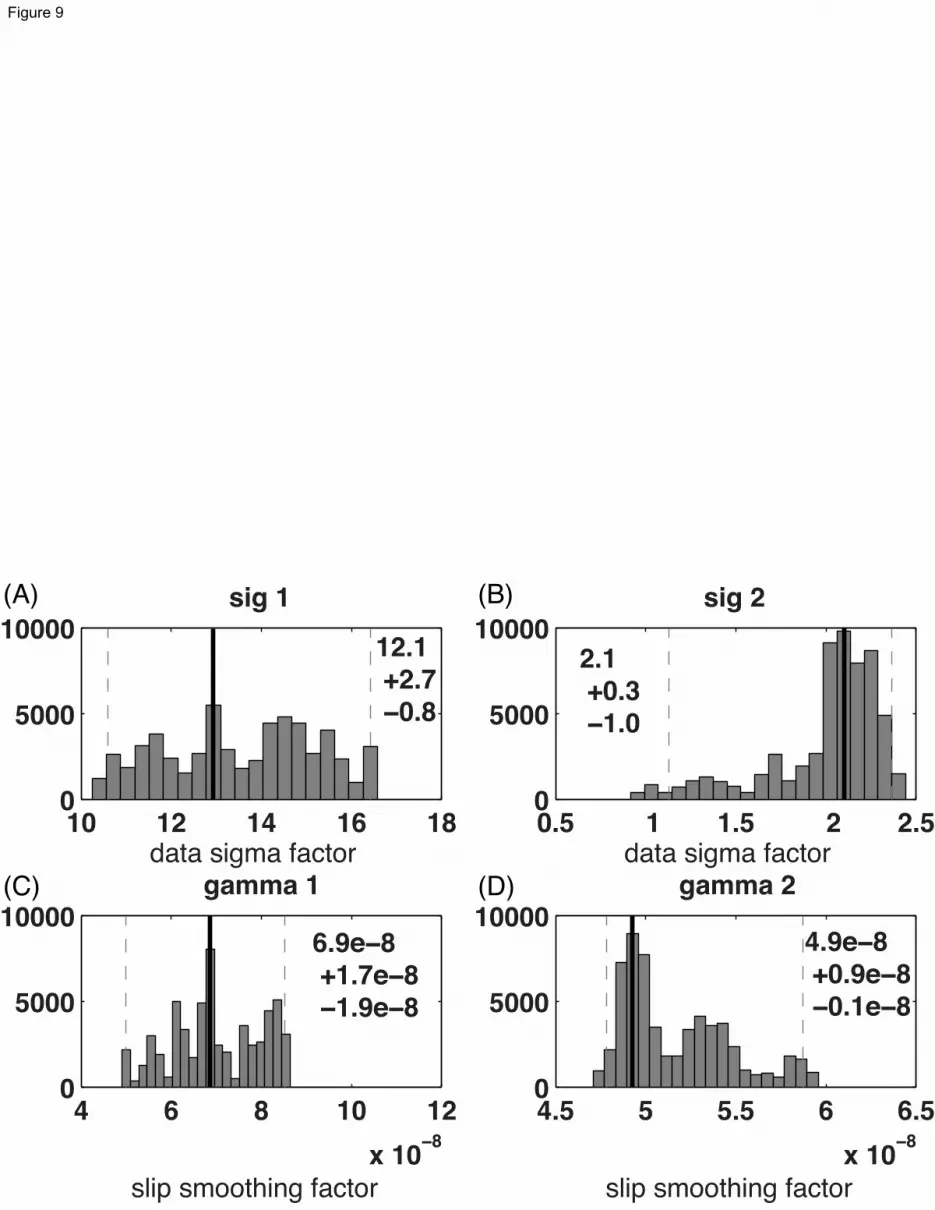
of the SAR data. The posterior distribution functions for the weighting and smoothing
factors are shown in Figure 9. The posterior distribution functions are somewhat irregular
due to non-linear effects and trade-offs when optimizing the fault geometry, so they are
not the same as the often-assumed Gaussian error distributions.
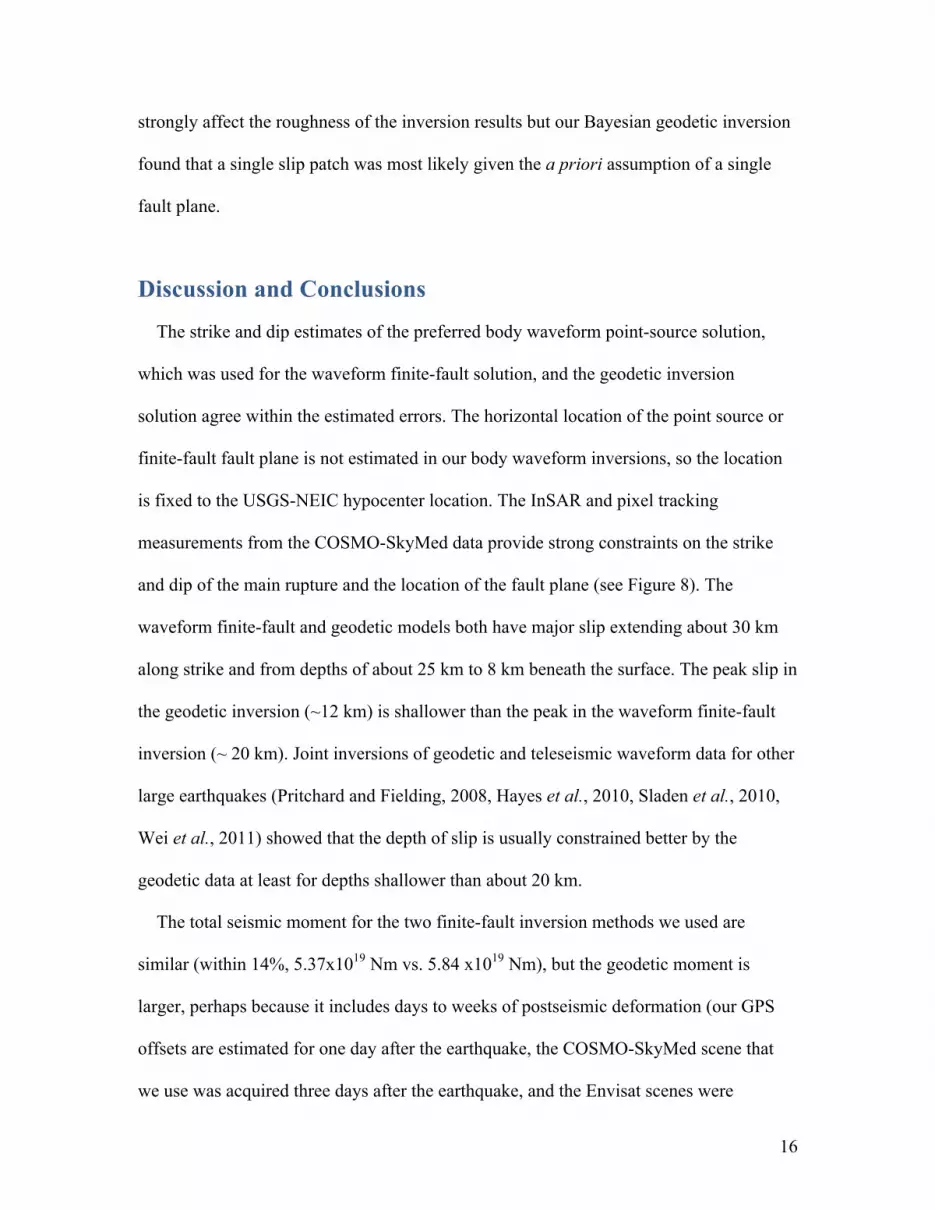
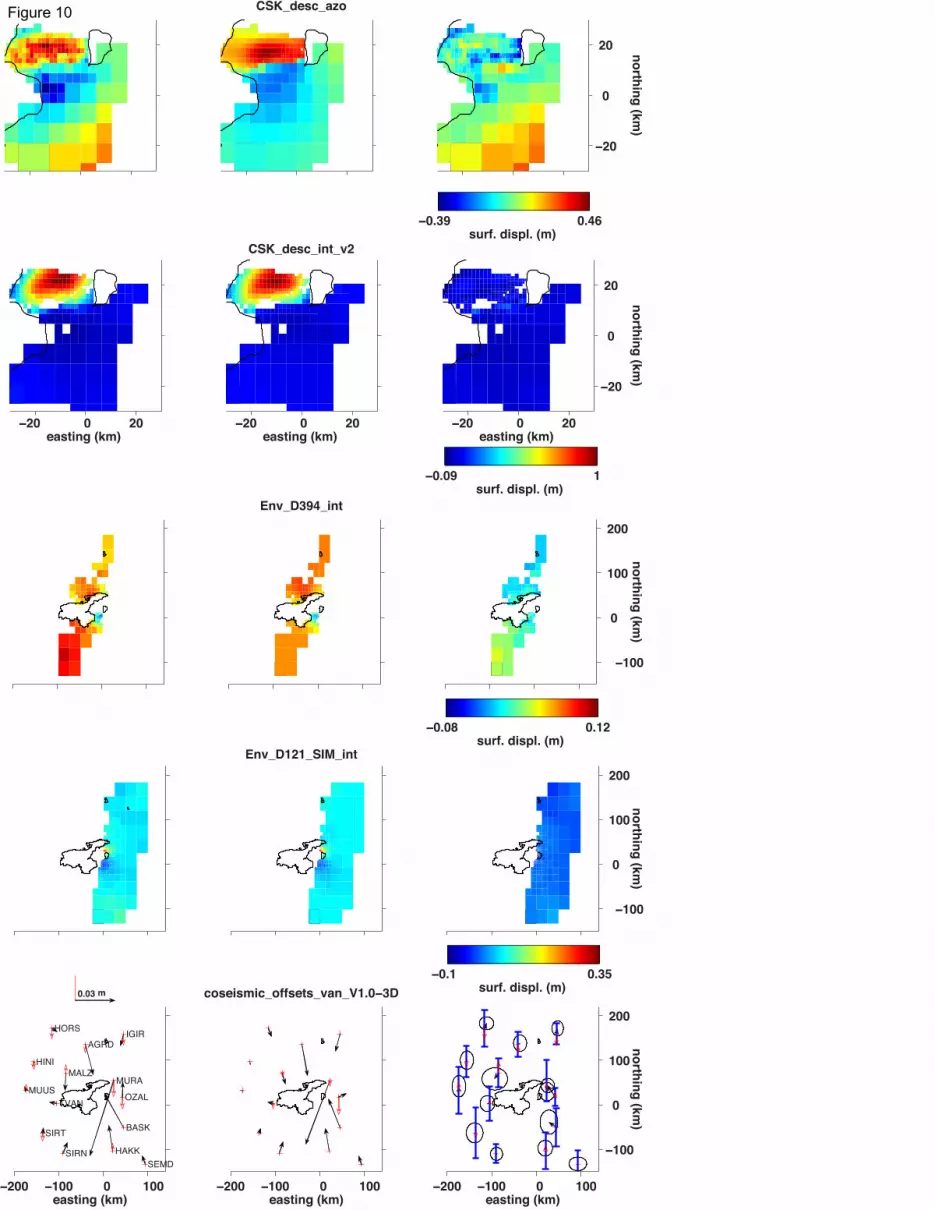
The most probable slip model from the geodetic inversion fits the data well (Figure
10), with an overall average RMS residual of 6 cm. The COSMO-SkyMed along-track or
azimuth offsets (top row of Figure 10) have a residual that is close to a planar ramp. This
is likely due to a poor estimate of the InSAR baseline effects on the along-track offsets
because the earthquake deformation distorts a large portion of the COSMO-SkyMed
(CSK) scene. The CSK interferogram (second row) is very well fit by the model
prediction, except near the top of the fault where the simple planar fault and large fault
patches are not exactly matching the actual fault geometry. The Envisat track D394
interferogram (third row) also has a residual that has a long spatial wavelength that is
likely due to water vapor variations or orbit error. The Envisat track D121 interferogram
(fourth row) does not have a long-wavelength residual because we estimated and
removed an empirical orbit correction (described above). The GPS displacements
15
(bottom row of Figure 10) are all fit within the 95% error estimates. Even though the
GPS displacements at distances greater than about 100 km are much smaller than their
error estimates (see Figure 5), they are still valuable for constraining the overall moment
of the earthquake because they constrain the surface displacements near zero at those
locations. The GPS vertical displacements have greater uncertainty so measured vertical
displacements far from the fault are probably not due to the main earthquake. The two
GPS stations to the east and southeast (OZAL and BASK) have horizontal residuals that
are close to the error estimate and both residuals are to the northwest direction. This may
indicate that our planar fault model or the homogeneous elastic structure is too simple.
Elliott et al. (2013, in press) preferred a fault model with two faults that have different
dips along strike, which we did not study.
Our most probable slip model from the geodetic inversion has peak slip slightly less
than 4 m at a depth close to 12 km and the area of major slip extended about 30 km along
strike (Figure 7). Slip decreases sharply at a depth of about 6-8 km, with less than a meter
of slip above that depth. The surface geodetic data has less resolution at depth, so we
cannot determine the bottom depth of the coseismic slip precisely, but it is likely that the
slip extended to at least 22 km and perhaps 25 km depth. As mentioned above, we did not
apply any constraint on the rake or direction of slip, so some patches with small
magnitude in the lower southwest have slip that would correspond to normal dip-slip.
This is probably an artifact of the inversion because that part of the model fault is beneath
Lake Van and therefore has no SAR data over it to constrain the slip (Figure 7a). Our
geodetic finite-fault model has only a single main slip patch, but our bodywave finite-
fault model has two slip patches, which could be similar to the two slip patches of the
Elliott et al. (2013, in press) preferred geodetic model. Different amounts of smoothing
16
strongly affect the roughness of the inversion results but our Bayesian geodetic inversion
found that a single slip patch was most likely given the a priori assumption of a single
fault plane.
Discussion and Conclusions
The strike and dip estimates of the preferred body waveform point-source solution,
which was used for the waveform finite-fault solution, and the geodetic inversion
solution agree within the estimated errors. The horizontal location of the point source or
finite-fault fault plane is not estimated in our body waveform inversions, so the location
is fixed to the USGS-NEIC hypocenter location. The InSAR and pixel tracking
measurements from the COSMO-SkyMed data provide strong constraints on the strike
and dip of the main rupture and the location of the fault plane (see Figure 8). The
waveform finite-fault and geodetic models both have major slip extending about 30 km
along strike and from depths of about 25 km to 8 km beneath the surface. The peak slip in
the geodetic inversion (~12 km) is shallower than the peak in the waveform finite-fault
inversion (~ 20 km). Joint inversions of geodetic and teleseismic waveform data for other
large earthquakes (Pritchard and Fielding, 2008, Hayes et al., 2010, Sladen et al., 2010,
Wei et al., 2011) showed that the depth of slip is usually constrained better by the
geodetic data at least for depths shallower than about 20 km.
The total seismic moment for the two finite-fault inversion methods we used are
similar (within 14%, 5.37x10¹⁹ Nm vs. 5.84 x10¹⁹ Nm), but the geodetic moment is
larger, perhaps because it includes days to weeks of postseismic deformation (our GPS
offsets are estimated for one day after the earthquake, the COSMO-SkyMed scene that
we use was acquired three days after the earthquake, and the Envisat scenes were
17
acquired later; see Table 2). The moment of our preferred point source model is
considerably smaller than the two finite-fault models (about 3.4x10¹⁹ Nm) if converted to
the shear modulus of 30 GPa that we used for our geodetic moment calculation (the shear
modulus for our teleseismic finite fault model is 30 GPa at depths 0-15 km and 40 GPa
15-33 km, so approximately the same). A body wave study that explored the dependence
of the seismic moment on the centroid depth for the Van mainshock found that the
moment increases drastically if the centroid is fixed to shallower depths (Elliott et al.,
2013, in press), with the moment close to 5x10¹⁹ Nm for a centroid depth of about 12 km
(at the peak of our geodetic slip model). Our geodetic estimate of the seismic moment
(5.84x10¹⁹ Nm for shear modulus 30 GPa or 6.23x10¹⁹ Nm for modulus 32 GPa often
used) is close to the Global Centroid Moment Tensor M0 of 6.40x10¹⁹ Nm (from
http://globalcmt.org) and is larger than M0 5.53x10¹⁹ Nm of the finite-fault model from
bodywave inversion of Irmak et al. (2013, in press). It is possible that some energy was
released in slower slip that was not measured by the teleseismic body waves.
Our analysis indicates that the 2011 main-shock primarily ruptured the middle crust
and the shallowest part had much less slip. The slip was primarily thrust with minor
strike-slip motion. The 2011 Van mainshock earthquake is similar to other large events
on blind thrust faults, including the 1983 Coalinga, California earthquake (Fielding et al.,
1984), 1989 Loma Prieta, California earthquake (Zhang and Lay, 1990), and 1994
Northridge, California earthquake (Jones et al., 1994). Field geologists mapped some
surface ruptures with lengths up to a km or two north of Van with tens of cm of offset
(Doğan and Karakaş, 2013, Irmak et al., 2013, in press, Elliott et al., 2013, in press), but
it is not clear whether these fault ruptures are directly connected to the main rupture at
depth or are separate faults. The shallow fault slip observed in the field may be triggered
18
slip from the dynamic and static stress changes of the mainshock. A COSMO-SkyMed
interferogram from four hours to three days after the mainshock shows clear shallow
afterslip (Elliott et al., 2013, in press). COSMO-SkyMed and TerraSAR-X
interferograms covering longer time intervals after the 23 October 2011 mainshock show
that several faults slipped for days and weeks after the M 7.1 earthquake (manuscript in
preparation). It is clear that the area of major slip stops at about 6-8 km beneath the
surface (Figure 7), so shallower thrust faults in the crust now have increased stress that
could lead to future large earthquakes in the next years or decades, similar to the Mw 6.6
1998 Fandoqa earthquake in Iran that ruptured 17 years after two large M7 deeper events
in 1981 (Berberian et al., 2001). We note that such triggering does not always occur: the
1983 Coalinga, 1989 Loma Prieta, and 1994 Northridge events have not yet had shallow
M>6 earthquakes above them. The Coalinga earthquake was followed by M>6
earthquakes on adjacent structures (Ekström et al., 1992).
The 2011 Van earthquake main rupture probably reached depths of about 25 km
(Figures 6 and 7). This is slightly more than half of the 43 km crustal thickness (Gök et
al., 2011) and indicates that the middle crust in this part of the Turkish-Iranian Plateau is
strong enough to rupture in large earthquakes despite extensive volcanism that has heated
the crust and an unusually hot uppermost mantle. This makes the Turkish-Iranian Plateau
distinctive from the highly extended Basin and Range province or the much thicker
Tibetan Plateau, which have earthquakes only down to about 15 km (e.g., Elliott et al.,
2010, Pancha et al., 2006). It is also clear that the Turkish-Iranian Plateau is still
undergoing north-south shortening consistent with the GPS measurements (Reilinger et
al., 2006) with some of the strain absorbed by roughly east-west trending thrust faults, in
19
addition to the previously mapped active strike-slip structures (Copley and Jackson,
2006).
Acknowledgements
We thank an anonymous reviewer for detailed comments on earlier versions of our
manuscript that helped us to improve it. We thank M. Barazangi, Z. Liu, S. Akçiz, E.
Hauksson, J. Elliott, and K. Hudnut for discussions. We thank S. Ergintav for helping to
arrange the sharing of the GPS data on the Geohazards Supersite. We thank B. Doğan for
sending preprints of papers in advance of publication. We would like to thank İstanbul
Technical University Research Fund (İTÜ-BAP), Turkish National Scientific,
Technological Foundation (TÜBİTAK), Turkish Academy of Sciences (TÜBA) in the
framework for Young Scientist Award Program (TT-TÜBA-GEBIP 2001-2-17), and
Alexander von Humboldt-Stiftung (AvH) for their support. Generic Mapping Tools
(GMT) (Wessel and Smith, 1998) and SAC2000 software packages (Goldstein et al.,
2003) were used to prepare figures and to process conventional earthquake data,
respectively. We are thankful to Yeşim Çubuk for her help in generating Figure 1 and
Table 1. The teleseismic body waves used in this study are from the International
Federation of Digital Seismograph Networks (FDSN), the Global Digital Seismograph
Network (GDSN) stations and archived at the IRIS-DMC. COSMO-SkyMed original
data is copyright 2011 by the Italian Space Agency and was provided under CSK AO PI
project 2271. Envisat original data is copyright 2010-2011 by the European Space
Agency and was delivered under the Group on Earth Observation (GEO) Geohazards
Supersite program. Part of this research was sponsored by the NASA Earth Surface and
20
Interior focus area and performed at the Jet Propulsion Laboratory, California Institute of
Technology.
References
Aki, K., 1972. Earthquake mechanism, Tectonophysics, 13, 423-‐446. Al-‐Damegh, K., Sandvol, E., Al-‐Lazki, A. & Barazangi, M., 2004. Regional seismic wave
propagation (Lg and Sn) and Pn attenuation in the Arabian Plate and surrounding regions, Geophys. J. Int., 157, 775-‐795.
Albini, P., Demircioglu, M.B., Locati, M., Rovida, A., Sesetyan, K., Stucchi, M. & Viganò, D., 2012. In Search of the Predecessors of the 2011 Van (Turkey) Earthquake, Seismological Research Letters, 83, 855-‐862.
Ambraseys, N.N. & Jackson, J.A., 1998. Faulting associated with historical and recent earthquakes in the Eastern Mediterranean region, Geophys J Int, 133, 390-‐406.
Bakırcı, T., Yoshizawa, K. & Özer, M.F., 2012. Three-‐dimensional S-‐wave structure of the upper mantle beneath Turkey from surface wave tomography, Geophys. J. Int., 190, 1058-‐1076.
Barazangi, M., Sandvol, E. & Seber, D., 2006. Structure and tectonic evolution of the Anatolian plateau in eastern Turkey. in Postcollisional Tectonics and Magmatism in the Mediterranean Region and Asia, pp. 463-‐473, eds. Dilek, Y. & Pavlides, S. Geological Society of America, Boulder.
Berberian, M., Jackson, J.A., Fielding, E.J., Parsons, B.E., Priestley, K., Qorashi, M., Talebian, M., Walker, R., Wright, T.J. & Baker, C., 2001. The 1998 March 14 Fandoqa earthquake (Mw 6.6) in Kerman province, southeast Iran: Re-‐rupture of the 1981 Sirch earthquake fault, triggering of slip on adjacent thrusts and the active tectonics of the Gowk fault zone, Geophys. J. Int., 146, 371-‐398.
Bertiger, W., Desai, S.D., Haines, B., Harvey, N., Moore, A.W., Owen, S. & Weiss, J.P., 2010. Single receiver phase ambiguity resolution with GPS data, Journal of Geodesy, 84, 327-‐337.
Chen, C.W. & Zebker, H.A., 2002. Phase unwrapping for large SAR interferograms: statistical segmentation and generalized network models, Geoscience and Remote Sensing, IEEE Transactions on,, 40, 1709-‐1719.
Christensen, D.H. & Ruff, L.J., 1985. Analysis of the trade-‐off between hypocentral depth and source time function, Bull. Seismol. Soc. Am., 75, 1637-‐1656.
Copley, A. & Jackson, J., 2006. Active tectonics of the Turkish-‐Iranian Plateau, Tectonics, 25, TC6006.
Doğan, B. & Karakaş, A., 2013. Geometry of co-‐seismic surface ruptures and tectonic meaning of the 23 October 2011 Mw 7.1 Van earthquake (East Anatolian Region, Turkey), J. Struct. Geol., 46, 99-‐114.
Dziewonski, A.M. & Anderson, D.L., 1981. Preliminary Reference Earth Model, Physics of the Earth and Planetary Interiors, 25, 297-‐356.

21
Ekström, G., Stein, R.S., Eaton, J.P. & Eberhart-‐Phillips, D., 1992. Seismicity and geometry of a 110-‐km-‐long blind thrust-‐fault .1. The 1985 Kettleman Hills, California, earthquake, Journal of Geophysical Research, 97, 4843-‐4864.
Elliott, J.R., Copley, A.C., Holley, R., Scharer, K. & Parsons, B., 2013, in press. The 2011 Mw 7.1 Van (Eastern Turkey) Earthquake, Journal of Geophysical Research.
Elliott, J.R., Walters, R.J., England, P.C., Jackson, J.A., Li, Z. & Parsons, B., 2010. Extension on the Tibetan plateau: recent normal faulting measured by InSAR and body wave seismology, Geophys. J. Int., 183, 503-‐535.
Ergin, K., Güçlü, U. & ve Uz, Z., 1967. Earthquake Catalog of Turkey and Surroundings, edn, Vol., pp. Pages, Faculty of Mines Printing House, Istanbul Technical University, Istanbul, Turkey.
Fielding, E.J., Barazangi, M., Brown, L., Oliver, J. & Kaufman, S., 1984. COCORP seismic profiles near Coalinga, California: Subsurface structure of the western Great Valley, Geology, 12, 268–273.
Fredrich, J., McCaffrey, R. & Denham, D., 1988. Source parameters of seven large Australian earthquakes determined by body waveform inversion, Geophysical Journal, 95, 1-‐13.
Fukuda, J. & Johnson, K.M., 2008. A fully Bayesian inversion for spatial distribution of fault slip with objective smoothing, Bull. Seismol. Soc. Am., 98, 1128-‐1146.
Futterman, W.I., 1962. Dispersive body waves, Journal of Geophysical Research, 67, 5279-‐5291.
Gök, R., Mellors, R.J., Sandvol, E., Pasyanos, M., Hauk, T., Takedatsu, R., Yetirmishli, G., Teoman, U., Turkelli, N., Godoladze, T. & Javakishvirli, Z., 2011. Lithospheric velocity structure of the Anatolian plateau-‐Caucasus-‐Caspian region, J. Geophys. Res., 116, B05303.
Gök, R., Sandvol, E., Türkelli, N., Seber, D. & Barazangi, M., 2003. Sn attenuation in the Anatolian and Iranian plateau and surrounding regions, Geophysical Research Letters, 30, 8042.
Goldstein, P., Dodge, D., Firpo, M. & Minner, L., 2003. SAC2000: Signal processing and analysis tools for seismologists and engineers. in The IASPEI International Handbook of Earthquake and Engineering Seismology, eds. Lee, W. H. K., Kanamori, H., Jennings, P. C. & Kisslinger, C. Academic Press, London.
Hartzell, S.H. & Heaton, T.H., 1983. Inversion of strong ground motion and teleseismic waveform data for the fault rupture history of the 1979 Imperial Valley, California, earthquake, Bull. Seismol. Soc. Am., 73, 1553-‐1583.
Hayes, G.P., Briggs, R.W., Sladen, A., Fielding, E.J., Prentice, C., Hudnut, K., Mann, P., Taylor, F.W., Crone, A.J., Gold, R., Ito, T. & Simons, M., 2010. Complex rupture during the 12 January 2010 Haiti earthquake, Nature Geosci, 3, 800-‐805, doi:810.1038/ngeo1977.
Irmak, T.S., Doğan, B. & Karakaş, A., 2013, in press. Source mechanism of the 23 October 2011 Van (Turkey) Earthquake (Mw = 7.1) and aftershocks with its tectonic implications, Earth Planets Space.
Jackson, J. & McKenzie, D., 1984. Active tectonics of the Alpine–Himalayan Belt between western Turkey and Pakistan, Geophysical Journal of the Royal Astronomical Society, 77, 185-‐264.

22
Jackson, J. & McKenzie, D., 1988. The relationship between plate motions and seismic moment tensors, and the rates of active deformation in the Mediterranean and Middle-‐East, Geophysical Journal, 93, 45-‐73.
Jackson, J., Priestley, K., Allen, M. & Berberian, M., 2002. Active tectonics of the South Caspian Basin, Geophys. J. Int., 148, 214-‐245.
Jeffreys, H. & Bullen, K.E., 1940, 1958. Seismological Tables, edn, Vol., pp. Pages, Brit. Assoc. for the Advanc. of Science, Gray-‐Milne Trust, London.
Jones, L., Aki, K., Boore, D., Celebi, M., Donnellan, A., Hall, J., Harris, R., Hauksson, E., Heaton, T., Hough, S., Hudnut, K., Hutton, K., Johnston, M., Joyner, W., Kanamori, H., Marshall, G., Michael, A., Mori, J., Murray, M., Ponti, D., Reasenberg, P., Schwartz, D., Seeber, L., Shakal, A., Simpson, R., Thio, H., Tinsley, J., Todorovska, M., Trifunac, M., Wald, D. & Zoback, M.L., 1994. The magnitude-‐6.7 Northridge, California, earthquake of 17-‐January-‐1994, Science, 266, 389-‐397.
Kanamori, H., 1994. Mechanics of earthquakes, Ann. Rev. Earth Planet. Sci., 22, 207-‐237.
Kikuchi, M. & Kanamori, H., 1991. Inversion of Complex Body Waves .3., Bull. Seismol. Soc. Am., 81, 2335-‐2350.
Koçyiğit, A., Yılmaz, A., Adamia, S. & Kuloshvili, S., 2001. Neotectonics of East Anatolian Plateau (Turkey) and Lesser Caucasus: implication for transition from thrusting to strike-‐slip faulting, Geodinamica Acta, 14, 177-‐195.
KOERI-‐UDIM, 2012. Historical Earthquakes Catalog Boğaziçi University, Kandilli Observatory and Earthquake Research Institute National Earthquake Monitoring Centre, Istanbul, Turkey.
Maggi, A. & Priestley, K., 2005. Surface waveform tomography of the Turkish–Iranian plateau, Geophys. J. Int., 160, 1068-‐1080.
McCaffrey, R., Zwick, P. & Abers, G.A., 1991. SYN4 programIASPEI Software Library 3, 81-‐166.
Nabelek, J., 1984. Determination of earthquake source parameters from inversion of body waves, PhD, Mass. Inst. of Tech., Cambridge, Mass., USA.
Nabelek, J., 1985. Geometry and Mechanism of Faulting of the 1980 El-‐Asnam, Algeria, Earthquake from Inversion of Teleseismic Body Waves and Comparison with Field Observations, Journal of Geophysical Research, 90, 2713-‐2728.
Örgülü, G., Aktar, M., Türkelli, N., Sandvol, E. & Barazangi, M., 2003. Contribution to the seismotectonics of Eastern Turkey from moderate and small size events, Geophysical Research Letters, 30, 8040.
Pancha, A., Anderson, J.G. & Kreemer, C., 2006. Comparison of Seismic and Geodetic Scalar Moment Rates across the Basin and Range Province, Bull. Seismol. Soc. Am., 96, 11-‐32.
Pathier, E., Fielding, E.J., Wright, T.J., Walker, R., Parsons, B.E. & Hensley, S., 2006. Displacement field and slip distribution of the 2005 Kashmir earthquake from SAR imagery, Geophysical Research Letters, 33, L20310, doi:20310.21029/22006GL027193.
23
Podgorski, J., Hearn, E.H., McClusky, S., Reilinger, R., Taymaz, T., Tan, O., Prilepin, M., Guseva, T. & Nadariya, M., 2007. Postseismic deformation following the 1991 Racha, Georgia, earthquake, Geophysical Research Letters, 34, L04310.
Pritchard, M.E. & Fielding, E.J., 2008. A study of the 2006 and 2007 earthquake sequence of Pisco, Peru, with InSAR and teleseismic data, Geophys. Res. Lett, 35, L09308, doi:09310.01029/02008GL033374.
Reilinger, R., McClusky, S., Vernant, P., Lawrence, S., Ergintav, S., Cakmak, R., Ozener, H., Kadirov, F., Guliev, I., Stepanyan, R., Nadariya, M., Hahubia, G., Mahmoud, S., Sakr, K., ArRajehi, A., Paradissis, D., Al-‐Aydrus, A., Prilepin, M., Guseva, T., Evren, E., Dmitrotsa, A., Filikov, S.V., Gomez, F., Al-‐Ghazzi, R. & Karam, G., 2006. GPS constraints on continental deformation in the Africa-‐Arabia-‐Eurasia continental collision zone and implications for the dynamics of plate interactions, J. Geophys. Res., 111, B05411, doi:05410.01029/02005jb004051.
Rosen, P.A., Hensley, S., Peltzer, G. & Simons, M., 2004. Updated repeat orbit interferometry package released, EOS, Trans. AGU, 85, 47.
Şengör, A.M.C., Özeren, S., Genç, T. & Zor, E., 2003. East Anatolian high plateau as a mantle-‐supported, north-‐south shortened domal structure, Geophysical Research Letters, 30, 8045.
Sladen, A., Tavera, H., Simons, M., Avouac, J.-‐P., Konca, A.O., Perfettini, H., Audin, L., Fielding, E.J., Ortega, F. & Cavagnoud, R., 2010. Source model of the 2007 Mw 8.0 Pisco, Peru earthquake-‐-‐implications for seismogenic behavior or subduction megathrusts, J. Geophys. Res, 115, B02405, doi:02410.01029/02009JB006429.
Tan, O. & Taymaz, T., 2006. Active tectonics of the Caucasus: Earthquake source mechanisms and rupture histories obtained from inversion of teleseismic body waveforms, Geological Society of America Special Papers, 409, 531-‐578.
Taymaz, T., 1993. The Source Parameters of the Çubukdağ (W Turkey) Earthquake of 1986 October 11, Geophys. J. Int., 113, 260-‐267.
Taymaz, T., 1996. Active tectonics of the East Anatolia: source parameters of destructive earthquakes and seismotectonic setting,Turkish National Science Foundation (TÜBİTAK) Ankara, Turkey.
Taymaz, T., Eyidog̃an, H. & Jackson, J., 1991. Source parameters of large earthquakes in the East Anatolian Fault Zone (Turkey), Geophys. J. Int., 106, 537-‐550.
Taymaz, T. & Price, S., 1992. The 1971 May 12 Burdur earthquake sequence, SW Turkey -‐ a synthesis of seismological and geological observations, Geophys. J. Int., 108, 589-‐603.
Taymaz, T., Wright, T.J., Yolsal, S., Tan, O., Fielding, E.J. & Seyitoğlu, G., 2007. Source characteristics of the 6 June 2000 Orta-‐Çankırı (central Turkey) earthquake: a synthesis of seismological, geological and geodetic (InSAR) observations, and internal deformation of the Anatolian plate. in The Geodynamics of the Aegean and Anatolia, pp. 259-‐290, eds. Taymaz, T., Yılmaz, Y. & Dilek, Y. Geological Society, London.
Vanacore, E.A., Taymaz, T. & Saygin, E., 2013. Moho structure of the Anatolian Plate from receiver function analysis, Geophys. J. Int., 193, 329-‐337.
24
Wagner, G.S. & Langston, C.A., 1989. Some pitfalls and trade-‐offs in source parameter determination using body wave modeling and inversion, Tectonophysics, 166, 101-‐114.
Wei, S., Fielding, E.J., Leprince, S., Sladen, A., Avouac, J.-‐P., Helmberger, D.V., Hauksson, E., Chu, R., Simons, M., Hudnut, K.W., Herring, T. & Briggs, R.W., 2011. Superficial simplicity of the 2010 El Mayor–Cucapah earthquake of Baja California in Mexico, Nature Geosci, 4, 615-‐618.
Wessel, P. & Smith, W.H.F., 1998. New, improved version of the Generic Mapping Tools released, EOS, Trans. AGU, 79, 579.
Yagi, Y. & Kikuchi, M., 2000. Source rupture process of the Kocaeli, Turkey, earthquake of August 17, 1999, obtained by joint inversion of near-‐field data and teleseismic data, Geophysical Research Letters, 27, 1969-‐1972.
Yagi, Y., Nakao, A. & Kasahara, A., 2012a. Smooth and rapid slip near the Japan Trench during the 2011 Tohoku-‐oki earthquake revealed by a hybrid back-‐projection method, Earth and Planetary Science Letters, 355, 94-‐101.
Yagi, Y., Nishimura, N. & Kasahara, A., 2012b. Source process of the 12 May 2008 Wenchuan, China, earthquake determined by waveform inversion of teleseismic body waves with a data covariance matrix, Earth Planets Space, 64, E13-‐E16.
Yolsal-‐Çevikbilen, S., Biryol, C.B., Beck, S., Zandt, G., Taymaz, T., Adıyaman, H.E. & Özacar, A.A., 2012. 3-‐D crustal structure along the North Anatolian Fault Zone in north-‐central Anatolia revealed by local earthquake tomography, Geophys. J. Int., 188, 819-‐849.
Yolsal-‐Çevikbilen, S. & Taymaz, T., 2012. Earthquake source parameters along the Hellenic subduction zone and numerical simulations of historical tsunamis in the Eastern Mediterranean, Tectonophysics, 536–537, 61-‐100.
Yoshida, S., 1992. Wave-‐Form inversion for rupture process using a nonflat sea-‐floor model -‐ application to 1986 Andreanof Islands and 1985 Chile earthquakes, Tectonophysics, 211, 45-‐59.
Yoshida, S., Koketsu, K., Shibazaki, B., Sagiya, T., Kato, T. & Yoshida, Y., 1996. Joint inversion of near-‐ and far-‐field waveforms and geodetic data for the rupture process of the 1995 Kobe earthquake, J. Phys. Earth, 44, 437-‐454.
Zhang, J. & Lay, T., 1990. Source parameters of the 1989 Loma Prieta Earthquake determined from long-‐period Rayleigh waves, Geophysical Research Letters, 17, 1195-‐1198.
Zor, E., Sandvol, E., Gürbüz, C., Türkelli, N., Seber, D. & Barazangi, M., 2003. The crustal structure of the East Anatolian plateau (Turkey) from receiver functions, Geophysical Research Letters, 30, 8044.
Zwick, P., McCaffrey, R. & Abers, G.A., 1994. MT5 programIASPEI Software Library 4.
25
Tables
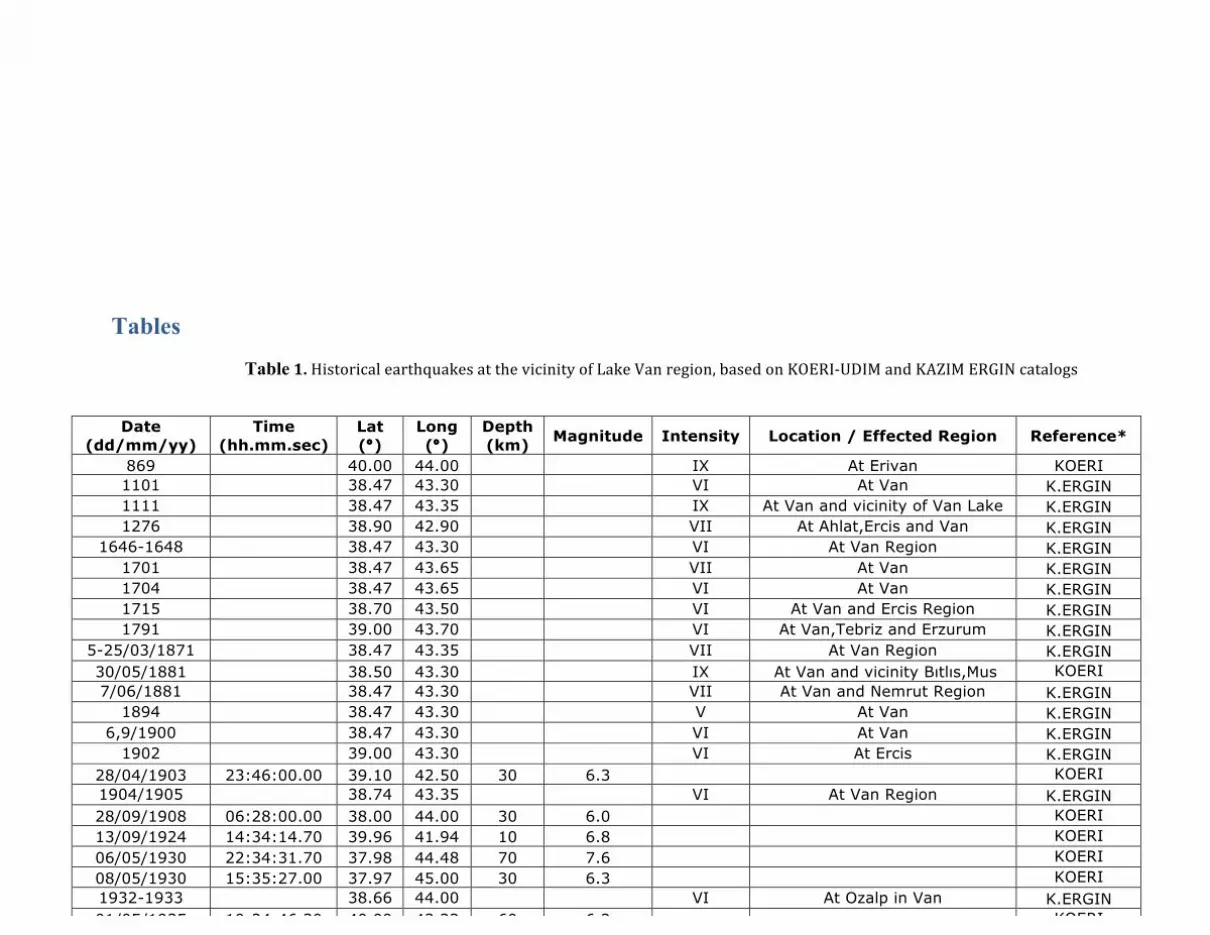
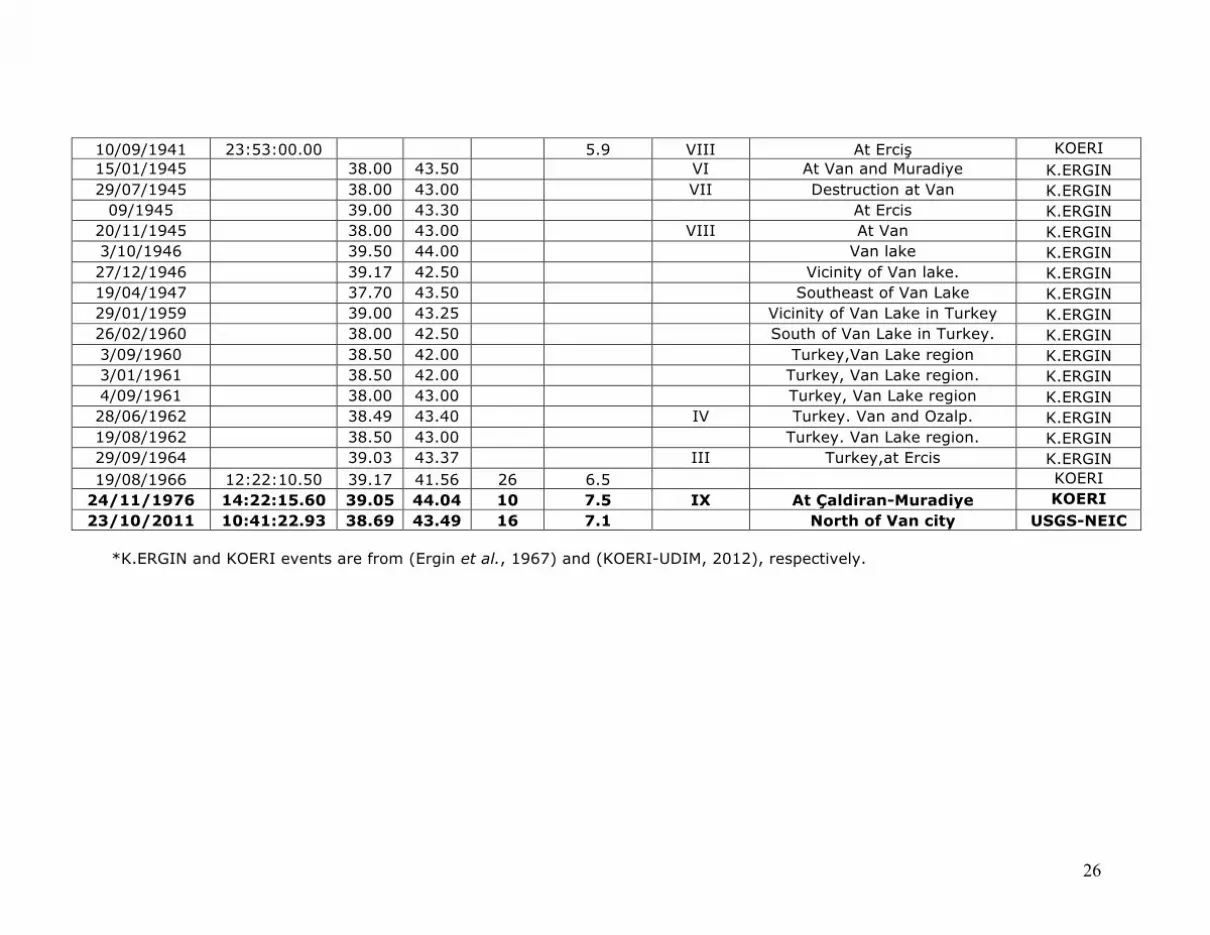
Table 1. Historical earthquakes at the vicinity of Lake Van region, based on KOERI-‐UDIM and KAZIM ERGIN catalogs
Date (dd/mm/yy)
Time (hh.mm.sec)
Lat (°)
Long (°)
Depth (km) Magnitude Intensity Location / Effected Region Reference*
869 40.00 44.00 IX At Erivan KOERI 1101 38.47 43.30 VI At Van K.ERGIN 1111 38.47 43.35 IX At Van and vicinity of Van Lake K.ERGIN 1276 38.90 42.90 VII At Ahlat,Ercis and Van K.ERGIN
1646-1648 38.47 43.30 VI At Van Region K.ERGIN 1701 38.47 43.65 VII At Van K.ERGIN 1704 38.47 43.65 VI At Van K.ERGIN 1715 38.70 43.50 VI At Van and Ercis Region K.ERGIN 1791 39.00 43.70 VI At Van,Tebriz and Erzurum K.ERGIN
5-25/03/1871 38.47 43.35 VII At Van Region K.ERGIN 30/05/1881 38.50 43.30 IX At Van and vicinity Bıtlıs,Mus KOERI 7/06/1881 38.47 43.30 VII At Van and Nemrut Region K.ERGIN
1894 38.47 43.30 V At Van K.ERGIN 6,9/1900 38.47 43.30 VI At Van K.ERGIN
1902 39.00 43.30 VI At Ercis K.ERGIN 28/04/1903 23:46:00.00 39.10 42.50 30 6.3 KOERI 1904/1905 38.74 43.35 VI At Van Region K.ERGIN 28/09/1908 06:28:00.00 38.00 44.00 30 6.0 KOERI 13/09/1924 14:34:14.70 39.96 41.94 10 6.8 KOERI 06/05/1930 22:34:31.70 37.98 44.48 70 7.6 KOERI 08/05/1930 15:35:27.00 37.97 45.00 30 6.3 KOERI 1932-1933 38.66 44.00 VI At Ozalp in Van K.ERGIN 01/05/1935 10:24:46.30 40.09 43.22 60 6.2 KOERI
26
10/09/1941 23:53:00.00 5.9 VIII At Erciş KOERI 15/01/1945 38.00 43.50 VI At Van and Muradiye K.ERGIN 29/07/1945 38.00 43.00 VII Destruction at Van K.ERGIN
09/1945 39.00 43.30 At Ercis K.ERGIN 20/11/1945 38.00 43.00 VIII At Van K.ERGIN 3/10/1946 39.50 44.00 Van lake K.ERGIN 27/12/1946 39.17 42.50 Vicinity of Van lake. K.ERGIN 19/04/1947 37.70 43.50 Southeast of Van Lake K.ERGIN 29/01/1959 39.00 43.25 Vicinity of Van Lake in Turkey K.ERGIN 26/02/1960 38.00 42.50 South of Van Lake in Turkey. K.ERGIN 3/09/1960 38.50 42.00 Turkey,Van Lake region K.ERGIN 3/01/1961 38.50 42.00 Turkey, Van Lake region. K.ERGIN 4/09/1961 38.00 43.00 Turkey, Van Lake region K.ERGIN 28/06/1962 38.49 43.40 IV Turkey. Van and Ozalp. K.ERGIN 19/08/1962 38.50 43.00 Turkey. Van Lake region. K.ERGIN 29/09/1964 39.03 43.37 III Turkey,at Ercis K.ERGIN 19/08/1966 12:22:10.50 39.17 41.56 26 6.5 KOERI
24/11/1976 14:22:15.60 39.05 44.04 10 7.5 IX At Çaldiran-Muradiye KOERI 23/10/2011 10:41:22.93 38.69 43.49 16 7.1 North of Van city USGS-NEIC
*K.ERGIN and KOERI events are from (Ergin et al., 1967) and (KOERI-UDIM, 2012), respectively.
27
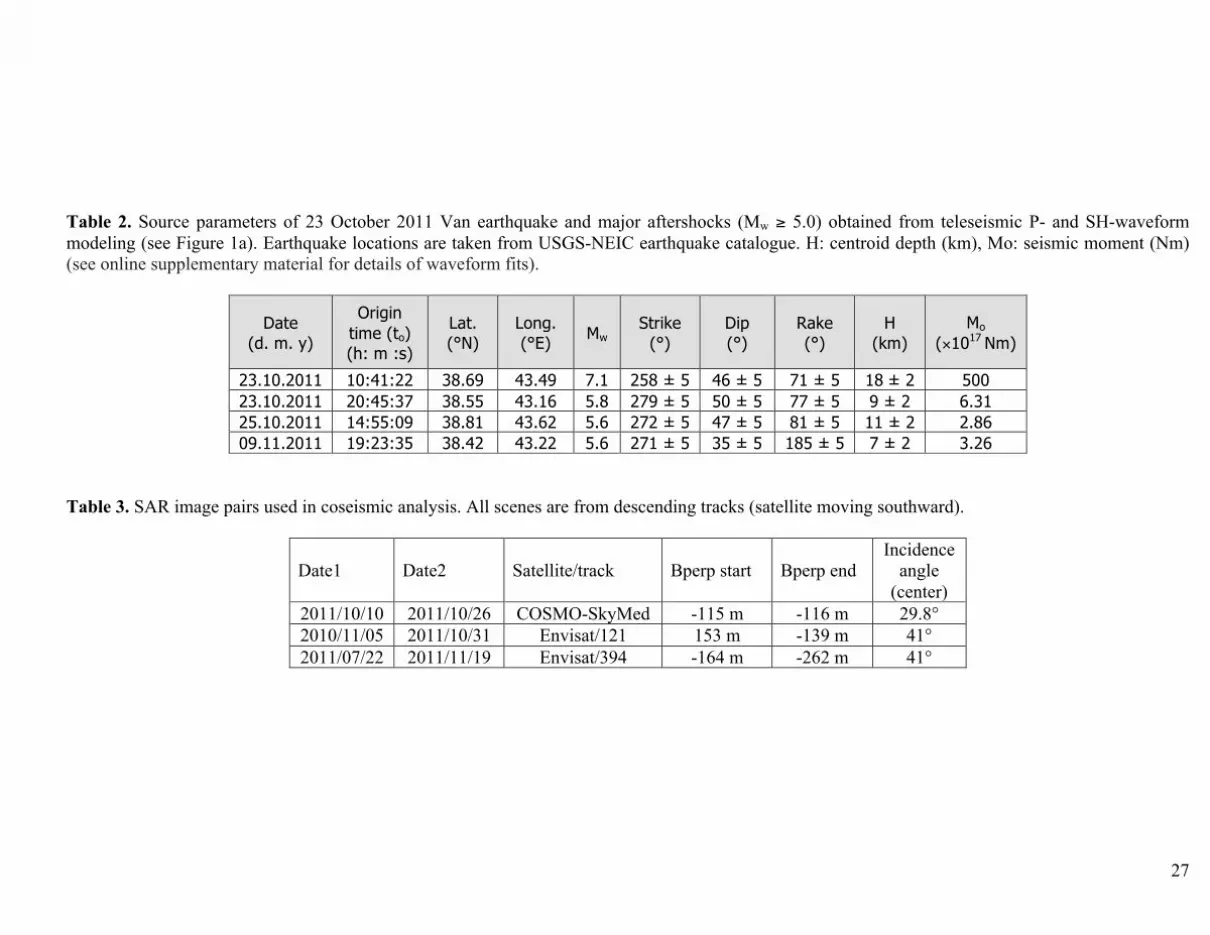
Table 2. Source parameters of 23 October 2011 Van earthquake and major aftershocks (Mw ≥ 5.0) obtained from teleseismic P- and SH-waveform modeling (see Figure 1a). Earthquake locations are taken from USGS-NEIC earthquake catalogue. H: centroid depth (km), Mo: seismic moment (Nm) (see online supplementary material for details of waveform fits).
Date (d. m. y)
Origin time (to) (h: m :s)
Lat. (°N)
Long. (°E) Mw Strike
(°) Dip (°)
Rake (°)
H (km)
Mo (×1017 Nm)
23.10.2011 10:41:22 38.69 43.49 7.1 258 ± 5 46 ± 5 71 ± 5 18 ± 2 500 23.10.2011 20:45:37 38.55 43.16 5.8 279 ± 5 50 ± 5 77 ± 5 9 ± 2 6.31 25.10.2011 14:55:09 38.81 43.62 5.6 272 ± 5 47 ± 5 81 ± 5 11 ± 2 2.86 09.11.2011 19:23:35 38.42 43.22 5.6 271 ± 5 35 ± 5 185 ± 5 7 ± 2 3.26
Table 3. SAR image pairs used in coseismic analysis. All scenes are from descending tracks (satellite moving southward).
Date1 Date2 Satellite/track Bperp start Bperp end Incidence
angle (center)
2011/10/10 2011/10/26 COSMO-SkyMed -115 m -116 m 29.8° 2010/11/05 2011/10/31 Envisat/121 153 m -139 m 41° 2011/07/22 2011/11/19 Envisat/394 -164 m -262 m 41°
28
Figures
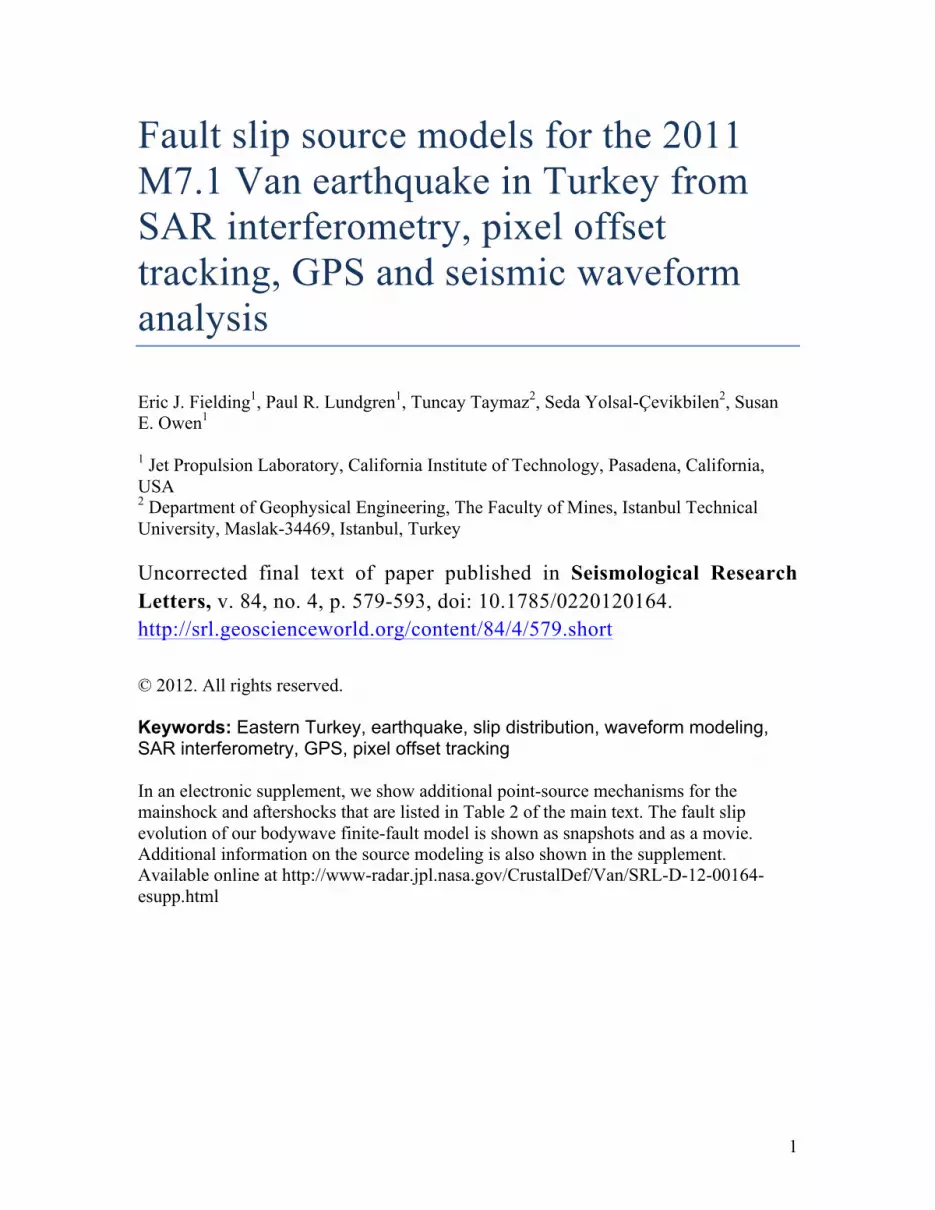
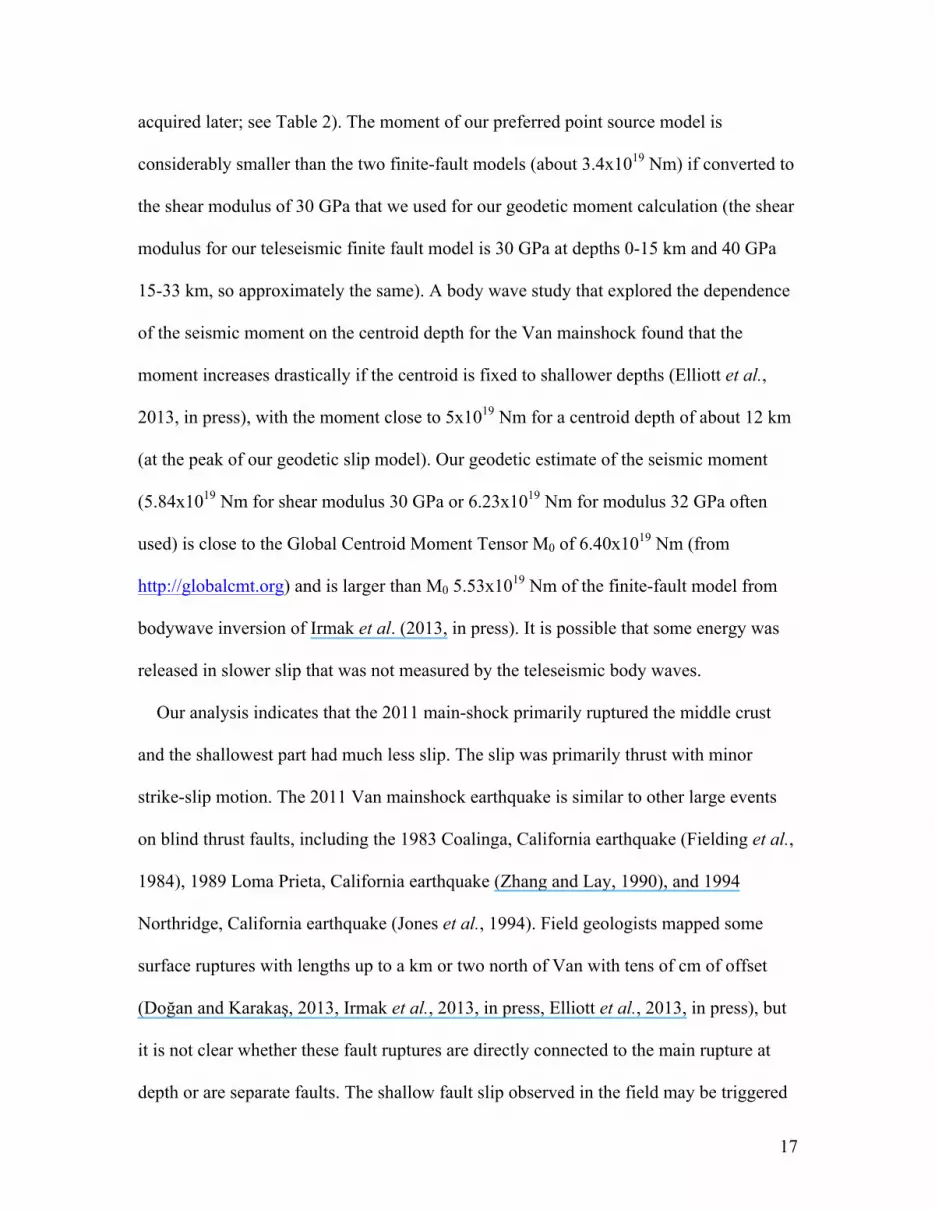
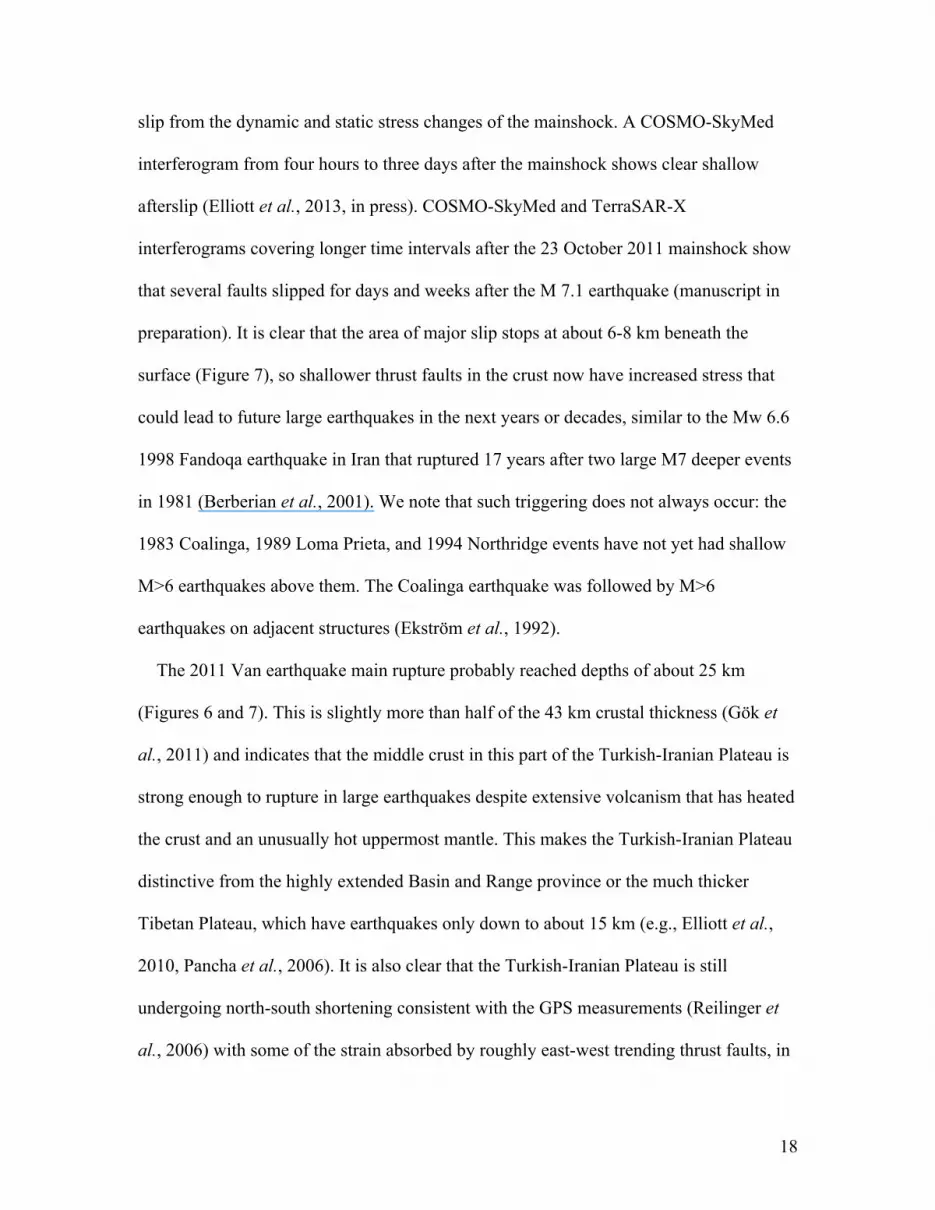
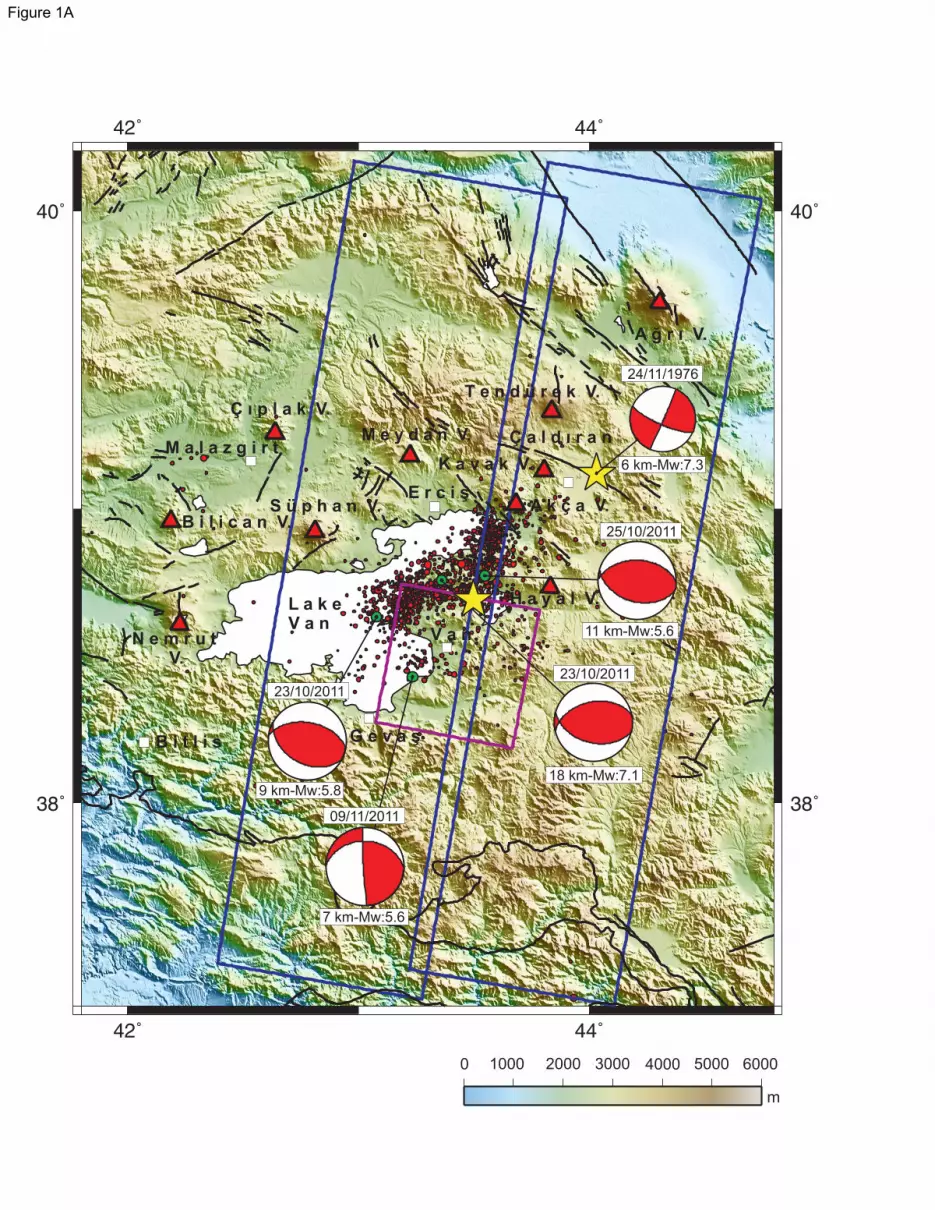
Figure 1. (a) Location map with the 2011 Mw 7.1 Van earthquake mainshock (yellow star; NEIC
location) and aftershock (red circle) epicenters (KOERI-UDIM) plotted over shaded relief
topography from GMTED2010. Rectangular outlines (dark blue) show coverage of the Envisat and
(purple) COSMO-SkyMed SAR images used in the geodetic data analysis. Locations of major
volcanoes and cities in the area are shown by red triangles and pink squares, respectively. Black lines
indicate active faults mapped in the area. Lower hemisphere projections of the focal mechanisms
corresponding to the minimum misfit solutions of earthquakes studied here (2011 events; see Table 2
and on-line supplementary material for details) and by earlier workers (1976 event; Nabelek 1984,
Taymaz, 1996) are also plotted, with green circles for KOERI-UDIM locations of 2011 events.
Compressional quadrants are colored in red. Event dates, magnitudes (Mw) and the focal depths (h)
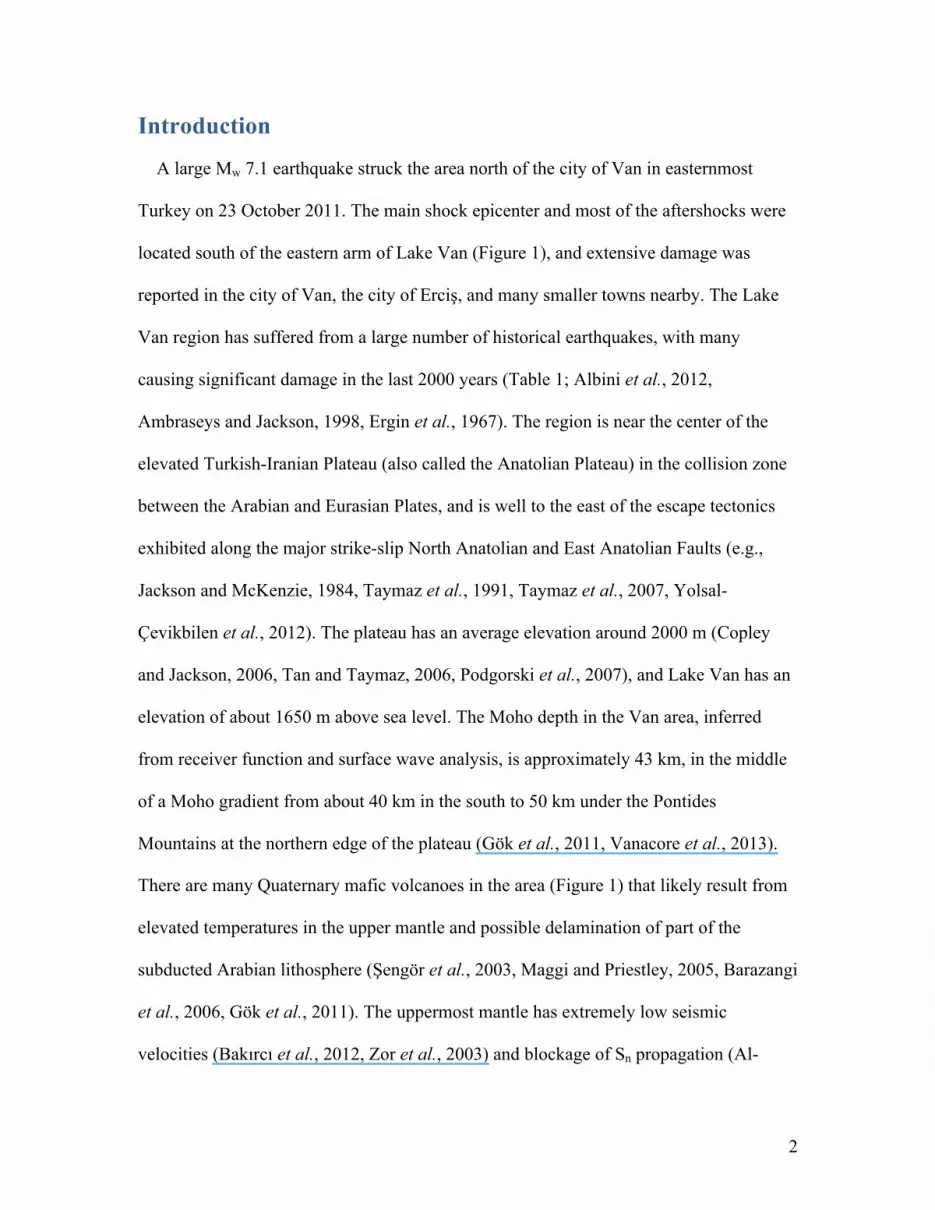
obtained from the inversion are shown above and below the focal spheres, respectively. (b) Locations
of historical earthquakes since 1894 (blue squares marked nearby with dates as dd-mm-yyyy) plotted
over shaded relief topography. Other symbols are as in (a). Yellow stars show locations of 2011 Van
and 1976 Çaldıran-Muradiye earthquakes (see Table 1).
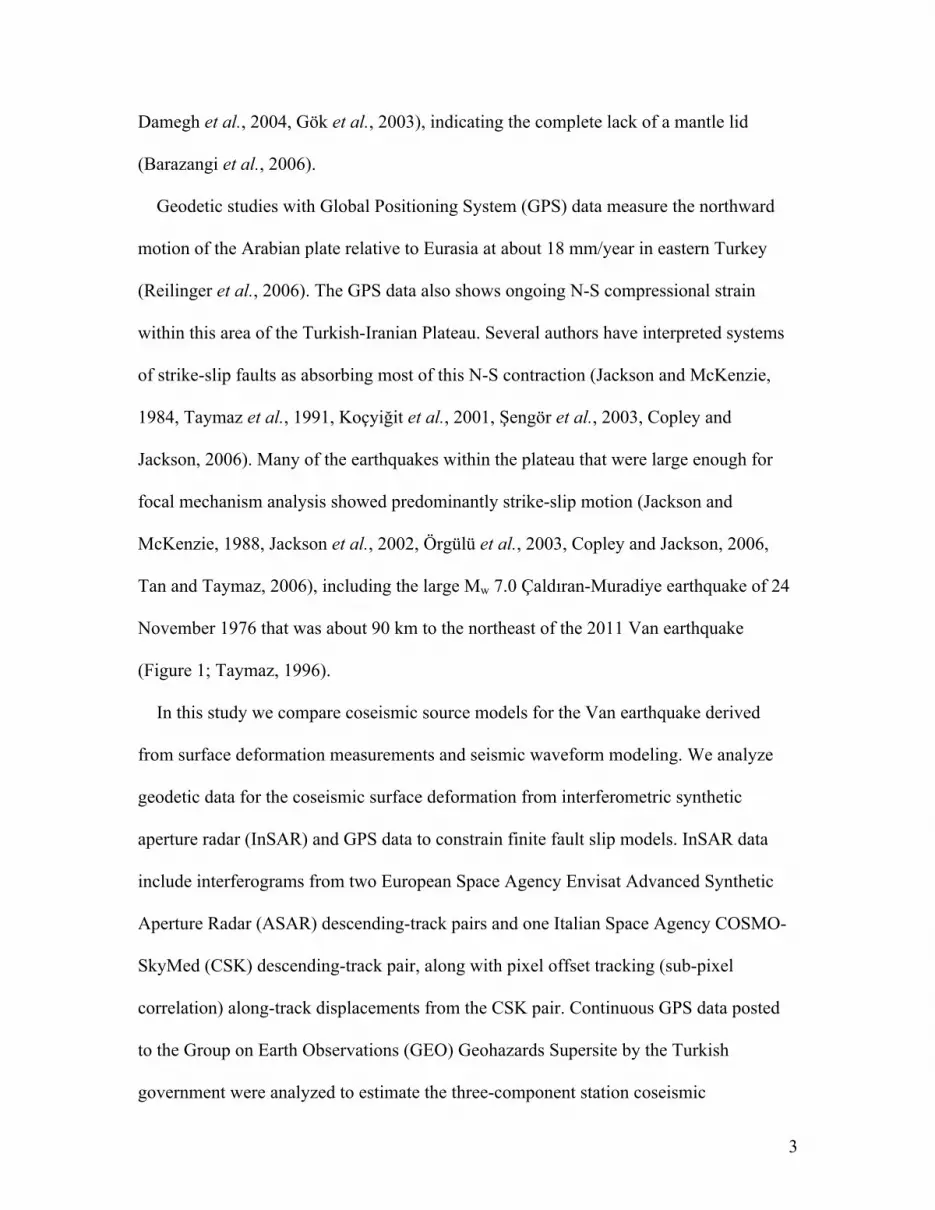
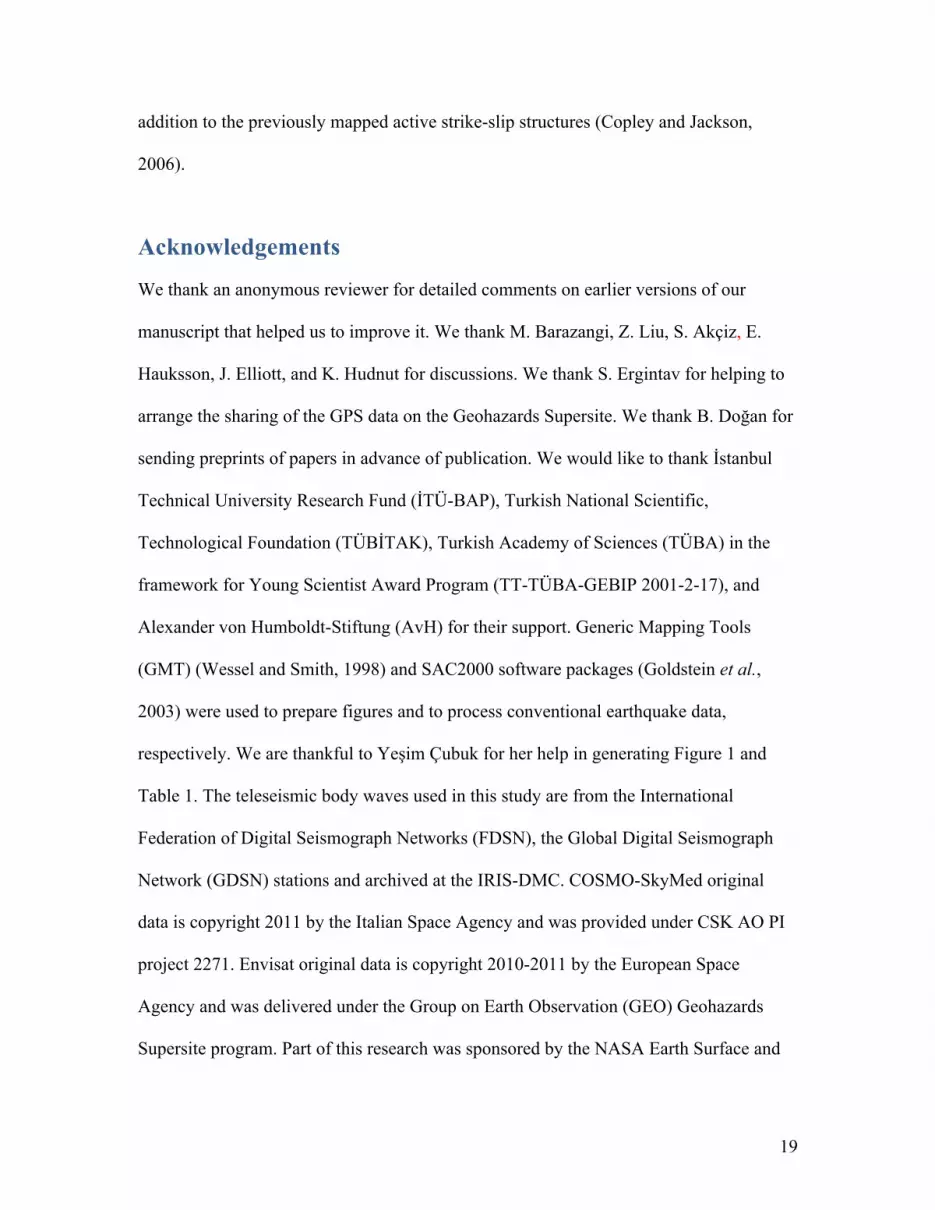
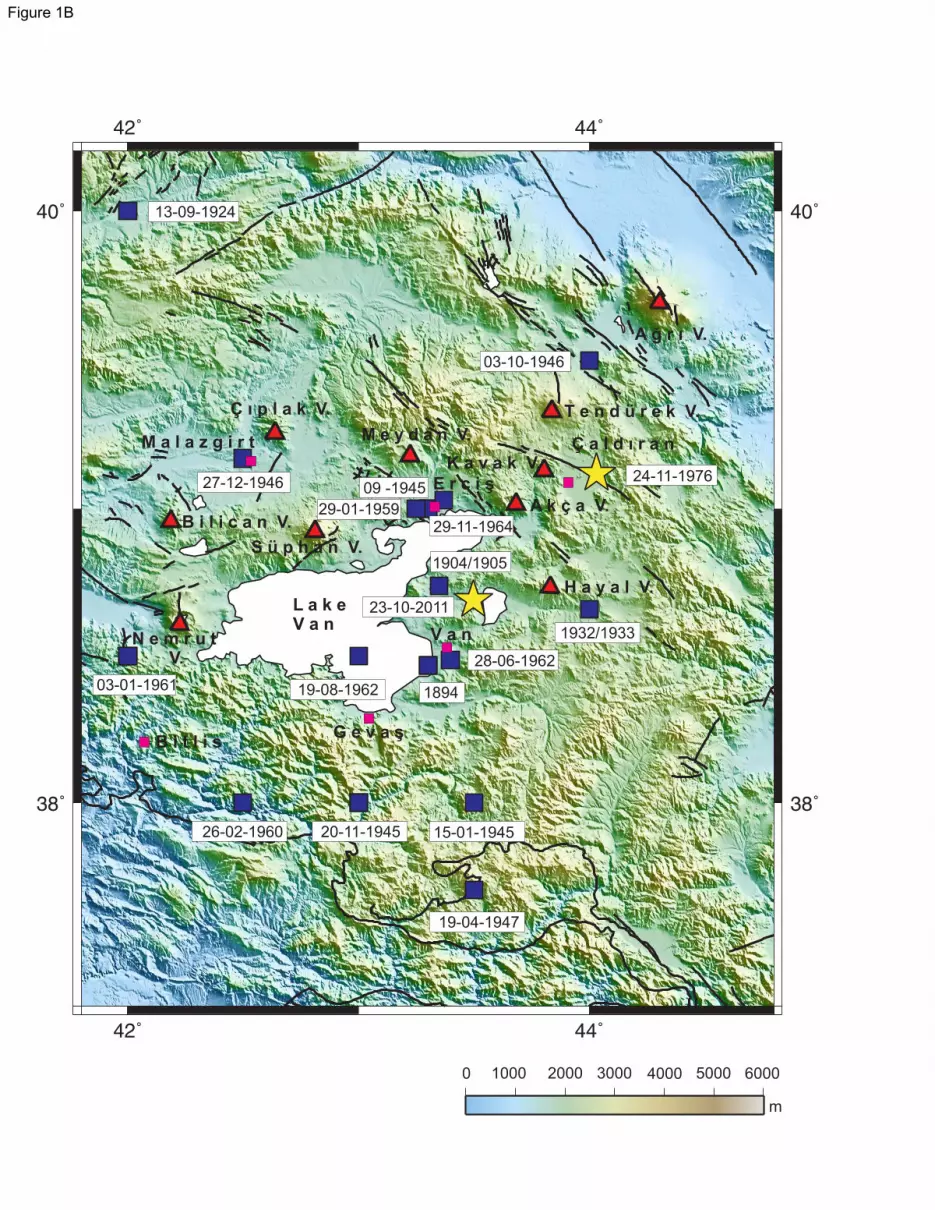
Figure 2. The radiation patterns and synthetic waveform fits for the minimum misfit solution
obtained from the point-source inversion of the 2011 Van mainshock. Fits to all long-period 32 P-
and 13 SH-waveforms (solid lines) used in the inversion are shown as dashed lines. Beneath the
header at the top of the figure, which shows the date and moment magnitude, are given the strike, dip
and rake angles of the first and second nodal planes (NP), focal depth (h) and seismic moment (Mo).
The source time function (STF) is shown in the middle of the figure, and beneath it is the time scale
used for the waveforms. Focal spheres are shown with P- (top) and SH- (bottom) nodal planes in
lower hemisphere projections. The vertical bar beneath the focal spheres shows the waveform
displacement scale in microns, with the lower case letter identifying the instrument type (d: GDSN
29
long-period). Station positions are indicated by letter and are arranged alphabetically clockwise,
starting from north. The P- and T-axes are marked by solid and open circles, respectively. Total
duration of source time function (STF) is 14 s, but most of the moment release occurred in the first
10 s.
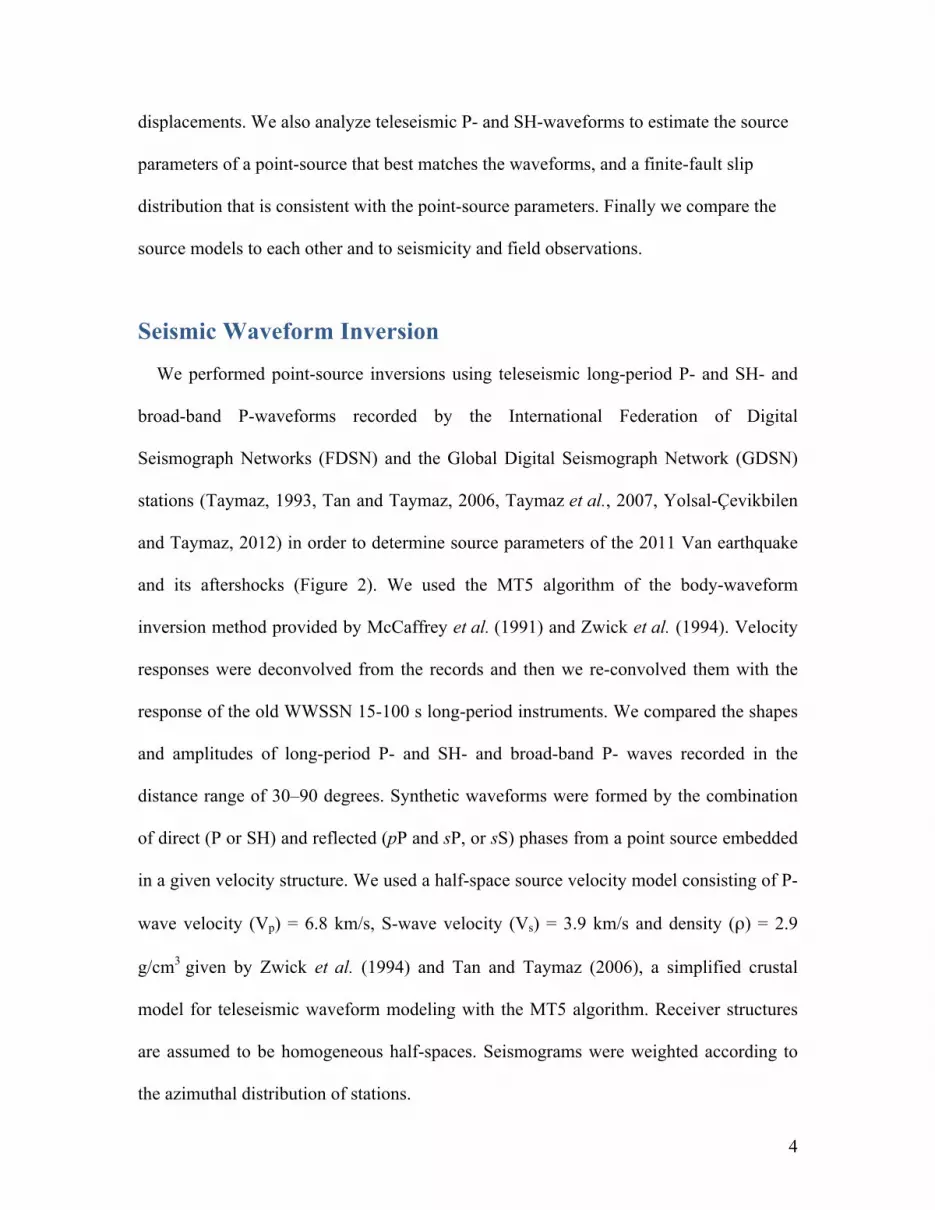
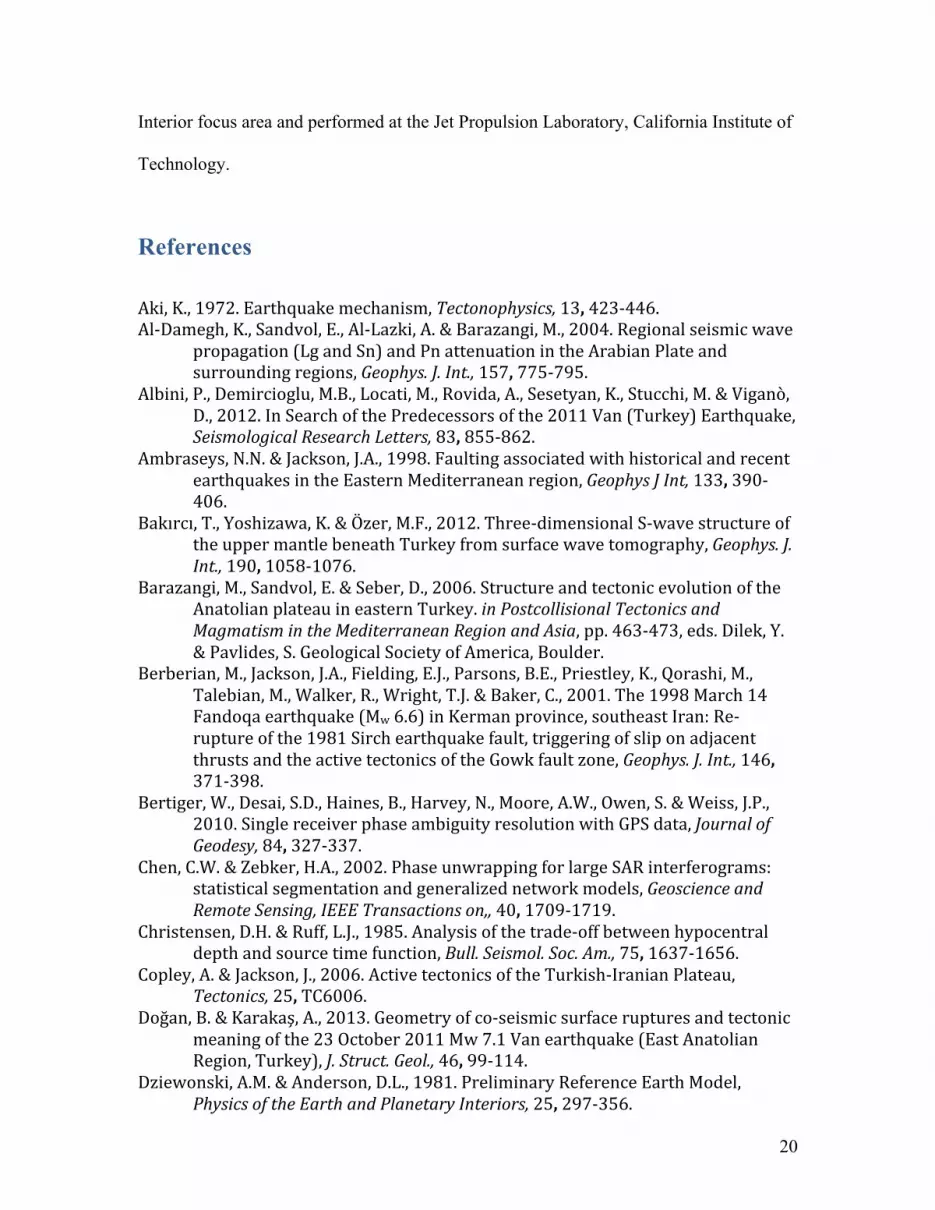
Figure 3. (Left) Focal mechanism, co-seismic slip distribution and total moment rate function of
the October 23, 2011 Van earthquake from teleseismic broad-band body-wave finite-fault inversion.
The strike, dip and rake angles of the first and second nodal planes (NP) and focal depth obtained
from minimum misfit point-source solution are given in the header. Slip model is derived on NP1.
The white star indicates the location of the rupture initiation (initial break) located at a depth of about
18 km (origin of the plot axes). The slip vectors and the distribution of slip magnitudes are also
presented. Along-dip distances shown on the left side and depth beneath the surface on the right side.
The color scale shows the displacement magnitude in meters. (Right) Comparison of the observed
(black) and synthetic (red) broad band P-waveforms used in slip distribution inversion. Station code
and maximum amplitude are above the waveforms, station azimuth and distance are below.
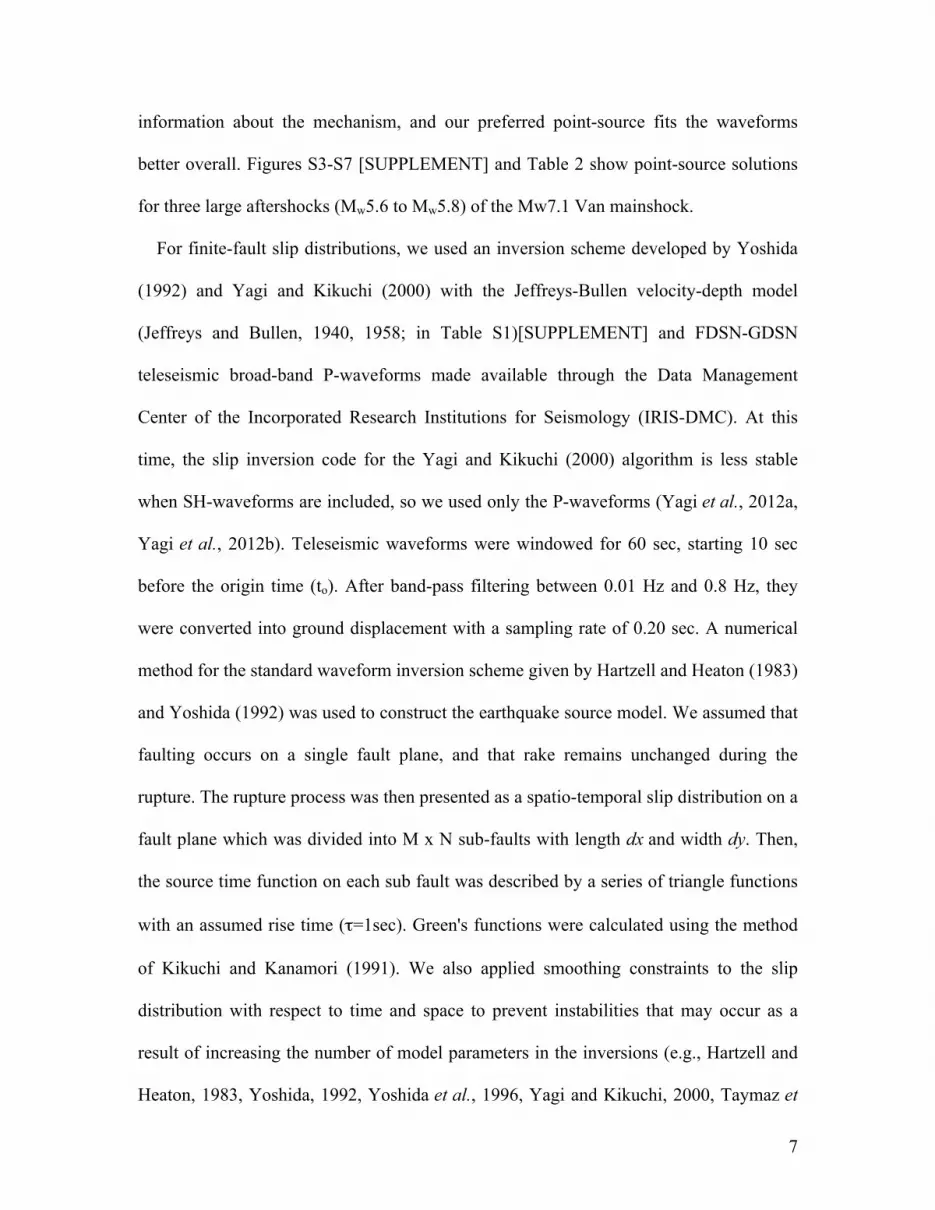
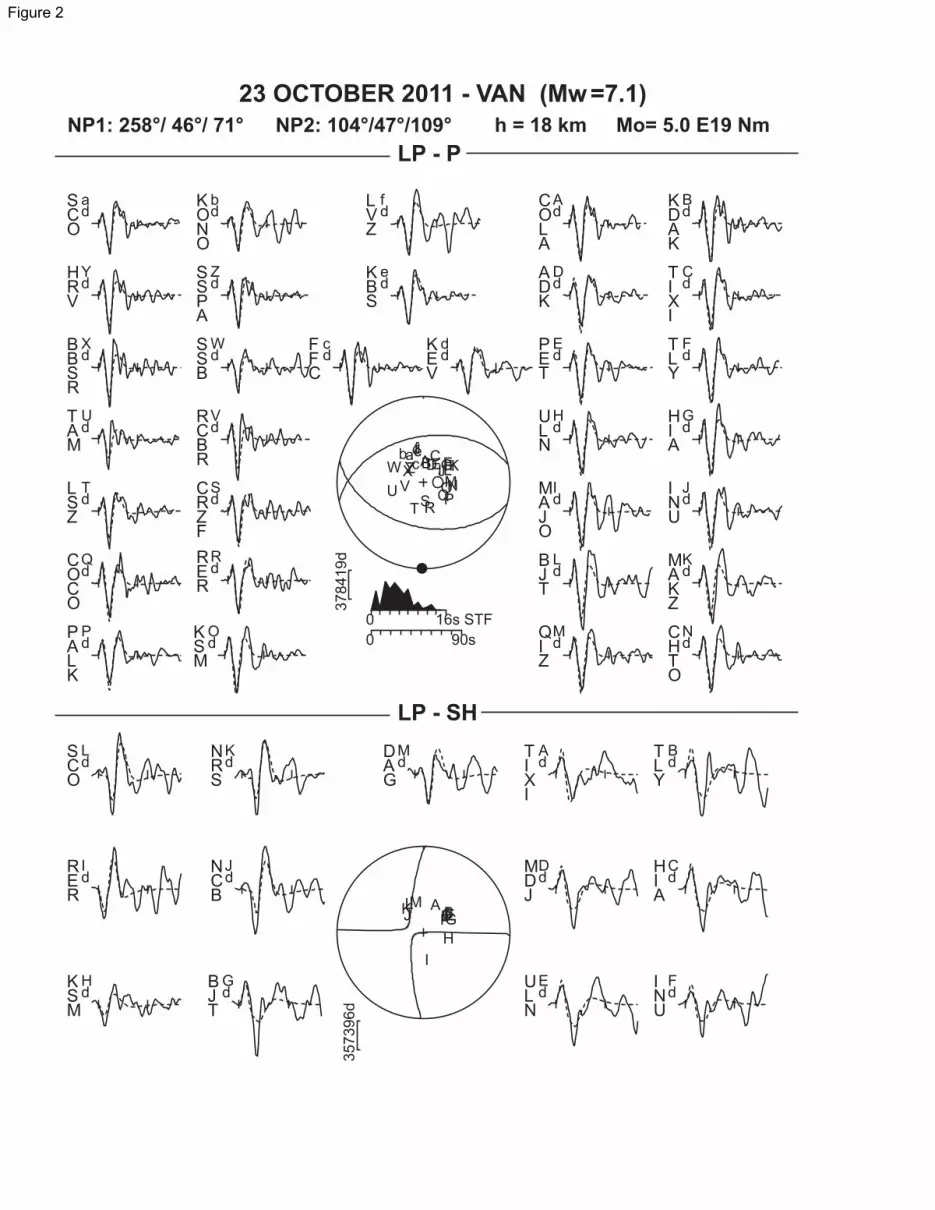
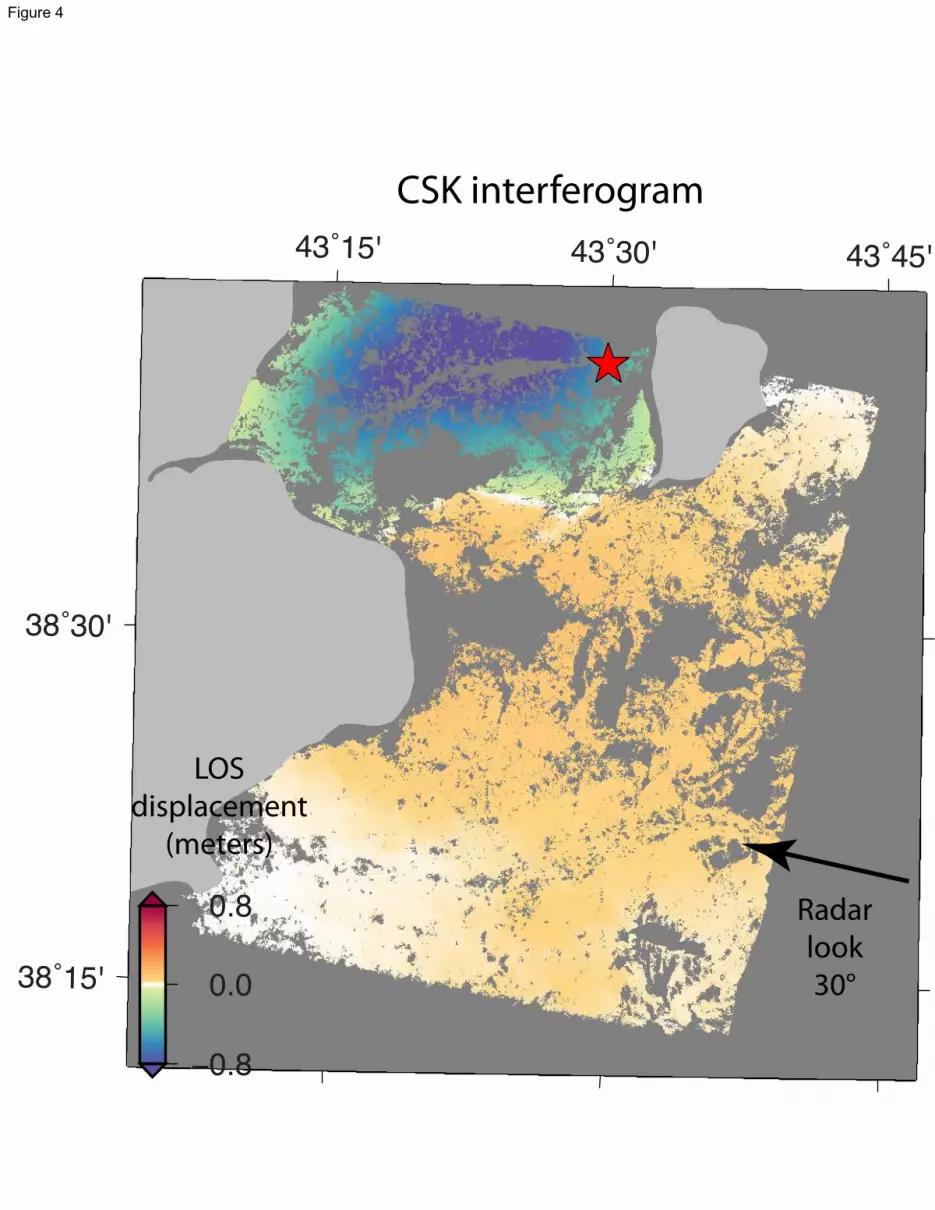
Figure 4. COSMO-SkyMed interferogram from 2011/10/10–2011/10/26, unwrapped phase
converted to line-of-sight displacements in meters. Negative displacement means range to satellite
decreased as surface moved upward or eastward. Red star is epicenter of Mw 7.1 mainshock.
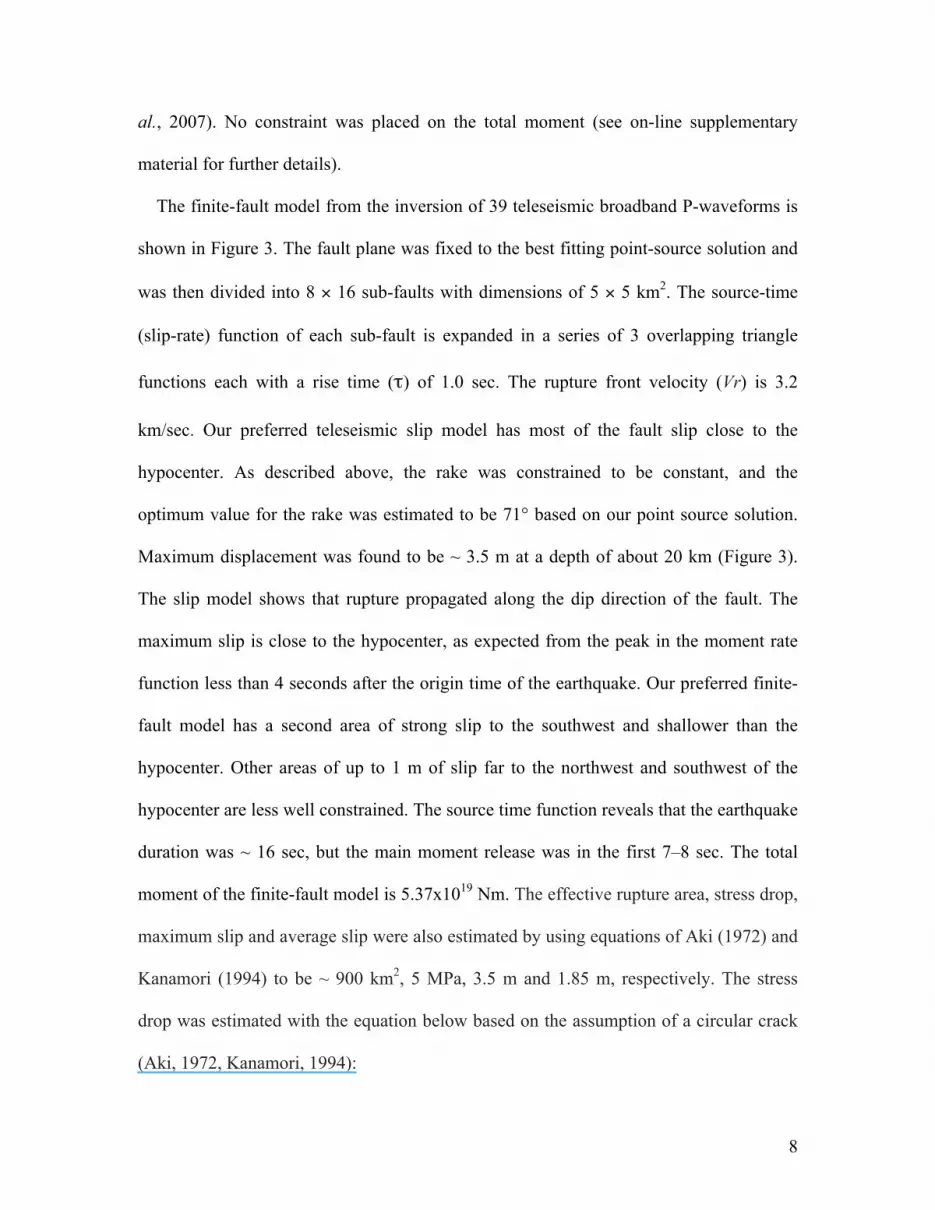
Figure 5. Envisat interferograms from both tracks combined (see Table 2 for dates) with GPS
coseismic horizontal offsets. Unwrapped phase converted to line-of-sight range change in meters.
GPS error ellipses are 95% confidence interval. Red star is mainshock epicenter.
Figure 6. COSMO-SkyMed pixel tracking offsets in the along-track direction from 2011/10/10–
2011/10/26. Positive displacements are to the south. Red star is epicenter of Mw 7.1 mainshock.
Figure 7. Views of estimated most probable fault geometry and slip distribution from geodetic
data inversion. Color shows slip magnitude and arrows show direction of motion of hanging wall on
each fault patch. Easting and northing are local coordinates relative to latitude 38.5° and longitude
30
43.5°. Large blue circle shows mainshock location from the USGS National Earthquake Information
Center and small cyan circles show locations of aftershocks with magnitude greater than 3 from the
KOERI catalog (KOERI-UDIM, 2012). (a) Map view of fault patches projected to surface. (b) Fault
normal view of hanging wall (looking roughly south) showing fault slip distribution in cross-section
with 1:1 vertical scale. Aftershocks with fixed depths have been removed from this view.
Figure 8. Estimated posterior error distributions for the geometrical parameters of the fault from
the geodetic data inversion after 60,000 runs. Solid lines on histograms mark the most probable
solution. Dashed lines mark the 95% probability limits estimated from histogram.
Figure 9. Estimated posterior distribution functions for weighting and smoothing parameters from
geodetic inversion after 60,000 runs. Panels (a) and (b) show dataset weighting factors for SAR and
GPS datasets, respectively. Panels (c) and (d) show smoothing parameters for dip-slip and strike-slip
components of fault slip, respectively. Solid lines on histograms mark the most probable solution.
Dashed lines mark the 95% probability limits estimated from histogram.
Figure 10. Geodetic data inputs, model predictions and residuals for most probable model from
geodetic inversion. Left column shows the sampled SAR interferograms and along-track offsets
along with GPS coseismic displacements (black vectors are horizontal and red vectors are vertical
displacements). Middle column shows predictions from most probable model, and right column
shows residual of data minus model. GPS error ellipses (black) at 95% confidence for horizontal
displacements shown on residual plot along with blue bars (2 σ) for vertical errors. Note that map
scale for COSMO-SkyMed data (top two rows) is different from the rest of the rows.
G e v a şB i t l i s
V a n
H a y a l V.
A k ç a V.E r c i ş
L a k eV a n
N e m r u tV.
B i l i c a n V.S ü p h a n V.
M a l a z g i r t
Ç ı p l a k V.
M e y d a n V.
K a v a k V.
Ç a l d ı r a n
T e n d ü r e k V.
A ğ r ı V.
200010000 3000 4000 5000 6000
m
24/11/1976
6 km-Mw:7.3
25/10/2011
11 km-Mw:5.6
23/10/2011
18 km-Mw:7.1
23/10/2011
9 km-Mw:5.8
09/11/2011
7 km-Mw:5.6
Figure 1A
200010000 3000 4000 5000 6000
m
G e v a şB i t l i s
V a n
H a y a l V.
A k ç a V.
E r c i ş
L a k eV a n
N e m r u tV.
B i l i c a n V.
M a l a z g i r t
Ç ı p l a k V.
M e y d a n V.
K a v a k V.Ç a l d ı r a n
T e n d ü r e k V.
A ğ r ı V.
1894
28- -196206
1932/1933
29- -195901
1904/1905
27- -194612
13- -192409
0 103- -1946
19- -196208
29- -196411
26- -196002 20- -194511 15- -194501
19- -194704
0 013- -1961
23 10 2011- -
24 11 1976- -
S ü p h a n V.
09 45-19
Figure 1B
378419d
0 90s
0 16s STF
A
COLA
Ad
B
KDAK
Bd
C
TIXI
Cd
D
ADK
Dd
E
PET
Ed
F
TLY
Fd
G
HIA
Gd
H
ULN
Hd
I
MAJO
Id
J
INU
Jd
K
MAKZ
Kd
L
BJT
Ld
M
QIZ
Md
N
CHTO
Nd
O
KSM
Od
P
PALK
Pd
Q
COCO
Qd
R
RER
Rd
SCRZF
Sd
T
LSZ
Td
U
TAM
Ud
V
RCBR
Vd
W
SSB
Wd
X
BBSR
Xd
Y
HRV
Yd
Z
SSPA
Zd
b
KONO
bd
a
SCO
ad
c
FFC
cd
d
KEV
dd
e
KBS
ed
f
LVZ
fd
357396d
A
TIXI
Ad
B
TLY
Bd
C
HIA
Cd
D
MDJ
Dd
E
ULN
Ed
F
INU
Fd
G
BJT
Gd
H
KSM
Hd
I
RER
Id
J
NCB
Jd
K
NRS
Kd
L
SCO
Ld
M
DAG
Md
LP - SH
LP - P
23 OCTOBER 2011 - VAN ( =7.1)Mw
NP2: 104°/47°/109° h = 18 km Mo= 5.0 E19 NmNP1: 258°/ 46°/ 71°
Figure 2

Strike (km)
Alo
ng
dip
(km
)
Slip (m)
23 OCTOBER 2011 - VAN
NP1: 258°/46°/71° NP2: 104°/47°/109°
Focal Depth : 18 km
Seismic Moment (Nm): 5.37 E19 Nm
WE
4°/76°
7°/77°
23°/52°
52°/43°
57°/71°
77°/66°
96°/51°
123°/45°
176°/63°
242°/70°
286°/36°
317°/79°
322°/87°
5°/76° 6°/79°
8°/82°
34°/72°
53°/61°
62°/63°
88°/40°
101°/72°
143°/53°
197°/69°
246°/53°
292°/52°
318°/78°
340°/82°
12°/83°
52°/53°
56°/46°
76°/65°
89°/79°
103°/71°
162°/44°
230°/71°
254°/35°
305°/82°
319°/84°
359°/83°
0
18
De
pth
(k
m)
32
Figure 3
43˚15' 43˚30' 43˚45'
38˚15'
38˚30'
−0.8
0.0
0.8
CSK interferogram
LOS
displacement
(meters)
Radar
look
30°
Figure 4
D394D394
−0.3
0.0
0.3
D121
LOS
change
meters
41˚30' 42˚00' 42˚30' 43˚00' 43˚30' 44˚00' 44˚30'
37˚30'
38˚00'
38˚30'
39˚00'
39˚30'
40˚00'
AGRD
BASK
HAKK
HINI
HORS
IGIR
MALZ
MURA
MUUS
OZAL
SIRN
SIRT
TVAN
1 cm−0.3
0.0
0.3
Envisat interferograms
Figure 5
43˚15' 43˚30' 43˚45'
38˚15'
38˚30'
−0.6
0.0
0.6
CSK along-track o�sets
Track
direction
Displacement
(meters)
Figure 6
0
3.67
Slip
(meters)
−60 −50 −40 −30 −20 −10 0 10 20 30−30
easting (km)
−20
−10
0
10
20
30
40
50
northing (km)
2.45
1.22
−30
−25
−20
−15
−10
−5
0
z(km)
−60−50−40−30−20−100102030
easting (km)
NE SW
(A)
(B)
Figure 7

35 40 45 500
5000
10000
length
km30 35 400
5000
10000
15000
width
km
0
2000
4000
6000
8000
dip
degrees254 256 258 260 2620
5000
10000
15000
strike
degrees cw from N
−16 −14 −12 −10 −80
5000
10000
15000
Easting
km10.5 11 11.5 12 12.50
5000
10000
15000
Northing
km
(A)
(C)
(E)
38 40 42 44 46
(F)
(D)
(B)
47.7
+0.5
−6.3
44.4
+2.1
−5.9
258.7°
+1.6
−1.2
42.5°
+2.2
−1.2
11.2
+0.6
−0.2
−12.1
+2.7
−0.8
Figure 8
10 12 14 16 180
5000
10000
sig 1
data sigma factor0.5 1 1.5 2 2.50
5000
10000
sig 2
data sigma factor
4 6 8 10 12
x 10−8
0
5000
10000
gamma 1
slip smoothing factor
4.5 5 5.5 6 6.5
x 10−8
0
5000
10000
gamma 2
slip smoothing factor
12.1
+2.7
−0.8
2.1
+0.3
−1.0
(A) (B)
6.9e−8
+1.7e−8
−1.9e−8
4.9e−8
+0.9e−8
−0.1e−8
(D)(C)
Figure 9
−200 −100 0 100
AGRD
BASK
HAKK
HINI
HORS IGIR
MALZ MURA
MUUS OZAL
SEMD
SIRN
SIRT
TVAN
0.03 m
easting (km)
Env_D121_SIM_int
−200 −100 0 100easting (km)
coseismic_offsets_van_V1.0−3D
surf. displ. (m) −0.09 1
−100
0
100
200
no
rthin
g (k
m)
surf. displ. (m) −0.1 0.35
−200 −100 0 100
−100
0
100
200
easting (km)
no
rthin
g (k
m)
CSK_desc_int_v2
−20
0
20
no
rthin
g (k
m)
−20 0 20easting (km)
−20 0 20easting (km)
−20 0 20easting (km)
Env_D394_int
−100
0
100
200
no
rthin
g (k
m)
surf. displ. (m) −0.08 0.12
CSK_desc_azo
−20
0
20
no
rthin
g (k
m)
surf. displ. (m) −0.39 0.46
Figure 10