Embed Size (px)
Citation preview


Copyright
This document is Copyright © 2021 by the LibreOffice Documentation Team. Contributors are listed below. This document maybe distributed and/or modified under the terms of either the GNUGeneral Public License (https://www.gnu.org/licenses/gpl.html), version 3 or later, or the CreativeCommons Attribution License (https://creativecommons.org/licenses/by/4.0/), version 4.0 or later.
All trademarks within this guide belong to their legitimate owners.
ContributorsTo this edition.
Peter Schofield Regina Henschel Elzett KotzeDavid Barton Jean Hollis Weber Winston Min Tjong
To previous editions.
Martin Fox John Cleland Jean Hollis WeberJohn A Smith Peter Schofield Vipul GuptaKees Kriek Claire Wood Hazel RussmanRegina Henschel
FeedbackPlease direct any comments or suggestions about this document to the Documentation Team’s mailing list: [email protected]
Note
Everything sent to a mailing list, including email addresses and any other personal information that is written in the message, is publicly archived and cannot be deleted.
Publication date and software versionPublished July 2021. Based on LibreOffice 7.1 Community. Other versions of LibreOffice may differ in appearance and functionality.
Documentation for LibreOffice is available at http://documentation.libreoffice.org/en/

ContentsCopyright...................................................................................................................................2
Preface................................................................................................................................6Who is this user guide for?........................................................................................................7
What is in this user guide?........................................................................................................7
Minimum requirements for using LibreOffice.............................................................................7
How to get LibreOffice...............................................................................................................7
Installing LibreOffice..................................................................................................................7
Setting up and customizing LibreOffice.....................................................................................7
Extensions and add-ons............................................................................................................8
Where to get more help.............................................................................................................8
What you see may be different................................................................................................10
Using LibreOffice on macOS...................................................................................................11
Who wrote this user guide?.....................................................................................................11
Frequently asked questions.....................................................................................................11
What is new in LibreOffice 7.1?...............................................................................................12
Chapter 1 Introducing Draw...........................................................................................13Introduction.............................................................................................................................14
Draw main window..................................................................................................................14
Choosing and defining colors..................................................................................................21
Grid, snap, and help lines........................................................................................................22
Chapter 2, Drawing Basic Shapes.................................................................................23Introduction.............................................................................................................................24
Drawing basic shapes.............................................................................................................24
Glue points and connectors.....................................................................................................34
Drawing geometric shapes......................................................................................................35
Adding, inserting and formatting text.......................................................................................37
Chapter 3 Working with Objects....................................................................................38Introduction.............................................................................................................................39
Selecting objects.....................................................................................................................39
Positioning and adjusting objects............................................................................................40
Using grid and snap functions.................................................................................................50
Using Helplines.......................................................................................................................56
Changing object shape............................................................................................................56
Chapter 4, Changing Object Attributes.........................................................................68Formatting lines.......................................................................................................................69
Formatting area fills.................................................................................................................77
Working with area fills.............................................................................................................82
Shadows.................................................................................................................................96
Transparencies.......................................................................................................................97
Drawing styles.........................................................................................................................98
Special effects.......................................................................................................................103
Draw Guide 7.1 | 3

Chapter 5, Combining Multiple Objects......................................................................110Grouping objects...................................................................................................................111
Combining objects.................................................................................................................113
Merging, subtracting, or intersecting objects.........................................................................115
Duplication and cross-fading.................................................................................................117
Positioning objects................................................................................................................120
Chapter 6, Editing Images............................................................................................123Introduction...........................................................................................................................124
Importing images...................................................................................................................124
Exporting graphics................................................................................................................128
Formatting images (raster objects)........................................................................................129
Cropping images...................................................................................................................133
Image filters..........................................................................................................................136
Replacing colors....................................................................................................................142
Conversion............................................................................................................................144
Chapter 7, Working with 3D Objects...........................................................................148Introduction...........................................................................................................................149
3D object types.....................................................................................................................149
Drawing toolbar.....................................................................................................................150
Creating 3D objects...............................................................................................................150
Editing 3D objects.................................................................................................................153
Combining objects.................................................................................................................166
Assembling 3D objects..........................................................................................................166
Chapter 8, Connections, Flowcharts, and Organization Charts...............................168Connectors and glue points...................................................................................................169
Flowcharts.............................................................................................................................178
Organization charts...............................................................................................................179
Chapter 9, Adding and Formatting Text......................................................................181Introduction...........................................................................................................................182
Text mode.............................................................................................................................182
Text boxes.............................................................................................................................183
Text in Draw objects..............................................................................................................187
Pasting text...........................................................................................................................189
Formatting text......................................................................................................................190
Bullet or numbered lists.........................................................................................................203
Using tables..........................................................................................................................208
Using fields...........................................................................................................................218
Using hyperlinks....................................................................................................................219
Image maps..........................................................................................................................221
Fontwork...............................................................................................................................223
Chapter 10, Printing, Exporting and Emailing............................................................226Printing..................................................................................................................................227
Exporting...............................................................................................................................233
4 | Draw Guide 7.1

Emailing documents..............................................................................................................235
Digital signatures...................................................................................................................235
Removing personal data.......................................................................................................236
Redaction..............................................................................................................................238
Chapter 11, Advanced Draw Techniques....................................................................240Drawing pages......................................................................................................................241
Master pages........................................................................................................................244
Templates..............................................................................................................................250
Multiple layers.......................................................................................................................258
Dimensioning........................................................................................................................261
Drawing to scale....................................................................................................................266
Multiple views of a drawing...................................................................................................267
Gallery...................................................................................................................................268
Colors....................................................................................................................................271
Bézier curves........................................................................................................................280
Adding comments to a drawing.............................................................................................283
Connecting and breaking lines..............................................................................................284
Coordinate system................................................................................................................284
Chapter 12, User Interface Variants.............................................................................286Introduction...........................................................................................................................287
Selecting user interface.........................................................................................................287
Standard Toolbar UI..............................................................................................................288
Tabbed UI..............................................................................................................................288
Tabbed Compact UI..............................................................................................................299
Groupedbar Compact UI.......................................................................................................299
Contextual Single UI.............................................................................................................300
Single Toolbar UI & Sidebar UI..............................................................................................300
Appendix A, Keyboard Shortcuts................................................................................301Introduction...........................................................................................................................302
Draw function key and keyboard shortcuts............................................................................302
Menu function key and keyboard shortcuts...........................................................................305
General function key and keyboard shortcuts.......................................................................309
Toolbar function key and keyboard shortcuts.........................................................................311
Appendix B, Toolbars....................................................................................................315Introduction...........................................................................................................................316
Using toolbars.......................................................................................................................316
Toolbars................................................................................................................................318
Draw Guide 7.1 | 5

Draw Guide
PrefaceDrawing Vector Graphics in LibreOffice

Who is this user guide for?
Anyone who wants to get up to speed quickly with LibreOffice Draw will find this guide very useful. You may be new to drawing software, or you may be familiar with another program.
What is in this user guide?
This book introduces the main features of LibreOffice Draw. Draw is a vector graphics drawing tool, although it can also perform some operations on raster graphics (pixels) such as photographs. Using Draw, a wide variety of graphical images can be quickly created.
A few examples of the drawing functions are: layer management, snap functions and grid-point system, dimensions and measurement display, connectors for making organization charts, 3D functions that enable small 3D drawings to be created (with texture and lighting effects), drawing and page-style integration, and Bézier curves.
The Draw Guide is not a course book to be worked through from beginning to end. Rather, it is a reference work in which can be browsed for guidance on particular topics.
Minimum requirements for using LibreOffice
For a detailed list of requirements and operating systems supported, see the LibreOffice website,https://www.libreoffice.org/get-help/system-requirements/
How to get LibreOffice
Versions of LibreOffice for Windows, Linux, and macOS are freely available and can be downloaded from https://www.libreoffice.org/download. Linux users will also find LibreOffice included free in many of the latest distributions.
Portable and other versions of LibreOffice are listed on the download page. Linux, Vanilla, and other versions may differ in a few features from the descriptions in this user guide.
Installing LibreOffice
Information on installing and setting up LibreOffice on the various supported operating systems isgiven here: https://www.libreoffice.org/get-help/install-howto/
Setting up and customizing LibreOffice
To change the default settings (options) in LibreOffice to suit your preferences, go to Tools > Options on the Menu bar (LibreOffice > Preferences in macOS).
Settings are described in LibreOffice Help and the Getting Started Guide. These two sources provide information on how to customize menus, toolbars, and keyboard shortcuts in LibreOffice Draw, add new menus and toolbars, and assign macros to events.
Tip
Many settings are intended for power users and programmers. If you do not understand what an option does, it is recommended leaving it on the default setting unless instructions in this user guide recommend changing the setting.
Setting up and customizing LibreOffice | 7

Extensions and add-ons
Functionality can be added to LibreOffice with extensions and add-ons. Several extensions are installed with the program and other expensions from the official extensions repository, https://extensions.libreoffice.org/ or from other sources. See the Getting Started Guide for more information on installing extensions and add-ons.
Where to get more help
This user guide and other LibreOffice user guides, the built-in Help system, and user support systems assume that users are familiar with computer and basic functions such as starting a program, opening and saving files.
Help systemLibreOffice comes with an extensive Help system and this can be used as the first line of support.Windows and Linux users can choose to download and install the offline Help for use when not connected to the Internet. Offline Help is installed with the MacOS version of LibreOffice.
To display the LibreOffice Help, press F1 or go to Help > LibreOffice Help from the Menu bar. If the offline help is not installed on a computer, but connected to the Internet, a dialog opens givingthe option to Read Help Online. Select this option and the default web browser opens at the LibreOffice online help pages in the LibreOffice website.
The Help menu also includes links to other LibreOffice information and support facilities.
• What's This? – for quick tips when a toolbar is visible, place the mouse cursor over any of the tool icons to see a small tooltip box with a brief explanation of the tool function. Also Extended Tips can be activated by going to Tools > Options > LibreOffice > General on the Menu bar. Extended Tips provide a brief description about tools and commands. To display an extended tip, use the keyboard Shift+F1, then point to a tool or command.
• User Guides – opens the default browser at the Documentation page of the LibreOffice website https://documentation.libreoffice.org/en/english-documentation/. This page gives access to the LibreOffice User Guides and other useful information that can be opened inthe default browser. Also, the User Guides are available in PDF format as a free download or to buy as printed copies.
• Show Tip-of-the-Day – opens a small window with a random tip on how to use LibreOffice.
• Get Help Online – opens the default browser at the Ask LibreOffice forum of questions and answers from the LibreOffice community, https://ask.libreoffice.org/en/questions/.
• Send Feedback – opens the default browser at the Feedback page of the LibreOffice website https://www.libreoffice.org/get-help/feedback/. From this page bugs can be reported, new features suggested and communicate with other users in the LibreOffice community.
• Restart in Safe Mode – opens a dialog window giving options to restart LibreOffice and reset the software to its default settings. Restarting in safe mode also provides an opportunity to restore LibreOffice from a backup.
• Get Involved – opens the default browser at the Get Involved page of the LibreOffice website, https://www.libreoffice.org/community/get-involved/. Choose a topic of interest tohelp improve the program.
8 | Draw Guide 7.1

• Donate to LibreOffice – opens the default browser at the Donation page of the LibreOffice website, https://donate.libreoffice.org/ providing an opportunity to make a donation to support LibreOffice.
• License Information – outlines the licenses under which LibreOffice is made available.
• Check for Updates – opens a dialog and checks the LibreOffice website for updates to version of the software. The dialog provides an opportunity to download and install any updates to LibreOffice.
• About LibreOffice – opens a dialog and displays information about the version of LibreOffice and the operating system being used. This information will often requested if the community is asked for help or assistance with the software (on macOS, this option isfound under LibreOffice on the Menu bar}.
Other free online supportThe LibreOffice community not only develops software, but provides free, volunteer-based support. See Table 1 and this web page: https://www.libreoffice.org/get-help/
For comprehensive online support from the community, look at mailing lists and the Ask LibreOffice website, https://ask.libreoffice.org/en/questions/. Other websites run by users also offer free tips and tutorials.
Table 1: Free support for LibreOffice users
Free LibreOffice support
FAQsAnswers to frequently asked questionshttps://wiki.documentfoundation.org/Faq
Mailing listsFree community support is provided by a network of experienced usershttps://www.libreoffice.org/get-help/mailing-lists/
Questions & Answers and Knowledge Base
Free community assistance is provided in a Question & Answer formatted web service. Search similar topics or open a new one in https://ask.libreoffice.org/en/questionsThe service is available in several other languages; just replace /en/ with de, es, fr, ja, ko, nl, pt, tr, and many others in the web address above.
Native language support
The LibreOffice website in various languageshttps://www.libreoffice.org/community/nlc/Mailing lists for native languageshttps://wiki.documentfoundation.org/Local_Mailing_ListsInformation about social networkinghttps://wiki.documentfoundation.org/Website/Web_Sites_services
Accessibility optionsInformation about available accessibility options. https://www.libreoffice.org/get-help/accessibility/
OpenOffice ForumAnother forum that provides support for LibreOffice, among other open source office suites. https://forum.openoffice.org/en/forum/
Paid support and trainingSupport and training is available through service contracts from a vendor or consulting firm specializing in LibreOffice. For information about certified professional support, see The Document Foundation website: https://www.documentfoundation.org/gethelp/support/.
Where to get more help | 9

What you see may be different
IllustrationsLibreOffice runs on Windows, Linux, and macOS operating systems, each of which has several versions and can be customized by users (fonts, colors, themes, window managers). The illustrations in this guide were taken from a variety of computers and operating systems. Therefore, some illustrations will not look exactly like what is seen on a computer display.
Also, some of the dialogs may differ because of the settings selected in LibreOffice. Either use dialogs from the computer system (default) or dialogs provided by LibreOffice.
To change to using LibreOffice dialogs:
1) On Linux and Windows operating systems, go to Tools > Options > LibreOffice > General on the Menu bar to open the dialog for general options.
2) On a Mac operating system, go to LibreOffice > Preferences > General on the Menu bar to open the dialog for general options.
3) Select Use LibreOffice dialogs in Open/Save dialogs to display the LibreOffice dialogs on your computer display.
4) Click OK to save the settings and close the dialog.
IconsThe LibreOffice community has created icons for several icon sets, including Breeze, Colibre, Elementary, Sifr, and Tango. Each user can select a preferred set. The icons used to illustrate some of the many tools available in LibreOffice may differ from the ones used in this guide. The icons in this user guide have been taken from a LibreOffice installation that has been set to display the Colibre set of icons.
Change the icon set used in a LibreOffice installation as follows:
1) On Linux and Windows operating systems, go to Tools > Options > LibreOffice > View on the main menu bar to open the dialog for view options.
2) On a Mac operating system, go to LibreOffice > Preferences > LibreOffice > View on the main menu bar to open the dialog for view options.
3) In Icon Style select Colibre (SVG) from the options available in the drop-down list.
4) In Icon Size, select Small from the drop-down lists for Toolbar, Notebookbar and Sidebar.
5) Click OK to save the settings and close the dialog.
Notes
Some Linux operating systems, for example Ubuntu, include LibreOffice as part of the installation and may not include the Colibre icon set. This icon set can be downloaded from the software repository for the Linux operating system being used.
10 | Draw Guide 7.1

Using LibreOffice on macOS
Some keystrokes and menu items are different on macOS from those used in Windows and Linux. Table 2 below gives some common substitutions for the instructions in this user guide. For a more detailed list, see the application Help.
Table 2: Using LibreOffice on macOS
Windows or Linux macOS equivalent Effect
Tools > Options menu selection
LibreOffice > Preferences Access setup options
Right-clickControl +click and/or right-click depending on computer setup
Open a context menu
Ctrl (Control) ⌘ (Command) Used with other keys
F11 ⌘+T Open the Styles deck in the Sidebar
Who wrote this user guide?
This user guide was written by volunteers from the LibreOffice community. Profits from sales of the printed edition will be used to benefit the community.
Frequently asked questions
How is LibreOffice licensed?LibreOffice is distributed under the Open Source Initiative (OSI) approved Mozilla Public License (MPL). See https://www.libreoffice.org/about-us/licenses/
It is based on code from Apache OpenOffice made available under the Apache License 2.0 but also includes software that differs from version to version under a variety of other Open Source licenses. New code is available under LGPL 3.0 and MPL 2.0.
May I distribute LibreOffice to anyone?Yes
May I sell it?Yes
May I use it in my business?Yes.
How many computers may I install it on?As many as you like.
Is LibreOffice available in my language?LibreOffice has been translated (localized) into over 40 languages, so your language probably is supported. Additionally, there are over 70 spelling, hyphenation, and thesaurus dictionaries available for languages, and dialects that do not have a localized program interface. The dictionaries are available from the LibreOffice website at: www.libreoffice.org.
How can you make it for free?LibreOffice is developed and maintained by volunteers and has the backing of several organizations.
I am writing a software application. May I use programming code from LibreOffice in my program?
You may, within the parameters set in the MPL and/or LGPL. Read the licenses: https://www.mozilla.org/MPL/2.0/.
Frequently asked questions | 11

Why do I need Java to run LibreOffice? Is it written in Java?LibreOffice is not written in Java; it is written in the C++ language. Java is one of several languages that can be used to extend the software. The Java JDK/JRE is only required for some features. The most notable one is the HSQLDB relational database engine.
Java is available at no cost. More information and download links to the appropriate edition for your operating system can be found at: https://java.com/en/download/manual.jsp
Note
If the LibreOffice features that require Java are to be used, it is important that the correct 32-bit or 64-bit edition matches the installed version of LibreOffice. See the Getting Started Guide. If Java is not to be used, nearly all of the LibreOffice features can still be used.
How can I contribute to LibreOffice?You can help with the development and user support of LibreOffice in many ways, and you do not need to be a programmer. To start, check out this webpage: https://www.libreoffice.org/community/get-involved/
May I distribute the PDF of this user guide, or print and sell copies?Yes, as long as you meet the requirements of one of the licenses in the copyright statementat the beginning of this user guide. You do not have to request special permission. We request that you share with the project some of the profits you make from sales of user guides, in consideration of all the work we have put into producing them.
Donate to LibreOffice: https://www.libreoffice.org/donate/
What is new in LibreOffice 7.1?
The LibreOffice 7.1 Release Notes are available at this link https://wiki.documentfoundation.org/ReleaseNotes/7.1
At this link the release notes for earlier versions of LibreOffice are located, which gives more information on the features that are included in LibreOffice.
12 | Draw Guide 7.1

Draw Guide
Chapter 1Introducing Draw

Introduction
LibreOffice Draw is a vector graphics drawing program, although it can also perform some operations on raster graphics (pixels). Using Draw, a wide variety of graphical images can easily and quickly created.
Vector graphics store and display an image as an assembly of simple geometric elements such as lines, circles, and polygons, rather than a collection of pixels (points on the screen). Vector graphics allow for easier storage and scaling of the image.
Draw is fully integrated into the LibreOffice suite, and this simplifies exchanging graphics with all components of the suite. If an image is created in Draw, reusing it in a Writer document is relatively easy, for example, select and copy the drawing in Draw and then paste the image directly into a Writer document. Also, drawings can be worked on directly from within Writer or Impress, using a subset of the functions and tools from Draw.
The functionality of LibreOffice Draw is extensive. Draw was not designed to rival high-end graphics applications, but it possesses more functionality than the drawing tools that are generally integrated with the majority of office productivity suites.
A few examples of the drawing functions are: layer management, magnetic grid-point system, dimensions and measurement display, connectors for making organization charts, 3D functions that enable small three-dimensional drawings to be created (with texture and lighting effects), drawing and page-style integration, and Bézier curves.
This Draw Guide is not a course book to be worked through from beginning to end. Rather, it is a reference work in which can be browsed for guidance on particular topics.
This document describes only the functions associated with Draw. Some concepts, such as file management or the way the LibreOffice environment works, are mentioned only briefly and are covered in more detail in the Getting Started Guide.
Draw main window
WorkspaceThe large area in the center of the Draw main window is the Workspace (Figure 1) where drawings are created. This drawing area can be surrounded with toolbars and information areas. The number and position of the visible tools vary with the task in hand, user preferences, and computer setup.
The maximum size of a drawing page in LibreOffice Draw is limited by the computer setup and the page size that that can be set and used in the printer connected to the computer.
Pages paneDrawings in Draw can be split over several pages. Multi-page drawings are used mainly for presentations. The Pages pane, on the left side of the Draw main window, gives an overview of the pages that created in a drawing. If the Pages pane is not visible, go to View > Page Pane on the Menu bar. To make changes to the page order, drag and drop one or more pages.
14 | Draw Guide 7.1

Figure 1: Draw main window
Layers barBy default, the Workspace consists of three layers (Layout, Controls and Dimension Lines) and the tabs for these default layers appear at the bottom of the Workspace. The default layers cannot be deleted or renamed, but layers can be added as and when necessary. A layer is a workspace where drawing elements and objects can be inserted.
The Layers bar is located on the bottom of the Workplace and contains three default layers calledLayout, Controls and Dimensions. The default layers cannot be deleted or renamed, but layerscan be added when necessary.
Tabs for layers appear in the Layers bar at the bottom of the Workspace, which is located at the bottom of the Workplace. The Layers bar allows for navigation between layers, adding layers as required, or deleting layers that have been created. For more information on layers, see Chapter 11, Advanced Draw Techniques.
SidebarThe Sidebar has five main decks in Draw and is similar to the Sidebar in the other LibreOffice modules. To open a deck, click on its icon on the right of the Sidebar, or click on Sidebar Settings icon at the top of the tab bar and select a deck from the drop-down list. If the Sidebar is not visible, go to View > Sidebar on the Menu bar.
PropertiesContains sections for object properties, for example, Page, Character, Paragraph, Area, Effect, Shadow, Image, Line, and Position and Size. Available sections depends on the object selected.
ShapesProvides quick selection of most items that are available on the Drawing toolbar: Lines and Arrows, Curves and Polygons, Connectors, Basic Shapes, Symbol Shapes, Block Arrows, Flowchart, Callouts, Stars and Banners, and 3D Objects.
Draw main window | 15

StylesProvides options to edit and apply Drawing Styles to objects within a drawing. When a styleis edited or modified, the changes are automatically applied to all of the elements formattedusing that style. In Draw, Presentation Styles are not available.
GalleryFrom the Gallery deck, objects can be inserted into a drawing either as a copy or as a link. The Gallery is divided into categories: Arrows, BPMN (Business Process Model and Notation), Bullets, Diagrams, Flowchart, Icons, Network, Shapes, and Sounds. See Chapter 11, Advanced Draw Techniques for more information on using the Gallery.
NavigatorOn the Navigator deck, pages and objects in a drawing can be quickly selected. It is recommended to give pages and objects in a drawing meaningful names so that they are easily identified when using the Navigator.
RulersRulers are positioned on the upper and left-hand sides of the Workspace. If they are not visible, go to View > Rulers in the Menu bar. The rulers show the size of a selected object on the page using double lines (highlighted in Figure 2). Also, rulers can be used to manage object handles and guide lines when positioning objects.
The page margins in the drawing area are also represented on the rulers. Change the margins directly on the rulers by dragging them with the cursor. The margin areas are indicated by the grayed out area on the rulers as shown in Figure 2.
To change the measurement units of the rulers, right-click on a ruler and select the measurementunit from the drop-down list, as shown in Figure 3 for the horizontal ruler. Measurement units for the horizontal and vertical rulers can be set to different measurement units.
Status barThe Status Bar (Figure 4) is located at the bottom of the Workspace in all LibreOffice modules. To hide the Status Bar, go to View on the Menu bar and deselect Status Bar.
Note
The measurement units shown on the Status Bar are set by going to Tools > Options > LibreOffice Draw > General on the Menu bar. These measurement unitscan be different to the measurement units set for the rulers.
Figure 2: Rulers showing object size
16 | Draw Guide 7.1

Figure 3: Ruler measurement units
Figure 4: Status bar
• Slide number – shows the number of the drawing pane that is selected.
• Information area – shows which action is being carried out, or object type selected.
• Cursor position and Object size – shows different information depending on whether objects are selected or not.
– When no object is selected, the position numbers show the current position (X and Y coordinates) of the mouse cursor.
– When an object is selected and being resized with the mouse, the object size numbers show the size of the object (width and height).
– If an object is selected, the position numbers shows the X and Y coordinates of the upper-left corner and the object size number pair displays the size of the object. These numbers do not relate to the object itself, but to the selection outline, which is the smallest possible rectangle that can contain the visible part or parts of the object; see Chapter 3, Working with Objects for more information.
– When an object is selected, clicking in either of these areas opens the Position and Size dialog. See Chapter 4, Changing Object Attributes for more information.
• Unsaved changes – indicates that the file needs saving and the icon depends on computer setup. Clicking on this icon opens the Save as dialog if the file is new and has not been saved before. If the file has been saved before any changes, then clicking on this icon after any changes automatically saves the file.
• Digital signature – indicates if the document is digitally signed. The icon only appears if the drawing has a digital signature certificate. After the file has been saved, double-clicking on this icon opens the digital signatures dialog. See LibreOffice Help for more information on digital signature certificates.
• Fit drawing – resizes the drawing so that the whole drawing appears in the Workspace.
• Zoom slider and Zoom percentage – adjusts and indicates the zoom percentage of the Workspace displayed. Double-clicking on zoom percentage opens the Zoom & View Layout dialog.
Draw main window | 17

Figure 5: Visible buttons on a toolbar
ToolbarsTo display or hide the various Draw toolbars, go to View > Toolbars on the Menu bar and select from the drop-down menu the toolbar required. For example, the Standard and Drawing toolbars are shown by default, but the Line and Filling, Text Formatting, and Options toolbars are not shown.
The appearance of the tool icons on toolbars depends on the computer operating system and theselection of icon style and size in Tools > Options > LibreOffice > View.
The tools available on a toolbar are indicated by a shaded outline around the tool icon or a checkmark as shown by the example in Figure 5. For more information about working with toolbars, see the Getting Started Guide.
The four main toolbars used in Draw are as follows:
Standard toolbarThe Standard toolbar (Figure 6) is the same for all LibreOffice components and is not described in detail in this chapter. By default, it is locked into position at the top of the Draw main window.
Figure 6: Standard toolbar
Drawing toolbarThe Drawing toolbar (Figure 7) contains all the necessary functions for drawing various geometric and freehand shapes, and for organizing them in the drawing. By default, it is locked into position on the left of the Draw main window. It is described in detail in Chapter 2, Drawing Basic Shapes.
18 | Draw Guide 7.1

Figure 7: Drawing toolbar
Line and Filling toolbarThe Line and Filling toolbar (Figure 8) is used to modify the main properties of a drawing object. The tools and pull-down lists vary according to the type of object selected. For example, to change the style of a line, click on the up and down arrows for Line Style and select the required style.
The functions on the Line and Filling toolbar are used to change the color, style, and width of the line drawn, the fill color and style, and other properties of a selected object. If the selected object is a text frame, the Line and Filling toolbar is replaced by the Text Formatting toolbar. For more information, see Chapter, 4 Changing Object Attributes.
Figure 8: Line and Filling toolbar
Text Formatting toolbarThe Text Formatting toolbar (Figure 9) is similar to the Formatting toolbar in Writer. It is onlyavailable when a text object has been selected in a drawing, replacing the Line and Filling toolbar. For more information, see Chapter, 4 Changing Object Attributes, and Chapter 9 Adding and Formatting Text.
Figure 9: Text Formatting toolbar
Adding and removing tools
The default set of tools on each toolbar can be modified using Visible Buttons. Add or remove atool to or from a toolbar as follows:
1) Either, right-click in an empty area on the toolbar, or click on the triangle ▼ in the toolbar title and select Visible Buttons from the context menu.
2) Click on a tool name to add or remove the tool to or from the toolbar.
Note
For more information on the available tools that can be added to a toolbar, see Appendix B, Toolbars and the Getting Started Guide. When a tool is added to a toolbar, its position on the toolbar (from left to right) is the same as its position in the Visible Buttons context menu.
Draw main window | 19

Available toolsets
Some tools on a toolbar have a downward pointing triangle ▼ to the right side of the tool icon. This indicates that the tool has additional tools available. Click on the downward pointing triangle ▼ to display the full set of tools (Figure 10).
This toolset can be turned into a floating toolbar. Click the area at the top of the toolset as shown in Figure 10, drag it across the screen to a convenient location and release the mouse button. To close a floating toolbar, click on the X on the right of the toolbar title.
Figure 10: Available tools and floating toolbar
Note
When a toolset is made into a floating toolbar, the tool on the existing toolbar remains in the toolbar and always shows the last tool used. This means that the tool icon on a screen may differ from the tool icon shown in this guide.
Tip
When double-clicking on a tool, the command corresponding to that tool becomes active and remains active. The tool command can be repeated as often as required. To exit from this mode, press the Esc key or click on another tool. Please note that this may not work for every tool on every toolbar.
Docked and floating toolbars
When Draw is opened, the Standard and Drawing toolbars, by default, are already locked and docked into their positions on the main Draw window. These toolbars can be undocked creating floating toolbars. To undock a toolbar and create a floating toolbar:
1) Move the mouse cursor to the far left of the toolbar and over the toolbar handle (Figure 11). The cursor changes shape, normally a grabbing hand, depending on computer setup and operating system.
2) Click and drag on the toolbar handle to move the toolbar until it becomes a floating toolbar. This floating toolbar capability is common to all components of LibreOffice.
Figure 11: Toolbar handles
20 | Draw Guide 7.1

To dock a floating toolbar, press and hold the Ctrl key, then double click on the title of the toolbar. The toolbar moves into available space at the top of the Draw main window.
An alternative method of docking a toolbar is to click in the toolbar title and drag the toolbar to thedocked position that required. This can be the top, bottom or one of the sides of the Draw main window.
Unlocking and locking toolbars
By default when Draw is opened, any docked toolbars are locked into position and have to be unlocked before they can become floating toolbars or repositioned on the Draw main window.
To unlock a toolbar, right-click in a blank area on the toolbar and deselect Lock Toolbar Positionfrom the context menu. A toolbar handle, as shown in Figure 11, appears at the left end of the toolbar, indicating that the toolbar is unlocked and can be moved.
To lock a toolbar into position, dock the toolbar into position, then right-click in a blank area on the toolbar and select Lock Toolbar Position from the context menu. The toolbar handle disappears from the left end of the toolbar.
Customizing toolbars
Draw toolbars can be customized by adding or removing commands to or from a toolbar. Also, customization allows the creation of toolbars for specific purposes. Customizing toolbars is in addition to using “Adding and removing tools” above.
For more information when adding a new commands, modifying toolbars, or creating toolbars, see Appendix B, Toolbars and the Getting Started Guide.
Choosing and defining colors
Color paletteThe Color Palette (Figure 12) provides quick access to a standard set of colors to use for selected objects and text in a drawing.
1) Go to View on the Menu bar and select Color Bar to open the Color Palette.
2) Select an object or text where to change the color.
3) Left click on the color required for the area fill or text and change the color of the object ortext.
4) Right click on the color required for the object or text box border and change the color of the border.
5) Go to View on the Menu bar and deselect Color Bar to close the Color Palette.
Figure 12: Color Palette (Color Bar)
Choosing and defining colors | 21

Note
The box with the X at the bottom left of the Color Palette corresponds to none (no color).
Note
The colors available in the Color Palette depend on the color palette that had been previously used when changing color on an object. For example, Figure 12 shows the Standard color palette that had been used previously when changing color to an object using a properties dialog.
Specialized color palettesIn addition to the standard Color Palette, Draw has several specialized color palettes available, giving a greater choice of color: for example, chart-palettes, material, html, and so on. After selecting an object or text in a drawing, use one of the following to access the specialized color palettes.
• Area or fill color – Color page in the Area dialog, Fill Color on the Drawing or Line and Filling toolbar, or Fill in the Area section in the Properties deck on the Sidebar.
• Line color – Line page in the Line dialog, Line Color on the Drawing or Line and Filling toolbar, or Color in the Line section in the Properties deck on the Sidebar
• Text color – Font Color tool on the Text Formatting toolbar, or Font Color in the Character section in the Properties deck on the Sidebar.
For more information on selecting a color and a color palette for an object or text, see Chapter 4, Changing Object Attributes, Chapter 9, Adding and Formatting Text and Chapter 11, Advanced Draw Techniques.
Custom colorsIn Draw, custom colors can be created using the Color Picker dialog, specific CMYK values, or specific RGB values to match the color schemes used in a company. For more detailed information on creating custom colors and color palettes, as well as more information on CMYK and RGB color schemes, refer to Chapter 11, Advanced Draw Techniques.
Grid, snap, and help lines
The grid and snap lines in Draw act as drawing aids and these can be turned on or off by clickingon Display Grid or Display Snap Guides on the Line and Filling or Options toolbars. The grid and snap lines are displayed only on the screen and are not shown on a printed drawing or whenthe drawing is used in another LibreOffice module. The color, spacing and resolution of the grid points can be individually chosen for each axis.
Help lines when moving objects can be displayed and these are turned on or off by clicking on Helplines While Moving on the Line and Filling or Options toolbars. Showing the position of the object while moving makes positioning the object much easier. If this function is activated, pairs of vertical and horizontal lines enclosing the object are shown while moving the object. These lines extend to the edges of the drawing area.
Draw also offers several snap functions to positioning of objects exactly in a drawing.
For more information on the grid, snap lines, snap functions, and help lines, see Chapter 3, Working with Objects.
22 | Draw Guide 7.1

Draw Guide
Chapter 2,Drawing Basic Shapes

Introduction
LibreOffice Draw can create 2D and 3D objects. This chapter shows how to draw simple 2D objects. The following chapters describe how to work with and edit such objects. For more information on 3D objects, see Chapter 7, Working with 3D Objects.
All shapes, whether they are lines, rectangles, or more complicated shapes, are called objects. This is common notation in vector drawing software.
The drawing tools are found on the Drawing toolbar (Figure 13). This toolbar is normally located on the left side of the main Draw window. If the toolbar is not visible, activate it by going to View > Toolbars on the Menu bar and select Drawing from the available options.
As with all the components of LibreOffice, the Drawing toolbar can be unlocked and placed the Draw workspace as a floating toolbar. Toolbars can be configured by adding, moving, hiding, or deleting tools. See Chapter 1, Introducing Draw for more information.
When a shape is drawn, select an object for editing, or add text to the drawing, the information field in the Status Bar (Figure 14) changes to reflect the action taken or in progress. See Chapter 1, Introducing Draw for more information on the Status Bar.
Figure 13: Drawing toolbar
Figure 14: Status Bar
Drawing basic shapes
Basic shapes, including text, are treated as objects in Draw. The default set of tools available for drawing basic shapes on the Drawing toolbar are shown in Figure 13. To add more tools to the Drawing toolbar, see Appendix B, Toolbars and the Getting Started Guide for more information.
Some tool icons on the Drawing toolbar change shape according to the last tool used from the selection of available tools. Each tool that has a triangle ▼ to the right of the tool icon indicates that more tools are available. See “Drawing geometric shapes” on page 35 for information on the available shapes.
Note
When a basic shape is drawn, or one selected for editing, the information area at the left side in the status bar changes to reflect the present action. For example Line created, Text frame xxyy selected, and so on.
24 | Draw Guide 7.1

Figure 15: Line section on Properties deck in Sidebar
Figure 16: Line starting point
Straight lines
Creating lines
A straight line is the simplest element or object in Draw to create.
1) Use one of the following options to start drawing a straight line:
– Click insert Line on the Drawing toolbar.
– Click the triangle ▼ on the right of Lines and Arrows on the Drawing toolbar and select Insert Line from the drop-down list.
– Click Insert Line in the Line section of the Shapes deck on the Sidebar (Figure 15).
2) Place the cursor at the starting point on the drawing, then click and drag the cursor to draw a straight line.
3) Release the mouse button when the end point is reached and a straight line is created. A selection handle appears at each end of the line, showing that this object is the currently selected object. The selection handle at the starting point of the line is slightly larger than the selection handle at the end point, as shown in Figure 16.
Drawing basic shapes | 25

4) To snap the start and end points of a line to the grid, use one of the following methods:
– Hold down the Ctrl key while drawing the line.
– Go to View > Snap Guides on the Menu bar and select Snap to Grid from the available options.
– To temporarily disable Snap to Grid when it has been selected, hold down the Ctrl key while drawing the line.
Note
To display the grid, go to View > Grid and Helplines on the Menu bar and select Display Grid. Alternatively, go to Tools > Options LibreOffice Draw > Grid and select Visible Grid.
5) To restrict the drawing angle of a line to a multiple of 45 degrees, use one of the following methods:
– Keep the Shift key pressed while drawing the line.
– However, if the option in the Constrain Objects section of
– Go to Tools > Options > LibreOffice Draw > Grid and select When creating or moving objects in Constrain Objects.
– To temporarily disable When creating or moving objects, hold down the Shift key whiledrawing the line.
6) To draw a line symmetrically outwards in both directions from the center of the line, hold down the Alt key while drawing the line.
Figure 17: Line dialog - Line page
26 | Draw Guide 7.1

Figure 18: Line and Filling toolbar
Formatting lines
When a line is drawn, it uses default attributes. To change any of these attributes and format a line to the drawing requirements, select a line by clicking on it and use one of the following methods to access formatting options for a line:
• Go to the Properties deck on the Sidebar and open the Line section.
• Right-click on a line and select Line from the context menu to open the Line dialog (Figure 17).
• Go to Format > Line on the Menu bar to open the Line dialog.
• Use the tools Line Style, Line Width, and Line Color on the Line and Filling toolbar (Figure 18).
Lines and arrowsDraw classifies both lines and arrows as lines and are drawn like straight lines. Hovering the cursor over each tool in the Lines and Arrows sub-toolbar (Figure 19) indicates what type of line or arrow each tool will draw. The information field on the Status Bar shows them only as lines.
Note
The tool icon for the last tool used will already be selected on the Drawing toolbar. This makes it easier to use the same tool again.
Figure 19: Lines and Arrows sub-toolbar
Creating lines or arrows
1) Use one of the following methods to start drawing a line or arrow:
– Click on the triangle ▼ next to Lines and Arrows on the Drawing toolbar and select the type line or arrow required from the options available.
– Select the type of line or arrow required in the Lines and Arrows section of the Shapesdeck on the Sidebar (Figure 22 on page 29).
2) Place the cursor at the starting point for the line or arrow, then click and drag the cursor. An arrowhead is drawn at the end point of an arrow when the mouse button is released.
3) For more information on options for drawing lines and arrows, see “Straight lines” on page 25.
Drawing basic shapes | 27
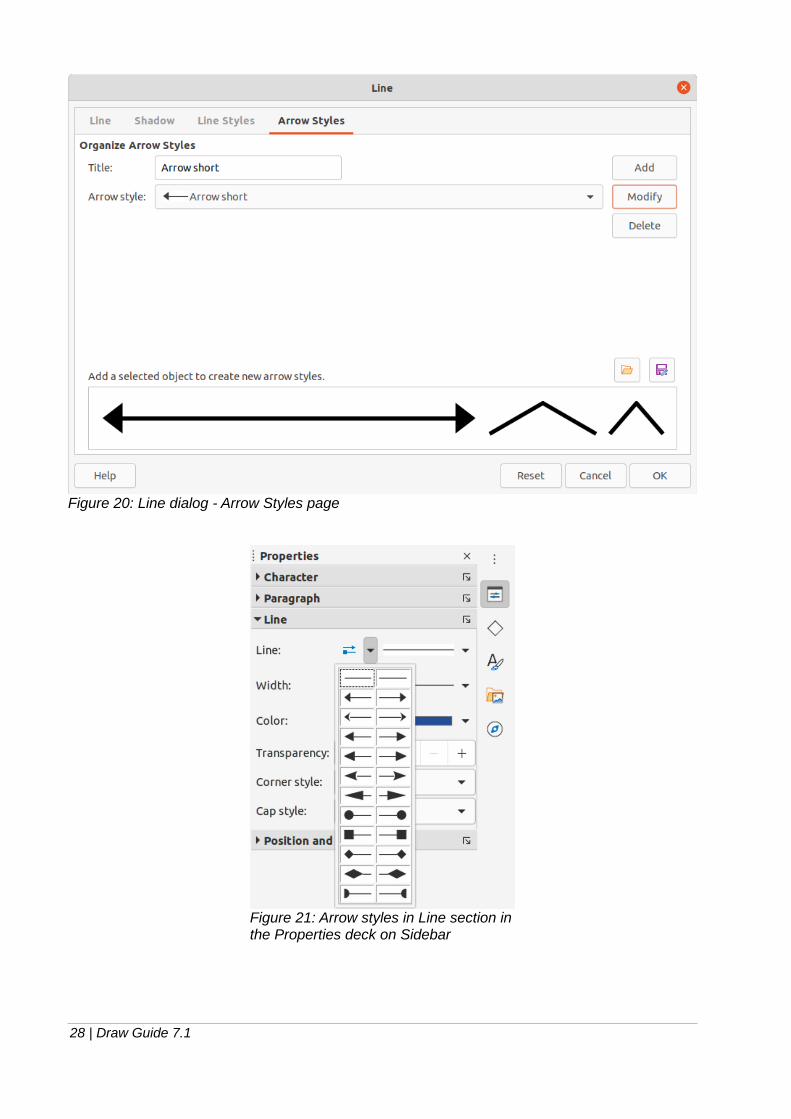
Figure 20: Line dialog - Arrow Styles page
Figure 21: Arrow styles in Line section inthe Properties deck on Sidebar
28 | Draw Guide 7.1

Formatting line or arrow
After drawing a line or arrow, make sure it is selected and format the line or arrow to the drawing requirements using one of the following methods:
• To format a line, see “Straight lines” on page 25 for more information.
• To format an arrow:
– Go to Format > Line on the Menu bar or right-click on the arrow to open the Line dialog. Click on Arrow Styles to open the Arrow Styles page (Figure 20). Select an arrow style from the options available in the Arrow style drop-down list. Click OK to apply the arrow style. This changes both ends of the arrow to the same style.
– Click on Arrow Style in the Line section on the Properties deck of the Sidebar to opena drop-down list (Figure 21) and select an arrow style. The arrow styles on the left change the start point arrow style. The arrow styles on the right change the end point arrow style.
Figure 22: Shapes deck on Sidebar
Figure 23: Legacy Rectangles toolbar
Drawing basic shapes | 29

Rectangles or squares1) Use one of the following methods to start drawing a rectangle or square:
– Click on Rectangle in the Drawing toolbar.
– Select the type of rectangle or square in Basic Shapes on the Shapes deck in the Sidebar (Figure 22).
– Click on the triangle ▼ to the right of Basic Shapes on the Drawing toolbar and selectthe type of rectangle or square required from the drop-down list.
– Select the type of rectangle or square from the Legacy Rectangles toolbar (Figure 23). To display the Legacy Rectangles toolbar, go to View > Toolbars on the Menu bar and select it.
2) Place the cursor at the starting point for the rectangle or square, then click and drag the cursor until the required size is drawn.
3) If Rectangle is selected, hold down the Shift key to draw a square.
4) If Rectangle is selected, to draw a square from its center rather than the bottom right corner, hold down the Shift and Alt keys while dragging the cursor. The square uses the start point as the center of the square.
5) To draw a rectangle or square from its center rather than the bottom right corner, hold down the Alt key while dragging the cursor. The rectangle or square uses the start point as the center of the rectangle or square.
Note
If the option When creating or moving objects has been selected in the Constrain Object section of Tools > Options > LibreOffice Draw > Grid, the action of the Shift key reversed. A square is drawn instead of a rectangle. To draw a rectangle, hold down the Shift key. This reversal of the Shift key action also applies when drawing ellipses, circles, arcs, and segments.
Ellipses or circles1) Use one of the following methods to start drawing an ellipse or circle:
– Click on Ellipse in the Drawing toolbar.
– Select the type of ellipse or circle in Basic Shapes on the Shapes deck in the Sidebar.
– Click on the triangle ▼ to the right of Basic Shapes on the Drawing toolbar and selectthe type of ellipse or circle required from the drop-down list.
– Select the type of ellipse or circle from the Legacy Circles and Ovals toolbar (Figure 24). To display the Legacy Circles and Ovals toolbar, go to View > Toolbars on the Menu bar and select it.
2) Place the cursor at the starting point for the ellipse or circle, then click and drag the cursoruntil the required size is drawn.
3) If Ellipse is selected, hold down the Shift key to draw a circle.
4) If Ellipse is selected, to draw a circle from its center rather than the bottom right corner, hold down the Shift and Alt keys while dragging the cursor. The circle uses the start point as the center of the circle.
5) To draw an ellipse or circle from its center rather than the bottom right corner, hold down the Alt key while dragging the cursor. The ellipse or circle uses the start point as the center of the ellipse or circle.
30 | Draw Guide 7.1

Figure 24: Legacy Circles and Ovals toolbar
Tip
To quickly insert a line, rectangle, ellipse, or text, press and hold down the Ctrl key and then click on one of the icons for Line, Rectangle, Ellipse, or Text and a standardsized object is drawn automatically in the work area. The size, shape, and color are all standard values. These attributes can be changed later, if desired. See Chapter 4 Changing Object Attributes for more information.
Dimension linesDimension lines display a measurement of an object in the drawing (Figure 25). The dimension line does not belong to the object itself, but is positioned close to it. An object can have as many dimension lines as necessary to indicate the size of its sides, edges, and distances.
To control the display of a dimension line components and appearance by right-clicking, on the dimension line and selecting Dimensions from the context menu to open the Dimension line dialog (Figure 26).
Inserting dimension lines
1) Use one of the following options to start drawing a dimension line:
– Click on the triangle ▼ on the right of Lines and Arrows on the Drawing toolbar and select Dimension Line from the drop-down list.
– Click on Dimension Line in the Lines and Arrows section of the Shapes deck on the Sidebar.
2) Place the cursor at the point close to the object to position the start of the dimension line.
3) Click and drag to draw the dimension line. As the dimension line is drawn, the dimension is displayed and automatically calculated.
4) Format the settings of a dimension line using the options available the Dimension Line dialog. For more information dimension line options, see Chapter 11, Advanced Draw Techniques.
Figure 25: Measuring an object with dimension lines
Drawing basic shapes | 31

Figure 26: Dimension Line dialog
Note
The measurement units used for dimension lines can be changed by going to Tools > Options > LibreOffice Draw > Grid on the Menu bar and select a measurement unit from the available options in the Units of measurement drop-down list.
Arcs and segmentsTools for drawing arcs or segments (partial circles or ellipses) are available as follows:
• Legacy Circles and Ovals toolbar.
• Basic Shapes sub-toolbar.
• Basic Shapes section in the Shapes deck on the Sidebar.
An arc or segment is drawn as follows:
1) Select the required tool from one of the options given above.
2) Click at the approximate start point and drag the cursor to start creating an arc or segment. Release the mouse button when the required object size is reached.
3) Move the cursor to the position where the arc or segment starts and click to start drawing the arc or segment. The Status Bar indicates the angle in degrees.
4) Move the cursor to the end position of where the arc or segment finishes. The Status Bar shows the angle in degrees.
5) Click again to complete the arc or segment.
32 | Draw Guide 7.1

Figure 27: Curves and Polygons sub-toolbar
Curves, polygons or freeform linesTools for drawing curves, polygons, or freeform lines are available in the following places:
• Click the triangle ▼ on the right of Curve and Polygons on the Drawing toolbar and select the type of curve, polygon or freeform line from the drop-down list.
• Select the type of curve, polygon or freeform line in the Curve and Polygons section of the Shapes deck on the Sidebar.
• Select the type of curve, polygon or freeform line from the Curves and Polygons sub-toolbar (Figure 27).
Curves
1) Click to create the starting point of the curve, then drag the cursor from the starting point to draw a line.
2) Release the mouse button and continue to drag the cursor to bend the line into the required curve shape.
3) Click to set the end point of the curve and position the curve on the drawing.
4) Continue dragging the cursor to draw straight lines at the end of the curve. Each mouse click sets a corner point and allows drawing of another straight line from each corner point.
5) Double-click to end the drawing of a curve and straight lines.
Note
A filled curve automatically joins the last point to the first point to close off the object and fills it with the selected fill. A curve without filling is not closed at the end of the drawing.
Polygons
1) Click to create the start point, then drag the cursor to draw a line between the first and second points.
2) Move the cursor to draw the next line. Each mouse click sets a corner point and draws another line.
3) Double-click to end the drawing of a polygon.
Note
A filled polygon automatically joins the last point to the first point to close off the figure and fills it with the selected fill. A polygon without filling is not closed at the end of the drawing.
Polygons 45°
Like ordinary polygons, these are formed from lines, but the angles between lines are restricted to 45 or 90 degrees. If required, hold down the Shift key as the line is drawn so that the line is drawn at an angle other than 45 or 90 degrees.
Drawing basic shapes | 33
Freeform lines
Using the freeform line tools is similar to drawing with a pencil on paper.
1) Click and drag the cursor to the line shape required.
2) Release the mouse button to complete the drawing of the freeform line.
3) If Freeform Line Filled is selected, the end point is joined automatically to the start point and the object is filled with the selected fill.
Note
The points in curves, polygons and freeform lines can be moved and edited. See Chapter 3, Working with Objects and Chapter 11, Advanced Draw Techniques for more information.
Glue points and connectors
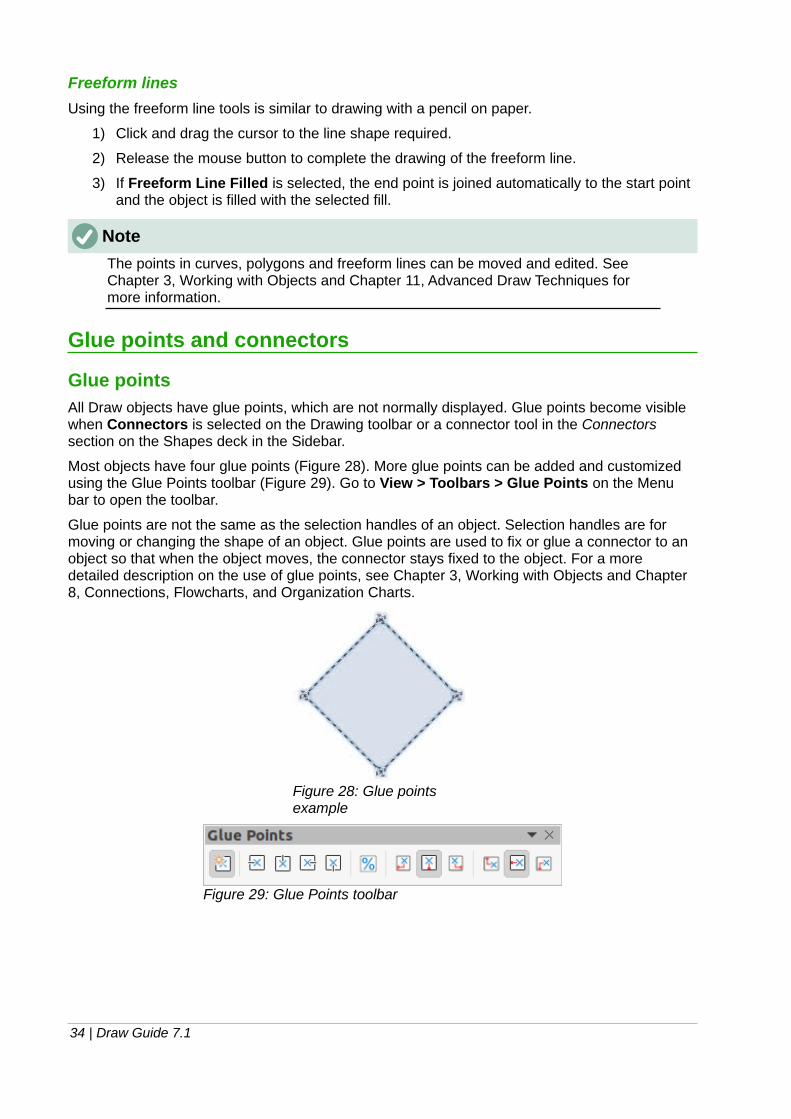
Glue pointsAll Draw objects have glue points, which are not normally displayed. Glue points become visible when Connectors is selected on the Drawing toolbar or a connector tool in the Connectors section on the Shapes deck in the Sidebar.
Most objects have four glue points (Figure 28). More glue points can be added and customized using the Glue Points toolbar (Figure 29). Go to View > Toolbars > Glue Points on the Menu bar to open the toolbar.
Glue points are not the same as the selection handles of an object. Selection handles are for moving or changing the shape of an object. Glue points are used to fix or glue a connector to an object so that when the object moves, the connector stays fixed to the object. For a more detailed description on the use of glue points, see Chapter 3, Working with Objects and Chapter 8, Connections, Flowcharts, and Organization Charts.
Figure 28: Glue points example
Figure 29: Glue Points toolbar
34 | Draw Guide 7.1

Figure 30: Connector between two objects
Figure 31: Connectors sub-toolbar
ConnectorsConnectors are lines or arrows whose ends automatically snap to a glue point of an object. Connectors are not the same as lines and arrows. When objects are moved or reordered, the connectors remain attached to a glue point. Figure 30 shows an example of two objects and a connector.
Draw offers a range of different connectors and connector functions. On the Drawing toolbar, click on the triangle ▼ next to Connectors to open the Connectors sub-toolbar (Figure 31), or select a connector from the Connectors section in the Shapes deck in the Sidebar. For a more detailed description of the use of connectors, see Chapter 8, Connections, Flowcharts, and Organization Charts.
Drawing geometric shapes
The tools for drawing geometric shapes are located on the Drawing toolbar and on the Shapes deck in the Sidebar. The use of these tools for geometric shapes is similar to the tools used for drawing rectangles and squares, or ellipses and circles. For more information, see “Drawing basic shapes” on page 24.
The tool icons on the Drawing toolbar, used for drawing geometric shapes, always indicate the last geometric shape drawn and may not be the same as the tool icons shown on the Drawing toolbar in this chapter. This also makes it easier to use the same tool again.
Clicking on the triangle ▼ to the right of a tool icon on the Drawing toolbar opens a sub-toolbar giving access to the toolset for that shape. If necessary, this sub-toolbar can be “torn off” to create a floating toolbar.
• Click the dotted line at the top of the toolset as shown in Figure 32, drag it across the screen to the Workspace and release the mouse button to create a floating toolbar
• To close a floating toolbar, click on the X on the right of the toolbar title.
Note
Text can be added to all of these geometric shapes. For more information, see Chapter 11, Advanced Draw Techniques.
Drawing geometric shapes | 35

Figure 32: Creating floating toolbar
Basic shapesClick on the triangle ▼ to the right of Basic Shapes on the Drawing toolbar opens the Basic Shapes sub-toolbar (Figure 33). This sub-toolbar also includes rectangle and ellipse tools that are identical to the ones already displayed on the Drawing toolbar. Alternatively, select the required tool in the Basic Shapes section in the Shapes deck on the Sidebar.
Figure 33: Basic Shapes sub-toolbar
Symbol shapesClick on the triangle ▼ to the right of Symbol Shapes on the Drawing toolbar opens the Symbol Shapes sub-toolbar (Figure 34). Alternatively, select the required tool in the Symbol Shapes section in the Shapes deck on the Sidebar.
Figure 34: Symbol Shapes sub-toolbar
Block arrowsClick on the triangle ▼ to the right of Block Arrows on the Drawing toolbar opens the Block Arrows sub-toolbar (Figure 35). Alternatively, select the required tool in the Block Arrows section in the Shapes deck on the Sidebar.
Figure 35: Block Arrows sub-toolbar
36 | Draw Guide 7.1
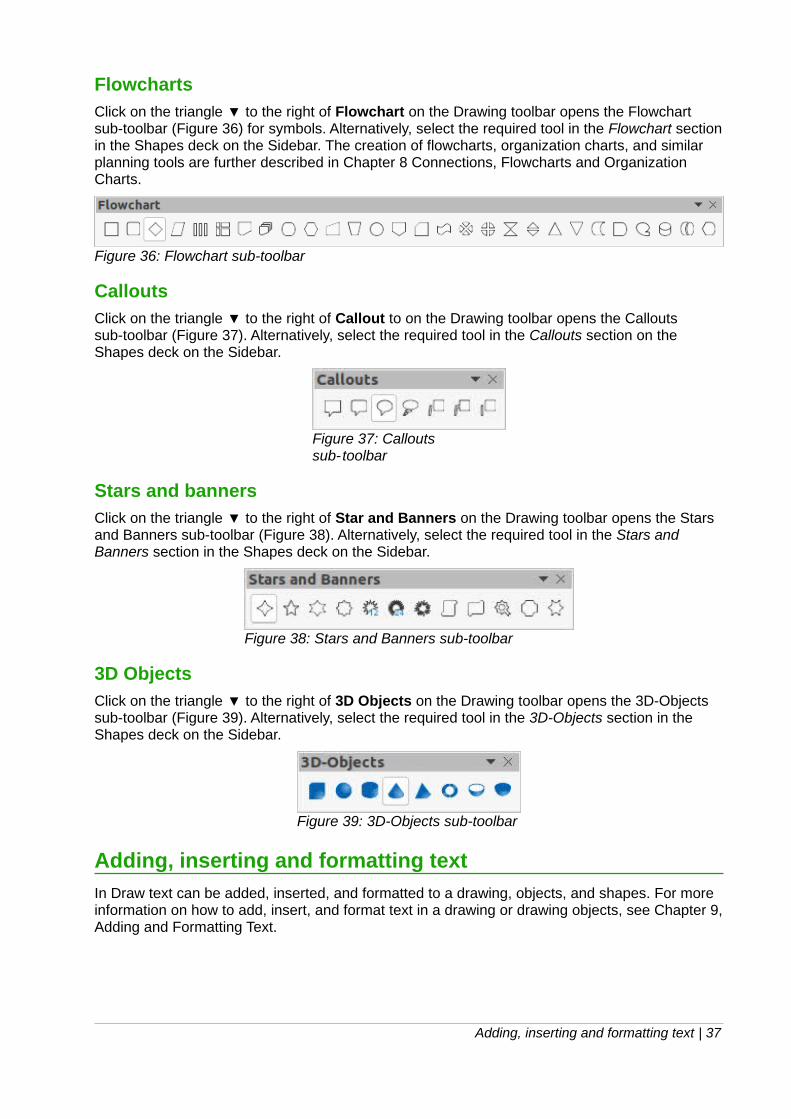
FlowchartsClick on the triangle ▼ to the right of Flowchart on the Drawing toolbar opens the Flowchart sub-toolbar (Figure 36) for symbols. Alternatively, select the required tool in the Flowchart sectionin the Shapes deck on the Sidebar. The creation of flowcharts, organization charts, and similar planning tools are further described in Chapter 8 Connections, Flowcharts and Organization Charts.
Figure 36: Flowchart sub-toolbar
CalloutsClick on the triangle ▼ to the right of Callout to on the Drawing toolbar opens the Callouts sub-toolbar (Figure 37). Alternatively, select the required tool in the Callouts section on the Shapes deck on the Sidebar.
Figure 37: Callouts sub-toolbar
Stars and bannersClick on the triangle ▼ to the right of Star and Banners on the Drawing toolbar opens the Stars and Banners sub-toolbar (Figure 38). Alternatively, select the required tool in the Stars and Banners section in the Shapes deck on the Sidebar.
Figure 38: Stars and Banners sub-toolbar
3D ObjectsClick on the triangle ▼ to the right of 3D Objects on the Drawing toolbar opens the 3D-Objects sub-toolbar (Figure 39). Alternatively, select the required tool in the 3D-Objects section in the Shapes deck on the Sidebar.
Figure 39: 3D-Objects sub-toolbar
Adding, inserting and formatting text
In Draw text can be added, inserted, and formatted to a drawing, objects, and shapes. For more information on how to add, insert, and format text in a drawing or drawing objects, see Chapter 9,Adding and Formatting Text.
Adding, inserting and formatting text | 37

Draw Guide
Chapter 3 Working with Objects

Introduction
This chapter looks at the tools and functions to modify existing drawings. All of the functions apply to a selected object or a group of selected objects, which can be distinguished by selection handles on a rectangular frame that is large enough to contain the object. Where several objects are selected, the frame around the objects corresponds to the smallest rectangle that can containall of the objects. This frame is called the selection rectangle.
Note
The color and shape of the selection handles changes depending on the tool and function that has been selected to change the object properties. The color of the selection handles also depends on the computer operating system and how the computer has been set up.
Selecting objects
Direct selectionThe easiest way to select an object is to click directly on it. For objects that are not filled, click on the object border to select it. To select more than one object, hold the Shift key down while clicking on objects. To deselect an object, move the cursor into a blank space on the drawing andclick.
Selection by framingSeveral objects can be selected at once by clicking and dragging the cursor around the objects drawing a selection rectangle around the objects. Only objects that lie entirely within this selection rectangle are selected. To select multiple objects by framing, Select on the Drawing toolbar must be active, as shown in Figure 40.
Figure 40: Drawing toolbar
Note
When a cursor is dragged to select multiple objects, the selection rectangle being created is also known as a marquee.
Selecting hidden objectsIf objects are located behind others and not visible, they can still be selected. When a hidden object is selected, its selection handles appear through the objects covering it.
• Windows, Mac or Linux – press the Tab key to select and cycle through the selection of objects in a drawing, stopping at the hidden object to select it. To cycle through the objects in reverse order, press Shift+Tab.
• Windows or Mac only – select the object in front of a hidden object, then press the Alt key and click to select the hidden object. If there are several hidden objects, keep holdingdown the Alt key and clicking until the object required is reached. To cycle through the objects in reverse order, hold down the Alt+Shift keys and click.
Selecting objects | 39

Arranging objectsIn a complex drawing, several objects may be stacked on top of one another. This stacking order can be rearranged by moving an object forward or backward using one of the following methods:
• Select an object, go to Shape > Arrange on the Menu bar, or right-click on the object andselect Arrange from the drop-down menu, then select one of the following options:
– Bring to Front (Ctrl+Shift++)
– Bring Forward (Ctrl++ )
– Send Backward (Ctrl+-)
– Send to Back (Ctrl+Shift+-)
– In Front of Object
– Behind Object
• Select an object, then select one of the Arrange tools at the left end of the Line and Filling toolbar (Figure 41). When the cursor is hovered over a tool, its function is indicated.
Figure 41: Line and Filling toolbar
Note
The Line and Filling toolbar is not visible in the default installation of LibreOffice. To make this toolbar visible, go to View > Toolbars > Line and Filling on the Menu bar.
Positioning and adjusting objects
Using zoomTo help in the positioning and adjustment of objects, Draw has a zoom function that reduces or enlarges the screen display of the current drawing. For example, zoom in to position objects on adrawing with greater accuracy; zoom out to see the complete drawing. Zooming is controlled using the Status Bar, Zoom & View Layout dialog, or ZoomI toolbar.
Note
Zooming is handled differently in Linux and Windows operating systems. A drawing saved with a 100% zoom factor in Windows is displayed at a larger zoom factor in Linux.
40 | Draw Guide 7.1

Figure 42: Zoom controls on Status Bar
Figure 43: Zoom & View Layout dialog
Status bar
The zoom controls are located on the right side of the Status Bar (Figure 42) and these controls give quick and easy access to zooming.
• Fit slide to current window – fits the drawing to the open window.
• Minus sign (-) – reduces the zoom factor
• Plus sign (+) – increases the zoom factor.
• Click and drag the zoom slider to increase or decrease the zoom factor.
• Right-click on the zoom percentage number and select a zoom factor from the context menu that opens.
• Go to View > Zoom > Zoom on the Menu bar to open the Zoom & View Layout dialog (Figure 43) or double-click on the zoom percentage number and select a zoom factor from the Zoom & View Layout dialog.
Zoom & View Layout dialog
The Zoom & View Layout dialog provides the following options to control how a drawing is viewedon a monitor.
• Zoom Factor – sets the zoom factor at which to display the current document and all documents of the same type that are subsequently opened.
– Optimal – resizes the display to fit the width of the text in the document.
– Fit width and height – displays the entire page on the screen.
Positioning and adjusting objects | 41

– Fit width – displays the complete width of the document page. The top and bottom edges of the page may not be visible.
– 100% – displays the document at its actual size.
– Variable – enter a percentage in the box for the zoom factor to display the document.
• View Layout – used to set the view layout and is not available for drawings. View layout is normally used in text documents to see the effects of different layout settings.
Zoom toolbar
Go to View > Toolbars > Zoom on the Menu bar to open the Zoom toolbar (Figure 44). The toolsavailable on this toolbar, from left to right, are as follows:
• Zoom In – displays the drawing at two times its current size each time the tool is selected.
• Zoom Out – displays the drawing at half its current size each time the tool is selected.
• 100% – displays the drawing at its actual size.
• Zoom Previous – returns the display of the drawing to the previous zoom factor applied.
• Zoom Next – undoes the action of the previous zoom command.
• Entire Page – displays the whole drawing in the Workspace.
• Page Width – displays the complete width of the drawing. The top and bottom edges of the slide may not be visible.
• Optimal – resizes the display to include all of the objects on the slide.
• Object Zoom – resizes the display to fit the selected object(s).
• Zoom & Pan – zooms in for each mouse click. Ctrl+click zooms out for each click. Shift+click allows panning of the drawing.
• Shift – moves the drawing within the Draw workspace. Place the cursor on the drawing and drag to move the drawing.
Figure 44: Zoom toolbar
Figure 45: Left end of Status Bar when working with objects
42 | Draw Guide 7.1

Moving and adjusting object sizeWhen moving an object or changing its size, check the left-hand area of the Status Bar at the bottom of the Workspace (Figure 45). From left to right, this area shows that a shape is selected, its position on the drawing in X/Y coordinates and dimensions of the object. The measurement units are those selected in Tools > Options > LibreOffice Draw > General.
Moving objects
To move an object (or a group of objects), select it and then click and drag within the object borders. During movement, a ghost image of the object appears to help with repositioning (Figure 46). When the object reaches its new location, release the mouse button.
Adjusting object size
To change the size of a selected object (or a group of selected objects), move the mouse cursor to one of the selection handles. The cursor changes shape to indicate the direction of movement for that selection handle. As the object size changes, a ghosted outline of the object appears (Figure 47). When the desired size of the object is reached, release the mouse button.
The results depend on which selection handle is used. To resize an object along one axis, use a side, top, or bottom handle. To resize along both axes, use a corner handle.
Note
Press and hold the Shift key while resizing an object, the change in size will be carried out symmetrically with respect to the object width and height so that the aspect ratio of the object remains the same. This Shift key behavior works on all selection handles.
Figure 46: Moving objects
Figure 47: Adjusting object size
Positioning and adjusting objects | 43

Figure 48: Modifying arcs
Modifying arcs
The size of an arc can be changed by adjusting the positions of the start and end points of an arc. Select an arc, then right click on the arc and select Points from the drop-down menu or press the F8 key. Two handles appear at the start and end of the arc (Figure 48). Click on one of these handles and drag it to a new position to change the shape of the arc.
Rotating and slanting objects
Rotating objects
To rotate an object (or a group of objects), select the object, then go to rotation mode using one of the following methods.
1) Select or click on an object
2) Use one of the following methods to switch to rotation mode. The selection handles change shape and color and a center of rotation indicator appears in the center of the object, as shown in Figure 49.
– Click again on a selected object.
– Click on the triangle ▼ on the right of Transformations on the Line and Filling toolbarand select Rotate from the pop up menu.
– Go to View > Toolbars > Transformations on the Menu bar to open the Transformations toolbar (Figure 50) and select Rotate.
Figure 49: Rotating objects
44 | Draw Guide 7.1

Figure 50: Transformations toolbar
3) Move the cursor over the handles and the cursor changes shape. The corner handles are for rotating the object, and the top, bottom and side handles are to shear or slant the object.
Note
The rotation center is normally located at the center of an object. To change the position of the rotation center, click on the rotation center and drag until it is at the desired position. This rotation center can even be outside of the object.
Note
Rotation works in a slightly different way for 3D objects because it occurs in a three dimensional space and not in a single plane. See Chapter 7, Working with 3D Objects for more information.
Slanting objects
To slant an object, select the object and switch on rotation mode (see “Rotating objects” above). Click on the handles located at the midpoints on the top, bottom and sides of a selected object. The cursor changes shape when it hovers over one of these midpoint handles indicating the direction of slanting.
The axis used for slanting an object is the object edge directly opposite the midpoint handle being used to slant the object. This axis stays fixed in location while the other sides of the object move in relation to it as the selection is dragged (Figure51). Click and drag the cursor to slant theobject. A ghosted outline of the object being slanted appears and the current angle of slanting is shown in the status bar.
Note
Press and hold the Shift key while rotating or slanting an object, movement is restricted to 15°. This is the default behavior of the Shift key. However, if When creating or moving objects has been selected in Tools > Options > LibreOffice Draw > Grid, the action of the Shift key is reversed and rotation or slanting is restricted to 15° of movement unless the Shift key is pressed.
Figure 51: Slanting objects
Positioning and adjusting objects | 45

Figure 52: Position and Size dialog
Setting exact position, size, rotation and slantUsing the mouse to position and resize objects is not exact. If greater accuracy is required to position and size an object, it is recommended to use the Position and Size dialog (Figure 52) or the Position and Size section (Figure 53) in the Properties deck on the Sidebar.
• To open the Position and Size dialog, select the object and use one of the following methods:
– Go to Format > Position and Size on the Menu bar.
– Right-click on the object and select Position and Size from the context menu.
– Use the keyboard shortcut F4.
• To open the Position and Size section in the Properties deck on the Sidebar, select the object, then click on Properties on the Sidebar and click on the down arrow next to the Position and Size title bar to open the section.
The options available in the Position and Size dialog and Position and Size section in the Properties deck on the Sidebar are similar. However, on the Sidebar, the position and size of an object cannot be protected, or an object adapted to fit any text, or set the base point position for position and size.
46 | Draw Guide 7.1

Figure 53: Position and Size section in Properties deck on Sidebar
Position and Size
• Position – specify the location of the selected object on the page.
– Position X – enter the horizontal distance required to move the object relative to the base point selected in the grid.
– Position Y – enter the vertical distance required to move the object relative to the base point selected in the grid.
– Base point – select a base point in the grid and then enter the amount required to shiftthe object relative to the base point that is selected in the Position Y and Position X boxes. The base points correspond to the selection handles on an object. This option is only available in the Position and Size dialog.
• Size – specify the amount required to resize the selected object with respect to the selected base point.
– Width – enter a width for the selected object.
– Height – enter a height for the selected object.
– Keep ratio – maintains proportions when resizing the selected object.
– Base point – select a base point in the grid, and then enter the new size dimensions for the selected object in the Width and Height boxes. This option is only available in the Position and Size dialog.
• Protect – this option is only available in the Position and Size dialog.
Positioning and adjusting objects | 47

– Position – prevents changes to the position or the size of the selected object.
– Size – prevents resizing of the object.
• Adapt – specifies, if the size of a text box should be adjusted to fit the size of entered text. This option is only available for text boxes.
– Fit width to text – expands the width of the object to the width of the text, if the object is smaller than the text.
– Fit height to text – expands the height of the object to the height of the text, if the object is smaller than the text.
The units of measurement used for X//Y coordinates and the width and height of the object are set by going to Tools > Options > LibreOffice Draw > General.
The default location of the base points for position and size is the upper left corner of the drawingarea. This base point can be temporarily change to make positioning or dimensioning simpler by clicking on a position corresponding to the location of the base point required. This change in base point is only valid for single use and the base point is reset to the standard position of top left corner when the Position and Size dialog is closed.
Figure 54: Position and Size dialog - Rotation page
48 | Draw Guide 7.1

Rotating objects
To accurately rotate an object, click on the Rotation tab of the Position and Size dialog (Figure 54). The options available allow the rotation angle and the location of the pivot point to bedefined. Alternatively, use the available options for rotation in the Position and Size section in the Properties deck on the Sidebar.
• Pivot Point – the selected object is rotated around a specified pivot point. The default pivot point is at the center of the object. If a pivot point is set too far outside of the object boundaries, the object could be rotated off of the page. This option is only available in thePosition and Size dialog.
– Position X – enter horizontal distance from the left edge of the page to the pivot point.
– Position Y – enter vertical distance from the top edge of the page to the pivot point.
– Default settings – select the position of the pivot point. Default position is the center ofthe object. Changing the rotation pivot point is only valid for single use. The pivot pointis reset to default settings when the Position and Size dialog is closed.
• Rotation – specify the number of degrees that required to rotate the selected object, or click in the rotation grid.
– Angle – enter the number of degrees that required to rotate the selected object. This option is only available in the Position and Size dialog.
– Default settings – click on the indicator to rotate the object. The number of degrees is shown in the Angle box as the indicator is rotated. This option is only available in the Position and Size dialog.
– Rotation – click on the indicator to rotate the selected object, or set the angle in the text box, or select a predetermined angle from the drop-down list. This option is only available in the Position and Size section in the Properties deck on the Sidebar.
Slant and corner radius
To accurately set the corner radius or slant angle of an object, click on the Slant & Corner Radius tab of the Position and Size dialog (Figure 55). Options for slant and corner radius are only available in the Position and Size dialog.
Figure 55: Position and Size dialog - Slant & Corner Radius page
Positioning and adjusting objects | 49

Note
To set the Corner Radius, rectangles and squares available on the Legacy Rectangles have to be used. This toolbar is optional and is opened by going to View > Toolbars > Legacy Rectangles on the Menu bar.
• Corner Radius – this option is only available for the corners of a rectangular or square object that has been created using the Legacy Rectangles toolbar. If this section is grayed out, the corner radius cannot set.
– Radius – enter the radius of the circle that to be used to round the corners. The larger the value for corner radius set, the rounder corners of a rectangle or square become.
• Slant – slants the selected object along the bottom edge of the object.
– Angle – enter the angle of the slant axis. The slant angle relates to how much an object inclines or slants from its normal vertical position on a drawing.
• Control Point 1 and 2 – enter a value to set the X and Y coordinates of the top left corner of the object. If these sections are grayed out, then coordinates cannot be set.
Using grid and snap functions
In Draw, objects can be positioned accurately and consistently using grid points, snap points and lines, object frames, individual points on objects, or page edges. This function is known as Snap.
It is easier to use snap functions at the highest practical zoom value for a drawing. Two different snap functions can be used at the same time. For example, snapping to a guide line and the page edge. However, it is recommended to activate only those snap functions that are really required.
Figure 56: Options LibreOffice Draw Grid dialog
Figure 57: Options toolbar
50 | Draw Guide 7.1

Configuring grid and snap functionsTo configure the grid and snap functions in a drawing, go to Tools > Options > LibreOffice Draw > Grid on the Menu bar to display the Grid dialog (Figure 56). The grid and snap functions can also be displayed and switched on or off using this dialog, right-clicking on a drawing and using the options in the context menu, or using the icons in the Options toolbar (Figure 57). If the Options toolbar is not open, go to View > Toolbars > Options on the Menu bar.
• Grid – specifies the settings for the configurable grid on document pages. This grid helpsto determine the exact position of objects. Also, this grid can be set in line with the magnetic snap grid. If the snap grid is activated, but want to move or create individual objects without snap positions, keep the Shift key pressed to deactivate this function.
– Snap to grid – specifies whether to move frames, drawing elements, and controls onlybetween grid points. To change the status of the snap grip only for the current action, drag an object while holding down the Ctrl key.
– Visible grid – specifies whether to display the grid.
• Resolution
– Horizontal – defines the unit of measure for the spacing between grid points on the X-axis.
– Vertical – defines the grid points spacing in the desired unit of measurement on the Y-axis.
• Subdivision
– Horizontal – specify the number of intermediate spaces between grid points on the X-axis.
– Vertical – specify the number of intermediate spaces between grid points on the Y-axis.
• Synchronize axes – specifies whether to change the current grid settings symmetrically. The resolution and subdivision for the X and Y axes remain the same.
• Snap
– To snap lines – snaps the edge of a dragged object to the nearest snap line when the mouse button is released. This setting can also be defined using Snap to Snap Guides on the Options toolbar.
– To the page margins – specifies whether to align the contour of the graphic object to the nearest page margin. The cursor or a contour line of the graphics object must be in the snap range. This function can also be accessed using Snap to Page Margins in the Options toolbar.
– To object frame – specifies whether to align the contour of the graphic object to the border of the nearest graphic object. The cursor or a contour line of the graphics object must be in the snap range. This function can also be accessed with Snap to Object Border in the Options toolbar.
– To object points – specifies whether to align the contour of the graphic object to the points of the nearest graphic object. This only applies if the cursor or a contour line of the graphics object is in the snap range. This function can also be accessed with Snap to Object Points in the Options toolbar.
– Snap range – defines the snap distance between the mouse pointer and the object contour. Snaps to a snap point if the cursor is closer than the distance selected.
Using grid and snap functions | 51

• Constrain Objects
– When creating or moving objects – specifies that graphic objects are restricted vertically, horizontally or diagonally (45°) when creating or moving them. This setting can be temporarily deactivated by pressing the Shift key.
– Extend edges – specifies that a square is created based on the longer side of a rectangle when the Shift key is pressed before releasing the mouse button. This also applies to an ellipse (a circle is created based on the longest diameter of the ellipse). When Extend edges is not selected, a square or a circle is created based on the shorter side or diameter.
– When rotating – specifies that graphic objects can only be rotated within the rotation angle that is selected. To rotate an object outside the defined angle, press the Shift key when rotating. Release the key when the desired rotation angle is reached.
– Point reduction – defines the angle for point reduction. When working with polygons, this maybe useful in reducing the editing points.
Snap to grid
Using Snap to Grid
Using Snap to Grid moves an object exactly onto a grid point in a drawing. This function can be switched on and off using one of the following methods:
• Go to View > Snap Guides > Snap to Grid on the Menu bar.
• Right-click on a drawing and select Snap Guides > Snap to Grid from the context menu.
• Click on Snap to Grid on the Options toolbar.
Displaying grid
Displaying or turning off the grid in a drawing is done using one of the following methods:
• Go to View > Grid and Helplines > Display Grid on the Menu bar.
• Click on Display Grid on the Options toolbar.
• Right-click on a drawing and select Grid and Helplines > Display Grid from the context menu.
• Select Visible grid in the Options LibreOffice Draw Grid dialog.
Changing color of grid points
By default and depending on the display and computer setup, the grid points are gray and are not always easy to see. To change the color of the grid points, go to Tools > Options > LibreOffice > Application Colors to open the Application Colors dialog (Figure 58). In the Drawing/Presentation section, select a more suitable color for the grid from the drop-down list.
Snap points and linesUnlike the grid, snap lines and snap points can be inserted when to position an object to a specific position on a drawing. Snap lines can either be horizontally or vertically and appear as dashed lines. Snap points appear as small crosses with dashed lines. Snap points and snap linesdo not appear in printed output.
52 | Draw Guide 7.1

Figure 58: Options LibreOffice Application Colors dialog
Figure 59: New Snap Object dialog
Inserting snap points and snap lines
To insert a snap point or snap line, go to Insert > Snap Guide on the Menu bar to open the New Snap Object dialog (Figure 59).
• Position – sets the position of a selected snap point or line relative to the top left corner of the page.
– X axis – enter the amount of space required between the snap point or line and the left edge of the page.
– Y axis – enter the amount of space required between the snap point or line and the top edge of the page.
• Type – specifies the type of snap object being inserted.
Using grid and snap functions | 53

– Point – inserts a snap point.
– Vertical – inserts a vertical snap line.
– Horizontal – inserts a horizontal snap line.
Displaying snap points and lines
Displaying or turning off snap points and lines in a drawing can be done using one of these methods:
• Go to View > Snap Guides > Display Snap Guides on the Menu bar.
• Click on Display Snap Guides in the Options toolbar.
• Right-click on a drawing and select Snap Guides > Display Snap Guides from the context menu.
Editing snap points and lines
To edit a snap point, right-click on the snap point and select Edit Snap Point from the context menu to open the Edit Snap Point dialog (Figure 60). Enter new X and Y coordinate settings for the snap point and click OK. Alternatively, drag a snap point to a new position on a drawing.
To edit a snap line, right-click on the snap line and select Edit Snap Line from the context menu to open the Edit Snap Line dialog (Figure 61). Enter a new X coordinate setting for vertical snap lines or a new Y coordinate setting for horizontal snap lines and click OK. Alternatively, drag a snap line to a new position on a drawing.
Figure 60: Edit Snap Point dialog
Figure 61: Edit Snap Line dialog
54 | Draw Guide 7.1

Deleting snap points and lines
To delete a snap point, drag it back to a ruler or right-click on the snap point and select Delete Snap Point from the context menu. To delete a snap line, drag it back to the ruler or right-click on the snap line and select Delete Snap Line from the context menu.
Configuring snap range
To configure the snap range of when an object snaps to position
1) Go to Tools > Options > LibreOffice Draw > Grid on the Menu bar to open the Options LibreOffice Grid dialog.
2) Enter the number of pixels to set the proximity of when the object will snap into position inthe Snap range box. The default setting is 5 pixels.
3) Click OK to set the new snap range and close the dialog.
Figure 62: Helplines while moving
Figure 63: Options LibreOffice Draw View dialog
Using grid and snap functions | 55

Using Helplines
Helplines are a function in Draw to help in positioning of objects. Helplines can be displayed whilethe object is being moved. They extend from the edges of the object to the rulers at the top and left side of a drawing and do not have a snap function (Figure 62).
To use guide lines, go to Tools > Options > LibreOffice Draw > View on the Menu bar to open the Options LibreOffice Draw View dialog (Figure 63) and select Helplines when moving option orclick Helplines While Moving in the Options toolbar.
Changing object shape
Regular shapesWhen drawing certain regular shapes, one or more dots are displayed in a different color to the selection handles when an object is selected. When the cursor hovers over one of these dots, it changes shape. Clicking and dragging on one of these dots modifies the shape of the object. For example, increasing the corner radius of a rounded rectangle or square, changes the angles of an arc, and so on.
These dots perform different functions according to the shape selected. The shapes with form changing dots and their functions are listed in the following sections.
Note
Regular shapes can also be changed after conversion to a curve or polygon and editing the points. See “Curves and polygons” on page 59 and “Editing points” on page 59 for more information.
Basic shapes
Figure 64: Basic Shapes sub-toolbar
Refer to Figure 64 to identify the following shapes with adjustment dots.
• Rectangle, Rounded – use the dot to change the radius of the curve that replaces the angled corners of a rectangle or square.
• Square, Rounded – use the dot to change the radius of the curve that replaces the angled corners of a rectangle or square.
• Parallelogram – use the dot to change the internal angles between the sides.
• Trapezoid – use the dot to change the internal angles between the sides.
• Circle Pie – use the dots to change the size of the filled sector.
• Block Arc – use the dot to change both internal diameter and size of the filled area.
• Isosceles Triangle – use the dot to modify the shape and type of the triangle.
• Hexagon – use the dot to change the internal angles between the sides.
• Octagon – use the dot to change the internal angles between the sides.
• Cylinder – use the dot to change the perspective.
56 | Draw Guide 7.1
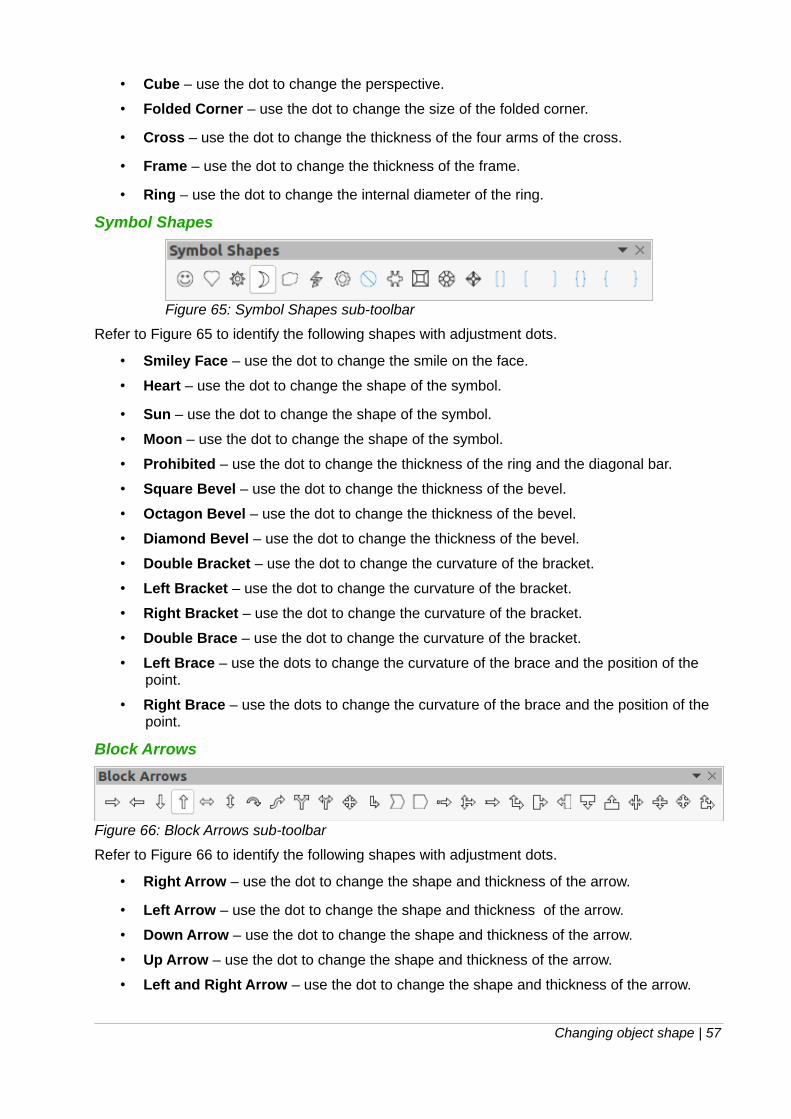
• Cube – use the dot to change the perspective.
• Folded Corner – use the dot to change the size of the folded corner.
• Cross – use the dot to change the thickness of the four arms of the cross.
• Frame – use the dot to change the thickness of the frame.
• Ring – use the dot to change the internal diameter of the ring.
Symbol Shapes
Figure 65: Symbol Shapes sub-toolbar
Refer to Figure 65 to identify the following shapes with adjustment dots.
• Smiley Face – use the dot to change the smile on the face.
• Heart – use the dot to change the shape of the symbol.
• Sun – use the dot to change the shape of the symbol.
• Moon – use the dot to change the shape of the symbol.
• Prohibited – use the dot to change the thickness of the ring and the diagonal bar.
• Square Bevel – use the dot to change the thickness of the bevel.
• Octagon Bevel – use the dot to change the thickness of the bevel.
• Diamond Bevel – use the dot to change the thickness of the bevel.
• Double Bracket – use the dot to change the curvature of the bracket.
• Left Bracket – use the dot to change the curvature of the bracket.
• Right Bracket – use the dot to change the curvature of the bracket.
• Double Brace – use the dot to change the curvature of the bracket.
• Left Brace – use the dots to change the curvature of the brace and the position of the point.
• Right Brace – use the dots to change the curvature of the brace and the position of the point.
Block Arrows
Figure 66: Block Arrows sub-toolbar
Refer to Figure 66 to identify the following shapes with adjustment dots.
• Right Arrow – use the dot to change the shape and thickness of the arrow.
• Left Arrow – use the dot to change the shape and thickness of the arrow.
• Down Arrow – use the dot to change the shape and thickness of the arrow.
• Up Arrow – use the dot to change the shape and thickness of the arrow.
• Left and Right Arrow – use the dot to change the shape and thickness of the arrow.
Changing object shape | 57

• Up and Down Arrow – use the dot to change the shape and thickness of the arrow.
• Circular Arrow – use the dot to change the shape and thickness of the arrow.
• 4-way Arrow – use the dots to change the shape and thickness of the arrow.
• Chevron – use the dot to change the angle between the sides and the shape.
• Pentagon – use the dot to change the angle between the sides and the shape.
• Striped Right Arrow – use the dot to change the shape and thickness of the arrow.
• Up, Right and Down Arrow – use the dots to change the shape and thickness of the arrow.
• Notched Right Arrow – use the dot to change the shape and thickness of the arrow.
• Up and Right Arrow – use the dots to change the shape and thickness of the arrow.
• Right Arrow Callout – use the dots to change the shape and thickness of the callout.
• Left Arrow Callout – use the dots to change the shape and thickness of the callout.
• Down Arrow Callout – use the dots to change the shape and thickness of the callout.
• Up Arrow Callout – use the dots to change the shape and thickness of the callout.
• Left and Right Arrow Callout – use the dots to change the shape and thickness of the callout.
• Up and Down Arrow Callout – use the dots to change the shape and thickness of the callout.
• 4-way Arrow Callout – use the dots to change the shape and thickness of the callout.
• Up and Right Arrow Callout – use the dots to change the shape and thickness of the callout.
Callouts
Figure 67: Callouts sub-toolbar
For all callouts (Figure 67) use the adjustment dots to change the length, position and angle of the pointer.
Stars and Banners
Figure 68: Stars and Banners sub-toolbar
Refer to Figure 68 to identify the following shapes with adjustment dots.
• 4-Point Star – use the dot to change the thickness and shape of the star points.
• 8-Point Star – use the dot to change the thickness and shape of the star points.
• 24-Point Star – use the dot to change the thickness and shape of the star points.
• Vertical Scroll – use the dot to change the width and shape of the scroll.
58 | Draw Guide 7.1

• Horizontal Scroll – use the dot to change the width and shape of the scroll.
• Doorplate – use the dot to change the inward curvature of the corners.
Curves and polygons
Bézier curves
The editing of curves and polygons depends on the mathematics of Bézier curves1. Explaining Bézier curves goes beyond this scope of this chapter. See Chapter 11, Advanced Draw Techniques for more information on drawing and manipulating Bézier curves.
The editing a Bézier curve consists in principle of moving points or tangents passing through these points. Each tangent has one control point at each end and a junction point where it meets the curve. The relative angle and distance between the control points determine the shape of the curve. Figure 69 shows what happens to a basic square and changing only one point on the square.
Figure 69: Creating different shapes by changing the tangent
Converting objects to curve or polygon
When changing the shape of an object and before modifying the points on an object, it must be converted to a curve or a polygon. Depending on what kind of shape and effect required to produce using one of the following methods to create a curve or a polygon:
• After selecting an object, go to Shape > Convert on the Menu bar and select either To Curve or To Polygon.
• Right click on an object and select Convert > To Curve or To Polygon from the context menu.
Editing pointsMany different shapes can be created by moving either the point itself, or one or both of the round handle points at either end of the tangent, as shown in Figure 69. Points can be added, deleted, or the points type changed using the tools available on the Edit Points toolbar (Figure 70). After converting a shape to a curve or polygon, object points are edited as follows:
1 Bézier curves were invented by Pierre Bézier, who developed the technique in the 1960s and was an engineer working with the Renault car manufacturer. The technology was intended to make modeling the surface of vehicles easier.
Changing object shape | 59

Figure 70: Edit Points toolbar
1) Select the object and switch to points editing mode using one of the following methods.
– Go to Edit > Points on the Menu bar.
– Click on the Points tool on the Standard toolbar.
– Right click on the converted object and select Points from the context menu.
– Use the keyboard shortcut F8.
Note
After switching to points editing mode, the selection handles become points. The number of points may increase or reduce in number. This change in number depends on the shape of the object and is normal behavior.
2) Click on an object point to change the object shape. The Edits Points toolbar opens and the tools become active when a point is selected. Tangents also appear attached to the selected point.
3) Use the various tools on the Edit Points toolbar to add, delete, or change the point type.
4) Click on and drag the point to move the point and change the object shape.
5) If the selected object is a curve, click on and drag the round points at the end of a tangentto make further changes to the object shape.
6) When satisfied with the shape, click outside of the object to cancel points editing mode and close the Edit Points toolbar.
Point typesThe available tools on the Edit Points toolbar depend on the object and type of object point that has been selected.
• Move Points – activates a mode allowing movement of points. Click and drag the selected point to another location. The object border follows the movement on both sidesof the selected point to the next point on each side of the selected point.
• Insert Points – activates the insert mode and allows points to be inserted. Points can also be moved. A point is inserted onto the selected object each time the mouse button isclicked and the object changes shape to include the new point into the border of the object. The inserted point is a smooth point.
• Delete Points – used to delete points from the selected object. Select Delete Points andthen click on a point to delete it. To delete several points, hold down the Shift key as eachpoint is selected for deletion, then click on Delete Points.
• Convert To Curve – converts a curve into a straight line or a straight line into a curve. If a single point is selected, the curve before the point will be converted. If two points are selected, the curve between both points will be converted. If more than two points are selected and each time this icon is clicked, a different portion of the curve will be converted. If necessary, round points are converted into corner points and corner points are converted into round points.
60 | Draw Guide 7.1

If a section of the curve is a straight line, the end points of the line have a maximum of one control point each. They cannot be modified to round points unless the straight line is converted back to a curve.
• Close Bézier – closes a line or a curve. A line is closed by connecting the last point with the first point, indicated by an enlarged square.
• Split Curve – select the point or points where the curve will be split, then click on Split Curve.
• Corner Point – converts the selected point or points into corner points. Corner points have two movable control points, which are independent from each other. A curved line, therefore, does not go straight through a corner point, but forms a corner.
To create a corner point, a smooth or a symmetrical point must be inserted first and then converted to a corner point by clicking on Corner Point.
• Smooth Transition-- converts a corner point or symmetrical point into a smooth point. Both control points of the corner point are aligned in parallel, and can only be moved simultaneously. The control points may differentiate in length, allowing variation in the degree of curvature.
• Symmetric Transition – converts a corner point or a smooth point into a symmetrical point. Both control points of the corner point are aligned in parallel and have the same length. They can only be moved simultaneously and the degree of curvature is the same in both directions.
• Eliminate Points – marks selected points for deletion. This happens if the point is located on a straight line. If converting a curve or a polygon using Convert to Curve into a straight line or alter a curve using the cursor so that a point lies on the straight line, the selected point is removed. The angle from which the point reduction is to take place is 15° by default.
TangentsBefore using tangents on an object, the object must be converted to a curve. Tangents are only used on curves. If an object has been converted to a polygon and a tangent is added, the object is automatically converted to a curve.
Note
The angle that a tangent relates to an object shape can be changed by clicking on one of the tangent control points at the end of a tangent and moving it with the cursor. As the tangent angle is changed, the shape of the object changes in response.
Symmetric transition
Symmetric transition converts a corner point or a smooth point into a symmetrical point. The tangents have the same length and are aligned in a straight line, as shown in Figure 71. The tangents can only be moved simultaneously and the degree of curvature is the same in both directions.
1) Convert the object to a curve or polygon.
2) Switch the selected object into editing points mode and open the Edit Points toolbar.
3) Select the point to be changed to a symmetrical point.
Changing object shape | 61

Figure 71: Symmetric transition
4) Click on Symmetric Transition in the Edit Points toolbar. The straight line on each side of the symmetric transition point is converted to a curve.
5) Click and drag one of the tangent control handles to change the curvature and shape of the object. Any change to one tangent is carried over symmetrically to the other tangent.
Smooth transition
Smooth transition converts a corner point or symmetrical point into a smooth point. The tangents are aligned in a straight line and can only be moved simultaneously. The tangents can have different lengths with the curvature controlled by the longest tangent being the largest curvature, as shown in Figure 72.
Figure 72: Smooth transition
1) Convert the object to a curve or polygon.
2) Switch the selected object into editing points mode and open the Edit Points toolbar.
3) Select the point to be changed to a symmetrical point.
4) Click on Smooth Transition on the Edit Points toolbar.
5) Click and drag one of the tangent control handles to change the shape of the object. This creates an asymmetric tangent with the largest curvature on the longest side of the tangent.
Corner point
Converts a selected point or points into corner points. Corner points have two movable control points, which are independent from each other. It is possible to independently change the angle on each side of a tangent using the central point of the tangent as a corner point, as shown in Figure 73.
62 | Draw Guide 7.1

Figure 73: Corner point
1) Convert the object to a curve or polygon.
2) Switch the selected object into editing points mode and open the Edit Points toolbar.
3) Select the point to be changed to a symmetrical point.
4) Click on Corner Point on the Edit Points toolbar.
5) Click and drag the end of one of the tangents to change its angle. Each tangent can be moved independently to create spikes and troughs in an object shape.
Points
Moving points
When moving points, the object border on both sides of the point follows the movement of the point changing the object shape.
1) Convert the object to a curve or a polygon,.
2) Switch the selected object into editing points mode and open the Edit Points toolbar.
3) Select the point to be changed to a symmetrical point.
4) Click on Move Points on the Edit Points toolbar.
5) Place the cursor on the selected point, then click and drag the point to create a new shape. Figure 74 illustrates how a different shape can be created from a circle by dragging the left hand side point to the left.
Figure 74: Moving points
Inserting points
A point is inserted onto the selected object each time the mouse button is clicked. Clicking inside the border of the object, the object changes shape to include the new point into the border of the object, as shown in Figure 75. The inserted point is a smooth point.
Points can also be moved in insert point mode. Hover the cursor over the point until it changes shape, then click and drag the point to change the object shape.
Changing object shape | 63

Figure 75: Inserting points
1) Convert the object to a curve or a polygon.
2) Switch the selected object into editing points mode and open the Edit Points toolbar.
3) Click on Insert Points on the Edit Points toolbar.
4) Click on the object border to insert a point at the required position on the border.
5) Alternatively, click inside the object border to insert a point. The object automatically changes shape to include the new point into the object border.
Deleting points
Figure 76 shows what happens when three points on the left were deleted from a circle. The left image is a the full circle and the right image is where three points have been deleted creating a new shape.
Figure 76: Deleting points
1) Convert the object to a curve or a polygon.
2) Switch the selected object into editing points mode and open the Edit Points toolbar.
3) To delete a single point, proceed as follows
a) Select the point for deletion.
b) Click on Delete Points on the Edit Points toolbar.
4) To delete several points at the same time, proceed as follows:
a) Hold down the Shift key.
b) Select all the points for deletion.
c) Click on Delete Points on the Edit Points toolbar
64 | Draw Guide 7.1

Eliminating points
The Eliminate Points tool on the Edit Points toolbar only functions on lines with multiple points. These lines are created when a curve is converted to a line using the Convert to Curve tool. An example of creating a straight line and eliminating points is shown in Figure 77.
Figure 77: Converting curve to line and eliminating points
1) Convert the curve to a curve or a polygon.
2) Switch the curve into editing points mode and open the Edit Points toolbar.
3) Select the curve with multiple points and convert to a line, see “Converting curves or lines” below.
4) Select the point or points on the line for elimination. The selected point is emphasized.
5) Select the Eliminate Points tool on the Edit Points toolbar.
6) Accurately position the cursor over the selected point, then click and drag the selected point. As the cursor is dragged, a dotted line forms between the neighboring points.
7) When this dotted line appears to be a straight line between the neighboring points, release the mouse button. The selected point is eliminated and a straight line now exists between the neighboring points.
Converting curves or linesCurves and lines are easily converted using the Convert to Curve tool on the Edit Points toolbar.When a curve is converted to a line, a straight line is created between selected points on a curve.When a line is converted to a curve, a curve is created between selected points on a line. An example of converting a curve to a line is shown in Figure 77.
1) Convert the object to a curve or a polygon.
2) Switch the object into editing points mode and open the Edit Points toolbar.
3) Select the points for converting from curve to line or from line to curve.
4) Click on Convert to Curve on the Edit Points toolbar. Between the selected points, a curve is converted into a line or a line is converted into a curve.
Splitting objects1) Convert the object to a curve or a polygon.
2) Switch the object into editing points mode and open the Edit Points toolbar.
Changing object shape | 65

Figure 78: Splitting objects
3) Select the point or points on the object where it is to be split. Keep the Shift key pressed down when selecting more than one point.
4) Click on Split Curve on the Edit Points toolbar to split or cut the object border at the selected point. If the object is filled, it will be emptied because the object border is no longer closed, as shown in Figure 78.
5) Deselect the object, then drag the cut segment and move it away from the original object.
Note
The point where the object was split is now larger than the remaining points visible on the object.
Closing objects1) Select an open object (Figure 79).
2) Switch the object into editing points mode and open the Edit Points toolbar.
3) Select a point where the object has been split. Note that the start point of an object is larger than the other points visible on the object.
4) Click on Close Bézier in the Edit Points toolbar to close the object. If the open object wasoriginally a closed and filled object, then the original color fills the object when it is closed.
Figure 79: Closing objects
66 | Draw Guide 7.1

Figure 80: Distorting objects
Distorting objects1) Select the object and switch into editing points mode to display the points on the object.
This also opens the Edit Points toolbar.
2) Select one of the points on the object and drag it to a new position to distort the object (Figure 80).
Changing object shape | 67

Draw Guide
Chapter 4, Changing Object Attributes

Formatting lines
In LibreOffice the term Line indicates a freestanding segment (line), the outer edge of a shape (border), or an arrow. In most cases, the properties of the line that can be modified are its style (solid, dashed, invisible, and so on), its width, its color and the type of arrowhead.
Tip
Hovering the cursor over a tool icon on a toolbar or in the Sidebar, a pop up displays the name of the tool.
Note
For more information on using color when formatting lines, line styles, arrows, and arrow styles, see “Working with area fills” on page 82.
Line and Filling toolbarFormat a line using the Line and Filling toolbar (Figure 81) as follows:
1) Make sure the line is selected in a drawing.
2) Select the line style required from the Line Style drop-down list.
3) Either type the line width in the Line Width text box, or use the up and down arrows to change the line width.
4) Click on the small triangle ▼ to the right of Line Color and select a color from one of the available color palettes.
5) Click on the small triangle ▼ to the right of Line Style and select a line style from one of the options in the drop-down list.
Figure 81: Line and Filling toolbar
SidebarFormat a line using the Line section in the Properties deck on the Sidebar (Figure 82) as follows:
1) Make sure the line is selected in a drawing.
2) Click on Properties on the Sidebar to open the Properties deck.
3) Click on the down arrowhead ˅ on the left of the Line title bar to open the Line section.
4) In Line, select from the Arrow Style drop-down lists the type of arrowhead for each end of the line and change the line into an arrow. The left drop-down list adds an arrowhead tothe beginning of the line. The right drop-down list adds an arrowhead to the end of the line.
Formatting lines | 69

Figure 82: Line section in Properties deck on Sidebar
5) In Line, select the type of line required from the Line Style drop-down list.
6) In Width, select the line width from the Width drop-down list or enter a width in the Custom Line Width text box.
7) In Color, click on the small triangle ▼ to the right of Line Color and select a color from one of the available color palettes.
8) In Transparency, enter a percentage for the amount of transparency for the line.
9) In Corner style, select a corner style from the drop-down list.
10) In Cap style, select a cap style from the drop-down list.
Line dialogTo fully change the appearance of a line, use the Line dialog.
1) Select the line in a drawing and open the Line dialog (Figure 83) using one of the following methods:
– Go to Format > Line on the Menu bar.
– Right-click on the line and select Line from the context menu.
– Click on More Options on the right of the Line section title on the Sidebar.
2) Use the options available in the pages of the Line dialog to format the line. The pages areLine, Shadow, Line Styles and Arrow Styles. The options are explained in the followingsections. The preview box at the bottom of the dialog shows the effect of the changes on a line.
3) Click OK to save the changes and close the dialog.
70 | Draw Guide 7.1

Figure 83: Line dialog - Line page
Line pageThe Line page in the Line dialog is where the basic parameters of the line are set. It is divided into three sections as follows.
Line properties
Use Line Properties to set the following parameters:
• Style – select a line style from the drop-down list.
• Color – select a predefined color from one of the available color palettes.
• Width – specifies the thickness of the line.
• Transparency – sets the transparency of a line. Figure 84 shows the effects of different percentages in transparency levels to lines when placed over an object.
Figure 84: Line transparency (0%, 25%, 50%, 75%)
Formatting lines | 71

Arrow styles
Use Arrow Styles to set the following parameters when creating arrows in a drawing.
• Start style and End style – select from the drop-down list an arrow style or arrowhead for the start and end of a line.
• Width – specifies the thickness of the arrow endings
• Center – moves the center of the arrow endings to the end point of the line. Figure 85 shows the effects of selecting this option.
• Synchronize ends – makes the two line ends identical.
Figure 85: Default arrow top; centered arrow bottom
Note
Arrowheads are only applicable to lines. They have no effect on the border of an object.
Corner and cap styles
Corner and Cap Styles determine how the connection between two segments looks. To appreciate the difference between these styles, choose a thick line style and observe how the preview changes.
• Corner style – select the shape to be used at the corners of the line. For a small angle between lines, a mitered shape is replaced with a beveled shape.
• Cap style – select the style of the line end caps. The caps are added to inner dashes as well.
Figure 86: Line dialog - Shadow page
72 | Draw Guide 7.1

Shadow pageThe Shadow page (Figure 86) of the Line dialog provides the options to add and format a shadow to a selected line. The settings on this dialog page are the same as those for shadows applied to other objects, described in “Shadows” on page 96.
A quick way to apply a shadow to a line is using the Shadow tool on the Line and Filling toolbar. The disadvantage of using the Shadow tool is that the shadow created uses the shadow settingsfor the default graphics style.
Line stylesLine styles are useful in a drawing when adding several lines of similar types. This reduces the need to format individual lines. LibreOffice provides standard line styles that can be used in a drawing. Also, line styles can be created, saved, and deleted.
Creating line styles
1) Create a line in a drawing.
2) Open the Line dialog and click on the Line Styles tab to open the Line Styles page (Figure 87).
3) In the Line style drop-down list, select a line style similar to the style to be created. An example of the line style selected is displayed at the bottom of the dialog page. This example changes as changes are made to the line style.
4) Click on Add and type a name for the new line style in the dialog that opens, then click OK. The name of the new style appears in the Line style box.
Figure 87: Line dialog - Line Styles page
Formatting lines | 73

5) In the Type drop-down menus, select either Dots or Dash. To use only one type for the line, select the same type in both Type boxes. To alternate the two line types within a single line, select different types in the two Type boxes.
6) In the Number boxes, specify the number of each line type selected in Type.
7) In the Length boxes, specify the Dash length as a percentage of the line. The Length option is not available for Dots.
8) In the Spacing box, specify the spacing between the dashes and dots as a percentage of the line. The Spacing option is not available when the option Fit to line width is selected.
9) If necessary, select Fit to line width so that the new style fits the line width when that line is created in a drawing.
10) To create a new line style for the current drawing only:
a) Click on Add to open the Name dialog and enter a unique name for the new line style.
b) Click on OK to save the new line style and close the Name dialog.
11) To modify an existing line style and create a new line style for the current drawing only:
a) Click on Modify to open the Name dialog and enter a unique name for the new line style.
b) Click on OK to save the new line style and close the Name dialog.
12) Click on OK to close the Line dialog and the new line style is ready for use in the current drawing only.
Note
When creating a line style, it is recommended to use a unique name for the line style.This prevents one of the standard line styles in LibreOffice from being overwritten and causing formatting problems in other drawings or documents that use the standard line styles.
Note
To use the new line style in other drawings, the line style must be saved using Save Line Styles option. See "Saving line styles" below for more information.
Saving line styles
Saving a line style allows for a newly created line style to be used in other LibreOffice drawings.
1) Create a new line style, described in “Creating line styles” above, but do not close the Line dialog.
2) Click on the Save Line Styles icon at the bottom right of the Line Styles page to open a file browser window at the correct location for line styles.
3) Enter a unique filename using the extension .sod for the line style in the Name box.
4) Click on Save to save the line style and close the file browser window. The new line style is now available for use in new drawings and documents.
74 | Draw Guide 7.1

Loading line styles
LibreOffice provides standard line styles when installed on a computer. However, compatible line styles can loaded and used in LibreOffice. Any line styles loaded into LibreOffice must use the fileextension .sod.
1) Create a line in a drawing.
2) Open the Line dialog and click on the Line Styles tab to open the Line Styles page (Figure 87).
3) Click on the Load Line Styles icon at the bottom right of the Line Styles page to open a file browser window at the correct location for line styles.
4) Select a style from the list of saved styles in the file browser window. The file extension for line styles is .sod.
5) Click Open to load the line style into LibreOffice. The line style becomes available for other LibreOffice drawings and documents.
6) Click OK to close the Line dialog and save any changes made.
Deleting line styles
1) Create a line in a drawing.
2) Open the Line dialog and click on the Line Styles tab to open the Line Styles page (Figure 87).
3) Select the line style for deletion from the Line style drop-down list.
4) Click on Delete and confirm the deletion by clicking on Yes in the confirmation dialog that opens.
5) Click OK to close the Line dialog and save any changes made.
Note
Before deleting line styles, make sure that the line style is not used in another drawing or document.
Arrow stylesUse the Arrow Styles page (Figure 88) in the Line dialog to create new arrow styles, modify existing arrow styles, or load previously saved arrow styles.
Note
The part of the shape required for the point of the arrowhead must be at the top of the shape created. If necessary, rotate the shape until the point is at the top of the shape. If the shape is already a curve, then the conversion option To Curve will not be available.
Creating arrow styles
1) Draw a shape to use for an arrowhead, or create a shape using one of the basic shapes that are available in Draw.
2) Select the shape and convert to a curve using one of the following methods:
– Right-click on the shape and select Convert > To Curve from the context menu.
– Go to Shape > Convert > To Curve on the Menu bar.
Formatting lines | 75

Figure 88: Line dialog - Arrow Styles page
3) With the shape selected, open the Arrow Styles page in the Line dialog.
4) Click on Add and type a unique name for the new arrow style in the Name dialog that opens.
5) Click OK and the new arrowhead style is displayed in the preview box of the Line dialog.
6) Click OK to save the changes and close the Line dialog. The new arrow style appears at the bottom of the Arrow style drop-down list on the Arrow Styles page in the Line dialog.
Note
Some shapes cannot be used as an arrowhead. This is indicated by rectangular blocks appearing at each end of the line in the preview box on the Line Styles page in the Line dialog.
Note
When creating an arrow style, it is recommended to use a unique name for the arrowstyle. This prevents one of the standard arrow styles in LibreOffice from being overwritten and causing formatting problems in other drawings that use the standard arrow styles.
Note
The new arrow style created is available only for use in the current drawing. To use the new arrow style in other drawings, the arrow style must be saved using the Save Arrow Styles option.
76 | Draw Guide 7.1

Saving arrow styles
Saving an arrow style allows for the newly created style to be used in other LibreOffice documents.
1) Create a new arrow style as described in “Creating arrow styles” above, but do not close the Line dialog.
2) Click on the Save arrow styles icon at the bottom right of the Arrow Styles page to opena file browser window at the correct location for arrow styles.
3) Enter a unique filename using the extension .soe for the arrow style.
4) Click on Save to save the arrow style and close the file browser window. The new arrow style is now available for use in new documents.
Loading arrow styles
LibreOffice provides standard arrow styles when installed on a computer. However, compatible arrow styles can be loaded and used in LibreOffice. Any arrow styles loaded into LibreOffice mustuse the file extension .soe.
1) Create an arrow or line in a drawing.
2) Open the Line dialog and click on the Arrow Styles tab to open the Arrow Styles page (Figure 88).
3) Click on the Load arrow styles icon at the bottom right of the Arrow Styles page to open a file browser window at the correct location for arrow styles.
4) Select an arrow style from the list of saved styles in the file browser window
5) Click Open to load the arrow style into the drawing. The arrow style also becomes available for other LibreOffice documents.
6) Click OK to close the Line dialog and save any changes made.
Deleting arrow styles
1) Create an arrow or line in a drawing.
2) Open the Line dialog and click on the Arrow Styles tab to open the Arrow Styles page (Figure 88).
3) Select the arrow style for deletion from the Arrow style drop-down list.
4) Click on Delete and confirm the deletion by clicking on Yes in the confirmation dialog that opens.
5) Click OK to close the Line dialog and save any changes made.
Note
Before deleting arrow styles, make sure that the arrow style is not used in another drawing or document.
Formatting area fills
The term area fill refers to the inside of an object. An area fill can be none, a uniform color, gradient, hatching, bitmap or pattern, as shown in Figure 89. Also, an area fill can be made partlyor wholly transparent and can throw a shadow.
Formatting area fills | 77

Figure 89: Examples of area fill types
Line and Filling toolbarTools on the Line and Filling toolbar (Figure 81 on page 69) provide a range of default fills readily available to quickly format graphic objects. If this toolbar is not showing, go to View > Toolbars >Line and Filling on the Menu bar. To format the area of an object:
1) Select an object so that the selection handles are displayed.
2) Click on Area Style/Filling on the Line and Filling toolbar and select the type of fill required from the drop-down list (None, Color, Gradient, Hatching, Bitmap, Pattern) (Figure 90).
3) Select one of the available options for the required type of area fill.
– Color (Figure 91) – select a color palette from the available options in the drop-down list, then select a color by clicking on the color. For more information on color fills, see “Color fills” on Page 82.
– Gradient (Figure 92) – select the required gradient from the drop-down list. For more information on gradient fills, see “Gradient fills” on Page 84.
– Hatching (Figure 93) – select the required hatching from the drop-down list. For moreinformation on hatching fills, see “Hatching fills” on Page 93.
– Bitmap (Figure 94) – select the required bitmap from the drop-down list. For more information on bitmap fills, see “Bitmap fills” on Page 88.
– Pattern (Figure 95) – select the required pattern from the drop-down list in the Area section in the Properties deck on the Sidebar. For more information on pattern fills, see “Pattern fills” on Page 91.
4) Deselect the object to save the changes to the object.
78 | Draw Guide 7.1

Figure 90: Area fill types
Figure 91: Color area fills
Figure 92: Gradient area fills
Formatting area fills | 79

Figure 93: Hatching area fills Figure 94: Bitmap area fills
Figure 95: Pattern area fills in Area section in Properties deck on Sidebar
SidebarFormat the area of an object using the Sidebar (Figure 95) as follows:
1) Make sure the object is selected in a drawing.
2) Click on Properties on the Sidebar, then click on the down arrowhead ˅ on the left of the Area titlebar to open the Area section.
80 | Draw Guide 7.1

3) Use the options in the Fill and Transparency drop-down lists to format the area of an object. For more information, see “Working with area fills” on page 82.
4) Deselect the object to save the changes.
Area dialogFormat area fills with greater control using the Area dialog (Figure 97) as follows:
1) Make sure the object is selected in a drawing.
2) Open the Area dialog using one of the following methods:
– Go to Format > Area on the Menu bar.
– Click on Area in the Line and Filling toolbar.
– Right-click on the selected object and select Area from the context menu.
– Click on More Options on the right of the Area section title on the Sidebar.
3) Click on the Area tab to open the Area page. For more information, see “Working with area fills” on page 82.
4) Select the type of area fill from the options.
5) Select the style of area fill from the options that become available for the type of area fill selected.
6) Click OK to close the Area dialog and save the changes.
Figure 96: Area dialog - Color page
Formatting area fills | 81

Working with area fills
Color fills
Selecting color fill
The following procedure to select a color for an area fill uses the Area dialog. Using the tools on the Line and Filling Toolbar, and the Area section in the Properties deck on the Sidebar is a similar procedure, but the available options are reduced. All color fills are solid colors.
1) Make sure the object is selected in a drawing.
2) Open the Area page on the Area dialog, then click on Color (Figure 96) to open the options available for a color fill.
3) In Colors, select the required palette from the available options in the Palette drop-down list.
4) Click on the color required. The present color fill of a selected object is displayed In the Active preview box.. After selecting a new color, a preview of the selected color appears in the New preview box.
5) Alternatively, enter the RGB values or the Hex value of a color in the New text boxes.
Figure 97: Pick A Color dialog
82 | Draw Guide 7.1

6) Alternatively, click on Pick to open the Pick a Color dialog (Figure 97). Select a color usingone of the following methods:
– Enter the RGB, Hex, HSB or CMYK values for the color, then click OK to close the Pick a Color dialog and place the color in the New preview box.
– Click on the color range in the vertical color bar, then click and drag the small circle in the color box to select the color. Click OK to close the Pick a Color dialog and place the color in the New preview box.
7) If necessary and to revert back to the original color, click on Reset and any changes made are removed.
8) Click OK to close the Area dialog and save the changes. The color is then changed in the selected object.
Tip
If a color has been used before, it appears in Recent Colors. It can be selected and used again from those colors available in Recent Colors.
Creating custom colors using Area dialog
To create a custom color so that the color is available for other drawings or documents, then the Colors page in the Area dialog must be used.
1) Select a filled object to create a color.
2) Open the Area page on the Area dialog, then click on Color to open the available options.
3) Specify the RGB values or the Hex value of the custom color in the New text boxes.
4) Alternatively, click on Pick to open the Pick a Color dialog. Select a color using one of thefollowing methods:
– Enter values for the custom color in the boxes for RGB, Hex, HSB or CMYK values, then click OK to close the Pick a Color dialog and place the color in the New preview box.
– Click on the color range in the vertical color bar, then click and drag the small circle in the color box to select the color. Click OK to close the Pick a Color dialog and place the color in the New preview box.
5) On the Area Color page of the Area dialog, under Custom Palette, click on Add and a Name dialog opens.
6) Enter a unique name in the text box and click OK. The new custom color then appears in the Custom palette.
7) Click OK to close the Area dialog and save the changes. The new custom color appears as a fill in the selected object and is available for use in other drawings or documents.
Creating custom colors using Pick a Color dialog
If a custom color for a drawing is only going to be used in that drawing, then use the Pick a Color dialog to create a custom color. A custom color using the following method is not available for other drawings or documents.
1) Select a filled object to create a color.
2) Open the Pick a Color dialog (Figure 97) using one of the following methods:
– Click on Pick on the Colors page of the Area dialog.
– Click on the triangle ▼ next to Fill Color on the Line and Filling toolbar.
Working with area fills | 83

– Click on the triangle ▼ next to Fill Color in the Area section of the Properties deck onthe Sidebar.
3) Create a custom color using one of the following methods.
– Enter the values for the custom color in the boxes for RGB, Hex, HSB or CMYK values.
– Click on the color range in the vertical color bar, then click and drag the small circle in the color box to select the color.
4) Click OK to close the Pick a Color dialog and save the changes. The new custom color appears as a fill in the selected object and is only available for use in the drawing being created.
Deleting custom colors
Only custom colors that are available in the custom palette can be deleted using the Area dialog. Colors that are available in the color palettes provided by LibreOffice cannot be deleted.
1) Select a filled object that uses the color fill for deletion.
2) Open the Area dialog using one of the following methods:
– Go to Format > Area on the Menu bar.
– Right-click on the object and select Area from the context menu.
– Click on More Options on the right of the Area section title on the Sidebar.
3) Click on Area, then click on Colors to open the Colors page.
4) In Colors, select Custom from the Palette drop-down list.
5) Select the color for deletion and click on the Delete button. There is no confirmation givenwhen deleting a color.
6) Click OK to save the changes and close the Area dialog.
Gradient fillsSeveral predefined gradients are included when LibreOffice is installed. It is recommended to create custom gradients that match the requirements rather than permanently modifying the installed predefined gradients. Predefined gradients may have been used in other objects in a drawing or other documents.
Custom gradients should be saved with a unique name allowing the custom gradient to be used in other drawings or documents. Custom gradients are placed at the end of the gradients displayed in the Gradient box on the Gradient page of the Area dialog (Figure 98).
Selecting and modifying gradient fills
The following procedure to select a gradient for an area fill uses the Area dialog. Using the tools on the Line and Filling Toolbar, and the Area section in the Properties deck on the Sidebar is a similar procedure, but the available options are reduced.
1) Make sure the object to be filled is selected in a drawing.
2) Open the Area page on the Area dialog, then click on Gradient .
3) Select the required gradient from the Gradient box. The selected gradient appears in Preview.
84 | Draw Guide 7.1

Figure 98: Area dialog - Gradient page
4) If necessary, change the values in the option boxes for Type, Increment, Center, Angle, Border, From Color and To Color to modify the gradient to the requirements. As changes are made, the gradient displayed in the Preview box also changes to indicate how it will look. For more information on gradient options, see “Table 3” below.
5) If necessary, when making changes to the Increment value of a selected gradient, deselect Automatic and enter an increment value in the text box.
6) If necessary and to revert back to the original gradient, click on Reset and any changes made are removed.
7) Click OK to close the Area dialog and save the changes. The gradient fill then appears in the selected object.
Note
Selecting and modifying a gradient using the above method only allows the gradient to be used in the drawing being created. If a modified gradient is to be used in other drawings or documents, then create a custom gradient and save it with a unique name. See “Creating and saving custom gradients” below.
Table 3: Gradient options
Gradient property Meaning
Linear gradient The color transitions from the starting color to the end color in a straight line.
Axial gradientThe color transitions from the starting color to the end color from the object center to the object edges in two opposite directions.
Working with area fills | 85

Gradient property Meaning
Radial gradientThe color transitions from the starting color to the end color in a circular pattern.
Ellipsoid gradientThe color transitions from the starting color to the end color in an elliptical pattern.
Quadratic gradientThe color transitions from the starting color to the end color from the object edges to the object center in four directions.
Square gradientThe color transitions from the starting color to the end color from the object edges to the object center in a square pattern.
IncrementEnter the number of steps for blending the two colors of the gradient. By default this is set to Automatic.
Center XFor Radial, Ellipsoid, Square and Rectangular gradients, modify these values to set the horizontal offset of the gradient center.
Center YFor Radial, Ellipsoid, Square and Rectangular gradients, modify these values to set the vertical offset of the gradient center.
Angle For all gradient types, modifies the angle of the gradient axis.
BorderIncrease this value to make the gradient start further away from the border of the shape.
From ColorThe start color for the gradient. In the edit box enter the intensity of the color: 0% corresponds to black, 100% to the full color.
To ColorThe end color for the gradient. In the edit box enter the intensity of the color: 0% corresponds to black, 100% to the full color.
Creating and saving custom gradients
To use a modified gradient in other drawings or documents, a custom gradient has to be saved with a unique name.
1) Make sure the object is selected in a drawing.
2) Open the Area page on the Area dialog, then click on Gradient to open the options available for a gradient fill.
3) Select a gradient and modify it using the options given in “Table 3” above. As changes are made, the gradient displayed in the Preview box also changes to give an indication of how the custom gradient will look.
4) Click on Add to open a Name dialog.
5) Enter a unique name for the new gradient, then click OK to close the Name dialog. The custom gradient is placed at the end of the gradient displayed in the Gradient preview boxand becomes available for use in other drawings and documents.
6) Click OK to close the Area dialog and save the changes.
Modifying custom gradients
Using the Modify option on the Gradient page in the Area dialog permanently changes a gradient and cannot be undone. It is recommended to only modify custom gradients and not the predefined gradients that were installed with LibreOffice.
1) Make sure the object is selected in a drawing.
2) Open the Area page on the Area dialog, then click on Gradient .
3) Select a custom gradient from the Gradient box. Custom gradients appear below the 15 predefined gradients in the Gradient box.
86 | Draw Guide 7.1

4) Make the necessary changes to the options given in “Table 3” above. As changes are made, the gradient displayed in the Preview box also changes to give an indication of how the custom gradient will look.
5) If necessary and to revert back to the original gradient, click on Reset and any changes made are removed.
6) Click on Modify to permanently change the selected custom gradient. There is no confirmation given when modifying a custom gradient.
7) Click OK to close the Area dialog and save the changes.
Deleting custom gradients
1) Select an object that uses a gradient fill.
2) Open the Area page on the Area dialog, then click on Gradient.
3) In the Gradient box, select the custom gradient for deletion.
4) Right click on the gradient and select Delete from the context menu. Click on Yes to confirm the deletion.
5) Click OK to save the changes and close the Area dialog.
Note
It is recommended to only delete or rename custom gradients that have been created. Deleting or renaming one of the predefined gradients that are installed with LibreOffice may cause problems in drawings and documents that use one of the gradients.
Advanced gradient controls
LibreOffice provides advanced controls for gradients on the Transformations toolbar (Figure 99).
1) Make sure the object is selected in a drawing.
2) Open the Area page on the Area dialog, then click on Gradient.
3) Go to View > Toolbars > Transformations on the Menu bar or click on the Transformations tool on the Line and Filling toolbar to open the Transformations toolbar.
Figure 99: Transformations toolbar
Working with area fills | 87

Figure 100: Interactive gradient tool selected
4) Click on Interactive gradient tool in the Transformations toolbar. This displays a dashed line connecting two colored squares (Figure 100). The colors show the From Color and To Color that are used for the selected gradient.
5) Select the type of gradient required for the object from the options in the Type drop-down list. Properties available for adjustment depend on the gradient type selected, as explained below. Moving the squares will have different effects depending on the type of gradient.
– Linear – move the square corresponding to the From Color to change where the gradient starts (border value). Move the square corresponding to the To Color to change the orientation (angle value).
– Axial – move the To Color to change both the angle and border properties of the gradient. Only the square corresponding to the To Color can be moved.
– Radial – move the From Color to modify the border property to set the width of the gradient circle. Move the To Color to change the point where the gradient ends (Center X and Center Y values).
– Ellipsoid – move the From Color to modify the border property to set the size of the gradient ellipsoid. Move the To Color to change the angle of the ellipsoid axis and the axis itself.
– Quadratic and Square – move the From Color to modify the border property to set the size of the gradient square or rectangle and the angle of the gradient shape. Movethe To Color to change the center of the gradient.
6) Click OK to save the changes and close the Area dialog.
Bitmap fillsSeveral predefined bitmaps are included when LibreOffice is installed on a computer. The content of the supplied bitmaps cannot be edited, but the display settings can be changed and other bitmaps can be imported from other sources. A GIF is an example of a graphics image file that has a bitmap.
Selecting bitmaps
The following procedure to select a bitmap for an area fill uses the Area dialog. Using the tools onthe Line and Filling Toolbar, and the Area section in the Properties deck on the Sidebar is a similar procedure, but the available options are reduced.
1) Make sure the object is selected in a drawing.
2) Open the Area page on the Area dialog, then click on Bitmap to open the options available for a bitmap fill (Figure 101).
3) Select the required bitmap from the Bitmap box. The selected bitmap appears in Preview.
88 | Draw Guide 7.1

Figure 101: Area dialog - Bitmap page
4) If necessary, change the values in the option boxes for Style, Size, Position, Tiling Position, and Tiling Offset to modify the bitmap to the requirements. For more information on bitmap options, see “Table 4” below.
5) If necessary and to revert back to the original bitmap, click on Reset and any changes made are removed.
6) Click OK to close the Area dialog and save the changes. The bitmap fill then appears in the selected object.
Table 4: Bitmap options
Bitmap option Meaning
Style – Custom position/size
When this option is selected, the position of the bitmap in the object and the size of the bitmap can be specified.
Style – TiledWhen this option is selected, the bitmap is tiled to fill the area. The size of the bitmap used for the tiling is determined by the Size settings
Style – Stretched When this option is selected, a bitmap is stretched to fill the object area.
Size – WidthSets the width of the bitmap. For example, 100% means that the bitmap is resized to occupy the whole fill area width, 50% means that the width of thebitmap is half that of the fill area.
Size – HeightSets the height of the bitmap. For example, 100% means that the bitmap isresized to occupy the whole fill area height, 50% means that the height of the bitmap is half that of the fill area.
Size – ScaleWhen selected, bitmap size is given as a percentage for Width and Height. When deselected, the actual size of the bitmap is given for Width and Height.
Working with area fills | 89

Bitmap option Meaning
Position Specifies the anchoring point of the bitmap.
Tiling Position – X-OffsetSets the offset for the width of the bitmap in percentage values. 50% offset means that Draw will place the middle part of the bitmap width at the anchor point and start tiling from there.
Tiling Position – Y-OffsetSets the offset for the height of the bitmap in percentage values. 50% offset means that Draw will place the middle part of the bitmap height at theanchor point and start tiling from there.
Tiling OffsetOffsets the columns of tiled bitmaps by the percentage entered in the box so that two subsequent columns of bitmaps are not aligned.
Figure 102: Examples of bitmap fills
Editing bitmaps
1) Make sure the object containing a bitmap fill is selected in a drawing.
2) Open the Area page on the Area dialog, then click on Bitmap.
3) Select a bitmap from the Bitmap box. The selected bitmap appears in Preview.
4) Change the values in the option boxes for Style, Size, Position, Tiling Position, and Tiling Offset to the requirements. For more information on bitmap options, see “Table 4” above. Examples of bitmap fills and the properties used are shown in Figure 102.
5) If necessary and to revert back to the original bitmap, click on Reset and any changes made are removed.
6) Click OK to save the changes and close the Area dialog.
Note
Supplied bitmaps cannot be edited, but the display settings for placement and tiling can be changed.
Adding or importing bitmaps
1) Make sure the object is selected in a drawing.
2) Open the Area page on the Area dialog, then click on Bitmap.
3) Click on Add/Import and a file browser window opens.
4) Navigate to the directory containing the bitmap file, then select the file and click Open.
90 | Draw Guide 7.1

5) Enter a unique name for the new bitmap in the Name dialog.
6) Click OK to close the Name dialog. The imported bitmap is added at the end of the bitmaps in the Bitmap box.
7) Click OK to save the changes and close the Area dialog. The imported bitmap fill appearsin the selected object.
Note
Bitmap images can be imported and used as area fills.
Deleting bitmaps
1) Make sure the object containing a bitmap fill is selected in a drawing.
2) Open the Area page on the Area dialog, then click on Bitmap.
3) Right click on the bitmap being deleted and select Delete from the context menu. Click onYes to confirm the deletion.
4) Click OK to save the changes and close the Area dialog.
Note
It is recommended to only delete or rename bitmaps that have been added or imported. Deleting or renaming one of the bitmaps installed with LibreOffice may cause problems in drawings and documents that use one of the bitmaps.
Pattern fillsSeveral predefined pattern fills are included when LibreOffice is installed on a computer. Custom patterns can also be created and modified in LibreOffice.
Selecting pattern fills
The following procedure to select a pattern for an area fill uses the Area dialog. Using the tools on the Line and Filling Toolbar, and the Area section in the Properties deck on the Sidebar is a similar procedure, but the available options are reduced.
1) Make sure the object is selected in a drawing.
2) Open the Area page on the Area dialog, then click on Pattern to open the options available for a pattern fill (Figure 103).
3) Select the required pattern from the Pattern box and the selected pattern appears in Preview.
4) If necessary, change the foreground and background colors, or the pattern itself, as described in “Creating custom and saving patterns” below. As changes are made, the pattern displayed in the Preview box also changes to indicate how it will look. Any changes will affect only the object being filled.
5) If necessary and to revert back to the original pattern, click on Reset and any changes made are removed.
6) Click OK to close the Area dialog and save the changes. The pattern fill then appears in the selected object.
Working with area fills | 91

Figure 103: Area dialog - Pattern page
Creating custom and saving patterns
1) Make sure the object is selected in a drawing.
2) Open the Area page on the Area dialog, then click on Pattern.
3) Select the required pattern in Pattern to use as a starting point and the selected pattern appears in Preview.
4) Optionally, select different colors for Foreground Color and Background Color. The pattern remains the same, but the colors change.
5) Optionally, in Pattern Editor, click on individual squares to change the color from Foreground Color to Background Color, or from Background Color to Foreground Color tocreate a new pattern.
6) Click on Add to open a Name dialog.
7) Enter a unique name for the new pattern, then click OK to close the Name dialog. The custom pattern is placed at the end of the patterns displayed in the Pattern box and becomes available for use in other drawings and documents.
8) If necessary and to revert back to the original pattern, click on Reset and any changes made are removed.
9) Click OK to close the Area dialog and save the changes.
92 | Draw Guide 7.1
Note
To use a modified pattern in other drawings or documents, the custom pattern has to be saved with a unique name.
Modifying custom patterns
Using the Modify option on the Pattern page in the Area dialog permanently changes a pattern and cannot be undone. It is recommended to only modify custom patterns and not the predefinedpatterns that were installed with LibreOffice.
1) Make sure the object is selected in a drawing.
2) Open the Area page on the Area dialog, then click on Pattern.
3) Select a custom pattern from the Pattern box and the selected pattern appears in Preview. Custom patterns are located below the predefined patterns in the Pattern box.
4) In Pattern Editor, click on each square to change the color from Foreground Color to Background Color, or from Background Color to Foreground Color to modify the selected pattern.
5) If necessary and to revert back to the original pattern, click on Reset and any changes made are removed.
6) Click on Modify to permanently change the selected custom pattern. There is no confirmation given when modifying a custom pattern.
7) Click OK to close the Area dialog and save the changes.
Deleting custom patterns
1) Select an object that uses a custom pattern as an area fill.
2) Open the Area page on the Area dialog, then click on Pattern.
3) In the Pattern box, select the custom pattern for deletion.
4) Right click on the pattern and select Delete from the context menu. Click on Yes to confirm the deletion.
5) Click OK to save the changes and close the Area dialog.
Note
It is recommended to only delete or rename custom patterns that have been created.Deleting or renaming one of the predefined patterns that are installed with LibreOfficemay cause problems in drawings and documents that use one of the gradients.
Hatching fillsHatchings fills are similar to pattern fills, but use lines instead of squares. Several predefined hatching fills are included when LibreOffice is installed on a computer. Custom hatching fills can also be created and modified.
Selecting hatching fills
The following procedure to select a hatching for an area fill uses the Area dialog. Using the tools on the Line and Filling Toolbar, and the Area section in the Properties deck on the Sidebar is a similar procedure, but the available options are reduced.
1) Make sure the object is selected in a drawing.
Working with area fills | 93

Figure 104: Area dialog - Hatch page
2) Open the Area page on the Area dialog, then click on Hatch to open the options availablefor a hatching fill (Figure 104).
3) Select the required hatching from the Hatch box and the selected hatching appears in Preview.
4) If necessary, change the colors or other options, as described in “Creating and saving custom hatching” below. As changes are made, the hatching displayed in the Preview boxalso changes.
5) If necessary and to revert back to the original hatching, click on Reset and any changes made are removed.
6) Click OK to close the Area dialog and save the changes. The hatching fill then appears in the selected object.
Creating and saving custom hatching
1) Make sure the object is selected in a drawing.
2) Open the Area page on the Area dialog, then click on Hatch.
3) Select the required hatching in Hatch as a starting point and the selected hatching appears in Preview.
4) Change the values in the option boxes for Spacing, Angle, Line type, Line color, and Background color to edit the hatching to the requirements. For more information on hatching options, see “Table 5” below.
5) Click on Add to open a Name dialog.
94 | Draw Guide 7.1

6) Enter a unique name for the new hatching, then click OK to close the Name dialog. The custom hatching is placed at the end of the hatchings displayed in the Hatch box and becomes available for use in other drawings and documents.
7) Click OK to close the Area dialog and save the changes.
Table 5: Hatching options
Hatching option Meaning
SpacingDetermines the spacing between two lines of the hatching fill. As the value is changed, the preview window is updated.
AngleUse the mini map below the numerical value to quickly set the angle formed by the line to multiples of 45 degrees. If the required angle is not a multiple of 45 degrees, enter the desired value in the edit box.
Line type Set single, double, or triple line for the style of the hatching.
Line color Use the list to select the color of the lines that will form the hatching.
Background color When selected, adds a color fill behind the lines used for the hatching.
Modifying custom hatchings
Using the Modify option on the Hatch page in the Area dialog permanently changes a hatching and cannot be undone. It is recommended to only modify custom hatchings and not the predefined hatchings that were installed with LibreOffice.
1) Make sure the object is selected in a drawing.
2) Open the Area page on the Area dialog, then click on Hatch.
3) Select a custom hatching from the Hatch box and the selected hatching appears in Preview. Custom hatchings are located below the predefined hatchings in the Hatch box.
4) Change the values in the option boxes for Spacing, Angle, Line type, Line color, and Background color to edit the hatching. For more information on hatching options, see “Table 5” above.
5) If necessary and to revert back to the original hatching, click on Reset and any changes made are removed.
6) Click on Modify to permanently change the selected custom hatching. There is no confirmation given when modifying a custom hatching.
7) Click OK to close the Area dialog and save the changes.
Deleting custom hatching
1) Select an object that uses the hatching fill for deletion.
2) Open the Area page on the Area dialog, then click on Hatch.
3) In the Hatch box, select the custom hatching for deletion.
4) Right-click on the hatching and select Delete from the context menu. Click on Yes to confirm the deletion.
5) Click OK to save the changes and close the Area dialog.
Note
It is recommended to only delete or rename custom hatchings that have been created. Deleting or renaming one of the predefined hatchings that are installed with LibreOffice may cause problems in drawings and documents that use one of the gradients.
Working with area fills | 95

Figure 105: Area dialog - Shadow page
Shadows
Default shadowsTo quickly apply a shadow to an object, select the object and click on Shadow in the Line and Filling toolbar. The shadow applied to an object using this method is set to the default settings in LibreOffice.
Note
To have more control when applying shadows to an object, use the Shadow page in Area or Line dialogs. The following describes the use of the Shadow page in the Area dialog (Figure 105), but can also be applied to the Shadow page in the Line dialog.
Formatting shadowsFor a more control when adding shadows to an object, use the Shadow page on the Area dialog (Figure 105) as follows:
1) Make sure the object is selected in a drawing.
2) Open the Area dialog, then click on Shadow to the open the Shadow page.
3) Select Use shadow for the shadow options to become active.
4) Select an anchor point for the direction of the shadow cast in relation to the object.
5) In Color, select the color palette and the color required for the shadow.
6) In Distance, enter a distance to set spacing between the object and the shadow.
7) In Blur, enter a value to soften the edges of the shadow.
8) In Transparency, enter a percentage for the shadow transparency.
9) Click OK to close the Area dialog and save the changes.
96 | Draw Guide 7.1

Transparencies
Transparencies can be applied to area fills as well as shadows and lines.
• To use transparencies on lines, refer to “Formatting lines” on page 69 for more information.
• To use transparencies on shadows, refer to “Shadows” above for more information.
To apply a transparency to an object area fill using the Area dialog (Figure 106) is as follows:
1) Make sure the object is selected in a drawing.
2) Open the Area dialog, then click on Transparency to the open the Transparency page and access the available options.
3) To create a uniform transparency, select Transparency and enter a percentage in the text box.
4) To create a gradient transparency so that the area becomes gradually transparent, select Gradient and select the type of gradient transparency from the drop-down list: Linear, Axial, Radial, Ellipsoid, Quadratic or Square. See “Table 3” on page 85 for more information on gradient types.
5) Set the parameters for the type of the gradient transparency selected above. Refer to “Table 6” below for a description of the properties. The parameters available depends on the type of gradient transparency selected above.
6) Click OK to close the Area dialog and save the changes.
Figure 106: Area dialog - Transparency page
Table 6: Transparency parameters
Transparency parameters Meaning
Centre XFor Radial, Ellipsoid, Quadratic and Square gradients. The values to set the horizontal offset of the gradient center.
Center YFor Radial, Ellipsoid, Quadratic and Square gradients. The values to set the vertical offset of the gradient center.
Transparencies | 97

Transparency parameters Meaning
AngleFor Linear, Axial, Ellipsoid, Quadratic and Square gradients. Specifies the angle of the gradient axis.
BorderIncrease this value to make the gradient start further away from the border of the object.
Start valueValue for the starting transparency gradient. 0% is fully opaque, 100% means fully transparent.
End valueValue for the ending transparency gradient. 0% is fully opaque, 100% means fully transparent.
Drawing styles
Suppose that the same area fill, line thickness, and border is to be applied to a set of objects. This repetitive process can be greatly simplified by the use of styles. Styles allow a format to be defined and then applied to multiple objects. For more information on styles, see the Writer Guide.
Note
The drawing styles included with LibreOffice Draw cannot be deleted or renamed. However, all drawing styles can be modified to the drawing requirements. Also, drawing styles can be hidden when not required, except for any drawing styles that have been used in a drawing.
Style categories
• All Styles – displays all the drawing styles available for use in Draw.
• Applied Styles – displays the drawing styles that have been used in the selected drawing.
• Hierarchical Styles – displays the drawing styles in a hierarchical list (also known as a linked or parent/child styles). To view the styles in a sub-level, click on the triangle ► nextto the style name to list the styles available in the sub-level, as shown in Figure 107.
• Custom Styles – displays all the user created drawing styles that are available for use inDraw.
• Hidden Styles – displays all the drawing styles that a user has hidden when not requiredfor use in Draw.
Note
Hierarchical styles are used with multiple objects differ, for example, in color, but are otherwise identically formatted. Create a parent style for the objects including borders, area fill, font, and so on. Then create a hierarchical or child styles, which differ only in the fill color attribute. If the font size or the thickness of a border needs to be changed, it is sufficient to change the parent style and all the child styles are changed accordingly.
Tip
At the bottom of the Styles deck on the Sidebar there is a drop-down list allowing selection of the style category. The style categories available are Hierarchical, All Styles, Hidden Styles, Applied Styles, and Custom Styles.
98 | Draw Guide 7.1

Figure 107: Styles deck in Sidebar
Selecting stylesStyles can only be selected and applied to objects using the Styles deck on the Sidebar (Figure 107).
1) Select the object for style application.
Note
When an object is placed into a drawing, the Default Drawing Style is automatically applied.
2) Open the Styles deck on the Sidebar using one of the following methods:
– Go to View > Sidebar on the Menu bar, then click on Styles at the right side of the Sidebar.
– Click on the Show the Styles Sidebar icon on the Line and Filling toolbar.
– Go to View > Styles on the Menu bar.
– Use the keyboard shortcut F11.
3) Select a style category from the drop-down list at the bottom of the Styles deck.
4) In the Styles deck, double-click on the style required for the selected object.
5) If necessary, create a new (custom) style or modify the selected style to the requirements,as described below.
Drawing styles | 99

Figure 108: Graphic Styles dialog - Organizer page
Note
It is recommended to create new (custom) styles rather than modify the drawing styles installed with LibreOffice. Modifying drawing styles installed with LibreOffice may cause problems if the style has been used in other drawings.
Creating new or custom stylesAfter creating a new or custom style, it is placed in All Styles and Custom Styles categories in the Styles deck of the Sidebar. When the custom style is applied to an object, the custom style also appears in Applied Styles.
Using Styles deck
1) Open the Styles deck on the Sidebar.
2) Right click on the style required as a starting point to create a custom style and select New from the context menu to open the Graphic Styles dialog (Figure 108).
3) Click on the Organizer tab to open the Organizer page in the Graphic Styles dialog.
4) In the Name text box, enter a unique style name.
5) If the new style is to inherit settings from an existing style, select a style from the Inherit from: drop-down list.
6) Use the options on the various pages of the Graphic Styles dialog to format and categorize a new style.
– Organizer – contains a summary of the style and its hierarchical position.
– Font, Font Effects, Indents & Spacing, Alignment, and Tabs – sets the attributes of the text inserted into a text box or graphic object.
– Dimensioning – sets the style of dimension lines when used on an object.
– Text, Text Animation, Connector, Line, Area, Shadowing, Highlighting and Transparency – sets the attributes for the object format..
7) Click OK when finished to save the new style and close the Graphic Styles dialog.
100 | Draw Guide 7.1

Using New Style from Selection
Using New Style from Selection allows all formatting to be made to an object first and then create a drawing style from that object.
1) Select the object to create a new style from, or create a new object in a drawing.
2) Format the object using the tools and options from the following dialogs and toolbars:
– Graphic Styles dialog.
– Area dialog.
– Line dialog
– Properties deck on the Sidebar.
– Line and Filling toolbar.
3) Create the new style using one of the following methods:
– Open the Styles deck on the Sidebar and click on New Style from Selection at the top right of the deck.
– Go to Format > Styles > New Style from Selection on the Menu bar.
4) In the Create Style dialog that opens, type a unique name for the new style. This dialog also shows existing custom styles.
5) Click OK to save the new style and close the Create Style dialog.
Modifying stylesIt is recommended to only modify styles that have been created. Modifying styles that are installed with LibreOffice may cause problems in other documents that use one of these styles.
1) Select an object in a drawing.
2) Open the Graphic Styles dialog using one of the following methods:
– Go to Format > Styles > Edit Style on the Menu bar.
– Right-click on the object and select Edit Style from the context menu.
– Right-click on the object style that is highlighted in the Styles deck on the Sidebar and select Modify from the context menu.
3) Use the options on the pages of the Graphic Styles dialog to modify the object style.
4) Click OK to save the changes and close the Graphic Styles dialog.
Editing hierarchical or parent stylesIf an object in a drawing uses a style that is linked to a hierarchical or parent style, then it is possible to edit the hierarchical or parent style.
1) Select an object in a drawing that uses a linked style.
2) Open the Graphic Styles dialog and click on Organizer to open the Organizer page in the Graphic Styles dialog.
3) Check that the style name in the Inherit from text box is the hierarchical or parent style forediting, use the various options on the pages in the Graphic Styles dialog to edit the style.
4) If the hierarchical or parent style is NOT the one required:
a) Click on Edit Style to the right of the Inherit from text box until the name of the style is displayed.
b) Use the various options on the pages in the Graphic Styles dialog to edit the style.
5) Click OK to save the changes and close the Graphic Styles dialog.
Drawing styles | 101

Note
It is recommended to create custom hierarchical styles rather than modify the existing hierarchical styles available in LibreOffice. Modifying hierarchical styles installed with LibreOffice may cause problems if the style has been used in other drawings.
Updating stylesUsing Update Style allows all the formatting to an object to be made first and then update the drawing style used by the object.
1) Select the object to modify the drawing style the object uses.
2) Format the object using the various tools and options from the following dialogs and toolbars:
– Graphic Styles dialog.
– Area dialog.
– Line dialog
– Properties deck on the Sidebar.
– Line and Filling toolbar.
3) Update the drawing style using one of the following methods. There is no confirmation when updating a drawing style.
– Open the Styles deck on the Sidebar and click on Update Style at the top right.
– Go to Format > Styles > Update Selected Style on the Menu bar
Note
Make sure to only update custom styles that have been created. Updating styles thatare part of the default installation of LibreOffice could cause problems in other documents that use LibreOffice drawing styles.
Applying stylesDrawing styles are applied to an object using the Styles deck on the Sidebar as follows:
1) Select the object to apply a drawing style.
2) Click on Styles on the Line and Filling toolbar, or click on Styles on the Sidebar.
3) Double click on the style name to apply the drawing style to the selected object.
Deleting stylesPredefined styles in LibreOffice cannot be deleted, even if they are not being used. Only user-defined (custom) styles can be deleted. However, before deleting a custom style, it is recommended to make sure the drawing style is not in use by checking the list of drawing styles in the Applied Styles category.
1) To open a list of styles, use one of the following methods:
– Click on Styles on the Line and Filling toolbar.
– Click on Styles on the Sidebar.
2) Select Applied Styles from the drop-down list at the bottom of the Styles deck on the Sidebar.
3) Right click on the style name in the styles list and select Delete from the context menu.
102 | Draw Guide 7.1

4) If the style is used on an object, a warning message will appear stating that the selected object will revert back to the default drawing style. Select Yes to confirm deletion of the style.
5) If the style is not in use, select Yes to confirm deletion of the style and there is no confirmation message.
Special effects
As well as the basic actions of moving and resizing an object, a number of special effects can also be applied to objects in Draw. Several of these effects are readily available in the Transformations toolbar. If the Transformations toolbar (Figure 99 on page 87) is not showing, select it from View > Toolbars > Transformations on the Menu bar.
The tools on the Transformations toolbar are described in the following sections with the exception of the In 3-D Rotation Object tool, which is described in Chapter 7, Working with 3D Objects.
Rotating objectsRotation of an object can be carried out manually or using a dedicated dialog. This is similar to changing the position or size of an object.
Manual rotation
1) Select the object for rotation so that the selection handles are displayed.
2) Use one of the following methods to switch the selected object into rotation mode,. The selection handles change shape and color when in rotation mode (Figure 109).
– Click again on the selected object.
– Click on the triangle ▼ to the right of Transformations on the Line and Filling and select Rotate from the context menu.
– If the Transformations toolbar is displayed, click on Rotate.
3) Move the cursor over one of the corner handles and the cursor changes shape.
4) Click and drag the object in the rotation direction. Only the corner selection handles are active for rotation.
5) To restrict the rotation angles to multiples of 15 degrees, press and hold the Shift key while rotating the object. This is very handy for rotating objects through 90 deg, for example from portrait to landscape.
6) When satisfied with the rotation, release the mouse button.
Figure 109: Manually rotating objects
Special effects | 103

7) By default, the rotation pivot point is a small circle in the center of the selected object. To change the center of object rotation, click and drag the rotation pivot point to a new position. This position for the rotation pivot point can be outside of the selected object.
Sidebar rotation
1) Select the object for rotation so that the selection handles are displayed.
2) Open the Position and Size section in the Properties deck on the Sidebar (Figure 110).
3) Rotate the object using one of the following options:
– Click on and drag the rotation indicator in Rotation.
– Enter a rotation angle in the Rotation text box.
4) When satisfied, click outside the object to deselect the object and deselect rotation mode.
Figure 110: Position and Size section in Properties deck on Sidebar
104 | Draw Guide 7.1

Figure 111: Position and Size dialog - Rotation page
Position and Size dialog
1) Select the object for rotation so that the selection handles are displayed.
2) Open the Position and Size dialog (Figure 111) using one of the following methods:
– Use the keyboard shortcut F4.
– Select Format > Position and Size on the Menu bar.
– Right-click on the object and select Position and Size from the context menu.
3) Click Rotation to open the Rotation page.
4) Rotate the object using one of the following methods:
– In the Angle text box, enter the degrees of rotation required.
– Click on and drag the rotation indicator in Default settings.
5) Click OK to save the changes and close the Position and Size dialog.
Flipping objects
Quick flipping
1) Select the object for flipping so that the selection handles are displayed.
2) Use one of the following methods to flip the object vertically or horizontally:
Special effects | 105

– Right click on the object and select Flip > Horizontally or Flip > Vertically from the context menu.
– In the Position and Size section of the Properties deck on the Sidebar, click on Flip Vertically or Flip Horizontally.
– In the Line and Filling toolbar, click on Vertically or Horizontally.
– Go to Shape > Flip > Vertically or Horizontally on the Menu bar.
Flip tool
Using the Flip tool on the Transformations toolbar, the position and angle that the object flips overcan be changed, as shown in Figure 112.
1) Select the object for flipping so that the selection handles are displayed.
2) Click on the Flip tool on the Transformations toolbar and the symmetry axis appears as a dashed line through the middle of the object. The object will be flipped about this symmetry axis.
3) Click and drag one or both ends of the symmetry axis to set the orientation of the axis.
4) Place the cursor over one of the object selection handles until it changes shape.
5) Click and drag the object across to the other side of the symmetry axis until the object appears flipped over. The angle and position of the flip depends on the angle and positionof the symmetry axis.
6) Release the mouse button and the object is flipped.
Note
Pressing and holding the Shift key while moving the symmetry axis allows rotation in 45 degree increments.
Figure 112: Example of using Flip tool
106 | Draw Guide 7.1

Mirror copiesAt the moment there is no mirror command existing in Draw. However, mirroring an object can beemulated by copying and flipping the object as follows:
1) Select the object to make a mirror copy of and copy the object to the clipboard.
2) Flip the object using the procedures in “Flipping objects” above.
3) Click in an empty area on the drawing to deselect the object.
4) Paste the copy of the original object back into its original location, creating a mirror copy.
5) If necessary, select both objects and align them using one of the following methods:
– Go to Shape > Align on the Menu bar and use one of the alignment options.
– Right-click the selected objects and select Align from the context menu, then select one of the alignment options.
Distorting imagesThree tools on the Transformations toolbar allow dragging on the corners and edges of an object to distort the image.
Before distorting an object, the object must be converted to a circle. Clicking on and dragging one of the object handles produces the desired effect. Examples of distortion are shown in the following figures.
Note
Transforming an object into a curve is a safe operation, but cannot be reversed otherthan by clicking Format > Undo on the Menu bar.
Set in circle (perspective)
Select an object and click on Set in Circle (perspective) in the Transformations toolbar. After converting to a curve, click and drag one of the selection handles (Figure 113).
Figure 113: Example of using Set in Circle (perspective) tool
Set to circle (slant)
Select an object and click on Set to Circle (slant) in the Transformations toolbar. After converting to a curve, click and drag one of the selection handles (Figure 114).
Special effects | 107

Figure 114: Example of using Set in Circle (slant) tool
Figure 115: Example of distortion using corner selection handle
Figure 116: Example of distortion using vertical selection handle
Figure 117: Example of distortion using horizontal selection handle
108 | Draw Guide 7.1

Distort
Select an object and click on Distort on the Transformations toolbar. After converting to a curve, click and drag a selection handle to stretch the object. The corner handles distort the corners of the object (Figure 115), the vertical midpoint handles distort the object horizontally (Figure 116) and the horizontal midpoint handles distort the object vertically (Figure 117).
Dynamic gradientsTransparency gradients are controlled in the same manner as color gradients and both types of gradient can be used together. With a transparency gradient, the direction and degree of object fill color changes from opaque to transparent. In a color gradient, the fill changes from one color to another, but the degree of transparency remains the same.
Figure 118: Example of dynamic gradient
Two icons on the Transformations toolbar dynamically control transparency and color gradients. Even if an object with a color fill is not assigned transparency, the transparency can be controlledby clicking on Interactive transparency tool. This defines a transparency gradient and a dashedline connecting two squares appears on the object. Move the two squares to modify the gradient.Define the direction of the gradient (vertical, horizontal, or at any angle) and the spot at which thetransparency begins.
A regular color gradient is defined in the same manner. Select an object, then select a gradient area fill (see “Gradient fills” on page 84 for more information). The Interactive gradient tool is now active on the Transformations toolbar. When clicking on Interactive gradient tool, a dashedline connecting two squares appears on the object, just as it does for a transparency gradient.
In both transparency gradient and gradient fill, click outside the object to set the gradient.
In the example shown in Figure 118 there is a single color object and a transparency gradient, covering part of the underlying object. This gradient transparency can be dynamically adjusted. Direction of transparency is changed by moving the white square and the distance over which it is applied by moving the green square.
Note
Moving the squares has different effects, depending on the type of gradient. For example, for a linear gradient, the start and end squares of the gradient will always be situated to either side of the center point of the object.
Special effects | 109

Draw Guide
Chapter 5, Combining Multiple Objects

Grouping objects
Grouping of objects is similar to putting objects into a container. Objects can be moved as a group and global changes applied to the objects within the group. A group can always be undone and the objects that make up the group can always be manipulated separately.
Temporary groupingA temporary grouping is when several objects are selected. Any changes to object parameters are applied to all of the objects within the temporary group. For example, a temporary group of objects can be rotated in its entirety.
A temporary group is created using one of the following methods:
• Click and drag the cursor over several objects surrounding the objects with a selection rectangle (this selection rectangle is also known as a marquee). Release the mouse button when all the objects required for a temporary group are selected.
• Click the first object, then hold down the Shift key and click on the remaining objects for the temporary group.
To cancel a temporary group of objects, simply click outside of the selection handles displayed around the objects.
GroupingWhen objects are grouped, any editing operations carried out on the group are applied to all objects within the group. Click on one object in a group, and the whole group is selected.
The objects within a group retain their own individual properties and can be edited independently.See “Editing individual group objects” on page 112 for more information.
1) Select the objects for a group using one of the following methods. Selection handles appear around all the objects selected for the group (Figure 119).
– Click on each object in turn while holding down the Shift key.
– Make sure Select on the Drawing toolbar is selected and draw a selection rectangle around the objects required for the group using the cursor.
2) Create the group of selected objects using one of the following methods:
– Right-click on the group and select Group from the context menu.
– Go to Shape > Group > Group on the Menu bar.
– Use the keyboard shortcut Ctrl+Shift+G.
Figure 119: Grouping objects
Grouping objects | 111

Ungrouping1) Select the group of objects and selection handles appear around the objects within the
group (Figure 119).
2) Ungroup the group of objects using one of the following methods:
– Right-click on the group and select Ungroup from the context menu.
– Go to Shape > Group > Ungroup on the Menu bar.
– Use the keyboard shortcut Ctrl+Alt+Shift+G.
Editing individual group objectsAn object within a group can be edited individually without ungrouping the objects.
1) Select a group, then enter the group using one of the following methods. After entering a group, objects outside the group cannot be selected for editing.
– Right-click on the group and select Enter Group from the context menu.
– Go to Shape > Group > Enter Group on the Menu bar.
– Use the keyboard shortcut F3.
– Double-click on the selected group.
2) Once inside the group, click on any object to select and individually edit it (Figure 120).
3) After making changes to an individual object, exit the group using one of the following methods:
– Right-click on the group and select Exit Group from the context menu.
– Go to Shape > Group > Exit Group on the Menu bar
– Use the keyboard combination Ctrl+F3.
– Double-click outside the group.
Figure 120: Editing objects within a group
Nesting groupsA group of groups can be created and this is commonly known as nesting groups. When nested groups are created, Draw retains the individual group hierarchy and remembers the order in which groups were selected. That is, the last individual group selected will be on top of all the other groups within a nested group. Ungrouping and entering a nested group works in exactly thesame way as for individual groups.
112 | Draw Guide 7.1

Combining objects
Combining objects is a permanent merging of objects creating a new object. The original objects are no longer available as individual objects and cannot be edited as individual objects. Any editing of a combined object affects all the objects that were used when combination was carried out.
Combining1) Select several objects for combining.
2) Combine the selected objects into a single object using one of the following methods:
– Right-click on the selection and select Shapes > Combine from the context menu.
– Go to Shape > Combine on the Menu bar.
– Use the keyboard combination Ctrl+Shift+K.
At first glance, the results can seem rather surprising, but the following points explain how combining objects works.
• The attributes (for example, area fill) of the resulting object are those of the object furthest back. In Figure 121, it is the ellipse and Figure 122 it is the yellow rectangle.
• Where the objects overlap, the overlapping zone is either filled or empty depending on whether the overlap is even numbered or odd numbered. Figure 122 shows that where the overlap number is even, an empty space is created and where the overlap number is odd, a filled area is created.
Figure 121: Combining objects
Tip
Objects can be reordered so they are further back or further forward in the arrangement order. Right-click on the object and select Arrangement from the context menu and select one of the options available. For more information, see “Arranging objects” on page 120.
Combining objects | 113

Figure 122: Example of area fill when combining overlapping objects
Figure 123: Example of splitting a combined object
Splitting combined objectsAn object which has been combined from several objects can be split into individual objects. However, the original objects retain the formatting of the combined object and do not revert back to their original formatting.
Select the combined object and use one of the following methods to split the combined object:
• Go to Shape > Split on the Menu bar.
• Use the keyboard shortcut Ctrl+Alt+Shift+K.
In Figure 123, the left graphic is the original example of overlapping area fills before combining. The right graphic is the result of splitting the combined object. The individual overlapping objects have taken the formatting of the object at the back of the overlapping objects.
Breaking combined objectsWhen an object is combined from several objects, the combined object can be broken into its constituent parts by going to Shape > Break on the Menu bar. This means that the original objects are broken into their constituent parts; for example, a rectangle is broken into four separate lines and the area is lost, as shown by the right graphic in Figure 124.
114 | Draw Guide 7.1

Figure 124: Example of breaking a combined object
Connecting linesThe constituent parts of an object can be connected together by selecting all the constituent parts of the object and going to Shape > Connect on the Menu bar. This connects the parts together and closes the object, resulting in the area becoming filled with the area fill it had before the object was broken.
Merging, subtracting, or intersecting objects
After selecting more than one object, the merge, subtract, and intersect functions become available. This allows creation of a new object with a new shape.
MergeWhen merging objects, a new object is created with a shape that follows the shape of the merged objects. The area fill of the merged object is determined by the area fill of the object that is at the rear of all the other objects, as shown in Figure 125.
After selecting several objects, use one of the following methods to merge the objects:
• Go to Shape > Merge on the Menu bar.
• Right-click on the selected objects and select Shapes > Merge from the context menu.
Figure 125: Merging objects
SubtractWhen subtracting objects, the objects at the front are subtracted from the object behind. This leaves a blank space that the subtracted objects occupied creating a new shape, as shown in Figure 126. After selecting several objects that overlap each other, use one of the following methods to subtract objects:
• Go to Shape > Subtract on the Menu bar.
• Right-click on the selected objects and select Shapes > Subtract from the context menu.
Merging, subtracting, or intersecting objects | 115

Figure 126: Subtracting objects
IntersectWhen intersecting objects, the front objects and the exposed area of the object at the rear are removed. This creates a new object from the area of the object at the rear that was covered by the objects at the front, as shown in Figure 127.
After selecting several objects that overlap each other, use one of the following methods to intersect objects:
• Go to Shape > Intersect on the Menu bar.
• Right-click on the selected objects and select Shapes > Intersect from the context menu.
Figure 127: Intersecting objects
Practical exampleThe following example shows how to use the merge, subtract, and intersect functions to create a knife with a wooden handle.
Draw an ellipse and then a rectangle overlapping half of its width.
Select both shapes, right-click, and select Shapes> Subtract from the context menu.
Draw another rectangle and put it over the top half of the ellipse.
116 | Draw Guide 7.1

Select both shapes, right-click, and select Shapes> Subtract from the context menu.
Draw a small ellipse covering just the lower right corner.
Select both shapes, right-click, and select Shapes> Subtract from the context menu. The knife blade shape is now complete.
To make the handle, draw a rectangle and an ellipse.
Merge the shapes together.
Position the handle on the blade. Select the handle and blade, then group together to create adrawing of the knife.
Duplication and cross-fading
DuplicationDuplication makes copies of an object while applying a set of changes (such as color or rotation) to the duplicates.
1) Select an object or group of objects, then use one of the following methods to open the Duplicate dialog (Figure 128):
– Go to Edit > Duplicate on the Menu bar.
– Go to Shape > Duplicate on the Menu bar.
– Use the keyboard shortcut Shift+F3.
2) Select the number of copies, placement, enlargement, and the start and end colors for duplicate copies.
3) Click OK and duplicate copies are created. An example of a duplication is shown in Figure 129. Each duplicate object is a separate object.
4) To group the duplicate objects into one group, see “Grouping objects” on page 111.
5) To combine the duplicate objects into one object, see “Combining objects” on page 113.
The following options are available when using the Duplicate dialog:
• Number of copies – enter the number of copies required.
• Placement – sets the position and rotation of duplicated objects in relation to the original object.
– X axis-- enter the horizontal distance between the centers of the selected object and the duplicate objects. Positive values shift the duplicate object to the right and negative values shift the duplicate object to the left.
– Y axis – enter the vertical distance between the centers of the selected object and theduplicate objects. Positive values shift the duplicate object down and negative values shift the duplicate object up.
– Angle – enter the angle (0 to 359 degrees) required for rotating the duplicate object. Positive values rotate the duplicate objects in a clockwise direction and negative values in a counterclockwise direction.
Duplication and cross-fading | 117

Figure 128: Duplicate dialog
Figure 129: Duplication example
• Enlargement – sets the size of the duplicate objects.
– Width – enter the amount to enlarge or reduce the width of the duplicate objects.
– Height – enter the amount to enlarge or reduce the height of the duplicate objects.
118 | Draw Guide 7.1

• Colors – sets the colors for the selected object and the duplicate objects. For more than one copy, these colors define the start and end points of a color gradient.
– Start – select a color for the selected object.
– End – select a color for the duplicate object. If making more than one copy, this color is applied to the last copy.
Cross-fadingCross-fading transforms one object shape into another object shape. The result is a new group ofindividual objects that includes the start and end objects. The intermediate steps show the transformation from one object shape to another object shape. The cross-fading is carried out from the first object selected to the second object selected.
1) Select two objects and go to Shape > Cross-fading on the Menu bar to open the Cross-fading dialog (Figure 130).
2) Select the number of Increments for the transformation.
3) If necessary, select Cross-fade attributes and Same orientation.
4) Click OK to cross-fade the selected objects and close the Cross-fading dialog. An example of cross-fading is shown in Figure 131 with Same orientation deselected. The object created is a group of objects.
5) To ungroup this group of objects and use the individual objects, see “Ungrouping” on page 112.
Figure 130: Cross-fading dialog
Figure 131: Cross-fading example
Duplication and cross-fading | 119

The following options are available in the Cross-fading dialog:
• Increments – enter the number of steps to be created between the selected objects.
• Cross-fade attributes – applies cross-fading to the line and fill properties of the selectedobjects. For example, if the selected objects are filled with different colors, a color transition between the two colors is applied.
• Same orientation – applies a smooth transition between the selected objects.
Positioning objects
Arranging objectsWhen combining, merging, subtracting, or intersecting objects, the end result varies depending on which object is at the front and which object is at the back. Each new object placed on a drawing automatically becomes the front object and all the other objects move backwards in positioning order. Arranging objects changes the order in of a group of objects.
To change the arrangement position of an object, select one or more objects and then use one ofthe following methods
• Right-click on the selected object(s), then select Arrange from the context menu and oneof the available options.
• Click on small triangle ▼ to the right of Arrange on the Standard toolbar to open the Position toolbar (Figure 132).
• Click one of the arrangement tools on the Line and Filling toolbar.
• Click on Shape > Arrange on the Menu bar and select an arrangement option.
• Use the Arrange tools in Position and Size section in the Properties deck on the Sidebar.
• Use a keyboard shortcut given below.
Figure 132: Position toolbar
The arrangement options available are as follows:
• Bring to Front (Shift+Ctrl++) – brings the selected object to the front of a group of objects.
• Bring Forward (Ctrl++) – brings the selected object forward one step.
• Send Backward (Ctrl+–) – sends the selected object one step backward.
• Send to Back (Shift+Ctrl+–) – sends the selected object to the back of a group of objects.
• In Front of Object – moves the selected object in front of another selected object.
• Behind Object – moves the selected object behind another selected object.
• Reverse – reverses the order of the selected objects. This tool is grayed out if only one object is selected.
120 | Draw Guide 7.1

Note
The positioning tools can be turned into a floating toolbar by clicking at the top of the pop-up on the Standard toolbar and dragging it to a new position on a drawing, as shown in Figure 132.
Aligning objectsTo make a drawing look more professional, objects can be aligned with each other. Select one or more objects and use one of the following methods to align objects:
• Right-click on the selected object(s), then select Align Objects from the context menu and one of the available options.
• Click on small triangle ▼ to the right of Align on the Standard or Line and Filling toolbarsto open a pop-up toolbar.
• Go to Shape > Align on the Menu bar and select the alignment required.
• Use the Align tools in the Position and Size section in the Properties deck on the Sidebar.
The alignment tools available are as follows:
• Left – aligns the left edges of the selected objects. If only one object is selected, the left edge of the object is aligned to the left page margin.
• Centered – horizontally centers the selected objects. If only one object is selected, the center of the object is aligned to the horizontal center of the page.
• Right – aligns the right edges of the selected objects. If only one object is selected, the right edge of the object is aligned to the right page margin.
• Top – vertically aligns the top edges of the selected objects. If only one object is selected, the top edge of the object is aligned to the upper page margin.
• Center – vertically centers the selected objects. If only one object is selected, the center of the object is aligned to the vertical center of the page.
• Bottom – vertically aligns the bottom edges of the selected objects. If only one object is selected, the bottom edge of the object is aligned to the lower page margin.
Figure 133: Align Objects toolbar
Note
The alignment tools can be turned into a floating toolbar by clicking at the top of the pop-up toolbar and dragging it to a new position on a drawing workspace, as shown in Figure 133.
Distributing objectsDistributing objects allows three or more objects to be evenly spaced along a horizontal axis or vertical axis. Objects are distributed using the outermost objects in the selection as base points for spacing.
Positioning objects | 121

Figure 134: Distribute Selection toolbar
Select at least three objects, then use one of the following methods to distribute the objects:
• Right-click on the selected objects, then select Distribute Selection from the context menu and one of the available options.
• Click on small triangle ▼ to the right of Distribute Selection on the Standard toolbar to open a pop-up toolbar.
• Go to Shape > Distribute Selection on the Menu bar and select a distribution option.
• Right-click on the selected objects and select Distribute Selection from the context menu, then select a distribution option.
The distribution options available are as follow:
• Horizontal Left – distributes the selected objects so that the left edges of the objects areevenly spaced from one another.
• Horizontal Center – distributes the selected objects so that the horizontal centers of the objects are evenly spaced from one another.
• Horizontal Spacing – distributes the selected objects horizontally so that the objects areevenly spaced from one another.
• Horizontal Right – distributes the selected objects so that the right edges of the objects are evenly spaced from one another.
• Vertical Top – distributes the selected objects so that the top edges of the objects are evenly spaced from one another.
• Vertical Center – distributes the selected objects so that the vertical centers of the objects are evenly spaced from one another.
• Vertical Spacing – distributes the selected objects vertically so that the objects are evenly spaced from one another.
• Vertical Bottom – distributes the selected objects so that the bottom edges of the objects are evenly spaced from one another.
Note
The distribution tools can be turned into a floating toolbar by clicking at the top of the pop-up toolbar and dragging it to a new position on a drawing workspace, as shown in Figure 134.
122 | Draw Guide 7.1

Draw Guide
Chapter 6, Editing ImagesRaster Graphics

Introduction
Earlier chapters of this Draw Guide have dealt only with vector graphics. The most common types of vector graphics in use are as follows:
• SVG (Scalable Vector Graphics) – an Extensible Markup Language (XML) based vector image format for two-dimensional graphics with support for interactivity and animation.
• EPS (Encapsulated PostScript) – a PostScript document format usable as a graphics file format. EPS files are more-or-less self-contained, reasonably predictable PostScript documents that describe an image or drawing and can be placed within another PostScript document.
• AI (Adobe Illustrator) – a proprietary file format developed by Adobe Systems for representing single-page vector-based drawings in either the EPS or PDF formats.
However, Draw also contains a number of functions for handling raster graphics (bitmaps) such as photographs and scanned pictures, including import, export, and conversion from one format to another.
Draw can read all the majority of graphic file formats. It has a subset of capabilities similar to raster graphics programs like Adobe Photoshop or Gimp. Raster graphics are generally images or pictures that use one of the following formats, which are the most common formats in use:
• JPG/JPEG – acronym for Joint Photographic Experts Group which created the format. It is the most common image format on websites and most digital cameras produce JPEG images as default.
• GIF (Graphics Interchange Format) – GIF is a bitmap image format that is popular because of its wide support and portability.
• PNG (Portable Network Graphics) – PNG is a raster image format which supports lossless data compression and also background transparency.
• TIF/TIFF (Tagged Image File Format) – TIFF is flexible, adaptable, and capable of storingimage data in a lossless format.
• BMP (BitMaP) – it is also known as bitmap image file, which is a dot matrix data structure.
Importing images
InsertingTo import image files into a drawing, go to Insert > Image on the Menu bar or click on Insert Image on the Standard toolbar to open the Insert Image dialog (Figure 135).
Draw contains import filters for the majority of graphic formats. If the file being imported has a graphic format not covered by the import filters, then it is recommended to use one of the many free graphic conversion programs to convert the file into a format that Draw recognizes.
If Preview is selected in the Insert Image dialog, a preview of the file is shown in the box on the right-hand side. This makes it easier to select the file required and also checks that Draw can import the file format used.
124 | Draw Guide 7.1

Figure 135: Insert Image dialog
EmbeddingEmbedding a graphic into a drawing makes the graphic a permanent part of the drawing. Any changes made to an embedded graphic only appear in the drawing where the graphic was embedded. The original graphic file is not affected.
Embedding happens when a graphic is imported into a drawing using one of the following methods:
• Insert Image dialog.
• Copying and pasting.
• Scanning a graphic.
• Dragging and dropping between open files.
The main advantage of embedding graphics into a drawing is that the graphic is always available no matter what computer is used to open the drawing.
The main disadvantage of embedding graphics is that it creates large file sizes, which may not bedesirable if there is limited capacity for storing computer files. Also, if the original graphic is altered, then the embedded graphic is not updated each time the drawing is opened.
Note
When a graphic is to be embedded into a LibreOffice drawing, make sure that the Insert as Link option is not selected in the Insert Image dialog.
Importing images | 125

Figure 136: Confirm Linked Graphic dialog
LinkingLinking to the original graphic does not insert the graphic into a drawing, but creates a link to where the original graphic file is located on the computer. Each time the drawing is opened, any linked graphics are displayed in the drawing.
The main advantage of linking a graphic file when placed in a drawing is that if the original graphic file is altered or replaced with a graphic using the same filename, the version of the graphic in the drawing is always up to date. The next time the drawing is opened, the latest version of the graphic is also opened in the drawing. Also the file size of the drawing is much smaller and the original graphic can easily be edited with specialized external applications.
The main disadvantage of linking graphics is that the link must be maintained between the drawing and the embedded graphic file for linking to work correctly. If the drawing or original graphic file is moved to another computer location, then any links must be updated to include the new location.
1) Open the Insert Image dialog.
2) Select the Insert as Link option in the Insert Image dialog.
3) Select the required graphic file and click on Open to open the Confirm Linked Graphic dialog (Figure 136).
4) Click on Keep Link to link the file and close the Confirm Linked Graphic dialog.
5) If necessary, click on Embed Graphic to embed the file if it is not to be linked. This also closes the Confirm Linked Graphic dialog.
Note
When a graphic file is linked to a LibreOffice drawing, the format of the linked graphicis not changed.
Editing linksLinks can be updated, modified, or broken as follows:
1) Go to Edit > Links to External File on the Menu bar to open the Edit Links dialog (Figure 137).
2) Select the link to be edited.
126 | Draw Guide 7.1

Figure 137: Edit Links dialog
3) Click on Modify, Break Link, or Update as appropriate.
– Modify – changes the graphic file in the drawing to the graphic file that uses the selected link.
– Break Link – breaks the link between the selected file and the current document. Theversion of the graphic file in the drawing becomes embedded into the drawing. A confirmation dialog opens asking if the link is to be broken. Click on Yes to confirm thebreaking of the link.
– Update – updates the selected link so that the most recent version of the linked file is displayed in the drawing.
4) Click on Close to save the changes to the link and close the Edit Links dialog.
ScanningWith most scanners a scanned image can be inserted into a drawing or document. Scanned images are embedded using PNG format. Make sure the scanner is configured for the computer and supported by the SANE system for a Linux operating system, or TWAIN for a Windows or Mac operating system.
1) Place a document, drawing, or photograph in the scanner and make sure that the scanner is switched on and ready.
2) If this is the first time the scanner has been used with LibreOffice, go to Insert > Media > Scan > Select Source on the Menu bar to select the scanner. If the scanner has been used before, go to Insert > Image > Scan > Request on the Menu bar.
3) The rest of the procedure depends on the scanner driver, interface, and computer operating system. Normally, scanning options need to be specified such as resolution, scan window, and so on. Consult the documentation that came with the scanner for more information.
Importing images | 127

4) When the image has been scanned, Draw places it in the drawing. At this point it can be edited like any other graphic.
Note
If more than one scanning device is connected to the computer, the device is selected when the source is selected. This selection becomes the default source when using scan requests until another device is used as the scanning source.
Copying and pastingCopying and pasting a graphic into a drawing is another way of embedding graphics. The copied graphic can be an image already embedded in another document or drawing, or it can be a graphic file such as a drawing, document, or photograph.
After copying, select the format for pasting a graphic into Draw using Edit > Paste Special > Paste Special on the Menu bar to open the Paste Special dialog. Available formats for pasting depend on the type of image copied onto the clipboard.
Note
When copying and pasting images into a drawing, please respect the copyright and license of the image being copied.
Dragging and droppingDragging and dropping is another method of embedding graphics into a drawing and can be usedon graphics that have been embedded or linked. The way that dragging and dropping works is determined by the computer operating system. Behavior of dragging and dropping is normally controlled using the Ctrl or Ctrl+Shift keys in combination with the mouse.
Objects and images which are used frequently can be stored in the Draw Gallery. From the Gallery, a copy of the object or image can be simply dragged onto the drawing. Working with the Gallery is dealt with in Chapter 11, Advanced Draw Techniques.
Exporting graphics
Exporting filesBy default Draw saves drawings in the *.ODG format. Some software programs cannot open *.ODG files. To make drawings available for other programs, the file can be exported in various formats. The export procedure used depends on the computer setup and computer operating system being used. The following procedure is an example export procedure.
1) Open the ODG file being exported.
2) Go to File > Export on the Menu bar and open the Export dialog. An example of an export dialog is shown in Figure 138.
3) Enter a new filename for the exported file and navigate to the folder where the exported file is to be saved.
4) Select the required file format from the options in the drop-down list.
5) Click Export and the file is exported as a new file in the selected file format.
128 | Draw Guide 7.1

Figure 138: Example export dialog
6) Depending on the file format selected, another dialog may open allowing options to be selected for the export format.
7) Depending on the additional dialog that may open, click on Export, Create, or OK and the file is exported as a new file in its new format.
Exporting objectsExporting individual objects, or a group of objects, from a drawing file is similar to “Exporting files”above. Open a drawing file and then select the object or objects for export. Make sure to choose the Selection option in the export dialog, as shown in Figure 138.
Using this method, an imported image can be modified, annotations added to it, and make other changes, then select it and export for use in another drawing or document.
Formatting images (raster objects)
Images (raster graphics) can be edited and formatted using one of the following methods to add or change filters and adjust the properties of color, lines, areas, and shadows:
• Go to Format > Image on the Menu bar and use one of the tools in the sub-menu that opens.
• Use the tools on the Image toolbar. See “Image toolbar” on below for more information.
• Use the tools available in the Shadow and Image sections on the Properties deck of the Sidebar (Figure 140 on page 131).
Formatting images (raster objects) | 129

• Some raster graphics may have a text element. For more information on formatting text, see Chapter 9, Adding and Formatting Text.
Raster graphics included in a group behave like other objects when the properties of the group are edited and formatted.
Note
Any formatting changes made to a graphic using the tools in LibreOffice only appear in the drawing where the graphic was modified. The original graphic file is not affected.
Naming imagesDraw names objects, including inserted images, Shape 1, Shape 2, and so on, in the order of insertion into a drawing. It is recommended to rename objects, including images in a drawing, with a unique name Names make images and other objects easily identifiable in the LibreOffice Navigator.
1) Select an image, then use one of the following methods to open the Name dialog, where a unique name can be entered for the selected image:
– Go to Format > Name on the Menu bar.
– Right-click on the image and select Name from the context menu.
2) Enter a name in the Name box and click OK.
Image toolbarThe Image toolbar (Figure 139) normally appears when an image or picture that is a raster graphic is selected. The Image toolbar can be fixed at the top of a drawing or as a floating toolbar. The default set of tools on the Image toolbar are as follows. For more information on the Image toolbar and the available tools, see Appendix B, Toolbars.
• Position and Size (F4) – opens the Position and Size dialog. See Chapter 3, Working with Objects for more information.
• Align Objects – opens a sub-toolbar giving access to alignment tools for aligning selected objects in relation to each other. See Chapter 5, Combining Multiple Objects for more information.
• Bring to Front (Shift+Ctrl++) – brings the selected object to the front of a group of objects.
• Bring Forward (Ctrl++) – brings the selected object forward one step.
• Send Backward (Ctrl+–) – sends the selected object one step backward.
• Send to Back (Shift+Ctrl+–) – sends the selected object to the back of a group of objects.
• In Front of Object – moves the selected object in front of another selected object.
• Behind Object – moves the selected object behind another selected object.
• Reverse – reverses the order of the selected objects. This tool is grayed out if only one object is selected.
• Line Style – opens a drop-down list with different line styles used for the outline of the border. See Chapter 4, Changing Object Attributes for more information.
• Line Width – used to change the width of a line. See Chapter 4, Changing Object Attributes for more information.
130 | Draw Guide 7.1

Figure 139: Image toolbar
Figure 140: Shadow and Image sections in Properties deck on Sidebar
• Line Color – used to change the color of a line. See Chapter 4, Changing Object Attributes for more information.
• Area Style/Filling – used to change the type of filling used in a shape. See Chapter 4, Changing Object Attributes for more information.
• Shadow – sets the default shadow effect around the picture. The shadow attributes are adjusted using the Shadow section in the Properties deck on the Sidebar (Figure 140). See Chapter 4, Changing Object Attributes for more information.
• Filter – opens the Image Filter toolbar which is described in “Image filters” on page 136.
Formatting images (raster objects) | 131

• Image Mode – changes the display of the graphic from color to grayscale, black and white, or a watermark. This setting affects only the display and printing of the picture; the original picture file remains unchanged. The image mode setting can also be changed using Color mode in the Image section in the Properties deck on the Sidebar (Figure 140).
– Default – the graphic is displayed unaltered in color.
– Grayscale – the graphic is displayed in 256 shades of gray.
– Black/White – the graphic is displayed in black and white.
– Watermark – the color, brightness, contrast, and gamma settings are reduced so that the graphic can be used as a watermark (background). These default settings can be adjusted using the Color toolbar (Figure 141).
• Crop – crops or trims a picture. When using this tool, crop marks appear around the picture. Drag one or more of these marks to crop the picture to the desired size. For more information on cropping, see “Cropping images” on page 133.
• Vertically – flips the selected object vertically. See Chapter 4, Changing Object Attributesfor more information.
• Horizontally – flips the selected object horizontally. See Chapter 4, Changing Object Attributes for more information.
• Transformations – opens the Transformations toolbar. See Chapter 4, Changing Object Attributes for more information.
• Transparency – adjusts the degree of transparency of the picture between 0% (opaque) and 100% (fully transparent). The transparency setting can also be adjusted using the Image section in the Properties deck on the Sidebar.
Figure 141: Color toolbar
• Color – opens the Color toolbar (Figure 141) to adjust the values of the RGB colors, brightness, contrast, and Gamma. These adjustments do not affect the original picture, but the values are stored in Draw as a separate formatting set. The color settings can also be adjusted using the Image section in the Properties deck on the Sidebar.
– Red, Green, Blue – select values between –100% (no color) to +100% (full intensity); 0% represents the original color value of the graphic.
– Brightness – select a value between –100% (totally black) and +100% (totally white).
– Contrast – select a value between –100% (minimum) and +100% (maximum).
132 | Draw Guide 7.1

– Gamma – this affects the brightness of the middle color tones. Select a value between0.10 (minimum) to 10 (maximum) Try adjusting this value if changing brightness or contrast does not give the required result.
Cropping images
Cropping is a method of hiding unwanted areas of an image or changing the size of an image in a drawing. Changes made when cropping an image only change the display of the graphic in a drawing and not the original graphic file.
Quick croppingAfter selecting a graphic, it can be cropped quickly using one of the following methods:
• Click on Crop Image on the Standard or Image toolbar.
• Go to Format > Image > Crop on the Menu bar.
• Right-click on the image and select Crop from the context menu.
Selection handles appear around the selected image (Figure 142) and the image is cropped as follows:
• Top, bottom, left, and right selection handles crop the image in one direction only.
Figure 142: Example image ready for cropping with selection handles
• Corner selection handles crop the image vertically and horizontally in two directions.
• To maintain the ratio between vertical and horizontal dimensions, hold down the Shift key while moving a selection handle.
Crop dialogFor more control and accuracy over the cropping functions, it is recommended to use the Crop dialog (Figure 143). After selecting an image, go to Format > Image > Crop Dialog on the Menubar to open the Crop dialog.
Cropping images | 133

Figure 143: Crop dialog
• Crop – use this section to trim or scale the selected graphic, or to add white space around the graphic.
– Keep scale – maintains the original scale of the graphic when cropping so that only the size of the graphic changes.
– Keep image size – maintains the original size of the graphic when you crop so that only the scale of the graphic changes. To reduce the scale of the graphic, select this option and enter negative values in the cropping boxes. To increase the scale of the graphic, enter positive values in the cropping boxes.
– Left and Right – if Keep scale is selected, enter a positive amount to trim the left or right edge of the graphic, or a negative amount to add white space to the left or right of the graphic. If Keep image size is selected, enter a positive amount to increase the horizontal scale of the graphic, or a negative amount to decrease the horizontal scale of the graphic.
– Top and Bottom – if Keep scale is selected, enter a positive amount to trim the top or bottom of the graphic, or a negative amount to add white space above or below the graphic. If Keep image size is selected, enter a positive amount to increase the vertical scale of the graphic, or a negative amount to decrease the vertical scale of thegraphic.
• Scale – this section is used to change the scale of the selected graphic as it appears in adrawing.
– Width – enter a percentage value to change the width of a selected graphic.
134 | Draw Guide 7.1

– Height – enter a percentage value to change the height of a selected graphic.
• Image Size – this section is used to change the size of the selected graphic.
– Width – enter a value for the width of the selected graphic.
– Height – enter a value for the height of the selected graphic.
• Original Size – the original size of the graphic is displayed above the option. Clicking on this option and then clicking OK resets the selected graphic to its original size.
Note
In the Crop dialog, the Width and Height are treated as independent values. Changing one without the other can result in significant distortion of the image and this may not be what is required.
Exporting cropped graphicsIf a cropped graphic is to be used in another drawing, use one of the following methods after selecting the cropped graphic:
• Go to File > Export on the Menu bar to open the Export dialog. Navigate to the destination folder, then enter a filename, choose the Selection option, and click on Export. See “Exporting graphics” on page 128 for more information.
• Go to Format > Image > Save on the Menu bar or right click on the cropped graphic and select Save from the context menu. Click on Yes to save the modified image and open an Image Export dialog. Select the file format required, navigate to the destination folder, then enter a filename and click on Save.
Figure 144: Compress Image dialog
Cropping images | 135

Compressing imagesIf a large image is inserted into a drawing and resized to fit into the layout of the drawing, the complete full-size original image is stored in the drawing file. This preserves its content, possibly resulting in a large file to store or send by mail.
If some loss of image quality can be accepted, the image can be compressed reducing its data volume while preserving its display in the page layout;
1) Open the Compress Image dialog (Figure 144) using one of the following methods:
– Right-click on the image and select Compress from the context menu.
– Go to Format > Image > Compress on the Menu bar.
2) Select the type of compression and the resolution required.
3) Click on Calculate New Size to update the image information when the Compression and Resolution settings are changed.
4) When satisfied with the new settings, click OK to apply the settings.
5) If the resulting image is not acceptable, use the keyboard shortcut Ctrl+Z to undo the changes and select another compression setting.
Image filters
Draw offers eleven filter effects that work on a selected graphic and they can be combined. Filters always apply to the entire graphic and it is not possible to use filters to edit only a part of the graphic.
Figure 145: Image Filter toolbar and available filters
136 | Draw Guide 7.1

1) Select a raster graphic to open the Image toolbar.
2) Apply an image filter using one of the following methods:
– Click on Filter to open the Image Filter toolbar (Figure 145), then select an image filter to apply.
– Go to Format > Image > Filter on the Menu bar and select an image filter from the context menu.
Note
If a graphic is embedded into a drawing, any image filters are applied directly to a selected graphic and the original graphic file is not changed. Save the drawing to retain any filter effects applied to the graphic in a drawing.
Note
After a drawing is saved and closed, the effects of image filters become permanent. If image filter effects are not satisfactory, use Edit > Undo on the Menu bar to cancelthe filter effects before saving the drawing.
The image filters available for application to a raster graphic are as follows:
• Invert – inverts or reverses the color values of a color image (similar to a color negative),or the brightness values of a grayscale image. Apply the filter again to revert to the original graphic (Figure 146).
Figure 146: Invert image filter
• Smooth – softens or blurs the image by applying a low pass filter. This reduces the contrast between neighboring pixels and produces a lack of sharpness making the imageappear smoother (Figure 147). The effect of the smooth filter can be very subtle. However, the following example shows the Smooth image filter applied at a Smooth radius setting of 50 making the image smooth, but blurred.
Selecting this filter opens the Smooth dialog (Figure 148) where the smooth radius parameter is set.
Figure 147: Smooth image filter
Image filters | 137

Figure 148: Smooth dialog
• Sharpen – sharpens the image by applying a high pass filter, adjusting the contrast between neighboring pixels. The effect increases if the filter is applied several times making the colors appear faded, as shown by the example in Figure 149.
Figure 149: Sharpen image filter
Figure 150: Remove Noise image filter
• Remove Noise – removes noise by applying a median filter comparing every pixel with its neighbor. It then replaces any pixel with extreme values that deviate in color by a largeamount from the mean value with a pixel that has a mean color value. The amount of picture information does not increase each time the filter is applied. However, there are fewer contrast changes resulting in an image that looks smoother and the effect is very subtle (Figure 150).
• Solarization – solarization refers to an effect that looks like what can happen when thereis too much light during photo development and the colors have become partly inverted. Dark areas appear light or light areas appear dark. In the digital world of photography, solarization creates a change or reversal of color (Figure 151), similar to the effect of the Invert image filter.
Selecting Solarization opens the Solarization dialog (Figure 152), where the degree of solarization (Threshold value) can be specified. Entering a value above 70% reverses the inversion effect on colors. Selecting Invert reverses the effect of the Solarization image filter.
138 | Draw Guide 7.1

Figure 151: Solarization image filter
Figure 152: Solarization dialog
• Aging – aging creates a look that resembles photographs developed in the early days of photography (Figure 153). All pixels are set to their gray values and then the green and blue color channels are reduced by the amount specified in Aging degree in the Aging dialog. Red color channel is not changed.
Selecting the Aging filter opens the Aging dialog (Figure 154), where the Aging degree can be defined and create an old look for the image.
Figure 153: Aging image filter
Figure 154: Aging dialog
Image filters | 139

• Posterize – posterizing reduces the number of colors in an image. For example, a photograph will probably look like a painting when the number of colors is reduced (Figure 155).
Selecting Posterize opens the Posterize dialog (Figure 156), where the number of poster colors can be defined to produce the effect required.
Figure 155: Posterize image filter
Figure 156: Posterize dialog
• Pop Art – changes the colors of an image converting it to a pop-art format (Figure 157).
Figure 157: Pop Art image filter
• Charcoal Sketch – displays an image as a charcoal sketch. The contours of the image are drawn in black and the original colors are suppressed (Figure 158).
140 | Draw Guide 7.1

Figure 158: Charcoal Sketch image filter
• Relief – calculates the edges of an image in relief as if the image is illuminated by a light source (Figure 159). Selecting Relief opens the Emboss dialog (Figure 160) where the position of the Light source is selected producing shadows that differ in direction and magnitude.
Figure 159: Relief image filter
Figure 160: Emboss dialog
• Mosaic – this image filter joins groups of pixels and converts them into rectangles of a single color creating an image that appears to be a mosaic (Figure 161). The larger the individual rectangles created, the fewer details in the mosaic graphic.
Selecting this image filter opens the Mosaic dialog (Figure 162), where the number of pixels for Width and Height of the tiles is set. Selecting Enhanced edges enhances the edges of each tile, creating a sharper definition.
Image filters | 141

Figure 161: Mosaic image filter
Figure 162: Mosaic dialog
Replacing colors
The Color Replacer tool only allows replacement or changing a color in an embedded graphic for another color or set a color as transparent. Up to four colors can be replaced at once. An areaof the graphic cannot be selected for editing as this tool only works on the entire graphic.
The selection of replacement colors can only be from one of the available palettes in LibreOffice. New colors cannot be defined here, but custom colors can be created before using the Color Replacer tool. For more information on creating colors, see Chapter 11, Advanced Draw Techniques.
Note
The Color Replacer can only be used on embedded graphics. If the Color Replaceris used on a linked graphic, the following error message appears “This image is linked to a document. Do you want to unlink the image in order to edit it?”. Click on Yes to unlink and embed the graphic.
Color Replacer dialog
• Pipette – switches color selection on when selected.
• Replace – replaces the selected source colors in the selected image with the colors specified in the Replace with boxes.
• Colors – lists the source colors and the replacement colors.
– Source color checkbox – select this checkbox to replace the current Source color withthe color that specified in the Replace with box.
– Tolerance – set the tolerance for replacing a source color in the source image. To replace colors that are similar to the color selected, enter a low value. To replace a wider range of colors, enter a higher value.
142 | Draw Guide 7.1

– Replace with – lists the available color palettes and replacement colors.
• Transparency – replaces transparent areas in the selected image with the color selected.
Replacing colors1) Select an embedded image to start using the Color Replacer.
2) Go to Tools > Color Replacer on the Menu bar to open the Color Replacer dialog (Figure 163).
3) Click on Pipette at the top of the Color Replacer dialog to activate the color selection mode.
4) Move the cursor over the color to be replaced in the selected image and a preview of the color appears in the box next to Pipette.
5) Click on the color. The selected color appears in the first Source color preview box and a check mark appears next to it
6) To select another color, place a check mark next to the second Source color preview box and click on another color in the selected image. A maximum of four colors can be selected in the Color Replacer dialog.
7) Enter the amount of tolerance required for replacing each selected color in the Tolerance boxes. The default selection is 10% tolerance.
8) In Replace with, select a color palette from the drop-down list, then select the required color from the color palette. Transparent is the default selection.
9) After selecting up to four colors for replacement, click Replace to replace the colors in theselected graphic. An example of color replacement is shown in Figure 164.
10) There is no preview of the effect. If the result is not satisfactory, select Edit > Undo > Color Replacer in the Menu bar and repeat the color replacement.
Figure 163: Color Replacer dialog
Replacing colors | 143

Figure 164: Example of using color replacer
Note
Using the Color Replacer replaces all occurrences of the Source color that are in the selected image.
Note
The default selection of Transparent in the Replace with boxes removes the selected color from the image and creates transparent areas in the selected image.
Replacing transparent areasTo replace any transparent areas in an image with a color, use the following procedure:
1) Go to Tools > Color Replacer on the Menu bar to open the Color Replacer dialog.
2) Click on the image with transparent areas to select the image.
3) Select Transparency in the Color Replacer dialog so that a check mark appears next to Transparency.
4) Select a color palette from the drop-down list next to Transparency, then select a color from the selected palette.
5) Click on Replace and the transparent areas are filled with the selected color.
6) There is no preview of the effect. If the result is not what you required, select Edit > Undo> Color Replacer in the Menu bar.
Conversion
Contour conversionContour conversion converts a selected object to a polygon, or a group of polygons, with four corner points. If an image was converted to a contour, then the converted image is set as a background graphic. If the conversion creates a group of polygons (for example, contour conversion of a text object), then enter the polygon group before selecting an individual polygon within the group. For more information on working with groups, see Chapter 5, Combining Multiple Objects.
After an object is converted to a contour, the object can no longer be edited normally. Instead, the contour converted object is edited using Edit > Points on the Menu bar to adjust its shape. For more information on editing points, see Chapter 3, Working with Objects.
144 | Draw Guide 7.1

Note
Any editing to an object must be completed before carrying out a contour conversion because any further editing is not possible on the converted object.
1) Carry out all necessary editing on the object before converting to a contour.
2) Make sure the object is selected.
3) Convert the object to a contour using one of the following methods:
– Go to Shape > Convert > To Contour on the Menu bar.
– Right-click on the selected object and select Convert > To Contour from the context menu.
Note
No confirmation dialog is provided for a contour conversion.
Polygon conversionPolygon conversion is used to convert a selected image into a group of polygons filled with color. The image is also converted to a vector graphic and can be resized with no loss of image quality or distortion of any text.
After conversion, the graphic can be broken into groups of polygons and then split into individual polygons. Breaking and splitting allows editing or deletion of individual colors within the graphic.
Conversion options and controls
• Number of colors – enter the number of colors to be displayed in the converted image. LibreOffice generates a polygon for each occurrence of a color in the image. The range for the number of colors is between 8 and 32.
• Point reduction – removes color polygons that are smaller than the pixel value entered. The range for point reduction is between 0 and 32 pixels.
• Fill holes – fills the blank areas in the graphic that can be created when applying a point reduction.
• Tile size – enter the size of the rectangle for the background fill. The range of tile sizes isbetween 8 and 128 pixels.
• Source image – preview of the original image.
• Vectorized image – preview of the converted image.
• Preview – creates a preview of the converted image in Vectorized image without applying any changes.
• OK – converts the image to a vector graphic consisting of polygons. The result is a metafile in SVM format (StarView Metafile) used by LibreOffice and allows transfer of the converted image to other LibreOffice documents.
Converting
1) Select an image in a drawing.
2) Convert the image into a polygon using one of the following methods and open the Convert to Polygon dialog (Figure 165):
– Go to Shape > Convert > To Polygon on the Menu bar.
– Right-click on the image and select Convert > To Polygon from the context menu.
Conversion | 145

Figure 165: Convert to Polygon dialog
3) Select Number of colors and Point reduction to be used in the conversion.
4) Select Fill holes to prevent any blank areas appearing in the converted image.
5) Enter the number of pixels to use for Tile size.
6) Click Preview to check how the converted graphic will look.
7) Make any necessary changes to the settings and check the preview again.
8) If the converted image meets the expected requirements, click OK to convert the image to a polygon and close the Convert to Polygon dialog.
Note
No confirmation dialog is provided for a polygon conversion.
Breaking
After converting an image to polygons, the vectorized image can be broken into groups of polygons. Each group of polygons consists of one color and becomes an object that can be used in another drawing.
1) Convert an image to polygons, see “Converting” above.
2) Make sure the converted image is selected, then use one of the following methods to break the image into groups of polygons:
– Go to Shape > Break on the Menu bar.
– Right-click on the image and select Break from the context menu.
3) Click on a color in the image and drag the group of polygons filled with that color out of the image to create a new image.
4) Alternatively, press Delete and delete the color from the image.
146 | Draw Guide 7.1

Splitting
After converting an image to polygons and breaking the image into groups of polygons, these polygon groups can be split into individual polygons.
1) Convert an image to polygons, see “Converting” above.
2) Break the image into groups of polygons, see “Breaking” above.
3) Select the image, then use one of the following methods to split the groups of polygons into individual polygons:
– Go to Shape > Split on the Menu bar.
– Right-click on the image and select Shapes > Split from the context menu.
– Use the keyboard shortcut Ctrl+Alt+Shift+K.
4) Select an individual polygon (or several polygons) in the image and drag the polygon fromthe image to create a new image in the drawing.
5) Alternatively, press Delete to delete the selected polygon(s) from the image.
Bitmap conversionAll drawing objects placed into a LibreOffice drawing are vector graphics and these vector graphics can be converted to a bitmap (raster graphic) in PNG format. Any transparency effects in the original vector graphic are lost during conversion even though the PNG format used by LibreOffice Draw supports transparencies.
Use one of the following methods to convert a vector graphic to a bitmap:
• Go to Shape > Convert > To Bitmap on the Menu bar.
• Right-click on the graphic and select Convert > To Bitmap from the context menu.
Note
No confirmation dialog is provided for a bitmap conversion.
Conversion | 147

Draw Guide
Chapter 7, Working with 3D Objects

Introduction
Although Draw does not match the functionality of leading drawing or image editing programs, it is capable of producing and editing 3D drawings. In Draw, two types of 3D objects are available: 3D scenes and extruded 3D shapes. The Status Bar indicates when a 3D scene has been selected (Figure 166). However, the Status Bar only indicates a shape has been selected (Figure 167) when an extruded 3D shape is selected.
Figure 166: Status Bar showing 3D scene selected
Figure 167: Status Bar showing shape selected
Depending on which type is selected, there are different possibilities for further editing of the object (rotation, illumination, perspective, and so on). Extruded 3D shapes are simpler to set up and edit, but 3D scenes allow for greater customization.
3D objects are created using one of the following methods:
• 3D Objects – these are ready made 3D objects and are 3D scenes selected using one ofthe following methods:
– Click on 3D Objects in the Drawing toolbar (Figure 168 on page 150).
– Select a 3D object in 3D Objects in the Shapes deck on the Sidebar.
• Convert a 2D object into a 3D object use one of the following tools on the Drawing toolbar:
– To 3D – creates a 3D scene containing an extrusion object.
– To 3D Rotation Object – creates a 3D scene into a rotation object using a default rotation axis.
– In 3D Rotation Object – creates a 3D scene into a rotation object using a user defined rotation axis.
– Toggle Extrusion – creates a 3D shape by extruding a 2D object into 3D. Only 3D shapes that have been extruded can be converted back to a 2D object.
3D object types
3D scenes3D scenes are created from objects with dimensions using x, y, and z coordinates and can contain object types, such as cube, sphere, extrusion object or rotation object. These object types do not exist outside a 3D scene.
The Status Bar displays 3D scene selected when a 3D object is selected that has been created from a 2D object using body rotation or conversion, or it is a ready-made 3D object that has beeninserted into a drawing.
A 3D scene acts similar to a group. Just like a group, a 3D scene can be entered for editing an individual object in the 3D scene and then exit after editing is completed. See Chapter 5, Combining Multiple Objects for more information on entering, editing and exiting groups.
When a 3D scene is created from a selection of more than one 2D object, a group is automatically created as a single 3D scene. This 3D scene can be entered so that individual objects within the 3D scene can be changed, edited and rotate.
3D object types | 149

Note
Individual objects cannot be ungrouped when a 3D scene has been created from a selection of 2D objects.
3D shapes3D shapes are solid objects that have three dimensions: length, width, and height. While 2D shapes are flat, 3D shapes have depth.
A 3D shape is created when a 2D shape or an object from the Fontwork Gallery is turned into 3D using Toggle Extrusion. The Status Bar displays Shape selected when this type of 3D object is selected.
A 3D shape can be viewed and edited in 3D or 2D mode. To edit in 2D mode, switch off extrusion, make the editing changes, and switch back to 3D mode using Toggle Extrusion.
Note
Extrusion, using Toggle Extrusion, can only be used when a 2D shape, a 3D object that has been extruded from a 2D shape, or an object from the Fontwork Gallery is selected. It is not available for text, lines, arrows, curves, and polygons.
Drawing toolbar
Before creating 3D objects in a drawing, it is recommended that the 3D tools are added to the Drawing toolbar (Figure 168) using Visible Buttons or the Customize dialog. For information on using Visible Buttons and the Customize dialog, see Appendix B, Toolbars and the Getting Started Guide.
After installing 3D tools onto the Drawing toolbar, these tools only become available when a 2D object is selected in a drawing.
Figure 168: Drawing toolbar with 3D tools added
Creating 3D objects
3D ready made objects3D ready made objects are 3D scenes and are inserted into a drawing using one of the following methods. The selection and drawing of 3D objects is the same for all methods of inserting a 3D ready made object.
• Click on the triangle ▼ to the right of 3D Objects on the Drawing toolbar and select a 3D object from the sub-toolbar. The 3D Objects icon displayed on the Drawing toolbar depends on the 3D object that had been previously selected and used.
• Go to View > Toolbars > 3D-Objects on the Menu bar to open the 3D-Objects toolbar (Figure 169).
• Go to Shapes > Insert > 3D Objects on the Menu bar.
• Go to Shapes > Default > 3D Objects on the Sidebar and select a 3D object.
150 | Draw Guide 7.1

Figure 169: 3D Objects toolbar
Note
Ready made 3D objects can be repositioned, resized, and edited in the same way as2D objects. See Chapter 3, Working with Objects for more information.
ExtrusionExtrusion converts a 2D object into a 3D scene by extruding the 2D object toward the observer. The scene is rotated by 20 degrees around the horizontal axis to make the 3D effect more visible. Examples of 3D conversion using extrusion are shown in Figure 170.
After selecting a 2D object in a drawing, convert it to a 3D scene with To 3D using one of the following methods:
• Right-click on the 2D object and select Convert > To 3D from the context menu.
• Click on To 3D in the Drawing toolbar.
• Go to Shape > Convert > To 3D on the Menu bar.
• Click on Convert to 3D in the 3D Effects dialog (Figure 176 on page 155).
Figure 170: Example of using extrusion for 3D conversion
Rotation
To 3D Rotation Object and Convert to Rotation Object
To 3D Rotation Object or Convert to Rotation Object converts a 2D object into a 3D scene by rotating the object using the left edge of the bounding box around the object as the axis of rotation. Examples of 3D conversion using either of these rotation tools are shown in Figure 171. The actual 3D scene created depends on the angle and shape of the object being rotated.
After selecting a 2D object in a drawing, convert it to a 3D scene using rotation with one of the following methods:
• Right-click on a 2D object and select Convert > To 3D Rotation Object from the context menu.
• Click on To 3D Rotation Object in the Drawing toolbar.
• Go to Shape > Convert > To 3D Rotation Object on the Menu bar.
• Click on Convert To Rotation Object in the 3D Effects dialog.
Creating 3D objects | 151

Figure 171: Examples of using rotation for 3D conversion
Figure 172: Example of moving rotation axis using In 3D Rotation Object
In 3D Rotation Object
In 3D Rotation Object converts a 2D object into a 3D scene by rotating the object through a movable axis of rotation. An example of moving the rotation axis and changing the rotation angle is shown in Figure 172. The actual 3D scene created also depends on the angle and shape of the object being rotated.
1) Select a 2D object in a drawing.
2) Click on In 3D Rotation Object in the Drawing toolbar.
3) Adjust the position and angle of the rotation axis. This is shown as a dashed line with rotation points at each end.
152 | Draw Guide 7.1

4) Click anywhere outside the 2D object and it is converted into a 3D scene, as shown in Figure 172.
Toggle ExtrusionExtrusion is where parallel surfaces are moved to create a 3D shape. In Draw, the 2D surface is moved forwards out of the drawing level. At the same time the object is slightly tilted and central projection turned on, creating the impression of a 3D shape. Draw uses a default value for this extrusion (body depth) based on the size of the 2D object. The value can be changed after the extrusion, see “Editing 3D objects” below.
Extrusion conversion is carried out using Toggle Extrusion. Extrusion only works on basic shapes, symbol shapes, block arrows, flowcharts, callouts, and stars and banners that are included as a part of the default set of tools on the Drawing toolbar or in the Shapes deck on the Sidebar. Extrusion can also be used on any objects created using Fontwork. Examples of toggle extrusion are shown in Figure 173.
1) Select a 2D object in a drawing that has been created from basic shapes, symbol shapes,block arrows, flowcharts, callouts, or stars and banners.
2) Click on Toggle Extrusion on the Drawing toolbar to convert the 2D object into a 3D shape.
3) To convert a 3D conversion back into a 2D object, select the 3D object and click on Toggle Extrusion on the Drawing toolbar.
Note
Extrusion cannot be used on text objects created using Insert Text Box or Insert Vertical Text.
Figure 173: Examples of toggle extrusion
Editing 3D objects
Note
Where 3D scenes have been created from more than one 2D object, a 3D scene group is automatically created. This 3D scene group cannot be ungrouped and any editing carried out will affect all 3D objects within the group. To edit an individual 3D object within this 3D scene group, enter the group. See Chapter 5, Combining Multiple Objects more information on working with groups.
Editing 3D objects | 153

Figure 174: 3D Settings toolbar
Position, Size and RotationEditing the position, size and rotation of 3D objects is similar to 2D objects. See Chapter 3, Working with Objects for more information.
3D settingsTo open the 3D-Settings toolbar (Figure 174), go to View > Toolbars > 3D-Settings on the Menubar. The 3D-Settings toolbar only becomes active when a 3D shape is selected that has been created from a 2D object using “Toggle Extrusion” above.
The tools available for editing 3D shapes are as follows. The result of any changes made using these editing tools is applied to the selected 3D shape immediately displaying the effect of the 3Dsetting applied.
• Tilt Down – tilts the selected object downward (horizontal axis rotation) by 5 degrees each time the icon is used.
• Tilt Up – tilts the selected object upward (horizontal axis rotation) by 5 degrees each timethe icon is used.
• Tilt Left – tilts the selected object left (vertical axis rotation) by 5 degrees each time the icon is used.
• Tilt Right – tilts the selected object right (vertical axis rotation) by 5 degrees each time the icon is used.
• Depth – opens a pop-up menu where where the extrusion depth can be set from an object by a fixed or custom amount.
• Direction – opens a pop-up menu where the view direction can be set to create an extrusion in either a perspective or parallel projection.
• Lighting – opens a pop-up menu where the direction and intensity of the lighting can be set when creating an extrusion.
• Surface – opens a pop-up menu where the surface of the extrusion can be set as matt, or wireframe display.
• 3D Color – opens a pop-up menu where the color used for the extrusion can be set. Thiscolor does not have to be the same as the color used for the original 2D object.
Figure 175 shows an example of tilting left, increasing extrusion depth, and changing 3D color using the 3D-Settings toolbar.
Note
The 3D Effects dialog cannot be used on 3D shapes created using Toggle Extrusion because the correct formatting results will not be achieved. If the 3D Effects dialog is used in error, remove any incorrect formatting by going to Format > Default Formatting on the Menu bar.
154 | Draw Guide 7.1

Figure 175: Example of changing 3D settings
Figure 176: 3D Effects dialog - Geometry page
Editing 3D objects | 155

3D effectsThe 3D Effects dialog (Figure 176) offers a wide range of possible settings for editing 3D ready made objects or 3D scenes. This dialog can also be used to convert a 2D object to 3D using the tools in the bottom left corner of the dialog. To open the 3D Effects dialog, click on 3D Effects on the Line and Filling toolbar, or go to Format > 3D-Effects on the Menu bar.
Any 3D effects applied to a 3D scene are not carried out until Assign is clicked in the top right of the 3D Effects dialog. This allows for all 3D effect changes to be carried out before applying themto a 3D scene.
Note
Any options on the pages in the 3D Effects dialog that are grayed out cannot be usedfor the selected object.
3D conversion
In the bottom left corner of the 3D Effects dialog are tools for converting a 2D object into a 3D scene and changing the projection used in a 3D scene.
• Convert to 3D – converts the selected object into a 3D scene. This tool works in the same way as using “Extrusion” on page 151.
• Convert to Rotation Object – converts a 2D object into a 3D scene using body rotation. This tool works in the same way as using “Rotation” on page 151.
• Perspective On/Off – switches perspective projection on or off for a 3D scene. Perspective projection is a technique to create a linear illusion of depth. As objects get further away from the viewer, a perspective drawing decreases in size at a constant rate.
3D Effects – Geometry
Click on Geometry in the 3D Effects dialog (Figure 176) to open the Geometry page and use the options available to change the geometry of a 3D object.
• Geometry – defines the properties of an object in a 3D scene.
– Rounded edges – enter the amount required to round the corners of a 3D shape as shown by the example in Figure 177. The default setting for rounded edges is 10%.
Figure 177: Example of rounded edges
– Scaled depth – enter the amount required to increase or decrease the frontal area of a selected 3D object. Figure 178 shows an example where the scaled depth has beenincreased to 150% and then decreased to 50%. The default setting for scaled depth is100%.
156 | Draw Guide 7.1
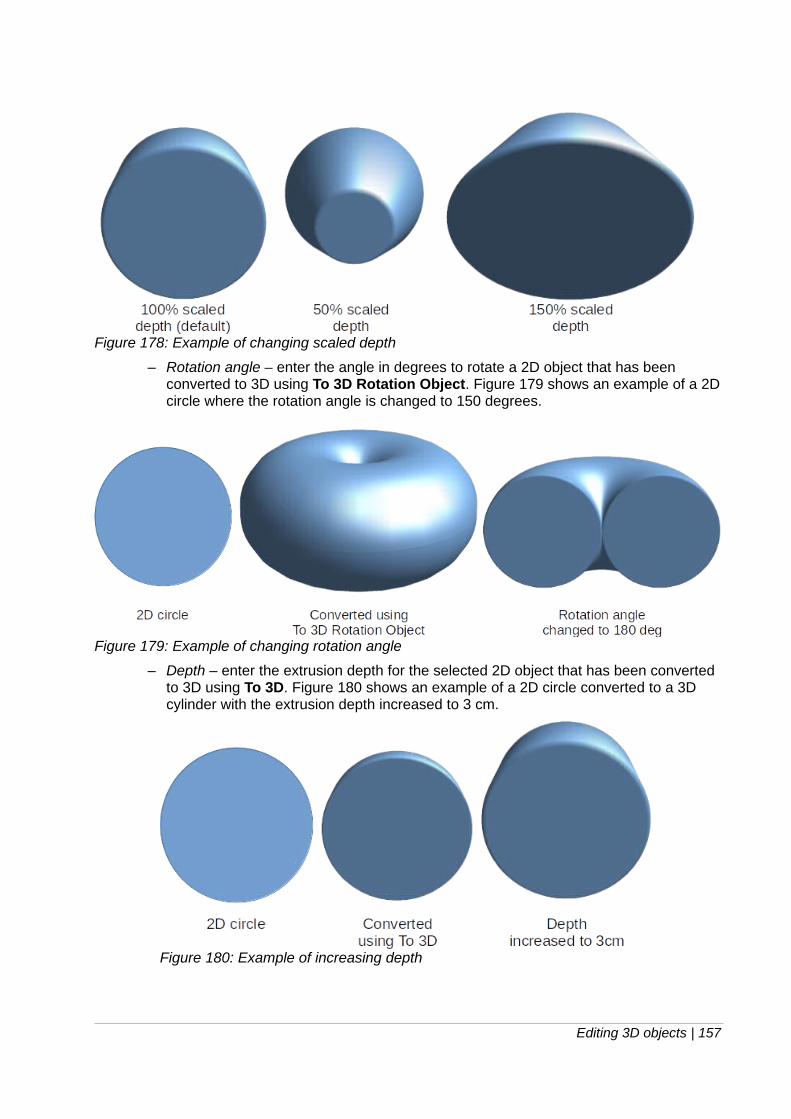
Figure 178: Example of changing scaled depth
– Rotation angle – enter the angle in degrees to rotate a 2D object that has been converted to 3D using To 3D Rotation Object. Figure 179 shows an example of a 2D circle where the rotation angle is changed to 150 degrees.
Figure 179: Example of changing rotation angle
– Depth – enter the extrusion depth for the selected 2D object that has been converted to 3D using To 3D. Figure 180 shows an example of a 2D circle converted to a 3D cylinder with the extrusion depth increased to 3 cm.
Figure 180: Example of increasing depth
Editing 3D objects | 157

• Segments – changes the number of segments that Draw uses to draw a 3D rotation object. The higher the number of segments, the smoother the object surface will be. However, a high segment number may increase the time it takes to generate the 3D object on a display. Figure 181 shows the difference on a 3D sphere when the segments have been increased from 10 to 30 segments horizontally and vertically.
– Horizontal – enter the number of horizontal segments used in the selected 3D rotationobject.
– Vertical – enter the number of vertical segments used in the selected 3D rotation object.
Figure 181: Example of segments
• Normals – modifies the rendering style of the 3D surface (Figure 182 and Figure 183).
– Object-Specific – renders the 3D surface according to the shape of the object. For example, a circular shape is rendered with a spherical surface.
– Flat – renders the 3D surface as polygons.
– Spherical – renders a smooth 3D surface regardless of the shape of the object.
– Invert Normals – an inverted normal is a normal that is pointing in the wrong direction.This tells a computer that an outside face is actually an inside face when it is not. If there is a hollow design, an inverted normal can be indicated because both surfaces facing are in and out in the same model.
– Double-Sided Illumination – lights the outside and the inside of the object. This has only an effect, if the inside is drawn at all, see Double-Sided. This is a setting for the whole of the 3D scene and not for a single object within the scene.
Figure 182: Examples of object specific, flat and spherical effects
158 | Draw Guide 7.1

Figure 183: Examples of invert normals and double sided illumination
Note
Figure 183 demonstrates the 3D effect of using Invert Normals in conjunction with using the 3D effect Double-Sided Illumination.
– Double-Sided – a 3D object has outside (front) and inside (back) faces. With Double-Sided switched off, only the outside face of the object is rendered. The effect, when looking from outside, is that the object is solid, but, when looking from inside, the frontface is transparent. If there is no view to the inside face, normal for an extruded 3D object with solid texture, Double-Sided should be switched off to improve performanceduring rendering. Any 3D object created using rotation often allows an inside view andit is recommended that Double-Sided is switched on.
3D Effects – Shading
On the Shading page of the 3D Effects dialog (Figure 184) provides options to set the shading, shadow, and camera effects on a selected 3D object.
• Shading – specifies the mode of shading applied to a 3D object (Figure 185).
– Gouraud – this shading mode is a method used in computer graphics to simulate the differing effects of light and color across the surface of an object. In practice, it is usedto achieve smooth lighting on low-polygon surfaces without the heavy computational requirements of calculating lighting for each pixel.
– Phong – this shading mode is an interpolation technique for surface shading calculating the normal of a point in the polygon by interpolating the normals of the vertices. The angle between normal and lighting direction determines how much of thelighting is used to color the pixel.
– Flat – this shading mode refers to the depiction of depth perception in 3D models or illustrations by varying the level of darkness. It assigns a single color of shading to a single segment on the surface of the object.
Editing 3D objects | 159
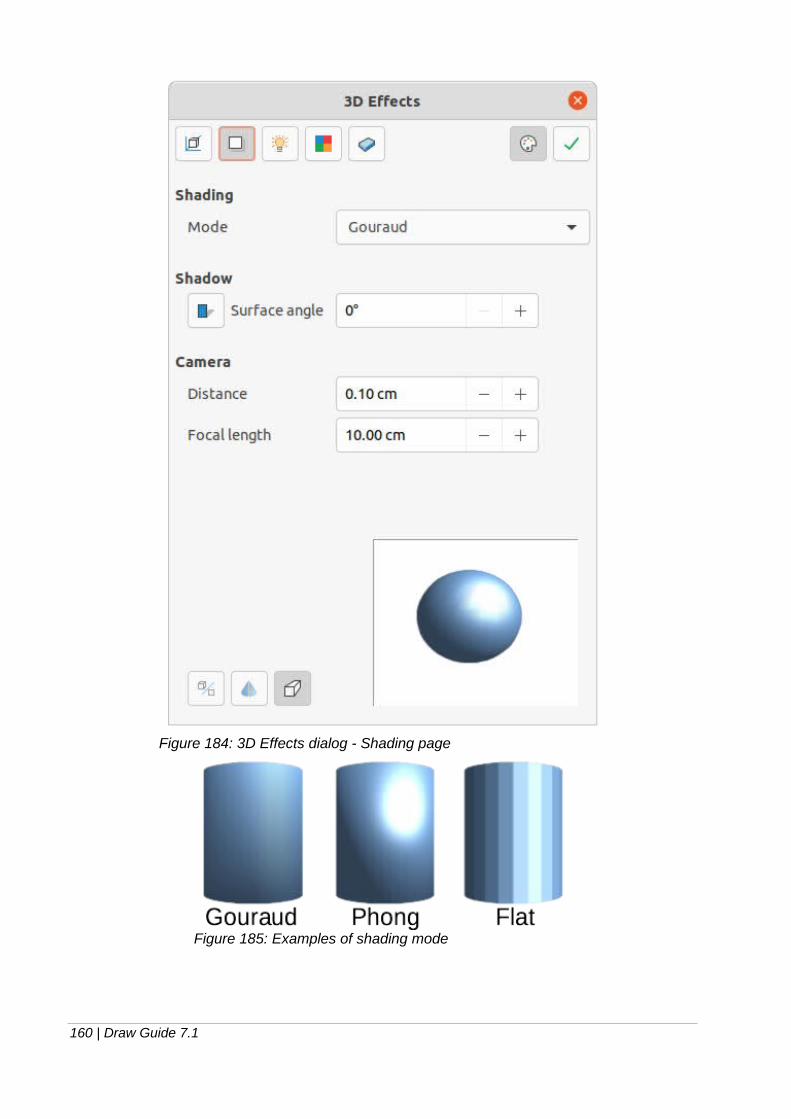
Figure 184: 3D Effects dialog - Shading page
Figure 185: Examples of shading mode
160 | Draw Guide 7.1

• Shadow – adds or removes a shadow from a selected 3D object (Figure 186). A shadow is generated only from the first light source. Enter a Surface Angle from the light source to the surface between 0 to 90 degrees to cast a shadow.
Figure 186: Examples of shadow surface angle
• Camera – sets the camera options for a selected 3D scene as if a camera is being used to take a photograph (Figure 187). The settings affect only central perspective and not parallel projection.
– Distance – enter the distance to leave between the camera and the center of the selected 3D scene. The default setting for distance is 2.6cm.
– Focal length – enter the focal length of the camera lens, where a small value corresponds to a fish-eye lens and a large value to a telephoto lens. The default setting for focal length is 10cm.
Figure 187: Example of changing camera settings
3D Effects – Illumination
The Illumination page of the 3D Effects dialog (Figure 188) defines how a 3D scene is lit and thesettings apply to all 3D objects in a scene. The direction of the light source, color of the light source, and the ambient light can be specified for the 3D scene.
By default, one light source is already selected when the Illumination page is opened. More light sources can be selected for illumination. A maximum of eight sources can be used and each lightsource can use a different color. Figure 188 shows three light sources selected with each light source having a different color.
Editing 3D objects | 161

Figure 188: 3D Effects dialog - Illumination page
1) Select a Light source to turn the light source on. The icon changes to an illuminated bulb.
2) Click again on the selected light source to adjust the color for the light source.
3) Select a color for the light from one of the color palettes in the Light source drop-down list. A different color can be used for each light source selected.
4) Select a color from one of the color palettes in the Ambient light drop-down list to set the color of the surrounding light.
5) To deselect a light source, select a light source already selected and click on it again.
The light source location and color are shown in the lower right corner of the Illumination page. The vertical slider bar adjusts the lighting angle and the horizontal slider bar rotates the light about the object. Alternatively, click on the light point and drag the light source to the required position.
162 | Draw Guide 7.1

To change the preview from a sphere to a cube, click on the small square to the right of the horizontal slider bar and below the vertical slider bar.
Each light source selected is shown as a small colored sphere in the color specified for it. The larger colored sphere indicates the active light source.
3D Effects – Textures
On the Textures page of the 3D Effects dialog (Figure 188) the properties of the surface texture can be set for a selected 3D object. Textures is only available after the area fill of a 3D object is set to Gradient, Hatching, or Bitmap. For more information on changing area fill, see Chapter 4, Changing Object Attributes.
• Type – sets the color properties of the texture.
– Black & White – converts the texture to black and white.
– Color – converts the texture to color.
Figure 189: 3D Effects dialog - Textures page
Editing 3D objects | 163

• Mode – shows or hides shading.
– Only Texture – applies the texture without shading.
– Texture and Shading – applies the texture with shading. To define the shading options for the texture, see “3D Effects – Shading” above.
– Texture, Shadow and Color – applies the texture with a shadow and color. To define the shading options for the texture, see “3D Effects – Shading” above.
• Projection X – sets the options for displaying the texture along the X axis. Only one of the three following options can be selected.
– Object-Specific – automatically adjusts the texture for best fit based on the shape and size of the object. This is the default setting except for extrusion objects.
– Parallel – applies the texture parallel to the horizontal axis and is mirrored on the rear side of the object. This is the default setting for extrusion objects.
– Circular – wraps the horizontal axis of the texture pattern around an object.
• Projection Y – sets the options for displaying the texture along the Y axis. Only one of the three following options can be selected.
– Object-Specific – automatically adjusts the texture for best fit based on the shape and size of the object. This is the default setting except for extrusion objects.
– Parallel – applies the texture parallel to the vertical axis and is mirrored on the rear side of the object. This is the default setting for extrusion objects.
– Circular – wraps the vertical axis of the texture pattern around an object.
• Filtering – filters out noise that can occur when a texture is applied to a 3D object.
– Filtering On/Off – applies a soft focus filter blurring the texture slightly to remove unwanted speckles.
3D Effects – Material
On the Materials page of the 3D Effects dialog (Figure 190) the appearance of a 3D object can be changed to represent different materials. Materials and textures can be combined with each other and it is a matter of trial and error to achieve the desired result.
• Material – assigns a color from a color palette. For custom colors, see Chapter 11, Advanced Draw Techniques for more information on creating custom colors.
– Favorites – select a material type for the selected object from the Favorites drop-downlist.
– Object color – select a color from one of the color palettes in the Object color drop-down list.
– Illumination color – select a color from one of the color palettes in the Illumination color drop-down list. This illuminates the object and brightens parts of the object whichlie in shadow making the object seem more illuminated.
• Specular – sets the light reflection properties for the selected object simulating the reflecting capacity of the surface. The position of the illuminated point is determined by the setting of the first light source.
– Color – select a color to be reflected from the object from one of the color palettes in the Color drop-down list.
– Intensity – enter the intensity of the specular effect as a percentage.
164 | Draw Guide 7.1

Figure 190: 3D Effects dialog - Materials page
• Colors Dialog – opens the Pick a Color dialog where custom colors are defined using the two-dimensional graphic and numerical gradient chart. Any colors created are stored in the custom palette. See Chapter 11, Advanced Draw Techniques for more information on creating custom colors.
Note
Metallic and glass surfaces do not simulate well because the appearance of these materials is produced using reflection.
Tip
Do not use a very high brightness value for individual colors. Colors are additive and it is easy to end up with a colored area that is white.
Editing 3D objects | 165

Combining objects
Multiple 3D objects cannot be combined using Shape > Combine on the Menu bar or the keyboard shortcut Shift+Ctrl+K. Multiple 2D objects have to be created first, then a single 3D object created as follows (see Chapter 5 Combining Multiple Objects for more information on combining objects):
1) Create multiple 2D objects and carry out all the necessary editing changes.
2) Make sure that all 2D objects are selected to create a single 3D object.
3) Create a single 3D object combining the multiple 2D objects using one of the following methods (example conversions are shown in Figure 191):
– Click on To 3D or To 3D Rotation Object on the Drawing toolbar.
– Right-click on the selected multiple 2D objects and select Convert > To 3D or To 3D Rotation Object from the context menu.
– Go to Shape > Convert > To 3D or To 3D Rotation Object on the Menu bar.
Figure 191: Example of creating single 3D object from multiple 2D objects
Assembling 3D objects
3D objects that each form a separate 3D scene can be combined or assembled into a single 3D scene. An example procedure for assembling 3D objects is as follows and shown in Figure 192:
1) Select a 3D object (for example, a cube) from 3D Objects on the Drawing toolbar or Shapes deck on the Sidebar and place it in a drawing.
2) Select a second 3D object (for example, a sphere) from 3D Objects on the Drawing toolbar or Shapes deck on the Sidebar and place it in the drawing.
3) If necessary, set the area fill to None and the lines to Continuous to create wire frame objects. This makes it easier to position both objects in the assembled 3D scene.
4) Select the second 3D object (sphere) and go to Edit > Cut on the Menu bar or right-click on the object and select Cut from the context menu.
5) Double-click the first 3D object (cube) to enter the group or go Shape > Group > Enter Group on the Menu bar.
166 | Draw Guide 7.1

Figure 192: Example of assembling 3D objects
6) Go to Edit > Paste on the Menu bar or right-click on the first 3D object and select Paste from the context menu. The sphere now appears inside the cube and is now part of the same group.
7) If required, edit the individual objects or change their position within the group.
8) Double-click outside the 3D assembled scene to exit the group, or go to Shape > Group > Exit Group on the Menu bar.
Note
The second object also reappears in its original position when Paste is carried out. This object is NOT part of the assembled 3D scene and can be deleted if necessary.
Assembling 3D objects | 167

Draw Guide
Chapter 8, Connections, Flowcharts, and Organization Charts

Connectors and glue points
Connectors and glue points were briefly introduced in Chapter 2 Drawing Basic Shapes. This section describes them in more detail and how to use them.
Connectors are lines or arrows whose ends automatically dock to a connection or glue point on the border of an object. Connectors are useful in drawings because connecting lines between objects remain connected to objects, even when objects are moved or rearranged. Also, when anobject with a connector attached is moved or resized, the connector automatically adjusts its shape to accommodate the changes.
For example, when creating flowcharts, organization chart, schematics, or diagrams, it is highly recommended to use connectors instead of simple lines. Using connectors removes the need to redraw lines between objects,
When a connector is drawn or selected, Draw displays selection handles that are different to the selection handles for normal lines or objects. The termination points of a connector are round at the start and end points of a connector, and square in the center of the lines that make up a connector, as shown by the example in Figure 193. The square selection handles on a connectorare used to change the routing of a connector where applicable.
Figure 193: Example of connectors between objects
ConnectorsDraw has a comprehensive selection of connectors to connect objects together, for example, in aflowchart or organization chart. The default set of connectors can be accessed using one of the following methods:
• Click the triangle ▼ to the right of Connectors on the Drawing toolbar. The Connectors icon changes shape depending on the last connector used.
• Select a connector from the options available in the Connectors section in the Shapes deck on the Sidebar.
If necessary, the connectors on the Drawing toolbar can be displayed as a Connectors floating toolbar as follows:
1) Click on the triangle ▼ on the right of Connectors on the Drawing toolbar.
2) Click at the top of the pop up toolbar and drag it on to the Workspace.
3) Release the mouse button and the pop up toolbar becomes the Connectors floating toolbar (Figure 194).
Figure 194: Connectors floating toolbar
Connectors and glue points | 169

Figure 195: Available connects for Connectors toolbar
Connector types
The full range of predefined connectors can be accessed by clicking on the triangle ▼ on the right of the titlebar for the Connectors toolbar and selecting Visible Buttons (Figure 195) from the context menu. Depending on the computer system being used, the connectors already installed on the toolbar are indicated either by a check mark against the name, or the connector icon is highlighted.
The connectors available fall into four type groups, as follows:
• Standard – connector name starts with Connector. Line segments run vertically and horizontally. Creates a connector with one or more 90 degree angle bends. Click on an object glue point, then drag the cursor to a glue point on another object to create a standard connector.
• Line – connector name starts with Line. Consists of a line segment with two smaller segments at the ends and draws a connector that bends near a glue point. Click on an object glue point, then drag to a glue point on another object to create a line connector. To adjust the length of the line segment between a bend point and a glue point, click on the connector and drag the bend point.
• Straight – connector name starts with Straight. Consists of a single line and draws a straight line connector. Click on an object glue point, then drag the cursor to a glue point on another object to create a straight connector.
• Curved – connector name starts with Curved. Based on Bézier curves, a curved connector bends around objects. Draws a curved line connector. Click on an object glue point, then drag the cursor to a glue point on another object to create a curved connector.
Adding connectors
1) Click on the triangle ▼ on the right of Connectors on the Drawing toolbar to open the options available for selecting connectors (Figures 194 and 195).
2) Select the type of connector required. See “Connector types” above for more information on connector types.
170 | Draw Guide 7.1

Figure 196: Example of objectglue points
3) Move the cursor over one of the objects to be connected and small crosses appear around the object edges, normally in the same position as object selection handles. These crosses are the glue points to which a connector can be attached (Figure 196). See “Glue points” on page 172 for more information on glue points.
4) Click on the required glue point to attach the start point of the connector, then click and drag the cursor to draw a connector to another object.
5) When the cursor is over a glue point of the target object release the mouse button and the connector is drawn. The connector end point is attached to the glue point.
6) The square selection handles that appear on the connector are used to adjust the path of the connector so that it does not cover any other object in its path. See “Modifying connectors” below on how to change the connector route to avoid any objects the connector crosses over.
Note
The end point of a connector can be positioned in an empty part of a document. When the mouse button is released, the unattached end point of the connector is locked into place until it is moved to a different location.
Note
The start and end points of a connector cannot be swapped, that is the start point becomes the end point and the end point becomes the start point. To swap the end points of a connector, a new connector has to be drawn in the opposite direction.
Modifying connectors
To detach or reposition a connector, click and drag either round end point of a connector line to a different location. See the example in Figure 193 on page 169 for an example of round end points.
To change the connector route between objects so that the connector does not overlap any objects on the route, click on a square control point on the connector line and drag it to a new position. See the example in Figure 193 on page 169 for an example of square control points.
To modify a connector, right-click on the connector and select Connector from the context menu to open the Connector dialog (Figure 197). Use this dialog to change connector type and its properties.
• Type – select the connector type from the drop-down list. See “Connector types” on page 170 for more information.
Connectors and glue points | 171

Figure 197: Connector dialog
• Line skew – defines the skew of a connector line. The dialog preview displays the result of any changes.
• Line spacing – sets the spacing around a connector.
– Begin horizontal – enter the amount of horizontal space required at the beginning of a connector.
– Begin vertical – enter the amount of vertical space required at the beginning of a connector.
– End horizontal – enter the amount of horizontal space required at the end of a connector.
– End vertical – enter the amount of vertical space required at the end of a connector
• Preview box – displays a preview of objects and connectors being used. A left click zooms in on the preview and a right-click zooms out.
Glue pointsGlue points are not the same as object selection handles. The selection handles are for moving or changing the shape of an object (see Chapter 3, Working with Objects for more information). Glue points are used to fix or glue a connector to an object so that when the object moves, the connector stays fixed to that object.
All objects have glue points, which are not normally displayed and only become visible when one of the following methods is used, Figure 196 on page 171 shows an example of glue points visible on an object after a connector has been selected.
• Connectors is selected on the Drawing toolbar. The Connectors icon displayed on the Drawing toolbar is the connector type that had been previously used.
• A connector type is selected in the Connectors section in the Shapes deck on the Sidebar.
172 | Draw Guide 7.1

Figure 198: Glue Points toolbar
To add, customize or delete glue points to an object, go to View > Toolbars > Glue Points on the Menu bar to activate the Glue Points toolbar (Figure 198). This toolbar only becomes visible after using one of the following methods:
• Click on Show Glue Point Functions on the Standard or Drawing toolbars.
• Select Edit > Glue Points on the Menu bar.
Note
Show Glue Point Functions on the Drawing toolbar is not part of the default set of tools for the Drawing toolbar. To add this tool, right-click in an empty area on the Drawing toolbar and select Visible Buttons > Glue Points from the context menu.
Glue point types
When the Glue Points toolbar opens, only the five tools on the left of Glue Point Relative are active. The remaining six tools on the right of the toolbar only become active when Glue Point Relative is deselected.
• Insert Glue Point – inserts a glue point at the cursor position in an object when the mouse button is clicked.
• Exit Direction Left – connector attaches to the left edge of the selected glue point.
• Exit Direction Top – connector attaches to the top edge of the selected glue point.
• Exit Direction Right – connector attaches to the right edge of the selected glue point.
• Exit Direction Bottom – connector attaches to the bottom edge of the selected glue point.
• Glue Point Relative – when selected, the glue point moves when the object is resized maintaining its position relative to the object borders. When deselected, a glue point can be repositioned after the object is resized. This tool is selected by default when the Glue Point toolbar opens. The following six tools only become active when Glue Point Relative is deselected.
• Glue Point Horizontal Left – when the object is resized, the selected glue point remainsfixed at the left edge of the object.
• Glue Point Horizontal Center – when the object is resized, the selected glue point remains fixed at the center of the object.
• Glue Point Horizontal Right – when the object is resized, the selected glue point remains fixed at the right edge of the object.
• Glue Point Vertical Top – when the object is resized, the selected glue point remains fixed at the top edge of the object.
• Glue Point Vertical Center – when the object is resized, the selected glue point remainsfixed at the vertical center of the object.
• Glue Point Vertical Bottom – when the object is resized, the selected glue point remains fixed at the bottom edge of the object.
Connectors and glue points | 173

Note
Each glue point added to an object can have only one horizontal position and one vertical position. Only one of the horizontal position tools and one of the vertical position tools can be selected and used at any one time.
Adding glue points
By default, most objects normally have four glue points as shown in the example in Figure 196 onpage 171. Add additional glue points to an object as follows:
1) Go to View > Toolbars > Glue Points on the Menu bar to activate the Glue Points toolbar.
2) Make sure no objects are selected and use one of the following methods to open the GluePoints toolbar:
– Click on Show Glue Point Functions on the Standard or Drawing toolbars.
– Select Edit > Glue Points on the Menu bar.
3) Select the object, then click on Insert Glue Point on the Glue Points toolbar.
4) Move the cursor to the required position on the selected object and the cursor changes shape to a cross (depending on the computer setup).
5) Click once to add a glue point. To add more glue points, move the cursor to a new position and click.
6) When finished adding glue points, move the cursor off the selected object and click in an empty space to deselect the object.
7) Alternatively, right-click on a glue point previously added to the object and select Insert Glue Point from the context menu, then click and drag the new glue point to the required position.
8) Select the type of glue point required from the options available on the Glue Points toolbar. See “Glue point types” above for more information.
Note
When an object has no fill, a glue point can only be added to the border of an empty object.
Tip
When adding, moving or customizing glue points, it is recommended to use the zoomfunction to make it easier to work with glue points. See Chapter 3, Working with Objects for more information. Also, glue points snap to the grid making it easier to position a glue point.
Customizing glue points
Only glue points that have been added to an object can be customized. The default glue points included with an object cannot be customized.
Customize the exit direction for a glue point that has been added to an object as follows:
1) Go to View > Toolbars > Glue Points on the Menu bar to activate the Glue Points toolbar.
2) Open the Glue Points toolbar:
174 | Draw Guide 7.1
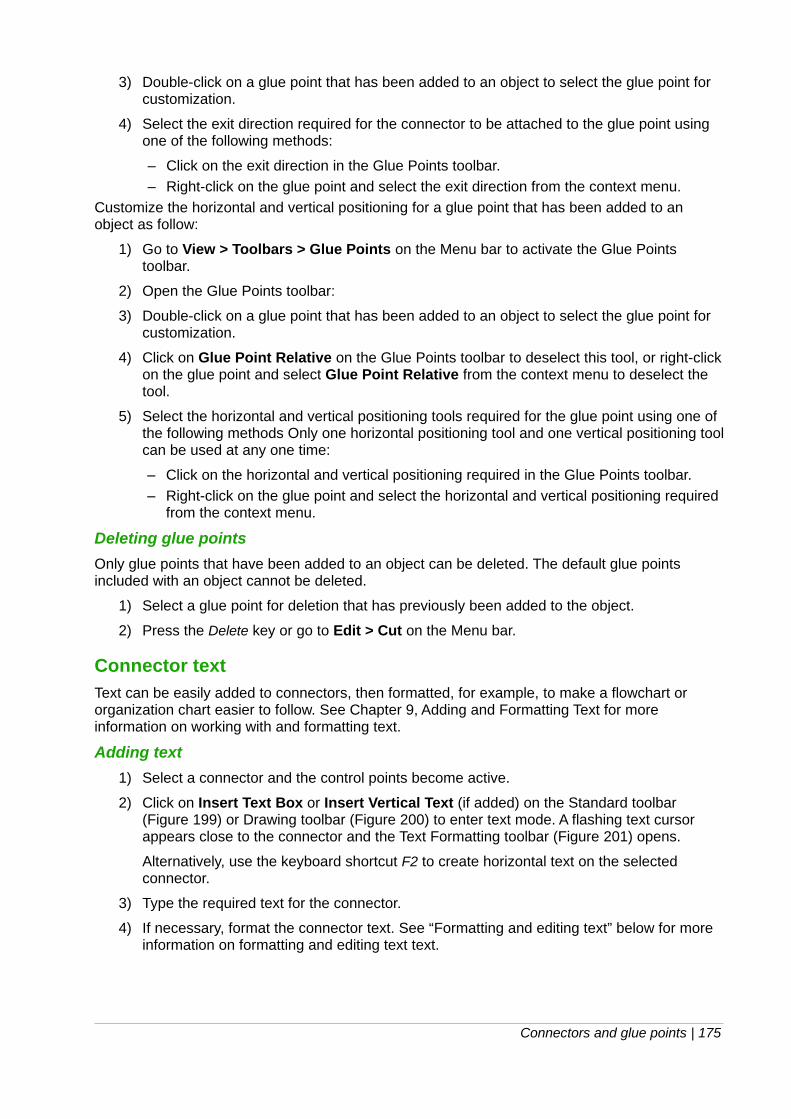
3) Double-click on a glue point that has been added to an object to select the glue point for customization.
4) Select the exit direction required for the connector to be attached to the glue point using one of the following methods:
– Click on the exit direction in the Glue Points toolbar.
– Right-click on the glue point and select the exit direction from the context menu.
Customize the horizontal and vertical positioning for a glue point that has been added to an object as follow:
1) Go to View > Toolbars > Glue Points on the Menu bar to activate the Glue Points toolbar.
2) Open the Glue Points toolbar:
3) Double-click on a glue point that has been added to an object to select the glue point for customization.
4) Click on Glue Point Relative on the Glue Points toolbar to deselect this tool, or right-clickon the glue point and select Glue Point Relative from the context menu to deselect the tool.
5) Select the horizontal and vertical positioning tools required for the glue point using one of the following methods Only one horizontal positioning tool and one vertical positioning toolcan be used at any one time:
– Click on the horizontal and vertical positioning required in the Glue Points toolbar.
– Right-click on the glue point and select the horizontal and vertical positioning required from the context menu.
Deleting glue points
Only glue points that have been added to an object can be deleted. The default glue points included with an object cannot be deleted.
1) Select a glue point for deletion that has previously been added to the object.
2) Press the Delete key or go to Edit > Cut on the Menu bar.
Connector textText can be easily added to connectors, then formatted, for example, to make a flowchart or organization chart easier to follow. See Chapter 9, Adding and Formatting Text for more information on working with and formatting text.
Adding text
1) Select a connector and the control points become active.
2) Click on Insert Text Box or Insert Vertical Text (if added) on the Standard toolbar (Figure 199) or Drawing toolbar (Figure 200) to enter text mode. A flashing text cursor appears close to the connector and the Text Formatting toolbar (Figure 201) opens.
Alternatively, use the keyboard shortcut F2 to create horizontal text on the selected connector.
3) Type the required text for the connector.
4) If necessary, format the connector text. See “Formatting and editing text” below for more information on formatting and editing text text.
Connectors and glue points | 175

Figure 199: Standard toolbar with Insert Vertical Text added
Figure 200: Drawing toolbar with Insert Vertical Text added
Figure 201: Text Formatting toolbar
5) When adding and formatting text is complete, move the cursor away from the text and connector, then click to end text mode. This also closes the Text Formatting toolbar.
Note
In the default installation of LibreOffice, the Insert Vertical Text tool is not included on the Standard or Drawing toolbars. To add Insert Vertical Text to the toolbar, right-click in an empty area in either toolbar, go to Visible Buttons and select Vertical Text from the context menu.
Figure 202: Text dialog
176 | Draw Guide 7.1

Figure 203: Text dialog - Text Animation page
Formatting and editing text
1) Select a connector with text added and activate the control points to enter text mode. See“Adding text” above for more information on adding text to a connector.
2) Use the tools available on the Text Formatting toolbar or the options available in Format >Text on the Menu bar to format the text.
3) Right-click on the connector text and select Text from the context menu to open the Text dialog (Figure 202) and change how the text appears next to the connector. The options available are as follows:
– Drawing Object Text – Fit to frame – resizes the text to fit the entire area of a connector rectangle or frame.
– Drawing Object Text – Adjust to contour – adapts the text flow so that it matches the contours of the selected connector.
– Spacing to Borders – specify the amount of space to leave between the connector and the borders of the text.
– Text Anchor – select one of nine positions to anchor the text within the connector rectangle.
– Full width – anchors the text to the full width of the connector rectangle. When selected, the top, middle and bottom center positions can be used for to anchor the text.
4) If required, click on Text Animation to open the Text Animation page (Figure 203) and access options to animate the text. However, this is not recommended unless the drawingis going to be displayed as part of a presentation. See the Impress Guide for more information on text animation.
Connectors and glue points | 177

5) Click OK to save the changes to text attributes and close the Text dialog.
6) Move the cursor away from text and connector, then click to end the text mode. This also closes the Text Formatting toolbar.
Flowcharts
For drawing flowcharts (also known as flow diagrams), Draw has a floating Flowchart toolbar (Figure 204) that includes a large selection of flowchart tools to create a flowchart.
1) Click on the triangle ▼ to the right of Flowchart on the Drawing toolbar to open a Flowchart pop up menu. Note that the Flowchart icon changes shape depending on the last flowchart tool used.
2) Click at the top of the Flowchart pop-up menu and drag it into the Workspace.
3) Release the mouse button and the pop-up menu becomes a floating Flowchart toolbar.
Recommended basic steps to follow when creating a flowchart:
• When adding objects or flowchart shapes to a flowchart, see Chapter 2, Drawing Basic Shapes for information on how to draw and resize object shapes.
• Add text to each flowchart shape to make it easily identified in the flowchart. See Chapter2, Drawing Basic Shapes and Chapter 11, Advanced Draw Techniques for more information.
• Use connector lines in a flowchart. This allows repositioning of an object in a flowchart while maintaining connections with the other objects in the flowchart. See “Connectors and glue points” on page 169 for more information.
• Use the zoom, grid, and snap functions to help in positioning objects in a flowchart. See Chapter 3, Working with Objects for more information.
• Use the alignment and distribution functions to give a flowchart a more professional look. See Chapter 5, Combining Multiple Objects for more information.
• Duplicate objects when more than one of the same shape and size is required. See Chapter 5, Combining Multiple Objects for more information.
Figure 204: Flowchart toolbar and available flowchart shapes
178 | Draw Guide 7.1
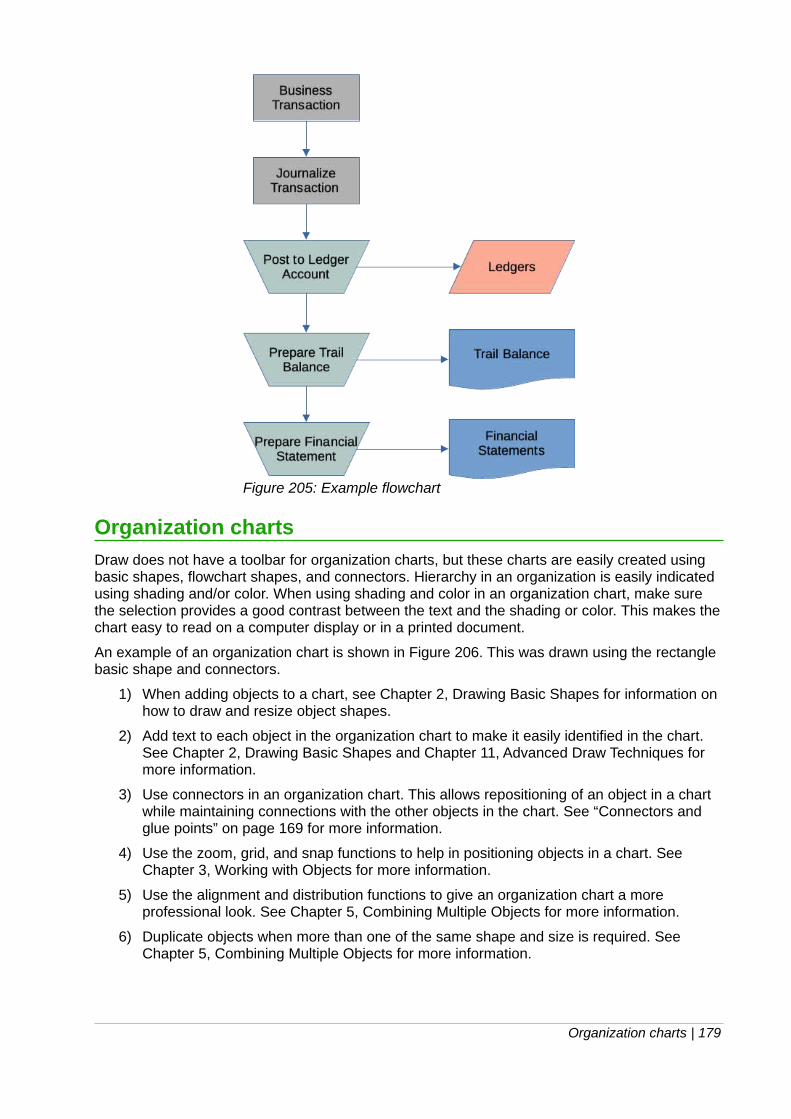
Figure 205: Example flowchart
Organization charts
Draw does not have a toolbar for organization charts, but these charts are easily created using basic shapes, flowchart shapes, and connectors. Hierarchy in an organization is easily indicated using shading and/or color. When using shading and color in an organization chart, make sure the selection provides a good contrast between the text and the shading or color. This makes thechart easy to read on a computer display or in a printed document.
An example of an organization chart is shown in Figure 206. This was drawn using the rectangle basic shape and connectors.
1) When adding objects to a chart, see Chapter 2, Drawing Basic Shapes for information on how to draw and resize object shapes.
2) Add text to each object in the organization chart to make it easily identified in the chart. See Chapter 2, Drawing Basic Shapes and Chapter 11, Advanced Draw Techniques for more information.
3) Use connectors in an organization chart. This allows repositioning of an object in a chart while maintaining connections with the other objects in the chart. See “Connectors and glue points” on page 169 for more information.
4) Use the zoom, grid, and snap functions to help in positioning objects in a chart. See Chapter 3, Working with Objects for more information.
5) Use the alignment and distribution functions to give an organization chart a more professional look. See Chapter 5, Combining Multiple Objects for more information.
6) Duplicate objects when more than one of the same shape and size is required. See Chapter 5, Combining Multiple Objects for more information.
Organization charts | 179

Figure 206: Example of an organization chart
180 | Draw Guide 7.1

Draw Guide
Chapter 9, Adding and Formatting Text

Introduction
When text is used in drawings, it is placed inside an object or inside a text box. This chapter describes how to create, format, use, and delete text. It also discusses the various types of text that can be inserted into a drawing. Finally, it provides information on how to insert special forms of text such as numbered or bulleted lists, tables, fields, hyperlinks, and Fontwork.
Text mode
Before any text can be typed in a drawing, text mode has to be activated using one of the following methods. The Text Formatting toolbar (Figure 207) automatically opens replacing the Line and Filling toolbar.
• For horizontal text only, go to Insert > Text Box on the Menu bar.
• For horizontal text only, use the keyboard shortcut F2.
• Click on Insert Text Box for horizontal text or Insert Vertical Text for vertical text on the Standard toolbar (Figure 208) or Drawing toolbar (Figure 209).
If Insert Vertical Text is not visible on the Standard or Drawing toolbars, it can be added to the toolbar as follows:
1) Go to Tools > Options > Language Settings > Languages on the Menu bar to open theLanguages page in the Options dialog.
Figure 207: Text Formatting toolbar
Figure 208: Standard toolbar with Insert Vertical Text added
Figure 209: Drawing toolbar with Insert Vertical Text added
182 | Draw Guide 7.1

2) In Default Languages for Documents, select the option Asian. Accept the default settings for this option.
3) Click OK to close the Options dialog and save the changes.
4) Right-click in an empty area on the Standard or Drawing toolbar and select Visible Buttons from the context menu.
5) Select Vertical Text from the drop-down list of options to add Insert Vertical Text to the Standard or Drawing toolbar.
Text boxes
Creating text boxesWhen text is added to a drawing, a text box is automatically created to contain the text. By default, the text box expands horizontally to accommodate a single line of horizontal text, or expands vertically to accommodate a single line of vertical text.
1) Activate text mode, see “Text mode” above.
2) Click at the approximate position in the drawing where the text box is to be placed. A text box is created containing a flashing text cursor.
3) Type or paste the text into the text box and the text box expands either horizontally or vertically to accommodate a single line of text. Also, the left corner of the Status Bar indicates text edit mode and the position of the text cursor (Figure 210).
4) To create multiple lines in the text box, use one of the following methods:
– Use the Enter key to create single line paragraphs inside the text box. The text box expands to accommodate more lines of text.
– Before typing text, click and drag the text cursor creating a text box with the approximate dimensions required. As the limits of the text box are reached, the text automatically word wraps inside the text box and the text box expands as it fills.
5) When creating or pasting text is complete, click outside the text box to exit text mode. TheText Formatting toolbar automatically closes.
6) Move, resize, rotate or format the text box as required. For more information, see the following sections and Chapter 3, Working with Objects.
7) If necessary, format the text using the various tools on the Text Formatting toolbar or in the various sections on the Sidebar. For more information on text formatting, see “Formatting text” on page 190.
Figure 210: Text information in Status Bar
Text boxes | 183
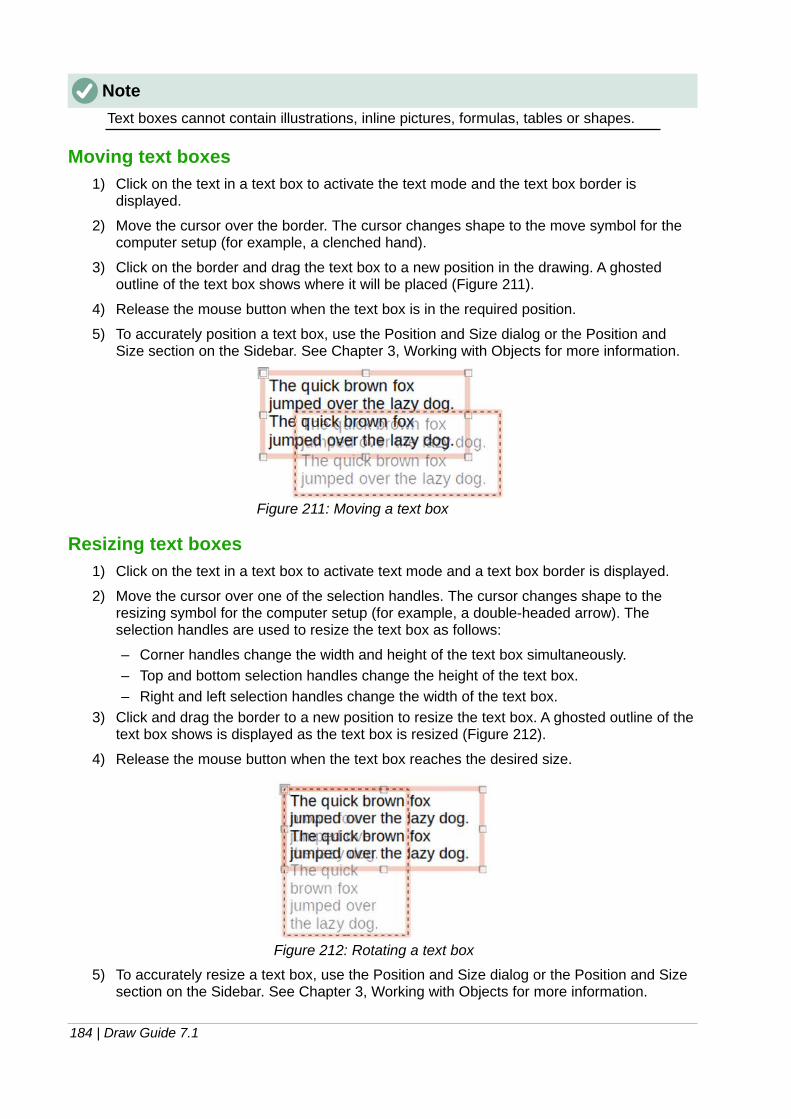
Note
Text boxes cannot contain illustrations, inline pictures, formulas, tables or shapes.
Moving text boxes1) Click on the text in a text box to activate the text mode and the text box border is
displayed.
2) Move the cursor over the border. The cursor changes shape to the move symbol for the computer setup (for example, a clenched hand).
3) Click on the border and drag the text box to a new position in the drawing. A ghosted outline of the text box shows where it will be placed (Figure 211).
4) Release the mouse button when the text box is in the required position.
5) To accurately position a text box, use the Position and Size dialog or the Position and Size section on the Sidebar. See Chapter 3, Working with Objects for more information.
Figure 211: Moving a text box
Resizing text boxes1) Click on the text in a text box to activate text mode and a text box border is displayed.
2) Move the cursor over one of the selection handles. The cursor changes shape to the resizing symbol for the computer setup (for example, a double-headed arrow). The selection handles are used to resize the text box as follows:
– Corner handles change the width and height of the text box simultaneously.
– Top and bottom selection handles change the height of the text box.
– Right and left selection handles change the width of the text box.
3) Click and drag the border to a new position to resize the text box. A ghosted outline of thetext box shows is displayed as the text box is resized (Figure 212).
4) Release the mouse button when the text box reaches the desired size.
Figure 212: Rotating a text box
5) To accurately resize a text box, use the Position and Size dialog or the Position and Size section on the Sidebar. See Chapter 3, Working with Objects for more information.
184 | Draw Guide 7.1

Note
To maintain the proportions of a text box while resizing, press and hold the Shift key, then click and drag a selection handle. Make sure to release the mouse button before releasing the Shift key.
Rotating text boxes1) Click on the text in a text box to activate text mode and a text box border is displayed.
2) Click on the text box border so that the selection handles are visible indicating that the text box is now in edit mode.
3) Click again on the text border and the selection handles change shape and color.
4) Click on a corner selection handle and drag to rotate the text box. A ghosted outline of thetext box being rotated appears and the current angle of rotation is shown in the status bar(Figure 213).
5) Release the mouse button when the text box is at the desired rotation angle.
6) To accurately rotate a text box, use the Rotation page in Position and Size dialog or the Position and Size section on the Sidebar. See Chapter 3, Working with Objects for more information.
Figure 213: Rotating text box
Note
When in rotation mode, the top, bottom, and side selection handles, though visible, are not available for use for rotating a text box. Also, text boxes cannot be sheared, slanted, flipped vertically, or flipped horizontally.
Formatting text boxesText boxes can be treated just like other basic shapes in a drawing when formatting the area fill or borders of a box. See Chapter 3, Working with Objects for more information on formatting the area fill or borders of a text box.
To format how text appears inside a text box:
1) Select a text box and use one of the following methods to open the Text dialog (Figure 214).
– Right-click on the text box and select Text Attributes from the context menu.
– Go to Format > Text Attributes on the Menu bar.
Text boxes | 185

Figure 214: Text dialog - Text page
2) Click on Text in the Text dialog to open the Text page and access to the formatting options:
– Drawing Object Text – Fit width to text – expands the width of the text box to the length of the text, if the text box is smaller than the text.
– Drawing Object Text – Fit height to text – expands the height of the text box to the height of the text, if the text box is smaller than the text.
– Drawing Object Text – Fit to frame – resizes (distorts) the text to fit the entire area ofthe text box. This option is not available if Fit width to text and/or Fit height to text options are selected.
– Spacing to Borders – specify the amount of space to leave between the text and the borders of the text box.
– Text Anchor – select one of nine positions to anchor the text within the text box.
– Full width – anchors the text to the full width of the text box. When selected, the top, middle or bottom center positions in Text Anchor are used to anchor the text.
3) If required, click on Text Animation to open the Text Animation page (Figure 215) to access options for animating the text. However, this is not recommended unless the drawing is going to be displayed as part of a presentation. See the Impress Guide for more information on text animation.
186 | Draw Guide 7.1

Figure 215: Text dialog - Text Animation page
4) Click OK to save the changes to text attributes and close the Text dialog.
5) Move the cursor away from the text box, then click to end the text mode.
Deleting text boxes1) Click on the text box so that the selection handles are visible indicating that the text box is
in edit mode.
2) Press the Delete or Backspace key. The text box is deleted without any warning.
Text in Draw objects
Text can be added to most Draw objects. The exceptions are control elements, for example buttons, polygons, curves, or 3D objects.
By default, an object is not dynamic when it is first created in Draw and does not behave like a text box. Text does not word wrap inside an object. To keep text within the borders of an object, use paragraphs, line breaks, smaller text size, increasing object size, or a combination of all four methods.
An example of adding text into a Draw object (Figure 216) and then using word wrap on the text is as follows:
1) Create an object in a drawing and make sure the object is selected with the selection handles displayed.
Text in Draw objects | 187

2) Enter text mode on the selected object using one of the following methods:
– Click on Insert Text Box for horizontal text or Insert Vertical Text for vertical text on the Standard or Drawing toolbar.
– For horizontal text, double-click on the selected object.
– For vertical text, double-click on the selected object and click on Insert Vertical Text on the Standard or Drawing toolbar.
3) Start typing the text into the selected object. If the text goes outside the object borders, use paragraphs, line breaks, smaller text size, increasing the object size, or a combination of all four methods to keep the text within the object borders.
Figure 216: Example of using word wrap
Figure 217: Text dialog for text attributes in an object
188 | Draw Guide 7.1

4) Alternatively, to make sure the text word wraps and stays within the borders of an object, proceed as follows:
a) Right-click on the text inside the object and select Text Attributes from the context menu to open the Text dialog for text attributes (Figure 217).
b) Click on Text to open the Text page.
c) In Custom Shape Text, select the option Word wrap text in shape.
d) Click OK to close the Text dialog and save the changes.
e) When finished typing text, click outside the object to cancel text mode and save the changes. The text inside the object now word wraps, as shown in Figure 216.
5) If necessary, format the text inside the object using the various formatting tools that are available. For more information, see “Formatting text” on page 190.
Pasting text
Text may be inserted into a text box or object by copying text from another document and pastinginto a drawing. However, pasted text retains the formatting from the source document and may not match the formatting of the text that has already been used on a drawing. This may match the text format in a drawing on some occasions, but, in most cases, it is better to make sure that text format is consistent throughout a drawing.
Note
If copied text is pasted directly into a drawing and not into an object using Format > Paste on the Menu bar or the keyboard shortcut Ctrl+V, the text is pasted as an OLEobject and not as a Draw object. It is recommended to paste text into Draw as unformatted text to create a text object in Draw.
It is good practice to paste text without formatting and apply the formatting later so it matches thetext already in a drawing.
Figure 218: Paste Special dialog
Pasting text | 189

1) Copy the text and paste it as unformatted text into a drawing using one of the following methods:
– Go to Edit > Paste Special > Paste Unformatted Text on the Menu bar.
– Go to Edit > Paste Special > Paste Special on the Menu bar and the Paste Special dialog (Figure 218) opens. Select the option Unformatted text and click OK to close the dialog.
– Use the keyboard shortcut Control+Shift+V and the Paste Special dialog opens. Selectthe option Unformatted text and click OK to close the dialog.
– Click on the small triangle ▼ on the right of Paste on the Standard toolbar and select Unformatted text from the context menu.
2) The unformatted text is pasted into a text box at the cursor position or inside a selected object and formatted to the default drawing style. Format the pasted text to the drawing requirements or apply a drawing style. For more information, see “Formatting text” below.
Formatting text
Text formatting can give a drawing a more consistent and professional look without any distracting elements. Text formatting tools are available on the Text Formatting toolbar and the drop-down menus in Format on the Menu bar. For more information on text formatting, see the Writer Guide.
If there are several text boxes and/or objects in a drawing that require the same text formatting, then it is recommended to use drawing styles. For more information on using and creating styles,see Chapter 4, Changing Object Attributes.
Quick font resizingAfter selecting text, the font size can be quickly increased or decreased using the tools Increase Font Size (Ctrl+]) and Decrease Font Size (Ctrl+[) on the Text Formatting toolbar. The amount by which the font size changes depends on the standard sizes available for the font in use.
Selecting textText must be selected before it can be formatted using one of the following methods. Any formatting changes apply only to the selected text.
• To format all the text in a text box or object, click once on the border of the text box or object to display the selection handles. Any formatting changes then apply to all text in the text box or object.
• To format only part of the text, select text using one of the following methods:
– Click in the text and drag the cursor over the text to highlight the text.
– Double-click on text to select a complete word or triple-click to select a whole paragraph.
– Click in the text, then press and hold the Shift key and use the keyboard arrow keys toselect text.
Text formattingDirect or manual text formatting can be applied directly to characters, words, sentences, and paragraphs. Direct formatting overrides any formatting that has been applied to text when using styles.
1) Select the text for formatting.
190 | Draw Guide 7.1

2) Format the selected text using one of the following methods:
– Various formatting tools on the Text Formatting toolbar.
– Go to Format on the Menu bar and select a formatting option from the drop-down menu. Selecting a formatting option opens either a context menu or a dialog providingfurther formatting options to apply to the selected text.
– Use the options in the Paragraph and Character dialogs.
– Use the options in the Paragraph and Character sections in the Properties deck on the Sidebar.
3) Click outside the text box or object to deselect the text.
Paragraph dialogThe Paragraph dialog (Figure 219) is used to format paragraphs of text.
1) Click anywhere in the paragraph that is to be formatted.
2) Use one of the following methods to open the Paragraph dialog.
– Right-click on the selected text and select Paragraph from the context menu.
– Go to Format > Paragraph on the Menu bar.
3) Use the various options on the tabbed pages of the Paragraph dialog to format the text.
4) Click OK to save the changes and close the Paragraph dialog.
5) Click outside the text box or object to deselect the text.
Figure 219: Paragraph dialog - Indents & Spacing page
Formatting text | 191

Indents and spacing options
The Indents & Spacing page (Figure 219) in the Paragraph dialog has three main sections:
• Indent – specifies the amount of space to leave between the left and the right page margins and the paragraph.
– Before text – enter the amount of space required to indent the paragraph from the page margin. If the paragraph is to extend into the page margin, enter a negative number.
– After text – enter the amount of space required to indent the paragraph from the page margin. If the paragraph is to extend into the page margin, enter a negative number.
– First line – indents the first line of a paragraph by the amount entered. To create a negative hanging indent enter a positive value for Before text and a negative value forFirst line. To create a positive hanging indent enter a positive value for Before text anda larger positive value for First line.
– Automatic – when selected, automatically indents a paragraph according to the font size and the line spacing. The setting value for First line is ignored.
• Spacing – specifies the amount of space to leave between paragraphs.
– Above paragraph – enter the amount of space required above a paragraph.
– Below paragraph – enter the amount of space required below a paragraph.
– Do not add space between paragraphs of the same style – when selected, only the spacing below a paragraph is applied when the preceding and following paragraphs are of the same paragraph style.
• Line spacing – specifies the amount of space to leave between lines of text in a paragraph. The options available from the drop-down list are as follows:
– Single – applies single line spacing to a paragraph. This is the default setting.
– 1.15 Lines – sets the line spacing to 1.15 lines.
– 1.5 Lines – sets the line spacing to 1.5 lines.
– Double – sets the line spacing to two lines.
– Proportional – select this option and then enter a percentage value in the box, where 100% corresponds to single line spacing.
– At Least – sets the minimum line spacing to the value entered in the box. If different font sizes are used within a paragraph, the line spacing is automatically adjusted to the largest font size. If identical spacing is required for all lines, specify a value that corresponds to the largest font size.
– Leading – sets the vertical space height that is inserted between two lines.
– Fixed – enter a fixed value to be used for line spacing.
Tip
Setting the line spacing to less than 100% is a good method to place a lot of text into a text box or object when space is limited. However, care must be taken as too small a value will make the text hard to read.
Tip
Change the default unit of measurement in Tools > Options > LibreOffice Impress > General on the Menu bar.
192 | Draw Guide 7.1

Figure 220: Paragraph dialog - Asian Typography page
Asian Typography options
The Asian Typography page (Figure 220) is only available when Asian options are enabled in Tools > Options > Language Settings > Languages on the Menu bar. The Line Change options are as follows:
• Apply list of forbidden characters to the beginning and end of lines – prevents the characters in the list from starting or ending a line. The characters are relocated to either the previous line or the next line. To edit the list of restricted characters that start or end aline, go to Tools > Options > LibreOffice > Language Settings > Asian Layout on the Menu bar.
• Allow hanging punctuation – prevents commas and periods from breaking the line. Instead, these characters are added to the end of the line, even in the page margin.
• Apply spacing between Asian and non-Asian text – inserts a space between Asian and non-Asian characters.
Tab options
Use the Tabs page (Figure 221) to create, edit, or delete the tab stops in a text box or object. Theoptions are as follow:
• Position – enter a measurement in the text box to set the position of a tab in a text box. Any tabs already created are listed in the preview box below the measurement setting.
• Type – determines the type of tab used.
– Left – aligns the left edge of the text to the tab stop and extends the text to the right. IfAsian language support is enabled in LibreOffice Preferences, this tab stop is called Left/Top.
– Right – aligns the right edge of the text to the tab stop and extends the text to the left of the tab stop. If Asian language support is enabled in LibreOffice Preferences, this tab stop is called Right/Bottom.
– Centered – aligns the center of the text to the tab stop.
– Decimal – aligns the decimal point of a number to the center of the tab stop. The numbers to the left of the decimal point are aligned to the left of the tab. The numbers to the right of the decimal point are aligned to the right of the tab.
– Character – enter a character to use as a decimal separator when using decimal tabs.
• Fill character – specifies the type of character inserted between the tab insertion point and the tab stop.
– None – no fill characters are inserted between the tab insertion point and the tab stop.It also removes any existing fill characters between the tab insertion point and the tab stop.
Formatting text | 193

Figure 221: Paragraph dialog - Tabs page
– Dots...... – inserts dots between the tab insertion point and the tab stop.
– Dashes----- – inserts dashes between the tab insertion point and the tab stop.
– Line______ – draws a line between the tab insertion point and the tab stop.
– Character – specify a character for insertion between the tab insertion point and the tab stop.
Creating tabs
1) Select the text box so that the selection handles on the text box border or object are displayed.
2) Right-click on the selected text box or object and select Paragraph from the context menu or go to Format > Paragraph on the Menu bar to open the Paragraph dialog.
3) Click on Tabs to open the Tabs page in the Paragraph dialog.
4) Enter the position measurement for the tab stop in the Position text box.
5) Select the type of tab from the options in Type.
Note
If the type is set to Decimal, the default character used is the character used for decimal points in the computer setup. If required, specify the character to be used asthe decimal point In Character box.
6) Select the type of Fill Character. The fill character is inserted between the tab insertion point and the tab stop.
7) Click on New to create the new tab stop in the text box. The new tab stop appears in the Position preview box.
8) Click OK to save the changes and close the dialog.
9) To use the new tab stop in more than one text paragraph in a text box or object:
– Modify or update the drawing style used for the text.
– Create a custom drawing style and apply it to the text.
Editing tabs
1) Select the text box so that the selection handles on the text box border or object are displayed.
2) Right-click on the selected text box or object and select Paragraph from the context menu or go to Format > Paragraph on the Menu bar to open the Paragraph dialog.
194 | Draw Guide 7.1

3) Click on Tabs to open the Tabs page in the Paragraph dialog.
4) Select the tab for editing in the Position preview box.
5) To change the tab position, delete the selected tab first, then create a new tab with the changes required.
6) Select the Type and Fill Character required for the selected tab stop.
7) Click OK to save the changes and close the dialog.
8) If necessary, update the drawing style used for the text.
Deleting tabs
1) Select the text box so that the selection handles on the text box border or object are displayed.
2) Right-click on the selected text box or object and select Paragraph from the context menu or go to Format > Paragraph on the Menu bar to open the Paragraph dialog.
3) Click on Tabs to open the Tabs page in the Paragraph dialog.
4) Select the tab for deletion in the Position preview box.
5) Click on Delete to delete the selected tab, or click Delete All to delete all the tab stops that are set for the selected text box or object.
6) Click OK to save the changes and close the dialog.
Figure 222: Paragraph dialog - Alignment page
Formatting text | 195

Alignment options
Use the Alignment page (Figure 222) to determine the text alignment in text boxes or objects:
• Options
– Left – aligns text to the left margin of the text box. If Asian language support is enabled, this option is named Left/Top.
– Right – aligns text to the right margin of the text box. If Asian language support is enabled, this option is named Right/Bottom.
– Center – aligns the text to the center of in the text box.
– Justified – aligns the text to the left and to the right margins of the text box.
• Text-to-text
– Alignment – provides alignment options for oversized or undersized characters in the text relative to the rest of the text.
• Properties
– Text direction – specifies the text direction for text that uses Complex Text Layout (CTL) and is only available if this option is enabled.
• Preview field – displays a preview of how the text will appear in the text box.
Sidebar Paragraph sectionAn alternative method of formatting paragraphs is to use the Paragraph section (Figure 223) in the Properties deck on the Sidebar. The formatting options in the Paragraph section are limited, but are similar in use to the formatting options in the various pages of the Paragraph dialog. Any formatting applied to a paragraph using the Sidebar is immediate.
1) Click anywhere in the paragraph that is to be formatted.
2) On the Sidebar, click on Properties to open the Properties deck.
Figure 223: Paragraph section in Properties deck on Sidebar
196 | Draw Guide 7.1

3) If necessary, click on the expansion symbol on the left of the Paragraph title bar to open the Paragraph section.
4) Format the text using the various tools in the Paragraph section. See “Paragraph dialog” on page 191 for more information on formatting options.
5) If necessary, click on More Options on the right of the title bar to open the Paragraph dialog to format text.
The text formatting options in the Paragraph section in the Properties deck on the Sidebar are asfollows. Most of these tools are also available on the Text Formatting toolbar.
• Align Left, Align Center, Alight Right, Align Justified – determines how text is alignedto the text box or object margins.
• Left-To-Right, Right-To-Left – only available when Complex Text Layout (CTL) optionshave been selected in Tools > Options > Language Settings > Languages.
• Align Top, Center Vertically, Align Bottom – aligns text to the top, center or bottom of a text box or object. This is similar to vertical alignment of data within a table cell.
• Increase Paragraph Spacing, Decrease Paragraph Spacing – increases or decreases the spacing above and below the selected text.
• Above Paragraph Spacing, Below Paragraph Spacing – increases or decreases the spacing either above or below selected text. Enter the amount of spacing required in the text box.
• Set Line Spacing – adjust the spacing between the lines of selected text. Click on the small triangle ▼ to the right of the icon and select the type of line spacing required from the drop-down list.
• Increase Indent, Decrease Indent – each click increases or decreases the indent level of selected text by the default value for Draw. To specify indent measurements, enter a value in the Before text, After text or First line boxes.
• Hanging Indent – sets a different indent for the first line of text to the indent set for a whole paragraph of text as follows:
– Enter a negative value in the First line box to reduce the indent of the first line of text.
– Enter a positive value in the First line box to increase the indent of the first line of text.
– First click sets a negative hanging indent and a second click sets a positive hanging indent.
– This tool is only active when a Before text indent has been set for the paragraph of text.
– To remove a hanging indent, set the value in the First line box to zero.
Character formattingDirect or manual character formatting can be applied to individual characters and words. Direct character formatting overrides any formatting that has been applied using direct text formatting and drawing styles.
1) Select the characters for formatting, see “Selecting text” on page 190 for more information.
2) Format characters using one of the following methods.
– Various formatting tools on the Text Formatting toolbar. Formatting applied to character(s) is immediate.
Formatting text | 197

– Go to Format on the Menu bar. Selecting a formatting option opens either a context menu or dialog where further formatting options are selected.
– Use the options available in the Character dialog. Clicking OK on the dialog applies the formatting changes.
– Use the options available in the Character section in the Properties deck on the Sidebar. Formatting applied to character(s) is immediate.
3) Click outside the text box or object to deselect the text.
Character dialogThe Character dialog (Figure 224) is used to format individual characters.
1) Select the characters for formatting and open the Character dialog using one of the following methods:
– Right-click on the characters and select Character from the context menu.
– Go to Format > Character on the Menu bar.
Figure 224: Character dialog - Fonts page
198 | Draw Guide 7.1

2) Use the options on the tabbed pages of the Character dialog to format the selected characters.
3) Click OK to apply the formatting changes and close the dialog.
4) Click outside the text box or object to deselect the text.
Fonts options
Use the Font page (Figure 224) in the Character dialog to select the font family, typeface (Italic, Bold, and so on), size, and language. A sample of the font is displayed in the preview box in the lower part of the dialog.
If support for Asian language or Complex Text Layout (CTL) has been enabled in Tools > Options > Language Settings > Languages, then character formatting options are also available for Asian Text Font or CTL Font.
Note
The number of typefaces available depends on the font family that is selected.
Tip
When creating a drawing in multiple languages, use the language setting to create styles that only differ in the language in formatting attributes. This allows for spelling checks of all of the drawing contents without affecting appearance.
Font Effects options
The options on the Font Effects page (Figure 225) apply font color, text decoration and effects tothe selected text or characters. A sample of the font effect is displayed in the preview box in the lower part of the dialog.
• Font Color
– Font color – sets the color for the selected text. Select a color from one of the available palettes. If Automatic is selected, the text color is set to black for light backgrounds and to white for dark backgrounds.
– Transparency – sets the transparency of the selected text. Enter a value in the text box. 100% entirely transparent, 0% no transparency.
• Text Decoration
– Overlining – select the over lining style from the drop-down list and the over lining color from one of the available palettes. If Automatic is selected, the color is set to black for light backgrounds and to white for dark backgrounds.
– Strikethrough – select a strikethrough style for the selected text.
– Underlining – select the underlining style from the drop-down list and the underlining color from one of the available palettes. If Automatic is selected, the color is set to black for light backgrounds and to white for dark backgrounds.
– Individual words – when selected, any over lining or underlining is applied to words only and spaces are ignored.
• Effects
– Case – select a capitalization effect from the drop-down list.
Formatting text | 199

Figure 225: Character dialog - Font Effects page
– Relief – select a relief effect for the selected text. Embossed relief makes the characters appear as if they are raised above the page. Engraved relief makes the characters appear as if they are pressed into the page.
– Emphasis mark – select a character to display over or below the entire length of the selected text.
– Position – specifies where to display the emphasis marks. Either above the text or below the text.
Position options
The options on the Position page (Figure 226) allows setting of the position, scaling, and spacing of selected text.
• Position – sets the subscript or superscript options for a character.
– Normal – removes superscript or subscript formatting.
– Superscript – reduces the font size of the selected text and raises the text above the baseline.
200 | Draw Guide 7.1

Figure 226: Character dialog - Position page
– Subscript – reduces the font size of the selected text and lowers the text below the baseline.
– Raise/lower by – enter the amount to raise or to lower the selected text in relation to the baseline. 100% is equal to the height of the font.
– Relative font size – enter the amount to reduce the font size of the selected text.
– Automatic – sets the amount by which the selected text is automatically raised or lowered in relation to the baseline.
• Scaling
– Scale width – enter a percentage of the font width to horizontally stretch or compress the selected text.
• Spacing – specifies the spacing between individual characters.
– Character spacing – specifies the spacing between the characters of the selected text. Enter the amount to expand or condense the text in the text box or object. To increase spacing, set a positive value; to reduce spacing, set a negative value.
– Pair kerning – automatically adjusts the character spacing for specific letter combinations. Kerning is only available for certain font types and requires printer support for this option.
Highlighting options
The options on the Highlighting page (Figure 227) allows highlighting of text so that the characters are different color to the rest of the text in the text box or object.
• Colors – select a highlight color from one of the available palettes.
• Active – shows the present color of the text and the Red, Green and Blue (RGB) settingsfor the present color.
• New – shows the highlight color of the text that has been selected in Colors and the Red, Green and Blue (RGB) settings for the new color. The color can also be selected bychanging the values in the RGB boxes or using the Pick a Color dialog when Pick is selected.
Formatting text | 201

Figure 227: Character dialog - Highlighting page
Sidebar Character sectionAn alternative method of formatting text is to use the Character section (Figure 228) in the Properties deck on the Sidebar. The formatting options available in the Character section are limited, but are similar in use to the formatting options available in the various pages of the Character dialog. Most of the options are also available on the Text Formatting toolbar.
1) Select a text box or object so that the selection handles on the border are displayed.
2) On the Sidebar, click on Properties to open the Properties deck.
3) Click on the expansion symbol on the left of the Character title bar to open the Character section.
4) Format the text using the tools in the Character section. See “Character dialog” on page 198 for more information on formatting options.
5) If necessary, click on More Options on the right of the title bar to open the Character dialog to format text.
The text formatting options available in the Character section in the Properties deck on the Sidebar are as follows:
• Font Name and Font Size – select the font family and size from the drop-down lists.
• Bold and Italic – applies a bold or italic typeface to the selected text.
• Underline – underlines the selected text. Click on the small triangle ▼ to the right and select the type of underlining from the drop-down list. Click More Options at the bottom of this drop-down list to open the Character dialog.
• Strikethrough – draws a line through the selected text.
• Shadow – adds a shadow to the selected text.
202 | Draw Guide 7.1

Figure 228: Character section in Properties deck on sidebar
• Increase Font Size and Decrease Font Size – each click increases or reduces the size of the selected characters by the same amount. Actual size depends on the computer setup.
• Font Color and Highlight Color – click on the small triangle ▼ to the right of these iconsand select a color from the available palettes.
• Set Character Spacing – click on the small triangle ▼ to the right of this tool and select the type of spacing between characters required. Spacing between characters is also know as kerning. A custom value for character spacing can also be set.
• Superscript – reduces the font size of the selected text and raises the text above the baseline.
• Subscript – reduces the font size of the selected text and lowers the text below the baseline.
Bullet or numbered lists
Bulleted and numbered lists can be created in text boxes and objects. However, when creating lists in objects, please remember that Draw objects are not dynamic and do not automatically expand as a list is created.
Note
Creating bulleted or numbered lists in Draw is similar to LibreOffice Writer, but the functionality in Draw has been reduced.
Creating listsBulleted or numbered lists can be created in text boxes or Draw objects as follows:
1) Select all of the text required for a list. The Text Formatting toolbar automatically opens.
2) Create a list using one of the following methods and default settings for lists:
– Click on Toggle Bullet List or Toggle Numbered List on the Text Formatting toolbar.
– Click on Toggle Bullet List or Toggle Numbered List in the Lists section on the Properties deck of the Sidebar.
– Go to Format > Lists > Bulleted List or Numbered List on the Menu bar.
Bullet or numbered lists | 203

Figure 229: More bullet lists
Figure 230: More numbered lists
3) To change the format of the list as the list is created, click on the small triangle ▼ on the right of the list icons and select a list style from the options in the pop-up window (Figures 229 and 230).
Adjusting list item level and positionEach item in a bulleted or numbered list can have its level demoted or promoted within a list, or moved up or down in list order as follows:
1) Click on a list item to demote, promote, or move up or down.
204 | Draw Guide 7.1

Figure 231: Lists section in Properties deck on Sidebar
2) To demote a list item one level at a time, use one of the following methods:
– Use the Tab key.
– Go to Format > Lists > Demote on the Menu bar.
– Use Demote in the Lists section on the Properties deck of the Sidebar (Figure 231).
3) To promote a list item one level at a time, use one of the following methods:
– Use the key combination Shift+Tab.
– Go to Format > Lists > Promote on the Menu bar.
– Use Promote in the Lists section on the Properties deck of the Sidebar.
4) To change the position of a list item in the list order, use one of the following methods:
– Go to Format > Lists > Move Down on the Menu bar.
– Use Move Down in the Lists section on the Properties deck of the Sidebar.
5) To change the position of the list item in the list order, use one of the following methods:
– Go to Format > Lists > Move Up on the Menu bar.
– Use Move Up in the Lists section on the Properties deck of the Sidebar.
Bullets and Numbering dialogUse the Bullets and Numbering dialog (Figure 232) for more control on the format of a list. Selecttext in a text box or object and open the dialog using one of the following methods:
• Go to Format > Bullets and Numbering on the Menu bar.
• Right-click on the selected text and select Bullets and Numbering from the context menu.
• Click on More Options on the right side of Lists section in the Properties deck on the Sidebar.
• Click on More Bullets or More Numbering after clicking on the triangle ▼ on the right ofToggle Bulleted List or Toggle Numbered List on the Lists section in the Properties deck on the Sidebar (Figures 229 and230).
• Click on More Bullets or More Numbering after clicking on the triangle ▼ on the right ofToggle Bulleted List or Toggle Numbered List on the Text Formatting toolbar.
The following options are available in the Bullets and Numbering dialog.
• Level – select the level(s) required to define the formatting options for a list. The selectedlevels are highlighted in the preview.
Bullet or numbered lists | 205

Figure 232: Bullets and Numbering dialog
• Properties
– Type – select the style for the list indicator from the drop-down list. When Graphic is selected as Type, select an image from a file or the Gallery.
– Character – when Bullet is selected as Type, select the character from the Special Characters dialog that opens.
– Color – select a color for the list indicator from the palettes available.
– Start at – when a numeric style list is selected in Type, enter a starting number for the current level. Default starting number is 1.
• Separator – this option becomes available when a numeric style list is selected in Type.
– Before – enter a character or text to display in front of the number in the list. For example, to create a list that uses the style (1, enter ( in this box.
– After – enter a character or text to display behind the number in the list. For example, to create a list that uses the style A), enter ) in this box.
206 | Draw Guide 7.1

• Size
– Rel. Size – enter a percentage amount to resize the list indicator in relation to the font height of the current list.
– Width – only available when Graphic is selected as Type. Enter a width for the graphic.
– Height – only available when Graphic is selected as Type. Enter a height for the graphic.
– Keep ratio – only available when Graphic is selected as Type. Maintains the size proportions of the graphic.
• Position
– Indent – sets the indent measurement of the list point and the margin.
– Width – set the indent measurement of the between the list indicator and the text in the list point. For example, this option is useful when large numbers are used in a list.
– Relative – select this option to measure the indent value relative to the previous level and not from the margin.
– Alignment – sets the paragraph alignment for the list indicator.
• Scope
– Page – applies the changes to the drawing.
– Selection – applies the changes only to the selected text.
• Preview – displays how the list will look when changes to the format are used.
Figure 233: Table Design section in Properties deck on Sidebar
Bullet or numbered lists | 207

Figure 234: Table toolbar
Using tables
Tables are a powerful mechanism to convey structured information quickly when used in a drawing. Tables can be added directly to a drawing eliminating the need to embed a Calc spreadsheet or a Writer text table. However, in some circumstances, it makes sense to embed a spreadsheet into a drawing, especially when greater functionality is required in the table. The tables provided by Draw do have a limited functionality.
Several predefined table designs are provided in the Table Design section in the Properties deck on the Sidebar (Figure 233). The Table Design section is only available when a table is selected.
When working with tables in Draw, the Table toolbar (Figure 234) automatically opens providing tools for creating and formatting a table. The default position for the toolbar when it opens is docked at the bottom of the Workspace. If the Table toolbar does not open when a table is selected, go to View > Toolbars > Table on the Menu bar.
Inserting tablesWhen working with tables, it is useful to know the number of rows and columns required as well as the appearance. Tables are placed at the center of a drawing and cannot be placed into objects or shapes. Also, unlike text boxes and other objects, tables cannot be rotated.
1) To create and insert a table using the Insert Table dialog (Figure 235):
a) Go to Insert > Table on the Menu bar to open the Insert Table dialog.
b) Enter the number of rows and columns required.
c) Click OK to insert the table into the center of a drawing and close the dialog.
Figure 235: Insert Table dialog
208 | Draw Guide 7.1

Figure 236: Table grid
2) Alternatively, to create and insert a table using the Table grid (Figure 236):
a) Click on Table on the Standard toolbar to open the Table grid.
b) Click and drag the cursor until the required number of columns and rows are selected,
c) Click again to insert the table into the center of a drawing and close the Table grid.
d) If necessary, click on More Options to open the Insert Table dialog to select the number of rows and columns required.
3) Move the table into position by clicking on the border and dragging it to its new position.
Note
When inserting tables into a drawing, the table is created using the default style and settings already applied. Currently these defaults are hard coded in LibreOffice. The table can be formatted after insertion to the drawing requirements.
Formatting tables
Table Design section
To open and use the Table Design section in the Properties deck on the Sidebar:
1) Insert a table into a drawing) or select a table in a drawing.
2) Click on Table Design in the Properties deck on the Sidebar to open the Table Design section, or click on Table Design on the Table toolbar.
3) Select a design for the table and the types of rows and columns from the available options.
The following options for rows and columns are available in the Table Design section:
• Header row – selected by default. The first row is normally a header row and is displayedwith a different background from the rest of the table.
Using tables | 209

• Total row – if selected, changes the background of the last row to make it stand out fromother rows.
• Banded rows – selected by default. Alternate rows have different backgrounds making it easier to read data entered into the rows.
• First column – when selected, highlights the first column of the table using a darker background.
• Last column – when selected, highlights the last column of the table using a darker background.
• Banded columns – when selected, alternate columns are highlighted with dark and light colors.
Table toolbar and Menu bar formatting
When a table is selected, the Table toolbar automatically opens providing the following tools for formatting a table to the drawing requirements. The formatting tools are also available by going toFormat > Table on the Menu bar and selecting a formatting option from the submenu.
• Table – inserts a new table in a drawing using the Insert Table dialog or the Table grid. See “Inserting tables” above for more information on inserting tables.
• Border Style – changes the line style of the borders of selected cells. Click on the small triangle ▼ next to the icon to open a drop-down list and select from a range of predefinedstyles.
Alternatively, click on Table Properties, or right-click on the selected cells and select Table Properties from the context menu, or go to Format > Table > Properties on the Menu bar to open the Table Properties dialog and change the line style for table borders.
• Border Color – changes the color of the borders of selected cells. Click on the small triangle ▼ next to the icon to open a drop-down list and select a color from a range of predefined palettes or create a custom color.
Alternatively, click on Table Properties, or right-click on the selected cells and select Table Properties from the context menu, or go to Format > Table > Properties on the Menu bar to open the Table Properties dialog and change the border color.
• Borders – selects predefined border configurations for selected cells. Click on the small triangle ▼ next to the icon to open a drop-down list and select a border configuration.
Alternatively, click on Table Properties, or right-click on the selected cells and select Table Properties from the context menu, or go to Format > Table > Properties on the Menu bar to open the Table Properties dialog and change the line style for cell borders.
• Area Style/Filling – select the cells to be filled, then select the type of fill from the drop-down list: None, Color, Gradient, Hatching, Bitmap or Pattern. The drop-down menu for fill options changes to show the fillings for each area type.
Alternatively, click on Table Properties, or right-click on the selected cells and select Table Properties from the context menu, or go to Format > Table > Properties on the Menu bar to open the Table Properties dialog and change the background area style/filling.
• Merge Cells – merges the selected cells into one cell. Note that the contents of the merged cells are also merged.
Alternatively, right-click on selected cells and select Merge Cells from the context menu, or go to Format > Table > Merge Cells on the Menu bar to merge the selected cells.
210 | Draw Guide 7.1

• Split Cells – splits a selected cell into multiple cells either horizontally or vertically. Make sure that the cursor is positioned on the cell, then click on Split Cells to open the Split Cells dialog (Figure 237).
Alternatively, go to Format > Table > Split Cells on the Menu bar.
Figure 237: Split Cells dialog
In the Split Cells dialog, select the number of cells required when splitting a cell and whether to split the cell horizontally or vertically. If necessary, when splitting horizontally, select Into equal proportions to create cells of equal size. The contents of the split cell arekept in the original cell (left or top cell).
• Optimize – evenly distributes the selected rows and columns in a table either horizontallyor vertically. Clicking on Optimize opens the Optimize toolbar (Figure 238) which contains the following tools:
Figure 238: Optimize toolbar
– Minimal Row Height – determines the minimal row height for selected rows. Minimal row height depends on the font size of the smallest character in the row. Alternatively, click on Format > Table > Minimal Row Height on the Menu bar.
– Minimal Column Width – defines the minimal column width for selected columns. Minimal column width depends on the shortest entry within a column. Alternatively, click on Format > Table > Minimal Column Width on the Menu bar.
– Optimal Row Height – determines the optimal row height for selected rows. Optimal row height depends on the font size of the largest character in the row. Alternatively, click on Format > Table > Optimal Row Height on the Menu bar.
– Optimal Column Width – defines the optimal column width for selected columns. Optimal column width depends on the longest entry within a column. Alternatively, click on Format > Table > Optimal Column Width on the Menu bar.
– Distribute Rows Equally – adjusts the height of the selected rows to match the height of the tallest row in the selection. Alternatively, click on Format > Table > Distribute Rows Equally on the Menu bar.
Using tables | 211

– Distribute Columns Evenly – adjusts the width of the selected columns to match the width of the widest column in the selection. The total width of the table cannot exceed the width of the page. Alternatively, click on Format > Table > Distribute Columns Evenly on the Menu bar.
• Align Top, Center Vertically, Align Bottom – sets the vertical alignment of text in selected cells.
Alternatively, go to Format > Align Text on the Menu bar and select the required alignment from the context menu for vertical or horizontal alignment of text in selected cells.
• Insert Row Above, Insert Row Below, Insert Column Before, Insert Column After – select a row or column and use these four tools to insert a row or column.
Alternatively, go to Format > Table > Insert Rows or Insert Columns on the Menu bar toopen the Insert Row dialog (Figure 239) or Insert Column dialog (Figure 240). Select the number of rows or columns and the insertion position, then click OK to insert and close the dialog.
Figure 239: Insert Rows dialog
Figure 240: Insert Columns dialog
212 | Draw Guide 7.1

• Delete Row, Delete Column, Delete Table – clicking on these tools deletes a single rowor column that contains the selected cell. To delete more than one row or column, highlight cells across the number of rows or columns as required, then click on Delete Row or Delete Column. To delete the whole table, place the cursor in a cell and select Delete Table.
Alternatively, right-click in a cell and select Delete > Delete Row or Delete Column or Delete Table from the context menu, or go to Format > Table > Delete Row or Delete Column or Delete Table on the Menu bar.
• Select Table, Select Column, Select Row – select a table, column, or row if the same attributes are going to be applied to a table, column, or row.
Alternatively, go to Format > Table > Select Row or Select Column or Select Table on the Menu bar.
• Table Design – when clicked, this tool opens the Table Design section in the Properties deck on the Sidebar. See “Table Design section” on page 209 for more information.
• Table Properties – opens the Table Properties dialog.
Alternatively, right-click on the table and select Table Properties from the context menu, go to Format > Table > Properties on the Menu bar.
Figure 241: Table Properties dialog - Font page
Using tables | 213

Table Properties dialog
The Table Properties dialog has five tabbed pages that provide formatting options for Font, Font Effects, Borders, Background, and Shadow. To open the Table Properties dialog use one of the following methods:
• Right-click in a table and select Table Properties from the context menu.
• Go to Format > Table > Properties on the Menu bar.
• Click on Table Properties on the Table toolbar.
The formatting options on each dialog page are as follows:
• Font (Figure 241) – select the required Family, Style, Size and Language for text in the table. A sample of the font selected is displayed in the preview box.
• Font Effects (Figure 242) – select the required Font Color, Text Decoration and Effects for the text in the table. A sample of the font effects applied to the text is displayed in the preview box.
• Borders (Figure 243) – select the required Line Arrangement, Line and Padding for the table and cell borders. These options are similar to the tools Border Style, Border Colorand Borders on the Table toolbar. See Chapter 4, Changing Object Attributes for more information on the lines used for table and cell borders.
Figure 242: Table Properties dialog - Font Effects page
214 | Draw Guide 7.1

Figure 243: Table Properties dialog - Borders page
Figure 244: Table Properties dialog - Background page
Using tables | 215

Figure 245: Table Properties dialog - Shadow page
• Background (Figure 244) – select a background as the area fill for the table and/or selected cells. This dialog page provides the same functions as Area Style/Filling tools on the Table toolbar. See Chapter 4, Changing Object Attributes for more information on area style and filling used for table and cell backgrounds.
• Shadow (Figure 245) – adds a shadow to the table. The options adjust the look and position of the shadow. See Chapter 4, Changing Object Attributes for more information on table shadows.
Table position and sizeTables are placed into boxes when created and are treated just like any other object in a drawing.However, only the Position and Size dialog (Figure 247) can be used for tables. Some options are greyed out and are not available for tables. See Chapter 3, Working with Objects for more information on position and size.
After selecting the table, open the Position and Size dialog using one of the following methods:
• Right-click on the table and select Position and Size from the context menu.
• Go to Format > Position and Size on the Menu bar.
• Use the keyboard shortcut F4.
Table position can be changed by dragging with the cursor and text box size can be changed by dragging one of the selection handles. See “Text boxes” on page 183 for more information.
Note
When the size of a table box is changed, the table and cell contents also increases or decreases in size to match the box size.
216 | Draw Guide 7.1

Figure 246: Position and Size dialog
Deleting tables
Whole table
Make sure the table is selected and the selection handles are visible on the table border, then delete the table using one of the following methods:
• Go to Format > Table > Delete Table, Delete Row or Delete Column on the Menu bar.
• Select Delete Table, Delete Row or Delete Column on the Table toolbar.
• Right-click and select Delete > Delete Table, Delete Row or Delete Column from the context menu.
Row or column
Click in a table cell, then delete the table row or column using one of the following methods. Make sure the table selection handles are not be displayed.
• Go to Format > Table > Delete Row or Delete Column on the Menu bar
• Select Delete Row or Delete Column on the Table toolbar.
• Right-click and select Delete > Delete Row or Delete Column from the context menu.
Using tables | 217

Cell contents
Delete cell contents in a table as follows:
1) Select the cell or cells.
2) Press the Delete or Backspace key on the keyboard.
Using fields
Fields allow for the automatic insertion of text into a drawing. Fields are commonly used when creating templates and drawing masters. For more information on templates and master drawings, see Chapter 11, Advanced Drawing Techniques.
Inserting fieldsA text box is created when a field is inserted into the center of a drawing and can be repositionedjust like any other text box. See “Text boxes” on page 183 for more information.
1) Go to Insert > Field on the Menu bar and select the type of field.
2) If necessary, position and resize the field text box. See “Text boxes” on page 183 for moreinformation.
3) If necessary, format the text used for the field information. See “Formatting text” on page 190 for more information.
Field typesThe fields available in Draw are as follows:
• Date (fixed) – inserts the current date into a drawing as a fixed field. The date is not automatically updated. Available date formats depend on the language setting in Tools >Options > Language Settings > Language. Right-click on the date field and select the required date format from the context menu.
• Date (variable) – inserts the current date into a drawing as a variable field. The date is automatically updated each time the file is opened. Available date formats depend on thelanguage setting in Tools > Options > Language Settings > Language. Right-click on the date field and select the required date format from the context menu.
• Time (fixed) – inserts the current time into a drawing as a fixed field. The time is not automatically updated. Available time formats depend on the language setting in Tools > Options > Language Settings > Language. Right-click on the time field and select the required time format from the context menu.
• Time (variable) – inserts the current time into a drawing as a variable field. The time is automatically updated each time the file is opened. Available time formats depend on thelanguage setting in Tools > Options > Language Settings > Language. Right-click on the time field and select the required time format from the context menu.
• Author – inserts the first and last names of the author of the drawing. This information is taken from values entered in the LibreOffice user data. To modify this information go to Tools > Options > LibreOffice > User Data.
• Page Number – inserts the page number into the current drawing. Alternatively, go to Insert > Page Number on the Menu bar. If a page number is to be added to every page in the drawing, go to View > Master on the Menu bar and insert the page number field.
• Page Title – inserts the page title. The default slide name is Page # if the page has not been renamed.
218 | Draw Guide 7.1

• Page Count – inserts the total number of pages in a drawing.
• File Name – inserts the name of the file used for the drawing. The file name only appearsafter the file has been saved.
Using hyperlinks
When inserting text that can be used as a hyperlink (for example, a website address or URL), Draw formats it automatically, creating the hyperlink and applying color and underlining.
Tip
To prevent LibreOffice from automatically turning website addresses or URLs into hyperlinks, go to Tools > AutoCorrect Options > Options on the Menu bar and deselect URL Recognition.
Tip
To change the color of hyperlinks, go to Tools > Options > LibreOffice > Application Colors, scroll to Unvisited links and/or Visited links, select the checkboxes, then select new colors from the color palettes for the links and click OK.Note this color change changes the color for all hyperlinks across all components of LibreOffice.
Inserting hyperlinks1) Click in the text box at the required position for the hyperlink.
2) Go to Insert > Hyperlink on the Menu bar, or use the keyboard shortcut Ctrl+K to open the Hyperlink dialog (Figure 248).
3) Select the type of hyperlink required and the required options. See “Hyperlink types” below for hyperlink types and the options available for each type.
4) Click Apply to insert the hyperlink and save your selections. If several hyperlinks are being created, click Apply after inserting each hyperlink.
5) Click OK to save the changes and close the Hyperlink dialog.
Hyperlink typesOn the left side, select one of the four types of hyperlinks. The dialog changes according to the type of hyperlink selected.
• Internet – select whether the link is Web or FTP. Enter the required web address (URL) and any necessary text.
• Mail – enter the recipient details and subject for the email.
• Document
– Enter the file path for the document, or click on Open File to open a file browser. Leave this blank if the link is to a target in the same drawing.
– Specify a target, for example. a specific page in a drawing. Click on Target to open the Target in Document dialog, where a target can be selected. If the name of the target is known, enter its name into the box.
– If necessary, enter the URL of the document. These hyperlinks are commonly referredto as a bookmark.
Using hyperlinks | 219

Figure 247: Hyperlink dialog
• New Document – creates a hyperlink to a new document.
– Select Edit now to edit the newly created document immediately, or Edit later to createa new document and edit it later.
– Select the type of document to create (text, spreadsheet, etc.).
– Click on Select path to open a file browser and navigate to the folder where the new document is going to be saved.
The Further Settings section in the Hyperlink dialog is common to all the hyperlink types, although some options are more relevant to some types of links.
• Frame – determines how the hyperlink opens. This applies to documents that open in a Web browser.
• Form – specifies if the link is to be presented as text or as a button.
• Text – specifies what text is visible to the user.
• Name – applicable to HTML documents. It specifies the text added as a NAME attribute in the HTML code behind the hyperlink.
Editing text hyperlinks1) Select the hyperlink.
2) Go to Edit > Hyperlink on the Menu bar to open the Hyperlink dialog.
3) Make editing changes using the available options, then click Apply when done. If several hyperlinks are to be edited, click Apply after editing each hyperlink.
4) Click OK to save the changes and close the dialog.
220 | Draw Guide 7.1

Figure 248: Image Map Editor dialog
Image maps
An image map defines areas of the image (called hotspots) associated with a URL (a web address or a file on the computer). Hotspots are the graphic equivalent of text hyperlinks. In Draw, clicking on a hotspot opens the linked page in the appropriate program (for example, default browser for HTML pages; LibreOffice Writer for ODT files; PDF viewer for PDF files).
Hotspots can be created in various shapes, such as rectangles, ellipses, and polygons, and include several hotspots in the same image. When a hotspot is clicked on, the URL opens in a browser window or frame that has been specified. The text that appears when the cursor hovers over a hotspot can also be specified.
Creating image maps1) Select an image in a drawing to use as a hotspot.
2) Go to Tools > ImageMap on the Menu bar to open the Image Map Editor dialog (Figure 248). The main part of the dialog shows the selected image where hotspots will be defined.
3) Select the type of hotspot area required from the icons at the top of the Image Map Editordialog – Rectangle, Ellipse, Polygon, Freeform Polygon.
4) Draw the hotspot area onto the selected image.
5) Enter the hyperlink address for the hotspot in the Address text box using the address format: file:///<path>/document_name#anchor_name.
Image maps | 221

6) Click on Apply to apply the settings.
7) Click on Save to save the image map to a file, then close the Image Map Editor dialog.
Image map toolsThe ImageMap Editor contains the following tools:
• Apply – applies the changes.
• Open – loads into the Image Map Editor an existing image map in the MAP-CERN, MAP-NCSA or SIP StarView image map file format.
• Save – saves the image map in the MAP-CERN, MAP-NCSA or SIP StarView image map file format.
• Select – selects a hotspot in the image map for editing.
• Rectangle, Ellipse, Polygon, Freeform Polygon – draws a hotspot on the selected image in the shape selected.
• Edit Points – change the shape of the selected hotspot by editing the anchor points.
• Move Points – move the individual anchor points of the selected hotspot.
• Insert Points – adds an anchor point at the selected point on the outline of the hotspot.
• Delete Points – deletes a selected anchor point.
• Undo – cancels the previous action.
• Redo – reapplies the previous cancelled action.
• Active – toggles the status of a selected hotspot between active and inactive.
• Macro – assign a macro that runs when the hotspot is clicked on.
• Properties – define the properties of the selected hotspot.
• Address – enter the URL for the file that opens when the selected hotspot is clicked on. The address format to be used: file:///<path>/document_name#anchor_name.
• Text – enter the text that is displayed when the cursor rests on the hotspot . If no text is entered, the Address is displayed.
• Frame – enter the name of the target frame for the hotspot. Standard frame name can beselected from the drop-down list and used instead.
– _blank – opens in a new browser window.
– _self – default selection and opens in the current window.
– _top – file opens in the topmost frame in the hierarchy.
– _parent – file opens in the parent frame of the current frame. If there is no parent frame, the current frame is used.
• Graphic view – displays the image map so that the hotspots can be selected and edited.
Tip
The value _self for the target frame will work on the vast majority of the occasions. It is not recommended to use the other values, if available, unless absolutely necessary.
222 | Draw Guide 7.1

Figure 249: Fontwork Gallery dialog
Fontwork
Using Fontwork creates graphical text as objects to make a drawing look more attractive. There are many different settings for Fontwork (line, area, position, size, and more) to match the requirements of a drawing.
Fontwork is also available with the Writer, Calc, and Impress modules of LibreOffice, but there are small differences in the way that each LibreOffice module displays Fontwork.
Creating Fontwork1) Open the Fontwork Gallery dialog (Figure 249) using one of the following methods.
– Go to Insert > Fontwork on the Menu bar.
– Click on Insert Fontwork Text on the Standard toolbar.
– Click on Insert Fontwork Text on the Fontwork toolbar, if this toolbar is visible.
2) Select a Fontwork style from the dialog and click OK. The selected Fontwork object appears in the center of the drawing and the dialog closes.
Fontwork | 223

Figure 250: Fontwork example
Figure 251: Fontwork toolbar
Figure 252: Fontwork Shape toolbar
3) Double-click on the black text in the Fontwork object to switch on editing mode.
4) Type the required text which replaces the black text in the Fontwork object as shown in Figure 250.
5) Press the Esc key or click outside the selected area to apply the change.
Fontwork toolbarThe Fontwork toolbar (Figure 251) becomes visible and active on the workspace when a Fontwork object is selected. If the toolbar is not visible, go to View > Toolbars > Fontwork on the Menu bar.
The following tools are available for editing a Fontwork object.
• Insert Fontwork Text – opens the Fontwork Gallery dialog.
• Fontwork Shape – changes the shape of the selected object. Click on Fontwork Shape to open a pop-up toolbar and select a Fontwork shape for the available options. The shapes are shown in the Fontwork Shape floating toolbar (Figure 252).
• Fontwork Same Letter Heights – changes the height of characters in the selected Fontwork object. Toggles between normal height where the characters have different heights to where all characters have the same height.
• Fontwork Alignment – specifies the text alignment within the frame. Options are Left Align, Center, Right Align, Word Justify, and Stretch Justify. The effects of the text alignment can only be seen if the text spans over two or more lines. In the stretch justify mode, all lines are filled completely.
• Fontwork Character Spacing – selects the spacing between characters and whether kerning pairs should be used. Options are Very Tight, Tight, Normal, Loose, Very Loose and Custom. For Custom spacing, input a percentage value: 100% is normal character spacing, less than 100% character spacing is tighter, and more than 100% character spacing is looser.
224 | Draw Guide 7.1

• Toggle Extrusion – converts the Fontwork object into a 3D shape using extrusion. See Chapter 7, 3D Objects for more information.
Modifying FontworkA Fontwork object can be treated like any other object in Draw. It can be resized, rotated, skewed, slanted, flipped, and so on. For more information on modifying a Fontwork object, see Chapter 3, Working With Objects, Chapter 4, Changing Object Attributes and Chapter 5, Combining Multiple Objects.
Fontwork is text and all text formatting that has been described in this chapter can be applied. Assign line properties only to Fontwork that is NOT going to be converted to 3D effect using Toggle Extrusion, otherwise line properties will not be visible.
Some of the Fontwork shapes can be modified. For example, to change the angles of trapezoid or parallelogram basic shapes by moving the dot that is displayed along with the selection handles.
Fontwork | 225

Draw Guide
Chapter 10, Printing, Exporting and Emailing

Printing
Quick printingTo quickly print a document or drawing, click on Print Directly on the Standard toolbar (Figure 253) to send the entire document to the default printer that is defined for the computer.
Figure 253: Standard toolbar
Note
The action of Print Directly can be changed by sending a document to the printer defined for the document instead of the default printer defined for the computer. Go to Tools > Options > Load/Save > General and select the option Load printer settings with the document.
Note
If Print Directly is not visible on the Standard toolbar, right-click in an empty area on the Standard toolbar and select Visible Buttons from the context menu. Select PrintDirectly from the displayed list of tools and the tool is added to the Standard toolbar.
Controlled printingFor more control over printing, open and use the Print dialog (Figure 254 and 255) using one of the following methods:
• Go to File > Print on the Menu bar.
• Use the keyboard shortcut Ctrl+P.
• Click on Print on the Standard toolbar.
Note
The options selected in the Print dialog only apply to the printing of the current document that is open in Draw. To specify default print settings for LibreOffice, go to Tools > Options > LibreOffice > Print on the main menu bar to open the Options LibreOffice Print dialog.
Note
Due to different computer setups and different operating systems, the print dialog that opens on a computer monitor may differ from the dialogs shown in Figure 254 and 255. However, the printing options available for LibreOffice remain the same.
Printing | 227

Figure 254: Print dialog - General page
Note
Any print options selected with the Draw Print dialog when printing from Draw will override the default printer settings that have been set using Tools > Options > LibreOffice > Print and Tools > Options > LibreOffice Draw > Print.
General options
The following general options are an example of what may be available on the General page of the Print dialog (Figure 254).
• Printer – select the printer to use from the printers available in the drop-down list.
• Range and Copies – select from the following options:
– All Pages – prints all the pages in the document.
– Pages – select the page number(s) to print. For multiple pages, use the format 1, 3. 7 or 1 – 5, 7, 9 for page number selection.
– Selection – select from the drop-down list Odd and Even pages, Odd pages, or Even pages.
– Paper sides – select from the drop-down list Print on one side (simplex), Print on bothsides (duplex long edge binding), or Print on both sides (duplex short edge binding).
– Number of copies – enter number of printed copies required for document.
– Collate – collates multiple printed copies into separate documents.
– Order – select from Create separate print jobs for collated output or Print reverse order.
228 | Draw Guide 7.1

Figure 255: Print dialog - LibreOffice Draw page
• Page Layout – select from the following options:
– Paper size – select the paper size to use from drop-down list
– Orientation – select from the drop-down list Automatic, Portrait or Landscape.
– Pages per sheet – select from the drop-down list how many pages are printed on one sheet of paper.
– Order – select from the drop-down list the printing order of multiple pages on one sheet of paper.
– Draw a border around each page – when multiple pages are printed on one sheet of paper, a border is drawn around each page.
– Brochure – prints the document so the pages can be folded into a booklet.
LibreOffice Draw options
The following options are available on the LibreOffice Draw page of the Print dialog (Figure 255)where settings are defined specific to the current document type:
• Contents – prints the Page name and/or Date and time on the drawing.
• Colors – prints the drawing in Original colors, Grayscale, or Black & white.
• Size – print the drawing using one of the following options:
– Original size – prints the drawing using its original size.
– Fit to printable page – the drawing size is changed so that it fits on the paper size used for printing.
– Distribute on multiple sheets of paper – used if the drawing is too large for the paper size being used.
Printing | 229

– Tile sheet of paper with repeated pages – used to print multiple copies of a drawing on a page.
Note
The following printing instructions are examples only. Actual method of printing may differ from the examples as this depends on computer operating system, computer setup, and the printer being used.
Single sheet printing of multiple pagesTo print multiple pages of a drawing on single sheet of paper:
1) Open the Print dialog, see “Controlled printing” on page 227.
2) Select the printer to use if more than one printer is connected to the computer.
3) In Page Layout, select the number of pages to print per sheet of paper from the Pages per sheet drop-down list. The preview panel on the right shows how the pages will look ona printed sheet of paper.
4) In Page Layout, select how the multiple pages are printed on the sheet of paper from theOrder drop-down list.
5) If necessary, select Draw a border around each page to distinguish each page printed on a sheet of paper.
6) Click OK to print the document and close the Print dialog.
Selecting pages to print
Individual page
1) Open the Print dialog, see “Controlled printing” on page 227.
2) Select the printer to use if more than one printer is connected to the computer.
3) In Ranges and Copies, select Pages and enter the page number of the page to print.
4) Click OK to print the individual pages and close the Print dialog.
Range of pages
1) Open the Print dialog, see “Controlled printing” on page 227.
2) Select the printer to use if more than one printer is connected to the computer.
3) In Ranges and Copies, select Pages and enter the page numbers of the pages to print using the format, for example, 1,3,7 or 2–5,7,9 for page number selection
4) Click OK to print the pages and close the Print dialog.
Selection printing
1) Open the Print dialog, see “Controlled printing” on page 227.
2) Select the printer to use if more than one printer is connected to the computer.
3) In Ranges and Copies, select Selection and then select Odd and Even pages, Even pages, or Odd pages from the drop-down list.
4) Click OK to print the pages and close the Print dialog.
230 | Draw Guide 7.1

Brochure printingIn Writer, Impress, and Draw, a document can be printed as a brochure (also known as booklet printing). The pages are arranged so that when the printed pages are folded in half, the pages are in the correct order to form a brochure or booklet.
Tip
Plan the document to make it look good when printed as a brochure. Choose appropriate margins, font sizes, and so on as the pages are normally printed at half size on a sheet of paper. Experiment to get the best document format to match the capabilities of the printer being used.
Simplex printer
To print a brochure or booklet on a printer only capable of simplex or single-sided printing:
1) Open the Print dialog, see “Controlled printing” on page 227.
2) Select the printer to use if more than one printer is connected to the computer.
3) In Printer, click Properties to open the properties dialog for the selected printer.
4) Make sure the printer is set to the same orientation (portrait or landscape) as specified in the page setup for the document. Usually the orientation does not matter, but it does for brochures.
5) Click OK to close the properties dialog and return to the Print dialog.
6) In Page Layout, select More, then select the Brochure option.
7) In Range and Copies, select Even pages or Odd pages from the Selection drop-down list.
8) Click OK to print the even or odd pages.
9) Take the printed pages out of the printer and put back into the printer in the correct orientation to print on the blank side. This may require some testing to find out what the correct arrangement is for the selected printer.
10) If Even Pages was selected, now select Odd Pages in Range and Copies. If Odd Pages was selected, now select Even Pages in Range and Copies.
11) Click OK to finish printing the document as a brochure and close the Print dialog.
Duplex printer
To print a brochure or booklet on a printer that is capable of duplex or double-sided printing:
1) Open the Print dialog, see “Controlled printing” on page 227.
2) Select the printer to use if more than one printer is connected to the computer.
3) In Printer, click Properties to open the properties dialog for the selected printer.
4) Make sure the printer is set to the same orientation (portrait or landscape) as specified in the page setup for the document. Usually the orientation does not matter, but it does for brochures.
5) Click OK to close the properties dialog and return to the Print dialog.
6) In Range and Copies, select More, then select Print on both sides (duplex long edge) from the Paper sides drop-down list. Actual options available for duplex printing depend on the printer model and the computer system being used.
7) In Page Layout, Select More, then select the Brochure option.
Printing | 231

8) In Range and Copies, select the All Pages option.
9) Click OK to print the document as a brochure and close the Print dialog..
Black and white or grayscale printing
Printer settings
To print documents in black and white or grayscale on a color printer:
1) Open the Print dialog, see “Controlled printing” on page 227.
2) Select the printer to use if more than one printer is connected to the computer.
3) Click on LibreOffice Draw to open the printing options page for LibreOffice Draw.
4) In Color, select Grayscale or Black & white.
5) Click OK to print the document and close the Print dialog.
Note
Some color printers may only allow printing in color regardless of the settings selected. More details can be found in the information that came with the selected printer.
Tip
Grayscale is the best option for printing any colored text or graphics in a document on a monochrome printer. Colors printed in shades of gray give more detail. When printing color in black and white some of this detail maybe lost.
LibreOffice settings
To change the LibreOffice settings to print all colored text and graphics as grayscale:
1) Go to Tools > Options > LibreOffice Draw > Print on the Menu bar to open the OptionsLibreOffice Draw Print dialog (Figure 256).
Figure 256: Options LibreOffice Draw Print dialog
232 | Draw Guide 7.1

2) In Quality, select either the option Grayscale or Black & white.
3) Click OK to save the change and close the Options LibreOffice Draw Print dialog.
4) Print the document using one of the above procedures and the document is printed as grayscale or black and white.
Exporting
LibreOffice can export documents to PDF (Portable Document Format). This industry wide standard of file format is ideal for sending a file for someone else to view using PDF viewing software.
Directly as PDFTo export the entire document using default PDF settings is as follows:
1) Click on Export Directly as PDF on the Standard toolbar, or got to File > Export As > Export Directly as PDF on the Menu bar.
2) Enter a file name and location for the PDF file and click on Save to export the file as PDF.
Note
Note that page range, image compression, or other printing options are not available when creating a PDF file using this method.
Figure 257: PDF Options dialog - General page
Exporting | 233

Controlling PDF content and qualityFor more control over the content and quality of the resulting PDF, use the options available in the PDF Options dialog (Figure 257). For more information on available options, see the Getting Started Guide.
1) Go to File > Export As > Export as PDF on the Menu bar to open the PDF Options dialog.
2) Select the required options available in the General, Initial View, User Interface, Links, Security and Digital Signatures pages.
3) Click on Export and a file browser window opens.
4) Navigate to the location and enter a file name for the PDF being created.
5) Click on Save to export the file as PDF. The file browser window and the PDF Options dialog close.
Other formatsLibreOffice can export files in various formats, which are listed in the drop-down list of the file browser window. For more information on exporting graphics, see Chapter 6, Editing Pictures.
To export a file in another format:
1) Go to File > Export on the Menu bar to open a file browser window.
2) Navigate to the directory where the drawing is going to be saved.
3) Specify a file name for the exported drawing in the Name text box.
4) Select the required file format from the drop-down list.
5) Click on Save to save the file and close the file browser window.
Note
The content of the exported file depends on the elements selected on the drawing. If no elements are selected, the entire drawing is exported.
Figure 258: HTML Export dialog
234 | Draw Guide 7.1

Web pagesTo export a multi-page Draw document as a series of web pages:
1) Go to File > Export on the Menu bar to open a file browser window.
2) Select HTML Document as the file format and click on Save to open the HTML Export dialog (Figure 258).
3) Create a New Design or select an Existing design and click on Next.
4) Follow the prompts to create the web pages and save the drawing as an HTML file. For more information on how to create HTMl file, see the Getting Started Guide.
Emailing documents
LibreOffice provides several ways to send documents quickly and easily as an email attachment in ODF format (LibreOffice default format), or as a PDF. For more information, see the Getting Started Guide.
Note
Documents can only be sent from the LibreOffice menu if an email profile has been set up.
Open Document formatTo email the current document in ODF format:
1) Go to File > Send > Email Document on the Menu bar. LibreOffice opens the default email program with the document attached to a new email.
2) In the email program, enter the recipient, subject, and message, then send the email.
PDF formatTo email the current document as a PDF file:
1) Go to File > Send > E-mail as PDF on the Menu bar. LibreOffice creates a PDF using the default PDF settings and then opens the email program with the PDF file attached to a new email.
2) In the email program, enter the recipient, subject, and message, then send the email.
Digital signatures
A digital signature is a mathematical scheme for verifying the authenticity of digital versions of drawings or documents.
To sign a drawing digitally, a personal key, also known as a certificate, is required. This personal key is stored on the computer being used as a combination of a private key, which must be kept secret, and a public key. These keys are added to a drawing when a digital signature is applied. A certificate is obtained from a certification authority, which may be a private company or a government institution.
When a digital signature is applied to a drawing, a checksum is computed from the drawing content plus the personal key being used. The checksum and public key are stored together with the drawing.
Digital signatures | 235

When the drawing is opened on another computer with a recent version of LibreOffice, the program computes the checksum again and compares it with the stored checksum. If both checksums are the same, the program opens the original, unchanged drawing.
In addition, the program can display the public key information from the certificate. This information can then be compared with the public key that is published on the web site of the certificate authority. Whenever the drawing is changed, this change breaks the digital signature.
For a more detailed description of how to obtain, use and manage a certificate and signature validation, see the Getting Started Guide and “Applying Digital Signatures” in the LibreOffice Help(https://help.libreoffice.org/7.1/en-US/text/shared/guide/digitalsign_send.html?&DbPAR=WRITER&System=UNIX).
Removing personal data
It maybe necessary to remove any personal data, versions, notes, hidden information, or recorded change from drawings before they are sent to other people or PDFs files created from the drawings.
Setting security and warning options1) In Tools > Options > LibreOffice > Security, to open Options LibreOffice Security dialog
(Figure 259).
2) Click on Options to open the Security Options and Warnings dialog (Figure 260).
3) Select the required options to allow LibreOffice to warn when drawings contain certain information and/or automatically remove personal information on saving.
4) Click OK to close the Security Options and Warnings dialog and save the option selection.
Figure 259: Options LibreOffice Security dialog
236 | Draw Guide 7.1

Figure 260: Security Options and Warnings dialog
Figure 261: Properties dialog
Removing personal data and drawing information1) Go to File > Properties on the Menu bar to open the Properties dialog (Figure 261) for
the open drawing.
Removing personal data | 237

2) In the General page uncheck Apply user data.
3) Click on Reset Properties removing any information in the created and modified fields, deleting the modification and printing dates, resetting the editing time to zero, resetting the creation date to the current date and time, and resetting the version number to 1.
4) Click OK to save the changes and close the Properties dialog.
Removing version informationTo remove version information from a drawing, use one of the following methods:
• Go to File > Versions on the Menu bar to open a dialog for the drawing, then select the versions from the list for deletion and click Delete. The dialog automatically closes.
• Go to File > Save As on the Menu bar and save the drawing with a different name.
Redaction
Documents can be redacted to remove or hide any sensitive information allowing the selective disclosure of information in a document while keeping other parts of the document secret.
When a redacted document is exported to a new document, any redacted portions are removed and replaced by redaction blocks of pixels. This prevents any attempt to restore or copy the original contents. A redacted document is often exported in PDF format for publication or sharing.
Any documents that are redacted in LibreOffice Writer, Calc, or Impress are automatically transferred as a copy to LibreOffice Draw where the redaction is carried out.
Documents, spreadsheets, or presentations1) Open the document to be redacted in LibreOffice Writer, Calc or Impress, then go to
Tools > Redact on the Menu bar and the following happens:
– A copy of the document is prepared and transferred to LibreOffice Draw as an untitledfile.
– LibreOffice Draw opens with the untitled document document displayed.
– The Redaction toolbar (Figure 262) automatically opens. If the Redaction toolbar is not displayed, go to View > Toolbars on the Menu bar in LibreOffice Draw and select Redaction.
Figure 262: Redaction toolbar
2) Go to Tools > Redact on the Menu bar and select either Rectangle or Freeform, or clickon Rectangle Redaction or Freeform Redaction in the Redaction toolbar.
3) Draw the required shapes to redact the sensitive areas in the document. The redaction shape is gray allowing the sensitive areas in the document to be visible before they are redacted.
4) If necessary, click on Export Directly as PDF to make an in-redaction copy of the document as a PDF file. The sensitive information in the redacted areas can then be reviewed that it is correct before redaction is finalized.
238 | Draw Guide 7.1

5) Go to Tools > Redact on the Menu bar and select either Redacted Export (White) or Redacted Export (Black), or click on Redacted Export (White) or Redacted Export (Black) in the Redaction toolbar. This opens a file browser window.
6) Navigate to the folder where the redact document is going to be saved and enter a name for the document, then click on Save to create the redacted PDF file.
– The gray redaction shapes are converted to white or black shapes and the document is exported as a PDF.
– There is no selectable text in the PDF file and any redacted content is non-existent.
DrawingsOpen a drawing in LibreOffice Draw, then use Steps 2) thru 6) in “Documents, spreadsheets, or presentations” to create a redacted PDF copy of the drawing file.
Note
When a redacted document is exported as a new PDF file, any redacted portions areremoved from the new document and replaced by redaction blocks of pixels. This prevents any attempt to restore or copy the original contents.
Redaction | 239

Draw Guide
Chapter 11, Advanced Draw Techniques

Drawing pages
A drawing created in Draw can consist of multiple pages. This allows a drawing to be created thathas several sections and stored as one file on a computer.
Pages paneThe Pages page is used to add, rename, delete, and arrange pages in a drawing. By default the Pages page (Figure 263) appears docked on the left of the Workspace when a drawing is opened in Draw and shows every page in a drawing as a thumbnail. If the Pages page is not visible, go to View > Page Pane on the Menu bar.
• For Windows and macOS only — press and hold the Ctrl key, then double-click in the titlebar of the Pages pane to create a floating window, or to return the floating Pages pane to its docked position on the left side of the Workspace.
• Click in the title bar and drag the Pages pane to create a floating window, or to return the floating Pages pane to its docked position on the left side of the Workspace.
• To close the Pages pane, click on the X on the right side of the title bar, or deselect View > Page Pane in the Menu bar.
Figure 263: Draw main window showing Pages pane, Workspace, and Sidebar
Drawing pages | 241

Figure 264: Navigator dialog
Figure 265: Navigator deck on Sidebar
Selecting pagesSelect a page using one of the following methods and the page appears in the Workspace readyfor editing:
• Click on a page thumbnail in the Pages pane.
• Select a page in the Navigator after opening.
If the Navigator is not open, use one of the following methods to open it:
• Press the F5 key to open the Navigator dialog (Figure 264).
• Go to View > Navigator on the Menu bar to open the Navigator dialog.
• Click on Navigator on the right of the Sidebar to open the Navigator deck (Figure 265).
242 | Draw Guide 7.1

Navigating pagesTo quickly select a page for editing so it appears in the Workspace, either select the page in the Pages pane, or go to Page > Navigate on the Menu bar and select one of the options from the submenu:
• To First Page – moves the selection to the first page in the drawing.
• To Previous Page – moves the selection backward to the previous page.
• To Next Page – moves the selection forward to the next page.
• To Last Page – moves the selection to the last page in the drawing.
Adding pages
Inserting new page
A new page is inserted into a drawing using one of the following methods. A new page is added after the selected page in the Pages pane, or at the end of the pages if no page is selected.
• Right-click in the Pages pane and select New Page from the context menu.
• Go to Page > New Page on the Menu bar.
• Go to Page > Insert Page from File on the Menu bar and the Insert File dialog opens. Navigate to the folder where the file is located, select the file, click on Open and then click OK.
Duplicating pages
Select a page in the Pages pane, then use one of the following methods to insert the duplicate page after the selected page:
• Right-click in the Pages pane and select Duplicate Page from the context menu.
• Go to Page > Duplicate Page on the Menu bar.
Renaming pagesWhen pages are inserted into a drawing, they are automatically named as Page 1, Page 2, and so on in the Page Pane and the Navigator. As the page order is changed, the pages are automatically renumbered. However, to easily identify each page, it is recommended to give eachpage a memorable name.
1) Select a page for renaming in the Pages pane.
2) Rename the selected page using one of the following methods:
– Go to Page on the Menu bar and select Rename Page from the submenu.
– Right-click on the selected page in the Pages pane and select Rename Page from the context menu.
3) In the Rename Page dialog that opens, type a new name for the page and click OK to save.
Changing page orderTo change the page order in a drawing, use one of the following methods:
• Select a page thumbnail in the Pages pane, then drag and drop the thumbnail to change the page order.
Drawing pages | 243

• Select a page thumbnail in the Pages pane, then go to Page > Move on the Menu bar and select one of the following options
– Page to Start – moves the selected page to the beginning of the drawing.
– Page Up – moves the selected page up one place in the page order of the drawing.
– Page Down – moves the selected page down one place in the page order of the drawing.
– Page to End – moves the selected page to the end of the drawing.
Deleting pages1) Select a page for deletion in the Pages pane.
2) Delete the selected page using one of the following methods:
– Go to Page > Delete Page on the Menu bar.
– Right-click on the selected page in the Pages pane and select Delete Page from the context menu.
Note
When deleting pages in a drawing, there is no deletion confirmation of the selected page.
Master pages
A master page is a page used as the starting point for other pages in a drawing. It is similar to a page style in Writer and controls the basic formatting of all pages based upon it. A drawing can have more than one master page so that a different look can be assigned to separate pages in a drawing, for example title page, contents page, and drawing pages.
A master page has a defined set of characteristics, including the background color, graphic, or gradient. For example, objects (such as logos, decorative lines, and other graphics) in the background, formatting of text, blocks of standard text, and fields such as page numbering, date, and filename.
Master page viewTo open the master page view, go to View > Master on the Menu bar. This also opens the Master View toolbar (Figure 266). If this toolbar does not open, go to View > Toolbars > Master View on the Menu bar.
To return to normal page mode, click on Close Master View in the Master View toolbar or go to View > Normal on the Menu bar.
Figure 266: MasterView toolbar
244 | Draw Guide 7.1

Creating master pagesEach drawing has a default master page. When a drawing has multiple pages, master pages canbe created and added to the drawing as follows:
1) Go to View > Master on the Menu bar to open the master page view and the Master Viewtoolbar.
2) Create a new master page using one of the following methods. After creation, the new master page is automatically selected.
– Click on New Master in the Master View toolbar.
– Go to Page > New Master on the Menu bar.
– Right-click in the Pages pane and select New Master from the context menu.
3) Add the required graphic objects, logos, fields, text and so on to the selected master page.
4) Save the drawing.
5) Assign the new master page to a drawing page. See “Assigning master pages” below for more information.
6) If necessary, rename the master page with a meaningful name, see “Renaming master pages” below.
Renaming master pagesEach new master page created has the default name of Default 1, Default 2, and so on. It is recommended to rename a new master page with a more meaningful name. The default master page that was created when the drawing was first created can also be renamed.
1) Go to View > Master on the Menu bar to open the master page view and the Master Viewtoolbar.
2) Open the Rename Master Slide dialog (Figure 267) using one of the following methods:
– Click on Rename Master in the Master View toolbar.
– Right-click on a master page in the Pages pane and select Rename Master from the context menu.
3) Enter a meaningful name for the master page in the Name text box.
4) Click OK to save the changes and close the Rename Master Slide dialog.
Figure 267: Rename Master Slide dialog
Master pages | 245

Figure 268: Available Master Slides dialog
Assigning master pagesWhen a drawing has more than one master page, different master pages can be assigned to different pages.
1) Go to View > Normal on the Menu bar.
2) In the Pages pane, select the page to assign a master page to it.
3) Right-click on the page in the Workspace and select Change Slide Master from the context menu to open the Available Master Slides dialog (Figure 268).
4) Select a master page design for the selected page in Select a Slide Design.
5) If necessary, select Exchange background page to use the selected master page for all pages in the drawing.
6) If necessary, select Delete unused backgrounds to delete any master pages shown in Select a Slide Design that have not been assigned to a page.
7) Click OK to assign the selected master page and close the Available Master Slides dialog.
246 | Draw Guide 7.1

Deleting master pagesThe default master page created when the drawing was first created cannot be deleted. Also, if the drawing only uses one named master page, then that named master page cannot be deleted.Deleting master pages is only available when there is more than one master page in a drawing.
1) Go to View > Master on the Menu bar to open the master page view and the Master Viewtoolbar.
2) Delete a master page using one of the following methods:
– Select and right-click on a master page in the Pages pane, then select Delete Masterfrom the context menu.
– Click on Delete Master in the Master View toolbar.
– Go to Page > Delete Master on the Menu bar.
Note
The deletion of the master page is immediate and there is no confirmation.
Inserting fieldsTo insert a field on a master page, go to Insert > Field on the Menu bar and select a field type from the options available on the submenu.
• Date (fixed) – inserts the current date into the master page as a fixed field. The date is not automatically updated.
Figure 269: Page Properties dialog
Master pages | 247

• Date (variable) – inserts the current date into the master page as a variable field. The date is automatically updated each time the file is opened.
• Time (fixed) – inserts the current time into the master page as a fixed field. The time is not automatically updated.
• Time (variable) – inserts the current time into the master page as a variable field. The time is automatically updated each time the file is opened.
• Author – inserts the first and last names listed in the LibreOffice user data into the activepage. Go to Tools > Options > LibreOffice > User Data on the Menu bar to enter user data details.
• Page Number – inserts the page number into every page of the drawing. To change the number format, go to Page > Page Properties on the Menu bar to open the Page Properties dialog (Figure 269). Click on the Page tab and select a number format from the drop-down list in Layout Settings.
• Page Title – inserts the page title. A page title is created in Normal view by going to Page> Rename Page on the Menu bar and entering a title in the Name text box in the Rename Page dialog that opens.
• Page Count – inserts the total number of pages in a drawing.
• File Name – inserts the name of the active file. The name only appears after the file has been saved.
Editing field format1) Click on a field to select it and display the selection handles.
2) Double click on the field contents to select the text.
3) Edit the field format using one of the following methods:
– Go to Edit > Fields... on the Menu bar to open the Edit Field dialog (Figure 270), thenselect format option(s) and click OK to save the changes.
– Right-click on the selected field contents and select an option from the context menu.
4) Click in a blank area of the master page to deselect the field.
Figure 270: Edit Field dialog
248 | Draw Guide 7.1

Note
The options available in the Edit Field dialog change to match the field type that has been selected for editing.
Master pages from templatesMaster pages from templates available in LibreOffice can be loaded into a drawing and used. If the master pages from a template use a different page size, the master pages loaded into a drawing are adapted to the page size used in the drawing. This may cause some objects to be stretched when adapted to fit the drawing page size.
1) Go to View > Master on the Menu bar to open the master page view and the Master Viewtoolbar.
2) Right-click on a master page displayed in the drawing and select Change Master Slide from the context menu to open the Available Master Slides dialog.
3) Click on Load… in the Available Master Slides dialog to open the Load Master Slide dialog (Figure 271).
4) Chose a template category from list displayed in Categories.
Figure 271: Load Master Slides dialog
Master pages | 249

5) Choose a template from the list displayed in Templates. Click Preview to display a preview of the selected template.
6) Click OK to close the Load Master Slide dialog and the Available Master Slides dialog opens displaying the template in Select a Slide Design.
7) Select the master page design required in Select a Slide Design.
8) If necessary, select Exchange background page to use the selected master page for all pages in the drawing.
9) If necessary, select Delete unused backgrounds to delete any master pages shown in Select a Slide Design that have not been assigned to a page.
10) Click OK to assign the selected master page to a drawing page and close the Available Master Slides dialog.
Templates
A template is a special type of drawing that is used as a basis to create a drawing. For example, a template can include a company logo, name and information on the first page of a drawing withthe remaining pages in a drawing only showing the company logo and name. Templates can contain anything that regular drawings can contain, such as text, graphics, a set of styles, and soon.
All document types created using LibreOffice are based on templates. If a template is not specified when a new document is started, then the default template for that type of document is used. This default template uses a set of properties that are hard coded in LibreOffice.
Specific templates can be created for any document type (text, spreadsheet, drawing, presentation). A default template for drawings can be created, see “Default template” on page 253 for more information.
For more information on templates and obtaining templates from other sources, see the Getting Started Guide.
Draw does not have any predefined templates when it is installed on a computer. However, templates can be created using methods described in the following sections. Templates can be installed that have been obtained from other sources, see "Importing templates" on page 256 for more information.
Creating templates from a drawing1) Open a drawing to use as a basis for a template, or open and edit a template to use as a
basis for a new template.
2) Add any extra content and styles or edit the content and styles in the drawing.
3) Save the drawing as a template using one of the following methods to open the Save As Template dialog (Figure 272):
– Go to File > Templates > Save As Template on the Menu bar.
– Click on the small triangle ▼ to the right of Save on the Standard toolbar and select Save as Template from the drop-down menu.
4) Enter a name for the template in the Template Name text box.
5) Select a category for the template in the Template Category box.
6) If the template is to be used as the default template in Draw, then select the option Set asdefault template.
7) Click on Save to save the template and close the dialog.
250 | Draw Guide 7.1

Figure 272: Save As Template dialog
Alternatively, use Save As to save the drawing as a template using the following procedure:
1) Go to File > Save As on the Menu bar to open the Save as dialog.
2) Navigate to the LibreOffice folder where templates are stored. Actual folder depends on the computer system and setup.
3) Enter a filename using the extension .otg.
4) Select ODF Drawing Template (.otg) as the file type.
5) Click on Save to save the template and close the dialog.
Note
When using the Save as dialog, the template must be saved in the LibreOffice templates folder for the template to be recognized and found by the LibreOffice Template Manager.
Creating a drawing from templatesInstead of using the default settings in LibreOffice to create a new drawing, a drawing can be created from a template.
Templates | 251

Figure 273: Templates dialog
Start Center
Start LibreOffice and create a new drawing from a template displayed in the Start Center using one of the following methods:
• Click on Templates in the Start Center to open a display of available templates for all LibreOffice applications. Click on a template and a new document opens using the relevant LibreOffice module application for the template.
• Click on the small triangle ▼ to the right of Templates in the Start Center, then select Draw Templates to display only the available templates for LibreOffice Draw. Click on a template and a new drawing opens using LibreOffice Draw.
Templates dialog
Instead of using the default settings in LibreOffice to create a new drawing using the Templates dialog (Figure 273) as follows:
1) Use one of the following methods to open the Templates dialog:
– Go to File > New > Templates on the Menu bar.
– Go to File > Templates > Manage Templates on the Menu bar.
– Use the keyboard short cut Shift+Ctrl+N.
2) In the Filter drop-down lists, select the application and category required for the new drawing.
3) Select a template from the options available in the preview box.
4) Click Open or double click on the template to create a new drawing using the selected template and close the Template dialog.
252 | Draw Guide 7.1

5) Go to File > Save As on the Menu bar and save the new drawing as a file using the extension .odg.
Default templateIf a new drawing is created without selecting a template, LibreOffice creates the drawing using a set of properties that are hard coded in LibreOffice. However, any drawing template can be used as the default template, but the template must be located in the templates folders used for LibreOffice applications and categories.
Setting the default template
1) Open the Template dialog.
2) In the Filter drop-down lists, select the application (Drawings) and category, then select a template from the templates displayed in the preview box.
3) Right-click on the template and select Set as default from the context menu. There is no confirmation that the selected template has become the default template for new drawings. The default template is indicated by check mark at the top left corner of the template icon.
4) Click on Cancel to close the Templates dialog. The next time a new drawing is created, it will use the new default template.
Note
If a new drawing is suitable to use as the default template, then the drawing must be saved as a template first before it can be used as the default template. See “Creatingtemplates from a drawing” on page 250 for more information.
Resetting default template
1) Open the Templates dialog:
2) In the Filter drop-down lists, select the application (Drawings) and category.
3) Right-click on the default template. The default template is indicated by check mark at thetop left corner of the template icon.
4) Select Reset Default from the context menu. There is no confirmation that Draw has been reset to using LibreOffice default properties for creating a new drawing. The check mark is removed from the template icon.
5) Click on Cancel to close the Templates dialog. The next time a new drawing is created, it will use the LibreOffice default properties.
Editing templatesTemplate styles and template content can be edited, and then, if necessary, reapplied to drawings that were created from that template.
Note
Only template styles and template content can be reapplied. Any drawing content notincluded in the template cannot be reapplied.
Editing
1) Open the Templates dialog:
2) Locate the template for editing and select the template.
Templates | 253

3) Right-click on the selected template and select Edit from the context menu. The template opens in Draw.
4) Edit the template as any other drawing.
5) Go to File > Save on the Menu bar or use the keyboard shortcut Ctrl+S to save the template.
6) To save the edited template as a new template, see “Creating templates from a drawing” on page 250 for more information.
Updating drawings from modified template
The next time a drawing is opened created from the changed template, a confirmation dialog opens asking to update the styles in the drawing to the formatting used in the modified template.
• Click Update Styles to update any styles in the drawing that have been changed in the template and close the confirmation dialog.
• Click Keep Old Styles so that styles in the drawing that have been changed in the template are not updated. The confirmation dialog closes and will not appear again the next time the document is opened.
Organizing templatesLibreOffice can only locate templates that are in LibreOffice template folders (categories). New LibreOffice template categories can be created and used to organize templates. For example, create separate categories for different projects or clients. Templates can also be imported and exported.
Tip
The location of LibreOffice template folders varies with the computer operating system. To learn where the template folders are stored on a computer, go to Tools > Options > LibreOffice > Paths on the Menu bar.
Creating template categories
1) Open the Templates dialog:
2) In the Filter drop-down lists, select Drawing as the application.
3) Click on Settings and select New Category from the context menu.
4) Enter a name in the Enter category name text box in the dialog that opens.
5) Click OK to save the new category in LibreOffice and close the dialog.
Renaming template categories
Using the Templates dialog, template categories supplied with LibreOffice cannot be renamed. Only template categories created using "Creating template categories" above can be renamed.
1) Open the Templates dialog.
2) In the Filter drop-down lists, select Drawing as the application and the category for renaming.
3) Click on Settings and select Rename Category from the context menu.
4) Enter a name in the Enter category name text box in the dialog that opens.
5) Click OK to save the renamed category as a template folder in LibreOffice and close the dialog.
254 | Draw Guide 7.1

Note
If an attempt to rename a supplied category is made, an error message opens stating that the category cannot be renamed.
Deleting template folders
Note
Template categories that were created when LibreOffice was installed cannot be deleted. Only template categories that were created after the installation of LibreOffice can be deleted.
1) Open the Templates dialog.
2) Click on Settings and select Delete Category from the context menu.
3) Select the category in the Delete Category dialog (Figure 274) that opens.
4) Click OK to delete the selected category and close the Delete Category dialog.
5) Click Yes to confirm the deletion of the category.
Note
If an attempt to delete a supplied category installed during the LibreOffice installation is made, an error message opens stating that the category cannot be deleted.
Figure 274: Delete Category dialog
Templates | 255

Figure 275: Select Category dialog
Moving templates
A template is moved from one template category to another as follows:
1) Open the Templates dialog.
2) In the Filter drop-down lists, select Drawing as the application and the category where the template is located.
3) Select the template that is going to be moved.
4) Click on Move and the Select Category dialog (Figure 275) opens.
5) Select a category from Select from Existing Category or enter a name for a new category in Create a New Category.
6) Click OK to move the template to the selected category and close the Select Category dialog.
Importing templates
Templates can be downloaded from many sources, including the official LibreOffice template repository reached through the Extension Manager. Save the template anywhere on a computer, then import it into LibreOffice as follows:
1) Open the Templates dialog.
2) Click on Import and the Select Category dialog opens.
3) Select a category from Select from Existing Category or enter a name for a new category in Create a New Category.
4) Click OK and a file browser window opens.
256 | Draw Guide 7.1

5) Navigate to the folder containing the template, select the template and click Open. The file browser closes and the template appears in the selected category in the Templates dialog.
Note
For more information about using the Extension Manager to import templates, see the Getting Started Guide.
Exporting templates
Export a template from a template category to another location in a computer or network as follows:
1) Open the Templates dialog.
2) In the Filter drop-down lists, select Drawing as the application and the category where the template is located.
3) Select a template for export and click Export to open a file browser window.
4) Navigate to the folder to export the template into.
5) Click OK and the exported template appears in the selected folder.
6) Click Cancel to close the Templates dialog.
Note
Exporting a template does not remove it from the Templates dialog. The action places a copy of the template in the location specified.
Deleting templates
1) Open the Templates dialog.
2) In the Filter drop-down lists, select Drawing as the application and the category where the template is located.
3) Right-click on the template for deletion and select Delete from the context menu.
4) Click Yes to confirm the deletion of the template.
5) Click Cancel to close the Templates dialog.
Tip
Press the Delete key on the keyboard to delete the selected template in the Templates dialog
Note
Templates that were installed when LibreOffice was installed cannot be deleted. Onlytemplates that were created after the installation of LibreOffice can be deleted.
Other ways to create templatesTemplates can be created and stored anywhere on a computer and then used without involving the Templates dialog. However, some results are different from those described earlier in this chapter.
Templates | 257

Drawing from a template
Create a drawing from a compatible template by double-clicking the template in a file browser window. The resulting drawing is not associated with (linked to) the template from which it was created. The template is not listed in the properties of the document and any changes to the template cannot be directly applied to the document. For many purposes, this may be what is required.
Template from a drawing
Create a template from a drawing using File > Save As on the Menu bar and selecting ODF Drawing Template (.otg) as the file type, then saving it anywhere on a computer, for example in aproject folder.
The resulting template is visible in the Templates dialog, unless it is imported it or added to the project folder to the locations shown for templates on the LibreOffice – Paths page of the Tools > Options dialog. See “Organizing templates” on page 254 and “Importing templates” on page 256 for more information.
Multiple layers
Layers in LibreOffice Draw allow assembly of elements in a drawing that are related. Think of layers as individual workspaces that can be hidden from view, prevented from printing, or locked so that changes cannot be made.
Layers do not determine the stacking order of objects on a drawing, except for the Controls layer which is always in front of all other layers. The stacking order of objects on a drawing is determined by the sequence in objects are added. This stacking order can be rearranged by going to Shape > Arrange on the Menu bar.
Layers in a drawing are indicated by tabs located at the bottom of the Workspace and above theStatus bar. Click on a tab to select a layer. Figure 276 shows the Layout layer has been selected.
Figure 276: Layer tabs
Note
When a new layer is added, the layer is added to all pages in a drawing. However, when an object is added to a layer, the object is only added to the selected drawing page.
Note
If an object is to appear on all pages of a drawing (for example, a company logo), add the object to the master page by going to View > Master on the Menu bar. See “Master pages” on page 244 for more information.
Default layers
Normal view
LibreOffice Draw provides three default layers that are visible to the user. These default layers cannot be deleted or renamed.
• Layout – is the default workspace where objects are normally placed.
258 | Draw Guide 7.1

• Controls – used for form controls that have been assigned an action. Objects on this layer are always in front of objects on other layers. Normally, form controls are not printed and the Printable option in the Modify Layer dialog has to be set deselected.
• Dimension Lines – is where the dimension lines are drawn. By switching the layer between show or hide, dimension lines are switched on and off.
Master view
The layer Background objects is where objects are placed that are to appear on every page in a drawing, for example company logo, date, page number, drawing title, and so on.
Inserting layersInserting a layer into a drawing is as follows:
1) Use one of the following methods to open the Insert Layer dialog (Figure 277):
– Right-click the layer tab area at the bottom of the Workspace area and select Insert Layer from the context menu.
– Go to Insert > Layer on the Menu bar.
2) Enter meaningful names for the layer in the Name and Title text boxes.
3) If necessary, enter a description for the new layer in the Description text box.
4) Select Visible for the layer to be visible in a drawing. When Visible is not selected, the layer is hidden and its name in the layer tab changes color to blue.
5) Select Printable for the layer to print when the drawing is printed. The name of a layer is underlined in the layer tab bar when Printable is not selected. For example, not printing alayer is useful if the layer is a draft layer for guides or annotations used in creating the drawing, but do not want this draft layer to appear in the final printed output.
Figure 277: Insert Layer dialog
Multiple layers | 259

6) Select Locked to prevent any objects on a layer from deletion, editing, or moving. No additional objects can be added to a locked layer. Foe example, locking a layer is useful when a base plan is to be protected while adding a new layer with other details. The name of a locked layer is changes to italic text in the layer tab bar.
7) Click OK to close the Insert Layer dialog and the new layer automatically becomes active.
Modifying layersModify any or all of the attributes of an inserted layer as follows:
1) Use one of the following methods to open the Modify Layer dialog. This dialog is similar tothe Insert Layer dialog.
– Right-click the name tab for the layer at the bottom of the Workspace and select Modify Layer from the context menu.
– Click on the layer tab to select it, then go to Format > Layer on the Menu bar.
– Double click on the layer tab.
2) Make the necessary changes to the attributes for the layer, then click OK to save the changes and close the Modify Layer dialog.
Working with layers
Selecting a layer
To select a layer, click on the name tab for the layer at the bottom of the Workspace. When a layer is selected it is activated, and any objects added to the drawing are only added to that layer. Form controls are automatically added to the Controls layer and dimension lines are automatically added to the Dimension Lines layer.
If there are several layers in a drawing, a layer tab may not not be visible on the layer tab bar. Use the navigation icons on the left of the layer tab bar to navigate to the layer for selection.
Hiding layers
1) Open the Modify Layer dialog. See “Modifying layers” above for more information.
2) Deselect the Visible option and click OK. The text on the layer name tab changes color toblue. Any objects placed on a hidden layer are no longer visible on the other layers in the drawing.
3) Alternatively, hold down the Shift key and click on the name tab to hide the layer.
Showing hidden layers
1) Open the Modify Layer dialog. See “Modifying layers” above for more information.
2) Select the Visible option and click OK. The text on the layer name tab changes color to the default text color. Any objects placed on a hidden layer are now visible on the other layers in a drawing.
3) Alternatively, hold down the Shift key and click on the name tab to make the layer visible.
Locking layers
1) Open the Modify Layer dialog. See “Modifying layers” above for more information.
2) Select the Locked option and click OK. The text on the layer name tab is underlined. Locking a layer prevents any modification of the layer.
3) Alternatively, hold down the Ctrl key and click on the name tab to lock the layer.
260 | Draw Guide 7.1

Unlocking layers
1) Open the Modify Layer dialog. See “Modifying layers” above for more information.
2) Deselect the Locked option and click OK. The text on the layer name tab is no longer underlined.
3) Alternatively, hold down the Ctrl key and click on the name tab to lock the layer.
Note
Only layers that have been added to a drawing can be renamed or deleted. The default layers Layout, Controls, Dimension Lines and Background objects cannot be renamed or deleted.
Renaming layers
1) Open the Modify Layer dialog and enter a new name in the Name text box. See “Modifying layers” above for more information.
2) Alternatively, right-click on the name tab of the layer and select Rename Layer from the context menu. The text becomes editable allowing the name to be changed. Click outside the tab area to save the change.
3) Alternatively, hold down the Alt key and click on the name tab. The text becomes editable allowing the name to be changed. Click outside the tab area to save the change.
Deleting layers
1) Right-click on the name tab of the layer and select Delete Layer from the context menu.
2) Confirm the deletion of the layer, The layer and all of the objects on the layer are deleted.
Moving objects between layers
If objects are selected on a layer, the Status bar indicates how many objects are selected. Move these selected objects from one layer to another layer using one of the following methods:
• Click and drag the selected objects to the name tab of the destination layer and release the mouse button. The position of the moved objects does not change and the layer where the objects have been placed is displayed in the Status bar.
• Go to Edit > Cut on the Menu bar or right-click on the selected objects and select Cut from the context menu. Select the destination layer, then go to Edit > Paste on the Menubar or right-click on the Workspace and select Paste from the context menu. The position of the moved objects does not change and the layer where the objects have been placed is displayed in the Status bar.
Dimensioning
Draw allows objects to be dimensioned and display these dimensions to make a drawing look more like an engineering drawing. When dimensions are created, they are automatically placed on the Dimension Lines layer.
Configuring dimensioningTwo ways are available to access the options to configure dimensioning. Both methods use a similar dialog where the length, measurement, and guide properties of a dimension line can be changed.
Dimensioning | 261

Figure 278: Graphic Styles dialog - Dimensioning page
Drawing object styles
1) Open the Graphics Styles dialog (Figure 278) using one of the following methods:
– Go to Format > Styles > Edit Styles on the Menu bar.
– Click on Show the Styles Sidebar on the Line and Filling toolbar to open the Styles deck on the Sidebar, then right-click on a style and select Modify from the context menu.
– Use the keyboard shortcut F11 to open the Styles deck on the Sidebar, then right-clickon a style and select Modify from the context menu.
– Click on Styles on the Sidebar to open the Styles deck, then right-click on a style and select Modify from the context menu.
2) Click on Dimensioning to open the Dimensioning page in the dialog.
3) Make the changes required to dimensioning using the various options in the Line and Legend sections on the Dimensioning page.
4) Click OK to save the changes and close the Graphic Styles dialog.
5) To reset the dimensioning options to the default properties of the template, open the Graphics Style dialog as given in Steps 1 and 2 above, then click on Standard.
Dimension line dialog
1) Draw a dimension line. See “Dimensioning objects” on page 265 for more information.
262 | Draw Guide 7.1

Figure 279: Dimension Line dialog
2) Right-click on the dimension line and select Dimensions from the context menu to open the Dimension line dialog (Figure 279).
3) Make the required changes for dimensioning using the various options in the Dimension line dialog. These options are also available on the Dimensions page in the Graphics Styles dialog.
4) Click OK to save the changes and close the Dimension line dialog.
Dimensioning options
The dimensioning options in the Dimensions page in the Graphics Style dialog and the Dimension Line dialog are as follows. The preview in the dialog changes as the following options are changed showing how the dimension line appears in a drawing. An example dimension line isshown in Figure 280.
• Line – sets the distances between the dimension line and guides with respect to each other, the dimension baseline and the object. The baseline is not visible in a drawing, but is indicated by baseline points on each of the guides.
– Line distance – specifies the distance between the dimension line and the object or the baseline. A minimum of -10mm to a maximum of 10mm can be entered in the text box. The lower the value, the closer the dimension line is to the object or baseline.
Dimensioning | 263

Figure 280: Example of a dimension line
– Guide overhang – is the distance the guide either extends above the dimension line oris below the dimension line. A minimum of -10mm to a maximum of 10mm can be entered in the text box. Positive values cause the guide overhang to extend above thedimension line. Negative values cause the guide overhang to be below the baseline.
– Guide distance – specifies the length of the right and left guides below the dimension line toward the object. A minimum of -10mm to a maximum of 10mm can be entered in the text box. Positive values extend the guides above the baseline and further awayfrom the object. Negative values extend the guides below the baseline and closer to the object.
– Left guide – specifies the length of the left guide starting at the dimension line. A minimum of -10mm to a maximum of 10mm can be entered in the text box. Positive values extend the guide below the dimension line toward the object. Negative values move the guide away from the object.
– Right guide – specifies the length of the right guide starting at the dimension line. A minimum of -10mm to a maximum of 10mm can be entered in the text box. Positive values extend the guide below the dimension line toward the object. Negative values move the guide away from the object.
– Measure below object – reverses the positions and lengths of the dimension line and guides set in Line options.
– Decimal places – specifies the number of decimal places used for the display of line properties.
• Legend – sets the properties of the dimension text.
– Text position – determines the position of the dimension text with respect to the dimension line and the guides. The AutoVertical and AutoHorizontal checkboxes mustbe empty before a text position can be assigned.
– AutoVertical – determines the optimal vertical position for the dimension text.
– AutoHorizontal – determines the optimal horizontal position for the dimension text.
– Parallel to line – displays, when selected, the text parallel to the dimension line or, when deselected, at 90 degrees to the dimension line.
– Show measurement units – shows or hides the dimension measurement units. A measurement unit can be selected from the drop-down list.
264 | Draw Guide 7.1

Note
The dimensioning options are linked and stored with the current work page. All the changes that made apply only to this drawing. New drawings are started with the standard properties of Draw. If the dimensioning options are to be used for future drawings, save the drawing as a template.
Guide selection handles
The guide selection handles at the top and bottom of the guides are used to extend the guides more than the limits of -10mm to 10mm. With reference to the dimension example in Figure 280, the guide selection handles are used as follows:
• Top guide selection handles – select either selection handle and drag the handle to increase or decrease the guide overhang of both guides.
• Lower left guide selection handle – select the left guide selection and drag the handle to increase or decrease of the left guide distance.
• Lower right guide selection handle – select the right guide selection and drag the handle to increase or decrease of the right guide distance.
Tip
When dimensioning objects, it is recommended to use the zoom function, guide linesand snap functions so dimension lines can be accurately placed on an object. See Chapter 3, Working with Objects and Object Points for more information.
Dimensioning objects1) Click on the small triangle ▼ next to the Lines and Arrows icon on the Drawing toolbar
to open the Lines and Arrows pop-up toolbar (Figure 281).
2) Click on Dimension Line and the cursor changes to shape, for example to a cross. The shape depends on the computer setup.
3) Position the cursor at one corner of the object, then click and drag the cursor to the other corner of the object to draw the dimension line. To restrict drawing the dimension line in the horizontal or vertical direction, press and hold the Shift key while dragging the cursor.
4) Release the mouse button when the other corner of the object is reached and the dimension line is drawn with the dimension automatically added (as shown in Figure 282).The dimension line is also placed automatically on the Dimension Lines layer.
5) To edit the text of the dimension, double-click on an unselected dimension line to enter text edit mode and make any necessary changes. Click outside the dimension line to save the changes.
6) To configure the dimension line, see “Configuring dimensioning” on page 261.
Note
After editing the dimension text, entering text and then deleting text, save the drawing and reopen it to enable automatic measurements for dimensioning.
Figure 281: Lines and Arrows sub-toolbar
Dimensioning | 265

Figure 282: Example of dimensioning objects
Note
If drawing to scale (see below), the dimension configuration values in the Graphics Style dialog and the Dimension Line dialog will also be to scale. For example, a valueof 10mm in the dialog results in a dimension value of 300mm if the scale has been set to 1:30.
Drawing to scale
In Draw, the predefined drawing area is called the Workspace is normally Letter or A4 page size depending on the computer setup and the default printer connected to the computer. However, depending on the actual size of the drawn objects, it is often convenient to reduce or enlarge the drawing by scaling (for example 1:10 or 2:1).
Specify the drawing scale value by going to Tools > Options > LibreOffice Draw > General (Figure 283) and selecting a value from the Drawing scale drop-down list. The default setting forthis option is 1:1. When a change is made to the drawing scale, it is reflected in the rulers at the top and left side of of the Workspace.
Any change in the drawing scale has no effect on the basic drawing operations. Draw automatically calculates the necessary values (for example, dimension lines). The spacing of the grid points is independent of drawing scale as the grid is only a visual drawing aid and not a drawing element.
Figure 283: Options LibreOffice Draw dialog - General page
266 | Draw Guide 7.1

Figure 284: Examples of drawing to scale
An increase in scale (for example 1:4) allows large objects to be drawn that would not fit into the paper size for a drawing. A decrease in drawing scale (for example 4:1) allows small objects to be drawn accurately at an increased size and make them easier to understand. Examples of drawing to scale are shown in Figure 284 where all three rectangles are the same size in the drawing.
• Left rectangle – drawn at the default 1:1 scale and dimensioned.
• Center rectangle – drawing scale changed to 1:4 and the dimensions were automaticallyincreased by Draw to reflect the decrease in scale.
• Right rectangle – drawing scale changed to 4:1 and the dimensions were automatically decreased by Draw to reflect the increase in scale.
Multiple views of a drawing
Several views of the same drawing can be opened and used in LibreOffice Draw. These views are displayed in windows that can use different settings for layers (visible, printable and locked), different zoom levels, different origins, or display different pages of the drawing and even use master page and normal page at the same time. However, make sure that the correct view is active when saving a drawing.
To open a new window showing the drawing, go to Window > New Window on the Menu bar. Arrange the windows according to the computer operating system and display preferences. Eachwindow open acts on the same drawing. A change to the drawing in one window is immediately reflected in the other windows.
In each window opened, the filename in the title bar is automatically numbered as shown by the example in Figure 285. If other LibreOffice documents are open at the same time, the list of windows includes all the open documents. The active window has a marker by its filename in the list. Switch between windows by clicking on a name in the list, or by clicking on the window itself if it is visible on the display.
To close a window, go to Window > Close Window on the Menu bar, or use the keyboard shortcut Ctrl+W, or click on Close in the Menu bar of the window.
Figure 285: Example of multiple windows
Multiple views of a drawing | 267

Figure 286: Gallery deck in Sidebar
Gallery
Draw includes several images in the Gallery. These images are grouped into themes (for example Arrows, Bullets, Diagrams, and so on). The Gallery deck on the Sidebar (Figure 286) lists the available themes. Click on a theme and its images are displayed below the theme list.
• For a detailed view of the images in a gallery theme, click on Detailed View at the bottom of the Sidebar.
• For an icon view of the images in a gallery theme, click on Icon View at the bottom of theSidebar
Using the Gallery1) Click on Gallery on the Sidebar, or go to Insert > Media > Gallery on the Menu bar.
2) Select a theme from the available options.
3) Use one of the following methods to place an image into a drawing:
– Click on an image in the Gallery deck and drag the image into a drawing.
– Right-click on an image and select Insert from the context menu. The image is placedat the centre of a drawing.
– Right-click on an image and select Copy from the context menu. Paste the image intothe drawing and the image is placed at the center of the drawing.
4) Edit the gallery image to the drawing requirements. For more information on editing images and pictures, see Chapter 6, Editing Pictures.
268 | Draw Guide 7.1

Figure 287: Properties of New Theme dialog - General page
Figure 288: Properties of New Theme dialog - Files page
Creating themes and adding images1) Open the Gallery deck on the Sidebar.
Gallery | 269

2) Click on New on the Gallery deck to open the Properties of New Theme dialog (Figure 287).
3) Enter a name for the theme in the text box.
4) Click on Files to open the Files page as shown by the example in Figure 288.
5) Click on Find Files to open a Select Path dialog.
6) Browse to the folder that contains the images required and select the folder
7) Click OK to select the files contained in the folder and the Select Path dialog closes. The list of files contained in the folder now appear in the Files page as shown by the example in Figure 288.
8) Select the files required for the new theme and click Add. The selected files disappear from the file list and the images appear in the Gallery.
9) If all the files in the list are to be added, click Add All. All the files disappear from the list and the images appear in the Gallery.
10) Click OK when finished adding files and close the Properties of New Theme dialog. The name of the new theme appears in the Gallery deck.
Note
If a Draw object is added to a theme, the object loses its connection to Draw graphic styles and all properties are set as direct formatting.
Deleting gallery themes and images1) Right-click on a theme or image in the Gallery and select Delete from the context menu.
2) Click Yes in the confirmation dialog and the image or theme is deleted from the Gallery.
Note
Only themes and images that have added to Draw can be deleted. The themes and images that were included with the installation of LibreOffice cannot be deleted.
Note
An image is a linked file and only the link is deleted from the Gallery. The original image file is not deleted.
Updating the GalleryAll images in the Gallery are linked files. Occasionally, it is beneficial to update a theme that has been added to Draw to make sure that all files are still accessible. Right-click on a theme that hasat least one file added to the theme and select Update from the context menu.
Renaming themesTo rename a theme that has been added to Draw, right-click on the theme name and select Rename from the context menu.
Note
Only themes and images that have added to Draw can be renamed. The themes andimages that were included with the installation of LibreOffice cannot be renamed.
270 | Draw Guide 7.1

Colors
Draw (like all LibreOffice components) uses colors grouped into color palettes. Colors can be created to suit drawing requirements. All custom colors created are placed in the custom color palette. The following color models can be used to create a custom color.
• RGB – stands for Red, Green, Blue. The RGB color model is based on the additive color model of light waves and is designed for electronic displays and computers. This means, the more color added, the closer a color moves towards white. RGB is created using scales from 0 to 255. This means that black is when R=0, G=0, and B=0 and white is when R=255, G=255, and B=255. LibreOffice uses the RGB color model internally for printing in all of its software modules.
• CMYK – stands for Cyan, Magenta, Yellow, Key (Black). It is a subtractive color model where colors are subtracted to get to white. It is mainly used in printing, which is why the ink cartridges for a printer are labeled CMYK. CMYK works on a scale of 0 to 100. If C=100, M=100, Y=100, and K=100, the color produced is black. If C=0, M=0, Y=0, and K=0, the color produced is white.
• HSB – stands for Hue, Saturation, Brightness. HSB values are an alternative representation of the RGB color model and was designed to be more closely aligned withthe way human vision perceives color-making attributes. Use HSB values to fine tune any custom colors that are created.
Tip
More information on color models and color values can be found at http://en.wikipedia.org/wiki/Color_model.
Changing colorsWhen changing colors in objects, color palettes are used to select colors. These color palettes are installed with LibreOffice and are used in all the LibreOffice modules. Using these color palettes is similar across all types of objects, but accessing the color palettes does vary according to the type of object selected.
Color Bar
Although LibreOffice includes tools that to precisely specify a color, it also includes a Color Bar (Figure 289) that allows the area fill, border, or line color of an object to be quickly changed in a drawing.
Figure 289: Color Bar (Color Palette)
Colors | 271

Note
The colors available in the Color Bar depend on the color palette that had been previously used when changing color on an object. For example, Figure 289 shows the Standard color palette that had been used previously when changing color to an object using a properties dialog.
1) Select an object in the drawing.
2) Go to View > Color Bar on the Menu bar to open the Color Bar.
3) Left click on a color to change the area fill color or right-click on a color to change the border or line color of a selected object.
4) Left click on the X box in the bottom left corner of the Color Bar to remove the color from an object fill, or right-click on the X box in the bottom left corner of the Color Bar to remove the color from an object border,
5) To close the Color Bar, go to View > Color Bar on the Menu bar and deselect Color Bar.
Area dialog
1) Select an object in the drawing.
2) Open the Area dialog (Figure 290) using one of the following methods:
– Go to Format > Area on the Menu bar.
– Right-click on the object and select Area from the context menu.
3) Click on Color to open the Color page.
4) In Colors, select a color palette from the Palette drop-down list.
Figure 290: Area dialog - Color page
272 | Draw Guide 7.1

5) Click on a color from the ones displayed, or select a color that has been previously used from Recent Colors.
6) Click OK to save the changes and close the Area dialog. The selected fill color appears inthe selected object.
Area section on the Sidebar
1) Select an object in the drawing.
2) Open the Area section in the Properties deck on the Sidebar (Figure 291).
3) Select Color from the Fill drop-down list.
4) Click on the small triangle ▼ on the right of Fill Color to open the palette last used.
5) Select a color palette to use from the palette drop-down list.
6) Click on a color from the colors displayed, or select a color that has been previously used from those displayed in Recent. The color palette closes and the selected fill color is applied to the object.
Figure 291: Area section in Properties deck on Sidebar
Fill Color on the Line and Filling or Drawing toolbars
1) Select an object in the drawing.
2) Click on the small triangle ▼ to the right of Fill Color on the Line and Filling or Draw toolbar to open the last palette used.
3) Select a color palette to use from the palette drop-down list.
Colors | 273

Figure 292: Line dialog
4) Click on a color from the colors displayed, or select a color that has been previously used from those displayed in Recent. The color palette closes and the selected fill color is applied to the object.
Line dialog
1) Select a line or an object in the drawing.
2) Open the Line dialog (Figure 292) using one of the following methods:
– Go to Format > Line on the Menu bar.
– Right-click on the line or object and select Line from the context menu.
3) Click on Line to open the Line page.
4) Click on the small triangle ▼ to the right of Color to open the last palette used.
5) Select a color palette to use from the palette drop-down list.
6) Click on a color from the colors displayed, or select a color that has been previously used from those displayed in Recent. The color palette closes and the selected line color is applied to the line or object border.
7) Click OK to save the color change and close the Line dialog.
Line section on the Sidebar
1) Select a line or an object in the drawing.
2) Open the Line section in the Properties deck on the Sidebar (Figure 293).
3) Click on the small triangle ▼ to the right of Line Color to open the palette last used.
4) Select a color palette to use from the palette drop-down list.
5) Click on a color from the colors displayed, or select a color that has been previously used from those displayed in Recent. The color palette closes and the selected line color is applied to the line or object border.
274 | Draw Guide 7.1

Figure 293: Line section in Properties deck onSidebar
Line Color on the Line and Filling or Drawing toolbars
1) Select a line or object in the drawing.
2) Click on the small triangle ▼ to the right of Line Color on the Line and Filling or Draw toolbar to open the last palette used.
3) Select a color palette to use from the palette drop-down list.
4) Click on a color from the colors displayed, or select a color that has been previously used from those displayed in Recent. The color palette closes and the selected line color is applied to the line or object border.
Changing text colorChanging text color is very similar to changing the color of an area fill, object border, or line. The Text Formatting toolbar automatically opens and replaces the Line and Filling toolbar when text isselected in a drawing. If the Text Formatting toolbar does not appear, go to View > Toolbars on the Menu bar and select Text Formatting.
Colors | 275

Figure 294: Character dialog - Font Effects page
Character dialog
1) Select the text in a text box or object and make sure the text is highlighted.
2) Open the Character dialog (Figure 294) using one of the following methods:
– Go to Format > Character on the Menu bar.
– Right-click on the highlighted text and select Character from the context menu.
3) Click on Font Effects to open the Font Effects page.
4) Click on the small triangle ▼ to the right of Font Color to open the last palette used.
5) Select a color palette to use from the palette drop-down list.
6) Click on a color from the colors displayed, or select a color that has been previously used from those displayed in Recent. The color palette closes and the selected color is applied to the selected text.
7) Click OK to save the color change and close the Character dialog.
Character section on the Sidebar
1) Select the text in a text box or object and make sure the text is highlighted.
2) Open the Character section in the Properties deck on the Sidebar (Figure 295).
3) Click on the small triangle ▼ to the right of Font Color to open the palette last used.
4) Select a color palette to use from the palette drop-down list.
276 | Draw Guide 7.1

Figure 295: Character section in Properties deck on Sidebar
5) Click on a color from the colors displayed, or select a color that has been previously used from those displayed in Recent. The color palette closes and the selected color is applied to the selected text.
Creating colors
Using Pick a Color dialog
1) Select the object or text and open the Pick a Color dialog (Figure 296) using one of the following methods:
– Open the Area dialog, then click on Color to open the Color page and click on Pick.
– Open the Area section in Properties deck on the Sidebar, click on the small triangle ▼to the right of Fill Color to open the color palette and click on Custom Color at the bottom of the color palette.
– Open the Line dialog, then open a color palette in Color and click on Custom Color at the bottom of the color palette.
– Open the Line section in Properties deck on the Sidebar, click on the small triangle ▼to the right of Line Color to open the color palette and click on Custom Color at the bottom of the color palette.
– Open the Character dialog, then open a color palette in Font color and click on Custom Color at the bottom of the color palette.
– Open the Character section in Properties deck on the Sidebar, click on the small triangle ▼to the right of Font Color to open the color palette and click on Custom Color at the bottom of the color palette.
Colors | 277

Figure 296: Pick a Color dialog
2) Select a color range in the vertical color bar on in the Pick a Color that approximately matches the custom color being created.
3) Click and drag the small target circle in the color box until the color matches the custom color required. The values for RGB, HSB and CMYK change as the small target circle is dragged around the color box. This helps in creating the exact color if these color values are known.
4) Alternatively, if the color values or hex number are known, enter these values in the appropriate text box. The values in all the text boxes changes to match the new values. For example, enter HSB values, the RGB, CMYK and Hex values also change to match.
5) Click OK to save the changes and close the Pick a Color dialog.
Note
When using the Line or Character dialog to open the Pick a Color dialog, the custom color created cannot be saved into the Custom color palette or renamed with a more meaningful name. The custom color created is named using the hex value that is displayed in the Pick a Color dialog. Only the Area dialog has the ability to rename custom colors and save custom colors into the Custom palette.
278 | Draw Guide 7.1

Note
LibreOffice uses the RGB color model for printing in color. The RGB values of a selected color are displayed below the preview boxes.
Using Area dialog
1) Open the Area dialog and click on Color to open the Color page.
2) In New, enter the RGB values or, if known, the Hex value into the text boxes. The color changes in the preview box to match the values entered.
3) Alternatively, in New, use the minus and plus signs for the RGB values to decrease or increase the values. The color changes in the preview box to match the values entered.
4) Click OK to change the color and close the Area dialog.
Adding custom colorsIf necessary, add a custom color to the Custom color palette using the Area dialog as follows:
1) Make sure the Area dialog is open at the Color page.
2) Select the custom color that is displayed in Recent Colors.
3) Click on Add to open a Name dialog.
4) Enter a new name for the color in the text box,
5) Click OK to save the changes and close the Name dialog. The custom color appears in the Custom palette.
6) Click OK to close the Area dialog.
Renaming custom colorsOnly a custom color can be renamed using the Area dialog as follows:
1) Make sure the Area dialog is open at the Color page.
2) Select the custom color that is displayed in the Custom color palette.
3) Click on Add to open a Name dialog.
4) Enter a new name for the color in the text box,
5) Click OK to save the changes and close the Name dialog. The custom color appears in the Custom palette.
6) Click OK to close the Area dialog.
Note
Renaming a custom color does not actually rename the custom color, but adds the custom color to the Custom palette with a new name.
Note
It is important to use a memorable names for custom colors so that they can be easily recognized in the Custom palette. By default, a custom color is given a hex number, which makes it difficult identifying colors when there is more than one custom color.
Colors | 279

Deleting custom colorsOnly a custom color can be deleted using the Area dialog as follows:
1) Make sure the Area dialog is open at the Color page.
2) Select the custom color that is displayed in the Custom color palette.
3) Click on Delete. There is no confirmation given when deleting custom colors.
4) Click OK to close the Area dialog.
Bézier curves
In LibreOffice, Bézier2 curves can be used in a drawing. A curve is defined by means of a start point, an end point, and, where necessary, control points. For points on the curve the terms nodes or anchors are often used. For more information and an explanation of the mathematical background of Bézier curves, see http://en.wikipedia.org/wiki/Bezier_curve.
Bézier curves are very useful for experimenting with the shape and form of curves. In point modethe curve alignment can be changed by dragging the points with the cursor. In the example shown in Figure 297, the curve leaves the start point P0 in the direction of the first control point P1 and arrives at the end point P3 from the direction of the second control point P2. The more distant a control point is from the start or end point, the smaller the curvature at that point.
Drawing Bézier curves1) Click on Curve in the Curves and Polygons section in the Shapes deck on the Sidebar or
in the Drawing toolbar.
2) Click at the start point for the curve and drag the cursor to the approximate position of theend point for the curve.
3) Release the mouse button and drag the end point of the curve to its end position.
4) Double-click when the end position of the curve is reached and a curve is drawn. The arc of the curve is determined by the distance dragged to create the end point.
Figure 297: Example of a Bézier curve
2 Bézier curves were invented by Pierre Bézier, an engineer working with the Renault car manufacturer, who developed the technique in the 1960s. The technology was intended to make modeling the surface of vehicles easier.
280 | Draw Guide 7.1

Figure 298: Edit Points toolbar
5) Switch to points mode using one of the following methods:
– Go to Edit > Points on the Menu bar.
– Click on Points on the Standard toolbar.
– Use the keyboard shortcut F8.
6) Open the Edit Points toolbar (Figure 298) using one of the following methods. The Edit Points toolbar does not become visible until a point has been selected on a curve.
– Go to View > Toolbars on the Menu bar and select Edit Points.
– Click on Points on the Standard toolbar.
– Use the keyboard shortcut F8.
– If added to the toolbar, click on Points on the Drawing toolbar.
7) Click once on the curve to display the start and end points. The start point of the curve is larger than the end point.
8) Click on a start or end point to display the control points. Control points appear at the end of a dashed line connected to the selected point, as shown in Figure 297.
9) Click on the control point and drag it to a new position to change the shape of the curve.
10) When the shape of the curve is correct, release the mouse button to fix the curve.
11) Click anywhere on the workspace to deselect the curve and stop editing points.
Edit Points toolsAfter the initial opening of the Edit Points toolbar, when an object is selected that has been converted to a curve or polygon, the toolbar is displayed. The tools available on the Edit Points toolbar allow the editing of a Bézier curve and changing of the curve shape. A point on a Bézier curve has to be selected for all the tools on the Edit Points toolbar to become available.
• Move Points – click and drag on a point to move it to another location.
– The curve on both sides of the point follows the movement and changes shape as theselected point changes position.
– Click and drag on the curve between points to move the entire curve without distortingthe form.
• Insert Points – activates the insert mode when selected and inserts smooth points onto a curve. Insert mode remains active after inserting points. Select Move Points to deactivate insert mode.
– The inserted point can be moved while insert mode is activated.
– If a corner or symmetrical point is required, insert a smooth point first and convert the point to a corner or symmetrical point.
• Delete Points – deletes selected points. If several points are to be deleted, hold down the Shift key whilst selecting points and before clicking on Delete Points.
Bézier curves | 281

Figure 299: Example of converting a curved segment to a line
• Convert To Curve – converts a curve into a straight line or a straight line into a curve as shown in Figure 299.
– Select a single point and the curved segment after the point converts to a straight line,or coverts a straight line segment to a curve after the point.
– When converting a segment from a curve to a straight line, each point at each end of the segment becomes a control point similar to the start or end point.
– When converting a segment from a straight line to a curve, each control point at each end of the segment becomes a smooth point.
• Close Bézier – closes a freeform line or curve by connecting the start point with the end point creating an object with area fill.
• Split Curve – splits a curve into two or more curves. Select a point or points and click on Split Curve to create separate segments of a curve. Deselect the curve, then select a segment to move or edit it.
• Corner Point – converts a selected point into a corner point, as shown in Figure 300. Corner points have two movable control points, which are independent from each other, and allows a corner to be created in a curve.
Figure 300: Example of a corner point
• Smooth Transition – converts a corner or symmetrical point into a smooth point, as shown in Figure 301. Both control points of a smooth transition point are aligned in parallel and can only be moved simultaneously. The control points may differ in length, allowing the degree of curvature to be varied.
Figure 301: Example of a smooth transition point
282 | Draw Guide 7.1

• Symmetric Transition – converts a corner point or a smooth point into a symmetrical point, as shown in Figure 302. Both control points of a symmetrical transition point are aligned in parallel and have the same length. These control points can only be moved simultaneously and the degree of curvature is the same in both directions.
Figure 302: Example of a symmetrical transition point
• Eliminate Points – allows selection of several points before using the Delete Points tool. This is useful when deleting a straight line segment to create a complete curve.
Adding comments to a drawing
Draw supports comments similar to those in Writer and Calc. For more about adding, navigating, and replying to comments, see the Getting Started Guide for more information. Comments in Draw cannot be printed. To reply to a comment in Draw, a new comment has to be added.
Figure 303: Comment in Draw
1) Go to Insert > Comment on the Menu bar and a comment box (Figure 303) appears in the upper left-hand corner of a drawing. Draw automatically adds the user name and dateat the bottom of the comment and places a comment marker on the drawing page.
2) Type or paste a comment into the comment text box.
3) To apply basic formatting to the text, right-click on the text and select the formatting optionfrom the context menu.
4) To delete a comment, use one of the following methods:
– Right-click in the comment box and select a delete option from the context menu.
– Right-click on the comment marker and select a delete option from the context menu.
Adding comments to a drawing | 283

– Click on the small triangle ▼ in the bottom right of the comment box and select a delete option from the context menu.
5) To move a comment, click on the comment marker and drag it to a new position.
6) To hide comments, use one of the following methods:
– Go to View on the Menu bar and deselect Comments to hide the comment and the comment marker.
– Click on the drawing outside of the comment to hide the comment. The comment marker remains visible.
7) To show comments, go to View > Comments on the Menu bar and click on the comment marker.
Note
For the user name and initials to appear in a comment, enter the user data in Tools > Options > LibreOffice > User Data dialog. If more than one person edits the document, each author is automatically allocated a different background color.
Connecting and breaking lines
It is possible in Draw to connect separate line elements together to make one line, or break a linethat is composed of separate elements.
• To connect lines, select the lines and go to Shape > Connect on the Menu bar. The end points on the line are joined together. The resulting shape is a freeform line and not a closed shape.
• To break a line that is composed of separate elements, select it and go to Shape > Break on the Menu bar. Deselect the object, then select each separate element. Each separate element is indicated with start and end points. Click on an element and drag it to a new position.
Coordinate system
X and Y axesThe x-axis is the horizontal position of an object and the y-axis is the vertical position of an object. The rulers do not show a minus sign if there are negative coordinates. However, the minus sign for negative coordinates is shown in the position field in the Status Bar and the Position and Size dialog.
WorkspaceThe Workspace in Draw is larger than the drawing page. The area outside the drawing page is one page width right and left and a half page above and below the drawing page. The size of the drawing page is indicated by highlighted portions in the horizontal and vertical rulers.
Draw objects can be drawn partly or wholly outside the drawing page and these objects are saved with the drawing. However, when the drawing is printed or exported, any object or portion of an object not on the drawing page is not included. This allows the Workspace area around the drawing page to be used for drafts when creating objects.
284 | Draw Guide 7.1

Object positionThe coordinates of objects and snap guides are shown relative to the origin. The default origin forcoordinates (0.00/0.00 position) is the top-left corner of the drawing page without margins or the top left corner of the drawing page where the margins intersect. To change the default origin, click and drag the intersection of the rulers in the top left corner of the Workspace to the desired position. Guide lines appear as the intersection is dragged from its default origin to its new position. This origin setting is only for the current view and is not saved in the document.
The area inside the default origin is the area used for the grid when the option Snap to Grid and Display Grid are selected.
To reset the default origin back to its original setting at the top-left corner of the page, double-click in the top-left corner on the Workspace where the horizontal and vertical rulers meet.
AccuracyDraw uses internally integer values in 1/100 mm. Therefore, for example, it is not possible to get an exact position for 1/8 inch. Also, many dialog fields are restricted to two decimals.
To work with the maximum possible accuracy, go to Tools > Options > Draw > General and set the option Unit of measurement to Millimeter. The rulers will show metric units after this option has been selected, To use another measurement unit for the rulers, right-click on a ruler and select the measurement unit from the context menu. The horizontal and vertical rulers can have different measurement units.
Coordinate system | 285

Draw Guide
Chapter 12, User Interface Variants

Introduction
By default, commands and tools used in LibreOffice Draw are grouped in a user interface consisting of cascading menus and toolbars. The functions and use of these cascading menus and toolbars are described in previous chapters of this user guide.
This chapter describes the user interface variants that are available for LibreOffice Draw. A user then has the option to select the user interface that suits their requirements and methods of creating drawings in LibreOffice Draw.
Note
When changing the user interface, the variant can be applied only to LibreOffice Draw, or applied to all the modules in LibreOffice.
Selecting user interface
To select a user interface variant or switching between the user interface variants:
1) Go to View > User Interface on the Menu bar to open the Select Your Preferred User Interface dialog (Figure 304).
2) In UI variants, select one of the variants. An example of the selected variant is shown in the Preview box, along with a short description.
3) Click on Apply to Draw to apply the variant selection to LibreOffice Draw only, or click on Apply to All to apply the variant to all the LibreOffice modules. The LibreOffice window changes to match the selected variant.
4) Click Close to close the dialog.
Figure 304: Select Your Preferred User Interface dialog
Note
If the option Enable experimental features has been selected in the Tools > Options > Advanced dialog, several more variants appear in UI variants. Being experimental, these variants are not described in this user guide.
Selecting user interface | 287

Figure 305: Standard Toolbar user interface in LibreOffice Draw
Note
In all the user interface variants, the Sidebar can be hidden or shown by clicking on the Hide/Show button on the left of the Sidebar,
Standard Toolbar UI
The Standard Toolbar user interface is the default view when LibreOffice is installed and the Workspace opened for the first time. Figure 305 shows an example of the default Workspace view in LibreOffice Draw, which normally consists of the following.
• Menu bar at the top of the Workspace.
• Standard toolbar positioned below the Menu bar.
• Line and Filling toolbar positioned below the Standard toolbar.
• Drawing toolbar positioned vertically on the left of the Workspace.
• Sidebar positioned on the right of the Workspace.
For more information on the Draw Workspace, see Chapter 1, Introducing Draw.
Tabbed UI
The Tabbed user interface provides a familiar interface for users coming from proprietary office suites, for example Microsoft Office. This user interface is divided into tabs, where each tab displays a set of tools grouped by context. The context changes depending on the object selected and the LibreOffice module being used.
It includes a Menu bar, a Tab bar, and tool icons grouped in context that would be normally used in LibreOffice Draw. If the tool icons on a tab page do not fit into the width of the Draw window, a double chevron >> appears at the right end of the row. Click the double chevron >> to display more commands.
288 | Draw Guide 7.1

Figure 306: Quick menu options
Figure 307: Icon bar
On Windows and Linux operating systems, the Menu bar can be hidden or displayed by clicking on Menubar at the left end of the Tab bar.
On the right of the Tab bar, a Quick menu (≡) (Figure 306) is available giving access to some commonly used commands and links. Some of the Quick menu items have submenus, indicated by a small triangle ► on the right. The Quick menu is the same for all tabs.
On the left of the Tab bar, an Icon bar (Figure 307) is available giving access to some commonly used tools – Menu bar; Open (Ctrl+O); Save (Ctrl+S);Undo (Ctrl+Z); Redo (Ctrl+Y).
The Tabbed user interface can be customized using the Notebookbar page of the Customize dialog to show or hide the individual tools on the various tabs. For more information on customization of LibreOffice, see the Getting Started Guide and the Writer Guide.
Note
When using the Tabbed user interface, the Draw toolbars are removed from view. If itis necessary, toolbars can be opened and used by going to View > Toolbars on the Menu bar or Quick menu > Toolbars.
Fixed tabsThe fixed tabs in the Tabbed user interface for Draw are described on the following pages. The illustrations show the left and right ends of the tabs separately so they are large enough to more easily see the commands.
File tab
The File tab (Figure 308) is a fixed tab providing commands to create new documents; open, save, print, and close documents; manage templates; export to PDF and EPUB; display document properties; add a digital signature; and sign an existing PDF.
The File tab has two menus (Figures 309 and 310): File and Help. The File tab menu contains the same commands as the tools available on the tab. The Help tab menu provides links to a variety of resources.
Tabbed UI | 289

Figure 308: Tabbed user interface - File tab
Figure 309: File tab menu
Figure 310: Help tab menu
290 | Draw Guide 7.1

Home tab
The Home tab (Figure 311) is a fixed tab providing commands to cut, copy, paste, and format text; insert common items (for example images, tables, charts); apply, update, and edit drawing styles; and so on. The Home tab menu (Figure 312) at the right end of the Tab bar provides additional commands that are not on the tab.
Figure 311: Tabbed user interface - Home tab
Figure 312: Home tab menu
Insert tab
The Insert tab (Figure 313) is a fixed tab providing commands to insert many commonly used items. The Insert tab menu (Figure 314) at the right end of the Tab bar provides some of the same commands.
Figure 313: Tabbed user interface - Insert tab
Tabbed UI | 291

Figure 314: Insert tab menu
Layout tab
The Layout tab (Figure 315) is a fixed tab providing commands to create the drawing page layout. The Layout tab menu (Figure 316) provides extra commands to create the drawing page layout.
Figure 315: Tabbed user interface - Layout tab
292 | Draw Guide 7.1

Figure 316: Layout tab menu
Review tab
The Review tab (Figure 317) is a fixed tab providing commands for spell checking text; inserting and deleting review comments; and redaction. The Review tab menu (Figure 318) provides additional text editing commands. Some of these commands appear only if Asian or Complex Text Layout are selected in Tools > Options > Language Settings > Languages.
Figure 317: Tabbed user interface - Review tab
Figure 318: Review tab menu
Tabbed UI | 293

View tab
The View tab (Figure 319) is a fixed tab providing commands for the display of a drawing on screen. The View tab menu (Figure 320) provides additional commands relating to the display ona drawing on screen.
Figure 319: Tabbed user interface - View tab
Figure 320: View tab menu
294 | Draw Guide 7.1

Extension tab
The Extension tab (Figure 321) is a fixed tab containing only the command to access the Extension Manager allowing the installation of extensions that are compatible for use in LibreOffice.
Figure 321: Tabbed user interface - Extension tab
Tools tab
The Tools tab (Figure 322) is a fixed tab providing several tools for macros; color replacer; mediaplayer; and form creation. The Tools tab menu (Figure 323) provides some of the same commands, plus extra tools for organizing macros and dialogs; image map; data sources; filter settings; extension manager; and options.
Figure 322: Tabbed user interface - Tools tab
Figure 323: Tools tab menu
Tabbed UI | 295

Additional tabsAdditional tabs appear when an object in Draw is selected and are displayed between the View and Extension tabs. The illustrations show the left and right ends of the tabs separately so they are large enough to more easily see the commands.
Draw tab
The Draw tab (Figure 324) is only available when a draw object is selected in a drawing. It provides commands for editing, transforming, grouping, aligning, and distributing draw objects. The Draw tab menu (Figure 325) provides a similar set of commands for editing, transforming and converting draw objects.
Figure 324: Tabbed user Interface - Draw tab
Figure 325: Draw tab menu
296 | Draw Guide 7.1
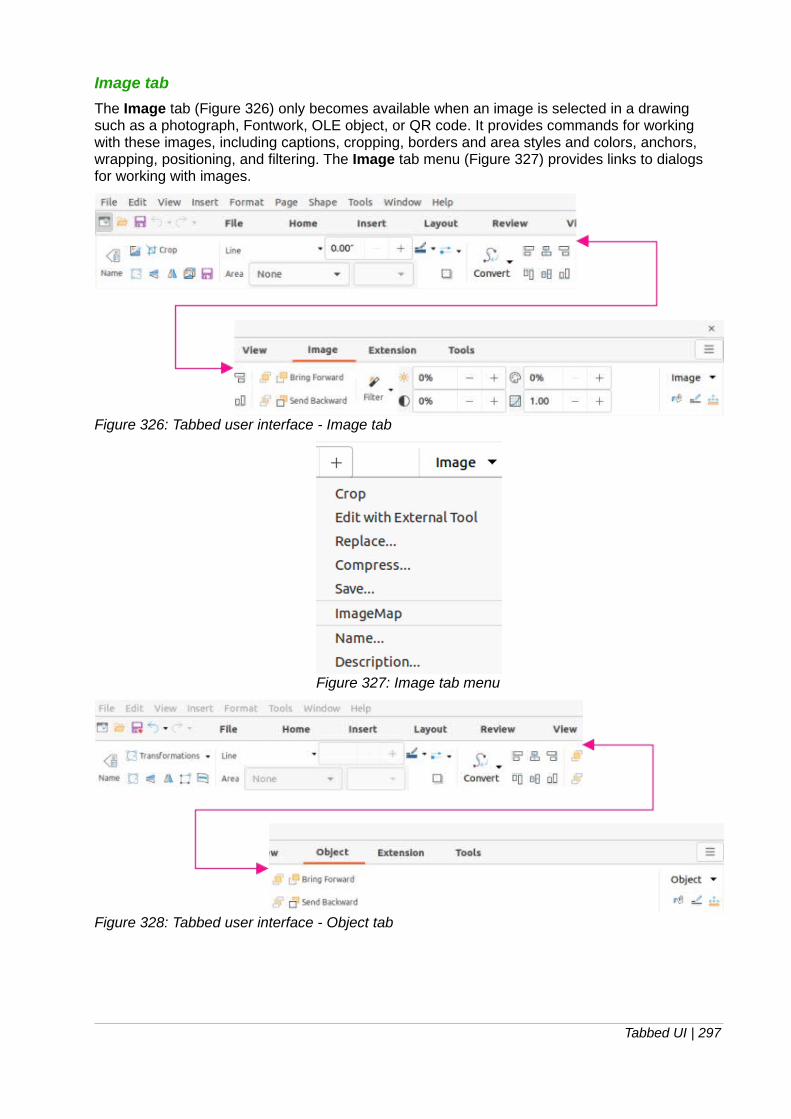
Image tab
The Image tab (Figure 326) only becomes available when an image is selected in a drawing such as a photograph, Fontwork, OLE object, or QR code. It provides commands for working with these images, including captions, cropping, borders and area styles and colors, anchors, wrapping, positioning, and filtering. The Image tab menu (Figure 327) provides links to dialogs for working with images.
Figure 326: Tabbed user interface - Image tab
Figure 327: Image tab menu
Figure 328: Tabbed user interface - Object tab
Tabbed UI | 297

Object tab
The Object tab (Figure 328) only becomes available when an object, such as a chart, is selected. It provides commands to position, resize, choose colors and borders for the selected object. The Object tab menu (Figure 329) provides extra commands to match the type of object selected.
Figure 329: Object tabmenu
Table tab
The Table tab (Figure 330) only becomes available when a table is selected in a drawing. It provides tools to format a table to the drawing requirements. The Table tab menu (Figure 331) includes extra commands for editing a table.
Figure 330: Tabbed user interface - Table tab
Figure 331: Table tab menu
Media tab
The Media tab (Figure 332) only becomes available when a media object is selected in a drawing. It provides commands for positioning and running an audio or video file. The Media tab menu (Figure 333) includes extra commands for editing a media object.
298 | Draw Guide 7.1

Figure 332: Tabbed user interface - Media tab
Figure 333: Media tab menu
Tabbed Compact UI
The Tabbed Compact user interface has the same tabs as the Tabbed user interface, but the commands on each tab are arranged as a single row of tools. Some of these tools have drop-down menus with extra options. Figure 334 shows an example of the File tab in the TabbedCompact user interface.
The tab menu on the right of the Tabbed Compact user interface provides the same options as the tab menus in the Tabbed user interface, see “Tabbed UI” on page 288 for more information.
Figure 334: Tabbed Compact user interface - File tab
Groupedbar Compact UI
The Groupedbar Compact user interface is divided into groups that contain commands organized as sets of tools and menus. The tools and menus that are available change to suit the type of object that has been selected. Figure 335 shows an example of Groupedbar Compact user interface when a draw object is selected.
Clicking on the double chevron >> displays more tools for editing an object. Figure 336 shows anexample of these tools when a draw object is selected.
The Groupedbar menu (Figure 337) on the right-hand end of this interface provides extra commands for working with LibreOffice Draw, including convenient ways to change the user interface and access toolbars.
Groupedbar Compact UI | 299

Figure 335: Example of Groupedbar Compact user interface with draw object selected
Figure 336: Example of more tools with draw object selected
Figure 337: Groupedbar menu
Contextual Single UI
The Contextual Single user interface displays a single toolbar to suit the type of object that has been selected. Figure 338 shows an example of Contextual Single user interface when a draw object is selected.
Clicking on the double chevron >> displays more tools for editing an object. Figure 339 shows anexample of these tools when a draw object is selected.
Figure 338: Example of Contextual Single user interface with draw object selected
Figure 339: Example of more tools with draw object selected
Single Toolbar UI & Sidebar UI
When selected, the Single Toolbar and Sidebar user interfaces only show the Menu bar with notoolbars. However, toolbars can be added to either of these user interfaces by going to View > Toolbars on the Menu bar and selecting the required toolbar from the options available. For more information on toolbars, see Appendix B, Toolbars in this guide and the Getting Started Guide.
300 | Draw Guide 7.1

Draw Guide
Appendix A, Keyboard Shortcuts

Introduction
LibreOffice can be used without requiring a pointing device, such as a mouse or trackball, using keyboard shortcuts. Tasks as varied and complex as docking and undocking toolbars and windows, or changing the size or position of objects can all be accomplished with these shortcuts. Although LibreOffice has an extensive set of shortcuts, each LibreOffice module has keyboard shortcuts that are specific to that module.
For help with LibreOffice keyboard shortcuts, or using LibreOffice with a keyboard only, search the LibreOffice Help using the “shortcut” or “accessibility” keywords.
In addition to using keyboard shortcuts that are listed in this appendix, additional keyboard shortcuts can be defined. You can assign shortcuts to standard Draw functions or macros and then save them for use with Draw only, or with the other modules in LibreOffice. To customize keyboard shortcuts, see the Getting Started Guide for more information.
Note
Some keyboard shortcuts are not available for computers using macOS and are indicated in the following tables by a blank cell.
Draw function key and keyboard shortcuts
Draw function keys
WindowsLinux
macOS Effect
F1 F1 Opens LibreOffice Draw help.
F2 F2Switches to text edit mode and opens the Text Formatting toolbar.
F3 F3 Enters a group of objects for editing.
Shift + F3 Shift + F3 Opens the Duplicate dialog of a selected object.
Ctrl + F3 + F3⌘ Exits a group of objects.
F4 F4 Opens the Position and Size dialog of a selected object.
F5 F5 Opens the Navigator.
F6 F6Forward navigation of the emphasis within the on screen elements.
Shift + F6 Shift + F6Backward navigation of the emphasis within the on screenelements.
F7 F7 Starts the spelling checker. Only available in text editing mode.
Shift + F7 Shift + F7 Switches on or off the automatic spell checking. Only available in text editing mode.
Ctrl + F7 + F⌘ 7Opens the Thesaurus dialog for the language being used. Only available in text editing mode.
F8 F8 Opens the Edit Points toolbar.
Ctrl + Shift + F8 + Shift + F8⌘ Fits text to frame of a selected object.
Shift + F10 Shift + F10 Opens the context menu of a selected object.
302 | Draw Guide 7.1

WindowsLinux
macOS Effect
F11 + ⌘ T Opens the Styles deck on the Sidebar.
Draw keyboard shortcuts
WindowsLinux
macOS Effect
Plus (+) Zooms in.
Minus (-) Zooms out.
Times (×) on number pad
Fits the drawing to fill the Workspace view.
Divide (÷) on number pad
Zooms in on the selected object.
Ctrl + Shift + G + Shift + G⌘ Groups selected objects.
Shift + Ctrl + Alt + G
+ Shift ⌘+ Option + G
Ungroups selected group.
Ctrl + click + ⌘ click Enters a group to edit individual objects in the group. Clickoutside the group to return to normal view.
Ctrl + Shift + K + Shift + K⌘ Combines selected objects.
Ctrl + Shift + Alt + K
+ Shift ⌘+ Option + K
Splits a selected object that has been combined from a group of two or more objects.
Ctrl + + + ⌘ + Brings current selection forward.
Ctrl +Shift + + + ⌘ Shift + + Brings current selection to the front.
Ctrl + - + -⌘ Sends current selection backward.
Ctrl + Shift + - + Shift + -⌘ Sends current selection to the back.
Page Up Switches to previous page. No function on the first page.
Page Down Switches to next page. No function on the last page.
Ctrl+Page Up Switches to previous layer.
Ctrl+Page Down Switches to next layer.
Arrow Arrow Moves a selected object in the direction of the arrow.
Ctrl+Arrow Ctrl+Arrow Moves the page view in the direction of the arrow.
Left Arrow Left ArrowWith Pages Pane selected, switches to the previous page in a drawing. No function on the first page.
Right Arrow Right ArrowWith Pages Pane selected, switches to the next page in a drawing. No function on the last page.
Shift ShiftWhen selecting objects, adds or removes object to or froma selection of objects.
Shift ShiftHold down Shift then click and drag a selection handle when resizing an object to maintain the proportions of the object.
Shift ShiftHold down the Shift key while moving a selected object to constrain the movement in multiples of 45 degrees.
Draw function key and keyboard shortcuts | 303

WindowsLinux
macOS Effect
Shift ShiftHold down the Shift key before selecting several adjacent objects or characters. Click at the start of a selection, move to the end of the selection.
Ctrl ⌘
Hold down the Ctrl ( ) key, ⌘ then click and drag a selected object to create a copy of the object. Note that this shortcut works only when the Copy when moving option in LibreOffice > Preferences > LibreOffice Draw > General is enabled (this option is enabled by default).
Alt OptionHold down the Alt (Option) key and draw or resize an object from the centre of the object.
Alt Option Hold down the Alt (Option) key when selecting an object that is behind the currently selected object.
Alt+ Shift Option + ShiftHold down the Alt (Option) + Shift keys when selecting anobject that is in front of the currently selected object.
Tab Tab Selects objects in the order in which they were created.
Shift + Tab Shift + TabSelects objects in the reverse order in which they were created.
Esc Esc Exits current mode.
Enter Enter Enters text mode if a text object in the drawing is selected.
Ctrl + Enter + ⌘ Enter Inserts a new page after the selected page in a drawing.
Home/End Selects the first/last page in a drawing.
Editing text keyboard shortcuts
WindowsLinux
macOS Effect
Ctrl + - + -⌘ Inserts a custom hyphen (soft hyphen) in text at the cursorposition.
Ctrl + Shift + - + Shift + -⌘ Inserts a non-breaking hyphen (hard hyphen) in text at thecursor position.
Ctrl + Shift + Space
+ Shift + Space⌘ Inserts a non-breaking space, which is not used for hyphenation and is not expanded if the text is justified.
Shift + Enter Shift + Enter Inserts a line break without paragraph change.
Left arrow Left arrow Moves the cursor one character to the left.
Shift + Left arrow Shift + Left arrowMoves the cursor one character to the left and selects the character.
Ctrl + Left arrowOption + Left arrow
Moves the cursor to the beginning of the previous word.
Ctrl + Shift + Left arrow
Option + Shift + Left arrow
Moves the cursor to the left and selects the word on the left.
Right arrow Right arrow Moves the cursor one character to the right.
Shift + Right arrow
Shift + Right arrow
Moves the cursor one character to the right and selects the character.
304 | Draw Guide 7.1

WindowsLinux
macOS Effect
Ctrl + Right arrowOption + Right arrow
Moves the cursor to the beginning of the next word.
Ctrl + Shift + Rightarrow
Option + Shift + Right arrow
Moves the cursor to the right and selects the word on the right.
Up arrow Up arrow Moves the cursor up one line.
Shift + Up arrow Shift + Up arrowMoves the cursor up one line in the text and selects the lines of text.
Ctrl + Up arrow Option + Up arrow Moves the cursor to the beginning of the paragraph.
Ctrl + Shift + Up arrow
Option + Shift + Up arrow
Moves the cursor to the beginning of the paragraph. Selects the text in the paragraph from the cursor position to the beginning of the paragraph.
Down arrow Down arrow Moves the cursor down one line.
Shift + Down arrow
Shift + Down arrow
Moves the cursor down one line in the text and selects thelines of text.
Ctrl + Down arrow + Down arrow⌘ Moves the cursor to the end of the paragraph.
Ctrl + Shift + Down arrow
Opt + Shift + Down arrow
Moves the cursor to the end of the paragraph. Selects the text in the paragraph from the cursor position to the end ofthe paragraph.
Home Moves the cursor to the beginning of the line.
Shift + HomeMoves the cursor to the beginning of the line and selects the text from the cursor position.
Ctrl + HomeMoves the cursor to the beginning of the text block on the slide.
End Moves the cursor to the end of the line.
Shift + EndMoves the cursor to the end of the line and selects the text from the cursor position.
Ctrl + End Moves the cursor to the end of the text block on the slide.
Ctrl + DelDeletes the text from the cursor position to the end of the word.
Ctrl + Shift + DelDeletes the text from the cursor position to the end of the sentence.
Ctrl + Backspace + Backspace⌘ Deletes the text from the cursor position to the beginning of the word.
Ctrl + Shift + Backspace
+ Shift + ⌘Backspace
Deletes the text from the cursor position to the beginning of the sentence.
Menu function key and keyboard shortcuts
The function key and keyboard shortcuts listed in the following tables are available in menu categories on the Menu bar. The tables give the menu item or sub-item, operating system validity, and the effect or purpose of the shortcut.
Menu function key and keyboard shortcuts | 305

Note
The menus listed below are in the same order as displayed on the Menu bar from leftto right.
File menu
Menu item or sub-item
WindowsLinux
macOS Effect
Open Ctrl + O + O⌘ Opens the Open file browser allowing navigation to a folder and file selection.
Save Ctrl + S + S⌘ Saves the open drawing.
Save As Ctrl + Shift + S + Shift + S⌘Opens the Save as file browser allowing navigation to a folder and saving the open drawing as a new file.
Print Ctrl + P + P⌘ Opens the Print dialog allowing selection of how the drawing is printed.
Edit Menu
Menu item or sub-item
WindowsLinux
macOS Effect
Undo Ctrl + Z + Z⌘ Undoes the previous editing action.
Redo Ctrl + Y + Y⌘ Reverses the action of the last Undo command.
Cut Ctrl + X + X⌘ Deletes the selected object and places it on the clipboard.
Copy Ctrl + C + C⌘ Copies the selected object to the clipboard.
Paste Ctrl + V + V⌘ Places the object on the clipboard into the drawing.
Paste Special > Paste Special
Ctrl + Shift + V + Shift + V⌘Pastes the contents of the clipboard at the cursor position in a format that is specified using the Paste Special dialog.
Select All Ctrl + A + A⌘ Selects all objects in a drawing.
Points F8 F8Opens the Edit Points toolbar if there is anobject on the drawing that uses editable points, for example a freeform line.
View menu
Menu item or sub-item
WindowsLinux
macOS Effect
Rulers Ctrl + Shift + R + Shift + R⌘ Switches the rulers off and on in the Workspace.
Sidebar Ctrl + F5 Opens or closes the Sidebar.
Styles F11 + T⌘ Opens or closes the Styles deck on the Sidebar.
306 | Draw Guide 7.1

Menu item or sub-item
WindowsLinux
macOS Effect
Navigator F5 F5 Opens the Navigator.
Insert menu
Menu item or sub-item
WindowsLinux
macOS Effect
Text Box F2 F2Switches to text edit mode and opens the Text Formatting toolbar.
Hyperlink Ctrl + K + K⌘ Opens the Hyperlink dialog.
Comment Ctrl + Alt + C + ⌘ Option + CInserts a new comment box onto the selected page.
Formatting Mark> Insert non-breaking space
Ctrl + Shift + Space
+ ⌘ Shift + Space
Inserts a non-breaking space at the cursor position.
Formatting Mark> Insert Narrow No-break Space
Alt + Shift + Space
Alt + Shift + Space
Inserts a narrow non-breaking space at the cursor position.
Formatting Mark> No-width Optional Break
Ctrl + / + /⌘ Inserts a narrow no-width optional break at the cursor position.
Format menu
Menu item or sub-item
WindowsLinux
macOS Effect
Text > Bold Ctrl + B + B⌘ Applies Bold format to selected text.
Text > Italic Ctrl + I + I⌘ Applies Italic format to selected text.
Text > Superscript
Ctrl + Shift + P + ⌘ Shift + PReduces the font size of the selected text and raises the text above the baseline.
Text > Subscript Ctrl + Shift + B + ⌘ Shift + BReduces the font size of the selected text and lowers the text below the baseline.
Text > Increase Size
Ctrl + ] + ⌘ ] Increases the point size of selected text.
Text > DecreaseSize
Ctrl + [ + [⌘ Decreases the point size of selected text.
Spacing > Line Spacing 1
Ctrl + 1 + 1⌘ Sets the line spacing in a paragraph to a single line.
Spacing Line Spacing 5
Ctrl + 5 + 5⌘ Sets the line spacing in a paragraph to one and half lines.
Spacing > Line Spacing 2
Ctrl + 2 + 2⌘ Sets the line spacing in a paragraph to two lines.
Align Text > Left Ctrl + L + L⌘ Sets the paragraph alignment to left aligned.
Align Text > Center
Ctrl + E + E⌘ Sets the paragraph alignment to center aligned.
Menu function key and keyboard shortcuts | 307

Menu item or sub-item
WindowsLinux
macOS Effect
Align Text > Right
Ctrl + R + R⌘ Sets the paragraph alignment to right aligned.
Align Text > Justified
Ctrl + J + J⌘ Sets the paragraph alignment to justified.
Clear Direct Formatting
Ctrl + M Ctrl + MRemoves direct formatting that has beenapplied without using styles.
Styles > ManageStyles
F11 + ⌘ TOpens or closes the Styles deck on the Sidebar.
Position and Size
F4 F4 Opens the Position and Size dialog of a selected object.
Shape menu
Menu item or sub-item
WindowsLinux
macOS Effect
Arrange > Bring to Front
Ctrl + Shift + + + Shift + +⌘ Moves a selected object to the front of other objects.
Arrange > Bring Forward
Ctrl + + + +⌘ Moves a selected object in front of the forward object.
Arrange > Send Backward
Ctrl + - + -⌘ Moves a selected object behind the backward object.
Arrange > Send to Back
Ctrl + Shift + - + Shift + -⌘ Moves a selected object to the back of other objects.
Group > Group Ctrl + Shift + G + Shift + G⌘ Groups selected objects.
Group > Ungroup
Ctrl + Alt + Shift+ G
+ ⌘ Option + Shift + G
Ungroups selected group.
Group > Enter Group
F3 F3 Enters a group of objects for editing.
Group > Exit Group
Ctrl + F3 + F3⌘ Exits a group of objects.
Duplicate Shift + F3 Shift + F3When an object is selected, opens the Duplicate dialog, which provides options for duplicating the selected object.
Tools menu
Menu item or sub-item
WindowsLinux
macOS Effect
Spelling F7 Starts spelling checker. Only available in text editing mode.
Automatic Spell Checking
Shift + F7 Shift + F7Switches on or off the automatic spell checking. Only available in text editing mode.
Thesaurus Ctrl + F7 + F⌘ 7Opens the thesaurus dialog for the language being used. Only available in text editing mode.
308 | Draw Guide 7.1

Menu item or sub-item
WindowsLinux
macOS Effect
Extension Manager
Ctrl + Alt + E + Alt + E⌘ Opens the Extension Manager dialog.
Options Alt + F12 Opens the Options LibreOffice dialog.
Windows menu
Menu item or sub-item
WindowsLinux
macOS Effect
Closes Window Ctrl + W + W⌘ Closes the active window. If there is onlyone window, closes Draw.
Help menu
Menu item or sub-item
WindowsLinux
macOS Effect
LibreOffice Help F1 F1Opens your browser application at the LibreOffice Help pages.
General function key and keyboard shortcuts
Opening menus and menu items
WindowsLinux
macOS Effect
Alt + <?>
Press the Alt key first, then select the underlined character of the menu to be opened. The <?> is the underlined character in the menu. For example, Alt+F opens the File menu.With the menu open, menu items have an underlined character. To access these menu items directly, press the underlined character key. Where two menu items have the same underlined character, press the character key again tomove to the next item.If an item in a menu has no underlined character, click on the menu item directly.
Esc Esc Closes an open menu.
F6 F6
Repeatedly pressing F6 cycles the focus through the following objects:Menu bar (Windows and Linux operating systems only)Each toolbar from top to bottom and from left to rightEach free window from left to rightDrawing
Shift + F6 Shift + F6Repeatedly pressing Shift+F6 cycles the focus in the opposite direction.
Ctrl + F6 Ctrl + F6 Cycles the focus back to the drawing.
F10 Switches the access on or off for the Menu bar.
General function key and keyboard shortcuts | 309

Accessing Menu bar commands
• Press F6 to select the first item on the Menu bar (the File menu).
• Press the right arrow to select the next menu to the right.
• Press the left arrow to select the previous menu to the left.
• Press the Home and End keys to select the first or last item on the Menu bar.
• Press the down arrow to open a selected menu. An additional press on the down arrow or up arrow moves the selection through the menu commands.
• Press the right arrow to open any submenus on the selected menu. Submenus are indicated by a triangle ► next to the menu item.
• Press Enter to execute the selected menu command.
Accessing toolbar commands
• Press F6 repeatedly until the first tool on a toolbar is selected.
• Use the right and left arrows to select a tool on a horizontal toolbar, or the up and down arrows to select a tool on a vertical toolbar.
• Press the Home key to select the first tool on a toolbar, or the End key to select the last tool on a toolbar.
• Press Enter to activate the selected tool.
• Press the right arrow to open any sub-toolbar on the selected toolbar. Sub-toolbars are indicated by a triangle ▼ next to the tool.
• Keep pressing the right arrow to select a tool on a sub-toolbar.
• Press Ctrl+Enter to insert the selected draw object. The draw object is placed in the center of the drawing, with a predefined size.
Controlling dialogsWhen any dialog is opened, one element (for example a button or option field) indicates it has focus by highlighting, a check mark, or a dotted box around the field or button name.
WindowsLinux
Effect
Enter Activates the selected option. Where no option is selected, Enter is the equivalent to clicking on OK.
EscCloses a dialog without saving any changes made while it was open, theequivalent to selecting Cancel.
Up or down arrow keysMoves focus up and down a list.Increases or decreases the value of a variable.Moves focus vertically within a section of dialog.
Left or right arrow keys Moves focus horizontally within a section of a dialog.
Tab Advances focus to the next section or element of a dialog.
Shift + Tab Moves the focus to the previous section or element in a dialog.
Alt + Down Arrow Shows the options available in a drop-down list.
SpacebarChecks or selects an empty checkbox.Clears or deselects a checked checkbox.
310 | Draw Guide 7.1

Toolbar function key and keyboard shortcuts
Draw provides several toolbars for the creation and editing of drawings. Some tools on the Draw toolbars can be activated using a function key or keyboard shortcut.
Note
The Draw toolbars are listed in the same order displayed in the context menu that is opened by going to View > Toolbars on the Menu bar.
Drawing
Tool nameWindowsLinuxmacOS
Effect
Insert Text Box F2Switches to text edit mode and opens the Text Formatting toolbar.
Edit Points F8Opens the Edit Points toolbar if there is an object on the drawing that uses editable points, for example a freeform line.
Find
Tool nameWindowsLinux
macOS Effect
Find and Replace
Ctrl + H + ⌘ Option + HFinds and replaces all instances of text in a drawing.
Form Design
Tool nameWindowsLinux
macOS Effect
Bring to Front Ctrl + Shift + + + Shift + +⌘ Moves a selected object to the front of other objects.
Send to Back Ctrl + Shift + - + Shift + -⌘ Moves a selected object to the back of other objects.
Group Ctrl + Shift + G + Shift + G⌘ Groups selected objects.
UngroupCtrl + Alt + Shift+ G
+ ⌘ Option + Shift + G
Ungroups selected group.
Enter Group F3 F3 Enters a group of objects for editing.
Exit Group Ctrl + F3 + F3⌘ Exits a group of objects.
Image
Tool nameWindowsLinux
macOS Effect
Position and Size
F4 F4 Opens the Position and Size dialog of a selected object.
Bring to Front Ctrl + Shift + + + Shift + +⌘ Moves a selected object to the front of other objects.
Toolbar function key and keyboard shortcuts | 311

Tool nameWindowsLinux
macOS Effect
Bring Forward Ctrl + + + +⌘ Moves a selected object in front of the forward object.
Send Backward Ctrl + - + -⌘ Moves a selected object behind the backward object.
Send to Back Ctrl + Shift + - + Shift + -⌘ Moves a selected object to the back of other objects.
Line and Filling
Tool nameWindowsLinux
macOS Effect
Position and Size
F4 F4 Opens the Position and Size dialog of a selected object.
Bring to Front Ctrl + Shift + + + Shift + +⌘ Moves a selected object to the front of other objects.
Bring Forward Ctrl + + + +⌘ Moves a selected object in front of the forward object.
Send Backward Ctrl + - + -⌘ Moves a selected object behind the backward object.
Send to Back Ctrl + Shift + - + Shift + -⌘ Moves a selected object to the back of other objects.
Styles F11 + ⌘ T Opens the Styles deck on the Sidebar.
Standard
Tool nameWindowsLinux
macOS Effect
New Ctrl + N + N⌘ Opens a new drawing.
Templates Ctrl + Shift + N + Shift + N⌘ Opens the Templates dialog to create a new drawing using a template.
Open Ctrl + O + O⌘Opens the Open file browser to allow navigation to a folder and selection of a drawing.
Save Ctrl + S + S⌘ Saves the open document.
Save As Ctrl + Shift + S + Shift + S⌘ Opens the Save as file browser to save the open drawing as a new drawing.
Edit Mode Ctrl + Shift + M + Shift + M⌘ Switches on edit mode when a drawing is in read only mode.
Print Ctrl + P + P⌘ Opens the Print dialog to select how to print the drawing.
Cut Ctrl + X + X⌘ Deletes the selected object and places it on the clipboard.
Copy Ctrl + C + C⌘ Copies the selected object to the clipboard.
312 | Draw Guide 7.1

Tool nameWindowsLinux
macOS Effect
Paste Ctrl + V + V⌘ Places the object on the clipboard into the document.
Clear Ctrl + M Ctrl + MRemoves direct formatting that has beenapplied without using styles.
Undo Ctrl + Z + Z⌘ Undoes the previous editing action.
Redo Ctrl + Y + Y⌘ Reverses the action of the last Undo command.
Spelling F7 F7Starts the spelling checker. Only available in text editing mode.
Auto Spellcheck Shift + F7 Shift + F7Switches on or off the automatic spell checking. Only available in text editing mode.
Text Box F2 F2Switches to text edit mode and opens the Text Formatting toolbar.
Insert Hyperlink Ctrl + K + K⌘ Opens the Hyperlink dialog.
Position and Size
F4 F4 Opens the Position and Size dialog of a selected object.
Edit Points F8 F8Opens the Edit Points toolbar if there is anobject on the drawing that uses editable points, for example a freeform line.
Standard (Viewing Mode)
Tool nameWindowsLinux
macOS Effect
Save As Ctrl + Shift + S + Shift + S⌘Opens the Save as file browser so you can save the open document as a new document.
Edit Mode Ctrl + Shift + M + Shift + M⌘ Switches on edit mode when a document is in read only mode.
Print Ctrl + P + P⌘Opens the Print dialog so that you can select how you want to print the document.
Copy Ctrl + C + C⌘ Copies the selected object to the clipboard.
Find and Replace
Ctrl + H + Option + F⌘ Opens the Find and Replace dialog.
Text Formatting
Tool nameWindowsLinux
macOS Effect
Increase Ctrl + ] + ⌘ ] Increases the point size of selected text.
Decrease Ctrl + [ + [⌘ Decreases the point size of selected text.
Toolbar function key and keyboard shortcuts | 313

Tool nameWindowsLinux
macOS Effect
Bold Ctrl + B + B⌘ Applies Bold format to selected text.
Italic Ctrl + I + I⌘ Applies Italic format to selected text.
Superscript Ctrl + Shift + P Ctrl + Shift + PReduces the font size of the selected text and raises the text above the baseline.
Subscript Ctrl + Shift + B Ctrl + Shift + BReduces the font size of the selected text and lowers the text below the baseline.
Clear Ctrl + M Ctrl + MRemoves direct formatting that has beenapplied without using styles.
Left Ctrl + L + L⌘ Sets the paragraph alignment to left aligned.
Center Ctrl + E + E⌘ Sets the paragraph alignment to center aligned.
Right Ctrl + R + R⌘ Sets the paragraph alignment to right aligned.
Justified Ctrl + J + J⌘ Sets the paragraph alignment to justified.
Select All Ctrl + A + A⌘ Selects all the text in a text box.
314 | Draw Guide 7.1

Draw Guide
Appendix B, Toolbars

Introduction
Draw provides several toolbars to help in creating drawings. Each toolbar has a default set of tools and the option to add additional tools.
Note
The icons displayed in the Draw toolbars illustrated in this appendix may differ from what is displayed on your computer screen. Toolbar icons depend on the computer operating system being used and how LibreOffice has been set up.
Using toolbars
Displaying toolbarsTo display a toolbar and make it active, go to View > Toolbars on the Menu bar. A submenu opens with a list of available toolbars for Draw. Click on a toolbar name to make it active. Active toolbars are indicated by highlighting or a check mark next to the name, as shown in Figure 340.
Figure 340: Draw toolbars
Note
Some toolbars, although selected in View > Toolbars on the Menu bar, will not display until an object of the correct type is selected in the drawing. For example, theImage toolbar only displays when an image is selected.
Closing toolbarsTo close a toolbar, use one of the following methods:
• Go to View > Toolbars on the Menu bar and deselect the toolbar.
• Right-click on a tool on a toolbar and select Close Toolbar from the context menu.
• Click on the X in the right corner of the title bar of a floating toolbar.
316 | Draw Guide 7.1

Moving toolbars
Docked toolbars
By default, some toolbars are docked into position in the Draw main window. For example, the Standard toolbar is docked at the top of the main window. Docked toolbars can be undocked andmoved to a new docked position on the main window or left as a floating toolbar. Before moving atoolbar, the toolbar must be unlocked.
1) Move the mouse cursor over the small vertical handle at the left end of the toolbar. The mouse cursor changes to a moving cursor for the computer system and setup.
2) Click and hold down the mouse button and drag the toolbar to a new location. This can bea new docked position or a floating toolbar. A hashed border appears around the toolbar indicating the toolbar position as it is dragged.
3) Release the mouse button when the required position is reached.
Floating toolbars
To move a floating toolbar, click on its title bar and drag it to a new floating location. Release the mouse button when the toolbar is in the requirted position. A floating toolbar does not have to be positioned on the Draw main window for it to function.
Docking a floating toolbar
To dock a floating toolbar, use one of the following methods:
• Click on the title bar and drag it to the top, bottom, left side, or right side of the main window. When the toolbar reaches a docking position, a hashed border appears at the docked position. Release the mouse button and the toolbar is docked.
• Right-click on the toolbar and select Dock Toolbar from the context menu. The toolbar moves into a docked position. If the position is not suitable, move the toolbar to a new docked position.
• To dock all floating toolbars that are active, right-click on the toolbar and select Dock All Toolbars from the context menu.
Locked toolbars
A docked toolbar can also be locked into its position on the Draw main window.
• To lock a toolbar into its docked position, right-click in a blank area on the toolbar and click on Lock Toolbar Position in the context menu. A check mark appears against this option indicating the toolbar is now locked.
• To unlock a toolbar, right-click in a blank area on the toolbar and click on Lock Toolbar Position in the context menu. The check mark next to this option disappears indicating the toolbar is now unlocked. Also, a small vertical bar appears at the left end of the toolbar and is used to move the toolbar.
Note
Some toolbars cannot be docked or locked into position. This is indicated by the options Dock Toolbar and/or Lock Toolbar Position being grayed out, making the options unavailable.
Using toolbars | 317

Editing toolbarsWhen LibreOffice is installed on a computer, it includes a set of toolbars suitable for each LibreOffice component. Each toolbar has a default set of visible tools. You can add tools, delete tools, and customize toolbars.
Adding tools
1) Right-click in a blank area on a toolbar, or click on the small downward triangle ▼ on the right of the toolbar title bar.
2) Select Visible Buttons from the context menu to display a list of available tools.
3) Click on the tool required and the tool appears in the toolbar. The list of available tools closes automatically. A highlight or check mark next to the tool indicates that the tool is already installed on the toolbar.
Note
When adding tools using Visible Buttons, the tool is added to the toolbar at the same position as the tool appears in the Visible Buttons list. That is, the top tool in Visible Buttons appears at the left end of the toolbar; the bottom tool in Visible Buttons list appears at the right end of the toolbar. Tool positions cannot be changedusing Visible Buttons.
Deleting tools
1) Right-click in a blank area on a toolbar, or click on the small downward triangle ▼ on the right of the toolbar title bar.
2) Select Visible Buttons from the context menu to display a list of available tools.
3) Click on the tool no longer required and the tool is removed from the toolbar. The highlightor check mark next to the tool is also removed. The list of available tools closes automatically.
Customizing toolbars
Extra tools and commands that are not available in Visible Buttons can be added to a toolbar using customization. Customization also allows the creation of new toolbars if a specific set of tools are required for a specific task. For information on customizing toolbars, see the Getting Started Guide.
Toolbars
Note
The tools installed on a toolbar are normally indicated in Visible Buttons either by the tool icon being highlighted or by a check mark. However, this install indication depends on computer setup and computer operating system being used.
Note
On some toolbars, the icons have a small downward pointing triangle ▼ to the right of an icon. Click on this triangle to open further options that are available for use.
318 | Draw Guide 7.1

Note
Some of the tools in the toolbars also have the option of using a keyboard shortcut instead of clicking on the tool. For a full list of keyboard shortcuts that are available inDraw, see Appendix A, Keyboard Shortcuts.
3D-ObjectsThe 3D-Objects toolbar (Figure 341) provides tools to create 3D objects in a drawing. It is activated either by going to View > Toolbars > 3D-Objects on the Menu bar or by clicking on 3DObjects on the Drawing toolbar.
Figure 341: 3D-Objects toolbar
Figure 342: 3D-Settings toolbar
3D-SettingsThe 3D-Settings toolbar (Figure 342) and its tools only become active when an object has been converted to 3D using the tool Toggle Extrusion and the converted object is then selected. The following tools on this toolbar have a small downward pointing triangle ▼ on the right of the icon. Click on this triangle to open a drop-down menu giving access to various options as follows:
Toolbars | 319

• Depth – 3D extrusion depth – 0cm; 1cm; 2.5cm; 5cm; 10cm; Infinity; Custom. The measurement unit depends on the settings in Tools > Options > LibreOffice Draw > General.
• Direction – 3D extrusion direction and type – Parallel; Perspective.
• Lighting – lighting direction and lighting level of 3D extrusion – Bright; Normal; Dim.
• Surface – surface type of 3D extrusion – Wire Frame; Matt; Plastic; Metal.
• 3D Color – color of 3D extrusion. Select a color from one of the available color palettes.
Align ObjectsThe Align Objects toolbar (Figure 343) provides tools for aligning several objects in a drawing to improve the visual impact of a drawing.
Figure 343: Align Objects toolbar
CommentsThe Comments toolbar (Figure 344) provides tool for adding, deletion, and navigation of comments in a drawing. To use comments, it is recommended to add your name and initials in Tools > Options > LibreOffice > User Data so that comments can be easily identified.
Figure 344: Comments toolbar
Distribute SelectionThe Distribute Selection toolbar (Figure 345) provides tools to distribute three or more selected objects evenly along the horizontal axis or vertical axis. Also, the spacing between objects can beevenly distributed.
320 | Draw Guide 7.1

Figure 345: Distribute Selection toolbar
DrawingThe Drawing toolbar (Figure 346) provides the majority of the tools normally used to create graphic objects in a drawing.
Figure 346: Drawing toolbar
Toolbars | 321

Some tool shapes on the Drawing toolbar change depending on the last tool that had previously been selected and used.
• Click on the small downward pointing triangle ▼ to the right of a tool to open a pop-up toolbar. Select the required shapeto add to a drawing.
• To create a sub-toolbar, click and drag at the top of the pop-up toolbar to an empty area on the main window. The sub-toolbars for each object type and the various shapes available are shown Figures 347 to 356.
Figure 347: Lines and Arrows sub-toolbar
Figure 348: Curves and Polygons sub-toolbar
322 | Draw Guide 7.1

Figure 349: Connectors sub-toolbar
Figure 350: Basic Shapes sub-toolbar
Toolbars | 323

Figure 351: Symbol shapes sub-toolbar
Figure 352: Block Arrows sub-toolbar
324 | Draw Guide 7.1

Figure 353: Flowchart sub-toolbar
Figure 354: Callouts sub-toolbar
Figure 355: Stars and Banners sub-toolbar
Toolbars | 325

Figure 356: 3D-Objects sub-toolbar
Edit PointsThe Edit Points toolbar (Figure 357) provides tools for editing the points of a curve or an object that has been converted to a curve. The toolbar only becomes active when an object is selected and one of the following methods is used to open the toolbar:
• Click on Edit Points on the Drawing or Standard toolbar.
• Use the keyboard shortcut F8.
Figure 357: Edit Points toolbar
FindThe Find toolbar (Figure 358) opens by default in the bottom left corner of the Draw main window. This toolbar is normally docked at the bottom left of the Draw main window above the Status bar. However, it can be undocked and made into a floating toolbar.
326 | Draw Guide 7.1

Figure 358: Find toolbar
FontworkThe Fontwork toolbar (Figure 359) is used to create graphical text objects in a drawing and provide the tools for editing the graphical text object. This toolbar only becomes active when a Fontwork graphical text object in the drawing has been selected.
Some tools on the Fontwork toolbar have a small downward pointing triangle ▼ to the right of thetool. Click on the triangle to open a pop-up toolbar or drop-down option list.
• Fontwork Shape – select the required shape for the Fontwork graphical text object from the options available.
• Fontwork Alignment – select the paragraph alignment from the options available.
• Fontwork Character Spacing – select the required character spacing from the options available.
Figure 359: Fontwork toolbar
Form ControlsThe Form Controls toolbar (Figure 360) provides the tools required to create an interactive form. This allows controls to be added to a form in a text, drawing, spreadsheet, presentation, or HTMLdocument (for example a button that runs a macro).
Toolbars | 327

Figure 360: Form Controls toolbar
Figure 361: Form Design toolbar
328 | Draw Guide 7.1

Form DesignThe Form Design toolbar (Figure 361) opens a form in Design Mode so that it can be edited. You cannot activate the controls of the form or edit its contents when in Design Mode. However, you can change the position and size of the controls, edit other properties, and add or delete controls in Design Mode.
Form NavigationThe Form Navigation toolbar (Figure 362) provides tools to edit a database table or control the data view. The toolbar is normally displayed at the bottom of a document that contains fields that are linked to a database. This toolbar is only active when forms are connected to a database; an inactivate toolbar is shown in Figure 362.
The Form Navigation toolbar also allows movement within records as well as inserting and deleting records. If data is saved in a form, the changes are transferred to the database. This toolbar also provides tools providing sort, filter, and search functions for data records.
Figure 362: Form Navigation toolbar
Figure 363: Glue Points toolbar
Toolbars | 329

Glue PointsThe Glue Points toolbar (Figure 363) provides tools to insert a glue point or modify the propertiesof a glue point. A glue point is a point where a connector is attached to an object. By default, LibreOffice automatically places a glue point at the center of each side of the bounding rectangle for every object created.
ImageThe Image toolbar (Figure 364) provides tools to edit, modify, align, reposition and resize images.The toolbar only becomes active and available when an image is selected in a drawing. The Image toolbar automatically replaces the Line and Filling toolbar when it becomes active.
Figure 364: Image toolbar
330 | Draw Guide 7.1

InsertThe Insert toolbar (Figure 365) provides tools to insert different types of objects into a drawing.
Figure 365: Insert toolbar
Legacy Circles and OvalsThe Legacy Circles and Ovals toolbar (Figure 366) provides tools to insert different types of circles and ovals into a drawing.
Figure 366: Legacy Circles and Ovals toolbar
Toolbars | 331

Legacy RectanglesThe Legacy Rectangles toolbar (Figure 367) provides tools to insert different types of rectangles and squares into a drawing.
Figure 367: Legacy Rectangles toolbar
Line and FillingThe Line and Filling toolbar (Figure 368) provides tools and drop-down lists for editing lines, arrows, and object borders. The tools available vary depending on the type of object selected for editing.
Figure 368: Line and Filling toolbar
332 | Draw Guide 7.1

Master ViewThe Master View toolbar (Figure 369) provides tools to create a new master page, rename a master page, delete a master page, and close master view. This toolbar is only active when Drawis in master view.
Figure 369: Master View toolbar
Media PlaybackThe Media Playback toolbar (Figure 370) provides the standard tools required to insert, view, play, and listen to audio and video files. The toolbar only becomes active when an audio or video file is selected. Draw supports many different media formats depending on the computer operating system being used. The tools available on the toolbar from left to right are as follows:
• Open – opens a movie file or a sound file.
• Play – plays the current file.
• Pause – pauses or resumes the playback of the current file.
• Stop – stops the playback of the current file.
• Repeat – plays the file repeatedly.
• Position – moves to a different position in the file.
• Mute – turns sound off and on.
• Volume – adjusts the volume level.
• View – adjusts the size of the movie playback.
Figure 370: Media Playback toolbar
OptionsThe Options toolbar (Figure 371) provides tools for editing various settings for newly created drawings, for example how objects snap to the grid when being moved or resized.
Toolbars | 333

Figure 371: Options toolbar
RedactionThe Redaction toolbar (Figure 372) is used to block portions of a drawing protecting sensitive information and helps enterprises and organizations to comply with regulations on confidentiality or privacy.
When a redacted drawing is exported to a new drawing, any redacted portions are removed fromthe new drawing and replaced by redaction blocks of pixels. This prevents any attempt to restore or copy the original contents. A redacted drawing is often exported to PDF for publication or sharing.
Figure 372: Redaction toolbar
StandardThe Standard toolbar (Figure 373) is common to all LibreOffice components and provides the most common tools when creating and editing documents using LibreOffice. The Standard toolbar differs between LibreOffice components to allow for different toolsets used in creating the different types of documents.
334 | Draw Guide 7.1

Figure 373: Standard toolbar
Figure 374: Standard (Viewing Mode) toolbar
Toolbars | 335

Standard (Viewing Mode)The Standard (Viewing Mode) toolbar (Figure 374) provides tools to save, edit, and distribute a drawing.
TableThe Table toolbar (Figure 375) provides tools and options to edit and format a table placed in a drawing. This toolbar only becomes active when a table is selected.
Figure 375: Table toolbar
Text FormattingThe Text Formatting toolbar (Figure 376) provides tools for formatting text and alignment commands. This toolbar becomes active when text in a text box or graphic object has been selected and it automatically replaces the Line and Filling toolbar.
336 | Draw Guide 7.1

Figure 376: Text Formatting toolbar
Figure 377: Transformations toolbar
Toolbars | 337

TransformationsThe Transformations toolbar (Figure 377) provides tools to modify the shape, orientation, or fill of selected objects.
ZoomThe Zoom toolbar (Figure 378) provides tools to reduce or enlarge the screen display of the current drawing.
Figure 378: Zoom toolbar
338 | Draw Guide 7.1

Draw GuideWorking With Vector Graphics
About this book:
This book covers the main features of Draw, the vector graphics component of LibreOffice. Using Draw, a wide variety of graphical images can be created.
Vector graphics store and display a picture as simple geometric elements such as lines, circles, and polygons rather than as a collection of pixels (points on the screen). This permits simpler storage and supports precise scaling of the picture elements.
Draw is fully integrated into LibreOffice. This simplifies exchanging graphics with Writer, Calc, and Impress. Images can be exported in many formats for use in other programs.
About the authors:
This book was written by volunteers from the LibreOffice community.
A PDF version of this book can be downloaded free from:https://documentation.libreoffice.org/en/
About LibreOffice:
LibreOffice is the free, libre, and open source personal productivity suite from The Documentation Foundation. It runs on Windows, macOS, and GNU/Linux. Support and documentation is free from a large, dedicated community of users, contributors, and developers.
Get involved as a volunteer and work in many areas: development, quality assurance, documentation, translation, user support, and more.
Download LibreOffice for free fromhttps://libreoffice.org/downloads/
For commercial use:
Work with certified LibreOffice professionals for any business needs, from deployment or conversion from other office suits, staff training, or custom development needs.
For information on professional support services, go tohttps://www.libreoffice.org/get-help/professional-support/


