Embed Size (px)
Citation preview
processes
Article
Experimental Analysis of a Heat Pump Dryer with an ExternalDesiccant Wheel Dryer
Kai-Shing Yang 1, Khalid Hamid 2, Shih-Kuo Wu 3, Uzair Sajjad 2 and Chi-Chuan Wang 2,*
�����������������
Citation: Yang, K.-S.; Hamid, K.;
Wu, S.-K.; Sajjad, U.; Wang, C.-C.
Experimental Analysis of a Heat
Pump Dryer with an External
Desiccant Wheel Dryer. Processes
2021, 9, 1216. https://doi.org/
10.3390/pr9071216
Academic Editor: Dariusz Dziki
Received: 15 June 2021
Accepted: 13 July 2021
Published: 15 July 2021
Publisher’s Note: MDPI stays neutral
with regard to jurisdictional claims in
published maps and institutional affil-
iations.
Copyright: © 2021 by the authors.
Licensee MDPI, Basel, Switzerland.
This article is an open access article
distributed under the terms and
conditions of the Creative Commons
Attribution (CC BY) license (https://
creativecommons.org/licenses/by/
4.0/).
1 Department of Refrigeration, Air Conditioning and Energy Engineering, National Chin-Yi Universityof Technology, Taichung 411, Taiwan; [email protected]
2 Department of Mechanical Engineering, National Yang Ming Chiao Tung University, Hsinchu 300, Taiwan;[email protected] (K.H.); [email protected] (U.S.)
3 Green Energy & Environment Research Laboratories, Industrial Technology Research Institute,Hsinchu 310, Taiwan; [email protected]
* Correspondence: [email protected]; Tel.: +886-3-571-2121 (ext. 55105); Fax: +886-3-572-0634
Abstract: This study examines the performance of three heat pump dryers: the original referencedesign, a modified drying chamber, and an external desiccant wheel design. Unlike most existingstudies that normally adopt organic products as the drying materials, in this study we used moistsodium polyacrylate (Orbeez) as the drying material for consistent characterization of the heat pumpperformance. R-134a was adopted as the refrigerant for the heat pump system. The experimentswere performed subject to different weights of Orbeez (drying material) at a constant volumetric flowrate of 100 m3/h. During experimentation, different parameters like the coefficient of performance(COPHP), drying rate, heat transfer rate by the condenser, moisture extraction rate, and specificmoisture extraction rate were calculated. The average COPHP, mass transfer rate, heat transferrate, MER, and SMER of the system were calculated as 3.9, 0.30 kg/s, 0.56 kW, 0.495 kg/h, and1.614 kg/kWh, respectively. The maximum COP for the refrigeration system was achieved at lowertest loads with the desiccant wheel. The moisture extraction rate for a lower test loading was higherthan that for a higher test load due to the higher penetration of drying air at the lower test load,although the maximum test load showed the maximum relative humidity at the dryer outlet. Thedesiccant wheel showed good performance in terms of moisture extraction rate and COPHP, but itshowed poor performance in terms of the specific moisture extraction rate due to the high powerconsumption (around 2.6 kW) of the desiccant dehumidifier. The moisture extraction rate (MER) forall designs increased to a maximum value, followed by consistent decline. However, the maximumMER for the desiccant design exceeded those for the other designs.
Keywords: Orbeez; heat pump dryer; desiccant wheel; coefficient of performance
1. Introduction
Drying is widely used in polymer, food, pharmaceutical, mineral, and other indus-trial processes. However, current commercially available dryers mainly adopt hot air tocomplete the drying process, and most of the traditional hot air dryers use direct electricheating to raise the inlet air temperature to evaporate the moisture contents of the drymatter. The drying process is strongly associated with ambient conditions in terms ofhumidity. This is an especially essential consideration in tropical or subtropical countrieswhere the humidity is comparatively high. For example, the average relative humidity inTaiwan is greater than 70% throughout the year, thereby imposing difficulties in dryingsystems and consuming more energy in the heating process.
An alternative drying process is via heat pump, which transports heat energy from alow temperature source to a high temperature source with supplied work. It can offer muchlarger thermal energy at the expense of much lower input work. Heat pumps have potentialapplications in heating, ventilation, and air conditioning, water heating, district heating,
Processes 2021, 9, 1216. https://doi.org/10.3390/pr9071216 https://www.mdpi.com/journal/processes

Processes 2021, 9, 1216 2 of 17
and industrial heating, and heat pump dryers (HPDs) are energy efficient when comparedto conventional heater dryers. Conventional dryers possess numerous limitations, suchas non-homogeneous product quality caused by under/over-drying due to inadequate orlong-time exposure of the product. Besides this, the lower contact efficiency between theproduct being dried and the drying medium is also a big issue. Furthermore, over-dryingmay result in surface hardening of the drying product. The aforementioned problems causevery poor drying and increase operational costs, which is especially likely with traditionaldrying. Hence, many efforts have been made in the literature to resolve these limitations ofconventional drying methods. These efforts include improving the product quality andovercoming the operational problems. Most of the conventional drying methods (eitherby convection or direct heating) employ fossil fuels as the power source and are therebyaccompanied by greenhouse gas emissions and pollution, which are a prime concern.Biomass and renewable energy may be incorporated to tackle this problem, but again,concerns regarding better preservation and drying product quality may prevail. Thisis because the quality and the cost of the drying product are directly influenced by thedrying method and the operational conditions. Another important point to be consideredis reliable and consistent product quality when using the same drying method.
In tackling the aforementioned problems, the HPD system has been proven a goodsolution. The HPD system has several advantages. Firstly, it can be used for effectiveheat recovery. Secondly, it offers a wide range of operational conditions (humidity, airtemperature) that help to achieve better quality. Thirdly, the drying process can be per-formed at relatively low temperature to preserve the quality of the drying product. This isbecause the HPD systems employ dehumidified and low-temperature air as the dryingmedium. A short summary of experimental investigations on HPD systems for the dryingof different products can be found in Table 1. From Table 1, an HPD is applicable forthe drying of various products, including vegetables, fruits, etc., and studies evaluatedthe HPD system in terms of different performance metrics of the drying process, such asweight reduction, moisture extraction rate, specific moisture extraction rate, coefficient ofperformance, and heat transfer rate for different time durations. However, the foregoingstudies mainly focused on different organic products, which are normally quite sensitiveto drying conditions. Hence, one of the main objectives of this study is to adopt a non-organic drying material for examination to characterize the more general performanceof a heat pump dryer. Moreover, limited investigations can be found in the literatureregarding the development and assessment of new HPD system designs. Especially forhumid environments, some systems should be integrated with an HPD to pre-condition(pre-dehumidify and pre-heat) the air before it enters the dryer. Thus, the present studyexamines the applicability of adding a desiccant rotary wheel along with the HPD.
In order to increase the drying efficiency of the traditional heat pump dryer andpre-condition the humid air before it enters the dryer, in this study, we developed anadsorption dehumidification device at the entrance of the traditional heat pump dryer,namely, a desiccant rotary wheel, to reduce the inlet humidity and use the energy releasedby the adsorption process to increase the inlet temperature. Subsequently, the applicabilityof this design is elaborated in detail. Experiments were performed to evaluate the dry-ing performance on Orbeez material (sodium polyacrylate) over a period of eight hours.Moreover, experiments were conducted with a modified drying chamber to achieve betterdrying by improving the air distribution and reducing the air resistance. For each case,various performance parameters such as the weight reduction, moisture extraction rate,specific moisture extraction rate, coefficient of performance, and heat transfer rate werecalculated for a constant flow rate.

Processes 2021, 9, 1216 3 of 17
Table 1. A summary of experimental investigations on HPD systems for drying.
Dried ProductRef.
ProductInitial
Mass (kg)
MoistureContentInitial
MoistureContent
Final
WC (kW)(QEV)(kW)
DT(◦C)
RH(%)
MER kgw/h(MC%/h)
DryingTime
(hr or min)
SMER(kgw/kW.h)
(COP)
Vegetable seeds [1] 0.2 30 (N/S) 6 (N/S) No 3055
5550–80 No 2 3.1–4.48
(4.2–6.5)Paddy [2] 1200 30–35 (w.b.) 13 (w.b.) 4.2 42, 26 26,14 8–15.9 15–16 h 2.0
Potato slices [3] No 4 kgw/kg 0.5–1kgw/kg (2–3.52) 25, 30,
40(32.9–
44) DED ~240 min No
Mushroom [4] 1 203 (d.b) 12 (d.b.) No 40.628.4
16.228.5 DED 30 to 81 h
(total) No
Cranberry and potato[5] No 84 (w.b.) 15 (w.b.) No −13 to
−10 85 to 15 No 2 h 1.19–2.73(4)
Chopped alfalfa [6] 3.6 70 (w.b.) 10 (w.b.) 0.424 30–40 No 0.288 4 (batch) 0.5–1.02
Tomato [7] No 23 (d.b.) 0.1 (d.b.) 2.2–2.6 40,45, 50 10 to 15 DED ~1000 min (2.56–2.68)
Specialty crops [8] 11.6–20.7 62.7–89.6(w.b.)
5.1–10.8(w.b.) No 30 & 35 No DED 3.3–120 h 0.06–0.61
Jew’s mallow,spearmint, and
parsley [9]2.5–7.5 81–83 (w.b.) 6 (w.b.) No 40, 45,
50, 55 No DED 4.75 to 6.35 h DED
Ginger [10] 0.1 No No No 45 10 DED 8 h No
Ginger [11] 0.2 800 to 900(d.b.) 12 (d.b.) No
40,50,60
DED 120 to 200min No
Shredded radish [12] 200 95 16 15 (CD) 40 No 6.3 25 h 1.5 (3–4)
Green sweet peppers[13] 0.025 1453 (d.b.) ~10.7 (d.b.) No
303540
402719
DED 16, 25 & 36 h 0.55 to 1.1
Olive leaves [14] No 69.55 (N/S) 5.17 (N/S) No 45–55 No No 270 to 390min No
Grain [15] ~1000 21.3 12.5 14.6 ~69 No 103.6 ~1 h ~4.38Saffron [16] 0.5 80 (w.b.) 10 (w.b.) DED 40, 60 No No ~0.5 h 0.5–1.1
Ivy gourd leaves [17] 0.035 17 (d.b.) 4 (d.b.) 0.25 20, 35, 50,55, 60 No DED 1 to 2 h (1.2)
2. Equipment and Methods
In the current study, we develop a heat pump dryer (HPD) to assess the performanceof a closed-loop heat pump dryer system. In total, three designs were made and tested,including an original reference design, a modified drying chamber with better airflowdistribution and less flow resistance, and a desiccant wheel on top of the modified design.Moreover, the assessment was extended to examine various parameters in a transientstate. In the current study, the refrigerant used for the HPD was R-134a. A single externalblower was used to circulate the air in a closed loop for eight hours. The experiments wereperformed on different weights of Orbeez (drying material) at a constant volumetric flowrate of 100 m3/h (0.5 m/s velocity). During experimentation, different parameters likethe COPHP, drying rate, heat transfer rate by the condenser, moisture extraction rate, andspecific moisture extraction rate were calculated.
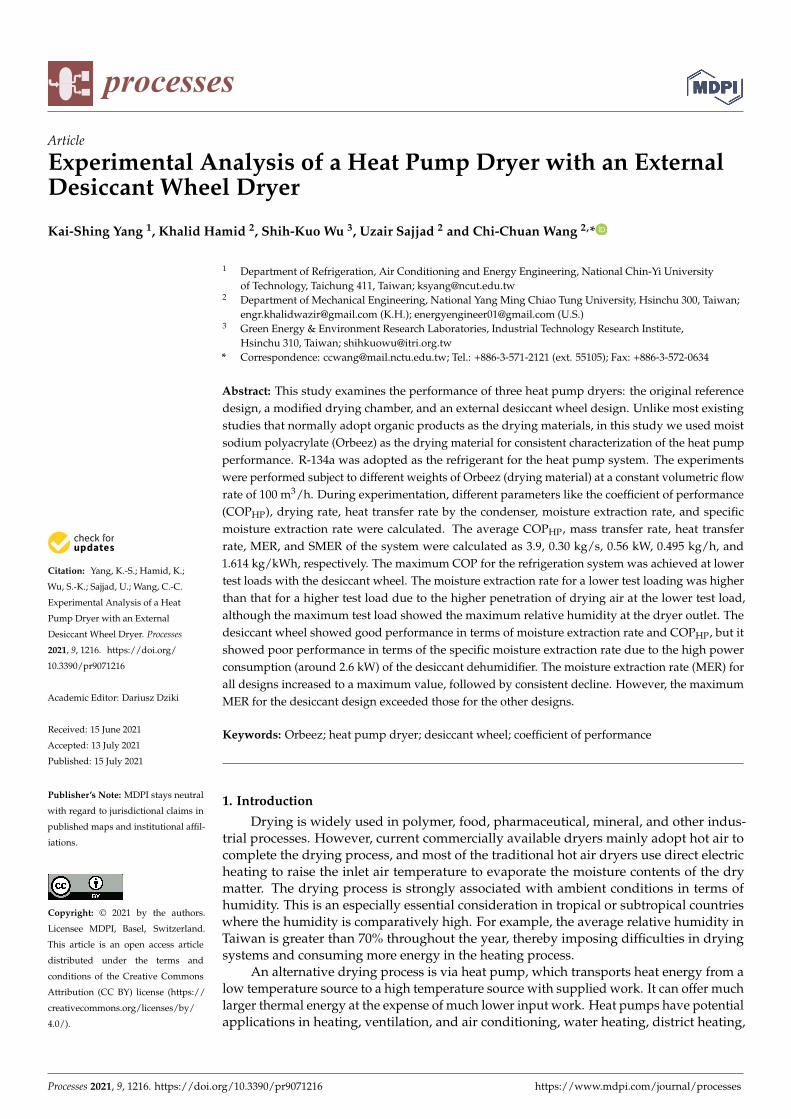
Figure 1 illustrates the schematic of the heat pump dryer. The experimental setup wasdeveloped in order to validate or verify the system performance of the HPD. In addition tothe four basic components of refrigeration—compressors, condensers, expansion valves,and evaporators—the system included an adsorption wheel (Dehutech, DA/DT-450, Täby,Sweden, Total Power Connection 3.5 kW) acting as an external dehumidifier, heat exchang-ers, electronic scales, and a drying chamber. Drying air is heated by the condenser of theHPD, and the low-relative-humidity air flows into the drying chamber via centrifugal fan.Subsequently, the hot and dry air absorbs moisture from the wet material, yielding highlyhumid air at the outlet of the dryer chamber. Afterwards, the humid air enters the evapora-tor to remove its moisture content. Temperature and humidity sensors were installed atthe inlet and exit of the test box, and the measurement temperature and humidity valuewere transmitted to the data extractor via a signal transmitter, with a temperature range of−100 ◦C to 200 ◦C, an accuracy of 0.1 ◦C, a humidity range of 0% to 100%, and an accuracyof 0.8%.
Processes 2021, 9, 1216 4 of 17
Processes 2021, 9, x FOR PEER REVIEW 4 of 18
enters the evaporator to remove its moisture content. Temperature and humidity sensors were installed at the inlet and exit of the test box, and the measurement temperature and humidity value were transmitted to the data extractor via a signal transmitter, with a tem-perature range of −100 °C to 200 °C, an accuracy of 0.1 °C, a humidity range of 0% to 100%, and an accuracy of 0.8%.
Figure 1. Heat pump dryer with an external dehumidification system.
Then, a flowmeter (SCHMIDT Technology SS30.302, Georgen, Germany) with a measuring range from 1.5 to 417 m3/h of 20 °C and 1013.25 hPa, accuracy: ±3% of m.v. +0.3% of full scale, was employed to measure the changes in air speed in the circulated airflow and the static pressure of the airstream lifted by the blower; then a desiccant wheel was installed to further lower the humidity of the airstream, and the low-humidity air enters the condenser to lower the relative humidity to complete the air cycle. The voltages and currents of the compressor and blower were measured using a power meter (Arch Meter Corporation PA310, measurement range from 0 to 200A, accuracy 0.5%.
2.1. Drying Material Orbeez or sodium polyacrylate (or Acrylic Polymer Salt sodium) was used as a dry-
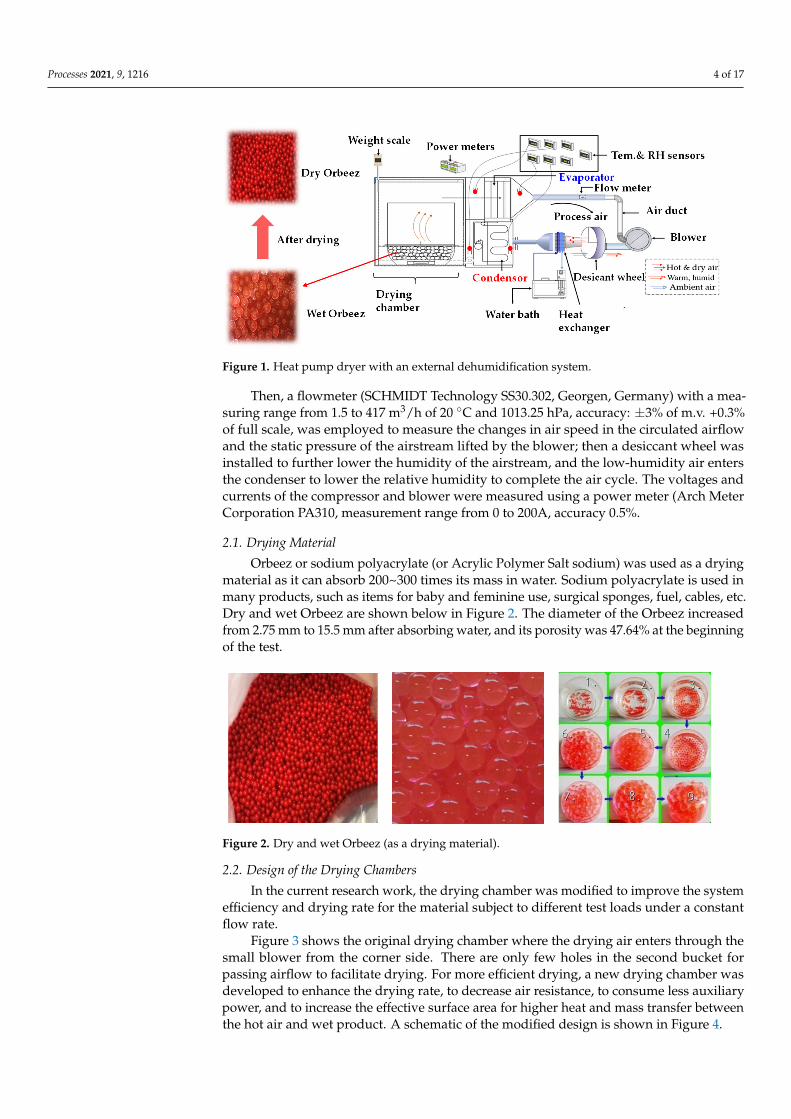
ing material as it can absorb 200~300 times its mass in water. Sodium polyacrylate is used in many products, such as items for baby and feminine use, surgical sponges, fuel, cables, etc. Dry and wet Orbeez are shown below in Figure 2. The diameter of the Orbeez in-creased from 2.75 mm to 15.5 mm after absorbing water, and its porosity was 47.64% at the beginning of the test.
Figure 2. Dry and wet Orbeez (as a drying material).
Figure 1. Heat pump dryer with an external dehumidification system.
Then, a flowmeter (SCHMIDT Technology SS30.302, Georgen, Germany) with a mea-suring range from 1.5 to 417 m3/h of 20 ◦C and 1013.25 hPa, accuracy: ±3% of m.v. +0.3%of full scale, was employed to measure the changes in air speed in the circulated airflowand the static pressure of the airstream lifted by the blower; then a desiccant wheel wasinstalled to further lower the humidity of the airstream, and the low-humidity air entersthe condenser to lower the relative humidity to complete the air cycle. The voltages andcurrents of the compressor and blower were measured using a power meter (Arch MeterCorporation PA310, measurement range from 0 to 200A, accuracy 0.5%.
2.1. Drying Material
Orbeez or sodium polyacrylate (or Acrylic Polymer Salt sodium) was used as a dryingmaterial as it can absorb 200~300 times its mass in water. Sodium polyacrylate is used inmany products, such as items for baby and feminine use, surgical sponges, fuel, cables, etc.Dry and wet Orbeez are shown below in Figure 2. The diameter of the Orbeez increasedfrom 2.75 mm to 15.5 mm after absorbing water, and its porosity was 47.64% at the beginningof the test.
Processes 2021, 9, x FOR PEER REVIEW 4 of 18
enters the evaporator to remove its moisture content. Temperature and humidity sensors were installed at the inlet and exit of the test box, and the measurement temperature and humidity value were transmitted to the data extractor via a signal transmitter, with a tem-perature range of −100 °C to 200 °C, an accuracy of 0.1 °C, a humidity range of 0% to 100%, and an accuracy of 0.8%.
Figure 1. Heat pump dryer with an external dehumidification system.
Then, a flowmeter (SCHMIDT Technology SS30.302, Georgen, Germany) with a measuring range from 1.5 to 417 m3/h of 20 °C and 1013.25 hPa, accuracy: ±3% of m.v. +0.3% of full scale, was employed to measure the changes in air speed in the circulated airflow and the static pressure of the airstream lifted by the blower; then a desiccant wheel was installed to further lower the humidity of the airstream, and the low-humidity air enters the condenser to lower the relative humidity to complete the air cycle. The voltages and currents of the compressor and blower were measured using a power meter (Arch Meter Corporation PA310, measurement range from 0 to 200A, accuracy 0.5%.
2.1. Drying Material Orbeez or sodium polyacrylate (or Acrylic Polymer Salt sodium) was used as a dry-
ing material as it can absorb 200~300 times its mass in water. Sodium polyacrylate is used in many products, such as items for baby and feminine use, surgical sponges, fuel, cables, etc. Dry and wet Orbeez are shown below in Figure 2. The diameter of the Orbeez in-creased from 2.75 mm to 15.5 mm after absorbing water, and its porosity was 47.64% at the beginning of the test.
Figure 2. Dry and wet Orbeez (as a drying material).
Figure 2. Dry and wet Orbeez (as a drying material).
2.2. Design of the Drying Chambers
In the current research work, the drying chamber was modified to improve the systemefficiency and drying rate for the material subject to different test loads under a constantflow rate.
Figure 3 shows the original drying chamber where the drying air enters through thesmall blower from the corner side. There are only few holes in the second bucket forpassing airflow to facilitate drying. For more efficient drying, a new drying chamber wasdeveloped to enhance the drying rate, to decrease air resistance, to consume less auxiliarypower, and to increase the effective surface area for higher heat and mass transfer betweenthe hot air and wet product. A schematic of the modified design is shown in Figure 4.

Processes 2021, 9, 1216 5 of 17
Processes 2021, 9, x FOR PEER REVIEW 5 of 18
2.2. Design of the Drying Chambers In the current research work, the drying chamber was modified to improve the sys-
tem efficiency and drying rate for the material subject to different test loads under a con-stant flow rate.
Figure 3 shows the original drying chamber where the drying air enters through the small blower from the corner side. There are only few holes in the second bucket for pass-ing airflow to facilitate drying. For more efficient drying, a new drying chamber was de-veloped to enhance the drying rate, to decrease air resistance, to consume less auxiliary power, and to increase the effective surface area for higher heat and mass transfer between the hot air and wet product. A schematic of the modified design is shown in Figure 4.
Figure 3. Heat pump drying chamber.
Figure 4. Schematic of the modified drying chamber.
2.3. Data Analysis 2.3.1. Coefficient of Performance
The coefficient of performance (COP) of an HP is used in a drying process to calculate the energy consumption of the system. The heat energy supplied in the condenser was evaluated using Equation (1). The analysis was divided into two parts: heat transfer and operating cost. 𝐶𝑂𝑃 = 𝑄𝑊 (1)𝑄 = 𝑚 𝐶𝑝 (𝑇 − 𝑇 ) (2)𝑚 = 𝜌 . 𝑉 (3)
Figure 3. Heat pump drying chamber.
Processes 2021, 9, x FOR PEER REVIEW 5 of 18
2.2. Design of the Drying Chambers In the current research work, the drying chamber was modified to improve the sys-
tem efficiency and drying rate for the material subject to different test loads under a con-stant flow rate.
Figure 3 shows the original drying chamber where the drying air enters through the small blower from the corner side. There are only few holes in the second bucket for pass-ing airflow to facilitate drying. For more efficient drying, a new drying chamber was de-veloped to enhance the drying rate, to decrease air resistance, to consume less auxiliary power, and to increase the effective surface area for higher heat and mass transfer between the hot air and wet product. A schematic of the modified design is shown in Figure 4.
Figure 3. Heat pump drying chamber.
Figure 4. Schematic of the modified drying chamber.
2.3. Data Analysis 2.3.1. Coefficient of Performance
The coefficient of performance (COP) of an HP is used in a drying process to calculate the energy consumption of the system. The heat energy supplied in the condenser was evaluated using Equation (1). The analysis was divided into two parts: heat transfer and operating cost. 𝐶𝑂𝑃 = 𝑄𝑊 (1)𝑄 = 𝑚 𝐶𝑝 (𝑇 − 𝑇 ) (2)𝑚 = 𝜌 . 𝑉 (3)
Figure 4. Schematic of the modified drying chamber.
2.3. Data Analysis2.3.1. Coefficient of Performance
The coefficient of performance (COP) of an HP is used in a drying process to calculatethe energy consumption of the system. The heat energy supplied in the condenser wasevaluated using Equation (1). The analysis was divided into two parts: heat transfer andoperating cost.
COP =
.Qcd
Wcomp(1)
.Qcd =
.miaCpair(Tco − Tci) (2).
mia = ρia·.
Vi (3)
Here,.Qcd = heat transfer rate by condenser (kW);.
mia = mass flow rate of dry air (kg/s);Cpair = specific heat of dry air (kJ/kg K);Tco = condenser outlet temperature (◦C);Tci = condenser inlet temperature (◦C);ρia = density of air (kg/m3);.
Vi = volumetric flow rate (m3/h).
Processes 2021, 9, 1216 6 of 17
2.3.2. Moisture Content (Wet Basis %)
The moisture content (MC) for moist Orbeez can be calculated on a wet basis (w.b) as
MCw.b (%) =Ww
Wp× 100 (4)
whereWw = weight of water in material;Wp = total weight of material.The moisture ratio was determined by the following equation
M =M−Me
Mo −Me(5)
The drying rate (DR) was calculated from the change in moisture content for sodiumpolyacrylate that occurred in each consecutive time interval by using the equation
DR =(Mt+dt − Mt)
dt(6)
whereDR = drying rate (kgwater/kg drysolid).The relative humidity was measured at four points during heat pump drying: two at
the dryer inlet and two at the evaporator outlet and condenser inlet. The amount of waterremoved per hour is called the moisture extraction rate or water removal rate (MER). TheMER represents the effectiveness of a dryer in terms of water removal. It can be calculatedfrom the humidity ratios by using the temperature and relative humidity at the dryer inletand outlet:
MER =.
mda(ωdout −ωdin) (7)
whereMER = moisture extraction rate (kg/h);.
mda = mass flow rate of dry air(
kgs
);
ωdout = Humidity ratio at dryer oulet(
kgkgDA
);
ωdin = Humidity ratio at dryer inlet(
kgkgDA
).
The term SMER is related to the power consumption and is determined using thefollowing equation:
SMER =
.mda(ωdout −ωdin)
Wcomp + Wblower(8)
whereSMER = moisture extraction rate (kg/kWh);ωdout = humidity ratio at outlet
(kg
kgDA
);
ωdin = humidity ratio at inlet(
kgkgDA
);
.mda = mass flow rate (kg/s);Wcomp = compressor output power (kWh);Wblower = blower output power (kWh).The experiment would have been affected by the environment or the accuracy of the
parameters, so the uncertainty of the mean values of measured and calculated parameterswas calculated and presented in Table 2.
Processes 2021, 9, 1216 7 of 17
Table 2. Uncertainty of mean values of measured and calculated parameters.
Blower power consumption Wb ±0.3Compressor power consumption Wc ±0.056Heat transfer rate at condenser Qcd kW ±0.736
Moisture extraction rate MER kg/h ±0.45Specific moisture extraction rate SMER kg/kWh ±0.336
Air mass flow rate.
m kg/sCoefficient of performance of heat pump COP - ±0.458
Moisture content MC g water/g wet material ±0.024
3. Results and Discussion
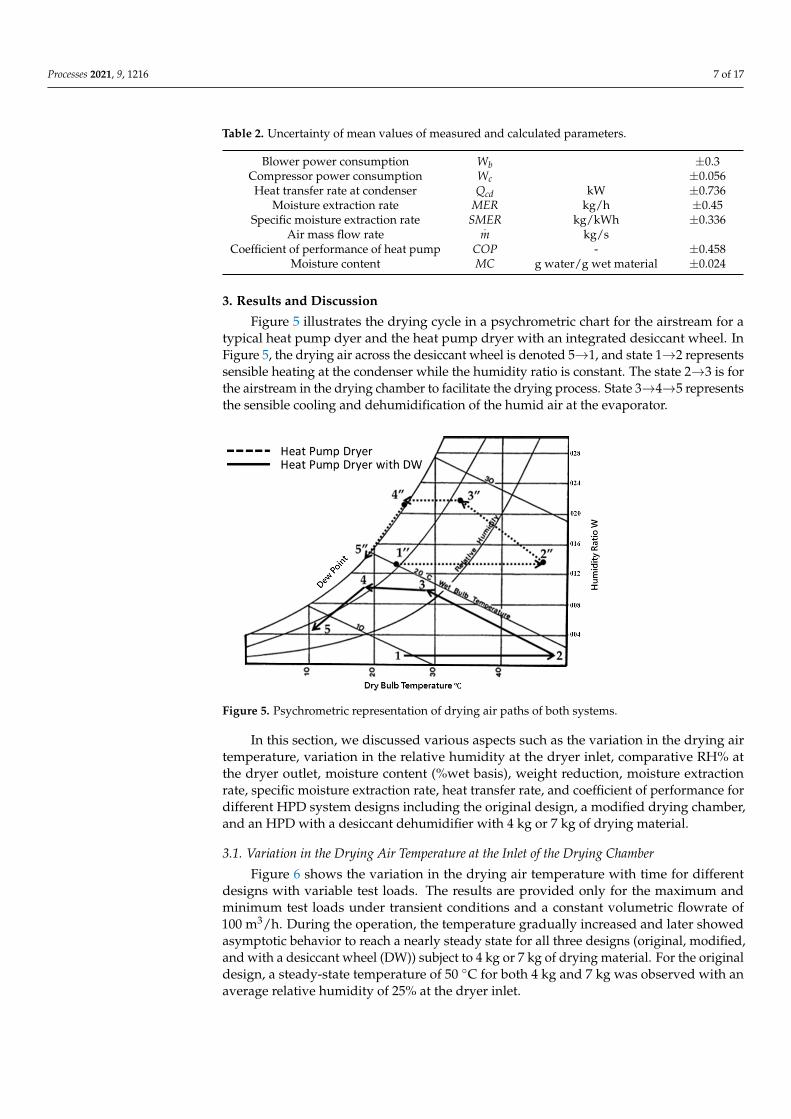
Figure 5 illustrates the drying cycle in a psychrometric chart for the airstream for atypical heat pump dyer and the heat pump dryer with an integrated desiccant wheel. InFigure 5, the drying air across the desiccant wheel is denoted 5→1, and state 1→2 representssensible heating at the condenser while the humidity ratio is constant. The state 2→3 is forthe airstream in the drying chamber to facilitate the drying process. State 3→4→5 representsthe sensible cooling and dehumidification of the humid air at the evaporator.
Processes 2021, 9, x FOR PEER REVIEW 7 of 18
𝑚 = mass flow rate (kg/s); 𝑊 = compressor output power (kWh); 𝑊 = blower output power (kWh). The experiment would have been affected by the environment or the accuracy of the
parameters, so the uncertainty of the mean values of measured and calculated parameters was calculated and presented in Table 2.
Table 2. Uncertainty of mean values of measured and calculated parameters.
Blower power consumption Wb ±0.3 Compressor power consumption Wc ±0.056 Heat transfer rate at condenser Qcd kW ±0.736
Moisture extraction rate MER kg/hr ±0.45 Specific moisture extraction rate SMER kg/kWh ±0.336
Air mass flow rate 𝑚 kg/s Coefficient of performance of heat pump COP - ±0.458
Moisture content MC g water/g wet material ±0.024
3. Results and Discussion Figure 5 illustrates the drying cycle in a psychrometric chart for the airstream for a
typical heat pump dyer and the heat pump dryer with an integrated desiccant wheel. In Figure 5, the drying air across the desiccant wheel is denoted 5→1, and state 1→2 repre-sents sensible heating at the condenser while the humidity ratio is constant. The state 2→3 is for the airstream in the drying chamber to facilitate the drying process. State 3→4→5 represents the sensible cooling and dehumidification of the humid air at the evaporator.
Figure 5. Psychrometric representation of drying air paths of both systems.
In this section, we discussed various aspects such as the variation in the drying air temperature, variation in the relative humidity at the dryer inlet, comparative RH% at the dryer outlet, moisture content (%wet basis), weight reduction, moisture extraction rate, specific moisture extraction rate, heat transfer rate, and coefficient of performance for dif-ferent HPD system designs including the original design, a modified drying chamber, and an HPD with a desiccant dehumidifier with 4 kg or 7 kg of drying material.
Figure 5. Psychrometric representation of drying air paths of both systems.
In this section, we discussed various aspects such as the variation in the drying airtemperature, variation in the relative humidity at the dryer inlet, comparative RH% atthe dryer outlet, moisture content (%wet basis), weight reduction, moisture extractionrate, specific moisture extraction rate, heat transfer rate, and coefficient of performance fordifferent HPD system designs including the original design, a modified drying chamber,and an HPD with a desiccant dehumidifier with 4 kg or 7 kg of drying material.
3.1. Variation in the Drying Air Temperature at the Inlet of the Drying Chamber
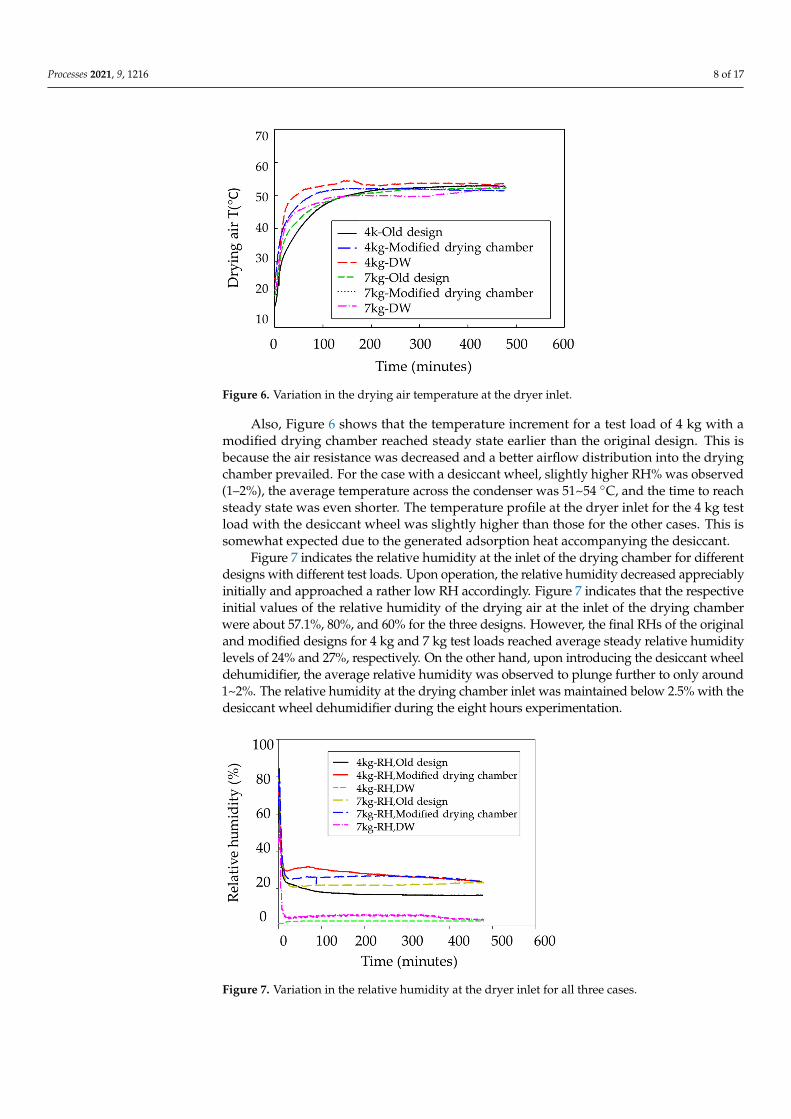
Figure 6 shows the variation in the drying air temperature with time for differentdesigns with variable test loads. The results are provided only for the maximum andminimum test loads under transient conditions and a constant volumetric flowrate of100 m3/h. During the operation, the temperature gradually increased and later showedasymptotic behavior to reach a nearly steady state for all three designs (original, modified,and with a desiccant wheel (DW)) subject to 4 kg or 7 kg of drying material. For the originaldesign, a steady-state temperature of 50 ◦C for both 4 kg and 7 kg was observed with anaverage relative humidity of 25% at the dryer inlet.
Processes 2021, 9, 1216 8 of 17
Processes 2021, 9, x FOR PEER REVIEW 8 of 18
3.1. Variation in the Drying Air Temperature at the Inlet of the Drying Chamber Figure 6 shows the variation in the drying air temperature with time for different
designs with variable test loads. The results are provided only for the maximum and min-imum test loads under transient conditions and a constant volumetric flowrate of 100 m3/h. During the operation, the temperature gradually increased and later showed as-ymptotic behavior to reach a nearly steady state for all three designs (original, modified, and with a desiccant wheel (DW)) subject to 4 kg or 7 kg of drying material. For the orig-inal design, a steady-state temperature of 50 °C for both 4 kg and 7 kg was observed with an average relative humidity of 25% at the dryer inlet.
Figure 6. Variation in the drying air temperature at the dryer inlet.
Also, Figure 6 shows that the temperature increment for a test load of 4 kg with a modified drying chamber reached steady state earlier than the original design. This is be-cause the air resistance was decreased and a better airflow distribution into the drying chamber prevailed. For the case with a desiccant wheel, slightly higher RH% was ob-served (1–2%), the average temperature across the condenser was 51~54 °C, and the time to reach steady state was even shorter. The temperature profile at the dryer inlet for the 4 kg test load with the desiccant wheel was slightly higher than those for the other cases. This is somewhat expected due to the generated adsorption heat accompanying the des-iccant.
Figure 7 indicates the relative humidity at the inlet of the drying chamber for differ-ent designs with different test loads. Upon operation, the relative humidity decreased ap-preciably initially and approached a rather low RH accordingly. Figure 7 indicates that the respective initial values of the relative humidity of the drying air at the inlet of the drying chamber were about 57.1%, 80%, and 60% for the three designs. However, the final RHs of the original and modified designs for 4 kg and 7 kg test loads reached average steady relative humidity levels of 24% and 27%, respectively. On the other hand, upon introducing the desiccant wheel dehumidifier, the average relative humidity was ob-served to plunge further to only around 1~2%. The relative humidity at the drying cham-ber inlet was maintained below 2.5% with the desiccant wheel dehumidifier during the eight hours experimentation.
Figure 6. Variation in the drying air temperature at the dryer inlet.
Also, Figure 6 shows that the temperature increment for a test load of 4 kg with amodified drying chamber reached steady state earlier than the original design. This isbecause the air resistance was decreased and a better airflow distribution into the dryingchamber prevailed. For the case with a desiccant wheel, slightly higher RH% was observed(1–2%), the average temperature across the condenser was 51~54 ◦C, and the time to reachsteady state was even shorter. The temperature profile at the dryer inlet for the 4 kg testload with the desiccant wheel was slightly higher than those for the other cases. This issomewhat expected due to the generated adsorption heat accompanying the desiccant.
Figure 7 indicates the relative humidity at the inlet of the drying chamber for differentdesigns with different test loads. Upon operation, the relative humidity decreased appreciablyinitially and approached a rather low RH accordingly. Figure 7 indicates that the respectiveinitial values of the relative humidity of the drying air at the inlet of the drying chamberwere about 57.1%, 80%, and 60% for the three designs. However, the final RHs of the originaland modified designs for 4 kg and 7 kg test loads reached average steady relative humiditylevels of 24% and 27%, respectively. On the other hand, upon introducing the desiccant wheeldehumidifier, the average relative humidity was observed to plunge further to only around1~2%. The relative humidity at the drying chamber inlet was maintained below 2.5% with thedesiccant wheel dehumidifier during the eight hours experimentation.
Processes 2021, 9, x FOR PEER REVIEW 9 of 18
Figure 7. Variation in the relative humidity at the dryer inlet for all three cases.
3.2. Comparison of the RH at the Dryer Outlet Figure 8 indicates the relative humidity levels at the dryer outlet for variable test
loads on three different designs. The drying rates shown in the figure can be categorized into transient, constant, and falling rates. At the beginning, the original and modified de-signs show the maximum RH at the outlet of the drying chamber. For the test load of 7 kg, the air resistance of the bucket was much higher for the original design as compared to the others, and the material possessed a large water content, thereby resulting in a ra-ther low dehumidifying process and a high relative humidity, accordingly. With the in-troduction of the modified drying chamber, a better heat and mass transfer process oc-curred; consequently, the RH at the outlet dropped consistently from the initial peak to-ward a lower value in a steady manner. This was further made clear with the introduction of the DW dehumidifier, where an even lower RH prevailed for the much lower inlet RH at the inlet of the drying chamber, as depicted in Figure 7.
Figure 8. Variation in the relative humidity at the dryer outlet.
3.3. Moisture Content (% Wet Basis) Figures 9 and 10 illustrate the effect of test loads (4 kg and 7 kg with initial moisture
contents (wet basis) of 98% and 99%, respectively) on the drying process of the heat pump dryer subject to an air velocity of 0.5 m/s under transient conditions. Before the experi-ment, the dry weight of the material was calculated, and it was then immersed in water
Figure 7. Variation in the relative humidity at the dryer inlet for all three cases.
Processes 2021, 9, 1216 9 of 17
3.2. Comparison of the RH at the Dryer Outlet
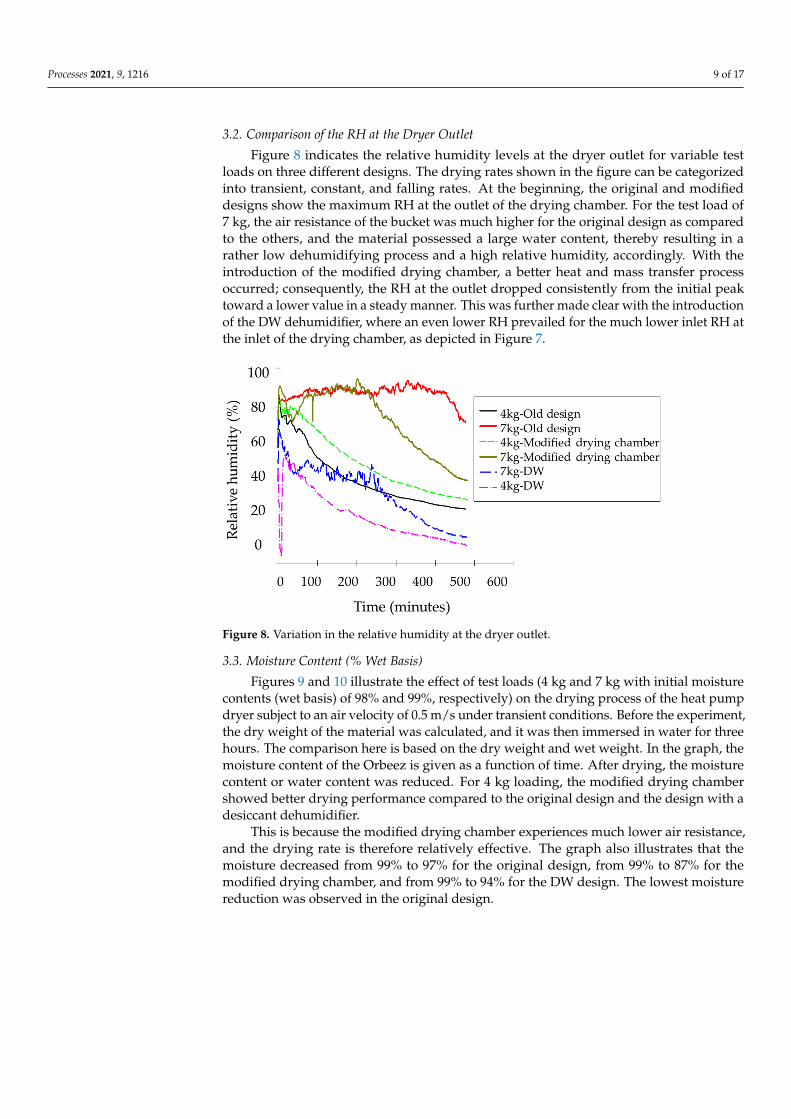
Figure 8 indicates the relative humidity levels at the dryer outlet for variable testloads on three different designs. The drying rates shown in the figure can be categorizedinto transient, constant, and falling rates. At the beginning, the original and modifieddesigns show the maximum RH at the outlet of the drying chamber. For the test load of7 kg, the air resistance of the bucket was much higher for the original design as comparedto the others, and the material possessed a large water content, thereby resulting in arather low dehumidifying process and a high relative humidity, accordingly. With theintroduction of the modified drying chamber, a better heat and mass transfer processoccurred; consequently, the RH at the outlet dropped consistently from the initial peaktoward a lower value in a steady manner. This was further made clear with the introductionof the DW dehumidifier, where an even lower RH prevailed for the much lower inlet RH atthe inlet of the drying chamber, as depicted in Figure 7.
Processes 2021, 9, x FOR PEER REVIEW 9 of 18
Figure 7. Variation in the relative humidity at the dryer inlet for all three cases.
3.2. Comparison of the RH at the Dryer Outlet Figure 8 indicates the relative humidity levels at the dryer outlet for variable test
loads on three different designs. The drying rates shown in the figure can be categorized into transient, constant, and falling rates. At the beginning, the original and modified de-signs show the maximum RH at the outlet of the drying chamber. For the test load of 7 kg, the air resistance of the bucket was much higher for the original design as compared to the others, and the material possessed a large water content, thereby resulting in a ra-ther low dehumidifying process and a high relative humidity, accordingly. With the in-troduction of the modified drying chamber, a better heat and mass transfer process oc-curred; consequently, the RH at the outlet dropped consistently from the initial peak to-ward a lower value in a steady manner. This was further made clear with the introduction of the DW dehumidifier, where an even lower RH prevailed for the much lower inlet RH at the inlet of the drying chamber, as depicted in Figure 7.
Figure 8. Variation in the relative humidity at the dryer outlet.
3.3. Moisture Content (% Wet Basis) Figures 9 and 10 illustrate the effect of test loads (4 kg and 7 kg with initial moisture
contents (wet basis) of 98% and 99%, respectively) on the drying process of the heat pump dryer subject to an air velocity of 0.5 m/s under transient conditions. Before the experi-ment, the dry weight of the material was calculated, and it was then immersed in water
Figure 8. Variation in the relative humidity at the dryer outlet.
3.3. Moisture Content (% Wet Basis)
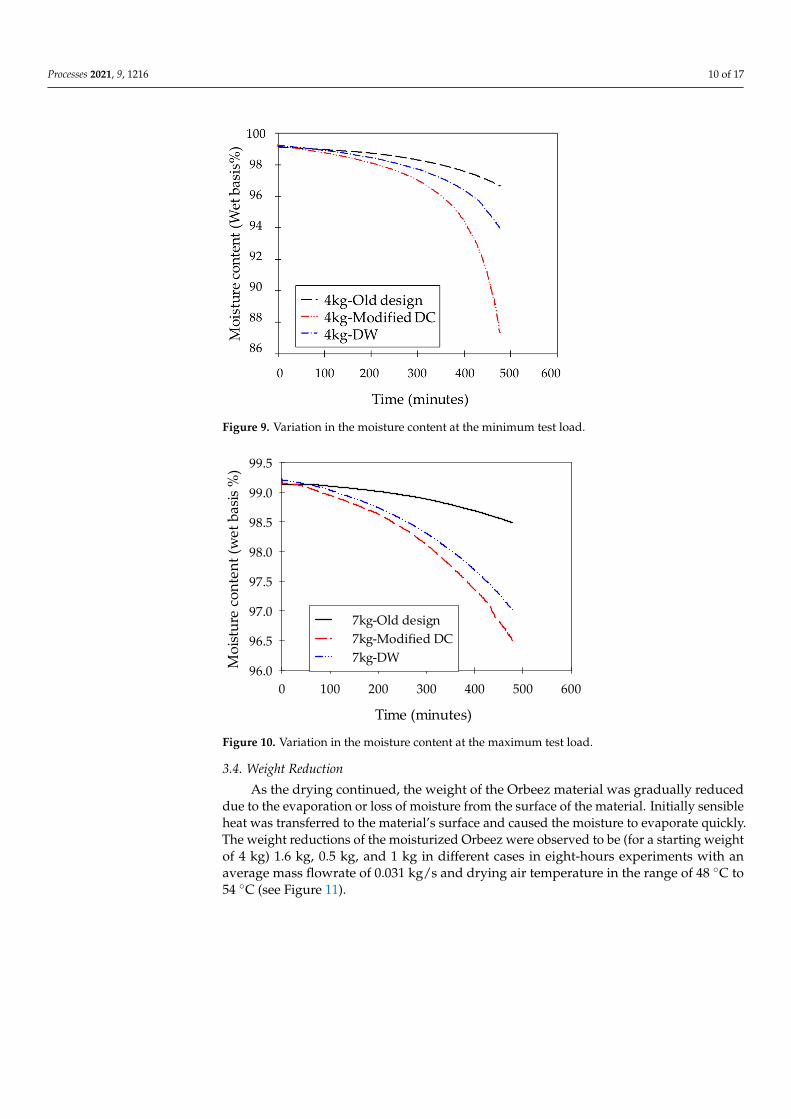
Figures 9 and 10 illustrate the effect of test loads (4 kg and 7 kg with initial moisturecontents (wet basis) of 98% and 99%, respectively) on the drying process of the heat pumpdryer subject to an air velocity of 0.5 m/s under transient conditions. Before the experiment,the dry weight of the material was calculated, and it was then immersed in water for threehours. The comparison here is based on the dry weight and wet weight. In the graph, themoisture content of the Orbeez is given as a function of time. After drying, the moisturecontent or water content was reduced. For 4 kg loading, the modified drying chambershowed better drying performance compared to the original design and the design with adesiccant dehumidifier.
This is because the modified drying chamber experiences much lower air resistance,and the drying rate is therefore relatively effective. The graph also illustrates that themoisture decreased from 99% to 97% for the original design, from 99% to 87% for themodified drying chamber, and from 99% to 94% for the DW design. The lowest moisturereduction was observed in the original design.
Processes 2021, 9, 1216 10 of 17
Processes 2021, 9, x FOR PEER REVIEW 10 of 18
for three hours. The comparison here is based on the dry weight and wet weight. In the graph, the moisture content of the Orbeez is given as a function of time. After drying, the moisture content or water content was reduced. For 4 kg loading, the modified drying chamber showed better drying performance compared to the original design and the de-sign with a desiccant dehumidifier.
Figure 9. Variation in the moisture content at the minimum test load.
Time (minutes)
0 100 200 300 400 500 600
Moi
stur
e co
nten
t (w
et b
asis
%)
96.0
96.5
97.0
97.5
98.0
98.5
99.0
99.5
7kg-Old design 7kg-Modified DC7kg-DW
Figure 10. Variation in the moisture content at the maximum test load.
This is because the modified drying chamber experiences much lower air resistance, and the drying rate is therefore relatively effective. The graph also illustrates that the moisture decreased from 99% to 97% for the original design, from 99% to 87% for the modified drying chamber, and from 99% to 94% for the DW design. The lowest moisture reduction was observed in the original design.
Figure 9. Variation in the moisture content at the minimum test load.
Processes 2021, 9, x FOR PEER REVIEW 10 of 18
for three hours. The comparison here is based on the dry weight and wet weight. In the graph, the moisture content of the Orbeez is given as a function of time. After drying, the moisture content or water content was reduced. For 4 kg loading, the modified drying chamber showed better drying performance compared to the original design and the de-sign with a desiccant dehumidifier.
Figure 9. Variation in the moisture content at the minimum test load.
Time (minutes)
0 100 200 300 400 500 600
Moi
stur
e co
nten
t (w
et b
asis
%)
96.0
96.5
97.0
97.5
98.0
98.5
99.0
99.5
7kg-Old design 7kg-Modified DC7kg-DW
Figure 10. Variation in the moisture content at the maximum test load.
This is because the modified drying chamber experiences much lower air resistance, and the drying rate is therefore relatively effective. The graph also illustrates that the moisture decreased from 99% to 97% for the original design, from 99% to 87% for the modified drying chamber, and from 99% to 94% for the DW design. The lowest moisture reduction was observed in the original design.
Figure 10. Variation in the moisture content at the maximum test load.
3.4. Weight Reduction
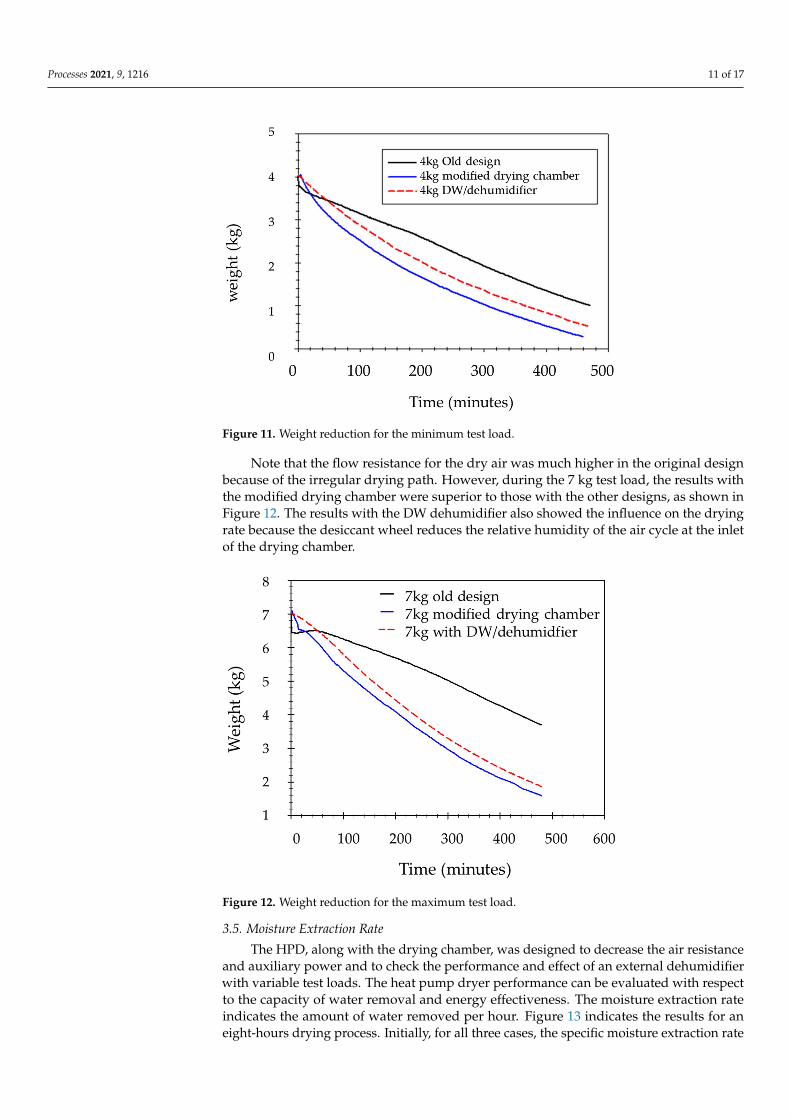
As the drying continued, the weight of the Orbeez material was gradually reduceddue to the evaporation or loss of moisture from the surface of the material. Initially sensibleheat was transferred to the material’s surface and caused the moisture to evaporate quickly.The weight reductions of the moisturized Orbeez were observed to be (for a starting weightof 4 kg) 1.6 kg, 0.5 kg, and 1 kg in different cases in eight-hours experiments with anaverage mass flowrate of 0.031 kg/s and drying air temperature in the range of 48 ◦C to54 ◦C (see Figure 11).
Processes 2021, 9, 1216 11 of 17
Processes 2021, 9, x FOR PEER REVIEW 11 of 18
3.4. Weight Reduction As the drying continued, the weight of the Orbeez material was gradually reduced
due to the evaporation or loss of moisture from the surface of the material. Initially sensi-ble heat was transferred to the material’s surface and caused the moisture to evaporate quickly. The weight reductions of the moisturized Orbeez were observed to be (for a start-ing weight of 4 kg) 1.6 kg, 0.5 kg, and 1 kg in different cases in eight-hours experiments with an average mass flowrate of 0.031 kg/s and drying air temperature in the range of 48 °C to 54 °C (see Figure 11).
Figure 11. Weight reduction for the minimum test load.
Note that the flow resistance for the dry air was much higher in the original design because of the irregular drying path. However, during the 7 kg test load, the results with the modified drying chamber were superior to those with the other designs, as shown in Figure 12. The results with the DW dehumidifier also showed the influence on the drying rate because the desiccant wheel reduces the relative humidity of the air cycle at the inlet of the drying chamber.
Figure 11. Weight reduction for the minimum test load.
Note that the flow resistance for the dry air was much higher in the original designbecause of the irregular drying path. However, during the 7 kg test load, the results withthe modified drying chamber were superior to those with the other designs, as shown inFigure 12. The results with the DW dehumidifier also showed the influence on the dryingrate because the desiccant wheel reduces the relative humidity of the air cycle at the inletof the drying chamber.
Processes 2021, 9, x FOR PEER REVIEW 12 of 18
Figure 12. Weight reduction for the maximum test load.
3.5. Moisture Extraction Rate The HPD, along with the drying chamber, was designed to decrease the air resistance
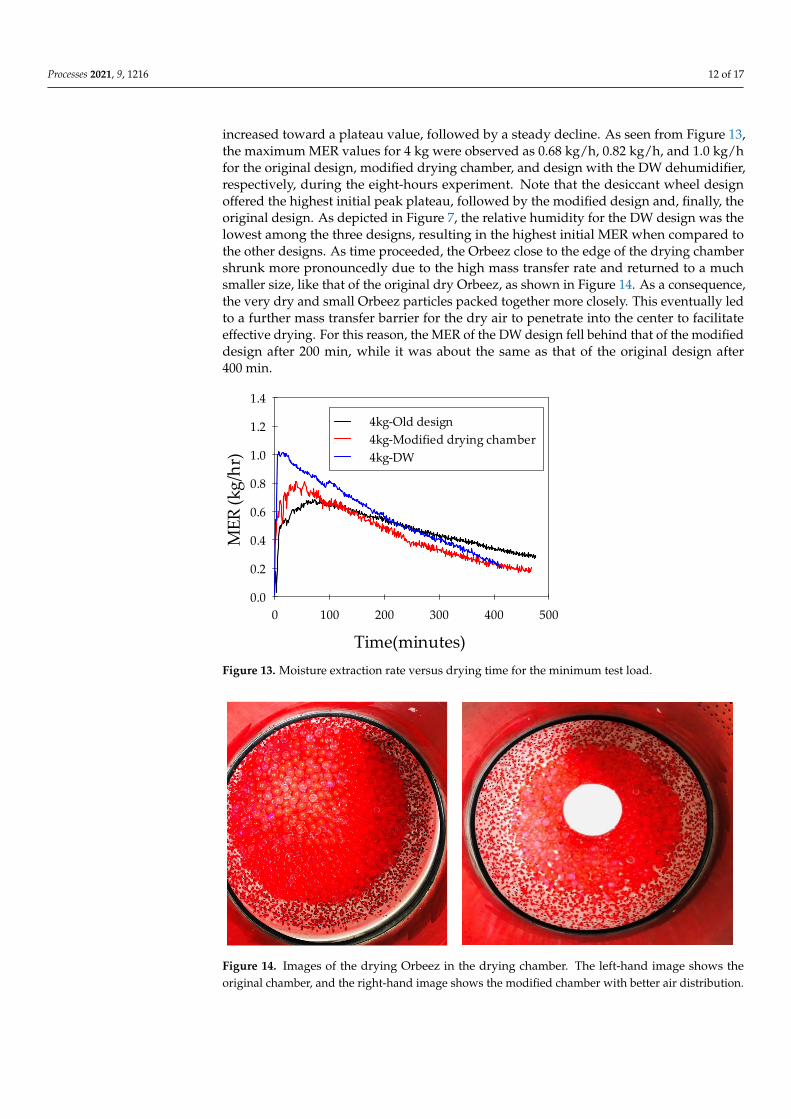
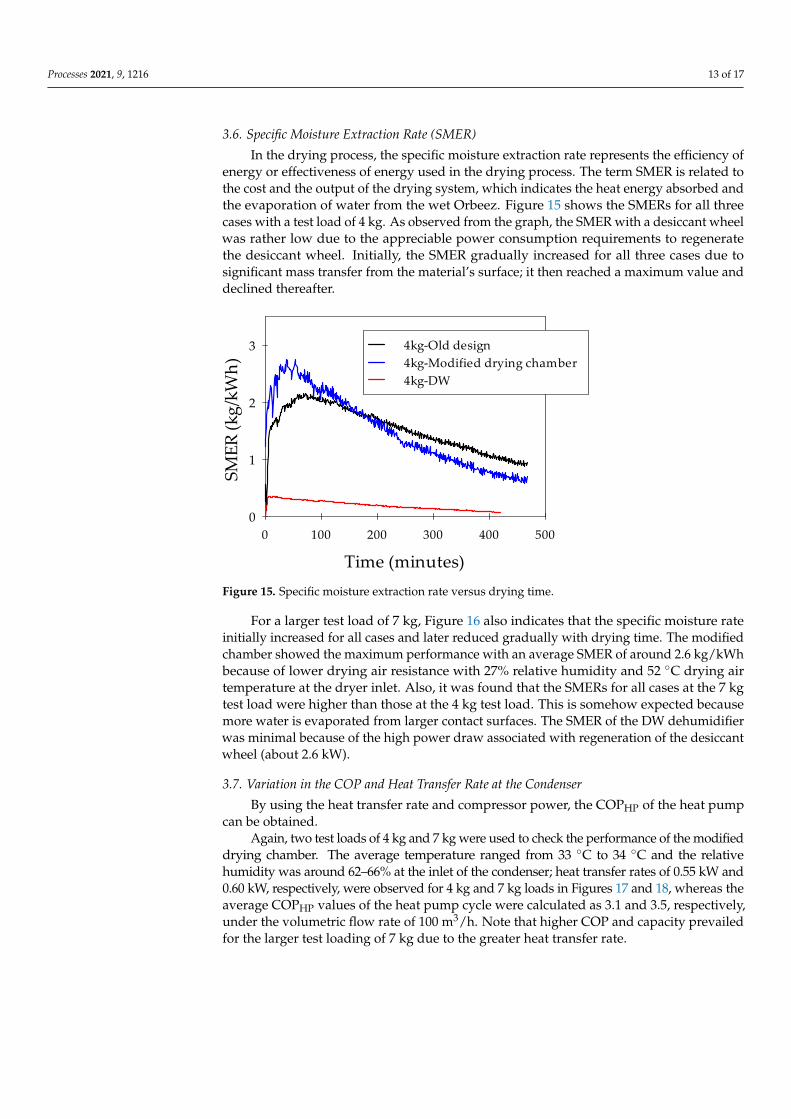
and auxiliary power and to check the performance and effect of an external dehumidifier with variable test loads. The heat pump dryer performance can be evaluated with respect to the capacity of water removal and energy effectiveness. The moisture extraction rate indicates the amount of water removed per hour. Figure 13 indicates the results for an eight-hours drying process. Initially, for all three cases, the specific moisture extraction rate increased toward a plateau value, followed by a steady decline. As seen from Figure 13, the maximum MER values for 4 kg were observed as 0.68 kg/h, 0.82 kg/h, and 1.0 kg/h for the original design, modified drying chamber, and design with the DW dehumidifier, respectively, during the eight-hours experiment. Note that the desiccant wheel design of-fered the highest initial peak plateau, followed by the modified design and, finally, the original design. As depicted in Figure 7, the relative humidity for the DW design was the lowest among the three designs, resulting in the highest initial MER when compared to the other designs. As time proceeded, the Orbeez close to the edge of the drying chamber shrunk more pronouncedly due to the high mass transfer rate and returned to a much smaller size, like that of the original dry Orbeez, as shown in Figure 14. As a consequence, the very dry and small Orbeez particles packed together more closely. This eventually led to a further mass transfer barrier for the dry air to penetrate into the center to facilitate effective drying. For this reason, the MER of the DW design fell behind that of the modi-fied design after 200 min, while it was about the same as that of the original design after 400 min.
Figure 12. Weight reduction for the maximum test load.
3.5. Moisture Extraction Rate
The HPD, along with the drying chamber, was designed to decrease the air resistanceand auxiliary power and to check the performance and effect of an external dehumidifierwith variable test loads. The heat pump dryer performance can be evaluated with respectto the capacity of water removal and energy effectiveness. The moisture extraction rateindicates the amount of water removed per hour. Figure 13 indicates the results for aneight-hours drying process. Initially, for all three cases, the specific moisture extraction rate
Processes 2021, 9, 1216 12 of 17
increased toward a plateau value, followed by a steady decline. As seen from Figure 13,the maximum MER values for 4 kg were observed as 0.68 kg/h, 0.82 kg/h, and 1.0 kg/hfor the original design, modified drying chamber, and design with the DW dehumidifier,respectively, during the eight-hours experiment. Note that the desiccant wheel designoffered the highest initial peak plateau, followed by the modified design and, finally, theoriginal design. As depicted in Figure 7, the relative humidity for the DW design was thelowest among the three designs, resulting in the highest initial MER when compared tothe other designs. As time proceeded, the Orbeez close to the edge of the drying chambershrunk more pronouncedly due to the high mass transfer rate and returned to a muchsmaller size, like that of the original dry Orbeez, as shown in Figure 14. As a consequence,the very dry and small Orbeez particles packed together more closely. This eventually ledto a further mass transfer barrier for the dry air to penetrate into the center to facilitateeffective drying. For this reason, the MER of the DW design fell behind that of the modifieddesign after 200 min, while it was about the same as that of the original design after400 min.
Processes 2021, 9, x FOR PEER REVIEW 13 of 18
Time(minutes) 0 100 200 300 400 500
MER
(kg/
hr)
0.0
0.2
0.4
0.6
0.8
1.0
1.2
1.4
4kg-Old design 4kg-Modified drying chamber 4kg-DW
Figure 13. Moisture extraction rate versus drying time for the minimum test load.
Figure 14. Images of the drying Orbeez in the drying chamber. The left-hand image shows the original chamber, and the right-hand image shows the modified chamber with better air distribution.
3.6. Specific Moisture Extraction Rate (SMER) In the drying process, the specific moisture extraction rate represents the efficiency
of energy or effectiveness of energy used in the drying process. The term SMER is related to the cost and the output of the drying system, which indicates the heat energy absorbed and the evaporation of water from the wet Orbeez. Figure 15 shows the SMERs for all three cases with a test load of 4 kg. As observed from the graph, the SMER with a desiccant wheel was rather low due to the appreciable power consumption requirements to regen-erate the desiccant wheel. Initially, the SMER gradually increased for all three cases due to significant mass transfer from the material’s surface; it then reached a maximum value and declined thereafter.
Figure 13. Moisture extraction rate versus drying time for the minimum test load.
Processes 2021, 9, x FOR PEER REVIEW 13 of 18
Time(minutes) 0 100 200 300 400 500
MER
(kg/
hr)
0.0
0.2
0.4
0.6
0.8
1.0
1.2
1.4
4kg-Old design 4kg-Modified drying chamber 4kg-DW
Figure 13. Moisture extraction rate versus drying time for the minimum test load.
Figure 14. Images of the drying Orbeez in the drying chamber. The left-hand image shows the original chamber, and the right-hand image shows the modified chamber with better air distribution.
3.6. Specific Moisture Extraction Rate (SMER) In the drying process, the specific moisture extraction rate represents the efficiency
of energy or effectiveness of energy used in the drying process. The term SMER is related to the cost and the output of the drying system, which indicates the heat energy absorbed and the evaporation of water from the wet Orbeez. Figure 15 shows the SMERs for all three cases with a test load of 4 kg. As observed from the graph, the SMER with a desiccant wheel was rather low due to the appreciable power consumption requirements to regen-erate the desiccant wheel. Initially, the SMER gradually increased for all three cases due to significant mass transfer from the material’s surface; it then reached a maximum value and declined thereafter.
Figure 14. Images of the drying Orbeez in the drying chamber. The left-hand image shows theoriginal chamber, and the right-hand image shows the modified chamber with better air distribution.
Processes 2021, 9, 1216 13 of 17
3.6. Specific Moisture Extraction Rate (SMER)
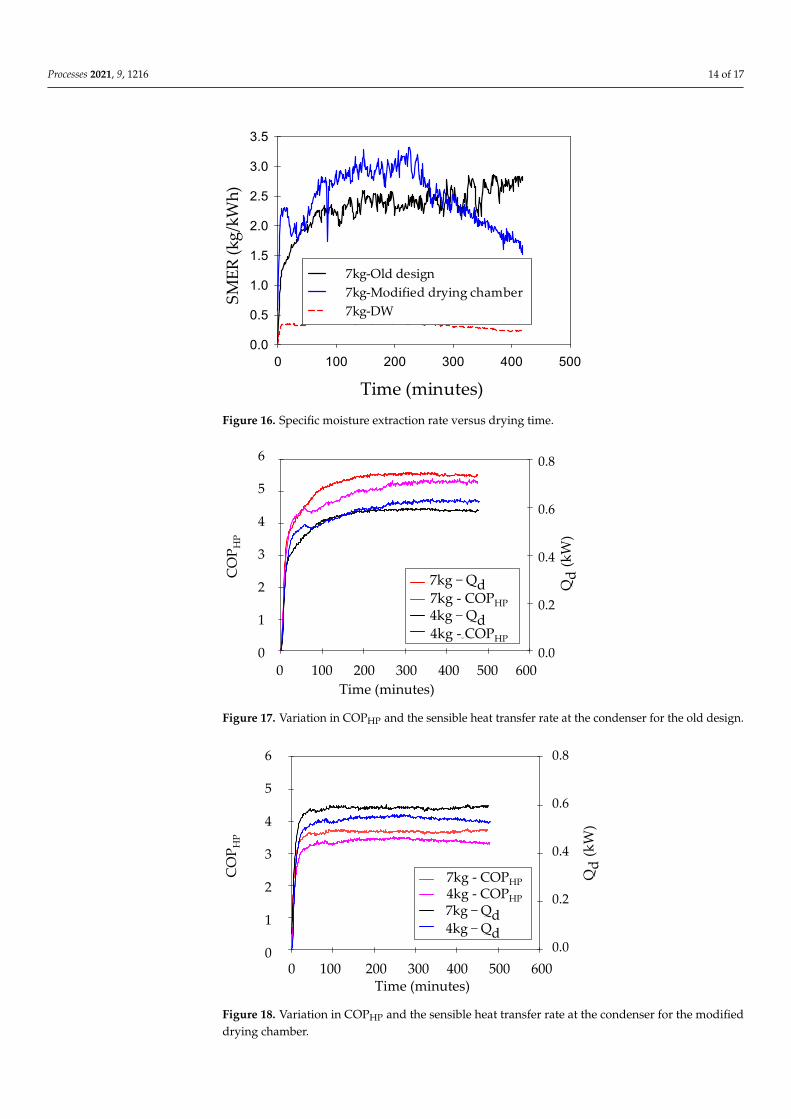
In the drying process, the specific moisture extraction rate represents the efficiency ofenergy or effectiveness of energy used in the drying process. The term SMER is related tothe cost and the output of the drying system, which indicates the heat energy absorbed andthe evaporation of water from the wet Orbeez. Figure 15 shows the SMERs for all threecases with a test load of 4 kg. As observed from the graph, the SMER with a desiccant wheelwas rather low due to the appreciable power consumption requirements to regeneratethe desiccant wheel. Initially, the SMER gradually increased for all three cases due tosignificant mass transfer from the material’s surface; it then reached a maximum value anddeclined thereafter.
Processes 2021, 9, x FOR PEER REVIEW 14 of 18
Time (minutes) 0 100 200 300 400 500
SMER
(kg/
kWh)
0
1
2
3 4kg-Old design 4kg-Modified drying chamber 4kg-DW
Figure 15. Specific moisture extraction rate versus drying time.
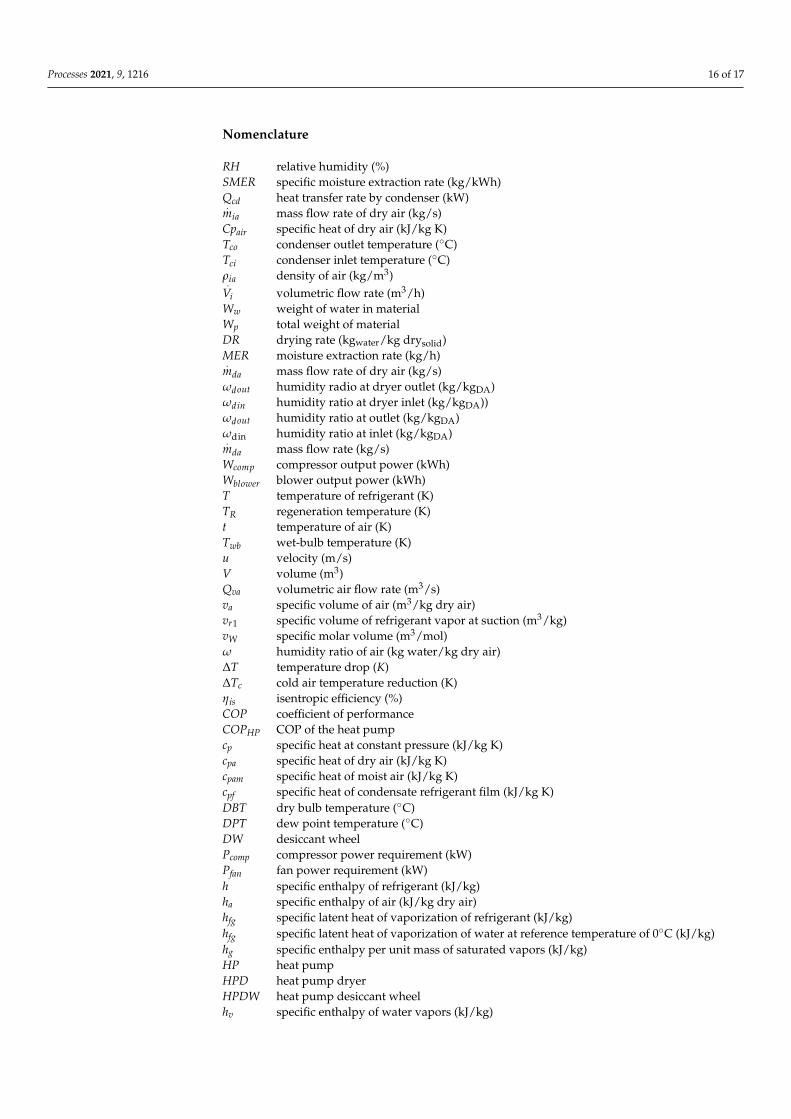
For a larger test load of 7 kg, Figure 16 also indicates that the specific moisture rate initially increased for all cases and later reduced gradually with drying time. The modified chamber showed the maximum performance with an average SMER of around 2.6 kg/kWh because of lower drying air resistance with 27% relative humidity and 52 °C dry-ing air temperature at the dryer inlet. Also, it was found that the SMERs for all cases at the 7 kg test load were higher than those at the 4 kg test load. This is somehow expected because more water is evaporated from larger contact surfaces. The SMER of the DW de-humidifier was minimal because of the high power draw associated with regeneration of the desiccant wheel (about 2.6 kW).
Time (minutes) 0 100 200 300 400 500
SMER
(kg/
kWh)
0.0
0.5
1.0
1.5
2.0
2.5
3.0
3.5
7kg-Old design 7kg-Modified drying chamber 7kg-DW
Figure 16. Specific moisture extraction rate versus drying time.
3.7. Variation in the COP and Heat Transfer Rate at the Condenser By using the heat transfer rate and compressor power, the COPHP of the heat pump
can be obtained. Again, two test loads of 4 kg and 7 kg were used to check the performance of the
modified drying chamber. The average temperature ranged from 33 °C to 34 °C and the relative humidity was around 62–66% at the inlet of the condenser; heat transfer rates of 0.55 kW and 0.60 kW, respectively, were observed for 4 kg and 7 kg loads in Figures 17
Figure 15. Specific moisture extraction rate versus drying time.
For a larger test load of 7 kg, Figure 16 also indicates that the specific moisture rateinitially increased for all cases and later reduced gradually with drying time. The modifiedchamber showed the maximum performance with an average SMER of around 2.6 kg/kWhbecause of lower drying air resistance with 27% relative humidity and 52 ◦C drying airtemperature at the dryer inlet. Also, it was found that the SMERs for all cases at the 7 kgtest load were higher than those at the 4 kg test load. This is somehow expected becausemore water is evaporated from larger contact surfaces. The SMER of the DW dehumidifierwas minimal because of the high power draw associated with regeneration of the desiccantwheel (about 2.6 kW).
3.7. Variation in the COP and Heat Transfer Rate at the Condenser
By using the heat transfer rate and compressor power, the COPHP of the heat pumpcan be obtained.
Again, two test loads of 4 kg and 7 kg were used to check the performance of the modifieddrying chamber. The average temperature ranged from 33 ◦C to 34 ◦C and the relativehumidity was around 62–66% at the inlet of the condenser; heat transfer rates of 0.55 kW and0.60 kW, respectively, were observed for 4 kg and 7 kg loads in Figures 17 and 18, whereas theaverage COPHP values of the heat pump cycle were calculated as 3.1 and 3.5, respectively,under the volumetric flow rate of 100 m3/h. Note that higher COP and capacity prevailedfor the larger test loading of 7 kg due to the greater heat transfer rate.
Processes 2021, 9, 1216 14 of 17
Processes 2021, 9, x FOR PEER REVIEW 14 of 18
Time (minutes) 0 100 200 300 400 500
SMER
(kg/
kWh)
0
1
2
3 4kg-Old design 4kg-Modified drying chamber 4kg-DW
Figure 15. Specific moisture extraction rate versus drying time.
For a larger test load of 7 kg, Figure 16 also indicates that the specific moisture rate initially increased for all cases and later reduced gradually with drying time. The modified chamber showed the maximum performance with an average SMER of around 2.6 kg/kWh because of lower drying air resistance with 27% relative humidity and 52 °C dry-ing air temperature at the dryer inlet. Also, it was found that the SMERs for all cases at the 7 kg test load were higher than those at the 4 kg test load. This is somehow expected because more water is evaporated from larger contact surfaces. The SMER of the DW de-humidifier was minimal because of the high power draw associated with regeneration of the desiccant wheel (about 2.6 kW).
Time (minutes) 0 100 200 300 400 500
SMER
(kg/
kWh)
0.0
0.5
1.0
1.5
2.0
2.5
3.0
3.5
7kg-Old design 7kg-Modified drying chamber 7kg-DW
Figure 16. Specific moisture extraction rate versus drying time.
3.7. Variation in the COP and Heat Transfer Rate at the Condenser By using the heat transfer rate and compressor power, the COPHP of the heat pump
can be obtained. Again, two test loads of 4 kg and 7 kg were used to check the performance of the
modified drying chamber. The average temperature ranged from 33 °C to 34 °C and the relative humidity was around 62–66% at the inlet of the condenser; heat transfer rates of 0.55 kW and 0.60 kW, respectively, were observed for 4 kg and 7 kg loads in Figures 17
Figure 16. Specific moisture extraction rate versus drying time.
Processes 2021, 9, x FOR PEER REVIEW 15 of 18
and 18, whereas the average COPHP values of the heat pump cycle were calculated as 3.1 and 3.5, respectively, under the volumetric flow rate of 100 m3/hr. Note that higher COP and capacity prevailed for the larger test loading of 7 kg due to the greater heat transfer rate.
Figure 17. Variation in COPHP and the sensible heat transfer rate at the condenser for the old de-sign.
Figure 18. Variation in COPHP and the sensible heat transfer rate at the condenser for the modified drying chamber.
4. Conclusions In the current study, we developed a heat pump dryer (HPD) to assess the perfor-
mance of a closed-loop heat pump dryer system, and a modified drying chamber was designed to offer a lower airflow resistance to facilitate effective drying. On top of the modified design, a desiccant wheel was installed to further lower the humidity of the dry-ing air, and further examination regarding its applicability was conducted. Unlike most of the existing studies, which normally adopt organic products as the drying materials, in this study we used moist sodium polyacrylate (Orbeez) as the drying material for con-sistent characterization of the heat pump performance. R-134a was adopted as the refrig-erant for the heat pump system. The experiments were performed subject to different weights of Orbeez (drying material) at a constant volumetric flow rate of 100 m3/h. The
Time (minutes) 0 100 200 300 400 500 600
Qcd
(kW
)
0.0
0.2
0.4
0.6
0.8
CO
P HP
0
1
2
3
4
5
6
7kg-Qcd(kW) 7kg -COP 4kg-Qcd(kW) 4kg-COP
Time (minutes)
CO
P HP
(kW
)
7kg - COPHP
4kg - COPHP
6
5
4
3
2
1
00 100 200 300 400 500 600
0.8
0.6
0.4
0.2
0.0
Time (minutes) 0 100 200 300 400 500 600
CO
P HP
0
1
2
3
4
5
6
Qcd
(kW
)
0.0
0.2
0.4
0.6
0.8
7kg- COP 4kg - COP 7kg - Qcd (kW) 4kg - Qcd (kW)
Time (minutes)
CO
P HP
(kW
)
7kg - COPHP4kg - COPHP
6
5
4
3
2
1
00 100 200 300 400 500 600
0.8
0.6
0.4
0.2
0.0
Figure 17. Variation in COPHP and the sensible heat transfer rate at the condenser for the old design.
Processes 2021, 9, x FOR PEER REVIEW 15 of 18
and 18, whereas the average COPHP values of the heat pump cycle were calculated as 3.1 and 3.5, respectively, under the volumetric flow rate of 100 m3/hr. Note that higher COP and capacity prevailed for the larger test loading of 7 kg due to the greater heat transfer rate.
Figure 17. Variation in COPHP and the sensible heat transfer rate at the condenser for the old de-sign.
Figure 18. Variation in COPHP and the sensible heat transfer rate at the condenser for the modified drying chamber.
4. Conclusions In the current study, we developed a heat pump dryer (HPD) to assess the perfor-
mance of a closed-loop heat pump dryer system, and a modified drying chamber was designed to offer a lower airflow resistance to facilitate effective drying. On top of the modified design, a desiccant wheel was installed to further lower the humidity of the dry-ing air, and further examination regarding its applicability was conducted. Unlike most of the existing studies, which normally adopt organic products as the drying materials, in this study we used moist sodium polyacrylate (Orbeez) as the drying material for con-sistent characterization of the heat pump performance. R-134a was adopted as the refrig-erant for the heat pump system. The experiments were performed subject to different weights of Orbeez (drying material) at a constant volumetric flow rate of 100 m3/h. The
Time (minutes) 0 100 200 300 400 500 600
Qcd
(kW
)
0.0
0.2
0.4
0.6
0.8
CO
P HP
0
1
2
3
4
5
6
7kg-Qcd(kW) 7kg -COP 4kg-Qcd(kW) 4kg-COP
Time (minutes)
CO
P HP
(kW
)7kg - COPHP
4kg - COPHP
6
5
4
3
2
1
00 100 200 300 400 500 600
0.8
0.6
0.4
0.2
0.0
Time (minutes) 0 100 200 300 400 500 600
CO
P HP
0
1
2
3
4
5
6
Qcd
(kW
)
0.0
0.2
0.4
0.6
0.8
7kg- COP 4kg - COP 7kg - Qcd (kW) 4kg - Qcd (kW)
Time (minutes)
CO
P HP
(kW
)
7kg - COPHP4kg - COPHP
6
5
4
3
2
1
00 100 200 300 400 500 600
0.8
0.6
0.4
0.2
0.0
Figure 18. Variation in COPHP and the sensible heat transfer rate at the condenser for the modifieddrying chamber.

Processes 2021, 9, 1216 15 of 17
4. Conclusions
In the current study, we developed a heat pump dryer (HPD) to assess the performanceof a closed-loop heat pump dryer system, and a modified drying chamber was designed tooffer a lower airflow resistance to facilitate effective drying. On top of the modified design,a desiccant wheel was installed to further lower the humidity of the drying air, and furtherexamination regarding its applicability was conducted. Unlike most of the existing studies,which normally adopt organic products as the drying materials, in this study we usedmoist sodium polyacrylate (Orbeez) as the drying material for consistent characterizationof the heat pump performance. R-134a was adopted as the refrigerant for the heat pumpsystem. The experiments were performed subject to different weights of Orbeez (dryingmaterial) at a constant volumetric flow rate of 100 m3/h. The test loads of 4 kg to 7 kg ofOrbeez were tested in the drying chamber. Based on the foregoing discussion, the followingconclusions are drawn:
1. The average COPHP, mass transfer rate, heat transfer rate, MER, and SMER of thesystem were calculated as 3.9, 0.30 kg/s, 0.56 kW, 0.495 kg/h, and 1.614 kg/kWh.
2. The moisture extraction rate for the lower test load was higher than that for the highertest load due to the higher penetration of drying air at the lower test load, althoughthe maximum test load showed the maximum relative humidity at the dryer outlet.
3. The maximum MERs for 4 kg were observed as 0.68 kg/h, 0.82 kg/h, and 1.0 kg/h forthe old design, modified drying chamber, and design with the external dehumidifier,respectively, during eight-hours experiments. The addition of the desiccant wheelshowed good performance in terms of the moisture extraction rate and coefficientof performance, while it showed poor performance in terms of the specific moistureextraction rate due to the required high-power regeneration (around 2.6 kW) of thedesiccant dehumidifier.
4. The moisture extraction rate (MER) for all designs increased to a maximum value, fol-lowed by a consistent decline. The maximum MER for the desiccant design exceededthose for the other designs. However, the MER for the desiccant dehumidifier designdecreased faster and may become lower than those of the other designs as time pro-ceeds further due to the close packing of dry Orbeez at the edge of the drying material.
5. In the future, further validation and more elaboration on reductions in the heat andmass transfer processes of the drying materials should be carried out, and the blockagephenomenon of the drying materials at the outer edge should be quantitativelystudied. More effective drying chamber designs should be studied through numericalexaminations (CFD) and verified through experiments.
Author Contributions: Conceptualization, K.-S.Y. and K.H.; methodology, K.H. and U.S.; writing—original draft preparation, K.-S.Y. and K.H.; writing—review and editing, C.-C.W.; supervision,S.-K.W. and C.-C.W.; project administration, C.-C.W. All authors have read and agreed to the pub-lished version of the manuscript.
Funding: This research was funded by the Bureau of Energy of the Ministry of Economic Affairsunder the contracts of 110-E0209 and by the Ministry of Science Technology of Taiwan under grantnumbers: MOST 109-2628-E-167-001-MY3 and MOST 108-2221-E-009-037-MY3.
Institutional Review Board Statement: Not applicable.
Informed Consent Statement: Not applicable.
Data Availability Statement: Data available on request due to restrictions.
Acknowledgments: The authors gratefully acknowledge the financial support from the Bureau ofEnergy of the Ministry of Economic Affairs under the contracts of 110-E0209 and by the Ministryof Science Technology of Taiwan under grant numbers: MOST 109-2628-E-167-001-MY3 and MOST108-2221-E-009-037-MY3.
Conflicts of Interest: The authors declare no conflict of interest.
Processes 2021, 9, 1216 16 of 17
Nomenclature
RH relative humidity (%)SMER specific moisture extraction rate (kg/kWh)Qcd heat transfer rate by condenser (kW).
mia mass flow rate of dry air (kg/s)Cpair specific heat of dry air (kJ/kg K)Tco condenser outlet temperature (◦C)Tci condenser inlet temperature (◦C)ρia density of air (kg/m3).
Vi volumetric flow rate (m3/h)Ww weight of water in materialWp total weight of materialDR drying rate (kgwater/kg drysolid)MER moisture extraction rate (kg/h).
mda mass flow rate of dry air (kg/s)ωdout humidity radio at dryer outlet (kg/kgDA)ωdin humidity ratio at dryer inlet (kg/kgDA))ωdout humidity ratio at outlet (kg/kgDA)ωdin humidity ratio at inlet (kg/kgDA).
mda mass flow rate (kg/s)Wcomp compressor output power (kWh)Wblower blower output power (kWh)T temperature of refrigerant (K)TR regeneration temperature (K)t temperature of air (K)Twb wet-bulb temperature (K)u velocity (m/s)V volume (m3)Qva volumetric air flow rate (m3/s)va specific volume of air (m3/kg dry air)vr1 specific volume of refrigerant vapor at suction (m3/kg)vW specific molar volume (m3/mol)ω humidity ratio of air (kg water/kg dry air)∆T temperature drop (K)∆Tc cold air temperature reduction (K)ηis isentropic efficiency (%)COP coefficient of performanceCOPHP COP of the heat pumpcp specific heat at constant pressure (kJ/kg K)cpa specific heat of dry air (kJ/kg K)cpam specific heat of moist air (kJ/kg K)cpf specific heat of condensate refrigerant film (kJ/kg K)DBT dry bulb temperature (◦C)DPT dew point temperature (◦C)DW desiccant wheelPcomp compressor power requirement (kW)Pfan fan power requirement (kW)h specific enthalpy of refrigerant (kJ/kg)ha specific enthalpy of air (kJ/kg dry air)hfg specific latent heat of vaporization of refrigerant (kJ/kg)hfg specific latent heat of vaporization of water at reference temperature of 0◦C (kJ/kg)hg specific enthalpy per unit mass of saturated vapors (kJ/kg)HP heat pumpHPD heat pump dryerHPDW heat pump desiccant wheelhv specific enthalpy of water vapors (kJ/kg)
Processes 2021, 9, 1216 17 of 17
CD thermal capacity of the heat pump’s condenserDED deductible value based on data provided (drying curves, etc.)No no Information or data not providedN/S not specifiedQEV evaporator thermal capacity (kW)
References1. Li, M.; Ma, Y.; Gong, W.; Su, W. Analysis of CO2 Transcritical Cycle Heat Pump Dryers. Dry. Technol. 2009, 27, 548–554. [CrossRef]2. Zhang, J.; Wu, Y. Experimental Study on Drying High Moisture Content Paddy by Super-Conducting Heat Pump Dryer. In
Proceedings of the 5th Asia-Pacific Drying Conference, Hong Kong, China, 13–15 August 2007; pp. 385–390. [CrossRef]3. Ho, J.C.; Chou, S.K.; Mujumdar, A.S.; Hawlader, M.N.A.; Chua, K.J. An optimisation framework for drying of heat-sensitive
products. Appl. Therm. Eng. 2001, 21, 1779–1798. [CrossRef]4. Chin, S.K.; Law, C.L. Product Quality and Drying Characteristics of Intermittent Heat Pump Drying of Ganoderma tsugaeMurrill.
Dry. Technol. 2010, 28, 1457–1465. [CrossRef]5. Alves-Filho, O. Combined innovative heat pump drying technologies and new cold extrusion techniques for production of
instant foods. Dry. Technol. 2002, 20, 1541–1557. [CrossRef]6. Adapa, P.K.; Schoenau, G.J.; Sokhansanj, S. Performance study of a heat pump dryer system for specialty crops—Part 2: Model
verification. Int. J. Energy Res. 2002, 26, 1021–1033. [CrossRef]7. Queiroz, R.; Gabas, A.L.; Telis, V.R.N. Drying Kinetics of Tomato by Using Electric Resistance and Heat Pump Dryers. Dry.
Technol. 2004, 22, 1603–1620. [CrossRef]8. Adapa, P.K.; Schoenau, G.J. Re-circulating heat pump assisted continuous bed drying and energy analysis. Int. J. Energy Res.
2005, 29, 961–972. [CrossRef]9. Fatouh, M.; Metwally, M.N.; Helali, A.B.; Shedid, M.H. Herbs drying using a heat pump dryer. Energy Convers. Manag. 2006, 47,
2629–2643. [CrossRef]10. Hawlader, M.N.A.; Perera, C.O.; Tian, M. Comparison of the Retention of 6-Gingerol in Drying of Ginger Under Modified
Atmosphere Heat Pump Drying and other Drying Methods. Dry. Technol. 2006, 24, 51–56. [CrossRef]11. Phoungchandang, S.; Nongsang, S.; Sanchai, P. The Development of Ginger Drying Using Tray Drying, Heat Pump–Dehumidified
Drying, and Mixed-Mode Solar Drying. Dry. Technol. 2009, 27, 1123–1131. [CrossRef]12. Lee, K.H.; Kim, O.J. Experimental Study on the Energy Efficiency and Drying Performance of the Batch-Type Heat Pump Dryer.
In Proceedings of the 5th Asia-Pacific Drying Conference, Hong Kong, China, 13–15 August 2007; pp. 428–433. [CrossRef]13. Pal, U.S.; Khan, M.K.; Mohanty, S.N. Heat Pump Drying of Green Sweet Pepper. Dry. Technol. 2008, 26, 1584–1590. [CrossRef]14. Erbay, Z.; Icier, F. Optimization of Drying of Olive Leaves in a Pilot-Scale Heat Pump Dryer. Dry. Technol. 2009, 27, 416–427.
[CrossRef]15. Xiang, F.; Wang, L.; Yue, X.-F. Exergy Analysis and Experimental Study of a Vehicle-Mounted Heat Pump–Assisted Fluidization
Drying System Driven by a Diesel Generator. Dry. Technol. 2011, 29, 1313–1324. [CrossRef]16. Mortezapour, H.; Ghobadian, B.; Minaei, S.; Khoshtaghaza, M.H. Saffron Drying with a Heat Pump–Assisted Hybrid Photovoltaic–
Thermal Solar Dryer. Dry. Technol. 2012, 30, 560–566. [CrossRef]17. Potisate, Y.; Phoungchandang, S. Chlorophyll Retention and Drying Characteristics of Ivy Gourd Leaf (Coccinia grandis Voigt)
Using Tray and Heat Pump–Assisted Dehumidified Air Drying. Dry. Technol. 2010, 28, 786–797. [CrossRef]


