Embed Size (px)
Citation preview
JOMO KENYATTA UNIVERSITY OF AGRICULTURE AND TECHNOLOGY
2014
PERFORMANCE OF A CENTRIFUGAL PUMP
EXPERIMENTAL ANALYSIS OF A ROTORDYNAMIC PUMP
MIMISA DICKENS EN251-0305/2011
CIVIL, CONSTRUCTION AND ENVIRONMENTAL ENGINEERING DEPARTMENT

Abstract
The results of an experiment carried out to investigate the theory of a Rotor dynamic pump and to determine the relationship between the head, discharge, the input power and the efficiency of a centrifugal pump under the prescribed revolution speed are presents with much focus on the specific aspects mentioned. This paper represents experimental study work carried out on centrifugal pump. Vibrations and noise are both pre dominant due to hydraulic effects. The pump system used allows for parametric variation of discharge. Data acquired are manually compiled and analyzed, reduced and presented into a form that can be typically used to analyze pump characteristics. Reduced data is used in determining the characteristic curve of the pump and to indicate the relationship between the efficiency and flow rate and power.
Introduction
Centrifugal pumps are classified as rotary type of pumps in which a dynamic pressure developed enables the lifting of water to great heights. The history of pumps dates back to the ancient day of technological development in Egypt where the locals used water wheels with buckets mounted on them to move water for the purposes of irrigation. It was not until the late 1600’s that true centrifugal pumps were developed by Denis Papin, a French boy, who developed the hydraulic device though with straight vanes. John G. Appold introducesthe curved vane in 1851 thereby improving the efficiency of the hydraulic device. It has been rapidly superseding the other types of pumps over the years and is seemingly the most used kind of pump. It is most suited for situations requiring moderate to high flow rates and modest increases in pressure. They are majorly used in municipal water supply systems, circulating water heating and cooling systems applied in buildings, pump system in dish and cloth washing machines and for pumping cooling water in automobile engines. Positive displacement pumps are more suited for high pressure-low flow applications. Flow rate is a function of rotational speed and has negligible dependence on pressure rise. They are also used to supply
oil under very high pressure for hydraulic actuators such as those on large earth moving machines.
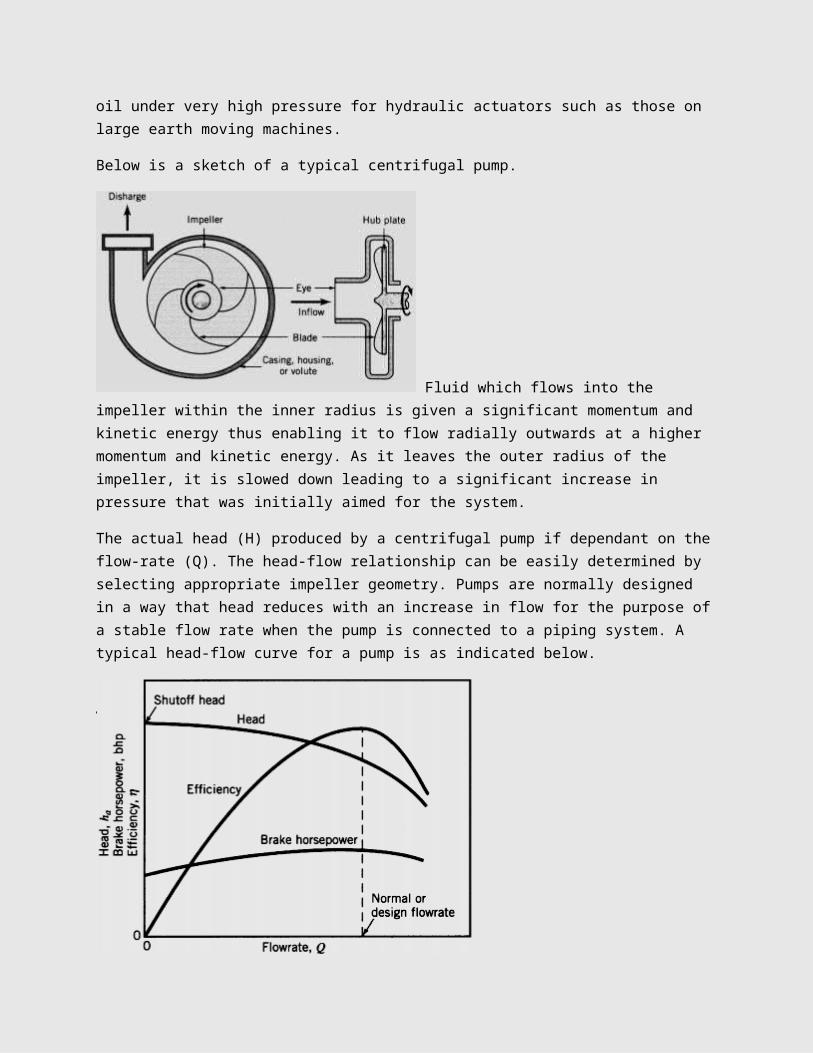
Below is a sketch of a typical centrifugal pump.
Fluid which flows into the impeller within the inner radius is given a significant momentum and kinetic energy thus enabling it to flow radially outwards at a higher momentum and kinetic energy. As it leaves the outer radius of the impeller, it is slowed down leading to a significant increase in pressure that was initially aimed for the system.
The actual head (H) produced by a centrifugal pump if dependant on theflow-rate (Q). The head-flow relationship can be easily determined by selecting appropriate impeller geometry. Pumps are normally designed in a way that head reduces with an increase in flow for the purpose ofa stable flow rate when the pump is connected to a piping system. A typical head-flow curve for a pump is as indicated below.
The result of the application of the mechanical energy equation applied on two sections of a piping system proves that
HP+V12
2g+P1γ
+Z1=h1+V22
2g+P2
γ+Z2
Where HP is the pump head and h1= total head loss in the piping length under study. The others are the pressure head and the velocity head ofthe system.
For any given pump operating at a given rotational speed, there is always only one operating point where the geometry of the impeller blades is an optimum. When this is combined with the other forces an efficiency of the system is obtained which is a function of the rate of flow. The efficiency is the ratio of the fluid work (power outputted) to the shaft power input of the pump.
This relation can be shown as η=YQHPPshaft
The performance of a pump is highly dependent on the impeller andcasing geometry, the rotational speed, the size of the pump and the properties of the flowing speed. However, it is not necessaryto vary all these factors in order for one to be able to determine the performance of a pump. Two geometrically identical pumps with flow rates adjusted so that the ratio of tangential toradial fluid velocities is the same are said to be homologous. Homologous pumps are known to have geometrical similarity and arealso known to have the following dimensionless parameters the same.
π1=QND3
π2=gHN2D2
Where N is the angular speed and D the diameter. The Diameter is takenas a measure of the length scale of the pump in question. A larger diameter indicates that all the other dimensions of the pump are relatively larger. The outer diameter of the impeller is normally used. These relationships make it possible to estimate the performanceof a pump of known diameter by testing another pump with a different diameter. It also becomes possible to determine the effects of a changing angular speed. This scaling, however, is not perfect and a few errors are expected of it.
Materials Used
For the effectiveness of the process, a number of equipment and materials had to be availed. These are as they have been listed below.
o A Centrifugal pumpo An Electric board comprised of an ammeter, a voltmeter and a
power factor metero A V-notch with a hook gaugeo Pressure gauges on a suction pipe and a delivery pipeo A thermometer
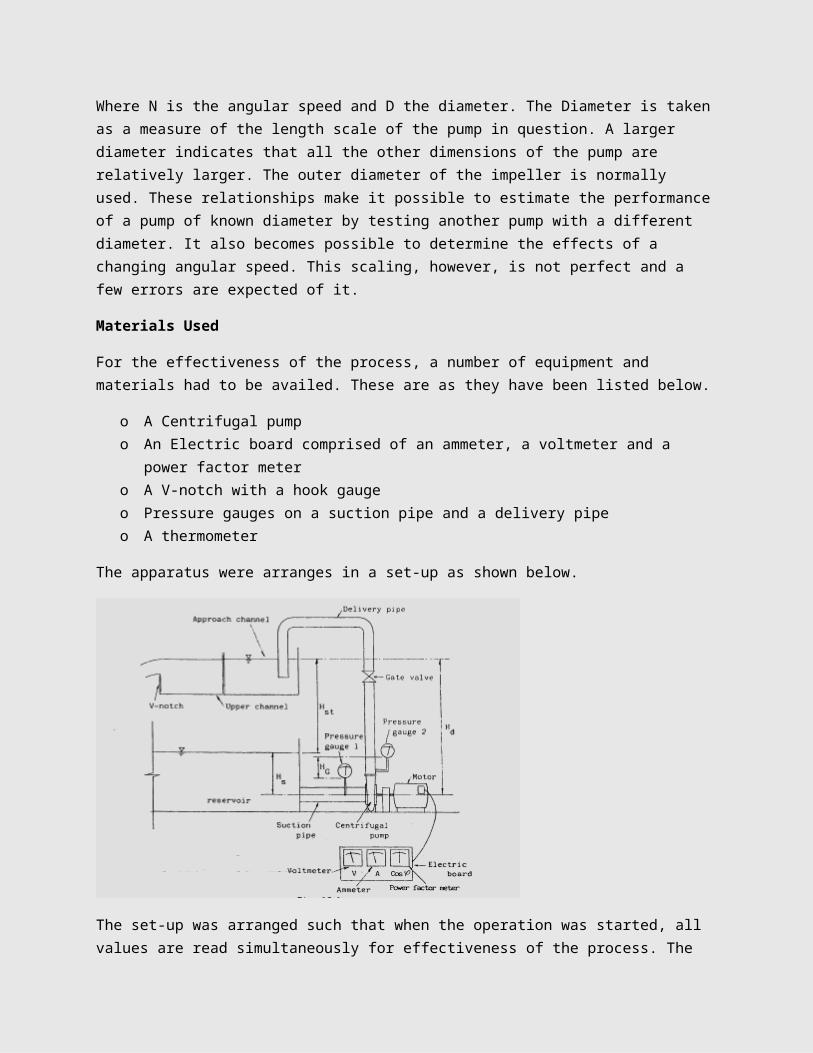
The apparatus were arranges in a set-up as shown below.
The set-up was arranged such that when the operation was started, all values are read simultaneously for effectiveness of the process. The
set-up was checked for correct layout with a few tests after which theactual experiment was started and data collected.
Procedure
The temperature of the water was first measured after which the crest level of the v-notch was measured using the hook-gauge. The operation of the pump was started with the gate valve closed after which the gate valve was slowly opened and a small discharge set. The head abovethe v-notch was measured using the hook gauge after it was clear that the flow had become steady. The readings of the pressure gauges, voltmeter, ammeter and the power factor meter were recorded on the data sheet. The procedure was repeated after the discharge was increased with the gate valve.
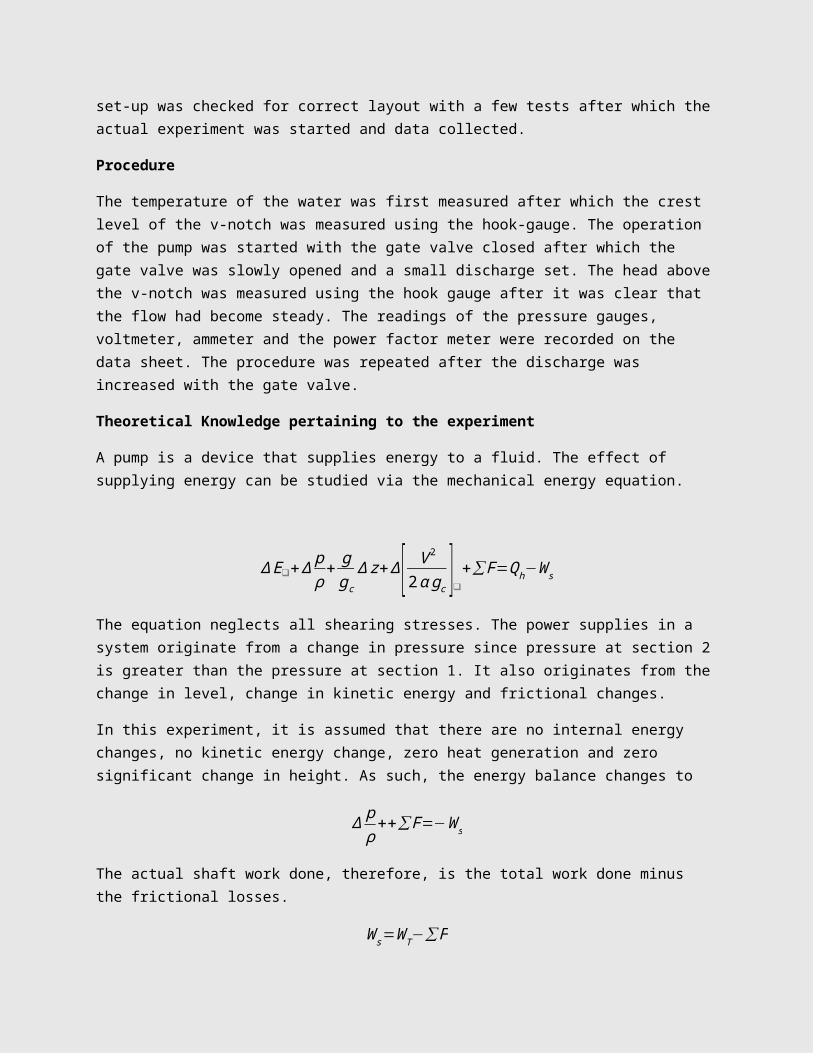
Theoretical Knowledge pertaining to the experiment
A pump is a device that supplies energy to a fluid. The effect of supplying energy can be studied via the mechanical energy equation.
∆E❑+∆ pρ
+ ggc∆z+∆[ V2
2αgc ]❑+∑F=Qh−Ws
The equation neglects all shearing stresses. The power supplies in a system originate from a change in pressure since pressure at section 2is greater than the pressure at section 1. It also originates from thechange in level, change in kinetic energy and frictional changes.
In this experiment, it is assumed that there are no internal energy changes, no kinetic energy change, zero heat generation and zero significant change in height. As such, the energy balance changes to
∆ pρ
++∑F=−Ws
The actual shaft work done, therefore, is the total work done minus the frictional losses.
Ws=WT−∑F
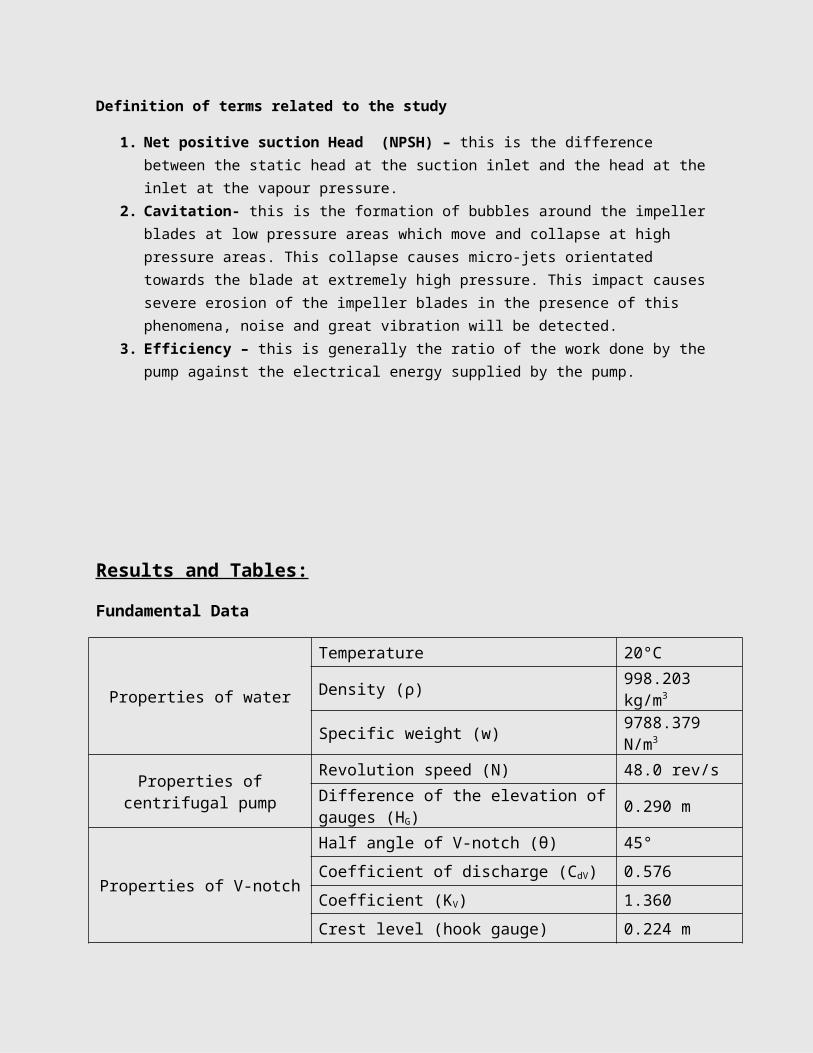
Definition of terms related to the study
1. Net positive suction Head (NPSH) – this is the difference between the static head at the suction inlet and the head at the inlet at the vapour pressure.
2. Cavitation- this is the formation of bubbles around the impeller blades at low pressure areas which move and collapse at high pressure areas. This collapse causes micro-jets orientated towards the blade at extremely high pressure. This impact causes severe erosion of the impeller blades in the presence of this phenomena, noise and great vibration will be detected.
3. Efficiency – this is generally the ratio of the work done by the pump against the electrical energy supplied by the pump.
Results and Tables:
Fundamental Data
Properties of water
Temperature 20°C
Density (ρ) 998.203 kg/m3
Specific weight (w) 9788.379 N/m3
Properties ofcentrifugal pump
Revolution speed (N) 48.0 rev/sDifference of the elevation ofgauges (HG) 0.290 m
Properties of V-notch
Half angle of V-notch (θ) 45°Coefficient of discharge (CdV) 0.576Coefficient (KV) 1.360Crest level (hook gauge) 0.224 m
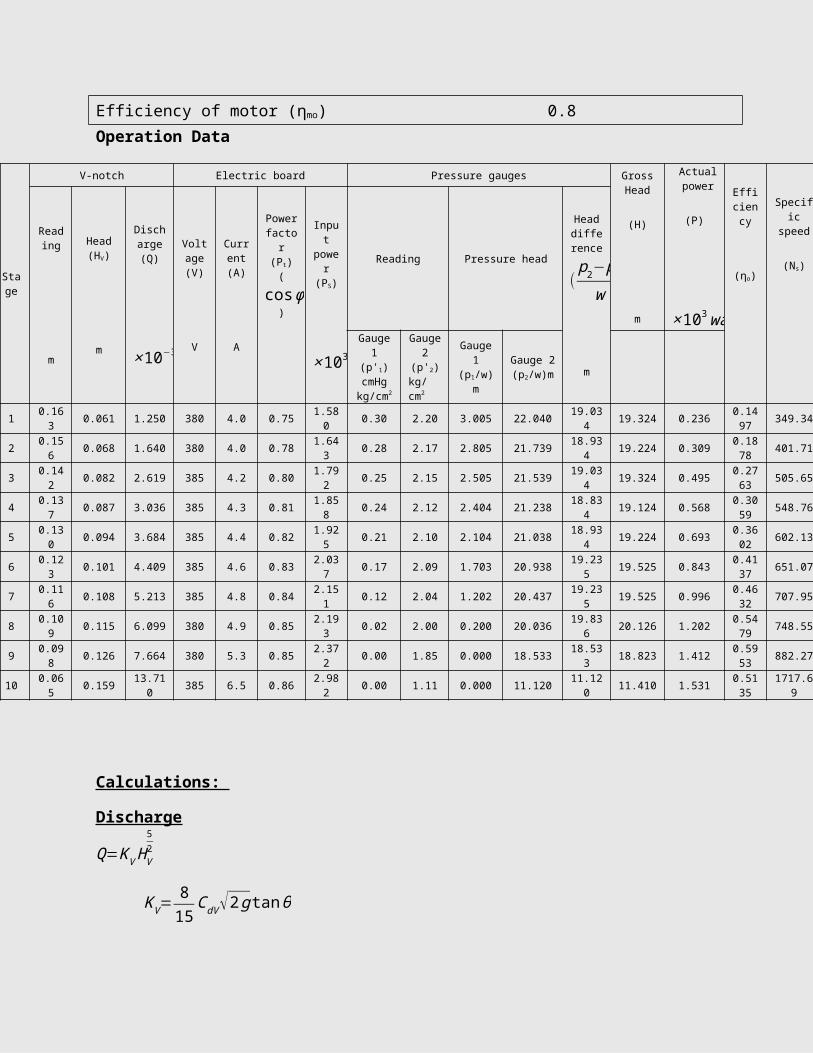
Efficiency of motor (ηmo) 0.8Operation Data
Stage
V-notch Electric board Pressure gauges GrossHead
(H)
m
Actualpower
(P)
×103watts
Efficiency
(ηo)
Specific
speed
(Ns)
Reading
m
Head(HV)
m
Discharge(Q)
×10−3m3/s
Voltage(V)
V
Current(A)
A
Powerfactor
(Pt)(
cosφ)
Input
power
(PS)
×103watt
Reading Pressure head
Headdifference
(p2−p1
w)
m
Gauge1
(p'1)cmHgkg/cm2
Gauge2
(p'2)kg/cm2
Gauge1
(p1/w)m
Gauge 2(p2/w)m
1 0.163 0.061 1.250 380 4.0 0.75 1.58
0 0.30 2.20 3.005 22.040 19.034 19.324 0.236 0.14
97 349.34
2 0.156 0.068 1.640 380 4.0 0.78 1.64
3 0.28 2.17 2.805 21.739 18.934 19.224 0.309 0.18
78 401.71
3 0.142 0.082 2.619 385 4.2 0.80 1.79
2 0.25 2.15 2.505 21.539 19.034 19.324 0.495 0.27
63 505.65
4 0.137 0.087 3.036 385 4.3 0.81 1.85
8 0.24 2.12 2.404 21.238 18.834 19.124 0.568 0.30
59 548.76
5 0.130 0.094 3.684 385 4.4 0.82 1.92
5 0.21 2.10 2.104 21.038 18.934 19.224 0.693 0.36
02 602.13
6 0.123 0.101 4.409 385 4.6 0.83 2.03
7 0.17 2.09 1.703 20.938 19.235 19.525 0.843 0.41
37 651.07
7 0.116 0.108 5.213 385 4.8 0.84 2.15
1 0.12 2.04 1.202 20.437 19.235 19.525 0.996 0.46
32 707.95
8 0.109 0.115 6.099 380 4.9 0.85 2.19
3 0.02 2.00 0.200 20.036 19.836 20.126 1.202 0.54
79 748.55
9 0.098 0.126 7.664 380 5.3 0.85 2.37
2 0.00 1.85 0.000 18.533 18.533 18.823 1.412 0.59
53 882.27
10 0.065 0.159 13.71
0 385 6.5 0.86 2.982 0.00 1.11 0.000 11.120 11.12
0 11.410 1.531 0.5135
1717.69
Calculations:
Discharge
Q=KVHV52
KV=815
CdV√2gtanθ
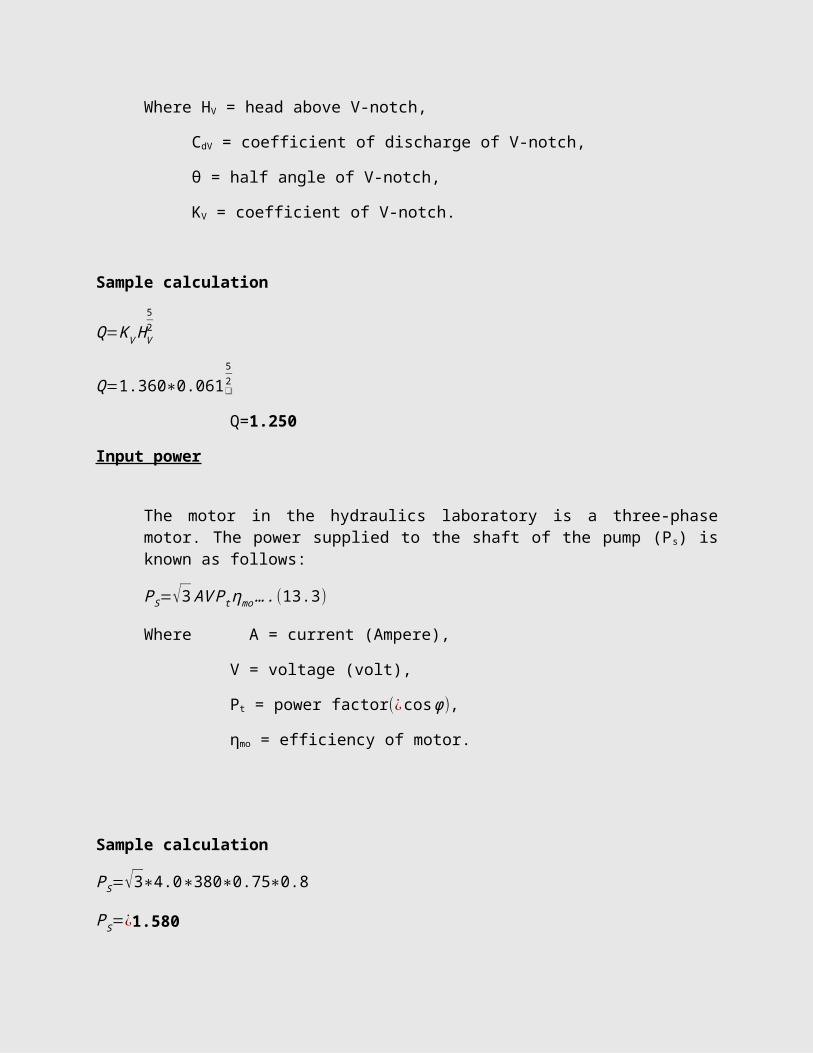
Where HV = head above V-notch,
CdV = coefficient of discharge of V-notch,
θ = half angle of V-notch,
KV = coefficient of V-notch.
Sample calculation
Q=KVHV52
Q=1.360∗0.061❑
52
Q=1.250
Input power
The motor in the hydraulics laboratory is a three-phasemotor. The power supplied to the shaft of the pump (Ps) isknown as follows:
PS=√3AVPtηmo….(13.3)
Where A = current (Ampere),
V = voltage (volt),
Pt = power factor(¿cosφ),
ηmo = efficiency of motor.
Sample calculation
PS=√3∗4.0∗380∗0.75∗0.8
PS=¿1.580
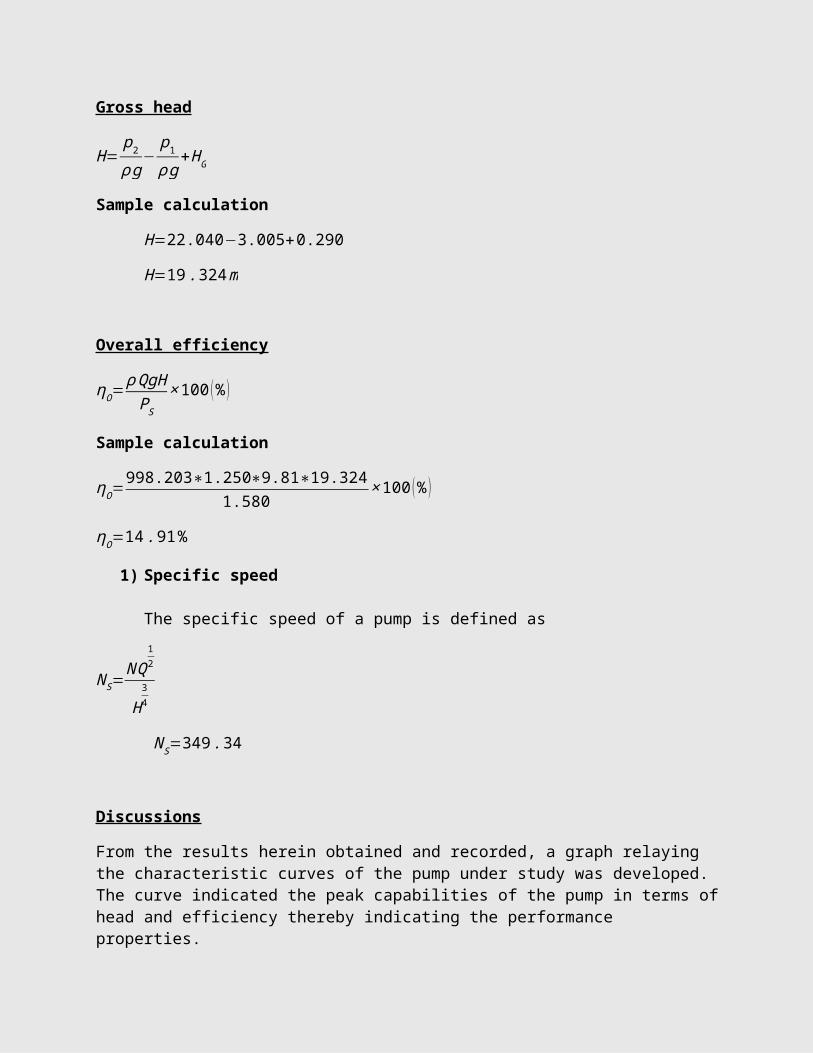
Gross head
H=p2
ρg−p1
ρg+HG
Sample calculation
H=22.040−3.005+0.290
H=19.324m
Overall efficiency
ηO=ρQgHPS
×100 (% )
Sample calculation
ηO=998.203∗1.250∗9.81∗19.324
1.580×100 (% )
ηO=14.91%
1) Specific speed
The specific speed of a pump is defined as
NS=NQ
12
H34
NS=349.34
Discussions
From the results herein obtained and recorded, a graph relaying the characteristic curves of the pump under study was developed. The curve indicated the peak capabilities of the pump in terms ofhead and efficiency thereby indicating the performance properties.
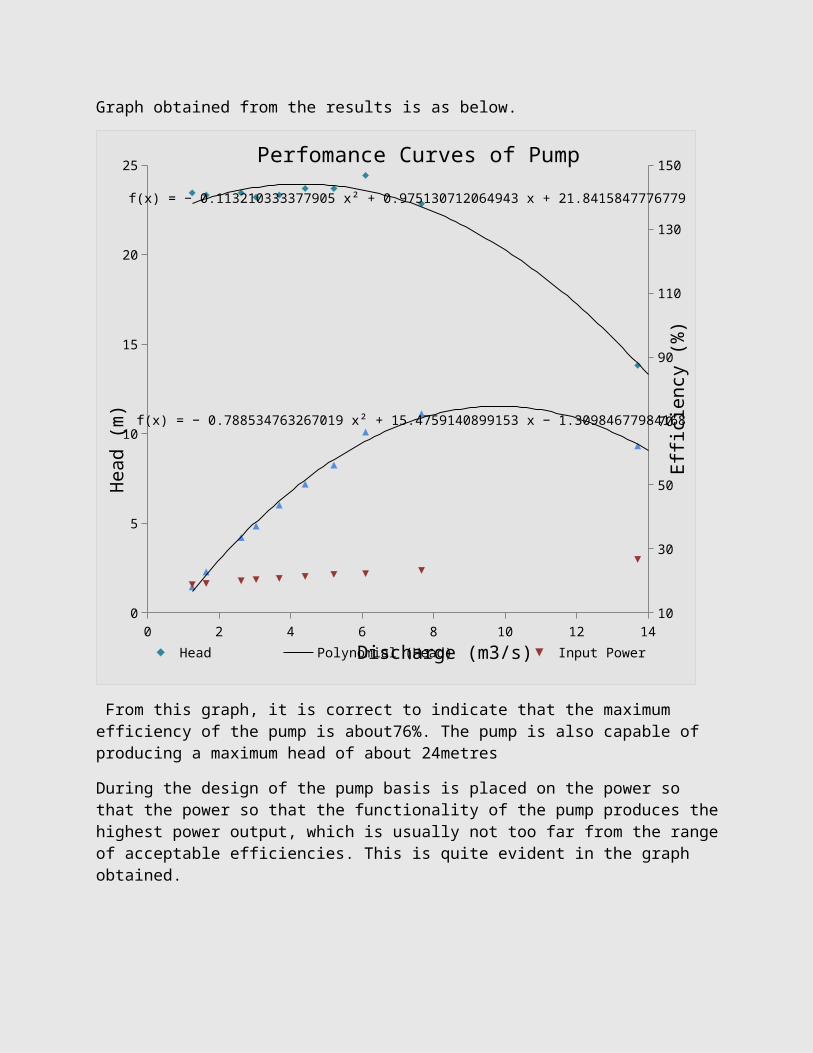
Graph obtained from the results is as below.
0 2 4 6 8 10 12 140
5
10
15
20
25
10
30
50
70
90
110
130
150
f(x) = − 0.788534763267019 x² + 15.4759140899153 x − 1.30984677984168
f(x) = − 0.113210333377905 x² + 0.975130712064943 x + 21.8415847776779
Perfomance Curves of Pump
Head Polynomial (Head) Input PowerDischarge (m3/s)
Head (m)
Efficiency (%)
From this graph, it is correct to indicate that the maximum efficiency of the pump is about76%. The pump is also capable of producing a maximum head of about 24metres
During the design of the pump basis is placed on the power so that the power so that the functionality of the pump produces thehighest power output, which is usually not too far from the rangeof acceptable efficiencies. This is quite evident in the graph obtained.
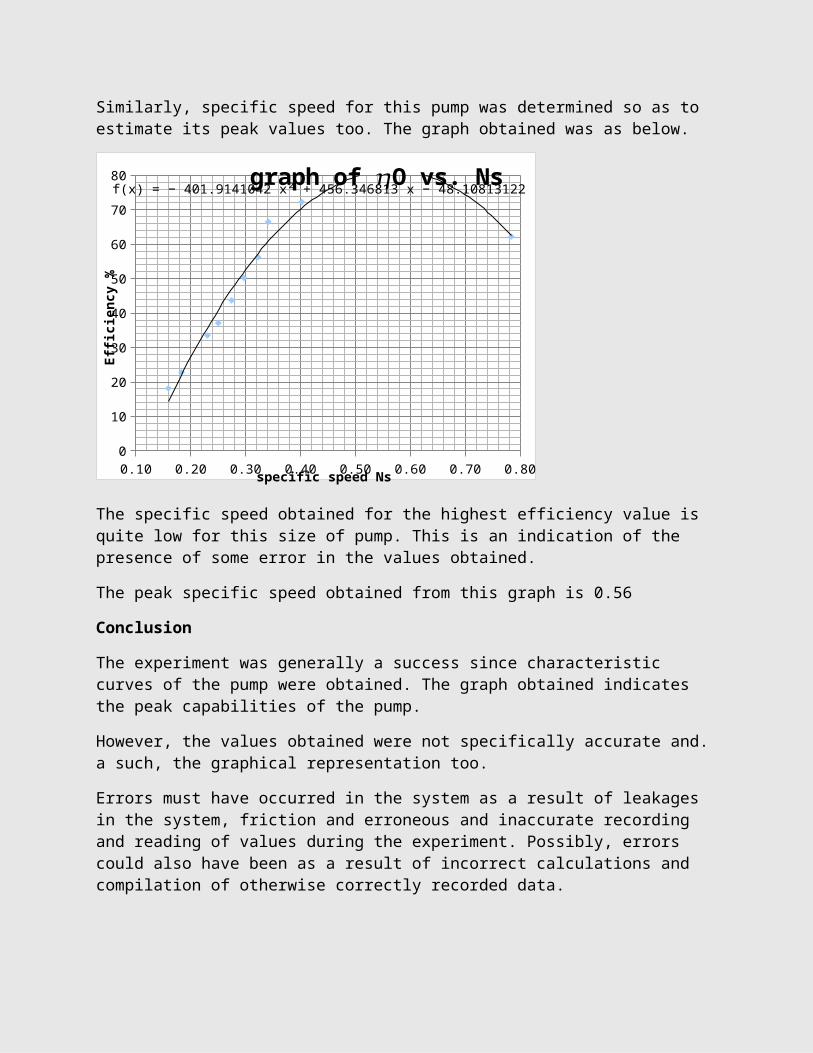
Similarly, specific speed for this pump was determined so as to estimate its peak values too. The graph obtained was as below.
0.10 0.20 0.30 0.40 0.50 0.60 0.70 0.800
10
20
30
40
50
60
70
80f(x) = − 401.9141042 x² + 456.346813 x − 48.10813122graph of O vs. Ns𝜂
specific speed Ns
Effi
cien
cy %
The specific speed obtained for the highest efficiency value is quite low for this size of pump. This is an indication of the presence of some error in the values obtained.
The peak specific speed obtained from this graph is 0.56
Conclusion
The experiment was generally a success since characteristic curves of the pump were obtained. The graph obtained indicates the peak capabilities of the pump.
However, the values obtained were not specifically accurate and. a such, the graphical representation too.
Errors must have occurred in the system as a result of leakages in the system, friction and erroneous and inaccurate recording and reading of values during the experiment. Possibly, errors could also have been as a result of incorrect calculations and compilation of otherwise correctly recorded data.
As such, a lot of care was taken during the collection of data and during the compilation of the results so as to reduce the margin of error expected at the final issue of the report.
It is further recommended that the experiment be repeated if moreaccurate data is required for the study of the performance characteristics of the centrifugal pump. This can be performed under controlled conditions that ensure little margin of error. Such a condition would include reducing the size of groups involved in the exercise.
References
1. Kumar, S., Gandhi, B. K., & Mohapatra, S. K. (2014). Performance Characteristics of Centrifugal Slurry Pump with Multi-Sized Particulate Bottom and Fly Ash Mixtures. Particulate Science and Technology, (just-accepted).
2. Marrero, T. R. Project-based Learning: Centrifugal Pump Operations.
3. Kumar, S., Gandhi, B. K., & Mohapatra, S. K. (2014). Performance Characteristics of Centrifugal Slurry Pump with Multi-Sized Particulate Bottom and Fly Ash Mixtures. Particulate Science and Technology, (just-accepted).


