Embed Size (px)
Citation preview
NIGERIAN JOURNAL OF TECHNOLOGICAL DEVELOPMENT, VOL. 10, NO 2, DECEMBER 2013 22
*Corresponding author’s e-mail address: [email protected]
Tertiary – Recent sediments
Tertiary volcanics
Cretaceous
Benin Flank
Calabar Flank
Jurassic Younger granites
Precambrian Basement
Major (reference) town
200 km
ABSTRACT: This research evaluated the Vertical Electrical Sounding (VES) method of groundwater development in the
Basement Complex terrain of West Central Nigeria. It was aimed at verifying the reliability of VES in differentiating lithologies,
predicting the depth to basement and probably, aquifer in groundwater development. In doing this, the Schlumberger electrode
configuration was employed in the surveys while partial curve matching and computer iteration techniques were used to
interpret the curves obtained. In all, seventy three VES were carried out and fourteen boreholes constructed. Comparison was
made between the predicted depth to basement from VES and the actual depth from the drilling log. A linear relationship
between the actual depth and that predicted by VES was established with coefficient of determination of 0.94 confirming the
reliability of the VES method. None of the boreholes drilled was abortive.
KEYWORDS: Groundwater, aquifer, geoelectric measurement, fractured zone
[Received June 25 2013; Revised September 15 2013 & October 15 2013; Accepted October 22 2013]
I. INTRODUCTION
Groundwater development in Nigeria is restricted by the
fact that more than half of the country is underlain by
crystalline basement rock of pre-cambrian era (Kazeem,
2007). The occurrence of groundwater in this environment is
due largely to the development of secondary porosity and
permeability by weathering and/or fracturing of the parent
rocks (Olayinka et al., 1997). The crystalline basement
complex terrain is often characterized by aquifers which are
discontinuous that is, localized, in nature hence the need for
detailed pre-drilling geophysical investigations (Dan-Hassan
and Olorunfemi, 1999 and Omosuyi et al., 2008).
In groundwater exploration, various geophysical methods
have been employed to locate suitable points for productive
boreholes. One of such methods commonly used is the
electrical resistivity method in which VES and Horizontal
Profiling (HP) are commonly carried out (Omosuyi, et al.,
2008). The VES method is a depth sounding galvanic method
and has proved very useful in groundwater studies due to
simplicity and reliability of the method. The electrical
resistivity of rock is a property which depends on lithology
and fluid contents. The number and thicknesses of the
geoelectric units as determined from VES measurements at a
locality may not necessarily be the same as the geological ones
(Emmanuel et al., 2011). The ultimate objective of VES at
some locality is to obtain a true resistivity log similar to the
induction log of a well at the locality, without actually drilling
the well (Hamill and Bell, 1986).
This study therefore evaluated the VES in ground water
development in a study area which falls within the Basement
Complex terrain of Kwara State, Nigeria (Figures 1 and 2).
The objective was to compare the depth predictions of VES
with actual observations obtained from drilling with respect to
depth to bedrock (basement), depth to aquifer/ fracture and
total depth of boreholes.
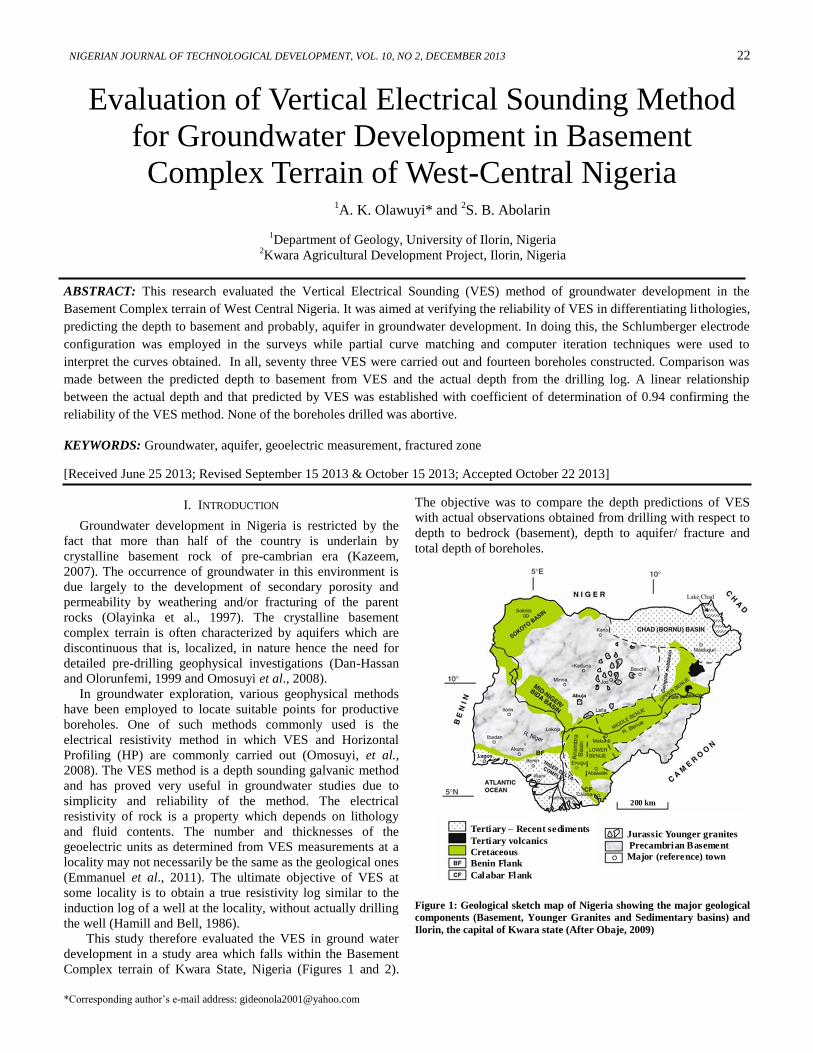
Figure 1: Geological sketch map of Nigeria showing the major geological components (Basement, Younger Granites and Sedimentary basins) and
Ilorin, the capital of Kwara state (After Obaje, 2009)
1A. K. Olawuyi* and
2S. B. Abolarin
1Department of Geology, University of Ilorin, Nigeria
2Kwara Agricultural Development Project, Ilorin, Nigeria
Evaluation of Vertical Electrical Sounding Method
for Groundwater Development in Basement
Complex Terrain of West-Central Nigeria

23 OLAWUYI AND ABOLARIN: EVALUATION OF VERTICAL ELECTRICAL SOUNDING METHOD FOR GROUNDWATER
Study area
II. GEOLOGY AND HYDROGEOLOGY OF THE STUDY
AREA
The study area lies between latitudes '068 and '518 N
and longitudes '244 and '125 E. It falls within the
Basement Complex terrain of Kwara State, West Central
Nigeria and range in age from Precambrian to Paleozoic.
About 90 percent of the State is covered by Precambrian rocks
that is the basement complex and the remaining area by
Cretaceous and Quaternary formations thai is sedimentary and
alluvia. Figure 2 is the geological map of Nupe Basin and
environs showing the distribution of the Basement Complex
and the Cretaceous sediments. Oyawoye (1972) classified the
Basement Complex into four main rock groups using
lithology. These include; (i) the older granites (ii) the
migmatite complex (iii) the metasedimentary series and (iv)
Miscellaneous rock types. Pegmatite occurs less commonly in
the study area and is usually associated with gneisses and
granite suites. The cretaceous sediments or sandstones are
found in the northern and north-eastern part of the State and
are generally referred to as Nupe sandstone. The oldest
deposits of the Nupe sandstones are sub-rounded coarse
conglomerates, clay-sand -pebble admixtures, cross-stratified
sandstones with scattered pebbles, cobbles and boulders
deposited as alluvial fans. These beds are conformably
overlain by sandstones, clay stones and siltstones. The
sandstones are generally angular to sub-angular, well to poorly
sorted and very fine to very coarse and pebbly. The alluvial
deposits are found along the Niger valley and its tributaries
(Garba, 2011).
Figure 2: Geological map of Bida Basin and Environs showing the study
area (After Obaje, 2011)
Three main aquifer types identifiable in the study area
occur in the weathered and fractured Basement Complex and
Alluvial sediments. The regional distribution of water level
appears to indicate a general slope in the regional groundwater
table from south to north, reflecting the topographic slope. The
distribution of borehole discharges does not show any regional
pattern. However, dry low-yielding or failed boreholes have
not generally been shown in the records so far obtained. Most
of the results fall in the range of 0.5 to 5.0 litres per second.
The groundwater in the Precambrian rocks of the Nigerian
Basement Complex occurs either in the weathered mantle or in
the joint and fracture systems in the un-weathered rocks ( Ako
and Olorunfemi, 1989 and Olayinka and Olorunfemi 1992).
The highest groundwater yield in the basement terrains is
found in areas where thick overburden overlies fractured zones
(Olorunfemi and Fasuyi, 1993). Frequency plots of borehole
yields, depth to water level and total depth show that median
yields in both the Basement rocks and sedimentary rocks in
Kwara State are between 1 and 3 litre per second. More than
75 per cent of boreholes in the basement have water levels
between 0 and 10m. Water levels in the cretaceous sediments
show a bimodal distribution with peaks at around 0-5m and
30-60m. Some hydrogeological parameters based on 312
boreholes with recorded geological information as obtained
from the report submitted to Kwara Agricultural Development
Project (KWADP) showed that, in the basement environment,
the mean values for drawdown (m), specific capacity (l /sm),
discharge (l /s), static water level (m) and total depth (m) were
19, 0.11, 2.0, 9 and 57 respectively from 271 boreholes; the
cretaceous sediments had 21, 0.10, 2.2, 42 and 110
respectively from 31 boreholes while the alluvia sediments
had 4, 2.7, 11.8, 7.0 and 55 respectively from 10 boreholes
(Geoxploration Nig. Associates, 1995).
The alluvia deposit occupies the valley of the River Niger
and has significant groundwater potentials. Boreholes in the
Niger alluvia have consistently recorded high groundwater
yields. Groundwater in the Niger alluvia occurs under
unconfined conditions. Formation material varies from coarse
gravels to clayey deposits, over relatively short distances.
III. MATERIALS AND METHODS
The ABEM Terrameter SAS 1000 was used for the
geoelectric survey. In doing this, the electrical resistivity
method involving VES technique (Zonge et al., 2005) was
used. Electrical resistivity surveys are usually designed to
measure the electrical resistivity of the subsurface materials by
making measurements at the earth surface (Abdel-Azim, et al.,
1996). The common electrode arrays suitable for VES work
are the Wenner and the Schlumberger arrays (Sharma, 1997).
In the Schlumberger array the spacing between the potential
electrodes was recommended not to exceed 40% of half the
distance of the spacing (AB) of the current electrodes
(Adewumi, et al., 2005). Schlumberger electrode
configuration with maximum current electrode separation
(AB/2) of 100 m was employed. This array has a depth
penetration of 0.125AB and its apparent resistivity ( a )
computed from the following equation (Sharma, 1997)
NIGERIAN JOURNAL OF TECHNOLOGICAL DEVELOPMENT, VOL. 10, NO 2, DECEMBER 2013 24
*Corresponding author’s e-mail address: [email protected]
VES and Borehole points Study area
Legend Scale 0 10 20 50 Km
Traverse
l
V
I
La
2
2
(1)
where L is half current-electrode spacing (AB/2), l is half the
potential-electrode (MN/2), is the surface gradient of
potential at the midpoint between M and N, I is the input
current.
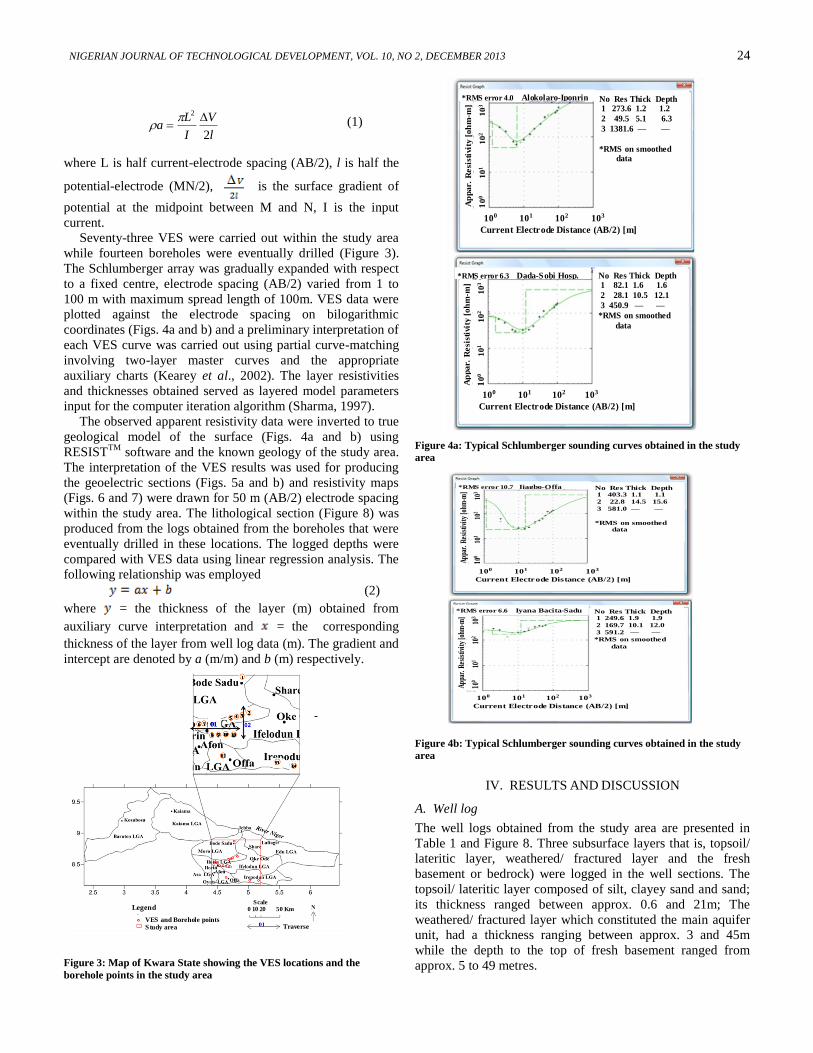
Seventy-three VES were carried out within the study area
while fourteen boreholes were eventually drilled (Figure 3).
The Schlumberger array was gradually expanded with respect
to a fixed centre, electrode spacing (AB/2) varied from 1 to
100 m with maximum spread length of 100m. VES data were
plotted against the electrode spacing on bilogarithmic
coordinates (Figs. 4a and b) and a preliminary interpretation of
each VES curve was carried out using partial curve-matching
involving two-layer master curves and the appropriate
auxiliary charts (Kearey et al., 2002). The layer resistivities
and thicknesses obtained served as layered model parameters
input for the computer iteration algorithm (Sharma, 1997).
The observed apparent resistivity data were inverted to true
geological model of the surface (Figs. 4a and b) using
RESISTTM
software and the known geology of the study area.
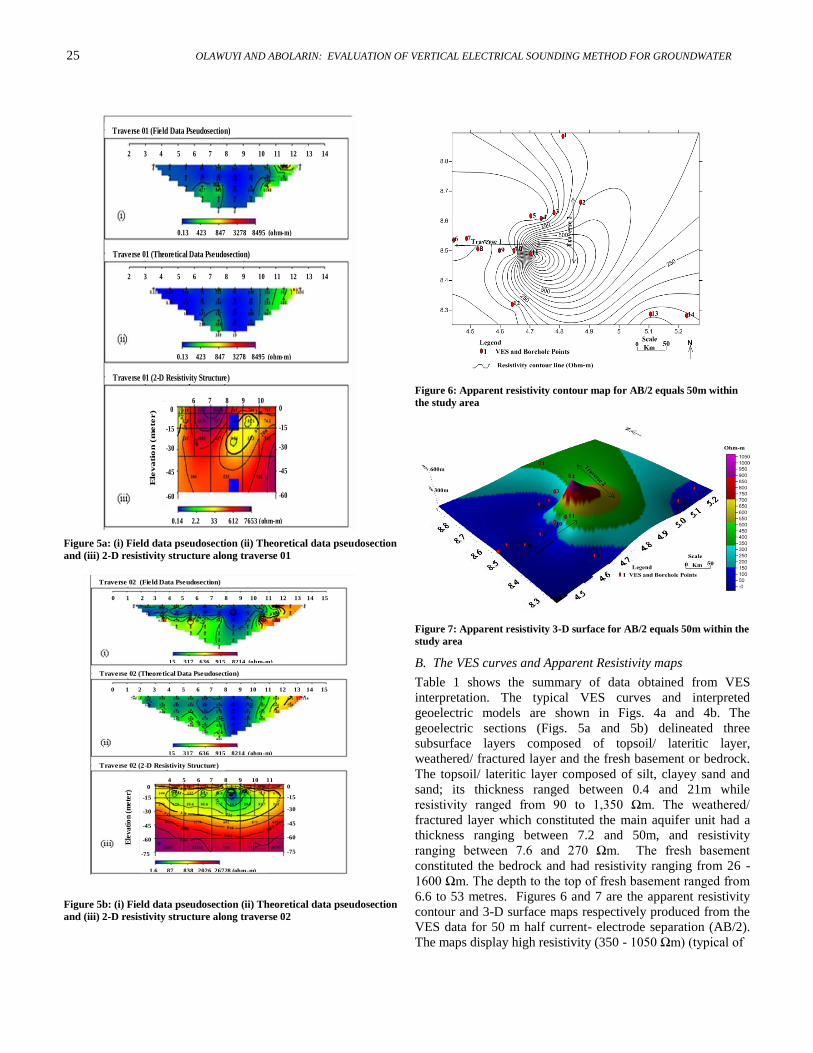
The interpretation of the VES results was used for producing
the geoelectric sections (Figs. 5a and b) and resistivity maps
(Figs. 6 and 7) were drawn for 50 m (AB/2) electrode spacing
within the study area. The lithological section (Figure 8) was
produced from the logs obtained from the boreholes that were
eventually drilled in these locations. The logged depths were
compared with VES data using linear regression analysis. The
following relationship was employed
(2)
where = the thickness of the layer (m) obtained from
auxiliary curve interpretation and = the corresponding
thickness of the layer from well log data (m). The gradient and
intercept are denoted by a (m/m) and b (m) respectively.
Figure 3: Map of Kwara State showing the VES locations and the
borehole points in the study area
Figure 4a: Typical Schlumberger sounding curves obtained in the study
area
Figure 4b: Typical Schlumberger sounding curves obtained in the study
area
IV. RESULTS AND DISCUSSION
A. Well log
The well logs obtained from the study area are presented in
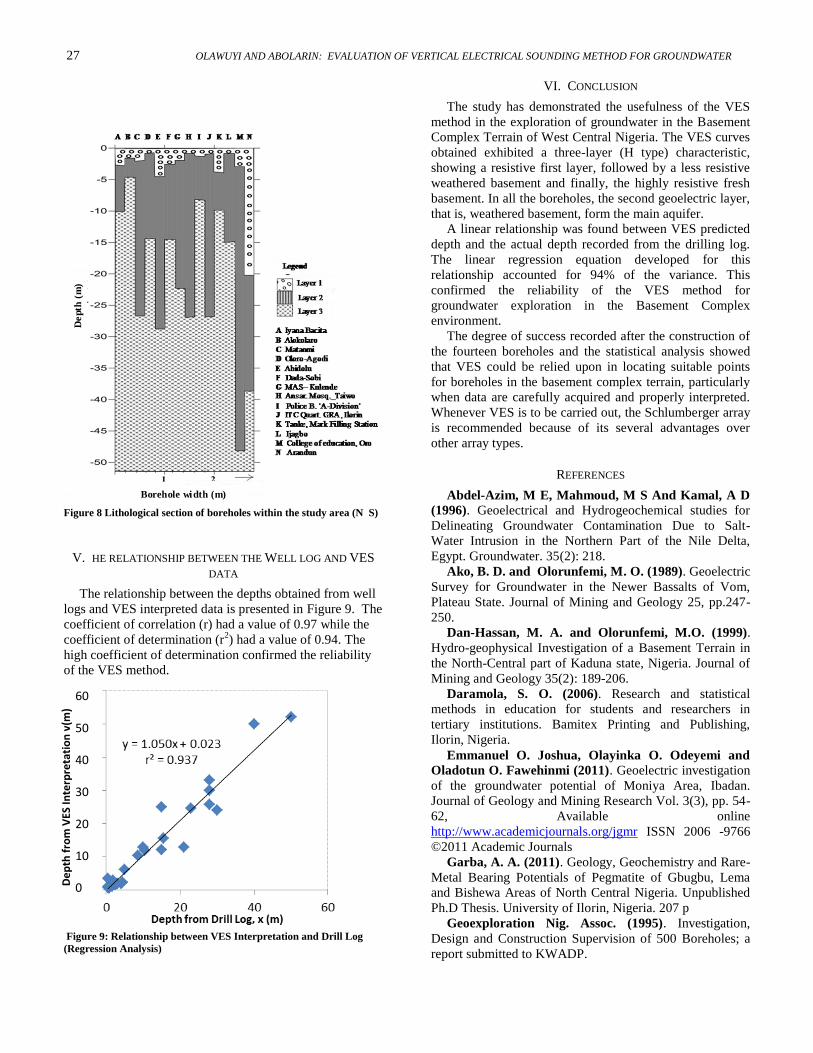
Table 1 and Figure 8. Three subsurface layers that is, topsoil/
lateritic layer, weathered/ fractured layer and the fresh
basement or bedrock) were logged in the well sections. The
topsoil/ lateritic layer composed of silt, clayey sand and sand;
its thickness ranged between approx. 0.6 and 21m; The
weathered/ fractured layer which constituted the main aquifer
unit, had a thickness ranging between approx. 3 and 45m
while the depth to the top of fresh basement ranged from
approx. 5 to 49 metres.
-
No Res Thick Depth 1 273.6 1.2 1.2
2 49.5 5.1 6.3
3 1381.6 — —
*RMS on smoothed data
*RMS error 4.0 Alokolaro-Iponrin
100 101 102 103
Current Electrode Distance (AB/2) [m]
Ap
pa
r. R
esi
stiv
ity
[o
hm
-m]
10
0
1
01
1
02
1
03
*RMS error 6.3 Dada-Sobi Hosp. No Res Thick Depth 1 82.1 1.6 1.6
2 28.1 10.5 12.1
3 450.9 — —
*RMS on smoothed
data
Ap
pa
r. R
esi
stiv
ity
[o
hm
-m]
10
0
1
01
1
02
1
03
100 101 102 103
Current Electrode Distance (AB/2) [m]
No Res Thick Depth 1 403.3 1.1 1.1
2 22.8 14.5 15.6
3 581.0 — —
*RMS on smoothed data
*RMS error 10.7 Ijagbo-Offa
100 101 102 103
Current Electrode Distance (AB/2) [m]
App
ar. R
esis
tivit
y [o
hm-m
]
100
10
1
10
2
103
*RMS error 6.6 Iyana Bacita-Sadu No Res Thick Depth 1 249.6 1.9 1.9
2 169.7 10.1 12.0
3 591.2 — —
*RMS on smoothed
data
App
ar. R
esis
tivit
y [o
hm-m
]
100
10
1
10
2
103
100 101 102 103
Current Electrode Distance (AB/2) [m]
25 OLAWUYI AND ABOLARIN: EVALUATION OF VERTICAL ELECTRICAL SOUNDING METHOD FOR GROUNDWATER
Figure 5a: (i) Field data pseudosection (ii) Theoretical data pseudosection
and (iii) 2-D resistivity structure along traverse 01
Figure 5b: (i) Field data pseudosection (ii) Theoretical data pseudosection
and (iii) 2-D resistivity structure along traverse 02
Figure 6: Apparent resistivity contour map for AB/2 equals 50m within
the study area
Figure 7: Apparent resistivity 3-D surface for AB/2 equals 50m within the
study area
B. The VES curves and Apparent Resistivity maps
Table 1 shows the summary of data obtained from VES
interpretation. The typical VES curves and interpreted
geoelectric models are shown in Figs. 4a and 4b. The
geoelectric sections (Figs. 5a and 5b) delineated three
subsurface layers composed of topsoil/ lateritic layer,
weathered/ fractured layer and the fresh basement or bedrock.
The topsoil/ lateritic layer composed of silt, clayey sand and
sand; its thickness ranged between 0.4 and 21m while
resistivity ranged from 90 to 1,350 Ωm. The weathered/
fractured layer which constituted the main aquifer unit had a
thickness ranging between 7.2 and 50m, and resistivity
ranging between 7.6 and 270 Ωm. The fresh basement
constituted the bedrock and had resistivity ranging from 26 -
1600 Ωm. The depth to the top of fresh basement ranged from
6.6 to 53 metres. Figures 6 and 7 are the apparent resistivity
contour and 3-D surface maps respectively produced from the
VES data for 50 m half current- electrode separation (AB/2).
The maps display high resistivity (350 - 1050 Ωm) (typical of
2 3 4 5 6 7 8 9 10 11 12 13 14
0.13 423 847 3278 8495 (ohm-m)
2 3 4 5 6 7 8 9 10 11 12 13 14
0.13 423 847 3278 8495 (ohm-m)
6 7 8 9 10 0
-15
-30
-45
-60
0
-15
-30
-45
-60
E
leva
tio
n (
me
ter)
0.14 2.2 33 612 7653 (ohm-m)
Traverse 01 (Field Data Pseudosection)
Traverse 01 (2-D Resistivity Structure)
Traverse 01 (Theoretical Data Pseudosection)
0 1 2 3 4 5 6 7 8 9 10 11 12 13 14 15
15 317 636 915 8214 (ohm-m)
15 317 636 915 8214 (ohm-m)
4 5 6 7 8 9 10 11 0 -15 -30
-45
-60
-75
0 -15
-30
-45
-60
-75
E
lev
ati
on
(m
ete
r)
1.6 87 838 2026 26728 (ohm-m)
Traverse 02 (Field Data Pseudosection)
Traverse 02 (2-D Resistivity Structure)
Traverse 02 (Theoretical Data Pseudosection)
0 1 2 3 4 5 6 7 8 9 10 11 12 13 14 15
NIGERIAN JOURNAL OF TECHNOLOGICAL DEVELOPMENT, VOL. 10, NO 2, DECEMBER 2013 26
*Corresponding author’s e-mail address: [email protected]
fresh basement) at the central and north-eastern part and very
low resistivity (< 150 Ωm) (characteristic of fractured
basement and clayey environment) on the western flank and
south-eastern edge.
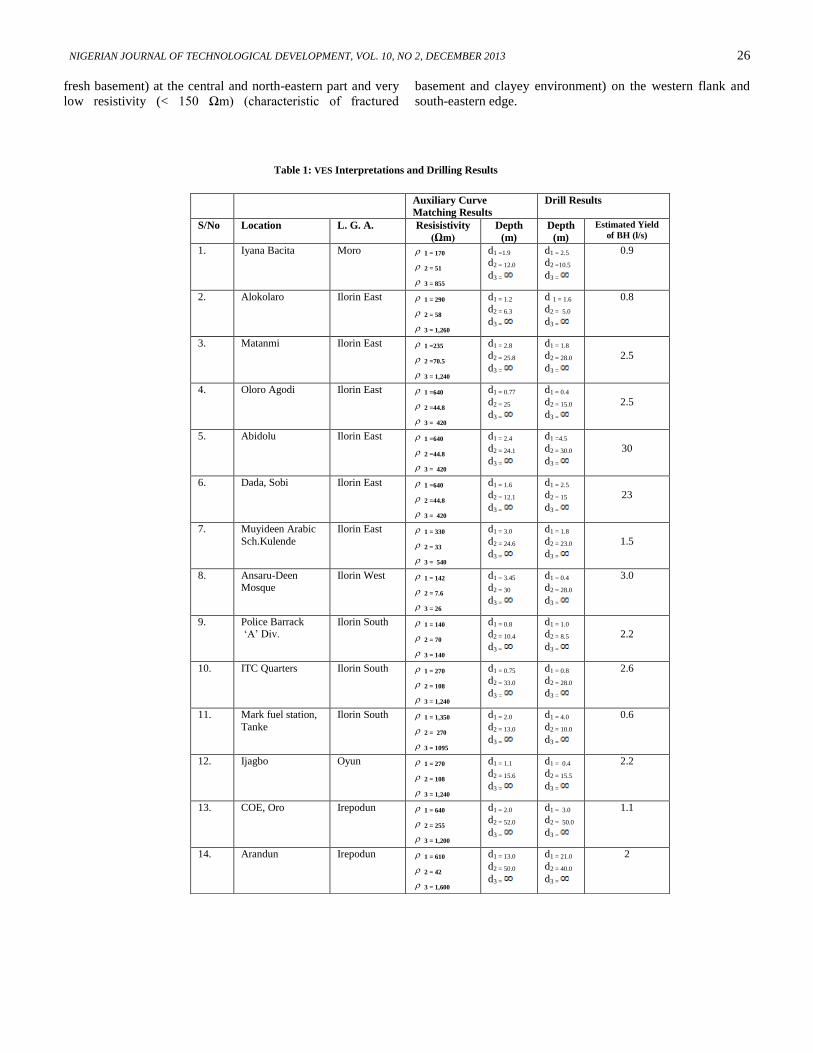
Table 1: VES Interpretations and Drilling Results
Auxiliary Curve
Matching Results
Drill Results
S/No Location L. G. A. Resisistivity
(Ωm)
Depth
(m)
Depth
(m)
Estimated Yield
of BH (l/s)
1. Iyana Bacita
Moro 1 = 170
2 = 51
3 = 855
d1 =1.9
d2 = 12.0
d3 =
d1 = 2.5
d2 =10.5
d3 =
0.9
2. Alokolaro
Ilorin East 1 = 290
2 = 58
3 = 1,260
d1 = 1.2
d2 = 6.3
d3 =
d 1 = 1.6
d2 = 5.0
d3 =
0.8
3. Matanmi
Ilorin East 1 =235
2 =70.5
3 = 1,240
d1 = 2.8
d2 = 25.8
d3 =
d1 = 1.8
d2 = 28.0
d3 =
2.5
4. Oloro Agodi Ilorin East 1 =640
2 =44.8
3 = 420
d1 = 0.77
d2 = 25
d3 =
d1 = 0.4
d2 = 15.0
d3 =
2.5
5. Abidolu Ilorin East 1 =640
2 =44.8
3 = 420
d1 = 2.4
d2 = 24.1
d3 =
d1 =4.5
d2 = 30.0
d3 =
30
6. Dada, Sobi Ilorin East 1 =640
2 =44.8
3 = 420
d1 = 1.6
d2 = 12.1
d3 =
d1 = 2.5
d2 = 15
d3 =
23
7. Muyideen Arabic
Sch.Kulende
Ilorin East 1 = 330
2 = 33
3 = 540
d1 = 3.0
d2 = 24.6
d3 =
d1 = 1.8
d2 = 23.0
d3 =
1.5
8. Ansaru-Deen Mosque
Ilorin West 1 = 142
2 = 7.6
3 = 26
d1 = 3.45
d2 = 30
d3 =
d1 = 0.4
d2 = 28.0
d3 =
3.0
9. Police Barrack ‘A’ Div.
Ilorin South 1 = 140
2 = 70
3 = 140
d1 = 0.8
d2 = 10.4
d3 =
d1 = 1.0
d2 = 8.5
d3 =
2.2
10. ITC Quarters Ilorin South 1 = 270
2 = 108
3 = 1,240
d1 = 0.75
d2 = 33.0
d3 =
d1 = 0.8
d2 = 28.0
d3 =
2.6
11. Mark fuel station,
Tanke
Ilorin South 1 = 1,350
2 = 270
3 = 1095
d1 = 2.0
d2 = 13.0
d3 =
d1 = 4.0
d2 = 10.0
d3 =
0.6
12. Ijagbo
Oyun 1 = 270
2 = 108
3 = 1,240
d1 = 1.1
d2 = 15.6
d3 =
d1 = 0.4
d2 = 15.5
d3 =
2.2
13. COE, Oro
Irepodun 1 = 640
2 = 255
3 = 1,200
d1 = 2.0
d2 = 52.0
d3 =
d1 = 3.0
d2 = 50.0
d3 =
1.1
14. Arandun
Irepodun 1 = 610
2 = 42
3 = 1,600
d1 = 13.0
d2 = 50.0
d3 =
d1 = 21.0
d2 = 40.0
d3 =
2
27 OLAWUYI AND ABOLARIN: EVALUATION OF VERTICAL ELECTRICAL SOUNDING METHOD FOR GROUNDWATER
Borehole width (m)
De
pth
(m
)
Figure 8 Lithological section of boreholes within the study area (N S)
V. HE RELATIONSHIP BETWEEN THE WELL LOG AND VES
DATA
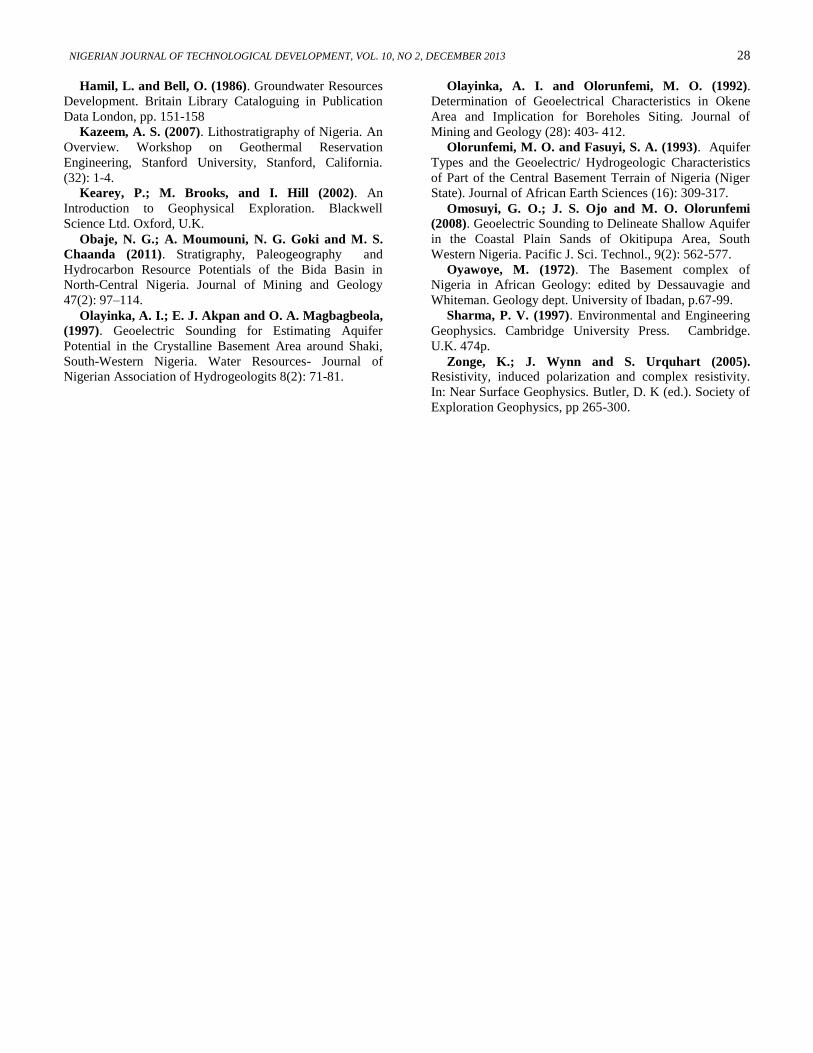
The relationship between the depths obtained from well
logs and VES interpreted data is presented in Figure 9. The
coefficient of correlation (r) had a value of 0.97 while the
coefficient of determination (r2) had a value of 0.94. The
high coefficient of determination confirmed the reliability
of the VES method.
Figure 9: Relationship between VES Interpretation and Drill Log
(Regression Analysis)
VI. CONCLUSION
The study has demonstrated the usefulness of the VES
method in the exploration of groundwater in the Basement
Complex Terrain of West Central Nigeria. The VES curves
obtained exhibited a three-layer (H type) characteristic,
showing a resistive first layer, followed by a less resistive
weathered basement and finally, the highly resistive fresh
basement. In all the boreholes, the second geoelectric layer,
that is, weathered basement, form the main aquifer.
A linear relationship was found between VES predicted
depth and the actual depth recorded from the drilling log.
The linear regression equation developed for this
relationship accounted for 94% of the variance. This
confirmed the reliability of the VES method for
groundwater exploration in the Basement Complex
environment.
The degree of success recorded after the construction of
the fourteen boreholes and the statistical analysis showed
that VES could be relied upon in locating suitable points
for boreholes in the basement complex terrain, particularly
when data are carefully acquired and properly interpreted.
Whenever VES is to be carried out, the Schlumberger array
is recommended because of its several advantages over
other array types.
REFERENCES
Abdel-Azim, M E, Mahmoud, M S And Kamal, A D
(1996). Geoelectrical and Hydrogeochemical studies for
Delineating Groundwater Contamination Due to Salt-
Water Intrusion in the Northern Part of the Nile Delta,
Egypt. Groundwater. 35(2): 218.
Ako, B. D. and Olorunfemi, M. O. (1989). Geoelectric
Survey for Groundwater in the Newer Bassalts of Vom,
Plateau State. Journal of Mining and Geology 25, pp.247-
250.
Dan-Hassan, M. A. and Olorunfemi, M.O. (1999).
Hydro-geophysical Investigation of a Basement Terrain in
the North-Central part of Kaduna state, Nigeria. Journal of
Mining and Geology 35(2): 189-206.
Daramola, S. O. (2006). Research and statistical
methods in education for students and researchers in
tertiary institutions. Bamitex Printing and Publishing,
Ilorin, Nigeria.
Emmanuel O. Joshua, Olayinka O. Odeyemi and
Oladotun O. Fawehinmi (2011). Geoelectric investigation
of the groundwater potential of Moniya Area, Ibadan.
Journal of Geology and Mining Research Vol. 3(3), pp. 54-
62, Available online
http://www.academicjournals.org/jgmr ISSN 2006 -9766
©2011 Academic Journals
Garba, A. A. (2011). Geology, Geochemistry and Rare-
Metal Bearing Potentials of Pegmatite of Gbugbu, Lema
and Bishewa Areas of North Central Nigeria. Unpublished
Ph.D Thesis. University of Ilorin, Nigeria. 207 p
Geoexploration Nig. Assoc. (1995). Investigation,
Design and Construction Supervision of 500 Boreholes; a
report submitted to KWADP.
60
50
40
30
20
10
0 De
pth
fro
m V
ES In
terp
reta
tio
n v
(m)
NIGERIAN JOURNAL OF TECHNOLOGICAL DEVELOPMENT, VOL. 10, NO 2, DECEMBER 2013 28
*Corresponding author’s e-mail address: [email protected]
Hamil, L. and Bell, O. (1986). Groundwater Resources
Development. Britain Library Cataloguing in Publication
Data London, pp. 151-158
Kazeem, A. S. (2007). Lithostratigraphy of Nigeria. An
Overview. Workshop on Geothermal Reservation
Engineering, Stanford University, Stanford, California.
(32): 1-4.
Kearey, P.; M. Brooks, and I. Hill (2002). An
Introduction to Geophysical Exploration. Blackwell
Science Ltd. Oxford, U.K.
Obaje, N. G.; A. Moumouni, N. G. Goki and M. S.
Chaanda (2011). Stratigraphy, Paleogeography and
Hydrocarbon Resource Potentials of the Bida Basin in
North-Central Nigeria. Journal of Mining and Geology
47(2): 97–114.
Olayinka, A. I.; E. J. Akpan and O. A. Magbagbeola,
(1997). Geoelectric Sounding for Estimating Aquifer
Potential in the Crystalline Basement Area around Shaki,
South-Western Nigeria. Water Resources- Journal of
Nigerian Association of Hydrogeologits 8(2): 71-81.
Olayinka, A. I. and Olorunfemi, M. O. (1992).
Determination of Geoelectrical Characteristics in Okene
Area and Implication for Boreholes Siting. Journal of
Mining and Geology (28): 403- 412.
Olorunfemi, M. O. and Fasuyi, S. A. (1993). Aquifer
Types and the Geoelectric/ Hydrogeologic Characteristics
of Part of the Central Basement Terrain of Nigeria (Niger
State). Journal of African Earth Sciences (16): 309-317.
Omosuyi, G. O.; J. S. Ojo and M. O. Olorunfemi
(2008). Geoelectric Sounding to Delineate Shallow Aquifer
in the Coastal Plain Sands of Okitipupa Area, South
Western Nigeria. Pacific J. Sci. Technol., 9(2): 562-577.
Oyawoye, M. (1972). The Basement complex of
Nigeria in African Geology: edited by Dessauvagie and
Whiteman. Geology dept. University of Ibadan, p.67-99.
Sharma, P. V. (1997). Environmental and Engineering
Geophysics. Cambridge University Press. Cambridge.
U.K. 474p.
Zonge, K.; J. Wynn and S. Urquhart (2005). Resistivity, induced polarization and complex resistivity.
In: Near Surface Geophysics. Butler, D. K (ed.). Society of
Exploration Geophysics, pp 265-300.


