Embed Size (px)
Citation preview

PLEASE SCROLL DOWN FOR ARTICLE
This article was downloaded by: [Filippelli, Gabriel]On: 13 September 2010Access details: Access Details: [subscription number 926849130]Publisher Taylor & FrancisInforma Ltd Registered in England and Wales Registered Number: 1072954 Registered office: Mortimer House, 37-41 Mortimer Street, London W1T 3JH, UK
International Journal of Remote SensingPublication details, including instructions for authors and subscription information:http://www.informaworld.com/smpp/title~content=t713722504
Estimation of heavy-metal contamination in soil using reflectancespectroscopy and partial least-squares regressionCaaminee M. Pandita; Gabriel M. Filippellia; Lin Lia
a Department of Earth Sciences, Indiana University Purdue University Indianapolis (IUPUI),Indianapolis, IN, USA
Online publication date: 13 September 2010
To cite this Article Pandit, Caaminee M. , Filippelli, Gabriel M. and Li, Lin(2010) 'Estimation of heavy-metalcontamination in soil using reflectance spectroscopy and partial least-squares regression', International Journal ofRemote Sensing, 31: 15, 4111 — 4123To link to this Article: DOI: 10.1080/01431160903229200URL: http://dx.doi.org/10.1080/01431160903229200
Full terms and conditions of use: http://www.informaworld.com/terms-and-conditions-of-access.pdf
This article may be used for research, teaching and private study purposes. Any substantial orsystematic reproduction, re-distribution, re-selling, loan or sub-licensing, systematic supply ordistribution in any form to anyone is expressly forbidden.
The publisher does not give any warranty express or implied or make any representation that the contentswill be complete or accurate or up to date. The accuracy of any instructions, formulae and drug dosesshould be independently verified with primary sources. The publisher shall not be liable for any loss,actions, claims, proceedings, demand or costs or damages whatsoever or howsoever caused arising directlyor indirectly in connection with or arising out of the use of this material.

Estimation of heavy-metal contamination in soil using reflectancespectroscopy and partial least-squares regression
CAAMINEE M. PANDIT, GABRIEL M. FILIPPELLI and LIN LI*
Department of Earth Sciences, Indiana University Purdue University Indianapolis
(IUPUI), 723 W. Michigan St., Indianapolis, IN 46202, USA
(Received 30 January 2008; in final form 7 November 2008)
Lead (Pb) poisoning from anthropogenic sources continues to threaten the health
of urban children. Mapping Pb distribution on a large scale is imperative to
identify hotspots and reduce Pb poisoning. To assess the feasibility of using
reflectance spectroscopy to map soil Pb and other heavy metal abundance, the
relationship between surface soil metal concentrations and hyperspectral reflec-
tance measurements was examined via partial least-squares regression (PLSR)
modelling. Soil samples were taken from four study sites. Metal concentrations
were determined by inductively coupled plasma-atomic-emission spectrometry
(ICP-AES) analysis, and reflectance was measured with an ASD (Analytical
Spectral Devices) field spectrometer covering the spectral region of 350–2500 nm.
Pb displayed an exponential decrease as a function of distance from the roadway,
demonstrating the depositional patterns from leaded gas combustion which remain
on the landscape 20 years after the phase-out of leaded gasoline. Calibration
samples were used to derive the PLSR algorithm, and validation samples assessed
the model’s predictive ability. The correlation coefficients between the lab-
determined abundance and the abundance predicted from PLSR calibration for
all metals except copper were at or above 0.970, with the correlation coefficient for
Pb the highest of all metals (0.992). Manganese, zinc and Pb had significant
coefficients of determination (0.808, 0.760 and 0.746, respectively) for the valida-
tion samples. These results suggest that Pb and other heavy metal concentrations
can be retrieved from spectral reflectance at high accuracy. Reflectance spectro-
scopy thus has potential to map the spatial distribution of Pb abundance with the
aim of improving children’s health in an urban environment.
1. Introduction
Lead (Pb) poisoning from anthropogenic sources remains a common, but prevent-
able, disease. Though the incidence of Pb poisoning in children (defined as a blood Pb
level . 10 mg dl-1) has decreased by 80% (to ,2.2%) since the late 1970s, childhood Pb
poisoning remains a public health menace in urban areas (Brody et al. 1994). Children
of low-income and minority families located in the inner-city endure high rates of
Pb poisoning; over 15% of children in many cities have blood levels of or exceedingthe maximum ‘safe’ level of 10 mg dl-1 (Rabito et al. 2003). Pb – a neurotoxin – can
permanently impair the brain’s functioning, inhibiting a child’s mental and beha-
vioural development. High doses can be fatal (Mielke 1999). Recent studies show that
*Corresponding author. Email: [email protected]
International Journal of Remote SensingISSN 0143-1161 print/ISSN 1366-5901 online # 2010 Taylor & Francis
http://www.tandf.co.uk/journalsDOI: 10.1080/01431160903229200
International Journal of Remote Sensing
Vol. 31, No. 15, 10 August 2010, 4111–4123
Downloaded By: [Filippelli, Gabriel] At: 15:21 13 September 2010

many urban children have high blood Pb levels due to exposure of soil-borne Pb
(figure 1). Small children are more susceptible to increased levels of Pb intake due to
frequent hand-to-mouth behaviour (Mielke 1999) after playing in an environment
with hazards such as elevated levels of Pb in house dust or yard soils (Bellinger 2004,
Choi et al. 2005).
Pb is found in inner-city soils primarily due to decomposed Pb-based paints andthe deposition of Pb from leaded gasoline and from decomposing Pb-based paint on
homes built before 1950. Gasoline-sourced Pb from combustion products was initially
deposited within ,50 m of a roadway if no obstructions were present (Filippelli et al.
2005). Leaded gasoline was used until 1986; an estimated 4 to 5 million tons of Pb has
been released into the atmosphere and has subsequently accumulated in the environ-
ment (Laidlaw et al. 2005). The amount of Pb deposited in soil by leaded gasoline is
proportional to the traffic flow of nearby roadways. Due to its insoluble nature, when
5 km
39o56′N86o21′W 39o56′N85o55′W
39
>200 ppm lead125–200 ppm lead75–125 ppm lead
o37′N85o55′W 39o37′N86o21′W
Figure 1. Concentration of diffuse soil lead in surface soils of Indianapolis (in colouredregions) showing a characteristic pattern of urban enrichment trending towards backgroundvalues in suburban and agricultural regions. The overprint of high diffuse soil lead presentedhere corresponds roughly with the distribution of elevated blood lead levels in children.Reprinted with permission from Filippelli et al. (2005).
4112 C. M. Pandit et al.
Downloaded By: [Filippelli, Gabriel] At: 15:21 13 September 2010

the particulate Pb is deposited on to a grassy area near the road, it is retained in
surface soil particulates through the surface complexation of Pb and Pb oxides with
soil organic matter (Filippelli et al. 2005). Smelters also contribute to high Pb
concentrations in urban areas.
Conventional wet-chemistry techniques used to determine Pb concentrations neces-sitate tedious processes, including preparation, loss on ignition, strong acid digestion
and inductively coupled plasma-atomic-emission spectrometry (ICP-AES). Soil
sampling and preparation entails collecting surface soils at least 5 cm deep and sieving
and drying the samples. After soil sampling and preparation, ashing the samples,
strong acid digestion and ICP-AES, about a week has passed. Not only are these
processes expensive (cost of instruments and manpower), but they are inefficient and
ineffective as well. The Pb concentration determined from sampling one spot is
not representative of the entire area; for instance, observe the Pb concentrations ofa roadway transect. Substantially higher Pb concentrations are found in a sample
taken 5 m away from a heavily trafficked road as opposed to 10 m. Developing a much
quicker and efficacious method for determining Pb concentrations is paramount.
Reflectance spectroscopy is promising in its ability to determine heavy metal con-
centrations through airborne or spaceborne remote sensors. These remote sensors are
operated from airplanes and satellites to acquire data on how various earth surfaces
emit and reflect electromagnetic energy (Lillesand et al. 2004). Hyperspectral remote
sensing is employed to measure more detailed spectral characteristics of objects innature than traditional multispectral sensors do, thus finding more applications in
monitoring and assessing environmental conditions. With the aid of field spectroscopy
for in-flight calibration (Milton et al. 1995), hyperspectral remote sensing has been
used to identify minerals and vegetation from airborne or spaceborne sensor systems
(Peters et al. 2001, 2003). Such capabilities are indicative of reflectance spectroscopy’s
ability to map heavy metal concentrations for health-related reasons.
Based on this background research, we hypothesize that the samples with the
highest concentrations (those closest to the roadway, according to the Pb roadwaytrend) would have the lowest reflectance, and that reflectance would increase propor-
tionally as the Pb concentrations decreased. Previous research on large-scale mining
contamination suggests that reflectance is inversely proportional to metal concentra-
tions (Peters et al. 2001, 2003). Urban Pb poisoning in children continues to remain a
threat, not only in Indianapolis but worldwide; through an exploration of reflectance
spectroscopy and partial least-squares regression (PLSR) modelling, this research lays
the foundation for utilizing airplane or satellite-based remote sensors to quickly map
Pb distributions over large regions.
2. Materials and methods
2.1 Study sites
The soil samples analysed in this research were taken along a transect in MilitaryPark, Indianapolis, IN, USA. This sampling array was chosen to characterize soils
that had varying levels of Pb as defined by an Indianapolis-wide soil Pb study in 2005
(Filippelli et al. 2005). Military Park is located in the urban area of downtown
Indianapolis, adjacent to the heavily travelled New York Street. The park has
remained completely undeveloped and relatively undisturbed over the past century,
making it an ideal and stable site to assess urban atmospheric deposition of contami-
nants: Military Park’s only exposure to Pb is through roadways (Filippelli et al. 2005).
Estimation of heavy-metal contamination in soil 4113
Downloaded By: [Filippelli, Gabriel] At: 15:21 13 September 2010

2.2 Field sampling
The soil samples used in this study were surface soils (top 5 cm). Sample location was
documented as both distance from the roadway and GPS coordinates. Sampling
began ,1 m from the roadway and concluded ,50 m.
2.3 Sample processing
The soil samples were dried at 105�C for 2 days and then sieved to 150 mm. Dried and
sieved samples were ashed in a muffle furnace at 550�C and digested with trace metal
grade 2 N HCl.
2.4 Sample geochemistry
Samples were analysed for Pb – as well as other heavy metals commonly found in urban
soils: zinc (Zn), copper (Cu), cadmium (Cd) and manganese (Mn) – concentrations viaICP-AES. Replicates and a standard were used. The percentage organic matter and the
abundance of the heavy metals were calculated for each soil sample to determine which
soil constituent had the greatest effect on the reflectance measurements.
2.5 Reflectance spectroscopy
The remaining dried samples were sieved to 500 mm and taken outside on a dry, sunny
and cloudless day. Spectral data were collected using an ASD field spectrometer
UV/VNIR (Analytical Spectral Devices Inc., Boulder, CO, USA) spectrometer with
an 8� lens. Optimization and white reference of the spectrometer preceded data
collection. The instrument acquired a continuous spectrum ranging from 350 to2500 nm simultaneously. Because reflectance spectra were measured outdoors, the
spectra are very noisy at around 1400, 1900 nm and the region beyond 2350 nm due to
atmospheric water. These noisy spectral bands were discarded to avoid the adverse
effect of the noise on the development of a spectral-compositional model.
2.6 Partial least-squares regression modelling
Partial least-squares regression (PLSR) is a standard multivariate statistical technique
that was developed by Herman Wold in 1966 (Wold 1966). The underlying assumption
behind a PLSR model is that linear combinations of observed explanatory variables,
which are called components, factors, or latent variables, drive a system or process.PLSR is used to find eigenvectors of the explanatory variables that will produce score
values. These score values must both summarize the variance of the explanatory
variables well and highly correlate with the response variables. A simplified PLSR
model consists of two outer relations and an inner relation. The two outer relations are
a result of the eigenstructure decomposition of the X and Y matrices, respectively. The
inner relation links the score for the X and Y matrices via a regression.
X is an n � m matrix for the explanatory variables measured for n samples at m
variables, and Y is an n � p matrix for the response variables measured for n samplesat p variables. Decomposing X into a matrix T (the score matrix) and a matrix PT (the
loadings matrix) plus an error matrix E derives the outer relation for the X matrix:
X ¼ TPT þ E: (1)
In this way, Y is decomposed into the score matrix U and the loading matrix QT plus
the error matrix F to create the outer relation for the Y matrix:
4114 C. M. Pandit et al.
Downloaded By: [Filippelli, Gabriel] At: 15:21 13 September 2010
Y ¼ UQT þ F: (2)
T and P are sized n� k and m� k, respectively; U and Q are sized n� l and p� l; k and
l are the number of principal components for reconstructing X and Y; PT and QT
represent the transpose of P and Q. Both E and F are residual matrices. E, the n � m
residual matrix for the matrix X, results from using k principal components to
summarize variance. F is the n � p residual matrix resulting from the subtraction ofl principal components from the Y matrix.
The purpose of PLSR is to minimize the norm of F while keeping the correlation
between X and Y by the inner relation. B is an n� n matrix for the regression coefficient:
U ¼ BT: (3)
By deriving the orthogonal score matrix (T), PLSR remains unaffected by harmful
colinearity in explanatory variables. The decomposition or reduction in the dimen-
sionality of the explanatory variables allows the regression model to be composed of a
small number of samples. PLSR has been applied to visible, near-infrared reflectanceand mid-infrared reflectance to predict mineral abundance and biological activity in
soil (Chang et al. 2005, Li 2006).
A MATLAB program was implemented to conduct PLSR modelling on the
samples. The spectral bands served as the explanatory variables, and six soil consti-
tuents (the 5 heavy metals and organic matter) were the response variables for PLSR
modelling. X is an n � s matrix, and Y is a 6 � n matrix, with n as the number
of samples and s as the number of spectral bands. Bands that are sensitive only to
water content in the atmosphere were automatically determined by the program andleft out during the regression, as they have no bearing on metal abundance
predictions.
To create a PLSR model with high predictive power, an optimal number of PLSR
components were selected for use in the model. Cross calibration of the PLSR model
using an increasing number of components was utilized to determine the ideal number
of components. One sample at a time was left out for the cross calibration of the
response variables. For the n sets of reflectance data, a PLSR model was built using
n – 1 spectra along with the corresponding abundance. The abundance of each metaland organic matter for the sample that was left out was predicted. This process was
repeated n times until each sample had been left out once. The abundance predictions
for the n soil samples were compared with the actual concentrations of the samples.
The resulting prediction error sum of squares (PRESS) was calculated:
PRESS ¼Xn
i¼1
yðiÞ � yi
� �2
; (4)
where y(i) is the estimate of a constituent value yi for the left-out sample i.
The root mean square error of cross-validation (RMSECV) was derived from the
PRESS. RMSECV indicates the accuracy of the model’s predictive power for new
samples. k is the number of components used in the PLSR model, and so PRESSk
is the prediction error sum of squares when k PLS components are used in cross-
validation:
RMSECV ¼ffiffiffiffiffiffiffiffiffiffiffiffiffiffiffiffiffiffiffiffiffiðPRESSkÞ
n
r: (5)
Estimation of heavy-metal contamination in soil 4115
Downloaded By: [Filippelli, Gabriel] At: 15:21 13 September 2010

The RMSECV was calculated as each new component was added to the PLSR model.
The model with the optimal number of PLSR components was the model with the lowest
RMSECV. RMSECV differs from the root mean square of calculation (RMSEC), as the
RMSEC indicates the accuracy of the model’s predictive power for the samples used to
create the model. The RMSEC also indicates the minimum error tolerated in predictionfor new samples based on the optimal number of PLSR components for modelling.
RMSEC ¼
ffiffiffiffiffiffiffiffiffiffiffiffiffiffiffiffiffiffiffiffiffiffiffiffiffiPni¼1
yi � yið Þ2
n
vuuut: (6)
3. Results and discussion
3.1 Geochemical analysis
The geochemical characteristics determined from the Military Park transect were
generally predictable, with higher values of vehicular-sourced metals near the road-
way, and a decrease with distance (table 1; figure 2). The curve in figure 3 is typical of a
Military Park Geochemical Transect
Distance from road edge (m)
0 10 20 30 40 50 60
Con
cent
ratio
n (p
pm)
0
200
400
600
800
1000
1200
1400
Pb (ppm)Zn (ppm)Cu (ppm)Cd (ppm)Mn (ppm)Organic matter (%)
Figure 2. Metal concentrations as a function of distance from roadway. Mn displays anincrease away from the roadway, possibly caused by leaching of Mn from soils due to roadwaysalt application and subsequent ion exchange. Zn and Pb exhibit a decrease as a function ofdistance from roadway, reflecting the vehicle sources for Zn (tire rubber) and Pb (leadedgasoline). Note the general decrease for Pb, indicating that the roadway source signature isstill preserved in surface soils, even though leaded gasoline was banned over 30 years ago.
4116 C. M. Pandit et al.
Downloaded By: [Filippelli, Gabriel] At: 15:21 13 September 2010

Pb roadway transect, illustrating the rapid deposition of Pb in exhaust particulates
from the combustion of leaded gasoline and the persistence of this Pb in surface soils(Filippelli et al. 2005). The only possible Pb source in Military Park was leaded
gasoline, which was phased out over 20 years ago. This trend demonstrates the effect
of long-term Pb loading from leaded gasoline and the immobility of this Pb in soil.
Soil Pb exhibited a weak relationship with percentage organic matter, yielding a
correlation coefficient (R) of 0.473. This low correlation evinces that although organic
matter is a factor in Pb retention, it does not control the deposition of Pb because little
organic matter is needed to retain Pb. Consequently, an increase in organic matter
would not retain any more Pb. For the other sites, Pb exhibited higher relationshipswith organic-matter content. While organic-matter content has little influence on the
deposition of Pb concentrations, it does affect other metals. For example, Cd and Zn
seem to exhibit some signs of mobility, with organic-matter content variations playing
a larger role in controlling their depositional concentrations than for Pb.
Pb, Zn and Cu have a similar roadway source – with Pb from leaded gasoline, Zn
from tyre dust and Cu from break pads – which may account for the high correlation
between Pb and Zn for these samples (R¼ 0.911). However, Mn and Cd do not share
this similar roadway source. As a function of distance, Cd and Cu vary little inconcentration. Magnesium exhibits no discernible pattern in respect to the roadway
trend, organic matter, the other metals or even alone.
3.2 Reflectance spectroscopy
A promising relationship between the Military Park Pb concentrations and reflectance
spectra (figure 3) was determined for the samples, with the exception of sample one. It
was hypothesized that the samples with the highest concentrations would have thelowest reflectance, and that the reflectance would increase proportionally as the Pb
concentrations decreased. Indeed, the spectral signatures of the soil samples changed
significantly as a function of Pb concentration. The most distinguishing change among
the samples was an overall decrease in albedo as the Pb concentrations increased.
Sample one did not fit this expected pattern, possibly due to its very close location to
the road and therefore its composition of shiny metallic particulates – as opposed to
elemental metals bound to particulates – which would affect the hyperspectral readings.
Without sample one, the linear relationship between Pb and reflectance is significant,
Table 1. Distance from the roadway, organic-matter content and metal concentrations foreach sample.
Sample Distance (m)Organic-matter
content (%) Pb (ppm) Zn (ppm) Cu (ppm) Cd (ppm) Mn (ppm)
1 1.7 15.87 412 339 41 7.0 7092 6 20.61 358 364 57 9.5 10193 10 20.97 279 309 38 9.5 10844 15 15.11 245 243 27 7.7 12195 20 16.97 204 225 20 6.8 9926 25 18.00 255 286 31 8.3 11937 40 12.00 187 197 19 6.5 10388 50 12.07 222 214 36 6.8 1286
Estimation of heavy-metal contamination in soil 4117
Downloaded By: [Filippelli, Gabriel] At: 15:21 13 September 2010

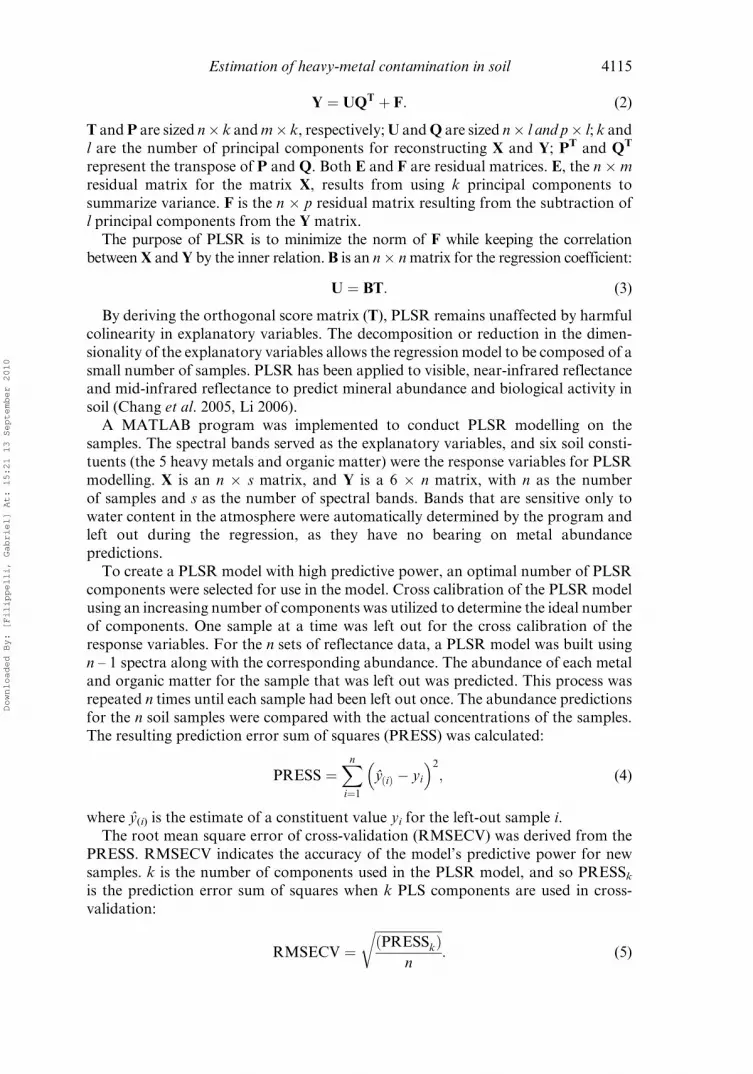
with a coefficient of determination (R2) of 0.691 and 0.683 at 800 and 1300 nm,respectively. Virtually all points are within a 95% level of confidence.
The dip in the scatter plots in figure 4 indicates that there may be an underlying effect
influencing the reflection of the samples, such as the nonlinear effect caused by spectral
overlapping. There is a possibility that the correlation may not only reveal the relation-
ship between reflectance and Pb, but also include effects of organic matter or other soil
constituents on the reflectance. Even if this is the case, Pb abundance may still be
determined from reflectance. For instance, Zn adopts the same roadway curve as Pb
due to their similar roadway source. For that reason, the same reflectance pattern isexpected for Pb as for Zn. High levels of Zn in an area (deposited from tyre dust) are
indicative of high Pb levels (from leaded gasoline) in that area. The high correlation
between organic matter and reflectance can be accounted for as well. While organic-
matter content has little influence over Pb retention, it does have an effect on the
depositional concentrations of Zn. Based on organic-matter content, one can determine
Zn concentrations and therefore determine Pb concentrations through a comprehensive
use of chemometrics. However, the overall trend indicates that metal – specifically Pb –
concentrations can be determined from remote sensing data for human healthpurposes.
3.3 Partial least-squares regression
Due to the aforementioned interference effects of organic matter, the selection of the
most sensitive spectral bands using corrgram plots did not result in highly accurate
prediction. Organic matter masks spectral signatures, making it difficult to identify
metal quantities at these wavelengths. In contrast, PLSR performs the regression
using full-spectrum data, and improves the estimates of Pb and other heavy metals
Military Park
Wavelength (nm)500 1000 1500 2000 2500
Ref
lect
ance
0.00
0.05
0.10
0.15
0.20
0.25Sample 1Sample 2Sample 3Sample 4Sample 5Sample 6Sample 7Sample 8
Figure 3. Reflectance of soil samples, from a transect of near-road to far-road samples(sample 1 to sample 8). The reflectance was measured outdoor and the noise at 1400 and1900 nm is due to atmospheric water.
4118 C. M. Pandit et al.
Downloaded By: [Filippelli, Gabriel] At: 15:21 13 September 2010
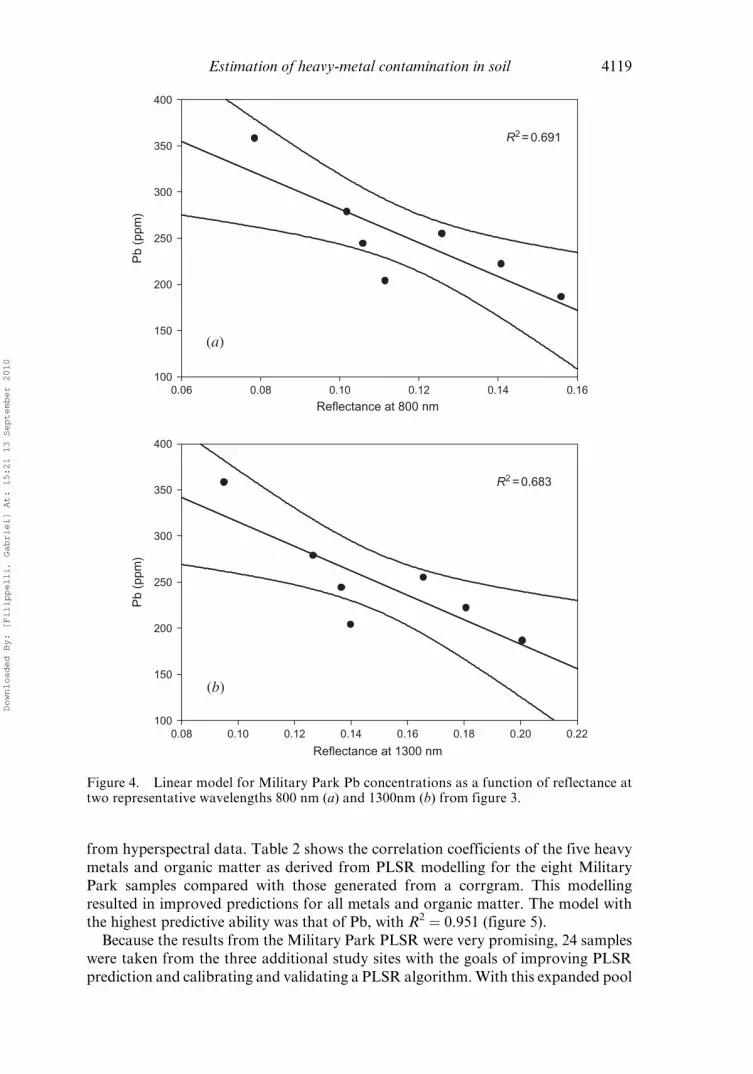
from hyperspectral data. Table 2 shows the correlation coefficients of the five heavy
metals and organic matter as derived from PLSR modelling for the eight Military
Park samples compared with those generated from a corrgram. This modelling
resulted in improved predictions for all metals and organic matter. The model withthe highest predictive ability was that of Pb, with R2 ¼ 0.951 (figure 5).
Because the results from the Military Park PLSR were very promising, 24 samples
were taken from the three additional study sites with the goals of improving PLSR
prediction and calibrating and validating a PLSR algorithm. With this expanded pool
0.06 0.08 0.10 0.12 0.14 0.16
Pb
(ppm
)
100
150
200
250
300
350
400
0.08 0.10 0.12 0.14 0.16 0.18 0.20 0.22
Pb
(ppm
)
100
150
200
250
300
350
400
Reflectance at 800 nm
Reflectance at 1300 nm
(a)
(b)
R2 = 0.691
R2 = 0.683
Figure 4. Linear model for Military Park Pb concentrations as a function of reflectance attwo representative wavelengths 800 nm (a) and 1300nm (b) from figure 3.
Estimation of heavy-metal contamination in soil 4119
Downloaded By: [Filippelli, Gabriel] At: 15:21 13 September 2010
of samples, a calibration PLSR model was created and tested. The samples were split
into two groups, one as the training set for deriving the PLSR algorithm and the other
as the validation set for assessing the model’s predictive ability. Twenty-four samples
were used to create the algorithm, and eight randomly selected samples were validated
using this algorithm. Again, the correlation coefficients as derived from PLSR (for the
calibration samples) were much higher than the correlations initially generated usinga corrgram plot (table 3), and even higher than those determined from the PLSR of
the Military Park samples. However, the correlation coefficient for Cu is skewed due
to the leverage point in the upper-right of the scatter plot. Without the leverage point,
R falls from 0.882 to 0.741.
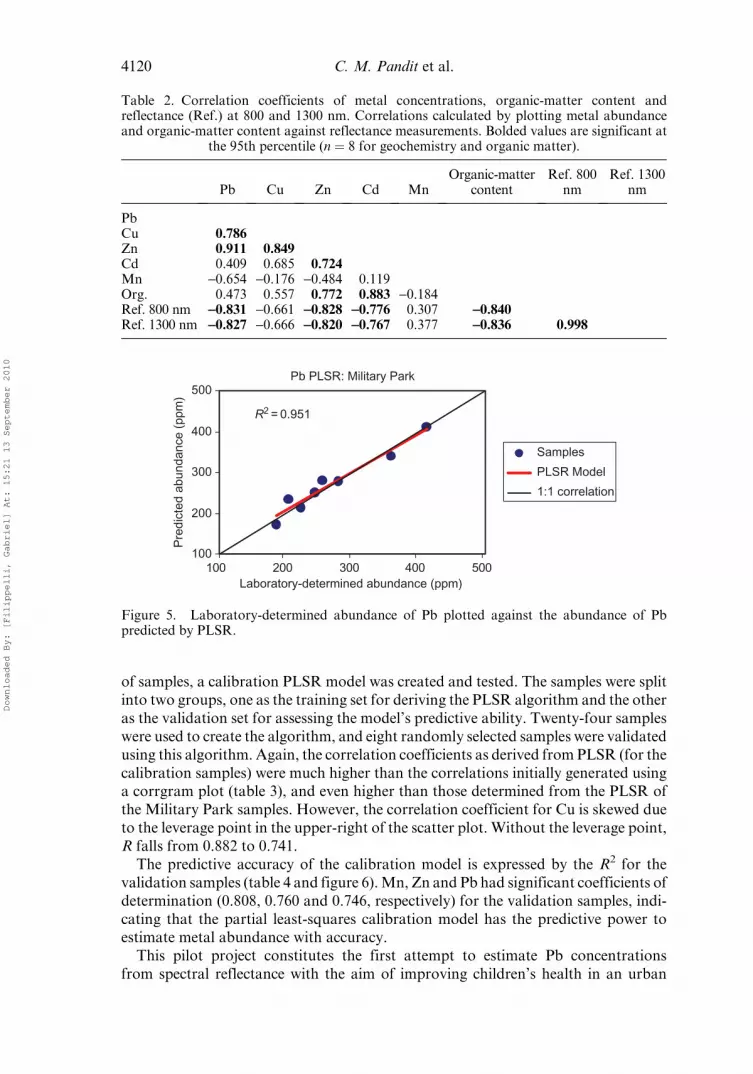
The predictive accuracy of the calibration model is expressed by the R2 for the
validation samples (table 4 and figure 6). Mn, Zn and Pb had significant coefficients of
determination (0.808, 0.760 and 0.746, respectively) for the validation samples, indi-
cating that the partial least-squares calibration model has the predictive power toestimate metal abundance with accuracy.
This pilot project constitutes the first attempt to estimate Pb concentrations
from spectral reflectance with the aim of improving children’s health in an urban
Table 2. Correlation coefficients of metal concentrations, organic-matter content andreflectance (Ref.) at 800 and 1300 nm. Correlations calculated by plotting metal abundanceand organic-matter content against reflectance measurements. Bolded values are significant at
the 95th percentile (n ¼ 8 for geochemistry and organic matter).
Pb Cu Zn Cd MnOrganic-matter
contentRef. 800
nmRef. 1300
nm
PbCu 0.786Zn 0.911 0.849Cd 0.409 0.685 0.724Mn -0.654 -0.176 -0.484 0.119Org. 0.473 0.557 0.772 0.883 -0.184Ref. 800 nm -0.831 -0.661 -0.828 -0.776 0.307 -0.840Ref. 1300 nm -0.827 -0.666 -0.820 -0.767 0.377 -0.836 0.998
100
200
300
400
500
100 200 300 400 500
Samples
PLSR Model
1:1 correlation
R2 = 0.951
Pb PLSR: Military Park
Laboratory-determined abundance (ppm)
Pre
dict
ed a
bund
ance
(pp
m)
Figure 5. Laboratory-determined abundance of Pb plotted against the abundance of Pbpredicted by PLSR.
4120 C. M. Pandit et al.
Downloaded By: [Filippelli, Gabriel] At: 15:21 13 September 2010

environment. The results demonstrate the feasibility of employing hyperspectral
analysis to determine Pb concentrations. However, this pilot mandates a continuance
of research. The factors of atmospheric conditions, soil moisture, organic matter,
particle size and soil texture need to be addressed before hyperspectral remote sensing
will be able to map Pb concentrations of a city.
4. Conclusions
As suggested in Peters et al. (2003), large concentrations of heavy metals can be
predicted using reflectance spectroscopy. However, it is much more difficult to
Table 3. Absolute value of the correlation coefficients generated from plotting metal concen-trations against reflectance measurements at 800 and 1300 nm, listed above the bold correlationcoefficients derived from PLSR. The advantage of PLSR can be seen by the improvedcorrelations for all constituents. *Cu correlations for the Transacts are those without the
leverage points.
PLSR: Military Park
Organic-matter content Pb Zn Cu* Cd Mn
Ref. 800 nm 0.840 0.831 0.828 0.661 0.776 0.307Ref. 1300 nm 0.836 0.827 0.820 0.666 0.767 0.377PLSR 0.886 0.975 0.972 0.832 0.843 0.968
Table 4. Coefficients of determination generated from the calibration model are listed abovethe coefficient of determinations derived from the model, which estimated soil constituentabundance from reflectance. Cu coefficients of determination are those without the leverage
points.
PLSR: four transects
Organic-matter content Pb Zn Cu Cd Mn
Calibration 0.982 0.985 0.95 0.778 0.982 0.941Validation 0.562 0.746 0.76 0.814 0.426 0.808
0
100
200
300
400
500
0 100 200 300 400 500
Calibration
Validation
1:1 Correlation
Calibration:
Validation:R2 = 0.985
R2 = 0.746
Pb PLSR calibration/validation
Laboratory-determined abundance (ppm)
Pre
dict
ed a
bund
ance
(pp
m)
Figure 6. Comparison of laboratory determined abundance of Pb with those generated fromPLSR calibration and validation.
Estimation of heavy-metal contamination in soil 4121
Downloaded By: [Filippelli, Gabriel] At: 15:21 13 September 2010
determine small concentrations of heavy metals in soil as opposed to large concen-
trations in mines. For the sake of children’s health, it is imperative to be able to
identify these relatively small Pb concentrations in soil because slight increases in Pb
concentration differentiate safe from poisonous Pb levels. In this study, we found
highly significant correlations between reflectance of soil and the soil constituents ofPb, Zn, Mn, Cd and organic matter. The PLSR models for Pb, Zn and Mn were also
accurate in estimating the metal abundance for new (validation) samples. This
research demonstrates the promise of using reflectance spectroscopy and PLSR
modelling to determine Pb and other heavy metal contamination in urban areas.
Further research on the correlation between reflectance spectroscopy and heavy
metals will benefit many, especially in the metropolises of the world. In advancing
remote sensing to the point where it can map the Pb concentrations of a city, those
potentially at risk from Pb poisoning – especially children – can be made aware ofhealth hazards in time to take preventative measures.
References
BELLINGER, D.C., 2004, Lead. Pediatrics, 113, pp. 1016–1020.
BRODY, D.J., PIRKLE, J.L., KRAMER, R.A., FLEGAL, K.M., MATTE, T.D., GUNTER, E.W. and
PASCHAL, D.C., 1994, Blood lead levels in the US population: Phase 1 of the third
national health and nutrition examination survey (NHANES III, 1988 to 1991). Journal
of the American Medical Association, 272, pp. 277–283.
CHANG, C., LAIRD, D.A. and HURBURGH JR, C.R., 2005, Influence of soil moisture on near
infrared reflectance spectroscopic measurement of soil properties. Soil Science, 170,
pp. 244–255.
CHOI, J.H., DAMM, C.J., O’DONOVAN, N.J., SAWYER, R.F., KOSHLAND, C.P. and LUCAS, D.,
2005, Detection of lead in soil with excimer laser fragmentation fluorescence spectro-
scopy. Applied Spectroscopy, 59, pp. 258–261.
FILIPPELLI, G.M., LAIDLAW, M.A.S., LATIMER, J.C. and RAFTIS, R, 2005, Urban lead poisoning
and medical geology: An unfinished story. GSA Today, 15, pp. 4–11.
LAIDLAW, M.A.S., MIELKE, H.W., FILIPPELLI, G.M., JOHNSON, D.L. and GONZALES, C.R., 2005,
Seasonality and children’s blood lead levels: Developing a predictive model using climatic
variables and blood lead data from Indianapolis, Indiana, Syracuse, New York, and New
Orleans, Louisiana (USA). Environmental Health Perspectives, 113, pp. 793–800.
LI, L., 2006, Partial least squares modeling to quantify lunar soil composition with hyperspec-
tral reflectance measurements. Journal of Geophysical Research, 111, pp. E04002.
LILLESAND, T.M., KIEFER, R.W. and CHIPMAN, J.W., 2004, Remote Sensing and Image
Interpretation, pp. 763 (Hoboken, NJ: Wiley).
MIELKE, H., 1999, Lead in the inner cities. American Scientist Online. Available online at:
http://americanscientist.org/template/AssetDetail/assetid/15602 (accessed 1 January
2008).
MILTON, E.J., ROLLIN, E.M. and EMERY, D.R., 1995, Advances in field spectroscopy. In
Advances in Environmental Remote Sensing, F.M. Danson and S.E. Plummer (Eds),
pp. 9–32 (New York: Wiley).
PETERS, D.C., HAUFF, P.L., PEPPIN, W.A., PROSH, E.C., BORSTAD, G.A., HENDERSON III,
F.B., DILLENBECK, E.D., CLOSS, L.G., LEE, K., THIROS, J.L., COULTER, D.W., ROBBINS,
D.A. and WANGERUD, K.W., 2001, Waste identification and characterization for the
international smelter area using CASI/SFSI hyperspectral remote sensing data. In
Proceedings of the Eighth International Conference on Tailings & Mine Waste ’01,
16–19 January 2001, Fort Collins, CO (Rotterdam: Balkema).
PETERS, D.C., HAUFF, P.L., SARES, M.A., HENDERSON III, F.B., BIRD, D., PROSH, E.C. and
PEPPIN, W.A., 2003, Preliminary results of a NASA-funded hyperspectral remote
4122 C. M. Pandit et al.
Downloaded By: [Filippelli, Gabriel] At: 15:21 13 September 2010

sensing project on natural and anthropogenic sources of impacted drainage. In 2003
SME Annual Meeting and Exhibit, 24–26 February, Cincinnati, OH.
RABITO, A., SHORTER, C. and WHITE, L.E., 2003, Lead levels among children who live in public
housing. Epidemiology, 14, pp. 263–268.
WOLD, H., 1966, Nonlinear estimation by iterative least squares procedure. In Research Papers
in Statistics, F. David (Ed.), pp. 411–444 (New York: Wiley & Sons).
Estimation of heavy-metal contamination in soil 4123
Downloaded By: [Filippelli, Gabriel] At: 15:21 13 September 2010