Embed Size (px)
Citation preview

AcknowledgementFirst of all I would like to express my sincere gratitude and
thanks to ALLAH SWT for his guidance through this work and forall the blessings He has bestowed upon me.
I am thankful to the Academy of Scientific Research andTechnology that give me the scholarship for doing this work and giveme the financial support for doing this practical work.
My deepest gratitude and thanks go to my supervisor, Prof.Dr. Tarek A. A. Moussa, Botany Department, Faculty of Science,Cairo University for his tireless guidance and enthusiasm during thecourse of this work. His excellence in academic standard, dedicationtoward research and teaching will always be a source of inspirationand encouragement to me. His support, encouragement and hisnumerous insightful suggestions made this experience an enjoyableone.
I would like to wholeheartedly acknowledge and express mydeepest gratitude and thanks to my supervisor Assoc. Prof. Dr.Mervat El-Sayed, Biochemistry section, Chemistry Department,Faculty of Science, Cairo University for her guidance, enthusiasmand words of encouragement during this research work.
I would like to thank Prof. Dr. Ahmed Al- Sabbagh, the headof Egyptian Petroleum Research Institute, for encouragement andsupporting me with different facilities.
I am sincerely grateful to Dr. Rehab M. Hafez, BotanyDepartment, Faculty of Science, Cairo University for her help. Iwant to appreciate my colleagues Omaima Sharaf, Mustafa, HananOsman, Akram Hassan, Mohammed Salah and Sara El- Tanany.
My deep thanks to my Parents for their understanding duringmy absence from them and for their support and encouragement tome.
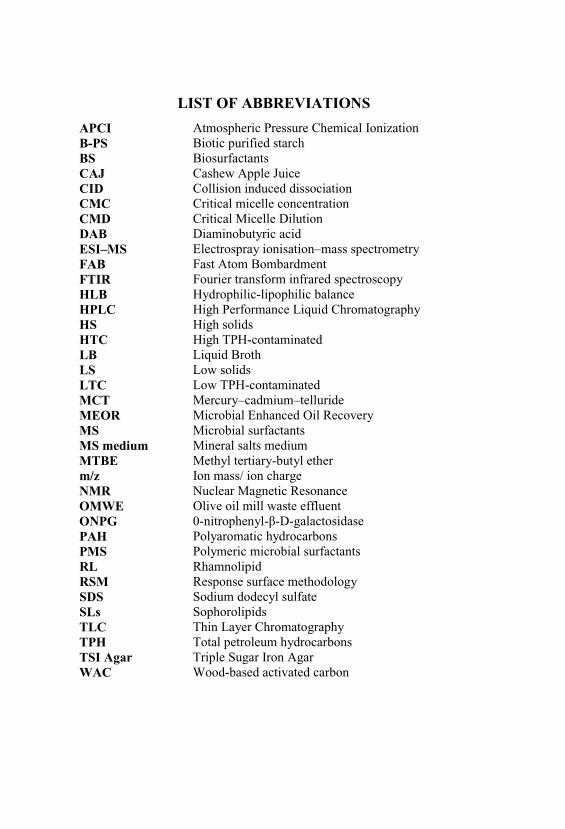
LIST OF ABBREVIATIONS
Atmospheric Pressure Chemical IonizationAPCIBiotic purified starchBiosurfactants
B-PSBS
Cashew Apple JuiceCollision induced dissociationCritical micelle concentration
CAJCIDCMC
Critical Micelle DilutionCMDDiaminobutyric acidDABElectrospray ionisation mass spectrometryESI MSFast Atom BombardmentFABFourier transform infrared spectroscopyFTIRHydrophilic-lipophilic balanceHLBHigh Performance Liquid ChromatographyHPLCHigh solidsHigh TPH-contaminatedLiquid BrothLow solids
HSHTCLBLS
Low TPH-contaminatedLTCMercury cadmium tellurideMicrobial Enhanced Oil RecoveryMicrobial surfactants
MCTMEORMS
Mineral salts mediumMS mediumMethyl tertiary-butyl etherIon mass/ ion chargeNuclear Magnetic Resonance
MTBEm/zNMR
Olive oil mill waste effluentOMWE0-nitrophenyl- -D-galactosidaseONPGPolyaromatic hydrocarbonsPolymeric microbial surfactants
PAHPMS
RhamnolipidRLResponse surface methodologyRSMSodium dodecyl sulfateSophorolipids
SDSSLs
Thin Layer ChromatographyTLCTotal petroleum hydrocarbonsTPHTriple Sugar Iron Agar Wood-based activated carbon
TSI AgarWAC
TABLE OF CONTENTS
PageList of abbreviations List of figuresList of tables .................................................................................. Aim of workIntroduction .. 1Literature Review 32.1 Nature of surfactant 3
..... 42.3 Classification and chemical nature of biosurfactants .. 6
72 .. 7
... 7.. 7
2.3.2. Fatty Acids, Phospholipids, and Neutral Lipids 82.3.3. Polymeric microbial surfactants 82.3.4. Surface active antibiotics .. 92.3.4.1. Surfactin ... 9
.. 9
. 112.4 Economic factors of Biosurfactant production .. 112.5 Substrates for commercial microbial production .. 122.5.1. Agro-industrial wastes .. 122.5.1.1. Use of raw substrates . 132.5.1.1.1. Vegetable oils and oil wastes .. 132.5.1.1.2. Olive oil mill waste effluent (OMWE) 142.5.1.1.3. Starchy substrates ... 142.5.1.1.4. Enzymatic production of biosurfactants 152.5.2. Industrial wastes from animal and plant origin 152.5.2.1. Animal fat . 152.5.2.2. Dairy Industry Whey . 162.5.2.3. Molasses 162.5.2.4. Soy Molasses ... 16
2.5.3. Other industrial wastes . 172.5.3.1. Soap stock . 172.6 Factors affecting biosurfactant production . 172.6.1. Bio-process optimization . 172.6.2. Influence of the Culture Medium Composition onBiosurfactant production ..
18
2.6.2.1. Carbon Source . 192.6.2.2. Nitrogen Source .. 202.6.3. Environmental Factors Affecting the Production 212.6.3.1. pH 212.6.3.2. Temperature . 212.6.3.3. Metal ion concentration 212.6.3.4. Aeration and Agitation .. 222.6.4. Product recovery . 222.6. 5. Metabolic characterization of biosurfactants 232.7 Improved Strains for Biosurfactant Production . 242.8 Methods of Detection and Analysis of rhamnolipids .. 242.8.1. Qualitative Methods .. 242.8.2. Quantitative Methods 252.8.2.1. Thin Layer Chromatography (TLC) 252.8.2.2. Liquid Chromatography 252.8.2.3. Liquid Chromatography Coupled to Mass Spectrometry .. 262.8.2.4. Other Spectroscopic Method ... 262.9 Environmental Applications of Biosurfactants .. 262.10 Biosurfactants and Hydrocarbons Degradation . 28
2.10.1. Role of Biosurfactants in Biodegradation Processes 29
2.10.2. Biodegradation Studies .. 302.10.3. Soil Washing Technology 322.10.4. Microbial Enhanced Oil Recovery (MEOR) . 32
2.11 Industrial applications of biosurfactants . 33
2.12 Biomedical applications . 342.12.1. Antimicrobial activity of biosurfactants .. 362.12.2. Biomedical and therapeutic applications of biosurfactants .. 37Material and methods 39
3.1. Microorganisms and their isolation . 393.2. Identification of micro-organisms . 393.2.1. Gram Stain 393.2.2. Biochemical Tests .. 403.2.2.1 Motility test ... 40
3.2.2.2. Catalase test .. 40
3.2.2.3. Oxidase production test 41
3.2.2.4. Growth at 42oC .. 41
3.2.2.5. Reaction in Triple Sugar Iron Agar . 41
3.2.3. API 20E Identification for selected isolate 413.2.4. 16S rRNA gene sequence analysis for selected isolate 423.3. Production of biosurfactant . 433.3.1. Preparation of Culture medium . 433.3.2. Fermentation medium and condition 433.4. Dried weight cell determination ... 443.5. Extraction of the produced biosurfactants . 443.6. Optimization of Biosurfactant Production . 443.6.1. Optimum Carbon Substrate . 443.6.2. Optimum Nitrogen Source .. 453.6.3. Optimum pH 453.6.4. Optimum Temperature . 453.6.5. Optimum Agitation Rate 453.7. Purification of biosurfactant .. 453.8. Structural characterization of biosurfactant .. 463.8.1. Fourier transform infrared spectroscopy (FTIR) . 463.8.2. Nuclear magnetic resonance analysis .. 463.8.3. Electrospray ionisation mass spectrometry (ESI MS) 473.9. Physicochemical characterization 473.9.1. Oil displacement test . 473.9.2. Surface tension measurement . 473.9.3. Measurement of critical micelle concentration (CMC) 483.9.4. Determination of emulsification index 48Experimental Results 49
4.1. Isolation and identifiction of selected Biosurfactant-producingbacterial strain
49
4.2. Optimization of Biosurfactant Production 534.2.1. Effects of carbon sources on rhamnolipid production 534.2.2. Effects of nitrogen sources on rhamnolipid production 534.2.3. Effect of pH on rhamnolipid production 544.2.4. Effect of temperature on rhamnolipid production 544.2.5. Effect of agitation rate on rhamnolipid production 574.3. Purification of biosurfactant 584.4. Structural characterization 584.4.1. Thin Layer Chromatography 584.4.2. Fourier transform infrared spectroscopy (FTIR) 604.4.3. Nuclear magnetic resonance NMR 604.4.4. Electrospray ionisation mass spectrometry (ESI MS) 604.5. Oil displacement test for par 654.6. Critical micelle concentration of partially purified biosurfactants 654.7. Estimation of Emulsification Activity 70Discussion 72Summary 78References 80Appendix 113
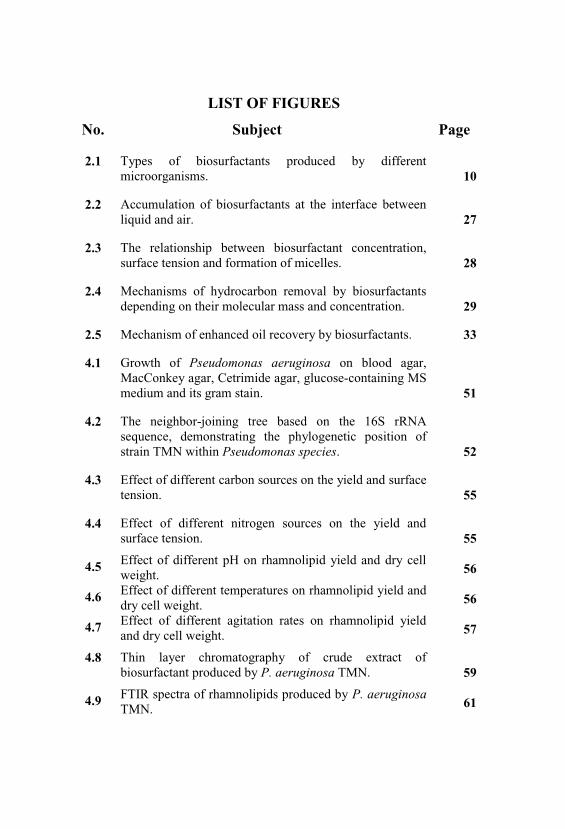
LIST OF FIGURES
No. Subject Page
2.1 Types of biosurfactants produced by differentmicroorganisms. 10
2.2 Accumulation of biosurfactants at the interface betweenliquid and air. 27
2.3 The relationship between biosurfactant concentration,surface tension and formation of micelles. 28
2.4 Mechanisms of hydrocarbon removal by biosurfactantsdepending on their molecular mass and concentration. 29
2.5 Mechanism of enhanced oil recovery by biosurfactants. 33
4.1 Growth of Pseudomonas aeruginosa on blood agar,MacConkey agar, Cetrimide agar, glucose-containing MSmedium and its gram stain. 51
4.2 The neighbor-joining tree based on the 16S rRNAsequence, demonstrating the phylogenetic position ofstrain TMN within Pseudomonas species. 52
4.3 Effect of different carbon sources on the yield and surfacetension. 55
4.4 Effect of different nitrogen sources on the yield andsurface tension. 55
4.5 Effect of different pH on rhamnolipid yield and dry cellweight. 56
4.6 Effect of different temperatures on rhamnolipid yield anddry cell weight. 56
4.7 Effect of different agitation rates on rhamnolipid yieldand dry cell weight. 57
4.8 Thin layer chromatography of crude extract ofbiosurfactant produced by P. aeruginosa TMN. 59
4.9 FTIR spectra of rhamnolipids produced by P. aeruginosaTMN. 61
No. Subject Page
4.10 1H-NMR spectrum of purified biosurfactant produced byP. aeruginosa TMN. 62
4.11 ESI mass spectrum and chemical structure of Rha-Rha-C10 C12 rhamnolipid and its fragments. 64
4.12 Diameters of the clear zones on the oil surface obtainedfrom oil displacement testing with the crude biosurfactantproduced from different carbon and nitrogen sources byPseudomonas aeruginosa TMN. 66
4.13 CMC of partially purified biosurfactant produced usingglucose as carbon source and NaNO3 as nitrogen source. 67
4.14 CMC of biosurfactants produced from different carbonsources. 68
4.15 CMC of biosurfactants produced from different nitrogensources. 69
4.16 Emulsifying activity (E24%) of biosurfactants obtainedfrom different carbon sources against kerosene. 71
4.17 Emulsifying activity (E24%) of biosurfactants obtainedfrom different nitrogen sources against kerosene. 71
LIST OF TABLES
No. Subject Page
2.1 List of biosurfactant producing organisms. 4
2.2 Methods for the recovery of biosurfactants. 23
2.3 Examples of biosurfactant applications in the medical field. 35
3.1 List of primers used in this study. 43
4.1 Biochemical characteristics of the 6 isolates of gramnegative bacteria grown on the API 20E strip and identifiedas Pseudomonas aeruginosa. 50
4.2 Purification of biosurfactant using different mobile phasesand oil displacement test for each fraction. 59
4.3 1H-NMR chemical shift data for rhamnolipid components 62
4.4 Homologues of rhamnolipid produced by Pseudomonasaeruginosa, ausing glucose as carbon source. 63
4.5 CMC of biosurfactants produced from different carbon andnitrogen sources. 67
Appendix Tables 113
A.1 Effect of different carbon sources on the yield and surfacetension. 113
A.2 Effect of different carbon sources on dry cell weight andyield. 113
A.3 Effect of different nitrogen sources on the yield and surfacetension. 114
A.4 Effect of different nitrogen sources on the dry cell weightand yield. 114
A.5 Effect of different PH on rhamnolipid yield and dry cellweight. 115
No. Subject Page
A.6 Effect of different temperatures on rhamnolipid yield anddry cell weight. 115
A.7 Effect of different agitation rates on rhamnolipid yield anddry cell weight. 116
A.8 Effect of different carbon sources on yield and Oildisplacement test 116
A.9 Effect of different nitrogen sources on the yield and Oildisplacement test. 117
A.10 Emulsification index of the carbon sources. 117
A.11 Emulsification index of the nitrogen sources. 118
The present study is designed aiming to use cheap materials could be introduced
from natural sources based on scientific and traditional merits for
bioremediation and oil recovery.
Aim of work
Introduction
CHAPTER I
INTRODUCTION
Microbial surface-active compounds are a group of structurally diverse
molecules produced by different microorganisms and are mainly classified by their
chemical structure and their microbial origin. All biosurfactants (BS) are amphiphiles,
they consist of two parts a polar (hydrophilic) moiety and non polar (hydrophobic)
group. A hydrophilic group consists of mono-, oligo- or polysaccharides, peptides or
proteins and a hydrophobic moiety usually contains saturated, unsaturated and
hydroxylated fatty acids or fatty alcohols (Lang, 2002). A characteristic feature of
biosurfactants is a hydrophilic-lipophilic balance (HLB) which specifies the portion of
hydrophilic and hydrophobic constituents in surface-active substances. These
structures confer a wide range of properties, including the ability to lower surface and
interfacial tension of liquids and to form micelles and microemulsions between two
different phases.
These compounds can be roughly divided into two main classes (Neu, 1996):
low molecular-weight compounds called biosurfactants, such as lipopeptides,
glycolipids, proteins and high-molecular-weight polymers of polysaccharides,
lipopolysaccharides proteins or lipoproteins that are collectively called bioemulsans
(Rosenberg and Ron, 1997) or bioemulsifiers (Smyth et al., 2010a). The former group
includes molecules which can efficiently reduce surface and interfacial tension, while
the latter are amphiphilic and polyphilic polymers which are usually more effective in
stabilising emulsions of oil-in-water but do not lower the surface tension as much
(Smyth et al., 2010b).
The best-studied microbial surfactants are glycolipids. Among these, the best-
known compounds are rhamnolipids (RL), trehalolipids, sophorolipids and
mannosylerythritol lipids, which contain mono- or disaccharides, combined with
long-chain aliphatic acids or hydroxyaliphatic acids. Rhamnolipid production by
Pseudomonas species has been extensively studied, and potential applications have
been proposed (Maier and Soberón-Chávez, 2000).
Introduction
Rhamnolipids from Pseudomonas aeruginosa are currently commercialised by
Jeneil Biosurfactant, USA, mainly as a fungicide for agricultural purposes or an
additive to enhance bioremediation activities. Biosurfactants have many
environmental applications such as bioremediation and dispersion of oil spills,
enhanced oil recovery and transfer of crude oil. Other potential applications of
biosurfactants relate to food, cosmetic, health care industries and cleaning toxic
chemicals of industrial and agricultural origin.
Literature Review
CHAPTER II
LITERATURE REVIEW
2.1 Nature of surfactant
Surfactants are SURFace ACTive AgeNTS with wide ranging properties
including the lowering of surface and interfacial tensions of liquids. Surfactants have
been used industrially as adhesives, flocculating, wetting and foaming agents, de
emulsifiers and penetrants (Mulligan and Gibbs, 1993). They are used for these
applications based on their abilities to lower surface tensions, increase solubility,
detergency power, wetting ability and foaming capacity. The petroleum industry has
traditionally been the major users, as in enhanced oil removal applications. In this
application, surfactants increase the solubility of petroleum components (Falatko,
1991). The effectiveness of a surfactant is determined by its ability to lower the
surface tension, which is a measure of the surface free energy per unit area required to
bring a molecule from the bulk phase to the surface (Rosen, 1978). Efficient
surfactants have a low critical micelle concentration (CMC) (i.e. less surfactant is
necessary to decrease the surface tension). The CMC is defined as the minimum
concentration necessary to initiate micelle formation (Becher, 1965).
In practice, the CMC is also the maximum concentration of surfactant
monomers in water and is influenced by pH, temperature and ionic strength. The
choice of surfactant is primarily based on product cost (Mulligan and Gibbs, 1993). In
general, surfactants are used to save energy and consequently energy costs (such as
the energy required for pumping in pump and treat techniques). Charge-type,
physicochemical behaviour, solubility and adsorption behaviour are some of the most
important selection criteria for surfactants. New markets are currently being
developed for use in the bioremediation of contaminated land sites (Oberbremer et al.,
1990; Samson et al., 1990).
Microbial-derived surfactants or biosurfactants are produced by a wide variety
of microbes and are amphipathic molecules with a hydrophilic and a hydrophobic
domain seem to facilitate the uptake of hydrocarbons into cells. Because of these
traits, biosurfactants accumulate at interfaces, can form micelles, lower the surface
tension and thereby enhance the solubility of poorly soluble compounds in water
Literature Review
(Kuiper et al., 2004). Wide spectra of microbial compounds, including glycolipids,
lipopeptides, fatty acids, and polymeric biosurfactants, have been found to have
surface activity (Morikawa et al., 2000).
Most of these compounds are either anionic or neutral. Only a few are cationic
such as those containing amine groups. The hydrophobic part of the molecule is based
on long- -alkyl- -hydroxy fatty acids. The
hydrophilic portion can be a carbohydrate, amino acid, cyclic peptide, phosphate,
carboxylic acid or alcohol. A wide variety of microorganisms can produce these
compounds.
The CMCs of the biosurfactants generally range from 1 to 200 mg/l and their
molecular mass is from 500 to 1500 Da (Lang and Wagner, 1987). Biosurfactants
have important advantages, such as biodegradability, low toxicity, and various
possible structures, relative to chemically synthesized surfactants (Benincasa et al.,
2002). For example, glycolipids from Rhodococcus species 413A were 50% less toxic
than Tween 80 in naphthalene solubilization tests (Kanga et al., 1997).
2.2 Microorganisms producing biosurfactants
Biosurfactants produced by a variety of microorganisms mainly bacteria, fungi
and yeasts are diverse in chemical composition and their nature and the amount
depend on the type of microorganism producing a particular biosurfactant as shown in
Table (2.1) (Saharan et al., 2011). Many microorganisms for industrial utilization for
waste products have been isolated from contaminated soils, effluents and waste water
sources. Thus, these have an ability to grow on substrates considered potentially
noxious for other non-producing microorganisms.
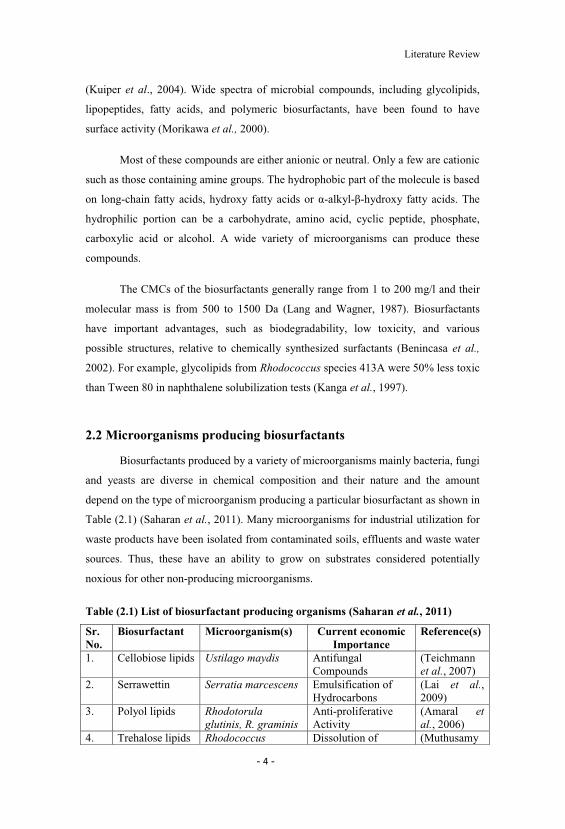
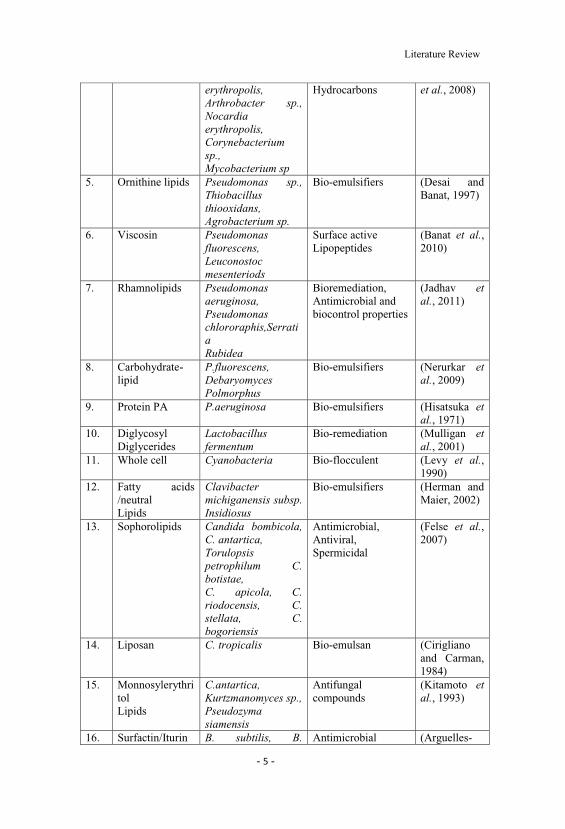
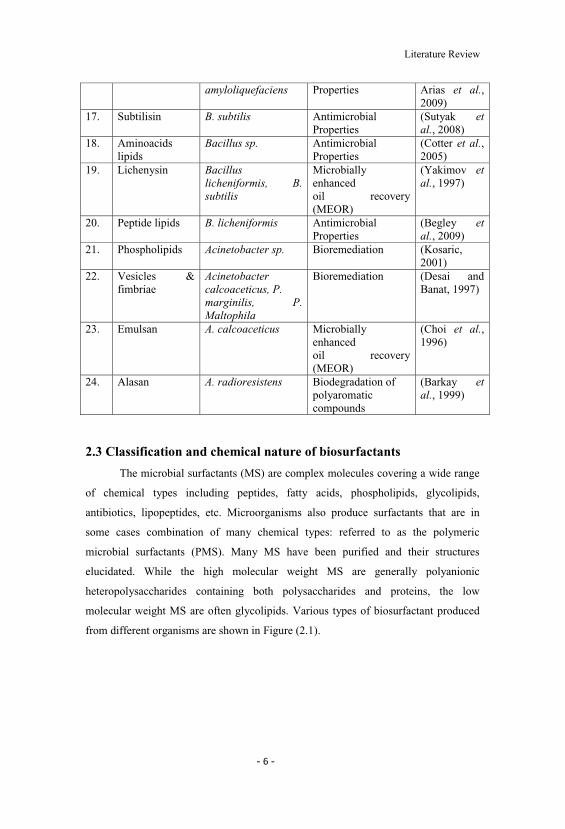
Table (2.1) List of biosurfactant producing organisms (Saharan et al., 2011)
Sr.No.
Biosurfactant Microorganism(s) Current economicImportance
Reference(s)
1. Cellobiose lipids Ustilago maydis AntifungalCompounds
(Teichmannet al., 2007)
2. Serrawettin Serratia marcescens Emulsification ofHydrocarbons
(Lai et al.,2009)
3. Polyol lipids Rhodotorulaglutinis, R. graminis
Anti-proliferativeActivity
(Amaral etal., 2006)
4. Trehalose lipids Rhodococcus Dissolution of (Muthusamy
Literature Review
erythropolis,Arthrobacter sp.,Nocardiaerythropolis,Corynebacteriumsp.,Mycobacterium sp
Hydrocarbons et al., 2008)
5. Ornithine lipids Pseudomonas sp.,Thiobacillusthiooxidans,Agrobacterium sp.
Bio-emulsifiers (Desai andBanat, 1997)
6. Viscosin Pseudomonasfluorescens,Leuconostocmesenteriods
Surface activeLipopeptides
(Banat et al.,2010)
7. Rhamnolipids Pseudomonasaeruginosa,Pseudomonaschlororaphis,SerratiaRubidea
Bioremediation,Antimicrobial andbiocontrol properties
(Jadhav etal., 2011)
8. Carbohydrate-lipid
P.fluorescens,DebaryomycesPolmorphus
Bio-emulsifiers (Nerurkar etal., 2009)
9. Protein PA P.aeruginosa Bio-emulsifiers (Hisatsuka etal., 1971)
10. DiglycosylDiglycerides
Lactobacillusfermentum
Bio-remediation (Mulligan etal., 2001)
11. Whole cell Cyanobacteria Bio-flocculent (Levy et al.,1990)
12. Fatty acids/neutralLipids
Clavibactermichiganensis subsp.Insidiosus
Bio-emulsifiers (Herman andMaier, 2002)
13. Sophorolipids Candida bombicola,C. antartica,Torulopsispetrophilum C.botistae,C. apicola, C.riodocensis, C.stellata, C. bogoriensis
Antimicrobial,Antiviral,Spermicidal
(Felse et al.,2007)
14. Liposan C. tropicalis Bio-emulsan (Ciriglianoand Carman,1984)
15. MonnosylerythritolLipids
C.antartica,Kurtzmanomyces sp.,Pseudozymasiamensis
Antifungalcompounds
(Kitamoto etal., 1993)
16. Surfactin/Iturin B. subtilis, B. Antimicrobial (Arguelles-
Literature Review
amyloliquefaciens Properties Arias et al.,2009)
17. Subtilisin B. subtilis AntimicrobialProperties
(Sutyak etal., 2008)
18. Aminoacidslipids
Bacillus sp. AntimicrobialProperties
(Cotter et al.,2005)
19. Lichenysin Bacilluslicheniformis, B.subtilis
Microbiallyenhancedoil recovery(MEOR)
(Yakimov etal., 1997)
20. Peptide lipids B. licheniformis AntimicrobialProperties
(Begley etal., 2009)
21. Phospholipids Acinetobacter sp. Bioremediation (Kosaric,2001)
22. Vesicles &fimbriae
Acinetobactercalcoaceticus, P.marginilis, P.Maltophila
Bioremediation (Desai andBanat, 1997)
23. Emulsan A. calcoaceticus Microbiallyenhancedoil recovery(MEOR)
(Choi et al.,1996)
24. Alasan A. radioresistens Biodegradation ofpolyaromaticcompounds
(Barkay etal., 1999)
2.3 Classification and chemical nature of biosurfactants
The microbial surfactants (MS) are complex molecules covering a wide range
of chemical types including peptides, fatty acids, phospholipids, glycolipids,
antibiotics, lipopeptides, etc. Microorganisms also produce surfactants that are in
some cases combination of many chemical types: referred to as the polymeric
microbial surfactants (PMS). Many MS have been purified and their structures
elucidated. While the high molecular weight MS are generally polyanionic
heteropolysaccharides containing both polysaccharides and proteins, the low
molecular weight MS are often glycolipids. Various types of biosurfactant produced
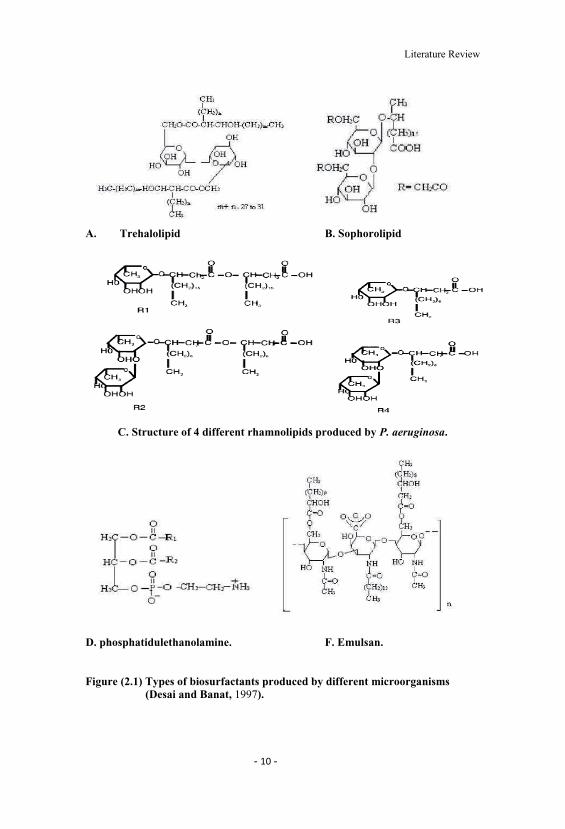
from different organisms are shown in Figure (2.1).
Literature Review
2.3.1. Glycolipids
Glycolipids are the most common types of BS (Karanth et al., 1999). The
constituent mono, di-, triandtetrasaccharides include glucose, mannose, galactose,
glucuronic acid, rhamnose, and galactose sulphate. The fatty acid component usually
has a composition similar to that of the phospholipids of the same microorganism.
The glycolipids can be categorized as:
2.3.1.1. Trehalose lipids
Several structural types of microbial trehalolipids biosurfactants have been
reported. Disaccharide trehalose linked at C-6 and C-6' to mycolic acids is associated
with most species of Mycobacterium, Nocardia, and Corynebacterium. Mycolic acids
-branched- -hydroxy fatty acids. Trehalolipids from different
organisms differ in the size and structure of mycolic acid, the number of carbon
atoms, and the degree of unsaturation (Cooper et al., 1989). Trehalose dimycolate
produced by rhodococcus erythropolis has been extensively studied. R.erythropolis
also synthesizes a novel anionic trehalose lipid. Trehalose lipids from R.erythropolis
and Arthrobacter sp. lowered the surface and interfacial tensions in the culture broth
to 25 to 40 and 1 to 5 mN/m, respectively (Rapp et al., 1979; Kretschmer et al., 1982;
Li et al., 1984).
2.3.1.2. Sophorolipids
These are produced by different strains of the yeast, Torulopsis. The sugar unit
is the disaccharide sophorose which consists of two b -1,2-linked glucose units. The 6
and 6¢ hydroxy groups are generally acetylated. The sophorolipids reduce surface
tensions between individual molecules at the surface, although they are effective
emulsifying agents. The sophorolipids of Torulopsis have been reported to stimulate,
inhibit, and have no effect on growth of yeast on water-insoluble substrates (Karanth
et al., 1999).
2.3.1.3. Rhamnolipids
A group of biosurfactants that has been studied extensively is the rhamnolipids
from Pseudomonas aeruginosa (Hitsatsuka et al., 1971, Guerra-santos et al., 1984).
Up to seven homologues have now been identified (Abalos et al., 2001). Surface
tensions of 29 mN/m are characteristic of these compounds. Two types of
Literature Review
-hydroxy decanoic acid
or one rhamnose connected to the identical fatty acid.
The hydroxyl group of one of the acids is involved in glycosidic linkage with
the reducing end of the rhamnose disaccharide, whereas the hydroxyl group of the
second acid is involved in ester formation. Since one of the carboxylic groups is free,
the rhamnolipids are anions above pH 4. Rhamnolipid was reported (Hitsatsuka et al.,
1971) to lower surface tension, emulsify hydrocarbons and stimulate growth on n-
hexadecane of P. aeruginosa strains but not other hydrocarbon-degrading bacteria.
The pure rhamnolipid lowered the interfacial tension against n-hexadecane to
about 1 mN/m and had a CMC of 10 to 30 mg/l, depending on the pH and salt
conditions (Lang and Wagner, 1987; Parra et al., 1989). Zhang and Miller, (1995)
reported that the interfacial tension between hexadecane and water was decreased to
less than 0.1 mN/m by a methyl ester of rhamnolipid, whereas the free acid decreased
the interfacial tension only to 5 mN/m.
2.3.2. Fatty Acids, Phospholipids, and Neutral Lipids
Several bacterial and yeast produce large quantities of fatty acid and
phospholipid surfactants during growth on n-alkanes (Ciriglino and Garman, 1985).
The HLB is directly related to the length of the hydrocarbon chain in their structures.
In Acinetobacter sp. Strain HO1-N phosphatidulethanolamine, rich vesicles are
produced (Gautam and Tyagi, 2006), which form optically clear microemulsions of
alkanes in water. Phosphatidulethanolamine produced by R. erythropolis grown on n-
alkane caused a lowering of interfacial tension between water and hexadecane to less
than 1 mN/m and a CMC of 30 mg/l (Kretschmer et al., 1982).
2.3.3. Polymeric microbial surfactants
The high molecular weight microbial surfactants are generally polyanionic
heteropolysaccharides containing both polysaccharides and proteins. The best studied
polymeric biosurfactants are emulsan, liposan, mannoprotein, and other
polysaccharide protein complexes. Acinetobacter calcoaceticus RAG-1 produces a
potent polyanionic amphipathic heteropolysaccharide bioemulsifiers (Rosenberg et
al., 1979).
Literature Review
Emulsan is a very effective emulsifying agent for hydrocarbons in water even at a
concentration as low as 0.001 to 0.01%. It is one of the most powerful emulsion
stabilizers known today and resists inversion even at a water to-oil ratio of 1:4.
Liposan is an extracellular water-soluble emulsifier synthesized by Candida
lipolytica and is composed of 83% carbohydrate and 17% protein (Cirigliano and
Carman, 1984). Cameron et al. (1988) reported the production of large amounts of
mannoprotein by Saccharomyces cerevisiae; this protein showed excellent emulsifier
activity toward several oils, alkanes, and organic solvents.
2.3.4. Surface active antibiotics
2.3.4.1. Surfactin
Bacillus subtilis produces a cyclic lipopeptide called surfactin or subtilysin
(Arima et al., 1968; Bernheimer and Avigad, 1970; Peypoux et al., 1999), which is
reputedly the most active biosurfactant known to date (Cooper and Zajic, 1980).
Surfactin has a CMC in water of 25 mg/l and lowers the surface tension to 27 mN/m.
The minimum interfacial tension against hexadecane was 1 mN/m. The yield of
surfactin produced by B. subtilis can be improved to around 0.8 g/l by continuously
removing the surfactant by foam fractionation and addition of either iron or
manganese salts to the growth medium (Cooper et al., 1981).
A recombinant B. subtilis, carrying a gene for surfactin production, produced
new surfactin variants (Nakayama et al., 1997). The amphipathic nature of surfactin
may contribute to some of its interesting biological properties, such as the formation
of ion-conducting pores in membranes (Grau et al., 1999).
2.3.4.2. Polymixins
These are a group of antibiotics produced by Brevibacterium polymyxa and
related bacilli. Polymixin B is a decapeptide in which amino acids 3 through 10 form
a cyclic octapeptide. A branched chain fatty acid is connected to the terminal 2, 4-
diaminobutyric acid (DAB). Polymixins are able to solubilize certain membrane
enzymes (Rosenberg et al., 1979).
Literature Review
A. Trehalolipid B. Sophorolipid
C. Structure of 4 different rhamnolipids produced by P. aeruginosa.
D. phosphatidulethanolamine. F. Emulsan.
Figure (2.1) Types of biosurfactants produced by different microorganisms(Desai and Banat, 1997).
Literature Review
2.3.4.3. Antibiotic TA
Myxococcus xanthus produces antibiotic TA which inhibits peptidoglycan
synthesis by interfering with polymerization of the lipid disaccharide pentapeptide
(Cooper et al., 1981). Antibiotic TA has interesting chemotherapeutic applications
(Karanth et al., 1999).
2.4 Economic factors of Biosurfactant production
Economical large scale production for established and new applications of
biosurfactants remains a challenge (Bognolo, 1999). Researchers have emphasized the
key parameters affecting the efficiency of biosurfactant production in terms of higher
yields and lower production costs (Kosaric, 1992; Bognolo, 1999; Mukherjee et al.,
2006). According to them the biosurfactant formation and accumulation follows the
basic facts of metabolic process and need to be studied comprehensively. According
to Syldatk and Hausmann, (2010) the reasons for limited use of microbial surfactants
in industry are the use of expensive substrates, limited product concentrations, low
yields and formation of product mixtures rather than pure compounds. All these
factors and other growth and upscale problems like use of antifoaming agents add on
to the high costs of the downstream processing.
To overcome the expensive cost constraints associated with biosurfactant
production, two basic strategies are generally adopted worldwide to make it cost-
effective:
(i) The use of inexpensive and waste substrates for the formulation of
fermentation media which lower the initial raw material costs involved in
the process.
(ii) Development of efficient and successfully optimized bioprocesses,
including optimization of the culture conditions and cost-effective
recovery processes for maximum biosurfactant production and recovery.
As millions of tons of hazardous and non-hazardous wastes are generated each
year throughout the world, a great need exists for their proper management and
utilization. It has been suggested that successful approaches to more economical
production technologies of biosurfactant will be a collaborative approach involving
process development and sustainable raw materials supplies. According to Smyth et
Literature Review
al. (Smyth et al., 2010a, b) emphasis should be on cost effective management of
downstream processing. The potential to obtain pure biosurfactants is dependent on
several complex extraction and purification steps. Use of simple substrates with less
downstream processing will economize the process and the use of agricultural
substrates and their wastes represents a positive step towards achieving that goal.
Some of the prevalent downstream processing process uses solvent extraction
(e.g. chloroform-methanol, dichloromethane-methanol, butanol, ethyl acetate,
pentane, hexane, acetic acid, ether) or acid precipitation, use of ammonium sulfate
precipitation, crystallization, centrifugation, adsorption and foam fractionation
(Martins et al., 2006; Mukherjee et al., 2006; Chen et al., 2008; Kaar et al., 2009;
Neto et al., 2009). More studies are needed on these processes for efficient production
of biosurfactants. The availability of processes with limited downstream processing
will give significant economical advantages and have been sought after.
2.5 Substrates for commercial microbial production
Despite possessing many industrially attractive properties and advantages
compared with synthetic ones, the production of biosurfactants on industrial scale has
not been undertaken due to high investment costs. This necessitates their profitable
production and recovery on a large scale. Various aspects of biosurfactants, such as
their biomedical and therapeutic properties (Cameotra and Makkar, 2004) their
natural roles (Ron and Rosenberg, 2001), their production on inexpensive alternative
substrates and their industrial potential, have been reviewed (Makkar and Cameotra,
2002). However their cost of production continues to remain very high. Using low-
cost raw materials is a possible solution for this obstacle (Makkar and Cameotra,
2002). Another approach is to use renewable low cost starting materials from various
sources including industrial wastes from frying oils, oil refinery wastes, molasses,
starch rich wastes, cassava waste water and distilled grape marc (Nitschke and
Pastore, 2006; Rivera et al., 2007; Sobrinho et al., 2008) .
2.5.1. Agro-industrial wastes
These wastes are obtained at low cost from the respective processing
industries and are as potent as low-cost substrates for industrial level biosurfactant
production. Agricultural wastes such as rice water and water from the processing of
Literature Review
cereals, pulse and molasses have potential to be used as excellent substrates for the
production of biosurfactants. P. aeruginosa can be cultivated in Cashew Apple Juice
(CAJ) supplemented with peptone (5.0 g/l) and nutritive broth to obtain surfactants.
Surface tension during the fermentation can be reduced by 41% when P. aeruginosa
is cultivated in CAJ supplemented with peptone (Maria et al., 2007) compared to
other amino acid sources.
2.5.1.1. Use of raw substrates
2.5.1.1.1. Vegetable oils and oil wastes:
Several studies with plant-derived oils have shown that they can act as
effective and cheap raw materials for biosurfactant production, for example, rapeseed
oil (Trummler et al., 2003), Babassu oil and corn oil (Vance-Harrop et al., 2003;
Pekin et al., 2005). Similarly, vegetable oils such as sunflower and soybean oils
(Ferraz et al., 2002; Rahman et al., 2002; Kim et al., 2006) were used for the
production of rhamnolipid, sophorolipid and mannosylerythritol lipid biosurfactants
by various microorganisms. Apart from various vegetable oils, oil wastes from
vegetable oil refineries and the food industry were also reported as good substrates for
biosurfactant production. In addition, industrial oil wastes such as tallow, soapstock,
marine oils, lard and free fatty acids can potentially induce microbial growth and
metabolite production owing to their typical fatty acid composition. Furthermore,
various waste oils with their origins at the domestic level, in vegetable oil refineries or
the soap industries were found to be suitable for microbial growth and biosurfactant
production (Haba et al., 2000; Abalos et al., 2001; Benincasa et al., 2002; Bednarski
et al., 2004; Benincasa et al., 2004; Nitschke et al., 2005).
These oils and oil wastes are readily available in good amounts throughout the
world. However, the oils used to date for biosurfactant production are mostly edible
oils and are not cheap. Several plant-derived oils, for example, jatropha oil, mesua oil,
castor oils, ramtil oil and jojoba oil, are not suitable for human consumption due to
their unfavourable odour, colour and composition and are, therefore, available at
much cheaper rates. Incorporation of these cheaper oils and oil wastes in the industrial
production media might potentially reduce the overall costs of biosurfactant
production.
Literature Review
2.5.1.1.2. Olive oil mill waste effluent (OMWE):
which is estimated at over 2.5 million metric tons per year with about 75% being
produced in the European Union. The process of olive oil extraction results in a large
amount of liquid waste. OMWE are characterized by an intensive dark brown color, a
strong acidic smell and a high organic content (COD 220 g/l). OMWE is a black
liquor and consists of a high content of organic matter (20-60 kg COD/m3), depending
on the olive oil extraction procedure (Marques, 2001). OMWE contains toxic
substances such as polyphenols (Hamman et al., 1999) making it unsuitable for
human consumption in raw or processed form but has valuable organic substances
such as sugars, nitrogen compounds, organic acids and residual oils which aid
microbial growth. The large diversity of components found in OMWE (carbohydrates,
polysaccharides, sugars, lipids and phenolic compounds) makes their treatment
difficult, and their disposal becomes a critical environmental problem (Niaounakis
and Halvadakis, 2004).
Thus, utilization of these materials is important from both environmental and
economical points of view and can be considered not only as a waste to be treated but
also a resource to be recovered. The use of fungi can lead to OMWE valorization
through the enzymes production (Crognale et al., 2006). The anaerobic treatment of
OMWE can also represent an effluent recovery and methane production. Yeasts can
also be used to degrade the phenolic compounds in OMWE. Specifically, Yarrowia
lipolytica strains are good candidates for the OMWE treatment and recovery
(Papanikolaou et al., 2008).
2.5.1.1.3. Starchy substrates:
Starchy waste materials are inexpensive raw materials suitable for the
production of surface active agents. A major source of inexpensive starchy substrate
is the potato processing industry. Potatoes are generally composed of 80% water, 17%
carbohydrates, 2% protein, 0.1% fat and 0.9% vitamins, inorganic minerals and trace
elements. They are a rich source of carbon (in the form of starch and sugars), nitrogen
and sulfur (from protein), inorganic minerals, trace elements and vitamins. Thompson,
(2000) reported the use of high solids (HS) and low solids (LS) potato effluents as
substrates for Surfactin production. Growth rate was higher in all HS- and LS-based
Literature Review
media than in the B-PS (biotic purified starch) control. Potato process effluents
(wastes from potato processing industries) can also be used to produce biosurfactant
by B. subtilis (Noah, 2005).
Cassava wastewater is another carbohydrate-rich residue generated in large
amounts during the preparation of cassava flour and is an attractive alternative
substrate in fermentation processes. It has been used for surfactin production by B.
subtilis (Nitschke and Pastore, 2006). Siddhartha et al. (2009) used Cassava
wastewater as a substrate for the simultaneous production of rhamnolipids and
polyhydroxyalkanoates by P. aeruginosa.
2.5.1.1.4. Enzymatic production of biosurfactants:
Polyglycerol and carbohydrate fatty acid esters are broadly used as industrial
detergents and as emulsifiers in a huge range of food formulations. Adelhorst et al.
(1990) have carried solvent-free esterification of simple alkyl-glycosides by means of
molten fatty acids and immobilized C. antarctica lipase. Fregapane et al. (1991)
obtained mono- and diesters of monosaccharides in elevated yields, with sugar acetyls
as preliminary resource.
Lipase from A. terreus synthesizes a biosurfactant by transesterification
involving natural oils and sugar alcohols (Yadav et al., 1997). Lipases may
furthermore substitute phospholipases in the production of lysophospholipids. Mucor
miehei lipase has been used for the transesterification of phospholipid in a variety of
primary- and secondary alcohols (Montet et al., 1990). Lipases may also be valuable
in the synthesis of an entire range of amphoteric biodegradable surfactants,
specifically amino acid-based esters and amides.
2.5.2. Industrial wastes from animal and plant origin
2.5.2.1. Animal fat:
Animal fat and tallow can be obtained in large quantities from meat processing
industries and have been used as a cooking medium for foods. Deshpande and
Daniels, (1995) used animal fat for the production of sophorolipids biosurfactant
production using the yeast, C. bombicola. When fat was provided as the sole carbon
source, the growth was poor. However, a mixture of 10% glucose and 10% fat gave
Literature Review
the highest level of growth indicating the requirement of an additional carbon source
in the medium.
2.5.2.2. Dairy Industry Whey:
The whey from dairy industries is also a cheap and viable substrate for
biosurfactant fermentation. About 6 liters of whey is produced per kg of paneer
(cheese). A large portion of whey from the organized dairy sector is not utilized and is
being disposed through the effluent treatment systems though it contains valuable
nutrients (proteins, peptides, amino acids, lipids, minerals and vitamins).Thus, the
effluent from the dairy industry, known as dairy wastewater supports good microbial
growth and can be used for biosurfactant production (Dubey and Juwarkar, 2004;
Siddhartha et al., 2009). Daniel et al. (1998) used dairy wastes as substrates and
achieved production of high concentrations of sophorolipids using two-stage
cultivation process for the yeast Cryptococcus curvatus ATCC 20509.
2.5.2.3. Molasses:
This is a co-product of sugar industry generated during sugar manufacturing
from either sugarcane or sugar beet and is a rich source of available carbon. Average
values for the constituents of cane molasses (75% dry matter) are: 48-56% (total
sugar), 9-12% (organic matter excluding sugar), 2.5% (protein), 1.5-5.0% (Potassium)
0.4-0.8% (Calcium), 0.06% (Magnesium), 0.06-2.0% (Phosphorus), 1.0-3.0 mg/kg
(biotin), 15-55 mg/kg (pantothenic acid), 2,500-6,000 mg/kg (inositol) and 1.8 mg/kg
(thiamine). Patel and Desai, (1997) used molasses and corn-steep liquor as the
primary carbon and nitrogen source to produce rhamnolipid biosurfactant using P.
aeruginosa (Strain GS3). The biosurfactant production reached a maximum when a
combination of 7% (v/v) molasses and 0.5% (v/v) corn-steep liquor waste used.
2.5.2.4. Soy Molasses:
Soy molasses is a cheap feedstock as it is a low-value co-product of soybean
processing and also rich in potentially fermentable sugar content and other growth
factors useful for sustaining microbial growth. As health-conscious consumers
continue to drive up the demands for soy protein-based foods and drinks, the soy
protein industry has experienced a sustained 10% annual growth for the past several
years with a market value of nearly $4 billion (Deak and Johnson, 2006). Thus, an
increasing amount of agricultural wastes from soy cultivation is becoming available
Literature Review
as a raw material for utilization in biosurfactant production. The major components of
the soluble carbohydrates in soy molasses are sucrose, raffinose and stachyose.
Investigators have demonstrated that soy molasses could be used in fermentation
processes to produce industrial chemicals such as lactic acid, butanol (Qureshi et al.,
2001), sophorolipids biosurfactant (Solaiman et al., 2004) and poly-
hydroxyalkanoates (Solaiman et al., 2006). Daniel et al. (1998) formulated a soy
molasses-based medium for reduced cost production of sophorolipids biosurfactant by
C . bombicola.
2.5.3. Other industrial wastes
2.5.3.1. Soap stock:
Soap stock is a gummy, amber colored by-product of oilseed processing
produced when hexane and other chemicals are used to extract and refine edible oil
from the oilseeds. It has been used to produce emulsan and bio-dispersan. Emulsan
forms and stabilizes oil-inwater emulsion, whereas bio-dispersan disperses the large
solid limestone granules, forming micrometer-size water suspension (Rosenberg et
al., 1988). P. aeruginosa strain LBI, isolated from petroleum contaminated soil, could
produce surface-active rhamnolipids biosurfactant (RLLBI) by batch fermentation in
a mineral salts medium with soapstock as the sole carbon source (Benincasa et al.,
2002). Biosurfactant production increased after nitrogen depletion and the maximum
rhamnolipids concentration was 15.9 g/l. RLLBI produced stable emulsions with
hydrocarbons (crude oil, kerosene, toluene, n-alkanes (C12-C14) and mineral oil) and
vegetable oils (linseed oil, almond oil).
2.6 Factors affecting biosurfactant production
2.6.1. Bio-process optimization
Type, quality and quantity of biosurfactant production is dependent on the
cultural conditions i.e. pH, temperature, agitation, aeration, dilution rate, the
concentration of metal ions, the nature of the carbon and nitrogen sources. There are
lots of studies regarding biosurfactant production relating the optimization of their
physicochemical properties (Sarubbo et al., 2001). Environmental factors are
exceptionally significant in the yield and characteristics of the biosurfactant produced.
Literature Review
In order to acquire large quantities of biosurfactant, it is essential to optimize the
process conditions.
Several elements, media compositions and precursors affect the process of
biosurfactant production. Different elements such as nitrogen, iron, and manganese
affect the production of biosurfactants. Limitation of nitrogen enhances biosurfactant
production in P. aeruginosa strain BS-2 (Dubey and Juwarkar, 2001) and U. maydis
(Hewald, 2005). Addition of iron and manganese to the culture medium increased the
production of biosurfactant by B. subtilis. The classical method of medium
optimization involves changing one variable at a time, while keeping the others at
fixed levels; however, this method is time consuming and does not guarantee the
optimal metabolite production.
A statistical optimization strategy response surface methodology (RSM) has
been developed for the optimization of process. RSM explores the relationships
between several explanatory variables and one or more response variables. This
method could be used to determine the optimum media, inoculum and environmental
conditions for the enhanced production of surfactin by B. subtilis (Sen and
Swaminathan, 2005). RSM has also been applied to enhance biosurfactant production
by P. aeruginosa AT10 (Abalos et al., 2002).
Such optimization methods would help the industry to design the best
combination of cheaper substrates for media production and to use the most favorable
environmental conditions for improved biosurfactant production. Current
developments in the area of optimization of fermentation conditions have resulted in a
considerable enhancement in production yields, making them more commercially
attractive.
2.6.2. Influence of the Culture Medium Composition on
Biosurfactant production
The use of different carbon sources alters the structure of the biosurfactant
produced and its properties and can be exploited to get products with desired
properties for particular applications. There are a number of studies in biosurfactant
production involving the optimization of their physicochemical properties (Sarubbo et
Literature Review
al., 2001; Sarubbo et al., 2006). The composition and characteristics of biosurfactants
are influenced by the nature of the nitrogen source as well as the presence of iron,
magnesium, manganese, phosphorus and sulphur in the media.
2.6.2.1. Carbon Source
Till date, biosurfactants are unable to compete inexpensively with chemically
synthesized compounds due to their high production costs and recovery system. These
costs may be significantly reduced by the use of alternative sources of nutrients.
Water-soluble carbon sources such as glycerol, glucose, mannitol, and ethanol were
all used for rhamnolipid production by Pseudomonas sp.
Biosurfactant product, however, was inferior to that obtained with water-
immiscible compounds such as n-alkanes and olive oil (Robert et al., 1989). Syldatk
et al., (1985a) demonstrated that although different carbon sources in the medium
affected the composition of biosurfactant production in Pseudomonas sp., substrates
with different chain lengths exhibited no effect on the chain length of fatty acid
moieties in glycolipids. On the other hand, Neidleman and Geigert, (1984) showed
evidence for qualitative variation, reflecting the carbon number of alkane for
biosurfactant production in Acinetobacter sp. strains H13-A and HO1-N, respectively.
When Arthrobacter paraffineus ATCC 19558 was grown on D-glucose,
supplementation with hexadecane in the medium during the stationary growth phase
resulted in a significant increase in biosurfactant yield (Duvnjak et al., 1982).
Others observed a little biosurfactant production, when cells were growing on
a readily available carbon source, only when all the soluble carbon was consumed and
when water-immiscible hydrocarbon was available was biosurfactant production
triggered (Banat et al., 1991; Banat, 1995).
Cavalero and Cooper, (2003) have shown that the sophorolipid yield from C.
bombicola ATCC 22214 increases with the n-alkane chain length (from C12 to C15).
This indicated that different microbes respond differently to the carbon sources. The
soy molasses, a byproduct from the production of soybean oil, plus oleic acid were
tested as carbon sources for the production of sophorolipids (SLs) by the yeast C.
bombicola (Solaiman et al., 2004). The purified SLs were obtained at 21 g/l and were
97% in lactone form. The surface properties of the SLs obtained from the soy
Literature Review
molasses/oleic acid fermentation had minimum surface-tension values of 37 mN/m
(pH 6) and 38 mN/m (pH 9), and critical micelle concentration values of 6 mg/l (pH
6) and 13 mg/l (pH 9).
The described C-sources, such as glucose, glycerol, acetates and other organic
acids, as well as pure n-alkanes are quite expensive and cannot reduce the cost of
biosurfactant production. An approach to lessen the cost is partial or complete
replacement of pure reagents with industrial/agricultural mixtures.
2.6.2.2. Nitrogen Source
Medium constituents other than carbon source also affect the production of
biosurfactants. Among the inorganic salts tested, ammonium salts and urea were
preferred nitrogen sources for biosurfactant production by Arthrobacter paraffineus,
whereas nitrate supported maximum surfactant production by Pseudomonas
aeruginosa (Guerra-Santos et al., 1986) and Rhodococcus sp. (Abu-Rawaida et al.,
1991a). Biosurfactant production by Arthrobacter paraffineus is increased by the
addition of amino acid such as aspartic acid, glutamic acid, asparagine, and glycine to
the medium.
Robert et al. (1989) and Abu-Ruwaida et al. (1991a), observed nitrate to be
the best source of nitrogen for biosurfactant production by Pseudomonas strain 44T1
and Rhodococcus strain ST-5 growing on olive oil and paraffin, respectivly. Similarly,
nitrogen limitation caused increased biosurfactant production in Pseudomonas
aeruginosa (Ramana and Karanth, 1989), Candida tropicalis IIP-4 (Singh et al.,
1990), and Nocardia strain SFC-D (Kosaric et al., 1990).
Syldatk et al. (1985b) showed that nitrogen limitation not only caused
overproduction of biosurfactant but also changed the composition of the biosurfactant
produced. Guerra-Santos et al. (1986), showed maximum rhamnolipid production
after nitrogen limitation at a C: N ratio of 16:1 to 18:1 and no surfactant production
below a C: N ratio of 11:1, where the culture was not nitrogen limited. According to
Hommel et al. (1987) it was the absolute quantity of nitrogen and not its relative
concentration that appeared to be important for optimum biomass yield, while
concentration of hydrophobic carbon source determines the conversion of carbon
available to the biosurfactant.
Literature Review
2.6.3. Environmental Factors Affecting the Production
Environmental factors are extremely important in the yield and characteristics
of the biosurfactant produced. In order to obtain large quantities of biosurfactant it is
necessary to optimize the process conditions because the production of a biosurfactant
is affected by variables such as pH, temperature, aeration and agitation speed.
2.6.3.1. pH
The pH of the medium plays an important role in sophorolipid production by
Torulopsis bombicola (Gobbert et al., 1984). Rhamnolipid production in
Pseudomonas sp. was at its maximum at a pH range from 6 to 6.5 and decrease
sharply above pH 7(Guerra-Santos et al., 1984). In contrast, Powalla et al. (1989)
showed that penta- and disaccharide lipid production in Nocardia corynbacteroides is
unaffected in the pH range of 6.5 to 8. In addition, surface tension and CMC of a
biosurfactant product remained stable over a wide range of pH values, whereas
emulsification had a narrower pH range (Abu-Rawaida et al., 1991b).
2.6.3.2. Temperature
In Arthrobacter paraffineus and Pseudomonas sp. strain DSM-2874 (Syldatk
et al., 1985b) temperature caused alteration in the composition of the biosurfactant
produced. A thermophilic Bacillus sp. grew and produced biosurfactant at temperature
above 40oC. Heat treatment of some biosurfactant caused no appreciable change in
biosurfactant properties such as the lowering of surface tension and interfacial tension
and the emulsification efficiency, all of which remained stable after autoclaving at
120 oC for 15 min (Abu Rawaida et al., 1991b).
2.6.3.3. Metal ion concentration
Metal ions concentrations play a very important role in the production of some
biosurfactants as they form important cofactors of many enzymes. The
overproduction of surfactin biosurfactant occurs in presence of Fe2+ in mineral salt
medium. The properties of surfactin are modified in the presence of inorganic cations
such as overproduction (Thimon et al., 1992).
Literature Review
2.6.3.4. Aeration and Agitation
An increase in agitation speed results in the reduction of biosurfactant yield
due to the effect of shear in Nocardia erythropolis (Margaritis et al., 1979). While
studying the mechanism of biosurfactant production in Acinetobacter calcoaceticus
RAG-1, Wang and Wang, (1990), revealed that the cell-bound polymer/dry-cell ratio
decrease as the shear stress increase. On the other hand, in yeast, biosurfactant
production increases when the agitation and aeration rates increased. Sheppard and
Cooper, (1990) had concluded that oxygen transfer was one of the Key parameters for
the process optimization and scale-up of surfactin production in Bacillus subtilis.
2.6.4. Product recovery
Even if optimum production is obtained using optimal media and cultural
conditions, the production process is still incomplete without an efficient and
economical means for the downstream processing. For many microbiological
products, the downstream processing costs account for 60% of the total production
costs. Several methods have been developed for improving the recovery of
Biosurfactants Table (2.2) (Saharan et al., 2011). These procedures take advantage of
some of the properties of biosurfactants such as their surface activity or their ability to
form micelles and are particularly applicable for large-scale continuous recovery of
extracellular biosurfactants from culture broth.
A few examples of such biosurfactant recovery strategies include foam
fractionation (Sarachat et al., 2010), ultra-filtration (Sen et al., 2010), adsorption-
desorption on polystyrene resins and ion exchange chromatography (Reiling, 1986),
and adsorption-desorption on wood-based activated carbon (WAC) (Dubey, 2005)
Ammonium sulphate precipitation and selective crystallization (Satpute et al., 2010).
Cheap and less toxic solvents such as methyl tertiary-butyl ether (MTBE) have been
successfully used in recent years to recover biosurfactants produced by Rhodococcus
(Kuyukina, 2001). These types of low cost, less toxic and highly available solvents
can be used to cut the recovery expenses substantially and minimize the
environmental hazards.
Literature Review
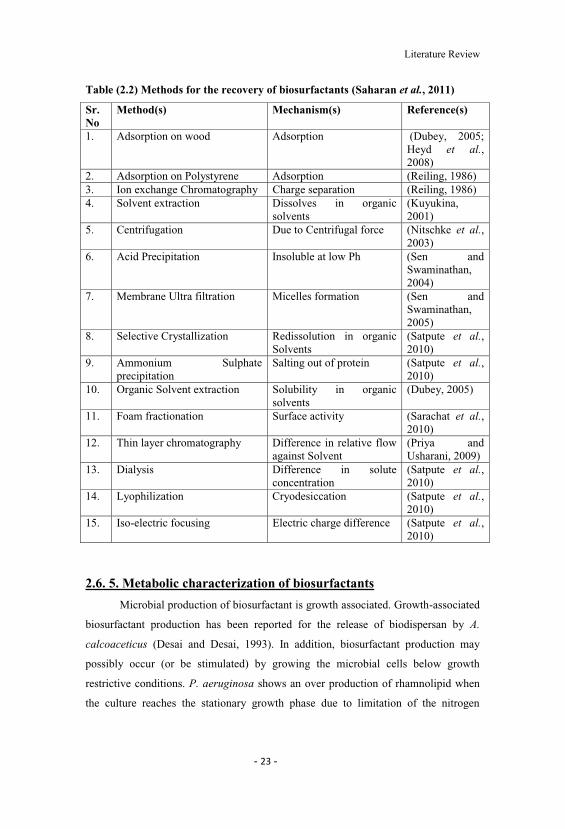
Table (2.2) Methods for the recovery of biosurfactants (Saharan et al., 2011)
Sr. No
Method(s) Mechanism(s) Reference(s)
1. Adsorption on wood Adsorption (Dubey, 2005;Heyd et al., 2008)
2. Adsorption on Polystyrene Adsorption (Reiling, 1986)3. Ion exchange Chromatography Charge separation (Reiling, 1986)4. Solvent extraction Dissolves in organic
solvents(Kuyukina,2001)
5. Centrifugation Due to Centrifugal force (Nitschke et al.,2003)
6. Acid Precipitation Insoluble at low Ph (Sen andSwaminathan,2004)
7. Membrane Ultra filtration Micelles formation (Sen andSwaminathan,2005)
8. Selective Crystallization Redissolution in organicSolvents
(Satpute et al.,2010)
9. Ammonium Sulphateprecipitation
Salting out of protein (Satpute et al.,2010)
10. Organic Solvent extraction Solubility in organicsolvents
(Dubey, 2005)
11. Foam fractionation Surface activity (Sarachat et al.,2010)
12. Thin layer chromatography Difference in relative flowagainst Solvent
(Priya andUsharani, 2009)
13. Dialysis Difference in soluteconcentration
(Satpute et al.,2010)
14. Lyophilization Cryodesiccation (Satpute et al.,2010)
15. Iso-electric focusing Electric charge difference (Satpute et al.,2010)
2.6. 5. Metabolic characterization of biosurfactants
Microbial production of biosurfactant is growth associated. Growth-associated
biosurfactant production has been reported for the release of biodispersan by A.
calcoaceticus (Desai and Desai, 1993). In addition, biosurfactant production may
possibly occur (or be stimulated) by growing the microbial cells below growth
restrictive conditions. P. aeruginosa shows an over production of rhamnolipid when
the culture reaches the stationary growth phase due to limitation of the nitrogen
Literature Review
source. Additionally, a direct relation exists between biosurfactant production and cell
growth along the fermentation process.
2.7 Improved Strains for Biosurfactant Production
One of the most important factors for economical production of biosurfactant
is use of mutant strain which may be hyper secretary or recombinant which can grow
on cheap raw material supported with efficient recovery process. The Pseudomonas
putida PCL1445 produces two cyclic lipopeptide biosurfactants, putisolvins I and II.
Studies on the regulation of putisolvin production indicate that dnak, together with the
dnaj and grpE heat shock genes were involved in the possible regulation (directly or
indirectly) of putisolvin biosynthesis at the transcription level. A gamma ray induced
mutant viz. B. subtilis AB01335-1M4 and B. subtilis AB02238-1R2 showed 5 and 3
times more Surfactin production, respectively, compared to parent strains when grown
on minimal medium (Bashandy et al., 2005).
Isolation of facultative anaerobic strain which could produce biosurfactant
with crude oil as carbon source and reduce surface tension from 16.36 mN/m to 6.49
mN/m has been reported (Liu and Li, 2005). They isolated the mutant of this strain by
both UV and EMS which could further reduce the surface tension by 32.8%.
2.8 Methods of Detection and Analysis of rhamnolipids
2.8.1. Qualitative Methods
Oil spreading test is a sensitive method for the rapid screening of RL
production by various isolates. In this assay a drop of bacterial supernatant is added
on top of an oil/ water interface (Morikawa et al., 2000). The presence of a surface-
active molecule will cause the oil to be repelled, forming a clearing zone whose
diameter can be correlated with the activity of the tensioactive compounds in the
supernatant.
A more precise approach based on the tensioactive properties of RLs is the
direct measurement of surface tension of culture broths. This method is typically
performed with a du Nouy-type tensiometer, which measures the force required to
pull a thin metal ring out of the surface of the solution. The measurement of the
surface tension after sequential dilution of the solution gives the concentration at
Literature Review
which the surface tension starts to increase and provides the CMC, which is specific
to each surfactant.
Thus, the degree of dilution required to attain the CMC allows for the
quantification of the surfactant in the initial solution (CMD Critical Micelle
Dilution). However, this method suffers from some drawbacks, as it is time-
consuming and not applicable to high-throughput screenings. In addition, as for all the
previous indirect tests based on surface tension, it will be affected by the presence of
tensioactive compounds other than RLs.
2.8.2. Quantitative Methods
2.8.2.1. Thin Layer Chromatography (TLC)
One of the problems of RL quantification is that these compounds are
produced as complex mixtures of congeners, in a medium that may contain many
other interfering compounds. RLs can be somewhat purified by simple extraction
methods, taking advantage of the fact that they are acidic and thus that they will
remain in the aqueous phase in basic medium, while being extractable by relatively
non polar solvents such as ethyl acetate or ethyl ether after acidification of the
aqueous solution. Nevertheless, such crude extracts are seldom pure enough to
gravimetrically quantify only RLs present in the broth. Thus, this requires a
preliminary separation step prior to quantification. TLC is not very sensitive
compared to those mentioned below. As an alternative, direct mass spectrometric
analysis of the eluted TLC plates can be performed using Fast Atom Bombardment
(FAB) to ionize the RLs prior to mass analysis (deKoster et al., 1994). Although this
method provides good structural information, it is not suitable for quantification
purposes.
2.8.2.2. Liquid Chromatography
High Performance Liquid Chromatography (HPLC) is especially well-suited
for RL analysis. It is generally performed using C8 or C18 reverse-phase columns with
a water/acetonitrile gradient. The main problem is the lack of standards to identify
each of the numerous RL congeners present in the culture medium. This can be
overcome by using a mass spectrometer as detector.
Literature Review
2.8.2.3. Liquid Chromatography Coupled to Mass Spectrometry
Direct coupling of reverse phase liquid chromatography to a mass
spectrometer provides the advantages of characterizing a given RL congener by its
retention time along with its mass spectral signature. This is normally done by
splitting the flow coming from the HPLC using a splitter that conveys only a fraction
of the eluent into the mass spectrometer. Electrospray Ionization (ESI), and
sometimes Atmospheric Pressure Chemical Ionization (APCI), has been mostly used
to ionize RLs prior to mass analysis (De´ziel et al., 1999, 2000; Haba et al., 2003a;
Benincasa et al., 2004; Monteiro et al., 2007). In negative ESI, the molecular weight
of the pseudomolecular ion [M-H]_ can be directly obtained. This provides some
information on the nature of the RL congener eluting from the column at that
retention time. In order to improve ionization, ammonium acetate is added to both
solvents of the water/acetonitrile gradient (De´ziel et al., 1999, 2000).
2.8.2.4. Other Spectroscopic Method
Infrared (IR) has been used mostly to quantify complex mixtures of congeners
(Gartshore et al., 2000). This approach is based on the relatively broad IR absorption
bands corresponding to various hydroxyl, ester, and carboxylic groups present in RLs.
This method has been used for the quantification of complex RL mixtures, but it
suffers from interferences by other constituents in the medium and of changes in pH.
Nuclear Magnetic Resonance (NMR) measures the absorption of radio frequencies for
various atoms exposed to a magnetic field. It provides very detailed information on
the chemical environment of atoms (the proton and 13C) within a molecule. This tool
has been used mostly for the structural analysis of purified congeners (Haba et al.,
2003; Monteiro et al., 2007) rather than for quantification of complex RL congener
mixtures.
2.9 Environmental Applications of Biosurfactants
As mentioned before biosurfactant are divided into low-molecular-mass
biosurfactants including glycolipids, phospholipids and lipopeptides and into high-
molecular-mass biosurfactants/bioemulsifiers containing amphipathic
polysaccharides, proteins, lipopolysaccharides, lipoproteins or complex mixtures of
these biopolymers. Low-molecular-mass biosurfactants are efficient in lowering
Literature Review
surface and interfacial tensions, whereas high-molecular-mass biosurfactants are more
effective at stabilizing oil-in-water emulsions (Rosenberg and Ron, 1999; Calvo et al.,
2009).
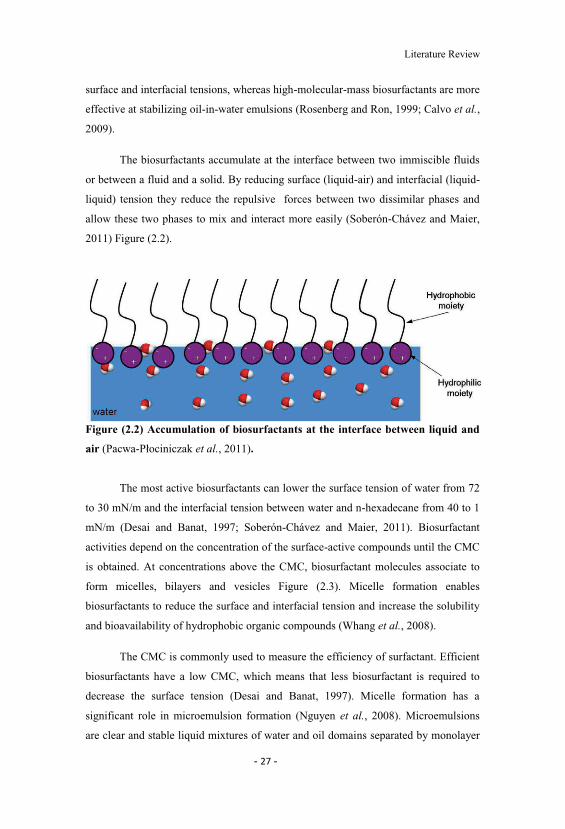
The biosurfactants accumulate at the interface between two immiscible fluids
or between a fluid and a solid. By reducing surface (liquid-air) and interfacial (liquid-
liquid) tension they reduce the repulsive forces between two dissimilar phases and
allow these two phases to mix and interact more easily (Soberón-Chávez and Maier,
2011) Figure (2.2).
Figure (2.2) Accumulation of biosurfactants at the interface between liquid and
air (Pacwa- et al., 2011).
The most active biosurfactants can lower the surface tension of water from 72
to 30 mN/m and the interfacial tension between water and n-hexadecane from 40 to 1
mN/m (Desai and Banat, 1997; Soberón-Chávez and Maier, 2011). Biosurfactant
activities depend on the concentration of the surface-active compounds until the CMC
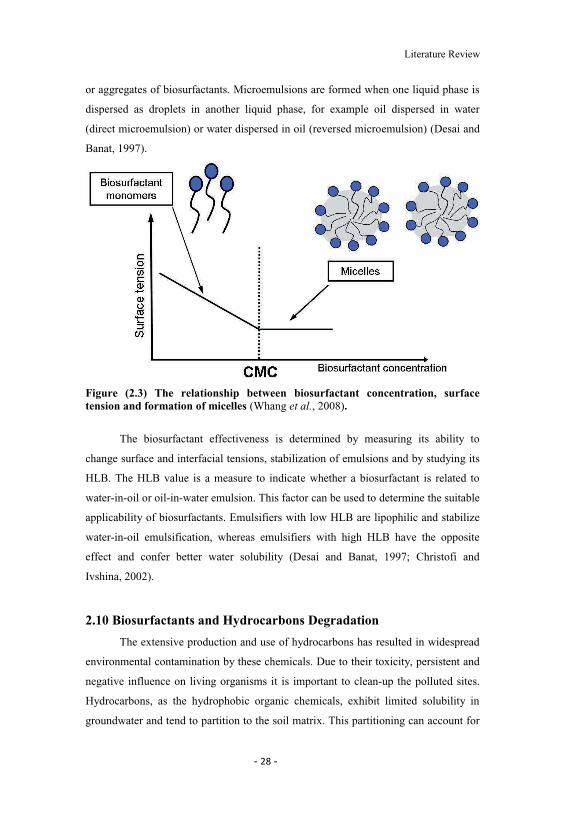
is obtained. At concentrations above the CMC, biosurfactant molecules associate to
form micelles, bilayers and vesicles Figure (2.3). Micelle formation enables
biosurfactants to reduce the surface and interfacial tension and increase the solubility
and bioavailability of hydrophobic organic compounds (Whang et al., 2008).
The CMC is commonly used to measure the efficiency of surfactant. Efficient
biosurfactants have a low CMC, which means that less biosurfactant is required to
decrease the surface tension (Desai and Banat, 1997). Micelle formation has a
significant role in microemulsion formation (Nguyen et al., 2008). Microemulsions
are clear and stable liquid mixtures of water and oil domains separated by monolayer
Literature Review
or aggregates of biosurfactants. Microemulsions are formed when one liquid phase is
dispersed as droplets in another liquid phase, for example oil dispersed in water
(direct microemulsion) or water dispersed in oil (reversed microemulsion) (Desai and
Banat, 1997).
Figure (2.3) The relationship between biosurfactant concentration, surfacetension and formation of micelles (Whang et al., 2008).
The biosurfactant effectiveness is determined by measuring its ability to
change surface and interfacial tensions, stabilization of emulsions and by studying its
HLB. The HLB value is a measure to indicate whether a biosurfactant is related to
water-in-oil or oil-in-water emulsion. This factor can be used to determine the suitable
applicability of biosurfactants. Emulsifiers with low HLB are lipophilic and stabilize
water-in-oil emulsification, whereas emulsifiers with high HLB have the opposite
effect and confer better water solubility (Desai and Banat, 1997; Christofi and
Ivshina, 2002).
2.10 Biosurfactants and Hydrocarbons Degradation
The extensive production and use of hydrocarbons has resulted in widespread
environmental contamination by these chemicals. Due to their toxicity, persistent and
negative influence on living organisms it is important to clean-up the polluted sites.
Hydrocarbons, as the hydrophobic organic chemicals, exhibit limited solubility in
groundwater and tend to partition to the soil matrix. This partitioning can account for
Literature Review
as much as 90 95% or more of the total contaminant mass. As a consequence, the
hydrocarbon contaminants exhibit moderate to poor recovery by physico-chemical
treatments; limited bioavailability to microorganisms; and limited availability to
oxidative and reductive chemicals when applied to in-situ and/or ex-situ applications.
2.10.1. Role of Biosurfactants in Biodegradation Processes
A promising method that can improve bioremediation effectiveness of
hydrocarbon contaminated environments is the use of biosurfactants. They can
enhance hydrocarbon bioremediation by two mechanisms. The first includes the
increase of substrate bioavailability for microorganisms, while the other involves
interaction with the cell surface which increases the hydrophobicity of the surface
allowing hydrophobic substrates to associate more easily with bacterial cells
(Mulligan and Gibbs, 2004).
By reducing surface and interfacial tensions, biosurfactants increase the
surface areas of insoluble compounds leading to increased mobility and
bioavailability of hydrocarbons. In consequence, biosurfactants enhance
biodegradation and removal of hydrocarbons. Addition of biosurfactants can be
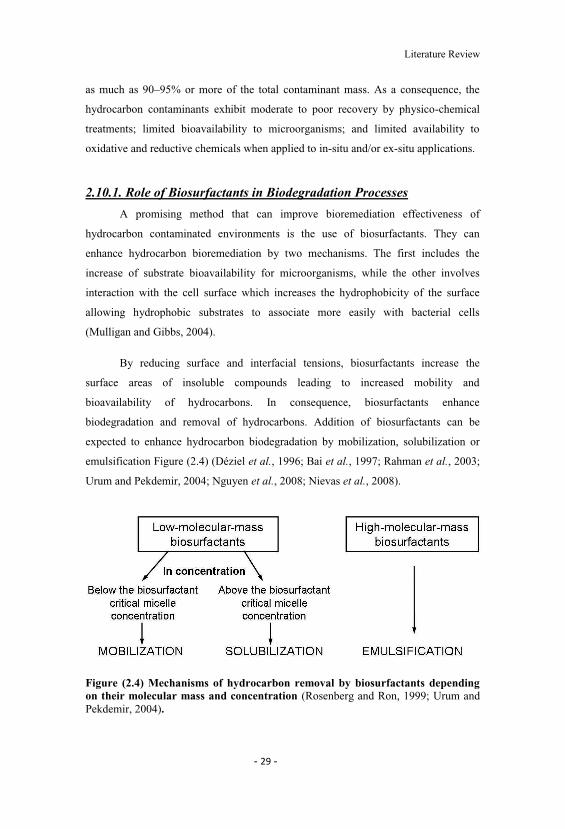
expected to enhance hydrocarbon biodegradation by mobilization, solubilization or
emulsification Figure (2.4) (Déziel et al., 1996; Bai et al., 1997; Rahman et al., 2003;
Urum and Pekdemir, 2004; Nguyen et al., 2008; Nievas et al., 2008).
Figure (2.4) Mechanisms of hydrocarbon removal by biosurfactants dependingon their molecular mass and concentration (Rosenberg and Ron, 1999; Urum andPekdemir, 2004).
Literature Review
The mobilization mechanism occurs at concentrations below the biosurfactant
CMC. At such concentrations, biosurfactants reduce the surface and interfacial
tension between air/water and soil/water systems. Due to the reduction of the
interfacial force, contact of biosurfactants with soil/oil system increases the contact
angle and reduces the capillary force holding oil and soil together. In turn, above the
biosurfactant CMC the solubilization process takes place. At these concentrations
biosurfactant molecules associate to form micelles, which dramatically increase the
solubility of oil. The hydrophobic ends of biosurfactant molecules connect together
inside the micelle while the hydrophilic ends are exposed to the aqueous phase on the
exterior. Consequently, the interior of a micelle creates an environment compatible
for hydrophobic organic molecules. The process of incorporation of these molecules
into a micelle is known as solubilization (Urum and Pekdemir, 2004).
Emulsification is a process that forms a liquid, known as an emulsion,
containing very small droplets of fat or oil suspended in a fluid, usually water. The
high molecular weight biosurfactants are efficient emulsifying agents. They are often
applied as an additive to stimulate bioremediation and removal of oil substances from
environments.
2.10.2. Biodegradation Studies
The capability of biosurfactants and biosurfactant-producing bacterial strains
by many authors (Déziel et al., 1996; Rahman et al., 2003; Inakollu et al., 2004).
Obayori et al. (2009) investigated the biodegradative properties of biosurfactant
produced by Pseudomonas sp. LP1 strain on crude oil and diesel. The results obtained
confirmed the ability of strain LP1 to metabolize the hydrocarbon components of
crude and diesel oil. They reported 92.34% degradation of crude oil and 95.29%
removal of diesel oil.
The effective microbiological method in bioremediation of hydrocarbon
polluted sites is the use of biosurfactant producing bacteria without necessarily
characterizing the chemical structure of the surface active compounds. The cell free
culture broth containing the biosurfactants can be applied directly or by diluting it
appropriately to the contaminated site. The other benefit of this approach is that the
Literature Review
biosurfactants are very stable and effective in the culture medium that was used for
their synthesis.
The usefulness of biosurfactant producing strains in bioremediation of sites
highly contaminated with crude petroleum-oil hydrocarbons was confirmed by Das
and Mukherjee, (2007). The ability of three biosurfactant producing strains: Bacillus
subtilis DM-04, Pseudomonas aeruginosa M and Pseudomonas aeruginosa NM to
remediate petroleum crude-oil contaminated soil samples was investigated by treating
the soil samples with aqueous solutions of biosurfactants obtained from the respective
bacteria strains. Additionally, the tested soil was inoculated with mineral-salts media
containing a specified amount of Bacillus subtilis DM-04 or Pseudomonas aeruginosa
M and NM strains. To determine the extent of biodegradation, the soil-phase total
petroleum hydrocarbons (TPH) concentrations were analyzed after 120 days and
compared to a control where the soil was treated with un-inoculated medium.
Biosurfactants have often been used to enhance bioavailability and
biodegradation of hydrophobic compounds but there is little knowledge available
about the effect of simultaneous emulsifier production on biodegradation of complex
hydrocarbon mixtures. Nievas et al. (2008) studied the biodegradation of a bilge
waste which is a fuel oil-type complex residue produced in normal ship operations.
Bilge waste is a hazardous waste composed of a mixture of sea-water and
hydrocarbon residue, where n-alkanes, resolvent total hydrocarbons and unsolvent
complex mixture are the main constituents. Unsolvent complex mixture principally is
composed by branched and cyclic aliphatic hydrocarbons and aromatic hydrocarbons,
which usually show the greatest resistance to biodegradation. In their studies, they
investigated the biodegradation of an oily bilge wastes by an emulsifier-producing
microbial consortium. As the result for both levels of oily wastes, 136 g/kg of
resolvent hydrocarbons and 406 g/kg of unsolvent mixture, they found that all of the
hydrocarbon types showed an important concentration reduction from their initial
values. They observed that the extent of biodegradation followed the order n-alkanes
> resolved total hydrocarbon > unsolvent complex mixture. An emulsifier-producing
microbial consortium used for biodegradation of bilge wastes showed reduction of n-
alkanes, resolvent hydrocarbons and unsolvent mixture around by 85%, 75% and
58%, respectively.
Literature Review
2.10.3. Soil Washing Technology
Soil washing technology is characterized by chemico-physical properties of
the biosurfactant and not by their effect on metabolic activities or changes in cell-
surface properties of bacteria (Banat et al., 2010). However, the processes may
enhance the bioavailability for bioremediation. Aqueous solutions of biosurfactants
can be also used to release compounds characterized by low solubility from soil and
other media in process called washing.
Lai et al. (2009) studied the ability of removing TPH from soil by two
biosurfactants: rhamnolipid and surfactin, and two synthetic surfactants: Tween 80
and Triton X-100. The TPH removal efficiency was examined for low TPH-
contaminated (LTC) and high TPH-contaminated (HTC) soils (containing 3000 and
9000 mg/kg dry soil of TPH, respectively) by washing them with (bio) surfactant
solutions. As a result, they observed that addition of 0.2 mass% of rhamnolipid,
surfactin, Triton X-100 and Tween 80 to LTC soil resulted in a TPH removal of 23%,
14%, 6% and 4%, respectively, while for HTC soil a significantly higher TPH
removal efficiency of 63%, 62%, 40% and 35%, respectively, was observed. These
results indicated that among four (bio) surfactants, rhamnolipid and surfactin showed
superior performance on TPH removal, compared to synthetic surfactants. The two
biosurfactants examined in this work have the potential to be used as biostimulation
agents for bioremediation of oil-polluted soils.
2.10.4. Microbial Enhanced Oil Recovery (MEOR)
Biosurfactants can also be involved in microbial enhanced oil recovery
(MEOR). MEOR methods are used to recover oil remaining in reservoirs after
primary (mechanical) and secondary (physical) recovery procedures (Banat et al.,
2000; Sen, 2008). It is an important tertiary process where microorganisms or their
metabolites, including biosurfactants, biopolymers, biomass, acids, solvents, gases
and also enzymes, are used to increase recovery of oil from depleted reservoirs.
Application of biosurfactants in enhanced oil recovery is one of the most
promising advanced methods to recover a significant proportion of the residual oil.
The remaining oil is often located in regions of the reservoir that are difficult to
access and the oil is trapped in the pores by capillary pressure (Sen, 2008).
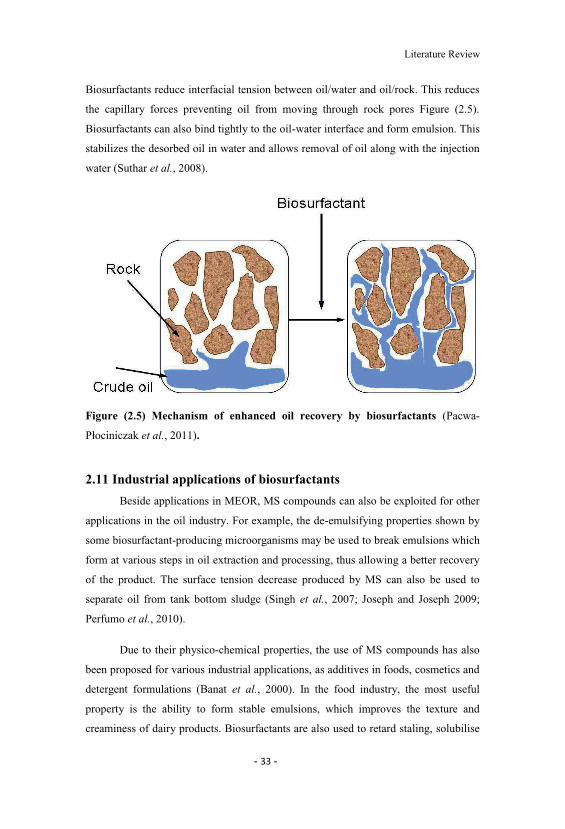
Literature Review
Biosurfactants reduce interfacial tension between oil/water and oil/rock. This reduces
the capillary forces preventing oil from moving through rock pores Figure (2.5).
Biosurfactants can also bind tightly to the oil-water interface and form emulsion. This
stabilizes the desorbed oil in water and allows removal of oil along with the injection
water (Suthar et al., 2008).
Figure (2.5) Mechanism of enhanced oil recovery by biosurfactants (Pacwa-
et al., 2011).
2.11 Industrial applications of biosurfactants
Beside applications in MEOR, MS compounds can also be exploited for other
applications in the oil industry. For example, the de-emulsifying properties shown by
some biosurfactant-producing microorganisms may be used to break emulsions which
form at various steps in oil extraction and processing, thus allowing a better recovery
of the product. The surface tension decrease produced by MS can also be used to
separate oil from tank bottom sludge (Singh et al., 2007; Joseph and Joseph 2009;
Perfumo et al., 2010).
Due to their physico-chemical properties, the use of MS compounds has also
been proposed for various industrial applications, as additives in foods, cosmetics and
detergent formulations (Banat et al., 2000). In the food industry, the most useful
property is the ability to form stable emulsions, which improves the texture and
creaminess of dairy products. Biosurfactants are also used to retard staling, solubilise
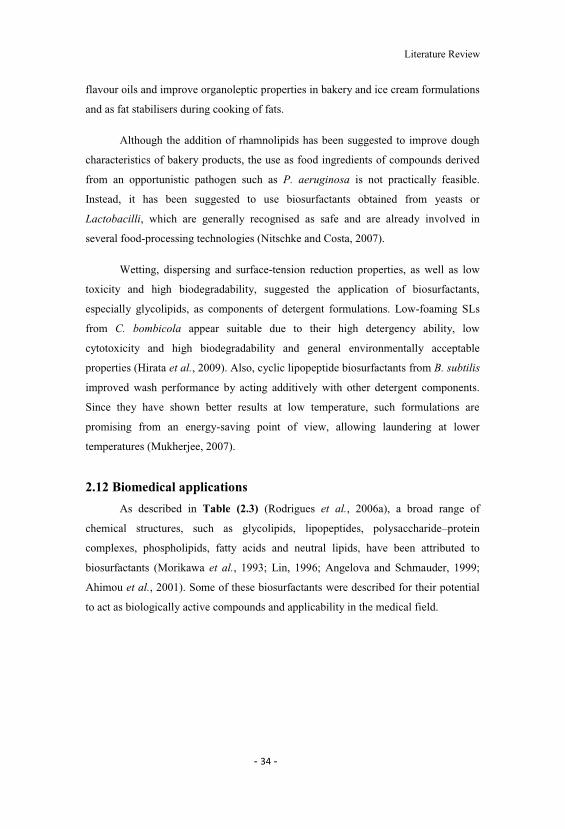
Literature Review
flavour oils and improve organoleptic properties in bakery and ice cream formulations
and as fat stabilisers during cooking of fats.
Although the addition of rhamnolipids has been suggested to improve dough
characteristics of bakery products, the use as food ingredients of compounds derived
from an opportunistic pathogen such as P. aeruginosa is not practically feasible.
Instead, it has been suggested to use biosurfactants obtained from yeasts or
Lactobacilli, which are generally recognised as safe and are already involved in
several food-processing technologies (Nitschke and Costa, 2007).
Wetting, dispersing and surface-tension reduction properties, as well as low
toxicity and high biodegradability, suggested the application of biosurfactants,
especially glycolipids, as components of detergent formulations. Low-foaming SLs
from C. bombicola appear suitable due to their high detergency ability, low
cytotoxicity and high biodegradability and general environmentally acceptable
properties (Hirata et al., 2009). Also, cyclic lipopeptide biosurfactants from B. subtilis
improved wash performance by acting additively with other detergent components.
Since they have shown better results at low temperature, such formulations are
promising from an energy-saving point of view, allowing laundering at lower
temperatures (Mukherjee, 2007).
2.12 Biomedical applications
As described in Table (2.3) (Rodrigues et al., 2006a), a broad range of
chemical structures, such as glycolipids, lipopeptides, polysaccharide protein
complexes, phospholipids, fatty acids and neutral lipids, have been attributed to
biosurfactants (Morikawa et al., 1993; Lin, 1996; Angelova and Schmauder, 1999;
Ahimou et al., 2001). Some of these biosurfactants were described for their potential
to act as biologically active compounds and applicability in the medical field.
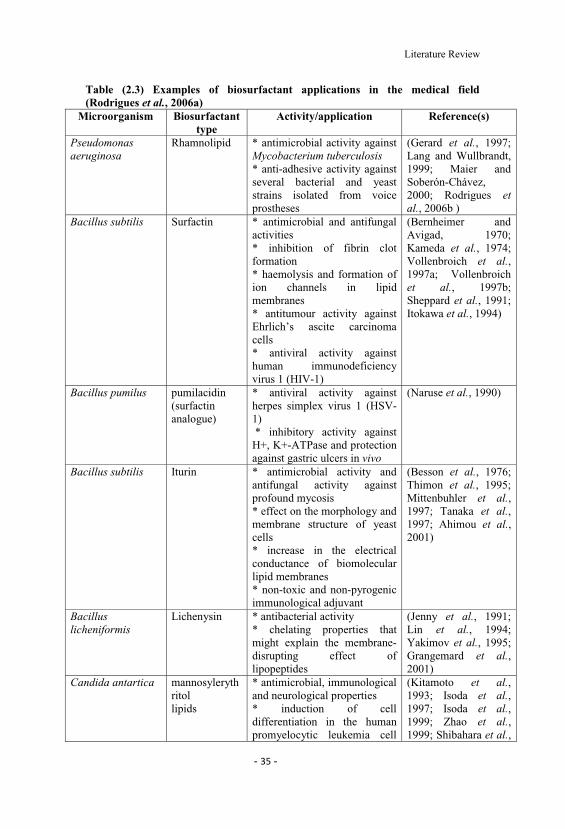
Literature Review
Table (2.3) Examples of biosurfactant applications in the medical field(Rodrigues et al., 2006a)
Microorganism Biosurfactanttype
Activity/application Reference(s)
Pseudomonasaeruginosa
Rhamnolipid * antimicrobial activity againstMycobacterium tuberculosis * anti-adhesive activity againstseveral bacterial and yeaststrains isolated from voiceprostheses
(Gerard et al., 1997;Lang and Wullbrandt,1999; Maier andSoberón-Chávez,2000; Rodrigues etal., 2006b )
Bacillus subtilis Surfactin * antimicrobial and antifungalactivities* inhibition of fibrin clotformation* haemolysis and formation ofion channels in lipidmembranes* antitumour activity against
cells* antiviral activity againsthuman immunodeficiencyvirus 1 (HIV-1)
(Bernheimer andAvigad, 1970;Kameda et al., 1974;Vollenbroich et al., 1997a; Vollenbroichet al., 1997b;Sheppard et al., 1991;Itokawa et al., 1994)
Bacillus pumilus pumilacidin(surfactinanalogue)
* antiviral activity againstherpes simplex virus 1 (HSV-1)* inhibitory activity againstH+, K+-ATPase and protectionagainst gastric ulcers in vivo
(Naruse et al., 1990)
Bacillus subtilis Iturin * antimicrobial activity andantifungal activity againstprofound mycosis* effect on the morphology andmembrane structure of yeastcells* increase in the electricalconductance of biomolecularlipid membranes* non-toxic and non-pyrogenicimmunological adjuvant
(Besson et al., 1976;Thimon et al., 1995;Mittenbuhler et al.,1997; Tanaka et al.,1997; Ahimou et al.,2001)
Bacilluslicheniformis
Lichenysin * antibacterial activity * chelating properties thatmight explain the membrane-disrupting effect oflipopeptides
(Jenny et al., 1991;Lin et al., 1994;Yakimov et al., 1995;Grangemard et al.,2001)
Candida antartica mannosylerythritollipids
* antimicrobial, immunologicaland neurological properties* induction of celldifferentiation in the humanpromyelocytic leukemia cell
(Kitamoto et al.,1993; Isoda et al.,1997; Isoda et al.,1999; Zhao et al.,1999; Shibahara et al.,
Literature Review
line HL60* induction of neuronaldifferentiation in PC12 cells
2000; Zhao et al.,2000; Wakamatsu etal., 2001)
Rhodococcuserythropolis
treahalose lipid * antiviral activity against HSVand influenza virus
(Uchida et al., 1989a;Uchida et al., 1989b)
Streptococcusthermophilus
Glycolipid * anti-adhesive activity againstseveral bacterial and yeaststrains isolated from voiceprostheses
(Busscher et al., 1994;Busscher et al., 1997;Busscher et al., 1999;Rodrigues et al.,2004; Rodrigues etal., 2006c)
Streptococcus mitis not identified * anti-adhesive activity againstStreptococcus mutans
(Pratt-Terpstra et al.,1989; Van Hoogmoedet al., 2000)
Lactobacillus Surlactin * anti-adhesive activity againstseveral pathogens includingenteric bacteria
(Reid et al., 1984;Velraeds et al., 1996a; Velraeds et al.,1996b ; Velraeds etal., 1997; Reid et al.,1999)
Lactococcus lactis not identified * anti-adhesive activity againstseveral bacterial and yeaststrains isolated from voiceprostheses
(Rodrigues et al.,2004a; Rodrigues etal., 2004b)
2.12.1. Antimicrobial activity of biosurfactants
The high demand for new antimicrobial agents following increased resistance
shown by pathogenic microorganisms against existing antimicrobial drugs has drawn
have been reported to be suitable alternatives to synthetic medicines and antimicrobial
agents and may therefore be used as effective and safe therapeutic agents (Banat et
al., 2000; Cameotra and Makkar, 2004; Singh and Cameotra, 2004).
Lipopeptides form the most widely reported class of biosurfactants with
antimicrobial activity. Surfactin, produced by B. subtilis, is the best-known
lipopeptide (Arima et al., 1968). Other antimicrobial lipopeptides include fengycin,
iturin, bacillomycins and mycosubtilins produced by B. subtilis (Vater et al., 2002).
Lichenysin, pumilacidin and polymyxin B (Naruse et al., 1990; Yakimov et al., 1995;
Grangemard et al., 2001; Landman et al., 2008) are other antimicrobial lipopeptides
produced by B. licheniformis, Bacillus pumilus and Bacillus polymyxa, respectively.
The production of antimicrobial lipopeptides by Bacillus probiotic products is one of
the main mechanisms by which they inhibit the growth of pathogenic microorganisms
Literature Review
in the gastrointestinal tract (Hong et al., 2005). Other reported biosurfactants having
antimicrobial activity are daptomycin, a cyclic lipopeptide from Streptomyces
roseosporus (Baltz et al., 2005), viscosin, a cyclic lipopeptide from Pseudomonas
(Neu et al., 1990; Saini et al., 2008), rhamnolipids produced by P. aeruginosa
(Abalos et al., 2001; Benincasa et al., 2004) and sophorolipids produced by C.
bombicola (Kim et al., 2002; Van Bogaert et al., 2007). Mannosylerythritol lipids
(MEL-A and MEL-B) produced by Candida antarctica strains have also been
reported to exhibit antimicrobial action against Gram-positive bacteria (Kitamoto et
al., 1993).
A rhamnolipid surfactant produced from soybean oil waste had antimicrobial
activity against several bacteria and fungi, namely Bacillus cereus, S. aureus,
Micrococcus luteus, Mucor miehei and Neurospora crassa (Nitschke et al., 2009).
Sophorolipids are also claimed to have activity against human
immunodeficiency virus (Shah et al., 2005). Similarly, a rhamonolipid and its
complex with alginate, both produced by a Pseudomonas sp. strain, showed
significant antiviral activity against herpes simplex virus types 1 and 2 (Remichkova
et al., 2008). The suppressive effect of the compounds on herpes simplex virus
replication was dose-dependent and occurred at concentrations lower than the CMC.
2.12.2. Biomedical and therapeutic applications of biosurfactants
Although there is an increasing potential for the application of biosurfactants
in the biomedical field, some of these molecules may pose a risk for humans. For
instance, P. aeruginosa is a bacterium responsible for severe nosocomial infections,
life threatening infections in immunocompromised persons and chronic infections in
cystic fibrosis patients; thus, rhamnolipids have to be well investigated prior to such
uses.
The virulence of a P. aeruginosa strain depends on a large number of cell-
associated and extracellular factors (Ishigami and Suzuki, 1997; Van Delden and
Iglewski, 1998; Ramisse et al., 2000). Cell-to-cell signalling systems control the
expression and allow a coordinated, cell-density-dependent production of many
extracellular virulence factors. The possible role of cell-to-cell signalling in the
Literature Review
pathogenesis of P. aeruginosa infections and a rationale for targeting cell-to cell
signalling systems in the development of new therapeutic approaches were discussed
by Van Delden and Iglewski, (1998). Synthesis of rhamnolipids is regulated by a very
complex genetic regulatory system that also controls different P. aeruginosa
virulence- associated traits (Maier and Soberón-Chávez, 2000).
The cosmetic and healthcare industries use large amounts of surfactants for a
wide variety of products, including insect repellents, antacids, acne pads, contact lens
solutions, hair colour and care products, deodorants, nail care products, lipstick, eye
shadow, mascara, toothpaste, denture cleaners, lubricated condoms, baby products,
foot care products, antiseptics and shaving and depilatory products (Kosaric, 1992).
Biosurfactants are known to have advantages over synthetic surfactants such
as low irritancy or anti-irritating effects and compatibility with skin. Rhamnolipids in
particular are being used as cosmetic additives and have been patented to make some
liposomes and emulsions, (Ishigami and Suzuki, 1997; Ramisse et al., 2000) both of
which are important in the cosmetic industry.
Materials and Methods
CHAPTER III
MATERIALS AND METHODS
3.1. Microorganisms and their isolation
The Microorganism used in all experiments was isolated by using Cetrimide
agar (Difco, U.S.A) from Compost pile waste collected from El-Sharkia region in
Delta, Egypt obtained in September 2010.
Cetrimide agar was melted and poured into separate sterile Petri dishes and
allowed to solidify. Thin layer of the compost pile was spread on the surface of
Cetrimide agar and incubated at 37oC for 24 hours and observed for signs of growth
and colony appearance.
The green colonies were picked with sterile inoculating wire and streaked on
the surface of MacConkey agar plates, labeled and incubated at 37oC for 24 hours and
observed for signs of growth and colony appearance.
White and golden to brown colonies on the MacConkey Agar plates were also
picked with sterile inoculating wire and streaked on the surface of blood agar plates,
labeled and incubated at 37oC for 24 hours.
The yellowish-green colonies observed were streaked onto nutrient agar slants
for various sub-cultures and incubated at 37oC for 24 hours and then kept (in the
refrigerator at -20oC) for further identification.
3.2. Identification of micro-organisms
3.2.1. Gram Stain
A clean grease free slide was obtained by cleaning with hot water and soap.
After which it was rinsed and the excess water blotted out with a lint-free cloth. A
drop of distilled water was placed on the slide and with the help of an inoculating
needle; the isolate picked from the surface of the agar plate was gently and thoroughly
emulsified in the drop of water and thinly spread on the glass slide. The smear was
dried in air and passed through a Bunsen flame to fix. It was then flooded with
Materials and Methods
ammonium oxalate crystal violet solution for about one minute and rinsed off with
washed off. The excess water was blotted off with bibulous paper and 95% ethyl
alcohol was applied and allowed to drain off until no more colour was seen leaving
the smear. It was again washed with water and Safranin was added and left for about
30 seconds. The contrast stain was then washed off and the smear dried in air (Harley
and Prescott, 1990). The slides were examined with the aid of a light microscope
(Olympus, Tokyo, Japan).
3.2.2. Biochemical Tests
Various biochemical tests were performed on the isolates to confirm their
identities. These included motility, catalase, oxidase, growth at 42oC and on Triple
Sugar Iron Agar.
3.2.2.1 Motility test
The suspected Pseudomonas isolates were inoculated into 10 ml nutrient
broths and incubated at 37 oC for 18-24 hours. Small drop of liquid bacterial culture
was placed in the centre of a cover slip and a small drop of water was placed at each
corner of the cover slip then a slide was inverted with a central depression over the
cover slip. The cover slip was stacked to the slide and when the slide was inverted the
drop of bacterial culture was suspended in the well (Health Protection Agency,
2010a). Motile organisms were examined using the light microscope (Olympus,
Tokyo, Japan).
3.2.2.2. Catalase test
A loopful of the isolate was streaked on nutrient agar and incubated at 37°C
for 24 hours. 0.2 ml of hydrogen peroxide solution was placed in a test tube. The
culture of the isolate was rubbed on the inside wall of the bottle above the surface of
the hydrogen peroxide solution and hydrogen peroxide solution was allowed to cover
the colony. A positive reaction was indicated by the appearance of vigorous bubbling
occurring within 10 seconds (Health Protection Agency, 2010b).
Materials and Methods
3.2.2.3. Oxidase production test
The oxidase reagent was prepared by dissolving 0.1 g of tetramethyl-p-
phenylenediamine in 10 ml of sterile distilled water. A loopful of the isolate was
streaked on nutrient agar and incubated at 37°C for 24 hours. Clean Whatman No.2
filter paper was placed in Petri dish and three drops of the freshly prepared oxidase
reagent added to it. The culture of the isolate was smeared across the impregnated
paper with a platinum loop (Harley and Prescott, 1990). A positive reaction was
indicated by the appearance of a dark purple colour on the paper within 10 seconds.
3.2.2.4. Growth at 42oC
The suspected Pseudomonas isolates were inoculated into 10 ml nutrient
broths and incubated at 42oC for 24 hours and observed for signs of growth (Hsueh et
al., 1998).
3.2.2.5. Reaction in Triple Sugar Iron Agar
The isolates grown on nutrient agar slants were picked with a sterile platinum
wire and then inoculated into triple sugar iron agar. The tubes were capped and
incubated at 37°C for 24 hours. A control of TSI Agar which was not inoculated was
also incubated alongside the tests (Mahon et al., 2007). After incubation, the tubes
were examined for the presence of sugar fermentation, gas and hydrogen sulfide
production (Harley and Prescott, 1990). A yellow butt and yellow slant due to the
fermentation of lactose, sucrose and glucose was recorded as a positive test.
3.2.3. API 20E Identification for selected isolate
The API20E strip (this strip is the same one used for the identification of
Enterobacteriaceae) contains 20 microtubes with substrates for the following 23 tests:
0-nitrophenyl- -D-galactosidase (ONPG); arginine dihydrolase; lysine and ornithine
decarboxylase; citrate utilization; hydrogen sulfide; urease; tryptophan deaminase;
indole; Voges-Proskauer (acetoin); gelatin liquefaction; fermentation of the
carbohydrates glucose, mannitol, inositol, sorbitol, rhamnose, sucrose, melibiose,
amygdalin, and arabinose; nitrate reduction and nitrogen gas production, tested in the
glucose microtube; and catalase production, in any other carbohydrate microtube. A
Materials and Methods
complete description of the strip is given in other reports (Washington et al., 1971;
Smith et al., 1972; Brooks et al., 1974; Nord et al., 1974).
Twenty-two of the initial tests were checked and recorded after 24 h of
incubation and again at 48 h. At this point, reagents were added for the five remaining
tests (tryptophan deaminase, indole, Voges-Proskauer, nitrate reduction, and nitrogen
gas production), and those results were recorded. The Analytical Profile Index and (if
necessary) the computer service were consulted for identification of the isolates.
When indicated, supplemental tests recommended by the manufacturer for
identification were done using conventional media. When sufficient reactions were
clear at 24 h, identification was determined on those readings.
3.2.4. 16S rRNA gene sequence analysis for selected isolate
For molecular identification, the selected bacterial isolate was referred for 16S
rRNA gene sequence analysis. DNA extraction was performed from 2 ml bacterial
cultures collected at the mid-exponential growth phase using Roche Kit (Germany)
according to the manufacturer's instructions and run in triplicate through polymerase
chain reaction (PCR). Three sets of primers are listed in Table (3.1).
V3 and V6 primers were used to amplify the V3 and V6; the most two
relevant hyper variable regions of the bacterial 16S rRNA gene, giving a product of
203 and 124 bp, respectively (Chakravorty et al. 2007). The reaction was carried out
Pfu DNA polymerase (Fermentas, St. Leon-Rot, Germany)
and 1 ng of template DNA. PCR amplification was performed as following: initial
denaturation at 95°C for 5 min, followed by 25 cycles each of 94°C for 1 min, 55°C
of annealing for 45 s, and a 45 s extension at 72°C. The 203 and 124 bp PCR products
amplified from the bacterial isolate which appeared as a single band were purified
using a High Pure PCR product purification kit (Roche Applied Science, Germany)
and sequenced on an ABI Prism 377 automatic sequencer (Applied Biosystems, CA,
USA). Sequence homologies were examined using BLAST version 2.2.12 of the
National Center for Biotechnology Information (Altschul et al. 1990). Multiple
sequence alignments were carried out using ClastalW and a consensus neighbor-
joining tree was constructed using Molecular Evolutionary Genetics Analysis
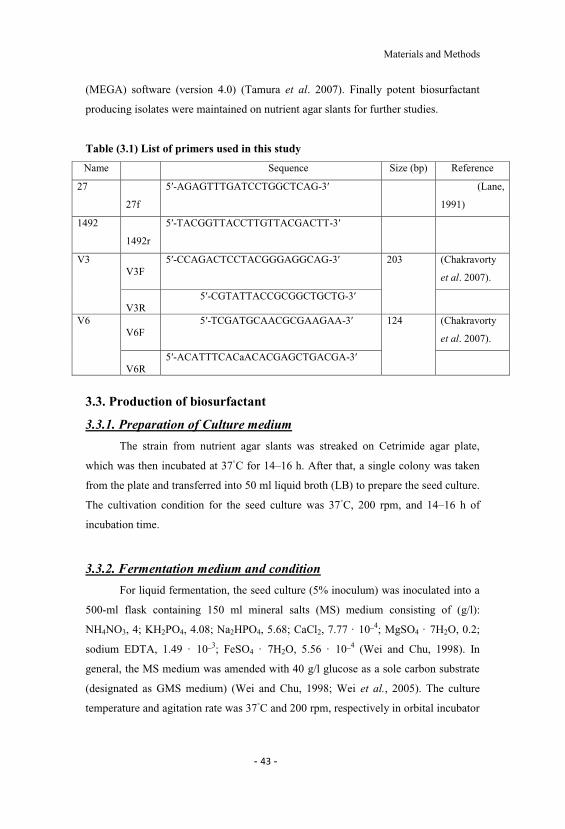
Materials and Methods
(MEGA) software (version 4.0) (Tamura et al. 2007). Finally potent biosurfactant
producing isolates were maintained on nutrient agar slants for further studies.
Table (3.1) List of primers used in this study
Name Sequence Size (bp) Reference
27 2
27f
-AGAGTTTGATCCTGGCTCAG- (Lane,
1991)
1492
1492r
-TACGGTTACCTTGTTACGACTT-
V3 VV3F
-CCAGACTCCTACGGGAGGCAG- 203 (Chakravorty
et al. 2007).
VV3R
-CGTATTACCGCGGCTGCTG-
V6 VV6F
-TCGATGCAACGCGAAGAA- 124 (Chakravorty
et al. 2007).
VV6R
-ACATTTCACaACACGAGCTGACGA-
3.3. Production of biosurfactant
3.3.1. Preparation of Culture medium
The strain from nutrient agar slants was streaked on Cetrimide agar plate,
which was then incubated at 37 C for 14 16 h. After that, a single colony was taken
from the plate and transferred into 50 ml liquid broth (LB) to prepare the seed culture.
The cultivation condition for the seed culture was 37 C, 200 rpm, and 14 16 h of
incubation time.
3.3.2. Fermentation medium and condition
For liquid fermentation, the seed culture (5% inoculum) was inoculated into a
500-ml flask containing 150 ml mineral salts (MS) medium consisting of (g/l):
NH4NO3, 4; KH2PO4, 4.08; Na2HPO4, 5.68; CaCl2, 7.77 · 10_4; MgSO4 · 7H2O, 0.2;
sodium EDTA, 1.49 · 10_3; FeSO4 · 7H2O, 5.56 · 10_4 (Wei and Chu, 1998). In
general, the MS medium was amended with 40 g/l glucose as a sole carbon substrate
(designated as GMS medium) (Wei and Chu, 1998; Wei et al., 2005). The culture
temperature and agitation rate was 37 C and 200 rpm, respectively in orbital incubator
Materials and Methods
SI50 (Stuart Scientific, UK) for 7 days. The pH of the medium was initially adjusted
to 6.8 by 1.0 M HCl.
3.4. Dried weight cell determination
After cultivation for 7 days, the collected fermentation broth was first
centrifuged at 9000g for 15 min to remove bacterial cells. 50 ml of the filtrate was
taken to detect surface tension, emulsification index, and oil displacement test which
will be described later. The removed bacterial cells were collected and placed in an
oven at 110 oC for 12 h to obtain a dried weight reported in terms of g/l, which is used
to express the microbial concentration.
3.5. Extraction of the produced biosurfactants
The pH of the remaining supernatant was adjusted to pH 2.0 with 1N HCl to
precipitate rhamnolipid. The precipitate was harvested by centrifugation (9000g, 20
min) and was then extracted three times with ethyl acetate at room temperature. The
organic phase was collected and the solvent was removed in a rotary evaporator,
allowing the yield of viscous honey-colored rhamnolipid product (Rotary vacuum
evaporator RE 10, Bibby Co., UK) (Chen et al., 2005; Wei et al., 2005).
3.6. Optimization of Biosurfactant Production
Type, quality and quantity of biosurfactant production is dependent on the
cultural conditions i.e. pH, temperature, agitation, aeration, dilution rate, the
concentration of metal ions, the nature of the carbon and nitrogen sources.
3.6.1. Optimum Carbon Substrate
For the experiments exploring the effect of carbon substrates on rhamnolipid
production, the carbon source in GMS medium (i.e., glucose) was replaced by
glycerol (40 g/l), sucrose (40 g/l), hexane (40 g/l), olive oil (80 g/l) and oleic acid (80
g/l) (Wu et al. 2008). Growth studies were done in 500-ml flasks containing 150 ml
medium at 37 C with pH 6.8 and shaking at 200 rpm for 7 days in orbital incubator
SI50. Experiment were done in duplicate and results reported as the average.
Biosurfactant production was monitored by measuring the weight and surface tension
of the partially purified biosurfactant.
Materials and Methods
3.6.2. Optimum Nitrogen Source
The nitrogen source in GMS medium (i.e. NH4NO3) was also replaced by
NH4Cl (50 mM), NaNO3 (50 mM), urea (50 mM), and yeast extract (10 g/l) to
investigate the effect of nitrogen source on rhamnolipid production. The concentration
of carbon and nitrogen source was identical to GMS medium, while that of oil and
yeast extract was determined according to the information from literature and
preliminary tests (Wu et al. 2008). The media was incubated at 37 C with pH 6.8 and
shaking at 200 rpm for 7 days in orbital incubator SI50.
3.6.3. Optimum pH
The optimum pH of MS medium for growth and biosurfactant production of
the tested bacterial isolates was investigated. The pHs tested were 4, 5, 6, 7, and 8.
The pH of the medium was adjusted using a solution of HCl or NaOH (1 M), with the
aid of a Sentron 2001 pH meter, and the inoculated medium was amended with
optimum carbon substrate and optimum nitrogen source.
3.6.4. Optimum Temperature
The growth and biosurfactant production of the isolated microorganisms were
monitored at a range of temperatures to determine the optimum one for each isolate.
The tested temperatures were 25, 30, 35, 37, 40 and 45oC. The inoculated medium
was adjusted to the optimum pH and supplied with the optimum carbon substrate and
optimum nitrogen source.
3.6.5. Optimum Agitation Rate
The growth and biosurfactant production of the isolated microorganisms were
monitored at a range of rpms to determine the optimum one for each isolate. The
tested rpms were 100, 150, 200, and 250 rpm. The inoculated medium was adjusted to
the optimum pH and supplied with the optimum carbon substrate and optimum
nitrogen source and adjusted at optimum temperature.
3.7. Purification of biosurfactant
The extracted viscous honey-colored rhamnolipid product was collected for
further purification using the chromatographic procedures. A 1.04 g sample of crude
Materials and Methods
biosurfactant was dissolved in chloroform, mixed with a small amount of silica gel 60
and dried with a rotary evaporator. The column (1.5cm×35 cm) was packed with
silica gel in hexane and not allowed to dry. The sample was applied on the surface of
the column and eluted with hexane. After that, it was eluted with solvents of gradually
increasing polarity: hexane > acetone > chloroform > chloroform:methanol (2:1, v/v)
>methanol (Darvishi et al., 2011).
Each fraction was evaporated with a rotary evaporator and its oil displacing
area was measured. The fractions that demonstrated the oil displacement test were
further separated by TLC using aluminum sheets of silica gel 60 F254 plates and a
chloroform:methanol:20% aqueous acetic acid (65:15:2) solvent system (Koch et al.,
1991). Rhamnolipids can be visualized using the orcinol test (Koch et al., 1991) or
Molisch test, with reagents specific for sugars or fatty acids or with reagents that are
used to reveal (Mechaly et
al., 1997).
3.8. Structural characterization of biosurfactant
The active fraction was analyzed by Fourier transform infrared spectroscopy
(FTIR), Nuclear magnetic resonance (1HNMR) and Electrospray ionisation mass
spectrometry (ESI MS).
3.8.1. Fourier transform infrared spectroscopy (FTIR)
FT-IR spectra of the dried biosurfactants were recorded on a Bruker 113V FT-
IR spectrometer equipped with a mercury cadmium telluride (MCT) detector cooled
with liquid N2. About 2mg of dried biomaterial was milled with 200mg of KBr to
form a very fine powder. This powder was then compressed into a thin pellet which
could be analyzed by FT-IR spectra measurement in wave number range of 4000 400
Cm 1 (Lotfabad et al., 2009). The analysis of IR spectra was carried out by using
OPUS 3.1 (Bruker Optics) software.
3.8.2. Nuclear magnetic resonance analysis
The 1H NMR spectra of fraction obtained from the fractionation step were
achieved from an FT NMR 500 mHz spectrometer (JEOL, JNM-A500) using
Materials and Methods
deuterated methanol as a solvent. The sample for analysis should be pure as possible
and free from insoluble and paramagnetic material (Pornsunthorntawee et al., 2008).
3.8.3. Electrospray ionisation mass spectrometry (ESI MS)
The analyses were performed with a triple Quadrupole Quattro LC
(Micromass, Manchester, UK) in negative-ion mode. 2 mg of rhamnolipid fraction
was dissolved in 1ml chloroform methanol (1:1, v/v), and aliquots of 0.1ml were
removed and diluted in 1.9 ml of acetonitrile water (7:3, v/v), which was introduced
by direct infusion with a syringe pump at a flow rate of 10µL min 1. ESI tandem mass
spectra were acquired by mass-selecting the target ion using a quadrupole mass
analyzer. The conditions of the analyses were: F1 capillary 2.03 kV, cone 15V and
collision energy 18V for collision induced dissociation (CID); F2 capillary 2.03 kV,
cone 27V and collision energy 45V for CID (Monteiro et al., 2007).
3.9. Physicochemical characterization
3.9.1. Oil displacement test
The oil displacement test is a method used to determine the surface activity by
measuring the diameter of the clear zone, which occurs after dropping a surfactant-
containing solution on a thin layer of oil on water. The binomial diameter allows an
evaluation of the surface tension reduction efficiency of a given biosurfactant
(Rodrigues et al., 2006d). The oil displacement test was done by adding 40 ml of
distilled water to a Petri dish with a diameter of 15 cm. After that, 15µl of crude oil
was dropped to form a thin oil layer on the surface of the water, and then 10µl of a
test solution was dropped onto the surface of oil. The test was conducted at room
temperature (25 27 C). The maximum diameter of the clear zone was observed under
light and measured. The larger the diameter of the clear zone, the higher the surface
activity of the test solution.
3.9.2. Surface tension measurement
The surface tension of the aqueous solution at different surfactant
concentrations was measured by Du-Nouy ring method with a Kruss Tensiometer
(Kruss, Hamburg, Germany). The surface tension measurement was carried out at 25
± 1 C after dipping the platinum ring in the solution for a while in order to attain
Materials and Methods
equilibrium conditions. The measurement was repeated three times and an average
value was obtained. CMC was then determined from the break point of the surface
tension versus its log of bulk concentration curve. For the calibration of the
instrument, the surface tension of the pure water was measured before each set of
experiments (Pornsunthorntawee et al., 2008).
3.9.3. Measurement of critical micelle concentration (CMC)
CMC is an important parameter during the evaluation of activity of
biosurfactant. The surface tension of surfactant reaches the lowest at its CMC. Above
this concentration, no further effect can be observed on the surface activity.
Measuring surface tension of serially diluted biosurfactant solution, the CMC was
determined by plotting the surface tension versus concentration of biosurfactant in the
solution. The determination of CMC was performed by several dilutions of crude
biosurfactant. These experiments were conducted in three independent replicates and
the results presented were the average data.
3.9.4. Determination of emulsification index
A mixture of 2 ml supernatant and 3 ml kerosene (or diesel) was vortically
stirred for 2 min and the height of emulsion layer was measured after 24 h to
determine the emulsification index (Cooper and Goldenberg, 1987; Wu et al., 2008).
The equation used to determine the emulsification index (E24 (%)) is as follows:
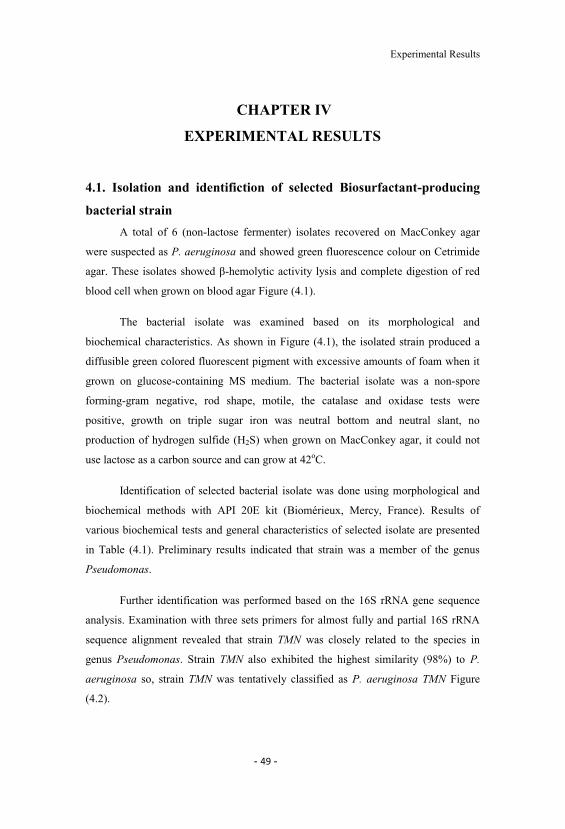
Experimental Results
CHAPTER IV
EXPERIMENTAL RESULTS
4.1. Isolation and identifiction of selected Biosurfactant-producing
bacterial strain
A total of 6 (non-lactose fermenter) isolates recovered on MacConkey agar
were suspected as P. aeruginosa and showed green fluorescence colour on Cetrimide
-hemolytic activity lysis and complete digestion of red
blood cell when grown on blood agar Figure (4.1).
The bacterial isolate was examined based on its morphological and
biochemical characteristics. As shown in Figure (4.1), the isolated strain produced a
diffusible green colored fluorescent pigment with excessive amounts of foam when it
grown on glucose-containing MS medium. The bacterial isolate was a non-spore
forming-gram negative, rod shape, motile, the catalase and oxidase tests were
positive, growth on triple sugar iron was neutral bottom and neutral slant, no
production of hydrogen sulfide (H2S) when grown on MacConkey agar, it could not
use lactose as a carbon source and can grow at 42oC.
Identification of selected bacterial isolate was done using morphological and
biochemical methods with API 20E kit (Biomérieux, Mercy, France). Results of
various biochemical tests and general characteristics of selected isolate are presented
in Table (4.1). Preliminary results indicated that strain was a member of the genus
Pseudomonas.
Further identification was performed based on the 16S rRNA gene sequence
analysis. Examination with three sets primers for almost fully and partial 16S rRNA
sequence alignment revealed that strain TMN was closely related to the species in
genus Pseudomonas. Strain TMN also exhibited the highest similarity (98%) to P.
aeruginosa so, strain TMN was tentatively classified as P. aeruginosa TMN Figure
(4.2).
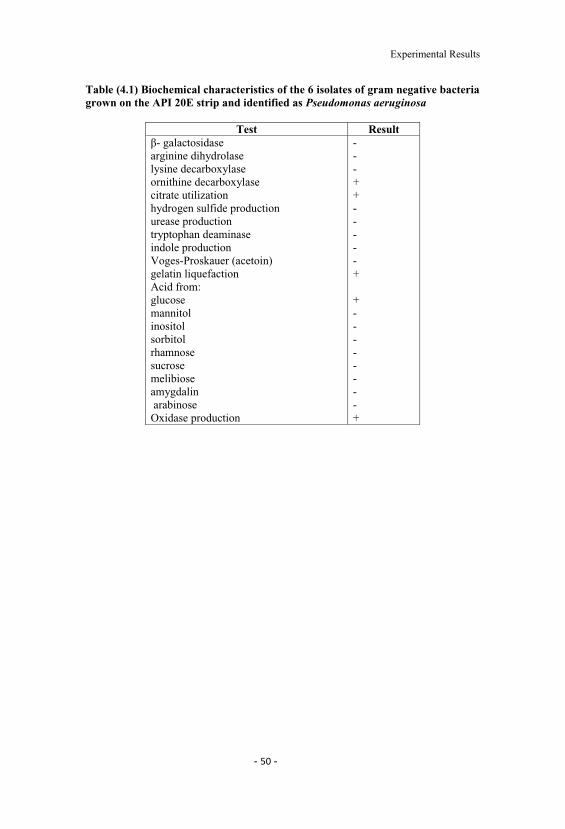
Experimental Results
Table (4.1) Biochemical characteristics of the 6 isolates of gram negative bacteriagrown on the API 20E strip and identified as Pseudomonas aeruginosa
Test Result- galactosidase
arginine dihydrolaselysine decarboxylaseornithine decarboxylasecitrate utilizationhydrogen sulfide productionurease productiontryptophan deaminaseindole productionVoges-Proskauer (acetoin)gelatin liquefactionAcid from:glucose mannitolinositol sorbitol rhamnose sucrosemelibioseamygdalinarabinoseOxidase production
---++-----+
+--------+
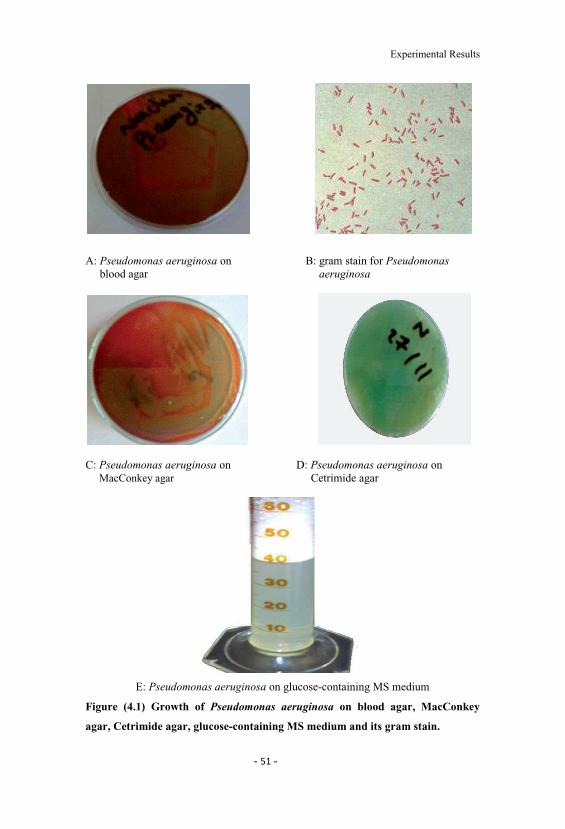
Experimental Results
A: Pseudomonas aeruginosa on B: gram stain for Pseudomonas blood agar aeruginosa
C: Pseudomonas aeruginosa on D: Pseudomonas aeruginosa on MacConkey agar Cetrimide agar
E: Pseudomonas aeruginosa on glucose-containing MS medium
Figure (4.1) Growth of Pseudomonas aeruginosa on blood agar, MacConkey
agar, Cetrimide agar, glucose-containing MS medium and its gram stain.
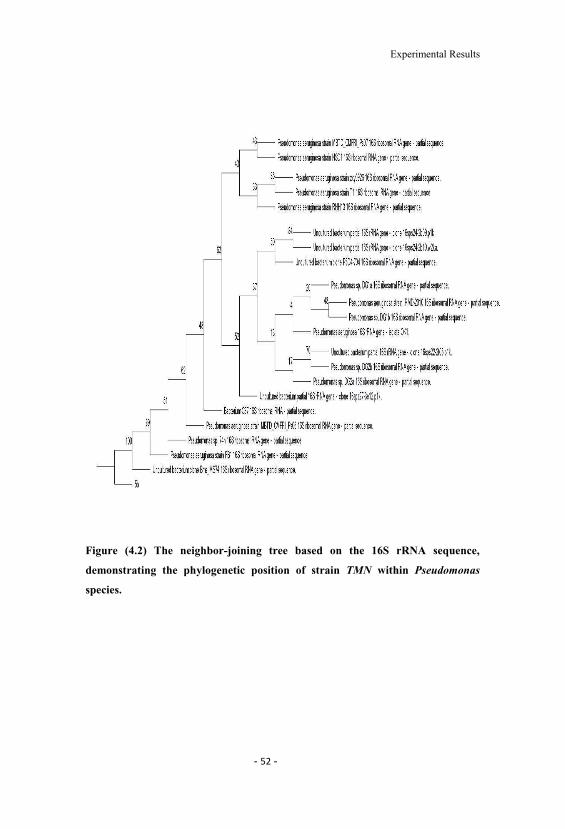
Experimental Results
Figure (4.2) The neighbor-joining tree based on the 16S rRNA sequence,
demonstrating the phylogenetic position of strain TMN within Pseudomonas
species.
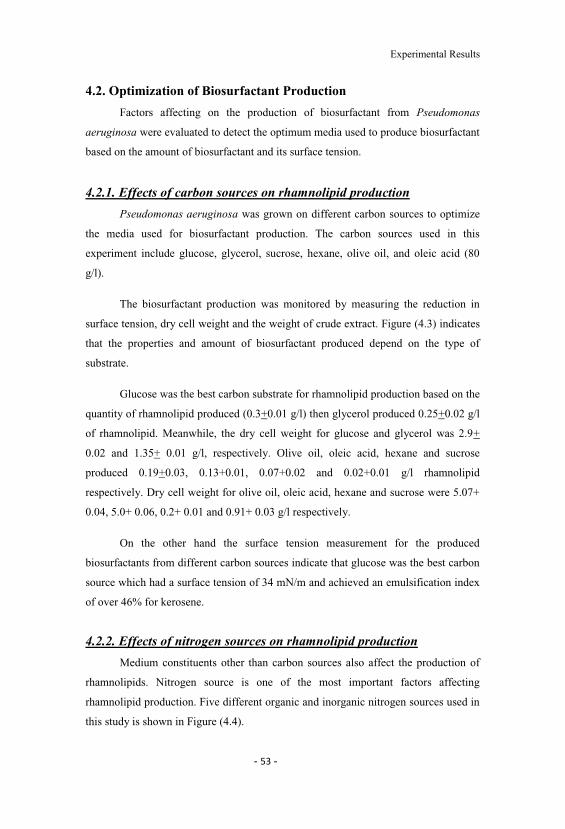
Experimental Results
4.2. Optimization of Biosurfactant Production
Factors affecting on the production of biosurfactant from Pseudomonas
aeruginosa were evaluated to detect the optimum media used to produce biosurfactant
based on the amount of biosurfactant and its surface tension.
4.2.1. Effects of carbon sources on rhamnolipid production
Pseudomonas aeruginosa was grown on different carbon sources to optimize
the media used for biosurfactant production. The carbon sources used in this
experiment include glucose, glycerol, sucrose, hexane, olive oil, and oleic acid (80
g/l).
The biosurfactant production was monitored by measuring the reduction in
surface tension, dry cell weight and the weight of crude extract. Figure (4.3) indicates
that the properties and amount of biosurfactant produced depend on the type of
substrate.
Glucose was the best carbon substrate for rhamnolipid production based on the
quantity of rhamnolipid produced (0.3+0.01 g/l) then glycerol produced 0.25+0.02 g/l
of rhamnolipid. Meanwhile, the dry cell weight for glucose and glycerol was 2.9+
0.02 and 1.35+ 0.01 g/l, respectively. Olive oil, oleic acid, hexane and sucrose
produced 0.19+0.03, 0.13+0.01, 0.07+0.02 and 0.02+0.01 g/l rhamnolipid
respectively. Dry cell weight for olive oil, oleic acid, hexane and sucrose were 5.07+
0.04, 5.0+ 0.06, 0.2+ 0.01 and 0.91+ 0.03 g/l respectively.
On the other hand the surface tension measurement for the produced
biosurfactants from different carbon sources indicate that glucose was the best carbon
source which had a surface tension of 34 mN/m and achieved an emulsification index
of over 46% for kerosene.
4.2.2. Effects of nitrogen sources on rhamnolipid production
Medium constituents other than carbon sources also affect the production of
rhamnolipids. Nitrogen source is one of the most important factors affecting
rhamnolipid production. Five different organic and inorganic nitrogen sources used in
this study is shown in Figure (4.4).
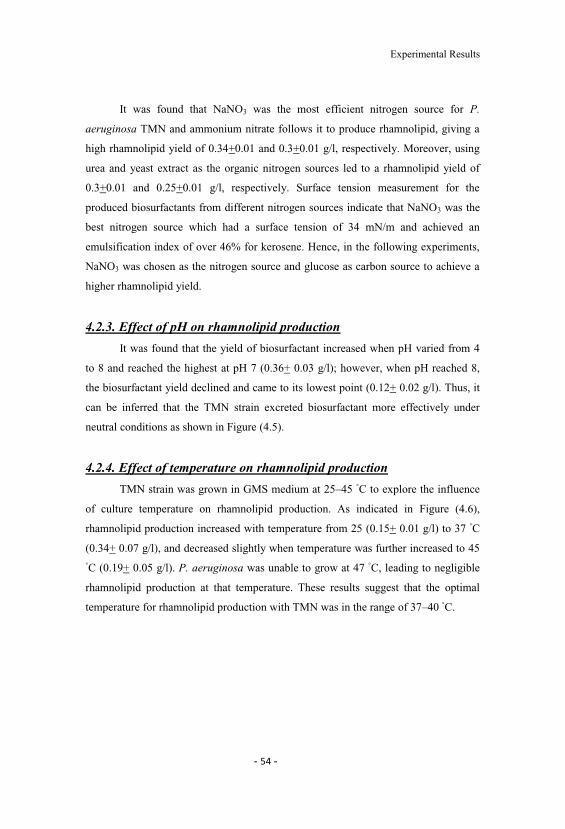
Experimental Results
It was found that NaNO3 was the most efficient nitrogen source for P.
aeruginosa TMN and ammonium nitrate follows it to produce rhamnolipid, giving a
high rhamnolipid yield of 0.34+0.01 and 0.3+0.01 g/l, respectively. Moreover, using
urea and yeast extract as the organic nitrogen sources led to a rhamnolipid yield of
0.3+0.01 and 0.25+0.01 g/l, respectively. Surface tension measurement for the
produced biosurfactants from different nitrogen sources indicate that NaNO3 was the
best nitrogen source which had a surface tension of 34 mN/m and achieved an
emulsification index of over 46% for kerosene. Hence, in the following experiments,
NaNO3 was chosen as the nitrogen source and glucose as carbon source to achieve a
higher rhamnolipid yield.
4.2.3. Effect of pH on rhamnolipid production
It was found that the yield of biosurfactant increased when pH varied from 4
to 8 and reached the highest at pH 7 (0.36+ 0.03 g/l); however, when pH reached 8,
the biosurfactant yield declined and came to its lowest point (0.12+ 0.02 g/l). Thus, it
can be inferred that the TMN strain excreted biosurfactant more effectively under
neutral conditions as shown in Figure (4.5).
4.2.4. Effect of temperature on rhamnolipid production
TMN strain was grown in GMS medium at 25 45 C to explore the influence
of culture temperature on rhamnolipid production. As indicated in Figure (4.6),
rhamnolipid production increased with temperature from 25 (0.15+ 0.01 g/l) to 37 C
(0.34+ 0.07 g/l), and decreased slightly when temperature was further increased to 45
C (0.19+ 0.05 g/l). P. aeruginosa was unable to grow at 47 C, leading to negligible
rhamnolipid production at that temperature. These results suggest that the optimal
temperature for rhamnolipid production with TMN was in the range of 37 40 C.
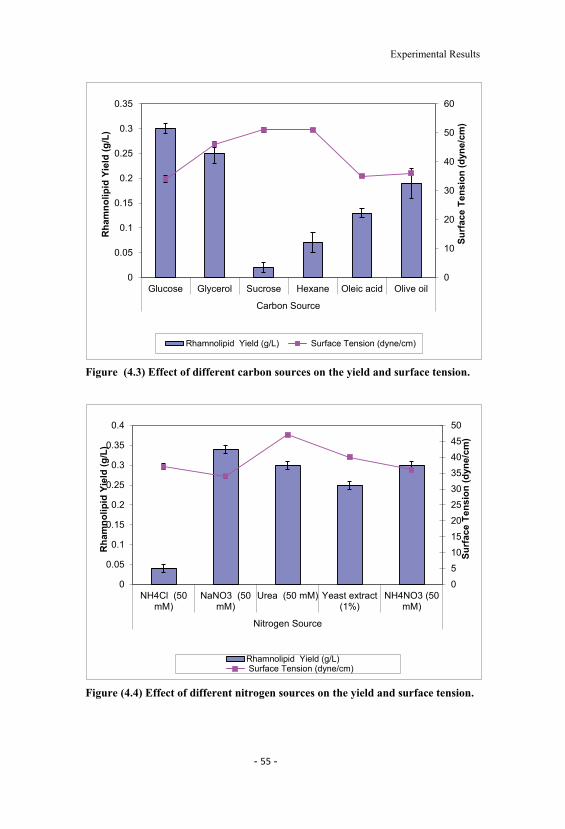
Experimental Results
Figure (4.3) Effect of different carbon sources on the yield and surface tension.
Figure (4.4) Effect of different nitrogen sources on the yield and surface tension.
0
10
20
30
40
50
60
0
0.05
0.1
0.15
0.2
0.25
0.3
0.35
Glucose Glycerol Sucrose Hexane Oleic acid Olive oil
Carbon Source
Surf
ace
Tens
ion
(dyn
e/cm
)
Rha
mno
lipid
Yiel
d (g
/L)
Rhamnolipid Yield (g/L) Surface Tension (dyne/cm)
0
5
10
15
20
25
30
35
40
45
50
0
0.05
0.1
0.15
0.2
0.25
0.3
0.35
0.4
NH4Cl (50mM)
NaNO3 (50mM)
Urea (50 mM) Yeast extract(1%)
NH4NO3 (50mM)
Nitrogen Source
Surf
ace
Tens
ion
(dyn
e/cm
)
Rha
mno
lipid
Yiel
d (g
/L)
Rhamnolipid Yield (g/L)Surface Tension (dyne/cm)
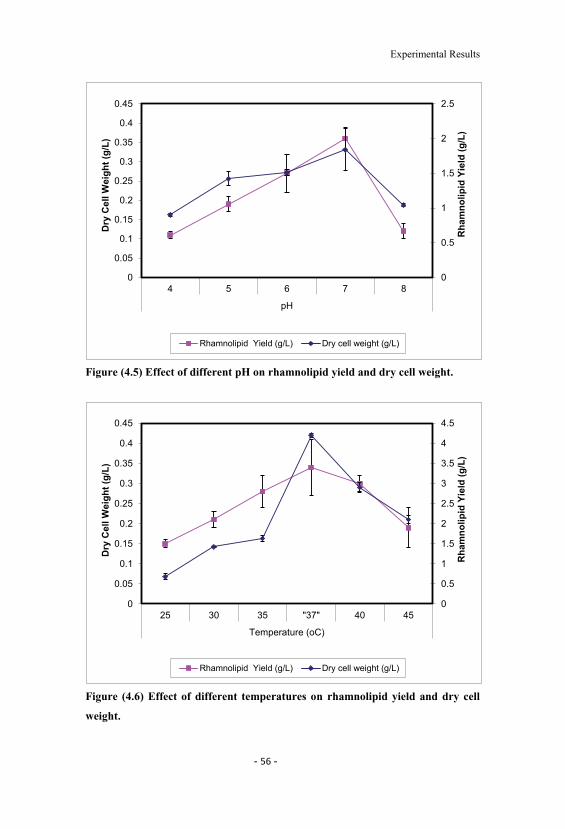
Experimental Results
Figure (4.5) Effect of different pH on rhamnolipid yield and dry cell weight.
Figure (4.6) Effect of different temperatures on rhamnolipid yield and dry cell
weight.
0
0.5
1
1.5
2
2.5
0
0.05
0.1
0.15
0.2
0.25
0.3
0.35
0.4
0.45
4 5 6 7 8
pH
Rha
mno
lipid
Yiel
d (g
/L)
Dry
Cel
lWei
ght (
g/L)
Rhamnolipid Yield (g/L) Dry cell weight (g/L)
0
0.5
1
1.5
2
2.5
3
3.5
4
4.5
0
0.05
0.1
0.15
0.2
0.25
0.3
0.35
0.4
0.45
25 30 35 "37" 40 45
Temperature (oC)
Rha
mno
lipid
Yiel
d (g
/L)
Dry
Cel
lWei
ght (
g/L)
Rhamnolipid Yield (g/L) Dry cell weight (g/L)
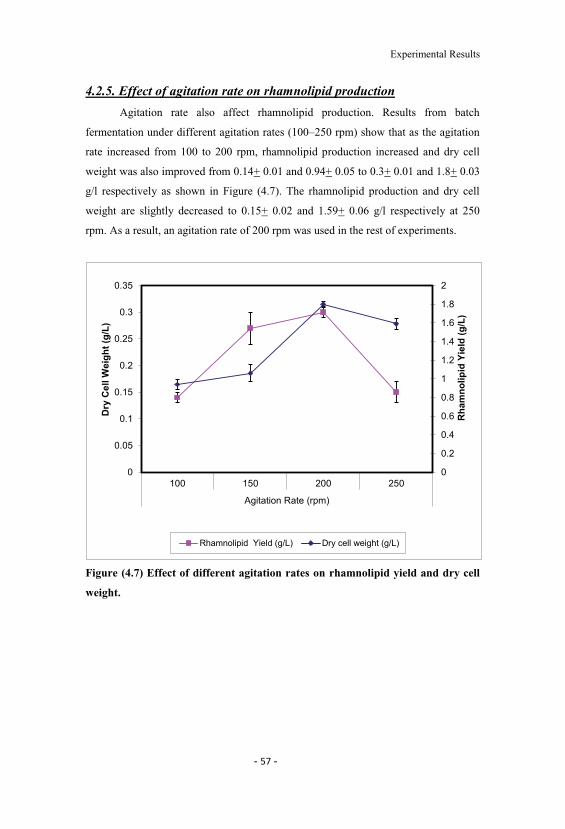
Experimental Results
4.2.5. Effect of agitation rate on rhamnolipid production
Agitation rate also affect rhamnolipid production. Results from batch
fermentation under different agitation rates (100 250 rpm) show that as the agitation
rate increased from 100 to 200 rpm, rhamnolipid production increased and dry cell
weight was also improved from 0.14+ 0.01 and 0.94+ 0.05 to 0.3+ 0.01 and 1.8+ 0.03
g/l respectively as shown in Figure (4.7). The rhamnolipid production and dry cell
weight are slightly decreased to 0.15+ 0.02 and 1.59+ 0.06 g/l respectively at 250
rpm. As a result, an agitation rate of 200 rpm was used in the rest of experiments.
Figure (4.7) Effect of different agitation rates on rhamnolipid yield and dry cell
weight.
0
0.2
0.4
0.6
0.8
1
1.2
1.4
1.6
1.8
2
0
0.05
0.1
0.15
0.2
0.25
0.3
0.35
100 150 200 250
Agitation Rate (rpm)
Rha
mno
lipid
Yiel
d (g
/L)
Dry
Cel
lWei
ght (
g/L)
Rhamnolipid Yield (g/L) Dry cell weight (g/L)
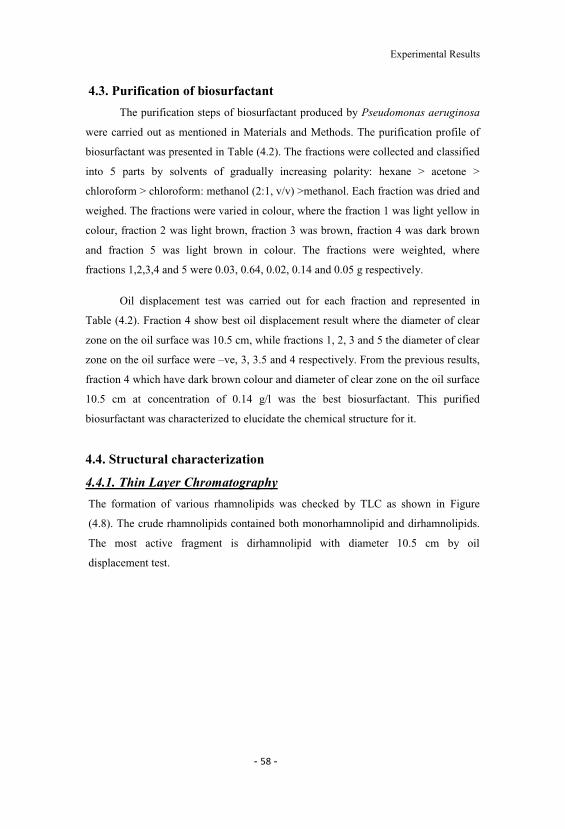
Experimental Results
4.3. Purification of biosurfactant
The purification steps of biosurfactant produced by Pseudomonas aeruginosa
were carried out as mentioned in Materials and Methods. The purification profile of
biosurfactant was presented in Table (4.2). The fractions were collected and classified
into 5 parts by solvents of gradually increasing polarity: hexane > acetone >
chloroform > chloroform: methanol (2:1, v/v) >methanol. Each fraction was dried and
weighed. The fractions were varied in colour, where the fraction 1 was light yellow in
colour, fraction 2 was light brown, fraction 3 was brown, fraction 4 was dark brown
and fraction 5 was light brown in colour. The fractions were weighted, where
fractions 1,2,3,4 and 5 were 0.03, 0.64, 0.02, 0.14 and 0.05 g respectively.
Oil displacement test was carried out for each fraction and represented in
Table (4.2). Fraction 4 show best oil displacement result where the diameter of clear
zone on the oil surface was 10.5 cm, while fractions 1, 2, 3 and 5 the diameter of clear
zone on the oil surface were ve, 3, 3.5 and 4 respectively. From the previous results,
fraction 4 which have dark brown colour and diameter of clear zone on the oil surface
10.5 cm at concentration of 0.14 g/l was the best biosurfactant. This purified
biosurfactant was characterized to elucidate the chemical structure for it.
4.4. Structural characterization
4.4.1. Thin Layer Chromatography
The formation of various rhamnolipids was checked by TLC as shown in Figure
(4.8). The crude rhamnolipids contained both monorhamnolipid and dirhamnolipids.
The most active fragment is dirhamnolipid with diameter 10.5 cm by oil
displacement test.
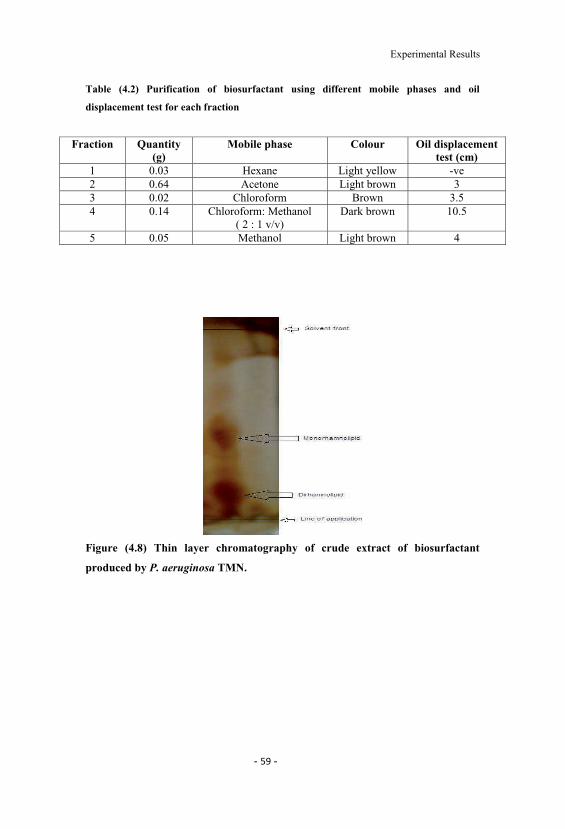
Experimental Results
Table (4.2) Purification of biosurfactant using different mobile phases and oil
displacement test for each fraction
Fraction Quantity(g)
Mobile phase Colour Oil displacementtest (cm)
1 0.03 Hexane Light yellow -ve2 0.64 Acetone Light brown 33 0.02 Chloroform Brown 3.54 0.14 Chloroform: Methanol
( 2 : 1 v/v)Dark brown 10.5
5 0.05 Methanol Light brown 4
Figure (4.8) Thin layer chromatography of crude extract of biosurfactant
produced by P. aeruginosa TMN.
Experimental Results
4.4.2. Fourier transform infrared spectroscopy (FTIR)
Infrared spectrum of biosurfactant which is shown in Figure (4.9) indicated a
broad stretching peak at 3429cm 1, characteristic of O H stretching vibrations.
Absorption around 2922cm 1 is assigned to the symmetric stretch (- C H) of CH2 and
CH3 groups of aliphatic chains. The corresponding symmetric stretch is seen at
2853cm 1. Also, a weak symmetric stretching peak at 1715cm 1 indicate the presence
of ester carbonyl groups (C=O in COOH) in the biosurfactant. The ester carbonyl
group was proved from the band at 1321cm 1 which corresponds to C- O deformation
vibrations, although other groups also absorb in this region.
The presence of the carboxylic acid functional group in the molecule was also
confirmed by the bending of the hydroxyl (O H) of medium intensity bands in the
region (1455 1386 cm 1 -pyranyl II sorption band at 834 cm 1 showed the
presence of dirhamnolipid in the mixture.
These characteristic adsorption bands together demonstrate that both hold
chemical structures identical with those of rhamnolipids, which have rhamnose rings
and long hydrocarbon chains.
4.4.3. Nuclear magnetic resonance NMR
The 1H NMR spectrum of purified biosurfactant was represented in Figure
(4.10). Chemical shifts are assembled in Table (4.3).
4.4.4. Electrospray ionisation mass spectrometry (ESI MS)
In this study, thirteen rhamnolipid homologues with the pseudo molecular ions
-MS and summarized in Table
(4.4). The di rhamnolipid homologues which correspond to Rha-Rha-C10 C12
Figure (4.11).
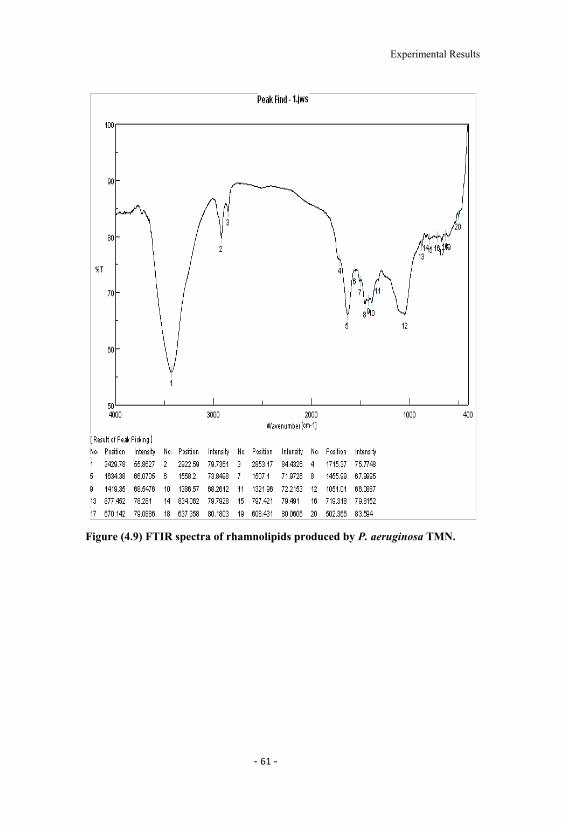
Experimental Results
Figure (4.9) FTIR spectra of rhamnolipids produced by P. aeruginosa TMN.
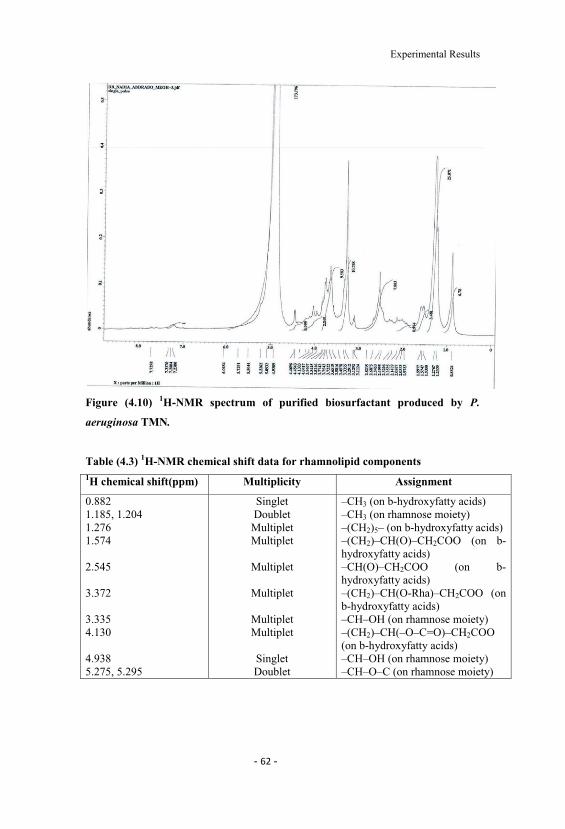
Experimental Results
Figure (4.10) 1H-NMR spectrum of purified biosurfactant produced by P.
aeruginosa TMN.
Table (4.3) 1H-NMR chemical shift data for rhamnolipid components1H chemical shift(ppm) Multiplicity Assignment
0.8821.185, 1.2041.2761.574
2.545
3.372
3.3354.130
4.9385.275, 5.295
SingletDoubletMultipletMultiplet
Multiplet
Multiplet
MultipletMultiplet
SingletDoublet
CH3 (on b-hydroxyfatty acids)CH3 (on rhamnose moiety)(CH2)5 (on b-hydroxyfatty acids)(CH2) CH(O) CH2COO (on b-
hydroxyfatty acids)CH(O) CH2COO (on b-
hydroxyfatty acids)(CH2) CH(O-Rha) CH2COO (on
b-hydroxyfatty acids)CH OH (on rhamnose moiety)(CH2) CH( O C=O) CH2COO
(on b-hydroxyfatty acids)CH OH (on rhamnose moiety)CH O C (on rhamnose moiety)
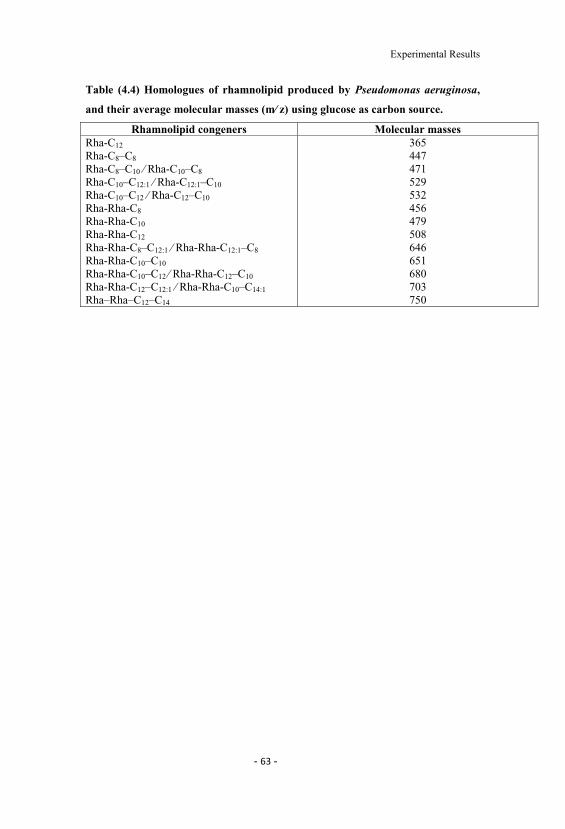
Experimental Results
Table (4.4) Homologues of rhamnolipid produced by Pseudomonas aeruginosa,
using glucose as carbon source.
Rhamnolipid congeners Molecular massesRha-C12
Rha-C8 C8
Rha-C8 C10 Rha-C10 C8
Rha-C10 C12:1 Rha-C12:1 C10
Rha-C10 C12 Rha-C12 C10
Rha-Rha-C8
Rha-Rha-C10
Rha-Rha-C12
Rha-Rha-C8 C12:1 Rha-Rha-C12:1 C8
Rha-Rha-C10 C10
Rha-Rha-C10 C12 Rha-Rha-C12 C10
Rha-Rha-C12 C12:1 Rha-Rha-C10 C14:1
Rha Rha C12 C14
365447471529532456479508646651680703750
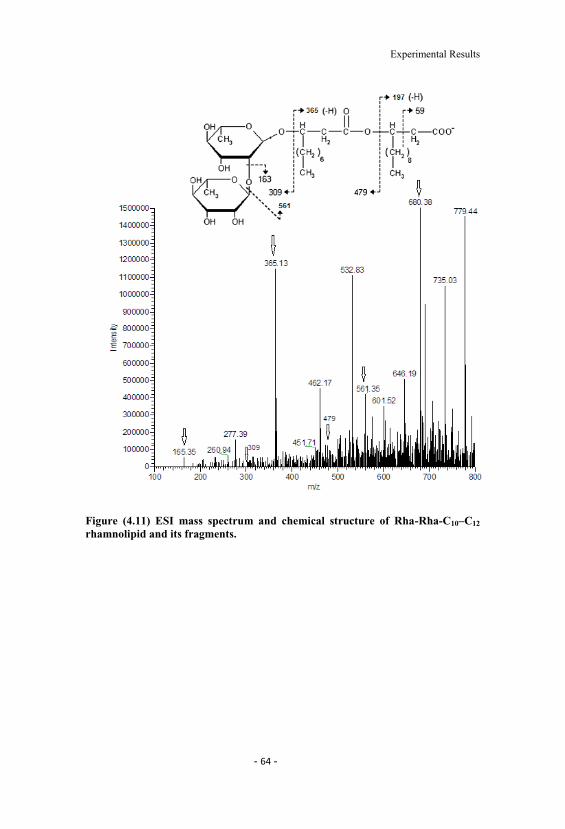
Experimental Results
Figure (4.11) ESI mass spectrum and chemical structure of Rha-Rha-C10 C12
rhamnolipid and its fragments.
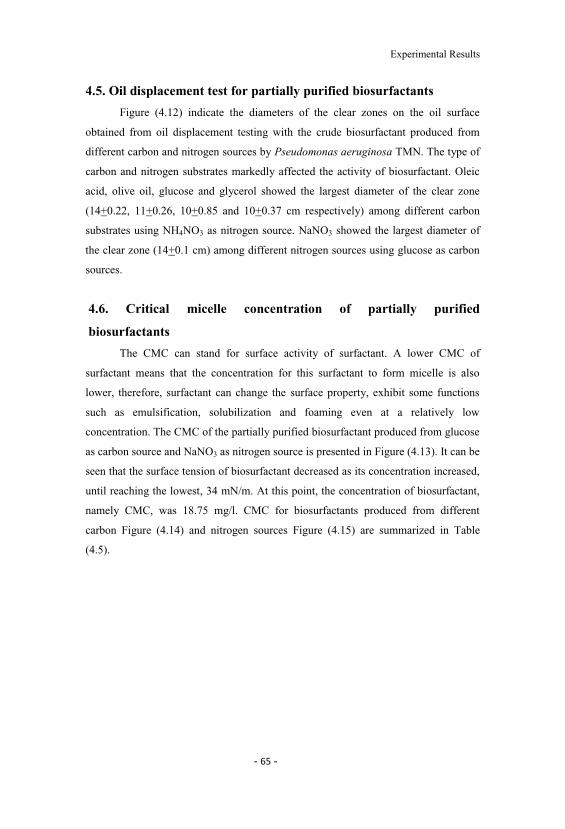
Experimental Results
4.5. Oil displacement test for partially purified biosurfactants
Figure (4.12) indicate the diameters of the clear zones on the oil surface
obtained from oil displacement testing with the crude biosurfactant produced from
different carbon and nitrogen sources by Pseudomonas aeruginosa TMN. The type of
carbon and nitrogen substrates markedly affected the activity of biosurfactant. Oleic
acid, olive oil, glucose and glycerol showed the largest diameter of the clear zone
(14+0.22, 11+0.26, 10+0.85 and 10+0.37 cm respectively) among different carbon
substrates using NH4NO3 as nitrogen source. NaNO3 showed the largest diameter of
the clear zone (14+0.1 cm) among different nitrogen sources using glucose as carbon
sources.
4.6. Critical micelle concentration of partially purified
biosurfactants
The CMC can stand for surface activity of surfactant. A lower CMC of
surfactant means that the concentration for this surfactant to form micelle is also
lower, therefore, surfactant can change the surface property, exhibit some functions
such as emulsification, solubilization and foaming even at a relatively low
concentration. The CMC of the partially purified biosurfactant produced from glucose
as carbon source and NaNO3 as nitrogen source is presented in Figure (4.13). It can be
seen that the surface tension of biosurfactant decreased as its concentration increased,
until reaching the lowest, 34 mN/m. At this point, the concentration of biosurfactant,
namely CMC, was 18.75 mg/l. CMC for biosurfactants produced from different
carbon Figure (4.14) and nitrogen sources Figure (4.15) are summarized in Table
(4.5).
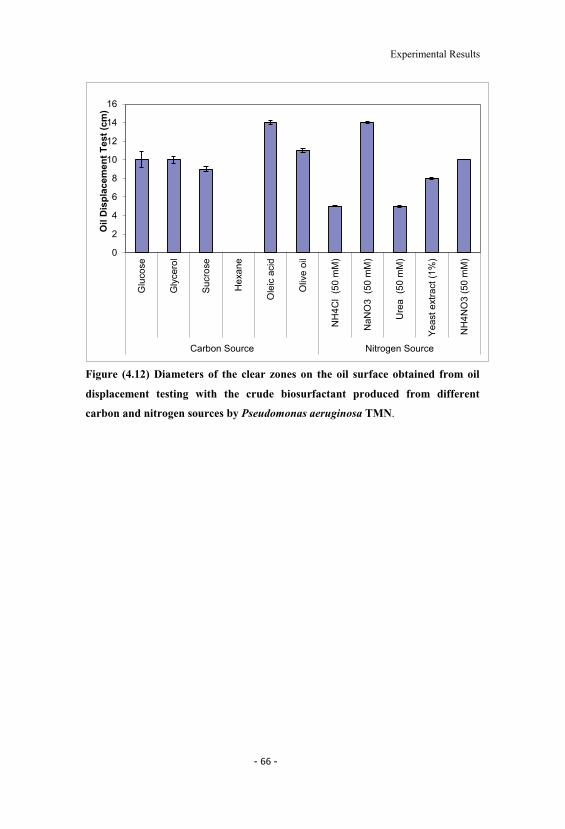
Experimental Results
Figure (4.12) Diameters of the clear zones on the oil surface obtained from oil
displacement testing with the crude biosurfactant produced from different
carbon and nitrogen sources by Pseudomonas aeruginosa TMN.
0
2
4
6
8
10
12
14
16
Glu
cose
Gly
cero
l
Suc
rose
Hex
ane
Ole
ic a
cid
Oliv
e oi
l
NH
4Cl
(50
mM
)
NaN
O3
(50
mM
)
Ure
a (5
0 m
M)
Yea
st e
xtra
ct(1
%)
NH
4NO
3 (5
0 m
M)
Carbon Source Nitrogen Source
Oil
Dis
plac
emen
tTes
t (cm
)
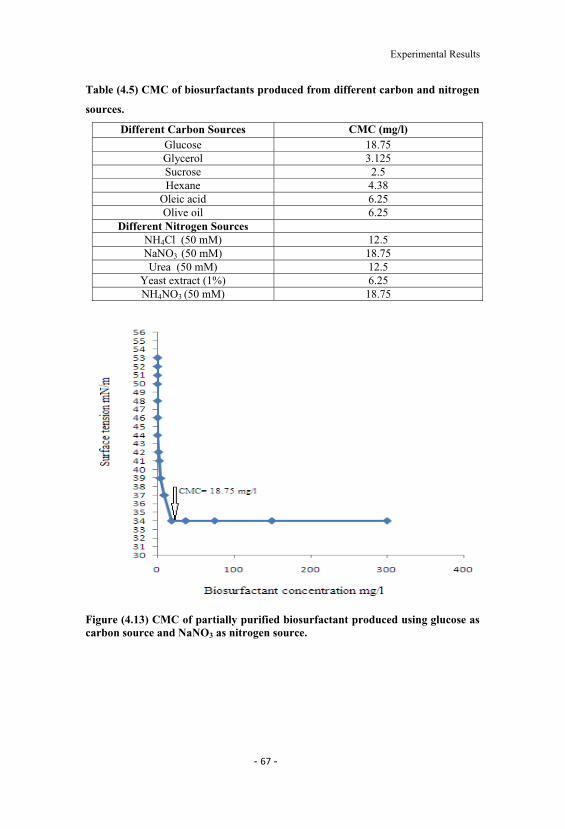
Experimental Results
Table (4.5) CMC of biosurfactants produced from different carbon and nitrogen
sources.
Different Carbon Sources CMC (mg/l)Glucose 18.75Glycerol 3.125Sucrose 2.5Hexane 4.38
Oleic acid 6.25Olive oil 6.25
Different Nitrogen SourcesNH4Cl (50 mM) 12.5NaNO3 (50 mM) 18.75Urea (50 mM) 12.5
Yeast extract (1%) 6.25NH4NO3 (50 mM) 18.75
Figure (4.13) CMC of partially purified biosurfactant produced using glucose ascarbon source and NaNO3 as nitrogen source.
Experimental Results
A. Glycerol as carbon source. B. Sucrose as carbon source.
C. Hexane as carbon source. D. Oleic acid as carbon source.
E. Olive oil as carbon source.
Figure (4.14) CMC of biosurfactants produced from different carbon sources.
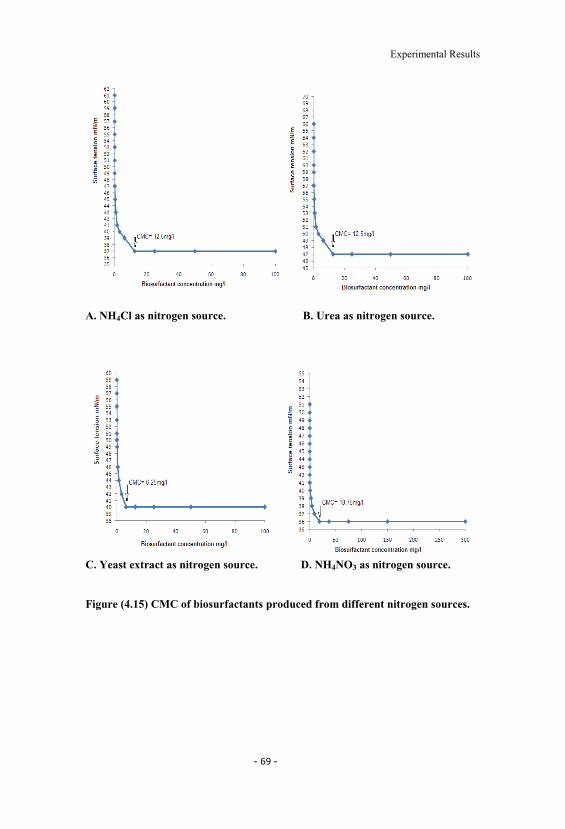
Experimental Results
A. NH4Cl as nitrogen source. B. Urea as nitrogen source.
C. Yeast extract as nitrogen source. D. NH4NO3 as nitrogen source.
Figure (4.15) CMC of biosurfactants produced from different nitrogen sources.
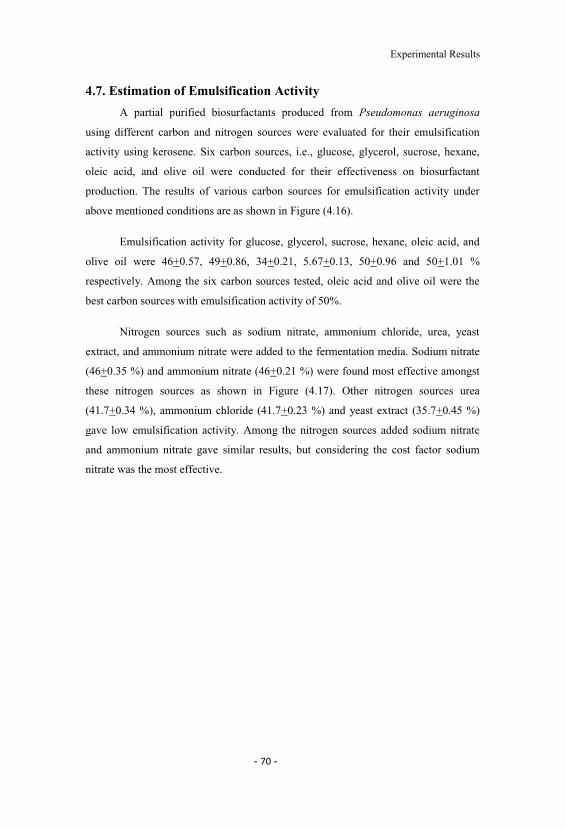
Experimental Results
4.7. Estimation of Emulsification Activity
A partial purified biosurfactants produced from Pseudomonas aeruginosa
using different carbon and nitrogen sources were evaluated for their emulsification
activity using kerosene. Six carbon sources, i.e., glucose, glycerol, sucrose, hexane,
oleic acid, and olive oil were conducted for their effectiveness on biosurfactant
production. The results of various carbon sources for emulsification activity under
above mentioned conditions are as shown in Figure (4.16).
Emulsification activity for glucose, glycerol, sucrose, hexane, oleic acid, and
olive oil were 46+0.57, 49+0.86, 34+0.21, 5.67+0.13, 50+0.96 and 50+1.01 %
respectively. Among the six carbon sources tested, oleic acid and olive oil were the
best carbon sources with emulsification activity of 50%.
Nitrogen sources such as sodium nitrate, ammonium chloride, urea, yeast
extract, and ammonium nitrate were added to the fermentation media. Sodium nitrate
(46+0.35 %) and ammonium nitrate (46+0.21 %) were found most effective amongst
these nitrogen sources as shown in Figure (4.17). Other nitrogen sources urea
(41.7+0.34 %), ammonium chloride (41.7+0.23 %) and yeast extract (35.7+0.45 %)
gave low emulsification activity. Among the nitrogen sources added sodium nitrate
and ammonium nitrate gave similar results, but considering the cost factor sodium
nitrate was the most effective.
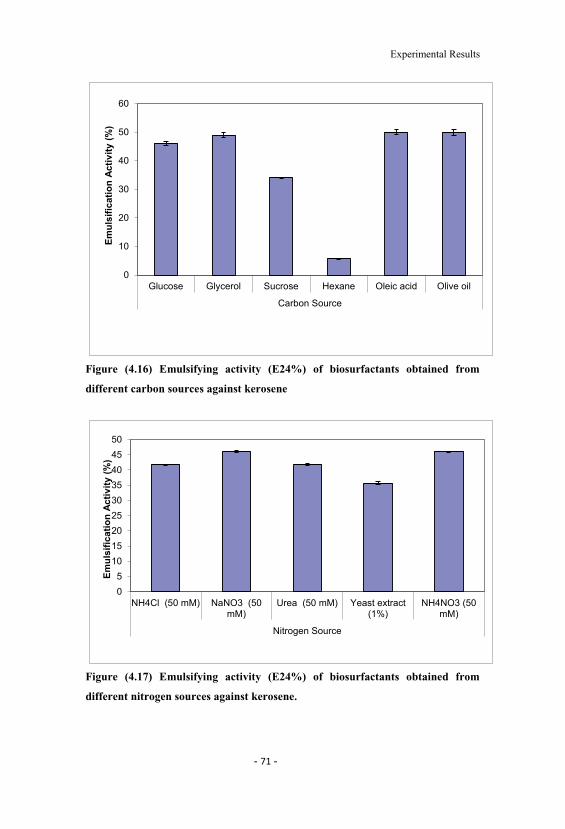
Experimental Results
Figure (4.16) Emulsifying activity (E24%) of biosurfactants obtained from
different carbon sources against kerosene
Figure (4.17) Emulsifying activity (E24%) of biosurfactants obtained from
different nitrogen sources against kerosene.
0
10
20
30
40
50
60
Glucose Glycerol Sucrose Hexane Oleic acid Olive oil
Carbon Source
Emul
sific
atio
nAc
tivity
(%)
05
101520253035404550
NH4Cl (50 mM) NaNO3 (50mM)
Urea (50 mM) Yeast extract(1%)
NH4NO3 (50mM)
Nitrogen Source
Emul
sific
atio
nAc
tivity
(%)
Discussion
CHAPTER V
DISCUSSION
Properties of Pseudomonas aeruginosa TMN isolated in this study are quite
similar with the literature (Lotfabad et al., 2009; Abbasi et al., 2012).
Literature revealed that the type and concentration of carbon and nitrogen
substrates markedly affected the production yield of rhamnolipid (Lang and
Wullbrandt, 1999; Mata-Sandoval et al., 1999; Maier and Soberón-Chávez, 2000;
Jeong et al., 2004).
Glucose was considered as the best carbon substrate based on rhamnolipid
yield and surface tension. P. aeruginosa TMN was unable to utilize sucrose
efficiently, resulting in a poor rhamnolipid yield and dry cell weight of 0.02 and 0.91
g/l, respectively. It is likely that the strain may lack the enzyme (i.e., invertase) for
sucrose hydrolysis (Wu et al., 2008). Boulton and Ratledge, 1987 mentioned that the
use of vegetable oil as carbon sources to produce rhamnolipids seemed to be an
interesting and low cost alternative but TMN strain attained a lower rhamnolipid yield
from olive oil than that from glucose and glycerol. The data showed that there seems
to be no clear trend between cell yield and rhamnolipid yield, which were, however,
strongly dependent on the carbon source used.
Use of oleic acid as the carbon source did not improve rhamnolipid production,
suggesting that hydrolysis of the oils was not the bottle- neck step. Some reports
showed that vegetable oils were more efficient substrates in rhamnolipid production
from P. aeruginosa TMN when compared with glucose, glycerol, and hydrocarbons
(Maier and Soberón-Chávez, 2000; Mata-Sandoval et al., 2001).
Moreover, hexane was also inefficient in cell growth and rhamnolipid
production; resulting in a low rhamnolipid yield and cell dry weight probably due to
its poor biodegradability (Chayabutra et al., 2001).
P. aeruginosa TMN used in this work showed a different trend, as glucose was
superior to the olive oils tested in terms of both rhamnolipid yield and surface tension.
Discussion
This suggests that the carbon source preference for rhamnolipid production seems to
be strain dependent.
These results are in concurrence with several previous reports, emphasizing the
utilization of glucose as cost-effective alternative substrates for microbial growth and
biosurfactant production (Lotfabad et al., 2009; Anyanwu and Chukwudi, 2010).
NaNO3 was the most efficient nitrogen source for P. aeruginosa TMN and
ammonium nitrate follows it to produce rhamnolipid. The observation that nitrate was
the better inorganic nitrogen source than ammonium ion for rhamnolipid production is
consistent with the finding of comparable studies in the literature (Guerra-Santos et
al., 1984; Arino et al., 1996; Wei and Chu, 1998; Anna et al., 2002; Santos et al.,
2002; Jeong et al., 2004).
Despite using urea and yeast extract as the organic nitrogen sources giving rise
to better cell growth, using those organic nitrogen sources had poorer performance
than using NaNO3 in terms of rhamnolipid yield. In fact, it has been reported that the
organic nitrogen source could help cell growth but was unfavorable to production of
glycolipid biosurfactant (Kim et al., 2006).
Addition of NaNO3 as the sole source of nitrogen in the glucose-containing
MS medium resulted in the highest biosurfactant production (0.98 g/l). Organic
nitrogen sources including yeast extract, and urea had approximately comparable
influence on the MR01 biosurfactant production (Lotfabad et al., 2009).
The yield of biosurfactant increased when pH varied from 4 to 8 and reached
the highest at pH 7; however, when pH reached 8, the biosurfactant yield declined and
came to its lowest point. Thus, indicated that the TMN strain excreted biosurfactant
more effectively under neutral conditions. These values agree with those previously
reported for rhamnolipid by the authors Priya and Usharani, 2009. They showed
maximum production of rhamnolipid at pH 7 using Pseudomonas aeruginosa.
Temperature and pH were two environmental factors that majorly affect biological
activities of prokaryotes (Yakimov et al., 1995).
Maximum rhamnolipid production was found at 37 C. Rhamnolipid
production increased with temperature from 25 to 37 C, and decreased slightly when
Discussion
temperature was further increased to 45 C. P. aeruginosa was unable to grow at 47
C, leading to negligible rhamnolipid production at that temperature.
These results suggest that the optimal temperature for rhamnolipid production
with TMN was in the range of 37 40 C. This result is comparable with the results
obtained by the authors Priya and Usharani, 2009. They showed maximum
biosurfactant production at 37 C.
Agitation rate affects the mass transfer efficiency of both oxygen and medium
components and is considered crucial to the cell growth and biosurfactant formation
of the strictly aerobic bacterium P. aeruginosa, especially when it was grown in a
shake flask. Rhamnolipid production increased and dry cell weight was also improved
at 200 rpm. The rhamnolipid production and dry cell weight are slightly decreased at
250 rpm. This result is comparable with the results obtained by the authors Maqsood
and Jamal, 2011. This can be attributed to the severe foaming while the flask was
shaken at 250 rpm. The heavy foaming caused by emulsification of rhamnolipid
during vigorous shaking (e.g., 250 rpm) may decrease the transfer efficiency of
oxygen gas into the liquid medium, and is thus unsuitable for rhamnolipid production
in shake-flask cultures. It should be pointed out that the heavy foaming during
biosurfactant fermentation is not necessarily a negative factor. Some researchers
collected the biosurfactant-rich foams from the fermenter for continuous recovery of
biosurfactant to avoid product inhibition and to simplify downstream processing
(Davis et al., 2001).
The fractions were collected and classified into 5 parts, Fraction 4 which has
dark brown colour and diameter of clear zone on the oil surface 10.5 cm at
concentration of 0.14 g/l was the best biosurfactant fraction. The biosurfactant
produced by P. aeruginosa have been characterized as rhamnolipids (Guerra-Santos
et al., 1984; Syldatk et al., 1985a; Parra et al., 1989; Rendell et al., 1990). They have
been found to increase the dispersion of hydrophobic compounds in water (Zhang and
Miller, 1992) and to enhance the recovery from soil of polyaromatic hydrocarbons
(PAH) (Van Dyke et al., 1993).
According to the results of the IR spectra, the rhamnolipids produced by P.
aeruginosa TMN belong to the glycolipid group, which is made up of aliphatic acid
Discussion
and ester. The absorption peak around 1051cm 1 was reported as C O C stretching in
the rhamnose (Pornsunthorntawee et al., 2008) -pyranyl II sorption band at 834
cm 1 showed the presence of dirhamnolipid in the mixture. The adsorption bands
obtained are consistent with the report of Guo et al. 2009 showing the presence of
rhamnose rings and hydrocarbon chains. In the FTIR spectrum, we could observe only
a minor shoulder; it might be because of the dirhamnolipid-rich biosurfactant
produced by TMN (Rahman et al., 2002).
The results obtained are consistent with the structure reported by (Stanghellini
and Miller, 1997; Pornsunthorntawee et al., 2008) consisting of aliphatic acid and the
glycolipid moiety.
The chemicals shifts were comparable to previous reports (Ramana and
Karanth, 1989; Sim et al., 1997; Wei et al., 2005) and the results were in accordance
with the structures as shown by ESI-spectra.
Thirteen rhamnolipid homologues were identified using ESI-MS (Lang and
Wullbrandt, 1999; Maier and Soberón-Chávez, 2000). The dirhamnolipid homologue
which corresponds to Rha-Rha-C10 C12
found. This work is in agreement with previous reports dealing with production of
rhamnolipids surfactant mixtures in which dirhamnolipids were the predominant
species (Arutchelvi and Doble, 2010). On the contrary, few reports (Arino et al.,
1996; Sim et al., 1997) describe a rhamnolipid mixture in which monorhamnolipid is
the predominant component.
The Oil displacement test is an indirect measurement of the surface activity of
a surfactant sample tested against oil; a larger diameter represents a higher surface
activity of the testing solution (Pornsunthorntawee et al., 2008). The oil spreading
method is rapid and easy to carry out, requires no specialized equipment and just a
small volume of sample et al., 2006). It can be applied when the activity and
quantity of biosurfactant is low. Youssef et al. 2004 and Plaza et al. 2006
demonstrated that the oil spreading technique is a reliable method to detect
biosurfactant production by diverse microorganisms. The assay was also applied for
screening by Huy et al. 1999. NaNO3 showed the largest diameter of the clear zone
among different nitrogen sources using glucose as carbon sources.
Discussion
The surface tension of biosurfactant decreased as its concentration increased,
until reaching the lowest, 34 mN/m. At this point, the concentration of biosurfactant,
namely CMC, was 18.75 mg/l. This CMC was much lower compared with some
chemical surfactant, for instance, sodium dodecyl sulfate (SDS) had a CMC value of
2100 mg/l (Chen et al., 2006). Nitschke and Pastore reported that the CMC of
biosurfactant obtained from Bacillus subtilis was 33 mg/l (Nitschke and Pastore,
2006). Li et al. 1984 showed that the CMC of rhamnolipid fermentation liquor was
386 mg/l (Daoshan et al., 2004).
Emulsification of rhamnolipids depends on carbon sources used to produce
rhamnolipids (Pornsunthorntawee et al., 2008). Six carbon sources, i.e., glucose,
glycerol, sucrose, hexane, oleic acid, and olive oil were conducted for their
effectiveness on biosurfactant production.
As evident from the results that Pseudomonas aeruginosa TMN was able to
grow in a medium containing oleic acid and olive oil with maximum emulsification
activity. Other carbon sources (glycerol, glucose, sucrose and hexane) used, showed
less emulsification activity, hexane being the lowest, as compared to other carbon
sources. This suggested that the carbon source preference of the strain for
biosurfactant production, which seems to be strain dependent (Wu et al., 2008). Most
microbial surfactants were substrate specific, solubilizing or emulsifying different
hydrocarbons at different rates.
Poor emulsification of other hydrocarbons might be due to the inability of the
biosurfactant to stabilize the microscopic droplets. Also inefficient oxygen supply in
the flask cultures may be responsible for poor growth in other carbon sources, as
biodegradation of these oils are known as an oxygen intensive metabolic event
(Panesar et al., 2009).
On other hand, oleic acid and olive oil are the carbon sources which are taken
up very easily than compared to others. Among the six carbon sources tested, oleic
acid and olive oil were the best carbon sources with emulsification activity of 50%.
Similar results were found with P. aeroginusa 44T1 (Robert et al., 1989). A probable
reason for this tendency that P. aeruginosa is lipase positive which facilitate
assimilation of fatty acids contained in oleic acid and olive oil.
Discussion
Sodium nitrate and ammonium nitrate were found most effective amongst the
nitrogen sources used. Other nitrogen sources (urea, ammonium chloride and yeast
extract) gave low emulsification activity. Among the nitrogen sources added sodium
nitrate and ammonium nitrate gave similar results, but considering the cost factor
sodium nitrate was the most effective. Similar results were reported elsewhere
(Ochsner et al., 1995; Arino et al., 1996; Healy et al., 1996).
Summary
SUMMARY
Surfactants are widely used for various purposes in industry, but for many
years were mainly chemically synthesized. It has only been in the past few decades
that biological surface active compounds (biosurfactants) have been described.
Biosurfactants are gaining prominence and have already taken over for a
number of important industrial uses, due to their advantages of low toxicity, high
biodegradability, low irritancy, and compatibility with human skin.
Biosurfactant-producing bacterial strain (Pseudomonas aeruginosa) was
isolated by using Cetrimide agar from Compost pile waste collected from El-Sharkia
region in Delta, Egypt. Morphological and biochemical characteristics of the isolate
indicated that strain was a member of the genus Pseudomonas. 16S rRNA gene
sequence analysis indicated that Strain TMN exhibited the highest similarity (98%) to
P. aeruginosa.
I. Several cultural conditions were studied to detect the optimum media used in
the production of biosurfactant from P. aeruginosa.
1. Different carbon sources (glucose, glycerol, sucrose, hexane, olive oil, and
oleic acid) were used to optimize the proper media used for biosurfactant
production. The result revealed that, maximum yield of biosurfactant (0.3 g
crude extract/l culture) and the maximum reduction in surface tension (34
mN/m) were obtained by using glucose as a carbon source and achieved an
emulsification index of over 46% for kerosene.
2. Different nitrogen sources (NH4NO3, NH4Cl, NaNO3, urea and yeast extract)
were investigated. NaNO3 was the most efficient nitrogen source to produce
rhamnolipid, giving a high rhamnolipid yield of (0.34 g crude extract/l
culture) and reduced surface tension of 34 mN/m and achieved an
emulsification index of over 46% for kerosene.
Summary
3. It was found that the yield of biosurfactant increased when pH varied from 4
to 8 and reached the highest at pH 7 (0.36 g crude extract/l culture).
4. It was found that the optimal temperature of rhamnolipid production was at
37 C where the rhamnolipid yield was 0.34 g crude extract/l culture.
5. The biosurfactant yield was maximized by increasing of the agitation rate.
Actually the maximum yield (0.3 g crude extract/l culture) was obtained at
agitation rate 200 rpm.
II. Column Chromatography was applied in the purification of biosurfactant;
fractions were collected and classified into 5 parts. The fraction of the fourth
part which had a dark brown in color and diameter of clear zone on the oil
surface 10.5 cm was the best biosurfactant. This purified biosurfactant was
characterized to elucidate its chemical formula.
III. FTIR, 1HNMR and ESI MS were applied to estimate the chemical
composition of the purified biosurfactant. The chemical structure is supposed
to be Rha-Rha-C10 C12.
IV. Oil displacement test for partially purified biosurfactants produced from
different carbon and nitrogen sources indicated that oleic acid showed the
largest diameter of the clear zone (14+0.22 cm) among different carbon
substrates and NaNO3 (14+0.1 cm) among different nitrogen sources.
V. CMC for biosurfactants produced from different carbon and nitrogen sources
indicated that glucose had higher CMC (18.75 mg/l) among different carbon
substrates while NaNO3 and NH4NO3 had higher CMC (18.75 mg/l for both)
among different nitrogen sources.
VI. Emulsification activity of the six carbon sources tested showed that oleic
acid and olive oil were the best carbon sources with emulsification activity of
50%. Sodium nitrate was found most effective amongst other nitrogen
sources with emulsification activity of 46%.
References
REFERENCES
Abalos, A.; Pinaso, A.; Infante, M. R.; Casals, M.; Garcia, F. and Manresa, A. (2001).
Physicochemical and antimicrobial properties of new rhamnolipids by Pseudomonas
aeruginosa AT10 from soybean oil refinery wastes. Langmuir. 17, 1367-1371.
Abbasi, H.; Hamedi, M. M.; Lotfabad, T. B.; Zahiri, H. S.; Sharafi, H.; Masoomi, F.;
Moosavi-Movahedi, A. A.; Ortiz, A.; Amanlou, M. and Noghabi, K. A. (2012).
Biosurfactant-producing bacterium, Pseudomonas aeruginosa MA01 isolated from
spoiled apples: Physicochemical and structural characteristics of isolated
biosurfactant. J. Biosci. Bioeng. 113, 211 219.
Abu-Ruwaida, A. S.; Banat, I. M.; Haditirto, and Khamis, A. (1991a). Nutritional
requirements and growth characteristics of a biosurfactant producing Rhodococcus
Bacterium. World J. Microbiol. Biotechnol. 7, 53-61.
Abu-Ruwaida, A. S.; Banat, I. M.; Haditirto, S.; Salem, A. and Kadri, M. (1991b). Isolation
of biosurfactant-producing bacteria product characterization and evaluation. Acta
Biotechnologica. 11, 315-324.
Adelhorst, K.; Bjorkling, F.; Godtfredsen, S. E. and Kirk, O. (1990). Enzyme catalysed
preparation of 6-O-acylglucopyranosides. Synthesis. 1, 112-115.
Ahimou, F.; Jacques, P. and Deleu, M. (2001). Surfactin and iturin A effects on Bacillus
subtilis surface hydrophobicity. Enzy. Microb. Technol. 27, 749 54.
Altschul, S. F.; Gish, W.; Miller, W.; Myers, E. W. and Lipman, D. J. (1990). Basic local
alignment search tool. J. Mol. Biol. 215, 403-410.
Amaral P. F. F.; da Silva, J. M. and Lehocky, M. (2006). Production and characterization of a
bioemulsifier from Yarrowia lipolytica. Process Biochem. 41, 1894-1898.
Angelova, B. and Schmauder, H. P. (1999). Lipophilic compounds in biotechnology-
interactions with cells and technological problems. J. Biotechnol. 67, 13 32.
References
Anna, L. M. S.; Sebastian, G. V.; Menezes, E. P.; Alves, T. L. M.; Santos, A. S.; Pereira N.
and Freire, D. M. G. (2002). Production of biosurfactants from Pseudomonas
aeruginosa PA1 isolated in oil environments. Braz. J. Chem. Eng. 19, 159 166.
Anyanwu, and Chukwudi, U. (2010). Surface activity of extracellular products of a
Pseudomonas aeruginosa isolated from petroleum contaminated soil. Inter. J.
Environ. Sci. 1, 225-235.
Arguelles-Arias, A.; Ongena, M.; Halimi, B.; Lara, Y.; Brans, A.; Joris, B. and Fickers, P.
(2009). Bacillus amyloliquefaciens GA1 as a source of potent antibiotics and other
secondary metabolites for biocontrol of plant pathogens. Microbial Cell Factory. 8,
63.
Arima, K.; Kahinuma, A. and Tamura, G. (1968). Surfactin, a crystalline peptide lipid
surfactant produced by Bacillus subtilis: isolation, characterization and its inhibition
of fibrin clot formation. Biochem. Biophys. Res. Commun. 31, 488 494.
Arino, S.; Marchal, R. and Vandecasteele, J. P. (1996). Identification and production of a
rhamnolipidic biosurfactant by a Pseudomonas species. Appl. Microbiol. Biotechnol.
45, 162 168.
Arutchelvi, J. and Doble, M. (2010). Characterization of glycolipid biosurfactant from
Pseudomonas aeruginosa CPCL isolated from petroleum-contaminated soil. Lett.
Appl. Microbiol. 51, 75-82.
Azim, A. and Gross, R. (2005). Sophorolipids, microbial glycolipids with anti-human
immunodeficiency virus and spermimmobilizing activities. Antimicrob. Agents
Chemother. 49, 4093 4100.
Baltz, R. H.; Miao, V. and Wrigley, S. K. (2005). Natural products to drugs:
daptomycin and related lipopeptide antibiotics. Nat. Prod. Rep. 22, 717 741.
Bai, G. Y.; Brusseau, M. L. and Miller, R. M. (1997). Biosurfactant enhanced removal of
residual hydrocarbon from soil. J. Cont. Hydrol. 25,157 170.
References
Banat, I. M.; Samarah, M.; Murad, M.; Horne, R. and Banerjee, S. (1991). Biosurfactant
production and use in oil tank clean-up. World J. Microbiol. Biotechnol. 7, 80-88.
Banat, I. M. (1995). Biosurfactants production and possible uses in microbial enhanced oil
recovery and oil pollution remediation. Bioresource Technol. 51, 1-12.
Banat, I. M.; Makkar, R. S. and Cameotra, S. S. (2000). Potential commercial applications of
microbial surfactants. Appl. Environ. Microbiol. 53, 495 508.
Banat, I. M.; Franzetti, A.; Gandolfi, I.; Bestetti, G.; Martinotti, M. G.; Fracchia, L.; Smyth,
T. J. and Marchant, R. (2010). Microbial biosurfactants production, applications and
future potential. Appl. Microbiol. Biot. 87, 427-444.
Barkay, T.; Navon-Venezia, S.; Ron, E. and Rosenberg, E. (1999). Enhancement of
solubilization and biodegradation of polyaromatic hydrocarbons by the emulsifier
alasan. Appl. Environ. Microbiol. 65, 2697-2702.
Bashandy, A. s.; Abu Shady, H. M. and Aziz, N. H. et al. (2005). Enhanced production and
properties of a surfactant by a gamma ray induced mutant of Bacillus subtilis. Egyp. J.
Biotechnol. 20, 290-303.
Becher, P. (1965). Emulsions, Theory and Practice, second ed. Reinhold Publishing, New
York.
Bednarski, W.; Adamcza
refinery waste in biosynthesis of glycolipids by yeast. Bioresource Technol. 95, 15
18.
Folia Microbiol. 51,
359 369.
References
Begley, M.; Cotter, P. D.; Hill, C. and Ross, R. P. (2009). Identification of a novel two-
peptide lantibiotic, lichenicidin, following rational genome mining for LanM proteins.
Appl. Environ. Microbiol. 75, 5451-5460.
Benincasa, M.; Contiero, J.; Manresa, M. A. and Moraes, I. O. (2002). Rhamnolipid
production by Pseudomonas aeruginosa LBI growing on soap stock as the sole
carbon source. J. Food Eng. 54, 283 288.
Benincasa, M.; Abalos, A.; Oliveira, I. and Manresa, A. (2004). Chemical structure, surface
properties and biological activities of the biosurfactant produced by Pseudomonas
aeruginosa LBI from soapstock. Anton. Leeuw. Int. J. G. 85, 1 8.
Bernheimer, A. W. and Avigad, L. S. (1970). Nature and properties of a cytological agent
produced by Bacillus subtilis. J. Gen. Microbiol. 61, 361 369.
Besson, F.; Peypoux, F.; Michel, G. and Delcambe, L. (1976). Characterization of iturin A in
antibiotics from various strains of Bacillus subtilis. J. Antibiot. (Tokyo). 29, 1043 9.
Bognolo, F. (1999). Biosurfactants as emulsifying agents for hydrocarbons. Coll. Surf. A.
152, 41 52.
Boulton, C. A., and C. Ratledge. (1987). Biosynthesis of lipid precursors to surfactant
production. In: N. Kosaric, W. L. Cairns, and N. C. C. Gray (ed.), Biosurfactants and
biotechnology. Marcel Dekker, Inc., New York, p. 47-87.
Brooks, K. A.; Jeno, M. and Sodeman, T. M. (1974). A clinical evaluation of the API
microtube system for identification of Enterobacteriaceae. Am. J. Med. Technol. 40,
55-61.
Busscher, H. J.; Neu, T. and Van der Mei, H. C. (1994). Biosurfactant production by
thermophilic dairy streptococci. Appl. Microbiol. Biotechnol. 41, 4 7.
Busscher, H. J.; Van Hoogmoed, C. G.; Geertsema-Doornbusch, G. I.; van der Kuijl-Booij,
M. and van der Mei, H. C. (1997). Streptococcus thermophilus and its biosurfactants
References
inhibit adhesion by Candida spp. on silicone rubber. Appl. Environ. Microbiol. 63,
3810 7.
Busscher, H. J.; Van de Belt-Gritter, B. and Westerhof, M. et al. (1999). Microbial
interference in the colonization of silicone rubber implant surfaces in the oropharynx:
Streptococcus thermophilus against a mixed fungal/bacterial biofilm. In: E.
Rosenberg (ed), Microbial Ecology and Infectious Disease. Washington, DC:
American Society for Microbiology, PP. 66 74.
Calvo, C.; Manzanera, M.; Silva-Castro, G. A.; Uad, I. and González-López, J. (2009).
Application of bioemulsifiers in soil oil bioremediation processes. Future prospects.
Sci. Total Environ. 407, 3634 3640.
Cameron, D. R.; Cooper, D. G. and Neufeld, R. J. (1988). The Mannoprotein of the
Saccharomyces cerevisiae is an Effective Bioemulsifier. Appl. Environ. Microbiol.
54, 1420-1425.
Cameotra, S. S. and Makkar, R. S. (2004). Recent applications of biosurfactants as biological
and immunological molecules. Curr. Opin. Microbiol. 7, 262-266.
Cavalero, D. A. and Cooper, D. G. (2003).The effect of medium composition on the structure
and physical state of sophorolipids produced by Candida bombicola ATCC 22214. J.
Biotechnol. 103, 31-41.
Chakravorty, S.; Helb, D.; Burday, M. ; Connell, N. and Alland, D. (2007). A detailed
analysis of 16S ribosomal RNA gene segments for the diagnosis of pathogenic
bacteria. J. Microbiol. Methods. 69, 330-339.
Chayabutra, C.; Wu, J. and Ju, L. K. (2001). Rhamnolipid production by Pseudomonas
aeruginosa under denitrification: effects of limiting nutrients and carbon substrates.
Biotechnol. Bioeng. 72, 25-33.
References
Chen, C. C.; Riadi, L.; Suh, S. J.; Ohman, D. E. and Ju, L. K. (2005). Degradation and
synthesis kinetics of quorum-sensing autoinducer in Pseudomonas aeruginosa
cultivation. J. Biotechnol. 117, 1 10.
Chen, J.; Wang, X. J.; Hu, J. D. and Tao, S. (2006). Effect of surfactants on biodegradation of
PAHs by white-rot fungi. Environ. Sci. 27, 154-159.
Chen, H. L.; Chen, Y. S. and Juang, R. S. (2008). Recovery of surfactin from fermentation
broths by a hybrid salting-out and membrane filtration process. Sep. Purif. Technol.
59, 244 252.
Choi, W. J.; Hyun-Goo, C. and Won-Hong, L. (1996). Effects of ethanol and phosphate on
emulsan production by Acinetobacter calcoaceticus RAG-1. J. Biotechnol. 45, 217-
225.
Christofi, N. and Ivshina, I. B. (2002). Microbial surfactants and their use in field studies of
soil remediation. J. Appl. Microbiol. 93, 915 929.
(2006). Olive oil mill wastewater valorisation by fungi. J. Chem. Technol. Biotechnol.
81, 1547-1555.
Cirigliano, M. C. and Carman, G. M. (1984). Isolation of a bioemulsifier from Candida
lipolytica. Appl. Environ. Microbiol. 48, 747-750.
Ciriglino, M. C. and Garman, G. M. (1985). Purification and Characterization of Liposan, a
Bioemulsifier from Candida lipolytica. Appl. Environ. Microbiol. 50, 846-850.
Cooper, D. G. and Zajic, J. E. (1980). Surface active compounds from microorganisms. Adv.
Appl. Microbiol. 26, 229 253.
References
Cooper, D. G.; MacDonald, C. R.; Duff, S. J. B. and Kosaric, N. (1981). Enhanced
production of surfactin of B. subtilis by continuous product removal and metal cation
additions. Appl. Environ. Microbiol. 42, 408 412.
Cooper, D. G.; Zajic, J. E. and Denis, C. (1981). Surface- active properties of a biosurfactant
from Corynebacterium lepus. J. Amer. Oil Chem. Soc. 58, 77-80.
Cooper, D. G. and Goldenberg, B. G. (1987). Surface-active agents from two Bacillus
species. Appl. Environ. Microbiol. 53, 224 229.
Cooper, D. G.; Liss, S. N.; Longay, R. and Zajic, J. E. (1989). Surface Activities of
Mycobacterium and Pseudomonas. J. Ferment. Technol. 59, 97-101.
Cotter, P. D.; Hill, C. and Ross, R. P. (2005). Bacteriocins: developing innate immunity for
food. Nature Rev. Microbiol. 3, 777-788.
Daniel, H. J.; Reuss, M. and Syldatk, C. (1998). Production of sophorolipids in high
concentration from deproteinized whey and rapeseed oil in a two stage fed batch
process using Candida bombicola ATCC 22214 and Cryptococcus curvatus ATCC
20509. Biotechnol. Lett. 20, 1153-56.
Daoshan, L.; Shouliang, L.; Yi, L. and Demin, W. (2004). The effect of biosurfactant on the
interfacial tension and adsorption loss of surfactant in ASP flooding. Colloid Surf. A.
244, 53-60.
Darvishi, P.; Ayatollahi, S.; Mowla, D. and Niazi, A. (2011). Biosurfactant production under
extreme environmental conditions by an efficient microbial consortium, ERCPPI-2.
Colloid Surf. B. 84, 292 300.
Das, K. and Mukherjee, A. K. (2007). Crude petroleum-oil biodegradation efficiency of
Bacillus subtilis and Pseudomonas aeruginosa strains isolated from a petroleum-oil
contaminated soil from North-East India. Bioresource Technol. 98, 1339 1345.
References
Davis, D. A.; Lynch, H. C. and Varley, J. (2001). The application of foaming for the
recovery of surfactin from Bacillus subtilis ATCC 21332 cultures. Enzyme Microb.
Technol. 28, 346 354.
Deak, N. A. and Johnson, L. A. (2006). Functional properties of protein ingredients prepared
from high-sucrose/low-stachyose soybeans. J. American Oil Chemi. Soci. 83, 811-
818.
deKoster, C. G.; Vos, B.; Versluis, C.; Heerma, W. and Haverkamp, J. (1994). High-
performance thin-layer chromatography/fast atom bombardment (tandem) mass
spectrometry of Pseudomonas rhamnolipids. Biol Mass Spectrom. 23,179 185.
Desai, J. and Desai, A. (1993). Production of biosurfactants. In: N. Kosaric (ed),
Biosurfactants: production, properties and applications. Marcel Dekker, New York, pp. 65
97.
Desai, J. D. and Banat, I. M. (1997). Microbial production of surfactants and their
commercial potential. Microbiol. Mol. Biol. R. 61, 47-64.
Deshpande, M. and Daniels, L. (1995). Evaluation of sophorolipid biosurfactant production
by Candida bombicola using animal fat. Bioresource Technol. 54, 143-150.
Déziel, E.; Paquette, G.; Villemur, R.; Lépine, F. and Bisaillon, J. G. (1996). Biosurfactant
production by a soil Pseudomonas strain growing on polycyclic aromatic
hydrocarbons. Appl. Environ. Microbiol. 62, 1908 1912.
De´ziel, E.; Le´pine, F.; Dennie, D.; Boismenu, D.; Mamer, O. A. and Villemur, R. (1999).
Liquid chromatography/ mass spectrometry analysis of mixtures of rhamnolipids
produced by Pseudomonas aeruginosa strain 57RP grown on mannitol or
naphthalene. Biochim. Biophys. Acta/Mol. Cell. Biol. Lipids. 1440,244 252.
References
De´ziel, E.; Le´pine, F.; Milot, S. and Villemur, R. (2000). Mass spectrometry monitoring of
rhamnolipids from a growing culture of Pseudomonas aeruginosa strain 57RP.
Biochim. Biophys. Acta/Mol. Cell. Biol. Lipids. 1485,145 152.
Dubey, K. and Juwarkar, A. (2004). Determination of genetic basis for biosurfactant
production in distillery and curd whey wastes utilizing Pseudomonas aeruginosa strain BS2.
Indian J. Biotechnol. 3, 74-81.
Dubey, K. V. (2005). Adsorption-desorption process using wood based activated carbon for
recovery of biosurfactant from fermented distillery wastewater. Biotechnol. Prog. 21,
860-867.
Duvnjak, Z.; Cooper, D. G. and Kosaric, N. (1982). Production of surfactant by Arthrobacter
paraffineus ATCC19558. Biotechnol. Bioeng. 24, 165-175.
Falatko, D.M. (1991). Effects of biologically reduced surfactants on the mobility and
biodegradation of petroleum hydrocarbons. M.S. thesis. Virginia Polytechnic Institute
and State University, Blackburg, VA.
Felse, P. A.; Shah, V.; Chan, J.; Rao, K. J. and Gross, R. A. (2007). Sophorolipid
biosynthesis by Candida bombicola from industrial fatty acid residues. Enzyme
Microbiol. Technol. 40, 316-323.
Ferraz, C.; De Araújo, A. A. and Pastore, G. M. (2002). The influence of vegetable oils on
biosurfactant production by Serratia marcescens. Appl. Biochem. Biotechnol. 98 100,
841 847.
Fregapane, G.; Saney, D. B. and Vulfson, E. N. (1991). Enz. Microbiol. Technol. 13, 796-
800.
Gartshore, J.; Lim, Y. C. and Cooper, D. G. (2000). Quantitative analysis of biosurfactants
using Fourier Transform Infrared (FT-IR) spectroscopy. Biotechnol. Lett. 22, 169
172.
References
Gautam, K. K. and Tyagi, V. K. (2006). Microbial Surfactants: A Review. J. Oleo Sci. 55,
155-166.
Gerard, J., Lloyd, R.; Barsby, T.; Haden, P.; Kelly, M. T. and Andersen, R. J. (1997).
Massetolides A-H, antimycobacterial cyclic depsipeptides produced by two
pseudomonads isolated from marine habitats. J. Nat. Prod. 60, 223 9.
Gobbert, U.; Lang, S. and Wagner, F. (1984). Sophorose lipids formation by resting cells of
Torulopsis bombicola. Biotechnol. Lett. 6, 225-230.
Grangemard, I.; Wallach, J.; Maget-Dana, R. and Peypoux, F. (2001). Lichenysin: a more
efficient cation chelator than surfactin. Appl. Biochem. Biotechnol. 90, 199 210.
Grau, A.; Gomez Fernandez, J. C.; Peypoux, F. and Ortiz, A. (1999). A study on the
interactions of surfactin with phospholipid vesicles. Biochim. Biophys. Acta. 1418,
307 319.
Guerra-Santos, L. H.; Käppeli, O. and Fiechter, A. (1984). Pseudomonas aeruginosa
biosurfactant production in continuous culture with glucose as carbon source. Appl.
Environ. Microbiol. 48, 301-305.
Guerra-Santos, L.; Kappeli, O. and Fiechter, A. (1986). Dependence of Pseudomonas
aeruginosa continuous culture biosurfactant production on nutritional and environ-
mental factors. Appl. Microbiol. Biotechnol. 24, 443-448.
Guo, Y. P.; Hu, Y. Y.; Gu, R. R. and Lin, H. (2009). Characterization and micellization of
rhamnolipidic fractions and crude extracts produced by Pseudomonas aeruginosa
mutant MIG-N146. J. Colloid Interface Sci. 331, 356-363.
Haba, E.; Espuny, M. J.; Busquets, M. and Manresa, A. (2000). Screening and production of
rhamnolipids by Pseudomonas aeruginosa 47T2 NCIB 40044 from waste frying oils.
J. Appl. Microbiol. 88, 379 387.
References
Haba, E.; Abalos, A.; Jauregui, O.; Espuny, M. J. and Manresa, A. (2003). Use of liquid
chromatographymass spectroscopy for studying the composition and properties of
rhamnolipids produced by different strains of Pseudomonas aeruginosa. J Surfactants
Deterg. 6, 155 161.
Hamman, O. B.; de la Rubia, T. and Martinez, J. (1999). Decolorization of olive oil mill
wastewater by Phanerochaete flavido-alba. Environ. Toxicol. Chem. 18, 2410-2415.
Harley, J. and Prescott, L. (1990). Laboratory Exercises in Microbiology. Wm.C.Brown
Publishers. 49-53.
Health Protection Agency (2010a). Motility Test. National Standard Method BSOP TP 21
Issue 2.1. http://www.hpa-standardmethods.org.uk/pdf_sops.asp.
Health Protection Agency (2010b). Catalase Test. National Standard Method BSOP TP 8
Issue 2.1. http://www.hpa-standardmethods.org.uk/pdf_sops.asp.
Healy, M.G.; Devine, C.M. and Murphy, R. (1996). Microbial production of biosurfactants.
Resour. Conservat. Recycl. 18, 41 57.
Herman, D. C. and Maier, R. M. (2002). Biosynthesis and Applications of Glycolipid and
Lipopeptide Biosurfactants. In: T. M. Kuo, H. W. Gardner (eds.), Lipid
Biotechnology. Marcel Dekker, New York (USA), pp. 629 654.
Hewald, S. (2005). Genetic analysis of biosurfactant production in Ustilago maydis.Appl. Environ. Microbiol. 71, 3033-3040.
Heyd, M.; Kohnert, A.; Tan, T. H.; Nusser, F. M.; Kirschhöfer Brenner-Weiss, G.; Franzreb,
M. and Berensmeier, S. (2008). Development and trends of biosurfactant analysis and
purification using rhamnolipids as an example. Annu. Bioanal. Chem. 391, 1579-159.
Hirata, Y.; Ryu, M.; Oda, Y.; Igarashi, K.; Nagatsuka, A.; Furuta, T. and Sugiura,
M. (2009). Novel characteristics of sophorolipids, yeast glycolipid biosurfactants, as
biodegradable low-foaming surfactants. J. Biosci. Bioeng. 108, 142 146.
References
Hitsatsuka, K.; Nakahara, T.; Sano, N. and Yamada, K. (1971). Formation of a rhamnolipid
by Pseudomonas aeruginosa and its function in hydrocarbon fermentation. Agric.
Biol. Chem. 35, 686-692.
Hommel, R.; Stiwer, O.; Stuber, W.; Haferburg, D. and Kleber, H. P. (1987). Production of
water-soluble surface-active exolipids by Torulopsis apicola. Appl. Microbiol.
Biotechnol. 26, 199-205.
Hong, H. A.; Duc, L. H. and Cutting, S. M. (2005). The use of bacterial spore formers as
probiotics. FEMS Microbiol. Rev. 29, 813 835.
Hsueh-Chia, R. and Sawyer, M. S. (1998). An experimental study of flow and heat transfer.
Int. J. Heat Mass Trans. 41, 3559-3573.
Huy, N. Q.; Jin, S.; Amada, K.; Haruki, M.; Huu, N. B.; Hang, D. T.; Ha, D. T.; Imanaka, T.;
Morikawa, M. and Kanaya, S. (1999). Characterization of petroleum-degrading
bacteria from oil-contaminated sites in Vietnam. J. Biosci. Bioeng. 88, 100-102.
Inakollu, S.; Hung, H. and Shreve, G. S. (2004). Biosurfactant enhancement of microbial
degradation of various strructural classes of hydrocarbon in mixed waste systems.
Environ. Eng. Sci. 21, 463 469.
Ishigami, Y. and Suzuki, S. (1997). Development of biochemicals-functionalization of
biosurfactants and natural dyes. Prog. Org. Coatings. 31, 51 61.
Isoda, H.; Kitamoto, D.; Shinmoto, H.; Matsumura, M. and Nakahara, T. (1997). Microbial
extracellular glycolipid induction of differentiation and inhibition of protein kinase C
activity of human promyelocytic leukaemia cell line HL60. Biosci. Biotechnol.
Biochem. 61, 609 14.
Isoda, H.; Shinmoto, H.; Matsumura, M. and Nakahara, T. (1999). The neurite-initiating
effect of microbial extracellular glycolipids in PC12 cells. Cytotechnol.
31, 163 70.
References
Itokawa, H.; Miyashita, T.; Morita, H.; Takeya, K.; Hirano, T.; Homma, M. and Oka, K.
(1994). Structural and conformational studies of [Ile7] and [Leu7] surfactins from
Bacillus subtilis. Chem. Pharmacol. Bull. (Tokyo). 42, 604 7.
Jadhav, M.; Kalme, S.; Tamboli, D. and Govindwar, S. (2011). Rhamnolipid from
Pseudomonas desmolyticum NCIM-2112 and its role in the degradation of Brown
3REL. J. Basic Microbiol. 51, 1-12.
Jenny, K.; Kappeli, O. and Fietcher, A. (1991). Biosurfactants from Bacillus
licheniformis: structural analysis and characterization. Appl. Microbiol. Biotechnol. 36, 5 13.
Jeong, H. S.; Lim, D. J.; Hwang, S. H.; Ha, S. D. and Kong, J. Y. (2004). Rhamnolipid
production by Pseudomonas aeruginosa immobilized in polyvinyl alcohol beads.
Biotechnol. Lett. 26, 35 39.
Joseph, P. J. and Joseph, A. (2009). Microbial enhanced separation of oil from a petroleum
refinery sludge. J. Hazard Mater. 161,522 525.
Kaar, W.; Hartmann, B. M.; Fan, Y.; Zeng, B.; Lua, L. H.; Dexter, A. F.; Falconer, R. J. and
Middelberg, A. P. (2009). Microbial bio-production of a recombinant stimuli
responsive biosurfactant. Biotechnol. Bioeng. 102, 176 187.
Kameda, Y.; Ouchira, S.; Matsui, K.; Kanatomo, S. and Hase, T. (1974). Antitumor activity
of Bacillus natto V. Isolation and characterization of surfactin in the culture medium
of Bacillus natto KMD 2311. Chem. Pharm. Bull. (Tokyo). 22, 938 44.
Kanga, S. H.; Bonner, J. S.; Page, C. A.; Mills, M. A. and Autenrieth, R. L. (1997).
Solubilization of naphthalene and methyl-substituted naphthalenes from crude oil
using biosurfactants. Environ. Sci. and Technol. 31, 556 561.
Karanth, N. G. K.; Deo, P. G. and Veenanadig, N. K. (1999). Microbial production of
biosurfactants and their importance. In: Current Science, 77 (1). pp. 116-126.
References
Asselineau, C. and Asselineau, J. (1978). Trehalose Containing Glycolipids. Prog. Chem.
Ftas Lipids. 16, 59-99.
Kim, K.; Yoo, D.; Kim, Y.; Lee, B.; Shin, D. and Kim, E. K. (2002). Characteristics
sophorolipid as an antimicrobial agent. J. Microbiol. Biotechnol. 12, 235 241.
Kim, H.; Jeon, J. W.; Kim, B. H.; Ahn, C. Y.; Oh, H. M. and Yoon, B. D. (2006).
Extracellular production of a glycolipid biosurfactant, mannosylerythritol lipid, by
Candida sp. SY16 using fed batch fermentation. Appl. Microbiol. Biotechnol. 70,
391 396.
Kitamoto, D.; Yanagishita, H.; Shinbo, T.; Nakane, T.; Kamisava, C. and Nakahara, T.
(1993). Surface-active properties and antimicrobial activities of mannosylerythritol
lipids as biosurfactants produced by Candida antarctica. J. Biotechnol. 29, 91-96.
Koch, A.K.; Kappeli, O.; Fiechter, A. and Reiser, J. (1991). Hydrocarbon assimilation and
biosurfactant production in Pseudomonas aeruginosa mutants. J. Bacteriol. 173,
4212-4219.
Kosaric, N.; Choi, H. Y. and Bhaszczyk, R. (1990). Biosurfactant production from Nacardia
SFC-D. Tenside Surfact. Deterg. 27, 294-297.
Kosaric, N. (1992). Biosurfactants in industry. Pure Appl. Chem. 64, 1731 1737.
Kosaric, N. (2001). Biosurfactants and Their Application for Soil Bioremediation. Food
Technol. Biotechnol. 39, 295-304.
Kretschmer, A.; Bock, H. and Wagner, F. (1982). Chemical and Physical Characterization of
Interfacial Active Lipids from Rhodococcus erythropolis Grown on n-alkane. Appl.
Environ. Microbiol. 44, 864-870.
Kuiper, I.; Ellen, L.; Lagendijk, R. P.; Jeremy, P. D.; Gerda, E. M. L.; Jane, E. T.; Ben, J. J.
L. and Guido, V. B. (2004). Characterization of two Pseudomonas putida lipopeptide
References
biosurfactants, putisolvin I and II, which inhibit biofilm formation and break down
existing biofilms. Mol. Microbiol. 51, 97-113.
Kuyukina, M. S. (2001). Recovery of Rhodococcus biosurfactants using methyl tertiarybutyl
ether extraction. J. Microbiol. Methods. 46, 149-156.
Lai, C. C.; Huang, Y. C.; Wei, Y. H. and Chang, J. S. (2009). Biosurfactant-enhanced
removal of total petroleum hydrocarbons from contaminated soil. J. Hazard. Mater.
167, 609-614.
Landman, D.; Georgescu, C.; Martin, D. A. and Quale, J. (2008). Polymyxins revisited. Clin.
Microbiol. Rev. 21, 449 465.
Lane, D. J. (1991). 16S/23S rRNA sequencing, In: E. Stackebrandt, M. Goodfellow (Eds.),
Nucleic acid techniques in bacterial systematic. John Wiley and Sons Inc., London,
pp. 115 175.
Lang, S. and Wagner, F. (1987). Structure and properties of biosurfactants. In: N. Kosaric,
W.L. Cairns, N.C.C. Gray (eds.), Biosurfactants and Biotechnology. Marcel Dekker,
New York, pp. 21 45.
Lang, S. and Wullbrandt, D. (1999). Rhamnose lipids-biosynthesis, microbial production and
application potential. Appl. Microbiol. Biotechnol. 51, 22 32. Lang, S. (2002).
Biological amphiphiles (microbial biosurfactants). Curr. Opin. Colloid Inter. Sci.7,
12 20.
Levy, N.; Bar-or, Y. and Magdassi, S. (1990). Flocculation of bentonite particles by
acyanobacterial bioflocculant. Colloid Surface. 48, 337 349.
Li, Y. Z.; Lang, S.; Wagner, F.; Witte, L. and Wray, V. (1984). Formation and Identification
of Interfacial-active Glycolipids From Resulting Microbial Cells of Arthrobacter sp.
and Potential Use in Tertiary Oil Recovery. Appl. Environ. Microbiol. 48, 610-617.
References
Lin, S.; Carswell, K. and Sharma, M. (1994). Continuous production of the lipopeptide
biosurfactant of Bacillus licheniformis JF-2. Appl. Microbiol. Biotechnol. 41, 281 5.
Lin, S. (1996). Biosurfactants: recent advances. J. Chem. Technol. Biotechnol. 66, 109 20.
Liu, Q. and Li, Q. (2005). Breeding of biosurfactant producing strain. Weishengwuxue Zazhi.
25, 54-56.
Lotfabad, T. B.; Shourian, M.; Roostaazad, R.; Najafabadi, A. R.; Adelzadeh, M. R. and
Noghabi, K. A. (2009). An efficient biosurfactant-producing bacterium Pseudomonas
aeruginosa MR01, isolated from oil excavation areas in south of Iran. Coll. Surf. B:
Biointer. 69, 183 193.
Mahon, C. R., Lehman, D. C. and Manuselis, G. (2007). Textbook of Diagnostic .3rd Ed., St.
Louis: Saunders. PP. 215-216.
Maier, R. M. and Soberón-Chávez, G. (2000). Pseudomonas aeruginosa rhamnolipids:
biosynthesis and potential applications. Appl. Microbiol. Biotechnol. 54, 625 633.
Makkar, R.S. and Cameotra, S.S. (2002). An update on the use of unconventional substrates
for biosurfactant production and their new applications. Appl. Microbiol. Biotechnol.
58, 428-434.
Maqsood, M. I. and Jamal, A. (2011). Factors affecting the rhamnolipid biosurfactant
production. Pak. J. Biotechnol. 8, 1-5.
Margaritis, A.; Zajic, J. E. and Gerson, D. F. (1979). Production and surface-active properties
of microbial surfactants. Biotechnol. Bioeng. 21, 1151-1162.
Maria, V. P.; Rocha, M. C. M.; Benedicto, S. C. L.; Bezerra, M. S.; Macedo, G. R.; Saavedra,
G. A. and Gonçalves, L. R. B. (2007). Production of Biosurfactant by Pseudomonas
aeruginosa Grown on Cashew Apple Juice. Humana Press Inc. 07, 136-140.
References
Marques, I. P. (2001). Anaerobic digestion treatment of olive mill wastewater for effluent re-
use in irrigation. Desalination. 137, 233-239.
Martins, V. G.; Kalil, S. J.; Bertolin, T. E. and Costa, J. A. (2006). Solid state biosurfactant
production in a fixed-bed column bioreactor. Z. Naturforsch. [C]. 61, 721 726.
Mata-Sandoval, J. C.; Karns, J. and Torrents, A. (1999). High-performance liquid
chromatography method for the characterization of rhamnolipid mixtures produced by
pseudomonas aeruginosa UG2 on corn oil. J. Chromatogr. A. 864, 211-220.
Mechaly, A.; Belakhov, V. ; Shoham, Y. and Baasov, T. (1997). An efficient chemical-
enzymatic synthesis of 4-nitrophenyl [beta]-xylobioside: a chromogenic substrate for
xylanases. Carbohydr. Res. 304, 111 115.
Mittenbuhler, K.; Loleit, M.; Baier, W.; Fischer, B.; Sedelmeier, E.; Jung, G.; Winkelmann,
G.; Jacobi, C.; Weckesser, J.; Erhard, M. H.; Hofmann, A.; Bessler, W. and
Hoffmann, P. (1997). Drug specific antibodies: T-cell epitope-lipopeptide conjugates
are potent adjuvants for small antigens in vivo and in vitro. Int J Immunopharmacol.
19, 277 87.
Monteiro, S. A.; Sassaki, G. L.; de Souza, L. M.; Meira, J. A.; de Araujo, J. M.; Mitchell, D.
A.; Ramos, L. P. and Krieger, N. (2007). Molecular and structural characterization of
the biosurfactant produced by Pseudomonas aeruginosa DAUPE 614. Chem. Phys.
Lipids. 147, 1 13.
Montet, D.; Servat, F.; Pina, M.; Graille, J.; Galzy, P.; Arnaud, A.; Ledon, H. and Marcou, L.
(1990). Enzymatic synthesis of N- -acyllysines. 67,
771 774.
Morikawa, M.; Daido, H. and Takao, T.; Murata, S.; Shimonishi, Y. and Imanaka, T. (1993).
A new lipopeptide biosurfactant produced by Arthrobacter sp. strain MIS38. J.
Bacteriol. 175, 6459 66.
References
Morikawa, M.; Hirata, Y. and Imanaka, T. (2000). A Study on the structure-function
relationship of lipopeptides biosurfactants. Biochim. Biophys. Acta. 1488, 211-218.
Mukherjee, S.; Das, P. and Sen, R. (2006). Towards commercial production of microbial
surfactants. Trends Biotechnol. 24, 509 515.
Mukherjee, A. K. (2007). Potential application of cyclic lipopeptides biosurfactants produced
by Bacillus subtilis in laundry detergent formulations. Lett. Appl. Microbiol. 45, 330
335.
Mulligan, C.N. and Gibbs, B.F. (1993). Factors influencing the economics of biosurfactants.
In: N. Kosaric (ed.), Biosurfactants, Production, Properties, Applications. Marcel
Dekker, New York, pp. 329 371.
Mulligan, C. N.; Yong, R. N. and Gibbs, B. F. (2001). Remediation technologies for metal
contaminated soils and groundwater: an evaluation. Eng. Geol. 60, 193-207.
Mulligan, C. N. and Gibbs, B. F. (2004). Types, production and applications of
biosurfactants. Proc. Indian Nat. Sci. Acad. 1, 31 55.
Muthusamy, K.; Gopalakrishnan, S.; Ravi, T. K. and Sivachidambaram, P. (2008).
Biosurfactants: properties, commercial production and application. Curr. Sci. 94, 736-
774.
Nakayama, S.; Takahashi, S.; Hirai, M. and Shoda, M. (1997). Isolation of new variants of
surfactin by a recombinant Bacillus subtilis. Appl. Microbiol. Biotechnol. 48, 80 82.
Naruse, N.; Tenmyo, O.; Kobaru, S.; Kamei, H.; Miyaki, T.; Konishi, M. and Oki, T. (1990).
Pumilacidin, a complex of new antiviral antibiotics: production, isolation, chemical
properties, structure and biological activity. J. Antibiot. (Tokyo). 43, 267 80.
Neidleman, S. L. and Geigert, J. (1984). Biotechnology and oleochemicals: changing
patterns. J. American Oil Chem. Soci. 61, 290-297.
References
Nerurkar, A. S.; Hingurao, K. S. and Suthar, H. G. (2009). Bioemulsfiers from marine
microorganisms. J. Sci. Indust. Res. 68, 273-277.
Neto, D. C.; Meira, J. A.; Tiburtius, E.; Zamora, P. P.; Bugay, C.; Mitchell, D. A. and
Krieger, N. (2009). Production of rhamnolipids in solid-state cultivation:
Characterization, downstream processing and application in the cleaning of
contaminated soils. Biotechnol. J. 4, 748 755.
Neu, T.; Hartner, T. and Poralla, K. (1990). Surface active properties of viscosin: a
peptidolipid antibiotic. Appl. Microbiol. Biotechnol. 32, 518 520.
Neu, T. R. (1996). Significance of bacterial surface-active compounds in interaction of
bacteria with interfaces. Microbiol. Rev. 60, 151 166.
Nguyen, T. T.; Youssef, N. H.; McInerney, M. J. and Sabatini, D. A. (2008). Rhamnolipid
biosurfactant mixtures for environmental remediation. Water Res. 42, 1735 1743.
Niaounakis, M. and Halvadakis, C. P. (2004). Olive-Mill Waste Management: Literature
Review and Patent Survey. Typothito -George Dardanos, Greece.
Nievas, M. L.; Commendatore, M. G.; Estevas, J. L. and Bucalá, V.(2008). Biodegradation
pattern of hydrocarbons from a fuel oil-type complex residue by an emulsifier-
producing microbial consortium. J. Hazard. Mater. 154, 96 104.
Nitschke, M. and Pastore, G. M. (2003). Cassava flour wastewater as a substrate for
biosurfactant production. Appl. Biochem. Biotechnol. 106, 295-302.
Nitschke, M. et al. (2005). Oil wastes as unconventional substrates for rhamnolipid
biosurfactant production by Pseudomonas aeruginosa LB1. Biotechnol. Prog. 21,
1562 1566.
References
Nitschke, M. and Pastore, G. (2006). Production and properties of a surfactant obtained from
Bacillus subtilis grown on cassava wastewater. Bioresource Technol. 97, 336-341.
Nitschke, M. and Costa, S. (2007). Biosurfactants in food industry. Trends Food Sci.
Technol. 18, 252 259.
Nitschke, M.; Costa, S. G. and Contiero, J. (2009). Structure and applications of a
rhamnolipid surfactant produced in soybean oil waste. Appl. Biochem. Biotechnol.
160, 2066 2074.
Noah, K. S. (2005). Surfactin production from potato process effluent by Bacillus subtilis in a
chemostat. Appl. Biochem. Biotechnol. 122, 465-474.
Nord, C. E.; Lindberg, A. A. and Dahlback, A. (1974). Evaluation of five test kits API, Auxo
Tab, Enterotube, Patho Tech and R/B for identification of Enterobacteriaceae. Med.
Microbiol. Immunol. 159, 211-220.
Obayori, O. S.; Ilori, M. O.; Adebusoye, S. A.; Oyetibo, G. O.; Omotayo, A. E. and Amund,
O. O. (2009). Degradation of hydrocarbons and biosurfactant production by
Pseudomonas sp. strain LP1. World J. Microbiol. Biotechnol. 25, 1615 1623.
Oberbremer, A.; Muller-Hurtig, R. and Wagner, F. (1990). Effect of the addition of microbial
surfactants on hydrocarbon degradation in a soil population in a stirred reactor. Appl.
Microbiol. Biotechnol. 32, 485 489.
Ochsner, U. A.; Hembach, T. and Fietcher, A. (1995). Production of rhamnolipid
biosurfactants. Biotechnol. 53, 90 117.
Pacwa- -Seget, Z. and Cameotra, S.S. (2011).
Environmental Applications of Biosurfactants: Recent Advances. Int. J. Mol. Sci.12,
633-654.
References
Panesar, R.; Panesar, P.S.; Hasija, D.; Bera, M.B. and Kumar, H. (2009). Fermentative
potential of Pseudomonas aeruginosa strain for biosurfactant production. Biol.
Forum- Inter. J. 1, 109-112.
Papanikolaou, S.; Galiotou-Panayotou, M.; Fakas, S.; Komaitis, M. and Aggelis, G. (2008).
Citric acid production by Yarrowia lipolytica cultivated on olive-mill wastewater-
based media. Bioresource Technol. 99, 2419-2428.
Parra, J. L.; Guinea, J.; Manresa, M. R.; Mercade, M. E.; Comelles, F. and Bosch, M. P.
(1989). Chemical characterization and physico-chemical behaviour of biosurfactants.
J. Am. Oil. Chem. Soc. 66, 141 145.
Patel, R. M. and Desai, A. J. (1997). Biosurfactant production by Pseudomonas aeruginosa
GS3 from molasses. Lett. Appl. Microbiol. 25, 91-94.
Pekin, G.; Vardar-Sukan, F. and Kosaric, N. (2005). Production of sophorolipids from
Candida bombicola ATCC 22214 using Turkish corn oil and honey. Eng. Life Sci. 5,
357 362.
Perfumo, A.; Rancich, I. and Banat, I. M. (2010). Possibilities and challenges for
advances in experimental medicine and biology. Springer, Berlin, pp. 135 157.
Peypoux, F.; Bonmatin, J. M. and Wallach, J. (1999). Recent trends in the biochemistry of
surfactin. Appl. Microbiol. Biotechnol. 51, 553 563.
thermophilic biosurfactant-producing bacteria from hydrocarbon-contaminated and
bioremediated soils. J. Petro. Sci. Eng. 50, 71 77.
Pornsunthorntawee, O.; Wongpanit, P.; Chavadej, S.; Abe, M. and Rujiravanit, R. (2008).
Structural and physicochemical characterization of crude biosurfactant produced by
Pseudomonas aeruginosa SP4 isolated from petroleum-contaminated soil. Bioresour.
Technol. 99, 1589 1595.
References
Powalla, M.; Lang, S. and Wray, V. (1989). Penta- and disaccharide lipid formation by
Nocardia corynebacteroides grown on n-alkanes. Appl. Microbiol. Biotechnol. 31,
473-479.
Pratt-Terpstra, I. H.; Weerkamp, A. H and Busscher, H. J. (1989). Microbial factors in a
thermodynamic approach of oral streptococcal adhesion to solid substrata. J. Colloid
Interface Sci. 129, 568 74.
Priya, T. and Usharani, G. (2009). Comparative Study for Biosurfactant Production by
Using Bacillus subtilis and Pseudomonas aeruginosa. Bot. Res. Inter. 2, 284-287.
Qureshi, N.; Lolas, A. and Blaschek, H. P. (2001). Soy molasses as fermentation substrate for
production of butanol using Clostridium beijerinckii BA101. J. Indust. Microbiol.
Biotechnol. 26, 290-295.
Rahman, K. S. M.; Rahman, T. J.; McClean, S.; Marchant, R. and Banat, I. M. (2002).
Rhamnolipid biosurfactant production by strains of Pseudomonas aeruginosa using
low-cost raw materials. Biotechnol. Prog. 18, 1277 1281.
Rahman, K. S. M.; Rahman, T. J.; Lakshmanaperumalsamy, P.; Marchant, R.and Banat, I. M.
(2003). The potential of bacterial isolates for emulsification with range of
hydrocarbons. Acta Biotechnol. 4, 335 345.
Ramana, K. V. and Karanth, N. G. (1989). Factors affecting biosurfactant production using
Pseudomonas aeruginosa CFTR-6 under submerged conditions. J. Chem. Technol.
Biotechnol. 45, 249-257.
Ramisse, F.; Delden, C., Gidenne, S.; Cavallo, J. and Hernandez, E. (2000). Decreased
virulence of a strain of Pseudomonas aeruginosa O12 overexpressing a chromosomal
type 1 b-lactamase could be due to reduced expression of cell-to-cell signalling
dependent virulence factors. FEMS Immunol. Med. Microbiol. 28, 241 5.
References
Rapp, P.; Bock, H.; Wray, V. and Wagner F. (1979). Formation, Isolation and
Characterization of Trehalose Dimycolates from Rhodococcus erythropolis Grown on
n-alkanes. J. Gen. Microbiol. 115, 491-503.
Reid, G.; Zalai, C. and Gardiner, G. (1984). Urogenital Lactobacilli probiotics, reliability,
and regulatory issues. J. Dairy Sci. 84, 164 9.
Reid, G.; Heinemann, C.; Velraeds, M.; van der Mei, H. C. and Busscher, H. J. (1999).
Biosurfactants produced by Lactobacillus. Methods Enzymol. 310, 426 33.
Reiling, H. E. (1986). Pilot plant production of rhamnolipid biosurfactant by Pseudomonas
aeruginosa. Appl. Environ. Microbiol. 51, 985-989.
Remichkova, M.; Galabova, D.; Roeva, I.; Karpenko, E.; Shulga, A. and Galabov, A. S.
(2008). Anti-herpesvirus activities of Pseudomonas sp S-17 rhamnolipid and its
complex with alginate. Z. Naturforsch C. 63, 75 81.
Rendell, N. B.; Taylor, G. W.; Somerville, M.; Todd, H; Wilson, R. and Cole, P. J. (1990).
Characterization of Pseudomonas rhamnolipids. Biochem. Biophys. Acta. 1045, 189-
193.
and biosurfactants production from hydrolyzed distilled grape marc. Proc. Biochem.
42, 1010-1020.
Robert, M.; Mercade, M. E.; Bosch, M. P.; Parra, J. L.; Espuny, M. J.; Manresa, M. A. and
Guinea, J. (1989). Effect of the carbon source on biosurfactant production by
Pseudomonas aeruginosa 44T. Biotechnol. Lett. 11, 871-874.
Rodrigues, L. R.; van der Mei, H. C.; Teixeira, J. and Oliveira, R. (2004a). Influence of
biosurfactants from probiotic bacteria on formation of biofilms on voice prostheses.
Appl. Environ. Microbiol. 70, 4408 10.
References
Rodrigues, L. R.; Van der Mei, H. C.; Teixeira, J. and Oliveira, R. (2004b). Biosurfactant from
Lactococcus lactis 53 inhibits microbial adhesion on silicone rubber. Appl. Microbiol.
Biotechnol. 66, 306 11.
Rodrigues, L.; Banat, I. M.; Teixeira, J. and Oliveira, R. (2006a). Biosurfactants: potential
applications in medicine. J. Antimicrob. Chemoth. 57, 609 618.
Rodrigues, L. R.; Banat, I. M.; Van der Mei, H. C.; Teixeira, J. A. and Oliveira, R. (2006b).
Interference in adhesion of bacteria and yeasts isolated from explanted voice
prostheses to silicone rubber by rhamnolipid biosurfactants. J. Appl. Microbiol. 100,
470-80.
Rodrigues, L. R.; Van der Mei, H. C.; Banat, I. M.; Teixeira, J. and Oliveira, R. (2006c).
Inhibition of microbial adhesion to silicone rubber treated with biosurfactant from
Streptococcus thermophilus A. FEMS Immunol. Med. Microbiol. 46, 107 12.
Rodrigues, L. R.; Teixeira, J. A.; van der Mei, H. C. and Oliveira, R. (2006d).
Physicochemical and funtional characterization of a biosurfactant produced by
Lactococcus lactis 53. Colloids Surf. B. 49, 79 86.
Ron, E. Z. and Rosenberg, E. (2001). Natural roles of biosurfactants. Environ. Microbiol. 3,
229-236.
Rosen, M.J. (1978). Surfactants and Interfacial Phenomena. John Wiley and Sons, New York.
Rosenberg, E.; Zuckerberg, A.; Rubinovitz, C. and Gutnick, D. L. (1979). Emulsifier of
Arthrobacter RAG-1: isolation and emulsifying properties. Appl. Environ. Microbiol.
37, 402 408.
Rosenberg, E.; Rubinovitz, C.; Gottlieb, A.; Rosenhak, S. and Ron, E. Z. (1988). Production
of biodispersan by Acinetobacter calcoaceticus A2. Appl. Environ. Microbiol. 54,
317-322.
References
Rosenberg, E. and Ron, E. Z. (1997). Bioemulsans: microbial polymeric emulsifiers. Curr.
Opin. Biotechnol. 8, 313 316.
Rosenberg, E. and Ron, E. Z. (1999). High- and low-molecular-mass microbial surfactants.
Appl. Microbiol. Biotechnol. 52, 154 162.
Saharan, B. S.; Sahu, R. K. and Sharma D. (2011). A Review on Biosurfactants:
Fermentation, Current Developments and Perspectives. Gen. Eng. Biotechnol J. 2011:
GEBJ-29, accepted version.
Saini, H. S.; Barragán-Huerta, B. E.; Lebrón-Paler, A.; Pemberton, J. E.; Vázquez, R. R.;
Burns, A. M.; Marron, M. T.; Seliga, C. J.; Gunatilaka, A. A. and Maier, R. M.
(2008). Efficient purification of the biosurfactant viscosin from Pseudomonas
libanensis strain M9-3 and its physicochemical and biological properties. J. Nat.
Prod. 71, 1011-1015.
Santos, A. S.; Sampaio, A. P.; Vasquez, G. S.; Santa Anna, L. M.; Pereira, N. and Freire, J.
D. M. (2002). Evaluation of different carbon and nitrogen sources in production of
rhamnolipids by a strain of Pseudomonas aeruginosa. Appl. Biochem. Biotechnol. 98-
100, 1025-1035.
Samson, R.; Cseh, T.; Hawari, J.; Greer, C.W. and Zaloum, R. (1990). Biotechnologies
physico chimique et biologique pour les sols contaminés par des BPC. Science et
Techniq 23, 15 18.
Sarachat, T.; Pornsunthorntawee, O.; Chavadej, S. and Rujiravanit, R. (2010). Purification
and concentration of a rhamnolipid biosurfactant produced by Pseudomonas
aeruginosa SP4 using foam fractionation. Bioresource Technol. 101, 324-330.
Sarubbo, L. A.; Marcal, M. C.; Neves, M. L. C.; Silva, M. C.; Porto, A. L. F. and Campos-
Takaki, G. M. (2001). Bioemulsifier production in batch culture using glucose as
carbon source by Candida lipolytica. Appl. Biochem. Biotechnol. 95, 59-68.
References
Sarubbo, L. A.; Luna J. M. and Campos-Takaki, G. M. (2006). Production and stability
studies of the bioemulsifier obtained from a new strain of Candida glabrata UCP
1002. Electron. J. Biotechnol. 9, 401-406.
Satpute, S. K.; Banpurkar, A. G.; Dhakephalkar, P. K.; Banat, I. M. and Chopade, B. A.
(2010). Methods for investigating biosurfactants and bioemulsifiers: a review. Crit.
Rev. Biotechnol. 2010, 1-18.
Sen, R. and Swaminathan, T. (2004). Response surface modeling and optimization to
elucidate the effects of inoculum age & size on surfactin production. Biochem. Eng. J.
21, 141-148.
Sen, R. and Swaminathan, T. (2005). Characterization of concentration and purification
parameters and operating conditions for the small-scale recovery of surfactin. Proc.
Biochem. 40, 2953-2958.
Sen, R. (2008). Biotechnology in petroleum recovery: the microbial EOR. Prog. Energ.
Combust. 34, 714 724.
Sen, R. D.; Basu, J. K. and Goswami, D. S. (2010). Surfactant anhanced ricinoleic acid
production using Candida rugosa lipase. Bioresource Technol. 101, 613-619.
Shah, V.; Doncel, G. F.; Seyoum, T.; Eaton, K. M.; Zalenskaya, I.; Hagver, R.; Remichkova,
M.; Galabova, D.; Roeva, I.; Karpenko, E.; Shulga, A. and Galabov, A. S. (2008).
Anti-herpesvirus activities of Pseudomonas sp. S-17 rhamnolipid and its complex
with alginate. Z. Naturforsch. C. 63, 75 81.
Sheppard, J. D. and Cooper, D. G. (1990). The effect of a biosurfactant on oxygen transfer in
a cyclone column reactor. J. Chem. Technol. Biotechnol. 48, 325-336.
Sheppard, J. D.; Jumarie, C.; Cooper, D. G. and Laprade, R. (1991). Ionic channels induced
by surfactin in plannar lipid bilayer membranes. Biochim. Biophys. Acta. 1064, 13
23.
References
Shibahara, M.; Zhao, X.; Wakamatsu, Y.; Nomura, N.; Nakahara, T.; Jin, C.; Nagaso, H.;
Murata, T. and Yokoyama, k. k. (2000). Mannosylerythritol lipid increases levels of
galactoceramide in and neurite outgrowth from PC12 pheochromocytoma cells.
Cytotechnol. 33, 247 51.
Siddhartha, G. V.; Costa, A. O.; Lépine, F.; Milot, S.; Déziel, E. and Nitschke, M. (2009).
Cassava wastewater as a substrate for the simultaneous production of rhamnolipids
and polyhydroxyalkanoates by Pseudomonas aeruginosa. J. Indust. Microbiol.
Biotechnol. 36, 1063-1072.
Sim, L.; Ward, O. P. and Li, Z. Y. (1997). Production and characterisation of a biosurfactant
isolated from Pseudomonas aeruginosa UW-1. J. Ind. Microbiol. Biotechnol. 19, 232-
238.
Singh, M.; Saini, V. S.; Adhikari, D. K.; Desai, J. D. and Sista, V. R. (1990). Production of
bioemulsifier by producing strain of Candida tropicalis during hydrocarbon
fermentation. Biotechnol. Lett. 12, 743-746.
Singh, P. and Cameotra, S. S. (2004). Potential applications of microbial surfactants in
biomedical sciences. Trends Biotechnol. 22, 142 146.
Singh, A.; van Hamme, J. D. and Ward, O. P. (2007). Surfactants in microbiology and
biotechnology: part 2. Application aspects. Biotechnol. Adv. 25, 99 121.
Smith, P. B.; Tomfohrde, K. M.; Rhoden, D. L. and Balows, A. (1972). API system: a
multitube micromethod for identification of Enterobacteriaceae. Appl. Microbiol. 24,
449-452.
Smyth, T. J. P.; Perfumo, A.; Marchant, R. and Banat, I. M. (2010a). Isolation and analysis of
low molecular weight microbial glycolipids. In: K. N. Timmis (ed.), Handbook of
hydrocarbon and lipid microbiology. Springer, Berlin, pp 3705 3723.
References
Smyth, T. J. P.; Perfumo, A.; McClean, S.; Marchant, R. and Banat, I. M. (2010b). Isolation
and analysis of lipopeptides and high molecular weight biosurfactants. In: K. N.
Timmis (ed.), Handbook of hydrocarbon and lipid microbiology. Springer, Berlin, pp
3689 3704.
Soberón-Chávez, G. and Maier, R.M. (2011). Biosurfactants: a General Overview. In: G.
Soberón-Chávez (ed.), Biosurfactants. Springer-Verlag, Berlin, Germany, pp. 1 11.
Sobrinho, H. B. S.; Rufino, R. D.; Luna, J. M.; Salgueiro, A. A.; Campos-Takaki, G. M.;
Leite, L. F. C. and Sarubbo, L. A. (2008). Utilization of two agro industrial by-
products for the production of a surfactant by Candida sphaerica UCP0995. Proc.
Biochem. 43, 912-917.
sophorolipids by Candida bombicola grown on soy molasses as substrate. Biotechnol.
Lett. 26, 1241-1245.
Solaiman, D. K. Y.; Ashby, R. D.; Hotchkiss, J. A.T. and Foglia, T. A. (2006). Biosynthesis
of mediumchain- length poly-hydroxyalkanoates from soy molasses. Biotechnol. Lett.
28, 157-162.
Stanghellini, M. E. and Miller, R. M. (1997). Biosurfactants: their identity and potential
efficacy in the biological control of zoosporic plant pathogens. Plant Dis. 81, 4 12.
Suthar, H.; Hingurao, K.; Desai, A. and Nerurkar, A. (2008). Evaluation of bioemulsi, fier
mediated microbial enhanced oil recovery using sand pack column. J. Microbiol.
Methods. 75, 225 230.
Sutyak, K. E.; Wirawan, R. E.; Aroutcheva, A. A. and Chiindas, M. L. (2008). Isolation of
the Bacillus subtilis antimicrobial peptide subtilosin from the dairy product derived
Bacillus amyliquefaceiens. J. Appl. Microbiol. 104, 1067-1074.
References
Syldatk, C. S.; Lang, S. and Wagner, F. (1985a). Chemical and physical characterization of
four interfacial-active rhamnolipids from Pseudomonas sp. DSM2874 gown on n-
alkanes. Zeitschrift für Naturforschung C. 40, 51-60.
Syldatk, C. S.; Lang, S.; Matulovic, U. and Wagner, F. (1985b). Production of four interfacial
active rhamnolipids from n-alkanes or glycerol by resting cells of Pseudomonas sp.
DSM2874. Zeitschrift für Naturforschung C. 40, 61-67.
Syldatk, C. and Hausmann, R. (2010). Microbial biosurfactants. Euro. J. Lipid Sci. Technol.
112, 615 616.
Tamura, K.; Dudley, J.; Nei, M. and Kumar, S. (2007). MEGA4: Molecular Evolutionary
Genetics Analysis (MEGA) software version 4.0. Mol. Biol. Evol. 24, 1596-1599.
Tanaka, Y.; Takashi, T. and Kazuhik, U. (1997). Method of producing iturin A and antifungal
agent for profound mycosis. Biotechnol. Adv. 15, 234 5.
Teichmann et al. (2007). A biosynthetic gene cluster for a secreted cellobiose lipid with
antifungal activity from Ustilago maydis. Mol. Microbiol. 66, 525- 533.
Thimon, L.; Peypoux, F. and Michel, G. (1992). Interaction of surfactin, a biosurfactant from
Bacillus subtilis, with inorganic cations. Biotechnol. Lett. 14, 713-718.
Thimon, L.; Peypoux, F.; Wallach, J. and Michel, G. (1995). Effect of lipopeptides antibiotic,
iturin A, on morphology and membrane ultra structure of yeast cells. FEMS
Microbiol. Lett. 128, 101 6.
Thompson, D. N. (2000). Biosurfactants from potato process effluents. Appl. Biochem.
Biotechnol. 84, 917-930.
Trummler, K.; Effenberger, F. and Syldatk, C. (2003). An integrated microbial/enzymatic
process for production of rhamnolipids andl-(+)-rhamnose from rapeseed oil with
Pseudomonas sp. DSM 2874. Eur. J. Lipid. Sci. Tech. 105, 563 571.
References
Uchida, Y.; Misava, S. and Nakahara, T. et al. (1989a). Factors affecting the formation of
succinoyltrehalose lipids by Rhodococcus erythropolis SD-74 grown on n-alkanes.
Agric. Biol. Chem. 53, 765 9.
Uchida, Y.; Tsuchiya, R. and Chino, M. et al. (1989b). Extracellular accumulation of mono
and di succinyl trehalose lipids by a strain of Rodococcus erythropolis grown on n-
alkanes. Agric. Biol. Chem. 53, 757 63.
Urum, K., T. (2004). Evaluation of biosurfactants for crude oil contaminated soil washing.
Chemosphere. 57, 1139 1150.
Van Bogaert, I. N. A.; Saerens, K.; De Muynck, C.; Develter, D.; Wim, S. and Vandamme,
E. J. (2007). Microbial production and application of sophorolipids. Appl. Microbiol.
Biotechnol. 76, 23 34.
Van Delden, C. and Iglewski, B. (1998). Cell-to-cell signaling and Pseudomonas aeruginosa
infections. Emerg. Infect. Dis. 4, 551 60.
Van Dyke, M. I.; Couture, P.; Brauer, M.; Lee, H. and Trevors, J. T. (1993). Pesudomonas
aeruginosa UG2 rhamnolipid biosurfactants: Structural characterization and their use
in removing hydrophobic compounds from soil. Can. J. Microbiol. 39, 1071-1078.
Vance-Harrop, M. H.; de Gusmão, N. B. and de Campos-Takaki, G. M. (2003). New
bioemulsifiers produced by Candida lipolytica using D-Glucose and Babassu oil as
carbon sources. Braz. J. Microbiol. 34, 120 123.
Van Hoogmoed, C. G.; Van der Kuijl-Booij, M.; Van der Mei, H. C. and Busscher, H. J.
(2000). Inhibition of Streptococcus mutans NS adhesion to glass with and without a
salivary conditioning film by biosurfactant-releasing Streptococcus mitis strain. Appl.
Environ. Microbiol. 66, 659 63.
Vater, J.; Kablitz, B.; Wilde, C.; Frank, P.; Mehta, N. and Cameotra, S. S. (2002). Matrix-
assisted laser desorption ionization time of flight mass spectrometry of lipopeptide
References
biosurin whole cells and culture filtrates of Bacillus subtilis C-1 isolated from
petroleum sludge. Appl. Environ. Microbiol. 68, 6210 6219.
Velraeds, M.; Van der Mei, H. C.; Reid, G. and Busscher, H. J. (1996a). Physicochemical and
biochemical characterization of biosurfactants released by Lactobacillus strains.
Colloids Surf. B Biointerfaces. 8, 51 61.
Velraeds, M.; Van der Mei, H. C.; Reid, G. and Busscher, H. J. (1996b). Inhibition of initial
adhesion of uropathogenic Enterococcus faecalis by biosurfactants from
Lactobacillus isolates. Appl. Environ. Microbiol. 62, 1958 63.
Velraeds, M.; Van der Mei, H. C.; Reid, G. and Busscher, H. J. (1997). Inibition of initial
adhesion of uropathogenic enterococcus faecalis to solid substrata by an adsorbed
biosurfactant layer from Lactobacillus acidophilus. Urology. 49, 790 4.
Vollenbroich, D.; Pauli, G.; Ozel, M. and Vater, J. (1997a). Antimycoplasma properties and
applications in cell culture of surfactin, a lipopeptide antibiotic from Bacillus subtilis.
Appl. Environ. Microbiol. 63, 44 9.
Vollenbroich, D.; Ozel, M.; Vater, J.; Kamp, R. M. and Pauli, G. (1997b). Mechanism of
inactivation of enveloped viruses by the biosurfactant surfactin from Bacillus subtilis.
Biologicals. 25, 289 97.
Wakamatsu, Y.; Zhao, X.; Jin, C.; Day, N.; Shibahara, M.; Nomura, N.; Nakahara, T.;
Murata, T. and Yokoyama, K. K. (2001). Mannosylerythritol lipid induces
characteristics of neuronal differentiation in PC12 cells through an ERK-related signal
cascade. Eur. J. Biochem. 268, 374 83.
Wang, S. D. and Wang, D. I. C. (1990). Mechanisms for biopolymer accumulation in
immobilized Acinetobacter calcoaceticus system. Biotechnol. Bioeng. 36, 402-410.
Washington, J. A.; Yu, P. K. W. and Martin, W. J. (1971). Evaluation of accuracy of multi
test method system for identification of Enterobacteriaceae. Appl. Microbiol. 22, 267-
269.
References
Whang, L. M.; Liu, P. W. G.; Ma, C. C. and Cheng, S. S. (2008). Application of
biosurfactant, rhamnolipid, and surfactin, for enhanced biodegradation of diesel-
contaminated water and soil. J. Hazard. Mater. 151, 155 163.
Wei, Y.H. and Chu, I.M. (1998). Enhancement of surfactin production in iron-enriched
media by Bacillus subtilis ATCC 21332. Enzyme Microb. Technol. 22, 724 728.
Wei, Y.H.; Chou, C.L. and Chang, J.S. (2005). Rhamnolipid production by indigenous
Pseudomonas aeruginosa J4 originating from petrochemical wastewater, Biochem.
Eng. J. 27, 146 154.
Wu, J. Y.; Yeh, K. L.; Lu, W. B.; Lin, C. L. and Chang, J. S. (2008). Rhamnolipid production
with indigenous Pseudomonas aeruginosa EM1 isolated from oil-contaminated site.
Bioresour. Technol. 99, 1157 1164.
Yadav, R. P.; Saxena, R. K.; Gupta, R. and Davidson, S. (1997). J. Sci. Indust. Res. 56, 479-
248.
Yakimov, M.; Timmis, K.; Wray, V. and Fredrickson, H. L. (1995). Characterization of a
new lipopeptide surfactant produced by thermotolerant and halotolerant subsurface
Bacillus licheniformis BAS50. Appl. Environ. Microbiol. 61, 1706 13.
Yakimov, M.; Amro, M. and Bock, M. (1997). The potential of Bacillus licheniformis strains
for in situ enhanced oil recovery. J. Petrol. Sci. Eng. 18, 147-60.
Youssef, N. H.; Duncan, K. E.; Nagle, D. P.; Savage, K. N.; Knapp, R. M. and McInerney,
M. J. (2004). Comparison of methods to detect biosurfactant production by diverse
microorganisms. J. Microbiol. Methods. 56, 339-347.
Zhang, Y. and Miller, R. (1992). Enhanced octadecane dispersion and biodegradation by a
Pseudomonas aeruginosa rhamnolipid surfactant (biosurfactant). Appl. Environ.
Microbiol. 58, 3276-3282.
References
Zhang, Y. and Miller, R. M. (1995). Effect of rhamnolipid (biosurfactant) structure on
solubilization and biodegradation of n-alkanes. Appl. Environ. Microbiol. 61, 2247
2251.
Zhao, X.; Wakamatsu, Y.; Shibahara, M.; Nomura, N.; Geltinger, C.; Nakahara, T.; Murata,
T. and Yokoyama, K. K. (1999). Mannosylerythritol lipid is a potent inducer of
apoptosis and differentiation of mouse melanoma cells in culture. Cancer Res. 59,
482 6.
Zhao, X.; Geltinger, C.; Kishikawa, S.; Ohshima, K.; Murata, T.; Nomura, N.; Nakahara, T.
and Yokoyama, K. K. (2000). Tretament of mouse melanoma cells with phorbol 12-
myristate 13-acetate counteracts mannosylerythritol lipid-induced growth arrest and
apoptosis. Cytotechnol. 33, 123 30.
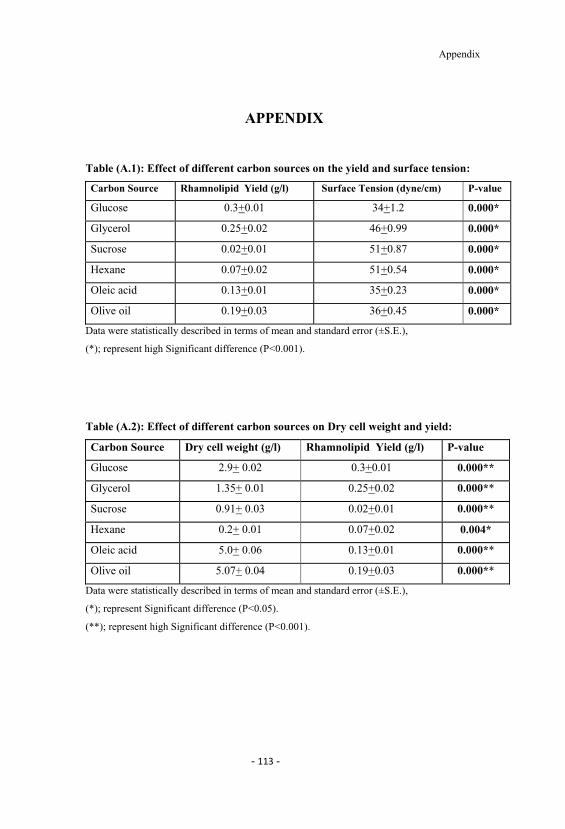
Appendix
APPENDIX
Table (A.1): Effect of different carbon sources on the yield and surface tension:
Carbon Source Rhamnolipid Yield (g/l) Surface Tension (dyne/cm) P-value
Glucose 0.3+0.01 34+1.2 0.000*
Glycerol 0.25+0.02 46+0.99 0.000*
Sucrose 0.02+0.01 51+0.87 0.000*
Hexane 0.07+0.02 51+0.54 0.000*
Oleic acid 0.13+0.01 35+0.23 0.000*
Olive oil 0.19+0.03 36+0.45 0.000*
Data were statistically described in terms of mean and standard error (±S.E.),
(*); represent high Significant difference (P 0.001).
Table (A.2): Effect of different carbon sources on Dry cell weight and yield:
Carbon Source Dry cell weight (g/l) Rhamnolipid Yield (g/l) P-value
Glucose 2.9+ 0.02 0.3+0.01 0.000**
Glycerol 1.35+ 0.01 0.25+0.02 0.000**
Sucrose 0.91+ 0.03 0.02+0.01 0.000**
Hexane 0.2+ 0.01 0.07+0.02 0.004*
Oleic acid 5.0+ 0.06 0.13+0.01 0.000**
Olive oil 5.07+ 0.04 0.19+0.03 0.000**
Data were statistically described in terms of mean and standard error (±S.E.),
(*); represent Significant difference (P 0.05).
(**); represent high Significant difference (P 0.001).
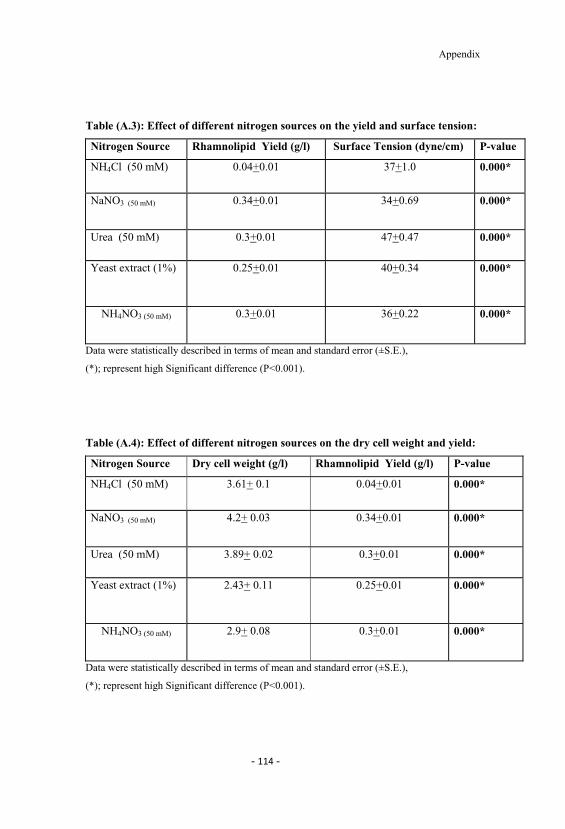
Appendix
Table (A.3): Effect of different nitrogen sources on the yield and surface tension:
Nitrogen Source Rhamnolipid Yield (g/l) Surface Tension (dyne/cm) P-value
NH4Cl (50 mM) 0.04+0.01 37+1.0 0.000*
NaNO3 (50 mM) 0.34+0.01 34+0.69 0.000*
Urea (50 mM) 0.3+0.01 47+0.47 0.000*
Yeast extract (1%) 0.25+0.01 40+0.34 0.000*
NH4NO3 (50 mM) 0.3+0.01 36+0.22 0.000*
Data were statistically described in terms of mean and standard error (±S.E.),
(*); represent high Significant difference (P 0.001).
Table (A.4): Effect of different nitrogen sources on the dry cell weight and yield:
Nitrogen Source Dry cell weight (g/l) Rhamnolipid Yield (g/l) P-value
NH4Cl (50 mM) 3.61+ 0.1 0.04+0.01 0.000*
NaNO3 (50 mM) 4.2+ 0.03 0.34+0.01 0.000*
Urea (50 mM) 3.89+ 0.02 0.3+0.01 0.000*
Yeast extract (1%) 2.43+ 0.11 0.25+0.01 0.000*
NH4NO3 (50 mM) 2.9+ 0.08 0.3+0.01 0.000*
Data were statistically described in terms of mean and standard error (±S.E.),
(*); represent high Significant difference (P 0.001).
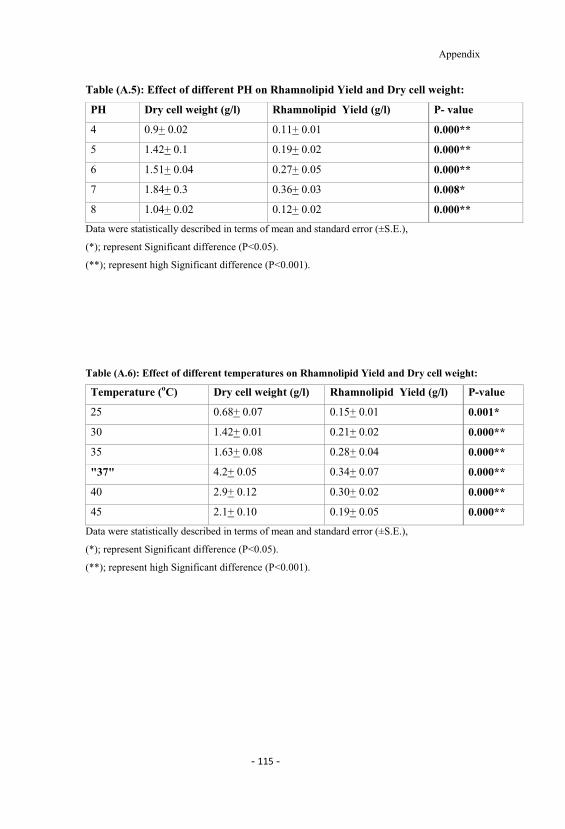
Appendix
Table (A.5): Effect of different PH on Rhamnolipid Yield and Dry cell weight:
PH Dry cell weight (g/l) Rhamnolipid Yield (g/l) P- value
4 0.9+ 0.02 0.11+ 0.01 0.000**
5 1.42+ 0.1 0.19+ 0.02 0.000**
6 1.51+ 0.04 0.27+ 0.05 0.000**
7 1.84+ 0.3 0.36+ 0.03 0.008*
8 1.04+ 0.02 0.12+ 0.02 0.000**
Data were statistically described in terms of mean and standard error (±S.E.),
(*); represent Significant difference (P 0.05).
(**); represent high Significant difference (P 0.001).
Table (A.6): Effect of different temperatures on Rhamnolipid Yield and Dry cell weight:
Temperature (oC) Dry cell weight (g/l) Rhamnolipid Yield (g/l) P-value
25 0.68+ 0.07 0.15+ 0.01 0.001*
30 1.42+ 0.01 0.21+ 0.02 0.000**
35 1.63+ 0.08 0.28+ 0.04 0.000**
"37" 4.2+ 0.05 0.34+ 0.07 0.000**
40 2.9+ 0.12 0.30+ 0.02 0.000**
45 2.1+ 0.10 0.19+ 0.05 0.000**
Data were statistically described in terms of mean and standard error (±S.E.),
(*); represent Significant difference (P 0.05).
(**); represent high Significant difference (P 0.001).
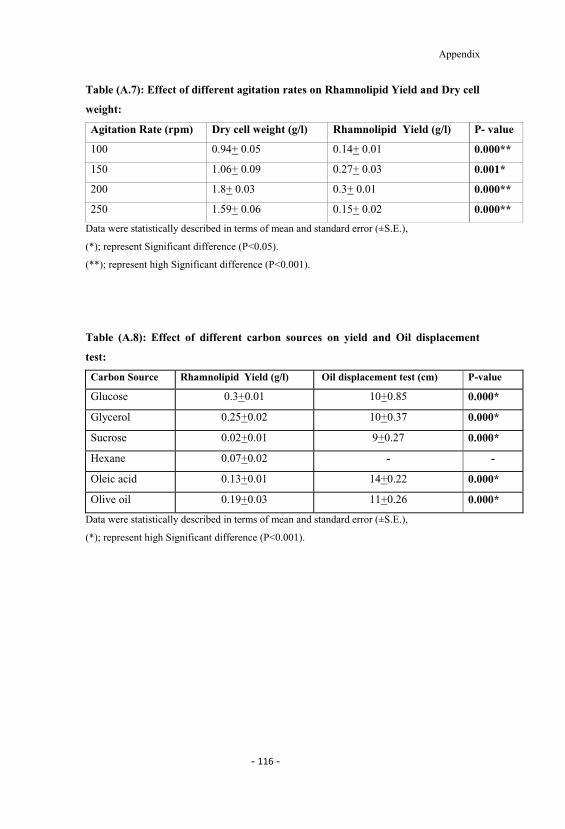
Appendix
Table (A.7): Effect of different agitation rates on Rhamnolipid Yield and Dry cell
weight:
Agitation Rate (rpm) Dry cell weight (g/l) Rhamnolipid Yield (g/l) P- value
100 0.94+ 0.05 0.14+ 0.01 0.000**
150 1.06+ 0.09 0.27+ 0.03 0.001*
200 1.8+ 0.03 0.3+ 0.01 0.000**
250 1.59+ 0.06 0.15+ 0.02 0.000**
Data were statistically described in terms of mean and standard error (±S.E.),
(*); represent Significant difference (P 0.05).
(**); represent high Significant difference (P 0.001).
Table (A.8): Effect of different carbon sources on yield and Oil displacement
test:
Carbon Source Rhamnolipid Yield (g/l) Oil displacement test (cm) P-value
Glucose 0.3+0.01 10+0.85 0.000*
Glycerol 0.25+0.02 10+0.37 0.000*
Sucrose 0.02+0.01 9+0.27 0.000*
Hexane 0.07+0.02 - -
Oleic acid 0.13+0.01 14+0.22 0.000*
Olive oil 0.19+0.03 11+0.26 0.000*
Data were statistically described in terms of mean and standard error (±S.E.),
(*); represent high Significant difference (P 0.001).
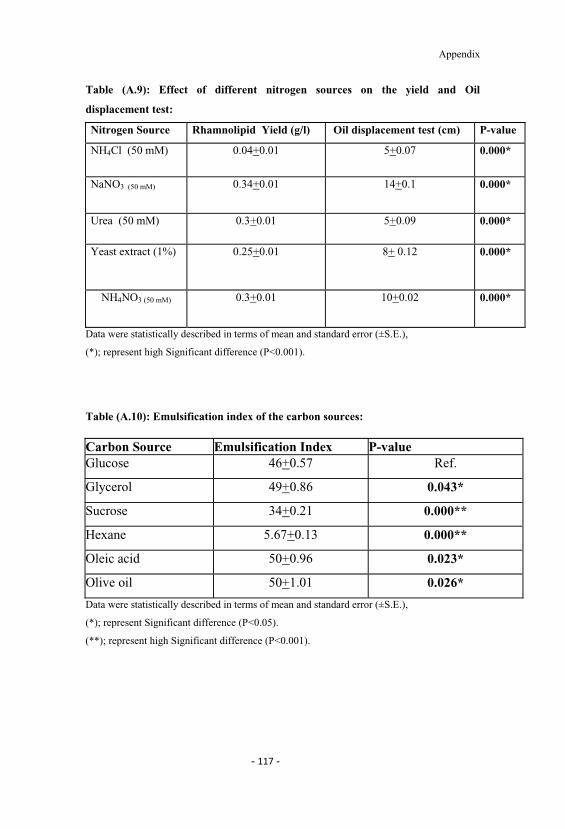
Appendix
Table (A.9): Effect of different nitrogen sources on the yield and Oil
displacement test:
Nitrogen Source Rhamnolipid Yield (g/l) Oil displacement test (cm) P-value
NH4Cl (50 mM) 0.04+0.01 5+0.07 0.000*
NaNO3 (50 mM) 0.34+0.01 14+0.1 0.000*
Urea (50 mM) 0.3+0.01 5+0.09 0.000*
Yeast extract (1%) 0.25+0.01 8+ 0.12 0.000*
NH4NO3 (50 mM) 0.3+0.01 10+0.02 0.000*
Data were statistically described in terms of mean and standard error (±S.E.),
(*); represent high Significant difference (P 0.001).
Table (A.10): Emulsification index of the carbon sources:
Data were statistically described in terms of mean and standard error (±S.E.),
(*); represent Significant difference (P 0.05).
(**); represent high Significant difference (P 0.001).
Carbon Source Emulsification Index P-valueGlucose 46+0.57 Ref.
Glycerol 49+0.86 0.043*
Sucrose 34+0.21 0.000**
Hexane 5.67+0.13 0.000**
Oleic acid 50+0.96 0.023*
Olive oil 50+1.01 0.026*
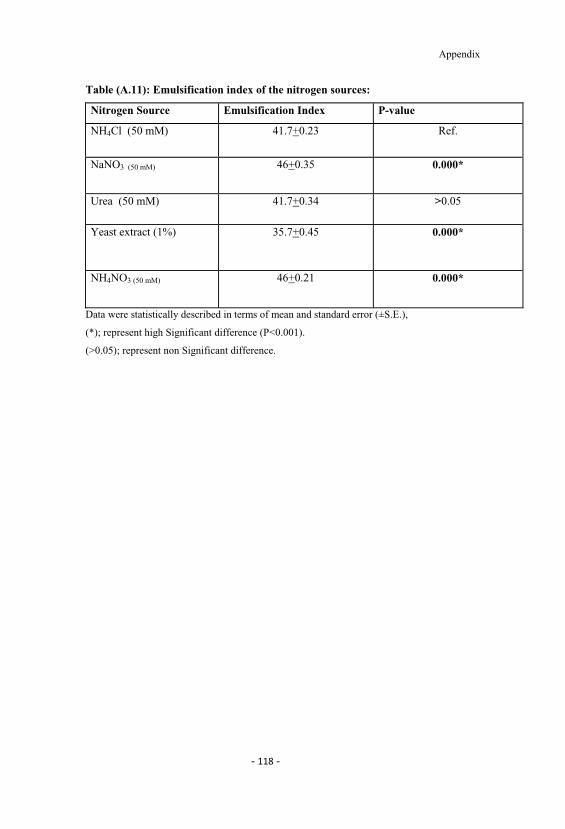
Appendix
Table (A.11): Emulsification index of the nitrogen sources:
Data were statistically described in terms of mean and standard error (±S.E.),
(*); represent high Significant difference (P 0.001).
( 0.05); represent non Significant difference.
Nitrogen Source Emulsification Index P-value
NH4Cl (50 mM) 41.7+0.23 Ref.
NaNO3 (50 mM) 46+0.35 0.000*
Urea (50 mM) 41.7+0.34 0.05
Yeast extract (1%) 35.7+0.45 0.000*
NH4NO3 (50 mM) 46+0.21 0.000*


Buy your books fast and straightforward online - at one of world’s
fastest growing online book stores! Environmentally sound due to
Print-on-Demand technologies.
Buy your books online at
www.get-morebooks.com
Kaufen Sie Ihre Bücher schnell und unkompliziert online – auf einer
der am schnellsten wachsenden Buchhandelsplattformen weltweit!
Dank Print-On-Demand umwelt- und ressourcenschonend produzi-
ert.
Bücher schneller online kaufen
www.morebooks.deVDM Verlagsservicegesellschaft mbH
Heinrich-Böcking-Str. 6-8 Telefon: +49 681 3720 174 [email protected] - 66121 Saarbrücken Telefax: +49 681 3720 1749 www.vdm-vsg.de