Embed Size (px)
Citation preview

Global Journal of Energy Technology Research Updates, 2014, 1, 71-89 71
E-ISSN: 2409-5818/14 © 2014 Avanti Publishers
Energy and other Key Performance Indicators for Buildings– Examples for Hellenic Buildings
C.A. Balaras1,*, E.G. Dascalaki1, K.G. Droutsa1, S. Kontoyiannidis1, R. Guruz2 and G. Gudnason3
1Group Energy Conservation, Institute for Environmental Research and Sustainable Development, National Observatory of Athens, P. Penteli, Greece 2Institut für Bauinformatik, Technische Universität Dresden, Germany 3Innovation Center Iceland, Reykjavik, Iceland
Abstract: Buildings are the leading energy consuming sector, representing about 40% of the final energy consumption in Europe. Different key performance indicators are available that can support the diverse needs and priorities of stakeholders in their efforts to improve the overall energy performance of buildings. The work first reviews the energy use and characteristics of European buildings, the main European legislation and technical developments that drive the efforts for lowering energy consumption. The main indicators that are used during the design, construction and operation of buildings are elaborated and when possible quantified, along with pertinent standards and regulations for guidance. Using common energy related indicators, a case study then focuses on Hellenic buildings and provides an insight on their performance, exploiting data from energy performance certificates. The contents document relevant work in information and communications technology for delivering simulation, modelling, analysis, monitoring and visualization tools, along with ongoing efforts to exploit building typologies for realistic assessment of energy use, during the design and operation of buildings. Future priorities are also outlined that support the ongoing European efforts to refurbish the existing building stock and the decision making process for setting effective policies towards nearly zero energy buildings.
Keywords: Buildings, performance indicators, KPI, energy consumption, energy use intensity, EUI, energy performance certificates, EPC.
1. INTRODUCTION
The gross inland consumption in the European Union (EU-28) Member States (MS) was 1683.5 million ton of oil equivalent (Mtoe) in 2012 (most recent year with officially published data), of which 34% petroleum and products, 23% gas, 17% solid fuels, 14% nuclear, 11% renewable energy sources (RES) and 1% wastes non-renewable [1]. Final energy consumption reached 1104.5 Mtoe of which 39.0% petroleum and products, 22.9% gas, 21.8% electricity, 7.2% renewables, 4.4% delivered heat, 4.3% solid fuels, and 0.4% non-renewable wastes. Gross electricity generation reached 3295.2 TWh in 2012, of which 27.4% using solid fuels, 26.8% nuclear, 24.2% renewables, 18.7% gas, 2.2% petroleum and products and 0.6% non-renewable wastes.
The European building sector accounts for 39.6% of the total final energy consumption in EU-28 of which 289.2 Mtoe in residential buildings and 148.7 Mtoe in non-residential (NR) buildings [1]. The EU-28 MS with the highest final energy consumption in the buildings’
*Address correspondence to this author at the Group Energy Conservation, Institute for Environmental Research & Sustainable Development, National Observatory of Athens, P. Penteli, Greece; Tel: +30 210 8109152; Fax: +30 210 8103236; E-mail: [email protected]
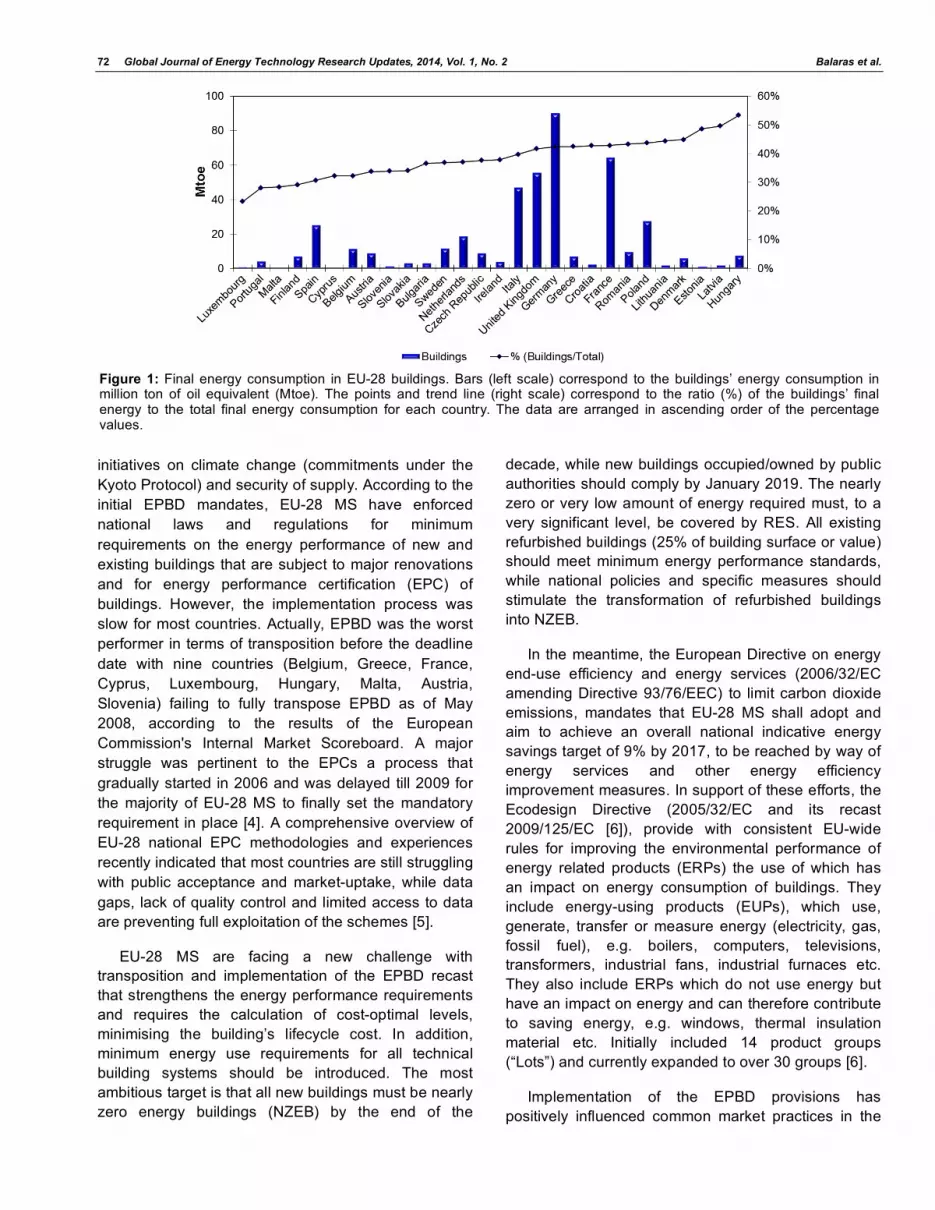
Sector (Figure 1) is Germany (90.3 Mtoe), France (64.6 Mtoe), United Kingdom (55.8 Mtoe), and Italy (47.3 Mtoe). Over the last decade, the most notable decrease of final energy consumption in buildings from 2002 to 2012 is observed in the United Kingdom by -11.4% and a small decrease by -0.5% in Germany. Over the same period there is an increase by 2.6% in France and 9.3% in Italy. In terms of the percentage of buildings’ final energy consumption to the total energy consumption (% buildings/total) the highest burden occurs in Hungary (53.3% of the total), Latvia (49.6%), Estonia (48.6) and Denmark (49.0%).
Improving the energy performance of the European building stock constitutes an integral part of the efforts to alleviate the EU energy import dependency, which is currently at about 53.4% and meet the EU 20-20-20 targets that call for a reduction in EU greenhouse gas emissions of at least 20% below 1990 levels, an increase to 20% of RES contribution to EU’s gross final energy consumption, and a 20% reduction in primary energy use by improving energy efficiency, by 2020 [2]. The main instrument for lowering the energy consumption in buildings is the European Directive on the energy performance of buildings (EPBD) first introduced by 2002/91/EC and the EPBD recast 2010/31/EU [3]. This Directive forms part of the EU
72 Global Journal of Energy Technology Research Updates, 2014, Vol. 1, No. 2 Balaras et al.
initiatives on climate change (commitments under the Kyoto Protocol) and security of supply. According to the initial EPBD mandates, EU-28 MS have enforced national laws and regulations for minimum requirements on the energy performance of new and existing buildings that are subject to major renovations and for energy performance certification (EPC) of buildings. However, the implementation process was slow for most countries. Actually, EPBD was the worst performer in terms of transposition before the deadline date with nine countries (Belgium, Greece, France, Cyprus, Luxembourg, Hungary, Malta, Austria, Slovenia) failing to fully transpose EPBD as of May 2008, according to the results of the European Commission's Internal Market Scoreboard. A major struggle was pertinent to the EPCs a process that gradually started in 2006 and was delayed till 2009 for the majority of EU-28 MS to finally set the mandatory requirement in place [4]. A comprehensive overview of EU-28 national EPC methodologies and experiences recently indicated that most countries are still struggling with public acceptance and market-uptake, while data gaps, lack of quality control and limited access to data are preventing full exploitation of the schemes [5].
EU-28 MS are facing a new challenge with transposition and implementation of the EPBD recast that strengthens the energy performance requirements and requires the calculation of cost-optimal levels, minimising the building’s lifecycle cost. In addition, minimum energy use requirements for all technical building systems should be introduced. The most ambitious target is that all new buildings must be nearly zero energy buildings (NZEB) by the end of the
decade, while new buildings occupied/owned by public authorities should comply by January 2019. The nearly zero or very low amount of energy required must, to a very significant level, be covered by RES. All existing refurbished buildings (25% of building surface or value) should meet minimum energy performance standards, while national policies and specific measures should stimulate the transformation of refurbished buildings into NZEB.
In the meantime, the European Directive on energy end-use efficiency and energy services (2006/32/EC amending Directive 93/76/EEC) to limit carbon dioxide emissions, mandates that EU-28 MS shall adopt and aim to achieve an overall national indicative energy savings target of 9% by 2017, to be reached by way of energy services and other energy efficiency improvement measures. In support of these efforts, the Ecodesign Directive (2005/32/EC and its recast 2009/125/EC [6]), provide with consistent EU-wide rules for improving the environmental performance of energy related products (ERPs) the use of which has an impact on energy consumption of buildings. They include energy-using products (EUPs), which use, generate, transfer or measure energy (electricity, gas, fossil fuel), e.g. boilers, computers, televisions, transformers, industrial fans, industrial furnaces etc. They also include ERPs which do not use energy but have an impact on energy and can therefore contribute to saving energy, e.g. windows, thermal insulation material etc. Initially included 14 product groups (“Lots”) and currently expanded to over 30 groups [6].
Implementation of the EPBD provisions has positively influenced common market practices in the
Figure 1: Final energy consumption in EU-28 buildings. Bars (left scale) correspond to the buildings’ energy consumption in million ton of oil equivalent (Mtoe). The points and trend line (right scale) correspond to the ratio (%) of the buildings’ final energy to the total final energy consumption for each country. The data are arranged in ascending order of the percentage values.

Energy and other Key Performance Indicators for Buildings Global Journal of Energy Technology Research Updates, 2014, Vol. 1, No. 2 73
design and construction of new buildings. What was perceived as “innovative” in the past is now considered as basic (required) practice and minimum care. EPBD implementation is already paving the way towards NZEBs. For example, initiating with an integrated design approach among the key-players (e.g. arc-hitects & engineers) taking into account proper building space layout and orientation (exploiting of local climatic conditions), configuring the surrounding space (improving microclimate), selecting openings for different orientations depending on direct solar gains,
daylight and ventilation requirements, arranging interior spaces depending on use and comfort requirements, integrating passive solar system (direct solar gains, thermal mass walls, Trombe walls, attached greenhouse, etc), providing proper solar protection, integrating natural ventilation, exploiting daylight for visual comfort.
For the thermal envelope, all EU-28 MS have introduced lower total heat transfer coefficients (U-values) that ensure lower heating loads. Throughout
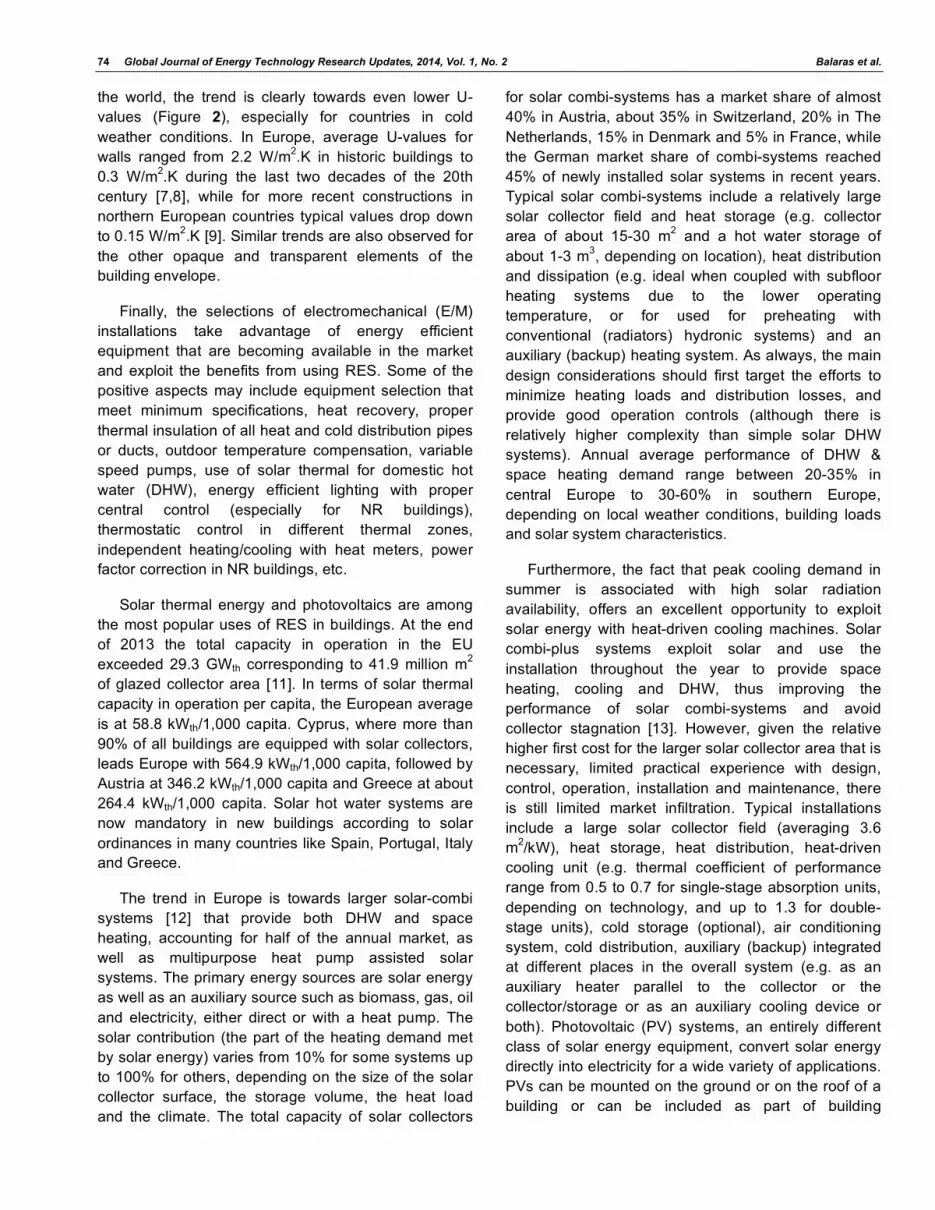
Figure 2: Recent developments of average U-values (W/m2K) for floors, roofs & walls for different periods and countries. (Reproduced by permission of NHBC Foundation www.zerocarbonhub.org [10]).
74 Global Journal of Energy Technology Research Updates, 2014, Vol. 1, No. 2 Balaras et al.
the world, the trend is clearly towards even lower U-values (Figure 2), especially for countries in cold weather conditions. In Europe, average U-values for walls ranged from 2.2 W/m2.K in historic buildings to 0.3 W/m2.K during the last two decades of the 20th century [7,8], while for more recent constructions in northern European countries typical values drop down to 0.15 W/m2.K [9]. Similar trends are also observed for the other opaque and transparent elements of the building envelope.
Finally, the selections of electromechanical (E/M) installations take advantage of energy efficient equipment that are becoming available in the market and exploit the benefits from using RES. Some of the positive aspects may include equipment selection that meet minimum specifications, heat recovery, proper thermal insulation of all heat and cold distribution pipes or ducts, outdoor temperature compensation, variable speed pumps, use of solar thermal for domestic hot water (DHW), energy efficient lighting with proper central control (especially for NR buildings), thermostatic control in different thermal zones, independent heating/cooling with heat meters, power factor correction in NR buildings, etc.
Solar thermal energy and photovoltaics are among the most popular uses of RES in buildings. At the end of 2013 the total capacity in operation in the EU exceeded 29.3 GWth corresponding to 41.9 million m2 of glazed collector area [11]. In terms of solar thermal capacity in operation per capita, the European average is at 58.8 kWth/1,000 capita. Cyprus, where more than 90% of all buildings are equipped with solar collectors, leads Europe with 564.9 kWth/1,000 capita, followed by Austria at 346.2 kWth/1,000 capita and Greece at about 264.4 kWth/1,000 capita. Solar hot water systems are now mandatory in new buildings according to solar ordinances in many countries like Spain, Portugal, Italy and Greece.
The trend in Europe is towards larger solar-combi systems [12] that provide both DHW and space heating, accounting for half of the annual market, as well as multipurpose heat pump assisted solar systems. The primary energy sources are solar energy as well as an auxiliary source such as biomass, gas, oil and electricity, either direct or with a heat pump. The solar contribution (the part of the heating demand met by solar energy) varies from 10% for some systems up to 100% for others, depending on the size of the solar collector surface, the storage volume, the heat load and the climate. The total capacity of solar collectors
for solar combi-systems has a market share of almost 40% in Austria, about 35% in Switzerland, 20% in The Netherlands, 15% in Denmark and 5% in France, while the German market share of combi-systems reached 45% of newly installed solar systems in recent years. Typical solar combi-systems include a relatively large solar collector field and heat storage (e.g. collector area of about 15-30 m2 and a hot water storage of about 1-3 m3, depending on location), heat distribution and dissipation (e.g. ideal when coupled with subfloor heating systems due to the lower operating temperature, or for used for preheating with conventional (radiators) hydronic systems) and an auxiliary (backup) heating system. As always, the main design considerations should first target the efforts to minimize heating loads and distribution losses, and provide good operation controls (although there is relatively higher complexity than simple solar DHW systems). Annual average performance of DHW & space heating demand range between 20-35% in central Europe to 30-60% in southern Europe, depending on local weather conditions, building loads and solar system characteristics.
Furthermore, the fact that peak cooling demand in summer is associated with high solar radiation availability, offers an excellent opportunity to exploit solar energy with heat-driven cooling machines. Solar combi-plus systems exploit solar and use the installation throughout the year to provide space heating, cooling and DHW, thus improving the performance of solar combi-systems and avoid collector stagnation [13]. However, given the relative higher first cost for the larger solar collector area that is necessary, limited practical experience with design, control, operation, installation and maintenance, there is still limited market infiltration. Typical installations include a large solar collector field (averaging 3.6 m2/kW), heat storage, heat distribution, heat-driven cooling unit (e.g. thermal coefficient of performance range from 0.5 to 0.7 for single-stage absorption units, depending on technology, and up to 1.3 for double-stage units), cold storage (optional), air conditioning system, cold distribution, auxiliary (backup) integrated at different places in the overall system (e.g. as an auxiliary heater parallel to the collector or the collector/storage or as an auxiliary cooling device or both). Photovoltaic (PV) systems, an entirely different class of solar energy equipment, convert solar energy directly into electricity for a wide variety of applications. PVs can be mounted on the ground or on the roof of a building or can be included as part of building
Energy and other Key Performance Indicators for Buildings Global Journal of Energy Technology Research Updates, 2014, Vol. 1, No. 2 75
components (e.g. facades, overhangs) that are usually referred to as building integrated photovoltaics (BIPV). Photovoltaic operated refrigeration cycles and solar mechanical refrigeration have also applications of practical interest [14].
Clearly, there are various ways and technologies that building designers, owners and other market stakeholders can follow and use in order to improve the energy performance of buildings. To facilitate the screening and selection process in practice one needs some kind of metrics as elaborated in the following sections.
2. KEY PERFORMANCE INDICATORS
Various performance indicators are available for benchmarking different building attributes or characteristics, facilitating decision making, assessing specific project requirements, or ensuring compliance with regulations and norms. These indicators quantify what one is trying to achieve and thus may need to select and use one or several of them at different stages of their work or process.
Opinion varies as to which one is the most important since they all depend on the user or the intent. In building design practice, simple numeric metrics may be easily associated with a building’s energy performance (i.e. lower or higher energy use) as a result of the building’s characteristics, design, equipment selection and overall operation. This way, one can compare different design scenarios in order to optimize building construction and operation, and use these indicators to quantify and substantiate selections to their clients. The European Commission has recognized the potential role information and communications technology (ICTs) can play in improving the energy performance of buildings [15]. The ICT sector can deliver simulation, modelling, analysis, monitoring, control and visualization tools to improve both the design and operation of buildings by properly quantifying the most important indicators. They can be a great asset when properly classified to support a user in building energy performance simulations, an effort that is currently being enhanced through the development of a virtual energy lab, by specifying a targeted process organized in various layers [16]. This effort is expected to further facilitate building energy performance simulations using building information modeling, by properly handling the interoperability among the various tools, the vast amounts of input data through a comprehensive and
well-structured simulation resource framework [17], mutli-variable key performance indicator sensitivity analyses in terms of the simulation outputs and decision making support.
Building managers and owners can use selected indicators on existing buildings for monitoring building performance and setting priorities for energy conservation measures, by comparing against other buildings or historical performance. Finally, this kind of data may also be used to compile selected indicators for policy makers and stakeholders to monitor the building stock and progress towards meeting national targets [18]. The following sub-sections provide an overview of indicator requirements in different building analysis domains.
2.1. Thermal Conditions
Indoor air temperature under free floating conditions (i.e. no mechanical heating or cooling) provides helpful insight on the overall thermal performance during initial building design. For example, using simulations to calculate the indoor temperature during summer for different thermal zones of a building, under a worst case scenario (no solar control on transparent elements) will reveal the zones with the most adverse characteristics. Detailed simulation results and monitoring data can then be used to identify overheating conditions and even suggest periods suitable for free cooling.
Accordingly, the minimum indoor temperature in winter and the maximum indoor temperature in summer can be used as indicators for checking compliance with the desirable indoor conditions and preliminary assessment of peak sensible loads. Similarly, indoor humidity can reveal relevant priorities for humidification in winter or dehumidification in summer and support the preliminary assessment of peak latent loads. On an annual basis, spaces should have no more than 1% of the annual occupied hours over/under the desirable set point temperature. The predictive mean vote (PMV) and percentage people dissatisfied (PPD) are common thermal comfort indicators [19] that can be used to quantify indoor thermal conditions and further assess the impact on occupancy.
2.2. Air Flow
Air ventilation and circulation plays a dominant role in achieving and maintaining comfort conditions and acceptable indoor environmental quality (IEQ). The

76 Global Journal of Energy Technology Research Updates, 2014, Vol. 1, No. 2 Balaras et al.
necessary amount of fresh (outdoor) air can be supplied by natural, mechanical and/or hybrid ventilation.
The first indicator is the minimum air flow rate of fresh outdoor air, which depends on the building end-use, the number of occupants and the generation of indoor pollutants [20-21]. Minimum requirements per person (m3/h/person), according to the maximum occupancy (person/m2 net occupiable floor area) to ensure proper indoor air quality are available in [22].
Another relevant indicator is the indoor air velocity that impacts thermal comfort conditions. Computational fluid dynamics (CFD) simulations can handle the complex phenomena and provide the necessary information in order to optimize the architectural and system design. CFD data visualization allows users to easily follow path lines and flow mixing resulting from mechanical or natural ventilation in order to evaluate the effectiveness of natural or mechanical ventilation systems.
2.3. Lighting
Visual comfort is an integral part of proper IEQ and a critical design parameter in NR buildings, since it improves productivity and overall functions. In terms of energy consumption, for some building categories, lighting may constitute a major final end-use and may also contribute to internal heat loads, depending on the type of lamps and the number of units used for artificial lighting. Average installed lighting power per unit floor area (W/m2) for satisfying the illuminance (lux) for different building or zone end-uses should meet minimum requirements [23]. The minimum luminous efficacy for general space lighting should be about 55 lumen/W. Common minimum illuminance levels range at 100 - 300 lux (lumen/m2) for normal activities and reach 500 lux in offices.
On the other hand, natural daylight can provide sufficient illumination for indoor spaces, preferable quality of light, and reduce electrical energy consumption for artificial lighting, in properly designed buildings. Even under overcast sky conditions, the available outdoor illuminance is about 10,000 lux. Given that indoor daylight levels are determined primarily by the form of the building and interior zones, the size and orientation of the transparent elements (windows), one needs to address these issues early in the design phase. However, since daylight increases direct solar heat gains, caution should be exercised to
also foresee proper solar control in order to avoid overheating and glare problems.
The Daylight Factor (DF) is a commonly used indicator for assessing the effectiveness of natural daylight in a space. DF quantifies the amount of indoor daylight against the simultaneously available outdoor daylight, i.e. defined as the ratio of the indoor illuminance to the simultaneous outdoor illuminance under overcast skies, expressed as a percentage. Accordingly, DF values around 1% are low, 2% are average daylit spaces, while 4% is perceived as a bright daylit space [24]. Spaces with a DF of 2-5% require little or no additional artificial lighting during daytime. As a simple daylight feasibility test for a desirable DF, one may check if the window to wall ratio (WWR) is less than 80%, then the space has a good potential for daylighting. Spaces with a WWR >80% should not require frequent use of daylight or would need to use more advanced daylight techniques (e.g. light shelves).
2.4. Building Loads
Engineers are usually interested on calculating the heating and cooling loads (demand) for sizing mechanical installations (kW). Comparing against national benchmarks for similar building categories, one can assess different building designs, materials and other scenarios. Alternatively, an indicator of the power demand normalized per unit floor area (W/m2) or volume (W/m3) can be used for comparing different size buildings and zones, either in terms of floor areas or volume if they have significantly different ceiling heights. The average peak heating demand of typical buildings in central Europe is about 100 W/m² and for energy efficient buildings this can drop down to 10 W/m2.
The simulations usually differentiate between peak sensible and latent loads, which are of primary importance for cooling load calculation and system selection. This is also necessary information for sizing mechanical equipment and thus may influence the first cost and selection of equipment. The simulation results can be used to illustrate and compare the peak loads of a thermal zone for different design scenarios. The normalized power demand can also provide a practical benchmark of sensible and/or latent loads for evaluating different design scenarios.
2.4.1. Final (Site) Energy
Simulations or measurements are commonly used to first calculate energy demand (loads) or final energy consumption of a building, which impacts the building’s

Energy and other Key Performance Indicators for Buildings Global Journal of Energy Technology Research Updates, 2014, Vol. 1, No. 2 77
operational cost. Final energy consumption, i.e. at the site of a building (also known as site energy), includes the energy supplied to the technical systems of a building through the system boundary to cover the different end-uses of the building for heating, ventilating and air-conditioning (HVAC), DHW, lighting, appliances etc., or to produce electricity. In this case it is necessary to differentiate between the different fuel sources, i.e. thermal and electrical energy consumption, in order to derive appropriate energy performance indicators, expressed per energy ware [25-27].
The difference on energy demand and energy consumption is due to different equipment efficiencies of mechanical systems. One can first optimize energy demand and then investigate the performance by selecting different equipment to cover the loads. Depending on the relative efficiency of different equipment that one may select, there may be a small or a large impact on site energy consumption.
Again, values are usually normalized per unit floor area, e.g. power (kW/m2), energy demand or consumption (kWh/m2), and sometimes per unit volume. Similarly, energy indicators may also be normalized for different weather conditions or variations from year-to-year, e.g. using local heating degree days for heating (kWh/m2.HDDL) or cooling degree days (CDD) for cooling. Seasonal variations may be used to identify the relative impact of a scenario. For example, reducing solar gains will reduce energy consumption for cooling but increase that for heating. The goal should be to identify the right balance for optimum year round performance. Reference locations may also be used taking into account the degree days of a national (reference) location (HDDR) and thus obtain similarly normalized values (kWh/m2)(HDDR/HDDL).
2.4.2. Primary (Source) Energy & Emissions
The primary energy, i.e. the source energy that has not been subjected to any conversion or transformation process (e.g. power plant), is used to produce the energy delivered to the building (e.g. electrical energy). Again, the primary energy consumption may be normalized, for example, per unit floor area or weather conditions (e.g. using HDD for heating) and may even be expressed for different end-uses, as previously discussed.
Use of primary energy is necessary for calculating the environmental impact and CO2 emissions indicators. Environmental emissions are expressed in CO2 emissions (or equivalent) in kg per unit floor area
of the building and depend on the specific primary fuel. National or even regional conversion factors for calculating the primary energy consumption from calculated or measured final energy consumption depends on the fuel and the fuel mix for generating electricity. Relevant procedures are available in [25-27].
As a general reference, the average EU-28 carbon intensity for 2012 is 2,373 kg CO2 per toe, defined on the basis of a tone of oil with a net calorific value of 41,868 kilojoules/kg [1]. Comparing CO2 emissions one may optimize the selection of different equipment that use different fuels. Some EU MS have set minimum requirements on environmental emissions of new buildings, in accordance to EPBD. Total annual primary (source) energy demand for all end-uses in energy efficient buildings does not usually exceed 120 kWh/m² that corresponds to about 24.5 kgCO2/m2.
2.4.5. Economic & Financial Indicators
The bottom line in a decision making process are the economic aspects of a project. Improving the building’s energy performance has a direct impact on first and operational costs. For example, starting with the efforts to minimize loads one can reduce the size of equipment and thus minimize first cost, which includes materials, labour, overhead, VAT etc. Some design options and materials may last for the life time of the building, while others will extend over the life time of the components that may run over several years or decades. Average construction cost (€/m2) varies depending on different designs and selection of building envelope materials, equipment, systems etc. For example, based on data from Germany, costs average for offices – business park at 1637 €/m2, offices – prestige at 2354 €/m2, large shopping centre including mall, supermarkets at 1292 €/m2, hotel-3star at 1751 €/m2, hotel-luxury at 3814 €/m2, etc. For high performance buildings, construction costs average 3 to 10% higher than standard alternatives. However, selecting energy efficient equipment or exploiting renewables will have a direct impact on true operation and maintenance (O&M) costs, which extend over the life time of the equipment. Running costs may be up to 40-50% lower than for conventional buildings, if properly operated.
The relevant costs may be expressed in monetary units per unit power (€/W) or per (heating or electrical) energy units (€/kWh) and compare against regional or national costs. For 2013, the average EU-28 price of gas (all taxes included) was 19.63 €/GJ and 20.09
78 Global Journal of Energy Technology Research Updates, 2014, Vol. 1, No. 2 Balaras et al.
€/100kWh for electricity [1], while recent retail prices of heating oil average 1.366 €/lt with large variations among EU member states due to large differences in duties and VAT (www.energy.eu).
In some cases, one may be able to benefit from nationally or even locally available rebates or other subsidies and/or use other instruments like financial incentives (e.g. personal income tax breaks or lower VAT). Clearly, building owners are concerned for both first and O&M costs and relevant data should be provided during the decision making process. For the time being, there is no mandate and the market is not yet ready to also account for external (indirect) costs for buildings (e.g. environmental impact and greenhouse gas emissions tax along the lines of industry).
Different economic indicators are also available for appraising the benefits and financial attractiveness of different design options and scenarios. For example, the simple payback period (PBP) that is commonly used and easily understood in the market, is the time required for the return on an investment. However, it does not account the timing of costs and benefits, likely residual value of assets at end of project life, or additional savings occurring after the payback term. The length of the PBP is key to the decision of selecting an alternative scenario. A 4-5 year PBP is usually acceptable. Longer periods may be acceptable if there are considerable energy savings (i.e. reduced energy costs and operating expenses) over the long run that increase the value of the building (e.g. rent or sale rates).
More accurate but more demanding methods like accounting rate of return (ROR) or average annual rate of return on investment (RRI) discounted cash flow (e.g. the net present value (NPV) and the internal rate of return (IRR) methods). Finally, life cycle costing (LCC) and analysis (LCCA) methodologies can be used to reach cost optimal levels. However, they are not easy to implement since they require information on energy prices, different material/equipment costs, and a number of relevant rates (e.g. variables and cash flow components) that may be difficult to realistically define in uncertain financial times. Currently, EU-28 MS are working on the calculation of cost-optimal levels of minimum energy performance requirements for buildings and building elements, as mandated by the EPBD recast.
Apparently, there is a wide range of systems for assessing and communicating the sustainability of
buildings that may even result to confusion since they are difficult to compare. Moving beyond the bottom-up approaches that focus on energy and environmental issues, efforts are underway to move towards sustainability indicators. These assessments take a top-down approach that identifies relevant objectives before quantifying their achievement. A review of various international and European initiatives, harmonisation and standardisation activities, along with national evaluation schemes is available in [28]. Several sustainability indicators are also proposed that will meet specific stakeholder needs and proposed effective use of benchmarking systems for assessing the environmental, social and economic performance of buildings.
3. ENERGY PERFORMANCE INDICATORS AND NZEBS
The normalized values per unit floor area (kWh/m2) can be used to compare against national benchmarks for similar building categories, to optimize the design scenarios or evaluate the performance of an existing building. Again, one may also use a normalized indicator per unit volume (kWh/m3) or for enhanced relevance, use energy per employee (e.g. for an office building) or energy per bed (for hotels) and others, depending on the characteristic functions of a building.
These indicators are commonly referred to as an energy performance indicators (EPI), energy use intensities (EUI) and energy key performance indicators (eKPI). They are the most commonly accepted metrics to measure a building’s absolute energy use performance, in order to benchmark against similar buildings or with best-practices and assess energy efficiency measures within buildings. However, for accurately comparing calculated or measured energy consumption one needs to consider various parameters in a common and consistent manner for determining, expressing and comparing the energy performance of buildings [27].
In the past, annual heating energy consumption of typical buildings in eastern and central Europe ranged at 250–400 kWh/m² often averaging about 2-3 times higher than that of similar buildings in western Europe [29]. On the other hand, well-insulated buildings have an annual consumption of 120-150 kWh/m2, while the so-called low energy buildings may even drop down to 60-80 kWh/m2.
Very low energy buildings are a reality for many years and in some countries have moved past the
Energy and other Key Performance Indicators for Buildings Global Journal of Energy Technology Research Updates, 2014, Vol. 1, No. 2 79
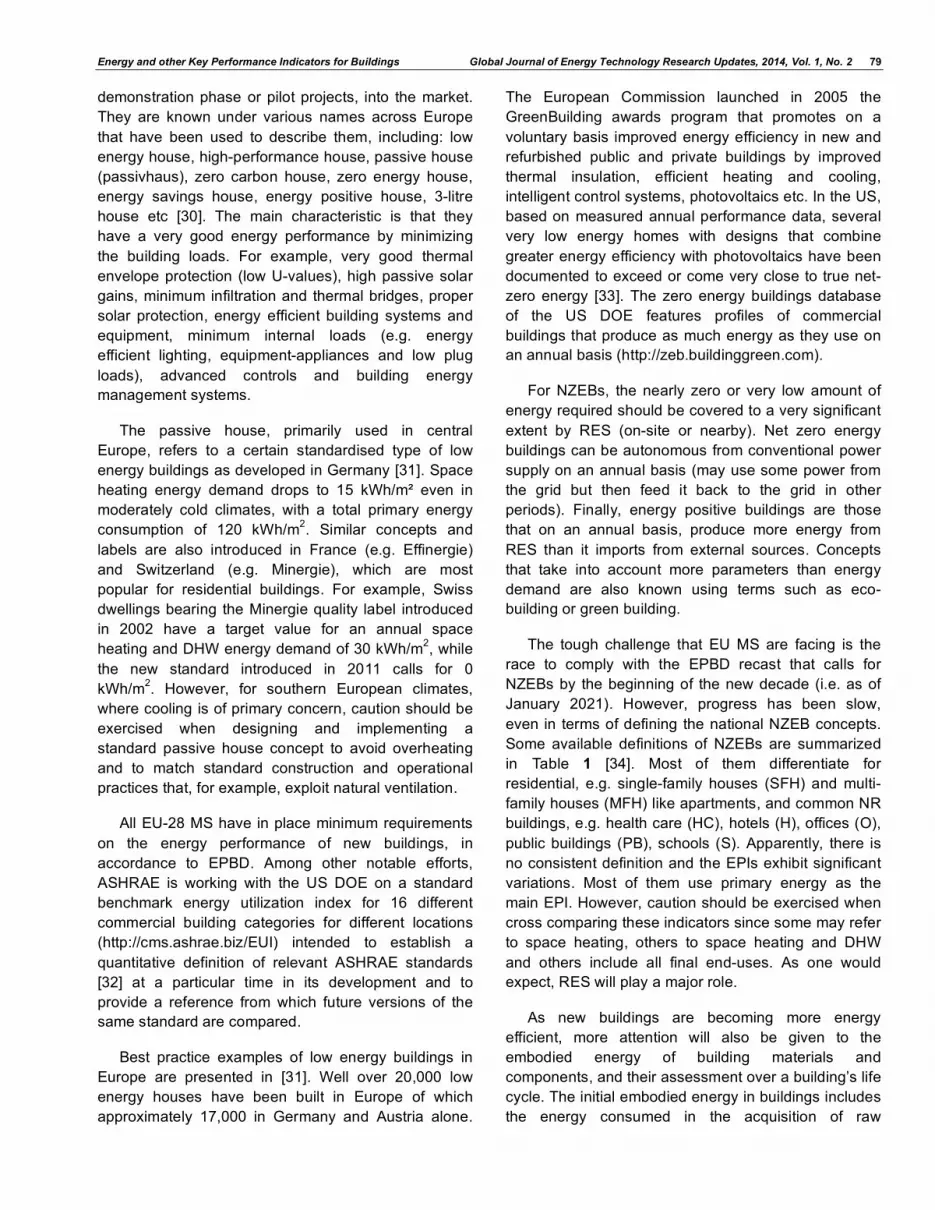
demonstration phase or pilot projects, into the market. They are known under various names across Europe that have been used to describe them, including: low energy house, high-performance house, passive house (passivhaus), zero carbon house, zero energy house, energy savings house, energy positive house, 3-litre house etc [30]. The main characteristic is that they have a very good energy performance by minimizing the building loads. For example, very good thermal envelope protection (low U-values), high passive solar gains, minimum infiltration and thermal bridges, proper solar protection, energy efficient building systems and equipment, minimum internal loads (e.g. energy efficient lighting, equipment-appliances and low plug loads), advanced controls and building energy management systems.
The passive house, primarily used in central Europe, refers to a certain standardised type of low energy buildings as developed in Germany [31]. Space heating energy demand drops to 15 kWh/m² even in moderately cold climates, with a total primary energy consumption of 120 kWh/m2. Similar concepts and labels are also introduced in France (e.g. Effinergie) and Switzerland (e.g. Minergie), which are most popular for residential buildings. For example, Swiss dwellings bearing the Minergie quality label introduced in 2002 have a target value for an annual space heating and DHW energy demand of 30 kWh/m2, while the new standard introduced in 2011 calls for 0 kWh/m2. However, for southern European climates, where cooling is of primary concern, caution should be exercised when designing and implementing a standard passive house concept to avoid overheating and to match standard construction and operational practices that, for example, exploit natural ventilation.
All EU-28 MS have in place minimum requirements on the energy performance of new buildings, in accordance to EPBD. Among other notable efforts, ASHRAE is working with the US DOE on a standard benchmark energy utilization index for 16 different commercial building categories for different locations (http://cms.ashrae.biz/EUI) intended to establish a quantitative definition of relevant ASHRAE standards [32] at a particular time in its development and to provide a reference from which future versions of the same standard are compared.
Best practice examples of low energy buildings in Europe are presented in [31]. Well over 20,000 low energy houses have been built in Europe of which approximately 17,000 in Germany and Austria alone.
The European Commission launched in 2005 the GreenBuilding awards program that promotes on a voluntary basis improved energy efficiency in new and refurbished public and private buildings by improved thermal insulation, efficient heating and cooling, intelligent control systems, photovoltaics etc. In the US, based on measured annual performance data, several very low energy homes with designs that combine greater energy efficiency with photovoltaics have been documented to exceed or come very close to true net-zero energy [33]. The zero energy buildings database of the US DOE features profiles of commercial buildings that produce as much energy as they use on an annual basis (http://zeb.buildinggreen.com).
For NZEBs, the nearly zero or very low amount of energy required should be covered to a very significant extent by RES (on-site or nearby). Net zero energy buildings can be autonomous from conventional power supply on an annual basis (may use some power from the grid but then feed it back to the grid in other periods). Finally, energy positive buildings are those that on an annual basis, produce more energy from RES than it imports from external sources. Concepts that take into account more parameters than energy demand are also known using terms such as eco-building or green building.
The tough challenge that EU MS are facing is the race to comply with the EPBD recast that calls for NZEBs by the beginning of the new decade (i.e. as of January 2021). However, progress has been slow, even in terms of defining the national NZEB concepts. Some available definitions of NZEBs are summarized in Table 1 [34]. Most of them differentiate for residential, e.g. single-family houses (SFH) and multi-family houses (MFH) like apartments, and common NR buildings, e.g. health care (HC), hotels (H), offices (O), public buildings (PB), schools (S). Apparently, there is no consistent definition and the EPIs exhibit significant variations. Most of them use primary energy as the main EPI. However, caution should be exercised when cross comparing these indicators since some may refer to space heating, others to space heating and DHW and others include all final end-uses. As one would expect, RES will play a major role.
As new buildings are becoming more energy efficient, more attention will also be given to the embodied energy of building materials and components, and their assessment over a building’s life cycle. The initial embodied energy in buildings includes the energy consumed in the acquisition of raw

80 Global Journal of Energy Technology Research Updates, 2014, Vol. 1, No. 2 Balaras et al.
materials, their processing, manufacturing, transpor-tation to the site and construction. Recurring embodied energy in buildings represents the non-renewable energy consumed to maintain, repair, restore, refurbish or replace materials, components or systems during the life of the building. For example, the embodied energy of a building may constitute 15-30% of its lifetime energy consumption, while this could exceed 50% with NZEBs.
Calculating the total embodied energy of a building product requires an understanding of all the materials (and their mass), that are used to produce the “product,
e.g. building envelope or E/M system components. Scarcity of national data is a major obstacle that forces relevant calculations to be based on international data bases.
Whole building indicators give no direction regarding which areas one should pursue in order to improve building performance [35]. A more analytic assessment of seasonal or monthly or even hourly energy performance underlying the annual total indicator can more effectively point to specific areas worthy of more detailed investigation. Accordingly, similar indicators can also be used for the breakdown of different energy carriers or different end-uses. This
Table 1: Representative NZEB Definitions in European Countries
EPI (kWh/m2) End-uses*
Residential Country
Non-residential
Energy basis for comparison
SH SC MV DHW SL AP Use of RES
45 Primary
Belgium (Brussels) 95-(2.5Volume/Area envelope) Primary
60 Primary 50% Belgium (Walloon)
60 Primary
30 Primary Belgium (Flemish)
40 Primary
>10kWh/m2
180 Primary 25% Cyprus
210 Primary 25%
20 Primary 51-56% Denmark
25 Primary 51-56%
50 (SFH), 100 (MFH) Primary Estonia 90 (S), 100 (O), 120 (PB), 130 (H), 270
(HC) Primary
50 Primary France
70 (O no AC), 110 (O with AC) Primary
Ireland 45 Primary
95 Primary Latvia
95 Primary
<0.25 EPC 50% Lithuania
<0.25 EPC 50%
0 EPC Netherlands
0 EPC Not quantified but necessary
32 (MFH), 54 (SFH) Primary 50% Slovakia
34 (S), 60 (O) Primary 50%
* SH: Space Heating, SC: Space Cooling, MV: Mechanical Ventilation, DHW: Domestic Hot Water, SL: Space Lighting, AP: Appliances.
Energy and other Key Performance Indicators for Buildings Global Journal of Energy Technology Research Updates, 2014, Vol. 1, No. 2 81
can be easily accomplished by simulations during the design phase or using metered (actual) energy consumption data. In this case, building energy management systems (BEMS), if available, that control and monitor most of energy consuming activities of a building and indoor environmental conditions, can provide the necessary detailed data.
The breakdown of data for different energy carriers (e.g. renewables, thermal, electrical) provides additional insight that may also be necessary for evaluating different scenarios in terms of compliance with national (local) regulations and for energy cost calculations. Several countries have set minimum levels for the use of energy from renewables in buildings, to comply with the European Directive 2009/28/EC on the promotion of the use of energy from renewables. For example, 60% of DHW demand for new buildings in Greece, 10 kWh/m2 floor space covered by RES in Ireland, 1 m2 collectors / occupant for DHW demand in Portugal, 30-70% of DHW demand in Spain, 20% of heating demand covered by RES in Switzerland. Similar energy codes and policy actions are in place in the US for monitoring and reporting measured performance data [36].
Architects and engineers should take these requirements into consideration when planning new construction projects and major renovations of existing buildings, ensure equipment and systems are installed for the use of heating, cooling and electricity from renewables, and for district heating and cooling when planning, designing, building and refurbishing industrial or residential areas.
The breakdown can also be combined with the different end-uses (e.g. heating, DHW, cooling, lighting, plug loads). The indicators can reveal the priorities for specific end-uses, since one may quickly assesses the contribution of each end-use, even in terms of the different fuels. Depending on the time step of simulations or the time discretization of operation data, one can document and analyse the seasonal, monthly or even active hours for a typical weekly schedule. Again, this kind of data discretization can facilitate the analysis and identification of priorities for redesign a new building or specific interventions for an existing building.
4. BUILDING LABELS, EPCS AND RATING SYSTEMS
Over the past decade, several programmes throu-ghout the world have emerged for rating and labeling the energy performance of buildings [37]. In Europe,
energy performance certification (EPC) of buildings, in accordance to EPBD, is an ongoing process for several years. EPCs document the building’s energy perfor-mance that is usually expressed as an index in terms of energy consumption, carbon dioxide emissions or energy cost per unit of conditioned floor area to facilitate comparison between buildings and allow for benchmarking based on distinct energy classes.
The main information provided in an EPC is an easy-to-understand global indicator of the building’s energy performance expressed as a ranking energy label (building class). It is usually based on the calculated primary energy consumption, although different national calculation methodologies have been adopted by some EU MS, e.g. CO2 emissions or energy cost. Typically, an EPC includes a general building description, the annual calculated and actual (if available) primary and final energy consumption and resulting CO2 emissions (normalized per unit floor area), and sometimes an evaluation of IEQ to support interpretation of the actual final energy consumption. EPCs also include a breakdown of the contribution of the various energy sources to the final end-uses, annual primary energy consumption for the different end-uses (per unit floor area), and cost effective recommendations for improving the building’s energy performance (including initial cost, calculated annual energy conservation and the abatement of CO2 emissions, and the simple payback period).
At a minimum, all new buildings throughout Europe, have an EPC that demonstrates that the building meets the minimum energy performance requirements and is better than a minimum indicator. EPCs in some countries (e.g. Austria, Greece, Ireland, Netherlands, Portugal, Slovenia) provide for an energy performance division into sub-classes, e.g. A+ and A- or B+ and B, thus illustrating even small scale improvements that would otherwise not be evident, to further encourage and differentiate buildings towards the high end energy performance.
Although Europe is leading the efforts in this area, similar schemes are available throughout the world. Information on worldwide practices for building energy performance ratings and disclosures, examples of labels and certificates are available in (www.buildingrating.org). Notable among them is ASHRAE's Building Energy Quotient (bEQ), a building energy labeling program that allows the industry to focus on opportunities to lower building operating cost and make informed decisions to increase value
82 Global Journal of Energy Technology Research Updates, 2014, Vol. 1, No. 2 Balaras et al.
(www.buildingenergyquotient.org). The bEQ label includes the "As Designed" rating of the building’s potential energy use under standardized conditions independent of occupancy and use, and the "In Operation" rating of the building’s actual measured energy use as influenced by the building’s occupancy and use.
Green certification is an evolving activity for confirming that a product meets requirements of a standard and is environmental friendly (http://www.wbdg.org). When the certification programs are developed on the basis of life cycle variables, these programs are transformed into multi-attributed (holistic) programs, such as building rating systems (BRS). Over the years, several BRSs have been developed (e.g. BREEAM, LEED) and used throughout the world [38] that assess and rate a building’s environmental performance by awarding some form of “credits” for various categories (e.g. environment, society, economy). Depending on their features, there are several pros and cons [39]. It is evident that one major drawback is the compatibility of the different ratings and possible confusion that they may cause to the market. Ongoing research is also focusing on the actual energy performance of labelled buildings.
5. HELLENIC BUILDINGS
In Greece, the total number of buildings is about 3.6 million buildings of which residential buildings represent about 77% of the total Hellenic building stock, with about 4.1 million dwellings. Final energy consumption
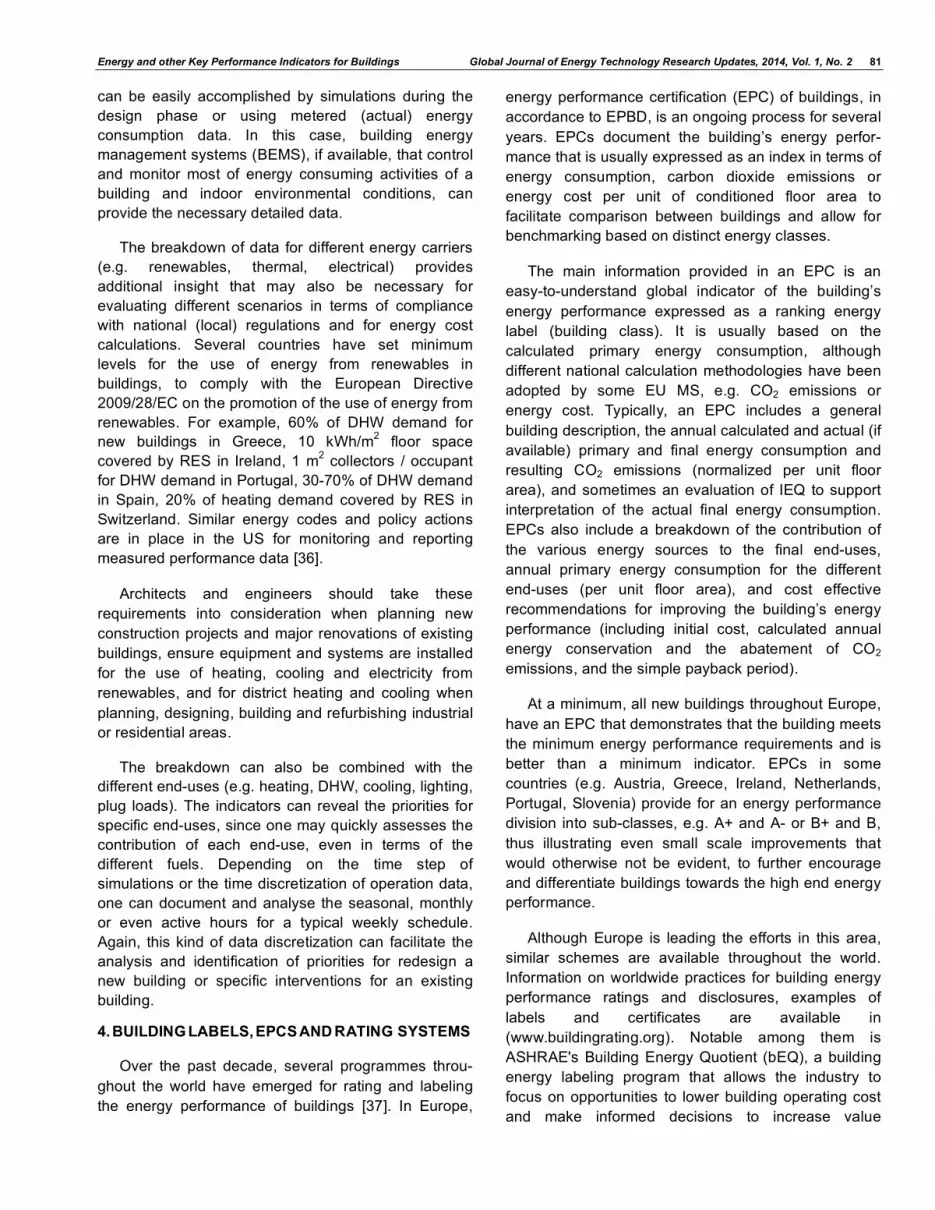
in Hellenic buildings was 42% of the total in 2012, which is the year with the most recent published data, from 32% in 2000, 26% in 1990 and 20% in 1980. Specifically, residential buildings reached 5.04 Mtoe or 29.4% of the total final energy consumption and 2.23 Mtoe (about 13% of the total) in non-residential (NR) buildings (Figure 3). The dropping trend of final energy consumption in recent years is clearly reflected as a result of the economic and financial crisis in Greece over the past few years as illustrated by the decline of the Gross Domestic Product (GDP) per capita.
Hellenic buildings consume about 69% of the produced electricity (34% by dwellings), 43% of oil for heating (38% by dwellings) and 13% of natural gas (9% by dwellings), contributing by 38% to the total greenhouse gas emissions of (or about 46 million ton. CO2 equivalent). Renewables provide about 0.16 Mtoe from solar (98% used by dwellings), 0.62 Mtoe from biomass and 0.04 Mtoe from district heating (practically all used by dwellings), along with small amounts of geothermal energy.
Hellenic households have an annual average thermal energy consumption of 10,244 kWh per household, of which 85.9% for space heating, 4.4% for DHW and 9.7% for cooking, according to a recent national survey [40]. Heating oil (63.8%) remains the main fuel source for space heating, while 12.4% use electricity, 12% biomass and 8.7% natural gas. The annual average electrical energy consumption per household is 10,244 kWh, which is used mainly for cooking (38.4%), white appliances (28.9%), DHW
Figure 3: Evolution of final energy consumption (million ton of oil equivalent) for residential and non-residential buildings and total consumption and gross domestic product per capita (at current market prices USD) in Greece (Data: Eurostat and World Bank).
Energy and other Key Performance Indicators for Buildings Global Journal of Energy Technology Research Updates, 2014, Vol. 1, No. 2 83
(9.4%), lighting (6.4%), cooling (4.9%) and space heating (3.0%). For DHW, 74.5% of households use an electrical thermo siphon, 37.6% solar and 25.2% the central heating system. Detailed data for NR buildings remains very abstract with limited data published in literature [41].
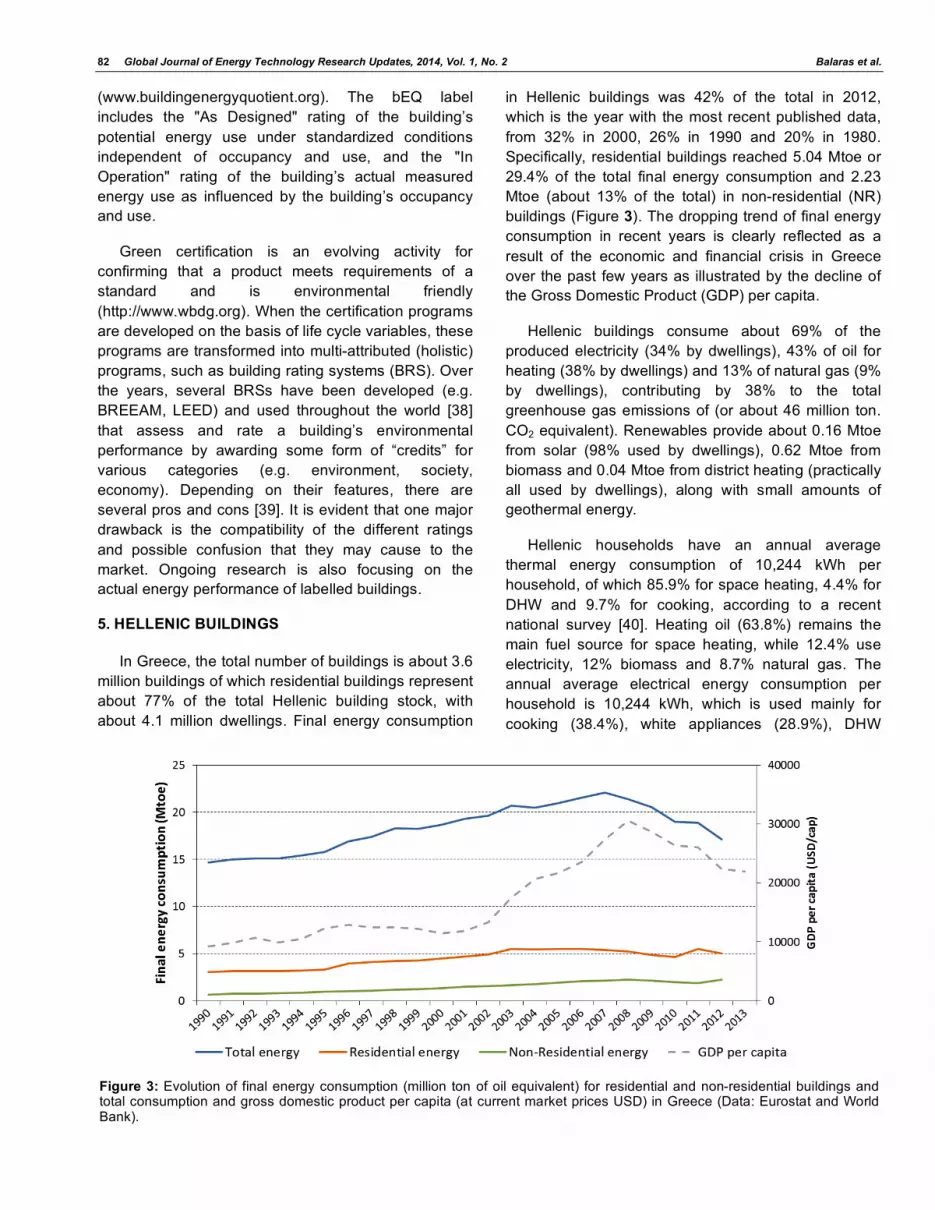
As a result of the economic-financial crisis and austerity measures, people are forced to reduce the operational energy costs in buildings, especially in dwellings, by reducing or cutting down the use and cost of energy for space heating. The available data for the EU-28 MS in 2012 [42] clearly indicates the grim reality of poverty throughout Europe (Figure 4), including about 35% of the Hellenic population (reaching about 36% in 2013). As a result, millions of residential buildings have poor or even unacceptable indoor thermal conditions. In Greece, according to the most recent published data for 2013, over 29.4% of the total population declares inability to keep their home adequately warm, while the corresponding percentage of the poor population is estimated at 48.6% [43]. Far beyond thermal discomfort, fuel poverty is linked with severe health impacts including excess winter deaths, mental disability, respiratory and circulatory problems.
On the other hand, it has long been recognized that Hellenic buildings have an excessive heat energy demand, as the majority of the building stock is not thermally insulated, since it was built prior to 1980 when the first national thermal insulation regulation (TIR) was introduced. As a result and despite the fact that heating degree-days range from 600 in the south
to over 2600 HDD in the northern parts of the country, about 52% of the dwellings and 30-68% depending on the NR building category, have no thermal insulation.
National EPBD transposition was initiated in 2010 by the introduction of the regulation on the energy performance in the building sector – KENAK [44]. One major change was that the U-values for the building’s thermal envelope became more stringent and minimum specifications were also introduced for the E/M installations. For example, the U-value for external vertical walls in contact with outdoor air was 0.7 W/m2.K with TIR and it was reduced by 14–43% with KENAK, depending on the national climate zone. Minimum specifications for the building’s E/M installations include, for example, use of outdoor temperature compensation systems, zone thermostatic control, along with heat recovery for central air-handling-units and energy efficient lighting for NR buildings.
According to KENAK and EPBD provisions, EPCs are also being issued since January 2011 [4] when buildings or building units are sold or rented out, ranking buildings in one out of nine classes ranging from H (lowest performance) to A+ (highest perfor-mance). The calculations are performed using the concept of a reference building for benchmarking, based on asset rating. The reference building is a carbon copy of the real building, but it automatically adapts the characteristics of its building elements and E/M installations to meet the minimum energy efficiency requirements. The reference building is a
Figure 4: Percentage of people at risk of poverty for EU MS in 2012.
84 Global Journal of Energy Technology Research Updates, 2014, Vol. 1, No. 2 Balaras et al.
‘‘good’’ building, i.e. by definition a class-B building. The rating classes are defined as a percentage of the reference building’s primary energy consumption.
To date, well over 570,000 EPCs have been generated, of which 85% are for dwellings. Less than 0.2% of the issued EPCs are for new buildings, reflecting the plunge of the construction industry over the past few years in Greece, as a result of the economic crisis. The available data from the national registry of EPCs constitutes a valuable resource for gaining an insight on the energy performance of existing buildings. As anticipated, the building class rankings confirm the poor energy performance of the building stock. Dwellings are dominated by the lowest energy-class (H) label, while NR buildings have a better average performance with a predominant D-class, since they are relatively newer buildings and are maintained and/or renovated more regularly.
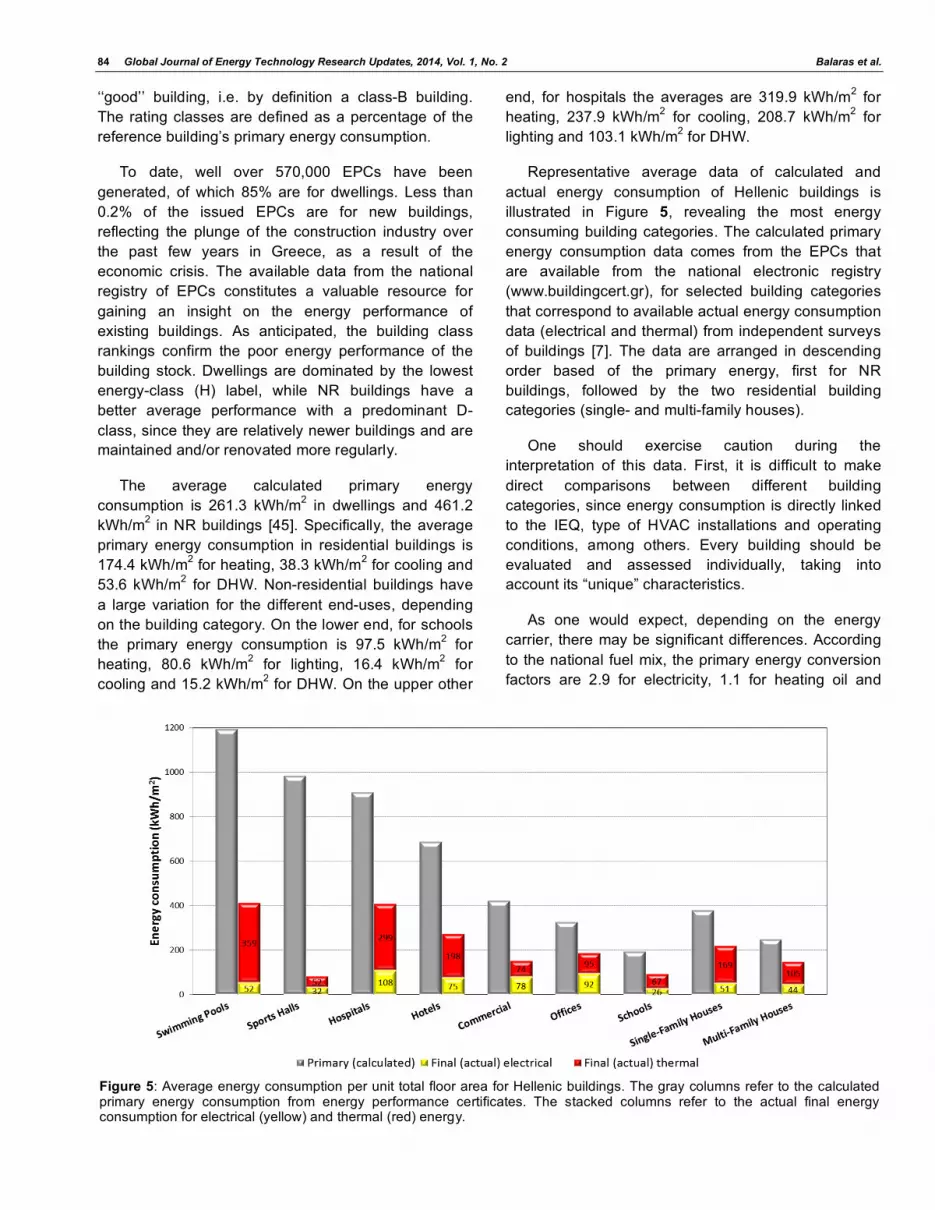
The average calculated primary energy consumption is 261.3 kWh/m2 in dwellings and 461.2 kWh/m2 in NR buildings [45]. Specifically, the average primary energy consumption in residential buildings is 174.4 kWh/m2 for heating, 38.3 kWh/m2 for cooling and 53.6 kWh/m2 for DHW. Non-residential buildings have a large variation for the different end-uses, depending on the building category. On the lower end, for schools the primary energy consumption is 97.5 kWh/m2 for heating, 80.6 kWh/m2 for lighting, 16.4 kWh/m2 for cooling and 15.2 kWh/m2 for DHW. On the upper other
end, for hospitals the averages are 319.9 kWh/m2 for heating, 237.9 kWh/m2 for cooling, 208.7 kWh/m2 for lighting and 103.1 kWh/m2 for DHW.
Representative average data of calculated and actual energy consumption of Hellenic buildings is illustrated in Figure 5, revealing the most energy consuming building categories. The calculated primary energy consumption data comes from the EPCs that are available from the national electronic registry (www.buildingcert.gr), for selected building categories that correspond to available actual energy consumption data (electrical and thermal) from independent surveys of buildings [7]. The data are arranged in descending order based of the primary energy, first for NR buildings, followed by the two residential building categories (single- and multi-family houses).
One should exercise caution during the interpretation of this data. First, it is difficult to make direct comparisons between different building categories, since energy consumption is directly linked to the IEQ, type of HVAC installations and operating conditions, among others. Every building should be evaluated and assessed individually, taking into account its “unique” characteristics.
As one would expect, depending on the energy carrier, there may be significant differences. According to the national fuel mix, the primary energy conversion factors are 2.9 for electricity, 1.1 for heating oil and
Figure 5: Average energy consumption per unit total floor area for Hellenic buildings. The gray columns refer to the calculated primary energy consumption from energy performance certificates. The stacked columns refer to the actual final energy consumption for electrical (yellow) and thermal (red) energy.
Energy and other Key Performance Indicators for Buildings Global Journal of Energy Technology Research Updates, 2014, Vol. 1, No. 2 85
1.05 for natural gas. Taking this into account, most of the cases exhibit a good agreement between the calculated primary and the available actual energy consumption. This allows confidence in both the assumptions for the estimations and the representativeness of the available data for actual energy consumption.
However, there are also some significant deviations between calculated and actual energy consumption that need to be explained. Inherent to the calculations of primary energy consumption for issuing an EPC, are several assumptions regarding their daily and annual operating hours, indoor conditions etc, according to the national methodology and technical guidelines. The main assumptions and simplifications used in the calculations vary depending on the building category. For example, for athletic facilities that exhibit the largest discrepancies, the calculations are performed for continuous operation (14 h/day, 365 days/year), indoor conditions (e.g. set-point temperature at 18oC in winter and 25oC in summer), DHW consumption (e.g. 20 lt/person.day at 45oC), infiltration and natural ventilation rates (e.g. 33.75 m3/h/m2 floor area), internal heat gains (e.g. lights at 9.6 W/m2, people at 90 W/m2 and equipment at 1 W/m2, with an occupancy correction factor of 58%). Apparently, the operating period constitutes the main source of discrepancy between the high calculated and low actual energy consumption, since athletic facilities are only periodically used through the year. Furthermore,
according to the national methodology, the energy calculations do not account for lighting and electrical appliances or similar process loads that typically are not linked to occupant comfort conditions in residential buildings. For NR buildings, office and miscellaneous equipment and process loads (e.g. elevators, escalators, data center and telecom room computing equipment) are not considered. In the event that a building does not have an installed cooling system, the calculations are performed for the reference building with a standard cooling system covering 50% of the cooling loads for dwellings and 100% for NR buildings. Mechanical ventilation is always accounted for in the calculations for NR buildings, with the same continuous operating schedules.
Another assessment of the energy performance indicators was carried out using available data from the Hellenic EPCs that also include the actual energy consumption of the buildings (optional information that is provided by the building owner and entered by the building inspector in the issued EPC, if available). The analysis was based using the EPCs available by mid-2014. At the time, the registry included a total of 564,948 EPCs (84.8% for dwellings and 15.1% for NR buildings). Excluding certificates with missing and incomplete information, not officially submitted (i.e. temporarily entered and stored data in the registry), the duplicates issued for the same dwellings during the second phase of a national program for energy efficiency in residential buildings and the ones issued
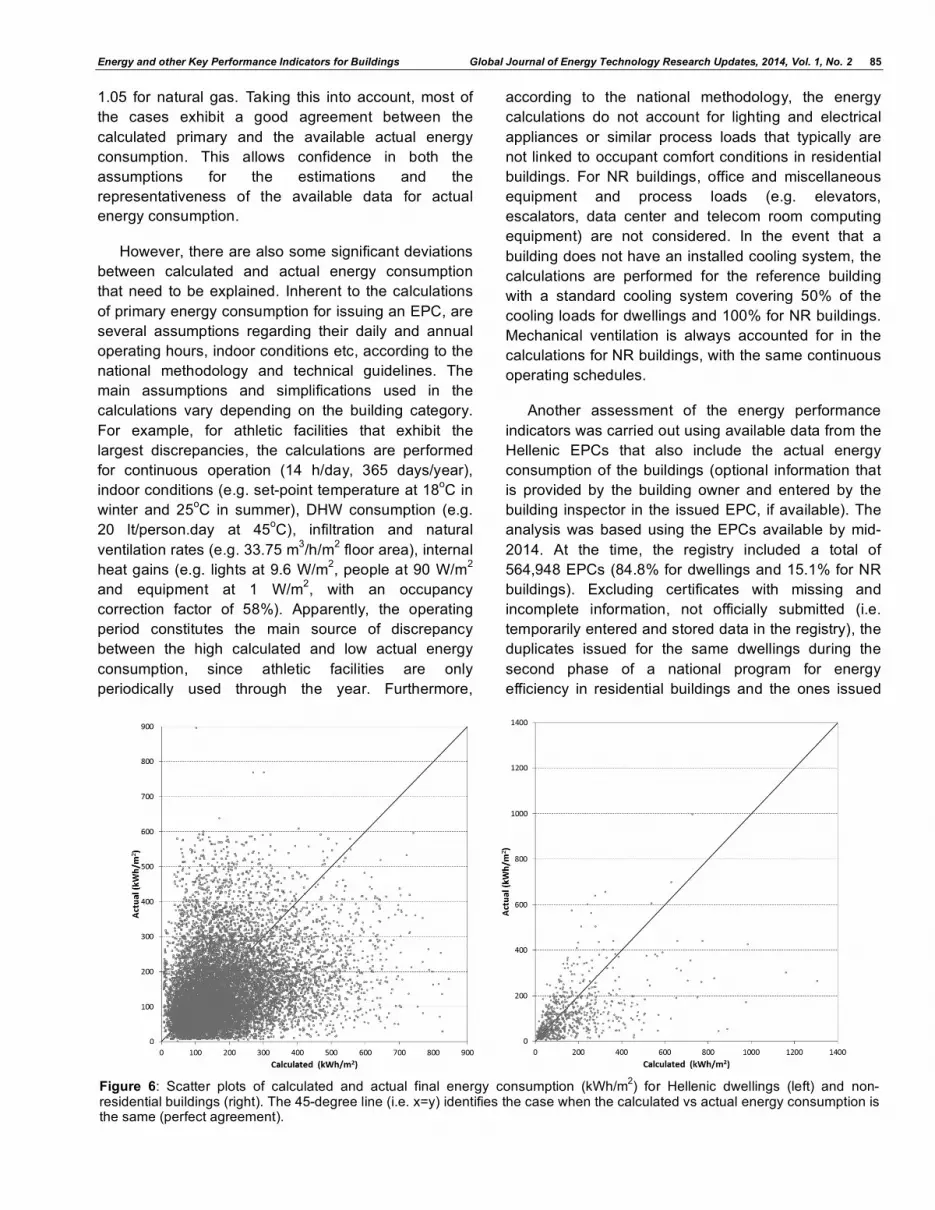
Figure 6: Scatter plots of calculated and actual final energy consumption (kWh/m2) for Hellenic dwellings (left) and non-residential buildings (right). The 45-degree line (i.e. x=y) identifies the case when the calculated vs actual energy consumption is the same (perfect agreement).
86 Global Journal of Energy Technology Research Updates, 2014, Vol. 1, No. 2 Balaras et al.
by energy inspectors that have been penalized and their temporary license revoked, the available EPCs reached 437,263 for dwellings and 84,757 for NR buildings. The valid certificates that also included actual energy consumption data were about 36.0% for dwellings and 1.3% for NR buildings. Finally, out of this sample, the data was screened to select cases that use only one energy carrier source for space heating or space heating and DHW, in order to compare the calculated and actual energy consumption for heating. Accordingly, the available data reached 12,549 for dwellings and 713 for NR buildings, which are illustrated in Figure 6.
Although there are very large variations for individual cases, the goal of this exercise is to look at the entire population of available data in order to derive adaptation factors f(actual/calculated) for reaching more realistic estimates of calculated energy performance for the Hellenic building stock. The average adaptation factor for dwellings is about 1.14 (i.e. 14% higher energy consumption than calculated). For NR buildings, the corresponding value is 0.98 (i.e. 2% lower). Overall, higher calculated indicators correspond to lower actual energy consumption. This is in agreement with the results reported in other studies based on German, Dutch, British, Belgian and French households, where actual energy use for heating is on average 30% less than calculated [46]. This is referred to as the “prebound” effect and it is more evident for buildings with a with a poor energy performance (i.e. a high calculated energy consumption). The opposite phenomenon is referred to as the “rebound” effect and is common for buildings with a good energy performance (i.e. a high calculated energy consumption), for which actual energy use is higher than the calculated. The adaptation factors should be refined on the basis of different building typologies (e.g. SFH, MFH and the different categories of NR buildings), construction periods and climate zones.
Setting minimum requirements for better building efficiency in the design and construction phases is the first step. However, one also needs to take into account the role of occupants, since the human factor can play a determinant role in altering the building’s actual energy use. Their behavior is influenced by other external factors, for example, energy prices or fuel poverty, even at the expense of proper IEQ.
Along these lines, work is underway to look at the actual energy consumption of new high performance buildings after occupancy and for existing buildings
before and after building refurbishment under realistic operating conditions. These efforts could provide valuable insight for adapting calculations to realistically quantify actual energy consumption of new buildings and energy savings from different refurbishment strategies in existing buildings. This knowledge will support the ongoing European efforts to introduce effective policies towards NZEBs and set realistic plans for refurbishing the existing building stock by taking into account the real effectiveness and market limitations of different energy conservation measures.
6. CONCLUSIONS
There are numerous performance indicators that one can use to assess building design alternatives of new or existing buildings. The main goals are usually to minimize building loads, exploit renewables and use energy efficient equipment with minimum conventional fuel or energy consumption. Different KPIs can support the diverse needs of stakeholders and their priorities, to support decision making. In routine building design practice, the first step is to calculate power demand (loads) or energy demand in an effort to minimize system sizing and thus meet building code requirements or minimize first cost. Depending on the opportunities for a given project, efforts may focus on building architecture, selection of different thermal envelope materials and components and then E/Μ systems. Other indicators may also be used for the assessment of indoor thermal comfort conditions under free floating conditions (e.g. minimum and maximum indoor temperature), indoor visual comfort conditions (e.g. daylight) and indoor air quality (e.g. different air flow rates and minimum fresh (outdoor) requirements).
Most commonly used eKPIs, which quantify a building’s energy performance, include the normalized final (site) energy breakdown of different fuels (e.g. renewables, electricity, heating oil, natural gas) and primary (source) energy consumption that facilitates the assessment of environmental impact (e.g. emissions). Although different times steps may be used (e.g. hourly, monthly), the most common is on an annual basis (e.g. annual energy consumption or annual emissions). In addition, indicators can be used for evaluating different scenarios for equipment and system selection that can lower the total building’s energy consumption, specific end-use energy consumption, e.g. related to HVAC equipment, lighting, and DHW.
Throughout Europe, new and existing buildings that are subject to major renovations meet the minimum

Energy and other Key Performance Indicators for Buildings Global Journal of Energy Technology Research Updates, 2014, Vol. 1, No. 2 87
energy performance requirements, which are expressed as an energy label (building class) in the EPCs. Energy performance indicators can represent primary energy, CO2 emissions, net delivered (final) energy weighted by any other parameter defined by national energy policy (e.g. delivered energy or cost). These may be complemented by any other indicator. That sets some kind of priorities and allows for enough flexibility to have them tailored to meet specific needs and even national or even market priorities. The bottom line, relevant economic indicators (e.g. taking into account first cost, energy cost or savings) for the life cycle of the building and components, will best support the decision making process.
Good quality data from EPCs and HVAC inspections according to the EPBD provisions can support efforts to gain an insight of the building stock using uniform specific data, while documenting relevant examples and best practices. The European Commission has recognized this need and is organizing a building stock observatory to monitor the improvement of the energy performance of buildings and its impact on the actual energy consumption of the building sector. The goal is to establish a dataset framework and methodology including specific indicators, to collect and evaluate national data for different building categories and building level results for all the indicators in a consistent and comparable manner. The minimum indicators will include data for the building stock (e.g. floor area, number of building categories and uses, type of energy generation, new construction and retrofit rates), energy performance (e.g. energy demand to satisfy the different building services, building envelope and technical installation characteristics, fuel mix, embodied energy, IEQ and behavioral aspects, actual energy consumption by building category), certification and financing (e.g. number of buildings with EPCs or other energy and sustainability certification, level of investment and financial schemes associated with renovations).
Exploiting recent data on actual energy performance of Hellenic buildings is a first attempt to close the gap between calculated (predicted) and actual energy consumption. The first analysis of real energy consumption data from the national EPC registry revealed that actual energy consumption exhibits large variations for the same calculated EPI. The average ratio of actual to calculated final energy consumption was about 14% higher in dwellings and 2% lower in NR buildings. Future work will also take into consideration additional information on actual
energy performance and operational behaviors of occupants, along with the insight from a focused investigation on selected buildings to explain and account for the deviations of calculated and actual consumption. Eventually, the objective is to develop a comprehensive methodology based on building typologies and practical tools for realistic assessment of energy use at building-level and for building stock analysis, in existing condition or before and after refurbishment.
ACKNOWLEDGEMENTS
Part of this work on the performance indicators was elaborated in the context of the European project “Intelligent Services for Energy-Efficient Design and Life Cycle Simulation – ISES” (http://ises.eu-project. info) that is co-financed by the European Commission (Seventh framework Programme, Information Society and Media Directorate-General). ISES is coordinated by Prof. Dr.-Ing. Raimar J. Scherer and Dr.-Ing. Peter Katranuschkov, Institute of Construction Informatics, Technische Univeritaet Dresden, Germany. The work related to the Hellenic buildings was performed in the frame of the European project EPISCOPE - Energy Performance Indicator Tracking Schemes for the Continuous Optimisation of Refurbishment Processes in European Housing Stocks (http://episcope.eu) that is co-financed by the European Commission (Executive Agency for Small and Medium Size Enterprises– EASME). EPISCOPE is coordinated by Dipl.-Ing. Brita Stein, Dipl. Physicist Tobias Loga and Dr.-Ing. Physicist Nikolaus Diefenbach, Institute for Housing and Environment, Darmstadt, Germany. The contents of this work does not necessarily reflect the opinion of the European Union. Neither the EASME nor the European Commission are responsible for any use that may be made of the information contained herein.
The official national EPC registry (www.buildingcert.gr) was developed and is maintained by the Ministry of Environment, Energy and Climate Change (YPEKA) in collaboration with the Centre for Renewable Energy Sources (CRES). The authors wish to acknowledge YPEKA for allowing access to the national EPC database.
REFERENCES
[1] Eurostat Pocketbooks. Energy. Transport and Environment Indicators – 2014 Edition. Brussels: European Union. Available from: http://ec.europa.eu/energy/publications/doc/2013_pocketbook.pdf
[2] Europe 2020 - Integrated guidelines for the economic and employment policies of the Member States. Brussels:
88 Global Journal of Energy Technology Research Updates, 2014, Vol. 1, No. 2 Balaras et al.
European Union. Available from: http://ec.europa.eu/eu2020/index_en.htm
[3] Directive 2010/31/EU of the European Parliament and of the Council of 19 May 2010 on the energy performance of buildings (recast), Brussels. Available from: http://ec.europa.eu/energy/efficiency/buildings/buildings_en.htm
[4] Dascalaki EG, Kontoyiannidis S, Balaras CA, Droutsa KG. Energy certification of Hellenic buildings: First findings. Energy and Buildings 2013; 65: 429-37. http://dx.doi.org/10.1016/j.enbuild.2013.06.025
[5] Arcipowska A, Anagnostopoulos F, Mariottini F, Kunkel S. Energy performance certificates across the EU, Brussels: Buildings Performance Institute Europe (BPIE), October 2014. Available from: http://bpie.eu/epc_2014.html
[6] Directive 2009/125/EC of the European Parliament and of the Council of 21 October 2009 establishing a framework for the setting of ecodesign requirements for energy-related products (recast), Brussels. Available from: http://ec.europa.eu/enterprise/policies/sustainable-business/ecodesign
[7] Dascalaki E, Droutsa P, Gaglia A, Kontoyiannidis S, Balaras CA. Data collection and analysis of the building stock and its energy performance – An example for Hellenic buildings. Energy and Buildings. 2010; 42(8): 1231-7. http://dx.doi.org/10.1016/j.enbuild.2010.02.014
[8] Loga T, Diefenbach N (eds.). DATAMINE - Collecting data from energy certification to monitor performance indicators for new and existing buildings, Final report, January 2009. Available from: http://www.meteo.noa.gr/datamine/DATAMINE_Final_Report.pdf
[9] A country-by-country review of the energy performance of buildings. Brussels: Buildings Performance Institute Europe (BPIE), October 2011. Available from: www.bpie.eu/eu_buildings_under_microscope.html
[10] Wilford C, Ramos M. Zero carbon compendium - Who's doing what in housing worldwide, Amersham: NHBC Foundation, Milton Keynes: Zero Carbon Hub, London: PRP Architects, 2010. Available from: http://www.zerocarbonhub.org/resources/reports/zero-carbon-compendium-whos-doing-what-housing-worldwide
[11] ESTIF - Solar thermal markets in Europe - Trends and market statistics 2013. Brussels: European Solar Thermal Industry Federation, June 2014. Available from: http://www.estif.org/statistics/st_markets_in_europe_2013/
[12] IEA Task 26. Solar combisystems. International Energy Agency. Available from: http://archive.iea-shc.org/task26/
[13] Balaras CA, Grossman G, Henning H-M, Ferreira CAI, Podesser E, Wang L. et al. Solar air conditioning in Europe – An overview. Renewable & Sustainable Energy Reviews. 2007; 11(2): 299-314. http://dx.doi.org/10.1016/j.rser.2005.02.003
[14] Klein SA, Reindl DT. Solar refrigeration. ASHRAE J. 2005; 47(9): S26-S30. http://www.sustainabilityconsortium.org/wp-content/themes/sustainability/assets/media/Solar_Refrigeration.pdf
[15] ICT for a low carbon economy – eeBuilding key performance indicators. Brussels: European Commission, January 2014. Available from: http://sustainable-places.eu/wp-content/uploads/2014/02/1stW-eeb_kpis_booklet.pdf
[16] Balaras CA, Dascalaki E, Guruz R, Katranuschkov P. D9+ Energy-related key performance indicators within ISES, Final Technical Report D9+ (Additional Deliverable) for ISES, European Commission, DG Information Society and Media, FP7, August 2013. Available from: http://ises.eu-project.info/documents/ISES-D9+.pdf
[17] Gudnason G, Katranuschkov P, Balaras CA, Scherer RJ. Framework for sharing and re-use of domain data in whole building energy simulation. Proceedings to the ECPPM 2014 eWork and eBusiness in Architecture, Engineering and Construction 10th European Conference on Product & Process Modelling. Vienna, Austria, 2014.
[18] Diefenbach N, Loga T, Stein B (eds.). Building stock energy performance indicators - First version. March 2014. Available from: http://episcope.eu/fileadmin/episcope/public/docs/reports/EPISCOPE_Indicators_FirstConcept.pdf
[19] EN 7730:2005. Ergonomics of the thermal environment – Analytical determination and interpretation of thermal comfort using calculation of the PMV and PPD indices and local thermal comfort criteria. Brussels: European Committee for Standardization.
[20] EN 15217:2007. Energy performance of buildings - Methods for expressing energy performance and for energy certification of buildings. Brussels: European Committee for Standardization.
[21] ASHRAE Standard 62.1:2013 Ventilation for acceptable indoor air quality. Atlanta: ASHRAE.
[22] EN 15251:2007. Indoor environmental input parameters for design and assessment of energy performance of buildings addressing indoor air quality, thermal environment, lighting and acoustics. Brussels: European Committee for Standardization.
[23] EN 15193:2007. Energy performance of buildings - Energy requirements for lighting. Brussels: European Committee for Standardization.
[24] Robertson K. Daylighting guide for buildings. Ontario: Canadian Mortgage & Housing Corporation 2005. Available from: http://www.cmhc-schl.gc.ca/en/inpr/bude/himu/coedar/upload/Daylighting-Guide-for-Buildings.pdf
[25] EN 15603:2008 Energy performance of buildings. Overall energy use and definition of energy ratings. Brussels: European Committee for Standardization.
[26] prEN 15603:2013 Energy performance of buildings ― Overarching standard EPBD. Brussels: European Committee for Standardization.
[27] ASHRAE Standard 105-2014, Standard methods of determining, expressing, and comparing building energy performance and greenhouse gas emissions. Atlanta: ASHRAE.
[28] Häkkinen T (ed.). Sustainability and performance assessment and benchmarking of buildings. SuPerBuildings Final report, Espoo: VTT 2012. Available from: http://cic.vtt.fi/superbuildings/
[29] Balaras CA, Gaglia AG, Georgopoulou E, Mirasgedis S, Sarafidis Y, Lalas DP. European residential buildings and empirical assessment of the Hellenic building stock, energy consumption, emissions & potential energy savings. Build Environ. 2007; 42: 1298-14. http://dx.doi.org/10.1016/j.enconman.2006.10.008
[30] Erhorn-Kluttig H, Kaan H, Borsboom W, Fuhler T, Koch A, Nyffenegger U. Market trends towards nearly-zero energy buildings. BUILD UP web portal of the European Commission. www.buildup.eu
[31] Low energy buildings in Europe: Current state of play, definitions and best practice. Commission's Info-Note on Low Energy Buildings, Brussels: European Commission. Available from: http://ec.europa.eu/energy/efficiency/doc/buildings/info_note.pdf
[32] ASHRAE Standard 90.1: 2013 Energy standard for buildings except low-rise residential buildings. Atlanta: ASHRAE.

Energy and other Key Performance Indicators for Buildings Global Journal of Energy Technology Research Updates, 2014, Vol. 1, No. 2 89
[33] Parker DS. Very low energy homes in the United States: Perspectives on performance from measured data. Energy and Buildings. 2009; 41 (5): 512-20. http://dx.doi.org/10.1016/j.enbuild.2008.11.017
[34] NZEB definitions in Europe, The BPIE data hub for the energy performance of buildings. Brussels: Buildings Performance Institute Europe (BPIE), March 2014. Available from: http://www.buildingsdata.eu/nzeb-definitions-europe
[35] Harris D, Higgins C. Key performance indicators – Field metering study and energy performance feedback. California Energy Commission, PIER Energy‐Related Environmental Research Program 2012. Available from: http://newbuildings.org/sites/default/files/KPIFinalReportJuly2012.pdf
[36] Key performance indicators for commercial buildings. Vancouver: New Buildings Institute. Available from: http://newbuildings.org/kpi
[37] Rajagopalan P, Leung Tony CY. Progress on building energy labelling techniques. Advances in Building Energy Research. 2012; 6(1): 61-80. http://hdl.handle.net/10536/DRO/DU:30047770
[38] Reed R, Bilos A, Schulte K, Wilkinson S. A comparison of international sustainable building tool- An update. Proceedings to the 17th Annual Pacific Rim Real Estate Society Conference, Gold Coast 2011. Available from: http://www.prres.net/Proceedings/..%5CPapers%5CReed_International_Rating_Tools.pdf
[39] Perez-Lombard L, Ortiz J, Gonzalez R, Maestre IR. A review of benchmarking, rating and labelling concepts within the framework of building energy certification schemes. Energy and Buildings. 2009; 41: 272–8. http://dx.doi.org/10.1016/j.enbuild.2008.10.004
[40] Survey on Energy Consumption in Households 2011-2012. Athens: Hellenic Statistical Authority, October 2013. Available from:
http://www.statistics.gr/portal/page/portal/ESYE/BUCKET/A0805/PressReleases/A0805_SFA40_DT_5Y_00_2012_01_F_EN.pdf
[41] Gaglia AG, Balaras CA, Mirasgedis S, Georgopoulou E, Sarafidis Y, Lalas DP. Empirical assessment of the Hellenic non-residential building stock, energy consumption, emissions and potential energy savings. Energy Convers Manag. 2007; 48 (4): 1160-75. http://dx.doi.org/10.1016/j.enconman.2006.10.008
[42] Atanasiu B, Kontonasiou E, Mariottini F. Alleviating fuel poverty in the EU - Investing in home renovation, A sustainable and inclusive solution. Brussels: Buildings Performance Institute Europe (BPIE), May 2014. Available from: http://www.bpie.eu/fuel_poverty.html
[43] Statistics on income and living conditions 2013. Athens: Hellenic Statistical Authority, October 2014. Available from: http://www.statistics.gr/portal/page/portal/ESYE/BUCKET/A0802/PressReleases/A0802_SFA10_DT_AN_00_2013_08_F_EN.pdf
[44] Dascalaki EG, Balaras CA, Gaglia AG, Droutsa KG, Kontoyiannidis S. Energy performance of buildings - EPBD in Greece. Energy Policy 2012; 45: 469-77. http://dx.doi.org/10.1016/j.enpol.2012.02.058
[45] Droutsa KG, Kontoyiannidis S, Dascalaki EG, Balaras CA. Mapping the energy performance of Hellenic buildings through the energy certificates. Proceedings to the 10th National Conference on Soft Energy Sources. Thessaloniki, Greece 2014. (In Greek)
[46] Sunikka-Blank M, Galvin R. Introducing the prebound effect: the gap between performance and actual energy consumption. Building Research & Information 2012; 40(3): 260-73. http://dx.doi.org/10.1080/09613218.2012.690952
Received on 16-10-2014 Accepted on 01-11-2014 Published on 08-01-2015
DOI: http://dx.doi.org/10.15377/2409-5818.2014.01.02.2
© 2014 Balaras et al.; Avanti Publishers. This is an open access article licensed under the terms of the Creative Commons Attribution Non-Commercial License (http://creativecommons.org/licenses/by-nc/3.0/) which permits unrestricted, non-commercial use, distribution and reproduction in any medium, provided the work is properly cited.