Embed Size (px)
Citation preview
ECOLE POLYTECHNIQUE FEDERALE DE LAUSANNE SCHOOL OF LIFE SCIENCES
Master's project in Bioengineering and Biotechnology
Effects of Photodynamic Therapy in Combination with
Anti-Angiogenic Drugs on the Chicken Chorioallantoic
Membrane Model
Done by
Andrea Weiss
Under the direction of
Prof. Hubert van den Bergh
Co-director
Dr. Patrycja Nowak-Sliwinska
In the laboratory of The Medical Photonics Group
EPFL
External Expert Prof. Dr. Arjan W. Griffioen
Department of Medical Oncology
VU University Medical Center, Amsterdam, The Netherland
LAUSANNE, EPFL 2011

Table of Contents Summary ..................................................................................................................................................... 1
Introduction .................................................................................................................................................. 3
Angiogenesis........................................................................................................................................... 3
Angiogenic factors .............................................................................................................................. 4
Receptor tyrosine kinases ................................................................................................................. 6
Exudative age-related macular degeneration .................................................................................... 8
Overview .............................................................................................................................................. 8
Treatment options for AMD ............................................................................................................... 9
Cancer .................................................................................................................................................... 13
Tumor angiogenesis ........................................................................................................................ 15
Anti-angiogenic drug therapy ............................................................................................................. 17
General information, advantages and disadvantages ................................................................ 17
Anti-angiogenic drugs ...................................................................................................................... 21
Photodynamic therapy ......................................................................................................................... 25
Clinical applications ......................................................................................................................... 25
Advantages and limitations ............................................................................................................. 25
Mechanism of action ........................................................................................................................ 26
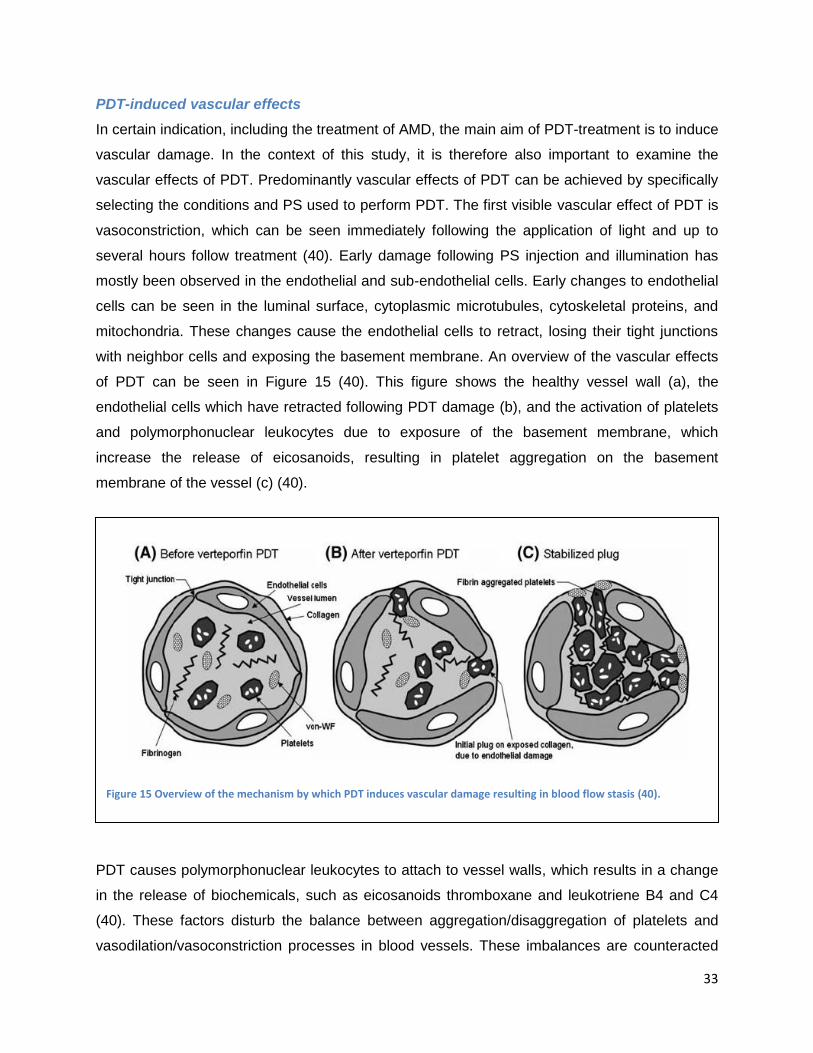
Visudyne® .......................................................................................................................................... 34
Comparative study of PDT and anti-angiogenic treatment of AMD ............................................. 36
Clinical study on combination therapy for the treatment of AMD .................................................. 36
Chicken Chorioallantoic Membrane (CAM) model .......................................................................... 37
Angiogenesis models ....................................................................................................................... 38
CAM as an angiogenesis model .................................................................................................... 39
Image-processing quantification programs ...................................................................................... 42
Quantification of inhibition of the naturally-developing CAM ..................................................... 42
Quantification of vascular regrowth following vaso-occlusive PDT .......................................... 44
Materials and Methods ............................................................................................................................ 46
Materials and chemicals ...................................................................................................................... 46
The in ovo CAM model ........................................................................................................................ 46
Microscope and image acquisition .................................................................................................... 47
Inhibition of developmental angiogenesis in the CAM .................................................................... 47
Visudyne®-photodynamic therapy ...................................................................................................... 48
Combination Visudyne®-PDT and anti-angiogenic drug therapy .................................................. 48
Image-processing quantification method .......................................................................................... 48
Results ....................................................................................................................................................... 52
Inhibition of developmental angiogenesis in the CAM .................................................................... 52
Inhibition of PDT-induced angiogenesis in the CAM ...................................................................... 55
Topically administrated angiogenesis-inhibitors .......................................................................... 56
Intravenously administrated angiogenesis-inhibitors .................................................................. 61
Discussion and Conclusions ................................................................................................................... 63
Abbreviations ............................................................................................................................................ 68
Works Cited ............................................................................................................................................... 70
1
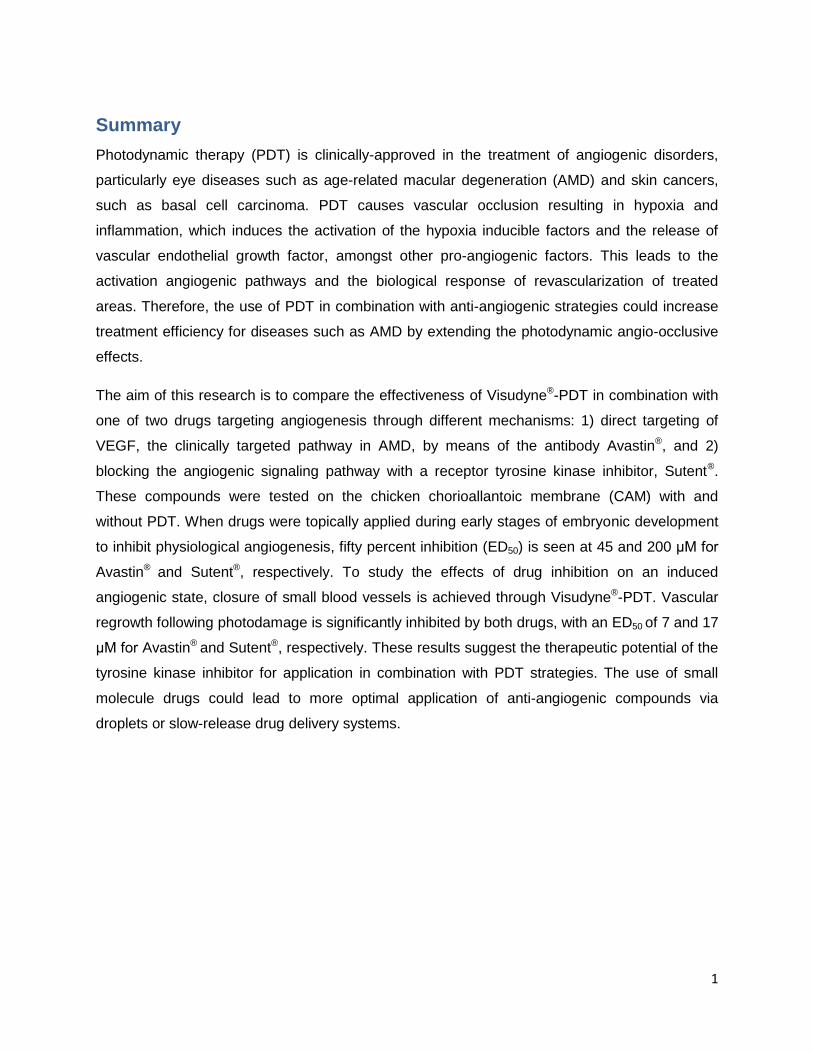
Summary
Photodynamic therapy (PDT) is clinically-approved in the treatment of angiogenic disorders,
particularly eye diseases such as age-related macular degeneration (AMD) and skin cancers,
such as basal cell carcinoma. PDT causes vascular occlusion resulting in hypoxia and
inflammation, which induces the activation of the hypoxia inducible factors and the release of
vascular endothelial growth factor, amongst other pro-angiogenic factors. This leads to the
activation angiogenic pathways and the biological response of revascularization of treated
areas. Therefore, the use of PDT in combination with anti-angiogenic strategies could increase
treatment efficiency for diseases such as AMD by extending the photodynamic angio-occlusive
effects.
The aim of this research is to compare the effectiveness of Visudyne®-PDT in combination with
one of two drugs targeting angiogenesis through different mechanisms: 1) direct targeting of
VEGF, the clinically targeted pathway in AMD, by means of the antibody Avastin®, and 2)
blocking the angiogenic signaling pathway with a receptor tyrosine kinase inhibitor, Sutent®.
These compounds were tested on the chicken chorioallantoic membrane (CAM) with and
without PDT. When drugs were topically applied during early stages of embryonic development
to inhibit physiological angiogenesis, fifty percent inhibition (ED50) is seen at 45 and 200 μM for
Avastin® and Sutent®, respectively. To study the effects of drug inhibition on an induced
angiogenic state, closure of small blood vessels is achieved through Visudyne®-PDT. Vascular
regrowth following photodamage is significantly inhibited by both drugs, with an ED50 of 7 and 17
μM for Avastin® and Sutent®, respectively. These results suggest the therapeutic potential of the
tyrosine kinase inhibitor for application in combination with PDT strategies. The use of small
molecule drugs could lead to more optimal application of anti-angiogenic compounds via
droplets or slow-release drug delivery systems.

2
3
Introduction
Angiogenesis
Angiogenesis is defined as the formation of new blood vessels from pre-existing capillaries (1).
This term was coined in 1935 in order to describe the formation of new blood vessels in
placenta (2). The survival of all cells and tissues is dependent on angiogenesis, due to the
transportation of gasses and nutrients in the blood through the vascular network. Angiogenesis
is therefore incredibly important to many normal physiological processes such as normal tissue
growth, embryonic development, wound healing and menstruation (1). In the same sense, the
inability of the body to properly control angiogenesis can lead to many severe disease states.
Inadequate angiogenesis can lead to ischemic tissues (tissues with restricted blood flow) and
cardiac failure, while abnormally high levels of angiogenesis can result in pathological
processes such as: cancer, age-related macular degeneration (AMD), cardiovascular diseases
(atherosclerosis), chronic inflammation (rheumatoid arthritis, Crohn‟s disease), diabetes
(diabetic retinopathy), psoriasis, endometriosis and adiposity (3; 4).
Blood vessels are lined by endothelial cells which are in direct contact with blood. Below the
monolayer of endothelial cells, blood vessels are surrounded by pericytes (structural support
cells), smooth muscle cells, fibroblasts, the basement membrane (BM) and the extracellular
membrane (ECM) (1). Endothelial cells are metabolically active and selectively permeable to
small solutes and peptides/proteins. They also play a key role in many regulatory processes in
the body including: regulation of blood coagulation (5); directing cells of the immune system to
specific sites in the body through the release of chemo-attractants, cytokines and chemokines
(6); aiding in vascular remodeling and being directly involved in the angiogenic cascade (1).
The process of angiogenesis is characterized by the formation of new vessels from preexisting
vessels, capillaries and postcapillary venules (7). Angiogenesis is initiated by the release of pro-
angiogenic factors which activate signaling cascades. The increased release of pro-angiogenic
factors is normally in response to the release of cytokines by cells in a hypoxic (low oxygen) or
ischemic environment (1). The transition from quiescent or non-proliferative vasculature to
angiogenic vasculature is marked by a change in the balance between pro- and anti-angiogenic
factors.
Endothelial cell activity is always the first process to initiate angiogenesis in all situations. It is
believed that vascular endothelial growth factor (VEGF) is the most important molecule involved
4
in the initiation of angiogenesis (1). This hypothesis is supported by the fact that the release of
VEGF results in vasodilation through endothelial cell production of nitrous oxide, which
increases endothelial cell permeability, a pre-requisite for endothelial cells to enter the
angiogenic cascade (1; 8). Increased endothelial cell permeability allows plasma proteins to
enter the tissue and form a fibrin-rich provisional network to support the growth of new blood
vessels (9). VEGF‟s importance in initiating the angiogenic cascade is supported by the fact that
its production is controlled by hypoxia inducible factors (HIF) and the fact that the VEGF
receptor (VEGFR) is over expressed in hypoxic or ischemic conditions (10). Even though VEGF
is arguably the most important factor involved in angiogenesis, evidence has shown that
angiogenesis in not entirely VEGF dependent (11).
In the process of angiogenesis, activated endothelial cells migrate to the desired location of the
body, degrading the BM of the parent venule in order to move towards an angiogenic stimulus.
The endothelial cells elongate and align to create a solid sprout, while the lumen of the vessel is
formed by a curvature in each endothelial cell (12). The endothelial cells continue to proliferate,
increasing the length of the sprout, until finally two hollow sprouts will join at their tips to create a
loop and allow blood to flow. Pericytes then line the base of the loop and new sprouts can grow
from its apex (13).
The exact process of these last steps of angiogenesis is not entirely understood, but the
process is believed to be guided by specialized cells at the front of the sprout called „tip cells‟. A
study conducted by Gerhardt et al. on angiogenesis in the retina of mice found that retinal
vessels grow in expanding circles (14). These sprouts were guided by specialized tip cells
supported by highly proliferative stalk cells. This study revealed that the tip cells are highly
polarized and uniquely responsive the VEGF-A isoform. Tip cells grow by extending along
filopodia which follow astrocyte cell tracks. The filopodia can guide the tip cells by detecting
VEGF-A gradients, which are created by astrocytes. The stalk cells are also specifically
responsive to VEGF-A, but to its absolute concentration and not its gradient (14).
Adult vasculature is mainly quiescent with the exception of organs which undergo ongoing
angiogenesis, such as the female reproductive organs, organs that undergo physiological
growth, or injured tissues (15).
Angiogenic factors
Physiologic angiogenesis is a very complicated process which involves many different pro- and
anti-angiogenic stimuli including many growth factors and environmental factors. Vascular
5
endothelial growth factor (VEGF) is the most potent and best understood of these growth factors
(1). It belongs to the VEGF-PDGF supergene family, which contains 5 isoforms based on
alternative exon splicing (VEGF-A, VEGF-B, VEGF-C, VEGF-D and VEGF-E). Out of these
factors, VEGF-A is the most potent growth factor and is frequently referred to as simply VEGF
(16). VEGF is responsible for the regulation of angiogenesis through the following mechanisms:
increasing micro-vascular permeability to plasma proteins (17); inducing endothelial cell division
and migration (18; 19); promoting endothelial cell survival through interactions with ECM
components, such as αvβ3 integrin, which prevents apoptosis (20) and reverses endothelial cell
senescence (21; 22); promoting stromal degradation and possibly increasing the formation of
extravascular fibrin substrate for endothelial and tumor cell growth (23; 24). VEGF is also
believed to induce the expression of proteases and receptors involved in cellular invasion and
tissue remodeling (25; 26). Loss of VEGF signaling can result in apoptosis of endothelial cells
(15). This family of ligands interacts with three receptor tyrosine kinases: VEGFR-1/FLT-1,
VEGFR-2/FLK-1/KDR and VEGFR-3/FLT-4; however its angiogenic effects are mainly due to
binding with VEGFR-1 and -2 found predominantly on vascular endothelial cells (24; 27).
VEGFRs, however, are not only expressed on the vascular endothelium, but also on
monocytes, macrophages and some tumors cells (1). VEGF is mainly produced by angiogenic
endothelial cells, but can also be produced in hypoxic tumor cells, macrophages and other
immune cells (28). VEGF-A binds with greater affinity to VEGFR-1 than VEGFR-2, but it is
believed that VEGFR-1 mainly acts as an intermediate receptor, controlling the availability of
VEGF-A to VEGFR-2, which is mainly responsible for VEGF-related signaling (24; 29).
Other important pro-angiogenic factors include the basic fibroblast growth factor family, (bFGF
also referred to as FGF2) and the platelet-derived growth factor (PDGF) (16). There are also
many ECM components which can have effects on angiogenesis and endothelial cell
morphology including: integrins, throbospondin, laminin and osteonectin. Integrin αvβ3 plays a
particularly critical role in angiogenesis due to the fact that its inhibition results in endothelial cell
apoptosis and the fact that it mediates cellular adhesion to many factors (30). In addition, it is
minimally expressed in quiescent endothelial cells while being up-regulated in angiogenic
endothelial cells (31).
In addition to the molecules and pathways mentioned above, there are also other cell types and
environmental factor which can affect angiogenesis including: immune cells, periendothelial
cells and environmental factors such as hypoxia (1). Hypoxic conditions are capable of inducing
6
angiogenesis through the activation of HIF, which in turn causes the release of VEGF and other
pro-angiogenic factors (1).
The decision for a blood vessel to remain quiescent or become angiogenic is dependent on
many different signals of varying importance, some of which are briefly discussed above.
Interactions with these pathways can be achieved through many different mechanisms and can
provide the ability to control angiogenesis for therapeutic purposes.
Receptor tyrosine kinases
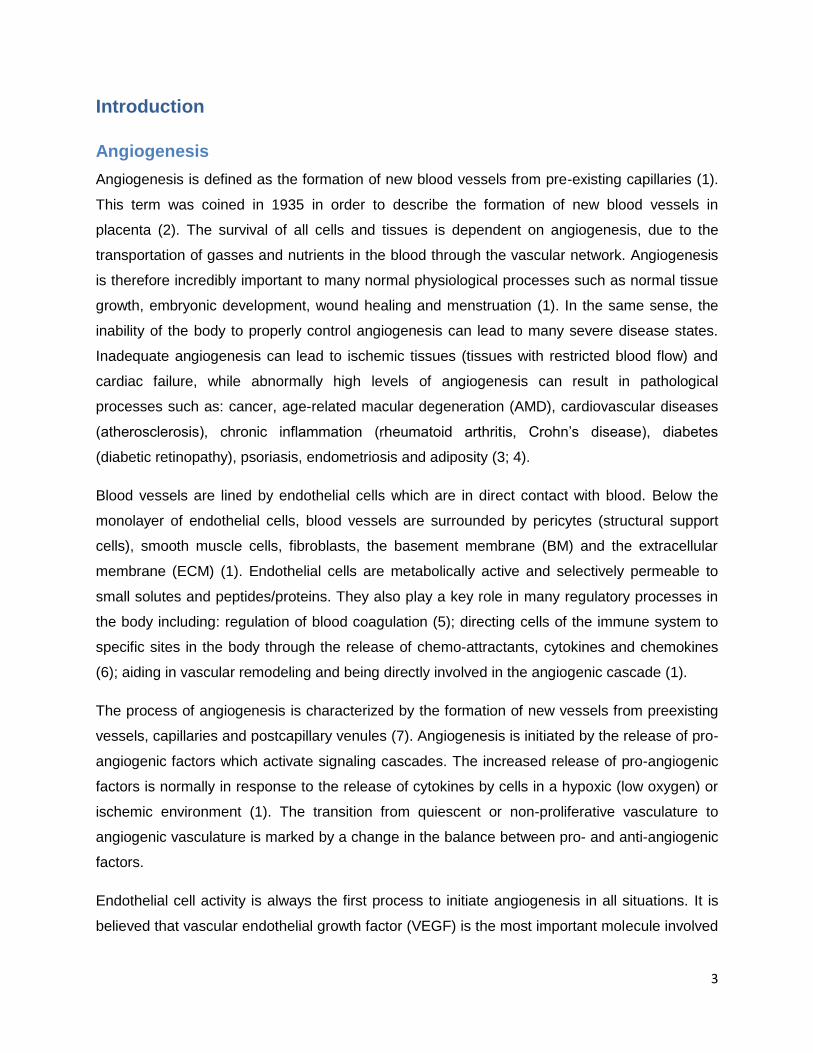
Many important angiogenic factors such as VEGFs, PDGF, FGFs, and epidermal growth factor
(EGF) interact with endothelial cells through receptors which are transmembrane cell signaling
proteins called receptor tyrosine kinases (RTKs) (32; 16). RTKs are responsible for transducing
extracellular signals to the interior of cells and are involved in many different pathways in the
body, including cell proliferation and migration (16). An overview of different pathways involved
in angiogenesis which are activated by RTKs can be seen in Figure 1 (adapted from Gotink et
al. (16)). The most common RTK involved in angiogenesis is the VEGFR (16).
Figure 1 Overview of receptor tyrosine kinase signaling pathways involved in angiogenesis (16).
7
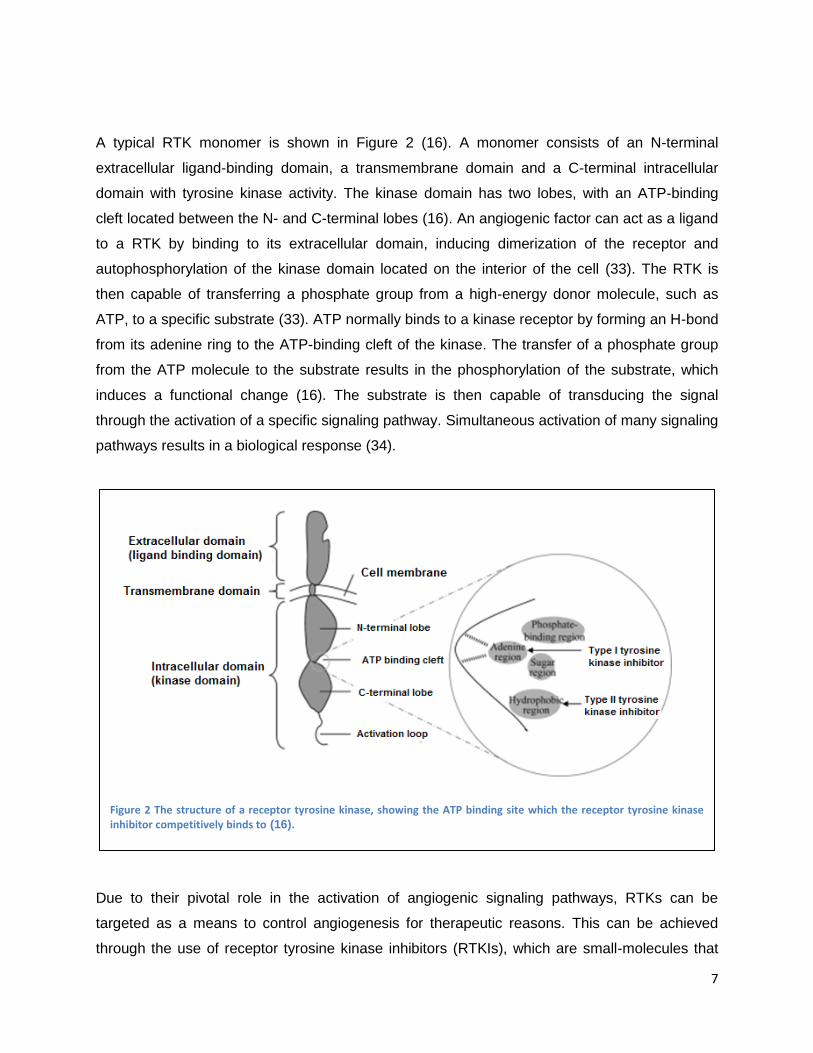
A typical RTK monomer is shown in Figure 2 (16). A monomer consists of an N-terminal
extracellular ligand-binding domain, a transmembrane domain and a C-terminal intracellular
domain with tyrosine kinase activity. The kinase domain has two lobes, with an ATP-binding
cleft located between the N- and C-terminal lobes (16). An angiogenic factor can act as a ligand
to a RTK by binding to its extracellular domain, inducing dimerization of the receptor and
autophosphorylation of the kinase domain located on the interior of the cell (33). The RTK is
then capable of transferring a phosphate group from a high-energy donor molecule, such as
ATP, to a specific substrate (33). ATP normally binds to a kinase receptor by forming an H-bond
from its adenine ring to the ATP-binding cleft of the kinase. The transfer of a phosphate group
from the ATP molecule to the substrate results in the phosphorylation of the substrate, which
induces a functional change (16). The substrate is then capable of transducing the signal
through the activation of a specific signaling pathway. Simultaneous activation of many signaling
pathways results in a biological response (34).
Due to their pivotal role in the activation of angiogenic signaling pathways, RTKs can be
targeted as a means to control angiogenesis for therapeutic reasons. This can be achieved
through the use of receptor tyrosine kinase inhibitors (RTKIs), which are small-molecules that
Figure 2 The structure of a receptor tyrosine kinase, showing the ATP binding site which the receptor tyrosine kinase inhibitor competitively binds to (16).
8
competitively interfere with the ATP binding site (shown in Figure 2) (16). There exist three
categories of RTKIs. Type I kinase inhibitors, which include Sutent®, recognize the active
conformation of the kinase and bind to the ATP-binding site by presenting one to three H-Bonds
which mimic bonds normally formed by ATP. Due to the fact that the ATP binding site is mostly
conserved in all RTKs, type I inhibitors always occupy the adenine region of ATP-binding site,
and it is therefore hard to have a type I inhibitor which is highly selective (16). Type II kinase
inhibitors recognize the inactive confirmation of the kinase and indirectly compete with ATP by
occupying the hydrophobic pocket right next to ATP-binding site. Finally, type III kinase
inhibitors, which are known as „covalent‟ inhibitors, covalently bind to the cysteines at a specific
site in the kinase, blocking the binding of ATP (16).
Exudative age-related macular degeneration
Overview
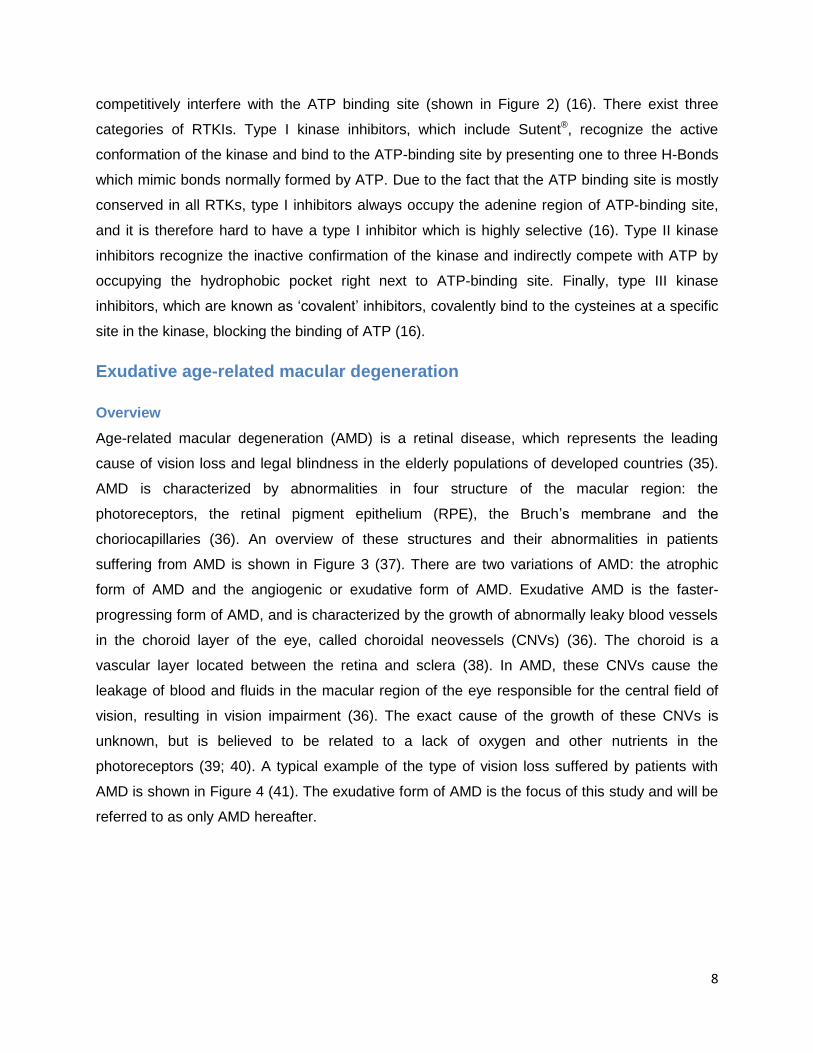
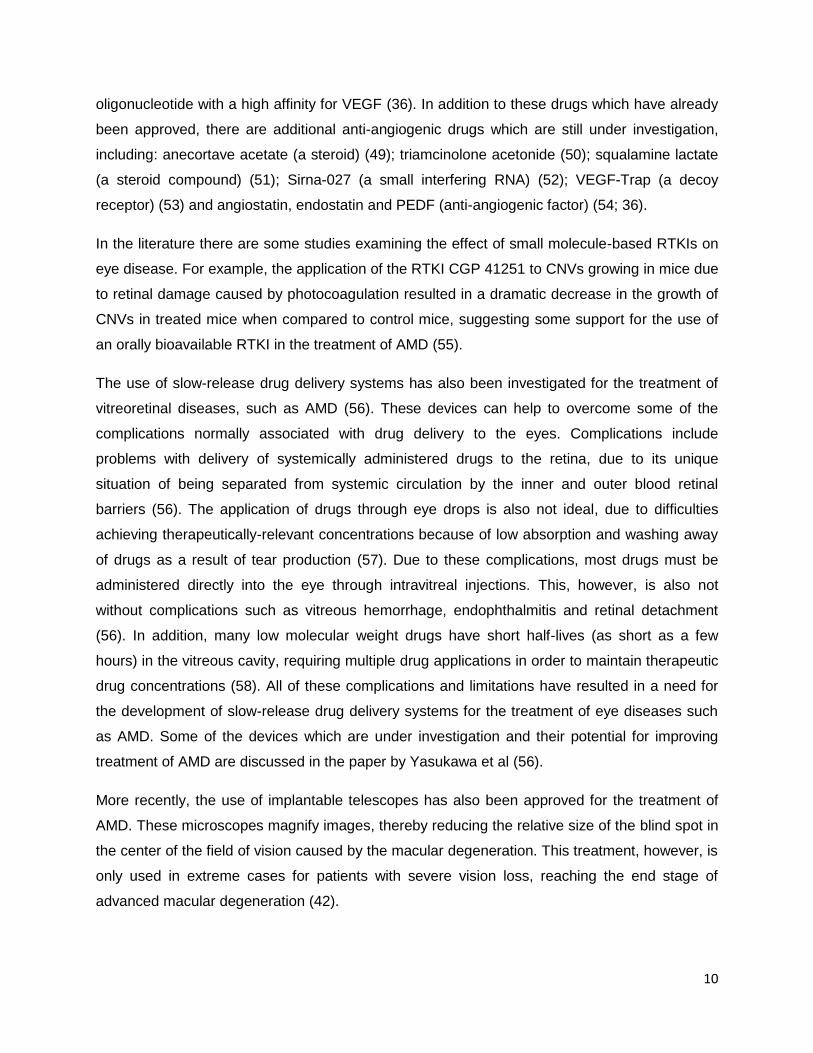
Age-related macular degeneration (AMD) is a retinal disease, which represents the leading
cause of vision loss and legal blindness in the elderly populations of developed countries (35).
AMD is characterized by abnormalities in four structure of the macular region: the
photoreceptors, the retinal pigment epithelium (RPE), the Bruch‟s membrane and the
choriocapillaries (36). An overview of these structures and their abnormalities in patients
suffering from AMD is shown in Figure 3 (37). There are two variations of AMD: the atrophic
form of AMD and the angiogenic or exudative form of AMD. Exudative AMD is the faster-
progressing form of AMD, and is characterized by the growth of abnormally leaky blood vessels
in the choroid layer of the eye, called choroidal neovessels (CNVs) (36). The choroid is a
vascular layer located between the retina and sclera (38). In AMD, these CNVs cause the
leakage of blood and fluids in the macular region of the eye responsible for the central field of
vision, resulting in vision impairment (36). The exact cause of the growth of these CNVs is
unknown, but is believed to be related to a lack of oxygen and other nutrients in the
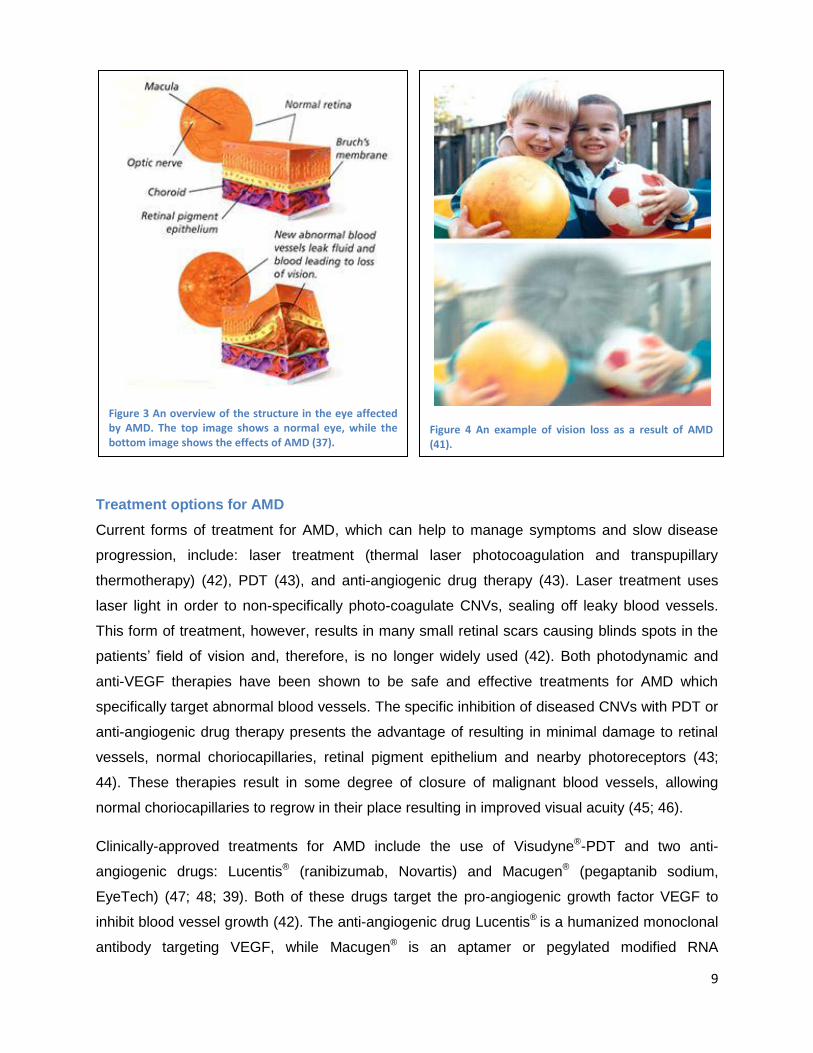
photoreceptors (39; 40). A typical example of the type of vision loss suffered by patients with
AMD is shown in Figure 4 (41). The exudative form of AMD is the focus of this study and will be
referred to as only AMD hereafter.
9
Treatment options for AMD
Current forms of treatment for AMD, which can help to manage symptoms and slow disease
progression, include: laser treatment (thermal laser photocoagulation and transpupillary
thermotherapy) (42), PDT (43), and anti-angiogenic drug therapy (43). Laser treatment uses
laser light in order to non-specifically photo-coagulate CNVs, sealing off leaky blood vessels.
This form of treatment, however, results in many small retinal scars causing blinds spots in the
patients‟ field of vision and, therefore, is no longer widely used (42). Both photodynamic and
anti-VEGF therapies have been shown to be safe and effective treatments for AMD which
specifically target abnormal blood vessels. The specific inhibition of diseased CNVs with PDT or
anti-angiogenic drug therapy presents the advantage of resulting in minimal damage to retinal
vessels, normal choriocapillaries, retinal pigment epithelium and nearby photoreceptors (43;
44). These therapies result in some degree of closure of malignant blood vessels, allowing
normal choriocapillaries to regrow in their place resulting in improved visual acuity (45; 46).
Clinically-approved treatments for AMD include the use of Visudyne®-PDT and two anti-
angiogenic drugs: Lucentis® (ranibizumab, Novartis) and Macugen® (pegaptanib sodium,
EyeTech) (47; 48; 39). Both of these drugs target the pro-angiogenic growth factor VEGF to
inhibit blood vessel growth (42). The anti-angiogenic drug Lucentis® is a humanized monoclonal
antibody targeting VEGF, while Macugen® is an aptamer or pegylated modified RNA
Figure 4 An example of vision loss as a result of AMD (41).
Figure 3 An overview of the structure in the eye affected by AMD. The top image shows a normal eye, while the bottom image shows the effects of AMD (37).
10
oligonucleotide with a high affinity for VEGF (36). In addition to these drugs which have already
been approved, there are additional anti-angiogenic drugs which are still under investigation,
including: anecortave acetate (a steroid) (49); triamcinolone acetonide (50); squalamine lactate
(a steroid compound) (51); Sirna-027 (a small interfering RNA) (52); VEGF-Trap (a decoy
receptor) (53) and angiostatin, endostatin and PEDF (anti-angiogenic factor) (54; 36).
In the literature there are some studies examining the effect of small molecule-based RTKIs on
eye disease. For example, the application of the RTKI CGP 41251 to CNVs growing in mice due
to retinal damage caused by photocoagulation resulted in a dramatic decrease in the growth of
CNVs in treated mice when compared to control mice, suggesting some support for the use of
an orally bioavailable RTKI in the treatment of AMD (55).
The use of slow-release drug delivery systems has also been investigated for the treatment of
vitreoretinal diseases, such as AMD (56). These devices can help to overcome some of the
complications normally associated with drug delivery to the eyes. Complications include
problems with delivery of systemically administered drugs to the retina, due to its unique
situation of being separated from systemic circulation by the inner and outer blood retinal
barriers (56). The application of drugs through eye drops is also not ideal, due to difficulties
achieving therapeutically-relevant concentrations because of low absorption and washing away
of drugs as a result of tear production (57). Due to these complications, most drugs must be
administered directly into the eye through intravitreal injections. This, however, is also not
without complications such as vitreous hemorrhage, endophthalmitis and retinal detachment
(56). In addition, many low molecular weight drugs have short half-lives (as short as a few
hours) in the vitreous cavity, requiring multiple drug applications in order to maintain therapeutic
drug concentrations (58). All of these complications and limitations have resulted in a need for
the development of slow-release drug delivery systems for the treatment of eye diseases such
as AMD. Some of the devices which are under investigation and their potential for improving
treatment of AMD are discussed in the paper by Yasukawa et al (56).
More recently, the use of implantable telescopes has also been approved for the treatment of
AMD. These microscopes magnify images, thereby reducing the relative size of the blind spot in
the center of the field of vision caused by the macular degeneration. This treatment, however, is
only used in extreme cases for patients with severe vision loss, reaching the end stage of
advanced macular degeneration (42).
11
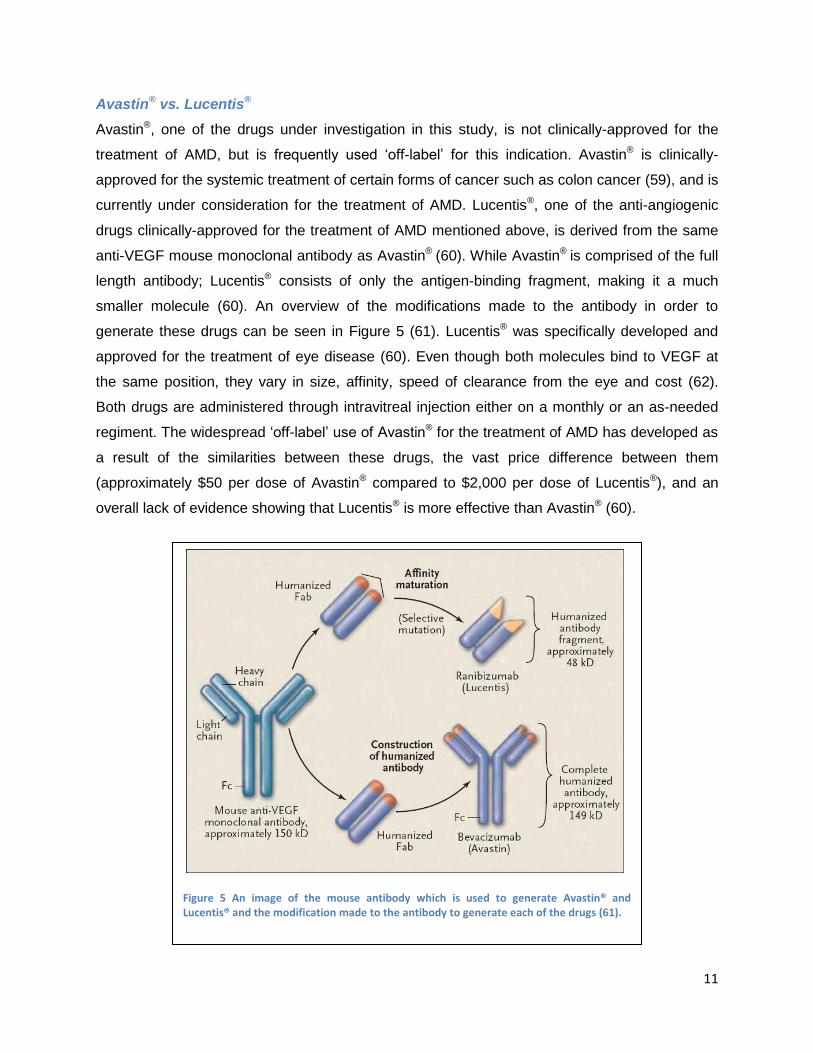
Avastin® vs. Lucentis®
Avastin®, one of the drugs under investigation in this study, is not clinically-approved for the
treatment of AMD, but is frequently used „off-label‟ for this indication. Avastin® is clinically-
approved for the systemic treatment of certain forms of cancer such as colon cancer (59), and is
currently under consideration for the treatment of AMD. Lucentis®, one of the anti-angiogenic
drugs clinically-approved for the treatment of AMD mentioned above, is derived from the same
anti-VEGF mouse monoclonal antibody as Avastin® (60). While Avastin® is comprised of the full
length antibody; Lucentis® consists of only the antigen-binding fragment, making it a much
smaller molecule (60). An overview of the modifications made to the antibody in order to
generate these drugs can be seen in Figure 5 (61). Lucentis® was specifically developed and
approved for the treatment of eye disease (60). Even though both molecules bind to VEGF at
the same position, they vary in size, affinity, speed of clearance from the eye and cost (62).
Both drugs are administered through intravitreal injection either on a monthly or an as-needed
regiment. The widespread „off-label‟ use of Avastin® for the treatment of AMD has developed as
a result of the similarities between these drugs, the vast price difference between them
(approximately $50 per dose of Avastin® compared to $2,000 per dose of Lucentis®), and an
overall lack of evidence showing that Lucentis® is more effective than Avastin® (60).
Figure 5 An image of the mouse antibody which is used to generate Avastin® and Lucentis® and the modification made to the antibody to generate each of the drugs (61).
12
In order to determine the efficacy of these two drugs, a large, prospective, multicenter
randomized clinical trial was performed called the Comparison of AMD Treatment Trials (CATT)
(63). In this study, optical coherence topographies (OCT) were used in order to monitor disease
progression following treatment and identify fluid leakage from blood vessels. First-year results
from this study showed that monthly use of Avastin® and Lucentis® resulted in the same visual
acuity outcome. OCT results showed better retinal thickness measurements for Lucentis®-
treated patients, which may be reflected in the visual acuity measurements for the second year
check point, but were not evident at the end of the first year. This study also showed equivalent
visual acuity outcomes for the monthly and as-needed treatment regime for Lucentis®. As-
needed treatment for Avastin® and Lucentis® appeared similar, but the as-needed treatment
regime for Avastin® was not as effective as the monthly regiment for either drug. This may be
due to Avastin® therapy resulting in shorter treatment benefits for a subgroup of patients
requiring more frequent drug administration (60; 63). Overall, these results are very positive for
patients, as it supports the use of Avastin®, a much less expensive drug than Lucentis®, and
suggests that monthly treatments may not always be necessary.
Visudyne®-PDT
Visudyne®-PDT is commonly used for the treatment of AMD with relatively good results (36; 64).
Studies have shown that Visudyne® preferentially accumulates in the neovasculature (including
CNVs); however animal models have shown that some drug is also present in the retina (65).
Visudyne®-PDT may, therefore, result in some damage to retinal pigmented epithelium and
outer nuclear layers of the retina. Temporary occlusion of CNVs following Visudyne®-PDT in
humans has been confirmed by fluorescein angiography (65).
Two double-masked, placebo-controlled, randomized studies on patients suffering from classic-
containing subfoveal CNVs secondary to age-related macular degeneration were conducted in
order to ascertain the effectiveness of Visudyne®-PDT (66; 65). A total of 609 patients (402
Visudyne® and 207 placebo) were involved in the two studies. Patients were treated and the
vascular effects of the treatment were monitored using fluorescein angiograms. If blood vessel
leakage was not entirely arrested or if a leakage returned, as detected by angiograms,
retreatment was allowed every 3 months. The results of these studies showed that a statistically
significant difference could be seen between patients treated with Visudyne®-PDT and control
patients at both the 1 and 2 year check for visual acuity measurements. A subgroup of patients
with classic CNV lesions (n=242, Visudyne®=159, placebo=83), defined as those where classic
components comprised 50% or more of the whole lesion area, showed a difference of
13
approximately 28% between groups at 12 and 24 months for the primary efficacy endpoint
(defined as the percentage of patients who lost <3 lines of visual acuity). In this subgroup,
severe vision loss ( 6 lines of visual acuity from baseline) occurred in 12% of Visudyne®-treated
patients compared to 36% of placebo-treated patients. Patients with predominantly classic CNV
lesions without occult CNVs showed the greatest treatment benefit, with a 49% difference
between treatment groups at the 1 year check point (assessed by <3 lines-lost definition). Older
patients ( 75), patients with dark irises, occult lesions or less that 50% classic CNVs are less
likely to benefit from PDT (66; 65).
These treatment modalities for AMD have been shown to be relatively effective; however, their
beneficial results are only transient and no long term-cure is yet available. This is due to the fact
that leaky blood vessels are only temporarily stabilized and the formation of new blood vessels
which can become diseased in not prevented. In addition, PDT actually promotes the regrowth
of new blood vessels by creating a hypoxic environment through vascular occlusion. Hypoxia
results in the release of pro-angiogenic factors and initiation of angiogenic signaling pathways
(43). This process accelerates the regrowth of malignant vasculature and therefore the
recurrence of disease symptoms. The recurrence of vision loss necessitates re-treatment and is
the major motivation for the adaptation of combination therapies, which could prevent or slow
the regrowth of blood vessels following treatment.
Cancer
Although exudative AMD is the primary focus of treatment for the research conducted in this
study, many of the implications of these results can be carried over to cancer research. This is
primarily due to the fact that like AMD, tumor growth is accompanied by abnormally angiogenic
vasculature, and the fact that therapeutic benefit can be seen for cancer patient‟s treatment with
anti-angiogenic drugs and PDT. In addition, the use of a combination of anti-angiogenic and
photodynamic therapies present many potential benefits in the treatment of certain forms of
cancer.
In 1971, Judah Folkman first proposed the theory that tumor growth is angiogenesis-dependent,
and that targeting the neovascularization of tumors could provide a new form of cancer therapy
(67). This theory was supported by a study performed in 1963, which showed that tumors
implanted in isolated perfused organs failed to grow larger than a few millimeters, but when the
same tumors were reimplanted into donor mice they grew rapidly killing the host (68). It was
14
believed that the perfused organ created an environment where neovascularization was
inhibited, limiting the tumor‟s growth (13).
This was followed by a study in 1968, which showed that tumors could induce new capillary
vessel growth even if they are separated from the vascular bed of the host by a Millipore filter
(69). This lead to the hypothesis that tumors are capable of releasing a diffusible angiogenic
factor or are capable of degrading an inhibitory factor, giving them the capability to initiating
angiogenesis (13).
It is now widely accepted that tumors are angiogenesis-dependent and their ability to have
sustained angiogenesis has been included as one of the hallmarks needed for the development
and progression of cancer (70).
Cells initially lack the ability to induce angiogenesis, which limits their ability to grow. It is
therefore believed that tumors must develop this ability, through what is referred to as an
„angiogenic switch‟, where the balance between angiogenesis inducers and inhibitors is
switched to favor angiogenesis (70). The „angiogenic switch‟ is believed to be the rate-limiting
secondary step to developing multi-stage carcinoma (71).
The „angiogenic switch‟ is normally accompanied by the increased expression of VEGFs and/or
FGFs, or the down-regulated expression of angiogenesis inhibitors, such as thrombospondin-1
or β-interferon or both. Pro-angiogenic factors secreted by tumor cells stimulate proliferation and
migration of endothelial cells, resulting in the outgrowth of new capillaries into the tumor (70).
Each tumor type utilizes different molecular strategies to initiate the „angiogenic switch‟ (70).
The theory that cancer is angiogenesis-dependent, and that the angiogenic phenotype is
dependent on the expression of pro-angiogenic factors, is supported by the fact that serum
concentrations of VEGF are 6.5 times higher in colon carcinoma patients when compared to
healthy individuals, and that high serum levels of VEGF is strongly associated with reduced
overall survival and disease-free survival (72; 73; 74).
The link between cancer and angiogenesis is further strengthened by evidence which shows
that many cancer-related genetic changes thought to result from mutations in tumor suppressor
genes and oncogenes also result in angiogenic endothelial cells. Many oncogenes, such as c-
myb, sis and src, cause increased expression of molecules that induce angiogenesis. For
example, the mutated ras gene strongly upregulates TGF- α, TGF-β, and VEGF, and can also
indirectly affect angiogenesis through the production and activation of the BM and ECM-
15
degradation enzymes (1). Another example is the mutation of the VHL gene, which is normally
involved in the degradation of HIF-1α. The mutated VHL gene is no longer capable of breaking
down HIF-1α, which can result in upregulation of VEGF, EGFR, and PDGF, and the induction of
angiogenesis (70; 75).
The „angiogenic switch‟ is very dependent on the expression of VEGF, due to the fact that it is
the most potent pro-angiogenic factor. The most common way to inhibit angiogenesis is,
therefore, through drugs which target VEGF or its receptors (16).
Tumor angiogenesis
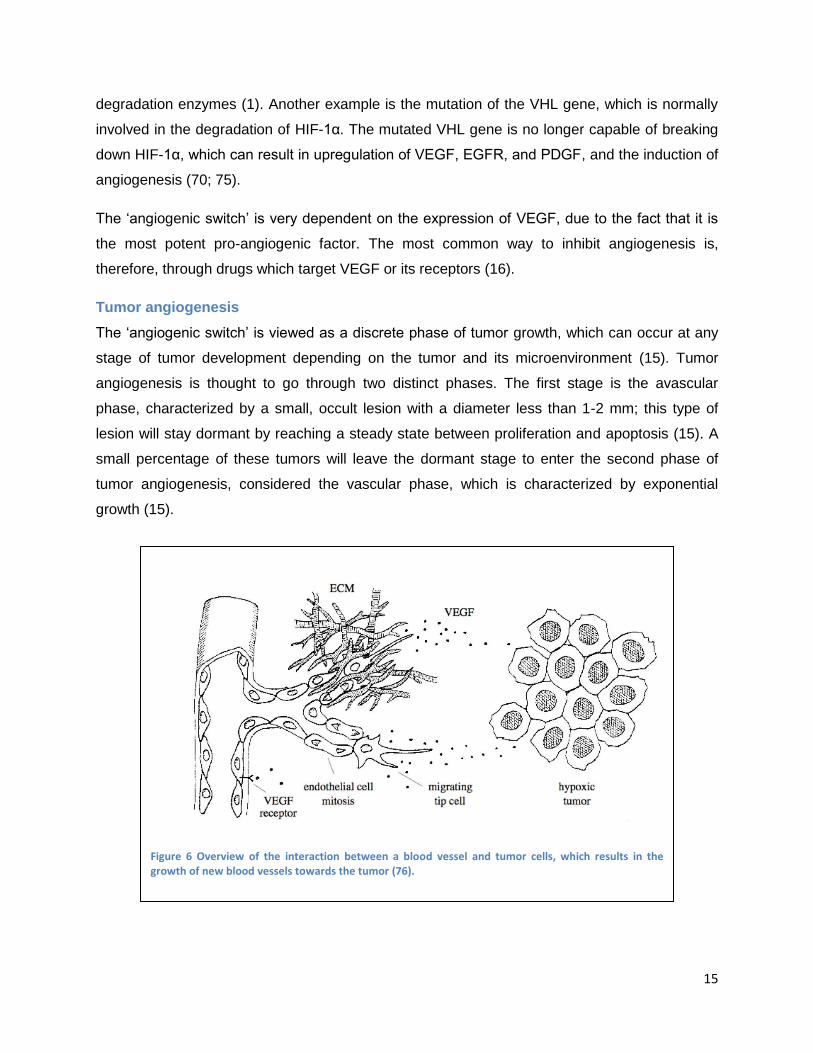
The „angiogenic switch‟ is viewed as a discrete phase of tumor growth, which can occur at any
stage of tumor development depending on the tumor and its microenvironment (15). Tumor
angiogenesis is thought to go through two distinct phases. The first stage is the avascular
phase, characterized by a small, occult lesion with a diameter less than 1-2 mm; this type of
lesion will stay dormant by reaching a steady state between proliferation and apoptosis (15). A
small percentage of these tumors will leave the dormant stage to enter the second phase of
tumor angiogenesis, considered the vascular phase, which is characterized by exponential
growth (15).
Figure 6 Overview of the interaction between a blood vessel and tumor cells, which results in the growth of new blood vessels towards the tumor (76).
16
There are many different pathways by which a tumor can induce angiogenesis, some of which
are described below (13). Tumors can release their own angiogenic factors; each tumor type will
release a combination of different factors in order to initiate angiogenesis. Macrophages can be
attracted and activated to release angiogenic factors. Collagenases and heparanasese, which
store angiogenic factors in the ECM, can be secreted and vascular permeability factors can be
released, which cause leakage of fibrinogen from postcapillary venules to stimulate
angiogenesis. An example of the type of interaction between tumor cells and nearby vasculature
which can result in angiogenesis is shown in Figure 6 (76). This figure shows the tumor cells
releasing pro-angiogenic factors (in this case VEGF) which activate nearby endothelial cells,
resulting in angiogenesis toward the tumor.
Tumor vasculature is significantly different from normal vasculature due changes in the balance
between pro- and anti-angiogenic factors (15). Some distinct characteristics of tumor
vasculature include: aberrant vascular structures, i.e. vessels are irregularly shaped, dilated and
tortuous, even having dead ends; altered endothelial-cell pericyte interactions characterized by
loosely-associated pericytes and less dense pericyte coverage (77); abnormal blood flow which
is slowed and sometimes oscillating, resulting in dysfunctional capillaries; increased vessel
permeability causing leaky and hemorrhagic vessels due to over expression of VEGF and
vessel characterized by delayed maturation (77; 15). These differences are due to the non-
physiologic balance of pro- and anti-angiogenic factors and to the reduced association of
pericytes with blood vessels. Reduced pericyte coverage allows for increased proliferation of
endothelial cells resulting in vessels with abnormal structure, such as the increased thickness or
tortuosity mentioned above, and results in vasculature which has increased sensitivity to the
inhibition of VEGF signaling (15).
It has been hypothesized the unorganized nature of tumor vasculature may be due to
misguiding of the filopodia which guide tip cells. One study showed that tumor vessels had
misguided filopodia similar to those of transgenic mice overexpressing VEGF (14). Tumor
hypoxia can also complicate the angiogenic activity of cancer cells and can result in tumor
vasculature which is never quiescent and constantly growing. It should also be noted that
research has shown that angiogenic activity does not necessarily correlate with the
aggressiveness of a tumor (15).
17
Anti-angiogenic drug therapy
General information, advantages and disadvantages
Based on his theory regarding the dependence of tumor growth on angiogenesis, Judah
Folkman proposed targeting the neovascularization of tumors as a new form of cancer therapy
(67; 16). Now that cancer‟s dependence on angiogenesis has been widely accepted, targeting
tumor angiogenesis has become a viable form of cancer therapy.
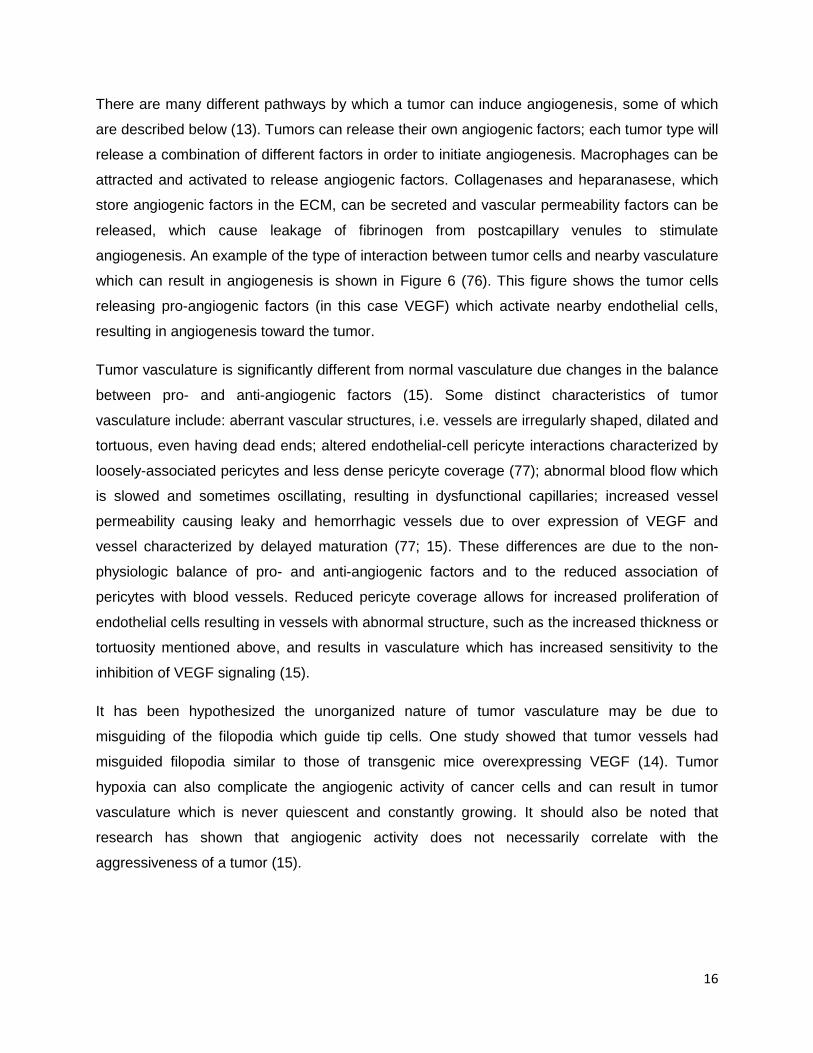
As previously described, angiogenesis is dependent on many pro- and anti- angiogenic
signaling pathways. This study focuses on the use of two particular anti-angiogenic agents: the
monoclonal antibody Avastin®, which directly target VEGF, and a RTKI, Sutent®, which inhibits
VEGFR, thus preventing angiogenic signal transduction. An overview of many of the different
pathways that can be targeted by anti-angiogenic drugs is shown in Figure 7 (78). The particular
pathways of Sutent® and Avastin® are outlined in red and blue, respectively.
Figure 7 Overview of potential targets of anti-angiogenic drugs in cancer treatment. Sutent® (sorafenib) (outlined in red in the figure) is shown targeting receptor tyrosine kinases in the tumors endothelium, while Avastin® (bevacizumab) (outlined in blue) is shown directly targeting VEGF molecules (78).
18
Due to the fact that there are many angiogenic signaling pathways and many pro-angiogenic
factors in the body, there exist many pathways by which angiogenesis can be targeted; but,
there exist equally as many by which a tumor can evade this form of therapy, compensating for
an inhibited factor through the increased expression of other factors (23). These mechanisms
form the basis for one of the main complications associated with anti-angiogenic drug therapy:
drug resistance. This also makes the combination of multiple anti-angiogenic drugs therapies an
attractive therapeutic option, which could provide increased benefits (23). Even though the
development of drug resistance has complicated the use of anti-angiogenic drug therapies in
clinical applications, beneficial results are frequently seen with this form of therapy, as well as
synergistic effects when they are used in combination with either chemo- or radiation therapy
(23).
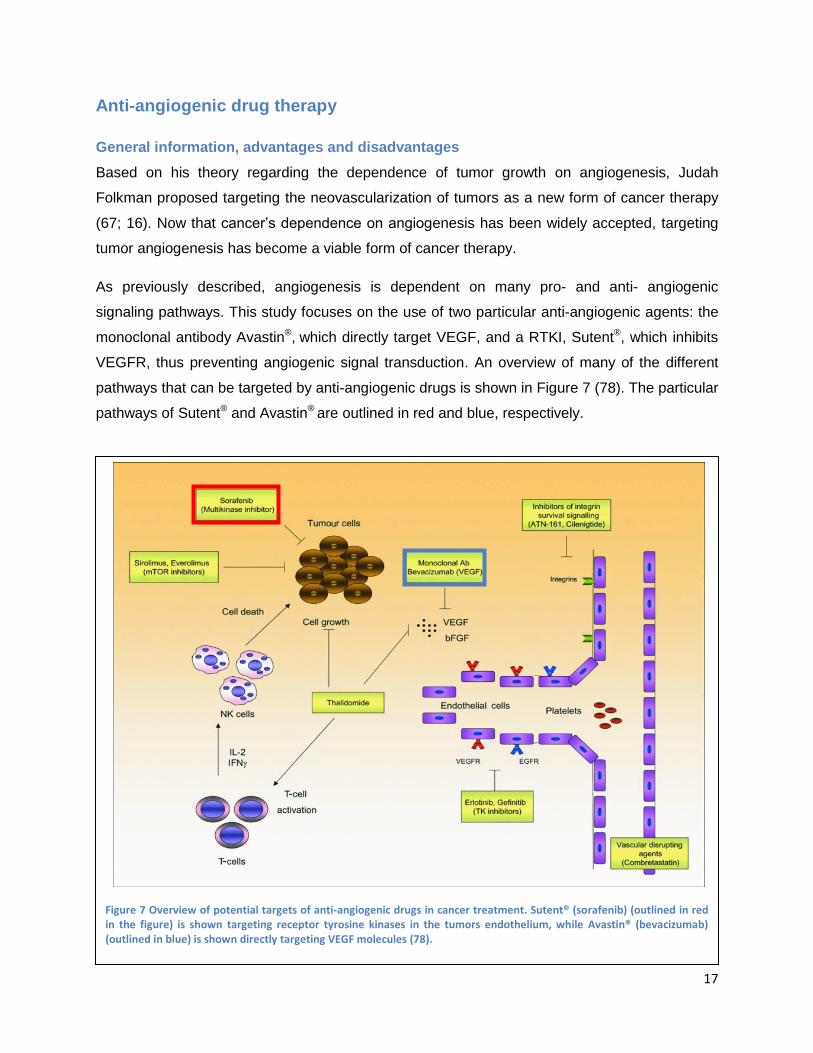
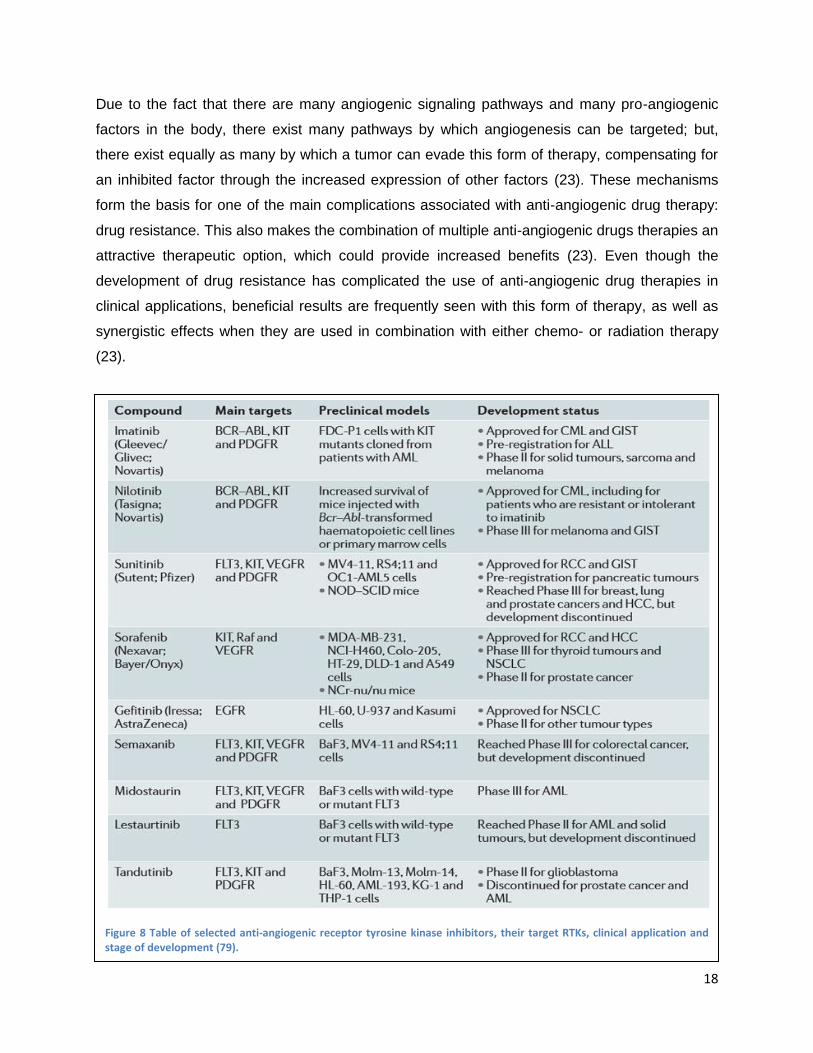
Figure 8 Table of selected anti-angiogenic receptor tyrosine kinase inhibitors, their target RTKs, clinical application and stage of development (79).
19
The use of anti-angiogenic agents for the treatment of angiogenesis based disorders has shown
a lot of therapeutic potential and is a field that is strongly researched. Many anti-angiogenic
drugs are currently under development, involved in clinical trials or are being used in the
treatment of angiogenesis disorders, particularly cancer. A table of selected RTKIs in different
stages of development can be found in Figure 8 (79). Some of the general advantages and
disadvantages of anti-angiogenic drug therapy will be discussed before each of the two drugs
being specifically investigated in this study are described in more detail.
Anti-angiogenic drug therapy has been shown to be a relatively reliable and safe form of
treatment for patients suffering from AMD and remains one of the best therapeutic options for
this disease. More interestingly, however, is the use of anti-angiogenic drug therapy for the
treatment of cancer, as it presents some unique advantages over other common forms of
cancer drug therapy. Drug resistance is one of the major factors which contribute to the failure
of certain types of cancer treatments, such as chemotherapy. It is believed to be caused by one
of two mechanisms: through mutations in growth factor receptor signaling genes, or, as in the
case of classic multi-drug resistance, the reduced energy-dependent uptake of anti-cancer
drugs by drug efflux transporters due to the cloning of multidrug transporters such as P-
glycoprotein (Pgp) (80; 81). It is believed that the development of drug resistance to anti-
angiogenic drugs through these sorts of mutations may be avoidable as they target the tumor
endothelium instead of the tumor cells themselves. Tumors must recruit these endothelial cells
in order to create the vasculature they need to survive and grow. These endothelial cells are
genetically more stable than the tumor cells, meaning that they are less susceptible to
developing mutations that could lead to drug resistance (23). In addition, some RTKIs may be
substrates and/or modulators of these multi-drug transporters, such as Pgp, and therefore may
be able to bypass this mechanism of resistance (80; 81). This advantage, however, is
considered controversial as much evidence has supported the ability of cancer to develop
resistance to anti-angiogenic drugs, as well as results from clinical trials showing the
development of drug resistance.
Although anti-angiogenic drug therapy is an effective form of treatment for AMD and some
forms of cancer, it is still subject to limitations and has certain side effects and toxicities.
Significant clinical toxicities to anti-angiogenic drug therapies have been observed and include:
gastro-intestinal perforation, hypertension and reduced left ventricle ejection fraction (LVEF),
thyroid disturbances and fatigue, kidney damage, sever bleeding, skin toxicities, and disturbed
20
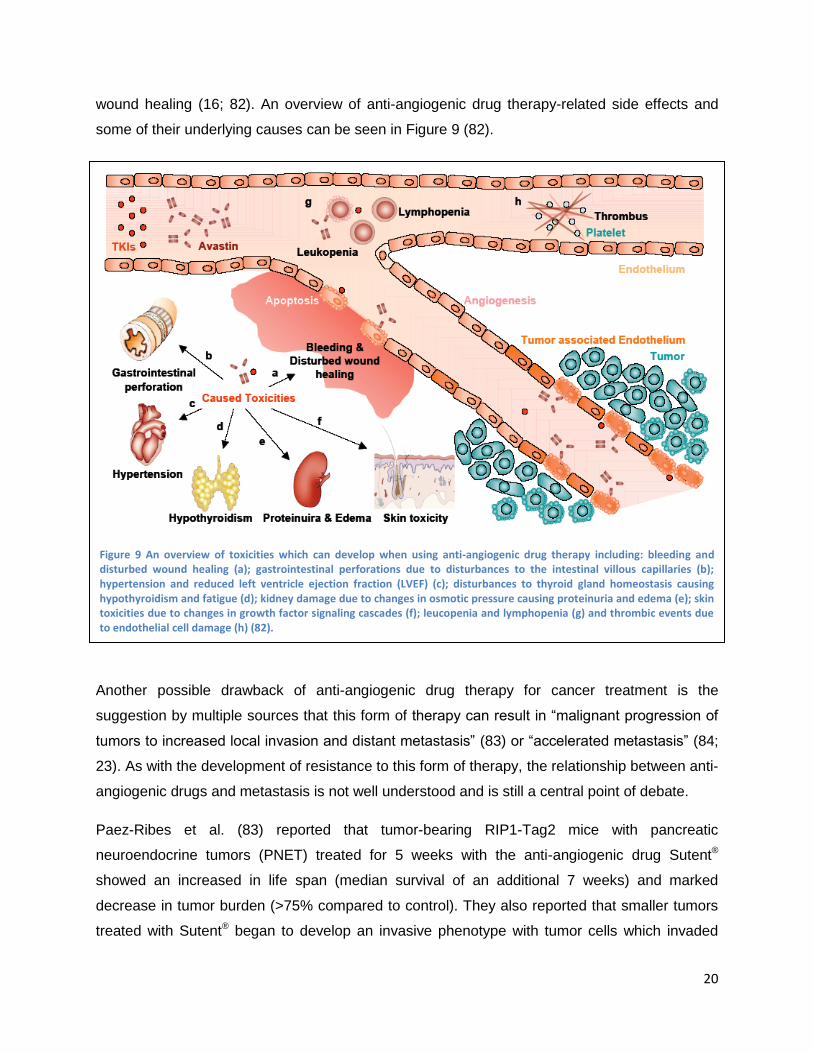
wound healing (16; 82). An overview of anti-angiogenic drug therapy-related side effects and
some of their underlying causes can be seen in Figure 9 (82).
Another possible drawback of anti-angiogenic drug therapy for cancer treatment is the
suggestion by multiple sources that this form of therapy can result in “malignant progression of
tumors to increased local invasion and distant metastasis” (83) or “accelerated metastasis” (84;
23). As with the development of resistance to this form of therapy, the relationship between anti-
angiogenic drugs and metastasis is not well understood and is still a central point of debate.
Paez-Ribes et al. (83) reported that tumor-bearing RIP1-Tag2 mice with pancreatic
neuroendocrine tumors (PNET) treated for 5 weeks with the anti-angiogenic drug Sutent®
showed an increased in life span (median survival of an additional 7 weeks) and marked
decrease in tumor burden (>75% compared to control). They also reported that smaller tumors
treated with Sutent® began to develop an invasive phenotype with tumor cells which invaded
Figure 9 An overview of toxicities which can develop when using anti-angiogenic drug therapy including: bleeding and disturbed wound healing (a); gastrointestinal perforations due to disturbances to the intestinal villous capillaries (b); hypertension and reduced left ventricle ejection fraction (LVEF) (c); disturbances to thyroid gland homeostasis causing hypothyroidism and fatigue (d); kidney damage due to changes in osmotic pressure causing proteinuria and edema (e); skin toxicities due to changes in growth factor signaling cascades (f); leucopenia and lymphopenia (g) and thrombic events due to endothelial cell damage (h) (82).
21
surrounding tissues. This, however, was accompanied by no significant increase in lymphatic
metastasis but an increase in tumor micro-metastases in the liver of the Sutent® treated mice
when compared to control mice (23; 83).
Another study by Ebos et al (84) reported that mice treated with short term Sutent® therapy (120
mg/kg/day) for 7 consecutive days, either directly before or after intravenous tumor implantation,
showed accelerated tumor metastasis and reduced survival when compared to control mice
who received a dose of Sutent® which was considered the minimum effective tumor-inhibiting
dose (continuously administering 40-60 mg/kg/day), as determined by a previous preclinical
study (85).
On the other hand, clinical data from more than 10,000 patients treated with anti-VEGF therapy
reported that “it is unlikely that VEGF-targeted therapy accelerates metastasis” (23; 86). In
addition, many sources have suggested that anti-angiogenic therapy may in fact help to prevent
tumor metastasis, as it is believed that the process of metastasis is angiogenesis-dependent
and may also be inhibited by anti-angiogenic drug therapy (87).
Anti-angiogenic drugs
Avastin®
Avastin® is a recombinant humanized monoclonal anti-body which specifically targets the
VEGF-A isoform of vascular endothelial growth factor. It effective binds and neutralizes human
VEGF, preventing it from binding with its target receptors, VEGFR-1 and 2. Avastin® is
composed of a full length, 149 kDa, antibody derived from an anti-VEGF mouse monoclonal
antibody. It is metabolized and eliminated by the reticuloendothelial system and has no active or
inactive metabolites (88).
As previously discussed, Avastin® is not clinically-approved for the treatment of AMD, but is
frequently used „off-label‟ for this indication in a dose of 1.25 mg (89). Avastin® is the first
clinically-approved angiogenesis inhibitor and was originally approved as a first-line treatment
for patients with advanced, metastatic, colorectal cancer, preferably in combination with
fluoropyrimidine-based chemotherapy (90). In 2008, it was also approved for the treatment of
unresectable, advanced metastatic or recurrent non-squamous non-small cell lung cancer
(NSCLC) in combination with paclitaxel/carboplatin, and has received conditional approval for
the treatment of breast cancer and glioblastoma multiforme (88; 91; 71).
22
For cancer treatment, Avastin® is administered intravenously in a dose ranging from 1 to 10
mg/kg every two weeks. Avastin® is predominantly used in combination with chemotherapy,
because it has been shown to increase the efficiency of treatment and improve progression free
survival and response (90; 92; 93). It is hypothesized that by blocking VEGF signaling, Avastin®
may help to transiently decrease blood vessel leakage in tumors, reducing VEGF-induced
hemorrhaging and edema and the physiological effect of the tumor burden (71). This is believed
to improve blood flow, increasing the bioavailability of chemotherapeutics in the tumor
microenvironment, resulting in increased beneficial effects from chemotherapy treatment (71).
A phase II clinical trial performed by Yang et al. studied the effects of Avastin® therapy on 116
patients with treatment-refractory metastatic clear-cell renal cell carcinoma (RCC). Patients
were either treated with a placebo, low-dose (3 mg/kg) or high-dose (10 mg/kg) Avastin®
administered intravenously every 2 weeks (94). The high-dose treatment group showed
significantly longer time to progression when compared to the placebo treatment group (4.8 vs.
2.5 months). No life-threatening toxicities or deaths were reported. The high-dose treatment
group showed side effects including: hypertension of any grade (36%) and grade 3 hypertension
(21%, not controlled by one standard medication) and asymptomatic proteinuria with no renal
insufficiency (64%). All these side effects were reversible after treatment was stopped. Grade 1
and 2 haemoptysis was also seen in 2 patients in the Avastin® treatment group and in 2 patients
in the placebo treatment group, no thromboembolic events were reported (94; 22).
Sutent®
Sutent® is a broad spectrum, small-molecule RTKI which targets VEGFR (particularly VEGFR-2)
and other RTKs including PDGF and c-kit receptors (22; 95). Being a broad spectrum or
multiple target RTKI, Sutent® interacts with a variety of other RTKs having potential „off-target‟
effects which may be at the origin of some of the side effects and toxicities associated with
Sutent® therapy. It has been speculated that Sutent® may have an additional direct inhibitory
effect on tumor cells by inhibiting one or more of their RTKs (96). Due to the fact that Sutent®
primarily targets tumor vasculature, treatment may have additional effects on drug delivery to
the tumor mass and result in sensitivity of specific vessels to the drug (96).
Sutent® can be administered orally, frequently in a salt form referred to as sunitinib malate, due
to the fact that it is a small molecule (molecular weight of 532 Da) which is mostly hydrophobic.
These characteristics make Sutent® capable of passing through cell membranes where it can
directly interact with the intracellular domain of receptors and intracellular signaling molecules
23
(16). Sutent®‟s bioavailability is not entirely understood, although it is known that its absorption
occurs slowly and a steady-state concentration can only be achieved after 10-14 daily doses
(97). Pharmacokinetic studies on animals have shown that at steady state, a minimum plasma
concentration between 50 and 100 ng/ml of Sutent® and its primary metabolite (SU212662) are
needed for pharmacological activity (98). The main route of elimination of Sutent® from the body
is through fecal excretion (99; 16; 75).
Sutent® is an anti-angiogenic and anti-cancer drug, and, as such, is approved for the treatment
of multiple forms of cancer. Sutent® was clinically approved for the treatment of RCC and
imatinib-resistant gastrointestinal stromal tumor (GIST) in 2006 (100; 101). More recently, in
2010, the European Commission approved the use of Sutent® for the treatment of „unresectable
or metastatic, well-differentiated pancreatic neuroendocrine tumors with disease progression in
adults‟ (102). A phase III clinical study on metastatic RCC showed that Sutent® monotherapy
was a more effective treatment option than interferon alpha immune therapy, which is the first
line of therapy for RCC which is chemotherapy resistant (103).Typical treatment regiments for
cancer patients includes oral administration of Sutent® in 12.5, 25 or 50 mg daily doses, on a 6-
week treatment cycle of 4-weeks on and 2-weeks off (100; 101). A study by Minkin et al. was
aimed at developing a method to quantify the Sutent® plasma concentrations in patients treated
with 25 mg/day on the 6-week cycle mentioned above. After 4 weeks of treatment, the steady
state minimum concentration in these patients was reported to be 32 ng/ml (falling within the
range predicted by the animal study discussed in the paragraph above) (104).
In clinical trials, many patients develop a resistance to Sutent® therapy and it has become
evident that this may be a limitation of Sutent® therapy. Most patients experience at least
transient benefits from treatment; however, a small percent experience no benefits. A study by
McDermott et al. examining the effects of Sutent® therapy on 637 tumor cells lines showed that
only two of the lines were highly sensitive to Sutent® at 1 μM due to activated PDGFRα
signaling, indicating that the other lines had already developed a resistance to the drug (105).
Advanced in reversing drug resistance, however, are possible as the Researchers at the Van
Andel Research Institute (VARI) studying the effects of Sutent® and its mechanism of action
may have identified a way to reverse Sutent® resistance in clear cell RCC tumors. They found
that these tumor cells are capable of developing Sutent® resistance through increased secretion
of the protein interleukin-8 (IL-8), and that when Sutent® is administering in combination with IL-
8 neutralizing antibodies, the tumors cells were resensitized to Sutent® therapy (106).
24
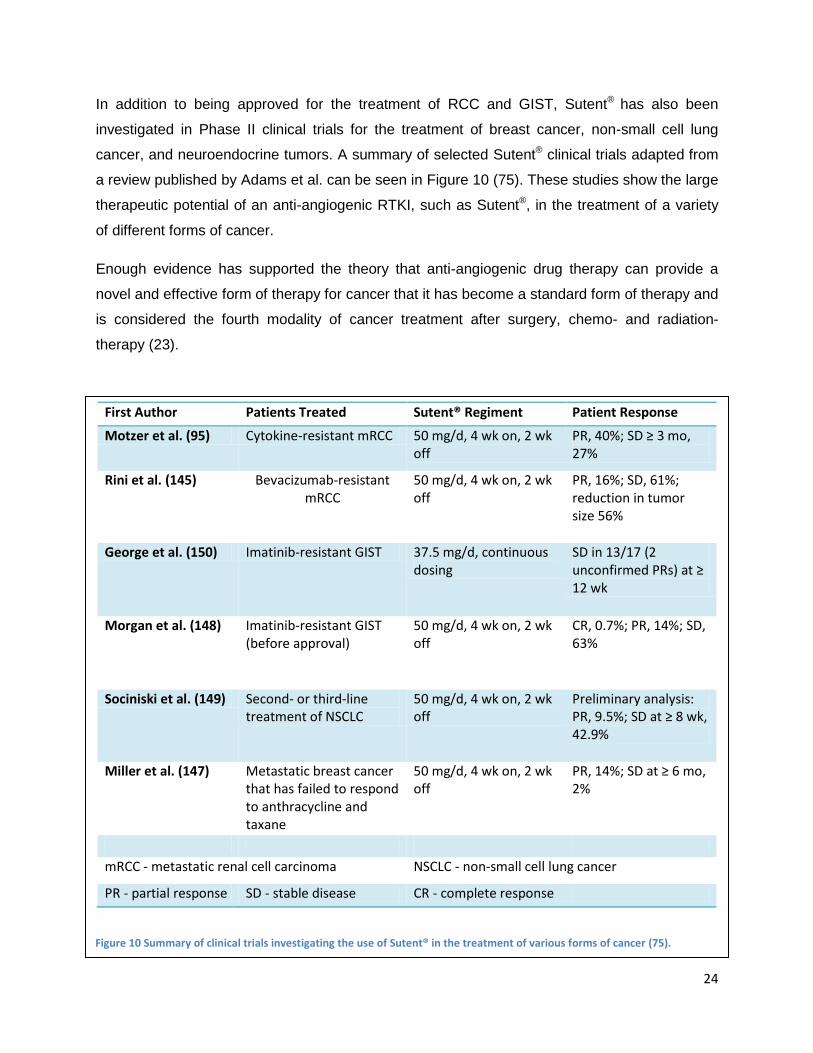
In addition to being approved for the treatment of RCC and GIST, Sutent® has also been
investigated in Phase II clinical trials for the treatment of breast cancer, non-small cell lung
cancer, and neuroendocrine tumors. A summary of selected Sutent® clinical trials adapted from
a review published by Adams et al. can be seen in Figure 10 (75). These studies show the large
therapeutic potential of an anti-angiogenic RTKI, such as Sutent®, in the treatment of a variety
of different forms of cancer.
Enough evidence has supported the theory that anti-angiogenic drug therapy can provide a
novel and effective form of therapy for cancer that it has become a standard form of therapy and
is considered the fourth modality of cancer treatment after surgery, chemo- and radiation-
therapy (23).
First Author Patients Treated Sutent® Regiment Patient Response
Motzer et al. (95) Cytokine-resistant mRCC 50 mg/d, 4 wk on, 2 wk off
PR, 40%; SD ≥ 3 mo, 27%
Rini et al. (145) Bevacizumab-resistant mRCC
50 mg/d, 4 wk on, 2 wk off
PR, 16%; SD, 61%; reduction in tumor size 56%
George et al. (150) Imatinib-resistant GIST 37.5 mg/d, continuous dosing
SD in 13/17 (2 unconfirmed PRs) at ≥ 12 wk
Morgan et al. (148) Imatinib-resistant GIST (before approval)
50 mg/d, 4 wk on, 2 wk off
CR, 0.7%; PR, 14%; SD, 63%
Sociniski et al. (149) Second- or third-line treatment of NSCLC
50 mg/d, 4 wk on, 2 wk off
Preliminary analysis: PR, 9.5%; SD at ≥ 8 wk, 42.9%
Miller et al. (147) Metastatic breast cancer that has failed to respond to anthracycline and taxane
50 mg/d, 4 wk on, 2 wk off
PR, 14%; SD at ≥ 6 mo, 2%
mRCC - metastatic renal cell carcinoma NSCLC - non-small cell lung cancer
PR - partial response SD - stable disease CR - complete response
Figure 10 Summary of clinical trials investigating the use of Sutent® in the treatment of various forms of cancer (75).
25
Photodynamic therapy
The concept of using light as a form of therapy has existed since antiquity. Many ancient
civilizations such as the Egyptians, Indians and Greeks performed a type of photodynamic
therapy using natural photosensitizers found in psolaren-containing plants and sunlight to treat
skin disorders such as psoriasis and vitiligo (107).
Modern PDT utilizes a photosensitizing agent, most often a porphyrin-based compound, and
light in the visual or near-infrared wavelengths. These photosensitizers (PSs) are activated
when irradiated by light allowing them to react with oxygen in the environment creating highly
reactive, short-lived singlet oxygen and reactive oxygen radicals, which causes local damage to
the vascular endothelium and eventually results in vessel occlusion (65). Clinical applications,
advantages and limitations of this therapy will be discussed before its mechanism of action and
vascular effects are described in more depth.
Clinical applications
In addition to being used in the treatment of AMD, PDT is frequently used in the treatment of
early stage cancer with good results and is considered an efficacious, simple, minimally
invasive, repeatable form of therapy (40). PDT is used in the treatment of head and neck tumors
(108), breast cancer (109), brain tumors (110), gynecological tumors (111), non-small cell lung
cancer (112), bladder carcinoma (113), esophageal and skin cancers (including basal cell
carcinoma (BCC) (114) and Bowen‟s disease) (115; 116; 117). PDT is also extensively used in
the treatment of dermatological disorders including, but not limited to: acne vulgaris, photo
rejuvenation, psoriasis, cutaneous lymphoma, viral warts and scleroderma (116).
A multicenter study of a large number of patients with five-year follow up found that PDT
treatment of patients suffering from BCC showed a success rate of approximately 95% in
superficial BCC and 73-94% in nodular BCC (114). The recurrence rate of the superficial BCC
was 22% (compared to 19% for other common forms of therapy) and 14% for nodular BCC
(compared to 4% for other treatment forms which mainly include surgery) (114; 116)
Advantages and limitations
PDT can provide therapeutic benefits for many forms of cancer, skin disorders and AMD. The
use of PDT in the treatment of cancer is advantageous over other forms of therapy (surgery,
chemotherapy or radiation-therapy) due to the fact that it is relatively non-invasive, results in
selective tissue damage and can be used to treat more than one lesion at a time (116). PDT
results in relatively limited damage to healthy tissue (due to both selective localization of the PS
26
and localized irradiation), uses non-ionizing radiation and allows for relatively rapid recovery
(116). In addition, PDT can be used in combination with other therapies (such as anti-
angiogenic drug therapies or chemotherapies) in hopes of achieving synergistic effects.
Although PDT is relatively non-invasive, it can still result in some side effects. These can
include: burns, swelling, pain and scarring of nearby tissues; skin and eye sensitivity to light;
stenosis, and perforation of hollow organs (115). In addition it has also been reported to result in
DNA damage including strand breaks, alkali-labile sites, DNA degradation and DNA-protein
cross links, and possibly causes chromosomal aberrations, such as sister chromatid exchanges
and mutations (65). Other shortcomings of PDT include the limitation of treatment depth due to
the penetration of light. Activation of PS is necessary in order to initiate the cytotoxic activity of
PDT, which limits treatment to lesions which are mainly superficial and can be directly
illuminated or are reachable by an endoscope for illumination, such as skin and hollow organ
cancers. In general, the penetration depth in tissue of the visible or IR light used in PDT ranges
from several mm to a 1 cm (116).
In addition to being limited by the penetration depth of light, PDT can also be limited by the
revascularization of treated areas. PDT results in damage to the vascular endothelium, which
causes increased vascular permeability as well as platelet aggregation, blood flow stasis,
vasoconstriction and eventually vascular occlusion. This vascular damage induces inflammation
and hypoxia, which in turn results in the activation of hypoxia inducible factors (HIF) and the
expression of angiogenic and survival molecules, including VEGF (43). The activation of
angiogenesis results in the revascularization of treated area, which is frequently accompanied
by disease progression and the return of disease symptoms. A major limitation of PDT,
therefore, is that its effects can be transient and re-treatment is frequently necessary.
Mechanism of action
The mechanism of action of PDT is dependent on three requirements: the localization of the PS
in the malignant tissue resulting is selective tissue damage; the activation of the PS by light,
followed by a series of energy transfers leading to the creation of reactive singlet oxygen
molecules, and vascular and cellular damage induced by the singlet oxygen molecules leading
to endothelial cell damage, blood flow stasis, and vascular occlusion. Each of these elements
will be discussed in more depth in the following sections.
27
PS selective uptake and retention
The „selectivity‟ of PDT depends on many factors including the drug, the drug carrier, the
application of light, and the tissue properties (40). The first step to achieving selective tissue
damage is to have selective PS uptake in the target tissue. In the case of AMD and cancer,
increased permeability and leakiness of blood vessels can result in increased PS delivery. In
addition, tumors may have increased expression of low density lipoprotein (LDL) and receptors
such as albumin. This can increase delivery of hydrophobic PSs, which can be bound in a lipid
core of lipoproteins, or hydrophilic PSs which can be transported by albumin. In addition,
advanced cancers tend to have decreased lymphatic drainage and low pH environments, which
can cause a decrease in the solubility of some porphyrins (40).
Following selective uptake of the PS, selective retention is needed in order to localize tissue
damage. Selective retention can be achieved through properties which are specific to the
diseased tissue or through chemical manipulations, such as a PS which is targeted to a certain
receptor selectively expressed on tumor cells or tumor endothelium (40).
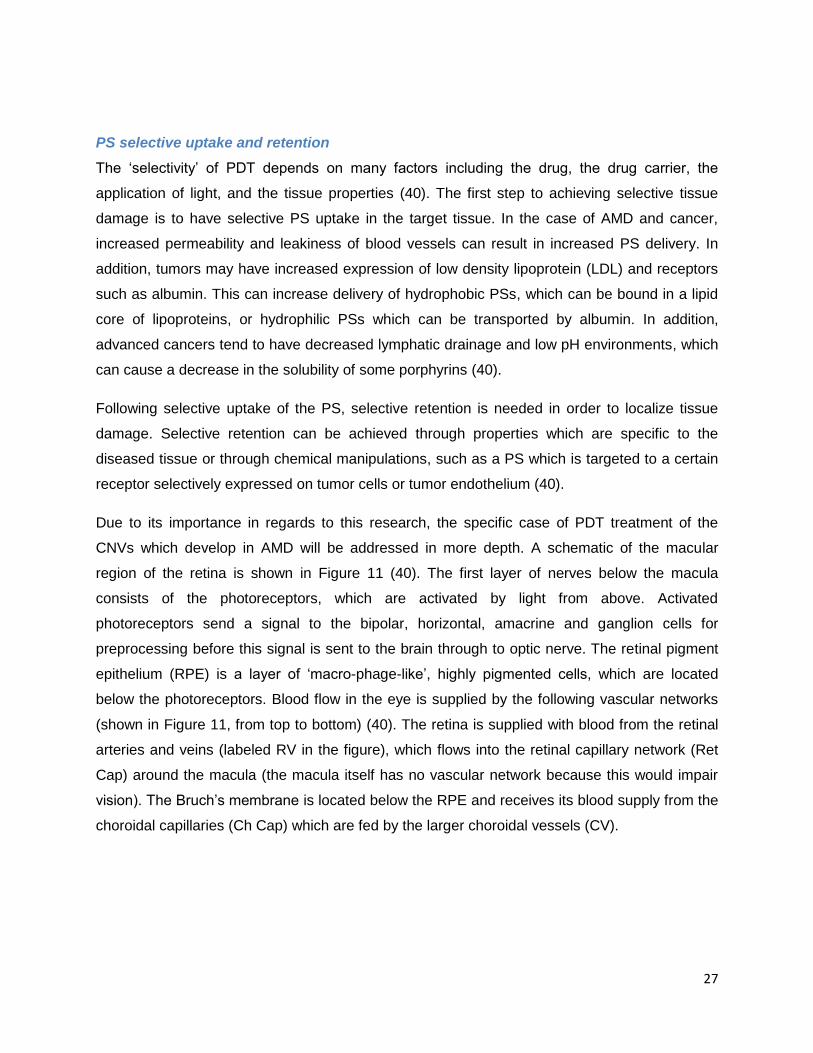
Due to its importance in regards to this research, the specific case of PDT treatment of the
CNVs which develop in AMD will be addressed in more depth. A schematic of the macular
region of the retina is shown in Figure 11 (40). The first layer of nerves below the macula
consists of the photoreceptors, which are activated by light from above. Activated
photoreceptors send a signal to the bipolar, horizontal, amacrine and ganglion cells for
preprocessing before this signal is sent to the brain through to optic nerve. The retinal pigment
epithelium (RPE) is a layer of „macro-phage-like‟, highly pigmented cells, which are located
below the photoreceptors. Blood flow in the eye is supplied by the following vascular networks
(shown in Figure 11, from top to bottom) (40). The retina is supplied with blood from the retinal
arteries and veins (labeled RV in the figure), which flows into the retinal capillary network (Ret
Cap) around the macula (the macula itself has no vascular network because this would impair
vision). The Bruch‟s membrane is located below the RPE and receives its blood supply from the
choroidal capillaries (Ch Cap) which are fed by the larger choroidal vessels (CV).
28
Closure of blood vessels in the retina must be very selective, because closure of the wrong
vessels could result in vision loss. In particular, closure of the retinal capillaries must be avoided
(40). This can partially be avoided due to a lower partial pressure of oxygen in the retinal
circulation compared to the choroidal circulation and oxygen gradients created by
heterogeneous oxygen supply and consumption across the retina (40). Cellular damage is also
mostly localized to the vasculature due to limited leakage of PSs into surrounding tissue when
light is applied relatively quickly following PS injection. Limited PS leakage results in limited
damage to photoreceptors and the RPE. Limiting damage to blood vessels, however, is not
enough, because selective close of the malignant CNVs is desired without closure of the
choriocapillaries or larger choroidal vessels (40). This is partially achieved due to the fact that
the larger choroidal vessels have a significantly higher amount of collagen in the vessel walls,
which may provide some degree of vascular protection (40). Additionally, the malignant vessels
may have higher expression of LDL and albumin receptors, resulting in increased uptake of
PSs. This selectivity, however, is not completely achieved as significant closure of
choriocapillaries is seen even up to one week after PDT-treatment (as can be seen in the non-
fluorescent part of the image shown in Figure 20) (40).
PS excitation and energy transfer
Following the localization of the PS, it must be irradiated by the proper wavelength of light in
order to be activated to its excited state (PS*). In order to become excited, the PSs must absorb
Figure 11 An overview of structure located in the macular region of the retina in eye (40).
29
energy from light in the form of photons. An absorption spectrum describes the probability that
light will be absorption as a function of wavelength for a given molecule or the probability that an
incident photon will induce an energy level change (40). The absorption spectrum for
Visudyne®, the PS used in these experiments and in the treatment of AMD, can be seen in
Figure 17 (118).
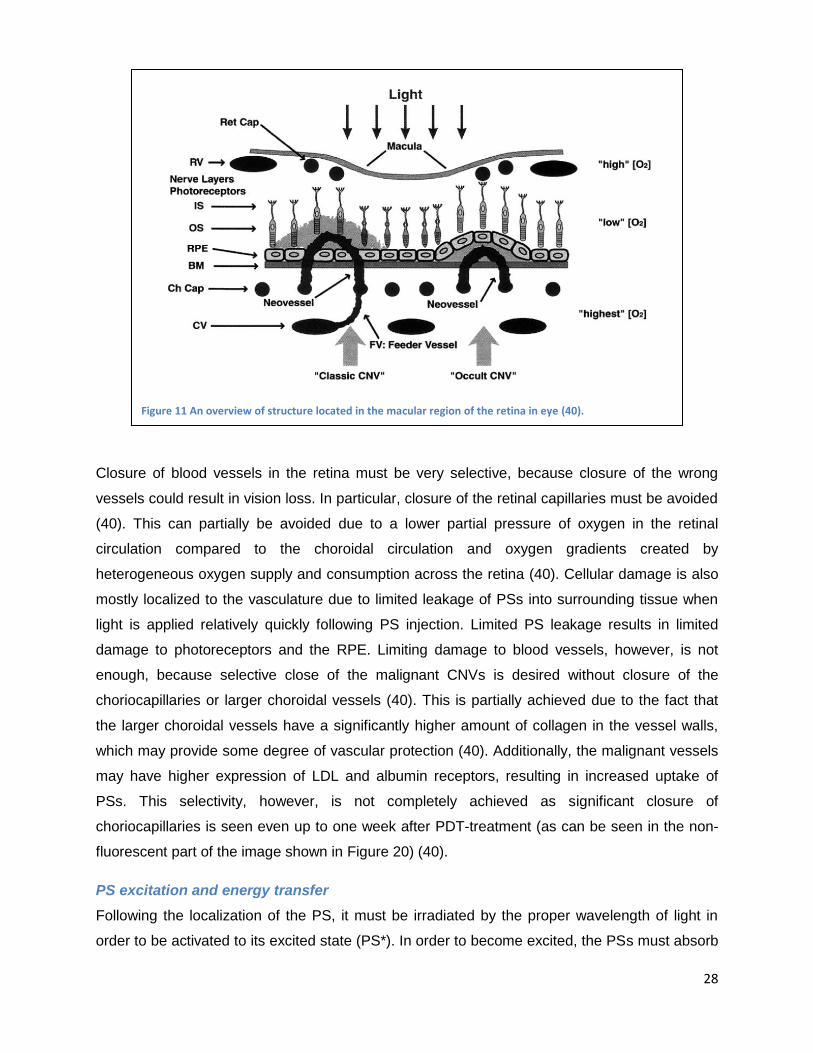
Following excitation due to the absorption of a photon, the PS undergoes a series of energy
transfers, which finally result in the production of a reactive singlet oxygen molecule. These
energy transfers can be described using a Jablonski diagram, which shows the different energy
levels of an electron and describes the possible transitions between them. A typical Jablonski
diagram can be seen in Figure 12 (119). When a photon is absorbed by the PS, it becomes
excited by making an energy transition from the ground singlet state (S0) to a vibrationally
excited level of the singlet excited state (S1). The process of absorption is extremely fast, taking
only 10-15 seconds. The excited PS (PS*) then undergoes internal conversion (IC) (taking ~10-12
seconds), to the „ground‟ S1 state, from which a variety of different energy transfers can take
place. In order for PDT to result in cellular damage, the PS* must then undergo intersystem
crossing (ISC), a non-radiative change between electronic states with different multiplicity (e.g.
a transition from S1 to T1, due to the higher energy of S1, the transfer would be to the higher
Figure 12 A Jablonski diagram showing the different energy levels of an electron and the possible energy transitions between them (119).
30
energy state of T1 and would relax to ground state through IC). After undergoing ISC, the T1
state PS can transfer its energy through a chemical reaction (e.g. S1 chemical reaction by
rearranging itself, connecting to another molecule or disassociating), exchange energy with a
nearby molecule causing it to become excited to the singlet state, or it can relax through internal
conversion to return to the S0 state (40). In the situation of PDT, the triplet state PS will react
chemically with molecules in the environment to generate reactive singlet oxygen.
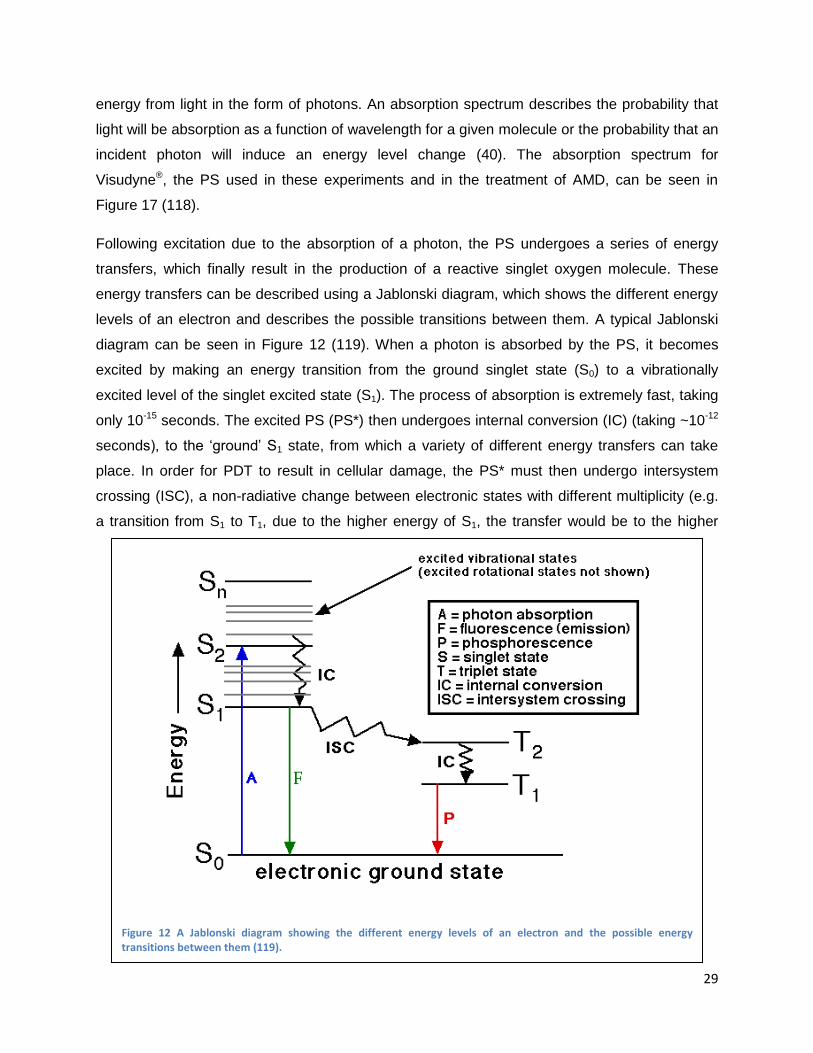
There are three main pathways through which the triple PS can chemically react, as shown in
Figure 13 (40). The first pathway (referred to as type II reactions) is an energy transfer to an
oxygen molecule or to a substrate molecule. An energy transfer to ground state oxygen
generates a singlet molecular oxygen, which can then react with the PS (bleaching it) or oxidize
a nearby biomolecular target. The second pathway is a hydrogen atom exchange between the
PS and a substrate molecule which can react with O2, forming peroxide radicals as intermediary
molecules in the process of oxidizing the substrate molecule. The final pathways is an electron
transfer between the PS and a substrate molecule, generating radical ions which, in
combination with O2, can cause other oxidizing reactive intermediates, such as superoxide
radical anion, H2O2, or hydroxyl radicals which are highly reactive. The second and third
Figure 13 Overview of the photo-oxidative reactions available to the triplet state photosensitizer (3PS) which result in the
generation of a sensitized biological substrate molecule (M) (40).
31
pathways are known as type I reactions. Type II reactions require oxygen in the first step, while
type I reaction require oxygen farther down in the chain of energy transfers. The photosensitizer
Visudyne® primarily interacts through type two reaction. The singlet oxygen which is generated
can react with proteins, lipids and nucleic acids to create free radicals leading to auto-oxidation
and breakdown of these molecules (120). Vascular damage is highly localized due to the fact
that singlet oxygen is highly reactive, and will either react very quickly or be quenched, so that
distant reactions are only a fraction of nanometers away from the PS (40).
Cellular effects
Following the activation of the PSs and the generation of reactive singlet oxygen molecules,
these molecules can cause tissue damage through cellular, vascular and immunological effects
(40). Tissue damage depends on the tissue, the sensitizer and the conditions of PDT applied
(i.e. time between drug and light application, the drug delivery system which affects the
localization of the PSs during therapy, and factors such as the quantity of drug or light applied).
PSs mainly target endothelial cells through either the mitochondria (for BPD-MA based PSs
including Visudyne®) or through the lysosome and plasma membrane causing cell death
through necrosis or apoptosis (40). Water soluble PSs, which localize in the lysosomes,
normally cause cell death through necrosis and apoptosis due to the release of cathepsins and
caspase 3. Mitochondrially-localized PS‟s, however, mainly cause cell death through apoptosis.
It is generally more desirable to induce vascular damage through apoptosis than through
necrosis, because it requires lower drug and light doses and may be easier to manipulate than
necrotic cell death, allowing for more selective tissue damage (40).
PDT causes peroxidation in organelles where the PS has accumulated, which can result in
organelle membrane disruption, changes in membrane potential or damage to membrane
proteins (40). Cells partially damaged by PDT will activate rescue responses including the
release of heat shock proteins, glucose-regulated proteins and heme oxygenase (40; 121). PDT
can also affect cell surface receptors inducing the release of cytokines, which may have
additional effects on the immune response (40).
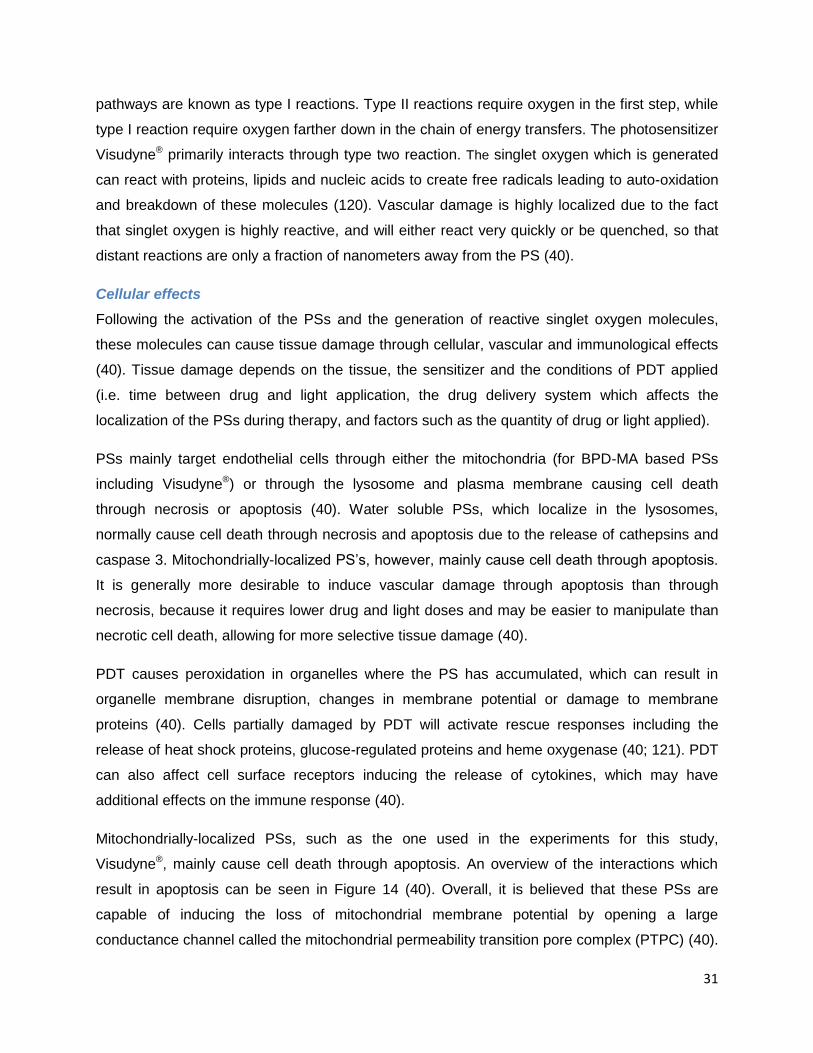
Mitochondrially-localized PSs, such as the one used in the experiments for this study,
Visudyne®, mainly cause cell death through apoptosis. An overview of the interactions which
result in apoptosis can be seen in Figure 14 (40). Overall, it is believed that these PSs are
capable of inducing the loss of mitochondrial membrane potential by opening a large
conductance channel called the mitochondrial permeability transition pore complex (PTPC) (40).
32
This may result in the release of cytochrome-c into the cytosol, where it can react with
apoptosis-activating factor-1 (APAF-1) and ATP to form a multi-protein complex called an
apoptosome (122). This complex activates caspase 9, which activates caspase 3, which in turn
activates caspase 6. Caspase 3 cleaves proteins involved in repairing damaged DNA (poly-
ADP-ribose polymerase and DNA-PK) as well as activating a molecule (CAD) known to cause
DNA damage. Caspase 6 cleaves the lamins of the cell‟s nucleus causing nuclear breakdown
and interacts with other molecules know to be involved in apoptosis such as SHREBs, Gelsolin,
caspase 7, caspase 9, MDM2, GAS2, Fodrin, FAK and more (40).
Another mechanism of apoptosis is through the activation of the cell surface “death receptors”
such as TRAIL (TNF-related apoptosis-inducing ligand), FAS and TNFR1 (tumor necrosis factor
receptor 1) (40). In this pathway, also shown in Figure 14, activation of these receptors will
result in adopter proteins such as FADD (FAS associated death domain) to bind to other
proteins in the cytosol. The complex they create induces the release of caspase 8, which
causes the release of caspase 3, and cleaves Bid to create truncated Bid (t-Bid), which moves
to the mitochondrial membrane to help release cytochrome-c. Cytochrome-c is also involved in
apoptosis through indirect interactions with the caspases mentioned above (40; 122; 123; 124).
Figure 14 An overview of the cellular pathways which result in cell death through apoptosis, the mechanism of cell death mainly achieved by mitochondrially-localized photosensitizers such as Visudyne® (40).
33
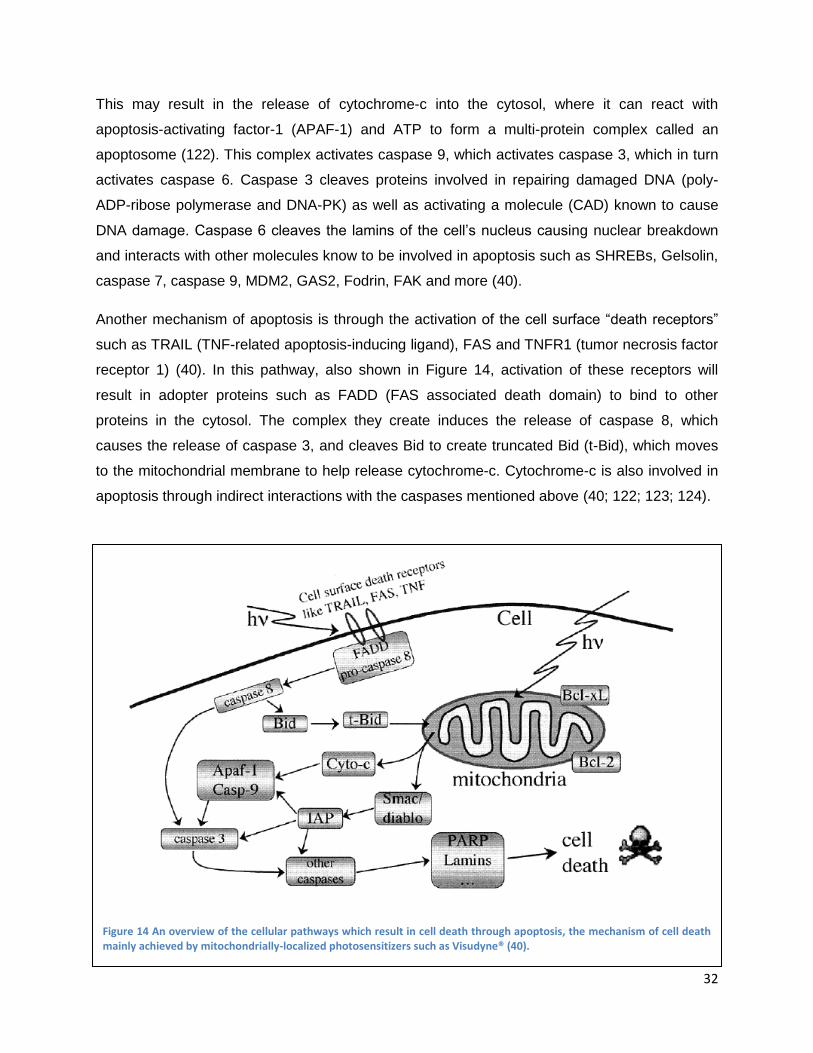
PDT-induced vascular effects
In certain indication, including the treatment of AMD, the main aim of PDT-treatment is to induce
vascular damage. In the context of this study, it is therefore also important to examine the
vascular effects of PDT. Predominantly vascular effects of PDT can be achieved by specifically
selecting the conditions and PS used to perform PDT. The first visible vascular effect of PDT is
vasoconstriction, which can be seen immediately following the application of light and up to
several hours follow treatment (40). Early damage following PS injection and illumination has
mostly been observed in the endothelial and sub-endothelial cells. Early changes to endothelial
cells can be seen in the luminal surface, cytoplasmic microtubules, cytoskeletal proteins, and
mitochondria. These changes cause the endothelial cells to retract, losing their tight junctions
with neighbor cells and exposing the basement membrane. An overview of the vascular effects
of PDT can be seen in Figure 15 (40). This figure shows the healthy vessel wall (a), the
endothelial cells which have retracted following PDT damage (b), and the activation of platelets
and polymorphonuclear leukocytes due to exposure of the basement membrane, which
increase the release of eicosanoids, resulting in platelet aggregation on the basement
membrane of the vessel (c) (40).
PDT causes polymorphonuclear leukocytes to attach to vessel walls, which results in a change
in the release of biochemicals, such as eicosanoids thromboxane and leukotriene B4 and C4
(40). These factors disturb the balance between aggregation/disaggregation of platelets and
vasodilation/vasoconstriction processes in blood vessels. These imbalances are counteracted
Figure 15 Overview of the mechanism by which PDT induces vascular damage resulting in blood flow stasis (40).
34
by increased smooth muscle activity resulting in vasoconstriction. Platelet aggregation,
combined with vasoconstriction, results in the formation of a plug, which is then stabilized by
fibrin (Figure 15C). The retraction of endothelial cells and biochemical changes initially causes
an increase in vessel permeability and leakage, before finally leading to blood flow stasis and
vascular occlusion (40).
Another mechanism leading to vascular occlusion is through PDT damage to membrane lipids.
This causes the release of arachidonic acid, which initiates a biochemical cascade ending in the
release of thromboxane, a vasoconstrictor. This, in addition to increased interstitial pressure due
to increase vascular leakage, also contributes to blood flow stasis and vascular occlusion (40).
Visudyne®
Visudyne® (Verteporfin for injection; Benzoporphyrin Derivative Monoacid Ring A (BPD-MA);
Novartis AG), is the photosensitive molecule clinically used in the treatment of AMD and other
eye disorders including pathological myopia, and presumed ocular histoplasmosis (69).
Visudyne® is composed of a semisynthetic mixture of two porphyrin regioisomers shown in
Figure 16 (120; 65).
The quantum yield for the production of singlet oxygen by Visudyne® is 0.76 in methanol (125)
(meaning that approximately 8 out of 10 photons absorbed by Visudyne® result in the production
of a singlet oxygen molecule). Approximated 500,000 singlet oxygen molecules can be
produced by a Visudyne® molecule in one second (120). Desirable qualities for a PS include a
Figure 16 The chemical structure of the two isomers which make up Visudyne® (65).
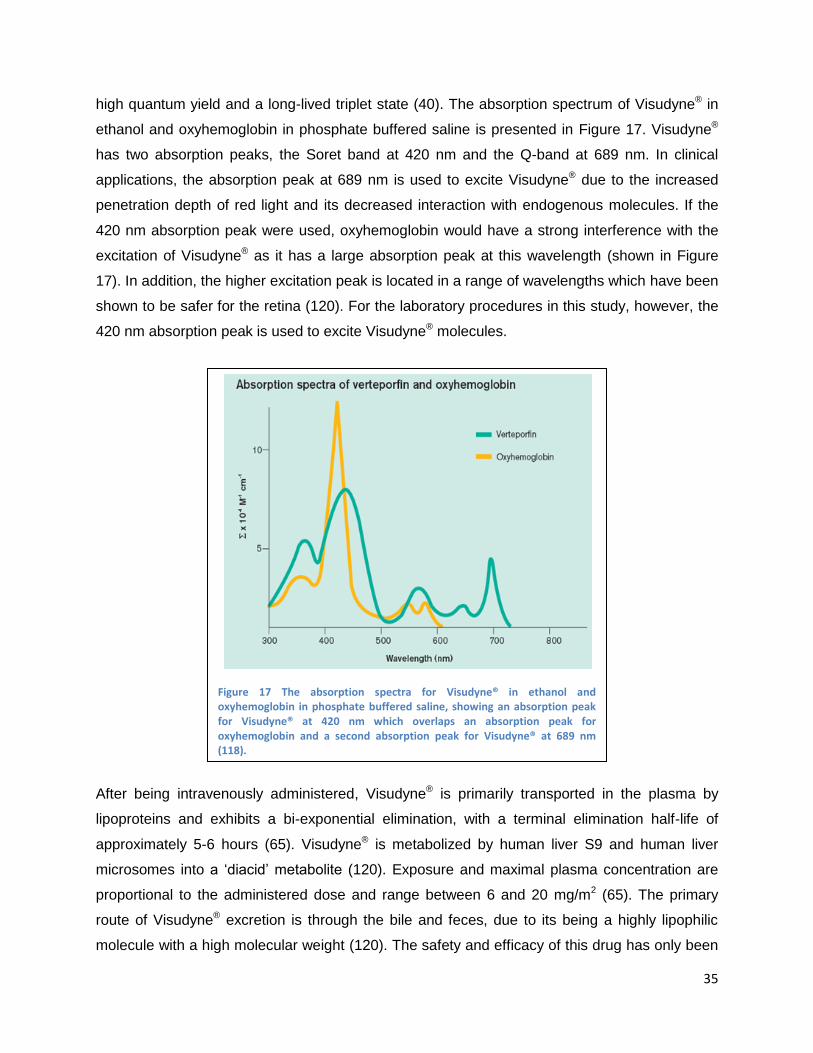
35
high quantum yield and a long-lived triplet state (40). The absorption spectrum of Visudyne® in
ethanol and oxyhemoglobin in phosphate buffered saline is presented in Figure 17. Visudyne®
has two absorption peaks, the Soret band at 420 nm and the Q-band at 689 nm. In clinical
applications, the absorption peak at 689 nm is used to excite Visudyne® due to the increased
penetration depth of red light and its decreased interaction with endogenous molecules. If the
420 nm absorption peak were used, oxyhemoglobin would have a strong interference with the
excitation of Visudyne® as it has a large absorption peak at this wavelength (shown in Figure
17). In addition, the higher excitation peak is located in a range of wavelengths which have been
shown to be safer for the retina (120). For the laboratory procedures in this study, however, the
420 nm absorption peak is used to excite Visudyne® molecules.
After being intravenously administered, Visudyne® is primarily transported in the plasma by
lipoproteins and exhibits a bi-exponential elimination, with a terminal elimination half-life of
approximately 5-6 hours (65). Visudyne® is metabolized by human liver S9 and human liver
microsomes into a „diacid‟ metabolite (120). Exposure and maximal plasma concentration are
proportional to the administered dose and range between 6 and 20 mg/m2 (65). The primary
route of Visudyne® excretion is through the bile and feces, due to its being a highly lipophilic
molecule with a high molecular weight (120). The safety and efficacy of this drug has only been
Figure 17 The absorption spectra for Visudyne® in ethanol and oxyhemoglobin in phosphate buffered saline, showing an absorption peak for Visudyne® at 420 nm which overlaps an absorption peak for oxyhemoglobin and a second absorption peak for Visudyne® at 689 nm (118).
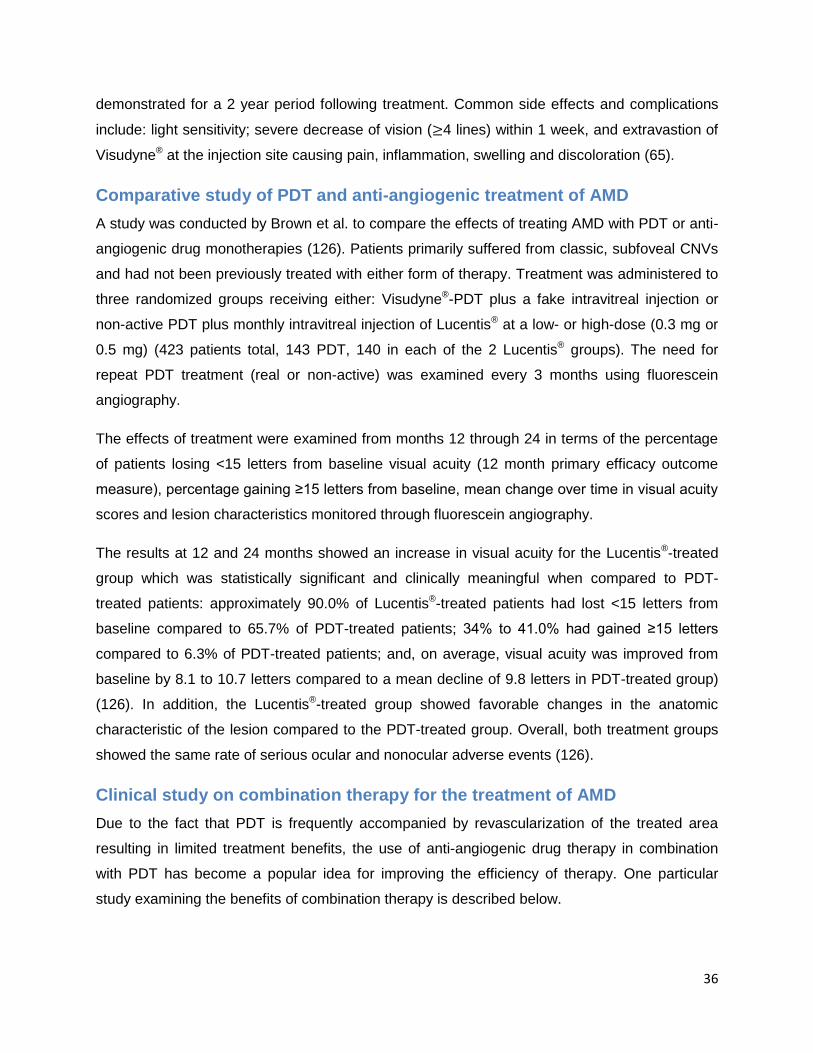
36
demonstrated for a 2 year period following treatment. Common side effects and complications
include: light sensitivity; severe decrease of vision ( 4 lines) within 1 week, and extravastion of
Visudyne® at the injection site causing pain, inflammation, swelling and discoloration (65).
Comparative study of PDT and anti-angiogenic treatment of AMD
A study was conducted by Brown et al. to compare the effects of treating AMD with PDT or anti-
angiogenic drug monotherapies (126). Patients primarily suffered from classic, subfoveal CNVs
and had not been previously treated with either form of therapy. Treatment was administered to
three randomized groups receiving either: Visudyne®-PDT plus a fake intravitreal injection or
non-active PDT plus monthly intravitreal injection of Lucentis® at a low- or high-dose (0.3 mg or
0.5 mg) (423 patients total, 143 PDT, 140 in each of the 2 Lucentis® groups). The need for
repeat PDT treatment (real or non-active) was examined every 3 months using fluorescein
angiography.
The effects of treatment were examined from months 12 through 24 in terms of the percentage
of patients losing <15 letters from baseline visual acuity (12 month primary efficacy outcome
measure), percentage gaining ≥15 letters from baseline, mean change over time in visual acuity
scores and lesion characteristics monitored through fluorescein angiography.
The results at 12 and 24 months showed an increase in visual acuity for the Lucentis®-treated
group which was statistically significant and clinically meaningful when compared to PDT-
treated patients: approximately 90.0% of Lucentis®-treated patients had lost <15 letters from
baseline compared to 65.7% of PDT-treated patients; 34% to 41.0% had gained ≥15 letters
compared to 6.3% of PDT-treated patients; and, on average, visual acuity was improved from
baseline by 8.1 to 10.7 letters compared to a mean decline of 9.8 letters in PDT-treated group)
(126). In addition, the Lucentis®-treated group showed favorable changes in the anatomic
characteristic of the lesion compared to the PDT-treated group. Overall, both treatment groups
showed the same rate of serious ocular and nonocular adverse events (126).
Clinical study on combination therapy for the treatment of AMD
Due to the fact that PDT is frequently accompanied by revascularization of the treated area
resulting in limited treatment benefits, the use of anti-angiogenic drug therapy in combination
with PDT has become a popular idea for improving the efficiency of therapy. One particular
study examining the benefits of combination therapy is described below.
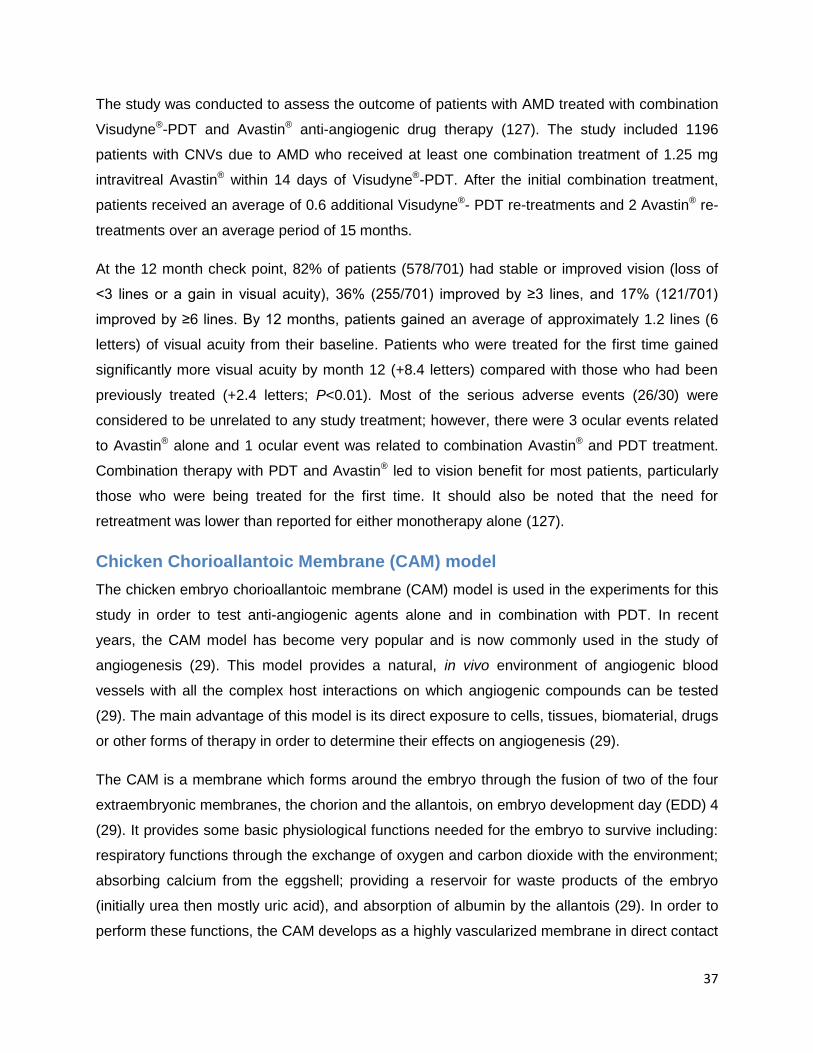
37
The study was conducted to assess the outcome of patients with AMD treated with combination
Visudyne®-PDT and Avastin® anti-angiogenic drug therapy (127). The study included 1196
patients with CNVs due to AMD who received at least one combination treatment of 1.25 mg
intravitreal Avastin® within 14 days of Visudyne®-PDT. After the initial combination treatment,
patients received an average of 0.6 additional Visudyne®- PDT re-treatments and 2 Avastin® re-
treatments over an average period of 15 months.
At the 12 month check point, 82% of patients (578/701) had stable or improved vision (loss of
<3 lines or a gain in visual acuity), 36% (255/701) improved by ≥3 lines, and 17% (121/701)
improved by ≥6 lines. By 12 months, patients gained an average of approximately 1.2 lines (6
letters) of visual acuity from their baseline. Patients who were treated for the first time gained
significantly more visual acuity by month 12 (+8.4 letters) compared with those who had been
previously treated (+2.4 letters; P<0.01). Most of the serious adverse events (26/30) were
considered to be unrelated to any study treatment; however, there were 3 ocular events related
to Avastin® alone and 1 ocular event was related to combination Avastin® and PDT treatment.
Combination therapy with PDT and Avastin® led to vision benefit for most patients, particularly
those who were being treated for the first time. It should also be noted that the need for
retreatment was lower than reported for either monotherapy alone (127).
Chicken Chorioallantoic Membrane (CAM) model
The chicken embryo chorioallantoic membrane (CAM) model is used in the experiments for this
study in order to test anti-angiogenic agents alone and in combination with PDT. In recent
years, the CAM model has become very popular and is now commonly used in the study of
angiogenesis (29). This model provides a natural, in vivo environment of angiogenic blood
vessels with all the complex host interactions on which angiogenic compounds can be tested
(29). The main advantage of this model is its direct exposure to cells, tissues, biomaterial, drugs
or other forms of therapy in order to determine their effects on angiogenesis (29).
The CAM is a membrane which forms around the embryo through the fusion of two of the four
extraembryonic membranes, the chorion and the allantois, on embryo development day (EDD) 4
(29). It provides some basic physiological functions needed for the embryo to survive including:
respiratory functions through the exchange of oxygen and carbon dioxide with the environment;
absorbing calcium from the eggshell; providing a reservoir for waste products of the embryo
(initially urea then mostly uric acid), and absorption of albumin by the allantois (29). In order to
perform these functions, the CAM develops as a highly vascularized membrane in direct contact
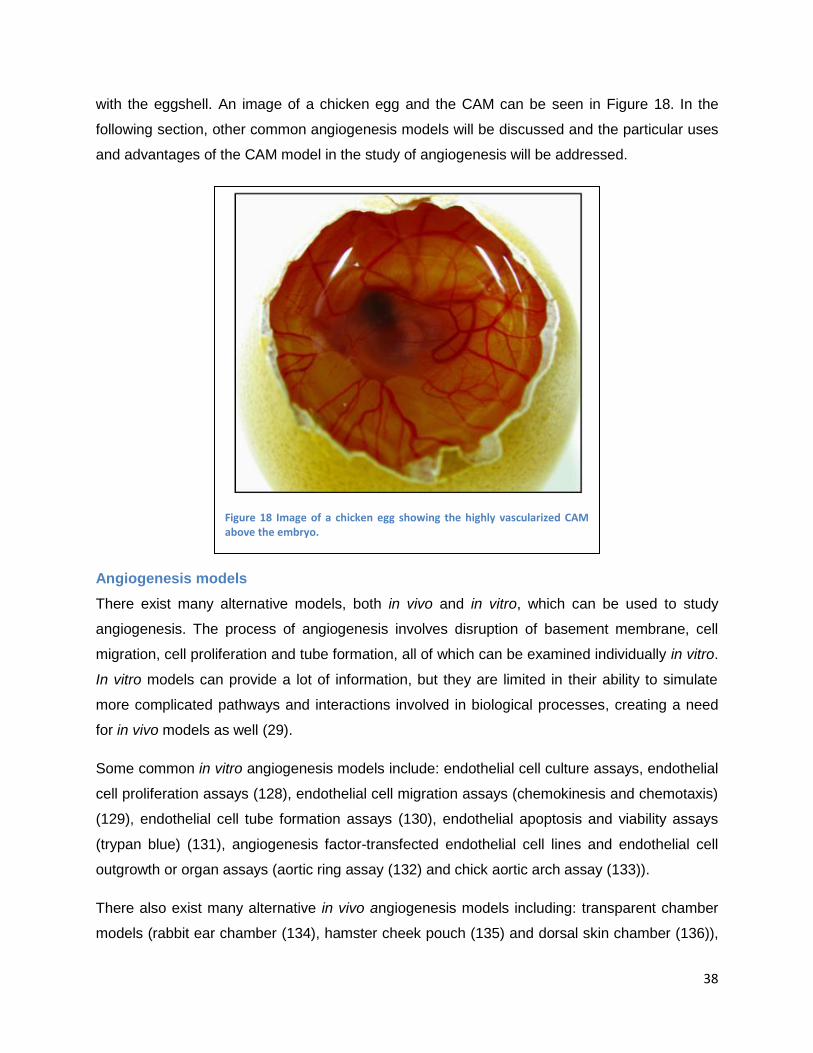
38
with the eggshell. An image of a chicken egg and the CAM can be seen in Figure 18. In the
following section, other common angiogenesis models will be discussed and the particular uses
and advantages of the CAM model in the study of angiogenesis will be addressed.
Angiogenesis models
There exist many alternative models, both in vivo and in vitro, which can be used to study
angiogenesis. The process of angiogenesis involves disruption of basement membrane, cell
migration, cell proliferation and tube formation, all of which can be examined individually in vitro.
In vitro models can provide a lot of information, but they are limited in their ability to simulate
more complicated pathways and interactions involved in biological processes, creating a need
for in vivo models as well (29).
Some common in vitro angiogenesis models include: endothelial cell culture assays, endothelial
cell proliferation assays (128), endothelial cell migration assays (chemokinesis and chemotaxis)
(129), endothelial cell tube formation assays (130), endothelial apoptosis and viability assays
(trypan blue) (131), angiogenesis factor-transfected endothelial cell lines and endothelial cell
outgrowth or organ assays (aortic ring assay (132) and chick aortic arch assay (133)).
There also exist many alternative in vivo angiogenesis models including: transparent chamber
models (rabbit ear chamber (134), hamster cheek pouch (135) and dorsal skin chamber (136)),
Figure 18 Image of a chicken egg showing the highly vascularized CAM above the embryo.
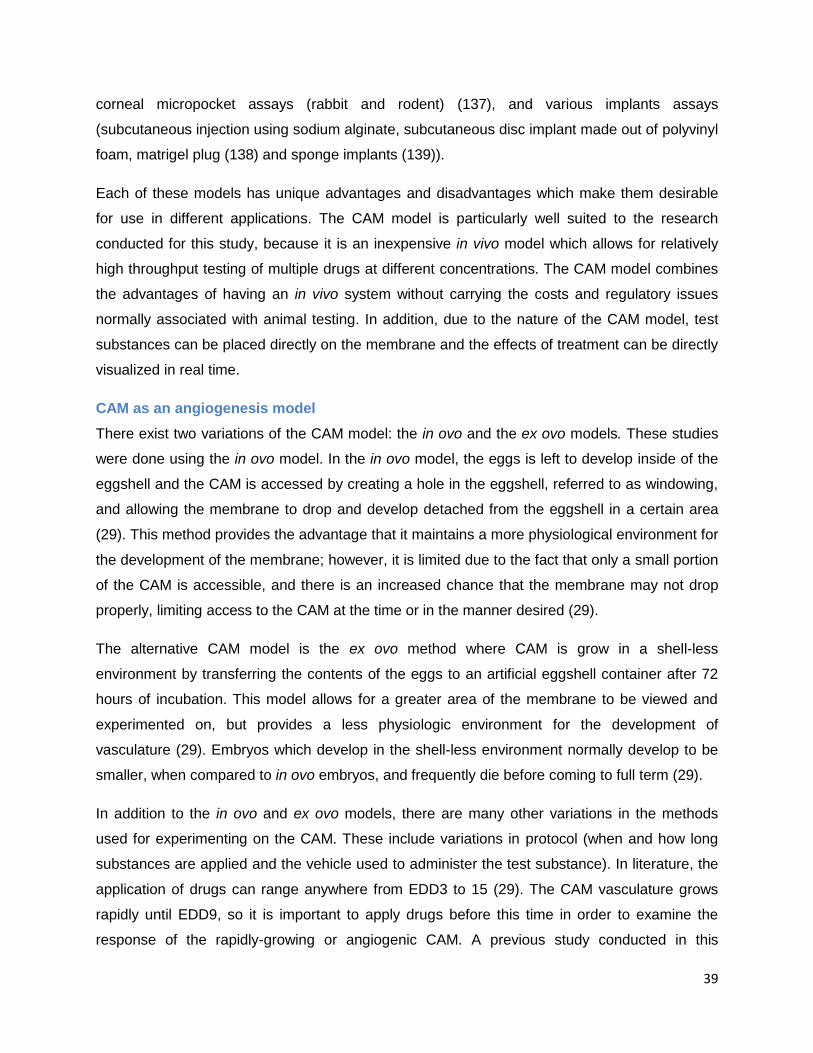
39
corneal micropocket assays (rabbit and rodent) (137), and various implants assays
(subcutaneous injection using sodium alginate, subcutaneous disc implant made out of polyvinyl
foam, matrigel plug (138) and sponge implants (139)).
Each of these models has unique advantages and disadvantages which make them desirable
for use in different applications. The CAM model is particularly well suited to the research
conducted for this study, because it is an inexpensive in vivo model which allows for relatively
high throughput testing of multiple drugs at different concentrations. The CAM model combines
the advantages of having an in vivo system without carrying the costs and regulatory issues
normally associated with animal testing. In addition, due to the nature of the CAM model, test
substances can be placed directly on the membrane and the effects of treatment can be directly
visualized in real time.
CAM as an angiogenesis model
There exist two variations of the CAM model: the in ovo and the ex ovo models. These studies
were done using the in ovo model. In the in ovo model, the eggs is left to develop inside of the
eggshell and the CAM is accessed by creating a hole in the eggshell, referred to as windowing,
and allowing the membrane to drop and develop detached from the eggshell in a certain area
(29). This method provides the advantage that it maintains a more physiological environment for
the development of the membrane; however, it is limited due to the fact that only a small portion
of the CAM is accessible, and there is an increased chance that the membrane may not drop
properly, limiting access to the CAM at the time or in the manner desired (29).
The alternative CAM model is the ex ovo method where CAM is grow in a shell-less
environment by transferring the contents of the eggs to an artificial eggshell container after 72
hours of incubation. This model allows for a greater area of the membrane to be viewed and
experimented on, but provides a less physiologic environment for the development of
vasculature (29). Embryos which develop in the shell-less environment normally develop to be
smaller, when compared to in ovo embryos, and frequently die before coming to full term (29).
In addition to the in ovo and ex ovo models, there are many other variations in the methods
used for experimenting on the CAM. These include variations in protocol (when and how long
substances are applied and the vehicle used to administer the test substance). In literature, the
application of drugs can range anywhere from EDD3 to 15 (29). The CAM vasculature grows
rapidly until EDD9, so it is important to apply drugs before this time in order to examine the
response of the rapidly-growing or angiogenic CAM. A previous study conducted in this
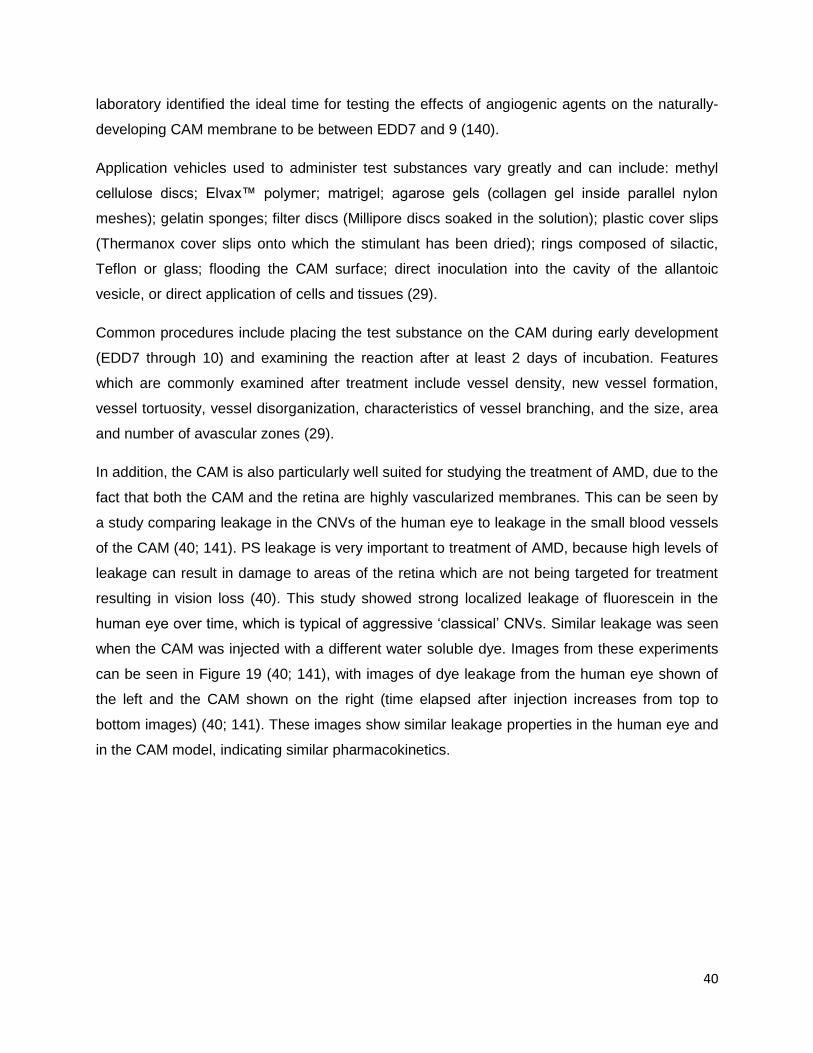
40
laboratory identified the ideal time for testing the effects of angiogenic agents on the naturally-
developing CAM membrane to be between EDD7 and 9 (140).
Application vehicles used to administer test substances vary greatly and can include: methyl
cellulose discs; Elvax™ polymer; matrigel; agarose gels (collagen gel inside parallel nylon
meshes); gelatin sponges; filter discs (Millipore discs soaked in the solution); plastic cover slips
(Thermanox cover slips onto which the stimulant has been dried); rings composed of silactic,
Teflon or glass; flooding the CAM surface; direct inoculation into the cavity of the allantoic
vesicle, or direct application of cells and tissues (29).
Common procedures include placing the test substance on the CAM during early development
(EDD7 through 10) and examining the reaction after at least 2 days of incubation. Features
which are commonly examined after treatment include vessel density, new vessel formation,
vessel tortuosity, vessel disorganization, characteristics of vessel branching, and the size, area
and number of avascular zones (29).
In addition, the CAM is also particularly well suited for studying the treatment of AMD, due to the
fact that both the CAM and the retina are highly vascularized membranes. This can be seen by
a study comparing leakage in the CNVs of the human eye to leakage in the small blood vessels
of the CAM (40; 141). PS leakage is very important to treatment of AMD, because high levels of
leakage can result in damage to areas of the retina which are not being targeted for treatment
resulting in vision loss (40). This study showed strong localized leakage of fluorescein in the
human eye over time, which is typical of aggressive „classical‟ CNVs. Similar leakage was seen
when the CAM was injected with a different water soluble dye. Images from these experiments
can be seen in Figure 19 (40; 141), with images of dye leakage from the human eye shown of
the left and the CAM shown on the right (time elapsed after injection increases from top to
bottom images) (40; 141). These images show similar leakage properties in the human eye and
in the CAM model, indicating similar pharmacokinetics.
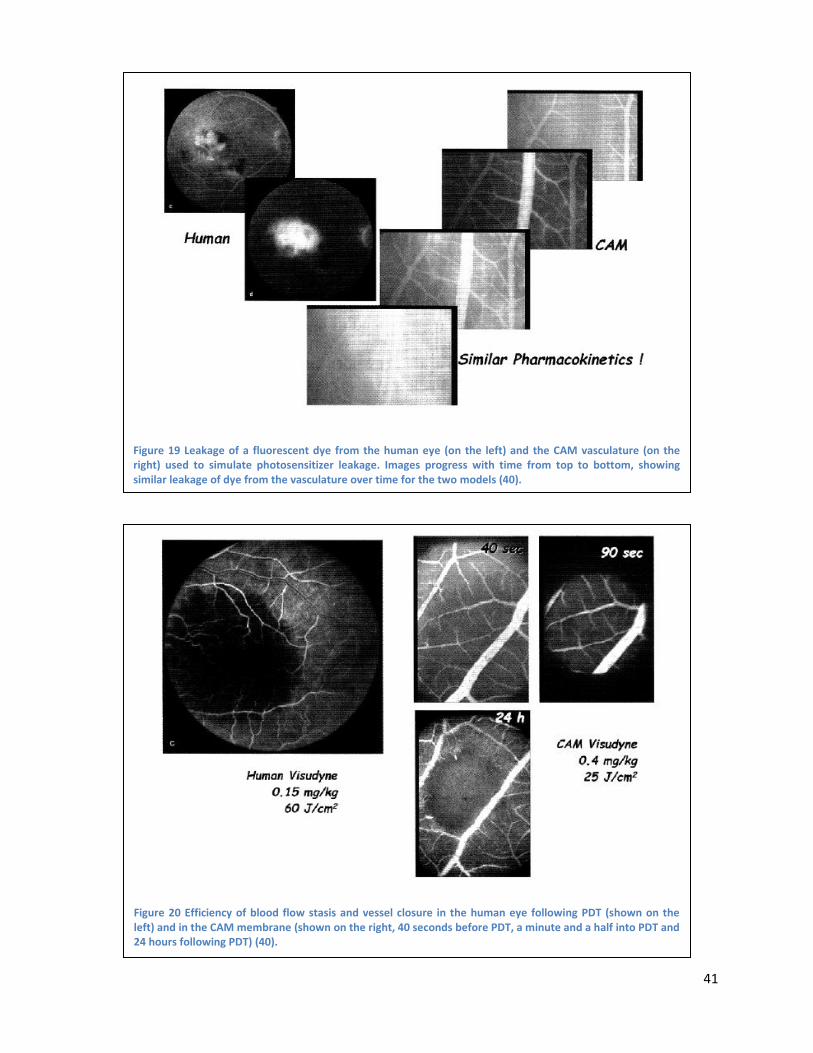
41
Figure 19 Leakage of a fluorescent dye from the human eye (on the left) and the CAM vasculature (on the right) used to simulate photosensitizer leakage. Images progress with time from top to bottom, showing similar leakage of dye from the vasculature over time for the two models (40).
Figure 20 Efficiency of blood flow stasis and vessel closure in the human eye following PDT (shown on the left) and in the CAM membrane (shown on the right, 40 seconds before PDT, a minute and a half into PDT and 24 hours following PDT) (40).
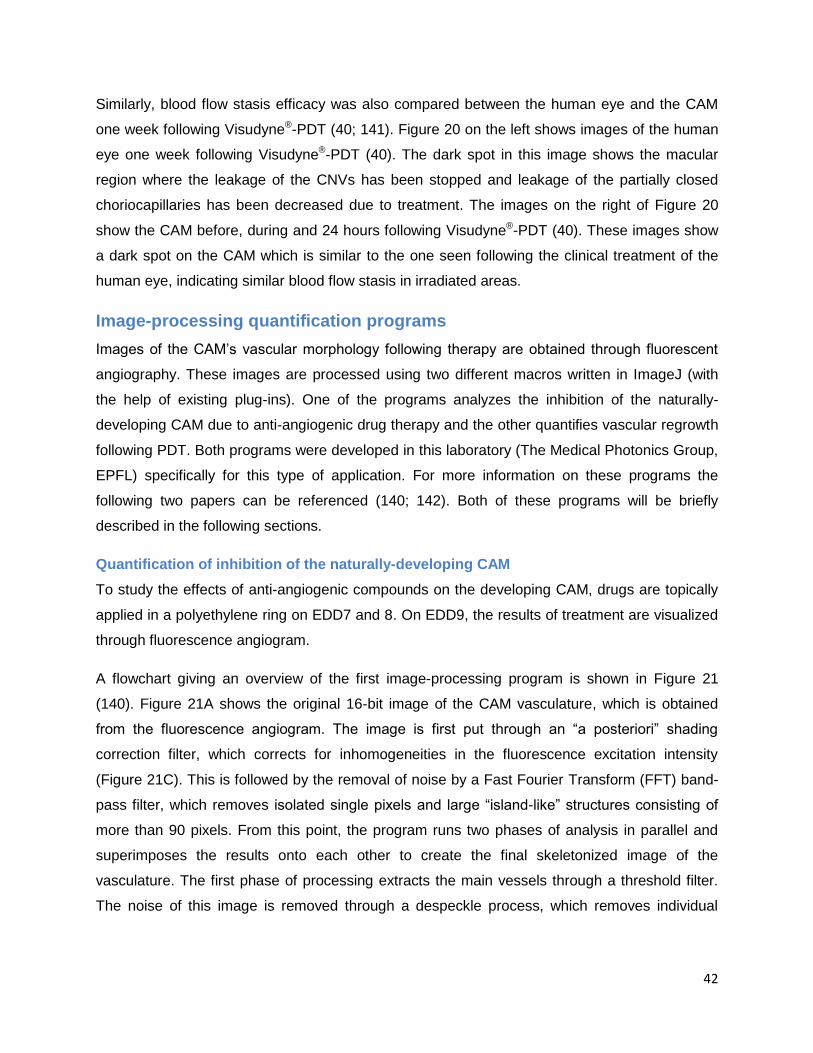
42
Similarly, blood flow stasis efficacy was also compared between the human eye and the CAM
one week following Visudyne®-PDT (40; 141). Figure 20 on the left shows images of the human
eye one week following Visudyne®-PDT (40). The dark spot in this image shows the macular
region where the leakage of the CNVs has been stopped and leakage of the partially closed
choriocapillaries has been decreased due to treatment. The images on the right of Figure 20
show the CAM before, during and 24 hours following Visudyne®-PDT (40). These images show
a dark spot on the CAM which is similar to the one seen following the clinical treatment of the
human eye, indicating similar blood flow stasis in irradiated areas.
Image-processing quantification programs
Images of the CAM‟s vascular morphology following therapy are obtained through fluorescent
angiography. These images are processed using two different macros written in ImageJ (with
the help of existing plug-ins). One of the programs analyzes the inhibition of the naturally-
developing CAM due to anti-angiogenic drug therapy and the other quantifies vascular regrowth
following PDT. Both programs were developed in this laboratory (The Medical Photonics Group,
EPFL) specifically for this type of application. For more information on these programs the
following two papers can be referenced (140; 142). Both of these programs will be briefly
described in the following sections.
Quantification of inhibition of the naturally-developing CAM
To study the effects of anti-angiogenic compounds on the developing CAM, drugs are topically
applied in a polyethylene ring on EDD7 and 8. On EDD9, the results of treatment are visualized
through fluorescence angiogram.
A flowchart giving an overview of the first image-processing program is shown in Figure 21
(140). Figure 21A shows the original 16-bit image of the CAM vasculature, which is obtained
from the fluorescence angiogram. The image is first put through an “a posteriori” shading
correction filter, which corrects for inhomogeneities in the fluorescence excitation intensity
(Figure 21C). This is followed by the removal of noise by a Fast Fourier Transform (FFT) band-
pass filter, which removes isolated single pixels and large “island-like” structures consisting of
more than 90 pixels. From this point, the program runs two phases of analysis in parallel and
superimposes the results onto each other to create the final skeletonized image of the
vasculature. The first phase of processing extracts the main vessels through a threshold filter.
The noise of this image is removed through a despeckle process, which removes individual
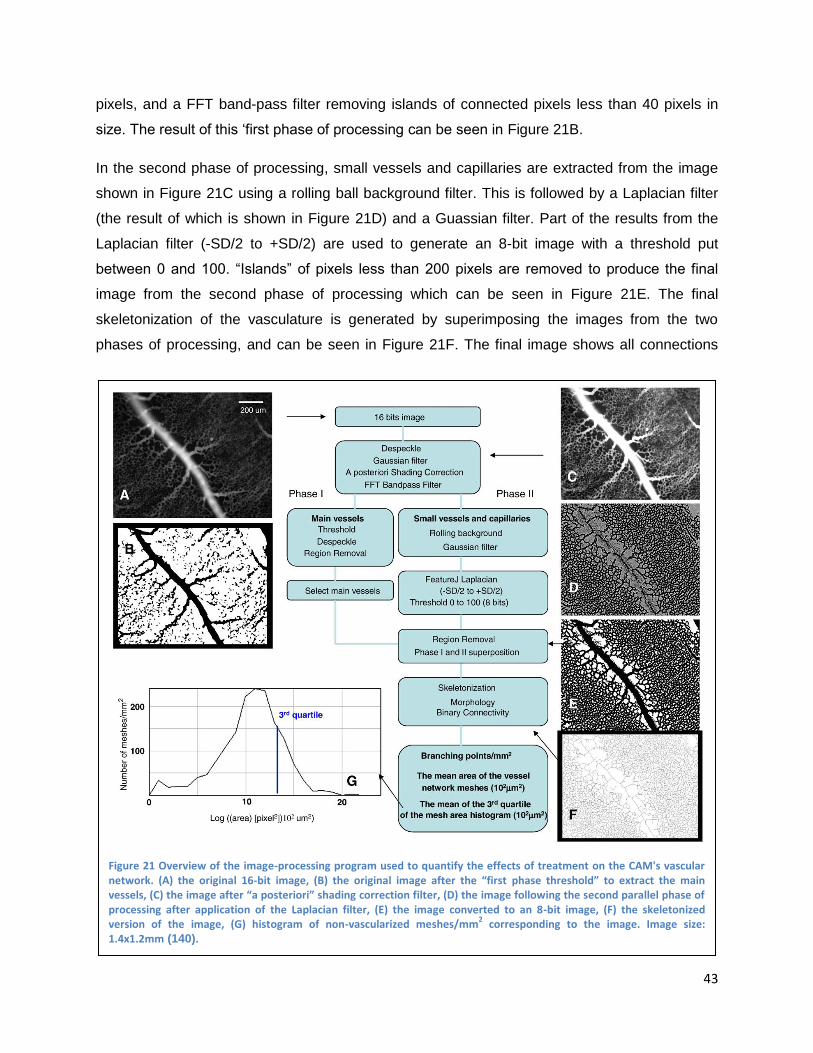
43
pixels, and a FFT band-pass filter removing islands of connected pixels less than 40 pixels in
size. The result of this „first phase of processing can be seen in Figure 21B.
In the second phase of processing, small vessels and capillaries are extracted from the image
shown in Figure 21C using a rolling ball background filter. This is followed by a Laplacian filter
(the result of which is shown in Figure 21D) and a Guassian filter. Part of the results from the
Laplacian filter (-SD/2 to +SD/2) are used to generate an 8-bit image with a threshold put
between 0 and 100. “Islands” of pixels less than 200 pixels are removed to produce the final
image from the second phase of processing which can be seen in Figure 21E. The final
skeletonization of the vasculature is generated by superimposing the images from the two
phases of processing, and can be seen in Figure 21F. The final image shows all connections
Figure 21 Overview of the image-processing program used to quantify the effects of treatment on the CAM's vascular network. (A) the original 16-bit image, (B) the original image after the “first phase threshold” to extract the main vessels, (C) the image after “a posteriori” shading correction filter, (D) the image following the second parallel phase of processing after application of the Laplacian filter, (E) the image converted to an 8-bit image, (F) the skeletonized version of the image, (G) histogram of non-vascularized meshes/mm
2 corresponding to the image. Image size:
1.4x1.2mm (140).
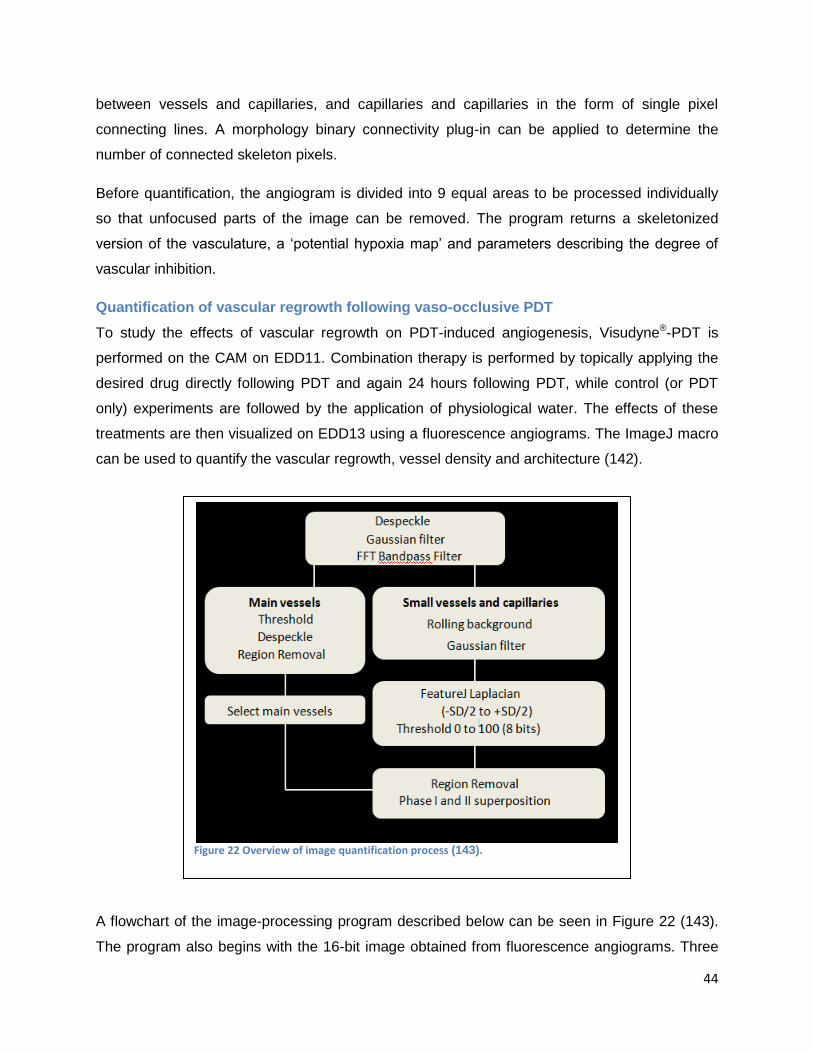
44
between vessels and capillaries, and capillaries and capillaries in the form of single pixel
connecting lines. A morphology binary connectivity plug-in can be applied to determine the
number of connected skeleton pixels.
Before quantification, the angiogram is divided into 9 equal areas to be processed individually
so that unfocused parts of the image can be removed. The program returns a skeletonized
version of the vasculature, a „potential hypoxia map‟ and parameters describing the degree of
vascular inhibition.
Quantification of vascular regrowth following vaso-occlusive PDT
To study the effects of vascular regrowth on PDT-induced angiogenesis, Visudyne®-PDT is
performed on the CAM on EDD11. Combination therapy is performed by topically applying the
desired drug directly following PDT and again 24 hours following PDT, while control (or PDT
only) experiments are followed by the application of physiological water. The effects of these
treatments are then visualized on EDD13 using a fluorescence angiograms. The ImageJ macro
can be used to quantify the vascular regrowth, vessel density and architecture (142).
A flowchart of the image-processing program described below can be seen in Figure 22 (143).
The program also begins with the 16-bit image obtained from fluorescence angiograms. Three
Figure 22 Overview of image quantification process (143).
45
points, manually inputted by the user, are used to determine the boarder of the treated area
marking a circular region of interest. The macro then automatically generates 3 concentric
circles, with identical widths, inside the original circle. The outermost circle is referred to as area
4 and is the first zone to be revascularized, while the innermost circles is referred to as area 1
and is the last to be revascularized.
Once the program has marked the different areas of regrowth, noise is removed from the image
using a despeckle process followed by a Gaussian filter. This is followed by a FFT band-pass
filter, which removes all single pixels and large “island-like” structures more than 90 pixels in
size. From this point two parallel phases of processing are run in parallel, the results of which
are superimposed on each other to generate the final skeletonized image of the vasculature.
The first phase of processing is used to isolate the main blood vessels. This is achieved through
the application of a grey threshold value, which is empirically set at the mean grey value of the
histogram + ½ SD. Isolated pixels are then removed using a despeckle process followed by the
removal of small “islands of connected pixels” containing less than 40 pixels per “island”.
The second phase of processing is used to isolate small vessels and capillaries. This is
achieved by the application of a rolling ball background filer, followed by a Laplacian filer. A part
of the results from the Laplacian (-SD/2 to +SD/2) are removed and transformed into an 8-bit
image with a threshold set between 0 and 100. “Islands” less than 300 pixels are then removed.
The skeletonization of the vasculature is then created by superimposing the results of these two
phases of processing. The skeletonization shows all connections between vessel and
capillaries, and capillaries and capillaries as single pixel connecting lines. The morphology
binary connectivity plug-in can be used to determine the number of connected skeleton pixels.
The program returns a skeletonized version of the vasculature, a „potential hypoxia map‟, and
parameters describing the degree of vascular regrowth.
46
Materials and Methods
The research conducted for this study utilizes two different experimental platforms involving the
chicken embryo CAM model. The first experimental platform is the investigation of the effects of
anti-angiogenic drugs on the physiologic angiogenic state of the developing CAM (EDD7-9).
The second platform investigates the effects of anti-angiogenic drugs on the angiogenic state
induced through vascular damage due to PDT on the mature CAM vasculature (EDD11-13).
The materials and methods provided here are based on the material and methods published in
previous articles from The Medical Photonics Group (140; 142).
Materials and chemicals
This study is based on the investigation of two anti-angiogenic drugs, Avastin® and Sutent®.
Avastin® (bevacizumab) is purchased from Genetech (San Fancisco, USA) and Sutent®
(sunitinib) is purchased from Pfizer Inc. (New York, USA). Visualization of blood vessels is
achieved through fluorescent angiography using fluorescein isothiocyanate dextran (FITC-
Dextran, 20 kDA, 25 mg/ml), which is purchased from Sigma-Alrich (Buchs, Switzerland). India
ink purchased from Pelikan (Witzikon \Switzerland) is injected into the extra-embryonic cavity to
increase contrast during fluorescent angiography by blocking additional fluorescence from the
embryo. A 0.9% NaCl solution, which is purchased from Bichsel AG (Interlaken, Switzerland), is
used as a solvent to create dilutions for both drugs or alone as a control. Chicken embryos are
purchased from AnimalcoAG (Staufen Switzerland). In order to perform PDT, the
photosensitizer Visudyne® is acquired from Novartis Pharma, Inc. (Hettlingen Switzerland, the
liposomal formulation of verteporfin (144)) and filtered through a sterile cellulose acetate
membrane (0.8 μm pores, Renner GmbH, Darmstadt, Germany). Laboratory wrapping film used
to cover the eggs protecting them from dehydration and possible contamination is purchased
from Parafilm® (Pechiney, Menasha, USA). Injections into the CAM‟s vasculature are achieved
using a Microliter™ syringes equipped with 33-guage metal HUB (N) needles from Hamilton
(Reno, USA). Injection of india ink under the CAM is achieved using a sterile 5 mL Luer
purchased from Codan Medical Aps and sterile 23-guage neolus needle purchased from
Terumo® (Leuven, Belgium).
The in ovo CAM model
Fertilized chicken eggs are received from Animalco AG (Staufen, Switzerland), labeled and
placed into a hatching incubator with a relative humidity of 65% and a temperature of 37o C.
Incubators are equipped with an automatic rotator (Savimat, Chauffry, France). Eggs are
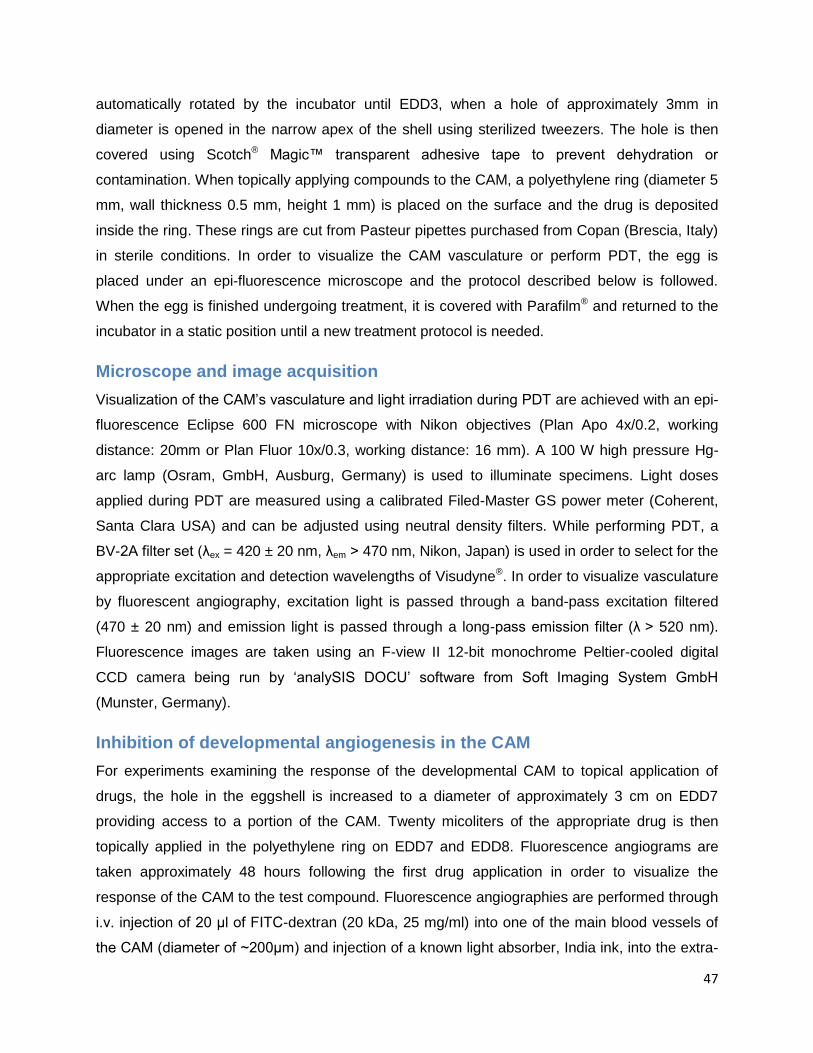
47
automatically rotated by the incubator until EDD3, when a hole of approximately 3mm in
diameter is opened in the narrow apex of the shell using sterilized tweezers. The hole is then
covered using Scotch® Magic™ transparent adhesive tape to prevent dehydration or
contamination. When topically applying compounds to the CAM, a polyethylene ring (diameter 5
mm, wall thickness 0.5 mm, height 1 mm) is placed on the surface and the drug is deposited
inside the ring. These rings are cut from Pasteur pipettes purchased from Copan (Brescia, Italy)
in sterile conditions. In order to visualize the CAM vasculature or perform PDT, the egg is
placed under an epi-fluorescence microscope and the protocol described below is followed.
When the egg is finished undergoing treatment, it is covered with Parafilm® and returned to the
incubator in a static position until a new treatment protocol is needed.
Microscope and image acquisition
Visualization of the CAM‟s vasculature and light irradiation during PDT are achieved with an epi-
fluorescence Eclipse 600 FN microscope with Nikon objectives (Plan Apo 4x/0.2, working
distance: 20mm or Plan Fluor 10x/0.3, working distance: 16 mm). A 100 W high pressure Hg-
arc lamp (Osram, GmbH, Ausburg, Germany) is used to illuminate specimens. Light doses
applied during PDT are measured using a calibrated Filed-Master GS power meter (Coherent,
Santa Clara USA) and can be adjusted using neutral density filters. While performing PDT, a
BV-2A filter set (λex = 420 ± 20 nm, λem ˃ 470 nm, Nikon, Japan) is used in order to select for the
appropriate excitation and detection wavelengths of Visudyne®. In order to visualize vasculature
by fluorescent angiography, excitation light is passed through a band-pass excitation filtered
(470 ± 20 nm) and emission light is passed through a long-pass emission filter (λ ˃ 520 nm).
Fluorescence images are taken using an F-view II 12-bit monochrome Peltier-cooled digital
CCD camera being run by „analySIS DOCU‟ software from Soft Imaging System GmbH
(Munster, Germany).
Inhibition of developmental angiogenesis in the CAM
For experiments examining the response of the developmental CAM to topical application of
drugs, the hole in the eggshell is increased to a diameter of approximately 3 cm on EDD7
providing access to a portion of the CAM. Twenty micoliters of the appropriate drug is then
topically applied in the polyethylene ring on EDD7 and EDD8. Fluorescence angiograms are
taken approximately 48 hours following the first drug application in order to visualize the
response of the CAM to the test compound. Fluorescence angiographies are performed through
i.v. injection of 20 μl of FITC-dextran (20 kDa, 25 mg/ml) into one of the main blood vessels of
the CAM (diameter of ~200μm) and injection of a known light absorber, India ink, into the extra-
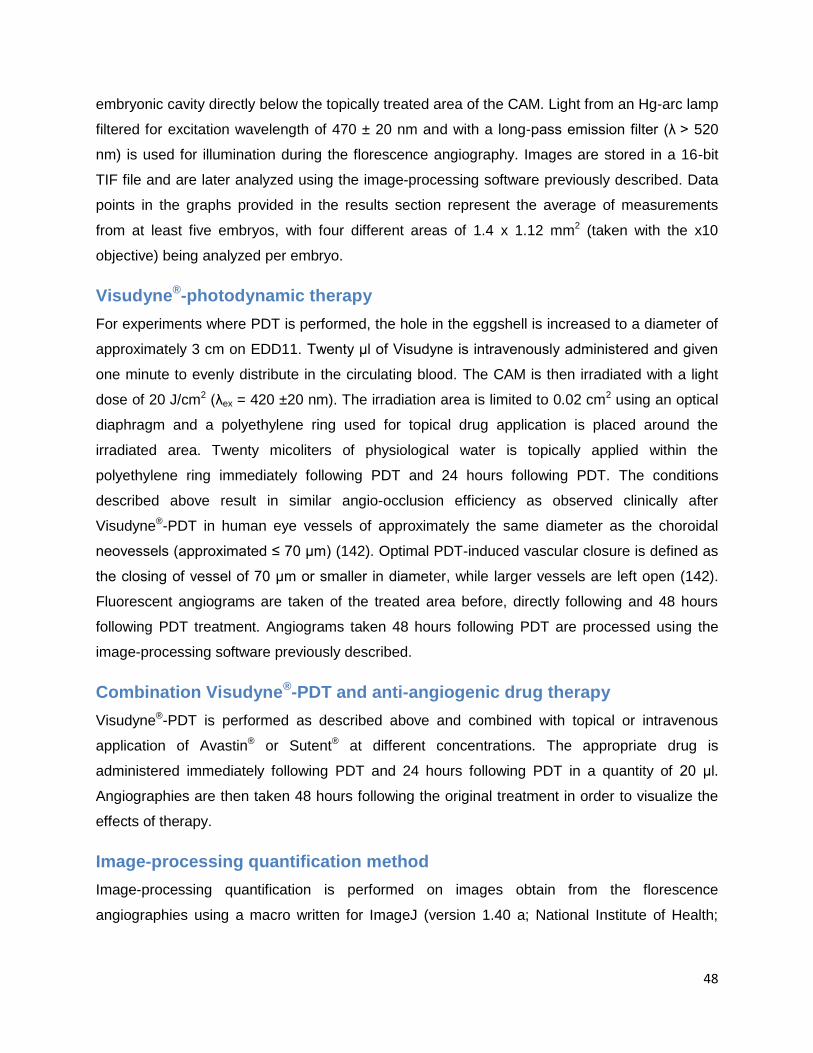
48
embryonic cavity directly below the topically treated area of the CAM. Light from an Hg-arc lamp
filtered for excitation wavelength of 470 ± 20 nm and with a long-pass emission filter (λ ˃ 520
nm) is used for illumination during the florescence angiography. Images are stored in a 16-bit
TIF file and are later analyzed using the image-processing software previously described. Data
points in the graphs provided in the results section represent the average of measurements
from at least five embryos, with four different areas of 1.4 x 1.12 mm2 (taken with the x10
objective) being analyzed per embryo.
Visudyne®-photodynamic therapy
For experiments where PDT is performed, the hole in the eggshell is increased to a diameter of
approximately 3 cm on EDD11. Twenty μl of Visudyne is intravenously administered and given
one minute to evenly distribute in the circulating blood. The CAM is then irradiated with a light
dose of 20 J/cm2 (λex = 420 ±20 nm). The irradiation area is limited to 0.02 cm2 using an optical
diaphragm and a polyethylene ring used for topical drug application is placed around the
irradiated area. Twenty micoliters of physiological water is topically applied within the
polyethylene ring immediately following PDT and 24 hours following PDT. The conditions
described above result in similar angio-occlusion efficiency as observed clinically after
Visudyne®-PDT in human eye vessels of approximately the same diameter as the choroidal
neovessels (approximated ≤ 70 μm) (142). Optimal PDT-induced vascular closure is defined as
the closing of vessel of 70 μm or smaller in diameter, while larger vessels are left open (142).
Fluorescent angiograms are taken of the treated area before, directly following and 48 hours
following PDT treatment. Angiograms taken 48 hours following PDT are processed using the
image-processing software previously described.
Combination Visudyne®-PDT and anti-angiogenic drug therapy
Visudyne®-PDT is performed as described above and combined with topical or intravenous
application of Avastin® or Sutent® at different concentrations. The appropriate drug is
administered immediately following PDT and 24 hours following PDT in a quantity of 20 μl.
Angiographies are then taken 48 hours following the original treatment in order to visualize the
effects of therapy.
Image-processing quantification method
Image-processing quantification is performed on images obtain from the florescence
angiographies using a macro written for ImageJ (version 1.40 a; National Institute of Health;
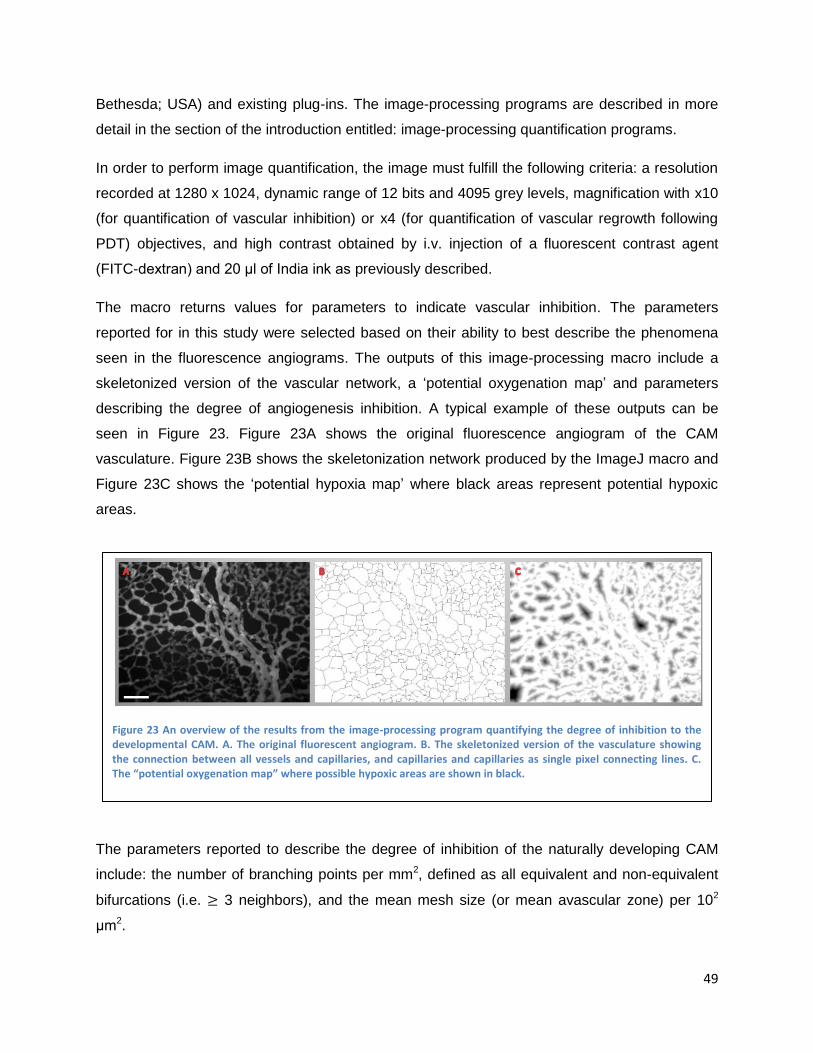
49
Bethesda; USA) and existing plug-ins. The image-processing programs are described in more
detail in the section of the introduction entitled: image-processing quantification programs.
In order to perform image quantification, the image must fulfill the following criteria: a resolution
recorded at 1280 x 1024, dynamic range of 12 bits and 4095 grey levels, magnification with x10
(for quantification of vascular inhibition) or x4 (for quantification of vascular regrowth following
PDT) objectives, and high contrast obtained by i.v. injection of a fluorescent contrast agent
(FITC-dextran) and 20 μl of India ink as previously described.
The macro returns values for parameters to indicate vascular inhibition. The parameters
reported for in this study were selected based on their ability to best describe the phenomena
seen in the fluorescence angiograms. The outputs of this image-processing macro include a
skeletonized version of the vascular network, a „potential oxygenation map‟ and parameters
describing the degree of angiogenesis inhibition. A typical example of these outputs can be
seen in Figure 23. Figure 23A shows the original fluorescence angiogram of the CAM
vasculature. Figure 23B shows the skeletonization network produced by the ImageJ macro and
Figure 23C shows the „potential hypoxia map‟ where black areas represent potential hypoxic
areas.
The parameters reported to describe the degree of inhibition of the naturally developing CAM
include: the number of branching points per mm2, defined as all equivalent and non-equivalent
bifurcations (i.e. 3 neighbors), and the mean mesh size (or mean avascular zone) per 102
μm2.
Figure 23 An overview of the results from the image-processing program quantifying the degree of inhibition to the developmental CAM. A. The original fluorescent angiogram. B. The skeletonized version of the vasculature showing the connection between all vessels and capillaries, and capillaries and capillaries as single pixel connecting lines. C. The “potential oxygenation map” where possible hypoxic areas are shown in black.
50
The image-processing program which analyzes vascular regrowth following PDT is slightly
different than the one analyzing inhibition of angiogenesis, but again produces the outputs of a
skeletonized version of the vasculature, a „potential oxygenation map‟ and parameters
describing the vascular density and degree of regrowth. In analyzing the regrowth of vessels
into the PDT treated area of the CAM, four concentric circles are placed on the treated area, the
outer most circle marking the entire treated area or the region of interest (this circle is drawn
based on user input). The four concentric circles create four zones of revascularization, each of
which is analyzed separately by the software. The outer most region, area 4, is the first region to
be revascularized while the inner most region, area 1, is the last to be revascularized. A typical
example of these outputs can be seen in Figure 24, with the original image shown in Figure
24A, the skeletonized version of the image shown in Figure 24B and the „potential hypoxia map‟
shown in Figure 24C.
The descriptors provided in this report to indicate vascular regrowth following PDT include: the
branching points (per mm2); a relative measure of mean mesh size as represented by the mean
distance between vessels in μm; and the vessel density measured as the percentage of black
pixels in the skeletonized image scaled to the surface area analyzed. All of the graphs provided
in the results section indicate the average value of these parameters in area 1 (the inner most
Figure 24 An overview of the results of the image-processing program analyzing vascular regrowth following PDT, with rings marking the areas of regrowth following PDT and the outermost rings marking the entire treated area. A. The original fluorescent angiogram. B. The skeletonized version of the vasculature showing the connection between all vessels and capillaries and capillaries and capillaries as single pixel connecting lines. C. The “potential oxygenation map” where possible hypoxic areas are shown in black. The white bar in the lower left corner represents 200 μm and is valid for all images.
51
region) of vascular regrowth for low and high concentrations of each drugs. Data from the inner
most region was selected, because this region showed the most significant difference between
conditions due to the fact that it is the last region to be revascularized. Graphs also indicate if
results are statistically significant in regards to the control condition based on the results of a
student t-test. Graphs are labeled as follows: data sets with a p-value > 0.1 have no indication;
data sets with a p-value between 0.05 and 0.1 are marked by one asterisks above the bar („*‟),
and data sets with a p-value < 0.05 are marked by two asterisks above the bar („**‟).
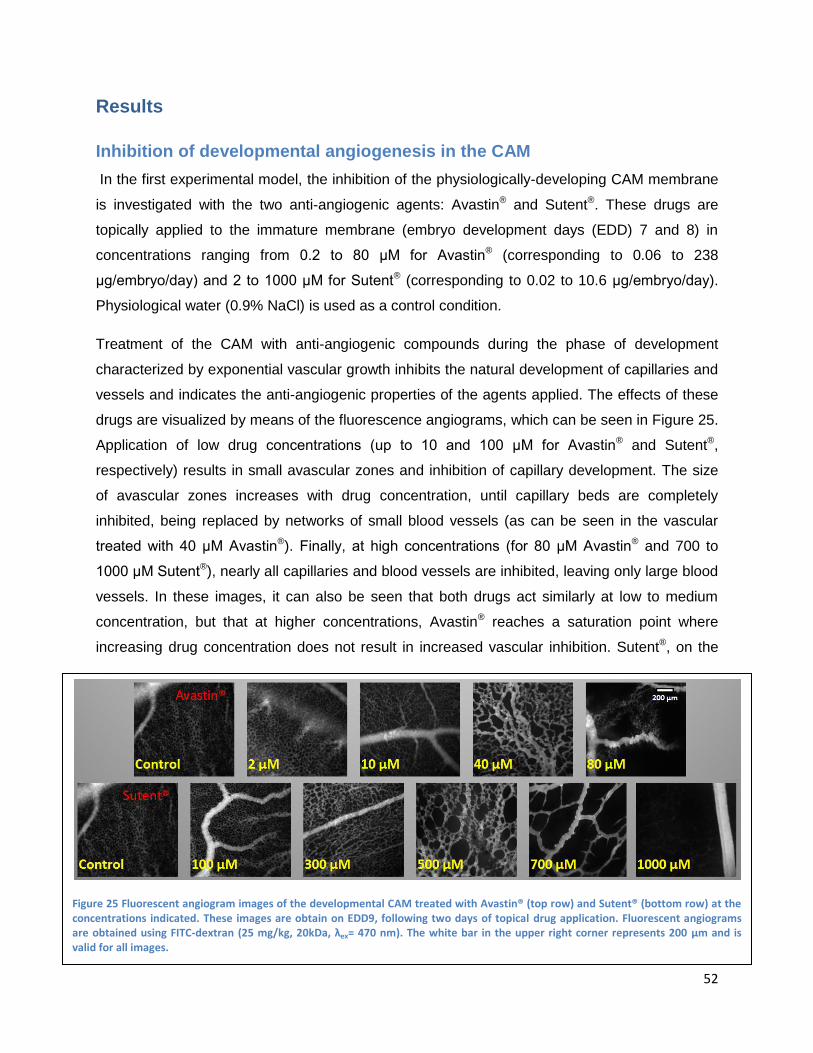
52
Results
Inhibition of developmental angiogenesis in the CAM
In the first experimental model, the inhibition of the physiologically-developing CAM membrane
is investigated with the two anti-angiogenic agents: Avastin® and Sutent®. These drugs are
topically applied to the immature membrane (embryo development days (EDD) 7 and 8) in
concentrations ranging from 0.2 to 80 μM for Avastin® (corresponding to 0.06 to 238
μg/embryo/day) and 2 to 1000 μM for Sutent® (corresponding to 0.02 to 10.6 μg/embryo/day).
Physiological water (0.9% NaCl) is used as a control condition.
Treatment of the CAM with anti-angiogenic compounds during the phase of development
characterized by exponential vascular growth inhibits the natural development of capillaries and
vessels and indicates the anti-angiogenic properties of the agents applied. The effects of these
drugs are visualized by means of the fluorescence angiograms, which can be seen in Figure 25.
Application of low drug concentrations (up to 10 and 100 μM for Avastin® and Sutent®,
respectively) results in small avascular zones and inhibition of capillary development. The size
of avascular zones increases with drug concentration, until capillary beds are completely
inhibited, being replaced by networks of small blood vessels (as can be seen in the vascular
treated with 40 μM Avastin®). Finally, at high concentrations (for 80 μM Avastin® and 700 to
1000 μM Sutent®), nearly all capillaries and blood vessels are inhibited, leaving only large blood
vessels. In these images, it can also be seen that both drugs act similarly at low to medium
concentration, but that at higher concentrations, Avastin® reaches a saturation point where
increasing drug concentration does not result in increased vascular inhibition. Sutent®, on the
Figure 25 Fluorescent angiogram images of the developmental CAM treated with Avastin® (top row) and Sutent® (bottom row) at the concentrations indicated. These images are obtain on EDD9, following two days of topical drug application. Fluorescent angiograms are obtained using FITC-dextran (25 mg/kg, 20kDa, λex= 470 nm). The white bar in the upper right corner represents 200 μm and is valid for all images.
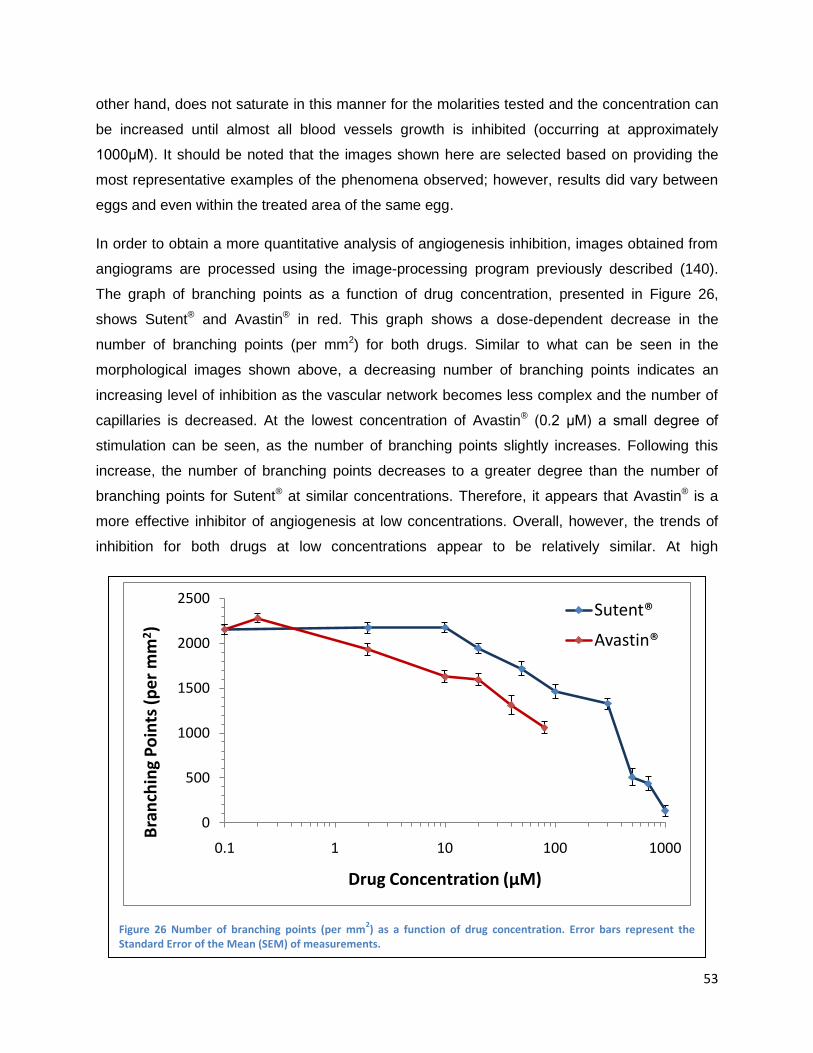
53
other hand, does not saturate in this manner for the molarities tested and the concentration can
be increased until almost all blood vessels growth is inhibited (occurring at approximately
1000μM). It should be noted that the images shown here are selected based on providing the
most representative examples of the phenomena observed; however, results did vary between
eggs and even within the treated area of the same egg.
In order to obtain a more quantitative analysis of angiogenesis inhibition, images obtained from
angiograms are processed using the image-processing program previously described (140).
The graph of branching points as a function of drug concentration, presented in Figure 26,
shows Sutent® and Avastin® in red. This graph shows a dose-dependent decrease in the
number of branching points (per mm2) for both drugs. Similar to what can be seen in the
morphological images shown above, a decreasing number of branching points indicates an
increasing level of inhibition as the vascular network becomes less complex and the number of
capillaries is decreased. At the lowest concentration of Avastin® (0.2 μM) a small degree of
stimulation can be seen, as the number of branching points slightly increases. Following this
increase, the number of branching points decreases to a greater degree than the number of
branching points for Sutent® at similar concentrations. Therefore, it appears that Avastin® is a
more effective inhibitor of angiogenesis at low concentrations. Overall, however, the trends of
inhibition for both drugs at low concentrations appear to be relatively similar. At high
Figure 26 Number of branching points (per mm2) as a function of drug concentration. Error bars represent the
Standard Error of the Mean (SEM) of measurements.
0
500
1000
1500
2000
2500
0.1 1 10 100 1000
Bra
nch
ing
Po
ints
(p
er
mm
2)
Drug Concentration (μM)
Sutent®
Avastin®
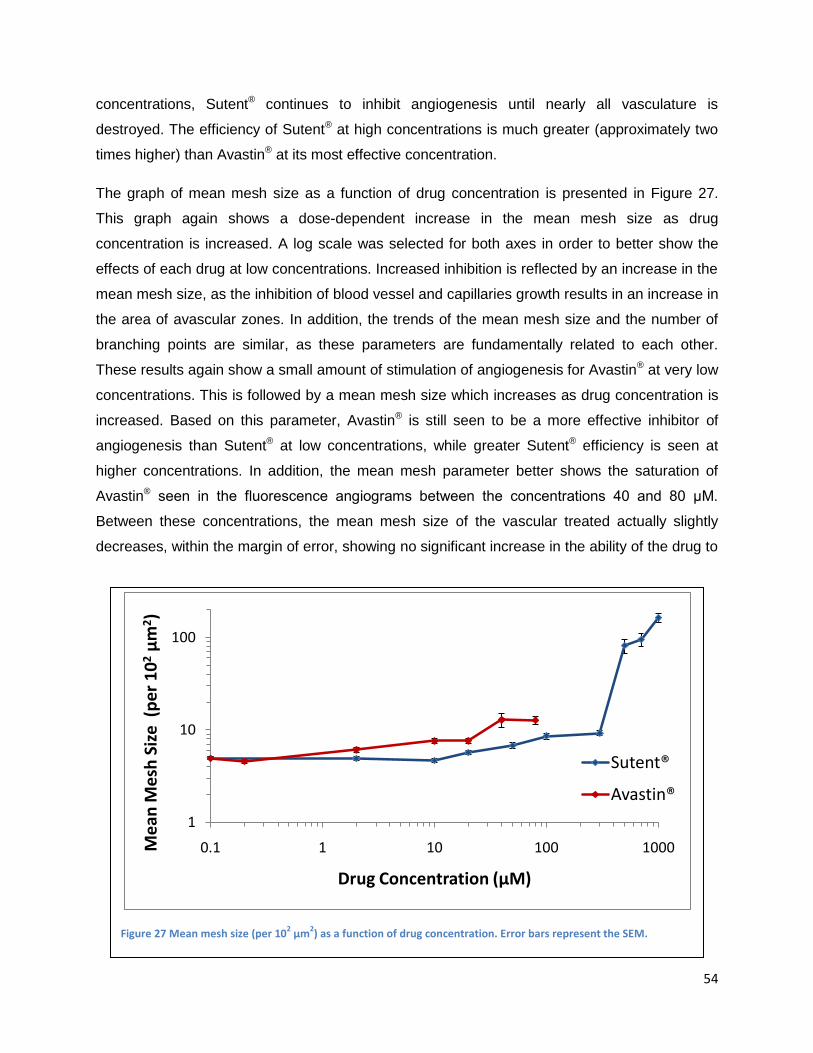
54
concentrations, Sutent® continues to inhibit angiogenesis until nearly all vasculature is
destroyed. The efficiency of Sutent® at high concentrations is much greater (approximately two
times higher) than Avastin® at its most effective concentration.
The graph of mean mesh size as a function of drug concentration is presented in Figure 27.
This graph again shows a dose-dependent increase in the mean mesh size as drug
concentration is increased. A log scale was selected for both axes in order to better show the
effects of each drug at low concentrations. Increased inhibition is reflected by an increase in the
mean mesh size, as the inhibition of blood vessel and capillaries growth results in an increase in
the area of avascular zones. In addition, the trends of the mean mesh size and the number of
branching points are similar, as these parameters are fundamentally related to each other.
These results again show a small amount of stimulation of angiogenesis for Avastin® at very low
concentrations. This is followed by a mean mesh size which increases as drug concentration is
increased. Based on this parameter, Avastin® is still seen to be a more effective inhibitor of
angiogenesis than Sutent® at low concentrations, while greater Sutent® efficiency is seen at
higher concentrations. In addition, the mean mesh parameter better shows the saturation of
Avastin® seen in the fluorescence angiograms between the concentrations 40 and 80 μM.
Between these concentrations, the mean mesh size of the vascular treated actually slightly
decreases, within the margin of error, showing no significant increase in the ability of the drug to
Figure 27 Mean mesh size (per 102 μm
2) as a function of drug concentration. Error bars represent the SEM.
1
10
100
0.1 1 10 100 1000Me
an M
esh
Siz
e (
pe
r 1
02
μm
2)
Drug Concentration (μM)
Sutent®
Avastin®
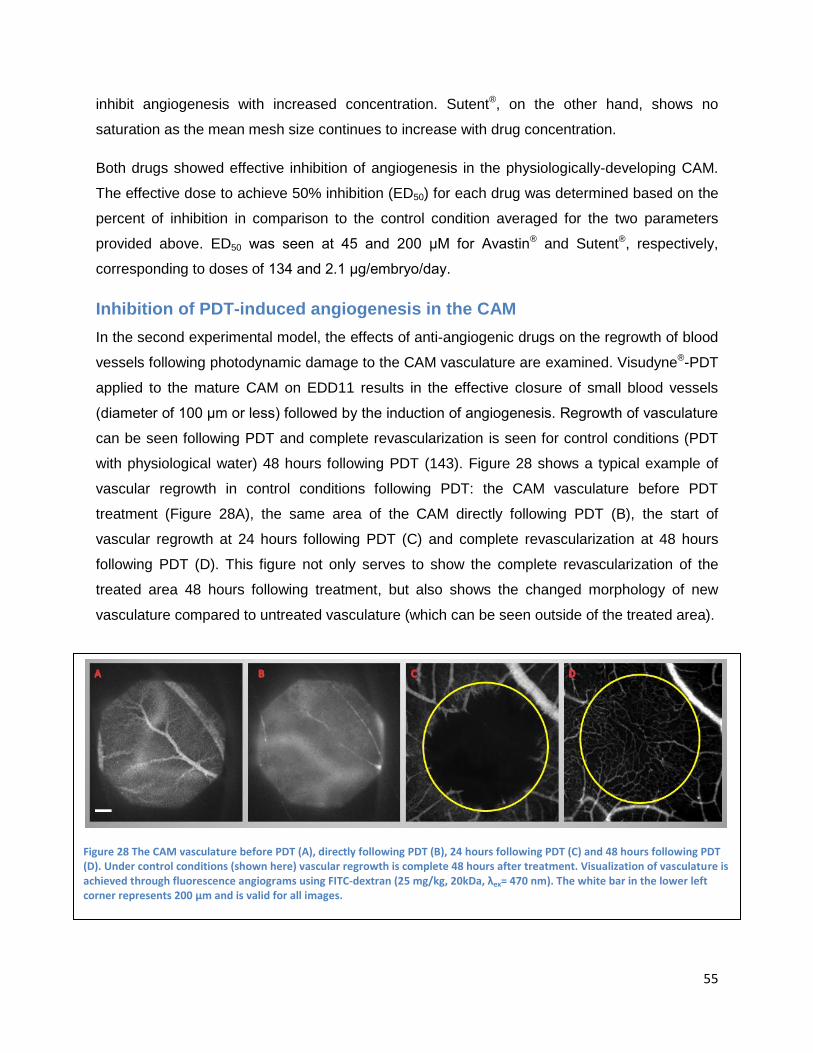
55
inhibit angiogenesis with increased concentration. Sutent®, on the other hand, shows no
saturation as the mean mesh size continues to increase with drug concentration.
Both drugs showed effective inhibition of angiogenesis in the physiologically-developing CAM.
The effective dose to achieve 50% inhibition (ED50) for each drug was determined based on the
percent of inhibition in comparison to the control condition averaged for the two parameters
provided above. ED50 was seen at 45 and 200 μM for Avastin® and Sutent®, respectively,
corresponding to doses of 134 and 2.1 μg/embryo/day.
Inhibition of PDT-induced angiogenesis in the CAM
In the second experimental model, the effects of anti-angiogenic drugs on the regrowth of blood
vessels following photodynamic damage to the CAM vasculature are examined. Visudyne®-PDT
applied to the mature CAM on EDD11 results in the effective closure of small blood vessels
(diameter of 100 μm or less) followed by the induction of angiogenesis. Regrowth of vasculature
can be seen following PDT and complete revascularization is seen for control conditions (PDT
with physiological water) 48 hours following PDT (143). Figure 28 shows a typical example of
vascular regrowth in control conditions following PDT: the CAM vasculature before PDT
treatment (Figure 28A), the same area of the CAM directly following PDT (B), the start of
vascular regrowth at 24 hours following PDT (C) and complete revascularization at 48 hours
following PDT (D). This figure not only serves to show the complete revascularization of the
treated area 48 hours following treatment, but also shows the changed morphology of new
vasculature compared to untreated vasculature (which can be seen outside of the treated area).
Figure 28 The CAM vasculature before PDT (A), directly following PDT (B), 24 hours following PDT (C) and 48 hours following PDT (D). Under control conditions (shown here) vascular regrowth is complete 48 hours after treatment. Visualization of vasculature is achieved through fluorescence angiograms using FITC-dextran (25 mg/kg, 20kDa, λex= 470 nm). The white bar in the lower left corner represents 200 μm and is valid for all images.
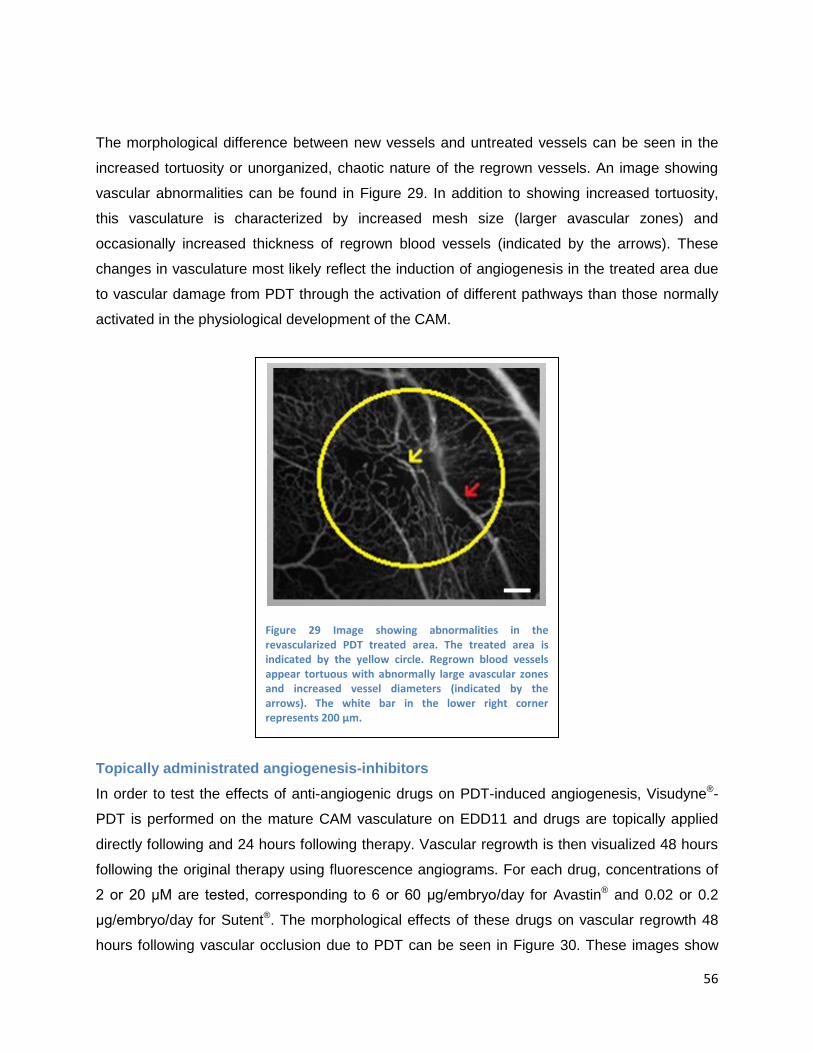
56
The morphological difference between new vessels and untreated vessels can be seen in the
increased tortuosity or unorganized, chaotic nature of the regrown vessels. An image showing
vascular abnormalities can be found in Figure 29. In addition to showing increased tortuosity,
this vasculature is characterized by increased mesh size (larger avascular zones) and
occasionally increased thickness of regrown blood vessels (indicated by the arrows). These
changes in vasculature most likely reflect the induction of angiogenesis in the treated area due
to vascular damage from PDT through the activation of different pathways than those normally
activated in the physiological development of the CAM.
Topically administrated angiogenesis-inhibitors
In order to test the effects of anti-angiogenic drugs on PDT-induced angiogenesis, Visudyne®-
PDT is performed on the mature CAM vasculature on EDD11 and drugs are topically applied
directly following and 24 hours following therapy. Vascular regrowth is then visualized 48 hours
following the original therapy using fluorescence angiograms. For each drug, concentrations of
2 or 20 μM are tested, corresponding to 6 or 60 μg/embryo/day for Avastin® and 0.02 or 0.2
μg/embryo/day for Sutent®. The morphological effects of these drugs on vascular regrowth 48
hours following vascular occlusion due to PDT can be seen in Figure 30. These images show
Figure 29 Image showing abnormalities in the revascularized PDT treated area. The treated area is indicated by the yellow circle. Regrown blood vessels appear tortuous with abnormally large avascular zones and increased vessel diameters (indicated by the arrows). The white bar in the lower right corner represents 200 μm.
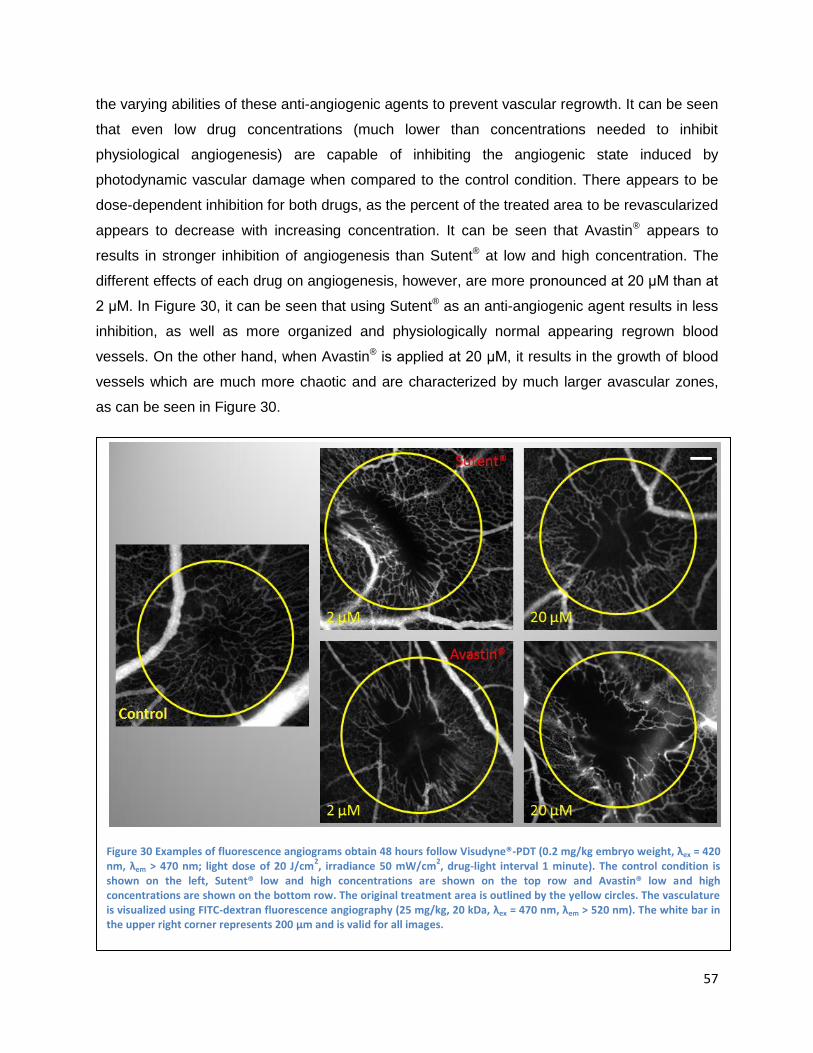
57
the varying abilities of these anti-angiogenic agents to prevent vascular regrowth. It can be seen
that even low drug concentrations (much lower than concentrations needed to inhibit
physiological angiogenesis) are capable of inhibiting the angiogenic state induced by
photodynamic vascular damage when compared to the control condition. There appears to be
dose-dependent inhibition for both drugs, as the percent of the treated area to be revascularized
appears to decrease with increasing concentration. It can be seen that Avastin® appears to
results in stronger inhibition of angiogenesis than Sutent® at low and high concentration. The
different effects of each drug on angiogenesis, however, are more pronounced at 20 μM than at
2 μM. In Figure 30, it can be seen that using Sutent® as an anti-angiogenic agent results in less
inhibition, as well as more organized and physiologically normal appearing regrown blood
vessels. On the other hand, when Avastin® is applied at 20 μM, it results in the growth of blood
vessels which are much more chaotic and are characterized by much larger avascular zones,
as can be seen in Figure 30.
Figure 30 Examples of fluorescence angiograms obtain 48 hours follow Visudyne®-PDT (0.2 mg/kg embryo weight, λex = 420 nm, λem > 470 nm; light dose of 20 J/cm
2, irradiance 50 mW/cm
2, drug-light interval 1 minute). The control condition is
shown on the left, Sutent® low and high concentrations are shown on the top row and Avastin® low and high concentrations are shown on the bottom row. The original treatment area is outlined by the yellow circles. The vasculature is visualized using FITC-dextran fluorescence angiography (25 mg/kg, 20 kDa, λex = 470 nm, λem > 520 nm). The white bar in the upper right corner represents 200 μm and is valid for all images.
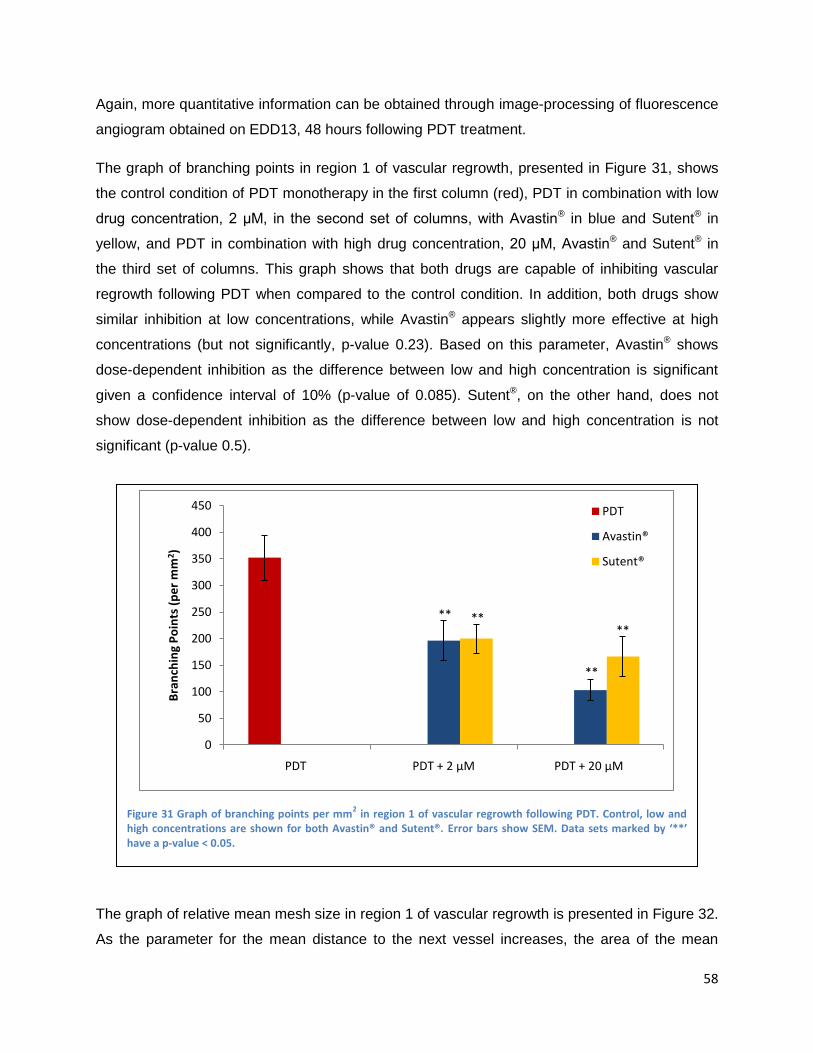
58
Again, more quantitative information can be obtained through image-processing of fluorescence
angiogram obtained on EDD13, 48 hours following PDT treatment.
The graph of branching points in region 1 of vascular regrowth, presented in Figure 31, shows
the control condition of PDT monotherapy in the first column (red), PDT in combination with low
drug concentration, 2 μM, in the second set of columns, with Avastin® in blue and Sutent® in
yellow, and PDT in combination with high drug concentration, 20 μM, Avastin® and Sutent® in
the third set of columns. This graph shows that both drugs are capable of inhibiting vascular
regrowth following PDT when compared to the control condition. In addition, both drugs show
similar inhibition at low concentrations, while Avastin® appears slightly more effective at high
concentrations (but not significantly, p-value 0.23). Based on this parameter, Avastin® shows
dose-dependent inhibition as the difference between low and high concentration is significant
given a confidence interval of 10% (p-value of 0.085). Sutent®, on the other hand, does not
show dose-dependent inhibition as the difference between low and high concentration is not
significant (p-value 0.5).
The graph of relative mean mesh size in region 1 of vascular regrowth is presented in Figure 32.
As the parameter for the mean distance to the next vessel increases, the area of the mean
Figure 31 Graph of branching points per mm2 in region 1 of vascular regrowth following PDT. Control, low and
high concentrations are shown for both Avastin® and Sutent®. Error bars show SEM. Data sets marked by ‘**’ have a p-value < 0.05.
**
**
****
0
50
100
150
200
250
300
350
400
450
PDT PDT + 2 μM PDT + 20 μM
Bra
nch
ing
Po
ints
(p
er
mm
2)
PDT
Avastin®
Sutent®
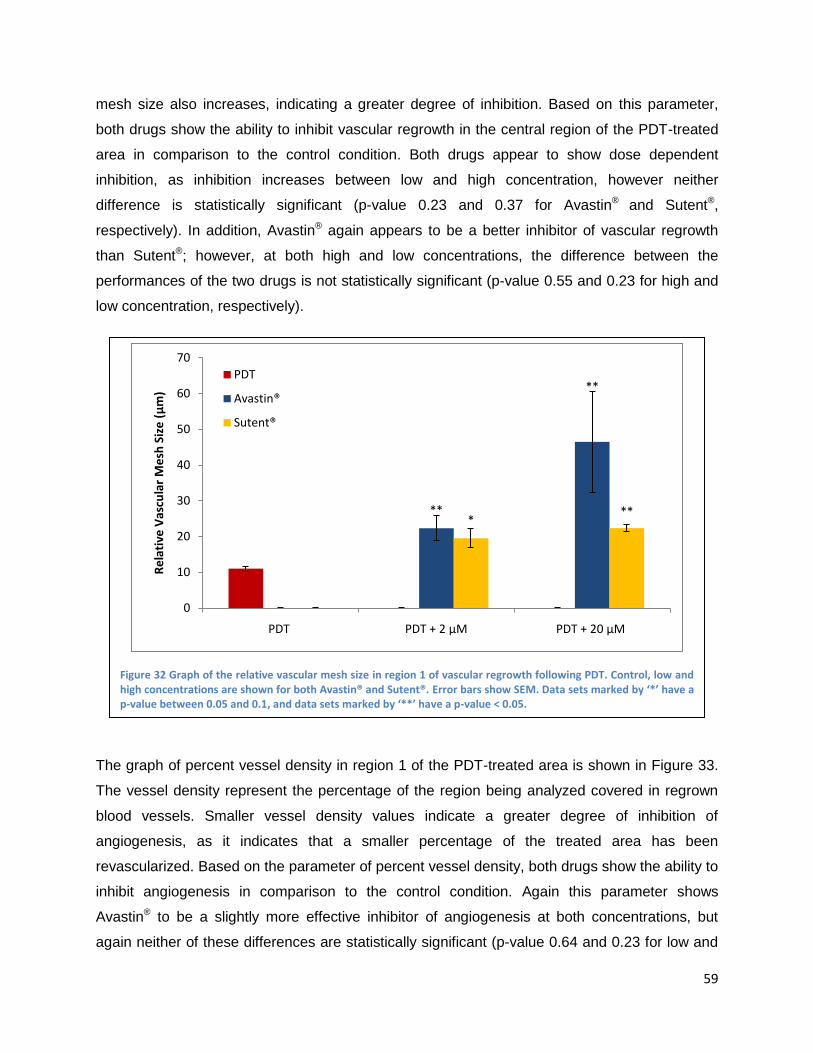
59
mesh size also increases, indicating a greater degree of inhibition. Based on this parameter,
both drugs show the ability to inhibit vascular regrowth in the central region of the PDT-treated
area in comparison to the control condition. Both drugs appear to show dose dependent
inhibition, as inhibition increases between low and high concentration, however neither
difference is statistically significant (p-value 0.23 and 0.37 for Avastin® and Sutent®,
respectively). In addition, Avastin® again appears to be a better inhibitor of vascular regrowth
than Sutent®; however, at both high and low concentrations, the difference between the
performances of the two drugs is not statistically significant (p-value 0.55 and 0.23 for high and
low concentration, respectively).
The graph of percent vessel density in region 1 of the PDT-treated area is shown in Figure 33.
The vessel density represent the percentage of the region being analyzed covered in regrown
blood vessels. Smaller vessel density values indicate a greater degree of inhibition of
angiogenesis, as it indicates that a smaller percentage of the treated area has been
revascularized. Based on the parameter of percent vessel density, both drugs show the ability to
inhibit angiogenesis in comparison to the control condition. Again this parameter shows
Avastin® to be a slightly more effective inhibitor of angiogenesis at both concentrations, but
again neither of these differences are statistically significant (p-value 0.64 and 0.23 for low and
Figure 32 Graph of the relative vascular mesh size in region 1 of vascular regrowth following PDT. Control, low and high concentrations are shown for both Avastin® and Sutent®. Error bars show SEM. Data sets marked by ‘*’ have a p-value between 0.05 and 0.1, and data sets marked by ‘**’ have a p-value < 0.05.
**
**
***
0
10
20
30
40
50
60
70
PDT PDT + 2 μM PDT + 20 μM
Re
lati
ve V
ascu
lar
Me
sh S
ize
(μ
m)
PDT
Avastin®
Sutent®
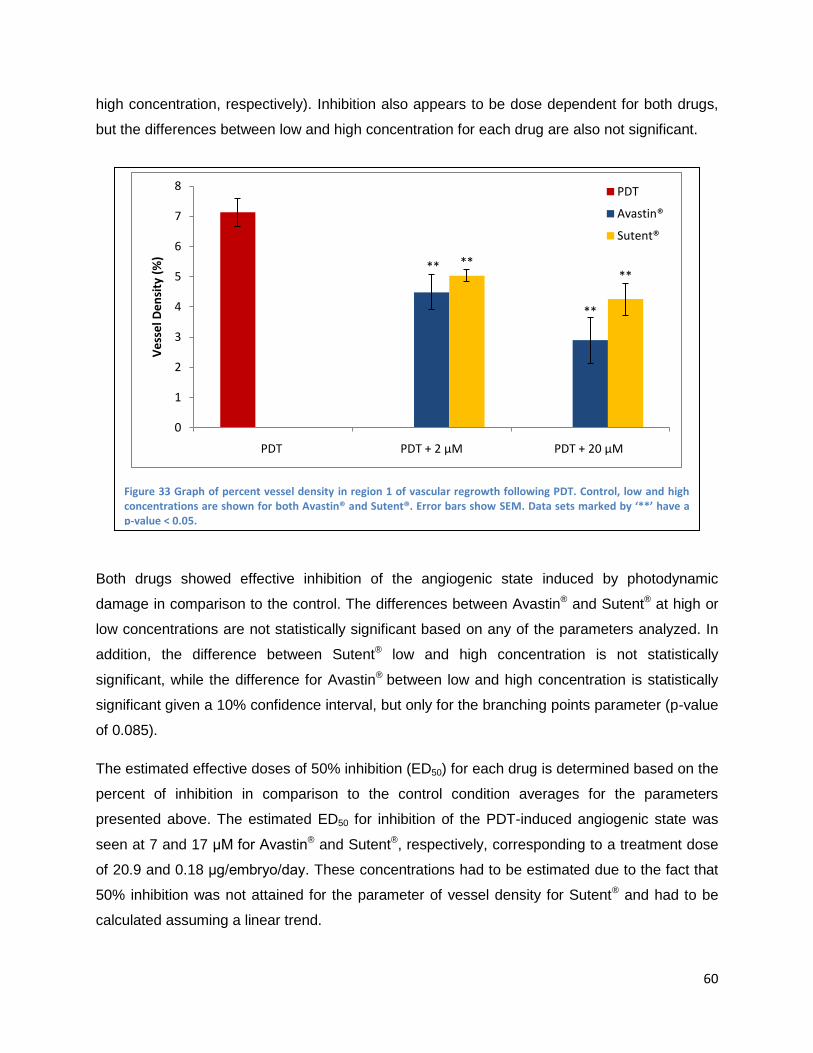
60
high concentration, respectively). Inhibition also appears to be dose dependent for both drugs,
but the differences between low and high concentration for each drug are also not significant.
Both drugs showed effective inhibition of the angiogenic state induced by photodynamic
damage in comparison to the control. The differences between Avastin® and Sutent® at high or
low concentrations are not statistically significant based on any of the parameters analyzed. In
addition, the difference between Sutent® low and high concentration is not statistically
significant, while the difference for Avastin® between low and high concentration is statistically
significant given a 10% confidence interval, but only for the branching points parameter (p-value
of 0.085).
The estimated effective doses of 50% inhibition (ED50) for each drug is determined based on the
percent of inhibition in comparison to the control condition averages for the parameters
presented above. The estimated ED50 for inhibition of the PDT-induced angiogenic state was
seen at 7 and 17 μM for Avastin® and Sutent®, respectively, corresponding to a treatment dose
of 20.9 and 0.18 μg/embryo/day. These concentrations had to be estimated due to the fact that
50% inhibition was not attained for the parameter of vessel density for Sutent® and had to be
calculated assuming a linear trend.
Figure 33 Graph of percent vessel density in region 1 of vascular regrowth following PDT. Control, low and high concentrations are shown for both Avastin® and Sutent®. Error bars show SEM. Data sets marked by ‘**’ have a p-value < 0.05.
**
**
****
0
1
2
3
4
5
6
7
8
PDT PDT + 2 μM PDT + 20 μM
Ve
sse
l De
nsi
ty (
%)
PDT
Avastin®
Sutent®
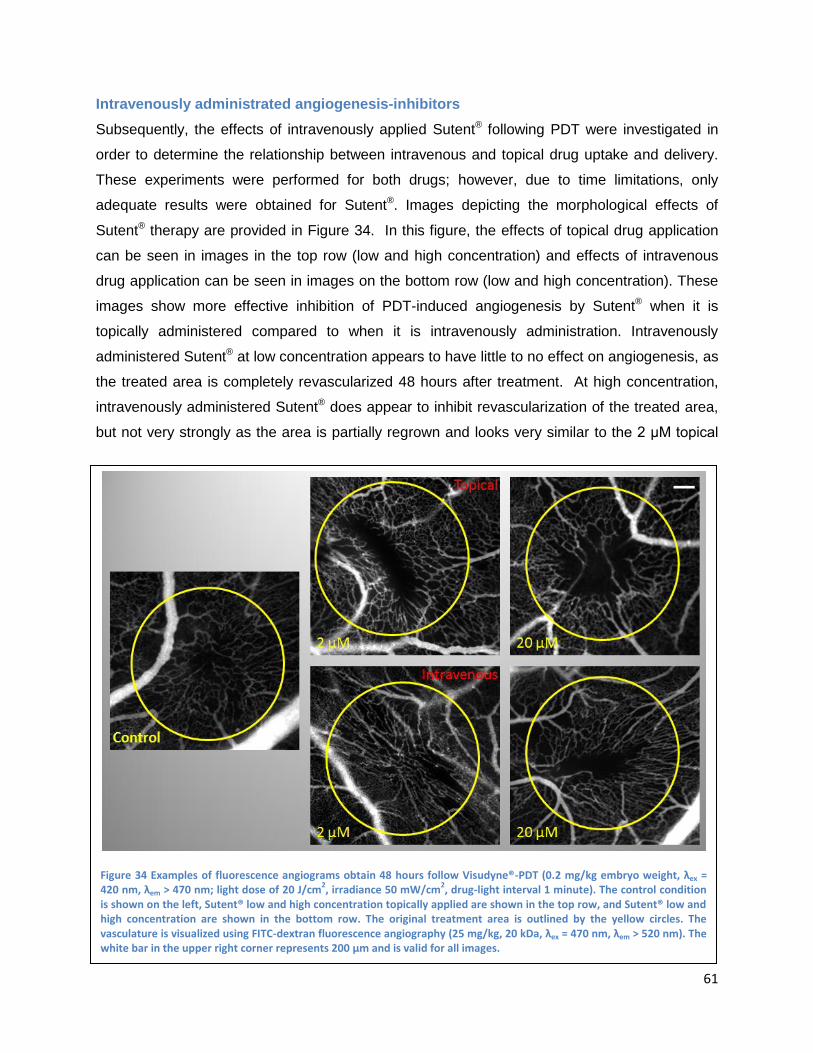
61
Intravenously administrated angiogenesis-inhibitors
Subsequently, the effects of intravenously applied Sutent® following PDT were investigated in
order to determine the relationship between intravenous and topical drug uptake and delivery.
These experiments were performed for both drugs; however, due to time limitations, only
adequate results were obtained for Sutent®. Images depicting the morphological effects of
Sutent® therapy are provided in Figure 34. In this figure, the effects of topical drug application
can be seen in images in the top row (low and high concentration) and effects of intravenous
drug application can be seen in images on the bottom row (low and high concentration). These
images show more effective inhibition of PDT-induced angiogenesis by Sutent® when it is
topically administered compared to when it is intravenously administration. Intravenously
administered Sutent® at low concentration appears to have little to no effect on angiogenesis, as
the treated area is completely revascularized 48 hours after treatment. At high concentration,
intravenously administered Sutent® does appear to inhibit revascularization of the treated area,
but not very strongly as the area is partially regrown and looks very similar to the 2 μM topical
Figure 34 Examples of fluorescence angiograms obtain 48 hours follow Visudyne®-PDT (0.2 mg/kg embryo weight, λex = 420 nm, λem > 470 nm; light dose of 20 J/cm
2, irradiance 50 mW/cm
2, drug-light interval 1 minute). The control condition
is shown on the left, Sutent® low and high concentration topically applied are shown in the top row, and Sutent® low and high concentration are shown in the bottom row. The original treatment area is outlined by the yellow circles. The vasculature is visualized using FITC-dextran fluorescence angiography (25 mg/kg, 20 kDa, λex = 470 nm, λem > 520 nm). The white bar in the upper right corner represents 200 μm and is valid for all images.
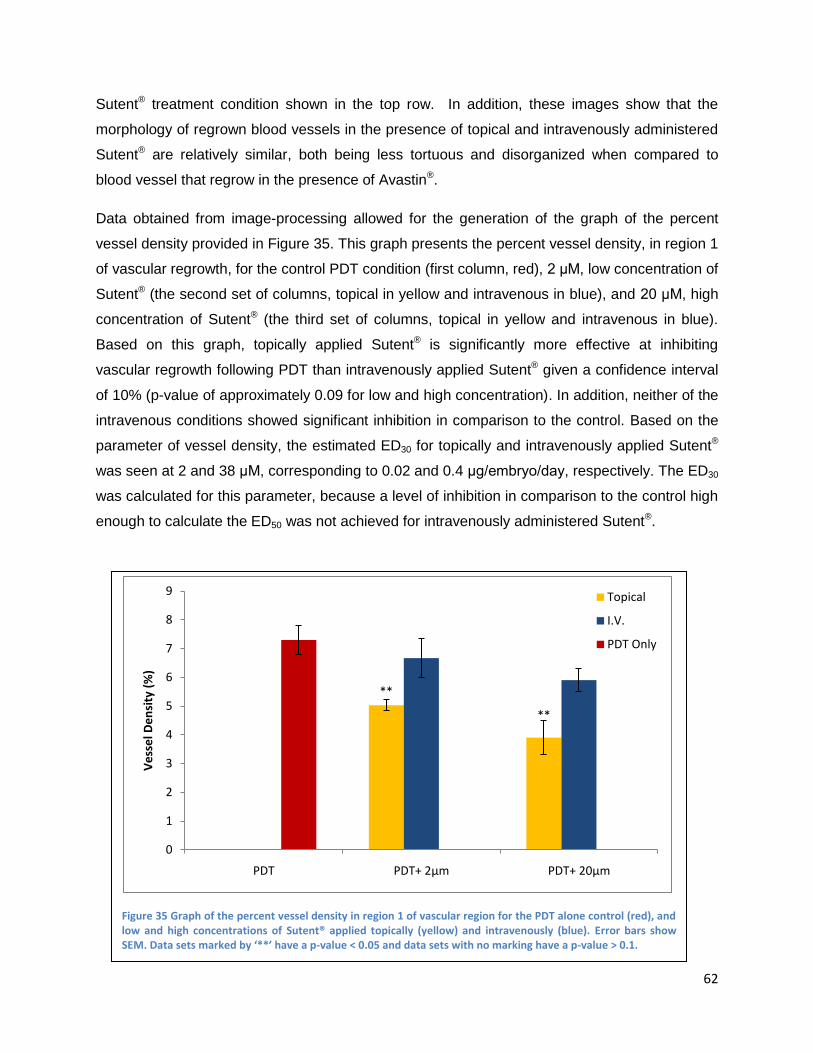
62
Sutent® treatment condition shown in the top row. In addition, these images show that the
morphology of regrown blood vessels in the presence of topical and intravenously administered
Sutent® are relatively similar, both being less tortuous and disorganized when compared to
blood vessel that regrow in the presence of Avastin®.
Data obtained from image-processing allowed for the generation of the graph of the percent
vessel density provided in Figure 35. This graph presents the percent vessel density, in region 1
of vascular regrowth, for the control PDT condition (first column, red), 2 μM, low concentration of
Sutent® (the second set of columns, topical in yellow and intravenous in blue), and 20 μM, high
concentration of Sutent® (the third set of columns, topical in yellow and intravenous in blue).
Based on this graph, topically applied Sutent® is significantly more effective at inhibiting
vascular regrowth following PDT than intravenously applied Sutent® given a confidence interval
of 10% (p-value of approximately 0.09 for low and high concentration). In addition, neither of the
intravenous conditions showed significant inhibition in comparison to the control. Based on the
parameter of vessel density, the estimated ED30 for topically and intravenously applied Sutent®
was seen at 2 and 38 μM, corresponding to 0.02 and 0.4 μg/embryo/day, respectively. The ED30
was calculated for this parameter, because a level of inhibition in comparison to the control high
enough to calculate the ED50 was not achieved for intravenously administered Sutent®.
Figure 35 Graph of the percent vessel density in region 1 of vascular region for the PDT alone control (red), and low and high concentrations of Sutent® applied topically (yellow) and intravenously (blue). Error bars show SEM. Data sets marked by ‘**’ have a p-value < 0.05 and data sets with no marking have a p-value > 0.1.
**
**
0
1
2
3
4
5
6
7
8
9
PDT PDT+ 2μm PDT+ 20μm
Ve
sse
l De
nsi
ty (
%)
Topical
I.V.
PDT Only
63
Discussion and Conclusions
The CAM model is extensively used in angiogenic research and is particularly well suited for the
study of diseases characterized by proliferative retinal vasculature, such as age-related macular
degeneration (29).
In the present work, this model was used in order to study the effects of vascular regrowth
following photodynamic occlusion of vessels in the presence of anti-angiogenic drugs targeting
two different mechanisms: direct inhibition of vascular endothelial growth factor (VEGF) through
a monoclonal antibody, such as Avastin®, or inhibition of VEGF and other pro-angiogenic
signaling through the receptor tyrosine kinase inhibitor (RTKI) Sutent®.
The aim of showing the efficiency of a RTKI in preventing angiogenesis and vascular regrowth
following photodynamic vascular occlusion is to open up the possibility for a new therapeutic
modality, which would present unique advantages over current therapeutic options. The
advantage of using a small molecule-based drug, such as Sutent®, in the treatment of AMD in
the place of a large molecule, such as Avastin®, is based on the bioavailibity of the drug. Being
a small molecule which is mostly hydrophobic, Sutent® can pass through cell membranes to
interact with the intracellular domains of receptor tyrosine kinases involved in the angiogenic
signaling cascade. This properties of Sutent® may well make it possible for drug application to
be achieved both locally and topically through either slow release drug delivery systems or eye
drops (56). This presents a potential advantage over Avastin®, which is currently administered
through intravitreal injection. Multiple treatments of anti-angiogenic drugs are required and, as
one can imagine, the advantages of a less invasive mode of drug administration would be great.
In addition to this practical advantage, a locally-administered RTKI drug would likely bypass
many of the common complications associated with anti-angiogenic drug therapy. First of all,
local drug administration will probably decrease the development of systemic side effects and
hopefully result in only the desired therapeutic effects of the drug. More importantly, drug
resistance is less likely to develop when using a RTKI for the treatment of AMD, as the believed
mechanisms by which resistance can develop are based on the abilities of cancerous cells to
mutate and circumvent some of the pathways inhibited by the anti-angiogenic drug therapy. It is
believed that because the vasculature being treated here is genetically stable, these
mechanisms of resistance will not be available, and drug resistance will not develop.
It is also possible that by targeting a new pathway additional benefits or increased efficiencies
may be seen which was not predicted. Targeting RTKIs opens up the possibility for new
64
combination therapies which have not previously been available. The use of multiple RTKIs or
the combination of a RTKI with a VEGF-targeting molecule could provide additional benefits and
synergistic effects not foreseen. In addition to additional therapeutic benefits from combination
therapies, however, there is also the risk that combining anti-angiogenic drugs could result in
unforeseen side effects and complications. Local administration of anti-angiogenic drugs can
also improve the effectiveness of PDT, as drug application prior to PDT results in vascular
normalization, increasing the availability of both PSs and oxygen in the blood vessels during
treatment, improving the efficiency of PDT (142).
The results of this research showed that both of the drugs tested were able to inhibit physiologic
and PDT-induced angiogenesis. In both situations, Avastin® appeared to be a slightly more
effective inhibitor of angiogenesis than Sutent®, but statistical analysis of the data revealed that
these differences were not significant. In the physiological angiogenic state, Avastin® appeared
to reach a saturation point which was not seen for Sutent®. This saturation was most likely due
to the fact that Avastin® is a large molecule which has a limited ability to penetrate blood vessels
to bind and neutralize VEGF, while Sutent® concentration can be increased until it completely
floods cells blocking nearly all of its target RTK pathways. The therapeutic relevance of this
result, however, is not very significant due to the fact that concentrations higher than this
saturation point (or concentrations of Sutent® needed to completely inhibit blood vessel growth)
are much greater than any concentration which would be used in a clinical setting.
It should be noted that it is difficult to make direct comparisons between the two drugs being
examined in this study. This is due to the fact that the drugs have drastically different molecular
weights (Avastin® is three orders of magnitude larger than Sutent®), have different properties
and bioavailabilities, and the fact that they target different. In this study, the drug molarity is
predominantly used to indicate doses applied the CAM; however this can be misleading as a
relatively high molarity of Sutent® still represents a relatively small dose in terms of μg of drug
administered embryo when compared to the dose given in μg of even very low molarities of
Avastin®. For this reason, all effective doses are provided in molarity and in terms of μg per
embryo.
The ED50 for Avastin® and Sutent® to inhibit the developmental angiogenic CAM was seen when
20 μl of 45 or 200 μM drug were applied to the CAM topically each day for two days,
respectively, which corresponds to 134 and 2.1 μg/embryo/day. In clinical treatment of cancer,
Avastin® is applied in an intravenous dose of 1 to 10 mg/kg which corresponds to 20 μl of 3.4 to
65
33.6 μM applied to the CAM. Sutent® is administered orally in a dose of 12.5, 25 or 50 mg per
day. Taking the middle dose (25mg) and assuming an average mass of 70 kg for a person, this
dose corresponds to 0.357 mg/kg which corresponds to 20 μl of 335 μM Sutent® applied to the
CAM. Therefore, the ED50 of Avastin® needed to inhibit the naturally-developing CAM
vasculature is slightly higher than what is clinically used (45 instead of 33.6 μM) and the Sutent®
needed is lower than the clinical doses (200 instead of 335 μM).
The estimated ED50 for Avastin® and Sutent® to inhibit the PDT-induced angiogenic state on the
CAM was seen when 20 μl of 7 or 17 μM drug were applied to the CAM topically each day for
two days, respectively, corresponding to 20.9 and 0.18 μg/embryo/day. The effective dose of
Avastin® fell within the clinically-used range of doses while the effective dose of Sutent® was
approximately 20 times lower than the clinically-used dose for cancer therapy.
In addition to determining the effective concentration of each drug to inhibit the physiologic and
PDT-induced angiogenic states, this research allows for a fundamental comparison of these two
angiogenic states to be made. A notable result is the fact that inhibition of the PDT-induced
angiogenic state was achieved at a much lower concentrations than inhibition of the
physiologically angiogenic CAM. Inhibition of the PDT-induced angiogenic state occurred at a
concentration approximately 2-3 fold lower than the developmental CAM for Avastin® and 4-fold
for Sutent®. This result could reflect fundamental differences between the angiogenic states and
the pathways they activate in order to achieve their desired biological responses. It may be the
case that PDT-induced angiogenesis only activates specific pathways associated with the
vascular damage done by PDT. For example, PDT induces hypoxia through vascular occlusion,
resulting in the activation of HIF and the release of VEGF. One could speculate that while
physiologic angiogenesis is a result of the activation of many closely regulated angiogenic
pathways (such as VEGF, angiopoietins, EGF, PDGF or PIGF (143)), PDT-induced
angiogenesis may be mainly a result of one or a few pathways activated due to hypoxia,
inflammation and cell damage (143). Morphological characteristics of the vasculature which
regrows after PDT damage also appear to support the hypothesis that this form of angiogenesis
may be mainly VEGF-driven. This vasculature is abnormally tortuous and disorganized, having
characteristics similar to tumor vasculature, which is known to be mainly VEGF-driven (142).
The estimated ED30 for topically and intravenous applied Sutent® was seen when 20 μl of 2 and
38 μM drug were applied each day for two days, respectively, corresponding to 0.02 and 0.4
μg/embryo/day, respectively. Again doses are much lower than what is clinically used for cancer
66
treatment and would remain lower even if it were possible to calculate the ED50 for this
parameter.
The method of direct topical drug application was selected because it most closely reflects
topical drug application via droplet to the eye, or application through a slow release drug
delivery system, which are the primary models being investigated by this research. Intravenous
drug application, however, was also performed for low and high concentrations of Sutent® in
order to obtain more information about the activity of the drug and determine the relationship
between these modes of drug administration. The results of these experiments showed that
topical Sutent® application results in stronger inhibitions than intravenous application. This result
can be explained by the fact that Sutent® is a small molecule drug, which when applied locally
and topically has no problems entering cells to have its desired effect. By administering Sutent®
systemically through intravenous injection, the drug concentration is effectively diluted by the
volume of blood in the system and the concentration of drug reaching the desired area is
reduced. This characteristic of Sutent® may also explain why effective angiogenesis-inhibiting
doses could be achieved at lower concentrations than those used in the clinical treatment of
cancer, which is also achieved through systemic administration. This result strongly supports
the hypothesis that local application of Sutent® in the form of eye drops or slow-release drug
delivery systems could provide an effective form of treatment for the choroidal neovessels which
develop in age-related macular degeneration.
The preliminary results obtained with Avastin® show stronger inhibition of angiogenesis when
this drug is administered intravenously as compared to topical application (data unshown). This
result could be explained by the fact that Avastin® is a large molecule, which can enter in direct
contact with VEGF when injected into the blood, allowing it to have a stronger effect than when
it must pass into blood vessels due to being topically applied.
In addition, a recent study conducted in this laboratory (The Medical Photonics Group) was
done to compare the effects of three different RTKIs, including Sutent®, with Avastin® in
inhibiting developmental angiogenesis and vascular regrowth following PDT-induced vascular
occlusion. This study showed Sutent® to have similar effectiveness as one of the RTKIs
(erlotinib) and to be less effective than the other RTKI (sorafenib). In addition, morphological
characteristics of regrown vasculature varied not only between Avastin® and the RTKIs, but
between the different RTKIs as well. This indicates that different pathways are being inhibited by
the different RTKIs, and that inhibition of different pathways results in angiogenesis achieved
67
through different mechanisms which is reflected in the structure and morphology of regrown
vessels (143). These results further support the potential of using RTKIs in the treatment of
angiogenic disorders.
Finally, it should be noted that it is complicated to translate the concentrations or doses applied
to the CAM into doses administered in clinical applications. This is due to the following
difficulties. The method of drug administration in clinical applications varies with the methods
used in the research protocol (oral administration for Sutent® and intravenous administration for
Avastin®), which results in different absorption and bioavailability of the drugs. There is
effectively an overall lack of information concerning serum and blood concentrations of drugs,
and there are important difficulties in translating results between a chicken and human. The two
drugs examined are targeted to human VEGF and human RTKs. It can be seen that these
drugs have an affinity for the chicken counterpart of their target molecule (by the fact that they
have anti-angiogenic effects), but it is impossible to determine how a decrease in affinity can
change the effectiveness of these drugs. This model and this research, therefore, are not being
used to determine exact effective concentrations or to make a direct translation to clinical
application, but instead serve to determine general trends and interactions of molecules and
drugs in order to determine if these therapies are viable treatment options which should be
investigated in more depth.
Experiments testing the effectiveness of the inhibition of physiologic and PDT-induced
angiogenic states on the CAM showed that both the drugs tested were capable of inhibiting
angiogenesis in comparison to the control condition and, more importantly, that there was no
statistically significant difference between the activity of the two drugs. The results of this
research support the theory that a small-molecule receptor tyrosine kinase inhibitor, such as
Sutent®, is capable of inhibiting PDT-induced angiogenesis and that molecules such as this one
could provide effective anti-angiogenic properties in the treatment of angiogenic disorders such
as age-related macular degeneration and cancer. In addition, topically applied Sutent® was
seen to be a more effective inhibitor of the PDT-induced angiogenesis than intravenously
administered Sutent®, supporting the theory that a locally-applied receptor tyrosine kinase
inhibitor could be used in the treatment of age-related macular degeneration.
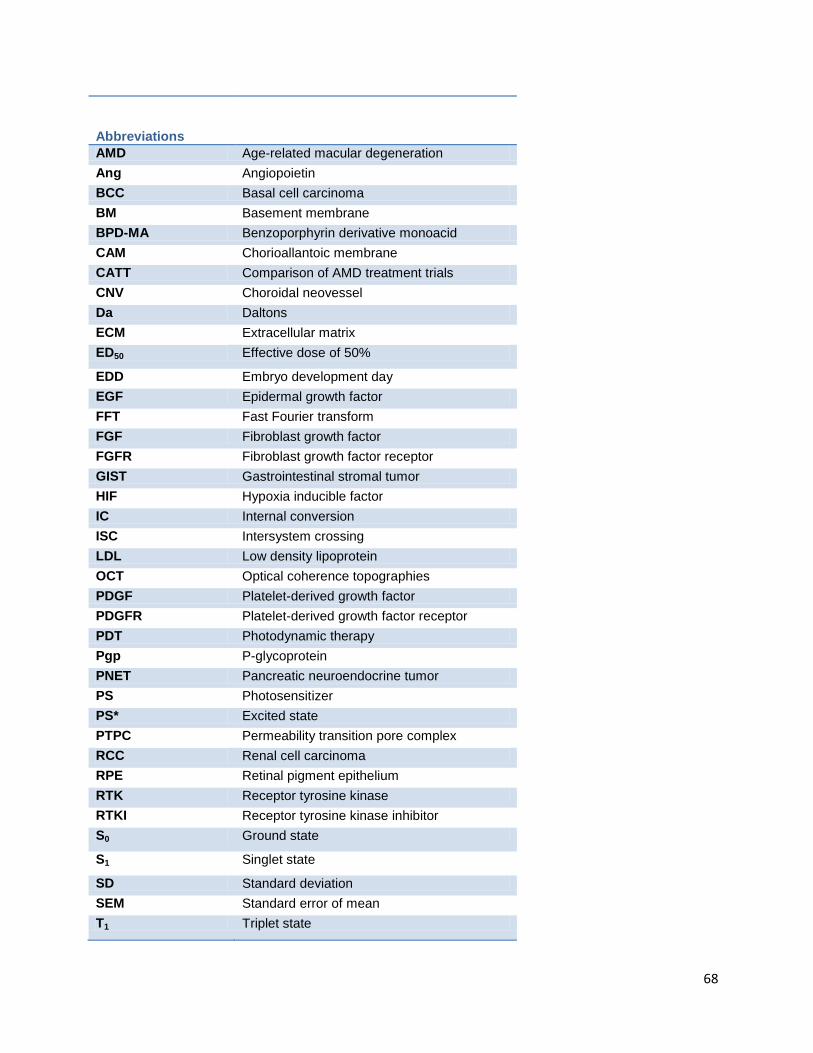
68
Abbreviations
AMD Age-related macular degeneration
Ang Angiopoietin
BCC Basal cell carcinoma
BM Basement membrane
BPD-MA Benzoporphyrin derivative monoacid
CAM Chorioallantoic membrane
CATT Comparison of AMD treatment trials
CNV Choroidal neovessel
Da Daltons
ECM Extracellular matrix
ED50 Effective dose of 50%
EDD Embryo development day
EGF Epidermal growth factor
FFT Fast Fourier transform
FGF Fibroblast growth factor
FGFR Fibroblast growth factor receptor
GIST Gastrointestinal stromal tumor
HIF Hypoxia inducible factor
IC Internal conversion
ISC Intersystem crossing
LDL Low density lipoprotein
OCT Optical coherence topographies
PDGF Platelet-derived growth factor
PDGFR Platelet-derived growth factor receptor
PDT Photodynamic therapy
Pgp P-glycoprotein
PNET Pancreatic neuroendocrine tumor
PS Photosensitizer
PS* Excited state
PTPC Permeability transition pore complex
RCC Renal cell carcinoma
RPE Retinal pigment epithelium
RTK Receptor tyrosine kinase
RTKI Receptor tyrosine kinase inhibitor
S0 Ground state
S1 Singlet state
SD Standard deviation
SEM Standard error of mean
T1 Triplet state
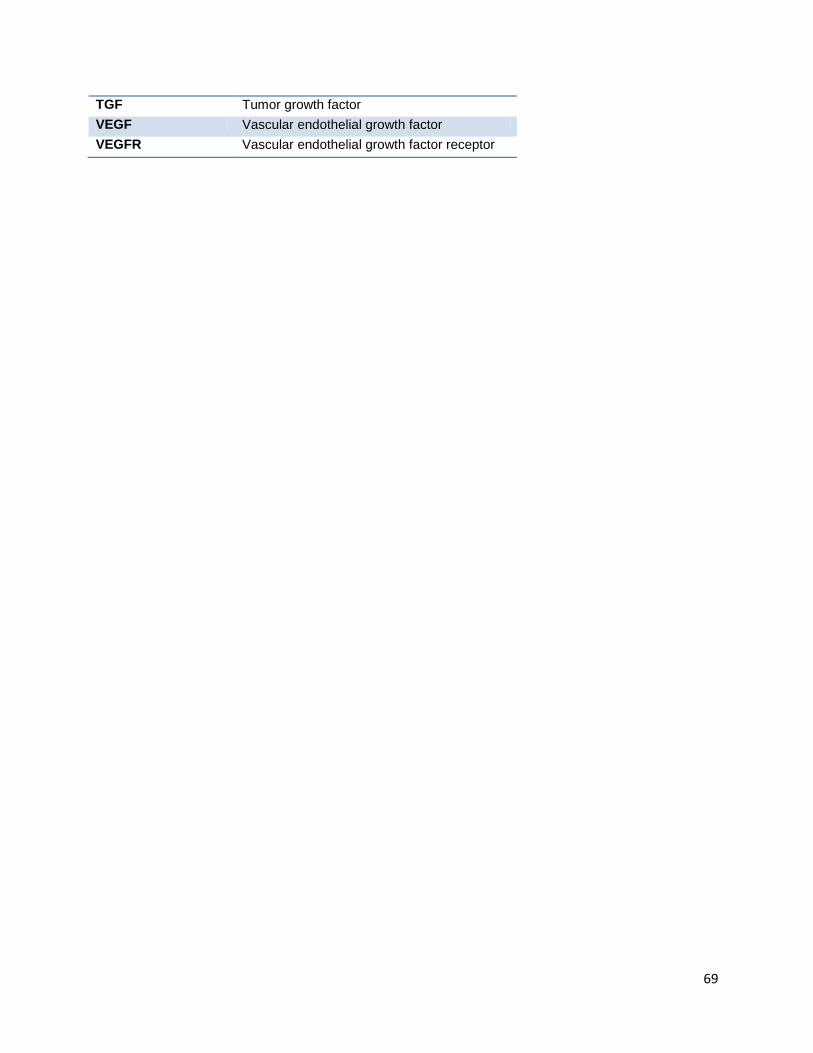
69
TGF Tumor growth factor
VEGF Vascular endothelial growth factor
VEGFR Vascular endothelial growth factor receptor
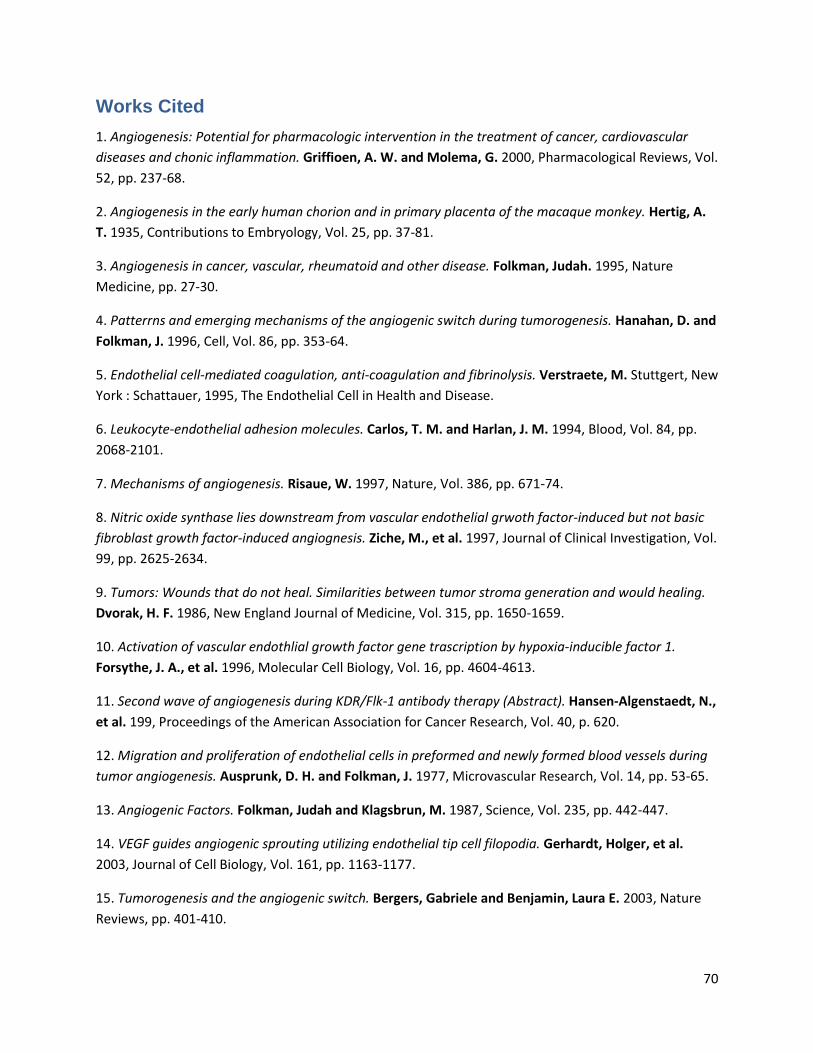
70
Works Cited
1. Angiogenesis: Potential for pharmacologic intervention in the treatment of cancer, cardiovascular
diseases and chonic inflammation. Griffioen, A. W. and Molema, G. 2000, Pharmacological Reviews, Vol.
52, pp. 237-68.
2. Angiogenesis in the early human chorion and in primary placenta of the macaque monkey. Hertig, A.
T. 1935, Contributions to Embryology, Vol. 25, pp. 37-81.
3. Angiogenesis in cancer, vascular, rheumatoid and other disease. Folkman, Judah. 1995, Nature
Medicine, pp. 27-30.
4. Patterrns and emerging mechanisms of the angiogenic switch during tumorogenesis. Hanahan, D. and
Folkman, J. 1996, Cell, Vol. 86, pp. 353-64.
5. Endothelial cell-mediated coagulation, anti-coagulation and fibrinolysis. Verstraete, M. Stuttgert, New
York : Schattauer, 1995, The Endothelial Cell in Health and Disease.
6. Leukocyte-endothelial adhesion molecules. Carlos, T. M. and Harlan, J. M. 1994, Blood, Vol. 84, pp.
2068-2101.
7. Mechanisms of angiogenesis. Risaue, W. 1997, Nature, Vol. 386, pp. 671-74.
8. Nitric oxide synthase lies downstream from vascular endothelial grwoth factor-induced but not basic
fibroblast growth factor-induced angiognesis. Ziche, M., et al. 1997, Journal of Clinical Investigation, Vol.
99, pp. 2625-2634.
9. Tumors: Wounds that do not heal. Similarities between tumor stroma generation and would healing.
Dvorak, H. F. 1986, New England Journal of Medicine, Vol. 315, pp. 1650-1659.
10. Activation of vascular endothlial growth factor gene trascription by hypoxia-inducible factor 1.
Forsythe, J. A., et al. 1996, Molecular Cell Biology, Vol. 16, pp. 4604-4613.
11. Second wave of angiogenesis during KDR/Flk-1 antibody therapy (Abstract). Hansen-Algenstaedt, N.,
et al. 199, Proceedings of the American Association for Cancer Research, Vol. 40, p. 620.
12. Migration and proliferation of endothelial cells in preformed and newly formed blood vessels during
tumor angiogenesis. Ausprunk, D. H. and Folkman, J. 1977, Microvascular Research, Vol. 14, pp. 53-65.
13. Angiogenic Factors. Folkman, Judah and Klagsbrun, M. 1987, Science, Vol. 235, pp. 442-447.
14. VEGF guides angiogenic sprouting utilizing endothelial tip cell filopodia. Gerhardt, Holger, et al.
2003, Journal of Cell Biology, Vol. 161, pp. 1163-1177.
15. Tumorogenesis and the angiogenic switch. Bergers, Gabriele and Benjamin, Laura E. 2003, Nature
Reviews, pp. 401-410.
71
16. Anti-angiogenic tyrosine kinase inhibitors: what is their mechanism of action. Gotink, K. J. and
Verheul, H. M. 2010, Angiogensis, pp. 1-14.
17. Induction of a fibrin-gel investment: an early event in line 10 hepatocarcinoma growth mediated by
tumor-secreted products. Dvorak, H. F., et al. 1979, Journal of Immunology, Vol. 122, pp. 166-74.
18. Vascular permeability factor/ vascular endothelial growth factor, microvascular hyperpermeability,
and angiogenesis. Dvorak, H. F., et al. 1995, American Journal of Pathology, Vol. 146, pp. 1029-39.
19. The biology of vascular endothlial growth factor. Ferrara, N. and Davis-Smyth, T. 1997, Endocrine
Review, Vol. 18, pp. 4-25.
20. Selective ablation of immature blood vessels in established human tumors follows vascular
endothelial growth factor withdrawal. Benjamin, L. E., et al. 1999, Journal of Clinical Investivation, Vol.
103, pp. 159-65.
21. Vascular permeability factor/vascular endothelial growth factor (VPF/VEGF) delays and induces
escape from senescence in human dermal microvascular endothelial cells. Watanabe, Y., et al. 1997,
Oncology, Vol. 14, pp. 2025-32.
22. Therapy targeted at vascular endothelial growth factor in metastatic renal cell carcinoma: biology,
clinical results and future developments. Rini, B. I., et al. 2005, British Journal of Urology International,
Vol. 96, pp. 286-90.
23. Evading tumor evasion: Current concepts and perspectives of anti-angiogenic cancer therapy.
Abdollahi, Amir and Folkman, Judah. 2010, Drug Resistance Updates, pp. 16-28.
24. Role of vascular endothelial growth factor in the regulation of angiogenesis. Ferrara, N. 2001,
American Journal of Cell Physiology, Vol. 280, pp. C1358-C1366.
25. Vascular endothelial growth factor: Basic biology and clinical implications. Ferrara, N. and Keyt, B.
1997, EXS, Vol. 79, pp. 209-232.
26. VEGF prevents apoptosis of human microvascular endothelial cells via opposing effects on MAPK/ERK
and SAPK/JNK signaling. Gupta, K., et al. 1999, Experimental Cell Research, Vol. 247, pp. 495-504.
27. Targeting VEGF ligands and receptors in cancer. Malik, A. K. and Gerberu, H. P. 2003, Targets, Vol. 2,
pp. 48-57.
28. Vascular permeability factor/vascular endothlial growth factor: A multi-functional angiogenic
cytokine. Brown, L. F., et al. 1997, EXS, Vol. 79, pp. 233-269.
29. The chick embryo chorioallantoic membrane as a model system for the study of tumor angiogenesis,
invasion and development of anti-angiogenic agents. Tufan, A. C. and Satiroglu-Tufan, N. L. 2005,
Current Cancer Drug Targets, Vol. 5, pp. 249-266.
72
30. Integrins: Structure, function and biological properties. Cheresh, D. A. 1993, Advanced Molecular Cell
Biology, Vol. 6, pp. 225-252.
31. Requirements of vascular integrin αvβ3 for angiogenesis. Brooks, P. C. et al. 1994, Science, Vol. 264,
pp. 569-571.
32. Hallmarks of cancer: the next generation. Hanahan, D. and Weinberg, R. A. 2011, Cell, Vol. 144, pp.
646-74.
33. Cell signaling by receptor tyrosine kinases. Schlessinger, J. 2000, Cell, Vol. 103, pp. 211-225.
34. Specificity in signal transduction: from phosphotyrosine-SH2 domain interactions to complex cellular
systems. Pawson, T. 2004, Cell, Vol. 116, pp. 191-203.
35. Age-related macular degeneration. Fine, S. L., et al. 2000, New England Journal of Medicine, Vol.
342, pp. 483-492.
36. Age-related macular degeneration (AMD): patholgenesis and therapy. Nowak, J. Z. 2006,
Pharmacological Reports, Vol. 58, pp. 353-363.
37. Disease. DeCleene Optometry inc. Eyecare for Life(TM). [Online] 2009. [Cited: 06 2011, 03.]
http://www.decleeneoptometry.com/pages/diseases.htm.
38. Anatomy. St. Luke's Cataract and Laser Institute. [Online] 2010. [Cited: 06 08, 2011.]
http://www.stlukeseye.com/anatomy/choroid.html.
39. Combination therapy using verteporfin and ranibizumab; optimizing the timing in the CAM model.
Debefve, E., et al. 2009, Photochemistry and Photobiology.
40. Photodynamic therapy: basic principles and mechanisms. Van den Bergh, Hubert and Ballini, Jean-
Pierre. 2003, Lasers in Ophthalmology - Basic, Diagnostic, and Surgical Aspects, pp. 183-195.
41. Fish oil can halt Age-Related Macular Degeneration, a prominent eye disease for the elderly. Fish Oil
Blog. [Online] 2011. [Cited: 06 2011, 03.] http://www.fishoilblog.com/fish-oil-treatment-age-related-
macular-degeneration-blindness.php.
42. Macular degeneration treatment. Haddrill, Marilyn. All About Vision. [Online] July 2010. [Cited: April
11, 2011.] http://www.allaboutvision.com/conditions/amd-treatments.htm.
43. Synergies of VEGF inhibition and photodynamic therapy in the treatment of age-related macular
degeneration. Zuluaga, M-F., et al. 2007, Investigative Opthalmology and Visual Science, Vol. 48, pp.
1767-1772.
44. Wet age-related macular degeneration. Kulkarni, A. D. and Kuppermann, B. D. 2005, Advanced Drug
Delivery Review, Vol. 57, pp. 1994-2009.
73
45. Managment of neovascular age-related macular degeneration. Schmidt-Erfurth, U. M. and Pruente,
C. 2007, Progess in Retinal and Eye Research, Vol. 26, pp. 437-451.
46. Guidance for the treatment of neovascular age-related macular degeneration. Schmidt-Erfurth, U.
M., et al. 2007, Acta Opthalmol. Scand., Vol. 85, pp. 486-94.
47. FDA News Release: FDA approves new biologic treatment for wet age-related macular degeneration.
FDA, U. S. Food and Drug Administration. [Online] 06 30, 2006. [Cited: 06 14, 2011.]
http://www.fda.gov/NewsEvents/Newsroom/PressAnnouncements/2006/ucm108685.htm.
48. FDA News Release: FDA approves new drug treatment for age-related macular degeneration. FDA, U.
S. Food and Drug Administration. [Online] 12 20, 2004. [Cited: 06 14, 2011.]
http://www.fda.gov/NewsEvents/Newsroom/PressAnnouncements/2004/ucm108385.htm.
49. Anecortave acetate for the treatment of subfoveal choroidal neovascularization secondary to age-
realted macular degeneration. Schmidt-Erfurth, U., et al. 2005, European Journal of Ophthalmology,
Vol. 15, pp. 482-485.
50. Intravitreal triamcinolone acetonide for treatment of intraocular proliferative, exudative and
neovascular diseases. Jonas, J. B., et al. 2005, Progress in Retinal and Eye Research, Vol. 24, pp. 587-611.
51. Antiangiogenic steroids in human cancer therapy. Petras, R. J. and Weinberg, O. K. 2005, Evidence
Based Complementary and Alternative Medicine, Vol. 2, pp. 49-57.
52. Supression of ocular neovascularization with siRNA targeting VEGF Receptor1. Shen, J., et al. 2006,
Gene Therapy, Vol. 13, pp. 225-234.
53. VEGF-TRAP (R1R2) suppresses choroidal neovascularization and VEGF-induced breakdown of the
blood retinal barrier. Saishin, Y., et al. 2003, Journal of Cell Physiology, Vol. 195, pp. 241-248.
54. Adenoviral vector-delivered pigment epithelium-derived factor for neo-vascular age-related macular
degeneration: results of phase I clinical tiral. Campochiaro, P. A., et al. 2006, Human Gene Therapy, Vol.
17, pp. 167-176.
55. Dramatic inhibition of retinal and choroidal neovascularization by oral administration of a kinase
inhibitor. Seo, M. S., et al. 1999, American Journal of Pathology, Vol. 154, pp. 1743-1753.
56. Intraocular sustained drug delivery using implantable polymeric devices. Yasukawa, T., et al. 2005,
Advanced Drug Delivery Reviews, Vol. 57, pp. 2034-2046.
57. Ocular drug delivery: conventional ocular formulations. Lang, L. C. 1995, Advanced drug delivery
review, Vol. 16, pp. 39-43.
58. Intravitreal administration of antisense oligonucleotides: potential of liposomal delivery. Bochot, A.,
et al. 2000, Pregressive Retinal Eye Research, Vol. 19, pp. 131-147.
74
59. FDA drug approval summary: bevacizumab plus FOLFOX4 as second-line treatment of colorectal
cancer. Cohen, M. H., et al. 2007, The Oncologist, Vol. 12, pp. 356-361.
60. Bevacizumab versus ranibizumab - the verdict. Rosenfeld, Philip J. Massachusetts Medical Society.
s.l. : New England Journal of Medicine, 2011.
61. Quand est-il du Lucentis (ranibizumab)? Lambert, Vincent. Experimental Ophthalmology Laboratory
of Liege, University of Liège. [Online] March 2009. [Cited: 05 06, 2011.]
http://www.ophtalmo.ulg.ac.be/lucentis.html.
62. Predicted biological activity of intravitreal bevacizumab. Stewart, M. W. 2007, Retina, Vol. 27, pp.
1196-200.
63. Ranibizumab and bevacizumab for neovascular age-related macular degeneration. CATT Research
Group, The. 2011, New England Journal of Medicine, p. DOI:10.1056/NEJMoa1102673.
64. New treatments in age-related macular degeneration. Hooper, C. Y. and Guymer, R. H. 2003, Clinical
Experimental Opthalmology, Vol. 31, pp. 376-391.
65. Visudyne (verteporfin for injection), Rx only, Perscribing Information. Novartis. East Hanover, New
Jersey : Novartis Pharmaceuticals Corporation, 2007.
66. Photodynamic therapy of subfoveal choroidal neovascularization in age-related macular
degeneration with verteporfin: two-year results of 2 randomized clinical trials-tap report 2. Bressler, N.
M. and TAP, Treatment of Age Related Macular Degeneration with Photodynamic Therapy Study
Group. 2001, Archives of Opthalmalogy, Vol. 119, pp. 198-207.
67. Tumor angiogenesis: thereapeutic implications. Folkman, Judah. 1971, New England Journal of
Medicine, pp. 1182-1186.
68. Growth and metastasis of tumors in organ culture. Folkman, J., et al. 1963, Cancer, p. 16.
69. Tumor angiogenesis: Transfilter diffusion studies in the hamster by the transparent chamber
technique. Greenblatt, M. and Shubik, P. 1968, Journal National Cancer Insititute, Vol. 41, pp. 111-124.
70. The hallmarks of cancer. Hanahan, D, Weinberg, R. A. 2000, Cell, pp. 57-70.
71. Modes of resistance to anti-angoigenic therapy. Bergers, Gabriele and Hanahan, Douglas. 2008, Nat
Rev Cancer, pp. 592-603.
72. Evaluation of metastatic and angiogenic potentials of human colon carcinoma cells in chicken
embryo model systems. Subauste, M. C., et al. 2009, Clinical and Experimental Metastasis, Vol. 26, pp.
1033-1047.
73. Soluble vascular endothelial growth factor levels in patients with primary colorectal carcinoma.
Werther, K., et al. 7, 2000, European Journal of Surgical Oncology, Vol. 26, pp. 657-662.
75
74. Elevated perioperative serum vascular endothelial growth factor levels in patients with colon
carcinoma. De Vita, F., et al. 2004, Cancer, Vol. 100, pp. 270-278.
75. Sunitinib malate for the treatment of metastatic renal cell carcinoma and gastrointestinal stromal
tumors. Adams, V. R. and Leggas, M. 2007, Clinical Therapeutics, Vol. 29, pp. 1338-1354.
76. The Jackson Cancer Modeling Group. Quantitative Cancer Research. [Online] 2011. [Cited: 06 13,
2011.] http://www.math.lsa.umich.edu/~tjacks/research.html.
77. Abnormalities in pericytes on blood vessels and endothelial sprouts in tumors. Morikawa, L. E and al.,
et. 2002, American Journal of Patholgy, Vol. 160, pp. 985-1000.
78. Targeting vessels to treat hepatocellular carcinoma. Romanque, P., et al. 2008, Clinical Science, Vol.
114, pp. 467-477.
79. Targeting non-malignant disorders with tyrosine kinase inhibitors. Grimminger, F., et al. 2010,
Nature, Vol. 9, pp. 956-970.
80. Understanding the causes of multidrug resistance in cancer: a comparison of doxorubicin and
sunitinib. Broxterman, H. J, et al. 2009, Drug Resistance Updates, Vol. 12, pp. 114-126.
81. Uptake and retention of duanomycin by leukemic cellls as factors in drug response. Kessel, D., et al.
1968, Cancer Research, Vol. 28, pp. 938-941.
82. Anti-angiogenic therapeutic drugs for treatment of human cancer. Wu, H.-C., et al. 2008, Journal of
Cancer Molecules, Vol. 4, pp. 37-45.
83. Antiangiogenic therapy elicits malignant progression of tumors to increased local invasion and
distant metastasis. Paez-Ribes, M., et al. 2009, Cancer Cell, pp. 220-231.
84. Accelerated metastasis after short-term treatment with a potent inhibitor of tumor angiogenesis.
Ebos, J. M., et al. 2009, Cancer Cell, Vol. 15, pp. 232-239.
85. Multiple circulating proangiogenic factors induced by sunitinib malate are tumor-independent and
correlate with antitumor efficacy. Ebos, J. M., et al. 2007, Proceedings of the National Academy of
Sciences, Vol. 104, pp. 17069–17074.
86. VEGF-targeted therapy: mechansims of anti-tumor activity. Ellis, L.M. and Hicklin, D.J. 2008, Nature
Reviews Cancer, Vol. 8, pp. 579-591.
87. Seminars in Medicine of the Beth Israel Hostpital, Boston. Clinical applications of research on
angiogenesis. Folkman, Judah. 1995, New England Journal fo Medicine, Vol. 333, pp. 273-286.
88. Bevacizumab, CCO Formulary. Roche. s.l. : Roche, 2010.
76
89. Avastin versus Lucentis: Why it matters. Kaufman, S. R, et al. Medical Research Modernization
Committee. [Online] 12 11, 2006. [Cited: 05 11, 2011.]
http://www.mrmcmed.org/AvastinversusLucentis.pdf.
90. Normalization of tumor vascularture: an emerging concept in antiangiogenic therapy. Jain, R. K.
2005, Science, Vol. 307, pp. 58-62.
91. Health Canada endorsed important safety information on Avastin (bevacizumab). HealthCanada.
December 16, 2008.
92. Genetic heterogeneity of the vasculogenic phenotype parrallels angiogenesis; implications for cellular
surrogate marker analusis of antiangiogenesis. Shaked, Y., et al. 2005, Cancer Cell, Vol. 7, pp. 101-111.
93. Antiangiogenic therapy in lung cancer: focus on vascular endothelial growth factor pathway.
Korpanty, G., et al. 2010, Experimental Biology and Medicine, Vol. 235, pp. 3-9.
94. A randomized trial of Bevacizumab, an anti-vascular endothelial growth factor antibody for
metastatic renal cancer. Yang, J. C., et al. 2003, New England Journal of Medicine, Vol. 349, pp. 427-34.
95. Activity of SU11248, a multitargeted inhibitor of vasular endothelial growth factor receptor and
platelet-derived growth factor receptor, in patients with renal cell carcinoma. Motzer, R. J., et al. 2006,
Journal of Clinical Oncology, Vol. 24, pp. 16-24.
96. Vessel fractions in tumor xenografts depicted by flow- or contrast-sensitive three- dimensional high
frequency doppler ultrasound respond differently to antiangiogenic treatment. Palmowski, M., et al.
2008, Cancer Research, Vol. 67, pp. 7042-7049.
97. Safety, pharmacokinetic and antitumor activity of SU11248, a novel oral multitarget tyrosine kinase
inhibitor, in patients with cancer. Faivre, S., et al. 2006, Journal of Clinical Oncology, Vol. 24, pp. 24-35.
98. In vivo antitumor activity of SU11248, a novel tyrosine kinase inhibitor targeting vascular endothelial
growth factor and platelet derived growth factor receptors: determination of a pharmacokinetic/
pharmodynamic relationship. Mendel, D. B., et al. 2003, Clinical Cancer Research, Vol. 13, pp. 327-37.
99. Development and validation of an HPLC-UV-visible method for sunitinib quantification in human
plasma. Blanchet, Benoit, et al. 2009, Clinical Chimica Acta, Vol. 404, pp. 134-39.
100. Approval summary: sunitinib for the treatment of imatinib refractory or intolerant gastrointestinal
stromal tumors and advanced renal cell carcinoma. Goodman, V. L., et al. 2007, Clinical Cancer
Research, Vol. 13, pp. 1367-1373.
101. Food and Drug Administration drug approval summary: sunitinib malate for the treatment of
gastrointestinal stromal tumor and advanced renal cell carcinoma. Rock, E. P., et al. 2007, Oncologist,
Vol. 12, pp. 107-113.
77
102. Pfizer Scores New Approval for Sutent in Europe. Genetic Engineering and Biotechnology News,
GEN. Genetic Engineering and Biotechnology News, GEN. [Online] December 2, 2010. [Cited: March 24,
2011.] http://www.genengnews.com/gen-news-highlights/pfizer-scores-new-approval-for-sutent-in-
europe/81244326/.
103. Overall survival and updated results from sunitinib compared with interferon alpha in metastatic
renal-cell carcinoma. Motzer, R. J., et al. 2009, Journal of Clinical Oncology, Vol. 27, pp. 3584-3590.
104. Quantification of sunitinib in human plasma by high performance liquid chromatography-tandem
mass spectrometry. Minkin, P., et al. 2008, Journal Chromatography Biology, Vol. 15, pp. 84-88.
105. Ligand-dependent platelet-derived growth factor receptor (PDGFR)-alpha activation sensitizes rare
lung cancer and sarcoma cells to PDGFR kinase inhibitors. McDermott, U., et al. 2009, Cancer Research,
Vol. 69, pp. 3937-3946.
106. Drug Discovery and Development. The Van Andel Research Institute. VARI Scientists Turn Off
Resistance to Sunitinib. [Online] 04 02, 2010. [Cited: 05 06, 2011.] http://www.dddmag.com/news-VARI-
Scientists-Turn-Off-Resistance-to-Sunitinib-3210.aspx.
107. The history of photodetection and photodynamic therapy. Ackroyd, Roger, et al. 2001,
Photochemistry and Photobiology, Vol. 74, pp. 656-669.
108. Photodynamic thearpy in the treatment of head and nech neoplasia. Biel, M. A. 1998,
Laryngoscope, Vol. 108, pp. 1259-1268.
109. A phase II/III study of tin ethyl etiopurpurin (Purlytin)-induced photodynamic therapy for the
treatment of recurrent cutaneous metastatic breast cancer. Mang, T. S., et al. 1998, Cancer Journal for
Scienctific America, Vol. 4, pp. 378-384.
110. Photodynamic therapy of brain tumors. Propovic, E. A., et al. 1996, Journal of Clinical Laser Medical
Surgery, Vol. 14, pp. 251-261.
111. Photomedical approaches for the diagnosis and treatment of gynocoologic cancers. Hornung, R.
2001, Current Drug Targets Immune Endocrine Metabolism Disorders, Vol. 2001, pp. 165-177.
112. Results of combined photodynamic therapy (PDT) and high dose rate brachytherapy (HDR) in
treatment of obstructive endobronchial non-small cell lung cancer (NSCLC). Weinberg, B. D., et al. 2010,
Photodyagnosis and Photodynamic therapy, Vol. 7, pp. 50-58.
113. Differential cytotoxic responses to low- and high-dose photodynamic therapy in human gastric and
bladder cancer cells. Yoo, J. O. 2011, Journal of Cell Biochemistry.
114. Guidelines on the use of phtotdynamic therapy for non-melanoma skin cancer: an international
consensus. Braathen, L. R., et al. s.l. : Journal of American Academic Dermatology, 2005. International
Society for Photodynamic therapy in Dermatology. Vol. 56, pp. 125-43.
78
115. Photodynamic Therapy for Cancer. National Cancer Institute. National Cancer Institute at the
National Institutes of Health. [Online] 12 05, 2004. [Cited: 05 23 , 2011.]
http://www.cancer.gov/cancertopics/factsheet/Therapy/photodynamic.
116. Phtotdynamic therapy: a review of the literature and documentation. Issa, M. C. A. 2010, Anais
Brasileiros de Dermatologia, Vol. 85, pp. 501-511.
117. Photodynamic therapy for cancer. Dolmans, D., et al. 2003, Nature.
118. Visudyne therapy – a selective approach. EPG online. [Online] 2011. [Cited: 05 06, 2011.]
http://www.epgonline.org/warning.cfm?path=www.epgonline.org~page.cfm~pageid~789.
119. Definition of Jablonski diagram. Chemicool. [Online] May 2011. [Cited: 05 12, 2011.]
http://www.chemicool.com/definition/jablonski_diagram.html.
120. Scientific Discussion for Approval of Visudyne. EMEA. EMEA. [Online] 12 01, 2003. [Cited: 05 10,
2011.] http://www.ema.europa.eu/docs/en_GB/document_library/EPAR_-
_Scientific_Discussion/human/000305/WC500052403.pdf.
121. Photodynamic therapy-mediated oxidative streess can induce expression of heat shock proteins.
Gomer, C. J., et al. 1996, Cancer Research, Vol. 56, pp. 2355-2360.
122. The role of apoptosis in response to photodynamic therapy: what, where, why and how. Oleinick, N.
L., et al. 2002, Photochemical Photobiology, Vol. 1, pp. 1-21.
123. Apoptosis-based therapies. Reed, J. C. 2002, Naturee Review Drug Discovery, Vol. 1, pp. 111-121.
124. TRAIL-induced apoptosis requires Bax-dependent mitochondrial release of Smac/DIABLO. Deng, Y.
and al, et. 2002, Genes Development, Vol. 16, pp. 33-45.
125. Spectroscopic properties and photodynamic effects of new lipophilic porphyrin derivatives: efficacy,
localisation and cell death pathways. Kramer-Marek, G. 2006, Journal of Photochemisty and
Photobiology, Vol. 84, pp. 1-14.
126. Ranibizumab versus verteporfin photodynamic therapy for neovascular age-related acular
degeneration: Two-year results of the ANCHOR study. Brown, D. M., et al. 2009, Opthalmology, Vol. 116,
pp. 57-65.
127. Verteporfin photodynamic therapy combined with intravitreal bevacizumab for neovascular age-
related macular degeneration. Kaiser, P. K. and Committee, Registry of Visudyne AMD Therapy
Writing. 2009, Opthalmology, Vol. 116, pp. 747-755.
128. Inhibition of human vascular endothelial cells proliferationg by terbinafine. Ho, P. Y., et al. 2004,
International Journal of Cancer, Vol. 111, pp. 51-59.
129. A hemangioendothelioma-derived cell line: its use as a model for the study of endothelial cell
biology. Obeso, J., et al. 1990, Laboratory Investigation, Vol. 63, pp. 259-269.
79
130. The role of basement membrane in angiogenesis and tumor growth. Grant, D. S., et al. 1994,
Pathology Research and Practive, Vol. 190, pp. 854-863.
131. Alchornea glandulosa ethyl acetate fraction exhibits antiangiogenic activity: preliminary findings
from in vitro assays using human umbilical vein endothelial cells. Lopes, F. C., et al. 2011, Journal of
Medicinal Food.
132. Growth of microvessels in serum-free matrix culture of rat aorta. A quantitative assay of
angiognesis in vitro. Nicosia, R. F. and Ottinetti, A. 1990, Laboratory Investigation, Vol. 63, pp. 115-122.
133. The chick embryo aortic arch assay: a new, rapid, quantifiable in vitro method for testing the
efficacy of angiogenic and anti-angiogenic factors in a three dimensional, serum-free organ culture
system. Muthukkarruppan, V. R., et al. 2000, Proceedings of the American Association for Cancer
Research, Vol. 41, p. 65.
134. A single local application of recombinant human basic fibroblast growth factor accelerates initial
angiogenesis during wound healing in rabbit ear chamber. Komori, M., et al. 2005, Anesthesia and
Analgesia, Vol. 100, pp. 830-834.
135. Effects of thalidomide on DMBA-induced oral carcinogenesis in hamster with respect to
angiogenesis. Yang, Y. et al. 2009, Journal of Oral Pathology and Medicine, Vol. 38, pp. 455-462.
136. The dorsal skinfold chamber: studying angiogenesis by intravital microscopy. Sckell, A. and Leunig,
M. 2009, Methods of Molecular Biology, Vol. 467, pp. 305-317.
137. Angiogenesis in the mous cornea. Muthukkaruppan, V. R., et al. 1979, Science, Vol. 205, pp. 1416-
1418.
138. A simple, quantitative method for assessing angiogenesis and antiangiogenic agents using
reconstituted basement membrane, heparin and fibroblast growth factor. Passaniti, A., et al. 1982,
Laboratory Investigation, Vol. 1982, pp. 519-528.
139. The sponge/Matrigel angiogenesis assay. Akhtar, N., et al. 2002, Angiogenesis, Vol. 5, pp. 75-80.
140. Processing of fluorescence angiograms for the quantification of vascular effects induced by anti-
angiogenic agents in the CAM model. Nowak-Sliwinska, P., et al. 2010, Microvascular Research, Vol. 79,
pp. 21-28.
141. A new drug-screening procedure for photodynamic sensitizing agenst used in photodynamic therapy
for CNV. Lange, N. and al., et. 2001, Investigative Ophthalmology Visual Science, Vol. 42, pp. 38-46.
142. Vascular regrowth following photodynamic therapy in the chicken embryo chorioallantoic
membrane. Nowak-Sliwinska, P., et al. 2010, Angiogenesis, Vol. 13, pp. 281-292.
143. Angiostatic kinase inhibitors to sustain photodynamic angio-occlusion. Nowak-Sliwinska, P., et al.
2011, Under Review.
80
144. Verteporfin, photofrin II, and merocyanine 540 as PDT photosensitizers against melanoma cells.
Nowak-Sliwinska, P., et al. 2006, Biochemical and Biophysical Research Communications, Vol. 349, pp.
549-55.
145. Efficacy and safety of sunitinib malate (SU11248) in bevacizumab-refractory metastatic renal cell
carcinoma (mRCC). Rini, B. I., et al. Atlanta, GA : s.n., 2006. ASCO Anual Meeting. p. Abstract 9540.
146. Inhibition of vascular endothelial growth factor-induced angiogenesis suppresses tumor growth in
vivo. Kim, K. J., et al. 1993, Nature, Vol. 362, pp. 841-844.
147. Phase II study of SU11248, a multitargeted receptor tyrosine kinase inhibitor (TKI), in patietns (pts)
with previously treated metastatic breast cancer (MBC). Miller, K. D., et al. Orlando Fla. : s.n., 2005.
ASCO Annual Meeting. p. Abstract 563.
148. Sunitinib for patients (pts) with advanced imatinib (IM)-refractory GIST: Early results from a
"treatment-use" trial. Morgan, J. A., et al. Atlanta, GA : s.n., 2006. ASCO Annual Meeting. p. Abstract
9540.
149. Efficacy and safety of sunitinib in previously treated, advanced non-small lung cancer (NSCLC):
Preliminary results of a multicenter phase II trial. Socinski, M. A., et al. Atlanta, GA : s.n., 2006. ASCO
Annual Meeting. p. Abstract 7001.
150. Phase II study of sunitinib administered. George, S., et al. Atlanta, GA : s.n., 2006. p. Abstract 9532.

81


