Embed Size (px)
Citation preview
Initiation of Autophagy by Photodynamic Therapy
David Kessel* and Nancy L. Oleinick†* Department of Pharmacology, Wayne State University School of Medicine, Detroit, Michigan, USA† Department of Radiation Oncology, Case Western Reserve University, Cleveland, Ohio, USA
AbstractPhotodynamic therapy (PDT) involves the irradiation of photosensitized cells with light. Dependingon localization of the photosensitizing agent, the process can induce photodamage to the endoplasmicreticulum (ER), mitochondria, plasma membrane, and/or lysosomes. When ER or mitochondria aretargeted, antiapoptotic proteins of the Bcl-2 family are especially sensitive to photodamage. Bothapoptosis and autophagy can occur after PDT, autophagy being associated with enhanced survivalat low levels of photodamage to some cells. Autophagy can become a cell-death pathway if apoptosisis inhibited or when cells attempt to recycle damaged constituents beyond their capacity for recovery.While techniques associated with characterization of autophagy are generally applicable, PDTintroduces additional factors related to unknown sites of photodamage that may alter autophagicpathways. This chapter discusses issues that may arise in assessing autophagy after cellularphotodamage.
1. IntroductionPhotodynamic therapy (PDT) is based on the ability of certain photosensitizing agents tolocalize in malignant cells and tissues. Subsequent irradiation with light corresponding to anabsorbance optimum of the photosensitizer leads to an energy-transfer process that results inthe conversion of molecular oxygen to a reactive oxygen species (ROS) termed singlet oxygen.The highly reactive singlet oxygen oxidizes cellular molecules, usually nearby lipids andproteins. If sufficient drug and light are provided, this can result in a severe oxidative stress inthe cells and a very selective means for tumor eradication (Dougherty et al., 1998). AdditionalROS may also be formed, including superoxide anion radical, hydrogen peroxide, and hydroxylradical, any of which can have adverse effects on cellular functions.
Autophagy has been identified as a mode of cell death after PDT and may predominate whereapoptosis is unavailable (Buytaert et al., 2006, 2008; Kessel et al., 2006; Xue et al., 2007).Antiapoptotic proteins of the Bcl-2 family, located in the mitochondria and/or endoplasmicreticulum (ER), are among the most sensitive targets for many commonly used photosensitizingdrugs (Kim et al., 1999; Xue et al., 2001a). Loss of such proteins can be a trigger for bothapoptosis and autophagy (Pattingre et al., 2005). When lysosomes are targeted, PDT leads tothe release of lysosomal enzymes, thereby catalyzing the conversion of Bid to the proapoptoticcleavage product termed t-Bid (Reiners et al., 2002). Because of the involvement of lysosomesin the autophagic process, this can have additional implications (i.e., in the fusion ofautophagosomes with lysosomes).
Autophagy can be a factor in PDT at two points in the sequence of events. The first involvesthe ability of autophagy to repair photodamaged cellular components, including organelles.This can result in a loss of the shoulder on the dose-response curve, generally taken to indicatedamage repair (Fig. 1.1). Silencing of the autophagy gene designated Atg7 results in thephotosensitization of mouse leukemia L1210 cells to photodynamic effects (Kessel andArroyo, 2007). A similar finding was recently reported with respect to effects of the silencing
NIH Public AccessAuthor ManuscriptMethods Enzymol. Author manuscript; available in PMC 2010 October 23.
Published in final edited form as:Methods Enzymol. 2009 ; 453: 1–16. doi:10.1016/S0076-6879(08)04001-9.
NIH
-PA Author Manuscript
NIH
-PA Author Manuscript
NIH
-PA Author Manuscript
of other factors involved in autophagy on the lethality of ionizing radiation (Apel et al.,2008). However, in human breast cancer MCF-7 cells, silencing of Atg7 may make the cellsmore resistant to PDT (L.Y. Xue, S.M. Chiu, S. Joseph, and N.L. Oleinick, unpublished).
An additional concern in the context of PDT is the propensity of most photosensitizing agentsto migrate to relatively hydrophobic intracellular sites (i.e., membranes). Irradiation maytherefore result in the inactivation of proteins required for the autophagic process.
2. Photosensitizing AgentsSeveral photosensitizing agents have been approved for clinical use, and many others are inclinical and preclinical trials. The agents are not always commercially available. Commonporphyrins and phthalocyanines can be obtained from the major suppliers (e.g., Sigma-Aldrich). A large selection of porphyrins, phthalocyanines, and related compounds is availablefrom Frontier Science (Logan, Utah; an inventory can be seen at the [email protected]). Frontier Science can often provide a custom preparation ofalmost any agent whose structure and synthetic route has been published. Photosensitizersprepared for clinical trials or those received directly from a synthetic chemist are generallysupplied at a documented high level of purity; those from commercial sources may requireadditional purification. The majority of the agents in current use are porphyrins, porphyrin-derived compounds (e.g., benzoporphyrins or pheophorbides), or related types of macrocyclestructures (e.g., phthalocyanines). All contain hydrophobic ring systems, even thenonporphyrin photosensitizers (e.g., hypericin). Structures of the latter compound, theporphyrin skeleton and the porphycene CPO are shown in Fig. 1.2.
The concentration and time of incubation will vary as a function of hydrophobicity. Agents atthe extreme ends of the solubility spectrum often require extended loading incubation times(Table 1.1). For delivery to cells, the hydrophobic photosensitizers are generally dissolved ina biocompatible organic solvent, such as ethanol, dimethylformamide or DMSO, or in watercontaining low (0.1%) concentration of a detergent such as Tween 80, and a small aliquot ofthe stock solution is added to the serum-containing medium bathing the cells. It is necessaryto check that the vehicle is not toxic, but if the level of organic solvent remains below 0.1% ofthe medium volume, we have found no effect from it. Entry of the photosensitizers into thecells involves partitioning of the compounds to intracellular hydrophobic sites; there is littleevidence for other mechanisms of cellular uptake.
While there are reports in the literature concerning sites of localization of differentphotosensitizing agents (e.g., Kessel et al., 1997; Trivedi et al., 1999; Lam et al., 2001; Usudaet al., 2003; Buytaert et al., 2006), it is usually necessary for each cell line to be evaluated withregard to these properties. Because the photosensitizers are not directed to specific receptors,and because the structural requirements for localization patterns have not been established forany class of photosensitizers, what applies for one or a few cell lines may not necessarily bepertinent to others.
3. Additional Factors Unique to PDTUnlike conventional drug-treatment protocols, photodynamic effects occur only whenphotosensitized cells are irradiated. It may be necessary to incubate cells for several hours soas to obtain a sufficient intracellular concentration of the photosensitizing agent (Table 1.1),but formation of ROS will occur only when irradiation begins. To mimic physiologicalconditions, irradiation is often carried out at 37 °C, but by manipulating the temperature ofirradiation, it is possible to alter the immediate consequences. For example, after Bcl-2photodamage, insertion of Bax into mitochondria occurs only when the temperature is greaterthat 15 °C (Pryde et al., 2000). It is therefore possible to carry out irradiation at a temperature
Kessel and Oleinick Page 2
Methods Enzymol. Author manuscript; available in PMC 2010 October 23.
NIH
-PA Author Manuscript
NIH
-PA Author Manuscript
NIH
-PA Author Manuscript

<15 °C so as to prevent the immediate initiation of apoptosis. If a chilled microscope stage isused for observations, it is then feasible to observe mitochondrial or ER photodamage beforethe initiation of apoptosis (Kessel and Castelli, 2001). This type of strategy can be importantin identifying early events in PDT, as apoptosis causes drastic changes in cell morphology.This may also be true with regard to autophagy.
4. A Typical PDT ProtocolWhile the precise conditions may vary, a procedure for photosensitization and irradiation ofcells in suspension culture using CPO involves the following steps (a modified protocol forcells that grow attached to a substratum is provided in the section labeled “Dose-responsedata”):
1. Cells are collected in the exponential phase of growth and suspended in fresh growthmedium at a density of 3.5 × 10⁵ per ml, with 20 mM HEPES, pH 7.0, replacingNaHCO3 to permit maintenance of a near-neutral pH.
2. Cells are loaded with CPO (final concentration 2 μM) for 30 min at 37 °C, thencollected by centrifugation (100 × g, 30 s) and resuspended in fresh HEPES-bufferedgrowth medium containing 10% serum, at 10 °C.
3. A photosensitized cell suspension is placed in a 1-ml glass tube in a thermoelectricallycooled Petri dish (10 °C) and irradiated with light corresponding to the long-wavelength absorbance bands of CPO as defined by a broad-band 600 ± 30 nminterference filter. The precise time will depend on prior experiments that establish adose-response curve on the basis of clonogenic viability studies. With the murineleukemia L1210 cell line, a 2-min irradiation is required.
4. Photodamaged cells can then be used directly for an estimate of photodamage assessedby fluorescence microscopy using fluorescent probes (Kessel and Reiners, 2007) orincubated for 10–60 min at 37 °C with the cells subsequently used for thedetermination of autophagic and/or apoptotic effects (e.g., DEVDase activation, LC3processing, or vacuole formation detected by phase-contrast and electronmicroscopy).
5. With adhering cells, a similar protocol is followed except that cells are grown on 1.5-cm circular glass disks and incubated in small Petri dishes throughout.
6. We routinely establish viability by plating appropriate dilutions of cells on soft agarand permitting colonies to develop over 6–10 days. When this is done, steriletechniques are employed throughout.
7. Pellets containing 2.5 × 10⁶ cells are lysed in 100 μl of a mixture of 10 mM HEPES,pH 7.5, 130 mM NaCl, 1% Triton X-100, 10 mM NaF, 10 mM Na pyrophosphate and1 mM PMSF. After 10 min at 4 °C, the mixture is clarified by brief centrifugation(10,000×g, 3 min). The protein content is determined on a 10 μl aliquot and theremainder used for assays (e.g., caspase activity or LC3 processing).
5. Identification and Characterization of Autophagy after PDTIdentification of autophagy can be ambiguous. No kits are available for qualitative orquantitative analysis. Some techniques that have proven useful are outlined subsequently.
5.1. Phase-contrast microscopyAt intervals following irradiation, cells are inspected for vacuole formation using phase-contrast microscopy. While this cannot be considered an unambiguous procedure, theappearance of such vacuoles (compared to a control culture that is irradiated without the
Kessel and Oleinick Page 3
Methods Enzymol. Author manuscript; available in PMC 2010 October 23.
NIH
-PA Author Manuscript
NIH
-PA Author Manuscript
NIH
-PA Author Manuscript

photosensitizer) is often associated with an autophagic response (Buytaert et al., 2006; Kesseland Arroyo, 2007; Kessel and Reiners, 2007; Kessel et al., 2006).
5.2. Fluorescence microscopyAdequate image acquisition can be carried out with any conventional fluorescence microscope.We have successfully used the Nikon Eclipse E600 system with Plan fluor objectivesspecifically designed for fluorescence detection. This is an upright system but can be used toexamine adhering cells if coverslips are placed in the dishes being used for cell culture.
It is helpful to have phase rings incorporated into the objectives so that both phase-contrastand fluorescence images can be obtained. We have also used a Plan Apo 60X water immersionobjective. This has the advantage of using water rather than oil so that there is less drag on thecover slip when acquiring a Z-series of images. This procedure is helpful in assessing numbersof lysosomes, or acidic vesicles. Use of a Nikon Apo 60X objective enhances resolution ofimages. This objective does not contain a phase ring, improving sensitivity to fluorescence,but eliminating the possibility for comparing phase with fluorescence images.
5.3. Techniques in fluorescence microscopyA qualitative estimate of initiation of autophagy after PDT can be obtained by examining thesubsequent appearance of vesicles labeled with monodansylcadaverine (MDC) or any of theLysoTracker or LysoSensor probes provided by Molecular Probes/Invitrogen (Eugene, OR).In a typical study, cells are labeled with 10 μM MDC for 10 min at 37 °C, and patterns ofpunctate green fluorescence determined using 360–380 nm excitation and 520–560 nmemission (also see the chapter by Vázquez and Colombo in this volume). There is somecontroversy in the literature as to whether this is (Iwai-Kanai et al., 2008) or is not (Bamptonet al., 2005) a suitable test for autophagy.
Enhanced numbers of lysosomes or other acidic vesicles can be visualized using one of theLysoTrackers or LysoSensors provided by Molecular Probes. Incubation for 5 min at 37 °C isusually sufficient for labeling of L1210 cells in suspension culture using 100 nM ofLysoTracker Red or 100 nM of the LysoSensors. Of the probes in current use, we have testedLysoTracker Red (λex = 570 nm, λem = 590 nm), LysoSensor Yellow (λex = 465 nm, λem = 535nm), and LysoSensor Green (λex = 440 nm, λem = 505 nm). Although the latter probes have agreater Stokes shift, any of these probes is satisfactory for assessing relative numbers oflysosomes and other acidic vesicles. It may be feasible to obtain more quantitative data usingflow cytometry.
To improve the quantitation of labeling patterns, a fluorescence microscope with a Z-drive isuseful. A confocal microscope will eliminate out-of-plane emissions, allowing both sharperimages and the ability to visualize a series of optical planes through the cells using the Z-drive.This permits acquisition of a series of stacked images, with subsequent image processingcapable of resolving numbers of fluorescent loci. The Metamorph software contains a programfor selecting the in-focus pixels from a stack of images. Alternatively, removal of blur fromout-of-focus pixels can be better accomplished with AutoQuant software (AutoQuant Imaging,Troy, NY). This can offer an improved assessment of MDC or LysoTracker fluorescence.
To date, we have only limited experience using GFP-labeled LC3, a procedure that has beensuccessful in other contexts (Klionsky et al., 2008). Preliminary studies suggest that asubstantial increase in appearance of punctate fluorescence is associated with other indices ofautophagy after photodamage.
Kessel and Oleinick Page 4
Methods Enzymol. Author manuscript; available in PMC 2010 October 23.
NIH
-PA Author Manuscript
NIH
-PA Author Manuscript
NIH
-PA Author Manuscript

5.4. Electron microscopyElectron microscopy provides an estimate of the nature of vacuoles associated with PDT. Forthis purpose, cells are fixed with 2.5% glutaraldehyde in phosphate-buffered saline, and storedfor processing (also see the chapter by Ylä-Anttila et al., in this volume). It is important toinclude treatment with uranium acetate and lead citrate for optimal visualization of the double-membrane structure associated with autophagy. A guide to interpretation of data has beenreported (Eskelinen, 2008). The major problems to consider are that (1) supralethal light dosescan obliterate most cellular structures (something that can also be visualized by phase-contrastmicroscopy), and (2) it is important to examine a population of control cells to assess the levelof autophagy in the normal cell population. In MCF-7 cells, a large increase in the content ofautophagosomes was observed following PDT (Xue et al., 2007). Typical results are as shownin Fig. 1.3.
5.5. Western blots: LC3 processingWestern blots as an index of LC3 processing have proved useful for providing asemiquantitative indication of autophagy, if appropriate precautions are taken (Mizushima andYoshimori, 2007) (also see the chapter by Kimura et al., in this volume). A useful, butsometimes neglected procedure for assessing the autophagic flux involves carrying outexperiments in the presence versus absence of lysosomal protease inhibitors (e.g., E64d andacetyl pepstatin). With the murine L1210 leukemia cells, where autophagy can be detectedwithin 30–60 min after photodamage, these inhibitors can be added during the sensitizer-loading incubation. If longer intervals are required, it will be necessary to determine that theinhibitors are still active during the process and/or have not induced toxic responses bythemselves. Perhaps additional supplements will be required. This procedure is found toprovide an indication of autophagy after ER photodamage to L1210 cells (Kessel and Arroyo,2007). However, in MCF-7 cells, the inhibitors cause extensive accumulation of LC3-IIindependent of PDT and do not alter the level of LC3-II that accumulates in the cells in responseto PDT (Xue et al., 2007). Thus, in this latter case, it is possible that both the inhibitors andPDT with the photosensitizer Pc 4 block autophagy at the same late stage of proteolysisfollowing fusion of autophagosomes with lysosomes.
6. Effects of Autophagy on PDT Responses6.1. Dose-response data
In the context of PDT, the simplest method for altering the dose is to vary the light intensityor duration. Under these conditions, a dose-response curve can be generated and effects ofautophagy most readily observed by use of appropriate knockouts. Another simple method foraltering the dose is to vary the amount of the photosensitizer in the cell culture medium,allowing sufficient time for cell uptake of the photosensitizer to reach a maximum level. Insuch a protocol, all of the cultures would then receive the same light dose. In either case, anappropriate measure of overall cell killing is required. A variety of short-term assays of cellviability, such as uptake of vital dyes (e.g., trypan blue) or determination of the ability of cellmitochondria to reduce a tetrazolium dye to a colored product (e.g., MTT assay), are often usedbecause of their relative simplicity and ease. We prefer to avoid these assays whenever possible,as none give a total accounting of cell deaths, both immediate and delayed. Colony-formingassays provide the most reliable assessment of the percentage of cells in a population that arecapable of dividing indefinitely and forming a colony. Moreover, short-term assay results canbe misleading (Xue et al., 2001a).
There are two types of clonogenic assay used for adhering cells, each of which has advantagesand disadvantages. We call these preplate and postplate protocols. In the former, small numbersof cells (e.g., 100, 300, 1,000) are plated in tissue-culture dishes (60-mm diameter) and allowed
Kessel and Oleinick Page 5
Methods Enzymol. Author manuscript; available in PMC 2010 October 23.
NIH
-PA Author Manuscript
NIH
-PA Author Manuscript
NIH
-PA Author Manuscript
to attach to the substratum. This usually requires approximately 4 h. The cells in some of thedishes are exposed to the photosensitizer and light, while other dishes receive photosensitizeronly, light only, or no treatment. Then the dishes are returned to the incubator for 1–2 weeksto allow colony formation. In the postplate protocol, cells are treated while in exponentialgrowth or after they have reached confluence. Cultures are exposed to PDT or are designatedcontrols, and then the cells from each plate are recovered by trypsinization, counted, andreplated in multiple plates in sufficient number to yield 50–100 colonies. This number is chosento allow accurate counting of individual colonies while providing statistical significance. Theadvantage of the preplate protocol is its comparative simplicity. However, a seriousdisadvantage is that the extent of uptake of the photosensitizer into the small number of cellsplated may be quite different from that into each cell in a subconfluent culture. As a result, thetoxicity measured with the preplate protocol may not reflect the toxicity under the sameconditions in which most molecular studies (e.g., LC3 processing) are carried out. In contrast,in the postplate protocol, identical cultures may be exposed to PDT, then processed for colonyformation or molecular measurements. However, it has been observed occasionally thatmonolayer cultures subjected to some PDT protocols can become so firmly attached to thesubstrate by PDT that it is not possible to remove them with trypsin (Ball et al., 2001; Uzdenskyet al., 2004). If this occurs, the postplate protocol cannot be carried out with that combinationof cells, photosensitizer, and dose. In most cases, this is not a problem, and because any numberof cells up to 106 may be plated to determine colony formation, it is possible to determine ifthe treatment has left as little as 1 live cell out of a million treated. Because this is the methodwe advocate, the procedure will be described in more detail.
6.2. A protocol for determining the effect of PDT on the colony-forming ability of adheringcultures
1. Setting up the cultures. Sterile technique is used for steps 1–5. A series of T-25 flasksis inoculated with sufficient cells to yield replicate subcon-fluent cultures on theplanned day of the experiment (day 0). As an example, for MCF-7 cells, we routinelyinoculate ≈7 × 10⁵ cells into each of 10–20 T-25 flasks 2 days before the day of PDT(i.e., on day –2). These cultures are allowed to grow in a tissue culture incubator at37 °C in a humidified atmosphere of 5% CO2 in air. When used for the PDTexperiment on day 0, there are approximately 2 106 cells in each flask.
2. Adding the photosensitizer. On day –1, an aliquot of a photosensitizer stock solutionis added to the medium above the cell monolayer. The timing of photosensitizeraddition and dose are determined in preliminary experiments. Issues concerningsolvents for hydrophobic photosensitizers have been discussed previously.
3. Photoirradiation. Flasks are exposed one at a time to the desired wavelengths of lightappropriate for the photosensitizer at the light fluence(s) and fluence rate(s) to bestudied. We typically use an LED array with a peak output at 675 nm, which is chosenbecause it is close to the absorption maximum of phthalocyanines, but broad-bandlight sources with suitable filters can also be used, as discussed previously.
4. Recovery of cells from the monolayer. Following irradiation, the cells from eachculture are released from the monolayer by trypsinization (1 mL of 0.25% trypsin-EDTA purchased from Thermo Scientific, South Logan, UT). The trypsin is blockedby addition of 4 mL of serum-containing medium, and the cell suspension is pipettedseveral times to break cell clumps. The presence of single cells is checked under amicroscope.
5. Processing of cells for colony formation. An aliquot of the cells is counted, either withan electronic cell counter or a hemacytometer, and the initial cell density is calculated.Serial dilutions of the cell stock are made into medium such that the final dilution will
Kessel and Oleinick Page 6
Methods Enzymol. Author manuscript; available in PMC 2010 October 23.
NIH
-PA Author Manuscript
NIH
-PA Author Manuscript
NIH
-PA Author Manuscript
result in the desired number of cells being delivered to each of at least 3 60-mm tissue-culture dishes. Calculation of that number requires knowing the plating efficiency(PE; the number of colonies formed per 100 cells plated) of the untreated cells frompreliminary tests. For many human cancer cell lines, the PE is 20%–50%, whereasfor many rodent cell lines, the PE can be 80% or greater. For example, for a cell linethat has a PE of 25%, if 400 cells are plated, 100 colonies should be obtained. For aculture that was exposed to a dose of PDT that is expected to kill 90% of the cells,4000 cells should be plated in each dish to result in 100 colonies. If the expectedsurvival is not known, it may be necessary to plate, for the example given, 3 dishesof 4000 cells, 3 with half and 3 with double that number. All dishes are placed in anincubator and left undisturbed (generally 1–2 weeks) to allow observable individualcolonies to form.
6. Determination of the survival response. The medium is removed, and the monolayeris covered with approximately 2 mL of a 0.1% crystal violet in 20% ethanol, and afterapproximately 5 min to allow staining of the cells, the dishes are washed by gentleimmersion into a tub of cool water. The plates are turned upside down to drain anddry. The colonies are then counted by eye under a dissecting microscope ormagnifying glass. For each dish, the number of colonies containing at least 50 cellsis divided by the number of cells plated to determine the PE. The PE values of triplicatedishes are averaged and normalized to the PE of the controls.
6.3. Role of autophagy in the sensitivity of cells to PDTUse of siRNA to produce a significant decrease in Atg7 reveals that autophagy can be a survivalprocess at the lower end of the dose-response curve in mouse leukemia L1210 cells (Kesseland Arroyo, 2007; Kessel and Reiners, 2007). In contrast, MCF-7 human breast cancer cellsdeficient in Atg7 (Abedin et al., 2006) are more resistant to the lowest doses of PDT, as revealedby an increased shoulder on the clonogenic survival curve (L.Y. Xue, S.M. Chiu, S. Joseph,and N.L. Oleinick, unpublished). Some investigators have advised use of different knockouts(e.g., comparing Atg7 with Atg5) to determine whether a process unique to one of the geneproducts might skew the results. The cell type– and/or agent-dependence of cell responses toloss of Atg7 is also observed with Atg5 knockdown. Thus, murine embryonic fibroblasts(MEFs) deficient in Atg5 are more sensitive to treatment with staurosporine or tunicamycinbut more resistant to treatment with menadione or UVC-radiation than the Atg5-replete MEFs(Wang et al., 2008), and SK-N-SH neuroblastoma cells deficient in Atg5 are sensitized to celldeath, as compared with wild-type cells, when treated with ER stressors but not when treatedwith staurosporine or when pretreated with rapamycin to inhibit mTOR activity (Ogata et al.,2006). Clearly, the mechanisms and roles of autophagy following PDT could also differmarkedly in different cell types, depending on a variety of cell characteristics, including theirpropensity to undergo apoptosis, and in response to agents that produce different types orlocations of damage. For PDT, this means that different responses may also follow treatmentwith photosensitizers that localize to different organelles.
6.4. Sequence of eventsAutophagy is expected to occur at a minimum of two points in the cellular response tophotodamage. When the ER and/or mitochondria are targets for photodamage, the firstresponse occurs shortly after irradiation of photosensitized L1210 cells (Kessel and Arroyo,2007). Autophagic vacuoles are observed within 15 min after irradiation, presumablyassociated with the recycling of photodamaged organelles. A second phase of autophagy occursafter the apoptotic response is ending and may reflect the fate of cells that attempt an excessiveamount of recycling and cannot survive. After 24 h, there are a few survivors along with highlyvacuolated cells that are freely permeably to propidium iodide. Phase-contrast images showing
Kessel and Oleinick Page 7
Methods Enzymol. Author manuscript; available in PMC 2010 October 23.
NIH
-PA Author Manuscript
NIH
-PA Author Manuscript
NIH
-PA Author Manuscript
the appearance of autophagic vacuoles and apoptotic morphology after an LD90 PDT dose areshown in Fig. 1.4. As with the many other measures, the same sequence of events is extendedover a longer time period in carcinoma cells than in the leukemic cells (Xue et al., 2007). Inhuman breast cancer MCF-7 cells, substantial increases in LC3-II can be observed by 2–24 hafter PDT (Fig. 1.5). This may indicate that PDT is promoting the early stage of apoptosis butinterfering with the later stages of autophagosome processing or LC3-II degradation.
6.5. Apoptosis versus autophagyThe murine L1210 cell line is useful for the study of apoptosis vs. autophagy as cell deathmechanisms. Silencing the Atg7 gene appears to essentially abolish autophagy, whereas lossof Bax is sufficient to substantially decrease apoptosis (Kessel and Arroyo, 2007). Figure 1.6shows the relative response of this cell line to 90% photokilling with the porphycene CPO.One hour after irradiation, a few apoptotic cells are detected with HO33342, and some vacuolesare apparent. When Atg7 is silenced, there is a much more substantial apoptotic response, whileloss of Bax results in a substantially greater number of vacuoles. In studies from the Kessellaboratory cited previously, vacuolization in this cell line is accompanied by LC3 processing,together with the appearance of double-membranes observed by electron microscopy.
Processing of LC3 appears to occur in all of the cell types that have been examined followingPDT (Buytaert et al., 2006; Kessel et al., 2006; Xue et al., 2007). Buytaert et al. (2006) foundgreater levels of PDT-induced LC3-II in Bax/Bak-double knockout MEFs that are deficient inapoptosis than in either the same cells transfected with mitochondrion-directed Bax (where theability to undergo apoptosis is restored) or in apoptosis-competent wild-type MEFs. Althoughdata for only one PDT dose and one post-PDT time are reported, the results suggest that theautophagic response in this system is greater when apoptosis is defective. In contrast, in acomparison of procaspase-3-deficient versus procaspase-3-overexpressing MCF-7 cells (Xueet al., 2007), there is no marked difference in the rate or extent of accumulation of LC3-II,suggesting that the initiation of autophagy is independent of the ability of the cells to undergoapoptosis. However, apoptosis dominates as a mechanism of cell death in those cells having afully constituted apoptotic pathway, whereas a non-apoptotic pathway, possibly autophagy, isresponsible for cell death when apoptosis is compromised (Xue et al., 2007). Furthermore, asthere is the potential for cross talk between the two pathways (e.g., via the interaction of Beclin1 with Bcl-2), further research is needed to explore more fully the relationship betweenapoptosis and autophagy following PDT.
AcknowledgmentsThe authors’ research is supported by NIH grants R01 CA83917, R01 CA106491, P30 CA43703, and CA 23378 fromthe National Cancer Institute, DHHS, and by the State of Ohio Biomedical Research and Technology Transfer TrustTECH 05-063.
REFERENCESAbedin MJ, Wang D, McDonnell MA, Lehmann U, Kelekar A. Autophagy delays apoptotic death in
breast cancer cells following DNA damage. Cell Death Differ 2006;14:500–510. [PubMed: 16990848]Apel A, Herr I, Schwarz H, Rodemann HP, Mayer A. Blocked autophagy sensitizes resistant carcinoma
cells to radiation therapy. Cancer Res 2008;68:1485–1494. [PubMed: 18316613]Ball DJ, Mayhew S, Vernon DI, Griffin M, Brown SB. Decreased efficiency of trypsinization of cells
following photodynamic therapy: Evaluation of a role for tissue transglutaminase. Photochem.Photobiol 2001;73:47–53. [PubMed: 11202365]
Bampton ET, Goemans CG, Niranjan D, Mizushima N, Tolkovsky AM. The dynamics of autophagyvisualized in live cells: From autophagosome formation to fusion with endo/lysosomes. Autophagy2005;1:23–36. [PubMed: 16874023]
Kessel and Oleinick Page 8
Methods Enzymol. Author manuscript; available in PMC 2010 October 23.
NIH
-PA Author Manuscript
NIH
-PA Author Manuscript
NIH
-PA Author Manuscript
Buytaert E, Callewaert G, Hendrickx N, Scorrano L, Hartmann D, Missiaen L, Vandenheede JR, HeirmanI, Grooten J, Agostinis P. Role of endoplasmic reticulum depletion and multidomain proapoptoticBAX and BAK proteins in shaping cell death after hypericin- mediated photodynamic therapy. FASEBJ 2006;20:756–758. [PubMed: 16455754]
Buytaert E, Matroule JY, Durinck S, Close P, Kocanova S, Vandenheede JR, de Witte PA, Piette J,Agostinis P. Molecular effectors and modulators of hypericin-mediated cell death in bladder cancercells. Oncogene 2008;27:1916–1929. [PubMed: 17952126]
Dougherty TJ, Gomer CJ, Henderson BW, Jori G, Kessel D, Korbelik M, Moan J, Peng Q. Photodynamictherapy. J. Natl. Cancer Inst 1998;90:889–905. [PubMed: 9637138]
Eskelinen E-L. To be or not to be? Examples of incorrect identification of autophagic compartments inconventional transmission electron microscopy of mammalian cells. Autophagy 2008;4:257–260.[PubMed: 17986849]
Iwai-Kanai E, Yuan H, Huang C, Sayen MR, Perry-Garza CN, Kim L, Gottlieb RA. A method to measurecardiac autophagic flux in vivo. Autophagy 2008;4:322–329. [PubMed: 18216495]
Kessel D, Arroyo AS. Apoptotic and autophagic responses to Bcl-2 inhibition and photodamage.Photochem. Photobiol. Sci 2007;6:1290–1295. [PubMed: 18046484]
Kessel D, Castelli M. Evidence that bcl-2 is the target of three photosensitizers that induce a rapidapoptotic response. Photochem. Photobiol 2001;74:318–322. [PubMed: 11547571]
Kessel D, Luo Y, Deng Y, Chang CK. The role of subcellular localization in initiation of apoptosis byphotodynamic therapy. Photochem. Photobiol 1997;65:422–426. [PubMed: 9077123]
Kessel D, Reiners JJ Jr. Apoptosis and autophagy after mitochondrial or endoplasmic reticulumphotodamage. Photochem. Photobiol 2007;83:1024–1028. [PubMed: 17880495]
Kessel D, Vicente MG, Reiners JJ Jr. Initiation of apoptosis and autophagy by photodynamic therapy.Lasers Surg. Med 2006;38:482–488. [PubMed: 16615135]
Kim HR, Luo Y, Li G, Kessel D. Enhanced apoptotic response to photodynamic therapy after Bcl-2transfection. Cancer Res 1999;59:3429–3432. [PubMed: 10416606]
Klionsky D, et al. Guidelines for the use and interpretation of assays for monitoring autophagy in highereukaryotes. Autophagy 2008;4:151–175. [PubMed: 18188003]
Lam M, Oleinick NL, Nieminen AL. Photodynamic therapy-induced apoptosis in epidermoid carcinomacells: Reactive oxygen species and mitochondrial inner membrane permeabilization. J. Biol. Chem2001;276:47379–47386. [PubMed: 11579101]
Mizushima N, Yoshimori T. How to interpret LC3 immunoblotting. Autophagy 2007;3:542–545.[PubMed: 17611390]
Ogata M, Hino S, Saito A, Morikawa K, Kondo S, Kanemoto S, Murakami T, Taniguchi M, Tanii I,Yoshinaga K, Shiosaka S, Hammarback JA, Urano F, Imaizumi K. Autophagy is activated for cellsurvival after endoplasmic reticulum stress. Mol. Cell. Biol 2006;26:9220–9231. [PubMed:17030611]
Pattingre S, Tassa A, Qu X, Garuti R, Liang XH, Mizushima N, Packer M, Schneider MD, Levine B.Bcl-2 antiapoptotic proteins inhibit Beclin 1-dependent autophagy. Cell 2005;122:927–939.[PubMed: 16179260]
Pryde JG, Walker A, Rossi AG, Hannah S, Haslett C. Temperature-dependent arrest of neutrophilapoptosis. Failure of Bax insertion into mitochondria at 15 degrees C prevents the release ofcytochrome c. J. Biol. Chem 2000;275:33574–33584. [PubMed: 10896657]
Reiners JJ Jr. Caruso JA, Mathieu P, Chelladurai B, Yin XM, Kessel D. Release of cytochrome c andactivation of pro-caspase-9 following lysosomal photodamage involves Bid cleavage. Cell DeathDiffer 2002;9:934–944. [PubMed: 12181744]
Trivedi NS, Wang H-W, Nieminen AL, Oleinick NL, Izatt JA. Quantitative analysis of Pc 4 localizationin mouse lymphoma cells via double-label confocal fluorescence microscopy. Photochem. Photobiol2000;71:634–639. [PubMed: 10818795]
Usuda J, Chiu SM, Murphy ES, Lam M, Nieminen AL, Oleinick NL. Domain-dependent photodamageto Bcl-2: A membrane-anchorage region is needed to form the target of phthalocyaninephotosensitization. J. Biol. Chem 2003;278:2021–2029. [PubMed: 12379660]
Uzdensky A, Juzeniene A, Ma LW, Moan J. Photodynamic inhibition of enzymatic detachment of humancancer cells from a substratum. Biochim. Biophys. Acta 2004;1670:1–11. [PubMed: 14729136]
Kessel and Oleinick Page 9
Methods Enzymol. Author manuscript; available in PMC 2010 October 23.
NIH
-PA Author Manuscript
NIH
-PA Author Manuscript
NIH
-PA Author Manuscript

Xue LY, Chiu SM, Azizuddin K, Joseph S, Oleinick NL. The death of human cancer cells followingphotodynamic therapy: Apoptosis competence is necessary for Bcl-2 protection but not for inductionof autophagy. Photochem. Photobiol 2007;83:1016–1023. [PubMed: 17880494]
Xue LY, Chiu SM, Oleinick NL. Photochemical destruction of the Bcl-2 oncoprotein duringphotodynamic therapy with the phthalocyanine photosensitizer Pc 4. Oncogene 2001a;20:3420–3427. [PubMed: 11423992]
Xue LY, Chiu SM, Oleinick NL. Photodynamic therapy-induced death of MCF-7 human breast cancercells: a role for caspase-3 in the late stages of apoptosis but not for the critical lethal event. Exp. CellRes 2001b;263:145–155. [PubMed: 11161713]
Wang Y, Singh R, Massey AC, Kane SS, Kaushik S, Grant T, Xiang Y, Cuervo AM, Czaja MJ. Loss ofmacroautophagy promotes or prevents fibroblast apoptosis depending on the death stimulus. J. Biol.Chem 2008;283:4766–4777. [PubMed: 18073215]
Kessel and Oleinick Page 10
Methods Enzymol. Author manuscript; available in PMC 2010 October 23.
NIH
-PA Author Manuscript
NIH
-PA Author Manuscript
NIH
-PA Author Manuscript

Figure 1.1.Dose-response curve obtained with wild-type L1210 cells (dashed line) and an Atg7knockdown subline (solid line). Cells were photosensitized with the porphycene CPO and thelight dose was varied as indicated. Viability was assessed by clonogenic assays.
Kessel and Oleinick Page 11
Methods Enzymol. Author manuscript; available in PMC 2010 October 23.
NIH
-PA Author Manuscript
NIH
-PA Author Manuscript
NIH
-PA Author Manuscript
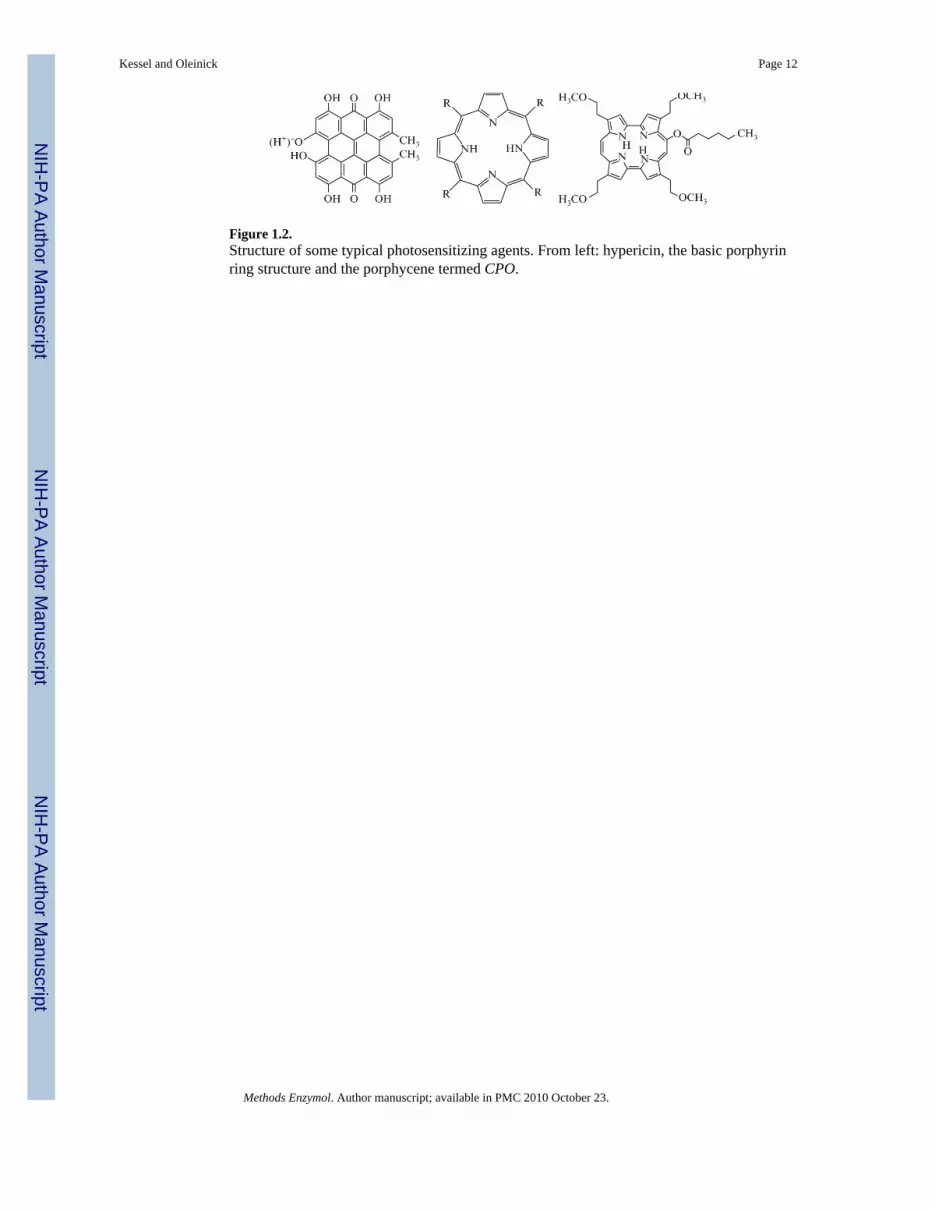
Figure 1.2.Structure of some typical photosensitizing agents. From left: hypericin, the basic porphyrinring structure and the porphycene termed CPO.
Kessel and Oleinick Page 12
Methods Enzymol. Author manuscript; available in PMC 2010 October 23.
NIH
-PA Author Manuscript
NIH
-PA Author Manuscript
NIH
-PA Author Manuscript

Figure 1.3.Electron micrographs of untreated (left) and PDT-treated (right) MCF-7 cells. Note thepresence of numerous autophagosomes after PDT, some containing what appear to be degradedmitochondria.
Kessel and Oleinick Page 13
Methods Enzymol. Author manuscript; available in PMC 2010 October 23.
NIH
-PA Author Manuscript
NIH
-PA Author Manuscript
NIH
-PA Author Manuscript

Figure 1.4.Progression of autophagy and apoptosis after photodynamic therapy. Murine leukemia L1210cells were incubated for 30 min with a 2 μM concentration of the porphycene CPO, resuspendedin fresh medium, irradiated (135 mJ/cm2) with light (600–640 nm) at 10°C, then warmed to37°C. Phase-contrast images were obtained at intervals. (A) Before irradiation, (B) 15 min afterirradiation, (C) after 1 h, (D) after 4 h, and (E) after 24 h.
Kessel and Oleinick Page 14
Methods Enzymol. Author manuscript; available in PMC 2010 October 23.
NIH
-PA Author Manuscript
NIH
-PA Author Manuscript
NIH
-PA Author Manuscript

Figure 1.5.Time-course and PDT dose-response for the accumulation of LC3-II in MCF-7c3 cells. Cellswere exposed to the indicated concentrations of the photosensitizer PC 4 overnight, followedby photoirradiation with 200 mJ/cm2 of red light from a light-emitting photodiode array. Cellswere collected at the indicated times post-irradiation and analyzed on Western blots.
Kessel and Oleinick Page 15
Methods Enzymol. Author manuscript; available in PMC 2010 October 23.
NIH
-PA Author Manuscript
NIH
-PA Author Manuscript
NIH
-PA Author Manuscript
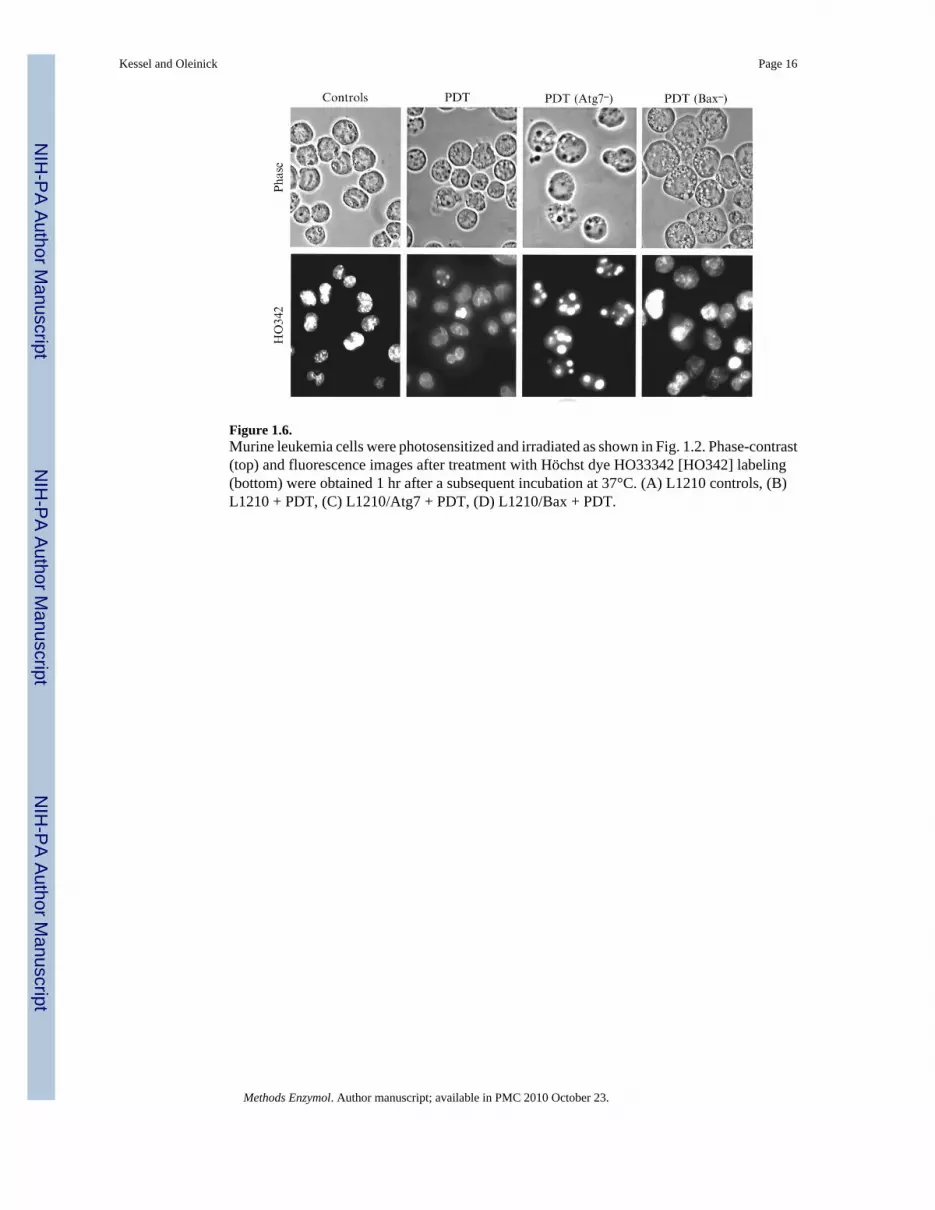
Figure 1.6.Murine leukemia cells were photosensitized and irradiated as shown in Fig. 1.2. Phase-contrast(top) and fluorescence images after treatment with Höchst dye HO33342 [HO342] labeling(bottom) were obtained 1 hr after a subsequent incubation at 37°C. (A) L1210 controls, (B)L1210 + PDT, (C) L1210/Atg7 + PDT, (D) L1210/Bax + PDT.
Kessel and Oleinick Page 16
Methods Enzymol. Author manuscript; available in PMC 2010 October 23.
NIH
-PA Author Manuscript
NIH
-PA Author Manuscript
NIH
-PA Author Manuscript

NIH
-PA Author Manuscript
NIH
-PA Author Manuscript
NIH
-PA Author Manuscript
Kessel and Oleinick Page 17
Table 1.1
Typical incubation conditions for photosensitizing agents
Sensitizer Relative hydrophobicity Concentration (μM) Time (h)
CPO moderate 2 0.5
NPe6 very low 30 16
mTHPC very high 2–4 16
Pc 4 high 0.2 1–18
Methods Enzymol. Author manuscript; available in PMC 2010 October 23.


