Embed Size (px)
Citation preview
Hiroaki Suzuki
Arish Dastur
Sebastian Moffatt
Nanae Yabuki
Eco2 CitiesEcological Cities as Economic Cities
THIS IS A CONFERENCE EDITION
Supported by the Australian Government, AusAID
Disclaimer
The views expressed in this publication are those of the authors and not necessarily those of the Australian Agency for International Development (AusAID).
FM rev2_PREP i 6/15/09 8:03:08 AM

©2009 The International Bank for Reconstruction and Development / The World Bank
1818 H Street NW
Washington DC 20433
Telephone: 202-473-1000
Internet: www.worldbank.org
E-mail: [email protected]
All rights reserved
1 2 3 4 12 11 10 09
This volume is a product of the staff of the International Bank for Reconstruction and Development / The World
Bank. The fi ndings, interpretations, and conclusions expressed in this volume do not necessarily refl ect the views of
the Executive Directors of The World Bank or the governments they represent.
The World Bank does not guarantee the accuracy of the data included in this work. The boundaries, colors,
denominations, and other information shown on any map in this work do not imply any judgement on the part of
The World Bank concerning the legal status of any territory or the endorsement or acceptance of such boundaries.
Rights and Permissions
The material in this publication is copyrighted. Copying and/or transmitting portions or all of this work without
permission may be a violation of applicable law. The International Bank for Reconstruction and Development /
The World Bank encourages dissemination of its work and will normally grant permission to reproduce portions
of thework promptly.
For permission to photocopy or reprint any part of this work, please send a request with complete
information to the Copyright Clearance Center Inc., 222 Rosewood Drive, Danvers, MA 01923, USA;
telephone: 978-750-8400; fax: 978-750-4470; Internet: www.copyright.com.
All other queries on rights and licenses, including subsidiary rights, should be addressed to the Offi ce of the
Publisher, The World Bank, 1818 H Street NW, Washington, DC 20433, USA; fax: 202-522-2422; e-mail:
The manuscript for this conference edition disseminates the fi ndings of work in progress to encourage the
exchange of ideas about development issues. It is unedited and is not for citation.
FM rev2_PREP ii 6/15/09 8:03:10 AM
iii
TABLE OF CONTENTS
Foreword!xiii
Acknowledgements!xv
Preface!xvii
The Structure of this Book!xxi
Executive Summary!1
PART ONE: THE FRAMEWORK 11
Chapter 1: Ecological Cities as Economic Cities 13
Challenges and Opportunities"13 Innovations in Urban Sustainability and their Benefi ts"18 Powerful Lessons from Best Practice Cities"23 Capitalizing on the Opportunities"26
Chapter 2: Eco² Cities: Principles and Pathways 27
Cites are Challenged on Many Fronts"28 A Principled Approach Can Overcome the Challenges"30 Moving from Principles to Core Elements to a Unique Eco2 Pathway"36
Chapter 3: A City-based Approach 41
The Core Elements of a City-based Approach"41 Stepping Stones for Taking a City-Based Approach"43
Chapter 4: An Expanded Platform for Collaborative 49
Design and Decision-Making
The Core Elements of a Platform for Collaboration"50 Stepping Stones for an Expanded Platform for Collaboration"57
FM rev2_PREP iii 6/15/09 8:03:10 AM
iv | ECO2 CITIES: ECOLOGICAL CITIES AS ECONOMIC CITIES
Chapter 5: A One System Approach 59
The Core Elements of a One System Approach"60 Integrating Flows: Infrastructure System Design and Management"60 Integrating Flows with Forms: Spatial Planning and Urban Design"68 Integrated Implementation"76 Stepping Stones towards the One-System Approach"85
Chapter 6: An Investment Framework that Values 87
Sustainability and Resiliency
The Core Elements of Investing in Sustainability and Resiliency"87 Incorporation of Lifecycle Costing"87 Equal Attention to All Capital Assets: an Expanded Framework for Accounting"90 Proactive Risk Management for All Threats"96 Stepping Stones for Investing in Sustainability and Resiliency"99
Chapter 7: Moving Forward Together 101
Knowledge Sharing, Technical Assistance, and Capacity Building"101 Financial Resources"102
PART TWO: A CITY-BASED DECISION SUPPORT SYSTEM 105
Introduction"107
Chapter 1: Methods for Collaborative Design and Decision-Making 109
Organizing and Managing Collaborative Working Groups"109 Developing a Shared Framework for Aligning Visions and Actions"112 Conducting a Regional Systems Design Charrette"117
Chapter 2: Methods for Analyzing Flows and Forms 121
Meta Diagrams and Materials Flow Analysis"121 E2 ective Overlay Mapping"131
Chapter 3: Methods for Investment Planning 139
Life Cycle Costing"140 Environmental Accounting"152 Foresight Workshops and Resiliency Planning"156
PART THREE: FIELD REFERENCE GUIDE 161
Introduction"163
Eco2 Case Studies: Best Practice Cities 165
Case One: Curitiba, Brazil"165 Case Two: Stockholm, Sweden"179 Case Three: Singapore"189
FM rev2_PREP iv 6/15/09 8:03:10 AM
CO N T E N T S | v
Case Four: Yokohama, Japan"199 Case Five: Brisbane, Australia"205 Case Six: Auckland, New Zealand"211
Eco2 Sector Notes 217
Introduction"217
Sector Note One: Cities and Energy"219 Sector Note Two: Cities and Water"241 Sector Note Three: Cities and Transport"257 Sector Note Four: Cities and Solid Waste"283 Managing Spatial Structure of the Cities"297World Bank Group’s Financial Instruments and Multi-Donor Funds"315
Endnotes!325
BOXES
Box 1.1. Combining Forecasts and Backcasts to achieve Resiliency and SustainabilityBox 1.2. Combining Flows and Forms to Create a Transdisciplinary Platform Box 1.3. Form and Flows Box.1.4. Urban Land Pooling and Land Readjustment Box 3.1. Development Strategies of Stockholm Box 3.2. Summary of Measures in CitySmart Program Box 3.3. Example of Grants and Rebates (AUS$) Box 3.4. Eight Goals Direct the Auckland Framework Box 3.5. Energy Planning in the City of Mannheim (Germany) Box 3.6. Public Agencies with Signifi cant Infl uence on Electricity
Production, Distribution, and Use in California Box 3.7. An Extensive Solar Water Heating Program in Rizhao, ChinaBox 3.8. Improving energy e9 ciency, reducing energy costs, and releasing
municipal budgets Box 3.9. E2 ect of Distribution System Confi guration on Energy Consumption Box 3.10. Domestic Water Consumption in Canada and Conservation Box 3.11. Combined water and energy activities in the water supply management Box 3.12. WATERGY Case Study Box 3.13. Four Pillars of Sustainable Urban Transport Institutions Box 3.14. Transit-Oriented Development (TOD) Box 3.15. Emission-Based Road Pricing in Milan, Italy Box 3.16. Beijing TDM and the Legacy of the Olympic Games Box 3.17. Bus Rapid Transit (BRT) Box 3.18. Performance Metrics Box 3.19. Innovative Waste Collection Approach Box 3.20. Recycling Program Involving Citizens Box 3.21. Waste Reduction through Stakeholder Engagement Box 3.22. CDM and Waste Management
FM rev2_PREP v 6/15/09 8:03:10 AM
Box 3.23. Landfi ll Gas Capture and Use—Tianjin, China Box 3.24. Using di2 erent Climate Change funds simultaneously or sequentially Box 3.25. Citywide GHG Emission Reduction and Carbon Finance
FIGURES
Figure 1.1. The Hammarby Model, Stockholm: An Example of Integrated Planning and Management
Figure 1.2. Initial First Phase Results of Hammarby Sjöstad by the Environmental Load Profi le Life Cycle Analysis Tool
Figure 1.3. The Integrated Transport Network in the 1970s to 1990s, and Today Figure 1.4. A Possible Role for National Governments: Administering a National Eco2
Fund to Support All Participating Cities Figure 1.5. Cities’ Collaborative Working Group at Three Tiers: Corporate, Municipal
and Regional Figure 1.6. Aalborg Charter Figure 1.7. Load Curve of a District Heating System Figure 1.8. Cascading Water Use Figure 1.9. Cascading and Looping Water in Singapore Figure 1.10. Looping Resources Figure 1.11. Cluster Management of Waste Figure 1.12. Distributed Systems. Figure 1.13. Uses of a Pedestrian Pathway. Figure 1.14. Distributed System for Wastewater Treatment. Figure 1.15. Integrated Materials and Waste Management Figure 1.16. Innovative Energy Infrastructure Figure 1.17. Integrated Stormwater Management. Figure 1.18. Traditional Dwelling Supply Systems Figure 1.19. Combined Trenching for Infrastructure Systems Figure 1.20. Houston Texas Figure 1.21. Urban Density and Transport-related Energy Consumption Figure 1.22. A Di2 erent Paradigm for Urban Design Figure 1.23. Integrating the Benefi ts of Natural Systems in Communities Figure 1.24. Multiple Uses of a Public School. Figure 1.25. Time Rings Figure 1.26. Shantigram Township, Before the Scheme Figure 1.27. Shantigram Township, Final Serviced Land Parcels for Sale Figure 1.28. Summary of Resource Flows Through London in 2000 Figure 1.29. Design Assessment Matrix Figure 1.30. Targeted Indicator Type, by Level of City Personnel Figure 1.31. Infl exible Energy System Figure 1.32. Adaptable Energy System Figure 1.33. Financial Instruments Figure 2.1. Collaborative Model Figure 2.2. Collaborative Working Group Figure 2.3. Core Team and Sector Advisors
vi | ECO2 CITIES: ECOLOGICAL CITIES AS ECONOMIC CITIES
FM rev2_PREP vi 6/15/09 8:03:10 AM
CO N T E N T S | vii
Figure 2.4. A Long-term Planning Framework Figure 2.5. Catalyst Projects Figure 2.6. A Policy Matrix Figure 2.7. A Regional Design Charrette Figure 2.8. A Sankey Diagram Figure 2.9. A Meta Diagram Example Figure 2.10. Baseline Water Flows for City of Irvine, California Figure 2.11. Example of a Countrywide Meta Diagram Figure 2.12. Patterns of Meta Diagrams: Physical Flows Figure 2.13. Meta Diagram for Jinze Town, Shanghai, Current Energy System Figure 2.14. Meta Diagram for Jinze Town, Shanghai, Advanced System Figure 2.15. Schematic for Downtown Neighborhood Figure 2.16. Meta Diagrams on Energy for Proposed New Town Figure 2.17. Annual Energy Use is an Indicator for Squamish, Canada Figure 2.18. Approaches to Developing Meta Diagrams Figure 2.19. Auditing Reference Buildings to Create a Meta Diagram Figure 2.20. Sample Forms for Standardised Data Collection on Water Flows Figure 2.21. Sample Universal Flow Matrix for Water Figure 2.22. Layering Data Figure 2.23. Overlay Mapping Figure 2.24. Example of an Overlay Map for Risk Assessment Figure 2.25. Example of an Overlay Map for Renewable Energy Sources Figure 2.26. Community Viz Figure 2.27. Building Life Cycle Figure 2.28. Baseline Low Density Scenario Developed Using a ‘Mask’ Figure 2.29. Baseline Scenario—Initial Capital Costs Figure 2.30. Baseline Scenario—Annual Operating Costs per Unit Figure 2.31. Baseline Scenario—Graphic Representation of Initial Capital Costs and
Annual Operating Costs per Unit Figure 2.32. Baseline Scenario—Representation of True Lifecycle Costs, including
Replacement Figure 2.33. Baseline Scenario—Graphic Representation of True Lifecycle Cost Figure 2.34. Baseline Scenario—Estimate of Taxes, User Fees, Initial DCCs Figure 2.35. Sustainable Neighbourhood Scenario—Initial Capital Costs per Unit Figure 2.36. Sustainable Neighbourhood Scenario—Annual Operating Costs per Unit
Figure 2.37. Sustainable Neighbourhood Scenario—Graphic Representation of Initial Capital Costs and Annual Operating Costs per Unit
Figure 2.38. Sustainable Neighbourhood Scenario—Representation of True Lifecycle Costs, including Replacement
Figure 2.39. Sustainable Neighbourhood—Graphic Representation of True Lifecycle Cost Figure 2.40. Sustainable Neighbourhood Scenario—Estimate of taxes, User Fees, Initial DCCs
Figure 2.41. Comparison between Baseline and Sustainable Neighbourhood Scenarios —Initial Capital Costs
Figure 2.42. Comparison between Baseline and Sustainable Neighbourhood Scenarios: Annual Operating Costs
FM rev2_PREP vii 6/15/09 8:03:10 AM
viii | ECO2 CITIES: ECOLOGICAL CITIES AS ECONOMIC CITIES
Figure 2.43. Comparison between Baseline and Sustainable Neighbourhood Scenarios—Annual Municipal Costs & Necessary Revenues over 75 Years
Figure 2.44. Comparison between Baseline Scenario and Sustainable Neighbourhood Scenario—annual lifecycle cost per household
Figure 2.45 RETScreen Software Figure 2.46. Example of RETScreen Financial Summary Figure 2.47. Example of RETScreen Financial Summary- Visual Figure 2.48. Environmental Load Profi le (ELP) Figure 2.49. ELP-related Achievements in Hammarby Sjöstad Figure 2.50. Opportunities to Reduce Environmental Impacts Figure 2.51. Example Pages from a Foresight Paper on Technological Change Figure 2.52. Template for an Infl uence Diagram Figure 3.1. Cityscape of Curitiba Figure 3.2. Policy Integration in Curitiba Figure 3.3. Urban Growth Axes Figure 3.4. Density of Curitiba (2004) Figure 3.5. Zoning of Curitiba (2000) Figure 3.6. Evolution of the Integrated Bus Network (1974–1995, and 2009) Figure 3.7. Trinary Road System and Structure Figure 3.8. Bi-articulated BRT Bus and Bus Station Figure 3.9. Color-coded Buses and Their Capacities Figure 3.10. Barigüi ParkFigure 3.11. Slums in Flood-prone Area Figure 3.12. Transfer of Development Rights for Environmental Preservation Figure 3.13a Curitiba’s Waste Program: “Garbage that is not Garbage” Program Figure 3.13b. Curitiba’s Waste Program: “Green Exchange” Figure 3.14. Illegal Occupancy Figure 3.15. Transfer of Building Rights and Social Housing Figure 3.16. Social Housing Figure 3.17. Pedestrian Streets in the City Center Figure 3.18. Transfer of Building Rights for Heritage Preservation Figure 3.19. Green Line Figure 3.20. Stockholm Cityscape Figure 3.21. The Hammarby Model Figure 3.21a. Hammarby Sjöstad Cityscape Figure 3.21b. Residential Area in Hammarby Sjöstad Figure 3.22. Example of Monitoring the Major Reduction of Environmental Load Stems
from the Buildings, Real Estate and the City District of Hammarby SjöstadFigure 3.23. Funding from the LIP Subsidy Program Allocated across ‘Types of Projects’Figure 3.24. Vision for the New City District Stockholm Royal Seaport Figure 3.25. Singapore Cityscape Figure 3.26. Green Area in Singapore Figure 3.27. Closed Water Loop Figure 3.28. Waterfront of Yokohama Figure 3.29. Waste Reduction in Yokohama, FY2001–FY2007
FM rev2_PREP viii 6/15/09 8:03:10 AM
CO N T E N T S | ix
Figure 3.30. Waste Flow in Yokohama, FY2007 (thousand ton) Figure 3.31. Auckland Harbor Viewed from East Figure 3.32. Logo of START Figure 3.33. Strategic planning among many stakeholders at a 3-day regional charrette
Figure 3.34. Auckland Sustainability Framework (ASF) Figure 3.35. A Stylized Framework for Approaching Urban Energy Planning and
Management Figure 3.36. Urban Energy Supply Sources and Systems: A Stylized Sketch Figure 3.37. New York City: Key Stakeholders of Electricity Supply and ConsumptionFigure 3.38. Typical Barriers to Public Sector Sustainable Energy Investments Figure 3.39. Urban Density and Transport-related Energy Consumption Figure 3.40. Input and Output Framework of Water Sector Figure 3.41. Water Sector Institutional Setup Figure 3.42. Schematic Diagram of Water System Figure 3.43. Area at Risk from 0.5 m Sea-level Rise in Asia Figure 3.44. Annual Mean of Daily Precipitation Changes Expected by 2100 (mm) Figure 3.45. Stakeholders Dynamics & Accountability TriangleFigure 3.46. Savings in Water Supply Figure 3.47. Input and Output Framework for Transport Interventions Figure 3.48. Average New Vehicle Fuel Economy StandardsFigure 3.49. Structure of Curitiba’s Integrated Public Transport Network Figure 3.50. Colorado, USA Figure 3.51. Pedestrian-friendly Street of Curitiba, Brazil Figure 3.52. Example of Micro-Design and Walking Isochrones Figure 3.53. Benefi t of Select ITS Highway Applications Under Speed Conditions Figure 3.54. Classifi cation of ITS Market Packages Figure 3.55. Elements of Utility in Mode Choice Models Figure 3.56. Photo of Terminal Carmo in Curitiba with Adjacent Shops and
“Citizenship Street” Figure 3.57. Road Consumed by Equivalent Passengers in Cars, Bicycles and Bus Figure 3.58. Input and Output Framework for a Waste Management System Figure 3.59. Waste Hierarchy Figure 3.60. Waste Sorting Plant and Windrow Composting Operation (Cairo, Egypt)Figure 3.61. Landfi ll Compactor Operating on a Landfi ll Figure 3.62. Central Electricity Generation Facility and Flare for Landfi ll Gas
(Tianjin, China) Figure 3.63. Spatial Structures and Trips Pattern Figure 3.64. Parking Space as Real Estate in Marina Towers in Chicago Figure 3.65. 3D representation of the Spatial Distribution of Population in Gauteng
and in Metropolitan JakartaFigure 3.66. Profi le of Built up Densities in 9 Large Metropolises Figure 3.67. Addis Ababa—A2 ordability of Minimum Plot Size in Suburban Areas Figure 3.68. South Africa—Sharing of larger plot by lower income households
FM rev2_PREP ix 6/15/09 8:03:10 AM
MAPS
Map 3.1. Location of Curitiba Map 3.2. Location of City of Stockholm Map 3.3. Inner City of Stockholm with Adjacent City Development Areas Map 3.4. Master Plan of Hammarby Sjöstad Map 3.5. Location of Singapore Map 3.6. Location of Yokohama Map 3.7. Location of Brisbane Map 3.8. Location of Auckland Map 3.9. Singapore metro network is centered on an expanding CBD
TABLES
Table 1.1. The Eco2 Cities Principles and Pathways Table 1.2. Impacts of Government Actions on Land Markets, the Size of
the Informal Sector, and the Spatial Structure of Cities Table 1.3. Sample Indicators for the Four Capitals Approach Table 2.1: Comparative Statistics of Two Scenarios: City of Fort St. John Table 3.1. Time and Fuel Loss Due to Congestion Table 3.2. Water Tari2 Table 3.3. Water Consumption and Water Bills per Household in 1995, 2000, and 2004Table 3.4. Power of Stakeholder Engagement Table 3.5. Waste in Yokohama, FY2001–FY2007 Table 3.6. CO2 Reduction through Waste Reduction FY2001–FY2007 Table 3.7. Greenhouse Gas Emissions and Electricity Use by Brisbane City CouncilTable 3.8. Energy Consumption in Cities: Main Sectors/Clusters Table 3.9. Energy Consumption in Cities: Key End-use Activities and Energy TypesTable 3.10. Energy Policies and Regulations and Linkages to Cities Table 3.11. Indicative Economics of Sustainable Energy Options Table 3.12. Sustainable Urban Energy Indicators and Benchmarks—Preliminary ProposalTable 3.13. Economic Analysis Comparing Several Street Lighting Systems Table 3.14. Water Sector Management Systems Table 3.15. Policies, Legislation and Regulations Framework A2 ecting the Water SectorTable 3.16. Typical Objectives or Desired Outputs of Transport Interventions Table 3.17. Di2 erent Urban Transport Outcomes from Several Cities Table 3.18. Policies, Legislation and Regulations A2 ecting the Transport Sector Table 3.19. Transport Institutional Functions and Jurisdictions Table 3.20. Framework of Transport Interventions Table 3.21. Basic and Advanced Transport Interventions Table 3.22. Type of Development and Implications for Transport Table 3.23. Mobility Infrastructure Hierarchy Table 3.24. Elements of a Public Transport Network Table 3.25. Summary of Select Vehicle and Fuel Interventions Table 3.26. CO2 Emissions from a Range of Vehicle Types and Modes Table 3.27. Basic and Advanced Stakeholder Interests Table 3.28. Economic and Financial Aspects
x | ECO2 CITIES: ECOLOGICAL CITIES AS ECONOMIC CITIES
FM rev2_PREP x 6/15/09 8:03:10 AM
Table 3.29. Summary of Cross-Sector Integration Opportunities Table 3.30. Waste Generation Rates Table 3.31. Waste Composition by Income Table 3.32. Impact of Government actions on land markets, the size of the informal
sector and the spatial structure of cities Table 3.33. World Bank IBRD Load/ IDA Credit: Specifi c Investment Loans (SILs) Table 3.34. World Bank IBRD Load/ IDA Credit: Subnational Development Policy
Lending (DPL) Table 3.35. World Bank Group Financing: Joint IFC-World Bank Subnational
Finance Table 3.36. World Bank Group Financing: Financing and Services (IFC) Table 3.37. World Bank Group Financing: Guarantee (MIGA)Table 3.38. Multi Donor Funds: Climate Investment Funds Table 3.39. Multi Donor Funds: Global Environment Facility Table 3.40. Market Based Instruments: Carbon Finance, Carbon Partnership
Facility (CPF)
SELECTED ABBREVIATIONS
CO N T E N T S | xi
BRT Bus Rapid TransitCAGECE Companhia de Água e Esgoto do
CearaCAPEX capital expenditureCBD central business districtCDM Carbon Development Mechanism CHP combined heat and powerCO2 Carbon dioxideDSM Demand Side ManagementDSS Decision Support SystemELP Environmental Load Profi leESCO energy service companyFAR fl oor-area ratioFY fi scal yearGDP gross domestic productGEF Global Environment FacilityGHG greenhouse GasGIS Geographic Information SystemsIBRD International Bank for
Reconstruction and DevelopmentIDA International Development
AssociationIFC International Finance
CorporationIPPUC Institute for Research and Urban
Planning of CuritibaLCA life cycle assessment
LCC life cycle costingLED light-emitting diodeLFG landfi ll gasLNG liquefi ed natural gasLPG liquefi ed petroleum gasMDB Multilateral Development BankMFA material fl ow analysisMIGA Multilateral Investment
Guarantee AgencyNGO nongovernmental organizationNMT non-motorized transportNPO nonprofi t organizationNPV net present valueO2 oxygenOECD Organisation for Economic
Co-operation and DevelopmentOPEX operation expenditurePPP public private partnershipPSP private sector participation PT public transportR&D research and developmentSEK Sweden KronaSO2 sulfur dioxideTDM travel demand managementTDR transfer of development rights TOD transit oriented development
FM rev2_PREP xi 6/15/09 8:03:10 AM

FM rev2_PREP xii 6/15/09 8:03:10 AM
xiii
Urbanization in developing countries is a defi ning feature of the 21st century. Some 90 percent of global urban
growth now takes place in developing coun-tries—and between the years 2000 and 2030, developing countries are projected to triple their entire built-up urban areas. Urbanization has enabled economic growth and innovation across all regions—currently accounting for three quarters of global economic production. At the same time, urbanization has also con-tributed to environmental and socio-economic challenges, including climate change, pollution, congestion, and the rapid growth of slums.
Global urban expansion poses cities, na-tions and the international development com-munity with a fundamental challenge and op-portunity. It sets forth before us a once in a lifetime opportunity to plan, develop, build and manage cities that are simultaneously more ecologically and economically sustain-able. We have a short time horizon within which to impact the trajectory of urbanization in a lasting and powerful way. The decisions we make together today, can lock-in systemic benefi ts for current and future generations.
Foreword
The Eco2 Cities Program presents itself at a critical historic juncture in relation to this challenge and opportunity. This book, which marks the launch of the Eco2 Cities Program, sends a positive message. The knowledge and expertise to resolve these challenges exist, and forward-thinking cities in developed and de-veloping countries have already applied this knowledge to make the most of opportunities. Importantly, many cities have shown that cost is not a major barrier to accomplishing urban sustainability.
The Eco2 Cities Program is an integral part of the World Bank’s new Urban Strategy which is currently being developed in consultation with stakeholders. The Eco2 Cities Program is also complementary to the ongoing e2 orts the World Bank and its development partners are making in sustainable development and cli-mate change.
Cities are now on the frontlines of manag-ing change and leading the global development agenda. It is only through cities that poverty reduction, economic growth, environmental sustainability, and climate change challenges can be addressed together. Sustainable city
FM rev2_PREP xiii 6/15/09 8:03:10 AM

xiv | ECO2 CITIES: ECOLOGICAL CITIES AS ECONOMIC CITIES
planning, development, and management, can unite these objectives and link them to activi-ties at local, regional, national, and global lev-els. We believe the Eco2 Cities Program will
further enable cities to make the most of their opportunities in e2 ective, creative, and holistic ways, thereby ensuring a more meaningful and sustainable future.
FM rev2_PREP xiv 6/15/09 8:03:10 AM
xv
The World Bank’s Eco2 Cities Program was conceived, developed and is man-aged by Hiroaki Suzuki (Team Leader)
and Arish Dastur (Co-Team Leader), who au-thored, compiled and edited the content of this book together with Sebastian Mo2 att and Nanae Yabuki.
The other contributing authors to this book are: Hinako Maruyama, Feng Liu, Jas Singh, Georges Darido, Khairy Al Jamal, Charles W. Peterson, Alain Bertaud, Nobue Amanuma, Malin Olsson, Karolina Brick, Maria Lennarts-son, and Bernd Kalkum. The peer reviewers for this report were Stephen Karam, Robert Taylor, Neeraj Prasad, Josef Leitmann, and Sam Zimmerman. Important comments and suggestions were received from Alan Coulthart, Tim Suljada, Brian Dawson, Carly Price from AusAID, Thomas Melin from SIDA, Sumter Lee Travers and Fang Chen from the Interna-tional Finance Cooperation (IFC), as well as Jas Singh, Victor Vergara, Shomik Mehndirat-ta, William Kingdom, Jan Bojo, Paul Kriss, Rohit Khanna, Peter Ellis, Habiba Gitay, Mir Altaf, Rama Chandra Reddy, Monali Ranade, Axel Baeumler, Nat Pinnoi, Masato Sawaki and Johannes Heister, from the World Bank.
Acknowledgements
Geo2 rey Payne, Örjan Svane and Richard Stren provided valuable suggestions at the early stages of Eco2, and Yuko Otsuki provided strong support to the team.
This book benefi ted from the guidance of Keshav Varma, Sector Director of Urban De-velopment for the East Asia and Pacifi c Region of the World Bank. Strong support was also provided by John Roome, Christian Delvoie, Abha Joshi-Ghani, Eleoterio Codato, Ede Jorge Ijjasz-Vaquez, and Amarquaye Armar.
Dean Thompson provided select editorial support. Elisabeth Mealey provided advice on our communications strategy. Claudia Gaba-rain contributed to the web design and online strategy. Patricia Katayama provided guidance to the team on publishing. Debra Naylor of Nay-lor Design Inc. is responsible for the cover de-sign and layout of the book. Many graphics were provided by Sebastian Mo2 att and The Sheltair Group. Jonathan Miller, Jaime F. Alva-rez and Laurie Weber of Art & Negative man-aged the printing of this edition. Inneke Hera-wati, Bobbie Brown, Vellet Fernandes, and Sandra Walston provided important logistical support.
FM rev2_PREP xv 6/15/09 8:03:11 AM
xvi | ECO2 CITIES: ECOLOGICAL CITIES AS ECONOMIC CITIES
The team acknowledges the valuable con-tributions of the Sheltair Group, and the World Bank’s Energy Sector Management Assistant Program (ESMAP) and Finance Economics and Urban Development (FEU) Department. The team also acknowledges the guidance re-ceived from key decision-makers in the follow-ing cities: 1) City of Curitiba, Brazil, especially, Mr. Carlos Alberto Richa, Mayor; Mr. Eduardo Pereira Guimarães, Secretary of International Relations; Mr. Cléver Ubiratan Teixeira de Almeida, President, IPPUC, and Ms. Priscila Tiboni, Foreign A2 airs Advisory, IPPUC; 2) City of Stockholm, Sweden, especially, Ms. Ma-lin Olsson, Head of Section, City Planning; and
Mr. Klas Groth, City Planning; 3) City of Van-couver, Canada, especially Mr. Brent Toderian, Director of Planning; 4) City of Yokohama, Ja-pan, especially Mr. Toru Hashimoto, Senior Project Manager, Co-Governance and Creation Taskforce; and 5) City of Brisbane, Australia, especially Mr. David Jackson, Manager, Eco-nomic Development; Mr. John Cowie, Senior Project O9 cer, Economic Development; and Mr. Lex Drennan, CitySmart Project Director.
This publication was made possible from scaled-up funding from the World Bank’s East Asia and Pacifi c Region, and generous co-funding from the Australian Government’s overseas aid program AusAID.
FM rev2_PREP xvi 6/15/09 8:03:11 AM
xvii
This book provides an overview of the ‘Eco2 Cities: Ecological Cities as Eco-nomic Cities’ Program. The objective of
the Eco2 Cities Program is to help cities in de-veloping countries achieve greater ecological and economic sustainability.
What do we mean by Ecological Cities?
Ecological cities enhance the wellbeing of citizens and society through integrated urban planning and management that fully harness-es the benefi ts of ecological systems, and pro-tects and nurtures these assets for future gen-erations.
Ecological cities value their own ecological assets as well as the regional and global ecolo-gies they depend on. Through their leadership, planning, policies and regulations, institution-al measures, strategic collaborations, urban design, and holistic long-term investment strategies, they drastically reduce the net dam-age to the local and global environment—while simultaneously improving the overall wellbe-ing of their citizens and the local economy.
Preface
Ecological cities also learn from and incorpo-rate management and design solutions from the e9 cient self-organizing strategies used by ecosystems.
What do we mean by Economic Cities?
Economic cities create value and opportuni-ties for citizens, businesses, and society by ef-fi ciently utilizing all tangible and intangible assets, and enabling productive, inclusive, and sustainable economic activity.
Often, when people talk about economic cities, they are referring to a narrower defi ni-tion of ‘productive’ cities, driven by a singular emphasis placed on the indicator of GDP. While productivity is certainly a fundamental attribute of economic cities, it is not the only one, and often the short term and excessive pursuit of productivity or profi t displaces fun-damental social and cultural considerations, and might undermine longer term economic resilience. In some cases, productivity over-shadows our basic value systems, and exposes us to substantial risk—as is evidenced in the
FM rev2_PREP xvii 6/15/09 8:03:11 AM
xviii | ECO2 CITIES: ECOLOGICAL CITIES AS ECONOMIC CITIES
causes and consequences of the current global economic crisis. In the Eco2 Cities program, we propose a more balanced notion of eco-nomic cities—where the emphasis falls on sus-tainable, innovative, inclusive, and resilient economic activity, within the context of a larg-er cultural and value system.
So what do we mean by an Eco² City?
As the name implies, an Eco2 City builds on the synergy and interdependence of ecological and economic sustainability and their fundamental ability to reinforce and strengthen each other in the urban context.
Innovative cities have demonstrated that with the appropriate strategic approach they can greatly enhance their resource e9 ciency by realizing the same value from a much small-er and renewable resource base—while simul-taneously decreasing harmful pollution and unnecessary waste. By doing so, they have im-proved the quality of life of their citizens, en-hanced their economic competitiveness and resilience, strengthened their fi scal capacity, and created an enduring ‘culture’ of sustain-ability. At the same time, many of their inter-ventions have also provided signifi cant benefi ts to the poor. Urban sustainability of this kind is a powerful and enduring investment that will pay compounding dividends. In a fast-paced and uncertain global economy, such cities are most likely to survive shocks, attract business-es, manage costs, and prosper.
It is with the purpose of enabling cities in developing countries to realize this value, and to take on a more rewarding and sustainable growth trajectory while the window of oppor-tunity is still open to them, that the Eco2 Cities Program has been developed.
How does the Eco² Cities Program work?
The World Bank’s Eco2 City program is a broad platform that will provide practical and scal-able, analytical and operational support for cit-ies in developing countries to achieve ecologi-cal and economic sustainability.
The issuing of this book marks the comple-tion of the fi rst phase of the Eco2 Cities Pro-gram—the development of the analytical and operational framework. This framework can be adapted by cities in developing countries to systematically work toward and accomplish the positive results mentioned above. The ana-lytical and operational framework is rooted in four key principles. These are 1) ‘A City Based Approach,’ which enables local governments to lead a development process that takes into ac-count their specifi c circumstances, including their local ecology; 2) ‘An Expanded Platform for Collaborative Design and Decision Making,’ that accomplishes sustained synergy by coordi-nating and aligning the actions of key stake-holders; 3) ‘A One System Approach,’ that en-ables cities to realize the benefi ts of integration by planning, designing, and managing the whole urban system; and 4) ‘An Investment Framework that Values Sustainability and Re-siliency,’ by incorporating and accounting for life cycle analysis, the value of all capital assets (manufactured, natural, human, and social), and a broader scope of risk assessments in de-cision making.
Through these principles are derived a set of core elements. Using the analytical and op-erational framework, each city can operation-alize the core elements into a series of concrete action items or ‘stepping stones,’ that should take into account local conditions, in a logical sequence. Together these stepping stones en-able a city to develop its own unique Eco2 ac-tion plan, called an Eco2 Pathway.
In this context, an Eco2 City is a city which formally accepts the four key principles, ap-
FM rev2_PREP xviii 6/15/09 8:03:11 AM
PREFACE | xix
plies the analytical and operational framework to its particular context, and by doing so devel-ops and begins to implement its own Eco2 Pathway.
Clearly, taking on all the core elements si-multaneously may not always be possible for all cities. Many cities will probably need to take an incremental or phased approach. Often, cit-ies may begin by engaging in capacity building and by targeting their most critical priority through the development and implementation of an Eco2 Catalyst project. Unlike stand alone projects in resource e9 ciency, what will dis-tinguish an Eco2 Catalyst project is its explicit objective and ability (beyond its immediate project scope and objectives) to drive the city forward on its Eco2 Pathway by catalyzing a process of change.
How will the Eco² Cities Program Evolve?
The second phase of the Eco2 program has be-gun with the release of this book, and will fo-cus on the application of this framework in specifi c pilot cities.
Application in the real world will initially require strong e2 orts and commitment. It will require political will, leadership, capacity building, collaboration, institutional reform, and even a new process for creative design and decision-making. However, the successful ap-plication of such a program will leave behind a legacy—as it has already done in the inspiring cases you will encounter through this book. The Eco2 Program is intended to provide the support that cities will need to make their own transition. It brings together a network of part-ners and practitioners, who share in the Eco2
philosophy, and who can all contribute to the process in their own capacities.
It will be important that the fi rst set of pilot Eco2 Cities demonstrate strong political will and city leadership. A fundamental issue in the second phase is to ensure that the fi rst set of pi-lot cities provides a genuine and strong oppor-tunity to mainstream Eco2, and to e2 ectively implement changes. Diversity between the con-ditions and contexts of the fi rst set of pilot cities (city size, geographic conditions, socio-eco-nomic conditions, institutional framework, fi s-cal capacity, etc.) will also be important. This will provide a broader and richer platform on which to apply the Eco2 framework, and there-by enable the program to learn from and assess its value-added in di2 erent circumstances.
It is evident that a city-by-city approach will be important as we pilot Eco2, and learn from the ground level experiences of each case. How-ever, given the magnitude and rate of ongoing urbanization, we will not be able to achieve the desired global impact within the window of op-portunity that currently presents itself, if we limit ourselves to a city-by-city approach. Ac-cordingly, the third phase of Eco2 will aim at mainstreaming and scaling up the Eco2 Cities Program through institutionalized national programs.
As we continue to work towards our com-mon objectives, the Eco2 Cities Program will evolve and grow as new knowledge, methods, tools, and resources become available. As we forge new partnerships and work with more cities, new possibilities and innovative ideas will continue to present themselves. The Eco2 Cities Program will constantly work to incor-porate these in an inclusive, iterative, and pur-poseful way.
FM rev2_PREP xix 6/15/09 8:03:11 AM

FM rev2_PREP xx 6/15/09 8:03:11 AM
xxi
This book is divided into three parts.
Part One is the framework for Eco2. It de-scribes the approach, beginning with the background and rationale. Key challenges are described, and lessons are drawn from cities which have managed to turn these challenges into opportunities. A set of four key principles are introduced. The program is then devel-oped around these four principles. Each of the principles is addressed in separate chap-ters that describe the core elements of the program, and the stepping stones that each city can follow as they develop their own unique Eco2 ‘pathway.’ Part One concludes with an overview of some of the ways in which cities can draw on the resources of var-ious development partners as they embark on their Eco2 pathways.
Part Two of the book is a City-based Decision Support System that introduces a set of core methods and tools to help cities as they devel-op their own Eco2 pathway, and work towards applying some of the core elements and step-ping stones outlined in Part One. Part Two
The Structure of this Book
looks into methods for collaborative design and decision-making, and methods to create an e2 ective long-term framework that can align policies and actions of stakeholders. Part Two then looks into material fl ow analysis, as well as the use of layered maps to facilitate a more integrated approach to urban infrastructure and spatial planning. Techniques for life cycle costing are described, and specifi c tools are referenced. Finally, Part Two introduces meth-ods for forecasting workshops and resiliency planning. It is expected that as the Eco2 pro-gram grows, there will be greater depth of in-formation generated to enrich the City-based Decision Support System.
Part Three of the book is a ‘Field Reference Guide’ that contains background literature de-signed to support cities in developing more of an in-depth insight and fl uency with the issues at two levels. This section provides a city-by-city and sector-by-sector lens on urban infra-structure. It begins with a section on a series of case studies from best practice cities around the world. Each city o2 ers the program a very di2 erent example of how various elements of
FM rev2_PREP xxi 6/15/09 8:03:11 AM
xxii | ECO2 CITIES: ECOLOGICAL CITIES AS ECONOMIC CITIES
the Eco2 approach can be applied. Most of these cities have already agreed to be a partner in the Eco2 Cities Program. The next section comprises of a series of Sector Notes, each of which explores sector specifi c issues as they pertain to urban development. The sectors in-clude: energy, water, transport and solid waste. This section also includes a note on the man-agement of the spatial structure of cities. To-gether, these sector notes provide insight on how each sector functions, and on how they currently interrelate with each other. As we view these issues from a city-by-city and sec-tor-by-sector lens, a bigger picture starts to emerge. Part Three also includes a fi nal section on some of the specifi c fi nancial instruments of the World Bank.
While the fi rst two parts of this book ad-dress the Eco2 Cities Program directly, the Field Reference Guide provides the back-ground on current best practices, and a full scope of policies, specifi c measures, and insti-tutional structures which need to be consid-ered. Together, these three parts provide cities with an up-to-date survey of the terrain ahead, and guidance on how to move forward on an Eco2 pathway. This book is a conference edi-tion that lays out the scope of Eco2, and should be viewed as an evolving document, particu-larly Parts Two and Three. We will soon be launching the Eco2 Cities program website at www.worldbank.org/eco2, which will provide detailed and updated information on a regular basis.
FM rev2_PREP xxii 6/15/09 8:03:11 AM
1
Challenges and Opportunities
Urbanization in developing countries may be the single greatest change in our century. It is projected that developing countries will have tripled their entire built-up urban area be-tween 2000 and 2030—from 200,000 square kilometres to 600,000 square kilometres.1 These 400,000 square kilometres of new ur-ban built up area, which are being constructed within just 30 years, equals the entire world’s total built up urban area as of 2000.2 One could say we are building a ‘whole new world’ at about 10 times the speed, in countries with se-vere resource constraints (natural, fi scal, ad-ministrative, and technical). We are doing so in an increasingly globalized context with many new, constantly fl uctuating, interlinked, and uncontrollable variables.
So what is driving the massive rates of ur-banization described above? Historically, and across most regions, urbanization has pro-pelled the growth of national economies. On average about 75 percent of global economic production takes place in cities, and in devel-oping countries this share is now rapidly in-
Executive Summary
creasing.3 In many developing countries, ur-ban shares of GDP already surpass 60 percent.4 In most regions of the world, the opportuni-ties provided by urbanization, have enabled large segments of the population to lift them-selves out of poverty.
However, urbanization at this rate and scale is certain to be accompanied by unprecedent-ed consumption and loss of natural resources. Calculations already show that if developing countries urbanize and consume resources as developed countries have, an ecological re-source base as large as 4 planet earths would be needed to support their growth.5 But, of course, we have only one Earth. As the under-lying resource base required to sustain such a transition does not exist, cities in developing countries, as well as ones in developed coun-tries, must fi nd more e9 cient ways to meet the needs of their populations.
It is clear that if we are to absorb and sus-tain this powerful wave of urbanization, while continuing to manage the existing built stock, we will need a paradigm shift. Fundamental questions to be addressed are: How can cities continue to e2 ectively harness the opportuni-
FM rev2_PREP 1 6/15/09 8:03:11 AM
2 | ECO2 CITIES: ECOLOGICAL CITIES AS ECONOMIC CITIES
ties for economic growth and poverty reduc-tion o2 ered by urbanization, while also miti-gating its negative impacts? How can cities do so given the speed and the scale at which this urbanization is progressing, and given their own capacity constraints? How can ecological and economic considerations be dovetailed, so that they result in cumulative and lasting ad-vantages for cities? How do we go from ‘Eco vs. Eco’ to ‘Eco2 Cities’?
Innovative cities have demonstrated that with the appropriate strategic approach they can greatly enhance their resource e9 ciency by realizing the same value from a much small-er and renewable resource base—while simul-taneously decreasing harmful pollution and unnecessary waste. By doing so, they have im-proved the quality of life of their citizens, en-hanced their economic competitiveness and resilience, strengthened their fi scal capacity, and created an enduring ‘culture’ of sustain-ability. At the same time, many of their inter-ventions have provided signifi cant benefi ts to the poor. Urban sustainability of this kind is a powerful and enduring investment that will pay compounding dividends. In a fast-paced and uncertain global economy, such cities are most likely to survive shocks, attract business-es, manage costs, and prosper.
What is most encouraging about the e2 orts made by these innovative cities is that many of the solutions are a2 ordable—even when bud-gets are limited—and they generate returns, including direct and indirect benefi ts for the poor. At the same time, much of the success can be achieved using existing and well proven methods and technologies, and by focusing on home-grown localized solutions.
The challenge that lies ahead is to take full advantage of the many opportunities created by the rapid rates of change and by successful innovations. Inappropriate institutional struc-tures and mindsets are commonly cited as the single greatest challenge when cities try to im-plement such opportunities. Best practices do exist for long term planning and regional
growth management, and an emergence of new tools for systems analysis and mapping of-fer potential for more integrated, practical, and rigorous analysis and planning. Methods for collaborative design and decision-making among key stakeholders have also proven ef-fective. Realizing that successful cities are of-ten fundamental to successful nations, higher levels of government are increasingly key part-ners in helping cities take initiative.
There is also growing concern and commit-ment at the international level for supporting cities and for fi nancing longer-term invest-ments within cities. New funding opportunities have emerged for cities in developing countries that are willing to implement actions to achieve sustainable urban development—particularly measures promoting energy and resource e9 -ciency that lead to GHG emission reductions. New accounting methods for estimating the full costs and benefi ts of various policy, plan-ning, and investment options are also being used (e.g., Life Cycle Costing). At the same time, accounting for all capital assets (manufactured, natural, social, and human) and the services they provide, o2 ers a more holistic and com-plete incentive framework to cities. Channel-ling these opportunities toward the massive scale and accelerating pace of urban develop-ment creates the potential for tremendous posi-tive impact.
It is with the purpose of enabling cities in developing countries to benefi t from the prom-ise of a more rewarding and sustainable growth trajectory while the window of opportunity is still open to them, that the Eco2 Cities Program has been developed.
The Analytical and Operation Framework
The Eco2 analytical and operational framework is rooted in four key principles. Cities will face challenges when trying to adopt a new ap-proach. These challenges have been carefully
FM rev2_PREP 2 6/15/09 8:03:11 AM
E X E C U T I V E S U M M A RY | 3
anticipated in the framework, and together with the valuable ground level lessons from best practice cities they help to frame our stra-tegic response: the key principles that will de-fi ne the Eco2 Cities Program. Each of these has been elevated to status of principle, because it is widely applicable, critical to success, and fre-quently ignored or under-appreciated.
These four principles are 1) ‘A City Based Approach,’ which enables local governments to lead a development process that takes into account their specifi c circumstances, includ-ing their local ecology; 2) ‘An Expanded Plat-form for Collaborative Design and Decision Making’ that accomplishes sustained synergy by coordinating and aligning the actions of key stakeholders; 3) ‘A One System Approach’ that enables cities to realize the benefi ts of integra-tion by planning, designing, and managing the whole urban system; and 4) ‘An Investment Framework that Values Sustainability and Re-siliency’ by incorporating and accounting for life cycle analysis, the value of all capital assets (manufactured, natural, human, and social), and a broader scope of risk assessments in de-cision making.
The four principles are interrelated and mutually supportive. For example, without a strong city-based approach, it is very di9 cult to fully engage key stakeholders through an ex-panded platform for collaborative design and decision-making. And without this expanded platform, it is di9 cult to explore creative new approaches to the design and management of integrated systems, and to coordinate policies to implement through the one system ap-proach. Prioritization, sequencing, and e2 ec-tiveness of investments in sustainability and resiliency will be greatly enhanced by appreci-ating the city as ‘one system’ and expanding the platform of collaboration.
Through these four key principles are de-rived a set of core elements that further defi ne the Eco2 Framework. Cities are encouraged to operationalize the core elements into a series of concrete action items or ‘stepping stones,’
that take into account local conditions, and fol-low a logical sequence. Together, these step-ping stones enable a city to develop its own unique Eco2 action plan, called an Eco2 Path-way. The Eco2 Cities program also introduces cities to methods and tools that will lead to more e2 ective decision-making through pow-erful diagnostics and scenario planning. These methods and tools can also be used to opera-tionalize the core elements and to implement the stepping stones.
In this context, an Eco2 City is a city which formally accepts the four key principles, ap-plies the Analytical and Operational Frame-work to its particular context, and by doing so develops and begins to implement its own Eco2 Pathway.
PRINCIPLE 1: A City-Based Approach
A city-based approach is the fi rst principle, and it carries two complementary messages. First-ly, it recognizes that cities are now at the front lines of managing change and leading an inte-grated approach. Not only do cities now em-body the engines of economy and the homes of citizens, they also are responsible for a majori-ty of resource and energy consumption, and harmful emissions. Only at the city level is it possible to integrate the many layers of site specifi c information, and to work closely and rapidly with the many stakeholders whose in-put can impact the e2 ectiveness of an Eco2
Pathway, and who have a stake in its successful implementation. In addition, fi scal and admin-istrative decentralisation has brought impor-tant decision making and management respon-sibility to local governments. Cities can exercise proactive leadership, and thereby trigger a pro-cess of change.
Secondly, a city based approach serves to emphasize the importance of incorporating within any development program the unique aspects of place—especially ecological systems. In this sense, a city-based approach responds to opportunities and constraints of local ecolo-
FM rev2_PREP 3 6/15/09 8:03:11 AM
4 | ECO2 CITIES: ECOLOGICAL CITIES AS ECONOMIC CITIES
gies. How might development fi t into the to-pography of the area so that water is provided by gravity, and so that drainage is provided by natural systems (reducing the need for expen-sive infrastructure investments and related op-eration costs)? How might a city protect its wa-ter recharge areas and wetlands, so that water capacity and quality are sustained? How do we distribute populations and design cities so that local or regional renewable energy—windy sites, forests, solar access—is su9 cient to meet basic needs? These types of questions may ulti-mately provide urban professionals with their most exciting design challenge: how to fi t cities into the landscape in ways that respect and complement the natural capital, and ensure ecological services are available for present and future generations.
A city-based approach is thus very place specifi c, with a focus on enabling local leader-ship, local ecologies, and the broader local con-text. In fact, one of the fi rst stepping stones of a city will be to review and adapt the Eco2 frame-work to the local context.
PRINCIPLE 2: An Expanded Platform for
Collaborative Design and
Decision-making
Cities are increasingly experiencing a splinter-ing of infrastructure responsibilities, the over-lapping and intersection of jurisdictions, and an increase in private sector ownership of key assets. If cities are to lead the process of urban development, especially in the context of rapid urbanization, it is important to get ahead of this curve.
A city can lead a collaborative process on at least three tiers of an expanded platform. At the fi rst tier, projects may be completely within the realm of control of the city administration itself, and will entail a city getting its own house in order—for example, by supporting an energy ef-fi ciency upgrade for all municipally-owned buildings, or a ride-share program for employ-ees, or energy and transport peak load manage-
ment by adjusting working hours. At the second tier, projects will involve the city in its capacity as a provider of services and include its formal planning, regulatory, and decision making pow-ers—this can include water provision, land use planning, or transit development. At this level, greater collaboration is warranted with other stakeholders (including the private sector and consumers) who can infl uence, and who might be impacted by, the outcomes. The third tier of the expanded platform will entail collaboration at the scale of the entire urban area or region—this can pertain to issues like the development of new land or metropolitan management—and may necessarily involve senior governments, key private sector partners, and civil society.
A core element of the triple tier platform for collaboration is a shared long-term plan-ning framework for aligning and strengthen-ing the policies of both the city administration and key stakeholders, and for guiding future work on Eco2 projects. In this way, triple tier collaboration can get everyone rowing in the same direction.
PRINCIPLE 3: A One-System Approach
The One System Approach is about taking full advantage of all opportunities for integration by learning to view the city and the urban en-vironment as a complete system. Once we see the city and the urban environment as a sys-tem, it is easier to design the elements to work well together. This can mean enhancing the e9 ciency of resource ‘fl ows’ in an urban area through integrated infrastructure system de-sign and management. For example, the loop-ing and cascading of energy or water through a hierarchy of uses can satisfy many demands with the same unit of supply.
The One System Approach also includes integrating urban ‘form’ with urban ‘fl ows’ by coordinating spatial development (land use, urban design, and density) with the planning of infrastructure systems. For instance, new development can be directed to those loca-
FM rev2_PREP 4 6/15/09 8:03:11 AM
E X E C U T I V E S U M M A RY | 5
tions with a surplus of water, energy, and tran-sit. Urban form and spatial development also establish the location, concentration, distri-bution, and nature of demand nodes that im-pact the design of infrastructure system net-works. By doing so, urban form establishes the physical and economic constraints and parameters for infrastructure system design, capacity thresholds, technology choices, and the economic viability of di2 erent options. This has tremendous implications for re-source use e9 ciency.
It is a challenge, and a huge opportunity, for any city to integrate the planning of fl ows and forms, and operationalize initiatives. The One System Approach also focuses on how to im-plement projects using a more integrated im-plementation approach. This means sequenc-ing investments so that the city sets the correct foundation by addressing the long-lasting, cross cutting issues fi rst. This also means cre-ating a policy environment that enables an in-tegrated approach, co-ordinating a full range of policy tools, collaborating with stakeholders to align key policies, and targeting new policies to refl ect the di2 erent circumstances between urbanization in new areas and improving ex-isting urban areas.
Integration can apply to the elements with-in a sector, or across sectors. It can apply to implementation policies, collaboration of stakeholders and their plans, sequencing of fi -nancing mechanisms, and all of these in combi-nation! In every case, the integration of ele-ments tends to reveal opportunities for greater e9 ciency, synergy, and increased utility from a given investment, with corresponding im-provements in ecological and economic per-formance.
By applying the One System Approach, cit-ies, and their surrounding natural and rural ar-eas, can strive to coalesce into a functional sys-tem that works well as a new whole.
PRINCIPLE 4: An Investment Framework
that Values Sustainability
and Resiliency
The simple concept of investing in sustainabil-ity and resiliency for cities has become ex-tremely di9 cult to put into action. Policies, plans, and projects tend to be assessed on their short term fi nancial returns, or on an economic valuation based upon narrowly structured cost benefi t analysis, from the perspective of a sin-gle stakeholder or project objective. Invest-ments are valued in monetary terms, and what cannot be monetarised is either ignored, or ad-dressed on the side as ‘externalities.’ Decisions are dominated by immediate capital costs, de-spite the fact that often over 90 percent of life-cycle costs for typical infrastructure are ex-pended during operational maintenance and rehabilitation.
Few cities worldwide have a real knowledge of the impact of new development on their long-term fi scal condition. Lifecycle costs are often back-loaded, which means that future generations will have a massive infrastructure defi cit, as they face costs for repair and replace-ment of infrastructure without any prior capi-talisation.
At the same time, ecological assets, the ser-vices they provide, and the economic and so-cial consequences of their depletion and de-struction are not accounted for in most government budgets. Since these assets are not measured, they are treated as zero value—and their services go unaccounted for. Principle 4 requires that cities adopt a new framework for making policy and investment decisions.
The framework has multiple elements. A new range of indicators and benchmarks must be adopted for assessing and rewarding perfor-mance of all stakeholders. The family of indica-tors must address the needs of di2 erent catego-ries of decision-makers (e.g., strategy evaluation vs. operational). Longer time horizons are needed, and life-cycle cost-benefi t analysis must be applied to understand full implications
FM rev2_PREP 5 6/15/09 8:03:11 AM
6 | ECO2 CITIES: ECOLOGICAL CITIES AS ECONOMIC CITIES
of policies and investment options. All four cat-egories of capital assets (manufactured, natural, human, and social) and the services they pro-vide must be appropriately valued or priced—and monitored through indicators. The combi-nation of indicators should be viewed as a whole so that the qualitative dimensions of city life (cultural, historic, and aesthetic) cannot be ig-nored when assessing costs and benefi ts.
At the same time, investing in sustainability and resiliency will entail broadening our scope of risk assessment and management to include managing the many indirect, di9 cult to mea-sure risks that nonetheless threaten the viability of an investment or even the city as a whole.
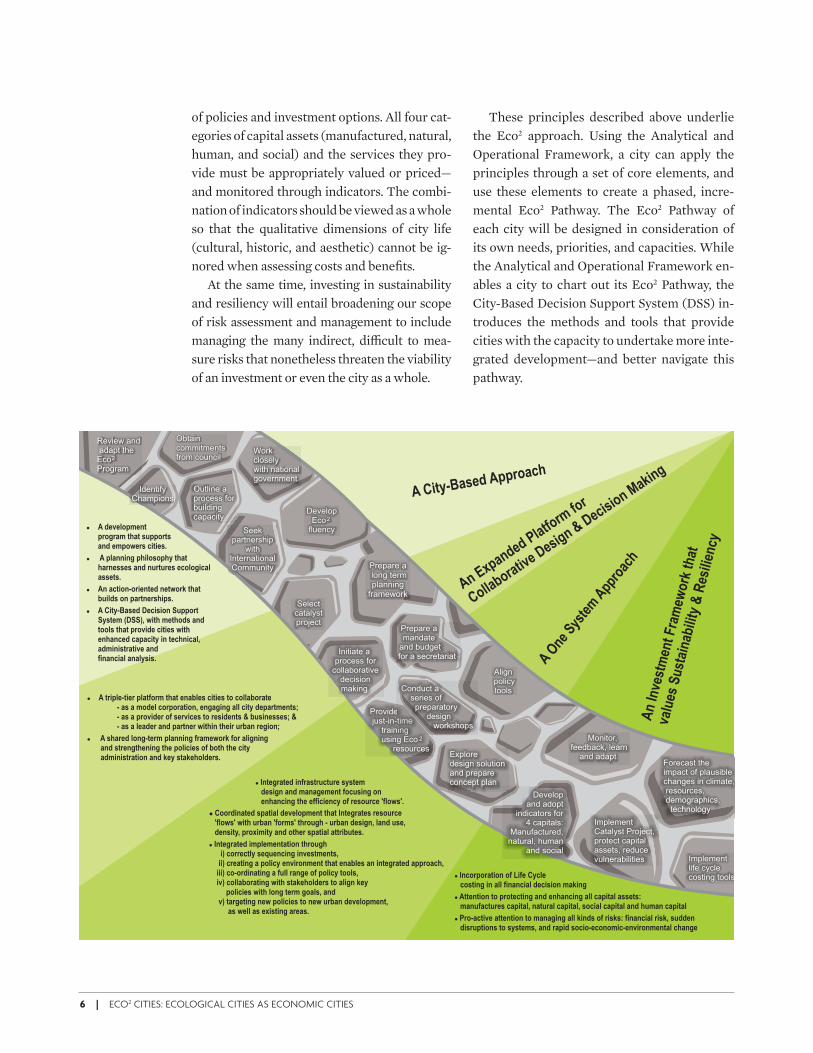
These principles described above underlie the Eco2 approach. Using the Analytical and Operational Framework, a city can apply the principles through a set of core elements, and use these elements to create a phased, incre-mental Eco2 Pathway. The Eco2 Pathway of each city will be designed in consideration of its own needs, priorities, and capacities. While the Analytical and Operational Framework en-ables a city to chart out its Eco2 Pathway, the City-Based Decision Support System (DSS) in-troduces the methods and tools that provide cities with the capacity to undertake more inte-grated development—and better navigate this pathway.
A City-Based Approach
A One
Sys
tem
App
roac
h
An Expanded Platform
for
Collaborativ
e Design & Decision Making
An
Inve
stm
ent
Fra
mew
ork
th
at
valu
es S
ust
ain
abili
ty &
Res
ilien
cy
Review and adapt the
Program
2Eco Work closely with national government
Seek partnership
with International Community
Develop2Eco
fluency
Select catalyst project
Prepare a long term planning
framework
Prepare amandate
and budget for a secretariat
Provide just-in-time training using resources
2Eco
etime ing
Conduct a series of preparatory design workshops
Exploredesign solutionand prepare concept plan
Monitor, feedback, learn
and adapt
Implement life cycle costing tools
Implement Catalyst Project, protect capital assets, reduce vulnerabilities
Forecast the impact of plausiblechanges in climate, resources, demographics, technology
Develop and adopt
indicators for 4 capitals:
Manufactured, natural, human
and social
Align policy tools
Initiate a
process for collaborative
decision making
Outline a process for building capacity
Identify Champions
Obtain commitments from council
lA development program that supports and empowers cities.
l A planning philosophy that harnesses and nurtures ecological assets.
lAn action-oriented network that builds on partnerships.
lA City-Based Decision Support System (DSS), with methods and tools that provide cities with enhanced capacity in technical, administrative and financial analysis.
l
- as a model corporation, engaging all city departments; - as a provider of services to residents & businesses; &- as a leader and partner within their urban region;
l A shared long-term planning framework for aligning and strengthening the policies of both the city administration and key stakeholders.
A triple-tier platform that enables cities to collaborate
l Incorporation of Life Cycle costing in all financial decision making
l Attention to protecting and enhancing all capital assets: manufactures capital, natural capital, social capital and human capital
l Pro-active attention to managing all kinds of risks: financial risk, sudden disruptions to systems, and rapid socio-economic-environmental change
l Coordinated spatial development that Integrates resource 'flows' with urban 'forms' through - urban design, land use, density, proximity and other spatial attributes.
l Integrated implementation through i) correctly sequencing investments, ii) creating a policy environment that enables an integrated approach, iii) co-ordinating a full range of policy tools, iv) collaborating with stakeholders to align key policies with long term goals, and v) targeting new policies to new urban development, as well as existing areas.
l Integrated infrastructure system design and management focusing on enhancing the efficiency of resource 'flows'.
FM rev2_PREP 6 6/15/09 8:03:12 AM
E X E C U T I V E S U M M A RY | 7
A City-Based Decision Support System
The City-Based Decision Support System intro-duced in Part Two of this book, is part of the Eco2 Program, and enables cities to better develop their capacity to operationalize some of the core elements of the Eco2 Program. It comprises a few core methods that together provide cities with a greater ability to implement the core ele-ments of the four principles listed above.
The fundamental purpose of these methods is to simplify the process of analysis, assess-ment, and decision-making. They provide practical ways for cities to take leadership, col-laborate, and analyze and asses various ideas for Eco2 projects. All methods are proven ap-proaches to getting the work done. They are expected to remain relevant for many years.
The chosen methods support the typical planning process at di2 erent times and in dif-ferent ways. Some methods can be used re-peatedly. For example, meta-diagrams that summarize resource fl ows can be used fi rstly as a way to baseline how a location is currently performing, and then later to help with diag-nosing, target setting, scenario development, and also cost assessment.
As an illustration, ‘Methods for Analyzing Flows and Forms’ reveal the important relation-ships between spatial attributes of cities (forms) and their physical resource consumption and emissions (fl ows). The combination of these analytical methods helps cities to develop a ‘transdisciplinary’ platform to analyze current situations as well as forecast scenarios.
One of the fi rst Stepping Stones on the Eco2 Pathway is to plan a process for capacity build-ing. Reviewing the DSS is a good place to begin. It sets out the scope of skills and knowledge that are an essential part of Eco2. While this book simply introduces the core methods, the capacity building plans of a city can include ob-taining more information, acquiring specifi c tools, obtaining outside technical support, and applying the methods to a catalyst project.
A Field Reference Guide
The Eco2 Field Reference Guide provided as Part Three of this book, is a technical resource specially tailored to building ground level and technical knowledge. It contains background literature designed to support cities in devel-oping more in-depth insight and fl uency with the issues at two levels. It provides a city-by-city and sector-by-sector lens on urban infra-structure. It begins by exploring a series of case studies from best practice cities around the world. Each city o2 ers the program a very di2 erent example of how various elements of the Eco2 approach can be applied. Some of these cities have already agreed to be a part-ner in the Eco2 Cities Program, and to assist cities in developing countries with their spe-cifi c challenges.
The fi eld reference guide also provides a se-ries of Sector Notes, each of which explores sector specifi c issues as they pertain to urban development. As cities develop their Eco2 Path-ways, it helps to survey issues through the lens of each urban infrastructure sector. Ideally, this leads to a kaleidoscopic view of the city, where each perspective can be turned to the next, as we interrelate energy, water, transport, and solid waste with each other and with the built form of the city.
It becomes clear as we study these sectors that many of their operational and jurisdic-tional lines impede innovation and creativity in achieving better outcomes. What is also clear is that investments made in one sector can result in savings in another sector (for ex-ample, investments in water e9 ciency usually result in large energy cost savings), and that pooling scarce resources to invest in multi-functional and multipurpose common ele-ments can benefi t everyone (for instance, through single purpose underground infra-structure corridors).
The Sector Notes shed light on critical sector-specifi c issues that have an impact on city sustainability, but are not under direct
FM rev2_PREP 7 6/15/09 8:03:15 AM
8 | ECO2 CITIES: ECOLOGICAL CITIES AS ECONOMIC CITIES
INTEGRATING FORMS AND FLOWS:
A Transdisciplinary Platform
Because diagrams and maps can be easily
understood and shared by a broad range
of professionals and decision-makers, they
help to bring stakeholders and experts
together, facilitating a common under-
standing of integrated approaches to de-
sign and decision-making. Both forms and
fl ows should be analyzed and understood
for current and future scenarios. The
methods in combination form a ‘transdis-
ciplinary’ platform for understanding both
the spatial dynamics of a city and its phys-
ical resource fl ows—elements that are in-
terdependent but diffi cult to integrate
because they involve such different skill
sets and stakeholders.
!"#$%&'('!"#$%&'('!"#$%&'('!"#$%&'('
)"*$'+&,*+)"*$'+&,*+)"*$'+&,*+)"*$'+&,*+)$(-"#.')$(-"#.')$(-"#.')$(-"#.'
!/"-!/"-!/"-!/"-!"#0!"#0!"#0!"#0
1&($#1&($#1&($#1&($#
2$((/$0$,(2$((/$0$,(2$((/$0$,(2$((/$0$,(
!"#$'(!"#$'(!"#$'(!"#$'(
3&4$#$*+5&6'+"7+(8$+3&4$#$*+5&6'+"7+(8$+3&4$#$*+5&6'+"7+(8$+3&4$#$*+5&6'+"7+(8$+9#:&,+3&,*'%&6$9#:&,+3&,*'%&6$9#:&,+3&,*'%&6$9#:&,+3&,*'%&6$
;< / = / > *
!/"-+?=&@#&0'+"7+(8$+9#:&,+!/"-+?=&@#&0'+"7+(8$+9#:&,+!/"-+?=&@#&0'+"7+(8$+9#:&,+!/"-+?=&@#&0'+"7+(8$+9#:&,+5$(&:"/='05$(&:"/='05$(&:"/='05$(&:"/='0
;A B C * B <;<%"/"@=%&/+>''$('+&,*+9#:&,+3&,*+9'$D
;A#"%$''+B C""*'+B <,$#@4E+1&($#E+5&($#=&/'E+A$"6/$D
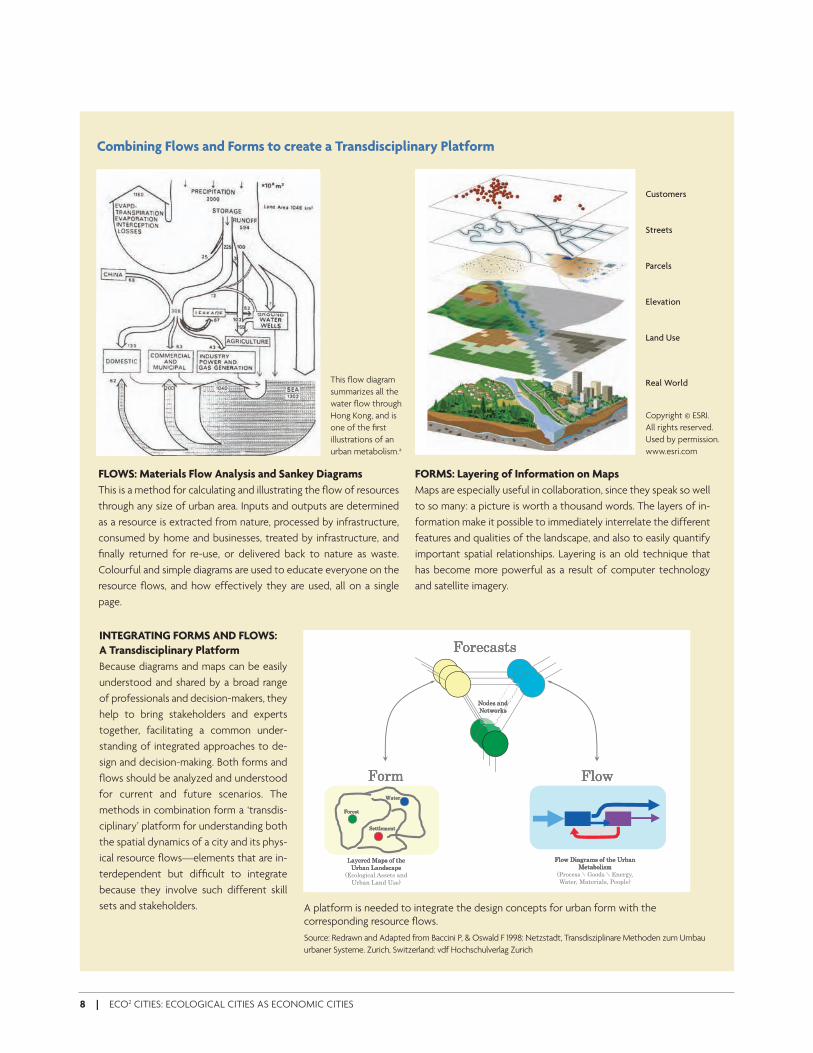
Combining Flows and Forms to create a Transdisciplinary Platform
FLOWS: Materials Flow Analysis and Sankey Diagrams
This is a method for calculating and illustrating the fl ow of resources
through any size of urban area. Inputs and outputs are determined
as a resource is extracted from nature, processed by infrastructure,
consumed by home and businesses, treated by infrastructure, and
fi nally returned for re-use, or delivered back to nature as waste.
Colourful and simple diagrams are used to educate everyone on the
resource fl ows, and how effectively they are used, all on a single
page.
FORMS: Layering of Information on Maps
Maps are especially useful in collaboration, since they speak so well
to so many: a picture is worth a thousand words. The layers of in-
formation make it possible to immediately interrelate the different
features and qualities of the landscape, and also to easily quantify
important spatial relationships. Layering is an old technique that
has become more powerful as a result of computer technology
and satellite imagery.
This fl ow diagram
summarizes all the
water fl ow through
Hong Kong, and is
one of the fi rst
illustrations of an
urban metabolism.a
Copyright © ESRI.
All rights reserved.
Used by permission.
www.esri.com
Customers
Streets
Parcels
Elevation
Land Use
Real World
A platform is needed to integrate the design concepts for urban form with the corresponding resource fl ows.
Source: Redrawn and Adapted from Baccini P, & Oswald F 1998: Netzstadt, Transdisziplinare Methoden zum Umbau
urbaner Systeme. Zurich, Switzerland: vdf Hochschulverlag Zurich
FM rev2_PREP 8 6/15/09 8:03:15 AM
E X E C U T I V E S U M M A RY | 9
control of city authorities. These issues may need to be addressed on a sector by sector basis—in collaboration with key stakehold-ers, particularly higher levels of government. Identifying critical pressure points beyond the direct control of city authorities is also important to devising an expanded platform for collaboration.
The guide also provides a strategy for man-aging the spatial structure of cities, and impor-tant lessons on how spatial planning and land use regulations can powerfully impact mobility and a2 ordability.
Moving Forward Together
As forward-looking cities in developing coun-tries develop and implement their own Eco2
pathways, support may be available from best practice cities worldwide, the international community, including development agencies, and academia. Cities are encouraged to tap into the unique resources of each of these partners. In this context, the World Bank Group6 togeth-er with other development partners is in a position to provide Technical Assistance and Capacity Building and Financial Support to cit-ies that demonstrate strong political will and commitment to implement the Eco2 program.
FM rev2_PREP 9 6/15/09 8:03:22 AM

FM rev2_PREP 10 6/15/09 8:03:22 AM
The Framework
E C O 2 C I T I E S : E C O L O G I C A L C I T I E S A S E C O N O M I C C I T I E S
Opportunities and Challenges, Principles and Pathways
PART 1
ECo2-Part1REVd_PREP 11 6/15/09 8:21:22 AM

ECo2-Part1REVd_PREP 12 6/15/09 8:21:23 AM
T H E F R A M E WO R K | 13
Ecological Cities as Economic Cities
CHAPTER 1
Challenges and Opportunities
This chapter outlines the key issues driving the
urgent need for a new approach to urban plan-
ning, development, and management. While all
of the transformations occurring can be seen as
threats, they also can be perceived as opportuni-
ties for rapid and widespread adoption of a new
approach to design, decision-making, and invest-
ment. By reviewing a few case studies, this chap-
ter demonstrates the tangible benefi ts of cost ef-
fective approaches that have led to greater
ecological and economic sustainability in cities. It
also clarifi es some commonly held misconcep-
tions about urban sustainability, and concludes
that cities should invest in and capitalize on op-
portunities. As you will see, if acted upon correct-
ly, the changes now underway o& er new opportu-
nities to achieve the sustainability and resiliency
of urban development for generations to come.
The Scale and Rate of Urbanization is
Unprecedented
Urbanization in developing countries may be the single greatest change in our century. It is projected that developing countries will have tripled their entire built-up urban area between 2000 and 2030 from 200,000 square kilome-tres to 600,000 square kilometres.7 These 400,000 square kilometres of new urban built up area, which are being constructed within just 30 years, equals the entire world’s total built up urban area as of 2000.8 One could say we are building a ‘whole new world’ at about 10 times the speed, in countries with severe re-source constraints (natural, fi scal, administra-tive, and technical). We are doing so in an in-creasingly globalized context with many new, constantly fl uctuating, interlinked, and uncon-trollable variables.
For the fi rst time in history, more than half of the world’s population, or 3.3 billion people, reside in urban areas. This is expected to grow to almost 5 billion by 2030.9 Over 90 percent
ECo2-Part1REVd_PREP 13 6/15/09 8:21:23 AM
14 | ECO2 CITIES: ECOLOGICAL CITIES AS ECONOMIC CITIES
of this urban growth is taking place in devel-oping countries. By the middle of the century, Asia alone will host 63 percent of the global urban population, or 3.3 billion people.10 Cit-ies in East Asia housed about 739 million peo-ple in 2005.11 They will need to accommodate another 500 million by 2030.12
The growth of the urban population is ac-companied by an increase in the number and size of cities. There were about 120 cities with over one million inhabitants in 2000. This fi g-ure is projected to increase to more than 160 by 2015.13 The World will have 26 mega cities—cities with populations of more than 10 mil-lion—by 2025. Developing countries in Asia will host twelve of them.14 An important issue char-acterizing this growth is that 50 percent of all urban growth is occurring in medium and smaller sized cities of less than 500,000 people. Over the next decade, half of the increase in ur-ban population in East Asia is projected to be absorbed by these cities.15
These population statistics imply a massive investment in manufactured capital, includ-ing building stock, urban infrastructure, and land development. The implications of the strategic urban approaches chosen and the in-frastructure decisions made within the next few years will no doubt have consequences for generations to come. While a more inte-grated approach does represent a challenge, it also represents an opportunity for much im-proved e6 ciency of urban systems that will last for generations.
Cites are Engines of Economic Growth
So what is driving the massive rates of urbaniza-tion described above? Historically, and across most regions, urbanization has propelled the growth of national economies. On average about 75 percent of global economic production takes place in cities, and in developing countries this share is now rapidly increasing.16 In many devel-oping countries, urban shares of GDP are al-ready surpassing 60 percent.17
The competitiveness of cities is determined by a variety of factors, including geography, na-tional policies, city leadership, market forces, and capital infl ows. Historically, nature and ge-ography (altitude, topography, and climate, as well as proximity to coasts, rivers, borders, and natural resources) have often been the trigger-ing factor in the development of cities. National policies also play an important role in determin-ing and facilitating the growth of cities by de-ciding on the location, quality, and connectivity of key infrastructure investments, which in turn further infl uence the investment and location decisions of private capital. These together en-able and generate a range of economic activity and diversifi cation which leads to population increases through rural-urban migration and productivity gains. In the context of increased globalization, the roles of trade and foreign in-vestment are increasingly recognized as other factors driving the growth of the cities. It has also been observed that as cities transition swiftly to a high value, knowledge based econo-my, their critical and competitive advantage is their ability to attract, retain, and invest in hu-man capital.18 Under these circumstances, a city’s ability to provide a business enabling en-vironment (such as good infrastructure, favour-able policies which reduce the cost of doing business, and connectivity to external markets), a good quality of life, and an environment that attracts and retains human capital (by provid-ing strong social infrastructure and a clean, af-fordable and liveable environment) has become a critical determinant of the growth of cities.
As organizational systems, urban agglomera-tions provide unique opportunities due to scale—both economic and spatial. The supply of critical infrastructural services (physical and social), as well as the institutional and administrative orga-nization upon which much economic develop-ment and social welfare are predicated, become fi nancially viable and reach economies of scale in cities. At the same time, geographic proximity reduces transaction costs and achieves econom-
ECo2-Part1REVd_PREP 14 6/15/09 8:21:23 AM
T H E F R A M E WO R K | 15
ic e6 ciencies by creating concentrated markets of labour, capital, and goods. This encourages growth, diversifi cation and innovation in the provision a wide range of goods and services, and the spill over of knowledge and skills critical to the creation of new ideas. Cities also serve as concentrated markets for the agricultural out-put of their rural hinterlands.
It is not simply the concentration of activi-ties that makes cities attractive: it is also the di-versifi cation and intensifi cation of activities which eventually make cities resilient, competi-tive, and dynamic. Besides, in addition to the spatial dimension, cities have a temporal di-mension. To remain relevant and competitive, successful cities continue to evolve. The water-front manufacturing land uses of many older industrial cities have now been converted into high-end residential and fi nancial sector real estate. Through the vastly improved global tele-communications and internet infrastructure, it is now possible for large segments of the service sector (whose products and services can be transferred across the globe at the speed of light) to access consumer and labour markets at the click of a button. This will pose interesting new possibilities for human settlement and em-ployment patterns. Although global economies based upon cities have occurred at various times throughout history, never before has a global economy achieved anything like the current reach: almost no city today operates outside of the global economic system, and every city fi nds a place in the network of cities.
It is because of the transformative forces of agglomeration economies that countries in East Asia are also undergoing a major shift in eco-nomic activities and employment patterns from agriculture to industry and services, accompa-nied by a diversifi cation of the economy within sectors. Concentration of economic production in urban areas is particularly signifi cant in East Asia. The more dynamic coastal regions of Chi-na produce more than half of the country’s GDP with less than one fi fth of its land area.19 Con-
centration of GDP is not proportional to that of population. For instance, Bangkok accounts for 40 percent of national GDP but only 12 percent of Thailand’s population. Such imbalances are commonly observed in other major Asian cit-ies—for instance, Manila (31 percent of national GDP but 13 percent of national population), Ho Chi Minh City (29 percent and 6 percent) and Shanghai (11 percent and 1 percent).20
Poverty Within and Around Cities is
a Challenge
In most regions, the opportunities provided by urbanization have enabled large segments of the population to lift themselves out of poverty. The United Nations Population Fund has ex-amined this relationship in 25 countries and concluded that urbanization has contributed signifi cantly to poverty reduction. For instance, 28.3 percent of Bolivia’s poverty reduction be-tween 1999 and 2005 was attributable to ur-banization.21 It is no wonder the poor have con-tinued and will continue to migrate to urban areas in search of better lives. However, while urbanization has led to economic growth and helped to reduce poverty, urbanization alone has not been able to eradicate poverty. Urban poverty and inequality exist despite the con-centration of income in cities.
Slums represent the worst of urban poverty. Individuals and communities living in slums face severe inadequacies in the most basic hu-man requirements, such as shelter, land, water, safe cooking fuel and electricity, heating, sanita-tion, garbage collection, drainage, paved roads, footpaths, street lighting, etc. Largely because of inadequate supply of serviced land at a9 ord-able prices, often caused by unrealistic regula-tory standards imposed on land (and chronic administrative defi ciencies), poor households are unable to access land and housing through legal channels. The poor are thereby forced to live in ramshackle and fl imsy settlements on en-vironmentally sensitive areas (slopes, low-lying areas), along railway lines and roads, close to
ECo2-Part1REVd_PREP 15 6/15/09 8:21:23 AM
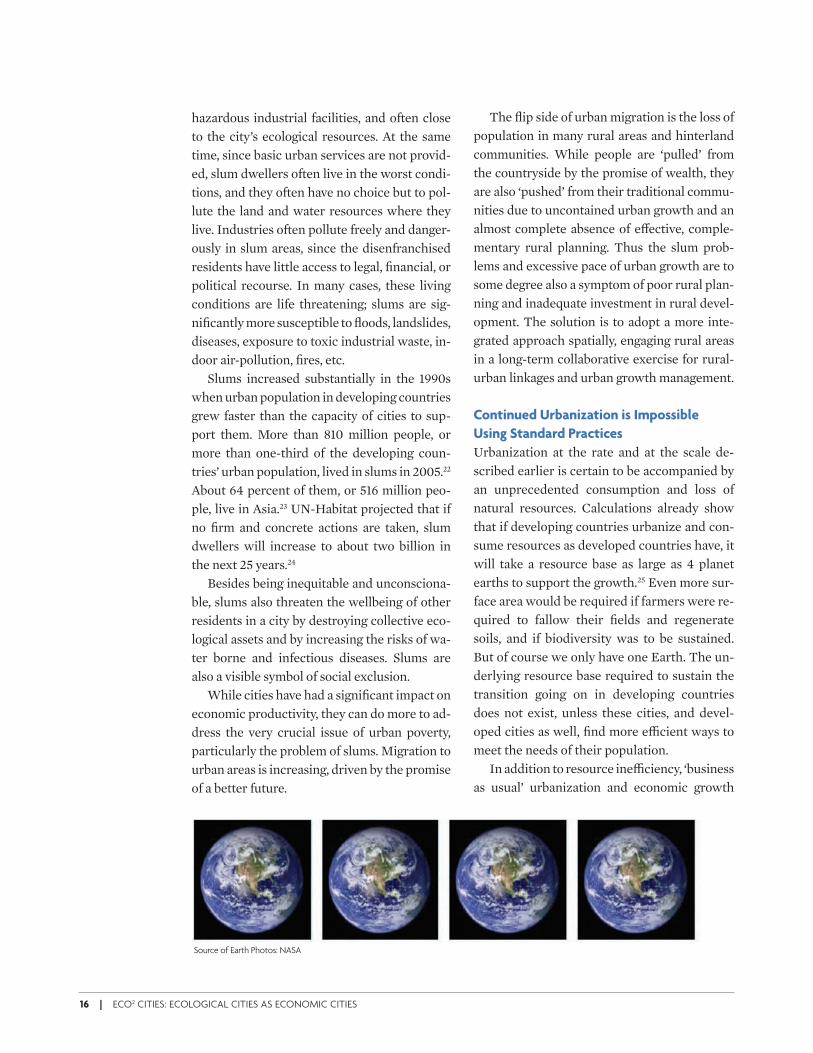
16 | ECO2 CITIES: ECOLOGICAL CITIES AS ECONOMIC CITIES
hazardous industrial facilities, and often close to the city’s ecological resources. At the same time, since basic urban services are not provid-ed, slum dwellers often live in the worst condi-tions, and they often have no choice but to pol-lute the land and water resources where they live. Industries often pollute freely and danger-ously in slum areas, since the disenfranchised residents have little access to legal, fi nancial, or political recourse. In many cases, these living conditions are life threatening; slums are sig-nifi cantly more susceptible to fl oods, landslides, diseases, exposure to toxic industrial waste, in-door air-pollution, fi res, etc.
Slums increased substantially in the 1990s when urban population in developing countries grew faster than the capacity of cities to sup-port them. More than 810 million people, or more than one-third of the developing coun-tries’ urban population, lived in slums in 2005.22 About 64 percent of them, or 516 million peo-ple, live in Asia.23 UN-Habitat projected that if no fi rm and concrete actions are taken, slum dwellers will increase to about two billion in the next 25 years.24
Besides being inequitable and unconsciona-ble, slums also threaten the wellbeing of other residents in a city by destroying collective eco-logical assets and by increasing the risks of wa-ter borne and infectious diseases. Slums are also a visible symbol of social exclusion.
While cities have had a signifi cant impact on economic productivity, they can do more to ad-dress the very crucial issue of urban poverty, particularly the problem of slums. Migration to urban areas is increasing, driven by the promise of a better future.
The fl ip side of urban migration is the loss of population in many rural areas and hinterland communities. While people are ‘pulled’ from the countryside by the promise of wealth, they are also ‘pushed’ from their traditional commu-nities due to uncontained urban growth and an almost complete absence of e9 ective, comple-mentary rural planning. Thus the slum prob-lems and excessive pace of urban growth are to some degree also a symptom of poor rural plan-ning and inadequate investment in rural devel-opment. The solution is to adopt a more inte-grated approach spatially, engaging rural areas in a long-term collaborative exercise for rural-urban linkages and urban growth management.
Continued Urbanization is Impossible
Using Standard Practices
Urbanization at the rate and at the scale de-scribed earlier is certain to be accompanied by an unprecedented consumption and loss of natural resources. Calculations already show that if developing countries urbanize and con-sume resources as developed countries have, it will take a resource base as large as 4 planet earths to support the growth.25 Even more sur-face area would be required if farmers were re-quired to fallow their fi elds and regenerate soils, and if biodiversity was to be sustained. But of course we only have one Earth. The un-derlying resource base required to sustain the transition going on in developing countries does not exist, unless these cities, and devel-oped cities as well, fi nd more e6 cient ways to meet the needs of their population.
In addition to resource ine6 ciency, ‘business as usual’ urbanization and economic growth
Source of Earth Photos: NASA
ECo2-Part1REVd_PREP 16 6/15/09 8:21:23 AM
T H E F R A M E WO R K | 17
generate enormous quantities of waste and pol-lution which impose heavy environmental, so-cial and (eventually) economic costs at the local and global scale. Much of this cost is localized and realized within the city itself: through sig-nifi cantly diminished human health and well-being caused by pollution (of air, water and land), the destruction of ecological assets, a growing fi scal burden, and reduced long term economic competitiveness. It is often the poor who su9 er most from localized pollution and unhealthy living conditions, as they cannot ac-cess safe places to live. Such issues are of imme-diate concern to city leaders, who wish to im-prove the wellbeing of all their citizens, provide a stable and attractive environment for busi-nesses, protect and capitalize on their ecological assets, and enhance their own fi scal strength.
Poor management of wastewater and inade-quate solid waste management have become major environmental and health hazards in cites of many developing countries. In addition the World Health Organization estimates that more than one billion people in Asia are ex-posed to outdoor air pollutant levels that ex-ceed WHO guidelines. For instance, a recent joint study of the Chinese Government and the World Bank estimated that the cost of ambient air pollution in China’s urban areas amounted to about US$63 billion in 2003, equivalent of 3.8 percent of China’s GDP in 2003.26
There is also a substantial globalized cost of ‘business as usual’ urbanization. It is estimated that cities consume about 67 percent of global energy, and account for well over 70 percent of GHG emissions: the main contributor to cli-mate change.27 Heating and lighting in residen-tial and commercial buildings generate nearly 25 percent of GHG emissions globally. This amount is as large as the amount generated through all agriculture and industrial activities combined. Transport contributes 13.5 percent of the global GHG emissions with road trans-port attributing 10 percent.28 These emissions cause irreversible climate change, which seri-
ously a9 ects global ecosystems and the global economy as a whole, particularly disadvantag-ing poorer nations.
According to the Stern report on conse-quences of climate change, business as usual scenarios could lead to a 5 to 10 percent loss in global GDP, with poor countries experiencing a loss of more than 10 percent of GDP. Taking the analysis a step further (beyond measures of losses in income and productivity like GDP), and looking into the costs of climate change (factoring direct health and environmental im-pacts, and amplifying/reinforcing feedbacks of such impacts and their outcomes) the business as usual assessment of the costs of the impacts and outcomes of climate change could reduce welfare by an amount equivalent to a reduction in consumption per head of between 5 and 20 percent. An accurate estimate is likely to be in the upper part of this range.29 The report clearly states that “the impacts of climate change will not be evenly distributed; the poorest countries and people will su9 er the most.”
In essence, the economic, social and envi-ronmental externalities of ‘business as usual’ urbanization are unsustainable.
A Twin Challenge: The Existing as well as
The New
It is clear that if we are to absorb and sustain the powerful wave of urbanization in develop-ing countries, while continuing to manage the existing built stock, we will need a paradigm shift. Fundamental questions to be addressed are: How can cities continue to e9 ectively har-ness the opportunities for economic growth
A few forward-looking cities are now taking the issue of climate
change very seriously. For instance, the City of Brisbane in
Australia is comprehensively addressing this issue through its
CitySmart program. Brisbane offi cials hope their experiences
can pave the way for other cities (see Part Three to read more
about Brisbane’s initiatives).
ECo2-Part1REVd_PREP 17 6/15/09 8:21:24 AM
18 | ECO2 CITIES: ECOLOGICAL CITIES AS ECONOMIC CITIES
and poverty reduction o9 ered by urbanization, while also mitigating for its negative impacts? How can cities do so given the speed and the scale at which this urbanization is progressing, and given their own capacity constraints? How can ecological and economic considerations be dovetailed, so that they result in a cumulative and lasting advantage for cities? How do we go from ‘Eco vs. Eco’ to ‘Eco2 Cities’?
In general cities are confronting a twin chal-lenge—that which is posed by their existing ur-ban areas, and that which is posed by rapid new urban expansion.
In dealing with existing urban areas cities can use a range of measures to enable the exist-ing built form to perform much more e9 ective-ly. Examples of retrofi tting measures include implementing end use e6 ciency in the energy and water sector, reducing reusing and recy-cling waste, and adapting existing transport in-frastructure (roads) to be used more e6 ciently (for instance, by designating routes for bus rap-id transit and lanes for bicycles). At the same time, cities can explore cost e9 ective ways of re-modeling the distribution, density, and use of the existing built form by increasing the fl oor area ratio, allowing the transfer of development rights (TDR), implementing land readjustment programs, re-zoning and changing land use patterns, and, importantly, by revising and en-forcing building codes and standards. Redevel-opment projects at a larger scale for certain ar-eas/districts of a city have also been successful in enhancing the sustainability of existing ar-eas. Both retrofi tting measures and redevelop-ment projects require holistic planning and co-ordination across sectors.
At the same time, cities are facing unprece-dented rates of urban expansion, and are in danger of being locked into patterns of ine6 -cient and unsustainable urban growth from which there is no easy return. In urban devel-opment, initial conditions form the bedrock for development at every scale, and impose power-ful constraints on what might be accomplished
as the city matures. Such initial conditions in-clude the spatial development pattern, the built urban form and most related trunk infrastruc-ture investments, which due to their size and permanence provide powerful constraints on many future options. This is typically referred to as Path Dependency. Such path dependency is also evident in the institutional architecture that evolves to support large complex infra-structure systems—this institutional architec-ture can then further reinforce and perpetuate growth of a particular kind. It is a tremendous prospect to be able to infl uence new urbaniza-tion and the growth of cities—getting things correct to begin with is much more cost e9 ec-tive than dealing with the situation later on. Be-ing proactive can provide compounded eco-nomic, social, and ecological returns. Action taken at this critical phase in the growth of these cities can provide a defi ning opportunity to leap-frog into built-in systemic advantages in ef-fi ciency and sustainability. Timing and sequenc-ing are crucial to ensure the lasting impact of coordinated interventions, maximize benefi ts and reduce long term externalities. There is an enormous opportunity cost to not acting at the correct time—and the correct time is now.
It is in the urgent interest of helping cities systematically capture this value, while the win-dow of opportunity is still open to them, that the World Bank is proposing the Eco2 City pro-gram.
Innovations in Urban Sustainability and their Benefi ts
It has been concretely demonstrated by some innovative cities that ecological sustainability and economical sustainability can signifi cantly reinforce each other and benefi t a range of stakeholders. One role of the Eco2 Cities Pro-gram is to refl ect on these examples, and fi nd ways to transfer the lessons and successes to cities elsewhere. To begin the process, let us
ECo2-Part1REVd_PREP 18 6/15/09 8:21:24 AM
T H E F R A M E WO R K | 19
quickly review three di9 erent case studies. Each of these cases is presented in much more detail in Part Three of this book. The fi rst is a case of implementing a successful integrated waste management program accomplished through systematic engagement with stake-holders—which has led to signifi cant environ-mental and economic gains. The second is a case of integrated utility and resource planning and management through systematic stake-holder collaboration which leads to signifi -cantly greater life cycle benefi ts. The third is a case of well coordinated and comprehensive urban development as well as social and envi-ronmental programs. The last case demon-strates that cost is not a major barrier to ecologi-cal and economic urban planning, development, and management—and is an illustration of suc-cessful path dependency (spatial, institutional and cultural) in urban development.
Yokohama accomplishes large
environmental and economic benefi ts
through stakeholder engagement in
integrated waste-management.
Yokohama, the second largest city in Japan, ini-tiated an Action Plan called G30 in 2003 (G = garbage; 30 = 30 percent reduction in waste generation by FY 2010). The G30 Action Plan clearly identifi es the responsibilities of house-holds, businesses, and the government to achieve waste reduction by the ‘3R’ (reduce, re-use, and recycle) method, and provides a mech-anism for an integrated approach to waste re-duction.30 Environmental education and various promotional activities related to waste reduc-tion were provided to enhance awareness and knowledge of people and business.
Yokohama had reduced waste generation by 38.7 percent from about 1.6 million tons in FY 2001 to 1 million tons in FY 200731 while its pop-ulation increased by 166,000 during the same period.32 This signifi cant waste reduction al-lowed Yokohama to save US$1.1 billion of capital costs otherwise required for renewal of two in-
cinerators. This also led to net savings of annual operation and maintenance costs of about US$6 million (US$30 million O&M costs of two incin-erators minus US$24 million O&M costs of waste recycling operations).33 Yokohama has two land-fi ll sites. When the G30 was planned in 2003, it was anticipated that the residual landfi ll capacity of these two sites would be 100,000 m3 by 2007. However, thanks to the waste reduction, the two sites still retained a capacity of 700,000 m3 in 2007. The value of the saved 600,000 m3 disposal capacities of two landfi lls is estimated to be US$83 million.34
It is calculated that this waste reduction be-tween FY 2001 and FY 2007 resulted in about 840,000 tons of CO2 emission reduction. This is equivalent to the amount that 60 million Japa-nese cedar trees can absorb annually. Approxi-mately 600 km2 (an area 1.4 times larger than the City) is needed to plant 60 million of Japanese cedar trees.35 At the same time, if these emission reductions were certifi ed and sold, they could provide an additional ongoing revenue stream through carbon fi nance.
Stockholm demonstrates that integrated
planning and management through system-
atic stakeholder collaboration can lead to
signifi cantly greater life cycle benefi ts
In the ongoing redevelopment project of Ham-marby Sjöstad (a southern city district in Stock-holm), the city council of Stockholm had set out to be 2 times more sustainable than Swedish best-practice in 1995 (the environmental pro-gram was adopted in 1995) on a range of indica-tors—most notably energy e6 ciency per meter squared. In Sweden the average annual rate of energy use in some regular new developments is 200kWh/m2, cutting edge practice produces an e6 ciency of 120kWh/m2 36, and the current project is aiming for 100kWh/m2.Other targets set for the project include: water conservation, waste reduction and reuse, emissions reduc-tion, reduced use of hazardous materials in construction, use of renewable sources of ener-
ECo2-Part1REVd_PREP 19 6/15/09 8:21:24 AM
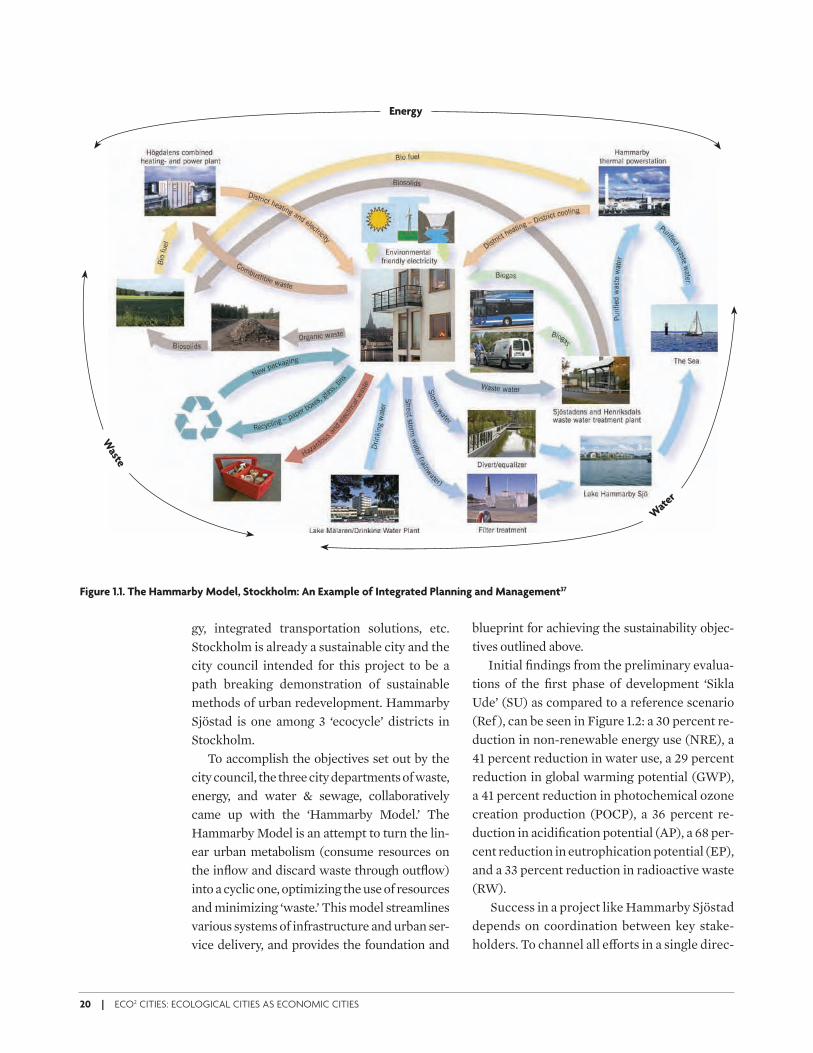
20 | ECO2 CITIES: ECOLOGICAL CITIES AS ECONOMIC CITIES
Figure 1.1. The Hammarby Model, Stockholm: An Example of Integrated Planning and Management37
gy, integrated transportation solutions, etc. Stockholm is already a sustainable city and the city council intended for this project to be a path breaking demonstration of sustainable methods of urban redevelopment. Hammarby Sjöstad is one among 3 ‘ecocycle’ districts in Stockholm.
To accomplish the objectives set out by the city council, the three city departments of waste, energy, and water & sewage, collaboratively came up with the ‘Hammarby Model.’ The Hammarby Model is an attempt to turn the lin-ear urban metabolism (consume resources on the infl ow and discard waste through outfl ow) into a cyclic one, optimizing the use of resources and minimizing ‘waste.’ This model streamlines various systems of infrastructure and urban ser-vice delivery, and provides the foundation and
blueprint for achieving the sustainability objec-tives outlined above.
Initial fi ndings from the preliminary evalua-tions of the fi rst phase of development ‘Sikla Ude’ (SU) as compared to a reference scenario (Ref ), can be seen in Figure 1.2: a 30 percent re-duction in non-renewable energy use (NRE), a 41 percent reduction in water use, a 29 percent reduction in global warming potential (GWP), a 41 percent reduction in photochemical ozone creation production (POCP), a 36 percent re-duction in acidifi cation potential (AP), a 68 per-cent reduction in eutrophication potential (EP), and a 33 percent reduction in radioactive waste (RW).
Success in a project like Hammarby Sjöstad depends on coordination between key stake-holders. To channel all e9 orts in a single direc-
Energy
Waste
Wat
er
ECo2-Part1REVd_PREP 20 6/15/09 8:21:24 AM
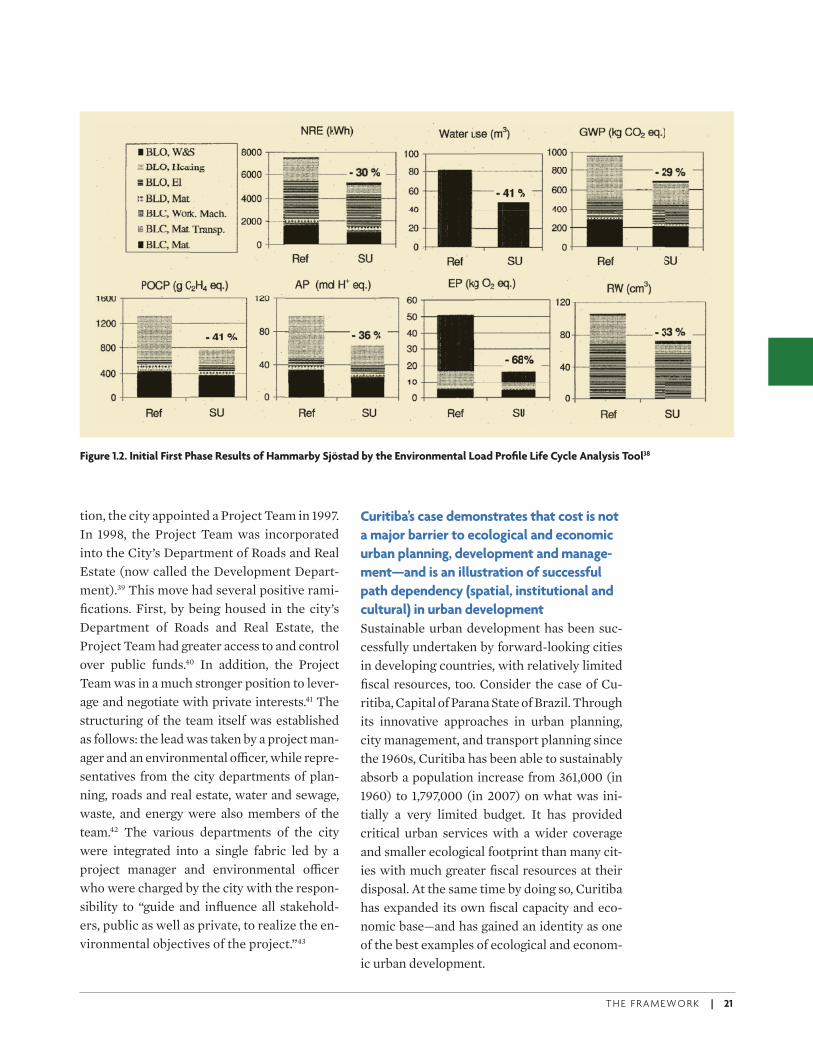
T H E F R A M E WO R K | 21
tion, the city appointed a Project Team in 1997. In 1998, the Project Team was incorporated into the City’s Department of Roads and Real Estate (now called the Development Depart-ment).39 This move had several positive rami-fi cations. First, by being housed in the city’s Department of Roads and Real Estate, the Project Team had greater access to and control over public funds.40 In addition, the Project Team was in a much stronger position to lever-age and negotiate with private interests.41 The structuring of the team itself was established as follows: the lead was taken by a project man-ager and an environmental o6 cer, while repre-sentatives from the city departments of plan-ning, roads and real estate, water and sewage, waste, and energy were also members of the team.42 The various departments of the city were integrated into a single fabric led by a project manager and environmental o6 cer who were charged by the city with the respon-sibility to “guide and infl uence all stakehold-ers, public as well as private, to realize the en-vironmental objectives of the project.”43
Curitiba’s case demonstrates that cost is not
a major barrier to ecological and economic
urban planning, development and manage-
ment—and is an illustration of successful
path dependency (spatial, institutional and
cultural) in urban development
Sustainable urban development has been suc-cessfully undertaken by forward-looking cities in developing countries, with relatively limited fi scal resources, too. Consider the case of Cu-ritiba, Capital of Parana State of Brazil. Through its innovative approaches in urban planning, city management, and transport planning since the 1960s, Curitiba has been able to sustainably absorb a population increase from 361,000 (in 1960) to 1,797,000 (in 2007) on what was ini-tially a very limited budget. It has provided critical urban services with a wider coverage and smaller ecological footprint than many cit-ies with much greater fi scal resources at their disposal. At the same time by doing so, Curitiba has expanded its own fi scal capacity and eco-nomic base—and has gained an identity as one of the best examples of ecological and econom-ic urban development.
Figure 1.2. Initial First Phase Results of Hammarby Sjöstad by the Environmental Load Profi le Life Cycle Analysis Tool38
ECo2-Part1REVd_PREP 21 6/15/09 8:21:27 AM
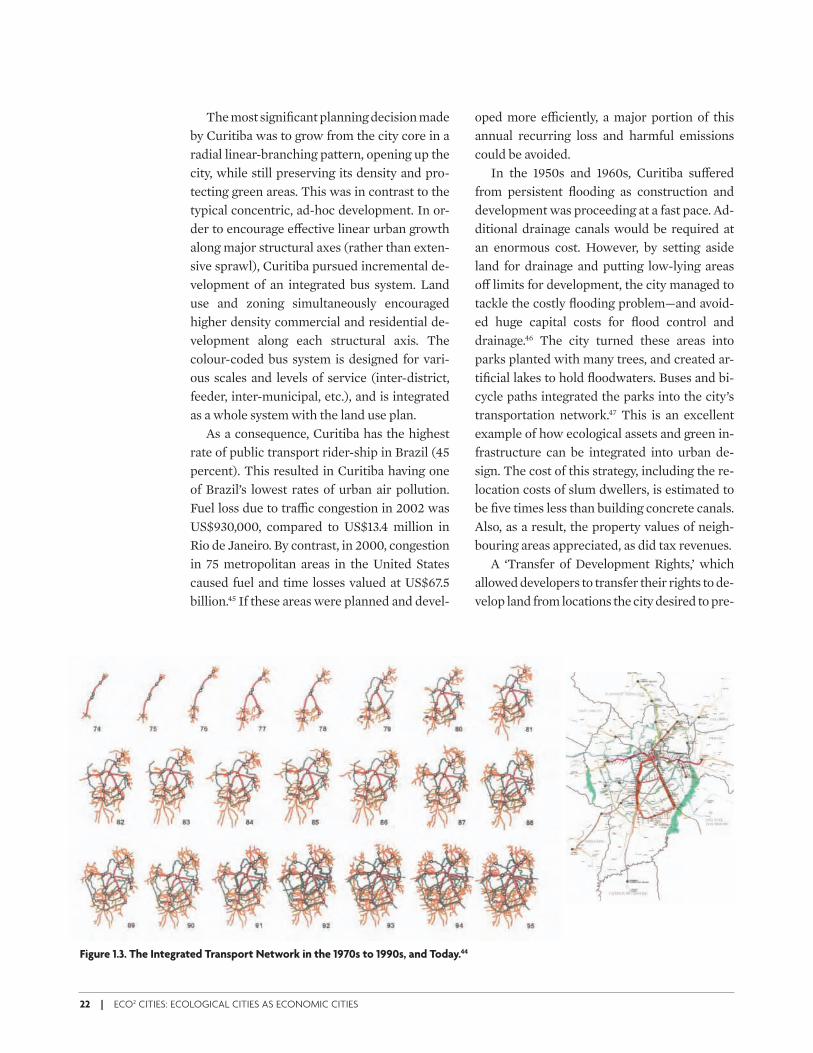
The most signifi cant planning decision made by Curitiba was to grow from the city core in a radial linear-branching pattern, opening up the city, while still preserving its density and pro-tecting green areas. This was in contrast to the typical concentric, ad-hoc development. In or-der to encourage e9 ective linear urban growth along major structural axes (rather than exten-sive sprawl), Curitiba pursued incremental de-velopment of an integrated bus system. Land use and zoning simultaneously encouraged higher density commercial and residential de-velopment along each structural axis. The colour-coded bus system is designed for vari-ous scales and levels of service (inter-district, feeder, inter-municipal, etc.), and is integrated as a whole system with the land use plan.
As a consequence, Curitiba has the highest rate of public transport rider-ship in Brazil (45 percent). This resulted in Curitiba having one of Brazil’s lowest rates of urban air pollution. Fuel loss due to tra6 c congestion in 2002 was US$930,000, compared to US$13.4 million in Rio de Janeiro. By contrast, in 2000, congestion in 75 metropolitan areas in the United States caused fuel and time losses valued at US$67.5 billion.45 If these areas were planned and devel-
oped more e6 ciently, a major portion of this annual recurring loss and harmful emissions could be avoided.
In the 1950s and 1960s, Curitiba su9 ered from persistent fl ooding as construction and development was proceeding at a fast pace. Ad-ditional drainage canals would be required at an enormous cost. However, by setting aside land for drainage and putting low-lying areas o9 limits for development, the city managed to tackle the costly fl ooding problem—and avoid-ed huge capital costs for fl ood control and drainage.46 The city turned these areas into parks planted with many trees, and created ar-tifi cial lakes to hold fl oodwaters. Buses and bi-cycle paths integrated the parks into the city’s transportation network.47 This is an excellent example of how ecological assets and green in-frastructure can be integrated into urban de-sign. The cost of this strategy, including the re-location costs of slum dwellers, is estimated to be fi ve times less than building concrete canals. Also, as a result, the property values of neigh-bouring areas appreciated, as did tax revenues.
A ‘Transfer of Development Rights,’ which allowed developers to transfer their rights to de-velop land from locations the city desired to pre-
22 | ECO2 CITIES: ECOLOGICAL CITIES AS ECONOMIC CITIES
Figure 1.3. The Integrated Transport Network in the 1970s to 1990s, and Today.44
ECo2-Part1REVd_PREP 22 6/15/09 8:21:40 AM
T H E F R A M E WO R K | 23
serve to locations which the city desired to de-velop, provided incentives and tax breaks for preserving green areas as well as historic and cultural heritage sites. At the same time, Curiti-ba preserved its vibrant urban density along the axes of growth: population density increased from 1,410 persons/km2 to 4,161 persons/km2 between 1970 and 2007, as the green area per person increased from 1 km2 to 51.5 km2 .
Much of the success of Curitiba can be at-tributed to its Institute for Research and Ur-ban Planning of Curitiba, also known as IP-PUC. Founded in 1965, IPPUC is a powerful ‘Municipal Independent Public Authority,’ and serves as the research, planning, imple-mentation, and supervision agency in Curiti-ba. The IPPUC enabled coordination of dif-ferent elements of urban development and was the most important factor in ensuring continuity and consistency in the planning process through successive city administra-tions. Its imaginative and integrated urban planning, development, and management so-lutions signifi cantly reduced the ine6 ciencies associated with piecemeal development.
Jaime Lerner, who contributed to drafting the 1966 Master Plan and worked as President of the IPPUC in 1969 and 1970, was elected mayor of Curitiba three times (1971–75, 1979–83, and 1989–92). He is widely known as one of the most popular, creative, and successful mayors in Brazil, whose infl uence has spread globally. He has won many awards (from the UNEP, UNICEF, International Institute for Energy Conservation, Prince Claus Awards of Nether-lands, and so on).
The current administration has also achieved wide-ranging success by taking on innovative new projects with a sustained focus on social, environment, and urban planning issues through substantive consultation with public audiences. Mayor Carlos Richa, who began his administration in 2004, enjoys very high popu-larity, as can be seen by his 77.27 percent ap-proval rating when he was reelected Mayor of Curitiba in October 2008.
Powerful Lessons from Best Practice Cities
One of the most powerful lessons derived from stories like Yokohama, Stockholm, and Curiti-ba is that many of the prevalent misconcep-tions about urban sustainability e9 orts have no sound basis in fact.
Many solutions are affordable—
even when budgets are limited—
and they generate returns
Often one of the biggest and most prevalent misconceptions is that such measures are not a9 ordable, and that they do not generate sig-nifi cant returns. As concretely demonstrated by Yokohama and Curitiba, this is certainly not the case. Many creative, practical and cost ef-fective solutions can simultaneously achieve greater benefi ts than the business as usual sce-narios. Another example might further help to underscore this lesson. The municipality of Emfuleni (South Africa) initiated an energy and water savings project and achieved savings of some 7 billion litres of water and 14 million kWh per year. At a cost of only US$1.8 million, the project saved over US$4 million each year, giving the project a payback period under 6 months. Since the contract was fi nanced and implemented by an energy service company (ESCO), the municipality not only saved large sums of money because of reduced water loss-es and pumping costs, but also did not have to pay for the investment upfront. The ESCO, on the other hand, recouped its investment quick-ly by sharing in part of the cost savings.48
Ample evidence like this demonstrates that actions to improve energy and resource e6 ciencies can bring about strong fi scal and economic gains. At the same time, solid waste management in many medium sized cities can account for 40 to 50 percent of the total municipal budget.49 Programs like the one in Yokohama can be powerful illustrations of the signifi cant returns that can be achieved and the capital costs that can be avoided. For
ECo2-Part1REVd_PREP 23 6/15/09 8:21:41 AM
24 | ECO2 CITIES: ECOLOGICAL CITIES AS ECONOMIC CITIES
cities and utilities looking for ways to meet budget shortfalls or save municipal expendi-tures for worthy social pursuits (such as ex-tending tap water services, waste collection and treatment or street lighting coverage to slums), there is no better place to look for new funds than cost savings from resource use e6 ciency.
At the same time, good and well coordinated urban planning, land policies, and an appropri-ate spatial layout can provide strong and sus-tained long term and compounding economic, social, and ecological returns. E9 ective urban planning and land policies can help integrate the urban poor into the economic, social, and physical fabric of the city—proving economi-cally benefi cial to cities, national governments, and the urban poor. The fi nancial costs required for good planning are not signifi cant. However, sustained commitment and investments in maintaining strong technical, administrative, and institutional capacity are required.
When designed and implemented appropri-ately, policy and regulatory measures can also generate environmental, fi scal, and economic gains. Households and businesses are major determinants of energy and resource consump-tion and the levels of waste generation, and their savings can be translated into economic and fi scal gains for a city as a whole. Since the mid-1970s, California’s energy e6 ciency poli-cies, consisting of standards, research and de-velopment, and utility improvement programs, have held per capita electricity use constant while the Unites States as a whole has in-creased per capita electricity use by nearly 80 percent. This has generated substantial savings from consumers, households, and businesses in California.50 Over the past three decades, California consumers have saved more than US$50 billion from appliance and building ef-fi ciency policies alone. Educational programs and awareness campaigns can also infl uence consumption patterns without spending a lot of resources.
Signifi cant success can be achieved using
existing, well proven technologies, and
appropriate new technologies
Best practices suggest that success is not so much about new technologies as it is about ap-propriate technologies. Expensive hydrogen fu-elled cars are less relevant to most cities than increasing the length of bicycle and pedestrian-friendly pathways. Simple technology solutions like insulation of homes or water saving faucets can often generate much more cost e9 ective savings than many ‘new’ technologies.51 That said, many of the new technology options are often mistakenly considered commercially un-viable because: 1) the true cost-benefi t analysis from a lifecycle point of view has not been car-ried out; and 2) sometimes new technologies have to compete with embedded subsidies that their competitors are benefi tting from. (An ex-ample of this is the high implied subsidy to auto-mobiles by way of free and cheap parking on public lands, and extensive highway construc-tion). The simple solution is sometimes to em-brace appropriate new technologies through: 1) bulk procurement by city and partners; or 2) in-cubating them through phased subsidy schemes until economies of scale bring down local prices; and/or 3) public awareness campaigns. In cases where local production can fi ll the need, the im-pact on Local Economic Development can be a signifi cant valued added. Manufacture and in-stallation of e6 cient technologies helps to cir-culate money within the community—generat-ing and retaining new local employment instead of exporting money to purchase water or energy commodities. Countries like Sweden and Den-mark have invested in incubating new technolo-gies and are now reaping the rewards. There is now a growing international demand for much of their technological expertise.
Developing countries should take pride in
developing home-made solutions
In many cases, cities in developing countries perform signifi cantly better on sustainability indicators than their counterparts in ‘devel-
ECo2-Part1REVd_PREP 24 6/15/09 8:21:41 AM
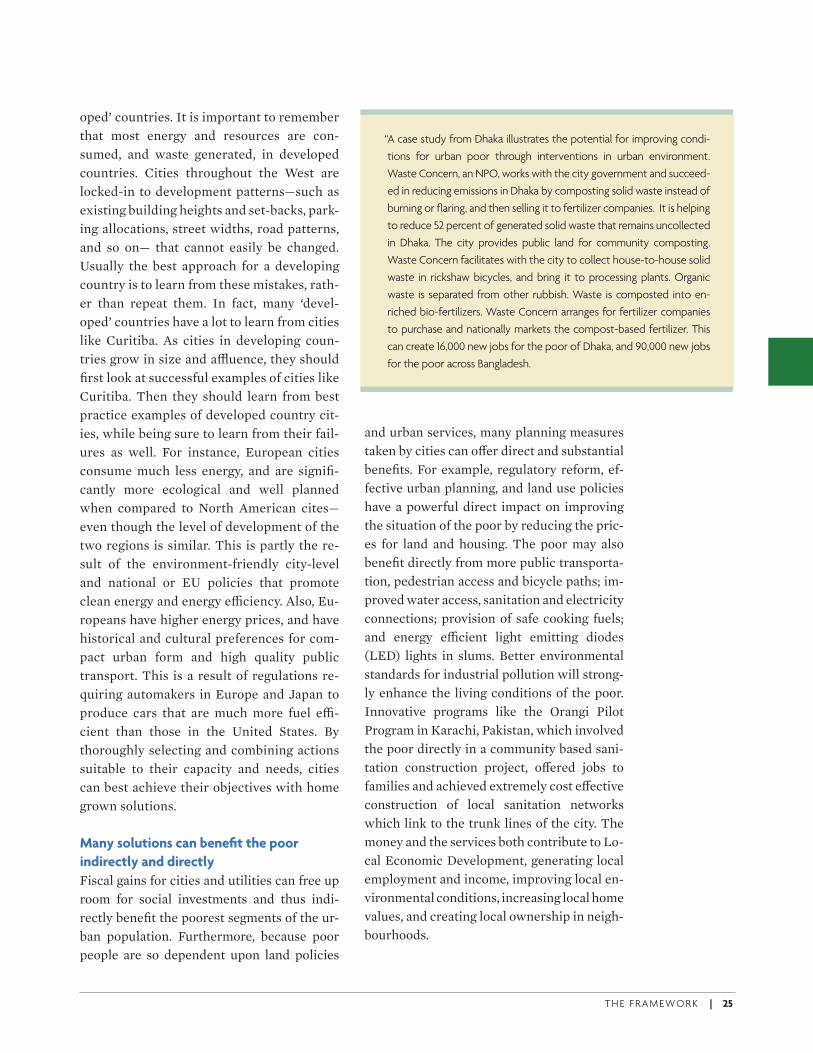
T H E F R A M E WO R K | 25
oped’ countries. It is important to remember that most energy and resources are con-sumed, and waste generated, in developed countries. Cities throughout the West are locked-in to development patterns—such as existing building heights and set-backs, park-ing allocations, street widths, road patterns, and so on— that cannot easily be changed. Usually the best approach for a developing country is to learn from these mistakes, rath-er than repeat them. In fact, many ‘devel-oped’ countries have a lot to learn from cities like Curitiba. As cities in developing coun-tries grow in size and aX uence, they should fi rst look at successful examples of cities like Curitiba. Then they should learn from best practice examples of developed country cit-ies, while being sure to learn from their fail-ures as well. For instance, European cities consume much less energy, and are signifi -cantly more ecological and well planned when compared to North American cites—even though the level of development of the two regions is similar. This is partly the re-sult of the environment-friendly city-level and national or EU policies that promote clean energy and energy e6 ciency. Also, Eu-ropeans have higher energy prices, and have historical and cultural preferences for com-pact urban form and high quality public transport. This is a result of regulations re-quiring automakers in Europe and Japan to produce cars that are much more fuel e6 -cient than those in the United States. By thoroughly selecting and combining actions suitable to their capacity and needs, cities can best achieve their objectives with home grown solutions.
Many solutions can benefi t the poor
indirectly and directly
Fiscal gains for cities and utilities can free up room for social investments and thus indi-rectly benefi t the poorest segments of the ur-ban population. Furthermore, because poor people are so dependent upon land policies
and urban services, many planning measures taken by cities can o9 er direct and substantial benefi ts. For example, regulatory reform, ef-fective urban planning, and land use policies have a powerful direct impact on improving the situation of the poor by reducing the pric-es for land and housing. The poor may also benefi t directly from more public transporta-tion, pedestrian access and bicycle paths; im-proved water access, sanitation and electricity connections; provision of safe cooking fuels; and energy e6 cient light emitting diodes (LED) lights in slums. Better environmental standards for industrial pollution will strong-ly enhance the living conditions of the poor. Innovative programs like the Orangi Pilot Program in Karachi, Pakistan, which involved the poor directly in a community based sani-tation construction project, o9 ered jobs to families and achieved extremely cost e9 ective construction of local sanitation networks which link to the trunk lines of the city. The money and the services both contribute to Lo-cal Economic Development, generating local employment and income, improving local en-vironmental conditions, increasing local home values, and creating local ownership in neigh-bourhoods.
“ A case study from Dhaka illustrates the potential for improving condi-
tions for urban poor through interventions in urban environment.
Waste Concern, an NPO, works with the city government and succeed-
ed in reducing emissions in Dhaka by composting solid waste instead of
burning or fl aring, and then selling it to fertilizer companies. It is helping
to reduce 52 percent of generated solid waste that remains uncollected
in Dhaka. The city provides public land for community composting.
Waste Concern facilitates with the city to collect house-to-house solid
waste in rickshaw bicycles, and bring it to processing plants. Organic
waste is separated from other rubbish. Waste is composted into en-
riched bio-fertilizers. Waste Concern arranges for fertilizer companies
to purchase and nationally markets the compost-based fertilizer. This
can create 16,000 new jobs for the poor of Dhaka, and 90,000 new jobs
for the poor across Bangladesh.
ECo2-Part1REVd_PREP 25 6/15/09 8:21:42 AM
26 | ECO2 CITIES: ECOLOGICAL CITIES AS ECONOMIC CITIES
Capitalizing on the Opportunities
The challenge that lies ahead is to take full ad-vantage of the many opportunities created by rapid rates of change and by successful inno-vations. Best practices do exist for strategic long-term planning and regional growth man-agement, and an emergence of new tools for systems analysis and mapping o9 er potential for more integrated, practical, and rigorous analysis. Realizing that successful cities are often fundamental to successful nations, higher levels of government are key partners in helping cities take initiative. There is also growing concern and commitment at the in-ternational level for supporting cities and for fi nancing investments enabling ecological and economic sustainability within cities. New funding opportunities have emerged for cities in developing countries that are willing to implement actions to achieve sustainable ur-ban development—particularly measures pro-moting energy and resource e6 ciency that leads to GHG emission reductions. New ac-counting methods for estimating the full costs and benefi ts of various policy, planning, and investment options are also being used (e.g.
Life Cycle Costing). Channelling these oppor-tunities toward a massive scale and accelerat-ing pace of urban development create poten-tial for tremendous impact.
An increasing number of cities have initiated actions to achieve greater ecological and eco-nomic sustainability according to their own vi-sions, needs, and capacities. Limited resources or capacities do not discourage these cities. Some cities demonstrate strong leadership in pioneering new approaches, some use well es-tablished approaches and excel in the imple-mentation of these approaches, and some work with the international community to learn from best practices and invest in technical, institu-tional and administrative capacity.
It is with the purpose of enabling cities in developing countries to benefi t from the prom-ise of a more rewarding and sustainable growth trajectory while the window of opportunity is still open to them, that the Eco2 Cities Program has been developed. The Chapters ahead pro-vide a detailed framework that can be adapted by cities in developing countries to systemati-cally work towards and accomplish many of the positive results discussed so far.
ECo2-Part1REVd_PREP 26 6/15/09 8:21:42 AM
T H E F R A M E WO R K | 27
Eco² Cities: Principles and Pathways
CHAPTER 2
The previous chapter explored the many op-
portunities o& ered to cities as a consequence of
change. It also used examples of best practice
drawn from cities worldwide to illustrate the
potential environmental and economic benefi ts
associated with the innovative approaches. If
the knowledge and means exist to design and
implement such measures, and if practical and
powerful solutions have been demonstrated
even for cities with very limited budgets, then
why are other cities not taking advantage of
these opportunities? Why are these examples
so rare?
This chapter will begin with a brief overview
of the many challenges that cities face when try-
ing to adopt a more integrated approach. Most
readers will be familiar with these challenges—
they are unfortunately very common—and a de-
tailed accounting is unnecessary. However the
challenges are worth highlighting at this time be-
cause together with the valuable ground level les-
sons from best practice cities, they help to frame
our strategic response: the key strategies and prin-
ciples that will defi ne the Eco2 City Program.
After reviewing challenges, this chapter de-
scribes a set of four overarching principles that
provide the scope and direction for all elements of
the Eco2 Program. Adopting these principles rep-
resents the fi rst step towards the Eco2 approach.
Basically, the principles are proven strategies that
can help cities seize new opportunities, overcome
challenges, and transfer best practices to every
new project
At the end of this chapter a summary table is
provided of the Eco2 approach. The principles
are translated into a number of core program
elements, and an example is provided for how
any city might operationalize the program in a
step by step fashion, and create its own unique
Eco2 Pathway.
ECo2-Part1REVd_PREP 27 6/15/09 8:21:42 AM
28 | ECO2 CITIES: ECOLOGICAL CITIES AS ECONOMIC CITIES
Cites are Challenged on Many Fronts
Limited Resources
In general, cities in developing countries face signifi cant capacity constraints—administra-tive, technical and fi nancial. Cities are further challenged by the rapid pace of new urbaniza-tion. For such reasons, city sta9 tend to focus their attention on chronic problems, and on the day to day and sector to sector problems that are piled on the front counter. Ask any city administrator, and you hear the same story: no time exists to take on long-term plans or cross-cutting agendas like Eco2.
Misinformation
Another reason for lack of initiative is that the lessons described in Chapter One have not been widely shared or understood. Instead, many local decision-makers operate under a series of myths and false assumptions. Solu-tions like Eco2 are perceived as demonstration projects, rather than a permanent, alternative approach to planning, developing, and manag-ing cities. They are assumed to be costly, dependent upon advanced and complex tech-nology, and practical only for wealthy neigh-bourhoods and well-resourced city adminis-trations. This attitude is exacerbated by the all-too-common assumption that the most ad-vanced approach to city building is to import the styles and technologies used by a majority of western cities—rather than building on local culture and ecology.
Correcting misconceptions may need to be one of the fi rst ‘stepping stones’ in a city’s Eco2 Pathway.
Institutional barriers
Inappropriate institutional structures and mindsets are commonly cited as the greatest challenges when cities are considering imple-menting integrated solutions. Some of the most obvious examples include:
• Fragmentation of responsibilities; Separate budgets, timelines and goals; piecemeal solutions that serve individual interests well, but that—in combination—are pre-cisely wrong.
• Excessive specialization and overwhelming complexity; silos of expertise; incomplete perspectives on urban resource use and as-sociated costs.
• Single purpose funding mechanisms that fail to address cities directly, or that fail to ad-dress the urban system as a whole, or that fail to link program objectives to priority issues in a city.
• Lengthy and challenging political processes for allocating funding at all scales.
• Short–term and narrow accounting formats that ignore indirect costs and benefi ts, sep-arate capital costs from operating and maintenance costs, fail to capitalize the re-placement of systems, do not take into ac-count all capital assets (manufactured, ecological, human and social) and risks, and mislead investors as well as citizens.
‘Locked-in’ relationships among networks
of public and private institutions and
existing technologies
Some dimensions of urban planning refl ect a complex set of entrenched relationships be-tween many di9 erent organizations, public and private. Because some groups benefi t from the status quo, they actively promote more of the same, and create obstacles to investment in al-ternatives.
A well-know example is the ‘highway lob-by’ which represents everyone who makes money from roads, and which has been ac-cused of promoting massive investments in road building regardless of societal costs and alternative technologies.
Cities commonly become locked-in to certain technologies as a result of their past capital investments in facilities and the on-
ECo2-Part1REVd_PREP 28 6/15/09 8:21:42 AM
T H E F R A M E WO R K | 29
going need to recover sunk costs and realize a return. If someone proposes to invest in demand side management, or to meet the need for services in other ways, the e9 ect is to reduce the fl ow of revenues below what was projected; as a consequence, the exist-ing facilities remain over-sized and may be-come economically unviable. This can hap-pen whenever cities or their fi nancial partners invest in new energy plants, water factories, waste-water treatment plants, sol-id waste transfer stations, and incinerators. Under such circumstances, it is common for cities to use policy to prevent innovative ap-proaches. Public private partnerships, if not developed properly, are another common example of how cities can become locked-in to technologies by entering into contracts that guarantee a long-term demand for ser-vices of one type.
Human inertia
A new planning process that involves many planners and designers will certainly challenge the natural tendency of people—and profes-sionals in particular—to resist change of any kind. Without a focused e9 ort to manage change, human inertia will invariably repro-duce the same patterns of land development, and exactly the same infrastructure, in city af-ter city, all in accordance with ‘standard prac-tice.’ It is di6 cult to change the mould. If con-servative engineers are hired to consider a type of system they have never previously designed,
they will invariably condemn the idea. While conservative engineers are in most respects the best kind to have, the process of preliminary engineering, or concept design, requires a much more open and innovative mindset—something that is di6 cult to fi nd without engaging specialty fi rms, at added expense and risk.
The Continuing Dominance of
19th Century Models
Part of the di6 culty with adopting a program like Eco2 is that current design and planning practices for cities are rooted in patterns estab-lished in the 19th century, when an abundance of coal, combined with new manufacturing technologies, brought unprecedented increas-es in wealth and improvements in quality of life. By the beginning of the last century, mil-lions of families in Europe and North America suddenly had access to clean water, sewage treatment, space heating, lighting, clean streets and public transit. This wave of societal prog-ress and modernism was achieved through single-purpose, centralized, supply-oriented utilities that operated in silos, and capitalized on economies of scale, abundant resources, and open access to public goods like water and the atmosphere.
Hugely successful in their time, the 19th century models are no longer the best solution, and in fact have become part of the problem. The world is more crowded and complex, and requires much more e6 cient, longer-term so-
“ Techno-Institutional Complex(TIC) arises because large technological systems, like electricity generation, dis-
tribution and end use, cannot be fully understood as a set of discrete technological artefacts, but have to be
seen as complex systems of technologies embedded in a powerful conditioning social context of public and
private institutions.
TICs develop through a path-dependent, co-evolutionary process involving positive feedbacks among
technological infrastructures and the organizations and institutions that create, diffuse and employ them.
Once locked-in, TIC are diffi cult to displace and can lock-out alternative technologies for extended periods,
even when the alternatives demonstrate improvements upon the established TIC.”
Gregory Unhur, Understanding Carbon Lock-in, 2000
ECo2-Part1REVd_PREP 29 6/15/09 8:21:42 AM
30 | ECO2 CITIES: ECOLOGICAL CITIES AS ECONOMIC CITIES
lutions for servicing urban areas. Nevertheless, the 19th century models are integral to our pro-fessional training and institutional structures. A program that encourages a more integrated approach must overcome the inertia of past practice, and the natural resistance to change within established institutions and groups of practicing professionals.
A Principled Approach can Overcome the Challenges
The Eco2 Program is designed on the premise that the many opportunities and challenges de-scribed so far can best be addressed through adopting a new set of four principles that can be used to guide the process of design, imple-mentation, and fi nancing of urban develop-ment. The principles function as ‘super’ strate-gies for cities in transition. The four Eco2 Principles are: 1) ‘A City Based Approach,’ which enables local governments to lead a de-velopment process that takes into account their specifi c circumstances, including their local ecology; 2) ‘An Expanded Platform for Collab-orative Design and Decision Making’ that ac-complishes sustained synergy by coordinating and aligning the actions of key stakeholders; 3) ‘A One System Approach’ that enables cities to realize the benefi ts of integration by planning, designing, and managing the whole urban sys-tem; and 4) ‘An Investment Framework that Values Sustainability and Resiliency’ by incor-porating and accounting for life cycle analysis, the value of all capital assets (manufactured, natural, human, and social), and a broader scope of risk assessments in decision-making.
Each of these strategies has been elevated to status of super strategy, or Principle, be-cause it is:
• universally applicable;• crucial to success (based upon the experi-
ence of best practice cities); and• frequently ignored or under appreciated.
The four principles are interrelated and mutually supportive. For example, without a strong city-based approach, it is very di6 cult to fully engage key stakeholders through an expanded platform for collaborative design and decision-making. And, without this ex-panded platform, it is di6 cult to explore cre-ative new approaches to the design and management of integrated systems, and to co-ordinate policies for implementing the one sys-tem approach. Prioritization, sequencing, and e9 ectiveness of investments in sustainability and resiliency will be greatly enhanced by ap-preciating the city as ‘one system’ and through an expanded platform of collaboration.
The synergy between the principles will become much more apparent as we move into later chapters of this book. For now, let’s ex-plore each of the Eco2 Principles, one at a time.
PRINCIPLE 1: A City-Based Approach
A city based approach is the fi rst principle, and it carries two complementary messages. First-ly, it recognizes that cities are now at the front lines for managing change and leading an inte-grated approach. Only at the city level is it pos-sible to integrate the many layers of site spe-cifi c information and work closely and rapidly with the many stakeholders who need input into an integrated solution. In addition, fi scal and administrative decentralisation has brought important decision making and management responsibility to local governments. Secondly, it serves to emphasize the importance of incor-porating within any development program the unique aspects of place, especially the ecologi-cal assets. Increasingly, cities depend upon their natural landscapes to provide food and recreation, capture and store water and energy, absorb wastes and satisfy many other needs. Protecting and enhancing ecological assets—the natural capital—is a priority when direct-ing (and constraining) urban growth. A city
ECo2-Part1REVd_PREP 30 6/15/09 8:21:42 AM
T H E F R A M E WO R K | 31
based approach is thus very place specifi c, with a focus on enabling local leadership and local ecologies. Let’s look at each of these in turn.
Depending upon size, cities are the most infl uential institutions within the modern state. Not only do they represent the engines of the economy and provide homes for a ma-jority of the population, they also are respon-sible for a majority of resource and energy consumption and harmful emissions. Thus a city that works with its key sectors and stake-holders is especially well placed to explore Eco2 solutions. Cities also have some critical instruments at their disposal, (zoning, per-mits, approvals, taxes, fees), and have been further empowered through fi scal and policy decentralization in many countries. It is not surprising, therefore, that almost all the case studies of Eco2 solutions have occurred in cit-ies that have taken leadership, and applied a city-based approach.
When a city takes leadership in setting pri-orities and implementing solutions, two fac-tors appear to be critical: its level of commit-ment and its capacity to act. Decision-makers need to be convinced of the value of an Eco2 approach, and they need to mobilize political support within their constituency. A city’s success will depend upon how e9 ectively and creatively it uses and develops the levers of infl uence within its control: these can range from its human & technical capacity and its knowledge of local realities, to its formal ur-ban planning tools and municipal fi nance strategies. Often, in order to act e9 ectively, a city may need technical, administrative and fi nancial support, including knowledge, skills and tools.
A city’s capacity to act will also depend on the levers of infl uence beyond its realm of control. Often its legislative, administrative, and fi scal powers are circumscribed by na-tional or state level governments whose coop-eration is crucial. At the same time, given the growing predominance of metropolitan areas
which span the jurisdiction of more than a single city, it is often the case that coordina-tion is required at the metropolitan level for optimal interventions within and across all sectors. Thus leadership by cities needs to oc-cur at many levels, including the region.
The city based approach is not only politi-cal, it is fundamentally ecological. Cities are centers of resource consumption, and ulti-mately resource e6 ciency will depend greatly on how well the city is integrated into the local and regional ecologies. City planning is fi rstly about protecting and regenerating the irre-placeable natural capital, especially the natural assets and ecological services throughout the urban region in which the city is located. All cities need to be fully integrated into a viable local ecology. The integration of cities into lo-cal ecologies can happen at all scales, from food gardens and nature-scaping to planning con-tainment boundaries that e9 ectively separate urban areas from natural areas.
Ideally the ecological elements mix and in-tersect within the city, and stretch throughout the city as a natural blue/green web, provid-ing multiple services to the local economy. Ecologies and open green spaces serve as a kind of ‘green infrastructure.’ They might pol-linate crops and orchards on behalf of the agri-food systems, or recharge aquifers on be-half of the water supply system, or channel wind toward open hilltops or water basins on behalf of the local energy utility. Green infra-structure may also serve to enhance the larger ecological systems.
“ The living city is not an island: its metabolism is
interlinked to surrounding ecosystems and its
people and culture networked to other viable ur-
ban cells to form a living and developing tissue, a
net primary producer, not a parasitic system.”
India-Goa 2100 Plan, 2003
ECo2-Part1REVd_PREP 31 6/15/09 8:21:42 AM
32 | ECO2 CITIES: ECOLOGICAL CITIES AS ECONOMIC CITIES
PRINCIPLE 2: An Expanded Platform for
Collaborative Design and
Decision-making
As we have seen, one of the characteristics of re-source e6 cient and well planned cities is their ability to capture synergies from integrated ap-proaches, and to coordinate actions among mul-tiple stakeholders over the long-term. An inte-grated approach and an alignment of policies is not something that is likely to emerge by default. The process requires a platform that is suitable for the expanded scope of activity.
Cities are dynamic phenomena. They emerge from the overlapping actions of many di9 erent groups of stakeholders—public sec-tor, the private sector, civil society groups and citizens—each of which has infl uence over how elements of the city are designed and managed. Although none has the mandate or capacity to address the performance of the city as a system, they all stand to benefi t when the elements are well integrated. However without a proactive e9 ort to bring these stake-holders together, and to integrate plans and policies, the likelihood exists that some poli-cies and actions will confl ict, and that the costs of confl ict will be borne by the economy and the environment. Even without direct confl ict, the tendency for all stakeholders to act in their own immediate interests ignores the potential for positive synergies, and opti-mum solutions.
Cities are increasingly experiencing a splintering of infrastructure responsibilities, the overlapping and intersection of jurisdic-tions, and an increase in private sector owner-ship of key assets. An additional constraint is the election cycle, which can limit the capac-ity of cities—on their own—to execute policies over the long-term. The typical four-year elec-tion cycles for local governments essentially undermine sustainable decision-making, since the change in leadership frequently means a loss in continuity. If cities are to lead the process of urban development, especially
in the context of rapid urbanization, it is im-portant to get ahead of this curve.
A city can lead a collaborative process on at least three tiers of an expanded platform. At the fi rst tier, projects may be completely with-in the realm of control of the city administra-tion itself, and will entail a city getting its own house in order—for example, an energy e6 -ciency upgrade for all municipally-owned buildings, or a ride-share program for em-ployees, or energy and transport peak load management through the adjustment of work-ing hours. At the second tier, projects will en-tail the city in its capacity as a provider of services and include its formal planning, reg-ulatory, and decision-making powers—this can include water provision, land use plan-ning, or transit development. At this level, greater collaboration is warranted with other stakeholders who can infl uence, and who might be impacted by, the outcomes.
The third tier of the expanded platform will entail collaboration at the scale of the en-tire urban area or region. This can pertain to issues like the development of new land, or metropolitan management, and may neces-sarily involve senior governments, key private sector partners and civil society. When col-laborating at the scale of the entire urban area, the city itself may lack the authority to coor-dinate actions of many stakeholders. Senior governments, utilities, landowners, and private sector groups all have their own plans and agendas. At this level, it is often an appropriate process to develop an overarching planning framework, including a growth management strategy, which sets the context for all other plans in the urban area by all other stakehold-ers. At each of these scales, very di9 erent levels of collaboration are necessary and di9 erent working groups are required, all participating in a city-led collaborative process.
As a city embarks on its Eco2 pathway, many di9 erent projects could occur over a single year in which di9 erent players from the private sector, public sector, civil sector and
ECo2-Part1REVd_PREP 32 6/15/09 8:21:42 AM
T H E F R A M E WO R K | 33
other sectors may wish to participate, or may have valuable information or assistance to of-fer at various levels. For this reason, it is im-portant for a city to initiate a process where participants develop a shared long-term plan-ning framework to guide all projects and ef-forts, and which creates the opportunity and vehicle for groups to align their policies and programs around a common set of long term goals and strategies. The framework can also set the context for specifi c projects. In many cases a primary collaborative working group can generate sub groups that meet as needed and that can also benefi t from professional fa-cilitation, research, and other support. The planning framework can be a powerful plat-form for collaborative design and decision-making and can enable the city to steer the e9 orts of all stakeholders toward a commonly agreed upon vision. Because Eco2 focuses on integrated design solutions, as well as inte-grated implementation policies, projects may invariably expand to include multiple stake-holders and require a highly diverse pool of expertise.
Once the formal collaborative process is in place, it also o9 ers the opportunity for much more intensive participation on particular projects amongst stakeholders in design and implementation. For example an integrated approach to neighbourhood revitalization can often benefi t from iterative series of design workshops that engage a variety of experts from di9 erent groups in creative design exer-cises. Regular participation in such creative design workshops is much easier to arrange and approve if the groups who need to be in-volved are already participating in a formal collaborative process at the most senior level. The same is true when it comes to implement-ing the preferred design solutions. Essentially, an expanded platform for collaboration at dif-ferent scales creates a mechanism that can be used repeatedly to bring stakeholders togeth-er, and to expedite the intensive, and interdis-
ciplinary process of design and implementa-tion of Eco2 projects.
Finally, the expanded platform for colla-boration, in combination with a long-term planning framework, is likely to increase the commitment by local governments to its lon-ger-term policies. It is much more di6 cult for a new council or mayor to reverse decisions if many other stakeholders have participated in the decisions, and are cooperating through their own policy instruments. In the case of Curitiba, for example, the creation of a sepa-rate planning institute—the IPPUC—provided a particularly strong basis for on-going col-laboration in long-term planning. This ap-proach has now been followed in many other countries in Latin America. By extending the platform for decision-making to include plan-ning institutes, and by encouraging alignment amongst all stakeholders, the governance of a city becomes less vulnerable to the inevitable disruptions created by elections, political inci-dents, and the manipulation of policy by special interest groups and swing voters at election time. An expanded platform for collaboration com-pensates for the inherent short-termism of the democratic process.
PRINCIPLE 3: A ‘One-System’ Approach
Chapter One o9 ered a number of specifi c ex-amples of system integration within cities—all of which led to sizable and lasting benefi ts. An integrated approach to planning and manage-ment in Stockholm helped to signifi cantly im-prove resource e6 ciency in a large urban rede-velopment project. In Yokohama, an integrated approach to waste reduction, reuse and recy-cling saved over a billion dollars for the city, with just as impressive environmental gains. In Curitiba, an integrated and holistic approach to urban planning, transportation planning, and socio-economic vitalization has enabled the city to achieve tremendous results across all sectors and for many stakeholder groups.
ECo2-Part1REVd_PREP 33 6/15/09 8:21:42 AM
34 | ECO2 CITIES: ECOLOGICAL CITIES AS ECONOMIC CITIES
There are many more examples that you will encounter in this book. What distinguishes these cities from others is that they broadened their perspective to adopt a One System Ap-proach, which they pursued largely through strategies of integration.
A One System Approach enables cities to plan, design, and manage the whole urban system by integrating and/or optimizing its key subsystems. In doing so, it provides the opportunity for cities to realize many benefi ts through synergy.
The One Systems Approach is about taking full advantage of all the opportunities for in-tegration. Integration can apply to hard infra-structure systems and land use planning. One can integrate elements within a sector or across sectors. Integration can be applied to policies, stakeholders and plans, sequencing of fi nancing mechanisms, and all of these in combination! In each case, the integration op-portunities tend to provide greater e6 ciency and increased utility for a given investment, and improve ecological and economic perfor-mance. By applying the One System Approach to every project, entire cities, and their sur-rounding natural and rural areas, can coalesce into a functional system that works well as a new whole.
The benefi ts of integration are especially attractive because the e6 ciency gains tend to be substantial, and because the opportunities tend to be missed. The greatest success in best
practice cities has been achieved: 1) in joint land-use, spatial, and transport planning and coordinated policies; 2) through positive syn-ergies across infrastructure sectors—such as increased water system e6 ciency positively impacting energy e6 ciency by reducing the need for electricity to pump water; 3) in inte-grated utility management systems (for in-stance, the reuse of sludge and organic waste as biogas (methane) and fertilizer); 4) through technology solutions, such as combined heat and power plants; and 5) through synchroni-zation of policy, investment planning, and regulations.
Integration is a powerful concept for cities, as we shall see in Chapter Five. So where does the concept come from, and where might it take us in the long run?
Integration is used here as it relates to the application of systems theory: seeing the full scope of elements that make up the city, how these di9 erent elements are connected, and how changes in one element can a9 ect the others. This systems perspective is a way of seeing the world that has emerged from study-ing ecological systems, and in the end it can help us design and manage cities so that they can become very e6 cient, and very adaptive—just like natural ecologies.
Ecological systems are characterised by a multi-functionality of elements and the loop-ing and cascading of resources through inter-linked and nested subsystems, which greatly enhance productive utility. They also demon-strate powerful strategies for managing change; strategies like succession and evolution, self-organization, and adaptive management. All of these strategies are part of what we mean by the integrated or One-System Approach. The strategies serve two purposes: they improve the e6 ciency of the system as a whole—maxi-mizing assets and information quality over time; and they help the system adapt to change at least cost, and recover quickly and fully from shocks. Many of these ideas are being applied by innovative cities which grasp the potential
“ Systems thinking can be defi ned as the art of simplifying complex-
ity, managing interdependency, and understanding choices. Once
we understand something —once we see it as one system—we no
longer see it as chaotic or complex.
“Contrary to widely held belief, the popular notion of a multidisci-
plinary approach is not a systems approach. The ability to synthesize
separate fi ndings into a coherent whole seems far more critical than
the ability to generate information from different perspectives.”
Systems Thinking, Garajedaghi 2006
ECo2-Part1REVd_PREP 34 6/15/09 8:21:42 AM
T H E F R A M E WO R K | 35
of these opportunities for system wide sustain-ability and resilience.
A One System Approach has many dimen-sions, but it is not complicated. The whole idea of systems thinking is to reduce complex-ity by understanding how parts fi t into the whole. The challenging part is overcoming the institutional structures and inherited at-titudes that prevent city leaders, investors, designers, users, suppliers, and managers from working as a team. Adopting the One System Approach as a principle for all proj-ects is a good way to bring the team together.
PRINCIPLE 4: An Investment Framework
that Values Sustainability
and Resiliency
Despite a rising interest in sustainability in many locations, and a demonstrated capacity for urban design solutions, cities today are hav-ing di6 culty investing in systems that are long-term and ecological. Although many excep-tions exist, our time horizons for investments generally appear to be shrinking. Perhaps the fast-paced and deregulated global economy makes it especially di6 cult for corporations and political leaders to take a long view.
Whatever the explanation, the simple con-cept of investing in sustainability and resil-iency has become extremely di6 cult for cities to put into action. Policies, plans, and projects are assessed on their abilities to provide short term fi nancial returns, or economic valuations based upon narrowly structured cost benefi t analyses from the perspectives of single stake-holders. Investments are valued in monetary terms, and what cannot be monetarised is ei-ther ignored, or addressed on the side as ‘ex-ternalities.’ Decisions are dominated by im-mediate capital costs, despite the fact that often over 90 percent of lifecycle costs for typical infrastructure are expended during operational maintenance and rehabilitation.
Most cities worldwide have no real knowl-edge of the long-term impacts on fi scal health
of new development. Lifecycle costs are back-loaded, which means that future generations will have huge costs for repair and replace-ment of infrastructure without any capitalisa-tion. In many developed country cities, that future has already arrived by creating a mas-sive infrastructure defi cit that can only be ad-dressed through subsidies and/or more debt fi nancing.
At the same time, ecological assets, the ser-vices they provide, and the economic conse-quences of their depletion and destruction are not accounted for in most government budgets. Since these resources are not mea-sured, they are treated as zero value assets—and their services go unaccounted for.
For instance, green areas in a city are usually thought of as simply providing some sort of soft aesthetic value. But, in fact, green areas are ecological assets that provide valuable services and economic benefi ts in several ways: 1) they provide natural drainage (results in avoided in-frastructure capital and maintenance costs, and reduces seasonal losses related to fl ood-ing); 2) they can reduce the average tempera-ture in cities (this reduces peak load demand on electricity, which can result in avoided capi-tal costs for installed power power as well as related operation and maintenance cost); 3) they absorb carbon dioxide and release oxygen, are natural air cleaners, and support overall citizen health; 4) they can be integrated into the public transport system as a network of bike paths and pedestrian walkways to en-hance utility; and 5) they have generally been shown to increase physical and mental wellbe-ing, while creating a sense of community and reducing crime. If all of these services were truly valued, and understood in the long-term, then decisions in many cities might be made in a way similar to Curitiba.52
To achieve ecological and economic sustain-ability, decision-making needs to be clearly guided by a holistic perspective. What this en-tails is a new accounting and assessment frame-work that allows every city to adopt a lifecycle
ECo2-Part1REVd_PREP 35 6/15/09 8:21:43 AM
36 | ECO2 CITIES: ECOLOGICAL CITIES AS ECONOMIC CITIES
perspective and make investments that are fair to all stakeholders, e9 ective at preserving all assets (manufactures, natural, human and so-cial), and good for our long-term fi scal health.
This will entail adopting a new range of in-dicators and benchmarks for assessing and re-warding the performance of all stakeholders. Longer time horizons and life-cycle analysis on the implications of policies and investment options and strategies among multiple stake-holders will need to be carried out to refl ect a truer, more inclusive, and more complete pic-ture. All capital assets (manufactured, natural, human and social) and the services they pro-vide should be appropriately valued or priced—and monitored by indicators. The combination of indicators should be viewed as a whole, so that the qualitative dimensions of city life (cul-tural, historic, and aesthetic) cannot be ignored when assessing costs and benefi ts. The basis and implications of policy decisions, regulatory actions, and legislation will need to be assessed in the broader context of Eco2.
At the same time, investing in sustainability and resiliency will entail broadening our scope of risk assessment and management to include managing the many indirect, di6 cult to measure risks that threaten the viability of an investment or even the city as a whole. In reality, cities today face multiple hazards that are largely external to fi nancial calculations. These include sudden disruptions to systems, such as epidemics, natural disasters, and so-cio-economic changes. By proactively adopt-ing the concepts of resilience and adaptive capacity, cities will be better positioned to ab-sorb and respond to shocks and protect their investments.
It is clearly understandable that introduc-ing new methodologies and a broader scope of accounting in many countries will be di6 -cult and complex. But, while the actual use of complex methodologies will take time to be established, at least the principle behind such methods should be clearly understood and
considered by decision-makers. Curitiba did not do a detailed accounting and valuation ex-ercise before following its development agen-da. But by appreciating the broader and lon-ger term perspective, it managed to focus on critical interventions which continue to pay lasting and compounded benefi ts.
Moving from Principles to Core Elements to a Unique Eco² Pathway
The four principles defi ne the scope of each city’s unique Eco2 pathway. In other words, ev-ery aspect of a city’s pathway follows directly from one or more of the principles. The con-nections to principles are reinforced in all as-pects of the pathway. Since they lie at the core of the program, if things become complicated or confused, we can always ‘fall back’ on our principles.
The Analytical and Operational Frame-work emerges from the principles. For start-ers, we derive a set of Core Elements from each principle.
The Core Elements serve to operationalize the principles. They provide specifi c informa-tion on new concepts, and on the roles and responsibilities of Eco2 Cities and their part-ners. Each core element is an arena of activity and learning that will be addressed in detail in later Chapters of this book.
Each city will translate the Core Elements into a series of action items or ‘stepping stones’ that adapt the Elements to local condi-tions in a logical, step-by-step sequence. The Framework below summarizes how each principle leads to a set of core elements and Stepping Stones.
Together, the Stepping Stones for a partic-ular city constitute a unique Eco2 Pathway. The Pathway should include all the essential actions needed to take leadership, collaborate, and design Eco2 projects, and invest in the preferred solutions.
ECo2-Part1REVd_PREP 36 6/15/09 8:21:43 AM
T H E F R A M E WO R K | 37
Table 1.1 on the following pages provides only a summary of the core elements and step-ping stones. Each item is described in much more detail in subsequent chapters. However, it is clear from the summary that developing an Eco2 Pathway is not a simple exercise, nor is it likely to be quick and easy. For this rea-son, this book also includes a number of meth-ods and tools, such as the city-based DSS, that is designed to save time and guide decisions. The methods and tools provide practical ways for cities to take leadership and collaborate,
and analyze and assess ideas for Eco2 projects. The methods also address all aspects of proj-ect implementation, including the use of an expanded accounting process and a strategic approach to fi nancing.53
In the fi nal analysis, all cities want to ben-efi t from good urban and spatial planning. It is up to city leaders to determine whether the Eco2 Program is the kind of pathway they are seeking. The following chapters describe the step by step processes.
ECo2-Part1REVd_PREP 37 6/15/09 8:21:43 AM
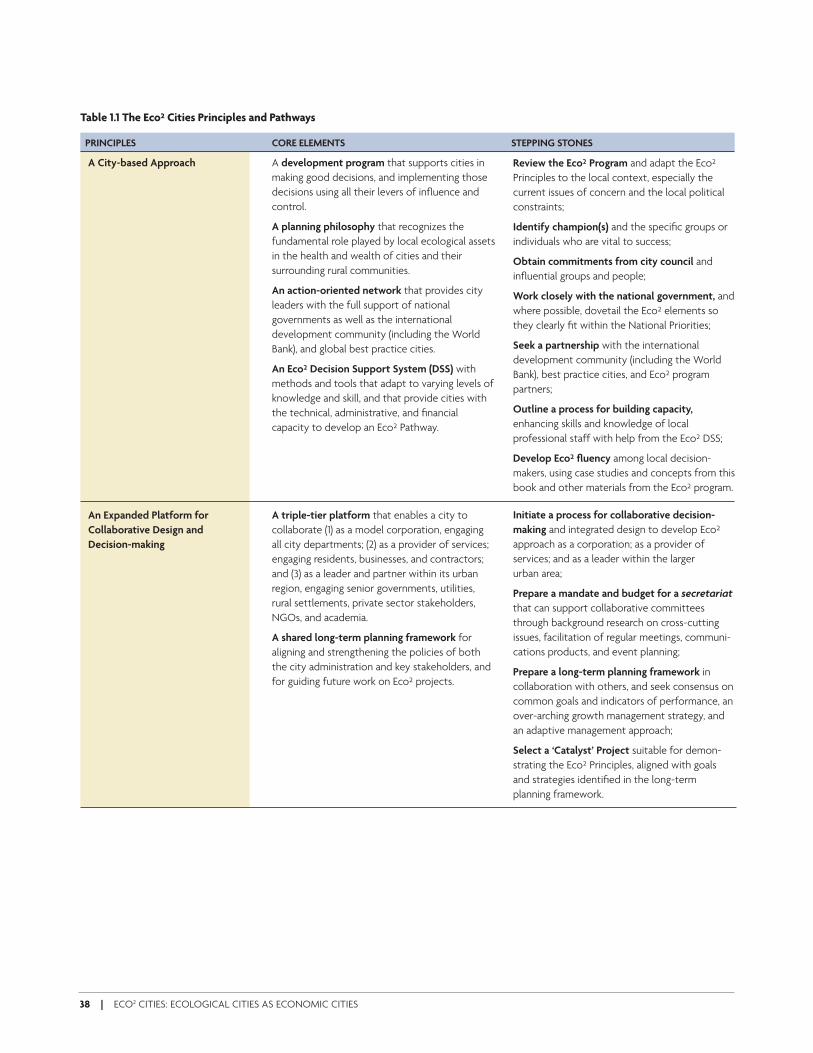
38 | ECO2 CITIES: ECOLOGICAL CITIES AS ECONOMIC CITIES
PRINCIPLES CORE ELEMENTS STEPPING STONES
A City-based Approach A development program that supports cities in
making good decisions, and implementing those
decisions using all their levers of infl uence and
control.
A planning philosophy that recognizes the
fundamental role played by local ecological assets
in the health and wealth of cities and their
surrounding rural communities.
An action-oriented network that provides city
leaders with the full support of national
governments as well as the international
development community (including the World
Bank), and global best practice cities.
An Eco² Decision Support System (DSS) with
methods and tools that adapt to varying levels of
knowledge and skill, and that provide cities with
the technical, administrative, and fi nancial
capacity to develop an Eco² Pathway.
An Expanded Platform for A triple-tier platform that enables a city to
Collaborative Design and collaborate (1) as a model corporation, engaging
Decision-making all city departments; (2) as a provider of services;
engaging residents, businesses, and contractors;
and (3) as a leader and partner within its urban
region, engaging senior governments, utilities,
rural settlements, private sector stakeholders,
NGOs, and academia.
A shared long-term planning framework for
aligning and strengthening the policies of both
the city administration and key stakeholders, and
for guiding future work on Eco² projects.
Review the Eco² Program and adapt the Eco²
Principles to the local context, especially the
current issues of concern and the local political
constraints;
Identify champion(s) and the specifi c groups or
individuals who are vital to success;
Obtain commitments from city council and
infl uential groups and people;
Work closely with the national government, and
where possible, dovetail the Eco² elements so
they clearly fi t within the National Priorities;
Seek a partnership with the international
development community (including the World
Bank), best practice cities, and Eco² program
partners;
Outline a process for building capacity,
enhancing skills and knowledge of local
professional staff with help from the Eco² DSS;
Develop Eco² fl uency among local decision-
makers, using case studies and concepts from this
book and other materials from the Eco² program.
Initiate a process for collaborative decision-
making and integrated design to develop Eco²
approach as a corporation; as a provider of
services; and as a leader within the larger
urban area;
Prepare a mandate and budget for a secretariat
that can support collaborative committees
through background research on cross-cutting
issues, facilitation of regular meetings, communi-
cations products, and event planning;
Prepare a long-term planning framework in
collaboration with others, and seek consensus on
common goals and indicators of performance, an
over-arching growth management strategy, and
an adaptive management approach;
Select a ‘Catalyst’ Project suitable for demon-
strating the Eco² Principles, aligned with goals
and strategies identifi ed in the long-term
planning framework.
Table 1.1 The Eco² Cities Principles and Pathways
ECo2-Part1REVd_PREP 38 6/15/09 8:21:43 AM
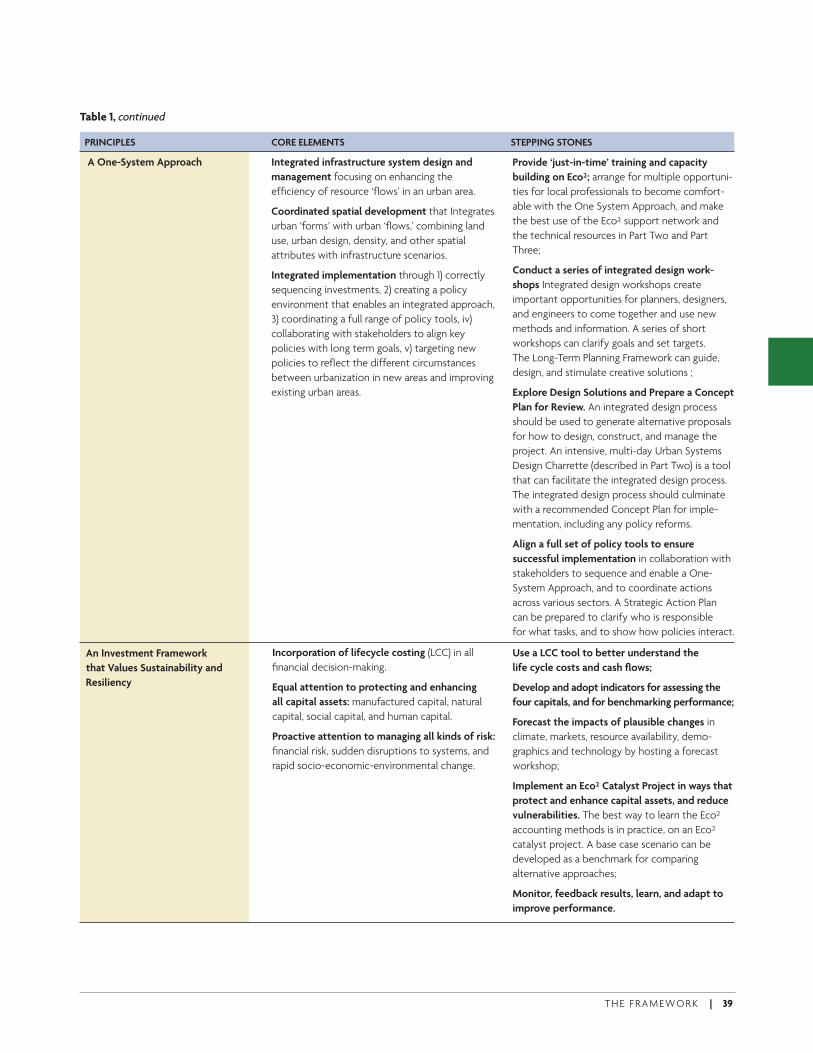
T H E F R A M E WO R K | 39
PRINCIPLES CORE ELEMENTS STEPPING STONES
A One-System Approach Integrated infrastructure system design and
management focusing on enhancing the
effi ciency of resource ‘fl ows’ in an urban area.
Coordinated spatial development that Integrates
urban ‘forms’ with urban ‘fl ows,’ combining land
use, urban design, density, and other spatial
attributes with infrastructure scenarios.
Integrated implementation through 1) correctly
sequencing investments, 2) creating a policy
environment that enables an integrated approach,
3) coordinating a full range of policy tools, iv)
collaborating with stakeholders to align key
policies with long term goals, v) targeting new
policies to refl ect the different circumstances
between urbanization in new areas and improving
existing urban areas.
An Investment Framework
that Values Sustainability and
Resiliency
Provide ‘just-in-time’ training and capacity
building on Eco²; arrange for multiple opportuni-
ties for local professionals to become comfort-
able with the One System Approach, and make
the best use of the Eco² support network and
the technical resources in Part Two and Part
Three;
Conduct a series of integrated design work-
shops Integrated design workshops create
important opportunities for planners, designers,
and engineers to come together and use new
methods and information. A series of short
workshops can clarify goals and set targets.
The Long-Term Planning Framework can guide,
design, and stimulate creative solutions ;
Explore Design Solutions and Prepare a Concept
Plan for Review. An integrated design process
should be used to generate alternative proposals
for how to design, construct, and manage the
project. An intensive, multi-day Urban Systems
Design Charrette (described in Part Two) is a tool
that can facilitate the integrated design process.
The integrated design process should culminate
with a recommended Concept Plan for imple-
mentation, including any policy reforms.
Align a full set of policy tools to ensure
successful implementation in collaboration with
stakeholders to sequence and enable a One-
System Approach, and to coordinate actions
across various sectors. A Strategic Action Plan
can be prepared to clarify who is responsible
for what tasks, and to show how policies interact.
Use a LCC tool to better understand the
life cycle costs and cash fl ows;
Develop and adopt indicators for assessing the
four capitals, and for benchmarking performance;
Forecast the impacts of plausible changes in
climate, markets, resource availability, demo-
graphics and technology by hosting a forecast
workshop;
Implement an Eco² Catalyst Project in ways that
protect and enhance capital assets, and reduce
vulnerabilities. The best way to learn the Eco²
accounting methods is in practice, on an Eco²
catalyst project. A base case scenario can be
developed as a benchmark for comparing
alternative approaches;
Monitor, feedback results, learn, and adapt to
improve performance.
Table 1, continued
Incorporation of lifecycle costing (LCC) in all
fi nancial decision-making.
Equal attention to protecting and enhancing
all capital assets: manufactured capital, natural
capital, social capital, and human capital.
Proactive attention to managing all kinds of risk:
fi nancial risk, sudden disruptions to systems, and
rapid socio-economic-environmental change.
ECo2-Part1REVd_PREP 39 6/15/09 8:21:43 AM

ECo2-Part1REVd_PREP 40 6/15/09 8:21:43 AM
T H E F R A M E WO R K | 41
A City-based Approach
CHAPTER 3
The fi rst step towards a city-based approach is
to appreciate and apply the philosophy at all
levels, from local councils to national govern-
ments to the international community. It needs
to be recognized that local governments, work-
ing in collaboration with stakeholders, are now
on the frontlines in dealing with some of the
most pressing development challenges, and
that most often they hold the key to solutions.
It is this philosophy that underlines the Eco2
Program. The core elements and stepping
stones of a City-based Approach are designed
to enable local governments to lead a develop-
ment process that accounts for their specifi c
circumstances, including local ecology.
The Core Elements of a City-based Approach
A development program that
supports cities
Cities have a wide range of powers that they can use to infl uence their development trajec-
tories. In addition, many countries are now for-warding processes of fi scal and administrative decentralisation. This has further brought im-portant decision making and management re-sponsibility to local governments. Often the impact of initiatives will depend on how e9 ec-tively and creatively city leadership cultivates and uses these powers. A development program that supports cities in their decision-making process, and more critically in the implementa-tion of decisions, is strongly needed to better enable cities to use their powers to exercise meaningful proactive leadership.
After assessing 25 successful cases of sustainable urbanization in dif-
ferent European cities, Timothy Beatley concludes that the role of city
leadership is crucial to success—“Government in these cities is not
seen as laissez-faire or caretaking in nature, but as an entity exercising
important proactive leadership; it is a pacesetter, not a follower or
spectator.”
Timothy Beatley, Green Urbanization, 2000
ECo2-Part1REVd_PREP 41 6/15/09 8:21:43 AM
42 | ECO2 CITIES: ECOLOGICAL CITIES AS ECONOMIC CITIES
A planning philosophy that recognizes the
fundamental role of local ecological assets
Local ecological assets provide all kinds of ser-vices to cities, from sand and gravel for con-crete, to renewable sources of energy, to sup-plies of drinking water, to assimilation of waste products, to pollination of market gardens, to pleasant views and recreational environments. The list of services for a typical city is very long. Increasingly, these services are critical to the viability of the local economy and the health, safety, and quality of life for residents. Because we lack a systems perspective and comprehen-sive accounting methods, the real quantity and value of such assets are rarely recognized. New accounting methods should help. So will a new philosophy of planning that gives priority to these assets when making decisions about ur-ban form and land use.
A city-based approach alters the mindset of the urban planner and civil engineer. Urban development moves from ‘big architecture’ in-dustrial engineering, and environmental man-agement (coping with externalities), to the stewardship of landscapes and integration of both social and ecological values into land use planning and infrastructure design and manage-ment. This is a change from the traditional city-centric view where natural systems are valued only as economic inputs or amenities, and where the rural and natural fringe of lands surround-ing a city is most often ignored, or treated as an ‘urban reserve’ for future expansion.
The Eco2 approach to planning begins with understanding the opportunities and con-straints of local ecologies. How do we fi t into the topography of the area so that water is provided by gravity? How do we protect the water recharge areas, and the wetlands, so that water capacity and quality is sustained? How do we distribute populations so that lo-cal renewable energy –windy sites, forests, solar access—is su6 cient to meet our basic needs? These type of questions are the fi rst place to start, and may ultimately provide ur-ban professionals with their most exciting de-
sign challenge: how to fi t cities into the land-scape in ways that respect and complement the natural capital and ensure ecological ser-vices are available for present and future gen-erations. In theory, all the constructed ele-ments that make up a city can contribute to—and benefi t from—the health and produc-tivity of local ecologies and natural resources.
An action-oriented network
The Eco2 approach is a team e9 ort. If cities are in the driver’s seat, then they need plenty of passengers to help with navigation and prob-lem solving. The composition of the team will vary from place to place. Often, it is the nation-al governments that must play a key role as their cities look for support and guidance in a fast-changing and competitive global market-place. National governments need to provide new channels for delivering resources to their cities. However, few countries have the re-sources to introduce all cities to new paradigms like Eco2. Nor can national governments pro-vide cities with the on-going technical, admin-istrative, and fi nancial resources that are need-ed to adopt best practices. It is for this reason that the Eco2 program is not an association of only cities, but rather a broad network of se-nior governments, international agencies and organizations, best practice cities, academic institutes, and private corporations—all of whom embrace Eco2 Principles and are willing to support those cities that assume leadership. The network allows each group to o9 er its spe-cial expertise and resources to cities in a coor-dinated or complementary fashion. Only through such multi-lateral and multi-level sup-port will it be practical to achieve signifi cant widespread changes to urban development in growing cities.
A City-based Decision Support System
(DSS)
The Eco2 approach requires that cities enhance their technical and administrative capacity, particularly with respect to leading collabora-
ECo2-Part1REVd_PREP 42 6/15/09 8:21:43 AM
T H E F R A M E WO R K | 43
tive processes and exploring integrated design solutions. Capacity-building means adopting methods and tools that help to simplify what would otherwise be very complex decisions. This is the role of the City-based Decision Sup-port System (DSS). The City-based DSS is an evolving set of methods and tools that is de-signed primarily to help cities take leadership and make the best choices.
Coping with complexity is one of the great-est challenges for Eco2. Cities represent the longest-lasting, most valuable, and most com-plex artefact created by humanity. Even under the best of circumstances, urban planning is a complex task, and the challenge increases when attempting to implement integrated so-lutions, which can be complex in themselves. Of course, the task becomes that much more challenging for developing countries where re-sources are limited and everything seems to be happening at once. Further challenges for de-veloping countries include their lack of experi-ence with using computer-based planning tools, and the often inadequate performance of existing infrastructure. For all these reasons the City-based DSS is an essential element in the Eco2 Program.
One of the most di6 cult tasks faced by any-one trying to apply an integrated approach to infrastructure systems is the dynamic rela-tionship that exists between physical fl ows and spatial form. Physical fl ows are more of-ten addressed through modeling and calcula-tion, and involve individuals with engineering and technical backgrounds. Spatial issues are usually addressed through mapping tech-niques, and involve individuals with a plan-ning or design background. Integrated design solutions need to incorporate both spatial and physical fl ows and understand interrelation-ships. The City-based DSS can help to create a ‘transdisciplinary’ platform for this purpose. Physical and spatial e9 ects are communicated by using graphical tools, sharing common data, and using terms and images that can eas-
ily be understood by a multidisciplinary group. These and other aspects of the Eco2 City-based DSS are described in much more detail in Part Two.
Stepping Stones for Taking a City-Based Approach
Review and adapt the Eco² Program
Change management is most successful when the new ideas are clothed in familiar patterns and sensitive to local concerns and capabilities. An assessment of local strengths and weak-nesses can help to tailor the Eco2 program to local conditions and experiences. This can in-clude a number of di9 erent ways to ‘customise’ Eco2:• Travelling Back to the Future: begin by
reviewing the history of the city and region, focusing on examples of where city leader-ship has achieved positive outcomes, or where a more integrated approach to de-sign, or a process of collaboration, has al-ready helped to provide multiple benefi ts. Use these historical examples to help ex-plain the strengths of Eco2. To obtain broad support within the city, the program is best introduced as a return to what has worked previously—a rea6 rmation of traditional values and institutions. The history of most cities is replete with stories that can be used for this purpose.
• Talking to the Trigger Issues: identify which of the current political issues within the community are most likely to be im-proved by an Eco2 approach. All politicians want to resolve these issues, and the media wants to speak to these issues and not a pro-gram or philosophy. These are the trigger issues which will build support for the Eco2 approach.
• Learning to lever infl uence, stand fi rm
and say No: The levers of infl uence and con-
ECo2-Part1REVd_PREP 43 6/15/09 8:21:43 AM
44 | ECO2 CITIES: ECOLOGICAL CITIES AS ECONOMIC CITIES
trol vary considerably from one location to another, and this obviously a9 ects the po-tential for an Eco2 approach. For example, in some countries the national government controls the fi nances for urban infrastruc-ture; in other countries, the ability of cities to invest in local renewable energy systems is prohibited by law. Cities that lack control over fi nancing or lack the authority to de-velop new policy obviously face a greater challenge. But often the biggest di6 culty is to use what levers exist to infl uence decisions—zoning, development approvals, hook-up requirements for infrastructure, and so on. An assessment of local strengths should clarify the full extent of infl uence and power available to local government. Almost always, cities have more authority than they realise, and the real challenge is learning to say no to the short-term vested interests that drive so much land development.
Identify local champion(s)
The successful introduction of Eco2 principles usually requires a strong champion who can help to motivate the many groups that need to be involved, sustain the commitment over time, and provide confi dence and leadership. Local champions can help put forward key ideas in ways that are acceptable to various stakehold-ers, and thereby broker solutions that are wide-ly accepted. Local champions can also attract other infl uential individuals, by virtue of their reputation and infl uence.
The Eco2 champion can be drawn from any place—everyone has the potential to take leader-ship. However the task is easier if the champion is someone with recognised authority or infl u-ence, such as a well-liked retired statesperson, the city mayor, the chief administrator, or the chair of a development committee. Sometimes, leadership can emerge from an advisory group of senior statespersons or ‘elders’ who are widely respected and support the Eco2 concept.
Wherever the champion is located, a sup-port group of committed and knowledgeable
individuals is also necessary. All champions de-pend upon a support group, or their ‘change agents’ to develop their networks and their knowledge base. In an Eco2 city, support can come from a small group of hard-working sta9 , or from an ad hoc group of experts and com-munity activists. Ideally, the support group should be capable of providing its champion with both administrative and technical sup-port. In some cases, a national body can be part of the support group. For example, support from national governments may include an of-fi ce for providing cities with both technical and fi nancial assistance.
Obtain a commitment from
the city council
Much of the land in a city, and a majority of the infrastructure as well, may be owned by private sector groups or by senior levels of government. Nevertheless, democratically elected local coun-cils have a high degree of legitimacy when it comes to land-use planning, especially in mak-ing strategic choices that can a9 ect the long-term health of the community. These councils are often seen as the appropriate leaders for bringing together regional stakeholders, and promoting collaborative decision-making and integrated design. Whenever a local council is fully engaged, others come to the table. It is thus critical that support is received from the council and individual councillors with special interests in development issues. The council needs to be engaged in the Eco2 program from the start.
When involving a council in Eco2 planning, it helps if the Eco2 Pathway is presented as a way to address issues of greatest concern to councillors. This is not usually a problem. The integrated approach adds strength to any spe-cifi c issue by providing multiple benefi ts, and expanding the base of support for positive change. For example, a9 ordable housing can be designed to treat wastewater for the neigh-bourhood, or to simultaneously increase the available space for small shops and business. The multi-purpose nature of Eco2 projects, and
ECo2-Part1REVd_PREP 44 6/15/09 8:21:44 AM
T H E F R A M E WO R K | 45
their more thorough analysis of impacts on the whole economy and ecology, make these proj-ects easier to broker.
Obtaining an informed commitment from the council, and sustaining this commitment, can be di6 cult and time-consuming. It is espe-cially important to emphasize the long-term and collaborative elements, and to use both these features as a means to dissociate Eco2 from any one political party or power group.
Work closely with the national
government
National governments can play a number of complementary roles in the Eco2 program. They can function as an important center of expertise and networking on best practices in urban design and planning. National govern-ments can share best practices from one city to another, and develop new policies in support of a city-based approach. They can choose to work with cities on a locally specifi c planning framework (e.g., a regional growth manage-ment strategy), and contribute expertise on a project by project basis.
Although the limited resources available to national government departments can con-strain their ability to participate directly with cities on new initiatives, these departments should still fi nd ways to participate to some de-gree in any regional-scale collaborative work-ing groups.
Another interesting and highly infl uential role for national governments is to establish a national Eco2 Fund Program, which can serve as a conduit for fi nancing programs and dis-seminating knowledge on global best practices. Both Sweden and Canada have used similar mechanisms to support cities. The Swedish Lo-cal Investment Program (LIP) which lasted from 1998 to 2002, allocated SEK 6.2 billion (671 million Euros) to 211 local investment programs in 161 municipalities, involving 1,814 projects.c This national investment leveraged from mu-nicipalities, businesses and other organizations SEK 27.3 billion (2.95 billion Euros), of which
SEK 21 billion (2.27 billion Euros) were invest-ments directly related to sustainability and the environment.d 20,000 full time temporary or permanent jobs were estimated to be created.e For more details on this program, please refer to Part Three, the Field Reference Guide.
Figure 1.4 illustrates one possible model of a National Eco2 Fund Program. The national government would adapt the Eco2 Program to local circumstances, working in partnership with the World Bank, other international agen-cies, development organizations, and the pri-vate sector. It would allocate resources among cities, and administer funds.
Whatever the involvement of national gov-ernment in the program, it is important for lo-cal governments to adapt their Eco2 pathway to current priorities established at the national level. This means fi nding points of commonal-ity, and adopting terms and language similar to those used by the national government. In this way, the national government automatically becomes an ally, and a potential partner.
Engage the International Community,
Best Practice Cities, and the World Bank’s
Eco² Program
Engaging the World Bank and other partners directly in the Eco2 Pathway is an option for every city. The Eco2 Program can o9 er cities a variety of literature, including guidelines and technical reports, to support every stage of the Eco2 Pathway. On a case-by-case basis, the World Bank, in concert with national govern-ments and Eco2 global partners, may be in a position to assist with fi nancing Eco2 integrat-ed solutions. For example, the World Bank can help cities integrate and consolidate a variety of fi nancial mechanisms, as Eco2 projects tend to need di9 erent types of fi nancing at each stage, and may qualify for multiple types of funding. The World Bank’s various fi nancial instruments are introduced in in Chapter 7 of Part One, and in Part Three.
Eco2’s global partners are willing to provide support to cities in cases where special exper-
ECo2-Part1REVd_PREP 45 6/15/09 8:21:44 AM
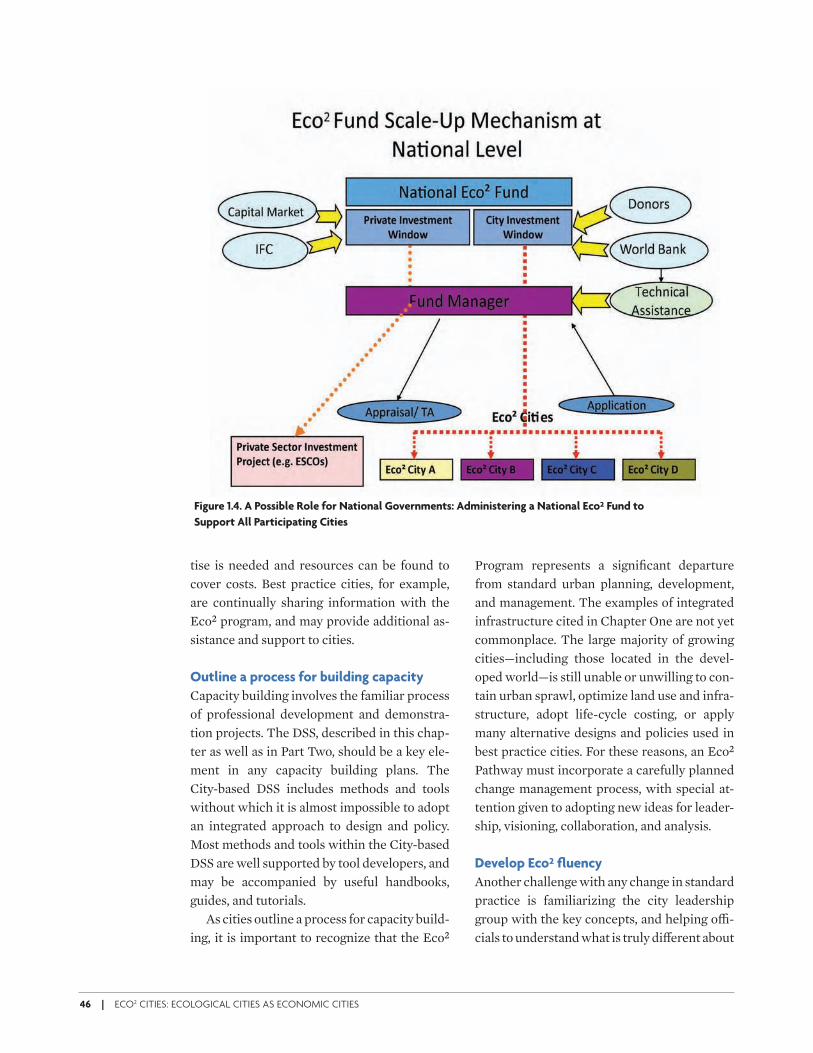
46 | ECO2 CITIES: ECOLOGICAL CITIES AS ECONOMIC CITIES
tise is needed and resources can be found to cover costs. Best practice cities, for example, are continually sharing information with the Eco2 program, and may provide additional as-sistance and support to cities.
Outline a process for building capacity
Capacity building involves the familiar process of professional development and demonstra-tion projects. The DSS, described in this chap-ter as well as in Part Two, should be a key ele-ment in any capacity building plans. The City-based DSS includes methods and tools without which it is almost impossible to adopt an integrated approach to design and policy. Most methods and tools within the City-based DSS are well supported by tool developers, and may be accompanied by useful handbooks, guides, and tutorials.
As cities outline a process for capacity build-ing, it is important to recognize that the Eco2
Program represents a signifi cant departure from standard urban planning, development, and management. The examples of integrated infrastructure cited in Chapter One are not yet commonplace. The large majority of growing cities—including those located in the devel-oped world—is still unable or unwilling to con-tain urban sprawl, optimize land use and infra-structure, adopt life-cycle costing, or apply many alternative designs and policies used in best practice cities. For these reasons, an Eco2 Pathway must incorporate a carefully planned change management process, with special at-tention given to adopting new ideas for leader-ship, visioning, collaboration, and analysis.
Develop Eco² fl uency
Another challenge with any change in standard practice is familiarizing the city leadership group with the key concepts, and helping o6 -cials to understand what is truly di9 erent about
Figure 1.4. A Possible Role for National Governments: Administering a National Eco² Fund to
Support All Participating Cities
ECo2-Part1REVd_PREP 46 6/15/09 8:21:44 AM
T H E F R A M E WO R K | 47
the new approach and why it can be especially benefi cial. Individuals need quiet time to ab-sorb new ideas. The Eco2 Cities program pro-vides resources—including this book—that can help introduce key concepts and terms. Case studies are an excellent place to start. Talking with best practice cities or viewing video testi-monials from other experienced decision mak-ers can also be helpful in providing leaders with the confi dence to adopt and promote a new approach.
Developing Eco2 fl uency might require spe-cial sessions for local politicians and executives that allow these o6 cials to explore new concepts and practice defending new approaches. Within the Eco2 program, for example, the concept of collaboration involves consensus decision-mak-
ing at di9 erent tiers, and a formal commitment by stakeholders to attend regular meetings and align their policies in cases where consensus ex-ists. These distinctions need to be made clear and acceptable, since they expand upon tradi-tional views of best practice in governance.
Another example where Eco2 fl uency is im-portant entails the concepts of ecological de-sign. The ‘looping and cascading’ of resource fl ows within a city can be explained using graphical case studies. It may be helpful to gather key decision-makers together for sev-eral hours in a comfortable environment to dis-cuss the case studies and key lessons learned, or even participate in mock workshops and de-sign exercises. The Eco2 fl uency campaign is about making decision-makers comfortable using a new language for design and invest-ment.
ECo2-Part1REVd_PREP 47 6/15/09 8:21:45 AM

ECo2-Part1REVd_PREP 48 6/15/09 8:21:45 AM
T H E F R A M E WO R K | 49
An Expanded Platform for Collaborative Design and Decision-Making
CHAPTER 4
This principle speaks to the importance of
adopting a design and decision-making process
that is more integrated, adaptable, and lasting.
If we want to improve economic and ecological
performance through integrated, fi ne-scaled,
fl exible and long-lasting solutions, we must
also pursue shifts in the institutional arrange-
ments that enable design and decision-making.
In many ways, the constructed environment is
mirror of the way we think and relate.
The solution is two-fold: 1) engage stake-
holders at all scales in a collaborative process
as part of every major project; and 2) develop
an over-arching planning framework for sus-
tainability and resiliency, which includes goals,
targets, and strategies. Each of these elements
is discussed in this chapter. The elements are
mutually supporting. The collaboration at all
scales generates the skills, goodwill, and cre-
ative interchange needed to adopt new busi-
ness models. The shared planning framework
provides the context for integrated project de-
sign, and also aligns everyone’s plans and poli-
cies with a common set of community goals.
Collaboration is also a new form of gover-
nance. By engaging stakeholders at all scales,
the city creates a planning forum that is more
appropriate to mixed economies, where private
sector groups often control a majority of infra-
structure systems. And because the process is
driven by long-term goals and strategies, it can
help cities compensate for the impacts of fre-
“ . . .the future seems to lead quite clearly to a consensus-led approach
where everything is discussed and the participation of all interested
groups spans all phases of the development plan process.”
Towards Sustainable Urban Infrastructure:
Assessment, Tools and Good Practice
European Union, COST Action 8 2006
ECo2-Part1REVd_PREP 49 6/15/09 8:21:45 AM
50 | ECO2 CITIES: ECOLOGICAL CITIES AS ECONOMIC CITIES
quent election cycles, which tend to focus atten-
tion on short-term agendas and crisis issues.
The single greatest di2 culty in adopting col-
laborative arrangements is the lack of any
institutional champion to lead and guide the
process. Almost by defi nition, no department,
group, or government has the mandate, funds,
or independence to undertake such a broad,
cross-cutting process. Without a sponsor or
host, the process never gets started. This is one
reason why so few collaborative models exist at
the city scale. It is also a key reason why the
Eco2 Cities program proposes that cities assume
leadership in creating a platform for on-going
collaboration. Methods and tools to help cities
organize an expanded platform for collabora-
tion, and to use this platform to develop e& ec-
tive planning frameworks, including regional
growth strategies, are included in the City-
based DSS (Part Two).
The Core Elements of a Platform for Collaboration
A triple-tier platform
The City can lead a collaborative process on at least three levels or tiers. Each tier a9 ects the others, and in an ideal world, every city should lead a collaborative working group at every tier. In practice, the process may be incremental, or periodic. However, it is still important to di9 er-entiate the options. The tiers refl ect the varying levels of control and infl uence.
Inner Tier—House in Order
(Corporate Operations)
The fi rst and most fundamental tier is the col-laboration that can occur within and between departments of the city. At this inmost tier, the city has a great measure of control. It is here that city government can address how well it functions as a corporation and works as a team to put its ‘house in order.’
Various departments can routinely collabo-rate to make decisions that are more integrated and more e9 ective. Cross-cutting goals and targets can be adopted and incorporated into the strategic plan. A reporting and monitoring process can be implemented that informs the wider community of how well the city is look-ing after its various assets including publically owned buildings, employees, equipment, capi-tal, and so on. Special internal programs may be warranted. For example, the city might re-duce transportation costs for employees by means of ride sharing, bicycle storage, new parking policy, purchase of e6 cient vehicles, tele-work, and so on. Such a project might re-quire changes to building facilities and em-ployee benefi ts—changes that may only be pos-sible through a collaborative process involving many city departments. Other internal initia-tives might include improving the e6 ciency of building operations, procurement processes, waste management systems, and energy use.
Whatever the program or project, this inner tier collaboration provides the city with an im-mediate opportunity to learn how to lead an e9 ective process, such as an Eco2 project, and demonstrate its benefi ts. The city can use the collaborative process to become a model for all types of e6 cient and sustainable corporate op-erations. In almost every sector worldwide, the leaders of sustainability not only provide sus-tainable products and services, they also take pride in corporate performance, such as, for example, their ‘green’ head o6 ce. The same logic applies to cities. There is no excuse for failing to collaborate internally, since the city can initiate the process unilaterally. And the benefi ts extend well beyond internal opera-tions. It is always easier for cities to lead a col-laboration process externally—with stakehold-ers and partners—when the city has already succeeded internally.
ECo2-Part1REVd_PREP 50 6/15/09 8:21:45 AM
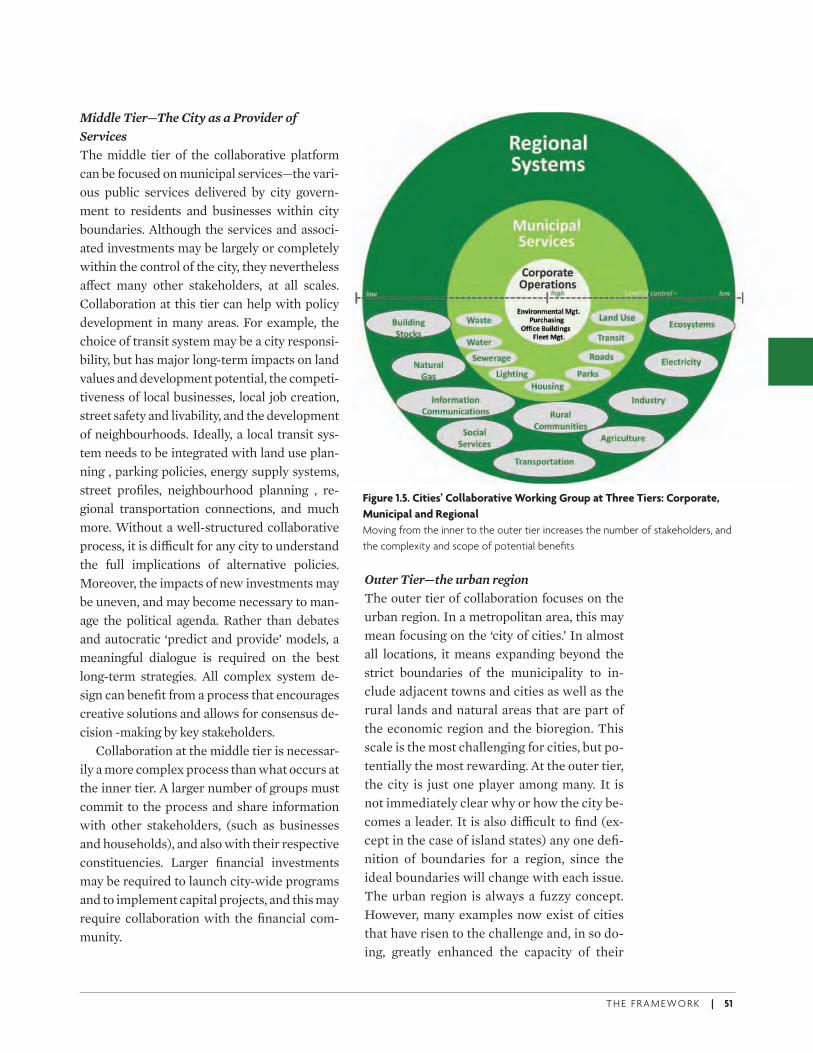
T H E F R A M E WO R K | 51
Middle Tier—The City as a Provider of
Services
The middle tier of the collaborative platform can be focused on municipal services—the vari-ous public services delivered by city govern-ment to residents and businesses within city boundaries. Although the services and associ-ated investments may be largely or completely within the control of the city, they nevertheless a9 ect many other stakeholders, at all scales. Collaboration at this tier can help with policy development in many areas. For example, the choice of transit system may be a city responsi-bility, but has major long-term impacts on land values and development potential, the competi-tiveness of local businesses, local job creation, street safety and livability, and the development of neighbourhoods. Ideally, a local transit sys-tem needs to be integrated with land use plan-ning , parking policies, energy supply systems, street profi les, neighbourhood planning , re-gional transportation connections, and much more. Without a well-structured collaborative process, it is di6 cult for any city to understand the full implications of alternative policies. Moreover, the impacts of new investments may be uneven, and may become necessary to man-age the political agenda. Rather than debates and autocratic ‘predict and provide’ models, a meaningful dialogue is required on the best long-term strategies. All complex system de-sign can benefi t from a process that encourages creative solutions and allows for consensus de-cision -making by key stakeholders.
Collaboration at the middle tier is necessar-ily a more complex process than what occurs at the inner tier. A larger number of groups must commit to the process and share information with other stakeholders, (such as businesses and households), and also with their respective constituencies. Larger fi nancial investments may be required to launch city-wide programs and to implement capital projects, and this may require collaboration with the fi nancial com-munity.
Outer Tier—the urban region
The outer tier of collaboration focuses on the urban region. In a metropolitan area, this may mean focusing on the ‘city of cities.’ In almost all locations, it means expanding beyond the strict boundaries of the municipality to in-clude adjacent towns and cities as well as the rural lands and natural areas that are part of the economic region and the bioregion. This scale is the most challenging for cities, but po-tentially the most rewarding. At the outer tier, the city is just one player among many. It is not immediately clear why or how the city be-comes a leader. It is also di6 cult to fi nd (ex-cept in the case of island states) any one defi -nition of boundaries for a region, since the ideal boundaries will change with each issue. The urban region is always a fuzzy concept. However, many examples now exist of cities that have risen to the challenge and, in so do-ing, greatly enhanced the capacity of their
Figure 1.5. Cities’ Collaborative Working Group at Three Tiers: Corporate,
Municipal and Regional
Moving from the inner to the outer tier increases the number of stakeholders, and
the complexity and scope of potential benefi ts
ECo2-Part1REVd_PREP 51 6/15/09 8:21:46 AM
52 | ECO2 CITIES: ECOLOGICAL CITIES AS ECONOMIC CITIES
communities to articulate and achieve eco-nomic and ecological goals. To a large extent, the sustainability of a city depends upon its capacity to provide leadership and collaborate at the scale of the urban region in which it is immersed.
Stakeholders at the outer tier may resist at-tempts to develop a formal platform for col-laboration. For an electrical utility, for exam-ple, its service territory may form a logical planning unit, not a particular urban region. For adjacent towns and cities, the habitual mode may be competition for land rents and tax base or access to development funding. The focus of collaboration needs to be long-term to fi nd common purposes. Absent a col-laborative process, the regional stakeholders will almost certainly be working at cross pur-poses. Collaboration provides an unusual and important opportunity for such groups to meet, develop personal relationships, agree on long-term directions, and discuss current plans. For example, electricity companies might meet with natural gas companies, and
begin a conversation about the best long-term uses for these scarce energy resources within the city. Or the owners of buildings might dis-cuss with the city departments the appropri-ate level of investment to be made to upgrade existing building stock for resource e6 ciency. These are crucial issues for Eco2 cities, and they can only be resolved through a continu-ous, well-managed dialogue and collaborative decision-making.
The outer tier collaborative platform needs a very strong structure. It may include senior statespersons at the core, team leaders from private fi rms, knowledge institutions and public bodies, and experts and champions from a variety of sectors. The structure can build upon existing partnerships and commit-tees if these exist, and if they are consistent with the collaborative process. A collabora-tive working group does not need to be time limited. Ad hoc sub-groups can be formed to meet regularly on specifi c issues as appropri-ate. Part Two provides much more detail on the potential make-up and activities of collab-orative working groups.
From 2003 to 2009, the urban region of Auckland New Zealand undertook a collabora-tive process, including the preparation of a shared long-term (100-year) planning frame-work. The process of developing a framework was highly inclusive, with many conversations feeding into the framework and emerging re-sponses. The Regional Growth Strategy, for ex-ample, facilitated region-wide discussions and a councillors’ reference group to provide direc-tion and support. Similarly, local authorities and the central government formed a working group to ensure representative infl uence, en-able shared responsibility for funding the Auckland Sustainability Framework, and en-sure that sta9 would be actively involved. The process was neither linear nor predictable and its ‘messiness’ can be seen as an inherent qual-ity of a positive outcome. A key collaborative element was the relationship between central and local governments aligned with common
The Danger of Predict and Provide Models
In the middle of the 20th century “a new ‘scientifi c’ and professional
endeavor was born through the transport planning and traffi c engi-
neering disciplines. The basic philosophy of the urban transport plan-
ning process was to plan for infrastructure supply to meet projected
traffi c growth—a ‘predict and provide’ approach. This approach be-
came characterized by self-fulfi lling prophecies of spiralling traffi c
growth, congestion and road building. This method of transport plan-
ning has proven damaging to cities around the world. Freeways have
been punched through neighborhoods, demolishing large section of
urban fabric, severing communities and destroying natural environ-
ments and food-producing areas. Roads have been built and widened
to accommodate more traffi c, reduce congestion, save fuel and re-
duce emissions, despite evidence that this approach fails. Public trans-
port, and particularly non-motororzied modes, have been big losers in
a planning process optimized for the automobile.”
J. Kenworthy “The Eco-City: Ten key transport and
planning dimensions for sustainable city development” in
Environment and Urbanization, Volume 18, No. 1, April 2006
ECo2-Part1REVd_PREP 52 6/15/09 8:21:47 AM
T H E F R A M E WO R K | 53
governance elements, including a joint com-mitment to developing a shared long-term view of a sustainable Auckland. Part Three in-cludes a full case study of the Auckland collab-orative process and the sustainability frame-work this city created.
A new approach to governance, and
perhaps a new way of living together
Collaboration is a process that can evolve from a simple working group for interdepartmental planning, to a new forum for governance for the urban region as a whole, to a new culture of cooperation and fl exible teamwork that is ad-opted as a matter of course. Whatever the scale of collaboration, the capacity to lead a collab-orative process can greatly improve potential for integrated design and policy, and for sus-tainable development. The fi rst step towards success is to fully understand how a city can organise and support a collaborative process. Much more detail is provided in the City-based DSS (Part Two).
A shared long-term planning framework
for the urban region
A second step towards creating an expanded platform for collaboration is to adopt a shared long-term planning framework. The frame-work ensures that all public decisions—includ-ing capital investments—are supported by a logical, transparent rationale. An Eco2 frame-work needs to combine two perspectives on the future: 1) achieving goals for sustainability, and 2) managing risk for greater resiliency. Box 1.1 summarizes how these two perspectives be-come integrated into a strategic plan for the re-gion. The framework needs to be developed through a collaborative process if it is to be in-fl uential across the region. Once in place, the framework becomes a tool that supports fur-ther collaborative e9 orts at all scales.
Not everyone will immediately see the point of developing a broad framework that tran-scends the urgent issues of the day, and tran-scends the authority of any one group. To in-
The Emergence of the Regional City as a Crucial Scale for
Long-term Planning
Peter Calthorpe describes the resurgence of a regional approach to
city building. He argues that the economic, social, and ecological pat-
terns of cities now seem to be best understood and planned at the
regional scale. As cities mature, the traditional combination of urban
sprawl and satellite or edge cities transforms into a structure that is
better described as ‘polycentric’—looking more like a bunch of grapes
than a single fruit with a dense core. The polycentric forms are com-
plex, instead of the focus on a single centre we see layers of net-
works—economic, open space, resources, connections—with many
more centres or nodes nested within other nodes. The challenge is to
fi t these complex forms into the landscape in ways that fi t the ecol-
ogy of the region and its resource base, and also to contain the nodes
so they are human scale and walkable. “The regional city must be
viewed as a cohesive unit—economically, ecologically and socially—
made up of coherent neighbourhoods and communities, all of which
play a vital role in creating the metropolitan region as a whole.”
Calthorpe P. The Regional City, 2001
“ Coordination and collaboration between national, provincial and lo-
cal authorities can achieve harmonious regional and urban develop-
ment, provided they share a common vision and demonstrate suffi -
cient political will. . . local authorities, working with regional authorities,
need to develop clear visions and strategies that articulate short and
medium-term responses to enhance economic and social condition
in their cities.”
State of the World’s Cities2008/09
Harmonious Cities UNHabitat
ECo2-Part1REVd_PREP 53 6/15/09 8:21:47 AM
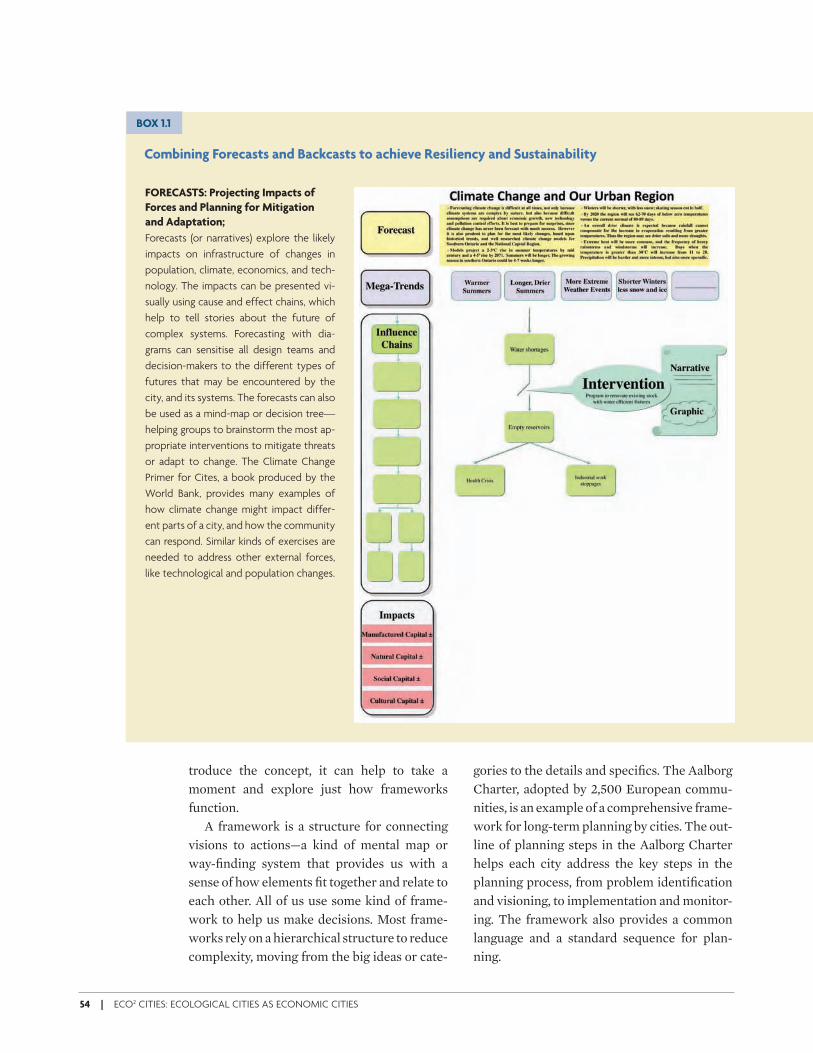
54 | ECO2 CITIES: ECOLOGICAL CITIES AS ECONOMIC CITIES
Combining Forecasts and Backcasts to achieve Resiliency and Sustainability
BOX 1.1
FORECASTS: Projecting Impacts of
Forces and Planning for Mitigation
and Adaptation;
Forecasts (or narratives) explore the likely
impacts on infrastructure of changes in
population, climate, economics, and tech-
nology. The impacts can be presented vi-
sually using cause and effect chains, which
help to tell stories about the future of
complex systems. Forecasting with dia-
grams can sensitise all design teams and
decision-makers to the different types of
futures that may be encountered by the
city, and its systems. The forecasts can also
be used as a mind-map or decision tree—
helping groups to brainstorm the most ap-
propriate interventions to mitigate threats
or adapt to change. The Climate Change
Primer for Cites, a book produced by the
World Bank, provides many examples of
how climate change might impact differ-
ent parts of a city, and how the community
can respond. Similar kinds of exercises are
needed to address other external forces,
like technological and population changes.
troduce the concept, it can help to take a moment and explore just how frameworks function.
A framework is a structure for connecting visions to actions—a kind of mental map or way-fi nding system that provides us with a sense of how elements fi t together and relate to each other. All of us use some kind of frame-work to help us make decisions. Most frame-works rely on a hierarchical structure to reduce complexity, moving from the big ideas or cate-
gories to the details and specifi cs. The Aalborg Charter, adopted by 2,500 European commu-nities, is an example of a comprehensive frame-work for long-term planning by cities. The out-line of planning steps in the Aalborg Charter helps each city address the key steps in the planning process, from problem identifi cation and visioning, to implementation and monitor-ing. The framework also provides a common language and a standard sequence for plan-ning.
ECo2-Part1REVd_PREP 54 6/15/09 8:21:47 AM
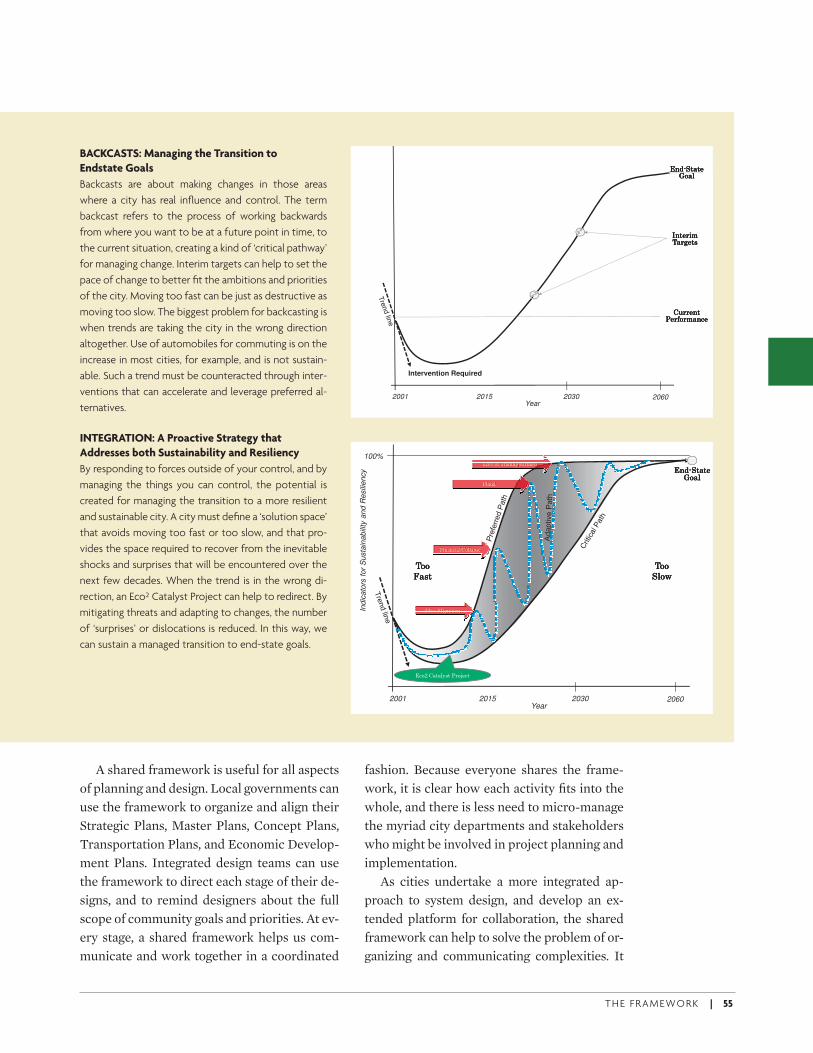
T H E F R A M E WO R K | 55
A shared framework is useful for all aspects of planning and design. Local governments can use the framework to organize and align their Strategic Plans, Master Plans, Concept Plans, Transportation Plans, and Economic Develop-ment Plans. Integrated design teams can use the framework to direct each stage of their de-signs, and to remind designers about the full scope of community goals and priorities. At ev-ery stage, a shared framework helps us com-municate and work together in a coordinated
fashion. Because everyone shares the frame-work, it is clear how each activity fi ts into the whole, and there is less need to micro-manage the myriad city departments and stakeholders who might be involved in project planning and implementation.
As cities undertake a more integrated ap-proach to system design, and develop an ex-tended platform for collaboration, the shared framework can help to solve the problem of or-ganizing and communicating complexities. It
!"#!"#!"#!"#$$$$%&'&()%&'&()%&'&()%&'&()*+',*+',*+',*+',
-"&(./0)-"&(./0)-"&(./0)-"&(./0)1'.2(&31'.2(&31'.2(&31'.2(&3
45..("&)45..("&)45..("&)45..("&)6(.7+.0'"8(6(.7+.0'"8(6(.7+.0'"8(6(.7+.0'"8(
0
2001 2015 2030 2060Year
Intervention Required
0
100%
2001 2015 2030 2060Year
Indic
ato
rs f
or
Susta
inabili
ty a
nd R
esili
ency
Trend
Line
!""#!""#!""#!""#$%&'$%&'$%&'$%&'
!""#!""#!""#!""#()"*()"*()"*()"*
+,-+,-+,-+,-....('%'/#('%'/#('%'/#('%'/#0"%)0"%)0"%)0"%)
Flood
Loss of Trading Partners
Financial Collapse
Mass Migration
+1"2#3%'%)4&'#56"7/1'
BACKCASTS: Managing the Transition to
Endstate Goals
Backcasts are about making changes in those areas
where a city has real infl uence and control. The term
backcast refers to the process of working backwards
from where you want to be at a future point in time, to
the current situation, creating a kind of ‘critical pathway’
for managing change. Interim targets can help to set the
pace of change to better fi t the ambitions and priorities
of the city. Moving too fast can be just as destructive as
moving too slow. The biggest problem for backcasting is
when trends are taking the city in the wrong direction
altogether. Use of automobiles for commuting is on the
increase in most cities, for example, and is not sustain-
able. Such a trend must be counteracted through inter-
ventions that can accelerate and leverage preferred al-
ternatives.
INTEGRATION: A Proactive Strategy that
Addresses both Sustainability and Resiliency
By responding to forces outside of your control, and by
managing the things you can control, the potential is
created for managing the transition to a more resilient
and sustainable city. A city must defi ne a ‘solution space’
that avoids moving too fast or too slow, and that pro-
vides the space required to recover from the inevitable
shocks and surprises that will be encountered over the
next few decades. When the trend is in the wrong di-
rection, an Eco² Catalyst Project can help to redirect. By
mitigating threats and adapting to changes, the number
of ‘surprises’ or dislocations is reduced. In this way, we
can sustain a managed transition to end-state goals.
ECo2-Part1REVd_PREP 55 6/15/09 8:21:48 AM
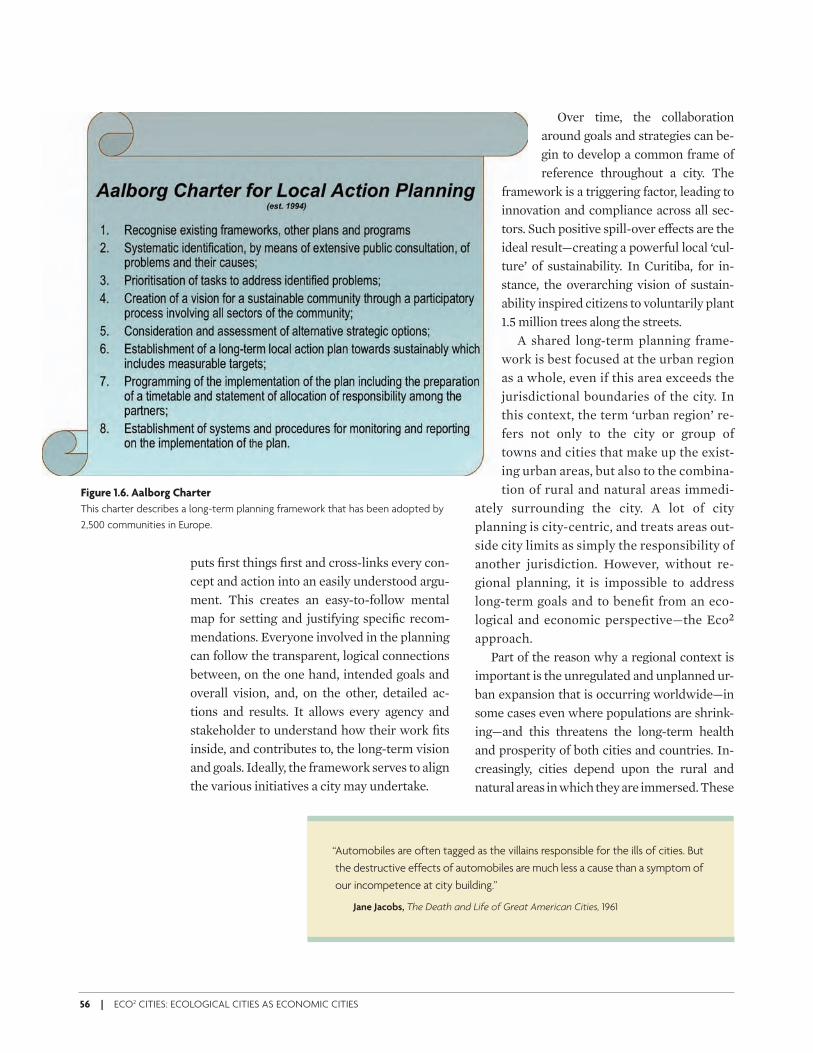
56 | ECO2 CITIES: ECOLOGICAL CITIES AS ECONOMIC CITIES
puts fi rst things fi rst and cross-links every con-cept and action into an easily understood argu-ment. This creates an easy-to-follow mental map for setting and justifying specifi c recom-mendations. Everyone involved in the planning can follow the transparent, logical connections between, on the one hand, intended goals and overall vision, and, on the other, detailed ac-tions and results. It allows every agency and stakeholder to understand how their work fi ts inside, and contributes to, the long-term vision and goals. Ideally, the framework serves to align the various initiatives a city may undertake.
Over time, the collaboration around goals and strategies can be-gin to develop a common frame of reference throughout a city. The
framework is a triggering factor, leading to innovation and compliance across all sec-tors. Such positive spill-over e9 ects are the ideal result—creating a powerful local ‘cul-ture’ of sustainability. In Curitiba, for in-stance, the overarching vision of sustain-ability inspired citizens to voluntarily plant 1.5 million trees along the streets.
A shared long-term planning frame-work is best focused at the urban region as a whole, even if this area exceeds the jurisdictional boundaries of the city. In this context, the term ‘urban region’ re-fers not only to the city or group of towns and cities that make up the exist-ing urban areas, but also to the combina-tion of rural and natural areas immedi-
ately surrounding the city. A lot of city planning is city-centric, and treats areas out-side city limits as simply the responsibility of another jurisdiction. However, without re-gional planning, it is impossible to address long-term goals and to benefi t from an eco-logical and economic perspective—the Eco2 approach.
Part of the reason why a regional context is important is the unregulated and unplanned ur-ban expansion that is occurring worldwide—in some cases even where populations are shrink-ing—and this threatens the long-term health and prosperity of both cities and countries. In-creasingly, cities depend upon the rural and natural areas in which they are immersed. These
Figure 1.6. Aalborg Charter
This charter describes a long-term planning framework that has been adopted by
2,500 communities in Europe.
“ Automobiles are often tagged as the villains responsible for the ills of cities. But
the destructive effects of automobiles are much less a cause than a symptom of
our incompetence at city building.”
Jane Jacobs, The Death and Life of Great American Cities, 1961
ECo2-Part1REVd_PREP 56 6/15/09 8:21:58 AM
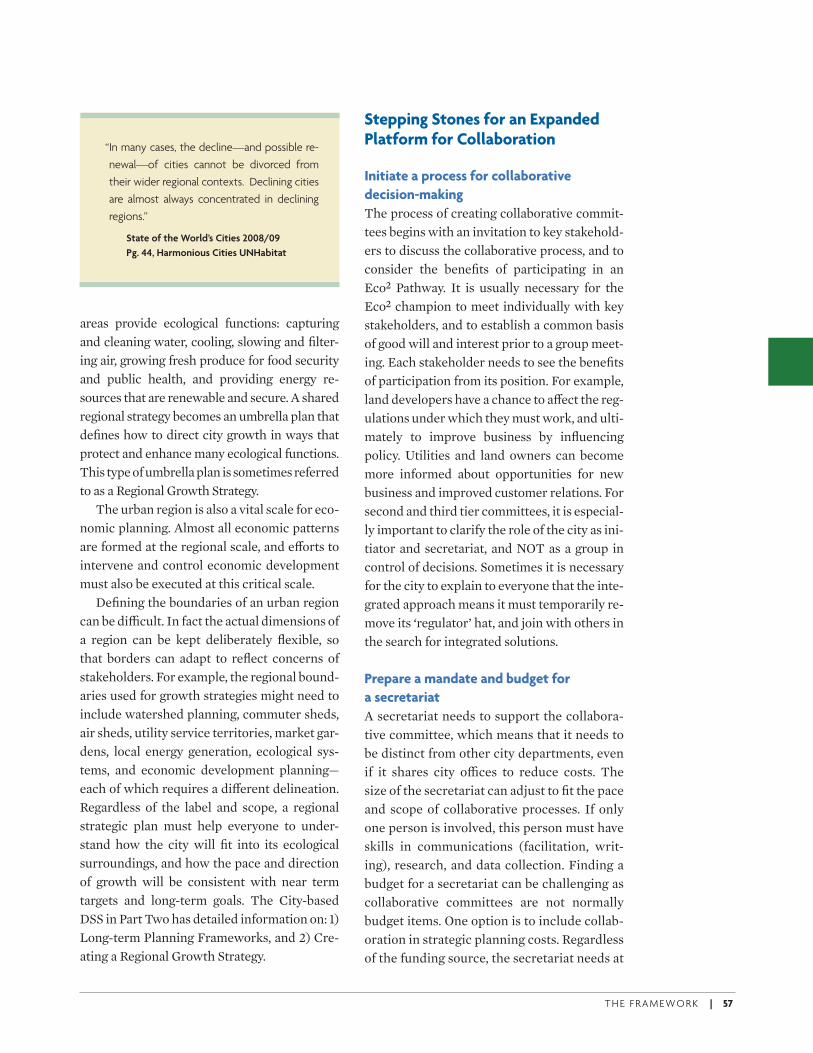
T H E F R A M E WO R K | 57
areas provide ecological functions: capturing and cleaning water, cooling, slowing and fi lter-ing air, growing fresh produce for food security and public health, and providing energy re-sources that are renewable and secure. A shared regional strategy becomes an umbrella plan that defi nes how to direct city growth in ways that protect and enhance many ecological functions. This type of umbrella plan is sometimes referred to as a Regional Growth Strategy.
The urban region is also a vital scale for eco-nomic planning. Almost all economic patterns are formed at the regional scale, and e9 orts to intervene and control economic development must also be executed at this critical scale.
Defi ning the boundaries of an urban region can be di6 cult. In fact the actual dimensions of a region can be kept deliberately fl exible, so that borders can adapt to refl ect concerns of stakeholders. For example, the regional bound-aries used for growth strategies might need to include watershed planning, commuter sheds, air sheds, utility service territories, market gar-dens, local energy generation, ecological sys-tems, and economic development planning—each of which requires a di9 erent delineation. Regardless of the label and scope, a regional strategic plan must help everyone to under-stand how the city will fi t into its ecological surroundings, and how the pace and direction of growth will be consistent with near term targets and long-term goals. The City-based DSS in Part Two has detailed information on: 1) Long-term Planning Frameworks, and 2) Cre-ating a Regional Growth Strategy.
Stepping Stones for an Expanded Platform for Collaboration
Initiate a process for collaborative
decision-making
The process of creating collaborative commit-tees begins with an invitation to key stakehold-ers to discuss the collaborative process, and to consider the benefi ts of participating in an Eco2 Pathway. It is usually necessary for the Eco2 champion to meet individually with key stakeholders, and to establish a common basis of good will and interest prior to a group meet-ing. Each stakeholder needs to see the benefi ts of participation from its position. For example, land developers have a chance to a9 ect the reg-ulations under which they must work, and ulti-mately to improve business by infl uencing policy. Utilities and land owners can become more informed about opportunities for new business and improved customer relations. For second and third tier committees, it is especial-ly important to clarify the role of the city as ini-tiator and secretariat, and NOT as a group in control of decisions. Sometimes it is necessary for the city to explain to everyone that the inte-grated approach means it must temporarily re-move its ‘regulator’ hat, and join with others in the search for integrated solutions.
Prepare a mandate and budget for
a secretariat
A secretariat needs to support the collabora-tive committee, which means that it needs to be distinct from other city departments, even if it shares city o6 ces to reduce costs. The size of the secretariat can adjust to fi t the pace and scope of collaborative processes. If only one person is involved, this person must have skills in communications (facilitation, writ-ing), research, and data collection. Finding a budget for a secretariat can be challenging as collaborative committees are not normally budget items. One option is to include collab-oration in strategic planning costs. Regardless of the funding source, the secretariat needs at
“ In many cases, the decline—and possible re-
newal—of cities cannot be divorced from
their wider regional contexts. Declining cities
are almost always concentrated in declining
regions.”
State of the World’s Cities 2008/09
Pg. 44, Harmonious Cities UNHabitat
ECo2-Part1REVd_PREP 57 6/15/09 8:22:00 AM
58 | ECO2 CITIES: ECOLOGICAL CITIES AS ECONOMIC CITIES
least three years of secure budget to prove its worth.
Prepare a long-term planning framework
for sustainability and resiliency
Part Two provides the detailed methods and tools that can assist with preparing a frame-work. If time or money is limited, a rapid pro-cess is possible, using pre-defi ned goals and strategies from appropriate best practice cities. In this context, the Case Study reports are helpful in providing examples of goals and strategies. Software tools are available on the web which can help to develop a framework that connects visions and goals to specifi c strat-egies and projects, and that allow the public and other stakeholders to explore the content of the framework. The framework also needs a locally specifi c set of external forces (e.g., cli-mate changes in your location, demographics
for each city’s population). An extensive col-laborative e9 ort may be required to complete the framework, supported by such tools as vi-sioning workshops and foresight workshops (Part Two).
Select a catalyst project
A catalyst project is a key part of managing change. Catalyst projects should be projects that o9 er substantial benefi ts to the most in-fl uential stakeholders and that can be com-pleted relatively quickly, at low risk to the city. With luck, the catalyst project will con-tribute to a rising spiral of goodwill and ac-ceptability for an Eco2 Pathway. Choose carefully—fi rst impressions count for a lot. The creation of positive expectations among the participating stakeholders and the public is crucially important to successful change management.
ECo2-Part1REVd_PREP 58 6/15/09 8:22:00 AM
T H E F R A M E WO R K | 59
A One System Approach
CHAPTER 5
A One System approach enables cities to plan,
design, and manage the whole urban system by
integrating and/or optimizing its key subsys-
tems. In doing so, it provides opportunities for
cities to realize many benefi ts through synergy.
As we explore the possibilities for a One Sys-
tem approach we will fi rst address enhancing
the e2 ciency of resource ‘fl ows’ in an urban
area through integrated infrastructure system
design and management. These approaches
apply to most urban infrastructure sectors, like
transport, energy, water, and waste manage-
ment—and may be applicable within each sec-
tor and across sectors.
We then look at possibilities for applying a
One System approach to integrate urban ‘form’
with urban ‘fl ows.’ We will consider spatial
planning, land use, density, connectivity, prox-
imity, and other attributes of urban form, and
see how a large extent of the overall system ef-
fi ciency depends on integrating and coordinat-
ing these attributes with infrastructure sys-
tems. There is a fundamental relationship
between a city’s infrastructure systems and its
urban form. Urban form and spatial develop-
ment establish the location, concentration, dis-
tribution, and nature of demand nodes for the
design of infrastructure system networks. By
doing so, urban form establishes the physical
and economic constraints and parameters for
infrastructure system designs, their capacity
thresholds, technology choices, and the eco-
nomic viabilities of di& erent options. These
have tremendous implications for resource use
e2 ciency. At the same time, infrastructure sys-
tem investments (transport, water, energy, etc.)
will typically enable and induce particular spa-
tial patterns on the basis of a market response
to these investments.
The fi nal section of this chapter looks at how
to implement projects using a more integrated
implementation approach. This means sequenc-
ing investments so that the city sets the correct
foundation by addressing the long-lasting, cross
cutting issues fi rst. This also means creating a
policy environment that enables an integrated
approach, coordinating a full range of policy
tools, collaborating with stakeholders to align
key policies, and targeting new policies to re-
fl ect the very di& erent circumstances between
urbanization in new areas, and improving ex-
isting urban areas.
ECo2-Part1REVd_PREP 59 6/15/09 8:22:00 AM
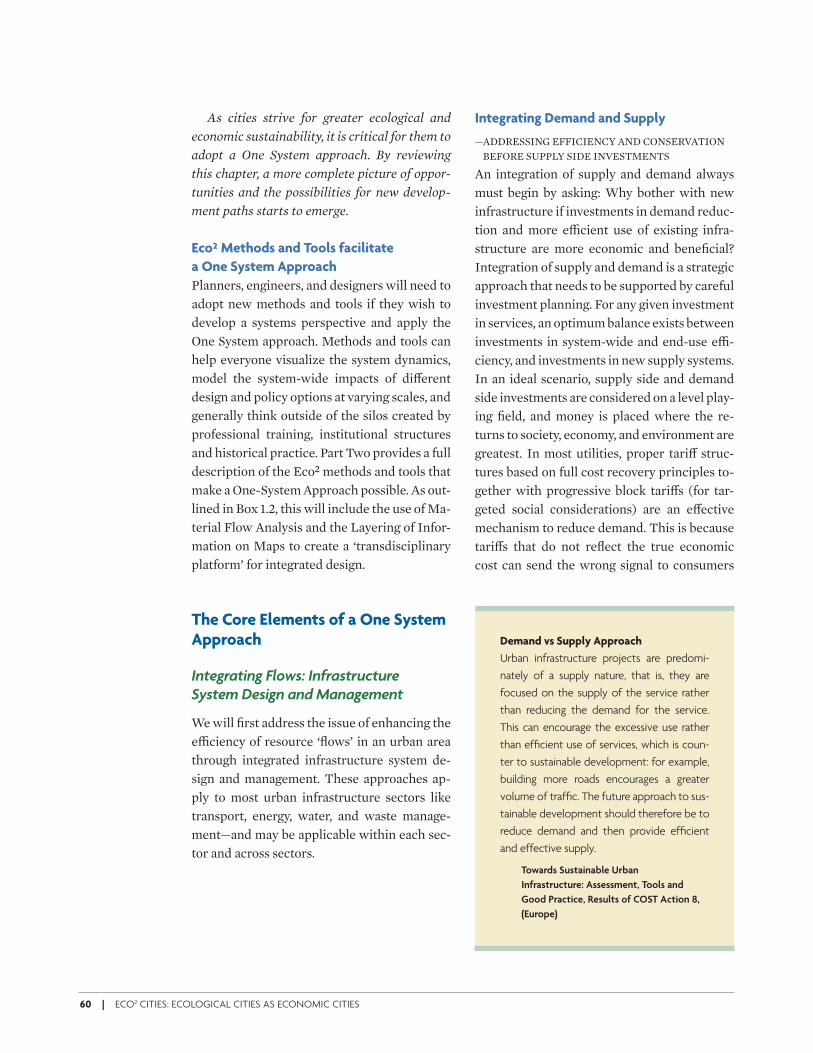
60 | ECO2 CITIES: ECOLOGICAL CITIES AS ECONOMIC CITIES
As cities strive for greater ecological and
economic sustainability, it is critical for them to
adopt a One System approach. By reviewing
this chapter, a more complete picture of oppor-
tunities and the possibilities for new develop-
ment paths starts to emerge.
Eco² Methods and Tools facilitate
a One System Approach
Planners, engineers, and designers will need to adopt new methods and tools if they wish to develop a systems perspective and apply the One System approach. Methods and tools can help everyone visualize the system dynamics, model the system-wide impacts of di9 erent design and policy options at varying scales, and generally think outside of the silos created by professional training, institutional structures and historical practice. Part Two provides a full description of the Eco2 methods and tools that make a One-System Approach possible. As out-lined in Box 1.2, this will include the use of Ma-terial Flow Analysis and the Layering of Infor-mation on Maps to create a ‘transdisciplinary platform’ for integrated design.
The Core Elements of a One System Approach
Integrating Flows: Infrastructure System Design and Management
We will fi rst address the issue of enhancing the e6 ciency of resource ‘fl ows’ in an urban area through integrated infrastructure system de-sign and management. These approaches ap-ply to most urban infrastructure sectors like transport, energy, water, and waste manage-ment—and may be applicable within each sec-tor and across sectors.
Integrating Demand and Supply
— ADDRESSING EFFICIENCY AND CONSERVATION BEFORE SUPPLY SIDE INVESTMENTS
An integration of supply and demand always must begin by asking: Why bother with new infrastructure if investments in demand reduc-tion and more e6 cient use of existing infra-structure are more economic and benefi cial? Integration of supply and demand is a strategic approach that needs to be supported by careful investment planning. For any given investment in services, an optimum balance exists between investments in system-wide and end-use e6 -ciency, and investments in new supply systems. In an ideal scenario, supply side and demand side investments are considered on a level play-ing fi eld, and money is placed where the re-turns to society, economy, and environment are greatest. In most utilities, proper tari9 struc-tures based on full cost recovery principles to-gether with progressive block tari9 s (for tar-geted social considerations) are an e9 ective mechanism to reduce demand. This is because tari9 s that do not refl ect the true economic cost can send the wrong signal to consumers
Demand vs Supply Approach
Urban infrastructure projects are predomi-
nately of a supply nature, that is, they are
focused on the supply of the service rather
than reducing the demand for the service.
This can encourage the excessive use rather
than effi cient use of services, which is coun-
ter to sustainable development: for example,
building more roads encourages a greater
volume of traffi c. The future approach to sus-
tainable development should therefore be to
reduce demand and then provide effi cient
and effective supply.
Towards Sustainable Urban
Infrastructure: Assessment, Tools and
Good Practice, Results of COST Action 8,
(Europe)
ECo2-Part1REVd_PREP 60 6/15/09 8:22:00 AM
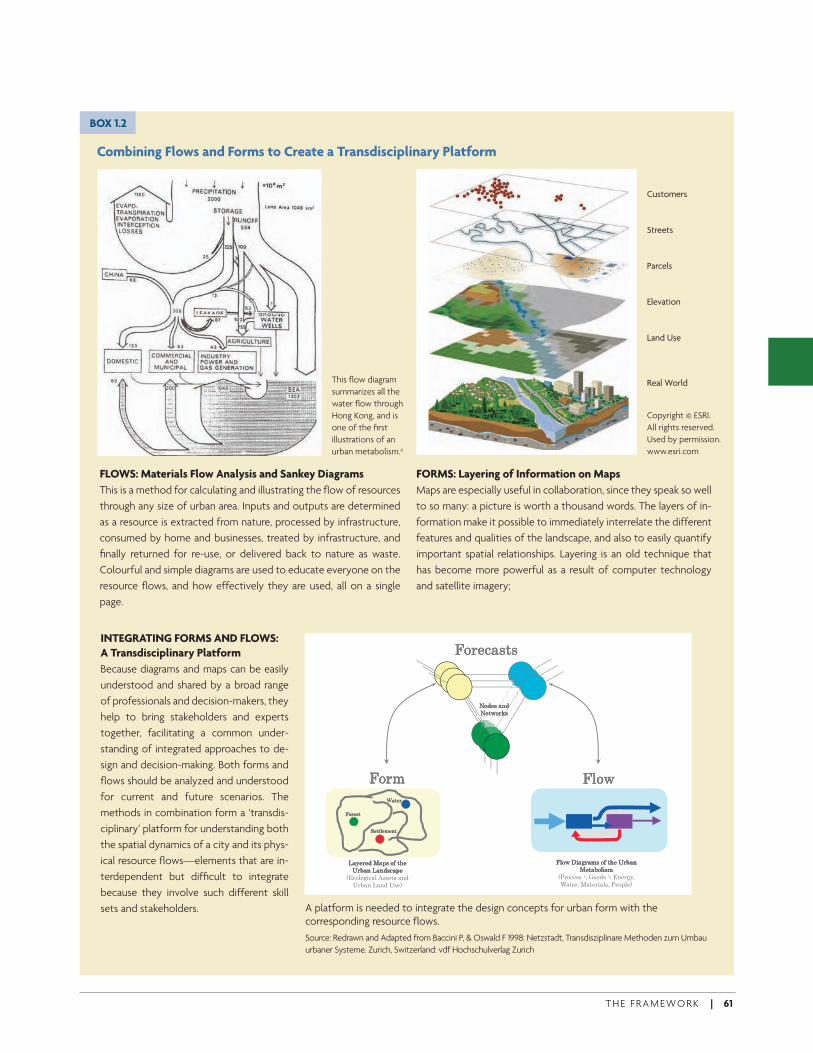
T H E F R A M E WO R K | 61
Combining Flows and Forms to Create a Transdisciplinary Platform
BOX 1.2
INTEGRATING FORMS AND FLOWS:
A Transdisciplinary Platform
Because diagrams and maps can be easily
understood and shared by a broad range
of professionals and decision-makers, they
help to bring stakeholders and experts
together, facilitating a common under-
standing of integrated approaches to de-
sign and decision-making. Both forms and
fl ows should be analyzed and understood
for current and future scenarios. The
methods in combination form a ‘transdis-
ciplinary’ platform for understanding both
the spatial dynamics of a city and its phys-
ical resource fl ows—elements that are in-
terdependent but diffi cult to integrate
because they involve such different skill
sets and stakeholders.
!"#$%&'('!"#$%&'('!"#$%&'('!"#$%&'('
)"*$'+&,*+)"*$'+&,*+)"*$'+&,*+)"*$'+&,*+)$(-"#.')$(-"#.')$(-"#.')$(-"#.'
!/"-!/"-!/"-!/"-!"#0!"#0!"#0!"#0
1&($#1&($#1&($#1&($#
2$((/$0$,(2$((/$0$,(2$((/$0$,(2$((/$0$,(
!"#$'(!"#$'(!"#$'(!"#$'(
3&4$#$*+5&6'+"7+(8$+3&4$#$*+5&6'+"7+(8$+3&4$#$*+5&6'+"7+(8$+3&4$#$*+5&6'+"7+(8$+9#:&,+3&,*'%&6$9#:&,+3&,*'%&6$9#:&,+3&,*'%&6$9#:&,+3&,*'%&6$
;< / = / > *
!/"-+?=&@#&0'+"7+(8$+9#:&,+!/"-+?=&@#&0'+"7+(8$+9#:&,+!/"-+?=&@#&0'+"7+(8$+9#:&,+!/"-+?=&@#&0'+"7+(8$+9#:&,+5$(&:"/='05$(&:"/='05$(&:"/='05$(&:"/='0
;A B C * B <;<%"/"@=%&/+>''$('+&,*+9#:&,+3&,*+9'$D
;A#"%$''+B C""*'+B <,$#@4E+1&($#E+5&($#=&/'E+A$"6/$D
FLOWS: Materials Flow Analysis and Sankey Diagrams
This is a method for calculating and illustrating the fl ow of resources
through any size of urban area. Inputs and outputs are determined
as a resource is extracted from nature, processed by infrastructure,
consumed by home and businesses, treated by infrastructure, and
fi nally returned for re-use, or delivered back to nature as waste.
Colourful and simple diagrams are used to educate everyone on the
resource fl ows, and how effectively they are used, all on a single
page.
FORMS: Layering of Information on Maps
Maps are especially useful in collaboration, since they speak so well
to so many: a picture is worth a thousand words. The layers of in-
formation make it possible to immediately interrelate the different
features and qualities of the landscape, and also to easily quantify
important spatial relationships. Layering is an old technique that
has become more powerful as a result of computer technology
and satellite imagery;
This fl ow diagram
summarizes all the
water fl ow through
Hong Kong, and is
one of the fi rst
illustrations of an
urban metabolism.a
Copyright © ESRI.
All rights reserved.
Used by permission.
www.esri.com
Customers
Streets
Parcels
Elevation
Land Use
Real World
A platform is needed to integrate the design concepts for urban form with the corresponding resource fl ows.
Source: Redrawn and Adapted from Baccini P, & Oswald F 1998: Netzstadt, Transdisziplinare Methoden zum Umbau
urbaner Systeme. Zurich, Switzerland: vdf Hochschulverlag Zurich
ECo2-Part1REVd_PREP 61 6/15/09 8:22:01 AM
62 | ECO2 CITIES: ECOLOGICAL CITIES AS ECONOMIC CITIES
and lead to waste or overuse of resources. His-torically, it is widely recognized that too much has been invested, too quickly, in supply solu-tions as opposed to investing in reducing de-mand through resource e6 ciency standards, building retrofi ts and substituting lighting, fi x-tures, vehicles, and appliances. In every sector, there are signifi cant gains realized by demand side management (DSM); we have seen the cases of Yokohama in the waste sector (avoided capital expenditure of US$1.1 billion) and of Emfuleni in the energy and water sector (where singular investments of US$1.8 million led to annual savings of US$4.0 million). Not only do the net economic returns tend to be higher for DSM, but so too do the many indirect benefi ts for a city, including improved living environ-ments, and reduced vulnerability to future price fl uctuations or interruptions in resource supply.
While in some cases DSM can be easy to implement and very quick to pay dividends, in others it is di6 cult to implement due to the in-centives of various stakeholders. Consider the case of housing and commercial buildings: on one hand, they represent a tremendous poten-tial for DSM, as most buildings have not been constructed to energy or water e6 ciency stan-dards and can generate high returns quickly for relatively small investments. On the other hand, changes to existing buildings require collaboration among decision-makers, and benefi ts do not always accrue to those who must make the investments, thereby fracturing the incentive structure. For instance, if owners cannot capture the benefi ts of energy e6 ciency savings, they will not invest in retrofi tting—and renters who have a short time horizon also have no incentive to investing in retrofi tting. In addition, the standards for products, including building codes, are often established by senior governments, and are therefore di6 cult to align with local goals and strategies. For all these reasons, a well planned collaborative process is necessary to capture the benefi ts of integrating supply and demand.
DSM measures can apply to all sectors and can include investments in more e6 cient tech-nology. Typical examples include energy retro-fi ts of building envelopes, resource e6 cient lighting and appliances, low fl ow water fi x-tures, waste reduction, reuse and recycling, and using Bus Rapid Transit instead of cars on the same roads (thereby avoiding the need to construct more roads). It can also imply a cul-ture of doing more with less, and living lightly on the earth, by voluntarily limiting consump-tion and waste. DSM also can be achieved by improving designs at multiple scales, and through regular audits, commissioning, pro-cess enhancement, and improved training for personnel who install, operate, and manage systems. The proliferation of the ESCO sector is evidence of the growing and still untapped potential of the energy e6 ciency market.
Often, DSM in one sector can lead to bene-fi ts in another sector. For this reason, integrat-ed approaches across sectors are critical. For instance, the signifi cant urban energy benefi ts of the water sector’s DSM led to a program launched by the Alliance to Save Energy called ‘Watergy.’ The Alliance has achieved signifi -cant benefi ts in developing-country cities in increasing access to clean water while reduc-ing energy costs and water losses.
In Fortaleza (northeast Brazil), the Alliance worked with the local utility, the Companhia de Água e Esgoto do Ceara (CAGECE), to de-velop and implement measures to improve the distribution of water and the access to sanita-tion services, while reducing operational costs and environmental impacts. CAGECE invested about US$1.1 million, including in the installa-tion of an automatic control system, and has saved US$2.5 million over four years. The e6 -ciency gains were so high that 88,000 new households were connected to the water sys-tem, without the need to increase supply!
DSM can even apply to spatial systems. For example, the demand for land can be reduced by reviewing regulations (including adjusting minimum lot sizes, increasing fl oor area ratios,
ECo2-Part1REVd_PREP 62 6/15/09 8:22:07 AM
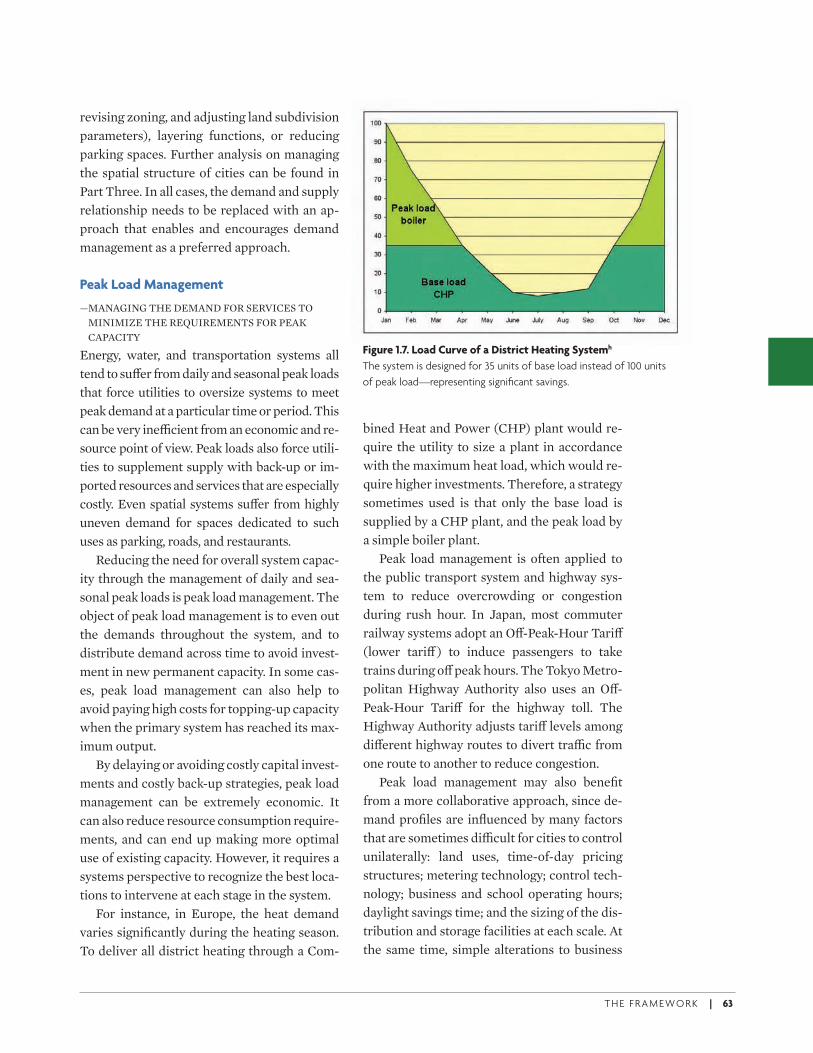
T H E F R A M E WO R K | 63
revising zoning, and adjusting land subdivision parameters), layering functions, or reducing parking spaces. Further analysis on managing the spatial structure of cities can be found in Part Three. In all cases, the demand and supply relationship needs to be replaced with an ap-proach that enables and encourages demand management as a preferred approach.
Peak Load Management
— MANAGING THE DEMAND FOR SERVICES TO MINIMIZE THE REQUIREMENTS FOR PEAK CAPACITY
Energy, water, and transportation systems all tend to su9 er from daily and seasonal peak loads that force utilities to oversize systems to meet peak demand at a particular time or period. This can be very ine6 cient from an economic and re-source point of view. Peak loads also force utili-ties to supplement supply with back-up or im-ported resources and services that are especially costly. Even spatial systems su9 er from highly uneven demand for spaces dedicated to such uses as parking, roads, and restaurants.
Reducing the need for overall system capac-ity through the management of daily and sea-sonal peak loads is peak load management. The object of peak load management is to even out the demands throughout the system, and to distribute demand across time to avoid invest-ment in new permanent capacity. In some cas-es, peak load management can also help to avoid paying high costs for topping-up capacity when the primary system has reached its max-imum output.
By delaying or avoiding costly capital invest-ments and costly back-up strategies, peak load management can be extremely economic. It can also reduce resource consumption require-ments, and can end up making more optimal use of existing capacity. However, it requires a systems perspective to recognize the best loca-tions to intervene at each stage in the system.
For instance, in Europe, the heat demand varies signifi cantly during the heating season. To deliver all district heating through a Com-
bined Heat and Power (CHP) plant would re-quire the utility to size a plant in accordance with the maximum heat load, which would re-quire higher investments. Therefore, a strategy sometimes used is that only the base load is supplied by a CHP plant, and the peak load by a simple boiler plant.
Peak load management is often applied to the public transport system and highway sys-tem to reduce overcrowding or congestion during rush hour. In Japan, most commuter railway systems adopt an O9 -Peak-Hour Tari9 (lower tari9 ) to induce passengers to take trains during o9 peak hours. The Tokyo Metro-politan Highway Authority also uses an O9 -Peak-Hour Tari9 for the highway toll. The Highway Authority adjusts tari9 levels among di9 erent highway routes to divert tra6 c from one route to another to reduce congestion.
Peak load management may also benefi t from a more collaborative approach, since de-mand profi les are infl uenced by many factors that are sometimes di6 cult for cities to control unilaterally: land uses, time-of-day pricing structures; metering technology; control tech-nology; business and school operating hours; daylight savings time; and the sizing of the dis-tribution and storage facilities at each scale. At the same time, simple alterations to business
Figure 1.7. Load Curve of a District Heating Systemh
The system is designed for 35 units of base load instead of 100 units
of peak load—representing signifi cant savings.
ECo2-Part1REVd_PREP 63 6/15/09 8:22:07 AM
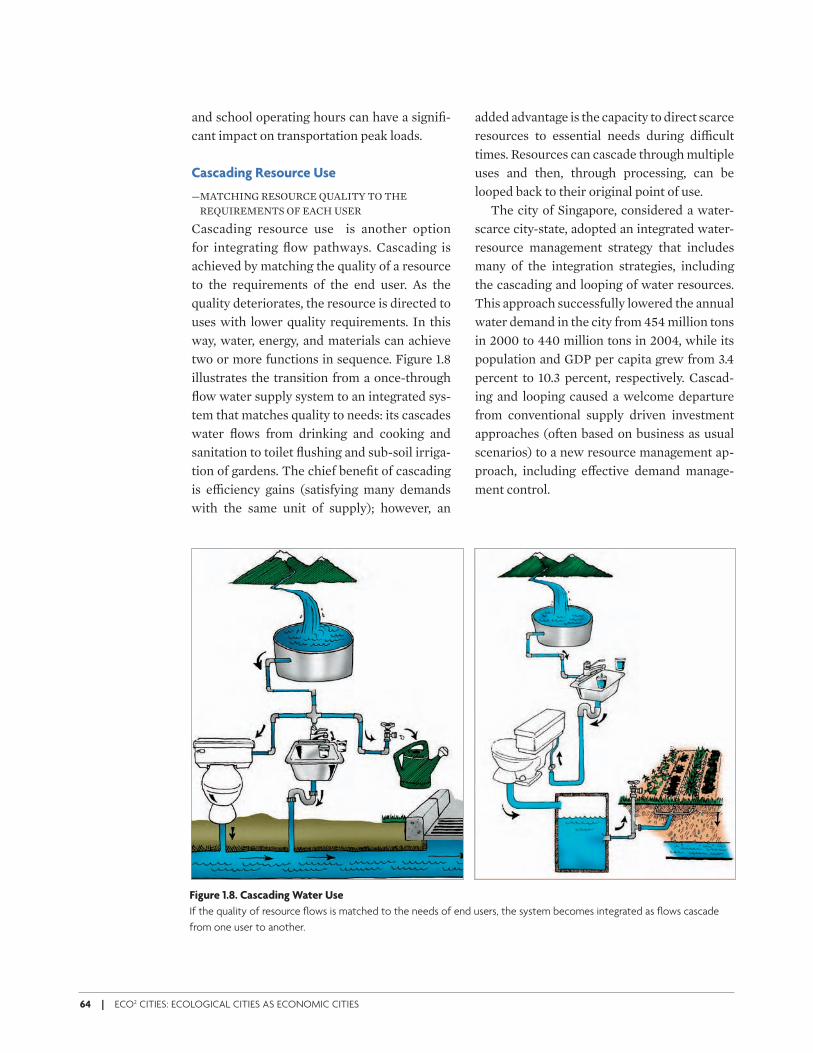
64 | ECO2 CITIES: ECOLOGICAL CITIES AS ECONOMIC CITIES
and school operating hours can have a signifi -cant impact on transportation peak loads.
Cascading Resource Use
— MATCHING RESOURCE QUALITY TO THE REQUIREMENTS OF EACH USER
Cascading resource use is another option for integrating fl ow pathways. Cascading is achieved by matching the quality of a resource to the requirements of the end user. As the quality deteriorates, the resource is directed to uses with lower quality requirements. In this way, water, energy, and materials can achieve two or more functions in sequence. Figure 1.8 illustrates the transition from a once-through fl ow water supply system to an integrated sys-tem that matches quality to needs: its cascades water fl ows from drinking and cooking and sanitation to toilet fl ushing and sub-soil irriga-tion of gardens. The chief benefi t of cascading is e6 ciency gains (satisfying many demands with the same unit of supply); however, an
added advantage is the capacity to direct scarce resources to essential needs during di6 cult times. Resources can cascade through multiple uses and then, through processing, can be looped back to their original point of use.
The city of Singapore, considered a water-scarce city-state, adopted an integrated water-resource management strategy that includes many of the integration strategies, including the cascading and looping of water resources. This approach successfully lowered the annual water demand in the city from 454 million tons in 2000 to 440 million tons in 2004, while its population and GDP per capita grew from 3.4 percent to 10.3 percent, respectively. Cascad-ing and looping caused a welcome departure from conventional supply driven investment approaches (often based on business as usual scenarios) to a new resource management ap-proach, including e9 ective demand manage-ment control.
Figure 1.8. Cascading Water Use
If the quality of resource fl ows is matched to the needs of end users, the system becomes integrated as fl ows cascade
from one user to another.
ECo2-Part1REVd_PREP 64 6/15/09 8:22:08 AM
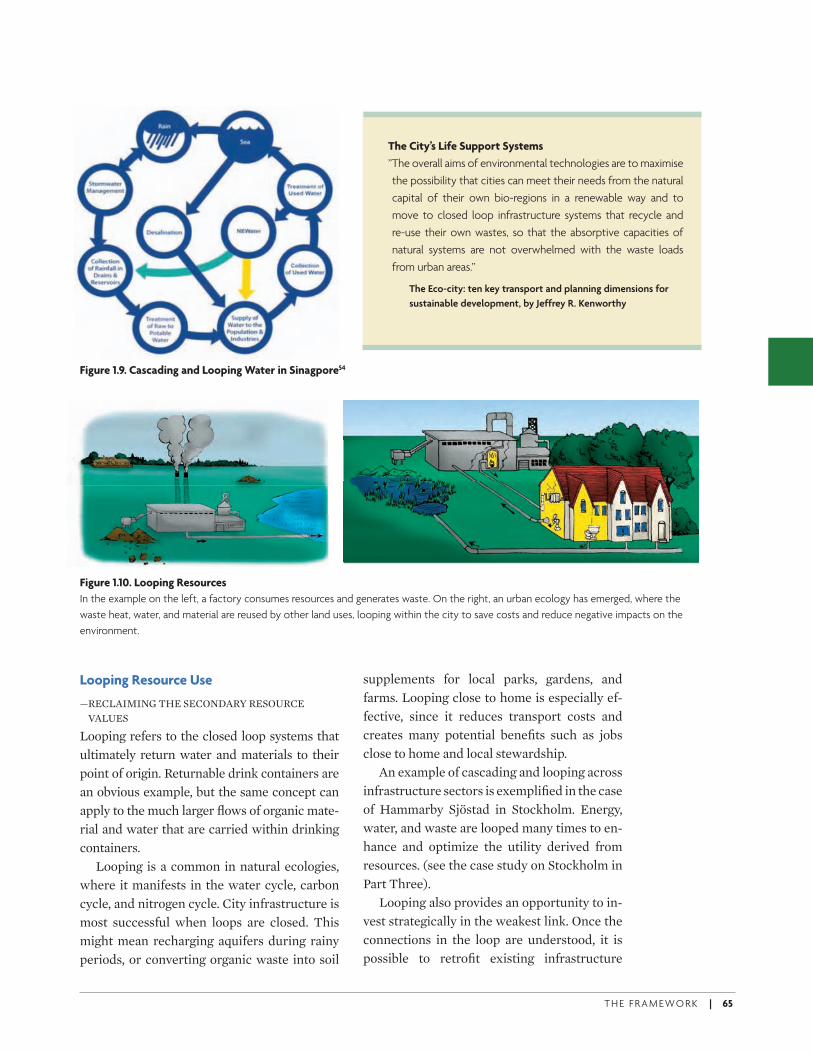
T H E F R A M E WO R K | 65
Looping Resource Use
— RECLAIMING THE SECONDARY RESOURCE VALUES
Looping refers to the closed loop systems that ultimately return water and materials to their point of origin. Returnable drink containers are an obvious example, but the same concept can apply to the much larger fl ows of organic mate-rial and water that are carried within drinking containers.
Looping is a common in natural ecologies, where it manifests in the water cycle, carbon cycle, and nitrogen cycle. City infrastructure is most successful when loops are closed. This might mean recharging aquifers during rainy periods, or converting organic waste into soil
supplements for local parks, gardens, and farms. Looping close to home is especially ef-fective, since it reduces transport costs and creates many potential benefi ts such as jobs close to home and local stewardship.
An example of cascading and looping across infrastructure sectors is exemplifi ed in the case of Hammarby Sjöstad in Stockholm. Energy, water, and waste are looped many times to en-hance and optimize the utility derived from resources. (see the case study on Stockholm in Part Three).
Looping also provides an opportunity to in-vest strategically in the weakest link. Once the connections in the loop are understood, it is possible to retrofi t existing infrastructure
Figure 1.9. Cascading and Looping Water in Sinagpore54
The City’s Life Support Systems
” The overall aims of environmental technologies are to maximise
the possibility that cities can meet their needs from the natural
capital of their own bio-regions in a renewable way and to
move to closed loop infrastructure systems that recycle and
re-use their own wastes, so that the absorptive capacities of
natural systems are not overwhelmed with the waste loads
from urban areas.”
The Eco-city: ten key transport and planning dimensions for
sustainable development, by Jeffrey R. Kenworthy
Figure 1.10. Looping Resources
In the example on the left, a factory consumes resources and generates waste. On the right, an urban ecology has emerged, where the
waste heat, water, and material are reused by other land uses, looping within the city to save costs and reduce negative impacts on the
environment.
ECo2-Part1REVd_PREP 65 6/15/09 8:22:09 AM
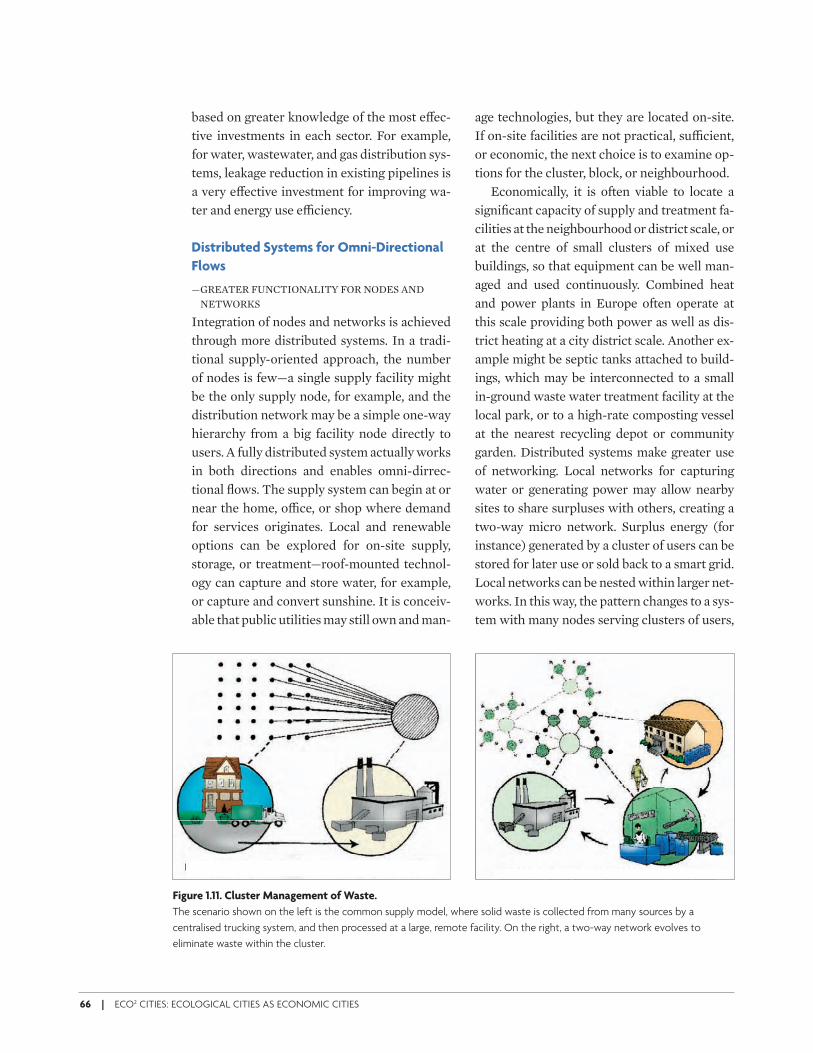
66 | ECO2 CITIES: ECOLOGICAL CITIES AS ECONOMIC CITIES
based on greater knowledge of the most e9 ec-tive investments in each sector. For example, for water, wastewater, and gas distribution sys-tems, leakage reduction in existing pipelines is a very e9 ective investment for improving wa-ter and energy use e6 ciency.
Distributed Systems for Omni-Directional
Flows
— GREATER FUNCTIONALITY FOR NODES AND NETWORKS
Integration of nodes and networks is achieved through more distributed systems. In a tradi-tional supply-oriented approach, the number of nodes is few—a single supply facility might be the only supply node, for example, and the distribution network may be a simple one-way hierarchy from a big facility node directly to users. A fully distributed system actually works in both directions and enables omni-dirrec-tional fl ows. The supply system can begin at or near the home, o6 ce, or shop where demand for services originates. Local and renewable options can be explored for on-site supply, storage, or treatment—roof-mounted technol-ogy can capture and store water, for example, or capture and convert sunshine. It is conceiv-able that public utilities may still own and man-
age technologies, but they are located on-site. If on-site facilities are not practical, su6 cient, or economic, the next choice is to examine op-tions for the cluster, block, or neighbourhood.
Economically, it is often viable to locate a signifi cant capacity of supply and treatment fa-cilities at the neighbourhood or district scale, or at the centre of small clusters of mixed use buildings, so that equipment can be well man-aged and used continuously. Combined heat and power plants in Europe often operate at this scale providing both power as well as dis-trict heating at a city district scale. Another ex-ample might be septic tanks attached to build-ings, which may be interconnected to a small in-ground waste water treatment facility at the local park, or to a high-rate composting vessel at the nearest recycling depot or community garden. Distributed systems make greater use of networking. Local networks for capturing water or generating power may allow nearby sites to share surpluses with others, creating a two-way micro network. Surplus energy (for instance) generated by a cluster of users can be stored for later use or sold back to a smart grid. Local networks can be nested within larger net-works. In this way, the pattern changes to a sys-tem with many nodes serving clusters of users,
Figure 1.11. Cluster Management of Waste.
The scenario shown on the left is the common supply model, where solid waste is collected from many sources by a
centralised trucking system, and then processed at a large, remote facility. On the right, a two-way network evolves to
eliminate waste within the cluster.
ECo2-Part1REVd_PREP 66 6/15/09 8:22:11 AM
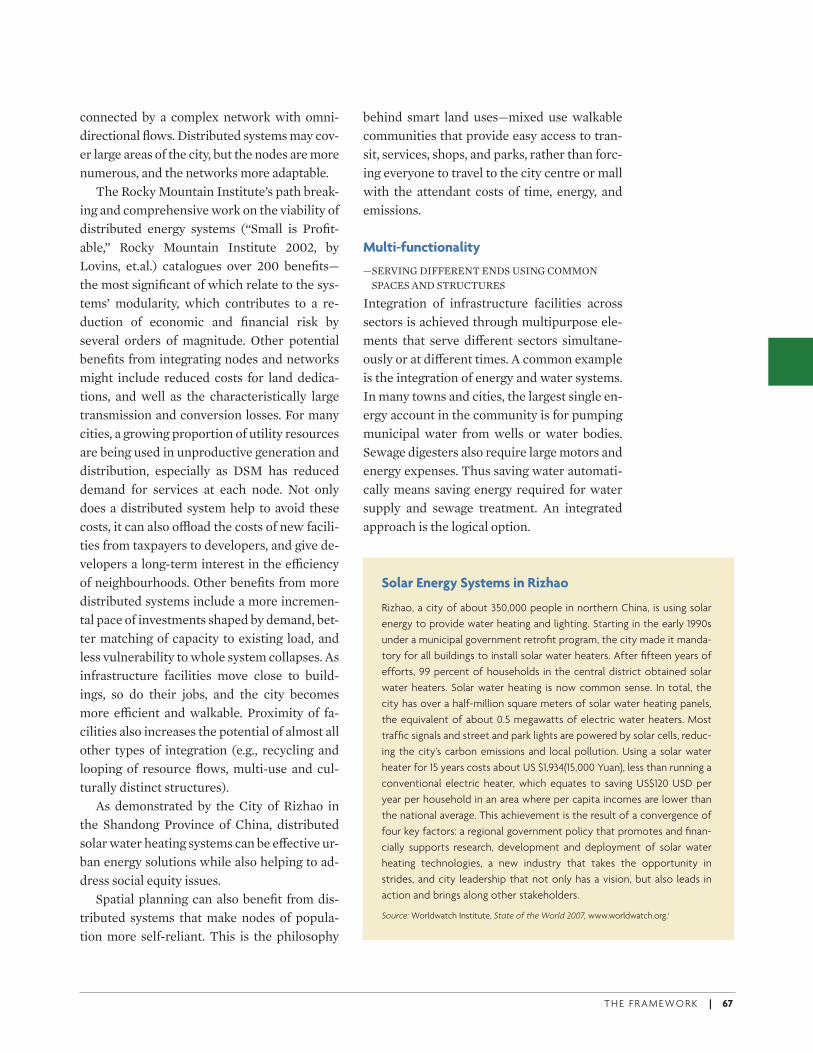
T H E F R A M E WO R K | 67
connected by a complex network with omni-directional fl ows. Distributed systems may cov-er large areas of the city, but the nodes are more numerous, and the networks more adaptable.
The Rocky Mountain Institute’s path break-ing and comprehensive work on the viability of distributed energy systems (“Small is Profi t-able,” Rocky Mountain Institute 2002, by Lovins, et.al.) catalogues over 200 benefi ts—the most signifi cant of which relate to the sys-tems’ modularity, which contributes to a re-duction of economic and fi nancial risk by several orders of magnitude. Other potential benefi ts from integrating nodes and networks might include reduced costs for land dedica-tions, and well as the characteristically large transmission and conversion losses. For many cities, a growing proportion of utility resources are being used in unproductive generation and distribution, especially as DSM has reduced demand for services at each node. Not only does a distributed system help to avoid these costs, it can also oX oad the costs of new facili-ties from taxpayers to developers, and give de-velopers a long-term interest in the e6 ciency of neighbourhoods. Other benefi ts from more distributed systems include a more incremen-tal pace of investments shaped by demand, bet-ter matching of capacity to existing load, and less vulnerability to whole system collapses. As infrastructure facilities move close to build-ings, so do their jobs, and the city becomes more e6 cient and walkable. Proximity of fa-cilities also increases the potential of almost all other types of integration (e.g., recycling and looping of resource fl ows, multi-use and cul-turally distinct structures).
As demonstrated by the City of Rizhao in the Shandong Province of China, distributed solar water heating systems can be e9 ective ur-ban energy solutions while also helping to ad-dress social equity issues.
Spatial planning can also benefi t from dis-tributed systems that make nodes of popula-tion more self-reliant. This is the philosophy
behind smart land uses—mixed use walkable communities that provide easy access to tran-sit, services, shops, and parks, rather than forc-ing everyone to travel to the city centre or mall with the attendant costs of time, energy, and emissions.
Multi-functionality
— SERVING DIFFERENT ENDS USING COMMON SPACES AND STRUCTURES
Integration of infrastructure facilities across sectors is achieved through multipurpose ele-ments that serve di9 erent sectors simultane-ously or at di9 erent times. A common example is the integration of energy and water systems. In many towns and cities, the largest single en-ergy account in the community is for pumping municipal water from wells or water bodies. Sewage digesters also require large motors and energy expenses. Thus saving water automati-cally means saving energy required for water supply and sewage treatment. An integrated approach is the logical option.
Solar Energy Systems in Rizhao
Rizhao, a city of about 350,000 people in northern China, is using solar
energy to provide water heating and lighting. Starting in the early 1990s
under a municipal government retrofi t program, the city made it manda-
tory for all buildings to install solar water heaters. After fi fteen years of
efforts, 99 percent of households in the central district obtained solar
water heaters. Solar water heating is now common sense. In total, the
city has over a half-million square meters of solar water heating panels,
the equivalent of about 0.5 megawatts of electric water heaters. Most
traffi c signals and street and park lights are powered by solar cells, reduc-
ing the city’s carbon emissions and local pollution. Using a solar water
heater for 15 years costs about US $1,934(15,000 Yuan), less than running a
conventional electric heater, which equates to saving US$120 USD per
year per household in an area where per capita incomes are lower than
the national average. This achievement is the result of a convergence of
four key factors: a regional government policy that promotes and fi nan-
cially supports research, development and deployment of solar water
heating technologies, a new industry that takes the opportunity in
strides, and city leadership that not only has a vision, but also leads in
action and brings along other stakeholders.
Source: Worldwatch Institute, State of the World 2007, www.worldwatch.org.i
ECo2-Part1REVd_PREP 67 6/15/09 8:22:12 AM
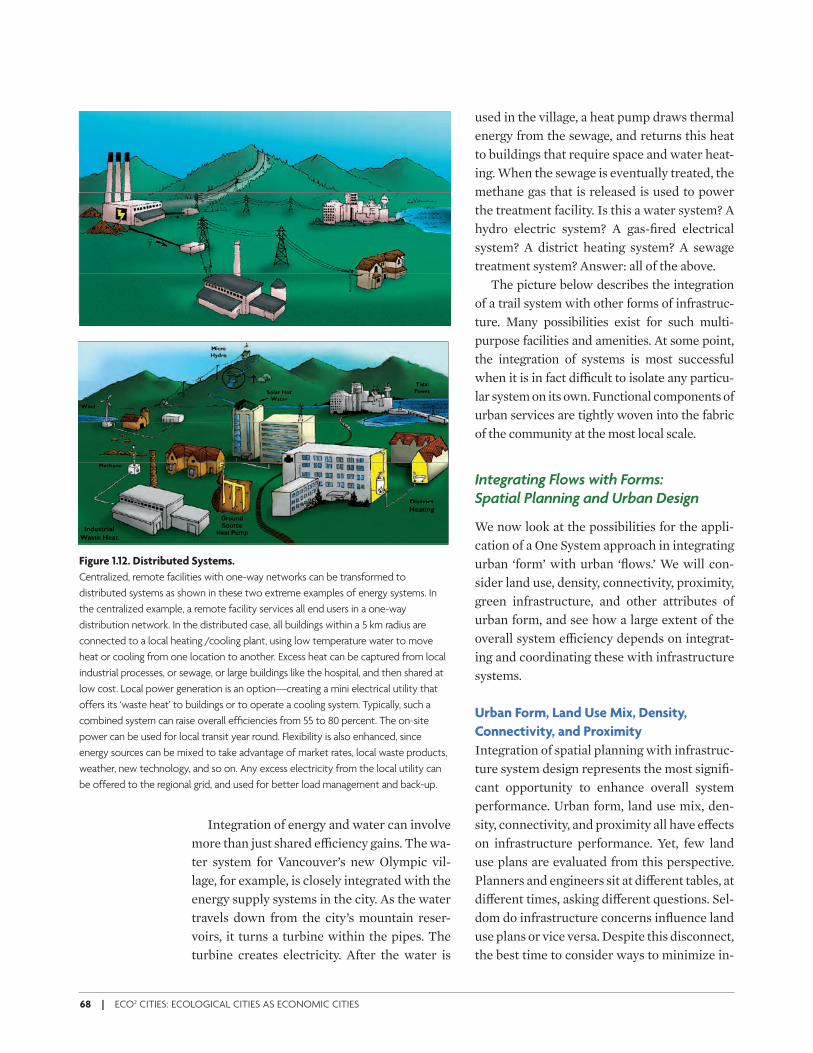
68 | ECO2 CITIES: ECOLOGICAL CITIES AS ECONOMIC CITIES
Integration of energy and water can involve more than just shared e6 ciency gains. The wa-ter system for Vancouver’s new Olympic vil-lage, for example, is closely integrated with the energy supply systems in the city. As the water travels down from the city’s mountain reser-voirs, it turns a turbine within the pipes. The turbine creates electricity. After the water is
used in the village, a heat pump draws thermal energy from the sewage, and returns this heat to buildings that require space and water heat-ing. When the sewage is eventually treated, the methane gas that is released is used to power the treatment facility. Is this a water system? A hydro electric system? A gas-fi red electrical system? A district heating system? A sewage treatment system? Answer: all of the above.
The picture below describes the integration of a trail system with other forms of infrastruc-ture. Many possibilities exist for such multi-purpose facilities and amenities. At some point, the integration of systems is most successful when it is in fact di6 cult to isolate any particu-lar system on its own. Functional components of urban services are tightly woven into the fabric of the community at the most local scale.
Integrating Flows with Forms: Spatial Planning and Urban Design
We now look at the possibilities for the appli-cation of a One System approach in integrating urban ‘form’ with urban ‘fl ows.’ We will con-sider land use, density, connectivity, proximity, green infrastructure, and other attributes of urban form, and see how a large extent of the overall system e6 ciency depends on integrat-ing and coordinating these with infrastructure systems.
Urban Form, Land Use Mix, Density,
Connectivity, and Proximity
Integration of spatial planning with infrastruc-ture system design represents the most signifi -cant opportunity to enhance overall system performance. Urban form, land use mix, den-sity, connectivity, and proximity all have e9 ects on infrastructure performance. Yet, few land use plans are evaluated from this perspective. Planners and engineers sit at di9 erent tables, at di9 erent times, asking di9 erent questions. Sel-dom do infrastructure concerns infl uence land use plans or vice versa. Despite this disconnect, the best time to consider ways to minimize in-
Figure 1.12. Distributed Systems.
Centralized, remote facilities with one-way networks can be transformed to
distributed systems as shown in these two extreme examples of energy systems. In
the centralized example, a remote facility services all end users in a one-way
distribution network. In the distributed case, all buildings within a 5 km radius are
connected to a local heating /cooling plant, using low temperature water to move
heat or cooling from one location to another. Excess heat can be captured from local
industrial processes, or sewage, or large buildings like the hospital, and then shared at
low cost. Local power generation is an option—creating a mini electrical utility that
offers its ‘waste heat’ to buildings or to operate a cooling system. Typically, such a
combined system can raise overall effi ciencies from 55 to 80 percent. The on-site
power can be used for local transit year round. Flexibility is also enhanced, since
energy sources can be mixed to take advantage of market rates, local waste products,
weather, new technology, and so on. Any excess electricity from the local utility can
be offered to the regional grid, and used for better load management and back-up.
ECo2-Part1REVd_PREP 68 6/15/09 8:22:12 AM
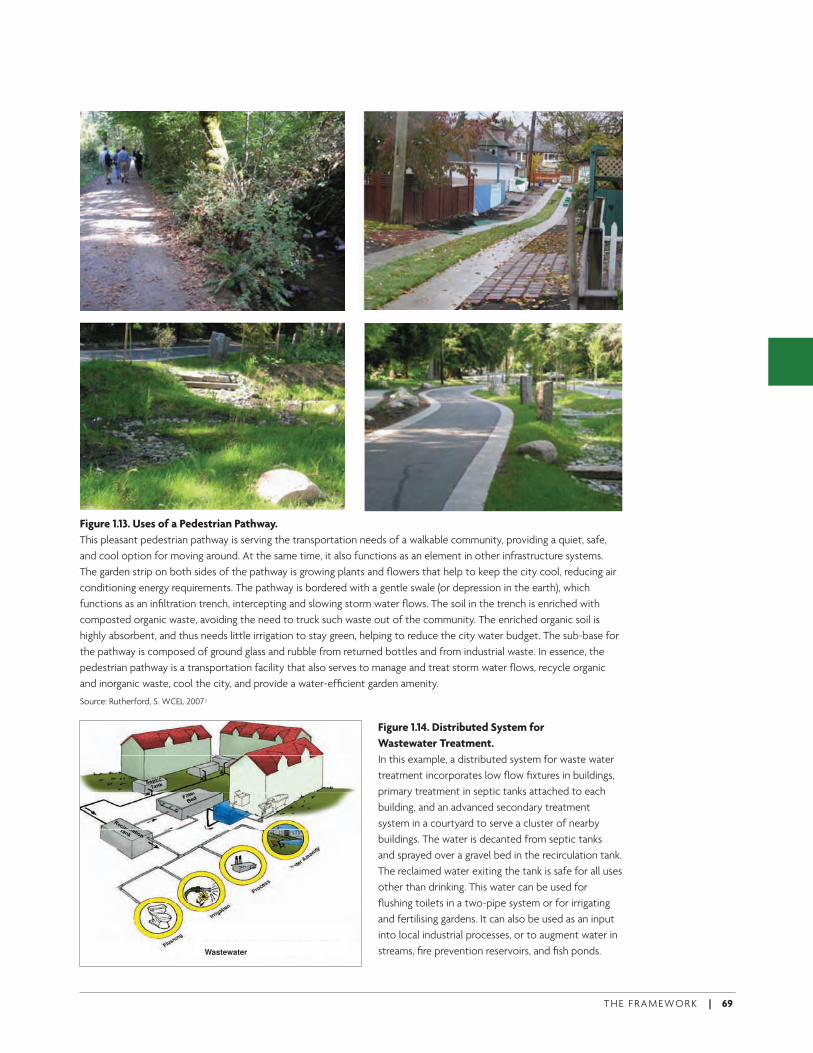
T H E F R A M E WO R K | 69
Figure 1.13. Uses of a Pedestrian Pathway.
This pleasant pedestrian pathway is serving the transportation needs of a walkable community, providing a quiet, safe,
and cool option for moving around. At the same time, it also functions as an element in other infrastructure systems.
The garden strip on both sides of the pathway is growing plants and fl owers that help to keep the city cool, reducing air
conditioning energy requirements. The pathway is bordered with a gentle swale (or depression in the earth), which
functions as an infi ltration trench, intercepting and slowing storm water fl ows. The soil in the trench is enriched with
composted organic waste, avoiding the need to truck such waste out of the community. The enriched organic soil is
highly absorbent, and thus needs little irrigation to stay green, helping to reduce the city water budget. The sub-base for
the pathway is composed of ground glass and rubble from returned bottles and from industrial waste. In essence, the
pedestrian pathway is a transportation facility that also serves to manage and treat storm water fl ows, recycle organic
and inorganic waste, cool the city, and provide a water-effi cient garden amenity.
Source: Rutherford, S. WCEL 2007 j
Wastewater
Figure 1.14. Distributed System for
Wastewater Treatment.
In this example, a distributed system for waste water
treatment incorporates low fl ow fi xtures in buildings,
primary treatment in septic tanks attached to each
building, and an advanced secondary treatment
system in a courtyard to serve a cluster of nearby
buildings. The water is decanted from septic tanks
and sprayed over a gravel bed in the recirculation tank.
The reclaimed water exiting the tank is safe for all uses
other than drinking. This water can be used for
fl ushing toilets in a two-pipe system or for irrigating
and fertilising gardens. It can also be used as an input
into local industrial processes, or to augment water in
streams, fi re prevention reservoirs, and fi sh ponds.
ECo2-Part1REVd_PREP 69 6/15/09 8:22:25 AM
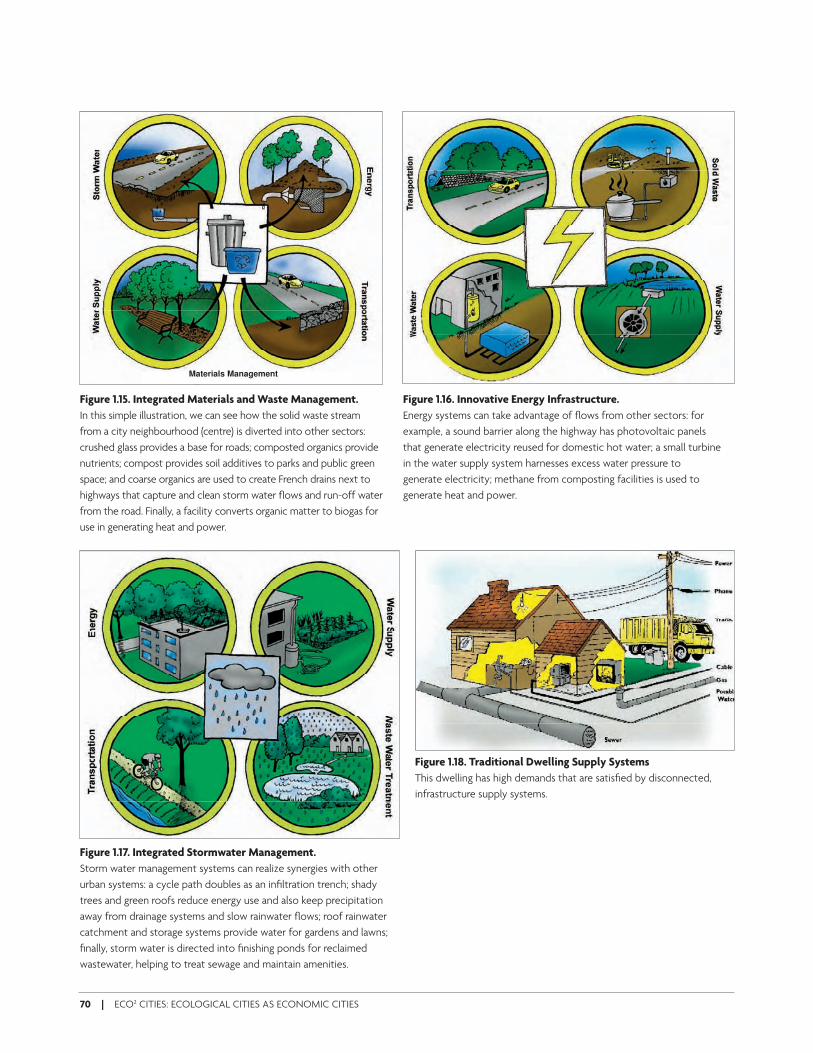
70 | ECO2 CITIES: ECOLOGICAL CITIES AS ECONOMIC CITIES
Materials Management
Figure 1.15. Integrated Materials and Waste Management.
In this simple illustration, we can see how the solid waste stream
from a city neighbourhood (centre) is diverted into other sectors:
crushed glass provides a base for roads; composted organics provide
nutrients; compost provides soil additives to parks and public green
space; and coarse organics are used to create French drains next to
highways that capture and clean storm water fl ows and run-off water
from the road. Finally, a facility converts organic matter to biogas for
use in generating heat and power.
Figure 1.17. Integrated Stormwater Management.
Storm water management systems can realize synergies with other
urban systems: a cycle path doubles as an infi ltration trench; shady
trees and green roofs reduce energy use and also keep precipitation
away from drainage systems and slow rainwater fl ows; roof rainwater
catchment and storage systems provide water for gardens and lawns;
fi nally, storm water is directed into fi nishing ponds for reclaimed
wastewater, helping to treat sewage and maintain amenities.
Figure 1.16. Innovative Energy Infrastructure.
Energy systems can take advantage of fl ows from other sectors: for
example, a sound barrier along the highway has photovoltaic panels
that generate electricity reused for domestic hot water; a small turbine
in the water supply system harnesses excess water pressure to
generate electricity; methane from composting facilities is used to
generate heat and power.
Figure 1.18. Traditional Dwelling Supply Systems
This dwelling has high demands that are satisfi ed by disconnected,
infrastructure supply systems.
ECo2-Part1REVd_PREP 70 6/15/09 8:22:30 AM
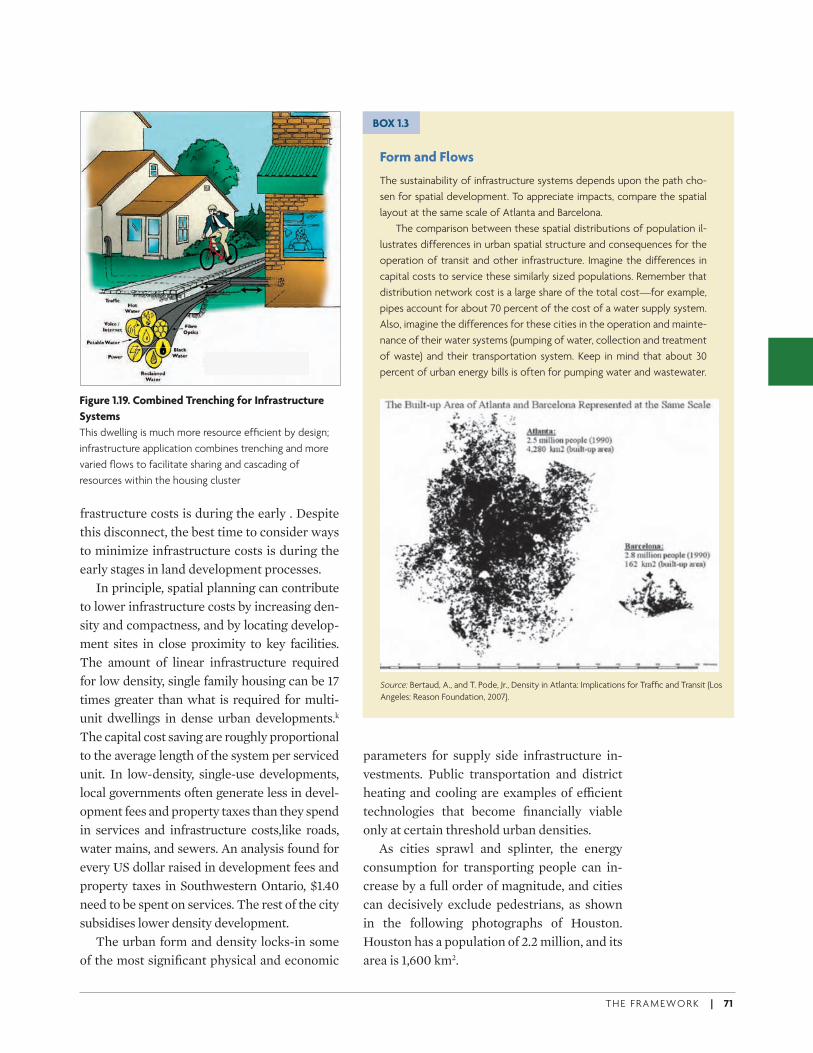
T H E F R A M E WO R K | 71
frastructure costs is during the early . Despite this disconnect, the best time to consider ways to minimize infrastructure costs is during the early stages in land development processes.
In principle, spatial planning can contribute to lower infrastructure costs by increasing den-sity and compactness, and by locating develop-ment sites in close proximity to key facilities. The amount of linear infrastructure required for low density, single family housing can be 17 times greater than what is required for multi-unit dwellings in dense urban developments.k The capital cost saving are roughly proportional to the average length of the system per serviced unit. In low-density, single-use developments, local governments often generate less in devel-opment fees and property taxes than they spend in services and infrastructure costs,like roads, water mains, and sewers. An analysis found for every US dollar raised in development fees and property taxes in Southwestern Ontario, $1.40 need to be spent on services. The rest of the city subsidises lower density development.
The urban form and density locks-in some of the most signifi cant physical and economic
parameters for supply side infrastructure in-vestments. Public transportation and district heating and cooling are examples of e6 cient technologies that become fi nancially viable only at certain threshold urban densities.
As cities sprawl and splinter, the energy consumption for transporting people can in-crease by a full order of magnitude, and cities can decisively exclude pedestrians, as shown in the following photographs of Houston. Houston has a population of 2.2 million, and its area is 1,600 km2.
Figure 1.19. Combined Trenching for Infrastructure
Systems
This dwelling is much more resource effi cient by design;
infrastructure application combines trenching and more
varied fl ows to facilitate sharing and cascading of
resources within the housing cluster
Form and Flows
The sustainability of infrastructure systems depends upon the path cho-
sen for spatial development. To appreciate impacts, compare the spatial
layout at the same scale of Atlanta and Barcelona.
The comparison between these spatial distributions of population il-
lustrates differences in urban spatial structure and consequences for the
operation of transit and other infrastructure. Imagine the differences in
capital costs to service these similarly sized populations. Remember that
distribution network cost is a large share of the total cost—for example,
pipes account for about 70 percent of the cost of a water supply system.
Also, imagine the differences for these cities in the operation and mainte-
nance of their water systems (pumping of water, collection and treatment
of waste) and their transportation system. Keep in mind that about 30
percent of urban energy bills is often for pumping water and wastewater.
BOX 1.3
Source: Bertaud, A., and T. Pode, Jr., Density in Atlanta: Implications for Traffi c and Transit (Los
Angeles: Reason Foundation, 2007).
ECo2-Part1REVd_PREP 71 6/15/09 8:22:36 AM
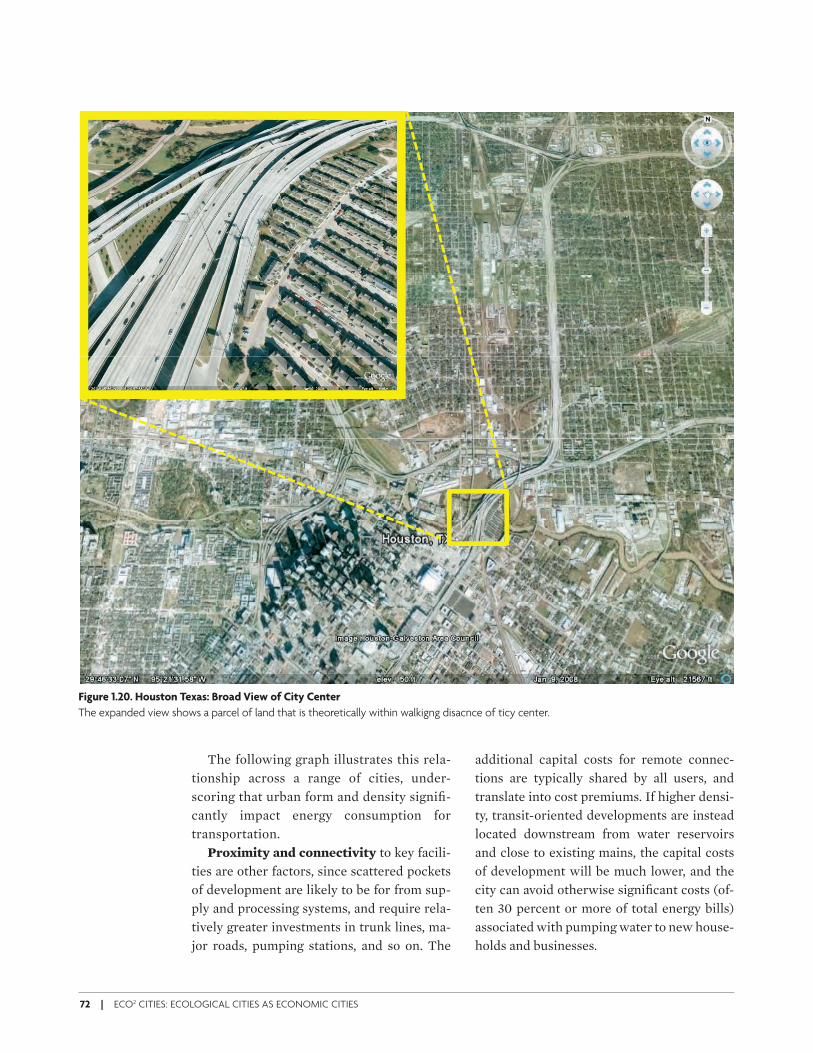
72 | ECO2 CITIES: ECOLOGICAL CITIES AS ECONOMIC CITIES
Figure 1.20. Houston Texas: Broad View of City Center
The expanded view shows a parcel of land that is theoretically within walkigng disacnce of ticy center.
The following graph illustrates this rela-tionship across a range of cities, under-scoring that urban form and density signifi -cantly impact energy consumption for transportation.
Proximity and connectivity to key facili-ties are other factors, since scattered pockets of development are likely to be for from sup-ply and processing systems, and require rela-tively greater investments in trunk lines, ma-jor roads, pumping stations, and so on. The
additional capital costs for remote connec-tions are typically shared by all users, and translate into cost premiums. If higher densi-ty, transit-oriented developments are instead located downstream from water reservoirs and close to existing mains, the capital costs of development will be much lower, and the city can avoid otherwise signifi cant costs (of-ten 30 percent or more of total energy bills) associated with pumping water to new house-holds and businesses.
ECo2-Part1REVd_PREP 72 6/15/09 8:22:39 AM
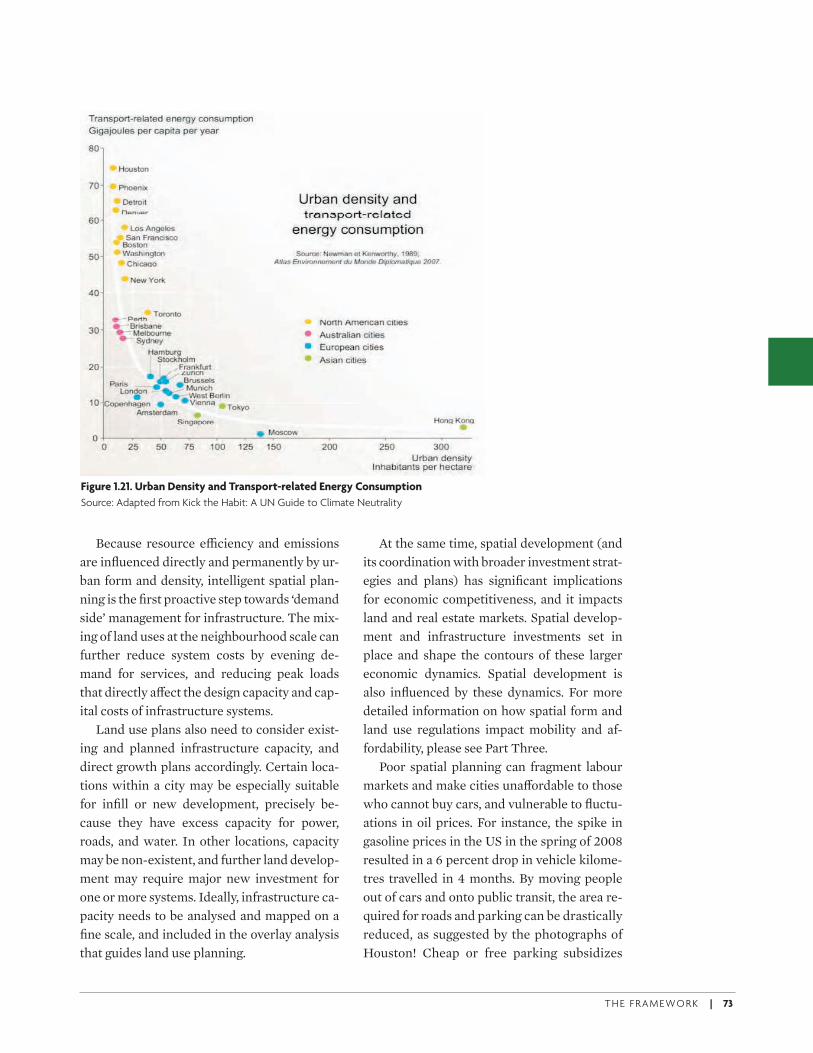
T H E F R A M E WO R K | 73
Because resource e6 ciency and emissions are infl uenced directly and permanently by ur-ban form and density, intelligent spatial plan-ning is the fi rst proactive step towards ‘demand side’ management for infrastructure. The mix-ing of land uses at the neighbourhood scale can further reduce system costs by evening de-mand for services, and reducing peak loads that directly a9 ect the design capacity and cap-ital costs of infrastructure systems.
Land use plans also need to consider exist-ing and planned infrastructure capacity, and direct growth plans accordingly. Certain loca-tions within a city may be especially suitable for infi ll or new development, precisely be-cause they have excess capacity for power, roads, and water. In other locations, capacity may be non-existent, and further land develop-ment may require major new investment for one or more systems. Ideally, infrastructure ca-pacity needs to be analysed and mapped on a fi ne scale, and included in the overlay analysis that guides land use planning.
At the same time, spatial development (and its coordination with broader investment strat-egies and plans) has signifi cant implications for economic competitiveness, and it impacts land and real estate markets. Spatial develop-ment and infrastructure investments set in place and shape the contours of these larger economic dynamics. Spatial development is also infl uenced by these dynamics. For more detailed information on how spatial form and land use regulations impact mobility and af-fordability, please see Part Three.
Poor spatial planning can fragment labour markets and make cities una9 ordable to those who cannot buy cars, and vulnerable to fl uctu-ations in oil prices. For instance, the spike in gasoline prices in the US in the spring of 2008 resulted in a 6 percent drop in vehicle kilome-tres travelled in 4 months. By moving people out of cars and onto public transit, the area re-quired for roads and parking can be drastically reduced, as suggested by the photographs of Houston! Cheap or free parking subsidizes
Figure 1.21. Urban Density and Transport-related Energy Consumption
Source: Adapted from Kick the Habit: A UN Guide to Climate Neutrality
ECo2-Part1REVd_PREP 73 6/15/09 8:22:42 AM
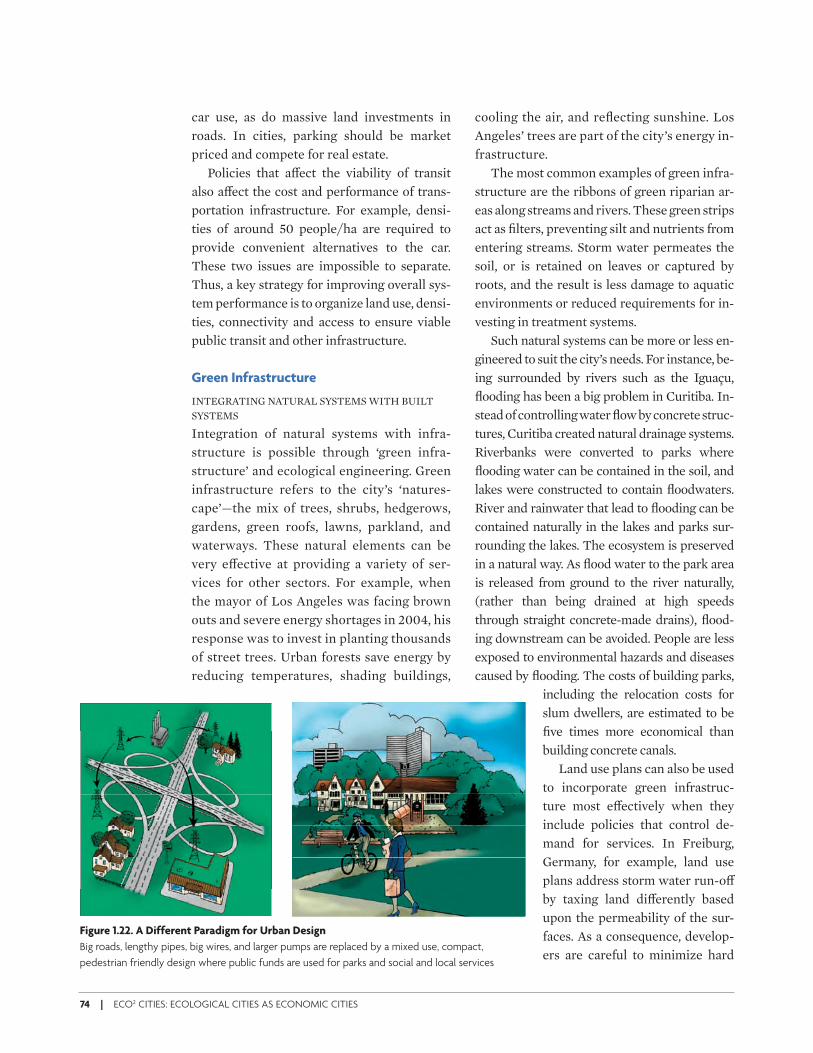
74 | ECO2 CITIES: ECOLOGICAL CITIES AS ECONOMIC CITIES
car use, as do massive land investments in roads. In cities, parking should be market priced and compete for real estate.
Policies that a9 ect the viability of transit also a9 ect the cost and performance of trans-portation infrastructure. For example, densi-ties of around 50 people/ha are required to provide convenient alternatives to the car. These two issues are impossible to separate. Thus, a key strategy for improving overall sys-tem performance is to organize land use, densi-ties, connectivity and access to ensure viable public transit and other infrastructure.
Green Infrastructure
INTEGRATING NATURAL SYSTEMS WITH BUILT SYSTEMS
Integration of natural systems with infra-structure is possible through ‘green infra-structure’ and ecological engineering. Green infrastructure refers to the city’s ‘natures-cape’—the mix of trees, shrubs, hedgerows, gardens, green roofs, lawns, parkland, and waterways. These natural elements can be very e9 ective at providing a variety of ser-vices for other sectors. For example, when the mayor of Los Angeles was facing brown outs and severe energy shortages in 2004, his response was to invest in planting thousands of street trees. Urban forests save energy by reducing temperatures, shading buildings,
cooling the air, and refl ecting sunshine. Los Angeles’ trees are part of the city’s energy in-frastructure.
The most common examples of green infra-structure are the ribbons of green riparian ar-eas along streams and rivers. These green strips act as fi lters, preventing silt and nutrients from entering streams. Storm water permeates the soil, or is retained on leaves or captured by roots, and the result is less damage to aquatic environments or reduced requirements for in-vesting in treatment systems.
Such natural systems can be more or less en-gineered to suit the city’s needs. For instance, be-ing surrounded by rivers such as the Iguaçu, fl ooding has been a big problem in Curitiba. In-stead of controlling water fl ow by concrete struc-tures, Curitiba created natural drainage systems. Riverbanks were converted to parks where fl ooding water can be contained in the soil, and lakes were constructed to contain fl oodwaters. River and rainwater that lead to fl ooding can be contained naturally in the lakes and parks sur-rounding the lakes. The ecosystem is preserved in a natural way. As fl ood water to the park area is released from ground to the river naturally, (rather than being drained at high speeds through straight concrete-made drains), fl ood-ing downstream can be avoided. People are less exposed to environmental hazards and diseases caused by fl ooding. The costs of building parks,
including the relocation costs for slum dwellers, are estimated to be fi ve times more economical than building concrete canals.
Land use plans can also be used to incorporate green infrastruc-ture most e9 ectively when they include policies that control de-mand for services. In Freiburg, Germany, for example, land use plans address storm water run-o9 by taxing land di9 erently based upon the permeability of the sur-faces. As a consequence, develop-ers are careful to minimize hard
Figure 1.22. A Different Paradigm for Urban Design
Big roads, lengthy pipes, big wires, and larger pumps are replaced by a mixed use, compact,
pedestrian friendly design where public funds are used for parks and social and local services
ECo2-Part1REVd_PREP 74 6/15/09 8:22:42 AM
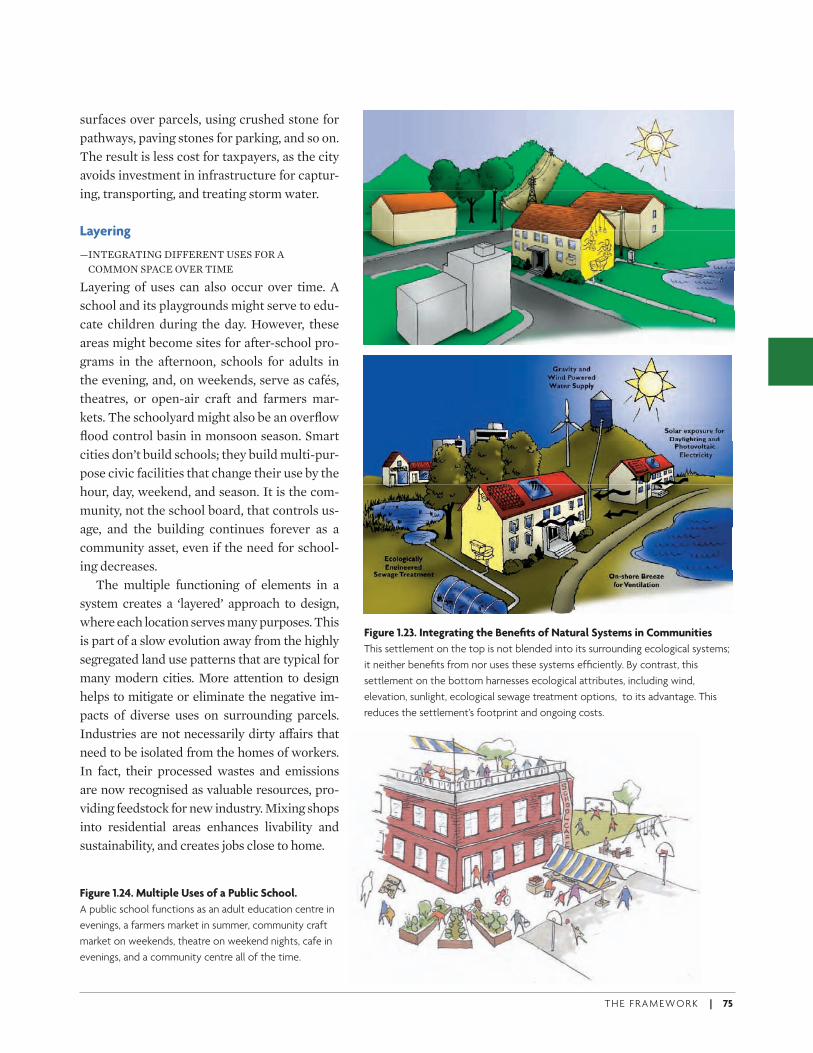
T H E F R A M E WO R K | 75
surfaces over parcels, using crushed stone for pathways, paving stones for parking, and so on. The result is less cost for taxpayers, as the city avoids investment in infrastructure for captur-ing, transporting, and treating storm water.
Layering
— INTEGRATING DIFFERENT USES FOR A COMMON SPACE OVER TIME
Layering of uses can also occur over time. A school and its playgrounds might serve to edu-cate children during the day. However, these areas might become sites for after-school pro-grams in the afternoon, schools for adults in the evening, and, on weekends, serve as cafés, theatres, or open-air craft and farmers mar-kets. The schoolyard might also be an overfl ow fl ood control basin in monsoon season. Smart cities don’t build schools; they build multi-pur-pose civic facilities that change their use by the hour, day, weekend, and season. It is the com-munity, not the school board, that controls us-age, and the building continues forever as a community asset, even if the need for school-ing decreases.
The multiple functioning of elements in a system creates a ‘layered’ approach to design, where each location serves many purposes. This is part of a slow evolution away from the highly segregated land use patterns that are typical for many modern cities. More attention to design helps to mitigate or eliminate the negative im-pacts of diverse uses on surrounding parcels. Industries are not necessarily dirty a9 airs that need to be isolated from the homes of workers. In fact, their processed wastes and emissions are now recognised as valuable resources, pro-viding feedstock for new industry. Mixing shops into residential areas enhances livability and sustainability, and creates jobs close to home.
Figure 1.23. Integrating the Benefi ts of Natural Systems in Communities
This settlement on the top is not blended into its surrounding ecological systems;
it neither benefi ts from nor uses these systems effi ciently. By contrast, this
settlement on the bottom harnesses ecological attributes, including wind,
elevation, sunlight, ecological sewage treatment options, to its advantage. This
reduces the settlement’s footprint and ongoing costs.
Figure 1.24. Multiple Uses of a Public School.
A public school functions as an adult education centre in
evenings, a farmers market in summer, community craft
market on weekends, theatre on weekend nights, cafe in
evenings, and a community centre all of the time.
ECo2-Part1REVd_PREP 75 6/15/09 8:22:45 AM
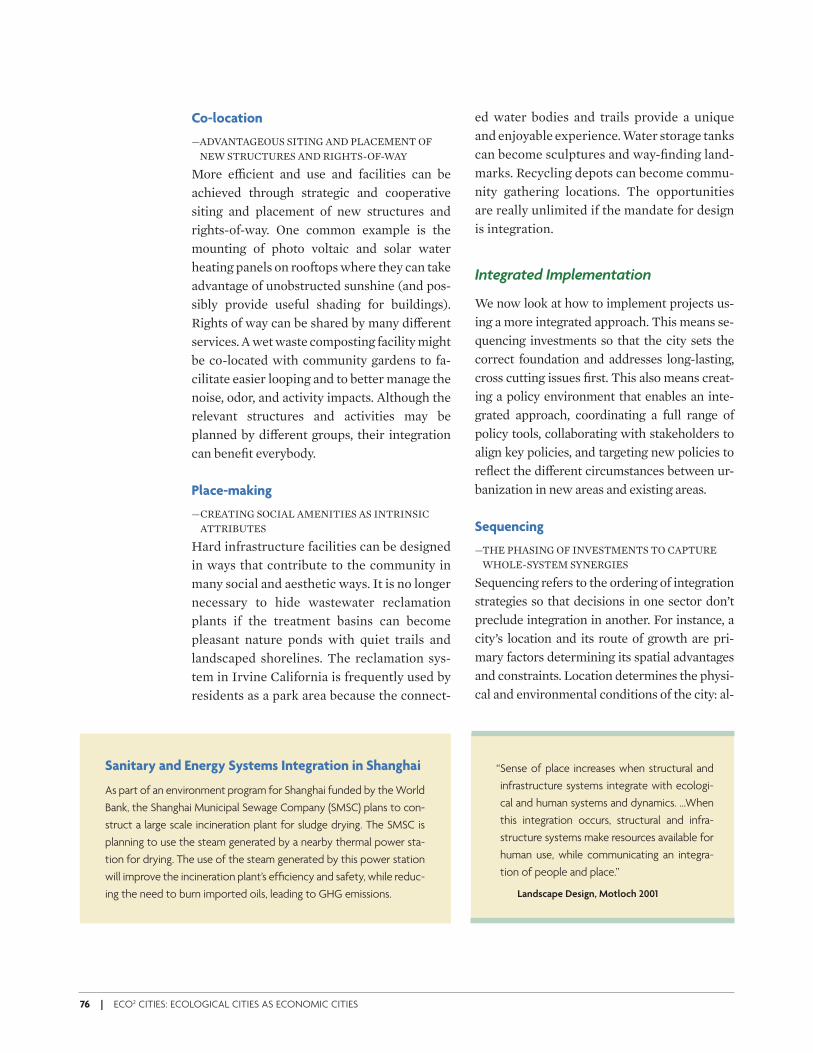
76 | ECO2 CITIES: ECOLOGICAL CITIES AS ECONOMIC CITIES
Co-location
— ADVANTAGEOUS SITING AND PLACEMENT OF NEW STRUCTURES AND RIGHTS-OF-WAY
More e6 cient and use and facilities can be achieved through strategic and cooperative siting and placement of new structures and rights-of-way. One common example is the mounting of photo voltaic and solar water heating panels on rooftops where they can take advantage of unobstructed sunshine (and pos-sibly provide useful shading for buildings). Rights of way can be shared by many di9 erent services. A wet waste composting facility might be co-located with community gardens to fa-cilitate easier looping and to better manage the noise, odor, and activity impacts. Although the relevant structures and activities may be planned by di9 erent groups, their integration can benefi t everybody.
Place-making
— CREATING SOCIAL AMENITIES AS INTRINSIC ATTRIBUTES
Hard infrastructure facilities can be designed in ways that contribute to the community in many social and aesthetic ways. It is no longer necessary to hide wastewater reclamation plants if the treatment basins can become pleasant nature ponds with quiet trails and landscaped shorelines. The reclamation sys-tem in Irvine California is frequently used by residents as a park area because the connect-
ed water bodies and trails provide a unique and enjoyable experience. Water storage tanks can become sculptures and way-fi nding land-marks. Recycling depots can become commu-nity gathering locations. The opportunities are really unlimited if the mandate for design is integration.
Integrated Implementation
We now look at how to implement projects us-ing a more integrated approach. This means se-quencing investments so that the city sets the correct foundation and addresses long-lasting, cross cutting issues fi rst. This also means creat-ing a policy environment that enables an inte-grated approach, coordinating a full range of policy tools, collaborating with stakeholders to align key policies, and targeting new policies to refl ect the di9 erent circumstances between ur-banization in new areas and existing areas.
Sequencing
— THE PHASING OF INVESTMENTS TO CAPTURE WHOLE-SYSTEM SYNERGIES
Sequencing refers to the ordering of integration strategies so that decisions in one sector don’t preclude integration in another. For instance, a city’s location and its route of growth are pri-mary factors determining its spatial advantages and constraints. Location determines the physi-cal and environmental conditions of the city: al-
Sanitary and Energy Systems Integration in Shanghai
As part of an environment program for Shanghai funded by the World
Bank, the Shanghai Municipal Sewage Company (SMSC) plans to con-
struct a large scale incineration plant for sludge drying. The SMSC is
planning to use the steam generated by a nearby thermal power sta-
tion for drying. The use of the steam generated by this power station
will improve the incineration plant’s effi ciency and safety, while reduc-
ing the need to burn imported oils, leading to GHG emissions.
“ Sense of place increases when structural and
infrastructure systems integrate with ecologi-
cal and human systems and dynamics. ...When
this integration occurs, structural and infra-
structure systems make resources available for
human use, while communicating an integra-
tion of people and place.”
Landscape Design, Motloch 2001
ECo2-Part1REVd_PREP 76 6/15/09 8:22:47 AM
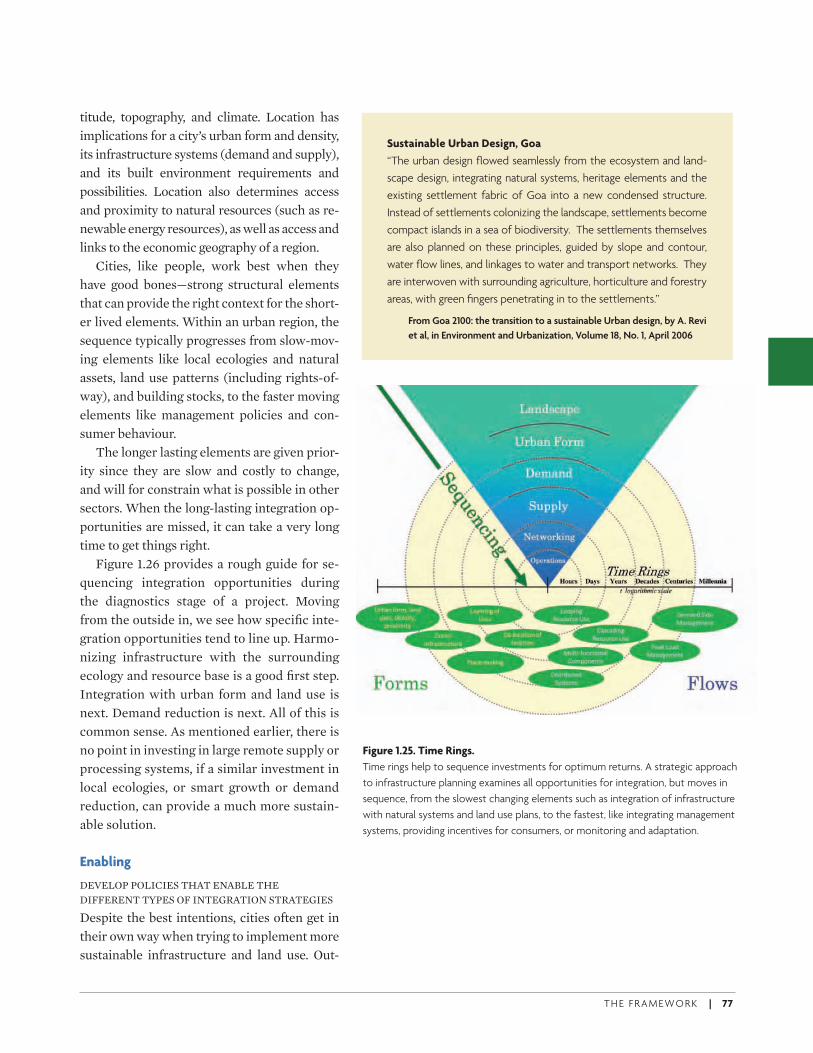
T H E F R A M E WO R K | 77
titude, topography, and climate. Location has implications for a city’s urban form and density, its infrastructure systems (demand and supply), and its built environment requirements and possibilities. Location also determines access and proximity to natural resources (such as re-newable energy resources), as well as access and links to the economic geography of a region.
Cities, like people, work best when they have good bones—strong structural elements that can provide the right context for the short-er lived elements. Within an urban region, the sequence typically progresses from slow-mov-ing elements like local ecologies and natural assets, land use patterns (including rights-of-way), and building stocks, to the faster moving elements like management policies and con-sumer behaviour.
The longer lasting elements are given prior-ity since they are slow and costly to change, and will for constrain what is possible in other sectors. When the long-lasting integration op-portunities are missed, it can take a very long time to get things right.
Figure 1.26 provides a rough guide for se-quencing integration opportunities during the diagnostics stage of a project. Moving from the outside in, we see how specifi c inte-gration opportunities tend to line up. Harmo-nizing infrastructure with the surrounding ecology and resource base is a good fi rst step. Integration with urban form and land use is next. Demand reduction is next. All of this is common sense. As mentioned earlier, there is no point in investing in large remote supply or processing systems, if a similar investment in local ecologies, or smart growth or demand reduction, can provide a much more sustain-able solution.
Enabling
DEVELOP POLICIES THAT ENABLE THE DIFFERENT TYPES OF INTEGRATION STRATEGIES
Despite the best intentions, cities often get in their own way when trying to implement more sustainable infrastructure and land use. Out-
Figure 1.25. Time Rings.
Time rings help to sequence investments for optimum returns. A strategic approach
to infrastructure planning examines all opportunities for integration, but moves in
sequence, from the slowest changing elements such as integration of infrastructure
with natural systems and land use plans, to the fastest, like integrating management
systems, providing incentives for consumers, or monitoring and adaptation.
Sustainable Urban Design, Goa
“The urban design fl owed seamlessly from the ecosystem and land-
scape design, integrating natural systems, heritage elements and the
existing settlement fabric of Goa into a new condensed structure.
Instead of settlements colonizing the landscape, settlements become
compact islands in a sea of biodiversity. The settlements themselves
are also planned on these principles, guided by slope and contour,
water fl ow lines, and linkages to water and transport networks. They
are interwoven with surrounding agriculture, horticulture and forestry
areas, with green fi ngers penetrating in to the settlements.”
From Goa 2100: the transition to a sustainable Urban design, by A. Revi
et al, in Environment and Urbanization, Volume 18, No. 1, April 2006
ECo2-Part1REVd_PREP 77 6/15/09 8:22:47 AM
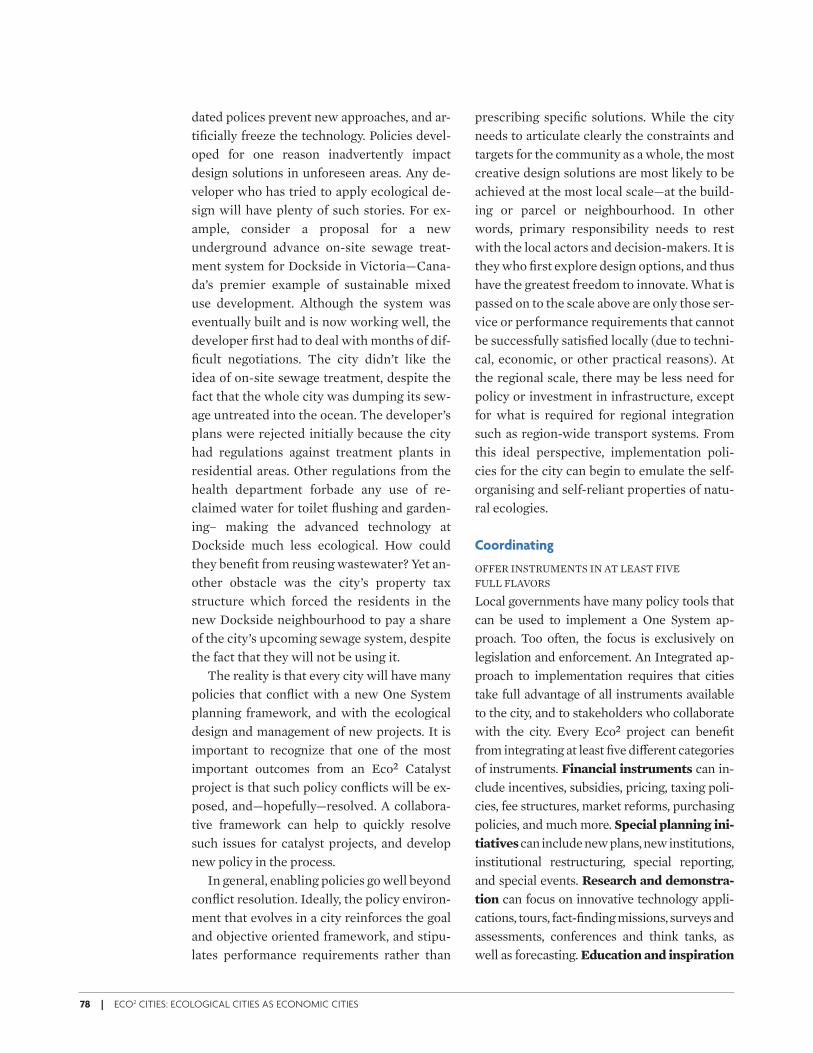
78 | ECO2 CITIES: ECOLOGICAL CITIES AS ECONOMIC CITIES
dated polices prevent new approaches, and ar-tifi cially freeze the technology. Policies devel-oped for one reason inadvertently impact design solutions in unforeseen areas. Any de-veloper who has tried to apply ecological de-sign will have plenty of such stories. For ex-ample, consider a proposal for a new underground advance on-site sewage treat-ment system for Dockside in Victoria—Cana-da’s premier example of sustainable mixed use development. Although the system was eventually built and is now working well, the developer fi rst had to deal with months of dif-fi cult negotiations. The city didn’t like the idea of on-site sewage treatment, despite the fact that the whole city was dumping its sew-age untreated into the ocean. The developer’s plans were rejected initially because the city had regulations against treatment plants in residential areas. Other regulations from the health department forbade any use of re-claimed water for toilet fl ushing and garden-ing– making the advanced technology at Dockside much less ecological. How could they benefi t from reusing wastewater? Yet an-other obstacle was the city’s property tax structure which forced the residents in the new Dockside neighbourhood to pay a share of the city’s upcoming sewage system, despite the fact that they will not be using it.
The reality is that every city will have many policies that confl ict with a new One System planning framework, and with the ecological design and management of new projects. It is important to recognize that one of the most important outcomes from an Eco2 Catalyst project is that such policy confl icts will be ex-posed, and—hopefully—resolved. A collabora-tive framework can help to quickly resolve such issues for catalyst projects, and develop new policy in the process.
In general, enabling policies go well beyond confl ict resolution. Ideally, the policy environ-ment that evolves in a city reinforces the goal and objective oriented framework, and stipu-lates performance requirements rather than
prescribing specifi c solutions. While the city needs to articulate clearly the constraints and targets for the community as a whole, the most creative design solutions are most likely to be achieved at the most local scale—at the build-ing or parcel or neighbourhood. In other words, primary responsibility needs to rest with the local actors and decision-makers. It is they who fi rst explore design options, and thus have the greatest freedom to innovate. What is passed on to the scale above are only those ser-vice or performance requirements that cannot be successfully satisfi ed locally (due to techni-cal, economic, or other practical reasons). At the regional scale, there may be less need for policy or investment in infrastructure, except for what is required for regional integration such as region-wide transport systems. From this ideal perspective, implementation poli-cies for the city can begin to emulate the self-organising and self-reliant properties of natu-ral ecologies.
Coordinating
OFFER INSTRUMENTS IN AT LEAST FIVE FULL FLAVORS
Local governments have many policy tools that can be used to implement a One System ap-proach. Too often, the focus is exclusively on legislation and enforcement. An Integrated ap-proach to implementation requires that cities take full advantage of all instruments available to the city, and to stakeholders who collaborate with the city. Every Eco2 project can benefi t from integrating at least fi ve di9 erent categories of instruments. Financial instruments can in-clude incentives, subsidies, pricing, taxing poli-cies, fee structures, market reforms, purchasing policies, and much more. Special planning ini-tiatives can include new plans, new institutions, institutional restructuring, special reporting, and special events. Research and demonstra-
tion can focus on innovative technology appli-cations, tours, fact-fi nding missions, surveys and assessments, conferences and think tanks, as well as forecasting. Education and inspiration
ECo2-Part1REVd_PREP 78 6/15/09 8:22:49 AM
T H E F R A M E WO R K | 79
can include professional training, visioning ex-ercises, co-training, communities of practice, curriculum reform, special publications and communications, social networking, and invest-ments in social capital. Legislation and en-forcement can include a wide variety of regula-tions, codes and standards, as well as specifi c fi nes and policing policies.
In some cases, the capacity of a city to apply particular policies will be restricted by national governments and by statute. However, by working with senior governments and stake-holders, through a collaborative working group, such limitations are overcome. The best approach to implementation is always to use the full set of instruments in concert, at time and resources allow.
For instance, if a city wants to reduce water consumption at lowest cost, it could work col-laboratively to explore an integrated approach. This might involve: 1) a public awareness and education campaign targeting households and businesses to convince them of the need and benefi ts of water savings, and to seek their sup-port in designing tari9 increases (stakeholder engagement); 2) adjusting the structure of wa-ter tari9 s fees/pricing (a policy and regulatory issue and demand management); 3) promoting the use of water saving faucets and toilets (a regulation and building code issue and public awareness); 4) designing guidelines and stan-dards for new residences and businesses to en-courage investments in the best performing water saving faucets and toilets, and procure-ment policies for private sector suppliers so that the best technology is supplied at high vol-ume market prices (engagement with private sector stakeholders); 5) incentives for captur-ing rainwater and reusing treated wastewater (resource management and market reform); 6) reducing the peak load demand, by creating in-centives for distributing use across time or by integrating storage of water into the delivery system in areas where capacity is at peak; and 7) reducing water leakage by upgrading the system.
All these measures will reduce water con-sumption, energy requirements for pumping, and the load-bearing requirements (and therefore design specifi cations) of the pipes and pumps, and a major component of water system costs. On the supply side, if water sys-tems investments are being planned, then the design and layout of the pipes and distribu-tion network, as well as the location of the treatment plant should be made in consider-ation of spatial e6 ciency (for instance, topog-raphy and its relation to the demand location are often considered for the e6 cient use of gravity in water/wastewater networks)—and energy e6 ciency.
Collaborating
SYNCHRONIZE POLICIES AMONG ALL THE STAKEHOLDERS
The best approach is to get everyone rowing in the same direction. All stakeholders or project partners bring a unique combination of policy tools based on their mandates, skills and re-sources. Part of the challenge for cities imple-menting new projects is ensuring that all stake-holders have aligned their existing policies and programs, and are using their particular strengths to support project goals and strate-gies. By collaborating with senior levels of gov-ernment, local utilities, private-sector corpora-tions, and NGOs, the potential is created for a broad and diverse suite of policy tools. A col-laborative process can even identify potential actions for the public at large, and for individu-als with special talents or interests.
Aligning
DEVELOP POLICIES THAT ARE CONSISTENT AND ALIGNED WITH THE GOALS AND STRATEGIES IN THE PLANNING FRAMEWORK
All new policy should begin with the relevant goals and strategies from the long term plan-ning framework, using these as a rationale. The references can be included directly in the policy document, if this helps. Sometimes the changes to policies must occur within
ECo2-Part1REVd_PREP 79 6/15/09 8:22:49 AM
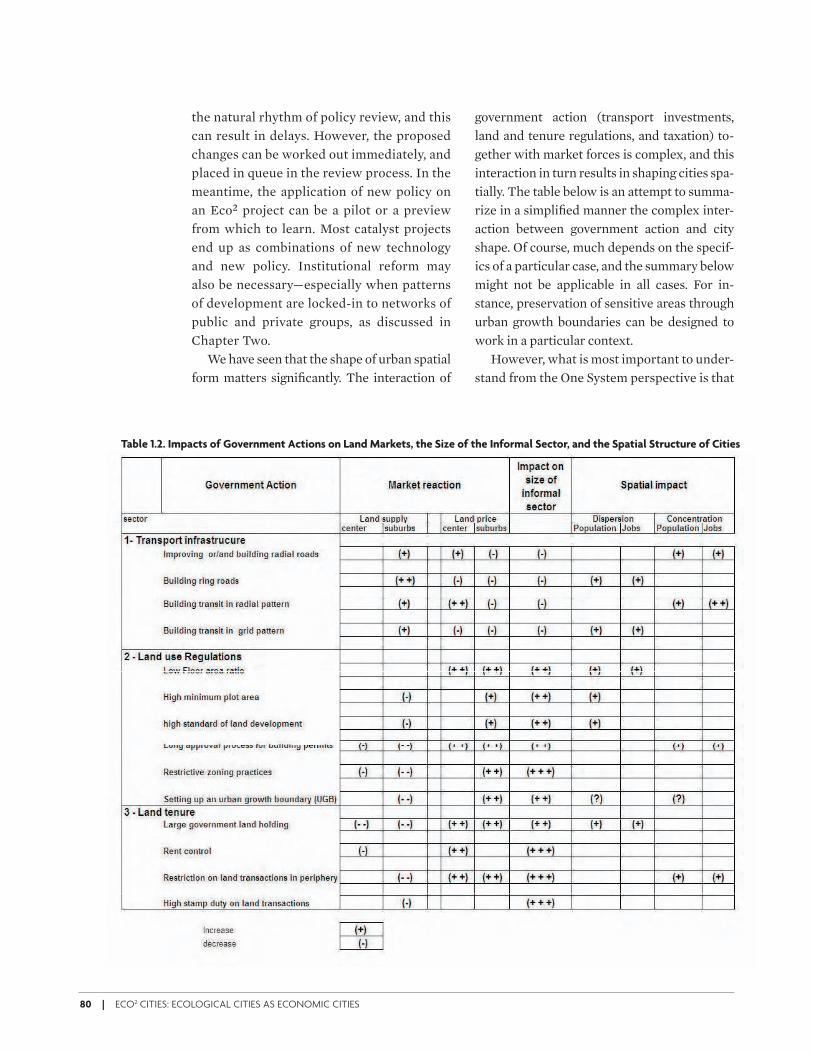
80 | ECO2 CITIES: ECOLOGICAL CITIES AS ECONOMIC CITIES
the natural rhythm of policy review, and this can result in delays. However, the proposed changes can be worked out immediately, and placed in queue in the review process. In the meantime, the application of new policy on an Eco2 project can be a pilot or a preview from which to learn. Most catalyst projects end up as combinations of new technology and new policy. Institutional reform may also be necessary—especially when patterns of development are locked-in to networks of public and private groups, as discussed in Chapter Two.
We have seen that the shape of urban spatial form matters signifi cantly. The interaction of
government action (transport investments, land and tenure regulations, and taxation) to-gether with market forces is complex, and this interaction in turn results in shaping cities spa-tially. The table below is an attempt to summa-rize in a simplifi ed manner the complex inter-action between government action and city shape. Of course, much depends on the specif-ics of a particular case, and the summary below might not be applicable in all cases. For in-stance, preservation of sensitive areas through urban growth boundaries can be designed to work in a particular context.
However, what is most important to under-stand from the One System perspective is that
Table 1.2. Impacts of Government Actions on Land Markets, the Size of the Informal Sector, and the Spatial Structure of Cities
ECo2-Part1REVd_PREP 80 6/15/09 8:22:49 AM
T H E F R A M E WO R K | 81
most government actions listed in table above are usually implemented with very limited objectives and without any considerations for their impacts on land supply and demand, the city shape in the long range , and their atten-dant implications for economic and resource ine6 ciency. For instance, when building ring roads the objective is usually to alleviate con-gestion in a given area by allowing through tra6 c to bypass the city center. Very little thought is given to the impact on land supply and land price.
Because the objectives of urban regulations and investments do not consider the One Sys-tem approach, it is not surprising that many government actions often contradict each other. For instance, in Bangalore, the local government fi nances a Bus Rapid Transit (BRT) system that tends to concentrate jobs in the center of the city. At the same time, the fl oor area ratio in the CBD has been kept low-er than in the suburbs, thereby preventing the concentration of jobs in the CBD that would have been the justifi cation and rationale of the BRT in the fi rst place.
This type of contradictory action between two di9 erent branches of the local govern-ment—transport and land use planning—is rather typical. Transport engineers want high densities along transit routes to ensure a high number of passengers for the transit they de-sign. Planners faced with congestion in the city center fi nd it easier to regulate a decrease in densities to alleviate congestion. This is where a planning framework can be of value. A framework helps to ensure that misalign-ment of actions is reduced drastically.
Targeting policies
RECOGNISE THE VERY DIFFERENT NEEDS OF EXISTING URBAN AREAS AS OPPOSED TO NEW DEVELOPMENT
One of the biggest factors infl uencing the se-quencing of investments, and their capital costs, is whether the focus of development is a
newly urbanizing area, or part of the existing city. Most cities include both types of situa-tions, and it is important to adjust and target the strategies accordingly.
—New development
In newly urbanizing areas, the extent of One Sys-tem integration is wide open: the major con-straints may be fi nancial resources and the ca-pacity of the design team. The clear advantage of new urbanization is the opportunity to apply best land use practices and spatial design princi-ples, and to integrate land use planning and de-sign of infrastructure systems. The stage can be set for a cost e9 ective way of incremental urban-ization, through optimal sequencing. Reserving rights of way for roads and services is easier, as is the allocation and designation of land for key government/utility functions and open spaces.
An example from Freiburg, Germany is the alignment of transit services with land develop-ment planning. By not granting occupancy per-mits for new residences until light rail transit services begin operating for a block, newcomers avoid habits such as purchasing and using cars for commuting. In this way, the road require-ments in developments are kept to a minimum.
The pace of change however, may be a complex issue governed by the individual schedules and the fi nancing capacity of the di9 erent land owners and government actors. Often, in most cities, one of the biggest road-blocks to implementing well thought through spatial plans in new areas are the ground level realities of land ownership, and the limita-tions of the city’s infl uence on land and its own fi nances. Special policies may be required to help unorganised landowners cooperate, and to avoid the incremental and largely un-planned expansion into new areas. An exam-ple of such a policy is Urban Land Pooling and Land Readjustment. This method is particu-larly interesting as it tackles two problems at once: land and fi nance. It is briefl y described in the box below.
ECo2-Part1REVd_PREP 81 6/15/09 8:22:51 AM
82 | ECO2 CITIES: ECOLOGICAL CITIES AS ECONOMIC CITIES
— Retrofi tting and Redevelopment of
Existing Areas
One of the di6 culties we all face when con-fronted by existing urban areas is the ‘illusion of permanence.’ The physical reality of build-ings, roads, and trees conveys a very strong message that only through superhuman e9 ort will radical changes occur. But, of course,the reality is almost the reverse. Maintaining neighbourhoods in their current form typically requires vast amounts of energy and time on a day-to-day basis, simply to delay the deteriora-tion of buildings and roads, and to provide ser-vices to all residents and businesses. In fact, the operating and maintenance costs for many city neighbourhoods are often so high that it is possible to justify a complete retrofi tting of neighbourhoods, and in some cases even a re-development, if the disruption to people’s lives and businesses is not an issue.
Badly planned cities represent a constant drain on resources. In dealing with existing ur-ban areas, cities can use a range of measures to enable the existing built form to perform much more e9 ectively. These usually fall into two cat-egories: retrofi tting and redevelopment. Retro-fi tting existing areas of the city entails working with the existing built stock and infrastructure and making improvements to enhance their performance, without redeveloping the entire area. Examples of retrofi tting measures include implementing end use e6 ciency in the energy and water sector; reducing, reusing and recy-cling waste; and adapting existing transport in-frastructure (roads) to be used more e6 cient (for instance, by designating routes for bus rapid transit and lanes for bicycles).
Redevelopment entails demolishing and re-building certain areas of the city, and is typically more complicated. Redevelopment is challeng-
Urban Land Pooling and Land Readjustment
This is an innovative technique for managing and fi nancing urban
land development. Local and central governments are undertaking
such projects to assemble and convert rural land parcels in selected
urban-fringe areas into planned layouts of roads, public utility lines,
public open spaces, and serviced building plots. Some of the plots
are sold for cost recovery and the other plots are distributed to the
landowners in exchange for their rural land parcels. To be viable, the
values of urban plots distributed to landowners after subdivision
need to be signifi cantly higher than before the project begins.
In a typical project, the authorized land pooling and readjust-
ment agency selects and designates the urban-fringe area to be de-
veloped, and identifi es the land parcels and owners to be included.
A draft scheme is then prepared to plan, defi ne, and explain the
project, and to demonstrate its fi nancial viability.
Majority landowner support for each proposed project is a key
requirement for the successful application of the technique, and is
therefore an important consideration in selecting projects sites. Al-
though the emphasis is on landowner agreement and support for
each proposed project, the land pooling and readjustment agency
also has to be able and willing to use the government power of
compulsory purchase against any minority holdout landowners in
the designated project area, if this becomes necessary.
BOX 1.4
Excerpt from Approaches to Urban Slums, Eds.Barjor Mehta and Arish Dastur, The World Bank, 2008.
The sharing of the project costs and benefi ts among the land-
owners, such as increased land values, is based on their land contribu-
tions to the project. The calculation of each landowner’s share can be
based on the area of his or her land parcel as a proportion of the total
land area, or based on the estimated market value of his or her land
as a proportion of the estimated market value of the total area.
There is an important legal difference between land pooling and
land readjustment in land ownership: in a Land Pooling project, land
is legally consolidated by transferring ownership of the separate
land parcels to the Land pooling agency, with the later transfer of
ownership of most new building plots back to the landowners. In a
Land Readjustment project, the land parcels are only notionally
consolidated with the land readjustment agency having the right to
design services and subdivide them on a unifi ed basis. Then, at the
end of the project the landowners exchange their land parcel title
documents for those of their new building plots.
There are many successful examples of such projects—for in-
stance in Japan, Korea, and Indonesia. A similar process of land pool-
ing and land readjustment is practiced in the state of Gujarat in In-
dia, where the projects are called ‘town planning schemes.’
ECo2-Part1REVd_PREP 82 6/15/09 8:22:51 AM
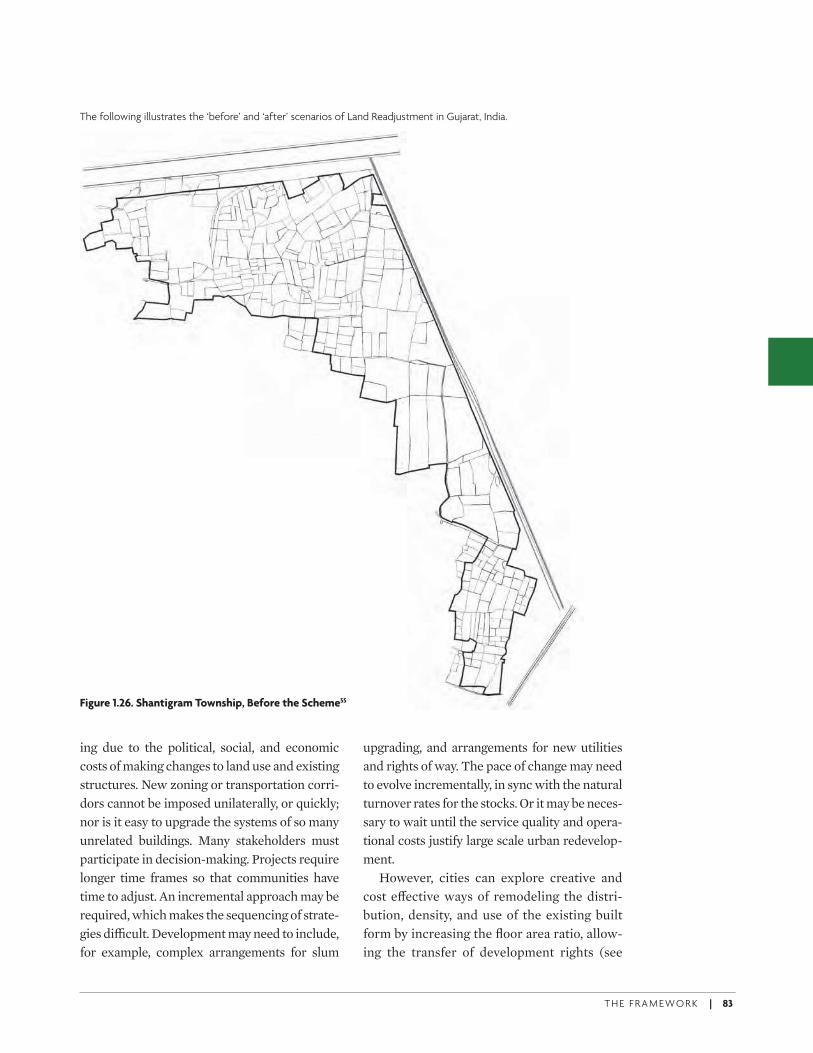
ing due to the political, social, and economic costs of making changes to land use and existing structures. New zoning or transportation corri-dors cannot be imposed unilaterally, or quickly; nor is it easy to upgrade the systems of so many unrelated buildings. Many stakeholders must participate in decision-making. Projects require longer time frames so that communities have time to adjust. An incremental approach may be required, which makes the sequencing of strate-gies di&cult. Development may need to include, for example, complex arrangements for slum
upgrading, and arrangements for new utilities and rights of way. The pace of change may need to evolve incrementally, in sync with the natural turnover rates for the stocks. Or it may be neces-sary to wait until the service quality and opera-tional costs justify large scale urban redevelop-ment.
However, cities can explore creative and cost e'ective ways of remodeling the distri-bution, density, and use of the existing built form by increasing the floor area ratio, allow-ing the transfer of development rights (see
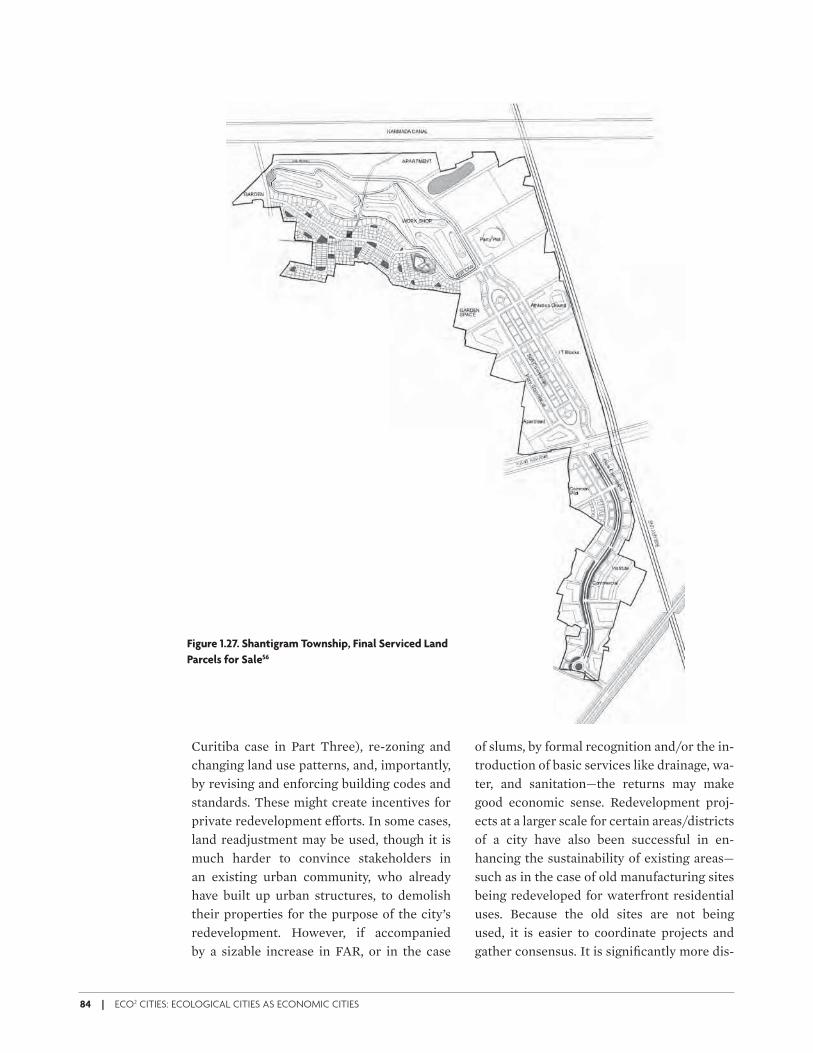
Curitiba case in Part Three), re-zoning and changing land use patterns, and, importantly, by revising and enforcing building codes and standards. These might create incentives for private redevelopment e&orts. In some cases, land readjustment may be used, though it is much harder to convince stakeholders in an existing urban community, who already have built up urban structures, to demolish their properties for the purpose of the city’s redevelopment. However, if accompanied by a sizable increase in FAR, or in the case
of slums, by formal recognition and/or the in-troduction of basic services like drainage, wa-ter, and sanitation—the returns may make good economic sense. Redevelopment proj-ects at a larger scale for certain areas/districts of a city have also been successful in en- hancing the sustainability of existing areas—such as in the case of old manufacturing sites being redeveloped for waterfront residential uses. Because the old sites are not being used, it is easier to coordinate projects and gather consensus. It is significantly more dis-
T H E F R A M E WO R K | 85
ruptive and unlikely to be able to redevelop existing residential neighbourhoods. In such cases, retrofi tting the existing structures is of-ten more realistic—or creating incentives as mentioned earlier by increasing FAR in ex-change for greater compliance with new re-source e6 cient constructions.
Stepping Stones towards the One-System Approach
Provide ‘just-in-time’ Training and
Capacity Building
The city leadership must arrange multiple op-portunities for local professionals to become comfortable with the One System approach. An Eco2 Catalyst Project, for example, provides a very concrete opportunity to train profes-sional sta9 in new procedures and methods. Ideally, the training occurs in a timely fashion, since new skills need to be immediately ap-plied or they are lost.
A special e9 ort is warranted to ensure the relevant institutions and people become well in-formed, supportive, and capable. Training can include invitations to local consultants and fi rms who can benefi t from exposure to the Catalyst Project and any new approaches. Without train-ing, these local experts may tend to obstruct projects and refuse support. Cultivating local expertise is an investment, and will ultimately determine what can be achieved city-wide, and possibly in other cities in the country.
A training program in the One-System Ap-proach can benefi t from a variety of Eco2 re-sources:
Other cities: Interested cities can access criti-cal expertise from Eco2 partner cities and agen-cies. It can be especially helpful to learn from other cities that have successfully implement-ed approaches and created the institutional frameworks for sustaining such e9 orts. This may include best practice cities, and also other cities engaged in an Eco2 Pathway.
Part Two, Methods: To apply the One System approach for design, analysis, formulation and implementation of options outlined in Chapter 5, it will be necessary to use the methods and tools in the City-Based DSS, in Part Two of this book. The full scope of integration options can be explored using methods and tools to develop and assess the performance of integrated solu-tions. Familiarity is particularly required with Material Flow Analysis and Overlay Mapping.
Part Three, Sector Notes and Case Studies:
The Sector Notes in the “Field Resource Guide” can provide more information on individual sectors with more specifi c and detailed ideas. The Case studies from Best Practice cities, also featured in the ‘Field Resource Guide,’ can in-troduce sta9 and consultants to examples of approaches in the real world – and reveal criti-cal lessons learned.
Conduct a Series of Preparatory Integrated
Design Workshops
Integrated design workshops create important opportunities for planners, designers, and en-gineers to come together and use new methods and information. The number and the scope of the workshops will vary with the situation. Sometimes, it is best to plan one or two short workshops to clarify goals, set targets, and share information among stakeholders. The di-rections and priorities can be refi ned, and aligned with the city’s shared planning frame-work. The framework (if already established) can be used within workshops to orient discus-sions or stimulate creative thinking on di9 er-ent topics, and then later to evaluate preferred strategies and actions. Workshops may also be warranted on analytical methods, producing, for example, a ‘business as usual’ scenario for benchmarking purposes. This scenario can in-clude Material Flow Analysis and Meta-dia-grams, overlay mapping, risk assessment, and other analytical exercises. Workshops can also be used to review and fi nalise a ‘Design Brief’ to prepare for more intensive design work.
ECo2-Part1REVd_PREP 85 6/15/09 8:22:53 AM
Explore Design Solutions, and Prepare a
Concept Plan for Review
An integrated design process should be used to generate alternative proposals for designing, constructing, and managing the project. An in-tensive, multi-day Urban Systems Design Charrette (discussed in Part Two of this book) is a tool that can facilitate the integrated design process, helping to generate creative and e9 ec-tive proposals in the shortest time. A well planned systems design Charrette can often produce a fi nal Concept Plan that is more than 90 percent complete. A Charrette that involves regulatory and management personnel can help to reveal what existing policies may need to be revised or removed to enable innovation. A design Charrette can benefi t the project indi-rectly by generating goodwill among stake-holders, and by helping experts to become fa-miliar with new concepts and technologies. The integrated design process should culmi-nate in a recommended Concept Plan for im-plementation, including any policy reforms.
Align Policy Tools among all Stakeholders
to ensure Successful Implementation
Use the procedures outlined in Chapter 5 to implement the project in an integrated fashion. This may help sequence investments, enable contributions from partners and residents, co-ordinate strategies among stakeholders, and align and target policies to match the planning framework. A collaborative exercise can help all interested parties explore how they can use complementary policy tools to help implement the Concept Plan and achieve the intended outcomes. A Strategic Action Plan can be pre-pared to clarify who is responsible for what tasks, and to show how policies interact. Where appropriate, a feasibility plan and a detailed master plan can be prepared with specifi ca-tions and guidelines for each element and for each phase of the work.
ECo2-Part1REVd_PREP 86 6/15/09 8:22:53 AM
T H E F R A M E WO R K | 87
An Investment Framework that Values Sustainability and Resiliency
CHAPTER 6
This chapter introduces the accounting method
and framework that are needed to understand
the full costs and benefi ts of projects and poli-
cies. It begins with an introduction to the ba-
sics of lifecycle costing for cities, and the poli-
cies and methods that make this possible. Next,
the chapter explores the need for an expanded
framework for economic accounting by Eco2
cities. The framework gives equal consider-
ation to di& erent categories of assets: manu-
factured capital, natural capital, social capital
and human capital. The chapter explores an
expanded framework for risk assessment that
incorporates foresight methods, including
long-term forecasts for all sectors, and a design
philosophy that increases the resiliency and
adaptive capacity of city lands and infrastruc-
ture. As before, the chapter concludes with
some suggestions for key actions or stepping
stones that might direct the city as it learns to
invest in sustainability and resiliency.
The Core Elements of Investing in Sustainability and Resiliency
Incorporation of Lifecycle Costing
Life cycle costing (LCC) is a decision support method that can help cities improve project cost/benefi t accounting measures and derive better estimates of the fi nancial and economic costs and benefi ts associated with any develop-ment project. As the term implies, life cycle costs include all the costs incurred by a project throughout its life cycle, including construc-tion, operation, maintenance, rehabilitation, disposal, and replacement.57 Part of the chal-lenge faced by all cities today is integrating cash fl ows over time. This includes optimizing capital and operating costs, ensuring adequate cash fl ows over the longer term, and recapital-izing investments so that funds are available for replacement of assets at the end of a proj-ect’s life cycle.
ECo2-Part1REVd_PREP 87 6/15/09 8:22:53 AM
88 | ECO2 CITIES: ECOLOGICAL CITIES AS ECONOMIC CITIES
LCC is especially important to the long-lived investments that are a large part of city infra-structure and land development. LCC is im-portant for decisions regarding:
• Fleets, decisive in determining new vehicle acquisitions;
• Infrastructure, especially relevant for wa-ter, transportation, and energy systems;
• Land use planning as it pertains to infra-structure costs;
• Civic buildings, relevant for premium e6 -ciency targets for new and existing stock; and
• Residential and commercial buildings.
LCC requires that a life expectancy and rate of deterioration be estimated for each type of as-set. It then becomes possible to quantify main-tenance and rehabilitation requirements. The maintenance of city infrastructure systems—pipes, facilities, pumps, and roads—can be ex-tremely costly, and can have signifi cant impact on the cash fl ow and fi nancial sustainability of any project. It also impacts the fi scal health of a city; in fact the lack of policies based on LCC has left many cities essentially bankrupt and unable to manage their assets.
Operating and maintenance costs for long-lived elements like buildings and pipelines can represent over 90 percent of lifecycle costs. The City of Hamilton in Canada estimated that initial construction accounts for only 8 percent of a civic building’s cost over its 30-40 year life, whereas operation and maintenance accounts for 92 percent. It is obviously dangerous to place too much emphasis on initial capital costs when making large public investments in city infrastructure and buildings. Nevertheless, it is still common worldwide for cities to have sep-arate capital and operating budgets, and to make investment decisions based on the initial capital investment costs without considering the net present value of future fl ows of associ-ated operations and maintenance costs. If, on the other hand, life cycle costs are well quanti-fi ed for a variety of development scenarios,
they can be minimized at both the design and implementation levels of land use and infra-structure planning.
LCC makes possible a more prudent and re-sponsible approach to long-term fi nancing of investments. The calculations can be fast, and comprehensive. For example, a new neighbour-hood development project can be analysed for a variety of densities and confi gurations, and then each scenario can be compared in terms of the capital and operating costs for utilities and ser-vices, including roads, water, sewer, garbage, schools, recreation facilities, public transit, pri-vate vehicle use, fi re protection, and policing. Interest rates for borrowing, tax rates, and ser-vice revenues can be calculated for di9 erent de-velopment plans and fi scal policies.
Lifecycle costs are typically annualized (converted into an annual cost) over a long pe-riod (75-years, in case of this neighbourhood construction project) allowing for operation, maintenance, and replacement of all utilities. All costs can be allocated on a per household ba-sis for residential developments, or normalised for standard o6 ce space.
Part Two includes details on how the LCC method can be applied to Eco2 cities, and in-cludes information on simple spreadsheet-based computer tools that can make LCC very easy and fast. The tools include a preset list of many life cycle cost categories that are worth considering for development projects, but that are typically ignored. All of the default values can be adjusted to match the historical costs for any specifi c country and community.
Included in Part Two is an example of how a LCC tool has helped the City of Fort St. John, Canada, to assess the potential costs and bene-fi ts of a proposed concept plan for demonstrat-ing a sustainable neighbourhood. A design workshop had proposed smaller lots, narrower streets, more tightly packed buildings, a greater diversity of building types, more public open space between buildings, and more integrated and multi-use designs of open spaces (includ-ing greenways, green infrastructure for storm
ECo2-Part1REVd_PREP 88 6/15/09 8:22:53 AM
T H E F R A M E WO R K | 89
water management, community gardens, all season pathways, and a large commons around a school and community centre). The proposed design represented a signifi cant departure from conventional neighbourhoods in the City. It was thus necessary to move beyond debate and opinion into a comprehensive analysis of costs and benefi ts.
Fort St. John compared the new approach to a base case scenario, modelled on adjacent ex-isting neighbourhoods. Capital costs were esti-mated and allocated to each household. Operat-ing costs were calculated, including those for water, roads, sewer, school transit, recreation fa-cilities, police, and fi re. In the fi nal analysis, the LCC assessment helped to clarify the potential gains from the new approach. Per household capital costs averaged US$35,000 less com-pared to the base case; annualized operating cost savings were estimated at US$6,053, a re-duction of more than 25 percent relative to the base case. Of course, the sustainable neighbour-hood plan had potential benefi ts unrelated to capital and operating costs, including improve-ments in liveability, streetscapes, social interac-tion, and amenities. However, the comprehen-sive fi nancial analysis helped to ‘win over’ the whole community, and provided the city coun-cil with a stronger argument for defending changes to standard practices. All politicians fi nd it easier to make the right decisions, and to stand strong in the face of vested interests or in-stitutional inertia, when provided with simple, transparent arguments for how alternatives can save taxpayers money, and reduce liabilities. This is an important role for life cycle costing.
Reserve Funding
One of the most e9 ective tools for sustainable fi nancing is a reserve fund. The concept behind a reserve fund is to set aside money incremen-tally and gradually, so that su6 cient funds are available for fi nancing upgrades and replace-ment at the end of a project’s life cycle. Not only does such an approach help to ensure the viability of an investment and it various com-
ponents, but it also avoids dumping huge liabil-ities and a potential fi nancial crisis onto future generations. Inadequate capitalization of in-frastructure systems also unfairly shifts main-tenance and replacement costs towards the end of a system’s life. Reserve funds make good economic and ethical sense.
The biggest challenge with reserve funds are keeping them truly reserved. Funds are subject to raids by those who see opportunities to spend the funds elsewhere. Consequently, reserve funds must be earmarked and legally protected.
A reserve fund is particularly necessary for non-revenue generating projects. It is impor-tant to keep an appropriate amount in reserve as determined by the overall investment plan. A larger reserve is not necessarily better, since the fund is exposed to infl ation risk. To reduce the amount of such a fund, it is desirable to pool similar assets, and, as far as possible, to keep the annual investment amount level.
How much is su6 cient for the reserve fund? In the case of the reserve fund for educational facilities of Tokyo Chuo ward, the fund covers the total investment cost, which will be re-quired in a few years. However, even if the fund does not cover the total required investment cost entirely, it could be considered su6 cient, if Chuo ward can mobilize additional funds from other sources. Important sources of ex-ternal funds for cities are issuance of municipal bonds and bank borrowings. In order to raise
Reserve Fund for School in Tokyo Chuo Ward
Like many other cities in Japan, Chuo ward, one of the 23 wards in Tokyo
Metropolitan Government, keeps a fund for maintenance, rehabilitation,
and replacement of school facilities. It sets aside annually an amount close
to the depreciation amount for its 16 elementary schools and four junior
high schools. The fund can be used only for the intended purposes, unless
the ward council agrees otherwise. As of the end of the fi scal year 2009,
the balance of the fund reached around Japanese Yen 10 billion (US$100
million), which is suffi cient to build three school buildings. Chuo ward
plans to replace three school buildings in a few years, under its long term
investment plan.
ECo2-Part1REVd_PREP 89 6/15/09 8:22:53 AM
90 | ECO2 CITIES: ECOLOGICAL CITIES AS ECONOMIC CITIES
these external funds in a timely manner, it is important for cities to manage the terms and amount of debt within their borrowing capac-ity. It is also important to level the investment requirement over long investment period through various ways so that annual capital funding requirements can be minimized. The lifecycle costing method provides a useful base for long term investment planning.
Equal Attention to All Capital Assets: an Expanded Framework for Accounting
A persistent challenge when accounting for the cost of urban development projects is the mea-surement and valuation of the many indirect benefi ts and costs. Economic analysis has evolved over the last few years in an attempt to get a better handle on these indirect costs, and to provide decision-makers with an assessment that more accurately refl ects the true, full costs
and benefi ts of any particular option. For exam-ple, cost benefi t analysis, the primary method for assessing economic viability, has been ex-panded to incorporate many indirect e9 ects into the monetary values. Cost e9 ectiveness, the oth-er standard method currently used for assessing the economic viability of a project, also has been expanding to examine some of the indirect ben-efi ts. Despite the e9 orts towards fuller cost and benefi t accounting, the reality is that most de-velopment projects proceed without a good un-derstanding of the real nature of the impacts on people, ecologies, and social systems. Many of the indirect costs of concern to communities cannot easily be measured or explained, nor can they be easily converted into credible monetary values. Techniques for converting impacts into monetary values have been debated for many years, and continue to seek for right solutions.
A more comprehensive economic analysis requires that more attention be given to envi-ronmental accounting as a separate, rigorous method. Every project needs a standard proto-col for assessing the environmental e9 ects by category, using well defi ned methods such as input output analysis, life cycle analysis, and materials fl ow analysis. One example of an ex-panded approach to quantifying impacts is the Environment Load Profi le (ELP) adopted in Hammarby Sjöstad, Stockholm (more details on ELP in Part Two). A separate set of indica-tors can be used to express each category of ef-fect in parallel with the economic analysis. Sometimes, the e9 ects can be added together to advantage: air quality, for example, is com-monly addressed in terms of an air quality in-dex that bundles together multiple factors like quantities of particles, organic compounds, and nitrogen oxides.
A number of techniques have been devel-oped for attempting to value a wider range of environmental and ecological e9 ects to arrive at one or several overarching measurement of natural capital. A notable example is the eco-logical footprint, which converts energy and material use into the total area of productive
Tokyo Waterworks. How to Finance US $10 Billion
Water Pipeline Replacement Project
Fees and charges are important elements for the revenue generating en-
terprises, such as water companies, when an appropriate level of reserve
fund is considered. The Tokyo Waterworks, serving 12.5 million people in
Metropolitan Tokyo, has been fi nancing operational expenses as well as
capital expenditures with water tariff revenues. Various reserve funds are
set aside to meet the fl uctuations of these costs. Currently, the Tokyo
Waterworks is facing a daunting task to replace its old existing water pipes,
starting in ten years time. The total investment is estimated at around
Japanese Yen 1 trillion (US$10 billion), which accounts for 40 percent of its
total assets of Japanese Yen 2.5 trillion (US$25 billion) at present value. To
meet this challenge, the Tokyo Waterworks started working to level this
Japanese Yen 1 trillion planned investment to the extent possible: (i) by
planning maintenance and rehabilitation well ahead of the project; and (ii)
by making a detailed plan for construction. In parallel with keeping annual
investment level, the Tokyo Waterworks already started accelerating debt
repayments so that the debt outstanding can be maintained at the current
debt level of Japanese Yen 0.5 trillion even after fi nancing the project.
Such accelerated repayments have been covered by revenues from the
water tariff, in spite of the fact the Tokyo Metropolitan Government low-
ered its water tariff on January 1, 2005. The Tokyo Waterworks intends to
achieve fi nancing a Japanese Yen 1 trillion replacement project within a
normal level of tariff adjustment.
ECo2-Part1REVd_PREP 90 6/15/09 8:22:54 AM
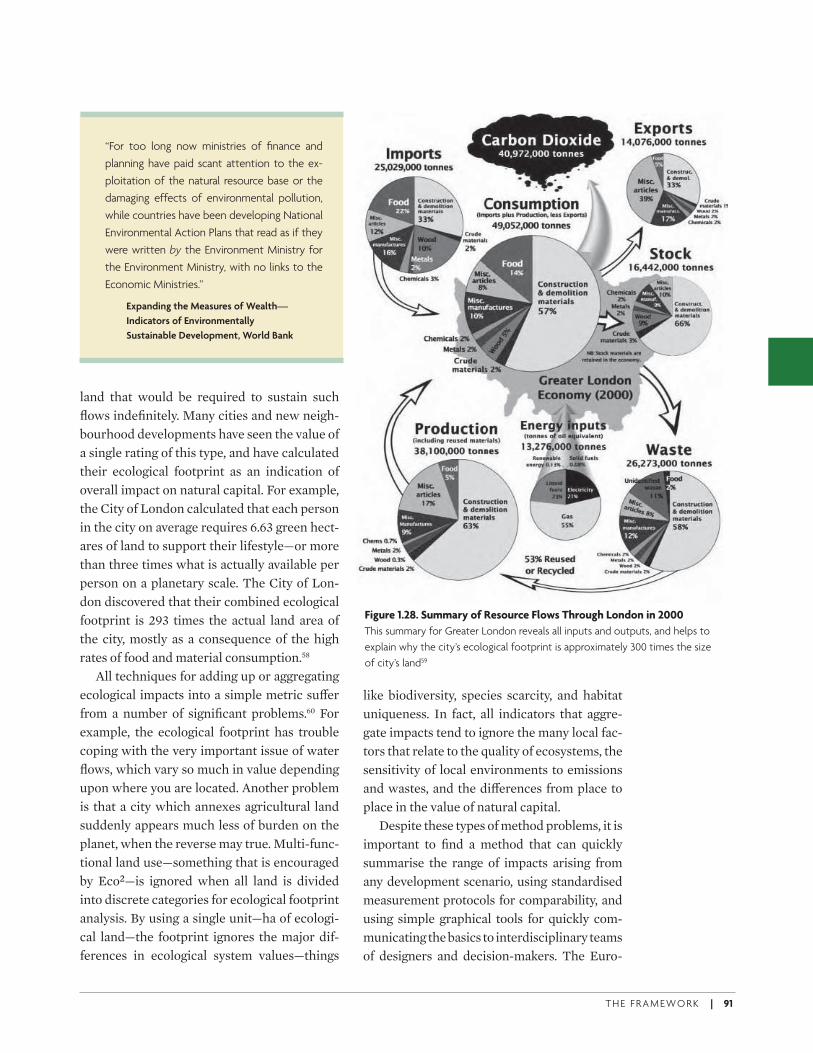
T H E F R A M E WO R K | 91
land that would be required to sustain such fl ows indefi nitely. Many cities and new neigh-bourhood developments have seen the value of a single rating of this type, and have calculated their ecological footprint as an indication of overall impact on natural capital. For example, the City of London calculated that each person in the city on average requires 6.63 green hect-ares of land to support their lifestyle—or more than three times what is actually available per person on a planetary scale. The City of Lon-don discovered that their combined ecological footprint is 293 times the actual land area of the city, mostly as a consequence of the high rates of food and material consumption.58
All techniques for adding up or aggregating ecological impacts into a simple metric su9 er from a number of signifi cant problems.60 For example, the ecological footprint has trouble coping with the very important issue of water fl ows, which vary so much in value depending upon where you are located. Another problem is that a city which annexes agricultural land suddenly appears much less of burden on the planet, when the reverse may true. Multi-func-tional land use—something that is encouraged by Eco2—is ignored when all land is divided into discrete categories for ecological footprint analysis. By using a single unit—ha of ecologi-cal land—the footprint ignores the major dif-ferences in ecological system values—things
like biodiversity, species scarcity, and habitat uniqueness. In fact, all indicators that aggre-gate impacts tend to ignore the many local fac-tors that relate to the quality of ecosystems, the sensitivity of local environments to emissions and wastes, and the di9 erences from place to place in the value of natural capital.
Despite these types of method problems, it is important to fi nd a method that can quickly summarise the range of impacts arising from any development scenario, using standardised measurement protocols for comparability, and using simple graphical tools for quickly com-municating the basics to interdisciplinary teams of designers and decision-makers. The Euro-
“For too long now ministries of fi nance and
planning have paid scant attention to the ex-
ploitation of the natural resource base or the
damaging effects of environmental pollution,
while countries have been developing National
Environmental Action Plans that read as if they
were written by the Environment Ministry for
the Environment Ministry, with no links to the
Economic Ministries.”
Expanding the Measures of Wealth—
Indicators of Environmentally
Sustainable Development, World Bank
Figure 1.28. Summary of Resource Flows Through London in 2000
This summary for Greater London reveals all inputs and outputs, and helps to
explain why the city’s ecological footprint is approximately 300 times the size
of city’s land59
ECo2-Part1REVd_PREP 91 6/15/09 8:22:54 AM
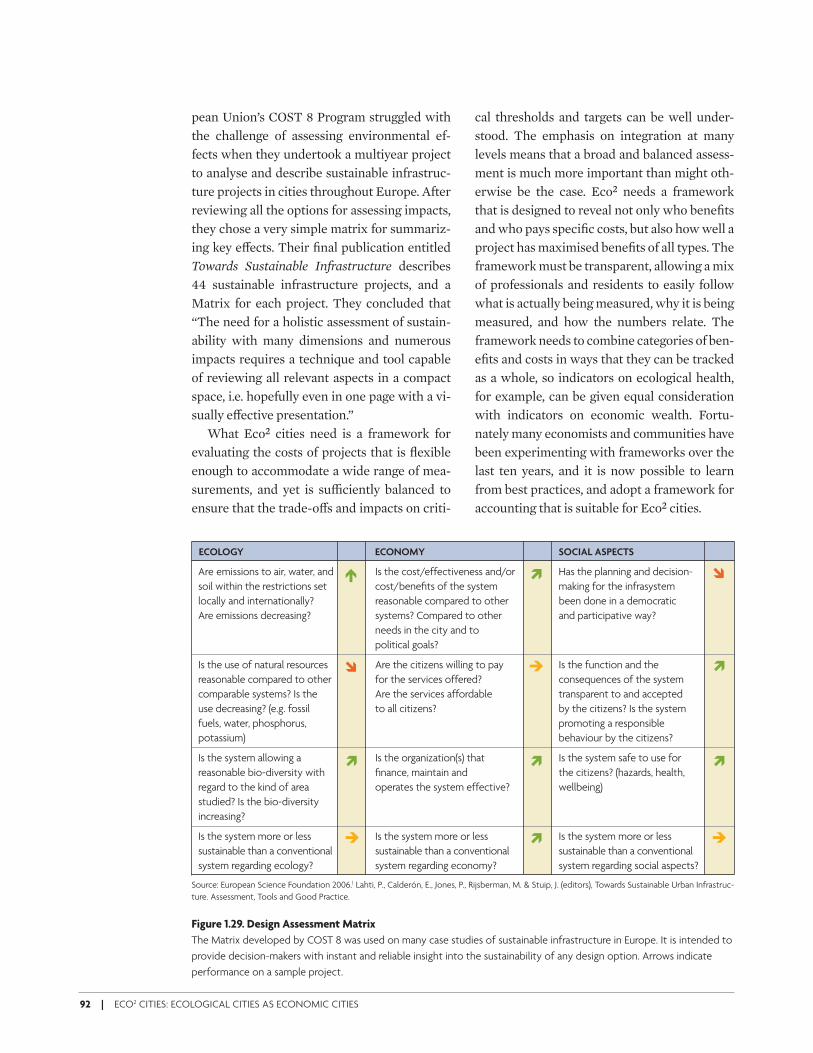
92 | ECO2 CITIES: ECOLOGICAL CITIES AS ECONOMIC CITIES
pean Union’s COST 8 Program struggled with the challenge of assessing environmental ef-fects when they undertook a multiyear project to analyse and describe sustainable infrastruc-ture projects in cities throughout Europe. After reviewing all the options for assessing impacts, they chose a very simple matrix for summariz-ing key e9 ects. Their fi nal publication entitled Towards Sustainable Infrastructure describes 44 sustainable infrastructure projects, and a Matrix for each project. They concluded that “The need for a holistic assessment of sustain-ability with many dimensions and numerous impacts requires a technique and tool capable of reviewing all relevant aspects in a compact space, i.e. hopefully even in one page with a vi-sually e9 ective presentation.”
What Eco2 cities need is a framework for evaluating the costs of projects that is fl exible enough to accommodate a wide range of mea-surements, and yet is su6 ciently balanced to ensure that the trade-o9 s and impacts on criti-
cal thresholds and targets can be well under-stood. The emphasis on integration at many levels means that a broad and balanced assess-ment is much more important than might oth-erwise be the case. Eco2 needs a framework that is designed to reveal not only who benefi ts and who pays specifi c costs, but also how well a project has maximised benefi ts of all types. The framework must be transparent, allowing a mix of professionals and residents to easily follow what is actually being measured, why it is being measured, and how the numbers relate. The framework needs to combine categories of ben-efi ts and costs in ways that they can be tracked as a whole, so indicators on ecological health, for example, can be given equal consideration with indicators on economic wealth. Fortu-nately many economists and communities have been experimenting with frameworks over the last ten years, and it is now possible to learn from best practices, and adopt a framework for accounting that is suitable for Eco2 cities.
ECOLOGY ECONOMY SOCIAL ASPECTS
Are emissions to air, water, and Is the cost/effectiveness and/or Has the planning and decision-
soil within the restrictions set cost/benefi ts of the system making for the infrasystem
locally and internationally? reasonable compared to other been done in a democratic
Are emissions decreasing? systems? Compared to other and participative way?
needs in the city and to
political goals?
Is the use of natural resources Are the citizens willing to pay Is the function and the
reasonable compared to other for the services offered? consequences of the system
comparable systems? Is the Are the services affordable transparent to and accepted
use decreasing? (e.g. fossil to all citizens? by the citizens? Is the system
fuels, water, phosphorus, promoting a responsible
potassium) behaviour by the citizens?
Is the system allowing a Is the organization(s) that Is the system safe to use for
reasonable bio-diversity with fi nance, maintain and the citizens? (hazards, health,
regard to the kind of area operates the system effective? wellbeing)
studied? Is the bio-diversity
increasing?
Is the system more or less Is the system more or less Is the system more or less
sustainable than a conventional sustainable than a conventional sustainable than a conventional
system regarding ecology? system regarding economy? system regarding social aspects?
Source: European Science Foundation 2006.l Lahti, P., Calderón, E., Jones, P., Rijsberman, M. & Stuip, J. (editors), Towards Sustainable Urban Infrastruc-
ture. Assessment, Tools and Good Practice.
Figure 1.29. Design Assessment Matrix
The Matrix developed by COST 8 was used on many case studies of sustainable infrastructure in Europe. It is intended to
provide decision-makers with instant and reliable insight into the sustainability of any design option. Arrows indicate
performance on a sample project.
! "
"" "
"
"
#
#
$
$
$
ECo2-Part1REVd_PREP 92 6/15/09 8:22:54 AM
T H E F R A M E WO R K | 93
Protecting and Enhancing Capital Assets
An appropriate method for use with Eco2 Cit-ies is the Four Capitals approach as outlined by Paul Ekins. This is a method that has evolved from a number of assessment tools that have been used in urban development, and that is fl exible enough to include any type of measure-ment, and yet well-balanced. It has been suc-cessfully used on a number of sustainable plan-ning projects in European countries.
Most economic analysis incorporates an in-ventory and valuation of capital assets; howev-er the focus is primarily on manufactured goods and systems that produce or facilitate the delivery of goods and services. This kind of capital is referred to as ‘manufactured capital,’ and includes the hard infrastructure of cities.
The four capitals method begins by recognis-ing that benefi ts can fl ow from many other sources than manufactured capital. We need to account for the quality of labour (human capi-tal), the networks through which labour is or-ganised and which create the context for eco-nomic activity (social capital), and the natural resources and ecological systems which provide inputs into the economic process and maintain life on earth (natural capital). A more detailed defi nition of these four capitals, as provided by Paul Ekins and James Medhurst in 2003, is quoted below. 62
“Manufactured Capital (or human-made) cap-ital is what is traditionally considered as capital: produced assets that are used to produce other goods and services. Some examples are ma-chines, tools, buildings, and infrastructure.
Natural Capital: In addition to traditional nat-ural resources, such as timber, water, energy, and mineral reserves, natural capital includes natural assets that are not easily valued mone-tarily, such as biodiversity, endangered species, and the ecological services provided by healthy ecosystems (e.g., air and water fi ltration). Nat-ural capital can be considered as components of nature that can be linked directly or indi-rectly to human welfare.
Social Capital: Social capital, like human capi-tal, is related to human wellbeing, but on a so-cietal rather than individual level. It consists of the social networks that support an e6 cient, cohesive society, and facilitate social and intel-lectual interactions among its members. Social capital refers to those stocks of social trust, norms, and networks that people can draw upon to solve common problems and create so-cial cohesion. Examples of social capital in-clude neighbourhood associations, civic orga-nizations, and co-operatives. The political and legal structures that promote political stability, democracy, government e6 ciency, and social justice (all of which are good for productivity as well as being desirable in themselves) are also part of social capital.
Human (Cultural) Capital: Human capital generally refers to the health, wellbeing, and productive potential of individual people. Types of human capital include mental and physical health, education, motivation, and work skills. These elements not only contrib-ute to a happy, healthy society, but also improve the opportunities for economic development through a productive workforce.”
All four types of capital are defi ned and identifi ed through the fl ow of benefi ts they provide. Sustainable development is mostly about how to maintain or increase the four capitals so that the fl ow of benefi ts is sustained indefi nitely. Some trade-o9 s may be consid-ered acceptable—for example, a reduction in the net area of ecological systems may be o9 set by increases to the net productivity of ecolo-gies resulting from good design and manage-ment practices. However, many systems, like ecologies, and assets require critical thresholds to be respected or the system begins to break down. For example, smaller green spaces may be more productive, but they may fail to pro-vide su6 cient habitat space for some species and, as a result, biodiversity declines.
The four capitals method is good choice for Eco2 Cities because:
ECo2-Part1REVd_PREP 93 6/15/09 8:22:54 AM
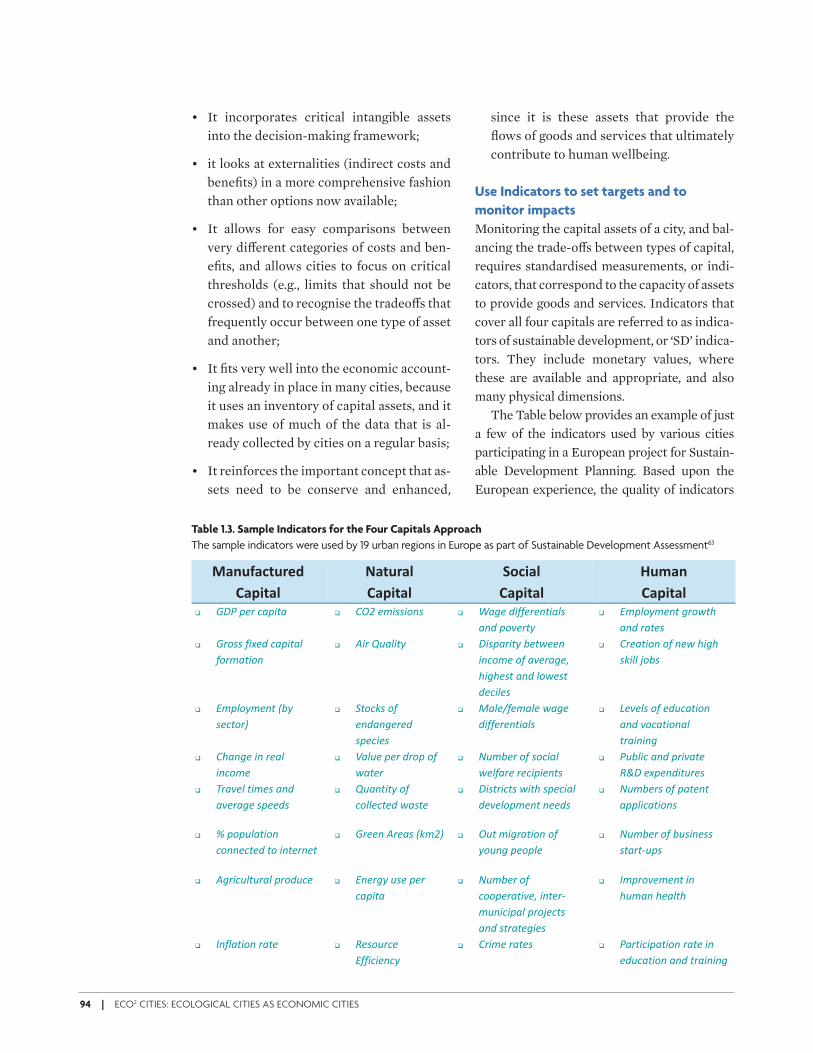
94 | ECO2 CITIES: ECOLOGICAL CITIES AS ECONOMIC CITIES
• It incorporates critical intangible assets into the decision-making framework;
• it looks at externalities (indirect costs and benefi ts) in a more comprehensive fashion than other options now available;
• It allows for easy comparisons between very di9 erent categories of costs and ben-efi ts, and allows cities to focus on critical thresholds (e.g., limits that should not be crossed) and to recognise the tradeo9 s that frequently occur between one type of asset and another;
• It fi ts very well into the economic account-ing already in place in many cities, because it uses an inventory of capital assets, and it makes use of much of the data that is al-ready collected by cities on a regular basis;
• It reinforces the important concept that as-sets need to be conserve and enhanced,
since it is these assets that provide the fl ows of goods and services that ultimately contribute to human wellbeing.
Use Indicators to set targets and to
monitor impacts
Monitoring the capital assets of a city, and bal-ancing the trade-o9 s between types of capital, requires standardised measurements, or indi-cators, that correspond to the capacity of assets to provide goods and services. Indicators that cover all four capitals are referred to as indica-tors of sustainable development, or ‘SD’ indica-tors. They include monetary values, where these are available and appropriate, and also many physical dimensions.
The Table below provides an example of just a few of the indicators used by various cities participating in a European project for Sustain-able Development Planning. Based upon the European experience, the quality of indicators
Table 1.3. Sample Indicators for the Four Capitals Approach
The sample indicators were used by 19 urban regions in Europe as part of Sustainable Development Assessment63
!"#$%"&'$()*+
,"-.'"/
0"'$("/+
,"-.'"/
12&."/+
,"-.'"/
3$4"#+
,"-.'"/
! !"#$%&'$()%*+) ! ,-.$&/*00*120 ! 3)4&$5*66&'&2+*)70$ ! 8/%719/&2+$4'1:+;$
)25$%1<&'+9 )25$')+&0
! !'100$6*=&5$()%*+)7$
61'/)+*12
! >*'$?@)7*+9 ! "*0%)'*+9$A&+:&&2$
*2(1/&$16$)<&')4&B$
;*4;&0+ )25 71:&0+
! ,'&)+*12$16$2&:$;*4;$
0C*77$D1A0
;*4;&0+$)25$71:&0+$
5&(*7&0
! 8/%719/&2+$EA9$
0&(+1'F
! G+1(C0$16$
&25)24&'&5$
*
! H)7&I6&/)7&$:)4&$
5*66&'&2+*)70
! J&<&70$16$&5@()+*12$
)25$<1()+*12)7$
+ * *0%&(*&0 +')*2*24
! ,;)24&$*2$'&)7$
*2(1/&
! K)7@&$%&'$5'1%$16$
:)+&'
! L@/A&'$16$01(*)7$
:&76)'&$'&(*%*&2+0
! #@A7*($)25$%'*<)+&$
MN"$&=%&25*+@'&0
! O')<&7$+*/&0$)25$ ! ?@)2+*+9$16$ ! "*0+'*(+0$:*+;$0%&(*)7$ ! L@/A&'0$16$%)+&2+$
)<&')4&$0%&&50 (177&(+&5$:)0+& 5&<&71%/&2+$2&&50 )%%7*()+*120
! P$%1%@7)+*12$
(122&(+&5$+1$*2+&'2&+
! !'&&2$>'&)0$EC/.F ! -@+$/*4')+*12$16$
91@24$%&1%7&
! L@/A&'$16$A@0*2&00$
0+)'+Q@%0
! >4'*(@7+@')7$%'15@(& ! 82&'49$@0&$%&'$
()%*+)
! L@/A&'$16$
(11%&')+*<&B$*2+&'Q
/@2*(*%)7$%'1D&(+0$
! R/%'1<&/&2+$*2$
;@/)2$;&)7+;
)25$0+')+&4*&0
! R267)+*12$')+& ! M&01@'(&$
866*(*&2(9$
! ,'*/&$')+&0 ! #)'+*(*%)+*12$')+&$*2$
&5@()+*12$)25$+')*2*24
ECo2-Part1REVd_PREP 94 6/15/09 8:22:54 AM
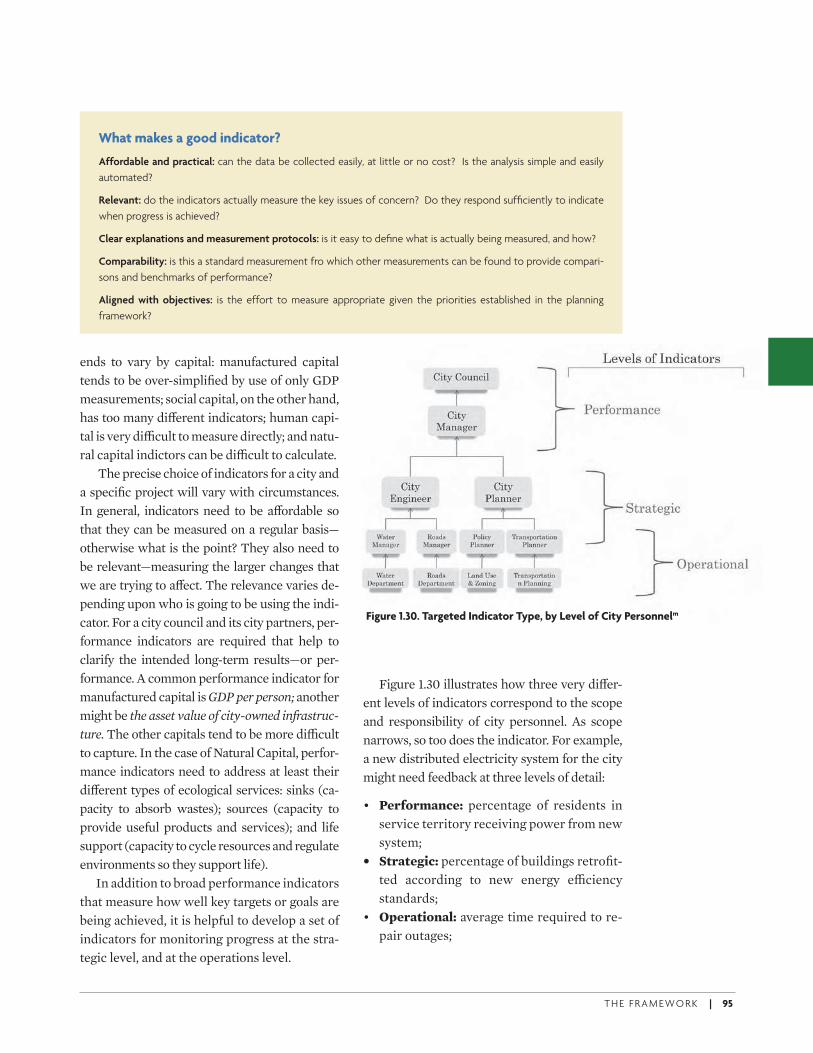
T H E F R A M E WO R K | 95
ends to vary by capital: manufactured capital tends to be over-simplifi ed by use of only GDP measurements; social capital, on the other hand, has too many di9 erent indicators; human capi-tal is very di6 cult to measure directly; and natu-ral capital indictors can be di6 cult to calculate.
The precise choice of indicators for a city and a specifi c project will vary with circumstances. In general, indicators need to be a9 ordable so that they can be measured on a regular basis—otherwise what is the point? They also need to be relevant—measuring the larger changes that we are trying to a9 ect. The relevance varies de-pending upon who is going to be using the indi-cator. For a city council and its city partners, per-formance indicators are required that help to clarify the intended long-term results—or per-formance. A common performance indicator for manufactured capital is GDP per person; another might be the asset value of city-owned infrastruc-ture. The other capitals tend to be more di6 cult to capture. In the case of Natural Capital, perfor-mance indicators need to address at least their di9 erent types of ecological services: sinks (ca-pacity to absorb wastes); sources (capacity to provide useful products and services); and life support (capacity to cycle resources and regulate environments so they support life).
In addition to broad performance indicators that measure how well key targets or goals are being achieved, it is helpful to develop a set of indicators for monitoring progress at the stra-tegic level, and at the operations level.
Figure 1.30 illustrates how three very di9 er-ent levels of indicators correspond to the scope and responsibility of city personnel. As scope narrows, so too does the indicator. For example, a new distributed electricity system for the city might need feedback at three levels of detail:
• Performance: percentage of residents in service territory receiving power from new system;
• Strategic: percentage of buildings retrofi t-ted according to new energy e6 ciency standards;
• Operational: average time required to re-pair outages;
What makes a good indicator?
Affordable and practical: can the data be collected easily, at little or no cost? Is the analysis simple and easily
automated?
Relevant: do the indicators actually measure the key issues of concern? Do they respond suffi ciently to indicate
when progress is achieved?
Clear explanations and measurement protocols: is it easy to defi ne what is actually being measured, and how?
Comparability: is this a standard measurement fro which other measurements can be found to provide compari-
sons and benchmarks of performance?
Aligned with objectives: is the effort to measure appropriate given the priorities established in the planning
framework?
Figure 1.30. Targeted Indicator Type, by Level of City Personnelm
ECo2-Part1REVd_PREP 95 6/15/09 8:22:54 AM
96 | ECO2 CITIES: ECOLOGICAL CITIES AS ECONOMIC CITIES
Each project may require a family of indica-tors, because decision-makers will be interest-ed in di9 erent time frames and levels of detail.
Proactive Risk Management for All Threats
Standard practice for fi nancial risk manage-ment involves an analysis of any investment in terms sensitivity to changes in the key factors used for determining costs and benefi ts. Each factor has a certain probability of changing over time, with consequences on the fi nancial bottom line. This assessment of risk based upon known probabilities for change in the di-rect economic factors is referred to as sensitiv-ity analysis. It is the principle risk assessment method for urban development projects, and it is an important and necessary part of due dili-gence. If a 15 percent drop in ridership is su6 -cient to undermine the fi nancial viability of a new transit system, city leaders will want to know the odds of such an occurrence. Sensitiv-ity analysis is not a replacement for good judge-ment, but is it a good way to educate decision-makers about what variables might undermine the critical viability of an investment. The oth-er well-known method for risk assessment is a Monte Carlo assessment, which expands the analysis to include the possible correlations between changing variables—essentially by making many random changes to variables in combination.
What is missing from these standard risk as-sessment methods is the many indirect, di6 -cult to measure risks that threaten the viability of an investment. Also missing are an assess-ment of uncertainties—the factors which sim-ply cannot be assessed statistically, but which nevertheless represent signifi cant threats. In a similar fashion to economic analysis, the risk assessment needs to be coupled with methods that expand the scope of what is examined and rated. In reality, cities today face many threats and hazards that are largely external to the fi -nancial calculations, but that can nevertheless
impact the viability of projects. These include sudden disruptions to systems such as natural disasters (earthquakes, hurricanes, tsunamis, etc.) and the possibility of rapid socio-econom-ic-environmental change such as the recent global fi nancial crisis. Over the next 30 years, for example, it is highly likely that we will wit-ness fundamental changes in energy, communi-cation, transportation technologies, climate, de-mographics, global markets, environmental regulations, the probable onset of epidemics, and the availability of critical resources like wa-ter, food, and fossil fuels. Thirty years is the blink of an eye for a city. The infrastructure invest-ments planned for the near future will need to perform for much longer than 30 years. But will they? How can Eco2 cities assess and improve the overall resiliency of development projects?
Expanding risk assessment to include
resiliency and adaptive capacity
Resiliency is a concept that is traditionally used to describe two characteristics: the robustness of a system—i.e. its ability to continue to per-form by resisting changing conditions, and the adaptability of a system—i.e. its ability to con-tinue to perform by responding appropriately to changing conditions. Resiliency can be used as a potential design criterion for all urban sys-tems including built infrastructure, culture, and governance.
The basic idea is that it is possible to better manage risk by forecasting the impacts of ex-ternal forces on urban areas, and by designing and operating urban land uses and infrastruc-ture in ways that are inherently more resilient. This means including in any assessment indi-cators that help designers, managers, and deci-sion-makers understand the relative capacity of systems to survive and recover from shocks and rapid change. The World Bank’s primer on Climate Resilient Cities, provides information on how cities can better access and manage the risks associated with climate change.
Elements of resilient design appear to rein-force a number of the ecological design strate-
ECo2-Part1REVd_PREP 96 6/15/09 8:22:55 AM
T H E F R A M E WO R K | 97
gies that are so e9 ective at improving e6 cien-cy. Remote generating plants, incinerators, treatment plants, and communications facilities are far more vulnerable to catastrophic failure than a network of modular, distributed systems closely integrated into the fabric of the city. Thus, urban security helps to reinforce distrib-uted systems—a design strategy already pro-posed as a way to improve urban resource e6 -ciency and environmental sustainability. The positive synergy between security and e6 ciency (or resiliency and sustainability) is an important outcome for integrated design solutions.
One measurement of resiliency might be redundancy—a strategy mentioned in the pre-vious chapter as an example of ecological de-sign. Redundancy for urban systems may mean that critical resources are supplied by a variety of systems, each capable of drawing resources from as wide a geographic area as possible. In the eventuality that droughts, fl oods, or other disasters a9 ect any one area, an alternative source of supply is already in place to meet at least minimum requirements. For each type of critical resource, the region may develop re-dundancy through a diversity of supply op-tions, or through a contingency plan. Redun-dancy may also need to consider the entire supply chain for each critical system, all the way back to the ecological resource. Redun-dancy can then be provided for the weakest links in the chain. Links are the processes or ‘nodes’ that provide essential services, wher-ever they are located. When we discover nodes that are essential, but not duplicated elsewhere in the system, we have found a weak link.
Redundancy and self-reliance work on dif-ferent scales. Even links within the region can benefi t from contingencies. For energy sys-tems, for example, this may mean a mix of sources, some local and some renewable. For potable water, this may mean distributed res-ervoirs and multiple sources of water.
Localized and distributed infrastructure systems may be more fl exible and responsive in the face of external threats. To the extent
that systems are self-organizing, they do not require lots of external regulation or direction in order to function or adapt to opportunities or constraints. Such systems can operate by a set of rules, similar to the market place, rather than a mechanistic, top down approach that imposes a fi nal solution from start to fi nish.
—Adaptability and durability
Adaptability can be broken down into a num-ber of simple strategies that are familiar to most engineers and designers:
- fl exibility or enabling minor shifts in how systems function or spaces are used;
- convertibility, or allowing for changes in use for parcels of land or buildings, or changes in inputs for infrastructure sys-tems; and
- expandability, or facilitating additions (or deletions) to the quantity of land or space dedicated to particular uses.
Infrastructure that is designed to adapt easily, at a low cost, is likely both to survive longer, and to operate more e6 ciently throughout its lifetime. An example might be combined trenching (utilidors) that allow easy access to pipes and wires.
Durability is a concept that can further ex-tend the useful lifetime of materials and tech-nology, and is complimentary to adaptability. In practice, adaptability and durability can be achieved through changes in design, and through the use of alternative zoning, materi-als, and technologies. For high performance, adaptable designs might begin with the concept of a fi xed investment cost. The object is then to achieve maximum durability by means of fl exi-bility and adaptable design features, while at the same time minimising the running costs for energy, cleaning, maintenance, and operation. Part of a durable design strategy may be to set minimums: for example no secondary compo-nents that last less than 30 years. In other cases, the solution may be to minimise maintenance and service costs for components.
ECo2-Part1REVd_PREP 97 6/15/09 8:22:55 AM
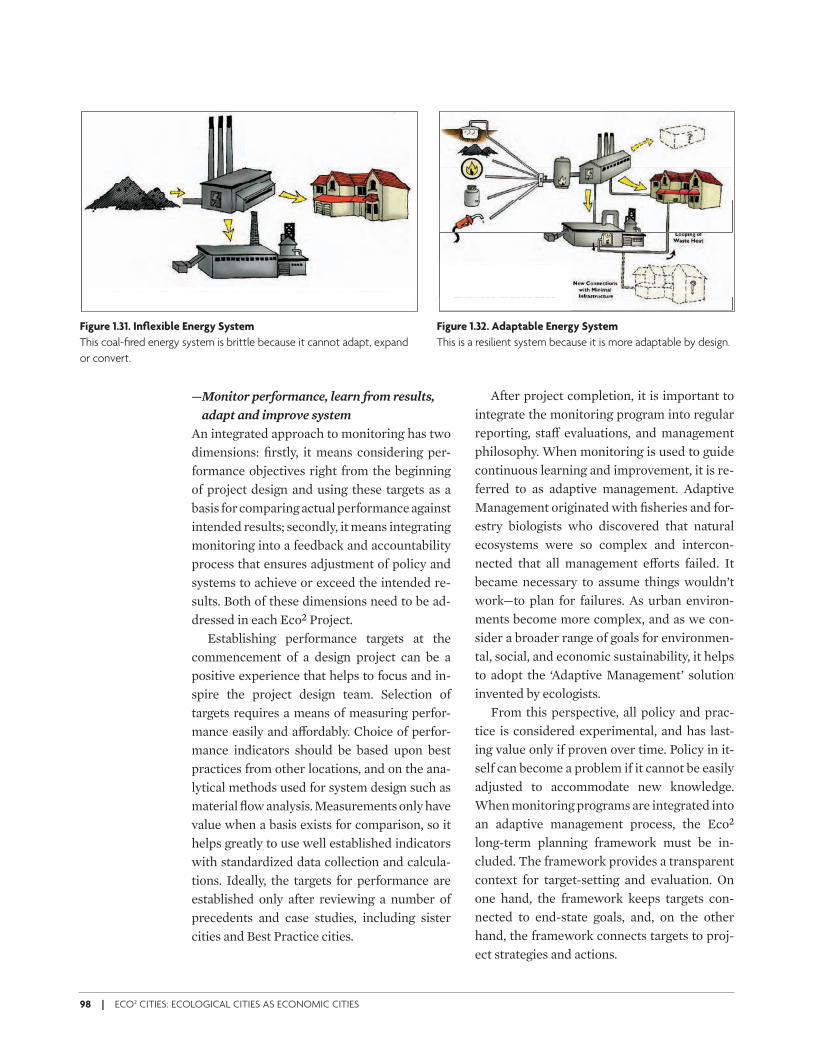
98 | ECO2 CITIES: ECOLOGICAL CITIES AS ECONOMIC CITIES
— Monitor performance, learn from results,
adapt and improve system
An integrated approach to monitoring has two dimensions: fi rstly, it means considering per-formance objectives right from the beginning of project design and using these targets as a basis for comparing actual performance against intended results; secondly, it means integrating monitoring into a feedback and accountability process that ensures adjustment of policy and systems to achieve or exceed the intended re-sults. Both of these dimensions need to be ad-dressed in each Eco2 Project.
Establishing performance targets at the commencement of a design project can be a positive experience that helps to focus and in-spire the project design team. Selection of targets requires a means of measuring perfor-mance easily and a9 ordably. Choice of perfor-mance indicators should be based upon best practices from other locations, and on the ana-lytical methods used for system design such as material fl ow analysis. Measurements only have value when a basis exists for comparison, so it helps greatly to use well established indicators with standardized data collection and calcula-tions. Ideally, the targets for performance are established only after reviewing a number of precedents and case studies, including sister cities and Best Practice cities.
After project completion, it is important to integrate the monitoring program into regular reporting, sta9 evaluations, and management philosophy. When monitoring is used to guide continuous learning and improvement, it is re-ferred to as adaptive management. Adaptive Management originated with fi sheries and for-estry biologists who discovered that natural ecosystems were so complex and intercon-nected that all management e9 orts failed. It became necessary to assume things wouldn’t work—to plan for failures. As urban environ-ments become more complex, and as we con-sider a broader range of goals for environmen-tal, social, and economic sustainability, it helps to adopt the ‘Adaptive Management’ solution invented by ecologists.
From this perspective, all policy and prac-tice is considered experimental, and has last-ing value only if proven over time. Policy in it-self can become a problem if it cannot be easily adjusted to accommodate new knowledge. When monitoring programs are integrated into an adaptive management process, the Eco2 long-term planning framework must be in-cluded. The framework provides a transparent context for target-setting and evaluation. On one hand, the framework keeps targets con-nected to end-state goals, and, on the other hand, the framework connects targets to proj-ect strategies and actions.
Figure 1.31. Infl exible Energy System
This coal-fi red energy system is brittle because it cannot adapt, expand
or convert.
Figure 1.32. Adaptable Energy System
This is a resilient system because it is more adaptable by design.
ECo2-Part1REVd_PREP 98 6/15/09 8:22:55 AM
T H E F R A M E WO R K | 99
Stepping Stones for Investing in Sustainability and Resiliency
Use the Life Cycle Costing method to
better understand costs and cash fl ows
An Eco2 Catalyst Project is an opportunity to make LCC a standard part of project planning. Every city can develop this capacity. Suitable methods and tools are introduced in Part Two of this book.
Develop and adopt indicators for assessing
the four capitals, and for benchmarking
performance
Indicators can be selected from lists provided by knowledge institutions and industry coali-tions. A good place to start is the long list of SD indicators used by cities in OECD countries or progressive cities in developing countries. Choices need to be guided by the selection crite-ria listed earlier. An indicator is not successful unless it is regularly measured and reported.
Forecast the impacts of plausible changes
Forecast the impacts of plausible changes in climate, markets, resource availability, demo-graphics, and technology. Forecasting the im-pact of external forces can help begin the pro-cess of proactively incorporating resiliency and adaptive capacity to better manage risks. Fore-sight workshops can assist in clarifying the various cause and e9 ect chains that can lead to signifi cant impacts on di9 erent urban infra-structure systems and the city as a whole. Some of the external forces that can be examined through such workshops—in addition to cli-mate change—include: changes in global mar-kets, resource availability, demographics, and technology. These are discussed in Part Two.
The World Bank’s primer on Resiliency and Climate Change is a good starting point for un-derstanding climate-related risks.
Implement an Eco² Catalyst Project, in
ways that protect and enhance capital
assets, and reduce vulnerabilities
The best way to learn the Eco2 accounting methods in practice is on an Eco2 catalyst proj-ect. This will require a multi-criteria assess-ment of projects, using the methods and tools described in Part Two of this book. Generally, what is needed is to develop a base case scenar-io—using business as usual assumptions, and then use this base case as a benchmark for evaluating any alternatives that have been pro-posed during the project design exercises. Eventually, the accounting methods should provide a sound basis for making recommen-dations on the preferred investment strategy.
Monitor and feedback results, then learn
and adapt to improve performance
Monitoring requires a set of indicators adapted to the city and project and budget. What is most important is that indicators are actually reported over time. This means a budget allo-cation for data collection, analysis, and publi-cation. The collection of measurements over time adds strength to the process of urban de-velopment. The feedback on key indicators makes it easy to see trends and patterns, edu-cate decision-makers of how well the city is do-ing, provide benchmarks, set targets for up-grading future projects, and provide a solid basis for employee and contractor accountabil-ity. The key to evaluation and learning is con-sistency and perseverance.
ECo2-Part1REVd_PREP 99 6/15/09 8:22:58 AM

ECo2-Part1REVd_PREP 100 6/15/09 8:22:58 AM
T H E F R A M E WO R K | 101
Moving Forward Together
CHAPTER 7
The Eco2 Cities program is a collaborative ex-
ercise that requires close working relationships
among all stakeholders and a willingness to
consider and to apply new concepts and meth-
ods together. Of course, cities are in the driver’s
seat. This book is designed to explain the key
principles of Eco2, how they translate into core
elements and stepping stones, and to provide
cities with the methods and tools—all of which
will enable them to develop their own Eco2
pathway. As explained at the beginning of this
book, the opportunities for positive changes
are especially great at present. We strongly en-
courage cities to take their fi rst step towards
ecological and economic sustainability, while
the window of opportunity to make lasting im-
pact is still open.
For forward-looking cities in developing
countries which intend to adopt Eco2 approach,
possible support is available from best practice
cities worldwide, the international community,
including donor agencies, and academia. Cities
are encouraged to tap the unique resources of
each of these partners. In this context, the
World Bank Group64 together with other part-
ners is in a position to provide: 1) Technical As-
sistance and Capacity Building; and 2) Finan-
cial Support to cities that demonstrate strong
commitment to implement the Eco2 program.
Knowledge Sharing, Technical Assistance, and Capacity Building
One of the most e9 ective methods of knowl-edge sharing, technical assistance, and capacity building is peer to peer engagement with best practice cities. It is conceivable that such en-gagement could be supported through donor funding. At the same time, the international community has a wide range of programs that provide technical assistance and capacity building. Academic institutions can be engaged in the process: for instance, the Environment Load Profi le tool which was used in Stockholm was jointly developed by the City of Stockholm, The Royal Institute of Technology, and a pri-vate fi rm Grontmij. Other options for technical
ECo2-Part1REVd_PREP 101 6/15/09 8:22:58 AM
102 | ECO2 CITIES: ECOLOGICAL CITIES AS ECONOMIC CITIES
assistance include the World Bank Group’s technical assistance and capacity building sup-port, which can be made available to cities ei-ther through a catalyst project, or through stand alone funding.
Technical assistance and capacity building can provide support to cities on many stepping stones of their Eco2 pathway. They can also help with a more detailed application of the core methods and tools. Some examples of pos-sible support include: 1) adapting Eco2 to suit a city’s unique demands and priorities; 2) con-ducting diagnostic analysis using the Eco2 methods and tools; 3) developing Eco2 path-ways and plans (including investment and fi -nancial plans, to materialize the vision and strategies); 4) enhancing institutional capaci-ties to implement Eco2 projects, with particu-lar attention to the key principles; 5) equipping local institutions with the technical require-ments (GIS for instance) to use of Eco2 meth-ods and tools; 6) designing a national strategy to institutionalize the Eco2 program through a national fi nancing mechanism ; 7) implement-ing an integrated design workshop or a fore-casting workshop; and 8) focused study tours or secondment opportunities in Eco2 best prac-tice cities.
Ultimately knowledge sharing, technical as-sistance, and capacity building agendas will be based on the specifi c needs of each city.
Financial Resources
In general, cities can access a range of fi nancial resources from the international community and donor agencies. Many of these fi nancial re-sources can be used to fund the many options of technical assistance outlined earlier. Larger donor agencies like the Multilateral Develop-ment Banks (The World Bank, The Asian De-velopment Bank, etc.) may also provide fi nan-cial resources for infrastructure investment under Eco2 projects. What is most important from an Eco2 perspective is that the number
and diversity of fi nancing tools are increasing, and that it is possible to combine such instru-ments to fi t the di9 erent dimensions or phases of an Eco2 project. For instance, let’s consider the case of the World Bank.
In most cases, cities seeking fi nancial sup-port from the World Bank Group need to sub-mit their requests through their respective na-tional governments to ensure that the provision of limited loans, credits, or grants is consistent with national priorities and strategies.65 The World Bank Group has diversifi ed fi nancial tools that can be used in combination to fi nance Eco2 projects, which are mentioned below along with other donor fi nancial instruments. Unlike a conventional ‘one project’ fi nancial instrument approach, the World Bank Group could package these instruments to facilitate an integrated approach that is critical to the success of the Eco2 program, and to the success of specifi c investment projects.
1) Development Policy Loans (DPLs) provide quick-disbursing fi nancing to support poli-cy and institutional reforms at both nation-al and sub-national government levels.
2) Specifi c Investment Loans (SILs) fi nance a broad range of specifi c infrastructure in-vestments (water supply, wastewater man-agement, power generation and distribu-tion, solid waste management, roads, public transport, etc.).
3) If policy and regulatory reform leads to sig-nifi cant reduction of GHG emissions in specifi c components based on the Carbon Development Mechanism (CDM) method-ology, or if direct investments do the same (for instance, through solid waste manage-ment), then the World Bank’s Carbon Fi-nance Unit can enable the purchase of emission reductions. This can increase the bankability of projects by adding an addi-tional hard revenue stream.
4) The International Finance Corporation, also part of the World Bank Group, can
ECo2-Part1REVd_PREP 102 6/15/09 8:22:58 AM
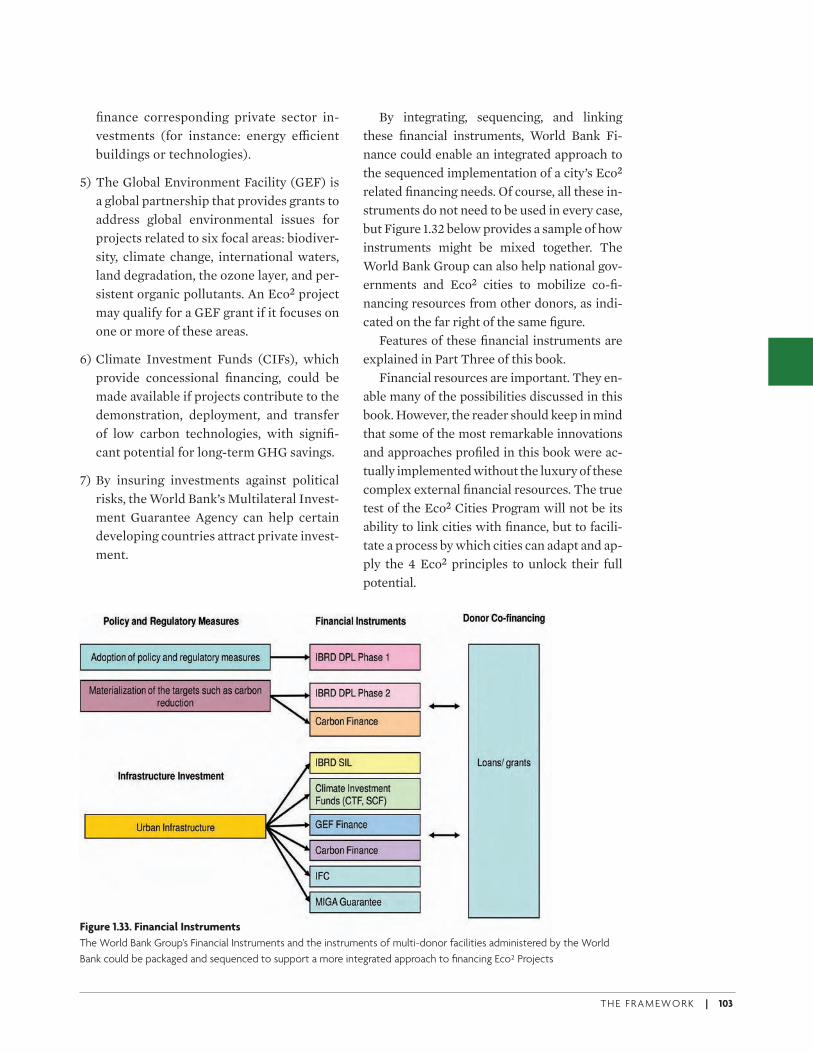
T H E F R A M E WO R K | 103
fi nance corresponding private sector in-vestments (for instance: energy e6 cient buildings or technologies).
5) The Global Environment Facility (GEF) is a global partnership that provides grants to address global environmental issues for projects related to six focal areas: biodiver-sity, climate change, international waters, land degradation, the ozone layer, and per-sistent organic pollutants. An Eco2 project may qualify for a GEF grant if it focuses on one or more of these areas.
6) Climate Investment Funds (CIFs), which provide concessional fi nancing, could be made available if projects contribute to the demonstration, deployment, and transfer of low carbon technologies, with signifi -cant potential for long-term GHG savings.
7) By insuring investments against political risks, the World Bank’s Multilateral Invest-ment Guarantee Agency can help certain developing countries attract private invest-ment.
By integrating, sequencing, and linking these fi nancial instruments, World Bank Fi-nance could enable an integrated approach to the sequenced implementation of a city’s Eco2 related fi nancing needs. Of course, all these in-struments do not need to be used in every case, but Figure 1.32 below provides a sample of how instruments might be mixed together. The World Bank Group can also help national gov-ernments and Eco2 cities to mobilize co-fi -nancing resources from other donors, as indi-cated on the far right of the same fi gure.
Features of these fi nancial instruments are explained in Part Three of this book.
Financial resources are important. They en-able many of the possibilities discussed in this book. However, the reader should keep in mind that some of the most remarkable innovations and approaches profi led in this book were ac-tually implemented without the luxury of these complex external fi nancial resources. The true test of the Eco2 Cities Program will not be its ability to link cities with fi nance, but to facili-tate a process by which cities can adapt and ap-ply the 4 Eco2 principles to unlock their full potential.
Figure 1.33. Financial Instruments
The World Bank Group’s Financial Instruments and the instruments of multi-donor facilities administered by the World
Bank could be packaged and sequenced to support a more integrated approach to fi nancing Eco² Projects
ECo2-Part1REVd_PREP 103 6/15/09 8:22:58 AM

ECo2-Part1REVd_PREP 104 6/15/09 8:23:00 AM
A City-Based Decision Support System
Methods and Tools for Eco2 Cities
E C O 2 C I T I E S : E C O L O G I C A L C I T I E S A S E C O N O M I C C I T I E S
PART 2
ECo2-Part2Final.indd 105 6/15/09 8:35:08 AM

ECo2-Part2Final.indd 106 6/15/09 8:35:09 AM
A C I T Y- BA S E D D E C I S I O N S U P P O RT SYST E M | 107
Part Two is for everyone who wants to be-come familiar with some of the core methods that together provide cities
with a Decision Support System (DSS). It ex-plains the role of these methods in assisting cities on their Eco2 Pathways. As explained earlier, the Decision Support System is part of a City-Based Approach, since it enables cities to develop their capacity to operationalize the core elements of the Eco2 Program. Even if you are not expecting to work with the methods directly, understanding what they do helps to bring the core elements to life.
Each Chapter deals with a di( erent category of methods and tools. Chapter 1: Methods for
Collaborative Design and Decision-Making is an overview of the operational and process meth-ods that help cities undertake leadership and collaboration. Chapter 2: Methods for Analyzing
Flows and Forms provides an overview of the most practical analytical methods. The combi-nation of analytical methods helps cities to de-velop the ‘transdisciplinary’ platform described in Part One, by revealing the important rela-tionships between spatial attributes of cities (forms) and their physical resource consump-tion and emissions (fl ows). Chapter 3: Methods
for Investment Planning Assessment is an over-view of accounting methods, and includes de-tails on how to apply Life Cycle Costing and Proactive Risk Mitigation and Adaptation.
The methods support the typical planning process at di( erent times and in di( erent ways. Some methods can be used repeatedly. For ex-ample, the meta-diagrams that summarize re-source fl ows can be used fi rstly as a way to baseline how a location is currently perform-ing, and then later to help with diagnosing, target setting, scenario development, and cost assessment.
All methods are proven approaches to get-ting the work done. They are expected to re-main relevant for many years. The fundamen-tal purpose of methods is to simplify the process of analysis, assessment, and decision-making. They provide practical ways for cities to take leadership, collaborate, and analyze and asses various ideas for Eco2 projects.
Wherever possible, methods are accompa-nied by tools. By tools we refer to such things as templates, checklists, diagrams, maps, and specialized software applications—anything that is convenient to use and helps us quickly operationalize a method. The tools mentioned
Introduction
ECo2-Part2Final.indd 107 6/15/09 8:35:09 AM
108 | ECO2 CITIES: ECOLOGICAL CITIES AS ECONOMIC CITIES
in the Eco2 Program are examples, and hope-fully their quality and quantity will increase as the program evolves.
Due to limited space, Part Two only intro-duces the core methods. One of the fi rst Step-ping Stones on the Eco2 Pathway is to plan a process for capacity building, which must in-clude a facility for using methods. Part Two of this book is a good place to begin. It sets out the scope of skills and knowledge that are required, and provides an introduction to the key meth-ods and tools, and also to sources of additional information. Capacity building can continue as cities follow through on suitable methods, ob-tain more information, acquire specifi c tools, employ outside technical support, and apply new methods to their catalyst projects.
Capacity building plans are usually devel-oped in stages, beginning with the most simple tools and applications. The benefi ts are still sub-stantial. For example, sophisticated computer print outs are not necessarily more e( ective than maps drawn on transparencies by individ-uals with lots of ground knowledge (community mapping). Sometimes, computers and fancy presentations can actually get in the way.
All capacity building plans should focus on tools that can accommodate varying lev-els of data and skill, allowing the capacity to evolve over time. Tools can help this evolu-tion if they are:
• Transparent—analytical tools must be easy to understand and adjust, so that even be-ginners can follow the rationale, and the fl ow of information. Complex ‘black box’ computer models are inappropriate.
• Scalable—tools easily adapt to the level of e( ort warranted by the project, and to the
level of knowledge and skill of the user. As conditions change, the same tool should ac-commodate a larger scope, or more precise inputs.
• Web-friendly—by designing most tools so they can make full advantage of the Inter-net, it becomes easier to train people, update tools, share results, interchange data and re-sults, and use the tools to enhance stake-holder and public participation.
• Modular—past experience1 with using tools for city planning suggests that it is a mistake to adopt models and tools that are overly general and all-inclusive in their purpose. Models work best when they are limited to specifi c tasks, and fl exible enough to work on their own or in combination with other tools. A modular approach, based on strong theoretical foundations but allowing for changes in key assumptions, can more easily adapt to the complexities of the real world, and to changing user needs.
Acquiring capacity in particular methods and tools may appear challenging. Training seminars, and user friendly software, can make the process more manageable. So too can ad-vice and assistance from the Eco2 Program ad-visors, partners, and best practice cities. Despite the challenges however, most cities in develop-ing countries will need to adopt new methods and to invest in capacity building. If anything, problems in the developing countries are often more complex and demanding than those faced by wealthier cities in developed countries, and thus the need for e( ective decision-support systems is that much greater. It is an invest-ment that will yield compounded benefi ts.
ECo2-Part2Final.indd 108 6/15/09 8:35:09 AM
A C I T Y- BA S E D D E C I S I O N S U P P O RT SYST E M | 109
Methods for Collaborative Design and Decision-Making
CHAPTER 1
Organizing and Managing Collaborative Working Groups
Adopting some basic rules for
collaboration
Collaboration is a method by which diverse groups join together for a common purpose, without necessarily altering their mandates, relinquishing their authority, or sharing their budgets. The power structures are retained. In fact, the reason why collaboration works is that nobody is forced to give away their power. What changes is that information fl ows are greatly enhanced, and the potential is greater for joint action. Collaboration is especially ef-fective for integrated design of urban areas, because so many di( erent parties can infl u-ence results. Any particular system may be sig-nifi cantly a( ected by land use policies, private development projects, on-site systems, de-mand side management programs, e1 ciency standards, use of shared rights-of-way, and so
on. Collaborative Committees begin by agree-ing to a simple set of rules or principles. It also helps to have a common vision of the desired long- term outcomes.
One key rule is that wherever agreement on strategies is reached within the collaboration, each member will use its unique mandate and resource base—in a more or less coordinated fashion—to contribute to the agreed strategy.
Balancing the membership and structuring inputs from varying levels of authority
Ideally, a collaborative working group is composed of a balance of sectors: government, private, civil, and academic (knowledge insti-tutes).
A balanced membership means that a collab-orative working group needs to be carefully constructed to include a full range of perspec-tives: short-term and long-term, private and public. A convenient approach is to establish roughly proportional representation from dif-ferent sectors: government, civil, private and academic. Each sector brings di( erent priori-
ECo2-Part2Final.indd 109 6/15/09 8:35:09 AM
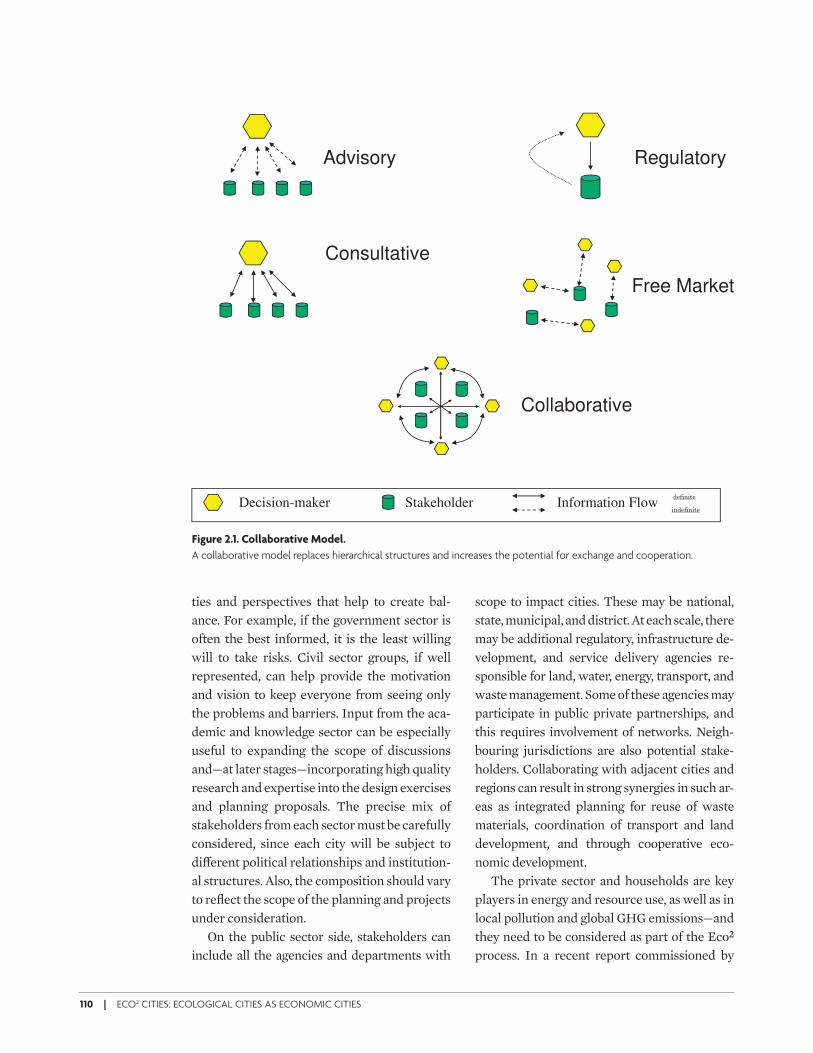
110 | ECO2 CITIES: ECOLOGICAL CITIES AS ECONOMIC CITIES
ties and perspectives that help to create bal-ance. For example, if the government sector is often the best informed, it is the least willing will to take risks. Civil sector groups, if well represented, can help provide the motivation and vision to keep everyone from seeing only the problems and barriers. Input from the aca-demic and knowledge sector can be especially useful to expanding the scope of discussions and—at later stages—incorporating high quality research and expertise into the design exercises and planning proposals. The precise mix of stakeholders from each sector must be carefully considered, since each city will be subject to di( erent political relationships and institution-al structures. Also, the composition should vary to refl ect the scope of the planning and projects under consideration.
On the public sector side, stakeholders can include all the agencies and departments with
scope to impact cities. These may be national, state, municipal, and district. At each scale, there may be additional regulatory, infrastructure de-velopment, and service delivery agencies re-sponsible for land, water, energy, transport, and waste management. Some of these agencies may participate in public private partnerships, and this requires involvement of networks. Neigh-bouring jurisdictions are also potential stake-holders. Collaborating with adjacent cities and regions can result in strong synergies in such ar-eas as integrated planning for reuse of waste materials, coordination of transport and land development, and through cooperative eco-nomic development.
The private sector and households are key players in energy and resource use, as well as in local pollution and global GHG emissions—and they need to be considered as part of the Eco2 process. In a recent report commissioned by
Figure 2.1. Collaborative Model.
A collaborative model replaces hierarchical structures and increases the potential for exchange and cooperation.
Advisory RegulatoryAdvisory Regulatory
Consultative
F M k tFree Market
CollaborativeCollaborative
Decision-maker Information FlowStakeholder!"#$%$&"
$%!"#$%$&"
ECo2-Part2Final.indd 110 6/15/09 8:35:09 AM
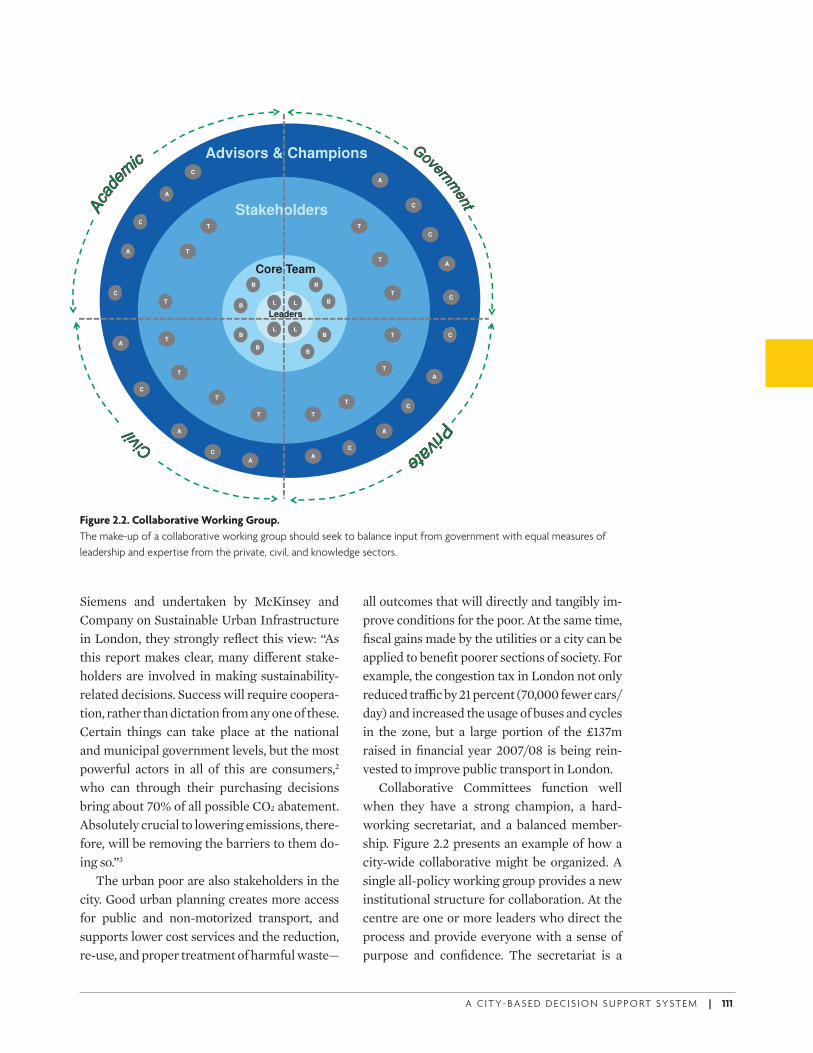
A C I T Y- BA S E D D E C I S I O N S U P P O RT SYST E M | 111
Siemens and undertaken by McKinsey and Company on Sustainable Urban Infrastructure in London, they strongly refl ect this view: “As this report makes clear, many di( erent stake-holders are involved in making sustainability-related decisions. Success will require coopera-tion, rather than dictation from any one of these. Certain things can take place at the national and municipal government levels, but the most powerful actors in all of this are consumers,2 who can through their purchasing decisions bring about 70% of all possible CO2 abatement. Absolutely crucial to lowering emissions, there-fore, will be removing the barriers to them do-ing so.”3
The urban poor are also stakeholders in the city. Good urban planning creates more access for public and non-motorized transport, and supports lower cost services and the reduction, re-use, and proper treatment of harmful waste—
all outcomes that will directly and tangibly im-prove conditions for the poor. At the same time, fi scal gains made by the utilities or a city can be applied to benefi t poorer sections of society. For example, the congestion tax in London not only reduced tra1 c by 21 percent (70,000 fewer cars/day) and increased the usage of buses and cycles in the zone, but a large portion of the £137m raised in fi nancial year 2007/08 is being rein-vested to improve public transport in London.
Collaborative Committees function well when they have a strong champion, a hard-working secretariat, and a balanced member-ship. Figure 2.2 presents an example of how a city-wide collaborative might be organized. A single all-policy working group provides a new institutional structure for collaboration. At the centre are one or more leaders who direct the process and provide everyone with a sense of purpose and confi dence. The secretariat is a
Figure 2.2. Collaborative Working Group.
The make-up of a collaborative working group should seek to balance input from government with equal measures of
leadership and expertise from the private, civil, and knowledge sectors.
Advisors & Champions
StakeholdersC
A
A
C
C
Core Team
TC
TA
T
C
T
A
Leaders
LL
LL
C
B B
T
T C
T
B
B B
BC
A
B
B B
C
TT C
B
TT
A
C
A
C
C
A
T
TT
T
CA
C
A
ECo2-Part2Final.indd 111 6/15/09 8:35:09 AM
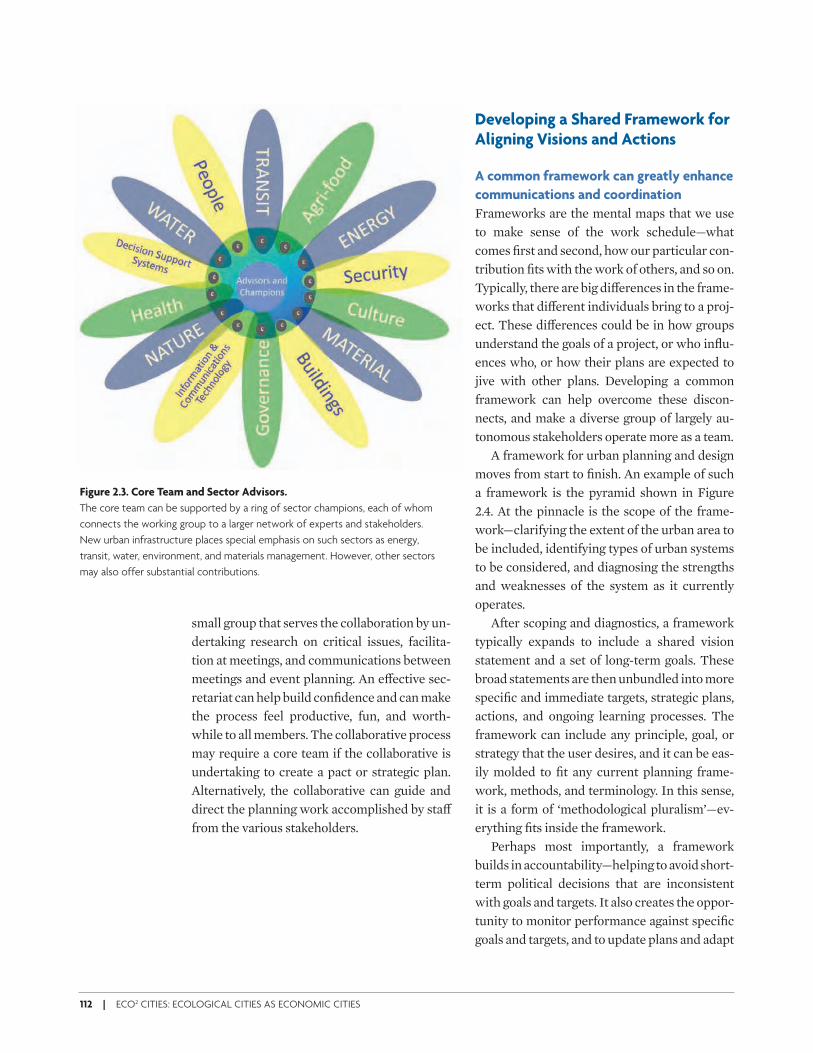
112 | ECO2 CITIES: ECOLOGICAL CITIES AS ECONOMIC CITIES
small group that serves the collaboration by un-dertaking research on critical issues, facilita-tion at meetings, and communications between meetings and event planning. An e( ective sec-retariat can help build confi dence and can make the process feel productive, fun, and worth-while to all members. The collaborative process may require a core team if the collaborative is undertaking to create a pact or strategic plan. Alternatively, the collaborative can guide and direct the planning work accomplished by sta( from the various stakeholders.
Developing a Shared Framework for Aligning Visions and Actions
A common framework can greatly enhance
communications and coordination
Frameworks are the mental maps that we use to make sense of the work schedule—what comes fi rst and second, how our particular con-tribution fi ts with the work of others, and so on. Typically, there are big di( erences in the frame-works that di( erent individuals bring to a proj-ect. These di( erences could be in how groups understand the goals of a project, or who infl u-ences who, or how their plans are expected to jive with other plans. Developing a common framework can help overcome these discon-nects, and make a diverse group of largely au-tonomous stakeholders operate more as a team.
A framework for urban planning and design moves from start to fi nish. An example of such a framework is the pyramid shown in Figure 2.4. At the pinnacle is the scope of the frame-work—clarifying the extent of the urban area to be included, identifying types of urban systems to be considered, and diagnosing the strengths and weaknesses of the system as it currently operates.
After scoping and diagnostics, a framework typically expands to include a shared vision statement and a set of long-term goals. These broad statements are then unbundled into more specifi c and immediate targets, strategic plans, actions, and ongoing learning processes. The framework can include any principle, goal, or strategy that the user desires, and it can be eas-ily molded to fi t any current planning frame-work, methods, and terminology. In this sense, it is a form of ‘methodological pluralism’—ev-erything fi ts inside the framework.
Perhaps most importantly, a framework builds in accountability—helping to avoid short-term political decisions that are inconsistent with goals and targets. It also creates the oppor-tunity to monitor performance against specifi c goals and targets, and to update plans and adapt
Figure 2.3. Core Team and Sector Advisors.
The core team can be supported by a ring of sector champions, each of whom
connects the working group to a larger network of experts and stakeholders.
New urban infrastructure places special emphasis on such sectors as energy,
transit, water, environment, and materials management. However, other sectors
may also offer substantial contributions.
ECo2-Part2Final.indd 112 6/15/09 8:35:10 AM
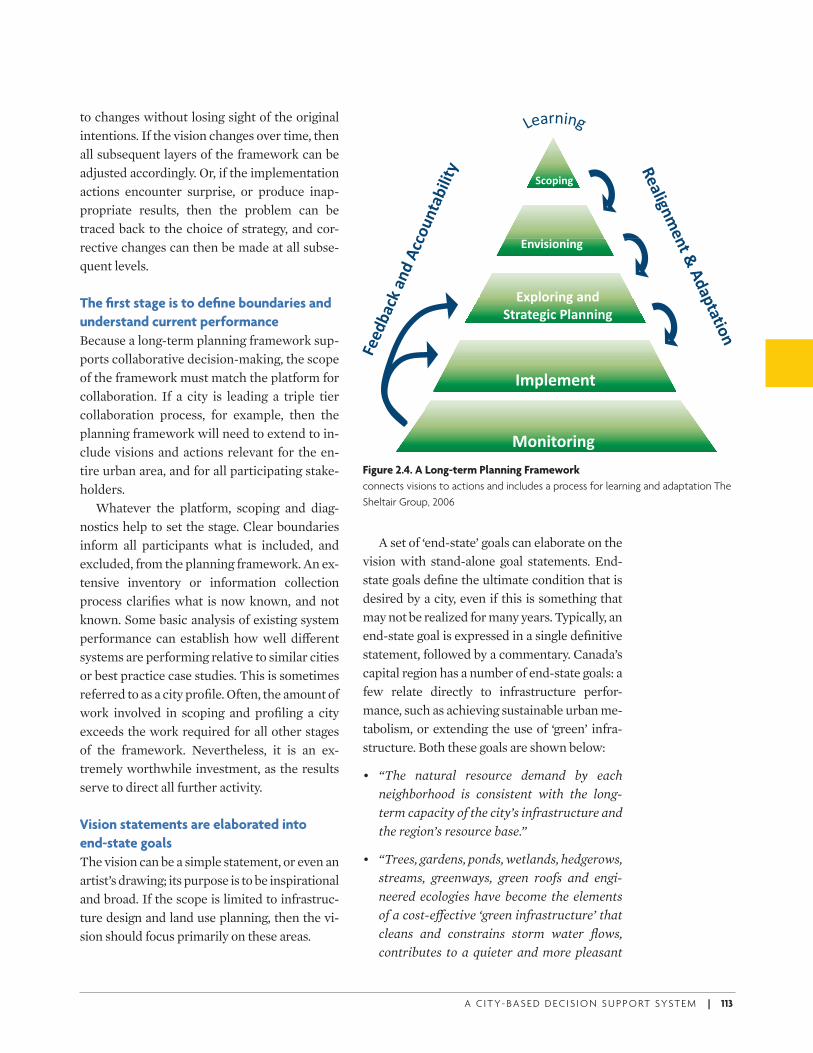
A C I T Y- BA S E D D E C I S I O N S U P P O RT SYST E M | 113
to changes without losing sight of the original intentions. If the vision changes over time, then all subsequent layers of the framework can be adjusted accordingly. Or, if the implementation actions encounter surprise, or produce inap-propriate results, then the problem can be traced back to the choice of strategy, and cor-rective changes can then be made at all subse-quent levels.
The fi rst stage is to defi ne boundaries and
understand current performance
Because a long-term planning framework sup-ports collaborative decision-making, the scope of the framework must match the platform for collaboration. If a city is leading a triple tier collaboration process, for example, then the planning framework will need to extend to in-clude visions and actions relevant for the en-tire urban area, and for all participating stake-holders.
Whatever the platform, scoping and diag-nostics help to set the stage. Clear boundaries inform all participants what is included, and excluded, from the planning framework. An ex-tensive inventory or information collection process clarifi es what is now known, and not known. Some basic analysis of existing system performance can establish how well di( erent systems are performing relative to similar cities or best practice case studies. This is sometimes referred to as a city profi le. Often, the amount of work involved in scoping and profi ling a city exceeds the work required for all other stages of the framework. Nevertheless, it is an ex-tremely worthwhile investment, as the results serve to direct all further activity.
Vision statements are elaborated into
end-state goals
The vision can be a simple statement, or even an artist’s drawing; its purpose is to be inspirational and broad. If the scope is limited to infrastruc-ture design and land use planning, then the vi-sion should focus primarily on these areas.
A set of ‘end-state’ goals can elaborate on the vision with stand-alone goal statements. End-state goals defi ne the ultimate condition that is desired by a city, even if this is something that may not be realized for many years. Typically, an end-state goal is expressed in a single defi nitive statement, followed by a commentary. Canada’s capital region has a number of end-state goals: a few relate directly to infrastructure perfor-mance, such as achieving sustainable urban me-tabolism, or extending the use of ‘green’ infra-structure. Both these goals are shown below:
• “The natural resource demand by each
neighborhood is consistent with the long-
term capacity of the city’s infrastructure and
the region’s resource base.”
• “Trees, gardens, ponds, wetlands, hedgerows,
streams, greenways, green roofs and engi-
neered ecologies have become the elements
of a cost-e- ective ‘green infrastructure’ that
cleans and constrains storm water fl ows,
contributes to a quieter and more pleasant
!"#$%&'!"#$%&'
()$*#+%&' ,&-
(&.%/%#&%&'
()$*#+%&'0,&-0
!1+,12'%"03*,&&%&'
45$*252&1
%&''
6#&%1#+%&'
Figure 2.4. A Long-term Planning Framework
connects visions to actions and includes a process for learning and adaptation The
Sheltair Group, 2006
ECo2-Part2Final.indd 113 6/15/09 8:35:10 AM
114 | ECO2 CITIES: ECOLOGICAL CITIES AS ECONOMIC CITIES
micro-climate, shades buildings in summer,
improves air quality, and generally contrib-
utes to the livability and biodiversity of
neighborhoods.”
Although such goals describe a long-term condition, they serve an immediate strategic purpose by providing a common reference point for all design and planning, and a basis for collaborative decision-making.
End-state goals for Eco2 Cities should ad-dress, at a minimum, the basic urban services (energy, water, and so on) and the ecological performance of the urban region. Cities can choose to use their own format and language, or they can adapt their framework goals from examples provided by the Eco2 Cities Program. Either way, goals should refl ect the local condi-tions and cultural values, and need to be dis-cussed and endorsed by key stakeholders. Be-cause the goals are long-term, the process of building consensus around the goal statements tends to be a positive experience, building a common purpose shared among stakeholders and residents.
Target-setting can help to translate goals
into clear objectives
Sometimes, it helps to develop intermediate targets to support specifi c end-state goals. The targets are based upon indicators that quantify the city’s desired performance with respect to one or more goals. By setting targets for spe-cifi c time periods, the city helps to direct the pace of change and the priorities for invest-ment. For example, the city of Stockholm has set a target for all new construction to be car-bon neutral by 2030; over 70 percent of New Zealand’s cities and towns have adopted a zero waste landfi ll target, with a timeline for each milestone on the journey; San Diego and Irvine California have achieved their targets for com-prehensive coverage of reclaimed water to commercial properties.
As part of adopting a set of end-state goals (and setting targets if desired) it can help to as-
sess performance and set priorities. Using ex-pert judgment and local knowledge, each goal can be subjected to a series of questions: How close is the city to achieving its goal today? What forces are likely to infl uence future suc-cess? What direction is the city now moving—are things getting better or worse? How fast is the pace of change? This type of rapid evalua-tion is helpful when setting priorities for Eco2 projects.
Strategic planning requires that planners
evaluate alternative scenarios
This exploring stage in a planning framework provides the opportunity to develop a range of alternative scenarios or approaches, and to as-sess their relative values in terms of how well they achieve guiding targets and goals. While city governments and departments may already have a strategic plan, the framework can help to extend and align the time horizons for such plans, and to integrate strategies that address the long lifecycles of such investments. At the scale of the urban region, strategic planning is especially helpful, although many urban regions in developing countries are currently operating without a shared strategic framework.
In a growing urban region, the umbrella plan that sets the context for all other planning is sometimes referred to as a Regional Growth Strategy (RGS). The RGS ensures that the vari-ous infrastructure plans—transportation, water, energy—all share the same assumptions about land use, demand, and development priorities. The RGS takes regional population growth and employment projections into account and gives the region, including its component parts (towns, counties, cities) long-term planning direction. It is the regional growth strategy that ensures inte-gration of the parts into a functional whole. In addition to providing the ‘big picture’ of how a city fi ts into its surroundings, the RGS provides the broad brush strategies for connecting neigh-borhoods, and directing new growth and invest-ment. The RGS should always address the criti-cal issues that must be solved at the scale of the
ECo2-Part2Final.indd 114 6/15/09 8:35:11 AM
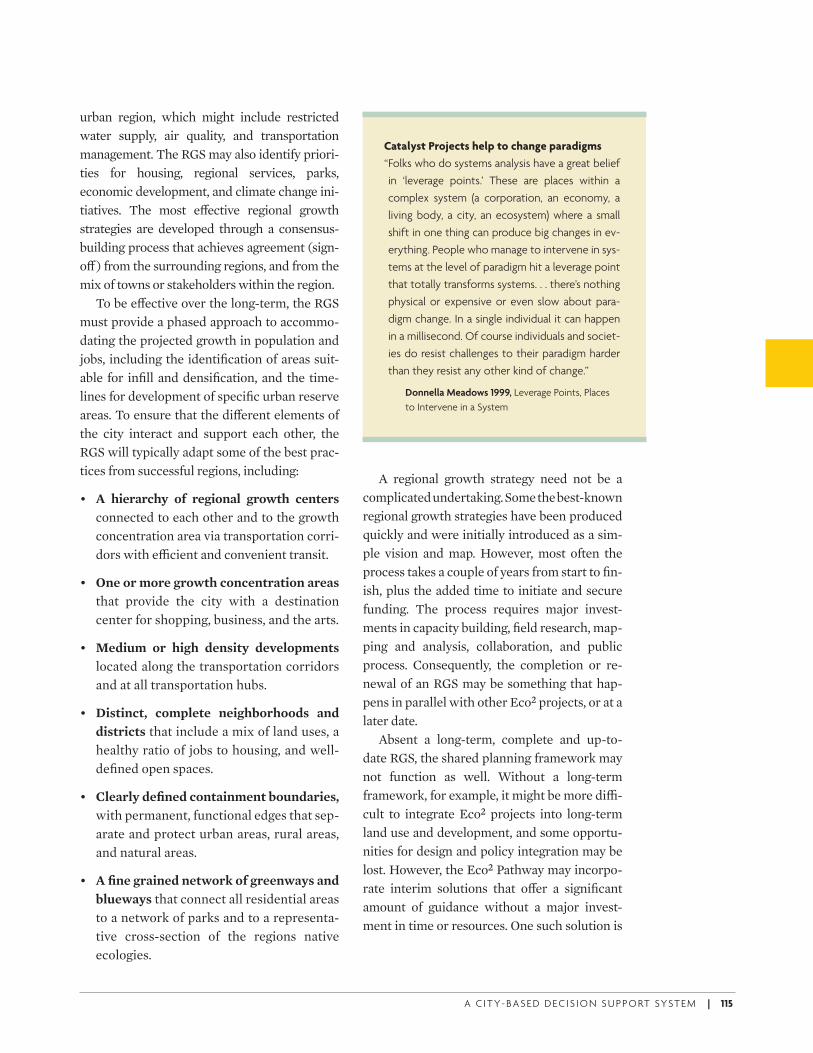
A C I T Y- BA S E D D E C I S I O N S U P P O RT SYST E M | 115
urban region, which might include restricted water supply, air quality, and transportation management. The RGS may also identify priori-ties for housing, regional services, parks, economic development, and climate change ini-tiatives. The most e( ective regional growth strategies are developed through a consensus-building process that achieves agreement (sign-o( ) from the surrounding regions, and from the mix of towns or stakeholders within the region.
To be e( ective over the long-term, the RGS must provide a phased approach to accommo-dating the projected growth in population and jobs, including the identifi cation of areas suit-able for infi ll and densifi cation, and the time-lines for development of specifi c urban reserve areas. To ensure that the di( erent elements of the city interact and support each other, the RGS will typically adapt some of the best prac-tices from successful regions, including:
• A hierarchy of regional growth centers connected to each other and to the growth concentration area via transportation corri-dors with e1 cient and convenient transit.
• One or more growth concentration areas
that provide the city with a destination center for shopping, business, and the arts.
• Medium or high density developments located along the transportation corridors and at all transportation hubs.
• Distinct, complete neighborhoods and
districts that include a mix of land uses, a healthy ratio of jobs to housing, and well-defi ned open spaces.
• Clearly defi ned containment boundaries,
with permanent, functional edges that sep-arate and protect urban areas, rural areas, and natural areas.
• A fi ne grained network of greenways and
blueways that connect all residential areas to a network of parks and to a representa-tive cross-section of the regions native ecologies.
A regional growth strategy need not be a complicated undertaking. Some the best-known regional growth strategies have been produced quickly and were initially introduced as a sim-ple vision and map. However, most often the process takes a couple of years from start to fi n-ish, plus the added time to initiate and secure funding. The process requires major invest-ments in capacity building, fi eld research, map-ping and analysis, collaboration, and public process. Consequently, the completion or re-newal of an RGS may be something that hap-pens in parallel with other Eco2 projects, or at a later date.
Absent a long-term, complete and up-to-date RGS, the shared planning framework may not function as well. Without a long-term framework, for example, it might be more di1 -cult to integrate Eco2 projects into long-term land use and development, and some opportu-nities for design and policy integration may be lost. However, the Eco2 Pathway may incorpo-rate interim solutions that o( er a signifi cant amount of guidance without a major invest-ment in time or resources. One such solution is
Catalyst Projects help to change paradigms
“ Folks who do systems analysis have a great belief
in ‘leverage points.’ These are places within a
complex system (a corporation, an economy, a
living body, a city, an ecosystem) where a small
shift in one thing can produce big changes in ev-
erything. People who manage to intervene in sys-
tems at the level of paradigm hit a leverage point
that totally transforms systems. . . there’s nothing
physical or expensive or even slow about para-
digm change. In a single individual it can happen
in a millisecond. Of course individuals and societ-
ies do resist challenges to their paradigm harder
than they resist any other kind of change.”
Donnella Meadows 1999, Leverage Points, Places
to Intervene in a System
ECo2-Part2Final.indd 115 6/15/09 8:35:11 AM
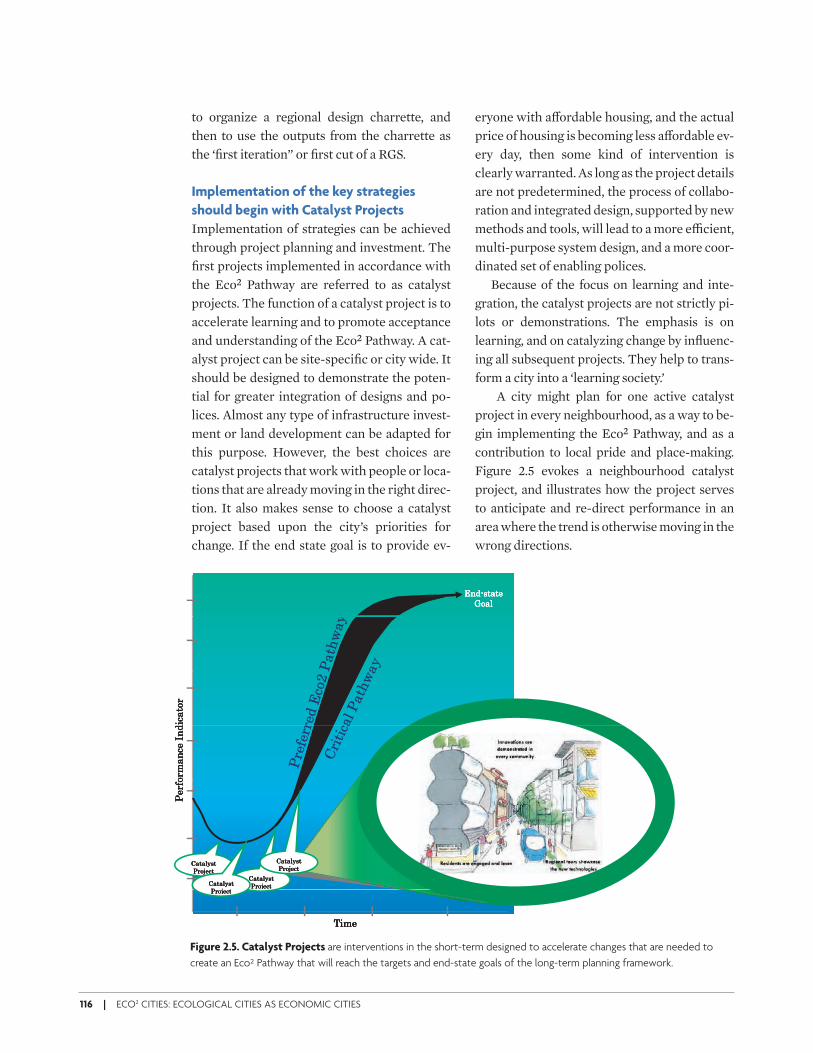
116 | ECO2 CITIES: ECOLOGICAL CITIES AS ECONOMIC CITIES
to organize a regional design charrette, and then to use the outputs from the charrette as the ‘fi rst iteration” or fi rst cut of a RGS.
Implementation of the key strategies
should begin with Catalyst Projects
Implementation of strategies can be achieved through project planning and investment. The fi rst projects implemented in accordance with the Eco2 Pathway are referred to as catalyst projects. The function of a catalyst project is to accelerate learning and to promote acceptance and understanding of the Eco2 Pathway. A cat-alyst project can be site-specifi c or city wide. It should be designed to demonstrate the poten-tial for greater integration of designs and po-lices. Almost any type of infrastructure invest-ment or land development can be adapted for this purpose. However, the best choices are catalyst projects that work with people or loca-tions that are already moving in the right direc-tion. It also makes sense to choose a catalyst project based upon the city’s priorities for change. If the end state goal is to provide ev-
eryone with a( ordable housing, and the actual price of housing is becoming less a( ordable ev-ery day, then some kind of intervention is clearly warranted. As long as the project details are not predetermined, the process of collabo-ration and integrated design, supported by new methods and tools, will lead to a more e1 cient, multi-purpose system design, and a more coor-dinated set of enabling polices.
Because of the focus on learning and inte-gration, the catalyst projects are not strictly pi-lots or demonstrations. The emphasis is on learning, and on catalyzing change by infl uenc-ing all subsequent projects. They help to trans-form a city into a ‘learning society.’
A city might plan for one active catalyst project in every neighbourhood, as a way to be-gin implementing the Eco2 Pathway, and as a contribution to local pride and place-making. Figure 2.5 evokes a neighbourhood catalyst project, and illustrates how the project serves to anticipate and re-direct performance in an area where the trend is otherwise moving in the wrong directions.
!"#!"#!"#!"#$$$$%&'&()%&'&()%&'&()%&'&()
*+',*+',*+',*+',
#-.'&+/)
#-.'&+/)
#-.'&+/)
#-.'&+/)
+/0'".()1"#
+/0'".()1"#
+/0'".()1"#
+/0'".()1"#
2(/3+
2(/3+
2(/3+
2(/3+
4'&',5%&)4'&',5%&)4'&',5%&)4'&',5%&)
2/+6(.&2/+6(.&2/+6(.&2/+6(.&
4'&',5%&)4'&',5%&)4'&',5%&)4'&',5%&)
2/+6(.&2/+6(.&2/+6(.&2/+6(.&
4'&',5%&)4'&',5%&)4'&',5%&)4'&',5%&)
2 6 &2 6 &2 6 &2 6 &
4'&',5%&)4'&',5%&)4'&',5%&)4'&',5%&)
2/+6(.&2/+6(.&2/+6(.&2/+6(.&
66662/+6(.&2/+6(.&2/+6(.&2/+6(.&
7-0()7-0()7-0()7-0()
Figure 2.5. Catalyst Projects are interventions in the short-term designed to accelerate changes that are needed to
create an Eco² Pathway that will reach the targets and end-state goals of the long-term planning framework.
ECo2-Part2Final.indd 116 6/15/09 8:35:11 AM
A C I T Y- BA S E D D E C I S I O N S U P P O RT SYST E M | 117
Implementation Policies should be
integrated across each policy tool/
instrument and stakeholder
To ensure that all stakeholders are engaged, and that a full set of policy tools and instru-ments has been considered, it is useful to cre-ate a matrix of stakeholders and policies by category. An example of such a matrix is pre-sented in Figure 2.6. The di( erent policy tools and instruments are listed across the top, and the di( erent stakeholders down the side. De-veloping such a matrix is the output of a col-laborative exercise based upon a shared plan-ning framework. The matrix is a tool for strategic planning, and also a way for any col-laborative working group to see the potential of teamwork. Each stakeholder tends to have di( erent levers of control or infl uence, and these produce di( erent, but complementary, actions for implementation.
Conducting a Regional Systems Design Charrette
At every tier, a collaborative committee pro-vides an important institutional structure for promoting and facilitating integrated design. Unlike the traditional planning and design pro-cess, which begins with a small team lead by an architect, planner, or engineer, and later adds experts when needed, integrated design en-gages a wide range of specialists, local stake-holders, and partners at very early stages. The objective is to use their expertise to infl uence seminal design decisions before opportunities are constrained, and to fi nd the synergies and out-of-the-box solutions that lead to practical and a( ordable Eco2 solutions.
The prior existence of a formal collabora-tion process among senior decision-makers means that the groups are likely to be more comfortable with participating in the integrat-ed design process. Ideally, the collaborative committee will agree that design workshops are worthwhile, and will contribute their best
designers. The collaborative agreements can also ensure that the results of such workshops are properly assessed and integrated into the fi nal project plans.
The Systems Design Charrette
Many kinds of design workshops can be used to facilitate the Eco2 Pathway. One of the most important workshop is a ‘systems’ design char-rette. A charrette is an intensive workshop that can last 4 to 7 days, and that typically brings to-gether a diverse group of specialists, designers, and residents. During the charrette, a number of small mixed teams will work side by side, day after day, with occasional interaction with each other, and with scheduled visits from public and VIPs.
Over the past few years, the techniques for design charrettes have evolved. Initially, the charrette was a tool used primarily to stimulate creative design solutions in building form and the use of interior space. A new building or group of buildings would be drawn in di( erent confi gurations, with input from many experts. More recently, the technique has been applied to entire neighborhoods, cities, and regions, with excellent results. The larger spatial areas can be treated as 3 dimensional spaces, with at-tention given to scale, walkability, streetscapes, and public space. Specifi c locations can be used as case studies. Engineers and planners can ad-dress urban resource fl ows, and include sche-matics and plans for alternative infrastructure. In this way, the design charrette expands to ad-dress all urban systems at the city scale.
In a charrette, the scale will vary to match the project. If the objective is to create a long-term regional plan, the scale will need to en-compass the entire urban area, and the rural fringe. One team might focus on boundaries and connections, another on the formation of complete neighborhoods, and another on infra-structure systems (urban systems). All teams are directed by the end-state goals. At fi rst, the small teams talk and share information and ideas. Then the process progresses from simple
ECo2-Part2Final.indd 117 6/15/09 8:35:12 AM
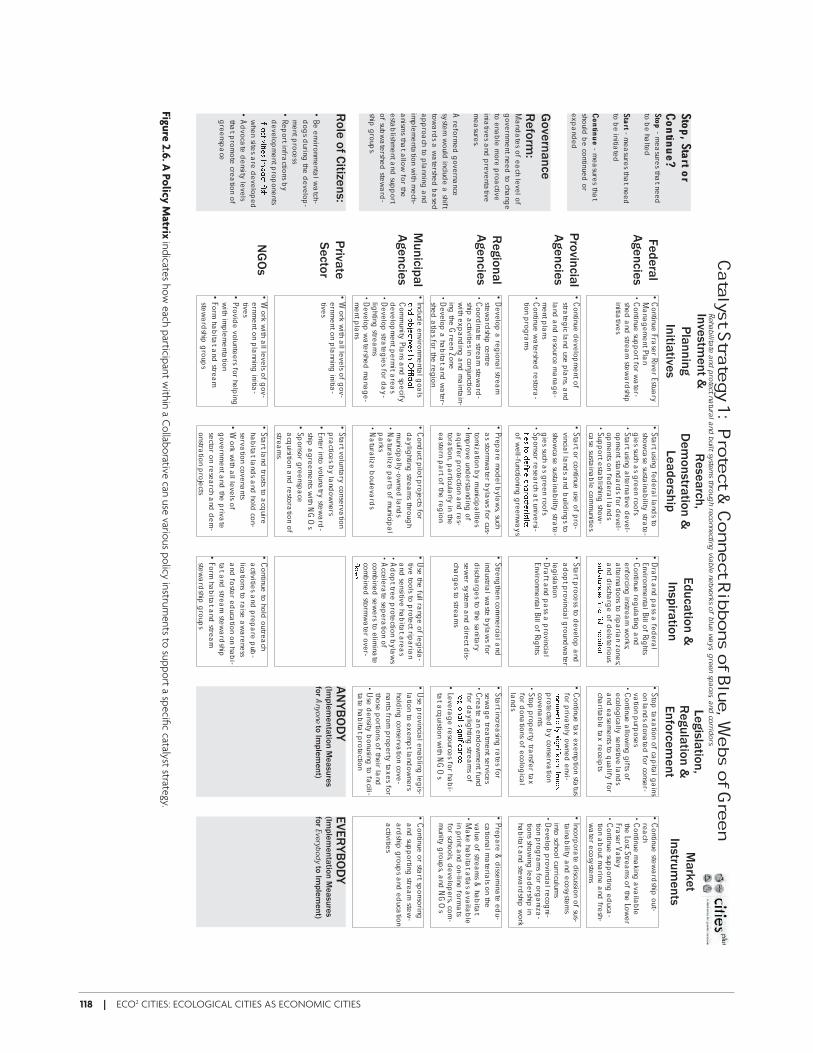
118 | ECO2 CITIES: ECOLOGICAL CITIES AS ECONOMIC CITIES
Figure
2.6
. A Po
licy M
atrix ind
icates h
ow
each
particip
ant w
ithin
a Co
llabo
rative can
use
variou
s po
licy instru
me
nts to
sup
po
rt a spe
cifi c catalyst strategy.
Go
vern
an
ce
Re
form
:
Re
sea
rch
,D
em
on
stratio
n &
L
ea
de
rship
Fe
de
ral
Ag
en
cie
s
Pro
vincia
l
Ag
en
cie
s
Re
gio
na
l
Ag
en
cie
s
Mu
nic
ipa
l
Ag
en
cie
s
Le
gisla
tion
,R
eg
ula
tion
&
En
forc
em
en
t
Inve
stme
nt &
Pla
nn
ing
Initia
tives
Ma
rke
t
Instru
me
nts
Ed
uca
tion
&
Insp
iratio
n
EV
ER
YB
OD
Y(Im
ple
me
nta
tion
Me
asu
res
for
Everybody to Im
ple
me
nt)
Priva
te
Se
cto
r
NG
Os
AN
YB
OD
Y(Im
ple
me
nta
tion
Me
asu
res
for
Anyo
ne to Im
ple
me
nt)
Ro
le o
f Citize
ns:
Stop
, Start o
r C
on
tinu
e?
Stop - m
easure
s that ne
ed
to b
e ha
lted
Sta
rt - mea
sures tha
t need
to b
e initia
ted
Co
ntin
ue - m
easure
s that
should
be co
ntinued
or
expand
ed
Mand
ate
s of ea
ch le
vel of
gove
rnment ne
ed
to cha
nge
to e
nable
more
proa
ctive
iniative
s and
pre
venta
tive
mea
sures.
A re
form
ed
gove
rnance
syste
m w
ould
include a
shift to
ward
s a w
ate
rshed b
ased
approa
ch to
pla
nning a
nd
imple
menta
tion w
ith m
ech
-
anism
s that a
llow
for the
esta
blishm
ent a
nd sup
port
of subwate
rshed ste
ward
-
ship g
roup
s.
Rehabilitate
and
pro
tect natural a
nd b
uilt systems thro
ugh reco
nnecting viable
networks of blue
ways, g
reen spa
ces, and
corridors.
•Continue
Frase
r River Estua
ry
Mana
gement Pla
n•
Continue
support for w
ate
r-shed
and
stream
steward
ship
initiative
s
•Continue
develop
ment o
f stra
tegic la
nd use
pla
ns, and
land
and
reso
urce m
ana
ge-
ment p
lans
•Continue
wate
rshed re
stora
-
tion p
rogra
ms
•Develop
a reg
iona
l stream
steward
ship ce
ntre•
Coord
inate
stream
steward
-
ship a
ctivities in
conjunctio
n
with
expand
ing a
nd m
ainta
in-
ing the
Gre
en Z
one
•Develop
a ha
bita
t and
wate
r-shed
atla
s for the
regio
n
•Includ
e e
nvironm
enta
l goa
ls
Community
Plans a
nd sp
ecify
develop
ment p
erm
it area
s•
Develop
strateg
ies fo
r day-
lighting
streams
•Develop
wate
rshed m
ana
ge-
ment p
lans
•Sta
rt using fed
era
l land
s to
showca
se susta
inability
strate
-
gie
s such a
s gre
en ro
ofs
•Sta
rt using a
lterna
tive d
evel-
opment sta
ndard
s for d
evel-
opments o
n fed
era
l land
s•
Sup
port e
stablishing
show
-
case
sustaina
ble
communitie
s
•Sta
rt or co
ntinue use
of p
ro-
vincial la
nds a
nd b
uilding
s to
showca
se susta
inability
strate
-
gie
s such a
s gre
en ro
ofs
•Sp
onso
r resea
rch a
t universi-
of well-functio
ning g
reenw
ays
•Prep
are
mod
el byla
ws, such
as sto
rmwater b
ylaws for cus-
tomiza
tionby m
unicipalitie
s•
Impro
ve und
ersta
nding
of
aquife
r pro
tectio
n a
nd re
s-to
ratio
n, p
articula
rly in
the
easte
rn p
art o
f the re
gio
n
•Cond
uct pilo
t pro
jects fo
r daylig
hting strea
ms thro
ugh
municip
ally
-owne
d la
nds
•Natura
lize p
arts o
f municip
al
parks
•Natura
lize b
oule
vard
s
•Dra
ft and
pass a
federa
l Enviro
nmenta
l Bill of Rig
hts•
Continue
regula
ting a
nd
enfo
rcing instrea
m w
orks;
alte
rnatio
ns to rip
aria
n zo
nes;
and
discha
rge o
f dele
terio
us
•Sta
rt pro
cess to
develop
and
adop
t pro
vincial g
round
wate
r le
gisla
tion
•Dra
ft and
pass a
pro
vincial
Environm
enta
l Bill of Rig
hts
•Stre
ngthe
n co
mmercia
l and
industria
lwaste
byla
ws for
discha
rges to
the sa
nitary
sewer sy
stem
and
dire
ct dis-
charg
es to
streams
•Use
the full ra
nge o
f legisla
-
tive to
ols to p
rote
ct riparia
n
and
sensitive
habita
t area
s•
Adop
t tree p
rote
ction b
ylaws
•Accele
rate
sepera
tion o
f co
mbined
sewers to
elimina
te
combined
stormwate
r ove
r-
•Stop
taxatio
n o
f capita
l gains
on la
nds d
ona
ted fo
r conse
r-va
tion p
urpose
s•
Continue
allo
wing
gifts o
f ecolog
ically
sensitive
land
s and
ease
ments to
qua
lify fo
r cha
ritable
tax re
ceipts
•Continue
tax ex
emptio
n sta
tus fo
r priva
tely o
wned
envi-
pro
tected
by co
nserva
tion
cove
nants
•Stop
prop
erty
transfe
r tax
for d
ona
tions o
f ecolog
ical
land
s
•Sta
rt increasing
rate
s for
sewage trea
tment se
rvices
•Crea
te a
n e
ndowment fund
for d
aylig
hting strea
ms of
•Le
vera
ge re
source
s for ha
bi-
tat a
cquistio
n w
ith N
GO
s
•Use
pro
vincial e
nabling
legis-
latio
n to
exempt la
ndowne
rs hold
ing co
nserva
tion co
ve-
nants fro
m p
roperty
taxes fo
r tho
se p
ortio
ns of their la
nd•
Use
density
bonusing
to fa
cili-ta
te ha
bita
t pro
tectio
n
•Continue
steward
ship o
ut-rea
ch•
Continue
making
ava
ilable
the Lo
st Strea
ms of the
Lower
Frase
rValley
•Continue
supporting
educa
-
tion a
bout m
arine
and
fresh
-
wate
r eco
syste
ms
•Inco
rpora
te d
iscussion o
f sus-ta
inability
and
eco
syste
ms
into scho
ol curriculums
•Develop
pro
vincial re
cogni-
tion p
rogra
ms fo
r org
aniza
-
tions sho
wing
leadership
in
habita
t and
steward
ship w
ork
•Prep
are
& d
issemina
te e
du-
catio
nal m
ate
rials o
n the
value
of strea
ms &
habita
t•
Make
habita
t atla
s ava
ilable
in p
rint and
on-line
form
ats
for scho
ols, develop
ers, co
m-
munity
gro
ups, a
nd N
GO
s
•Continue
or sta
rt sponso
ring
and
supporting
stream
stew
-
ard
ship g
roup
s and
educa
tion
activitie
s
Catalyst S
trategy 1
: Protect &
Connect R
ibbons of B
lue, W
ebs of G
reen
•W
ork
with
all le
vels of gov-
ernm
ent o
n p
lanning
initia-
tives
•W
ork
with
all le
vels of gov-
ernm
ent o
n p
lanning
initia-
tives
•Pro
vide volunte
ers fo
r helping
with
imple
menta
tion
•Fo
rm ha
bita
t and
stream
steward
ship g
roup
s
•Sta
rt voluntary
conse
rvatio
npra
cticesby la
ndowne
rs•
Enter into
volunatry
steward
-
ship a
gre
ements w
ith N
GO
s•
Sponso
r gre
ensp
ace
acq
uisition a
nd re
stora
tion o
f strea
ms
•Sta
rt land
trusts to a
cquire
habita
t land
s and
hold co
n-
serva
tion co
vena
nts•
Work
with
all le
vels of gove
rnment a
nd the
priva
te
secto
r on re
search
and
dem
-
onstra
tion p
rojects
•Continue
to hold
outrea
ch
activitie
s and
prep
are
pub
-
licatio
ns to ra
ise a
ware
ness
and
foste
r educa
tion o
n ha
bi-
tat a
nd strea
m ste
ward
ship•
Form
habita
t and
stream
steward
ship g
roup
s
•Be
enviro
nmenta
l watch
-
dog
s during
the d
evelop
-
ment p
roce
ss•
Report infra
ctions b
ydevelop
ment p
ropone
nts
whe
n site
s are
develop
ed•
Advo
cate
density
levels
that p
romote
creatio
n o
f gre
ensp
ace
ECo2-Part2Final.indd 118 6/15/09 8:35:12 AM
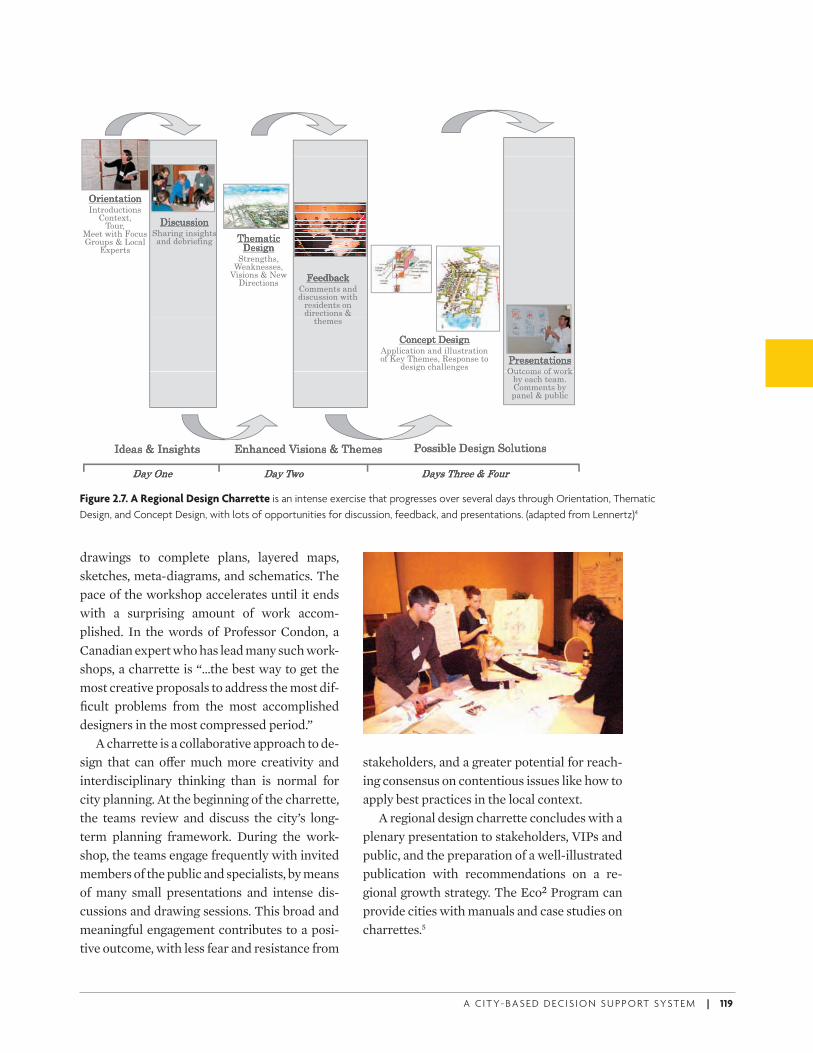
A C I T Y- BA S E D D E C I S I O N S U P P O RT SYST E M | 119
drawings to complete plans, layered maps, sketches, meta-diagrams, and schematics. The pace of the workshop accelerates until it ends with a surprising amount of work accom-plished. In the words of Professor Condon, a Canadian expert who has lead many such work-shops, a charrette is “...the best way to get the most creative proposals to address the most dif-fi cult problems from the most accomplished designers in the most compressed period.”
A charrette is a collaborative approach to de-sign that can o( er much more creativity and interdisciplinary thinking than is normal for city planning. At the beginning of the charrette, the teams review and discuss the city’s long-term planning framework. During the work-shop, the teams engage frequently with invited members of the public and specialists, by means of many small presentations and intense dis-cussions and drawing sessions. This broad and meaningful engagement contributes to a posi-tive outcome, with less fear and resistance from
!"#$%&'&#(%!"#$%&'&#(%!"#$%&'&#(%!"#$%&'&#(%)%&"(*+,&#(%-)%&"(*+,&#(%-./(%&$0&1.2(+"1
3$$&.4#&5.6(,+-.7"(+8-.9.:(,';.
<08$"&-
25$='&#,.25$='&#,.25$='&#,.25$='&#,.>$-#?%>$-#?%>$-#?%>$-#?%@&"$%?&5-1A B
>#-,+--#(%>#-,+--#(%>#-,+--#(%>#-,+--#(%@5'"#%?.#%-#?5&-.'%*.*$C"#$D#%?
A$'B%$--$-1E#-#(%-.9.F$4.>#"$,&#(%-
6$$*C',B.6$$*C',B.6$$*C',B.6$$*C',B./(==$%&-.'%*.*#-,+--#(%.4#&5."$-#*$%&-.(%..*#"$,&#(%-.9.
5
/(%,$8&.>$-#?%/(%,$8&.>$-#?%/(%,$8&.>$-#?%/(%,$8&.>$-#?%G88;#,'&#(%.'%*.#;;+-&"'&#(%.(D.H$I.25$=$-1.J$-8(%-$.&(.
*$-#?%.,5';;$%?$-.
&5$=$-..
K"$-$%&'&#(%-K"$-$%&'&#(%-K"$-$%&'&#(%-K"$-$%&'&#(%-!+&,(=$ (D 4("B!+&,(=$.(D.4("B.CI.$',5.&$'=L./(==$%&-.CI.8'%$;.9.8+C;#,
K(--#C;$.>$-#?%.@(;+&#(%-K(--#C;$.>$-#?%.@(;+&#(%-K(--#C;$.>$-#?%.@(;+&#(%-K(--#C;$.>$-#?%.@(;+&#(%-<%5'%,$*.E#-#(%-.9.25$=$-<%5'%,$*.E#-#(%-.9.25$=$-<%5'%,$*.E#-#(%-.9.25$=$-<%5'%,$*.E#-#(%-.9.25$=$-)*$'-.9.)%-#?5&-)*$'-.9.)%-#?5&-)*$'-.9.)%-#?5&-)*$'-.9.)%-#?5&-
>'I.!%$>'I.!%$>'I.!%$>'I.!%$ >'I-.25"$$.9.6(+">'I-.25"$$.9.6(+">'I-.25"$$.9.6(+">'I-.25"$$.9.6(+">'I.24(>'I.24(>'I.24(>'I.24(
Figure 2.7. A Regional Design Charrette is an intense exercise that progresses over several days through Orientation, Thematic
Design, and Concept Design, with lots of opportunities for discussion, feedback, and presentations. (adapted from Lennertz)4
stakeholders, and a greater potential for reach-ing consensus on contentious issues like how to apply best practices in the local context.
A regional design charrette concludes with a plenary presentation to stakeholders, VIPs and public, and the preparation of a well-illustrated publication with recommendations on a re-gional growth strategy. The Eco2 Program can provide cities with manuals and case studies on charrettes.5
ECo2-Part2Final.indd 119 6/15/09 8:35:13 AM

ECo2-Part2Final.indd 120 6/15/09 8:35:16 AM
A C I T Y- BA S E D D E C I S I O N S U P P O RT SYST E M | 121
Methods for Analyzing Flows and Forms
CHAPTER 2
Meta Diagrams and Materials Flow Analysis
The Meta Diagram is one of the most powerful tools available for systems thinking about in-frastructure design and performance. It has two dimensions: (1) it is a visualization tool that illustrates complex information in simple and standard ways; and (2) it is a calculation method that tracks the fl ows of energy, water, and mate-rials through cities. This section will explore both dimensions of the Meta Diagrams, and how they help to develop a systems perspec-tive and can contribute, in many ways, to the process of integrated infrastructure design.
The visualization tool is a type of Sankey dia-gram, and like all Sankey diagrams, its function is to illustrate fl ow directions and quantities. Figure 2.8 provides an explanation of how a Sankey is constructed and interpreted. By illus-trating both quantity and direction of fl ows, the Sankey displays more information on a single page than any other graphic. As is commonly
said, one Sankey is worth a thousand pie charts. The calculation method is referred to as Ma-
terials Flow Analysis (MFA). MFA tracks fl ows as a balanced set of input-output accounts. The inputs are either resources derived directly from nature (rainwater, for example, or local sunshine and biomass) or resources imported from other regions. Inputs are then tracked as they fl ow through the city’s infrastructure and buildings. Typically, the input fl ows are fi rst processed—for example, rain might be fi ltered, sunshine converted to electricity, or biomass burned to create heat. After processing, the fl ows are used to satisfy demand for services—things like drinking, lighting, and cooking. After servicing demand, the fl ows may again be pro-cessed—sewage might be treated, for example, or biogas captured and recycled. Finally, the fl ows are returned to nature as waste and emis-sions to the air, water, and land, or they might be stored or exported to other regions. Whatever the resource or pathway, inputs always equal outputs.
ECo2-Part2Final.indd 121 6/15/09 8:35:16 AM
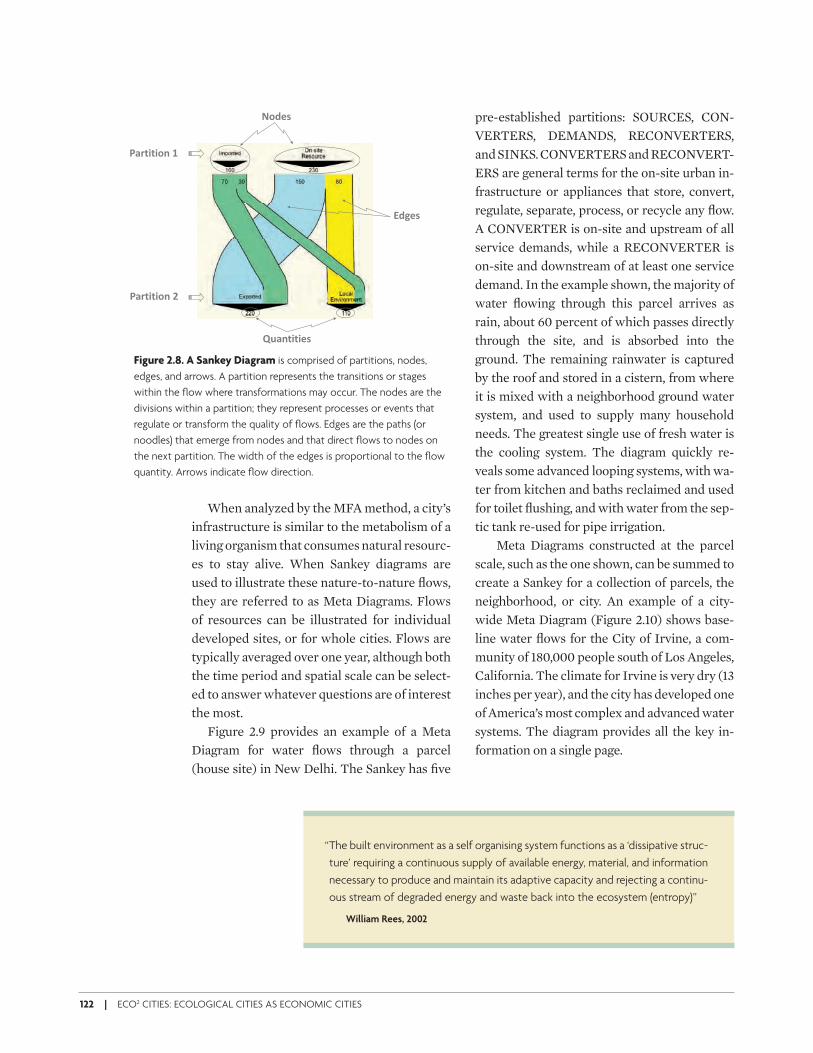
122 | ECO2 CITIES: ECOLOGICAL CITIES AS ECONOMIC CITIES
Figure 2.8. A Sankey Diagram is comprised of partitions, nodes,
edges, and arrows. A partition represents the transitions or stages
within the fl ow where transformations may occur. The nodes are the
divisions within a partition; they represent processes or events that
regulate or transform the quality of fl ows. Edges are the paths (or
noodles) that emerge from nodes and that direct fl ows to nodes on
the next partition. The width of the edges is proportional to the fl ow
quantity. Arrows indicate fl ow direction.
!"#$%
&'()*)*"+,-
.#/$%
&'()*)*"+,0
12'+)*)*$%
When analyzed by the MFA method, a city’s infrastructure is similar to the metabolism of a living organism that consumes natural resourc-es to stay alive. When Sankey diagrams are used to illustrate these nature-to-nature fl ows, they are referred to as Meta Diagrams. Flows of resources can be illustrated for individual developed sites, or for whole cities. Flows are typically averaged over one year, although both the time period and spatial scale can be select-ed to answer whatever questions are of interest the most.
Figure 2.9 provides an example of a Meta Diagram for water fl ows through a parcel (house site) in New Delhi. The Sankey has fi ve
pre-established partitions: SOURCES, CON-VERTERS, DEMANDS, RECONVERTERS, and SINKS. CONVERTERS and RECONVERT-ERS are general terms for the on-site urban in-frastructure or appliances that store, convert, regulate, separate, process, or recycle any fl ow. A CONVERTER is on-site and upstream of all service demands, while a RECONVERTER is on-site and downstream of at least one service demand. In the example shown, the majority of water fl owing through this parcel arrives as rain, about 60 percent of which passes directly through the site, and is absorbed into the ground. The remaining rainwater is captured by the roof and stored in a cistern, from where it is mixed with a neighborhood ground water system, and used to supply many household needs. The greatest single use of fresh water is the cooling system. The diagram quickly re-veals some advanced looping systems, with wa-ter from kitchen and baths reclaimed and used for toilet fl ushing, and with water from the sep-tic tank re-used for pipe irrigation.
Meta Diagrams constructed at the parcel scale, such as the one shown, can be summed to create a Sankey for a collection of parcels, the neighborhood, or city. An example of a city-wide Meta Diagram (Figure 2.10) shows base-line water fl ows for the City of Irvine, a com-munity of 180,000 people south of Los Angeles, California. The climate for Irvine is very dry (13 inches per year), and the city has developed one of America’s most complex and advanced water systems. The diagram provides all the key in-formation on a single page.
“ The built environment as a self organising system functions as a ‘dissipative struc-
ture’ requiring a continuous supply of available energy, material, and information
necessary to produce and maintain its adaptive capacity and rejecting a continu-
ous stream of degraded energy and waste back into the ecosystem (entropy)”
William Rees, 2002
ECo2-Part2Final.indd 122 6/15/09 8:35:16 AM
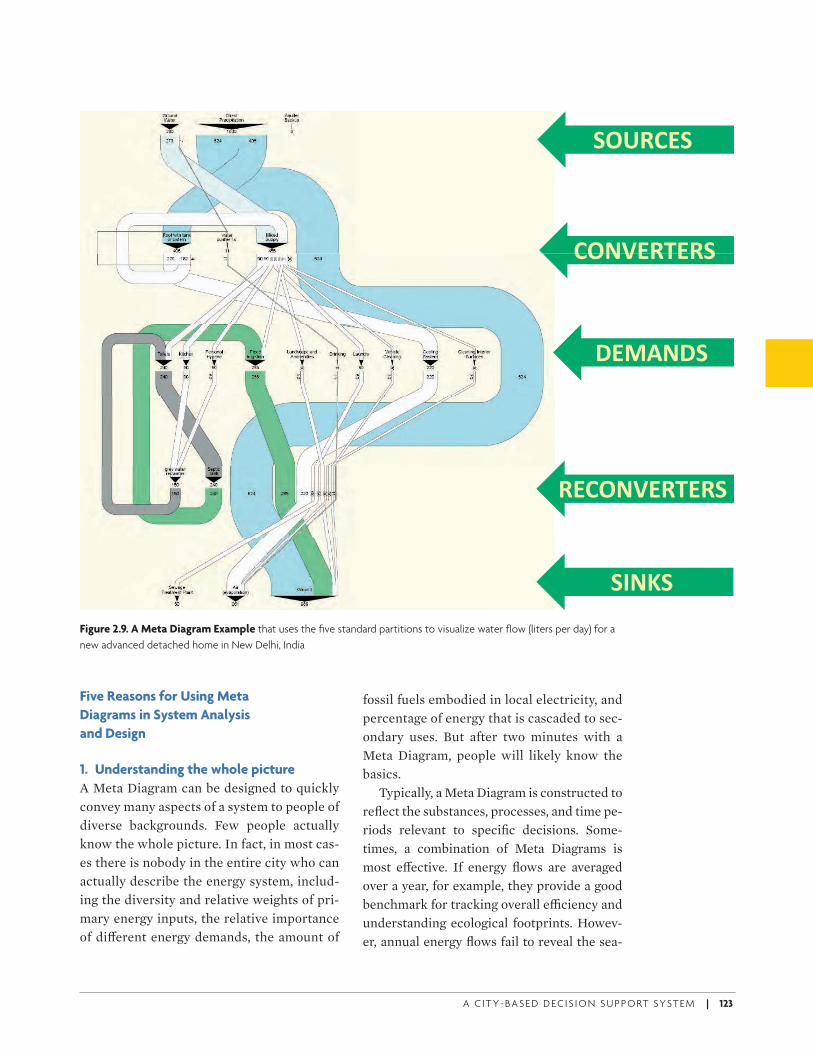
A C I T Y- BA S E D D E C I S I O N S U P P O RT SYST E M | 123
!"#$%&!
%"'(&$)&$!%"'(&$)&$!
*&+,'*!
$&%"'(&$)&$!
!-'.!
Figure 2.9. A Meta Diagram Example that uses the fi ve standard partitions to visualize water fl ow (liters per day) for a
new advanced detached home in New Delhi, India
Five Reasons for Using Meta
Diagrams in System Analysis
and Design
1. Understanding the whole picture
A Meta Diagram can be designed to quickly convey many aspects of a system to people of diverse backgrounds. Few people actually know the whole picture. In fact, in most cas-es there is nobody in the entire city who can actually describe the energy system, includ-ing the diversity and relative weights of pri-mary energy inputs, the relative importance of di( erent energy demands, the amount of
fossil fuels embodied in local electricity, and percentage of energy that is cascaded to sec-ondary uses. But after two minutes with a Meta Diagram, people will likely know the basics.
Typically, a Meta Diagram is constructed to refl ect the substances, processes, and time pe-riods relevant to specifi c decisions. Some-times, a combination of Meta Diagrams is most e( ective. If energy fl ows are averaged over a year, for example, they provide a good benchmark for tracking overall e1 ciency and understanding ecological footprints. Howev-er, annual energy fl ows fail to reveal the sea-
ECo2-Part2Final.indd 123 6/15/09 8:35:16 AM
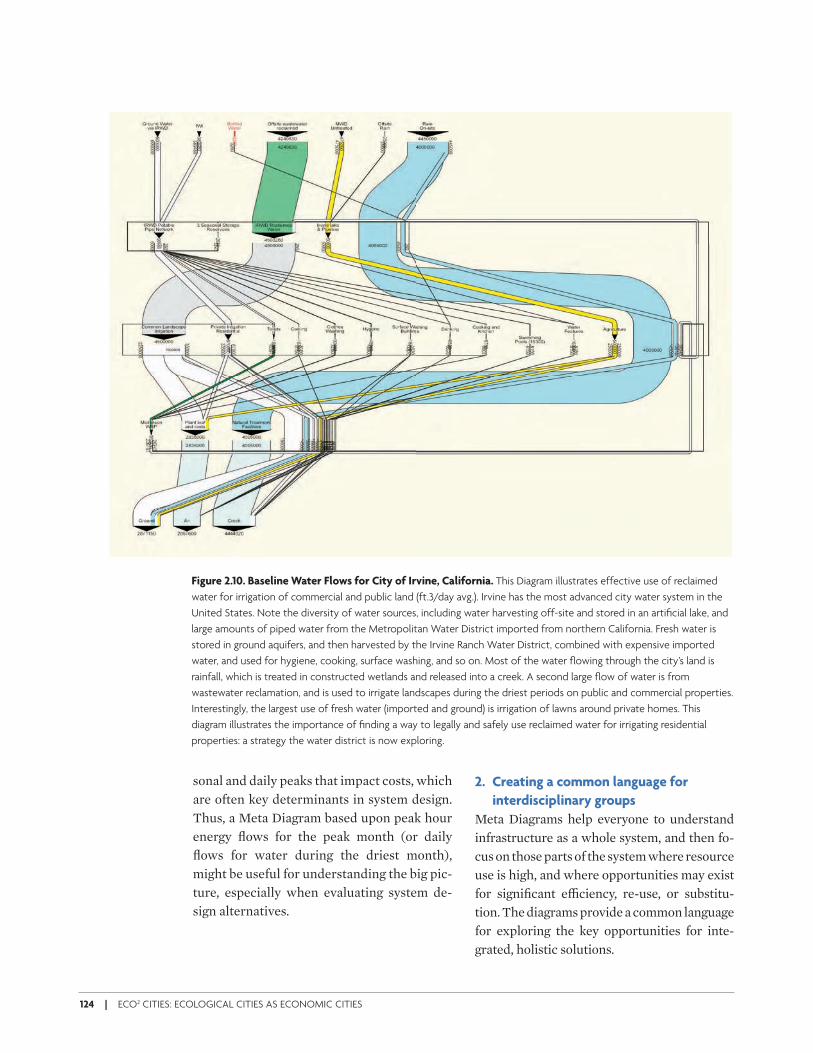
124 | ECO2 CITIES: ECOLOGICAL CITIES AS ECONOMIC CITIES
sonal and daily peaks that impact costs, which are often key determinants in system design. Thus, a Meta Diagram based upon peak hour energy fl ows for the peak month (or daily fl ows for water during the driest month), might be useful for understanding the big pic-ture, especially when evaluating system de-sign alternatives.
2. Creating a common language for
interdisciplinary groups
Meta Diagrams help everyone to understand infrastructure as a whole system, and then fo-cus on those parts of the system where resource use is high, and where opportunities may exist for signifi cant e1 ciency, re-use, or substitu-tion. The diagrams provide a common language for exploring the key opportunities for inte-grated, holistic solutions.
Figure 2.10. Baseline Water Flows for City of Irvine, California. This Diagram illustrates effective use of reclaimed
water for irrigation of commercial and public land (ft.3/day avg.). Irvine has the most advanced city water system in the
United States. Note the diversity of water sources, including water harvesting off-site and stored in an artifi cial lake, and
large amounts of piped water from the Metropolitan Water District imported from northern California. Fresh water is
stored in ground aquifers, and then harvested by the Irvine Ranch Water District, combined with expensive imported
water, and used for hygiene, cooking, surface washing, and so on. Most of the water fl owing through the city’s land is
rainfall, which is treated in constructed wetlands and released into a creek. A second large fl ow of water is from
wastewater reclamation, and is used to irrigate landscapes during the driest periods on public and commercial properties.
Interestingly, the largest use of fresh water (imported and ground) is irrigation of lawns around private homes. This
diagram illustrates the importance of fi nding a way to legally and safely use reclaimed water for irrigating residential
properties: a strategy the water district is now exploring.
ECo2-Part2Final.indd 124 6/15/09 8:35:16 AM
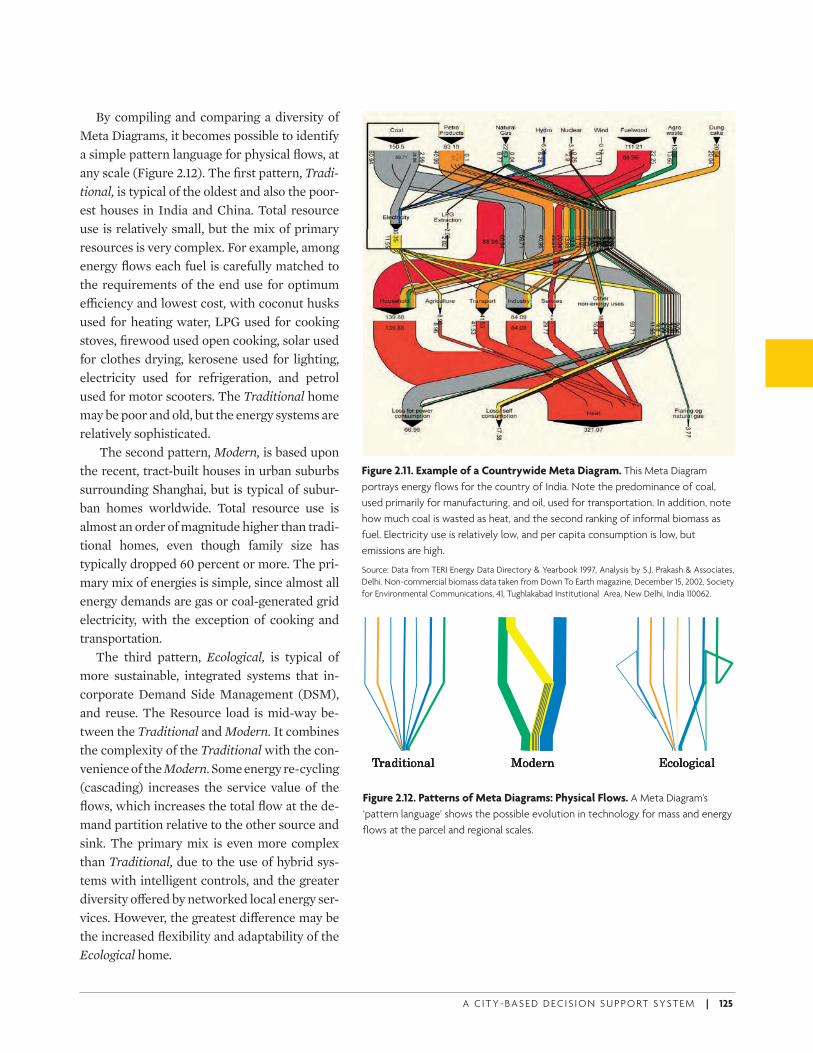
A C I T Y- BA S E D D E C I S I O N S U P P O RT SYST E M | 125
By compiling and comparing a diversity of Meta Diagrams, it becomes possible to identify a simple pattern language for physical fl ows, at any scale (Figure 2.12). The fi rst pattern, Tradi-tional, is typical of the oldest and also the poor-est houses in India and China. Total resource use is relatively small, but the mix of primary resources is very complex. For example, among energy fl ows each fuel is carefully matched to the requirements of the end use for optimum e1 ciency and lowest cost, with coconut husks used for heating water, LPG used for cooking stoves, fi rewood used open cooking, solar used for clothes drying, kerosene used for lighting, electricity used for refrigeration, and petrol used for motor scooters. The Traditional home may be poor and old, but the energy systems are relatively sophisticated.
The second pattern, Modern, is based upon the recent, tract-built houses in urban suburbs surrounding Shanghai, but is typical of subur-ban homes worldwide. Total resource use is almost an order of magnitude higher than tradi-tional homes, even though family size has typically dropped 60 percent or more. The pri-mary mix of energies is simple, since almost all energy demands are gas or coal-generated grid electricity, with the exception of cooking and transportation.
The third pattern, Ecological, is typical of more sustainable, integrated systems that in-corporate Demand Side Management (DSM), and reuse. The Resource load is mid-way be-tween the Traditional and Modern. It combines the complexity of the Traditional with the con-venience of the Modern. Some energy re-cycling (cascading) increases the service value of the fl ows, which increases the total fl ow at the de-mand partition relative to the other source and sink. The primary mix is even more complex than Traditional, due to the use of hybrid sys-tems with intelligent controls, and the greater diversity o( ered by networked local energy ser-vices. However, the greatest di( erence may be the increased fl exibility and adaptability of the Ecological home.
Figure 2.11. Example of a Countrywide Meta Diagram. This Meta Diagram
portrays energy fl ows for the country of India. Note the predominance of coal,
used primarily for manufacturing, and oil, used for transportation. In addition, note
how much coal is wasted as heat, and the second ranking of informal biomass as
fuel. Electricity use is relatively low, and per capita consumption is low, but
emissions are high.
Source: Data from TERI Energy Data Directory & Yearbook 1997, Analysis by S.J. Prakash & Associates,
Delhi. Non-commercial biomass data taken from Down To Earth magazine, December 15, 2002, Society
for Environmental Communications, 41, Tughlakabad Institutional Area, New Delhi, India 110062.
!"#$%&%'(#)!"#$%&%'(#)!"#$%&%'(#)!"#$%&%'(#) *'$+"(*'$+"(*'$+"(*'$+"( ,-')'.%-#),-')'.%-#),-')'.%-#),-')'.%-#)
Figure 2.12. Patterns of Meta Diagrams: Physical Flows. A Meta Diagram’s
‘pattern language’ shows the possible evolution in technology for mass and energy
fl ows at the parcel and regional scales.
ECo2-Part2Final.indd 125 6/15/09 8:35:17 AM
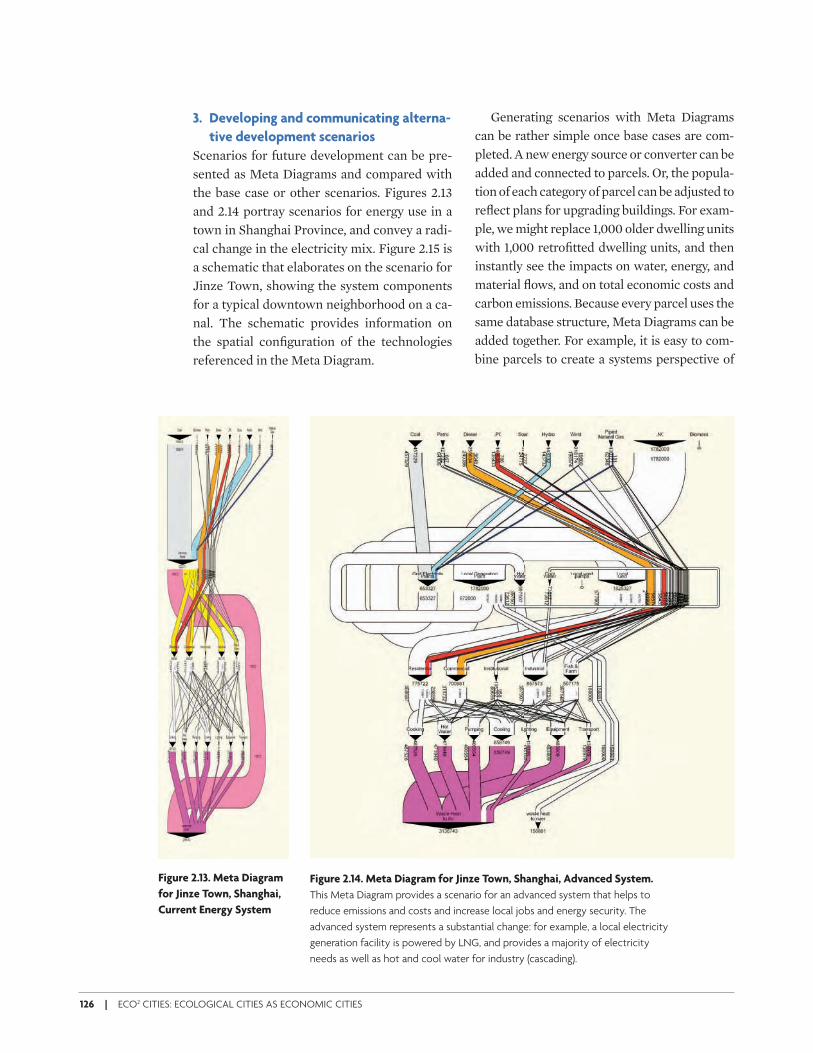
126 | ECO2 CITIES: ECOLOGICAL CITIES AS ECONOMIC CITIES
3. Developing and communicating alterna-
tive development scenarios
Scenarios for future development can be pre-sented as Meta Diagrams and compared with the base case or other scenarios. Figures 2.13 and 2.14 portray scenarios for energy use in a town in Shanghai Province, and convey a radi-cal change in the electricity mix. Figure 2.15 is a schematic that elaborates on the scenario for Jinze Town, showing the system components for a typical downtown neighborhood on a ca-nal. The schematic provides information on the spatial confi guration of the technologies referenced in the Meta Diagram.
Generating scenarios with Meta Diagrams can be rather simple once base cases are com-pleted. A new energy source or converter can be added and connected to parcels. Or, the popula-tion of each category of parcel can be adjusted to refl ect plans for upgrading buildings. For exam-ple, we might replace 1,000 older dwelling units with 1,000 retrofi tted dwelling units, and then instantly see the impacts on water, energy, and material fl ows, and on total economic costs and carbon emissions. Because every parcel uses the same database structure, Meta Diagrams can be added together. For example, it is easy to com-bine parcels to create a systems perspective of
Figure 2.13. Meta Diagram
for Jinze Town, Shanghai,
Current Energy System
Figure 2.14. Meta Diagram for Jinze Town, Shanghai, Advanced System.
This Meta Diagram provides a scenario for an advanced system that helps to
reduce emissions and costs and increase local jobs and energy security. The
advanced system represents a substantial change: for example, a local electricity
generation facility is powered by LNG, and provides a majority of electricity
needs as well as hot and cool water for industry (cascading).
ECo2-Part2Final.indd 126 6/15/09 8:35:18 AM
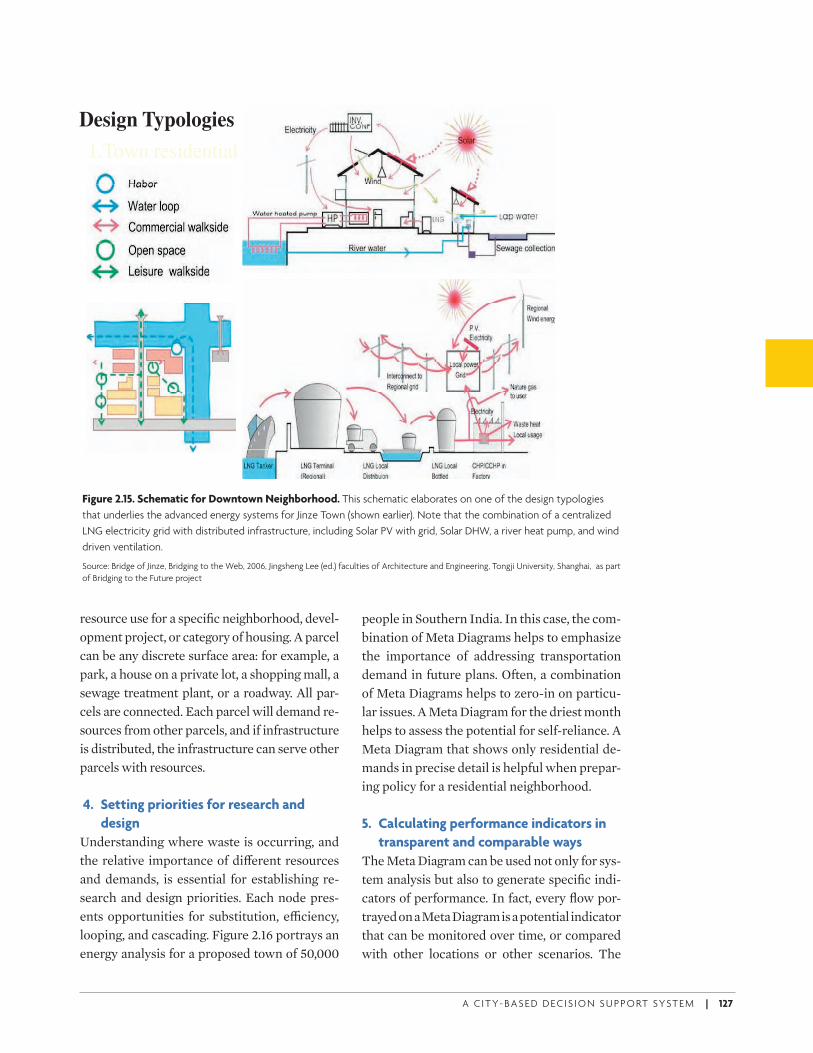
A C I T Y- BA S E D D E C I S I O N S U P P O RT SYST E M | 127
resource use for a specifi c neighborhood, devel-opment project, or category of housing. A parcel can be any discrete surface area: for example, a park, a house on a private lot, a shopping mall, a sewage treatment plant, or a roadway. All par-cels are connected. Each parcel will demand re-sources from other parcels, and if infrastructure is distributed, the infrastructure can serve other parcels with resources.
4. Setting priorities for research and
design
Understanding where waste is occurring, and the relative importance of di( erent resources and demands, is essential for establishing re-search and design priorities. Each node pres-ents opportunities for substitution, e1 ciency, looping, and cascading. Figure 2.16 portrays an energy analysis for a proposed town of 50,000
people in Southern India. In this case, the com-bination of Meta Diagrams helps to emphasize the importance of addressing transportation demand in future plans. Often, a combination of Meta Diagrams helps to zero-in on particu-lar issues. A Meta Diagram for the driest month helps to assess the potential for self-reliance. A Meta Diagram that shows only residential de-mands in precise detail is helpful when prepar-ing policy for a residential neighborhood.
5. Calculating performance indicators in
transparent and comparable ways
The Meta Diagram can be used not only for sys-tem analysis but also to generate specifi c indi-cators of performance. In fact, every fl ow por-trayed on a Meta Diagram is a potential indicator that can be monitored over time, or compared with other locations or other scenarios. The
Design Typologies
1.Town residential
Design Typologies
Figure 2.15. Schematic for Downtown Neighborhood. This schematic elaborates on one of the design typologies
that underlies the advanced energy systems for Jinze Town (shown earlier). Note that the combination of a centralized
LNG electricity grid with distributed infrastructure, including Solar PV with grid, Solar DHW, a river heat pump, and wind
driven ventilation.
Source: Bridge of Jinze, Bridging to the Web, 2006, Jingsheng Lee (ed.) faculties of Architecture and Engineering, Tongji University, Shanghai, as part
of Bridging to the Future project
ECo2-Part2Final.indd 127 6/15/09 8:35:19 AM
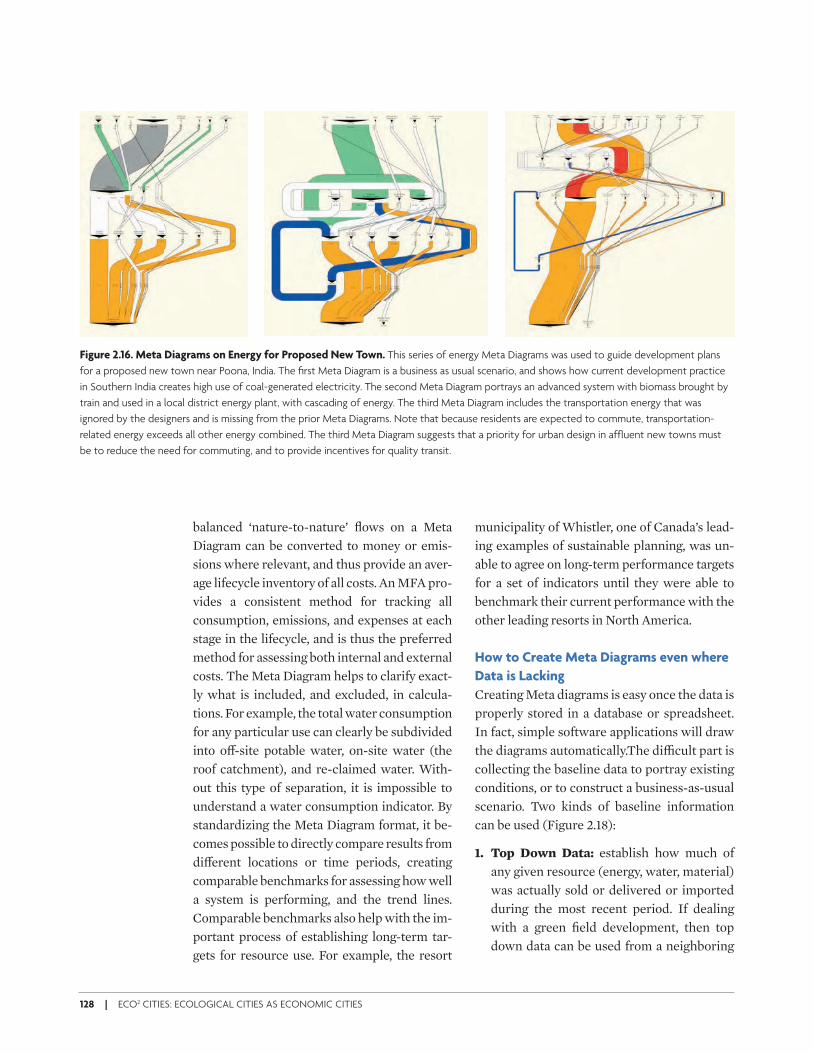
128 | ECO2 CITIES: ECOLOGICAL CITIES AS ECONOMIC CITIES
balanced ‘nature-to-nature’ fl ows on a Meta Diagram can be converted to money or emis-sions where relevant, and thus provide an aver-age lifecycle inventory of all costs. An MFA pro-vides a consistent method for tracking all consumption, emissions, and expenses at each stage in the lifecycle, and is thus the preferred method for assessing both internal and external costs. The Meta Diagram helps to clarify exact-ly what is included, and excluded, in calcula-tions. For example, the total water consumption for any particular use can clearly be subdivided into o( -site potable water, on-site water (the roof catchment), and re-claimed water. With-out this type of separation, it is impossible to understand a water consumption indicator. By standardizing the Meta Diagram format, it be-comes possible to directly compare results from di( erent locations or time periods, creating comparable benchmarks for assessing how well a system is performing, and the trend lines. Comparable benchmarks also help with the im-portant process of establishing long-term tar-gets for resource use. For example, the resort
municipality of Whistler, one of Canada’s lead-ing examples of sustainable planning, was un-able to agree on long-term performance targets for a set of indicators until they were able to benchmark their current performance with the other leading resorts in North America.
How to Create Meta Diagrams even where
Data is Lacking
Creating Meta diagrams is easy once the data is properly stored in a database or spreadsheet. In fact, simple software applications will draw the diagrams automatically.The di1 cult part is collecting the baseline data to portray existing conditions, or to construct a business-as-usual scenario. Two kinds of baseline information can be used (Figure 2.18):
1. Top Down Data: establish how much of any given resource (energy, water, material) was actually sold or delivered or imported during the most recent period. If dealing with a green fi eld development, then top down data can be used from a neighboring
Figure 2.16. Meta Diagrams on Energy for Proposed New Town. This series of energy Meta Diagrams was used to guide development plans
for a proposed new town near Poona, India. The fi rst Meta Diagram is a business as usual scenario, and shows how current development practice
in Southern India creates high use of coal-generated electricity. The second Meta Diagram portrays an advanced system with biomass brought by
train and used in a local district energy plant, with cascading of energy. The third Meta Diagram includes the transportation energy that was
ignored by the designers and is missing from the prior Meta Diagrams. Note that because residents are expected to commute, transportation-
related energy exceeds all other energy combined. The third Meta Diagram suggests that a priority for urban design in affl uent new towns must
be to reduce the need for commuting, and to provide incentives for quality transit.
ECo2-Part2Final.indd 128 6/15/09 8:35:19 AM
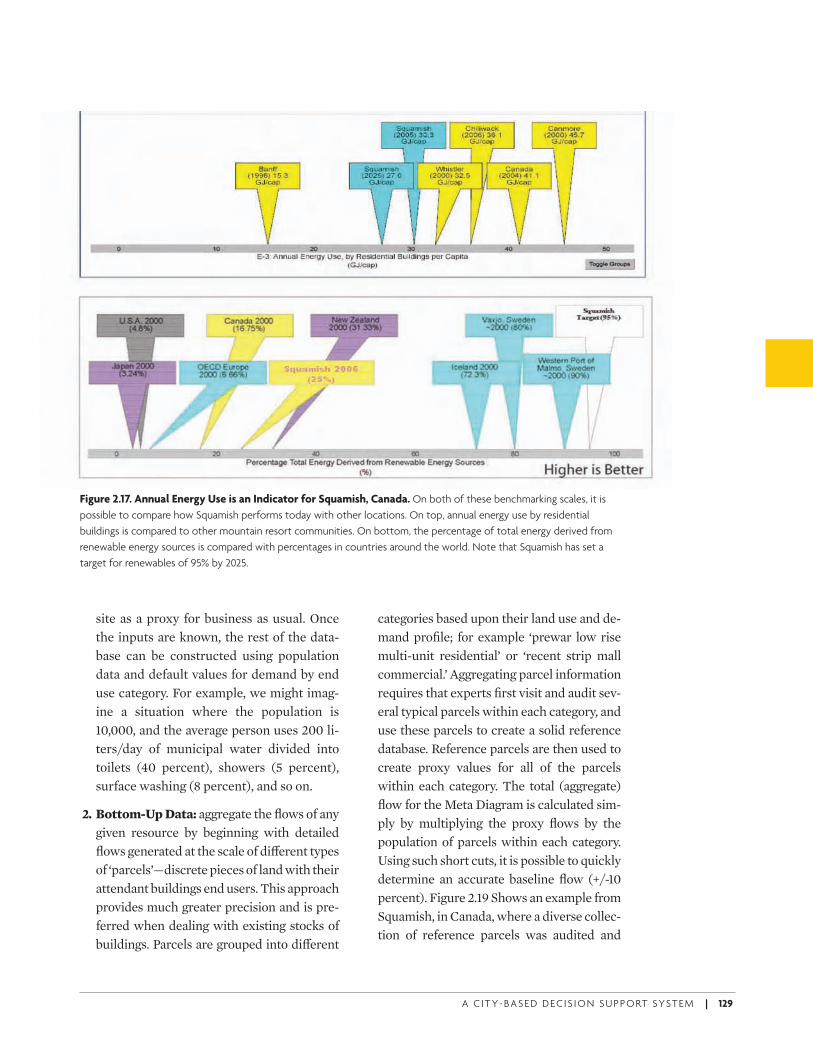
A C I T Y- BA S E D D E C I S I O N S U P P O RT SYST E M | 129
site as a proxy for business as usual. Once the inputs are known, the rest of the data-base can be constructed using population data and default values for demand by end use category. For example, we might imag-ine a situation where the population is 10,000, and the average person uses 200 li-ters/day of municipal water divided into toilets (40 percent), showers (5 percent), surface washing (8 percent), and so on.
2. Bottom-Up Data: aggregate the fl ows of any given resource by beginning with detailed fl ows generated at the scale of di( erent types of ‘parcels’—discrete pieces of land with their attendant buildings end users. This approach provides much greater precision and is pre-ferred when dealing with existing stocks of buildings. Parcels are grouped into di( erent
categories based upon their land use and de-mand profi le; for example ‘prewar low rise multi-unit residential’ or ‘recent strip mall commercial.’ Aggregating parcel information requires that experts fi rst visit and audit sev-eral typical parcels within each category, and use these parcels to create a solid reference database. Reference parcels are then used to create proxy values for all of the parcels within each category. The total (aggregate) fl ow for the Meta Diagram is calculated sim-ply by multiplying the proxy fl ows by the population of parcels within each category. Using such short cuts, it is possible to quickly determine an accurate baseline fl ow (+/-10 percent). Figure 2.19 Shows an example from Squamish, in Canada, where a diverse collec-tion of reference parcels was audited and
Figure 2.17. Annual Energy Use is an Indicator for Squamish, Canada. On both of these benchmarking scales, it is
possible to compare how Squamish performs today with other locations. On top, annual energy use by residential
buildings is compared to other mountain resort communities. On bottom, the percentage of total energy derived from
renewable energy sources is compared with percentages in countries around the world. Note that Squamish has set a
target for renewables of 95% by 2025.
ECo2-Part2Final.indd 129 6/15/09 8:35:21 AM
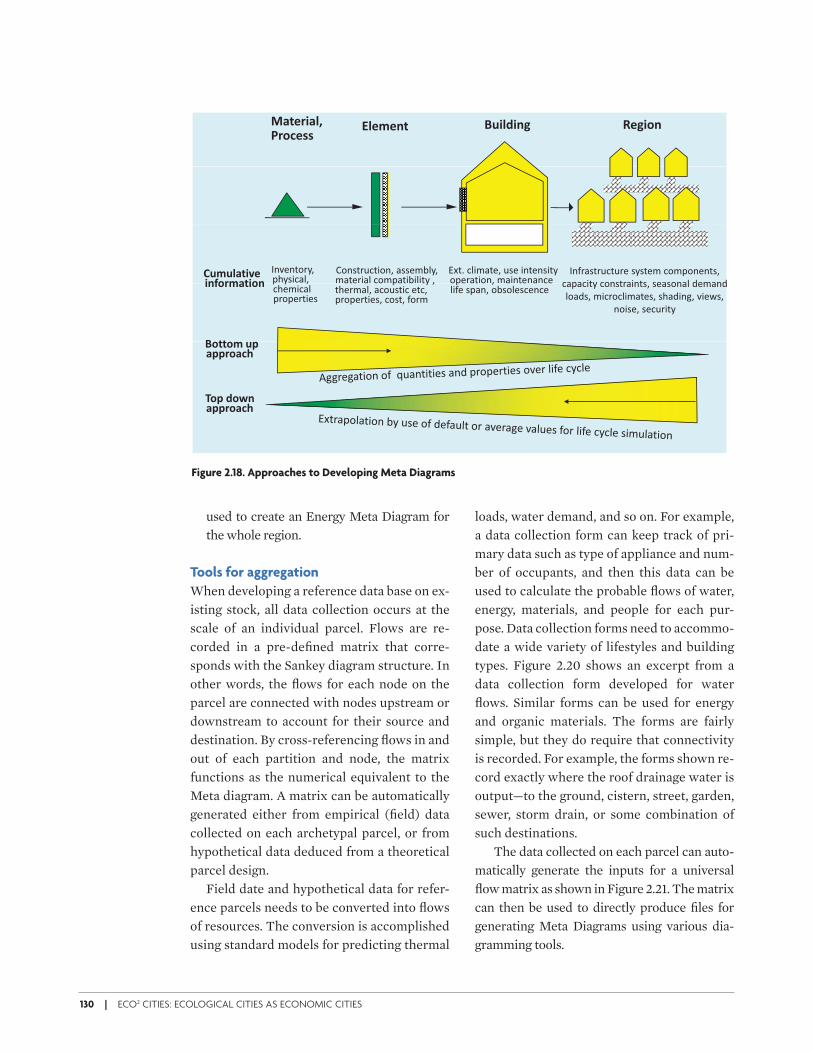
130 | ECO2 CITIES: ECOLOGICAL CITIES AS ECONOMIC CITIES
used to create an Energy Meta Diagram for the whole region.
Tools for aggregation
When developing a reference data base on ex-isting stock, all data collection occurs at the scale of an individual parcel. Flows are re-corded in a pre-defi ned matrix that corre-sponds with the Sankey diagram structure. In other words, the fl ows for each node on the parcel are connected with nodes upstream or downstream to account for their source and destination. By cross-referencing fl ows in and out of each partition and node, the matrix functions as the numerical equivalent to the Meta diagram. A matrix can be automatically generated either from empirical (fi eld) data collected on each archetypal parcel, or from hypothetical data deduced from a theoretical parcel design.
Field date and hypothetical data for refer-ence parcels needs to be converted into fl ows of resources. The conversion is accomplished using standard models for predicting thermal
loads, water demand, and so on. For example, a data collection form can keep track of pri-mary data such as type of appliance and num-ber of occupants, and then this data can be used to calculate the probable fl ows of water, energy, materials, and people for each pur-pose. Data collection forms need to accommo-date a wide variety of lifestyles and building types. Figure 2.20 shows an excerpt from a data collection form developed for water fl ows. Similar forms can be used for energy and organic materials. The forms are fairly simple, but they do require that connectivity is recorded. For example, the forms shown re-cord exactly where the roof drainage water is output—to the ground, cistern, street, garden, sewer, storm drain, or some combination of such destinations.
The data collected on each parcel can auto-matically generate the inputs for a universal fl ow matrix as shown in Figure 2.21. The matrix can then be used to directly produce fi les for generating Meta Diagrams using various dia-gramming tools.
Figure 2.18. Approaches to Developing Meta Diagrams
!"#$%&"'()*%+,$--
.'$/$0# 12&'3&04 5$4&+0
!"#$"%&'()*+,(-./01)**
2&"-%'3/%.&")*0--$451()**40%$'.01*/&4+0%.5.1.%(*)*
67%8*/1.40%$)*3-$*."%$"-.%(*&+$'0%.&")*40."%$"0"/$*
62/2'"#&7$&08+%/"#&+0
!"9'0-%'3/%3'$*-(-%$4*/&4+&"$"%-)*
/0+0/.%( /&"-%'0."%- -$0-&"01 :$40":+ ( )/,$4./01*+'&+$'%.$-
0%$ 0 /& +0% 5 %( )%,$'401)*0/&3-%./*$%/)*+'&+$'%.$-)*/&-%)*9&'4**
&+$ 0% & ) 0 %$ 0 /$1.9$*-+0")*&5-&1$-/$"/$*
1 ##
&08+%/"#&+0 /0+0/.%(*/&"-%'0."%-)*-$0-&"01*:$40":*
1&0:-)*4./'&/1.40%$-)*-,0:.";)*#.$<-)*
"&.-$)*-$/3'.%(
1+##+/)29))"99%+",:
;+9 3+<0;+9)3+<0)"99%+",:
ECo2-Part2Final.indd 130 6/15/09 8:35:22 AM
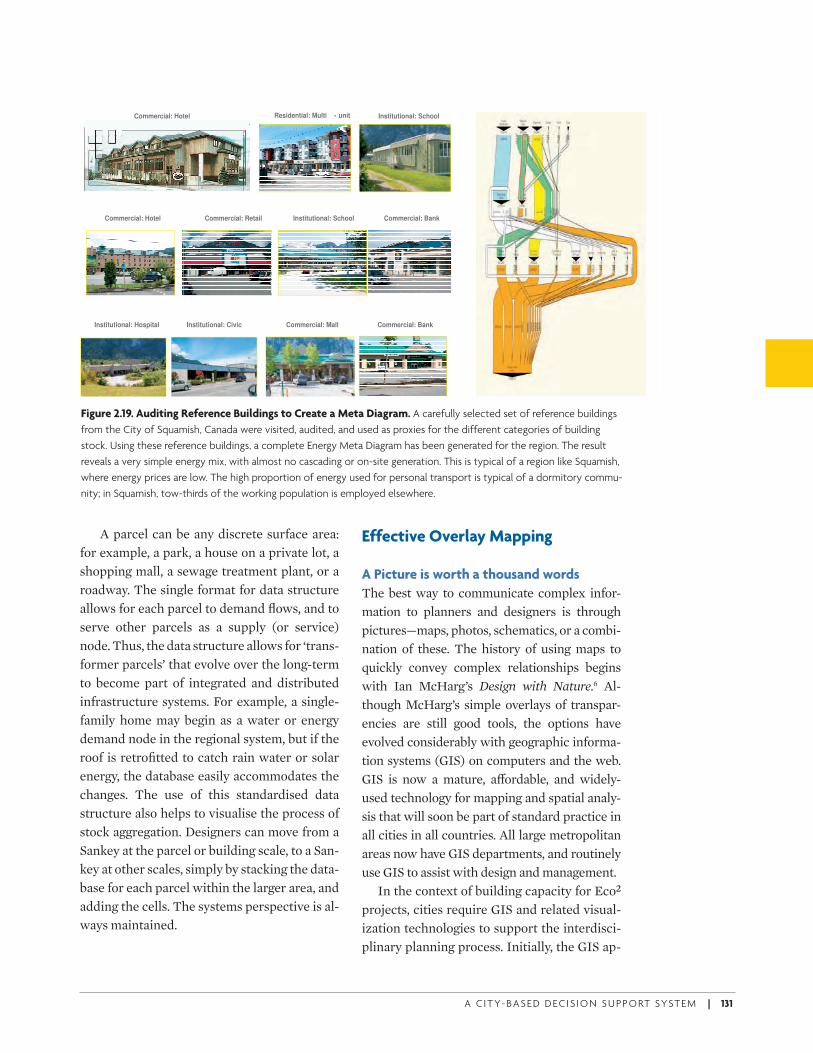
A C I T Y- BA S E D D E C I S I O N S U P P O RT SYST E M | 131
A parcel can be any discrete surface area: for example, a park, a house on a private lot, a shopping mall, a sewage treatment plant, or a roadway. The single format for data structure allows for each parcel to demand fl ows, and to serve other parcels as a supply (or service) node. Thus, the data structure allows for ‘trans-former parcels’ that evolve over the long-term to become part of integrated and distributed infrastructure systems. For example, a single-family home may begin as a water or energy demand node in the regional system, but if the roof is retrofi tted to catch rain water or solar energy, the database easily accommodates the changes. The use of this standardised data structure also helps to visualise the process of stock aggregation. Designers can move from a Sankey at the parcel or building scale, to a San-key at other scales, simply by stacking the data-base for each parcel within the larger area, and adding the cells. The systems perspective is al-ways maintained.
Effective Overlay Mapping
A Picture is worth a thousand words
The best way to communicate complex infor-mation to planners and designers is through pictures—maps, photos, schematics, or a combi-nation of these. The history of using maps to quickly convey complex relationships begins with Ian McHarg’s Design with Nature.6 Al-though McHarg’s simple overlays of transpar-encies are still good tools, the options have evolved considerably with geographic informa-tion systems (GIS) on computers and the web. GIS is now a mature, a( ordable, and widely-used technology for mapping and spatial analy-sis that will soon be part of standard practice in all cities in all countries. All large metropolitan areas now have GIS departments, and routinely use GIS to assist with design and management.
In the context of building capacity for Eco2 projects, cities require GIS and related visual-ization technologies to support the interdisci-plinary planning process. Initially, the GIS ap-
Institutional: SchoolCommercial: Hotel Residential: Multi - unit
Commercial: Retail Commercial: BankCommercial: Hotel Institutional: School
Institutional: Hospital Commercial: Mall Commercial: BankInstitutional: Civic
Figure 2.19. Auditing Reference Buildings to Create a Meta Diagram. A carefully selected set of reference buildings
from the City of Squamish, Canada were visited, audited, and used as proxies for the different categories of building
stock. Using these reference buildings, a complete Energy Meta Diagram has been generated for the region. The result
reveals a very simple energy mix, with almost no cascading or on-site generation. This is typical of a region like Squamish,
where energy prices are low. The high proportion of energy used for personal transport is typical of a dormitory commu-
nity; in Squamish, tow-thirds of the working population is employed elsewhere.
ECo2-Part2Final.indd 131 6/15/09 8:35:22 AM
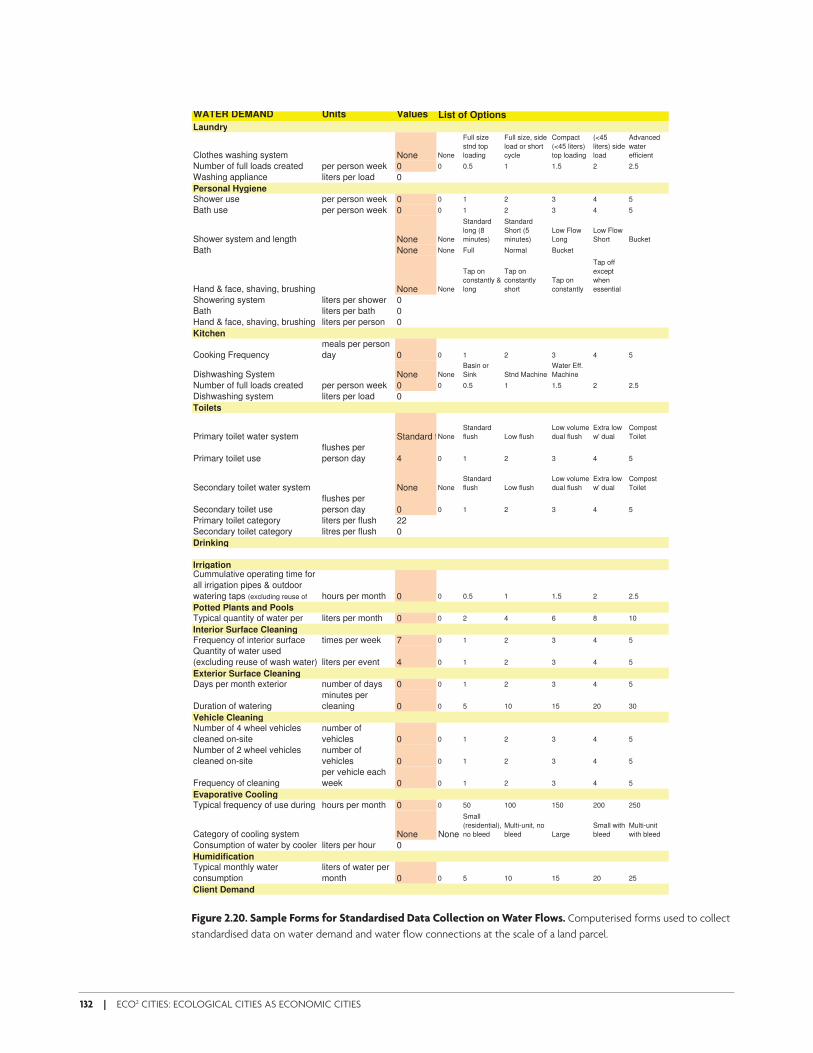
132 | ECO2 CITIES: ECOLOGICAL CITIES AS ECONOMIC CITIES
WATER DEMAND Units Values List of Options
Laundry
Clothes washing system None None
Full size
stnd top
loading
Full size, side
load or short
cycle
Compact
(<45 liters)
top loading
(<45
liters) side
load
Advanced
water
efficient
Number of full loads created per person week 0 0 0.5 1 1.5 2 2.5
Washing appliance liters per load 0
Personal Hygiene
Shower use per person week 0 0 1 2 3 4 5
Bath use per person week 0 0 1 2 3 4 5
Shower system and length None None
Standard
long (8
minutes)
Standard
Short (5
minutes)
Low Flow
Long
Low Flow
Short Bucket
Bath None None Full Normal Bucket
Hand & face, shaving, brushing None None
Tap on
constantly &
long
Tap on
constantly
short
Tap on
constantly
Tap off
except
when
essential
Showering system liters per shower 0
Bath liters per bath 0
Hand & face, shaving, brushing liters per person 0
Kitchen
Cooking Frequency
meals per person
day 0 0 1 2 3 4 5
Dishwashing System None None
Basin or
Sink Stnd Machine
Water Eff.
Machine
Number of full loads created per person week 0 0 0.5 1 1.5 2 2.5
Dishwashing system liters per load 0
Toilets
Primary toilet water system Standard fNone
Standard
flush Low flush
Low volume
dual flush
Extra low
w' dual
Compost
Toilet
Primary toilet use
flushes per
person day 4 0 1 2 3 4 5
Secondary toilet water system None None
Standard
flush Low flush
Low volume
dual flush
Extra low
w' dual
Compost
Toilet
Secondary toilet use
flushes per
person day 0 0 1 2 3 4 5
Primary toilet category liters per flush 22
Secondary toilet category litres per flush 0
Drinking
IrrigationCummulative operating time for
all irrigation pipes & outdoor
watering taps (excluding reuse of hours per month 0 0 0.5 1 1.5 2 2.5
Potted Plants and Pools
Typical quantity of water per liters per month 0 0 2 4 6 8 10
Interior Surface Cleaning
Frequency of interior surface times per week 7 0 1 2 3 4 5
Quantity of water used
(excluding reuse of wash water) liters per event 4 0 1 2 3 4 5
Exterior Surface Cleaning
Days per month exterior number of days 0 0 1 2 3 4 5
Duration of watering
minutes per
cleaning 0 0 5 10 15 20 30
Vehicle Cleaning
Number of 4 wheel vehicles
cleaned on-site
number of
vehicles 0 0 1 2 3 4 5
Number of 2 wheel vehicles
cleaned on-site
number of
vehicles 0 0 1 2 3 4 5
Frequency of cleaning
per vehicle each
week 0 0 1 2 3 4 5
Evaporative Cooling
Typical frequency of use during hours per month 0 0 50 100 150 200 250
Category of cooling system None None
Small
(residential),
no bleed
Multi-unit, no
bleed Large
Small with
bleed
Multi-unit
with bleed
Consumption of water by cooler liters per hour 0
Humidification
Typical monthly water
consumption
liters of water per
month 0 0 5 10 15 20 25
Client Demand
Figure 2.20. Sample Forms for Standardised Data Collection on Water Flows. Computerised forms used to collect
standardised data on water demand and water fl ow connections at the scale of a land parcel.
ECo2-Part2Final.indd 132 6/15/09 8:35:49 AM
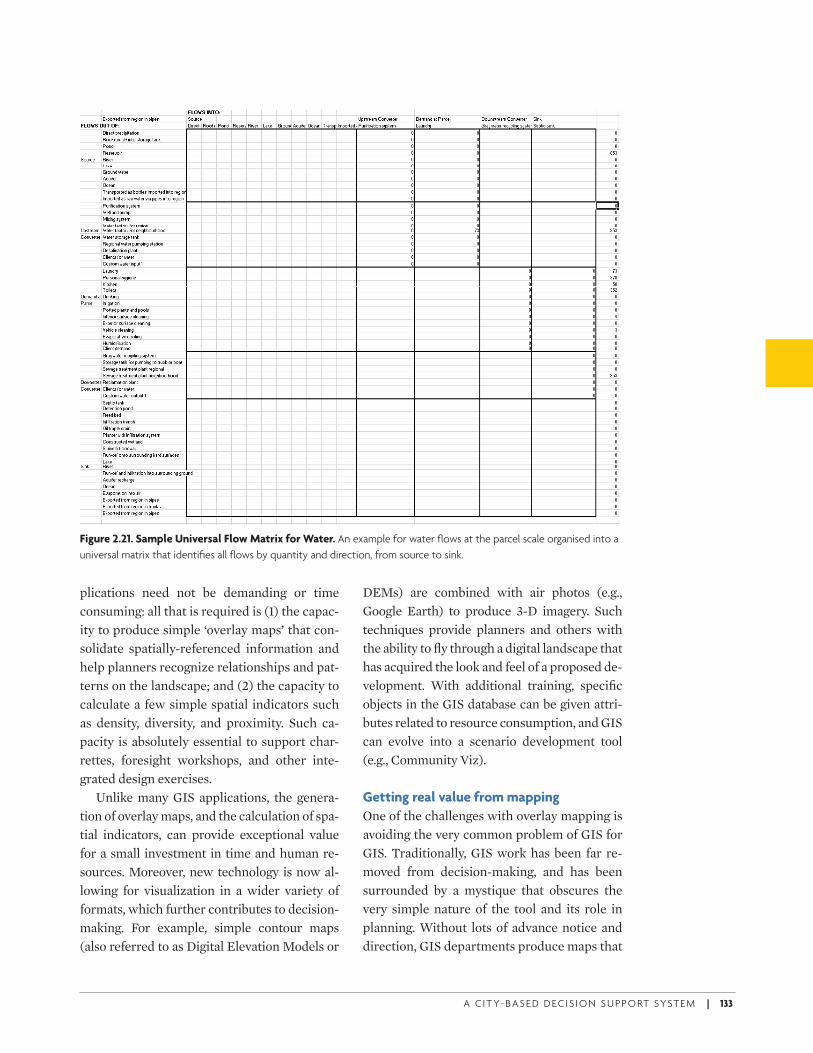
A C I T Y- BA S E D D E C I S I O N S U P P O RT SYST E M | 133
Figure 2.21. Sample Universal Flow Matrix for Water. An example for water fl ows at the parcel scale organised into a
universal matrix that identifi es all fl ows by quantity and direction, from source to sink.
plications need not be demanding or time consuming: all that is required is (1) the capac-ity to produce simple ‘overlay maps’ that con-solidate spatially-referenced information and help planners recognize relationships and pat-terns on the landscape; and (2) the capacity to calculate a few simple spatial indicators such as density, diversity, and proximity. Such ca-pacity is absolutely essential to support char-rettes, foresight workshops, and other inte-grated design exercises.
Unlike many GIS applications, the genera-tion of overlay maps, and the calculation of spa-tial indicators, can provide exceptional value for a small investment in time and human re-sources. Moreover, new technology is now al-lowing for visualization in a wider variety of formats, which further contributes to decision-making. For example, simple contour maps (also referred to as Digital Elevation Models or
DEMs) are combined with air photos (e.g., Google Earth) to produce 3-D imagery. Such techniques provide planners and others with the ability to fl y through a digital landscape that has acquired the look and feel of a proposed de-velopment. With additional training, specifi c objects in the GIS database can be given attri-butes related to resource consumption, and GIS can evolve into a scenario development tool (e.g., Community Viz).
Getting real value from mapping
One of the challenges with overlay mapping is avoiding the very common problem of GIS for GIS. Traditionally, GIS work has been far re-moved from decision-making, and has been surrounded by a mystique that obscures the very simple nature of the tool and its role in planning. Without lots of advance notice and direction, GIS departments produce maps that
ECo2-Part2Final.indd 133 6/15/09 8:35:49 AM
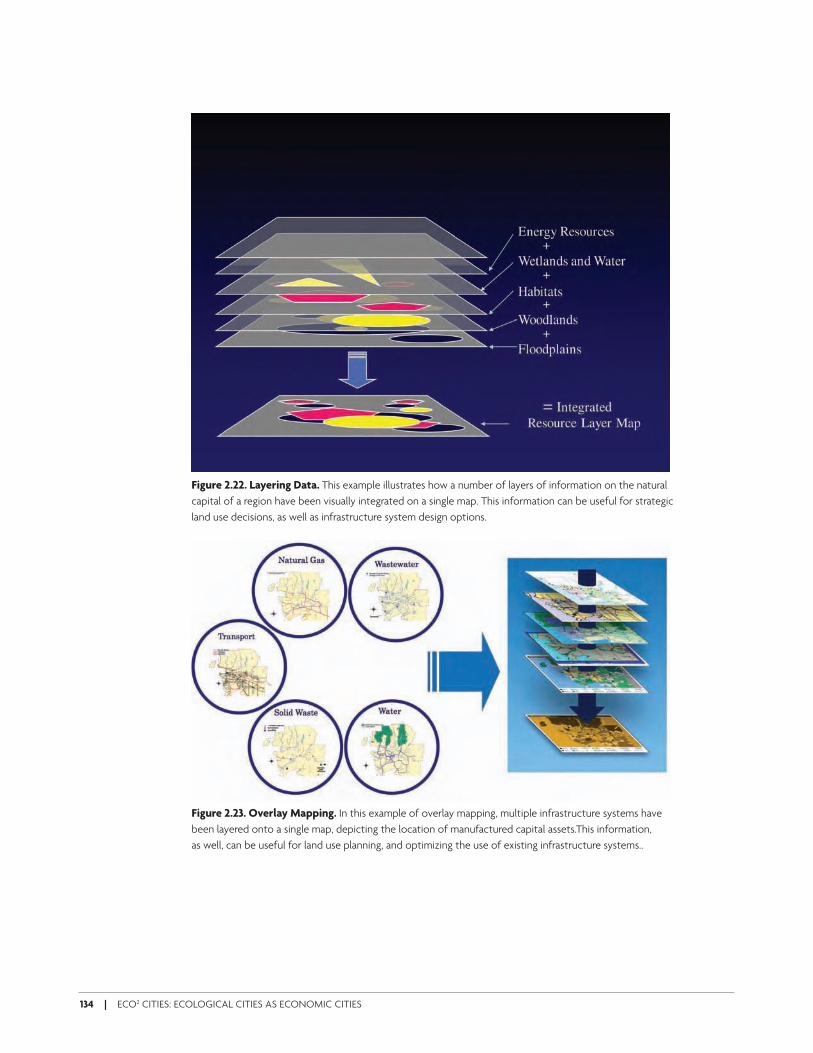
134 | ECO2 CITIES: ECOLOGICAL CITIES AS ECONOMIC CITIES
Figure 2.22. Layering Data. This example illustrates how a number of layers of information on the natural
capital of a region have been visually integrated on a single map. This information can be useful for strategic
land use decisions, as well as infrastructure system design options.
Figure 2.23. Overlay Mapping. In this example of overlay mapping, multiple infrastructure systems have
been layered onto a single map, depicting the location of manufactured capital assets.This information,
as well, can be useful for land use planning, and optimizing the use of existing infrastructure systems..
ECo2-Part2Final.indd 134 6/15/09 8:35:49 AM
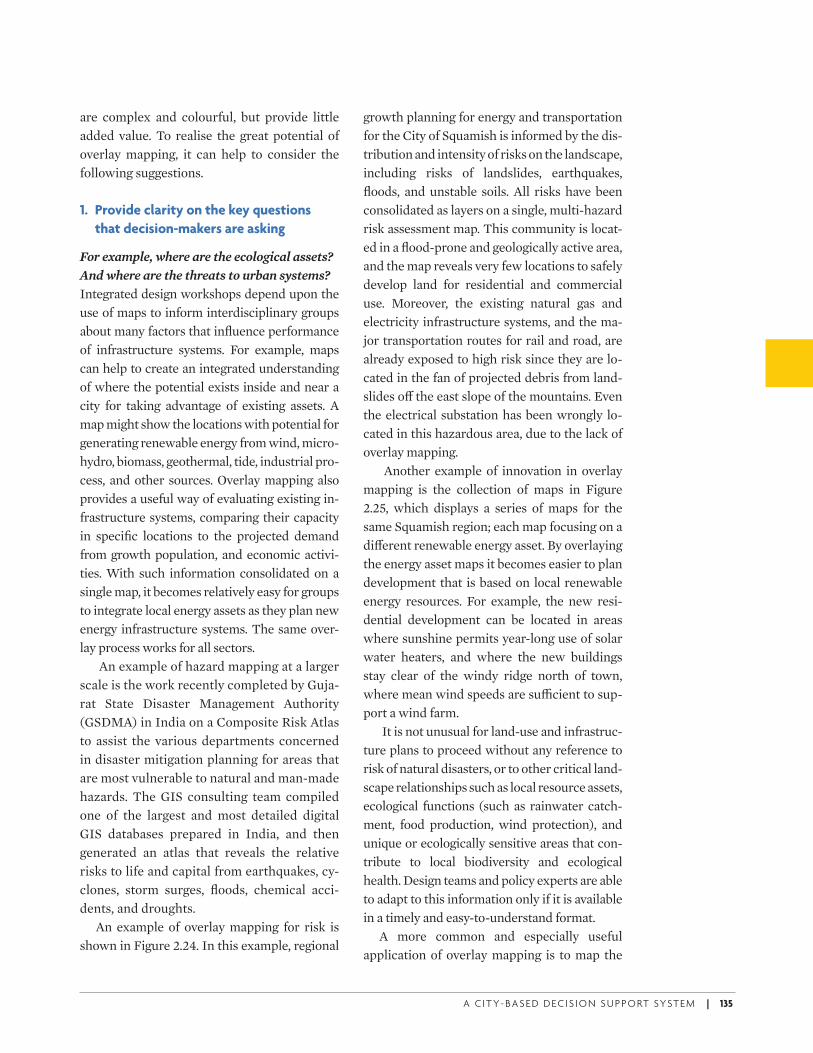
A C I T Y- BA S E D D E C I S I O N S U P P O RT SYST E M | 135
are complex and colourful, but provide little added value. To realise the great potential of overlay mapping, it can help to consider the following suggestions.
1. Provide clarity on the key questions
that decision-makers are asking
For example, where are the ecological assets?
And where are the threats to urban systems?
Integrated design workshops depend upon the use of maps to inform interdisciplinary groups about many factors that infl uence performance of infrastructure systems. For example, maps can help to create an integrated understanding of where the potential exists inside and near a city for taking advantage of existing assets. A map might show the locations with potential for generating renewable energy from wind, micro-hydro, biomass, geothermal, tide, industrial pro-cess, and other sources. Overlay mapping also provides a useful way of evaluating existing in-frastructure systems, comparing their capacity in specifi c locations to the projected demand from growth population, and economic activi-ties. With such information consolidated on a single map, it becomes relatively easy for groups to integrate local energy assets as they plan new energy infrastructure systems. The same over-lay process works for all sectors.
An example of hazard mapping at a larger scale is the work recently completed by Guja-rat State Disaster Management Authority (GSDMA) in India on a Composite Risk Atlas to assist the various departments concerned in disaster mitigation planning for areas that are most vulnerable to natural and man-made hazards. The GIS consulting team compiled one of the largest and most detailed digital GIS databases prepared in India, and then generated an atlas that reveals the relative risks to life and capital from earthquakes, cy-clones, storm surges, fl oods, chemical acci-dents, and droughts.
An example of overlay mapping for risk is shown in Figure 2.24. In this example, regional
growth planning for energy and transportation for the City of Squamish is informed by the dis-tribution and intensity of risks on the landscape, including risks of landslides, earthquakes, fl oods, and unstable soils. All risks have been consolidated as layers on a single, multi-hazard risk assessment map. This community is locat-ed in a fl ood-prone and geologically active area, and the map reveals very few locations to safely develop land for residential and commercial use. Moreover, the existing natural gas and electricity infrastructure systems, and the ma-jor transportation routes for rail and road, are already exposed to high risk since they are lo-cated in the fan of projected debris from land-slides o( the east slope of the mountains. Even the electrical substation has been wrongly lo-cated in this hazardous area, due to the lack of overlay mapping.
Another example of innovation in overlay mapping is the collection of maps in Figure 2.25, which displays a series of maps for the same Squamish region; each map focusing on a di( erent renewable energy asset. By overlaying the energy asset maps it becomes easier to plan development that is based on local renewable energy resources. For example, the new resi-dential development can be located in areas where sunshine permits year-long use of solar water heaters, and where the new buildings stay clear of the windy ridge north of town, where mean wind speeds are su1 cient to sup-port a wind farm.
It is not unusual for land-use and infrastruc-ture plans to proceed without any reference to risk of natural disasters, or to other critical land-scape relationships such as local resource assets, ecological functions (such as rainwater catch-ment, food production, wind protection), and unique or ecologically sensitive areas that con-tribute to local biodiversity and ecological health. Design teams and policy experts are able to adapt to this information only if it is available in a timely and easy-to-understand format.
A more common and especially useful application of overlay mapping is to map the
ECo2-Part2Final.indd 135 6/15/09 8:35:51 AM
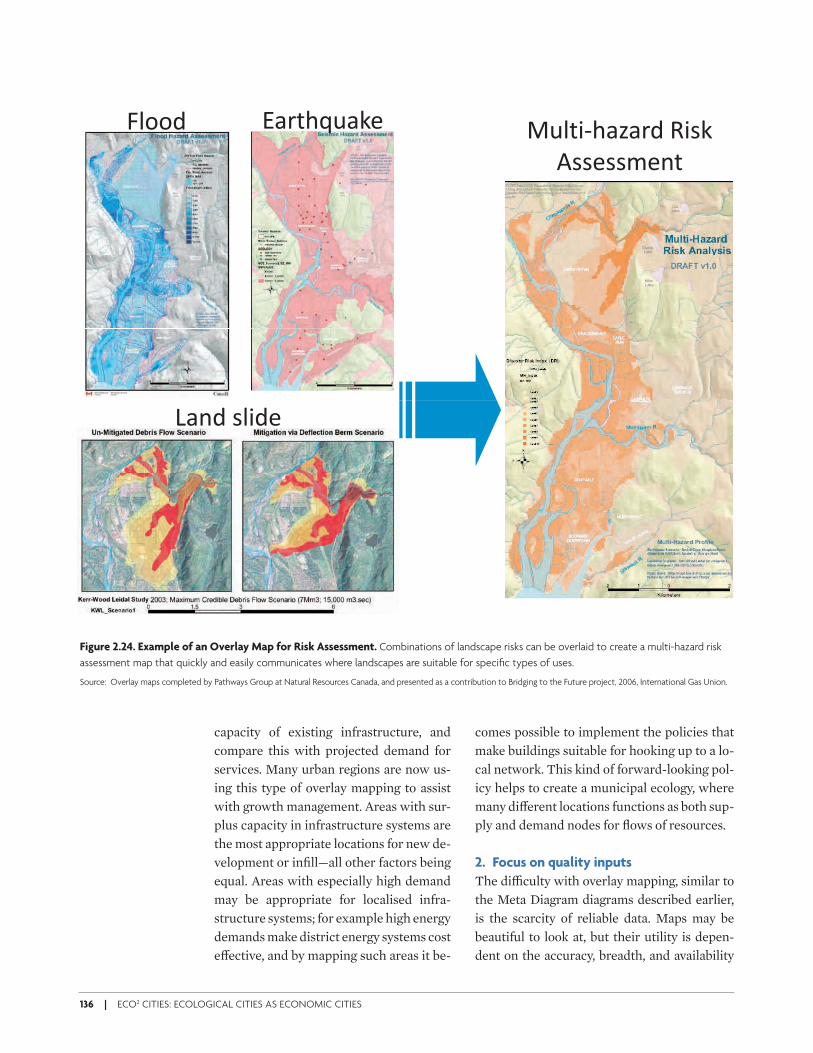
136 | ECO2 CITIES: ECOLOGICAL CITIES AS ECONOMIC CITIES
Figure 2.24. Example of an Overlay Map for Risk Assessment. Combinations of landscape risks can be overlaid to create a multi-hazard risk
assessment map that quickly and easily communicates where landscapes are suitable for specifi c types of uses.
Source: Overlay maps completed by Pathways Group at Natural Resources Canada, and presented as a contribution to Bridging to the Future project, 2006, International Gas Union.
Earthquakes!"##$ %&"'()*+,+-$./(01.
200300435'
6+-'*7&+13.
8+5$.0"($3
capacity of existing infrastructure, and compare this with projected demand for services. Many urban regions are now us-ing this type of overlay mapping to assist with growth management. Areas with sur-plus capacity in infrastructure systems are the most appropriate locations for new de-velopment or infi ll—all other factors being equal. Areas with especially high demand may be appropriate for localised infra-structure systems; for example high energy demands make district energy systems cost e( ective, and by mapping such areas it be-
comes possible to implement the policies that make buildings suitable for hooking up to a lo-cal network. This kind of forward-looking pol-icy helps to create a municipal ecology, where many di( erent locations functions as both sup-ply and demand nodes for fl ows of resources.
2. Focus on quality inputs
The di1 culty with overlay mapping, similar to the Meta Diagram diagrams described earlier, is the scarcity of reliable data. Maps may be beautiful to look at, but their utility is depen-dent on the accuracy, breadth, and availability
ECo2-Part2Final.indd 136 6/15/09 8:35:51 AM
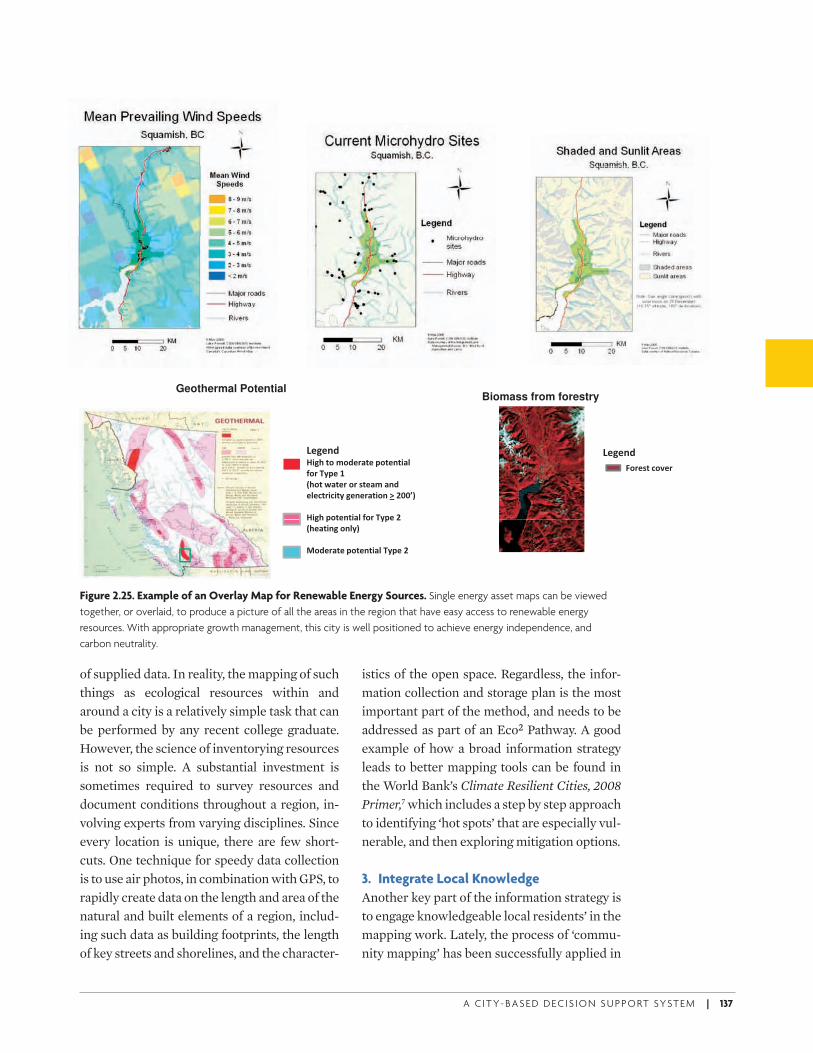
A C I T Y- BA S E D D E C I S I O N S U P P O RT SYST E M | 137
Biomass from forestryGeothermal Potential
! "!#$#%" !#$#%"
&'(#)*+,'-#(
!#$#%"./$0+*'+1'"#(2*#+3'*#%*/24+
5'(+673#+8+
90'*+:2*#(+'(+)*#21+2%"+
#4#,*(/,/*7+$#%#(2*/'%+; <==>?
./$0 3'*#%*/24 5'( 673# <./$0+3'*#%*/24+5'(+673#+<+
90#2*/%$+'%47?
@'"#(2*#+3'*#%*/24+673#+<
of supplied data. In reality, the mapping of such things as ecological resources within and around a city is a relatively simple task that can be performed by any recent college graduate. However, the science of inventorying resources is not so simple. A substantial investment is sometimes required to survey resources and document conditions throughout a region, in-volving experts from varying disciplines. Since every location is unique, there are few short-cuts. One technique for speedy data collection is to use air photos, in combination with GPS, to rapidly create data on the length and area of the natural and built elements of a region, includ-ing such data as building footprints, the length of key streets and shorelines, and the character-
istics of the open space. Regardless, the infor-mation collection and storage plan is the most important part of the method, and needs to be addressed as part of an Eco2 Pathway. A good example of how a broad information strategy leads to better mapping tools can be found in the World Bank’s Climate Resilient Cities, 2008
Primer,7 which includes a step by step approach to identifying ‘hot spots’ that are especially vul-nerable, and then exploring mitigation options.
3. Integrate Local Knowledge
Another key part of the information strategy is to engage knowledgeable local residents’ in the mapping work. Lately, the process of ‘commu-nity mapping’ has been successfully applied in
Figure 2.25. Example of an Overlay Map for Renewable Energy Sources. Single energy asset maps can be viewed
together, or overlaid, to produce a picture of all the areas in the region that have easy access to renewable energy
resources. With appropriate growth management, this city is well positioned to achieve energy independence, and
carbon neutrality.
ECo2-Part2Final.indd 137 6/15/09 8:35:53 AM
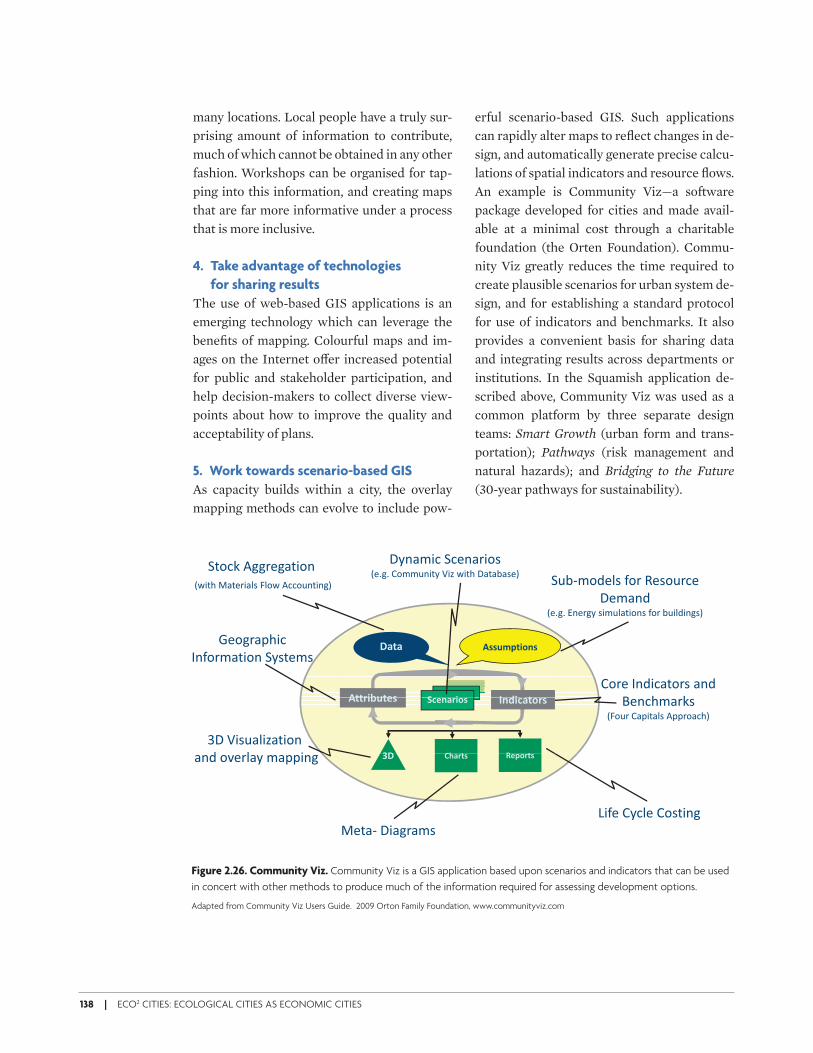
138 | ECO2 CITIES: ECOLOGICAL CITIES AS ECONOMIC CITIES
!"#$%&'()'*#$+&,-.*/0/(1,%%2#&3"(4&5(6&37(!$3$8$-*9
)28:%,;*<- =,+ >*-,2+'*)3,'?(@00+*0$3&,#
.6&37 A$3*+&$<- B<,6 @'',2#3	 )28 %,;*<-(=,+(>*-,2+'*(
!*%$#;(.*/0/(C#*+0"(-&%2<$3&,#-(=,+(82&<;�-9
.6&37(A$3*+&$<-(B<,6(@'',2#3	
D*,0+$E7&'!"#" $%%&'(#)*+%
, )$##-).&#/% 0 1) #
D*,0+$E7&'(
F#=,+%$3&,#()"-3*%-
1,+*(F#;&'$3,+-($#;(
G 7 ?
23 #
,4/+"-)*%$##-).&#/% 0+1)4"#*-%
5 #6!
H!(4&-2$<&5$3&,#
; < &
G*#'7%$+?-.B,2+(1$E&3$<-(@EE+,$'79
23"-#% 5/(*-#%6!
I&= 1 < 1 3&
$#;(,J*+<$"(%$EE�
A*3$: !&$0+$%-
I&=*(1"'<*(1,-3�
many locations. Local people have a truly sur-prising amount of information to contribute, much of which cannot be obtained in any other fashion. Workshops can be organised for tap-ping into this information, and creating maps that are far more informative under a process that is more inclusive.
4. Take advantage of technologies
for sharing results
The use of web-based GIS applications is an emerging technology which can leverage the benefi ts of mapping. Colourful maps and im-ages on the Internet o( er increased potential for public and stakeholder participation, and help decision-makers to collect diverse view-points about how to improve the quality and acceptability of plans.
5. Work towards scenario-based GIS
As capacity builds within a city, the overlay mapping methods can evolve to include pow-
erful scenario-based GIS. Such applications can rapidly alter maps to refl ect changes in de-sign, and automatically generate precise calcu-lations of spatial indicators and resource fl ows. An example is Community Viz—a software package developed for cities and made avail-able at a minimal cost through a charitable foundation (the Orten Foundation). Commu-nity Viz greatly reduces the time required to create plausible scenarios for urban system de-sign, and for establishing a standard protocol for use of indicators and benchmarks. It also provides a convenient basis for sharing data and integrating results across departments or institutions. In the Squamish application de-scribed above, Community Viz was used as a common platform by three separate design teams: Smart Growth (urban form and trans-portation); Pathways (risk management and natural hazards); and Bridging to the Future (30-year pathways for sustainability).
Figure 2.26. Community Viz. Community Viz is a GIS application based upon scenarios and indicators that can be used
in concert with other methods to produce much of the information required for assessing development options.
Adapted from Community Viz Users Guide. 2009 Orton Family Foundation, www.communityviz.com
ECo2-Part2Final.indd 138 6/15/09 8:35:56 AM

A C I T Y- BA S E D D E C I S I O N S U P P O RT SYST E M | 139
Methods for Investment Planning
CHAPTER 3
Investing wisely in urban development is a complex process. A large number of profes-sionals (architects, designers, suppliers, engi-neers, economists and fi nancial planners) must be engaged, each of whom brings a dif-ferent concept of what is important, and how it can be measured. Construction occurs over many phases and many years (programming and planning, design and engineering, con-struction, operation, and dismantling). The fi nal product is composed of many levels of subsidiary products: materials, components and technologies, whole buildings, infra-structure systems, and open space. And at each phase and every scale, di( erent actors are involved in the decision-making process. The complexity of interactions between these actors and between the many elements is one of most signifi cant challenges faced by any-body trying to assess the real costs and bene-fi ts of alternative plans for development. In-vesting wisely in urban development is about coping with complexity.
A number of assessment methods are avail-able to help cities cope with complexity. The following methods are worth considering. Each of these can be applied using simple and scal-able tools that adjust to needs and capacity of the user.
First and foremost is Life Cycle Costing (LCC), which is used to understand many of the indirect and contingent costs associated with any project design over the expected lifetime of the facilities. Some LCC tools work with com-plete urban environments, including both spa-tial elements and infrastructure. Other LCC tools work exclusively with specifi c types of in-frastructure facilities, like treatment plants and power plants. We will look at both types.
The second method to consider is environ-mental accounting, which attempts to add up the lifetime environmental impacts of a project. Environmental accounting includes Material Flow Analysis, but further expands the scope to include the broader impacts of specifi c projects on the environment, including resource use and
ECo2-Part2Final.indd 139 6/15/09 8:36:11 AM
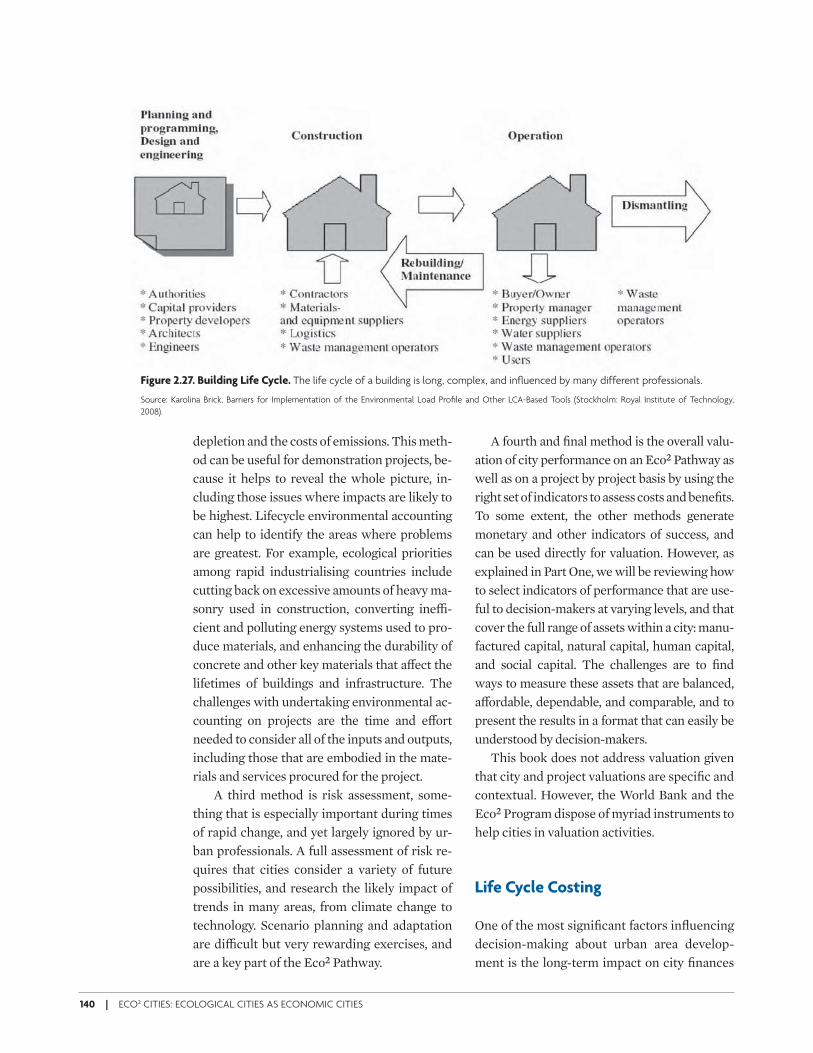
140 | ECO2 CITIES: ECOLOGICAL CITIES AS ECONOMIC CITIES
depletion and the costs of emissions. This meth-od can be useful for demonstration projects, be-cause it helps to reveal the whole picture, in-cluding those issues where impacts are likely to be highest. Lifecycle environmental accounting can help to identify the areas where problems are greatest. For example, ecological priorities among rapid industrialising countries include cutting back on excessive amounts of heavy ma-sonry used in construction, converting ine1 -cient and polluting energy systems used to pro-duce materials, and enhancing the durability of concrete and other key materials that a( ect the lifetimes of buildings and infrastructure. The challenges with undertaking environmental ac-counting on projects are the time and e( ort needed to consider all of the inputs and outputs, including those that are embodied in the mate-rials and services procured for the project.
A third method is risk assessment, some-thing that is especially important during times of rapid change, and yet largely ignored by ur-ban professionals. A full assessment of risk re-quires that cities consider a variety of future possibilities, and research the likely impact of trends in many areas, from climate change to technology. Scenario planning and adaptation are di1 cult but very rewarding exercises, and are a key part of the Eco2 Pathway.
A fourth and fi nal method is the overall valu-ation of city performance on an Eco2 Pathway as well as on a project by project basis by using the right set of indicators to assess costs and benefi ts. To some extent, the other methods generate monetary and other indicators of success, and can be used directly for valuation. However, as explained in Part One, we will be reviewing how to select indicators of performance that are use-ful to decision-makers at varying levels, and that cover the full range of assets within a city: manu-factured capital, natural capital, human capital, and social capital. The challenges are to fi nd ways to measure these assets that are balanced, a( ordable, dependable, and comparable, and to present the results in a format that can easily be understood by decision-makers.
This book does not address valuation given that city and project valuations are specifi c and contextual. However, the World Bank and the Eco2 Program dispose of myriad instruments to help cities in valuation activities.
Life Cycle Costing
One of the most signifi cant factors infl uencing decision-making about urban area develop-ment is the long-term impact on city fi nances
Figure 2.27. Building Life Cycle. The life cycle of a building is long, complex, and infl uenced by many different professionals.
Source: Karolina Brick, Barriers for Implementation of the Environmental Load Profi le and Other LCA-Based Tools (Stockholm: Royal Institute of Technology,
2008).
ECo2-Part2Final.indd 140 6/15/09 8:36:11 AM
A C I T Y- BA S E D D E C I S I O N S U P P O RT SYST E M | 141
and the costs for residents and businesses. Un-fortunately, when it comes to complex inte-grated designs that include new land use and new infrastructure, the costs and revenues are often very di1 cult to estimate. Good common sense arguments might exist for alternative Eco2 designs, but without accompanying fi -nancial analysis, decision-makers may be un-derstandably reluctant. This is especially true given prevalent misconceptions and misinfor-mation. Moreover, it is not always easy to rec-ognize the ‘win-win-win’ potential, and the as-sumption may be that change may be costly, at least until a fi nancial analysis is complete.
The debate over costs has two dimensions: what are the true costs over the long-term? And how equitably are costs and benefi ts distribut-ed? A Life Cycle Costing method is the only way to address both of these questions.
Life Cycle Costing (LCC) for urban infra-structure applies to everything—from build-ings to roads, pathways, right-of-ways, parking lots, wires, pipes, ditches, bridges, and the as-sociated treatment plants, sub-stations, open spaces, and facilities. Most of these infrastruc-ture elements have exceptionally long lifetimes and can account for large quantities of lifecycle material and energy fl ows. By adopting LCC, the design and purchasing choices can be ad-justed to optimise the system over its entire life. Sewer pipes, for example, may change from concrete to welded steel, if due consider-ation is given to durability, cleaning, mainte-nance, and other recurring costs over the full life of the system, and to the potential for adapt-ability and recycling. Road surfaces may change from asphalt to concrete, if due consideration is given to the improved e1 ciency and fuel sav-ings achieved by trucks tires on concrete. Lin-ear in-the-ground infrastructure grids may adopt ‘combined trenching’ and easily accessed ‘utilidors,’ if these are shown to o( er greater adaptability and lower operating costs over the long life cycle of such systems. LCC can pro-duce even greater changes in practices for spa-tial planning, as described in Part One.
Application of LCC to integrated Land Use
and Community Infrastructure Planning
LCC can assist with the evaluation of alterna-tive spatial planning activities by providing credible estimates of the full long-term costs for infrastructure and impacts on taxes, fi scal health, a( ordable housing, and commercial space. The benefi ts are best under-stood by describing a specifi c ex-ample where LCC has been applied. The example presented here is based on a tool developed by a Ca-nadian public agency for use in inte-grated design exercises. The tool, entitled Life Cycle Costing Tool for Community Infrastructure Planning,
allows users to estimate the major costs of community development, particularly those that change with di( erent forms of develop-ment (for example, linear infrastructure) and to compare alternative development scenarios. The tool is geared towards estimating planning level costs and revenues associated with the residential component of a development, al-though fi nancial impacts of commercial and other types of development can be incorporat-ed provided that infrastructure requirements are specifi ed correctly. The tool is suited to as-sessing development projects ranging in size from a collection of houses to a block-by-block infi ll development to an entire subdivision or neighbourhood. A good measure of the appli-cability of the tool to a given project is whether or not alternatives can be conceived that would result in signifi cantly di( erent densities or in-frastructure requirements, or make use of dif-ferent green infrastructure alternatives.
This tool is a spreadsheet (Excel) based ap-plication that makes it quick and easy to esti-mate life cycle costs for almost any type of land use and infrastructure alternative. The tool in-cludes costing variables with default values that can be adjusted to match the local or national costs for the city location. Outputs include an integrated fi nancial assessment with monetary values for the following major categories:
!"#$%%&'($)*+",-%./
Note: Life Cycle Costing
Software available from
Canada Mortgage and
Housing Corporation
ECo2-Part2Final.indd 141 6/15/09 8:36:12 AM
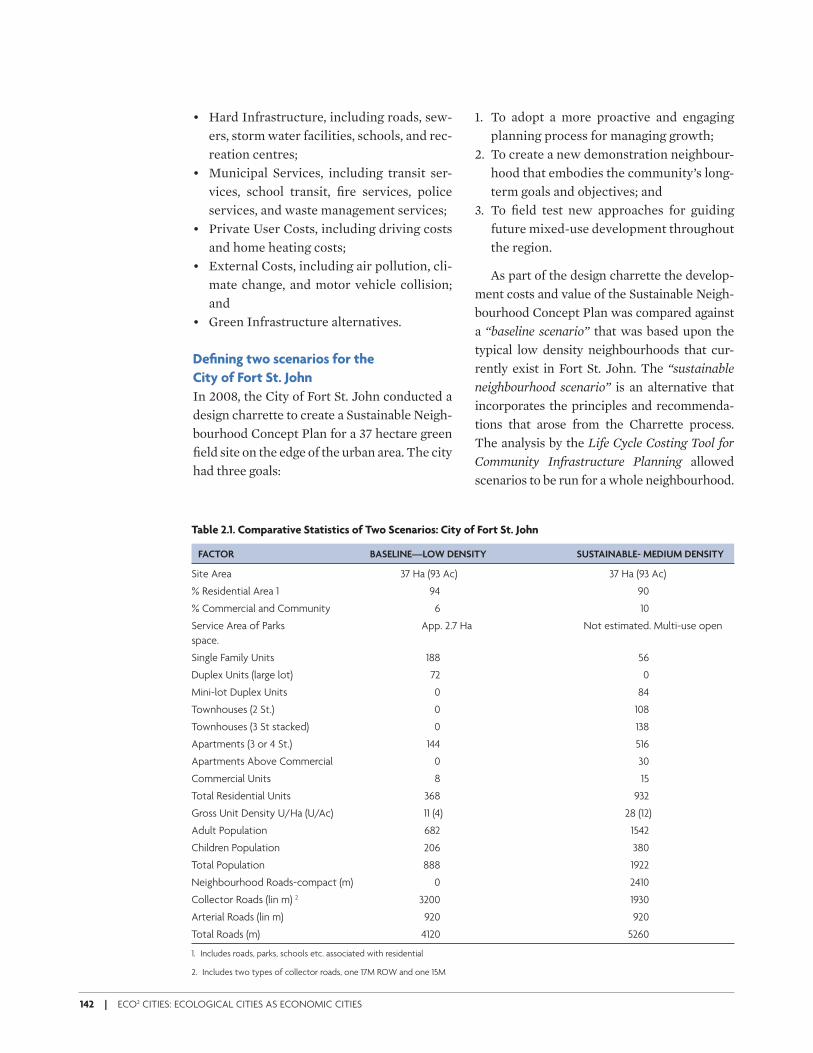
142 | ECO2 CITIES: ECOLOGICAL CITIES AS ECONOMIC CITIES
• Hard Infrastructure, including roads, sew-ers, storm water facilities, schools, and rec-reation centres;
• Municipal Services, including transit ser-vices, school transit, fi re services, police services, and waste management services;
• Private User Costs, including driving costs and home heating costs;
• External Costs, including air pollution, cli-mate change, and motor vehicle collision; and
• Green Infrastructure alternatives.
Defi ning two scenarios for the
City of Fort St. John
In 2008, the City of Fort St. John conducted a design charrette to create a Sustainable Neigh-bourhood Concept Plan for a 37 hectare green fi eld site on the edge of the urban area. The city had three goals:
1. To adopt a more proactive and engaging planning process for managing growth;
2. To create a new demonstration neighbour-hood that embodies the community’s long-term goals and objectives; and
3. To fi eld test new approaches for guiding future mixed-use development throughout the region.
As part of the design charrette the develop-ment costs and value of the Sustainable Neigh-bourhood Concept Plan was compared against a “baseline scenario” that was based upon the typical low density neighbourhoods that cur-rently exist in Fort St. John. The “sustainable neighbourhood scenario” is an alternative that incorporates the principles and recommenda-tions that arose from the Charrette process. The analysis by the Life Cycle Costing Tool for Community Infrastructure Planning allowed scenarios to be run for a whole neighbourhood.
Table 2.1. Comparative Statistics of Two Scenarios: City of Fort St. John
FACTOR BASELINE—LOW DENSITY SUSTAINABLE- MEDIUM DENSITY
Site Area 37 Ha (93 Ac) 37 Ha (93 Ac)
% Residential Area 1 94 90
% Commercial and Community 6 10
Service Area of Parks App. 2.7 Ha Not estimated. Multi-use open
space.
Single Family Units 188 56
Duplex Units (large lot) 72 0
Mini-lot Duplex Units 0 84
Townhouses (2 St.) 0 108
Townhouses (3 St stacked) 0 138
Apartments (3 or 4 St.) 144 516
Apartments Above Commercial 0 30
Commercial Units 8 15
Total Residential Units 368 932
Gross Unit Density U/Ha (U/Ac) 11 (4) 28 (12)
Adult Population 682 1542
Children Population 206 380
Total Population 888 1922
Neighbourhood Roads-compact (m) 0 2410
Collector Roads (lin m) 2 3200 1930
Arterial Roads (lin m) 920 920
Total Roads (m) 4120 5260
1. Includes roads, parks, schools etc. associated with residential
2. Includes two types of collector roads, one 17M ROW and one 15M
ECo2-Part2Final.indd 142 6/15/09 8:36:12 AM
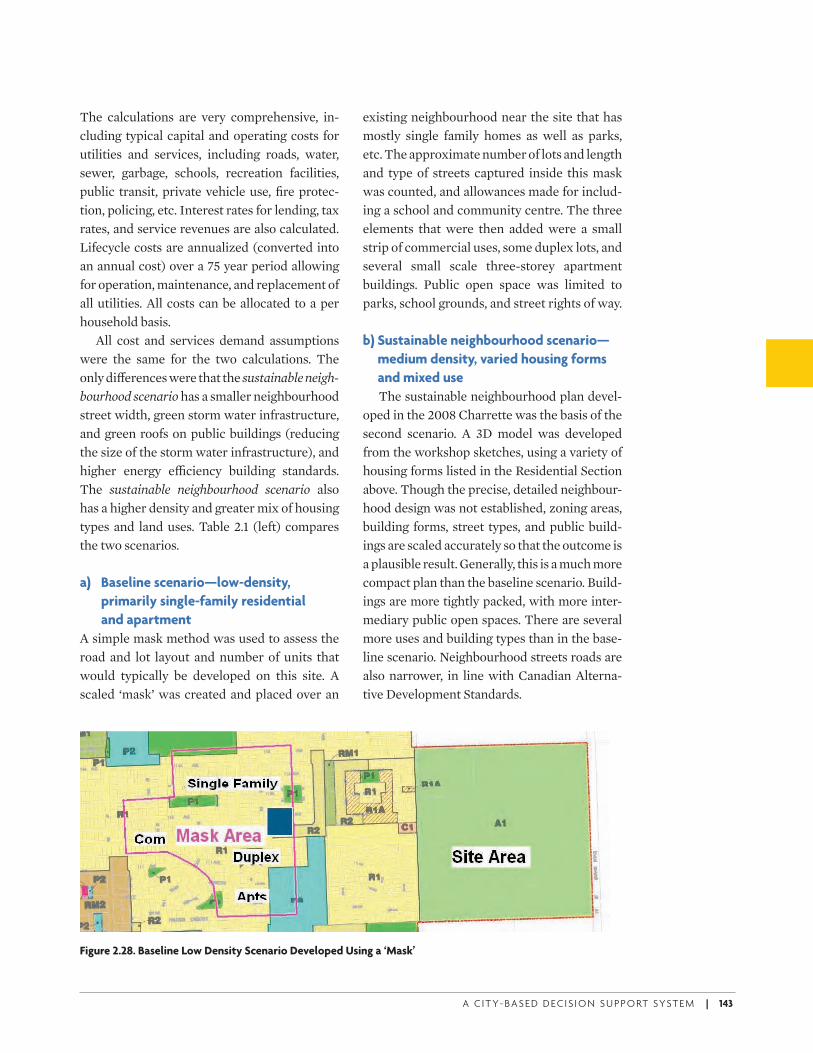
A C I T Y- BA S E D D E C I S I O N S U P P O RT SYST E M | 143
The calculations are very comprehensive, in-cluding typical capital and operating costs for utilities and services, including roads, water, sewer, garbage, schools, recreation facilities, public transit, private vehicle use, fi re protec-tion, policing, etc. Interest rates for lending, tax rates, and service revenues are also calculated. Lifecycle costs are annualized (converted into an annual cost) over a 75 year period allowing for operation, maintenance, and replacement of all utilities. All costs can be allocated to a per household basis.
All cost and services demand assumptions were the same for the two calculations. The only di( erences were that the sustainable neigh-bourhood scenario has a smaller neighbourhood street width, green storm water infrastructure, and green roofs on public buildings (reducing the size of the storm water infrastructure), and higher energy e1 ciency building standards. The sustainable neighbourhood scenario also has a higher density and greater mix of housing types and land uses. Table 2.1 (left) compares the two scenarios.
a) Baseline scenario—low-density,
primarily single-family residential
and apartment
A simple mask method was used to assess the road and lot layout and number of units that would typically be developed on this site. A scaled ‘mask’ was created and placed over an
existing neighbourhood near the site that has mostly single family homes as well as parks, etc. The approximate number of lots and length and type of streets captured inside this mask was counted, and allowances made for includ-ing a school and community centre. The three elements that were then added were a small strip of commercial uses, some duplex lots, and several small scale three-storey apartment buildings. Public open space was limited to parks, school grounds, and street rights of way.
b) Sustainable neighbourhood scenario—
medium density, varied housing forms
and mixed use
The sustainable neighbourhood plan devel-oped in the 2008 Charrette was the basis of the second scenario. A 3D model was developed from the workshop sketches, using a variety of housing forms listed in the Residential Section above. Though the precise, detailed neighbour-hood design was not established, zoning areas, building forms, street types, and public build-ings are scaled accurately so that the outcome is a plausible result. Generally, this is a much more compact plan than the baseline scenario. Build-ings are more tightly packed, with more inter-mediary public open spaces. There are several more uses and building types than in the base-line scenario. Neighbourhood streets roads are also narrower, in line with Canadian Alterna-tive Development Standards.
Figure 2.28. Baseline Low Density Scenario Developed Using a ‘Mask’
ECo2-Part2Final.indd 143 6/15/09 8:36:12 AM
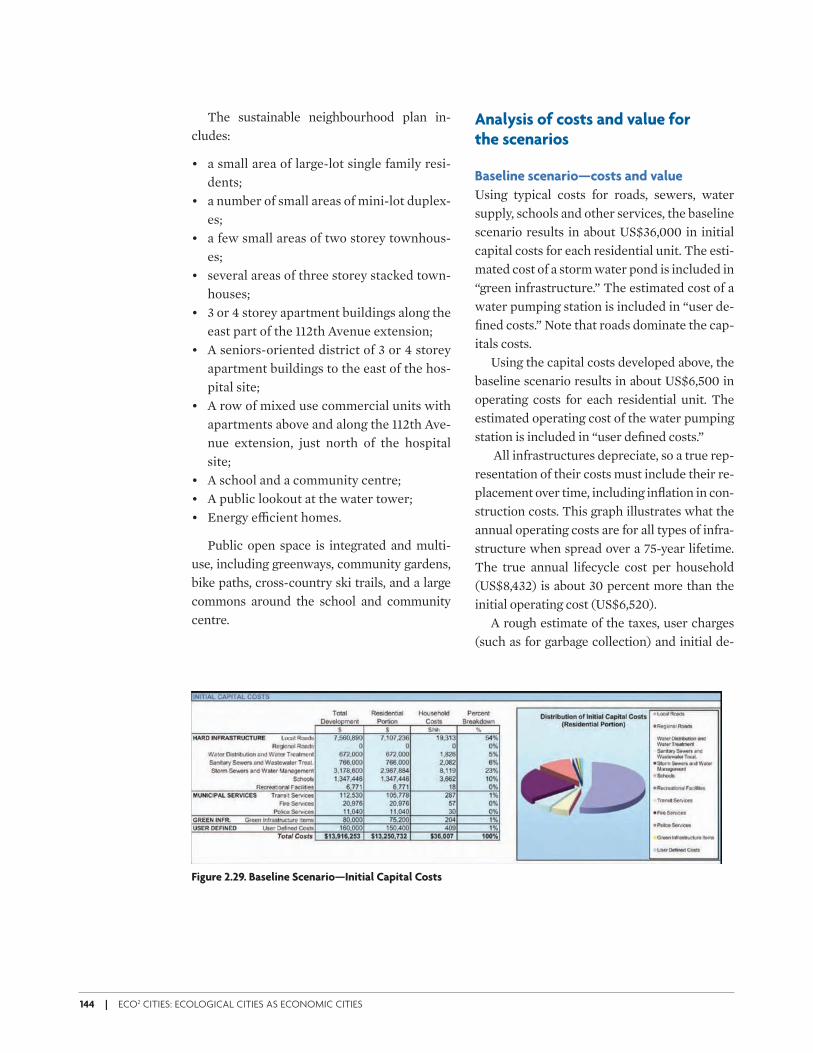
144 | ECO2 CITIES: ECOLOGICAL CITIES AS ECONOMIC CITIES
The sustainable neighbourhood plan in-cludes:
• a small area of large-lot single family resi-dents;
• a number of small areas of mini-lot duplex-es;
• a few small areas of two storey townhous-es;
• several areas of three storey stacked town-houses;
• 3 or 4 storey apartment buildings along the east part of the 112th Avenue extension;
• A seniors-oriented district of 3 or 4 storey apartment buildings to the east of the hos-pital site;
• A row of mixed use commercial units with apartments above and along the 112th Ave-nue extension, just north of the hospital site;
• A school and a community centre;• A public lookout at the water tower;• Energy e1 cient homes.
Public open space is integrated and multi-use, including greenways, community gardens, bike paths, cross-country ski trails, and a large commons around the school and community centre.
Analysis of costs and value for the scenarios
Baseline scenario—costs and value
Using typical costs for roads, sewers, water supply, schools and other services, the baseline scenario results in about US$36,000 in initial capital costs for each residential unit. The esti-mated cost of a storm water pond is included in “green infrastructure.” The estimated cost of a water pumping station is included in “user de-fi ned costs.” Note that roads dominate the cap-itals costs.
Using the capital costs developed above, the baseline scenario results in about US$6,500 in operating costs for each residential unit. The estimated operating cost of the water pumping station is included in “user defi ned costs.”
All infrastructures depreciate, so a true rep-resentation of their costs must include their re-placement over time, including infl ation in con-struction costs. This graph illustrates what the annual operating costs are for all types of infra-structure when spread over a 75-year lifetime. The true annual lifecycle cost per household (US$8,432) is about 30 percent more than the initial operating cost (US$6,520).
A rough estimate of the taxes, user charges (such as for garbage collection) and initial de-
Figure 2.29. Baseline Scenario—Initial Capital Costs
ECo2-Part2Final.indd 144 6/15/09 8:36:12 AM
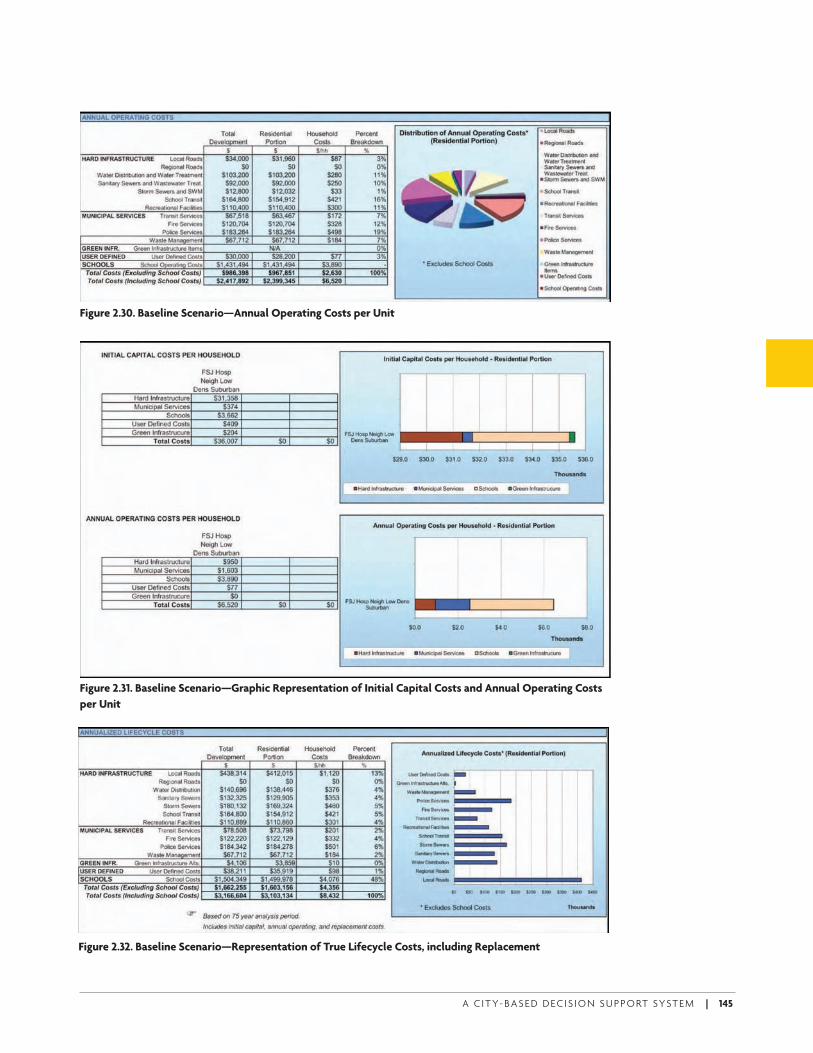
A C I T Y- BA S E D D E C I S I O N S U P P O RT SYST E M | 145
Figure 2.30. Baseline Scenario—Annual Operating Costs per Unit
Figure 2.31. Baseline Scenario—Graphic Representation of Initial Capital Costs and Annual Operating Costs
per Unit
Figure 2.32. Baseline Scenario—Representation of True Lifecycle Costs, including Replacement
ECo2-Part2Final.indd 145 6/15/09 8:36:13 AM
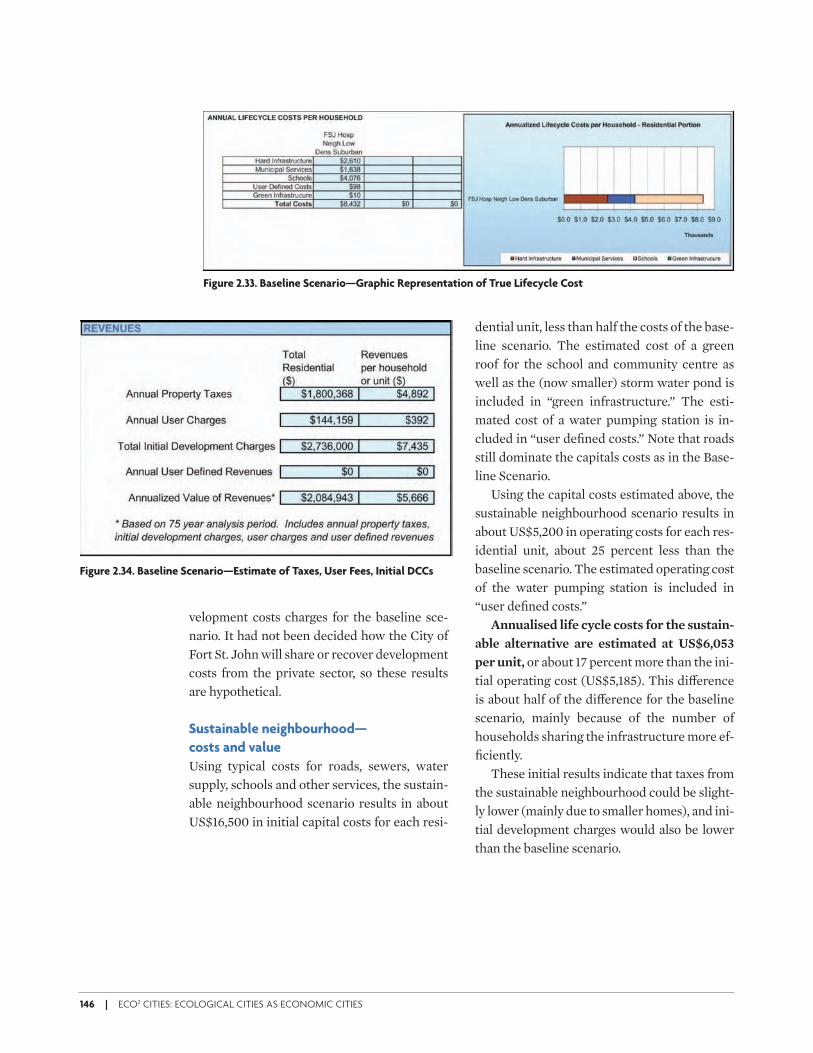
146 | ECO2 CITIES: ECOLOGICAL CITIES AS ECONOMIC CITIES
velopment costs charges for the baseline sce-nario. It had not been decided how the City of Fort St. John will share or recover development costs from the private sector, so these results are hypothetical.
Sustainable neighbourhood—
costs and value
Using typical costs for roads, sewers, water supply, schools and other services, the sustain-able neighbourhood scenario results in about US$16,500 in initial capital costs for each resi-
Figure 2.33. Baseline Scenario—Graphic Representation of True Lifecycle Cost
Figure 2.34. Baseline Scenario—Estimate of Taxes, User Fees, Initial DCCs
dential unit, less than half the costs of the base-line scenario. The estimated cost of a green roof for the school and community centre as well as the (now smaller) storm water pond is included in “green infrastructure.” The esti-mated cost of a water pumping station is in-cluded in “user defi ned costs.” Note that roads still dominate the capitals costs as in the Base-line Scenario.
Using the capital costs estimated above, the sustainable neighbourhood scenario results in about US$5,200 in operating costs for each res-idential unit, about 25 percent less than the baseline scenario. The estimated operating cost of the water pumping station is included in “user defi ned costs.”
Annualised life cycle costs for the sustain-
able alternative are estimated at US$6,053
per unit, or about 17 percent more than the ini-tial operating cost (US$5,185). This di( erence is about half of the di( erence for the baseline scenario, mainly because of the number of households sharing the infrastructure more ef-fi ciently.
These initial results indicate that taxes from the sustainable neighbourhood could be slight-ly lower (mainly due to smaller homes), and ini-tial development charges would also be lower than the baseline scenario.
ECo2-Part2Final.indd 146 6/15/09 8:36:15 AM
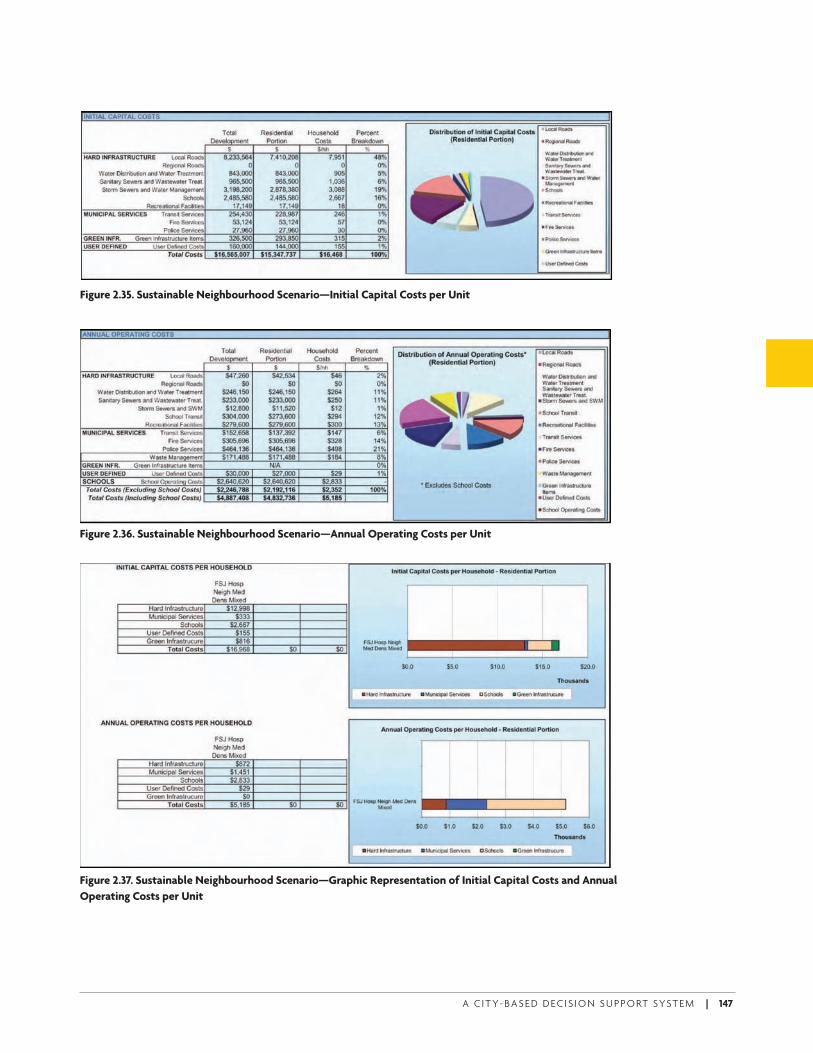
A C I T Y- BA S E D D E C I S I O N S U P P O RT SYST E M | 147
Figure 2.35. Sustainable Neighbourhood Scenario—Initial Capital Costs per Unit
Figure 2.36. Sustainable Neighbourhood Scenario—Annual Operating Costs per Unit
Figure 2.37. Sustainable Neighbourhood Scenario—Graphic Representation of Initial Capital Costs and Annual
Operating Costs per Unit
ECo2-Part2Final.indd 147 6/15/09 8:36:16 AM
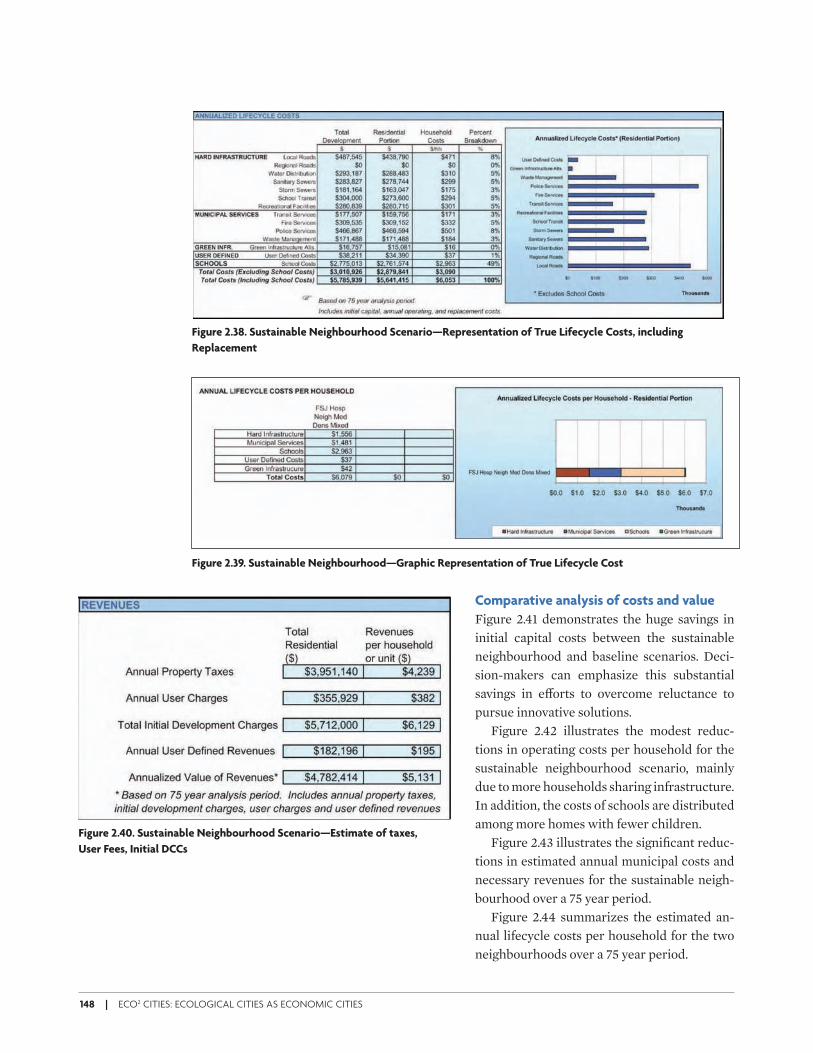
148 | ECO2 CITIES: ECOLOGICAL CITIES AS ECONOMIC CITIES
Comparative analysis of costs and value
Figure 2.41 demonstrates the huge savings in initial capital costs between the sustainable neighbourhood and baseline scenarios. Deci-sion-makers can emphasize this substantial savings in e( orts to overcome reluctance to pursue innovative solutions.
Figure 2.42 illustrates the modest reduc-tions in operating costs per household for the sustainable neighbourhood scenario, mainly due to more households sharing infrastructure. In addition, the costs of schools are distributed among more homes with fewer children.
Figure 2.43 illustrates the signifi cant reduc-tions in estimated annual municipal costs and necessary revenues for the sustainable neigh-bourhood over a 75 year period.
Figure 2.44 summarizes the estimated an-nual lifecycle costs per household for the two neighbourhoods over a 75 year period.
Figure 2.38. Sustainable Neighbourhood Scenario—Representation of True Lifecycle Costs, including
Replacement
Figure 2.39. Sustainable Neighbourhood—Graphic Representation of True Lifecycle Cost
Figure 2.40. Sustainable Neighbourhood Scenario—Estimate of taxes,
User Fees, Initial DCCs
ECo2-Part2Final.indd 148 6/15/09 8:36:18 AM
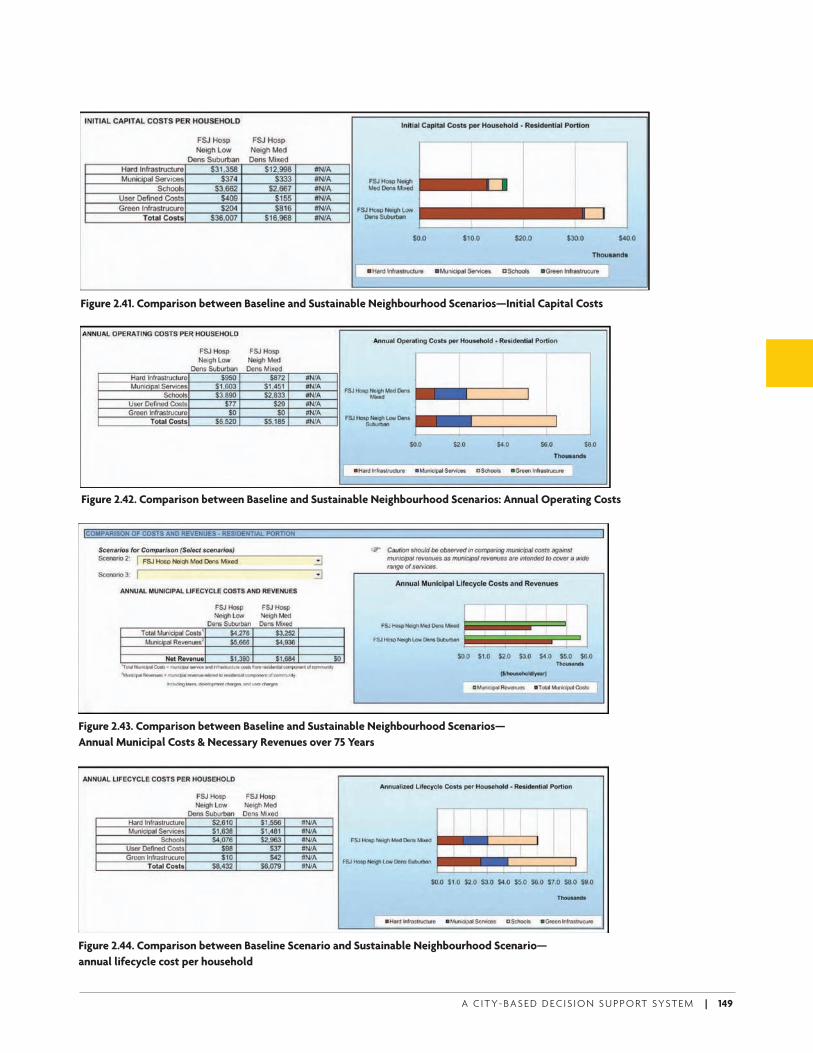
A C I T Y- BA S E D D E C I S I O N S U P P O RT SYST E M | 149
Figure 2.42. Comparison between Baseline and Sustainable Neighbourhood Scenarios: Annual Operating Costs
Figure 2.41. Comparison between Baseline and Sustainable Neighbourhood Scenarios—Initial Capital Costs
Figure 2.43. Comparison between Baseline and Sustainable Neighbourhood Scenarios—
Annual Municipal Costs & Necessary Revenues over 75 Years
Figure 2.44. Comparison between Baseline Scenario and Sustainable Neighbourhood Scenario—
annual lifecycle cost per household
ECo2-Part2Final.indd 149 6/15/09 8:36:20 AM
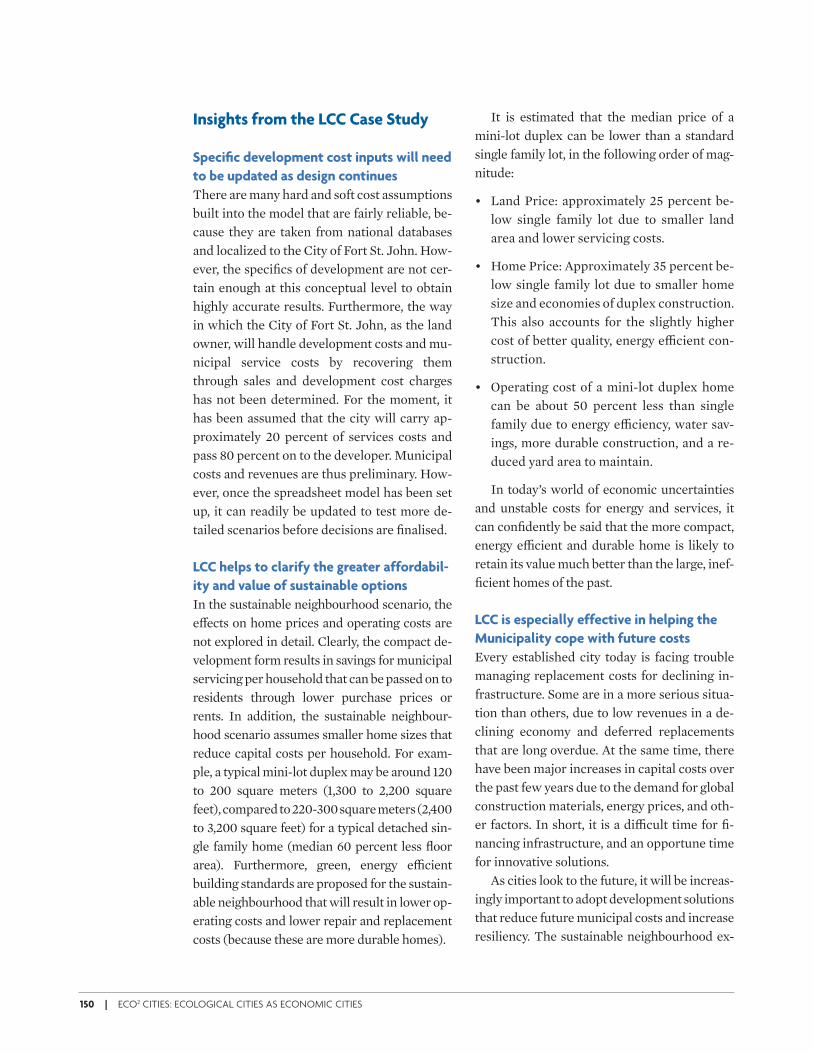
150 | ECO2 CITIES: ECOLOGICAL CITIES AS ECONOMIC CITIES
Insights from the LCC Case Study
Specifi c development cost inputs will need
to be updated as design continues
There are many hard and soft cost assumptions built into the model that are fairly reliable, be-cause they are taken from national databases and localized to the City of Fort St. John. How-ever, the specifi cs of development are not cer-tain enough at this conceptual level to obtain highly accurate results. Furthermore, the way in which the City of Fort St. John, as the land owner, will handle development costs and mu-nicipal service costs by recovering them through sales and development cost charges has not been determined. For the moment, it has been assumed that the city will carry ap-proximately 20 percent of services costs and pass 80 percent on to the developer. Municipal costs and revenues are thus preliminary. How-ever, once the spreadsheet model has been set up, it can readily be updated to test more de-tailed scenarios before decisions are fi nalised.
LCC helps to clarify the greater affordabil-
ity and value of sustainable options
In the sustainable neighbourhood scenario, the e( ects on home prices and operating costs are not explored in detail. Clearly, the compact de-velopment form results in savings for municipal servicing per household that can be passed on to residents through lower purchase prices or rents. In addition, the sustainable neighbour-hood scenario assumes smaller home sizes that reduce capital costs per household. For exam-ple, a typical mini-lot duplex may be around 120 to 200 square meters (1,300 to 2,200 square feet), compared to 220-300 square meters (2,400 to 3,200 square feet) for a typical detached sin-gle family home (median 60 percent less fl oor area). Furthermore, green, energy e1 cient building standards are proposed for the sustain-able neighbourhood that will result in lower op-erating costs and lower repair and replacement costs (because these are more durable homes).
It is estimated that the median price of a mini-lot duplex can be lower than a standard single family lot, in the following order of mag-nitude:
• Land Price: approximately 25 percent be-low single family lot due to smaller land area and lower servicing costs.
• Home Price: Approximately 35 percent be-low single family lot due to smaller home size and economies of duplex construction. This also accounts for the slightly higher cost of better quality, energy e1 cient con-struction.
• Operating cost of a mini-lot duplex home can be about 50 percent less than single family due to energy e1 ciency, water sav-ings, more durable construction, and a re-duced yard area to maintain.
In today’s world of economic uncertainties and unstable costs for energy and services, it can confi dently be said that the more compact, energy e1 cient and durable home is likely to retain its value much better than the large, inef-fi cient homes of the past.
LCC is especially effective in helping the
Municipality cope with future costs
Every established city today is facing trouble managing replacement costs for declining in-frastructure. Some are in a more serious situa-tion than others, due to low revenues in a de-clining economy and deferred replacements that are long overdue. At the same time, there have been major increases in capital costs over the past few years due to the demand for global construction materials, energy prices, and oth-er factors. In short, it is a di1 cult time for fi -nancing infrastructure, and an opportune time for innovative solutions.
As cities look to the future, it will be increas-ingly important to adopt development solutions that reduce future municipal costs and increase resiliency. The sustainable neighbourhood ex-
ECo2-Part2Final.indd 150 6/15/09 8:36:22 AM
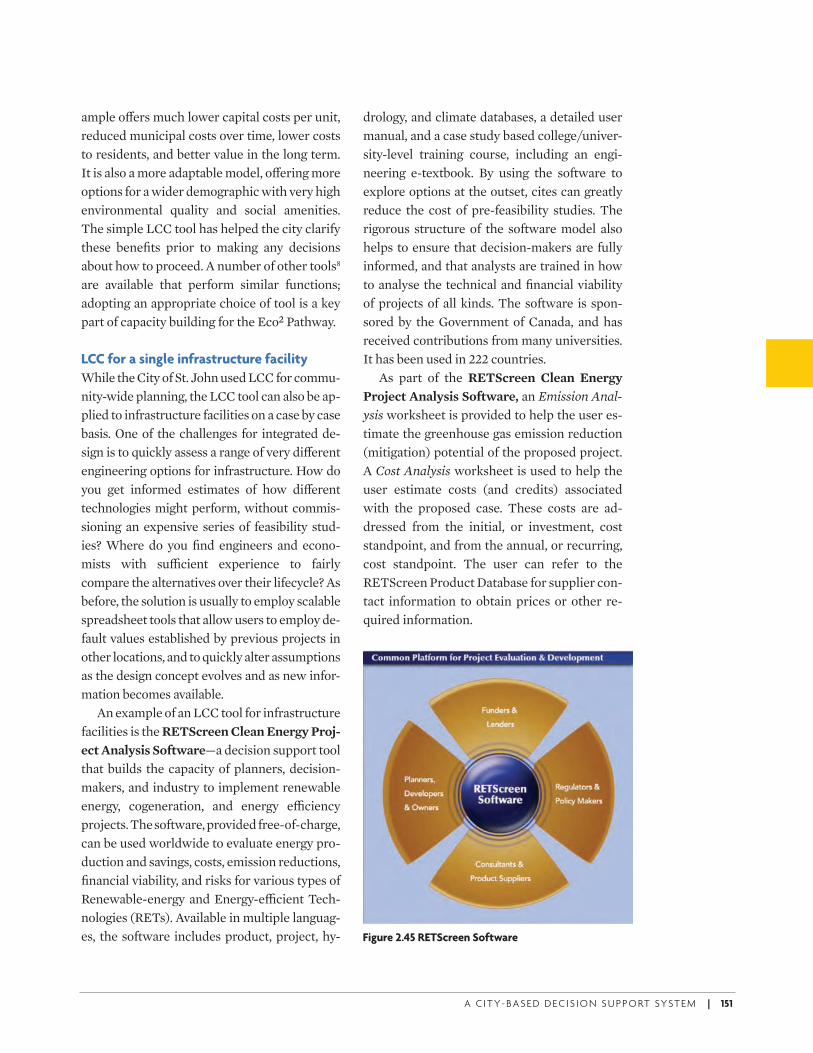
A C I T Y- BA S E D D E C I S I O N S U P P O RT SYST E M | 151
ample o( ers much lower capital costs per unit, reduced municipal costs over time, lower costs to residents, and better value in the long term. It is also a more adaptable model, o( ering more options for a wider demographic with very high environmental quality and social amenities. The simple LCC tool has helped the city clarify these benefi ts prior to making any decisions about how to proceed. A number of other tools8 are available that perform similar functions; adopting an appropriate choice of tool is a key part of capacity building for the Eco2 Pathway.
LCC for a single infrastructure facility
While the City of St. John used LCC for commu-nity-wide planning, the LCC tool can also be ap-plied to infrastructure facilities on a case by case basis. One of the challenges for integrated de-sign is to quickly assess a range of very di( erent engineering options for infrastructure. How do you get informed estimates of how di( erent technologies might perform, without commis-sioning an expensive series of feasibility stud-ies? Where do you fi nd engineers and econo-mists with su1 cient experience to fairly compare the alternatives over their lifecycle? As before, the solution is usually to employ scalable spreadsheet tools that allow users to employ de-fault values established by previous projects in other locations, and to quickly alter assumptions as the design concept evolves and as new infor-mation becomes available.
An example of an LCC tool for infrastructure facilities is the RETScreen Clean Energy Proj-ect Analysis Software—a decision support tool that builds the capacity of planners, decision-makers, and industry to implement renewable energy, cogeneration, and energy e1 ciency projects. The software, provided free-of-charge, can be used worldwide to evaluate energy pro-duction and savings, costs, emission reductions, fi nancial viability, and risks for various types of Renewable-energy and Energy-e1 cient Tech-nologies (RETs). Available in multiple languag-es, the software includes product, project, hy-
drology, and climate databases, a detailed user manual, and a case study based college/univer-sity-level training course, including an engi-neering e-textbook. By using the software to explore options at the outset, cites can greatly reduce the cost of pre-feasibility studies. The rigorous structure of the software model also helps to ensure that decision-makers are fully informed, and that analysts are trained in how to analyse the technical and fi nancial viability of projects of all kinds. The software is spon-sored by the Government of Canada, and has received contributions from many universities. It has been used in 222 countries.
As part of the RETScreen Clean Energy Project Analysis Software, an Emission Anal-
ysis worksheet is provided to help the user es-timate the greenhouse gas emission reduction (mitigation) potential of the proposed project. A Cost Analysis worksheet is used to help the user estimate costs (and credits) associated with the proposed case. These costs are ad-dressed from the initial, or investment, cost standpoint, and from the annual, or recurring, cost standpoint. The user can refer to the RETScreen Product Database for supplier con-tact information to obtain prices or other re-quired information.
Figure 2.45 RETScreen Software
ECo2-Part2Final.indd 151 6/15/09 8:36:22 AM
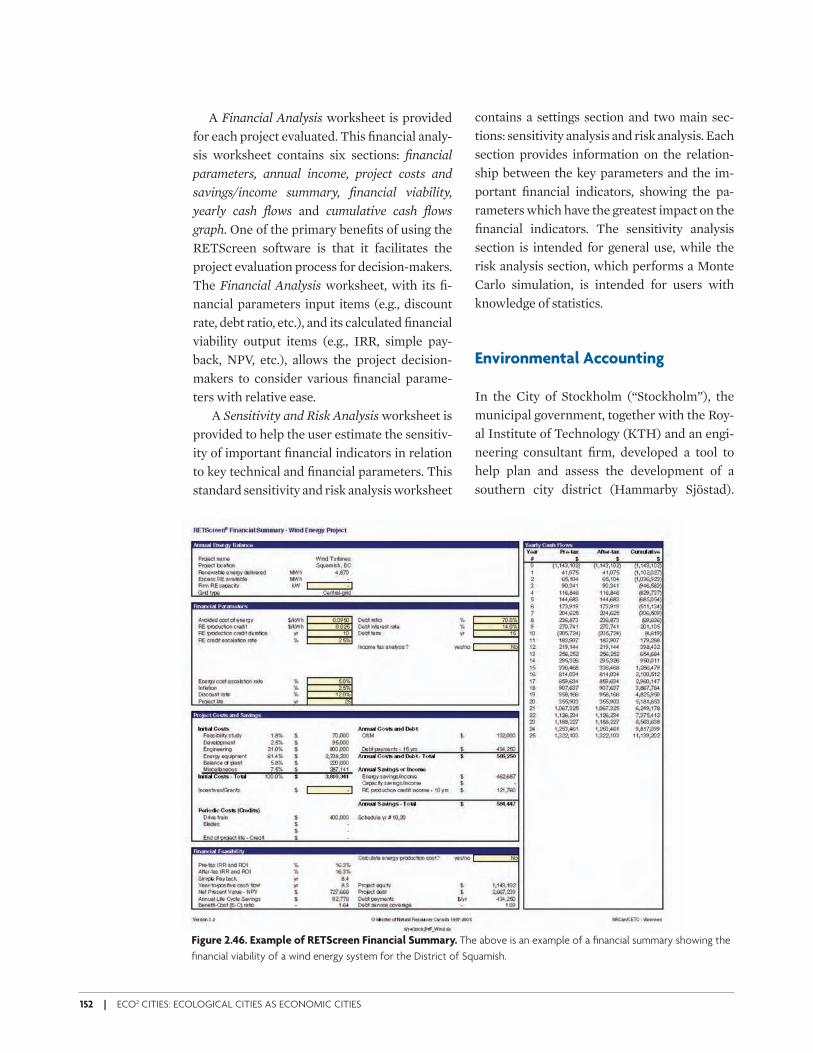
152 | ECO2 CITIES: ECOLOGICAL CITIES AS ECONOMIC CITIES
A Financial Analysis worksheet is provided for each project evaluated. This fi nancial analy-sis worksheet contains six sections: fi nancial parameters, annual income, project costs and
savings/income summary, fi nancial viability,
yearly cash fl ows and cumulative cash fl ows
graph. One of the primary benefi ts of using the RETScreen software is that it facilitates the project evaluation process for decision-makers. The Financial Analysis worksheet, with its fi -nancial parameters input items (e.g., discount rate, debt ratio, etc.), and its calculated fi nancial viability output items (e.g., IRR, simple pay-back, NPV, etc.), allows the project decision-makers to consider various fi nancial parame-ters with relative ease.
A Sensitivity and Risk Analysis worksheet is provided to help the user estimate the sensitiv-ity of important fi nancial indicators in relation to key technical and fi nancial parameters. This standard sensitivity and risk analysis worksheet
contains a settings section and two main sec-tions: sensitivity analysis and risk analysis. Each section provides information on the relation-ship between the key parameters and the im-portant fi nancial indicators, showing the pa-rameters which have the greatest impact on the fi nancial indicators. The sensitivity analysis section is intended for general use, while the risk analysis section, which performs a Monte Carlo simulation, is intended for users with knowledge of statistics.
Environmental Accounting
In the City of Stockholm (“Stockholm”), the municipal government, together with the Roy-al Institute of Technology (KTH) and an engi-neering consultant fi rm, developed a tool to help plan and assess the development of a southern city district (Hammarby Sjöstad).
Figure 2.46. Example of RETScreen Financial Summary. The above is an example of a fi nancial summary showing the
fi nancial viability of a wind energy system for the District of Squamish.
ECo2-Part2Final.indd 152 6/15/09 8:36:22 AM
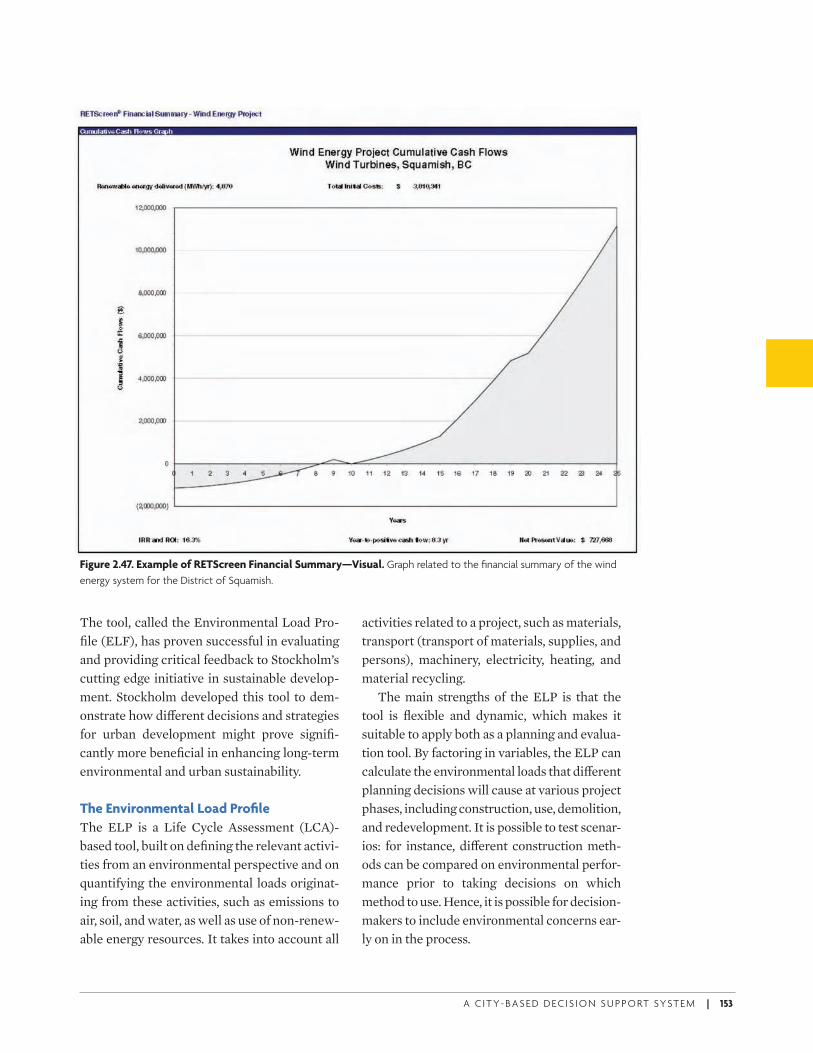
A C I T Y- BA S E D D E C I S I O N S U P P O RT SYST E M | 153
The tool, called the Environmental Load Pro-fi le (ELF), has proven successful in evaluating and providing critical feedback to Stockholm’s cutting edge initiative in sustainable develop-ment. Stockholm developed this tool to dem-onstrate how di( erent decisions and strategies for urban development might prove signifi -cantly more benefi cial in enhancing long-term environmental and urban sustainability.
The Environmental Load Profi le
The ELP is a Life Cycle Assessment (LCA)-based tool, built on defi ning the relevant activi-ties from an environmental perspective and on quantifying the environmental loads originat-ing from these activities, such as emissions to air, soil, and water, as well as use of non-renew-able energy resources. It takes into account all
activities related to a project, such as materials, transport (transport of materials, supplies, and persons), machinery, electricity, heating, and material recycling.
The main strengths of the ELP is that the tool is fl exible and dynamic, which makes it suitable to apply both as a planning and evalua-tion tool. By factoring in variables, the ELP can calculate the environmental loads that di( erent planning decisions will cause at various project phases, including construction, use, demolition, and redevelopment. It is possible to test scenar-ios: for instance, di( erent construction meth-ods can be compared on environmental perfor-mance prior to taking decisions on which method to use. Hence, it is possible for decision-makers to include environmental concerns ear-ly on in the process.
Figure 2.47. Example of RETScreen Financial Summary—Visual. Graph related to the fi nancial summary of the wind
energy system for the District of Squamish.
ECo2-Part2Final.indd 153 6/15/09 8:36:24 AM
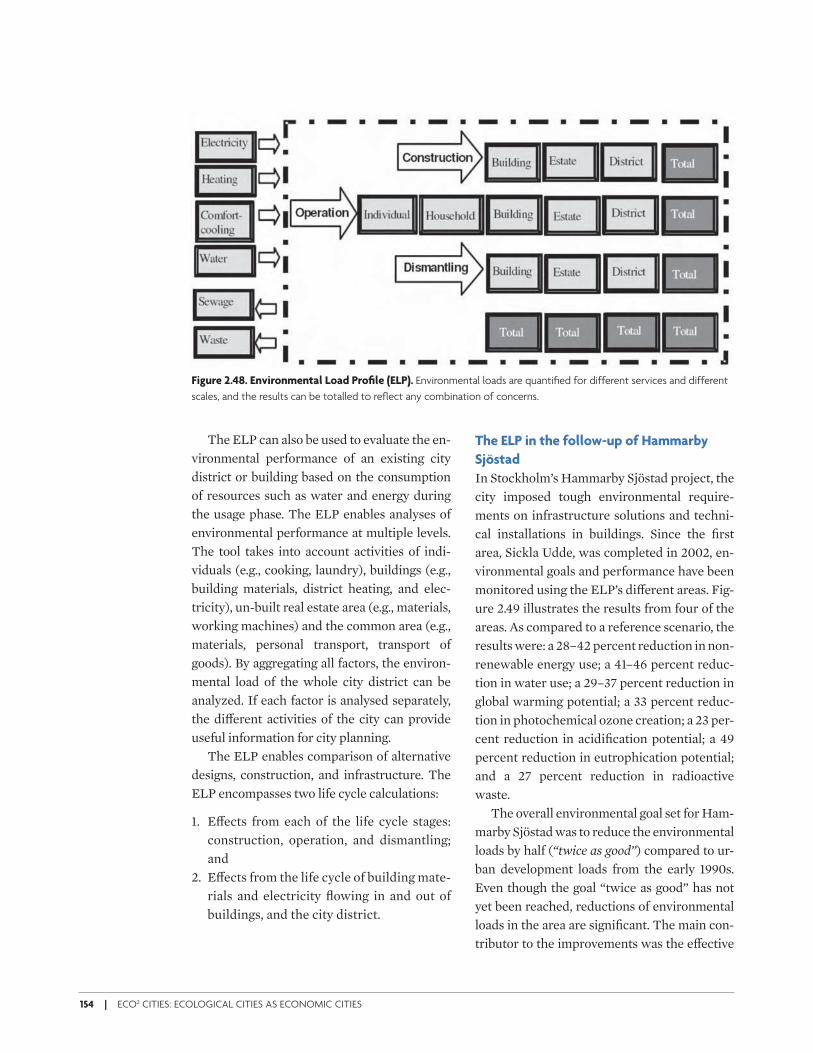
154 | ECO2 CITIES: ECOLOGICAL CITIES AS ECONOMIC CITIES
The ELP can also be used to evaluate the en-vironmental performance of an existing city district or building based on the consumption of resources such as water and energy during the usage phase. The ELP enables analyses of environmental performance at multiple levels. The tool takes into account activities of indi-viduals (e.g., cooking, laundry), buildings (e.g., building materials, district heating, and elec-tricity), un-built real estate area (e.g., materials, working machines) and the common area (e.g., materials, personal transport, transport of goods). By aggregating all factors, the environ-mental load of the whole city district can be analyzed. If each factor is analysed separately, the di( erent activities of the city can provide useful information for city planning.
The ELP enables comparison of alternative designs, construction, and infrastructure. The ELP encompasses two life cycle calculations:
1. E( ects from each of the life cycle stages: construction, operation, and dismantling; and
2. E( ects from the life cycle of building mate-rials and electricity fl owing in and out of buildings, and the city district.
The ELP in the follow-up of Hammarby
Sjöstad
In Stockholm’s Hammarby Sjöstad project, the city imposed tough environmental require-ments on infrastructure solutions and techni-cal installations in buildings. Since the fi rst area, Sickla Udde, was completed in 2002, en-vironmental goals and performance have been monitored using the ELP’s di( erent areas. Fig-ure 2.49 illustrates the results from four of the areas. As compared to a reference scenario, the results were: a 28–42 percent reduction in non-renewable energy use; a 41–46 percent reduc-tion in water use; a 29–37 percent reduction in global warming potential; a 33 percent reduc-tion in photochemical ozone creation; a 23 per-cent reduction in acidifi cation potential; a 49 percent reduction in eutrophication potential; and a 27 percent reduction in radioactive waste.
The overall environmental goal set for Ham-marby Sjöstad was to reduce the environmental loads by half (“twice as good”) compared to ur-ban development loads from the early 1990s. Even though the goal “twice as good” has not yet been reached, reductions of environmental loads in the area are signifi cant. The main con-tributor to the improvements was the e( ective
Figure 2.48. Environmental Load Profi le (ELP). Environmental loads are quantifi ed for different services and different
scales, and the results can be totalled to refl ect any combination of concerns.
ECo2-Part2Final.indd 154 6/15/09 8:36:25 AM
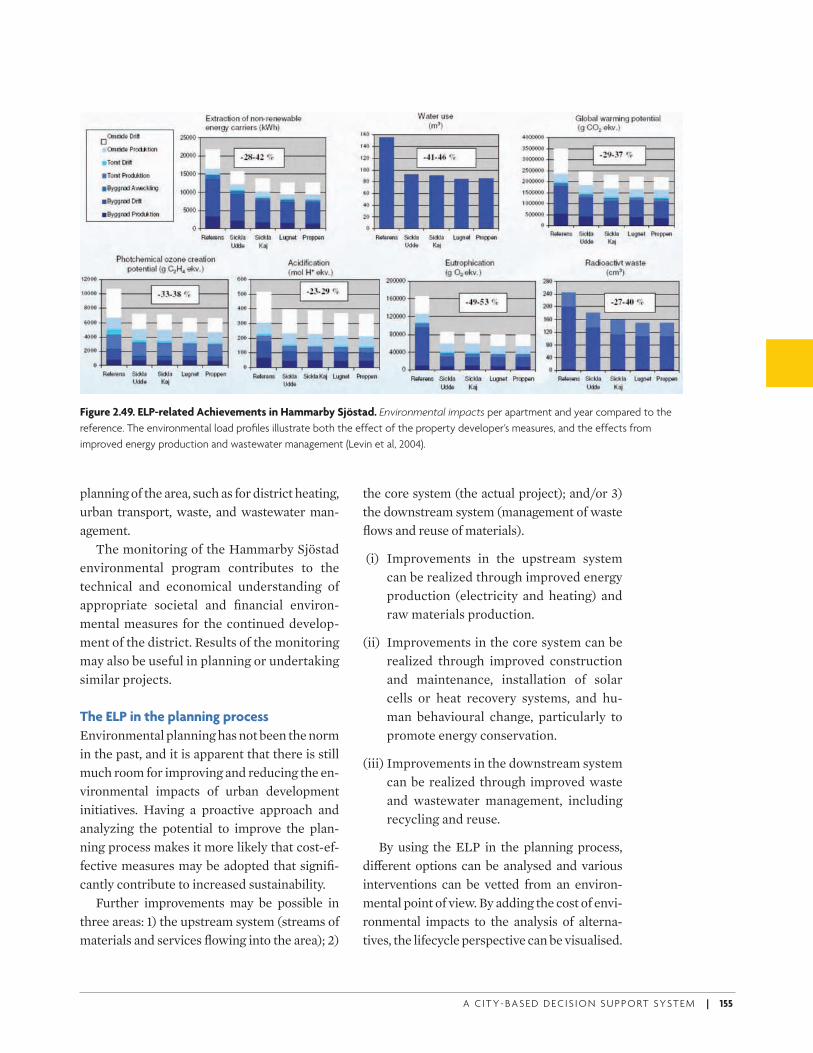
A C I T Y- BA S E D D E C I S I O N S U P P O RT SYST E M | 155
planning of the area, such as for district heating, urban transport, waste, and wastewater man-agement.
The monitoring of the Hammarby Sjöstad environmental program contributes to the technical and economical understanding of appropriate societal and fi nancial environ-mental measures for the continued develop-ment of the district. Results of the monitoring may also be useful in planning or undertaking similar projects.
The ELP in the planning process
Environmental planning has not been the norm in the past, and it is apparent that there is still much room for improving and reducing the en-vironmental impacts of urban development initiatives. Having a proactive approach and analyzing the potential to improve the plan-ning process makes it more likely that cost-ef-fective measures may be adopted that signifi -cantly contribute to increased sustainability.
Further improvements may be possible in three areas: 1) the upstream system (streams of materials and services fl owing into the area); 2)
the core system (the actual project); and/or 3) the downstream system (management of waste fl ows and reuse of materials).
(i) Improvements in the upstream system can be realized through improved energy production (electricity and heating) and raw materials production.
(ii) Improvements in the core system can be realized through improved construction and maintenance, installation of solar cells or heat recovery systems, and hu-man behavioural change, particularly to promote energy conservation.
(iii) Improvements in the downstream system can be realized through improved waste and wastewater management, including recycling and reuse.
By using the ELP in the planning process, di( erent options can be analysed and various interventions can be vetted from an environ-mental point of view. By adding the cost of envi-ronmental impacts to the analysis of alterna-tives, the lifecycle perspective can be visualised.
Figure 2.49. ELP-related Achievements in Hammarby Sjöstad. Environmental impacts per apartment and year compared to the
reference. The environmental load profi les illustrate both the effect of the property developer’s measures, and the effects from
improved energy production and wastewater management (Levin et al, 2004).
ECo2-Part2Final.indd 155 6/15/09 8:36:25 AM
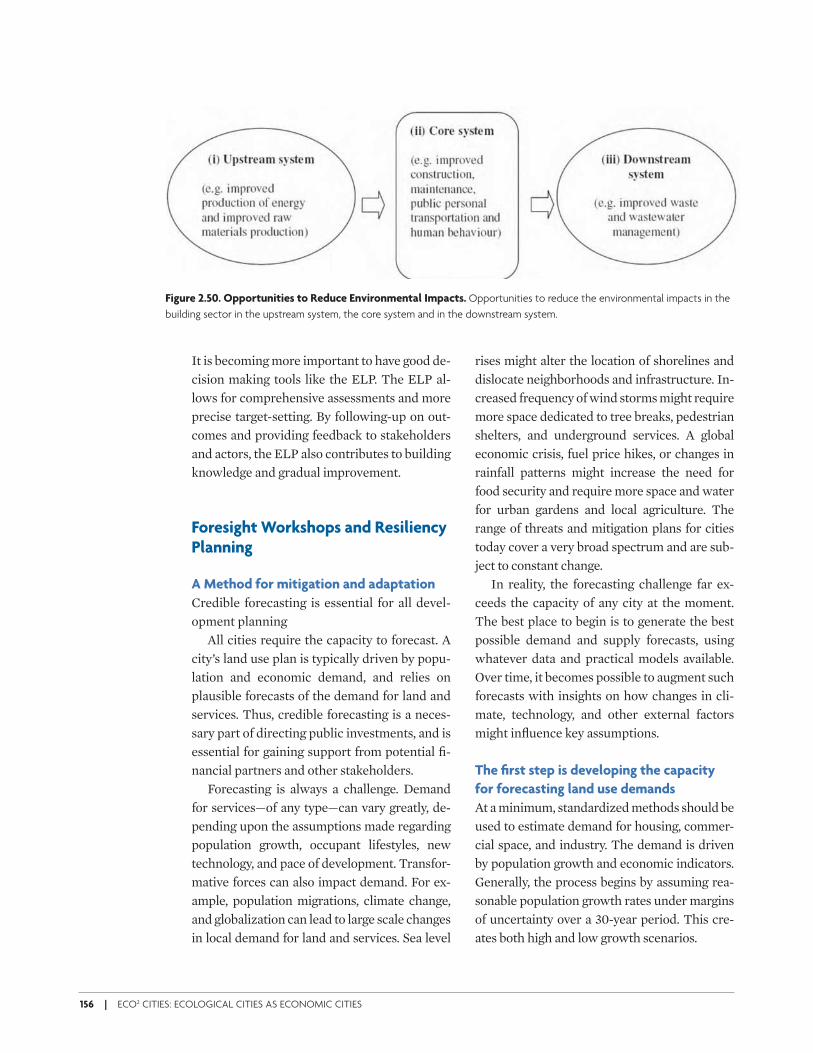
156 | ECO2 CITIES: ECOLOGICAL CITIES AS ECONOMIC CITIES
Figure 2.50. Opportunities to Reduce Environmental Impacts. Opportunities to reduce the environmental impacts in the
building sector in the upstream system, the core system and in the downstream system.
It is becoming more important to have good de-cision making tools like the ELP. The ELP al-lows for comprehensive assessments and more precise target-setting. By following-up on out-comes and providing feedback to stakeholders and actors, the ELP also contributes to building knowledge and gradual improvement.
Foresight Workshops and Resiliency Planning
A Method for mitigation and adaptation
Credible forecasting is essential for all devel-opment planning
All cities require the capacity to forecast. A city’s land use plan is typically driven by popu-lation and economic demand, and relies on plausible forecasts of the demand for land and services. Thus, credible forecasting is a neces-sary part of directing public investments, and is essential for gaining support from potential fi -nancial partners and other stakeholders.
Forecasting is always a challenge. Demand for services—of any type—can vary greatly, de-pending upon the assumptions made regarding population growth, occupant lifestyles, new technology, and pace of development. Transfor-mative forces can also impact demand. For ex-ample, population migrations, climate change, and globalization can lead to large scale changes in local demand for land and services. Sea level
rises might alter the location of shorelines and dislocate neighborhoods and infrastructure. In-creased frequency of wind storms might require more space dedicated to tree breaks, pedestrian shelters, and underground services. A global economic crisis, fuel price hikes, or changes in rainfall patterns might increase the need for food security and require more space and water for urban gardens and local agriculture. The range of threats and mitigation plans for cities today cover a very broad spectrum and are sub-ject to constant change.
In reality, the forecasting challenge far ex-ceeds the capacity of any city at the moment. The best place to begin is to generate the best possible demand and supply forecasts, using whatever data and practical models available. Over time, it becomes possible to augment such forecasts with insights on how changes in cli-mate, technology, and other external factors might infl uence key assumptions.
The fi rst step is developing the capacity
for forecasting land use demands
At a minimum, standardized methods should be used to estimate demand for housing, commer-cial space, and industry. The demand is driven by population growth and economic indicators. Generally, the process begins by assuming rea-sonable population growth rates under margins of uncertainty over a 30-year period. This cre-ates both high and low growth scenarios.
ECo2-Part2Final.indd 156 6/15/09 8:36:26 AM
A C I T Y- BA S E D D E C I S I O N S U P P O RT SYST E M | 157
Population growth is translated into housing demand by dividing the population into subsets based on age and socio economic status. Then, one associates with each subset a propensity for di( erent types of housing: low rise apartments, large detached houses, high rise dwellings, and so on. Predictions can thus be generated for the demand for di( erent types of housing.
The second challenge is to forecast supply. Ideally, this is accomplished using a GIS tool that allows for easy contingent analysis. Exist-ing zoning or a set of zoning options is used as a basis for equating land areas with potential numbers of housing by type. Based on these as-sumptions, each area of land has a build-out ca-pacity, and this limits the supply of units in the city. It is then a simple matter of comparing the demand forecast with the supply forecast, and identifying gaps for specifi c types of housing. The same forecast provides a basis for estimat-ing gaps in infrastructure capacity—for roads, transit, water, and energy.
A similar forecasting process can be used for commercial and industrial demand and supply. Ideally, the residential forecasts are considered in concert with the commercial and industrial, due to interdependencies.
Foresight Workshops can be used to better
understand Impacts of external forces
A number of techniques have been developed specifi cally to engage large groups of experts in envisioning the long-term future and develop-ing appropriate design strategies. Some tradi-tional foresight tools have proven to be quite di1 cult to apply—for example, the ‘Delphi’ technique, developed by RAND researchers in the 1950s has not been particularly successful as a predictive method. However, a host of oth-er visioning and exploring techniques can now be used to bring groups of experts together as part of ‘think-tanks’ or workshops on future urban issues. Such techniques can be referred to as ‘creativity tools,’ and include trial and er-ror, brainstorming, morphological analysis,
method of focal objects and lateral thinking. In urban planning and design, communicative planning has been promoted as a fi eld-tested method for engaging stakeholders and experts in a more dynamic, open-ended enquiry. An example is the Sustainable Cities Program’s European Awareness Scenario (Bilderbeek, 1994). Extensive engagement exercises of this type have at times been intellectually and phys-ically trying for participants. These exercises thus carry some risk that stakeholders may lose interest. In this context, the success of collab-orative planning may depend on tools that pro-mote a simpler ‘systems approach’ and involve stakeholders in more intense, time-limited ex-ercises, such as design charrettes and foresight workshops.
A Foresight Workshop consists of a progres-sive series of presentations and exercises in-tended to introduce designers and planners to the potential for proactive risk management through resilient land use and infrastructure design. Typically, it begins with an exploration of how external forces might impact urban and rural systems within the region. A summary presentation or a set of papers may be provided that covers the local context on the fi ve major forces: Demographics; Climate Change; Tech-nological Change; Globalisation; and Sudden Shocks. Foresight Papers review the patterns and trends for each force and how it might im-pact the urban region.
As part of the workshop, sub-teams may ex-plore how forces might impact di( erent urban systems: mobility; housing; buildings; land use; energy; materials and waste; water; health; in-formation and communications; security; agri-food; and the economy. The sub-groups can use graphical tools to assist in forecasting.
Decision trees, infl uence diagrams, and be-lief nets are examples of tools that support the ‘front end’ of a decision analysis. A particularly e( ective technique is to use Infl uence diagrams for structuring and facilitating dialogue. For many people, an infl uence diagram is the easi-
ECo2-Part2Final.indd 157 6/15/09 8:36:26 AM
158 | ECO2 CITIES: ECOLOGICAL CITIES AS ECONOMIC CITIES
est way to understand a series of cause and ef-fect chains, although, strictly speaking, the cau-sality is not always direct or restricted to the elements shown, and thus the terms ‘infl uence’ or ‘relevance’ are used. These diagrams are easy and intuitive to draw; they allow easy numeri-cal assessments. Most importantly, they visually communicate independencies between vari-ables. By visually displaying changing assump-tions, they allow groups to focus on internal dependencies as a whole, rather than in dis-jointed sections. Aspects of inference, predic-tion, and decision can be drawn using simple nodes and arrows, and discussed at a non-tech-nical level, with a view to reinforcing a systems perspective. These diagrams also can provide a foundation for more complex modeling be-tween groups.
An example template for an infl uence dia-gram is shown in Figure 2.52. Each unique cause and e( ect chain leads to potential im-pacts on economic, social and, environmental aspects of the region. With help from special-ists, sub-teams can employ such diagrams to map cause and e( ect chains, and impacts on the four capitals for each major force and urban system.
The interdisciplinary sub-teams can then ex-plore specifi c interventions, or alternative de-signs, for mitigating any signifi cant negative im-pacts in their infl uence diagrams. In this way, the infl uence and intervention diagrams be-
come a framework or mind map, helping inter-disciplinary groups to explore the longer-term vulnerabilities of the region, and then develop mitigation strategies. A Foresight Workshop can orient design teams to unfamiliar topics, like se-curity and resiliency. Such a workshop also ini-tiates capacity building in the larger fi eld of re-siliency planning. Most designers and planners have little understanding of future studies, in-cluding on such topics as technology scans; S. Curves and innovation cycles; risk management; and the accelerating pace of change in many ur-ban systems. While many of these concepts are di1 cult to grasp and integrate into daily prac-tice, the Foresight Workshop exercises allow pragmatic issues to be discussed, and complex concepts to be presented, in visual formats that can be easy to understand and reference.
A Foresight Workshop also creates the pos-sibility for generating initial design solutions that promote resiliency. These workshops rep-resent opportunities to explore adaptable de-signs. Designs that are versatile and durable fa-vour simplicity, factor in redundancy, allow upgrades, opt for independence, and minimise destructive change. These workshops are also chances to demonstrate the benefi ts of ecologi-cal design solutions, such as compartmental-ization and modularization, which help to re-duce the vulnerability of systems to the failure of any single part.
ECo2-Part2Final.indd 158 6/15/09 8:36:26 AM
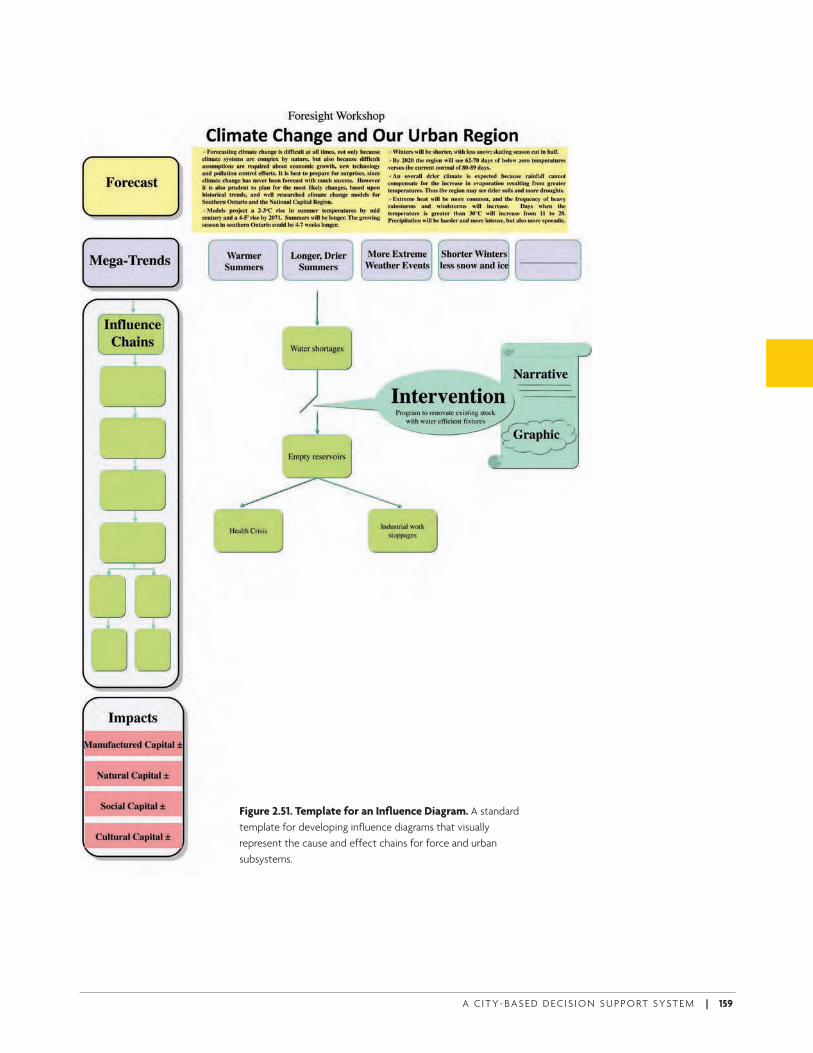
A C I T Y- BA S E D D E C I S I O N S U P P O RT SYST E M | 159
Figure 2.51. Template for an Infl uence Diagram. A standard
template for developing infl uence diagrams that visually
represent the cause and effect chains for force and urban
subsystems.
ECo2-Part2Final.indd 159 6/15/09 8:36:26 AM

ECo2-Part2Final.indd 160 6/15/09 8:36:29 AM
Field Reference Guide
E C O 2 C I T I E S : E C O L O G I C A L C I T I E S A S E C O N O M I C C I T I E S
A City-by-City and Sector-by-Sector Lens on Urban Infrastructure
PART 3
ECo2-Part3aREV_PREP 161 6/15/09 8:42:44 AM

ECo2-Part3aREV_PREP 162 6/15/09 8:42:44 AM
A F I E L D R E F E R E N C E G U I D E | 163
The Eco2 Field Reference Guide is a tech-nical resource specially tailored to build ground level and technical knowledge.
This part of the book contains background lit-erature designed to support cities in develop-ing in-depth insight and fl uency on relevant issues at two levels. This section provides a city-by-city and sector-by-sector lens on urban infrastructure. It begins with a series of case studies from best practice cities around the world. Each city o& ers the program a di& erent example of how various elements of the Eco2 approach can be applied. Most of these cities have already agreed to be partners in the Eco2
Cities Program. The next section comprises of a series of Sector Notes, each of which explores sector specifi c issues as they pertain to urban development. The sectors include energy, wa-ter, transport, and solid waste. This section also includes a note on managing the spatial struc-ture of cities. Together, these sector notes pro-vide insight on how each sector functions and how they interrelate. As we view these issues through a city-by-city and sector-by-sector lens, the bigger picture starts to emerge. Final-ly, Part Three concludes with information on the specifi c fi nancial instruments of the World Bank Group and some multi-donor funds.
Introduction
ECo2-Part3aREV_PREP 163 6/15/09 8:42:44 AM

ECo2-Part3aREV_PREP 164 6/15/09 8:42:44 AM
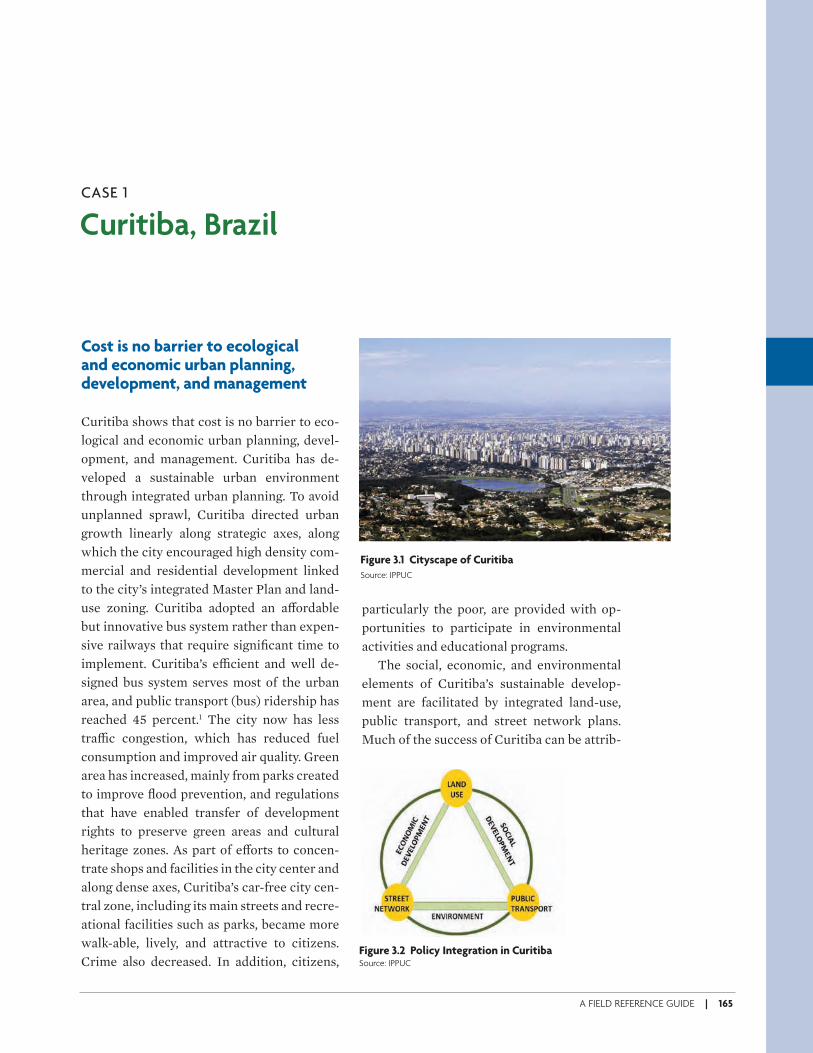
A FIELD REFERENCE GUIDE | 165
Cost is no barrier to ecological and economic urban planning, development, and management
Curitiba shows that cost is no barrier to eco-logical and economic urban planning, devel-opment, and management. Curitiba has de-veloped a sustainable urban environment through integrated urban planning. To avoid unplanned sprawl, Curitiba directed urban growth linearly along strategic axes, along which the city encouraged high density com-mercial and residential development linked to the city’s integrated Master Plan and land-use zoning. Curitiba adopted an a& ordable but innovative bus system rather than expen-sive railways that require signifi cant time to implement. Curitiba’s e* cient and well de-signed bus system serves most of the urban area, and public transport (bus) ridership has reached 45 percent.1 The city now has less tra* c congestion, which has reduced fuel consumption and improved air quality. Green area has increased, mainly from parks created to improve fl ood prevention, and regulations that have enabled transfer of development rights to preserve green areas and cultural heritage zones. As part of e& orts to concen-trate shops and facilities in the city center and along dense axes, Curitiba’s car-free city cen-tral zone, including its main streets and recre-ational facilities such as parks, became more walk-able, lively, and attractive to citizens. Crime also decreased. In addition, citizens,
Curitiba, BrazilCASE 1
Figure 3.1 Cityscape of Curitiba
Source: IPPUC
particularly the poor, are provided with op-portunities to participate in environmental activities and educational programs.
The social, economic, and environmental elements of Curitiba’s sustainable develop-ment are facilitated by integrated land-use, public transport, and street network plans. Much of the success of Curitiba can be attrib-
Figure 3.2 Policy Integration in CuritibaSource: IPPUC
ECo2-Part3aREV_PREP 165 6/15/09 8:42:45 AM
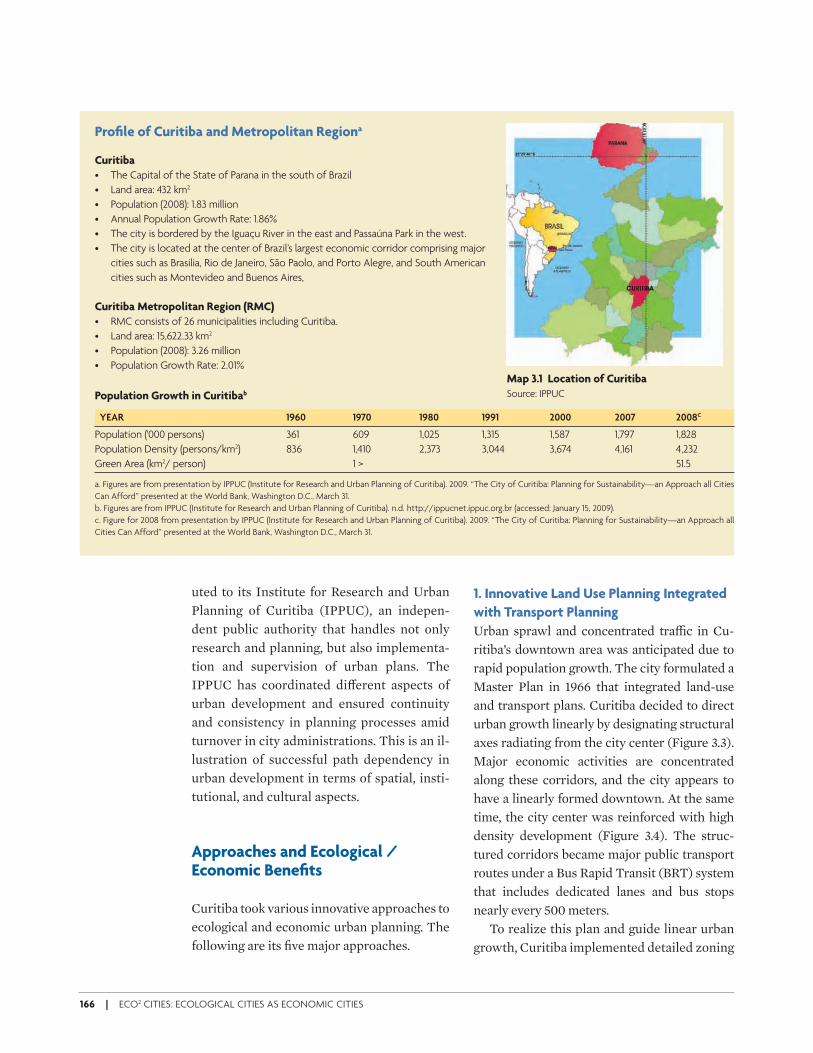
166 | ECO2 CITIES: ECOLOGICAL CITIES AS ECONOMIC CITIES
uted to its Institute for Research and Urban Planning of Curitiba (IPPUC), an indepen-dent public authority that handles not only research and planning, but also implementa-tion and supervision of urban plans. The IPPUC has coordinated di& erent aspects of urban development and ensured continuity and consistency in planning processes amid turnover in city administrations. This is an il-lustration of successful path dependency in urban development in terms of spatial, insti-tutional, and cultural aspects.
Approaches and Ecological / Economic Benefi ts
Curitiba took various innovative approaches to ecological and economic urban planning. The following are its fi ve major approaches.
Profi le of Curitiba and Metropolitan Regiona
Curitiba
• The Capital of the State of Parana in the south of Brazil
• Land area: 432 km2
• Population (2008): 1.83 million
• Annual Population Growth Rate: 1.86%
• The city is bordered by the Iguaçu River in the east and Passaúna Park in the west.
• The city is located at the center of Brazil’s largest economic corridor comprising major
cities such as Brasilia, Rio de Janeiro, São Paolo, and Porto Alegre, and South American
cities such as Montevideo and Buenos Aires,
Curitiba Metropolitan Region (RMC)
• RMC consists of 26 municipalities including Curitiba.
• Land area: 15,622.33 km2
• Population (2008): 3.26 million
• Population Growth Rate: 2.01%
Population Growth in Curitibab
YEAR 1960 1970 1980 1991 2000 2007 2008C
Population ('000 persons) 361 609 1,025 1,315 1,587 1,797 1,828
Population Density (persons/km2) 836 1,410 2,373 3,044 3,674 4,161 4,232
Green Area (km2/ person) 1 > 51.5
a. Figures are from presentation by IPPUC (Institute for Research and Urban Planning of Curitiba). 2009. “The City of Curitiba: Planning for Sustainability—an Approach all Cities
Can Afford” presented at the World Bank, Washington D.C., March 31.
b. Figures are from IPPUC (Institute for Research and Urban Planning of Curitiba). n.d. http://ippucnet.ippuc.org.br (accessed: January 15, 2009).
c. Figure for 2008 from presentation by IPPUC (Institute for Research and Urban Planning of Curitiba). 2009. “The City of Curitiba: Planning for Sustainability—an Approach all
Cities Can Afford” presented at the World Bank, Washington D.C., March 31.
Map 3.1 Location of Curitiba
Source: IPPUC
1. Innovative Land Use Planning Integrated
with Transport Planning
Urban sprawl and concentrated tra* c in Cu-ritiba’s downtown area was anticipated due to rapid population growth. The city formulated a Master Plan in 1966 that integrated land-use and transport plans. Curitiba decided to direct urban growth linearly by designating structural axes radiating from the city center (Figure 3.3). Major economic activities are concentrated along these corridors, and the city appears to have a linearly formed downtown. At the same time, the city center was reinforced with high density development (Figure 3.4). The struc-tured corridors became major public transport routes under a Bus Rapid Transit (BRT) system that includes dedicated lanes and bus stops nearly every 500 meters.
To realize this plan and guide linear urban growth, Curitiba implemented detailed zoning
ECo2-Part3aREV_PREP 166 6/15/09 8:42:45 AM
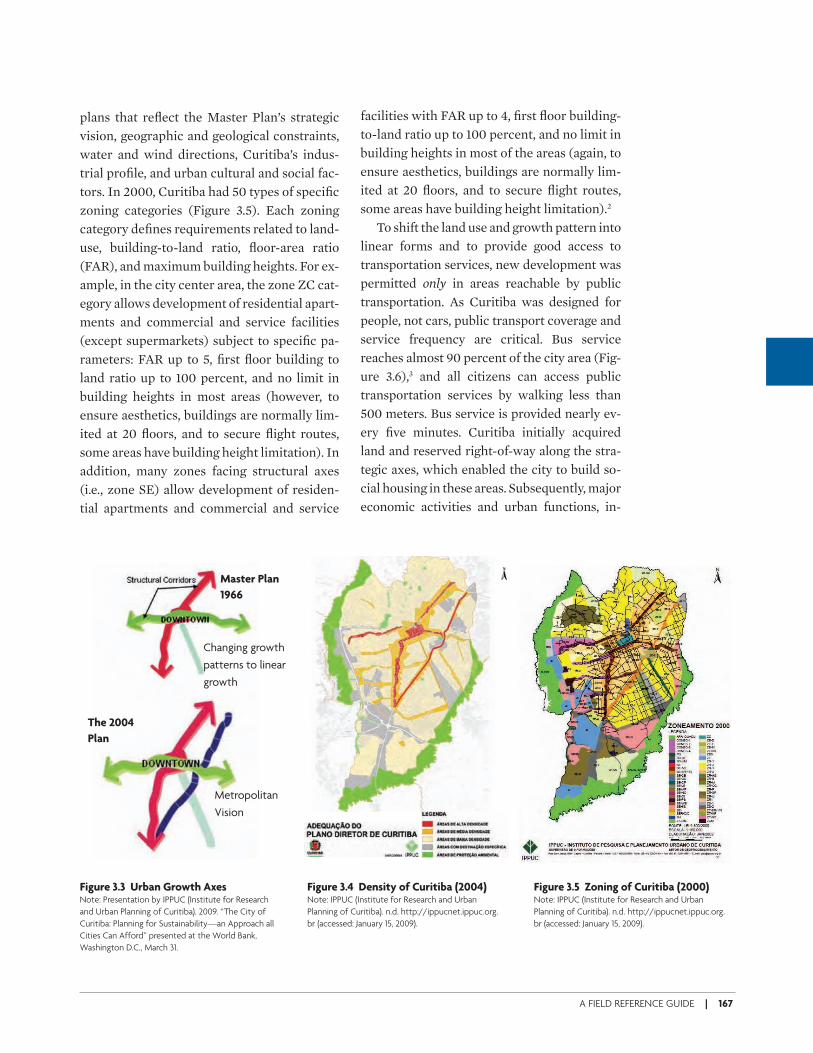
A FIELD REFERENCE GUIDE | 167
plans that refl ect the Master Plan’s strategic vision, geographic and geological constraints, water and wind directions, Curitiba’s indus-trial profi le, and urban cultural and social fac-tors. In 2000, Curitiba had 50 types of specifi c zoning categories (Figure 3.5). Each zoning category defi nes requirements related to land-use, building-to-land ratio, fl oor-area ratio (FAR), and maximum building heights. For ex-ample, in the city center area, the zone ZC cat-egory allows development of residential apart-ments and commercial and service facilities (except supermarkets) subject to specifi c pa-rameters: FAR up to 5, fi rst fl oor building to land ratio up to 100 percent, and no limit in building heights in most areas (however, to ensure aesthetics, buildings are normally lim-ited at 20 fl oors, and to secure fl ight routes, some areas have building height limitation). In addition, many zones facing structural axes (i.e., zone SE) allow development of residen-tial apartments and commercial and service
facilities with FAR up to 4, fi rst fl oor building-to-land ratio up to 100 percent, and no limit in building heights in most of the areas (again, to ensure aesthetics, buildings are normally lim-ited at 20 fl oors, and to secure fl ight routes, some areas have building height limitation).2
To shift the land use and growth pattern into linear forms and to provide good access to transportation services, new development was permitted only in areas reachable by public transportation. As Curitiba was designed for people, not cars, public transport coverage and service frequency are critical. Bus service reaches almost 90 percent of the city area (Fig-ure 3.6),3 and all citizens can access public transportation services by walking less than 500 meters. Bus service is provided nearly ev-ery fi ve minutes. Curitiba initially acquired land and reserved right-of-way along the stra-tegic axes, which enabled the city to build so-cial housing in these areas. Subsequently, major economic activities and urban functions, in-
Figure 3.3 Urban Growth Axes Note: Presentation by IPPUC (Institute for Research
and Urban Planning of Curitiba). 2009. “The City of
Curitiba: Planning for Sustainability—an Approach all
Cities Can Afford” presented at the World Bank,
Washington D.C., March 31.
Figure 3.5 Zoning of Curitiba (2000)Note: IPPUC (Institute for Research and Urban
Planning of Curitiba). n.d. http://ippucnet.ippuc.org.
br (accessed: January 15, 2009).
Figure 3.4 Density of Curitiba (2004) Note: IPPUC (Institute for Research and Urban
Planning of Curitiba). n.d. http://ippucnet.ippuc.org.
br (accessed: January 15, 2009).
Master Plan
1966
The 2004
Plan
Changing growth
patterns to linear
growth
Metropolitan
Vision
ECo2-Part3aREV_PREP 167 6/15/09 8:42:46 AM
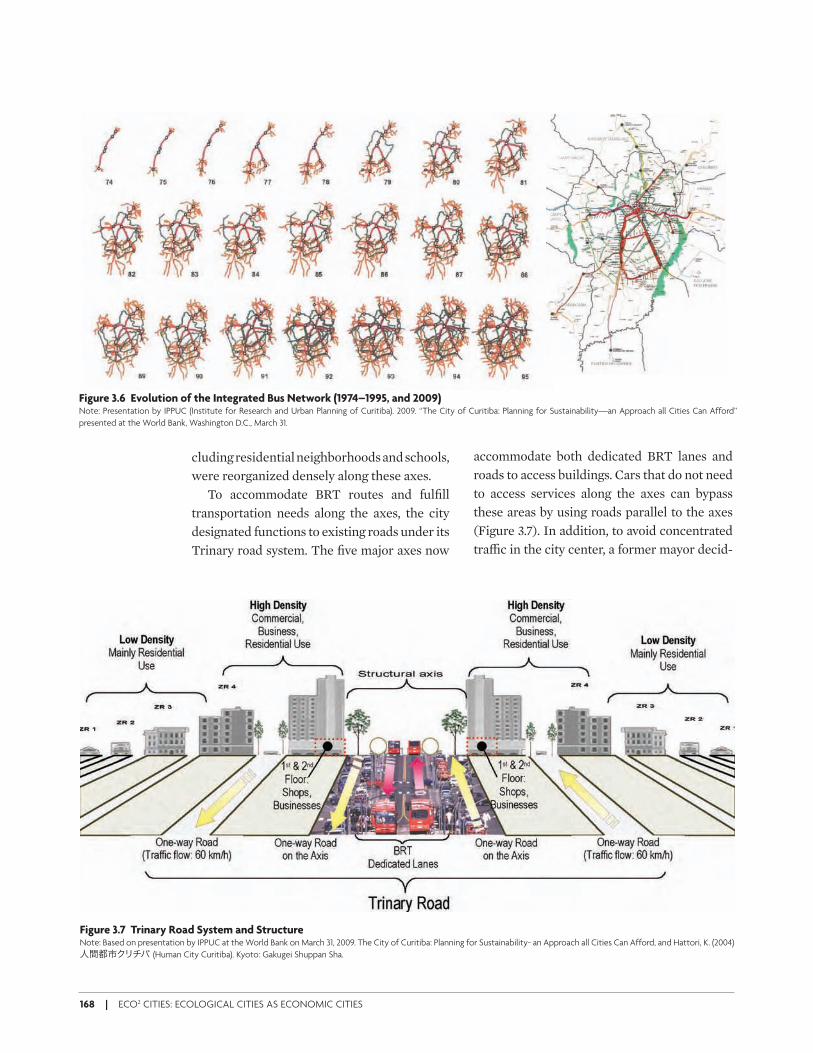
168 | ECO2 CITIES: ECOLOGICAL CITIES AS ECONOMIC CITIES
cluding residential neighborhoods and schools, were reorganized densely along these axes.
To accommodate BRT routes and fulfi ll transportation needs along the axes, the city designated functions to existing roads under its Trinary road system. The fi ve major axes now
accommodate both dedicated BRT lanes and roads to access buildings. Cars that do not need to access services along the axes can bypass these areas by using roads parallel to the axes (Figure 3.7). In addition, to avoid concentrated tra* c in the city center, a former mayor decid-
Figure 3.6 Evolution of the Integrated Bus Network (1974–1995, and 2009)Note: Presentation by IPPUC (Institute for Research and Urban Planning of Curitiba). 2009. “The City of Curitiba: Planning for Sustainability—an Approach all Cities Can Afford”
presented at the World Bank, Washington D.C., March 31.
Figure 3.7 Trinary Road System and StructureNote: Based on presentation by IPPUC at the World Bank on March 31, 2009. The City of Curitiba: Planning for Sustainability- an Approach all Cities Can Afford, and Hattori, K. (2004)
人間都市クリチバ (Human City Curitiba). Kyoto: Gakugei Shuppan Sha.
Trinary Road System
ECo2-Part3aREV_PREP 168 6/15/09 8:42:47 AM
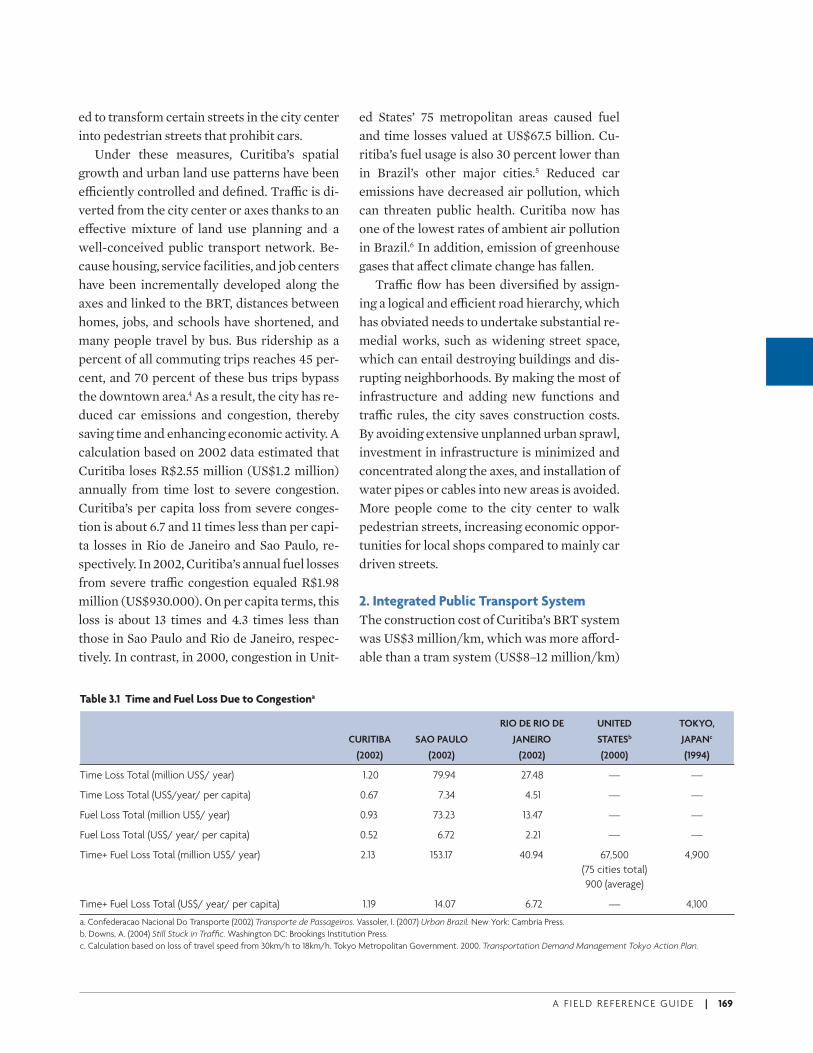
A F I E L D R E F E R E N C E G U I D E | 169
ed to transform certain streets in the city center into pedestrian streets that prohibit cars.
Under these measures, Curitiba’s spatial growth and urban land use patterns have been e* ciently controlled and defi ned. Tra* c is di-verted from the city center or axes thanks to an e& ective mixture of land use planning and a well-conceived public transport network. Be-cause housing, service facilities, and job centers have been incrementally developed along the axes and linked to the BRT, distances between homes, jobs, and schools have shortened, and many people travel by bus. Bus ridership as a percent of all commuting trips reaches 45 per-cent, and 70 percent of these bus trips bypass the downtown area.4 As a result, the city has re-duced car emissions and congestion, thereby saving time and enhancing economic activity. A calculation based on 2002 data estimated that Curitiba loses R$2.55 million (US$1.2 million) annually from time lost to severe congestion. Curitiba’s per capita loss from severe conges-tion is about 6.7 and 11 times less than per capi-ta losses in Rio de Janeiro and Sao Paulo, re-spectively. In 2002, Curitiba’s annual fuel losses from severe tra* c congestion equaled R$1.98 million (US$930.000). On per capita terms, this loss is about 13 times and 4.3 times less than those in Sao Paulo and Rio de Janeiro, respec-tively. In contrast, in 2000, congestion in Unit-
ed States’ 75 metropolitan areas caused fuel and time losses valued at US$67.5 billion. Cu-ritiba’s fuel usage is also 30 percent lower than in Brazil’s other major cities.5 Reduced car emissions have decreased air pollution, which can threaten public health. Curitiba now has one of the lowest rates of ambient air pollution in Brazil.6 In addition, emission of greenhouse gases that a& ect climate change has fallen.
Tra* c fl ow has been diversifi ed by assign-ing a logical and e* cient road hierarchy, which has obviated needs to undertake substantial re-medial works, such as widening street space, which can entail destroying buildings and dis-rupting neighborhoods. By making the most of infrastructure and adding new functions and tra* c rules, the city saves construction costs. By avoiding extensive unplanned urban sprawl, investment in infrastructure is minimized and concentrated along the axes, and installation of water pipes or cables into new areas is avoided. More people come to the city center to walk pedestrian streets, increasing economic oppor-tunities for local shops compared to mainly car driven streets.
2. Integrated Public Transport System
The construction cost of Curitiba’s BRT system was US$3 million/km, which was more a& ord-able than a tram system (US$8–12 million/km)
Table 3.1 Time and Fuel Loss Due to Congestiona
RIO DE RIO DE UNITED TOKYO,
CURITIBA SAO PAULO JANEIRO STATESb JAPANc
(2002) (2002) (2002) (2000) (1994)
Time Loss Total (million US$/ year) 1.20 79.94 27.48 — —
Time Loss Total (US$/year/ per capita) 0.67 7.34 4.51 — —
Fuel Loss Total (million US$/ year) 0.93 73.23 13.47 — —
Fuel Loss Total (US$/ year/ per capita) 0.52 6.72 2.21 — —
Time+ Fuel Loss Total (million US$/ year) 2.13 153.17 40.94 67,500 4,900
(75 cities total)
900 (average)
Time+ Fuel Loss Total (US$/ year/ per capita) 1.19 14.07 6.72 — 4,100
a. Confederacao Nacional Do Transporte (2002) Transporte de Passageiros. Vassoler, I. (2007) Urban Brazil. New York: Cambria Press.
b. Downs, A. (2004) Still Stuck in Traffi c. Washington DC: Brookings Institution Press.
c. Calculation based on loss of travel speed from 30km/h to 18km/h. Tokyo Metropolitan Government. 2000. Transportation Demand Management Tokyo Action Plan.
ECo2-Part3aREV_PREP 169 6/15/09 8:42:49 AM
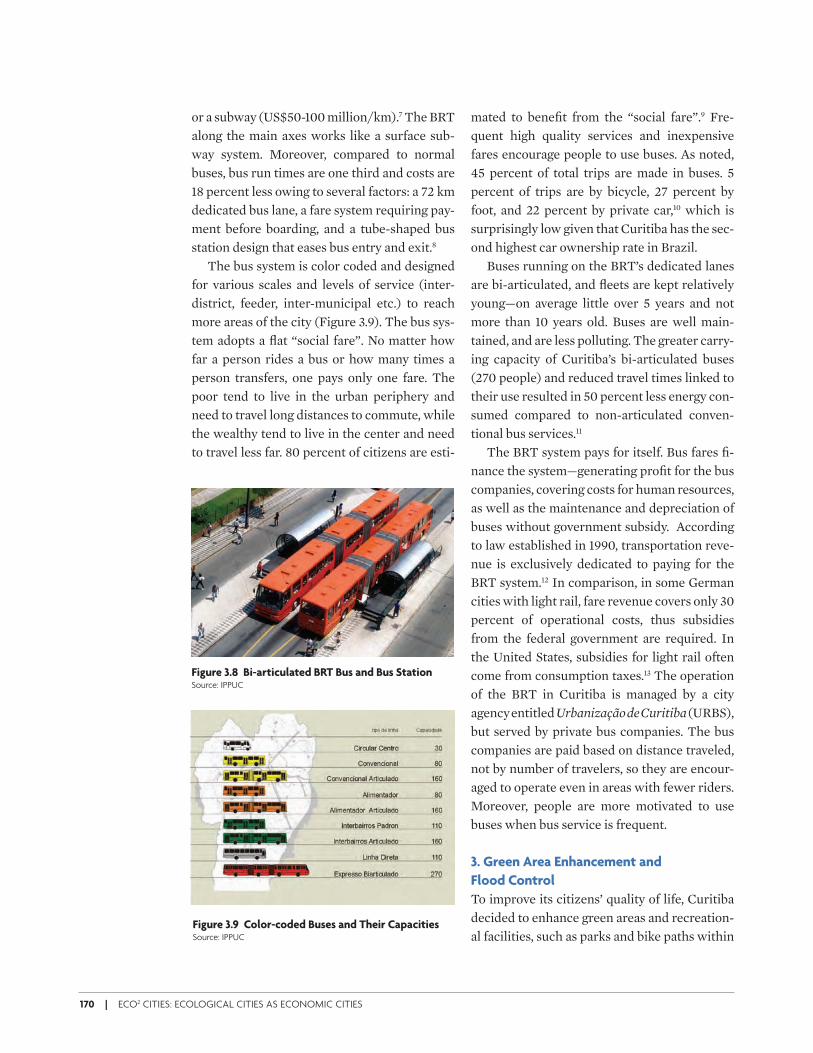
170 | ECO2 CITIES: ECOLOGICAL CITIES AS ECONOMIC CITIES
or a subway (US$50-100 million/km).7 The BRT along the main axes works like a surface sub-way system. Moreover, compared to normal buses, bus run times are one third and costs are 18 percent less owing to several factors: a 72 km dedicated bus lane, a fare system requiring pay-ment before boarding, and a tube-shaped bus station design that eases bus entry and exit.8
The bus system is color coded and designed for various scales and levels of service (inter-district, feeder, inter-municipal etc.) to reach more areas of the city (Figure 3.9). The bus sys-tem adopts a fl at “social fare”. No matter how far a person rides a bus or how many times a person transfers, one pays only one fare. The poor tend to live in the urban periphery and need to travel long distances to commute, while the wealthy tend to live in the center and need to travel less far. 80 percent of citizens are esti-
mated to benefi t from the “social fare”.9 Fre-quent high quality services and inexpensive fares encourage people to use buses. As noted, 45 percent of total trips are made in buses. 5 percent of trips are by bicycle, 27 percent by foot, and 22 percent by private car,10 which is surprisingly low given that Curitiba has the sec-ond highest car ownership rate in Brazil.
Buses running on the BRT’s dedicated lanes are bi-articulated, and fl eets are kept relatively young—on average little over 5 years and not more than 10 years old. Buses are well main-tained, and are less polluting. The greater carry-ing capacity of Curitiba’s bi-articulated buses (270 people) and reduced travel times linked to their use resulted in 50 percent less energy con-sumed compared to non-articulated conven-tional bus services.11
The BRT system pays for itself. Bus fares fi -nance the system—generating profi t for the bus companies, covering costs for human resources, as well as the maintenance and depreciation of buses without government subsidy. According to law established in 1990, transportation reve-nue is exclusively dedicated to paying for the BRT system.12 In comparison, in some German cities with light rail, fare revenue covers only 30 percent of operational costs, thus subsidies from the federal government are required. In the United States, subsidies for light rail often come from consumption taxes.13 The operation of the BRT in Curitiba is managed by a city agency entitled Urbanização de Curitiba (URBS), but served by private bus companies. The bus companies are paid based on distance traveled, not by number of travelers, so they are encour-aged to operate even in areas with fewer riders. Moreover, people are more motivated to use buses when bus service is frequent.
3. Green Area Enhancement and
Flood Control
To improve its citizens’ quality of life, Curitiba decided to enhance green areas and recreation-al facilities, such as parks and bike paths within
Figure 3.8 Bi-articulated BRT Bus and Bus StationSource: IPPUC
Figure 3.9 Color-coded Buses and Their CapacitiesSource: IPPUC
ECo2-Part3aREV_PREP 170 6/15/09 8:42:50 AM
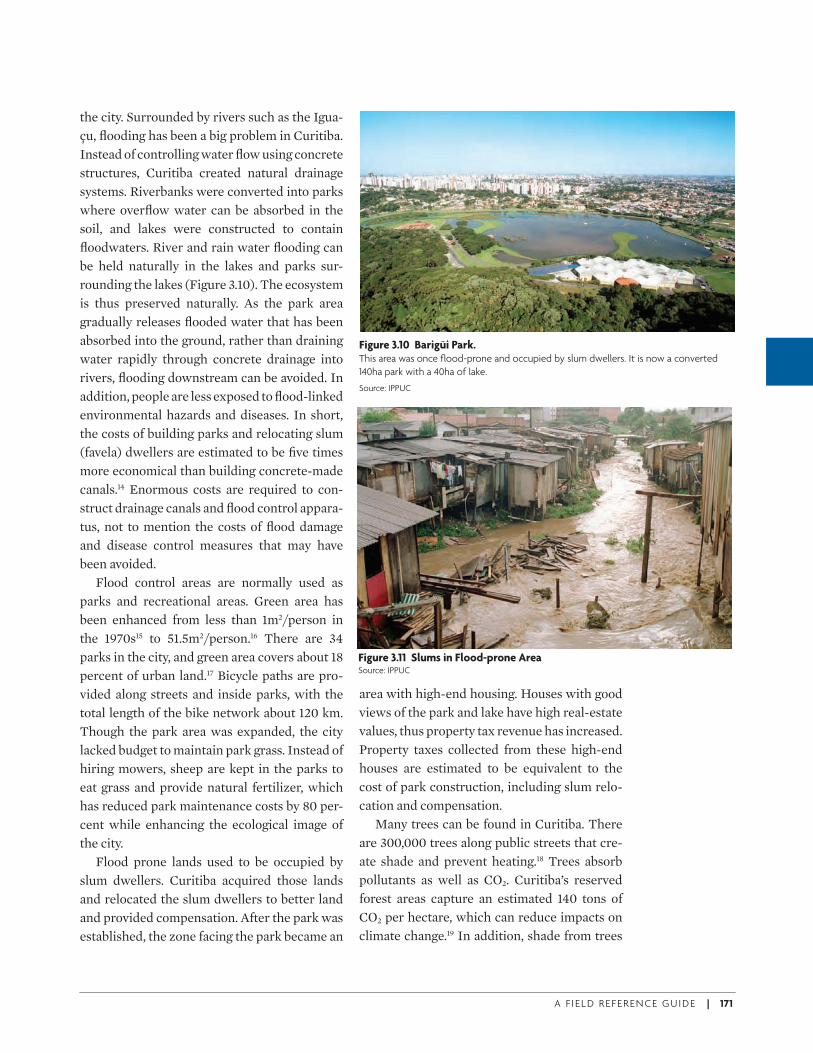
A F I E L D R E F E R E N C E G U I D E | 171
the city. Surrounded by rivers such as the Igua-çu, fl ooding has been a big problem in Curitiba. Instead of controlling water fl ow using concrete structures, Curitiba created natural drainage systems. Riverbanks were converted into parks where overfl ow water can be absorbed in the soil, and lakes were constructed to contain fl oodwaters. River and rain water fl ooding can be held naturally in the lakes and parks sur-rounding the lakes (Figure 3.10). The ecosystem is thus preserved naturally. As the park area gradually releases fl ooded water that has been absorbed into the ground, rather than draining water rapidly through concrete drainage into rivers, fl ooding downstream can be avoided. In addition, people are less exposed to fl ood-linked environmental hazards and diseases. In short, the costs of building parks and relocating slum (favela) dwellers are estimated to be fi ve times more economical than building concrete-made canals.14 Enormous costs are required to con-struct drainage canals and fl ood control appara-tus, not to mention the costs of fl ood damage and disease control measures that may have been avoided.
Flood control areas are normally used as parks and recreational areas. Green area has been enhanced from less than 1m2/person in the 1970s15 to 51.5m2/person.16 There are 34 parks in the city, and green area covers about 18 percent of urban land.17 Bicycle paths are pro-vided along streets and inside parks, with the total length of the bike network about 120 km. Though the park area was expanded, the city lacked budget to maintain park grass. Instead of hiring mowers, sheep are kept in the parks to eat grass and provide natural fertilizer, which has reduced park maintenance costs by 80 per-cent while enhancing the ecological image of the city.
Flood prone lands used to be occupied by slum dwellers. Curitiba acquired those lands and relocated the slum dwellers to better land and provided compensation. After the park was established, the zone facing the park became an
Figure 3.10 Barigüi Park. This area was once fl ood-prone and occupied by slum dwellers. It is now a converted
140ha park with a 40ha of lake.
Source: IPPUC
Figure 3.11 Slums in Flood-prone AreaSource: IPPUC
area with high-end housing. Houses with good views of the park and lake have high real-estate values, thus property tax revenue has increased. Property taxes collected from these high-end houses are estimated to be equivalent to the cost of park construction, including slum relo-cation and compensation.
Many trees can be found in Curitiba. There are 300,000 trees along public streets that cre-ate shade and prevent heating.18 Trees absorb pollutants as well as CO2. Curitiba’s reserved forest areas capture an estimated 140 tons of CO2 per hectare, which can reduce impacts on climate change.19 In addition, shade from trees
ECo2-Part3aREV_PREP 171 6/15/09 8:42:50 AM
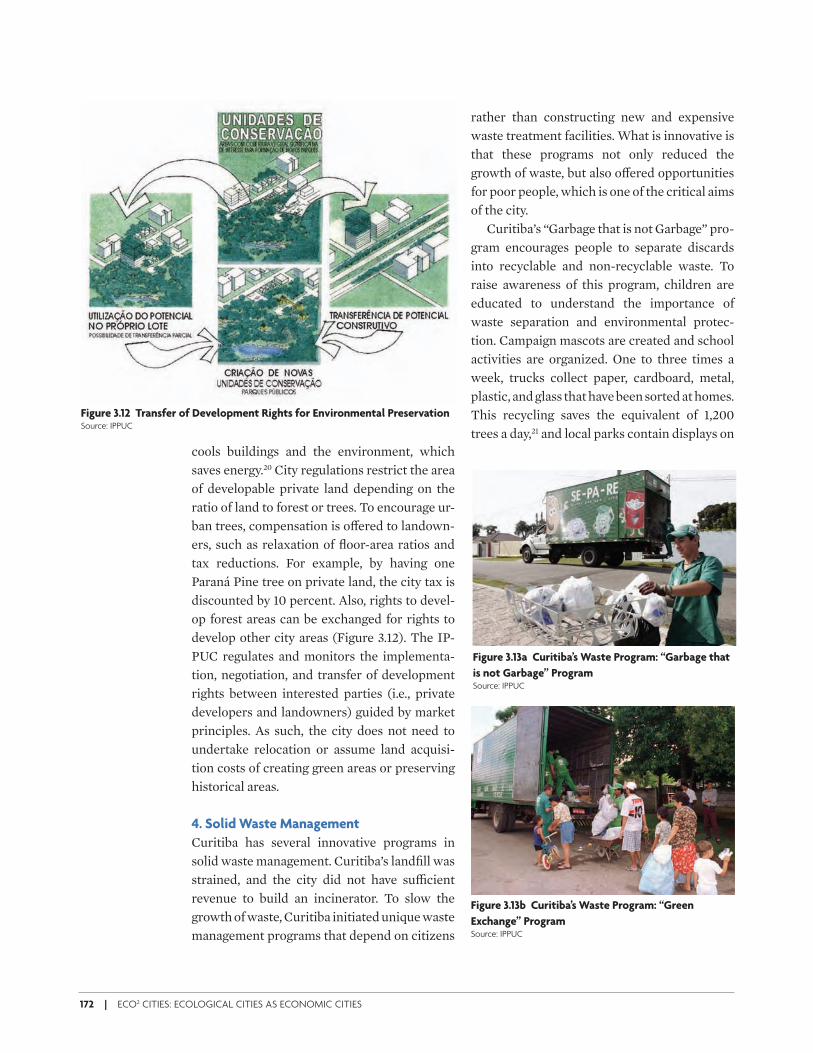
172 | ECO2 CITIES: ECOLOGICAL CITIES AS ECONOMIC CITIES
cools buildings and the environment, which saves energy.20 City regulations restrict the area of developable private land depending on the ratio of land to forest or trees. To encourage ur-ban trees, compensation is o& ered to landown-ers, such as relaxation of fl oor-area ratios and tax reductions. For example, by having one Paraná Pine tree on private land, the city tax is discounted by 10 percent. Also, rights to devel-op forest areas can be exchanged for rights to develop other city areas (Figure 3.12). The IP-PUC regulates and monitors the implementa-tion, negotiation, and transfer of development rights between interested parties (i.e., private developers and landowners) guided by market principles. As such, the city does not need to undertake relocation or assume land acquisi-tion costs of creating green areas or preserving historical areas.
4. Solid Waste Management
Curitiba has several innovative programs in solid waste management. Curitiba’s landfi ll was strained, and the city did not have su* cient revenue to build an incinerator. To slow the growth of waste, Curitiba initiated unique waste management programs that depend on citizens
rather than constructing new and expensive waste treatment facilities. What is innovative is that these programs not only reduced the growth of waste, but also o& ered opportunities for poor people, which is one of the critical aims of the city.
Curitiba’s “Garbage that is not Garbage” pro-gram encourages people to separate discards into recyclable and non-recyclable waste. To raise awareness of this program, children are educated to understand the importance of waste separation and environmental protec-tion. Campaign mascots are created and school activities are organized. One to three times a week, trucks collect paper, cardboard, metal, plastic, and glass that have been sorted at homes. This recycling saves the equivalent of 1,200 trees a day,21 and local parks contain displays on
Figure 3.12 Transfer of Development Rights for Environmental PreservationSource: IPPUC
Figure 3.13a Curitiba’s Waste Program: “Garbage that
is not Garbage” ProgramSource: IPPUC
Figure 3.13b Curitiba’s Waste Program: “Green
Exchange” ProgramSource: IPPUC
ECo2-Part3aREV_PREP 172 6/15/09 8:42:51 AM
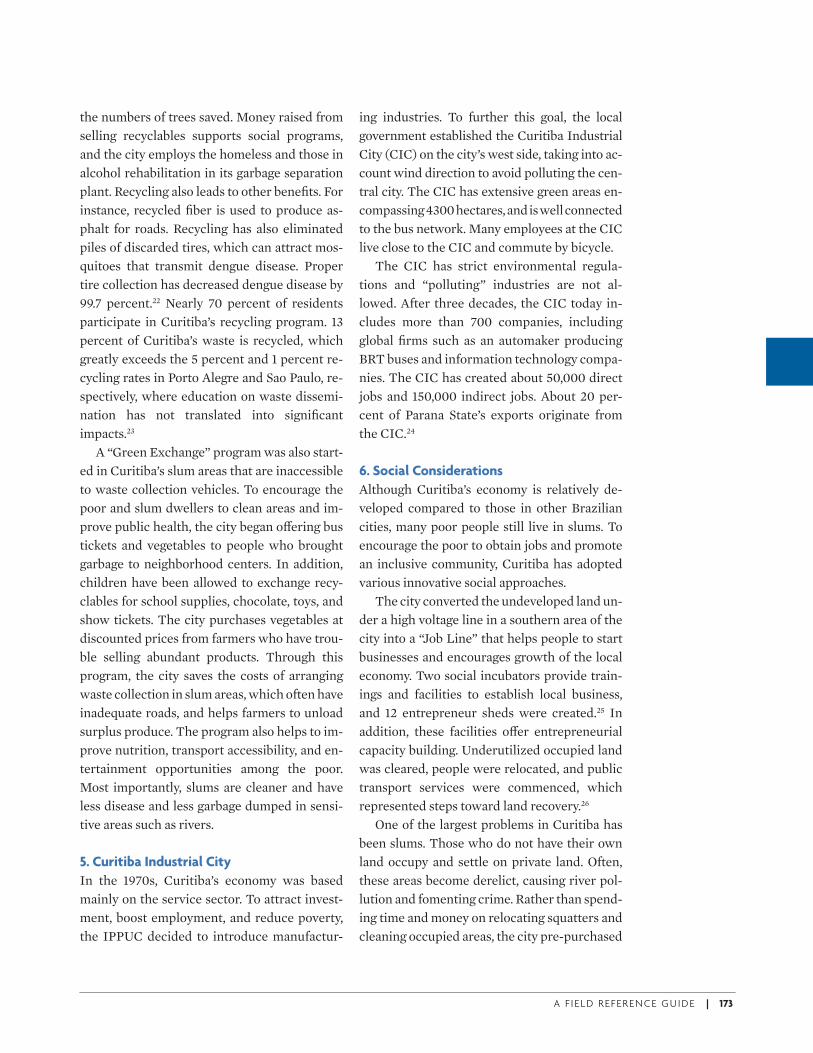
A F I E L D R E F E R E N C E G U I D E | 173
the numbers of trees saved. Money raised from selling recyclables supports social programs, and the city employs the homeless and those in alcohol rehabilitation in its garbage separation plant. Recycling also leads to other benefi ts. For instance, recycled fi ber is used to produce as-phalt for roads. Recycling has also eliminated piles of discarded tires, which can attract mos-quitoes that transmit dengue disease. Proper tire collection has decreased dengue disease by 99.7 percent.22 Nearly 70 percent of residents participate in Curitiba’s recycling program. 13 percent of Curitiba’s waste is recycled, which greatly exceeds the 5 percent and 1 percent re-cycling rates in Porto Alegre and Sao Paulo, re-spectively, where education on waste dissemi-nation has not translated into signifi cant impacts.23
A “Green Exchange” program was also start-ed in Curitiba’s slum areas that are inaccessible to waste collection vehicles. To encourage the poor and slum dwellers to clean areas and im-prove public health, the city began o& ering bus tickets and vegetables to people who brought garbage to neighborhood centers. In addition, children have been allowed to exchange recy-clables for school supplies, chocolate, toys, and show tickets. The city purchases vegetables at discounted prices from farmers who have trou-ble selling abundant products. Through this program, the city saves the costs of arranging waste collection in slum areas, which often have inadequate roads, and helps farmers to unload surplus produce. The program also helps to im-prove nutrition, transport accessibility, and en-tertainment opportunities among the poor. Most importantly, slums are cleaner and have less disease and less garbage dumped in sensi-tive areas such as rivers.
5. Curitiba Industrial City
In the 1970s, Curitiba’s economy was based mainly on the service sector. To attract invest-ment, boost employment, and reduce poverty, the IPPUC decided to introduce manufactur-
ing industries. To further this goal, the local government established the Curitiba Industrial City (CIC) on the city’s west side, taking into ac-count wind direction to avoid polluting the cen-tral city. The CIC has extensive green areas en-compassing 4300 hectares, and is well connected to the bus network. Many employees at the CIC live close to the CIC and commute by bicycle.
The CIC has strict environmental regula-tions and “polluting” industries are not al-lowed. After three decades, the CIC today in-cludes more than 700 companies, including global fi rms such as an automaker producing BRT buses and information technology compa-nies. The CIC has created about 50,000 direct jobs and 150,000 indirect jobs. About 20 per-cent of Parana State’s exports originate from the CIC.24
6. Social Considerations
Although Curitiba’s economy is relatively de-veloped compared to those in other Brazilian cities, many poor people still live in slums. To encourage the poor to obtain jobs and promote an inclusive community, Curitiba has adopted various innovative social approaches.
The city converted the undeveloped land un-der a high voltage line in a southern area of the city into a “Job Line” that helps people to start businesses and encourages growth of the local economy. Two social incubators provide train-ings and facilities to establish local business, and 12 entrepreneur sheds were created.25 In addition, these facilities o& er entrepreneurial capacity building. Underutilized occupied land was cleared, people were relocated, and public transport services were commenced, which represented steps toward land recovery.26
One of the largest problems in Curitiba has been slums. Those who do not have their own land occupy and settle on private land. Often, these areas become derelict, causing river pol-lution and fomenting crime. Rather than spend-ing time and money on relocating squatters and cleaning occupied areas, the city pre-purchased
ECo2-Part3aREV_PREP 173 6/15/09 8:42:53 AM
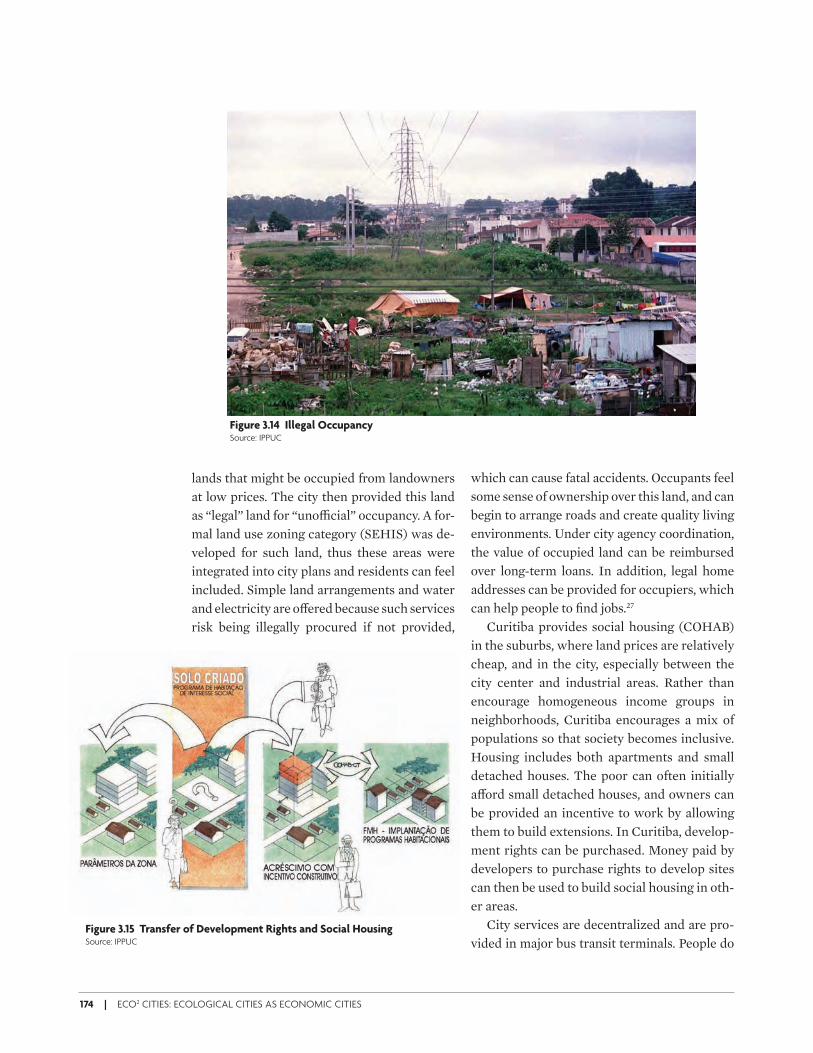
174 | ECO2 CITIES: ECOLOGICAL CITIES AS ECONOMIC CITIES
lands that might be occupied from landowners at low prices. The city then provided this land as “legal” land for “uno* cial” occupancy. A for-mal land use zoning category (SEHIS) was de-veloped for such land, thus these areas were integrated into city plans and residents can feel included. Simple land arrangements and water and electricity are o& ered because such services risk being illegally procured if not provided,
which can cause fatal accidents. Occupants feel some sense of ownership over this land, and can begin to arrange roads and create quality living environments. Under city agency coordination, the value of occupied land can be reimbursed over long-term loans. In addition, legal home addresses can be provided for occupiers, which can help people to fi nd jobs.27
Curitiba provides social housing (COHAB) in the suburbs, where land prices are relatively cheap, and in the city, especially between the city center and industrial areas. Rather than encourage homogeneous income groups in neighborhoods, Curitiba encourages a mix of populations so that society becomes inclusive. Housing includes both apartments and small detached houses. The poor can often initially a& ord small detached houses, and owners can be provided an incentive to work by allowing them to build extensions. In Curitiba, develop-ment rights can be purchased. Money paid by developers to purchase rights to develop sites can then be used to build social housing in oth-er areas.
City services are decentralized and are pro-vided in major bus transit terminals. People do
Figure 3.14 Illegal Occupancy Source: IPPUC
Figure 3.15 Transfer of Development Rights and Social HousingSource: IPPUC
ECo2-Part3aREV_PREP 174 6/15/09 8:42:53 AM
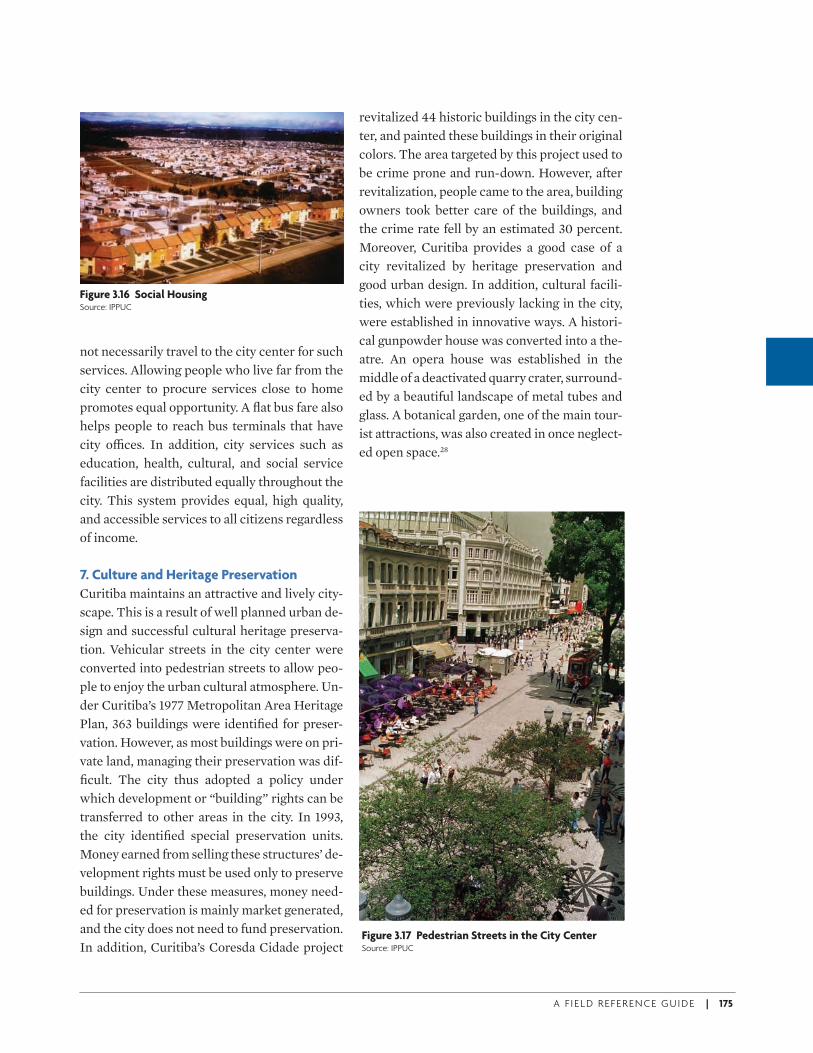
A F I E L D R E F E R E N C E G U I D E | 175
not necessarily travel to the city center for such services. Allowing people who live far from the city center to procure services close to home promotes equal opportunity. A fl at bus fare also helps people to reach bus terminals that have city o* ces. In addition, city services such as education, health, cultural, and social service facilities are distributed equally throughout the city. This system provides equal, high quality, and accessible services to all citizens regardless of income.
7. Culture and Heritage Preservation
Curitiba maintains an attractive and lively city-scape. This is a result of well planned urban de-sign and successful cultural heritage preserva-tion. Vehicular streets in the city center were converted into pedestrian streets to allow peo-ple to enjoy the urban cultural atmosphere. Un-der Curitiba’s 1977 Metropolitan Area Heritage Plan, 363 buildings were identifi ed for preser-vation. However, as most buildings were on pri-vate land, managing their preservation was dif-fi cult. The city thus adopted a policy under which development or “building” rights can be transferred to other areas in the city. In 1993, the city identifi ed special preservation units. Money earned from selling these structures’ de-velopment rights must be used only to preserve buildings. Under these measures, money need-ed for preservation is mainly market generated, and the city does not need to fund preservation. In addition, Curitiba’s Coresda Cidade project
revitalized 44 historic buildings in the city cen-ter, and painted these buildings in their original colors. The area targeted by this project used to be crime prone and run-down. However, after revitalization, people came to the area, building owners took better care of the buildings, and the crime rate fell by an estimated 30 percent. Moreover, Curitiba provides a good case of a city revitalized by heritage preservation and good urban design. In addition, cultural facili-ties, which were previously lacking in the city, were established in innovative ways. A histori-cal gunpowder house was converted into a the-atre. An opera house was established in the middle of a deactivated quarry crater, surround-ed by a beautiful landscape of metal tubes and glass. A botanical garden, one of the main tour-ist attractions, was also created in once neglect-ed open space.28
Figure 3.16 Social HousingSource: IPPUC
Figure 3.17 Pedestrian Streets in the City CenterSource: IPPUC
ECo2-Part3aREV_PREP 175 6/15/09 8:42:54 AM
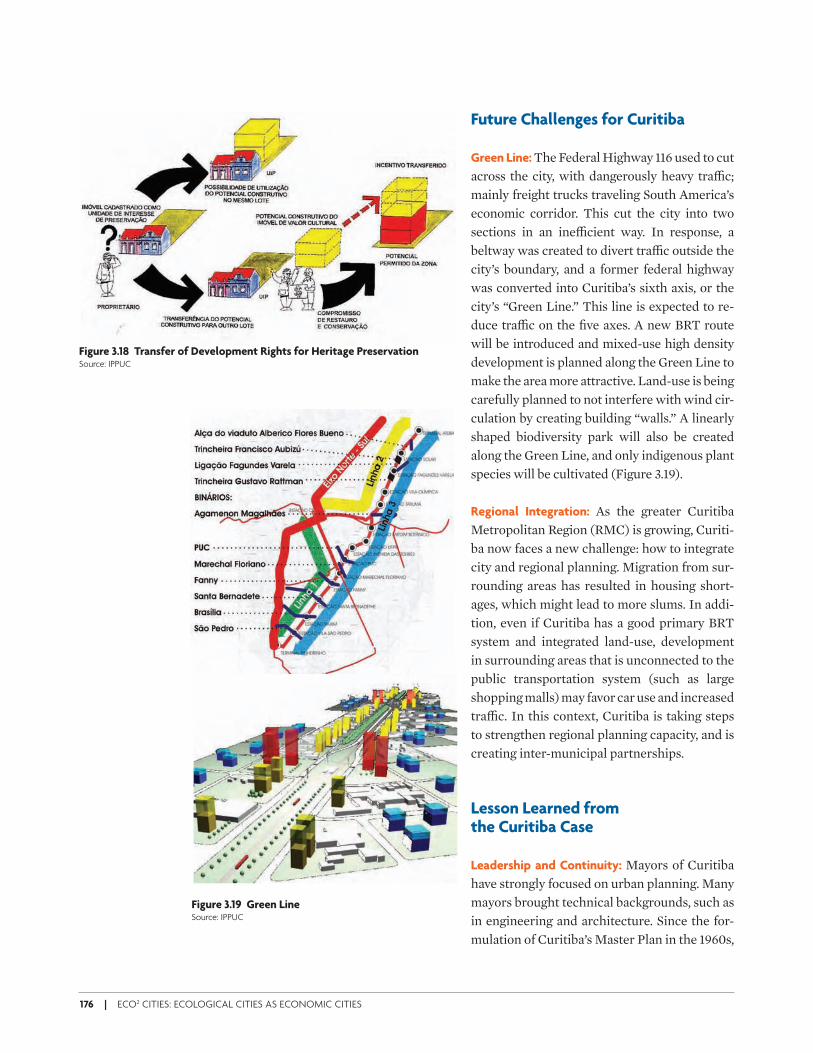
176 | ECO2 CITIES: ECOLOGICAL CITIES AS ECONOMIC CITIES
Future Challenges for Curitiba
Green Line: The Federal Highway 116 used to cut across the city, with dangerously heavy tra* c; mainly freight trucks traveling South America’s economic corridor. This cut the city into two sections in an ine* cient way. In response, a beltway was created to divert tra* c outside the city’s boundary, and a former federal highway was converted into Curitiba’s sixth axis, or the city’s “Green Line.” This line is expected to re-duce tra* c on the fi ve axes. A new BRT route will be introduced and mixed-use high density development is planned along the Green Line to make the area more attractive. Land-use is being carefully planned to not interfere with wind cir-culation by creating building “walls.” A linearly shaped biodiversity park will also be created along the Green Line, and only indigenous plant species will be cultivated (Figure 3.19).
Regional Integration: As the greater Curitiba Metropolitan Region (RMC) is growing, Curiti-ba now faces a new challenge: how to integrate city and regional planning. Migration from sur-rounding areas has resulted in housing short-ages, which might lead to more slums. In addi-tion, even if Curitiba has a good primary BRT system and integrated land-use, development in surrounding areas that is unconnected to the public transportation system (such as large shopping malls) may favor car use and increased tra* c. In this context, Curitiba is taking steps to strengthen regional planning capacity, and is creating inter-municipal partnerships.
Lesson Learned from the Curitiba Case
Leadership and Continuity: Mayors of Curitiba have strongly focused on urban planning. Many mayors brought technical backgrounds, such as in engineering and architecture. Since the for-mulation of Curitiba’s Master Plan in the 1960s,
Figure 3.18 Transfer of Development Rights for Heritage PreservationSource: IPPUC
Figure 3.19 Green LineSource: IPPUC
ECo2-Part3aREV_PREP 176 6/15/09 8:42:56 AM
A F I E L D R E F E R E N C E G U I D E | 177
the direction of urban planning has been largely consistent between administrations. Curitiba places a premium on implementation and rapid action to address urban issues; if there is a 70 percent of chance of success, the city puts plans quickly into action.
Institutionalized Planning and Expertise: Curiti-ba’s practices a& ect the city in several positive ways. Curitiba’s success was linked to strong mayoral leadership and people’s active partici-pation in city programs. It was also attributable to IPPUC, the integrated planning institute that has been playing an important role as a “mu-nicipally independent public authority” that researches, formulates, implements, and super-vises urban plans. The IPPUC provided inte-grated, cross-sector urban planning and over-sight of implementation and monitoring, while ensuring consistency amid changes in political leadership. These holistic approaches to urban planning were brought about by planners’ cre-ativity, imagination, and good understanding of local culture. For more than 50 years, engineers and architects have undertaken urban planning to address key urban issues in integrated ways. The work of the IPPUC ensures continuity and consistency in planning processes that extend beyond the mayoral cycles since 1966, when the IPPUC was established. Curitiba made the most of its existing infrastructure and local charac-teristics without spending much money on new construction. Although Curitiba’s activities were accomplished with little budgetary resources, tremendous benefi ts were achieved.
Citizen Ownership and Eco-consciousness: Citi-zens are encouraged and are provided opportu-nities to comment during urban planning pro-cesses. Public hearings with the mayor are held frequently, and proposed plans are evaluated and discussed with the community. People can speak directly to the mayor and city o* cials. More than 250 public hearing have been held since 2005. Citizens are actively involved in planning, as people have made the link between good urban planning and a better quality of life. The city provides opportunities for people to participate in other urban activities, such col-lecting garbage, constructing neighborhood roads, and maintaining green areas, which strengthen citizen ownership and maintenance of urban facilities. Children are also enrolled in environmental education activities, such as the urban waste program. Moreover, behaving in environmentally friendly ways is now the norm for Curitibanos.
Local Character: Curitiba considers its local sit-uation, including its budget, capacity, and social conditions, when devising urban strategies. Taking into account municipal capacity, local o* cials develop innovative solutions to solve urban problems. For example, rather than wait-ing for adequate revenues to construct a sub-way, Curitiba implemented the BRT system, which proved a& ordable and quick to imple-ment without time-consuming construction work.
ECo2-Part3aREV_PREP 177 6/15/09 8:42:57 AM

ECo2-Part3aREV_PREP 178 6/15/09 8:42:57 AM
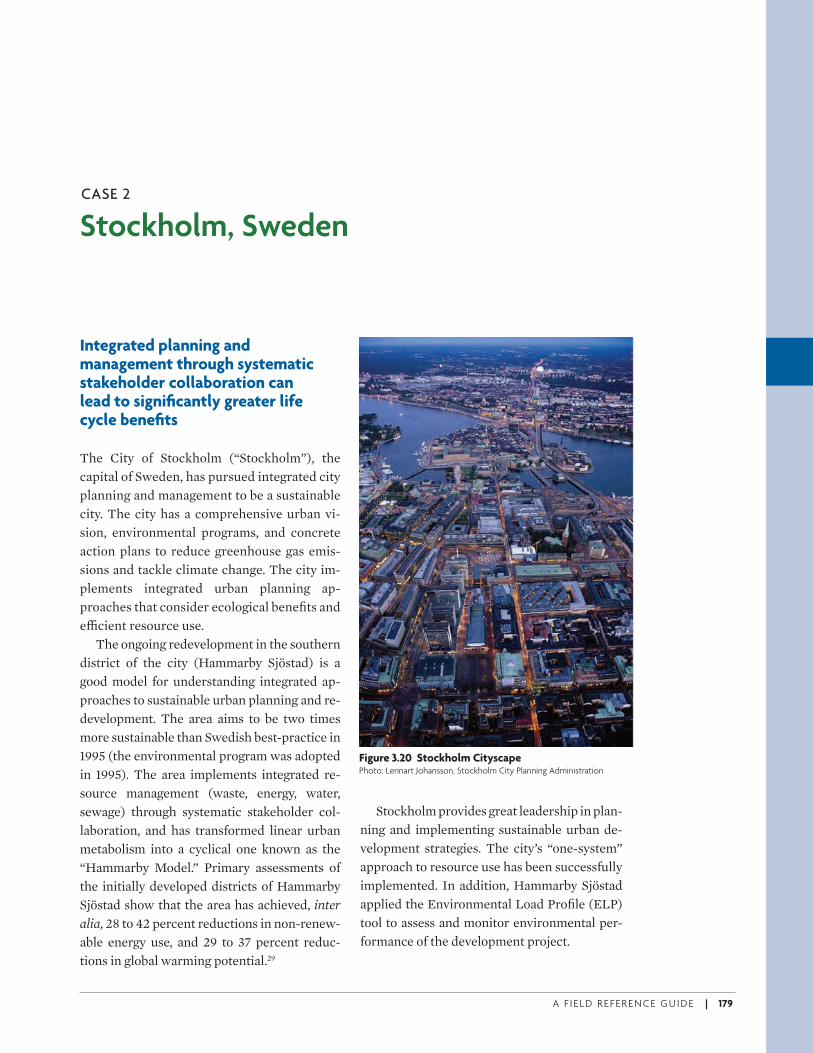
A F I E L D R E F E R E N C E G U I D E | 179
Stockholm, SwedenCASE 2
Integrated planning and management through systematic stakeholder collaboration can lead to signifi cantly greater life cycle benefi ts
The City of Stockholm (“Stockholm”), the capital of Sweden, has pursued integrated city planning and management to be a sustainable city. The city has a comprehensive urban vi-sion, environmental programs, and concrete action plans to reduce greenhouse gas emis-sions and tackle climate change. The city im-plements integrated urban planning ap-proaches that consider ecological benefi ts and e* cient resource use.
The ongoing redevelopment in the southern district of the city (Hammarby Sjöstad) is a good model for understanding integrated ap-proaches to sustainable urban planning and re-development. The area aims to be two times more sustainable than Swedish best-practice in 1995 (the environmental program was adopted in 1995). The area implements integrated re-source management (waste, energy, water, sewage) through systematic stakeholder col-laboration, and has transformed linear urban metabolism into a cyclical one known as the “Hammarby Model.” Primary assessments of the initially developed districts of Hammarby Sjöstad show that the area has achieved, inter alia, 28 to 42 percent reductions in non-renew-able energy use, and 29 to 37 percent reduc-tions in global warming potential.29
Figure 3.20 Stockholm CityscapePhoto: Lennart Johansson, Stockholm City Planning Administration
Stockholm provides great leadership in plan-ning and implementing sustainable urban de-velopment strategies. The city’s “one-system” approach to resource use has been successfully implemented. In addition, Hammarby Sjöstad applied the Environmental Load Profi le (ELP) tool to assess and monitor environmental per-formance of the development project.
ECo2-Part3aREV_PREP 179 6/15/09 8:42:57 AM
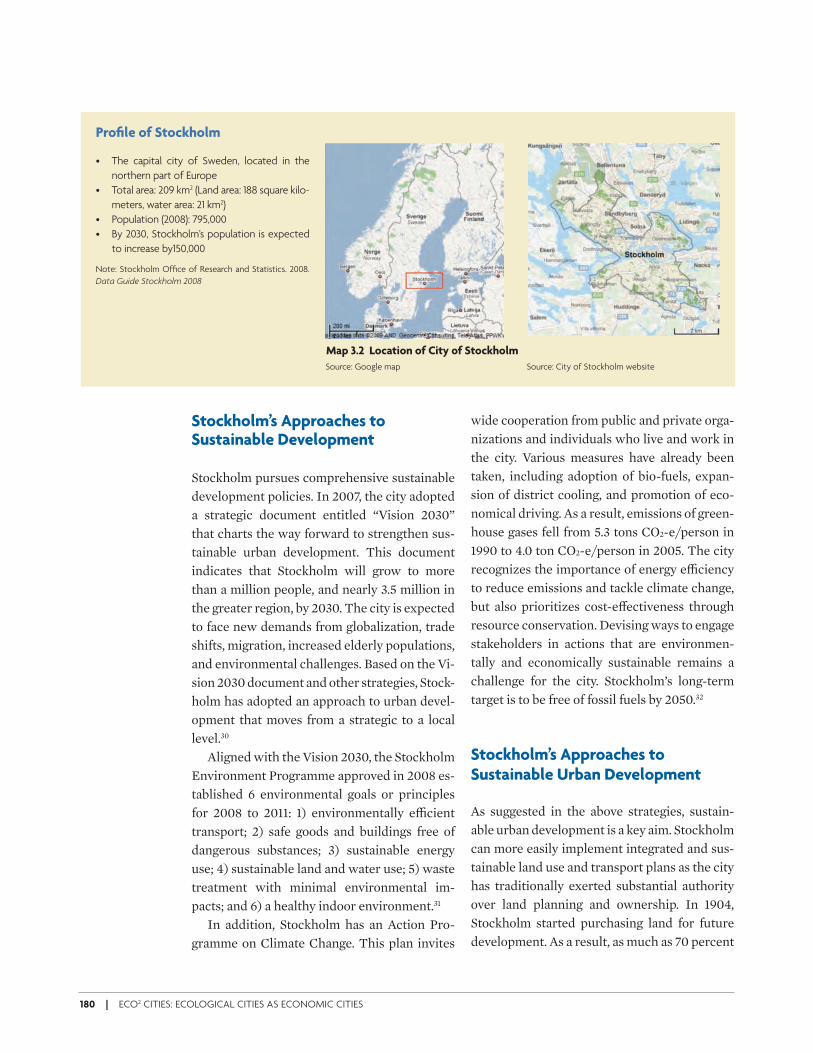
180 | ECO2 CITIES: ECOLOGICAL CITIES AS ECONOMIC CITIES
Stockholm’s Approaches to Sustainable Development
Stockholm pursues comprehensive sustainable development policies. In 2007, the city adopted a strategic document entitled “Vision 2030” that charts the way forward to strengthen sus-tainable urban development. This document indicates that Stockholm will grow to more than a million people, and nearly 3.5 million in the greater region, by 2030. The city is expected to face new demands from globalization, trade shifts, migration, increased elderly populations, and environmental challenges. Based on the Vi-sion 2030 document and other strategies, Stock-holm has adopted an approach to urban devel-opment that moves from a strategic to a local level.30
Aligned with the Vision 2030, the Stockholm Environment Programme approved in 2008 es-tablished 6 environmental goals or principles for 2008 to 2011: 1) environmentally e* cient transport; 2) safe goods and buildings free of dangerous substances; 3) sustainable energy use; 4) sustainable land and water use; 5) waste treatment with minimal environmental im-pacts; and 6) a healthy indoor environment.31
In addition, Stockholm has an Action Pro-gramme on Climate Change. This plan invites
wide cooperation from public and private orga-nizations and individuals who live and work in the city. Various measures have already been taken, including adoption of bio-fuels, expan-sion of district cooling, and promotion of eco-nomical driving. As a result, emissions of green-house gases fell from 5.3 tons CO2-e/person in 1990 to 4.0 ton CO2-e/person in 2005. The city recognizes the importance of energy e* ciency to reduce emissions and tackle climate change, but also prioritizes cost-e& ectiveness through resource conservation. Devising ways to engage stakeholders in actions that are environmen-tally and economically sustainable remains a challenge for the city. Stockholm’s long-term target is to be free of fossil fuels by 2050.32
Stockholm’s Approaches to Sustainable Urban Development
As suggested in the above strategies, sustain-able urban development is a key aim. Stockholm can more easily implement integrated and sus-tainable land use and transport plans as the city has traditionally exerted substantial authority over land planning and ownership. In 1904, Stockholm started purchasing land for future development. As a result, as much as 70 percent
Profi le of Stockholm
• The capital city of Sweden, located in the
northern part of Europe
• Total area: 209 km2 (Land area: 188 square kilo-
meters, water area: 21 km2)
• Population (2008): 795,000
• By 2030, Stockholm’s population is expected
to increase by150,000
Note: Stockholm Offi ce of Research and Statistics. 2008.
Data Guide Stockholm 2008
Map 3.2 Location of City of Stockholm
Source: Google map Source: City of Stockholm website
ECo2-Part3aREV_PREP 180 6/15/09 8:42:58 AM
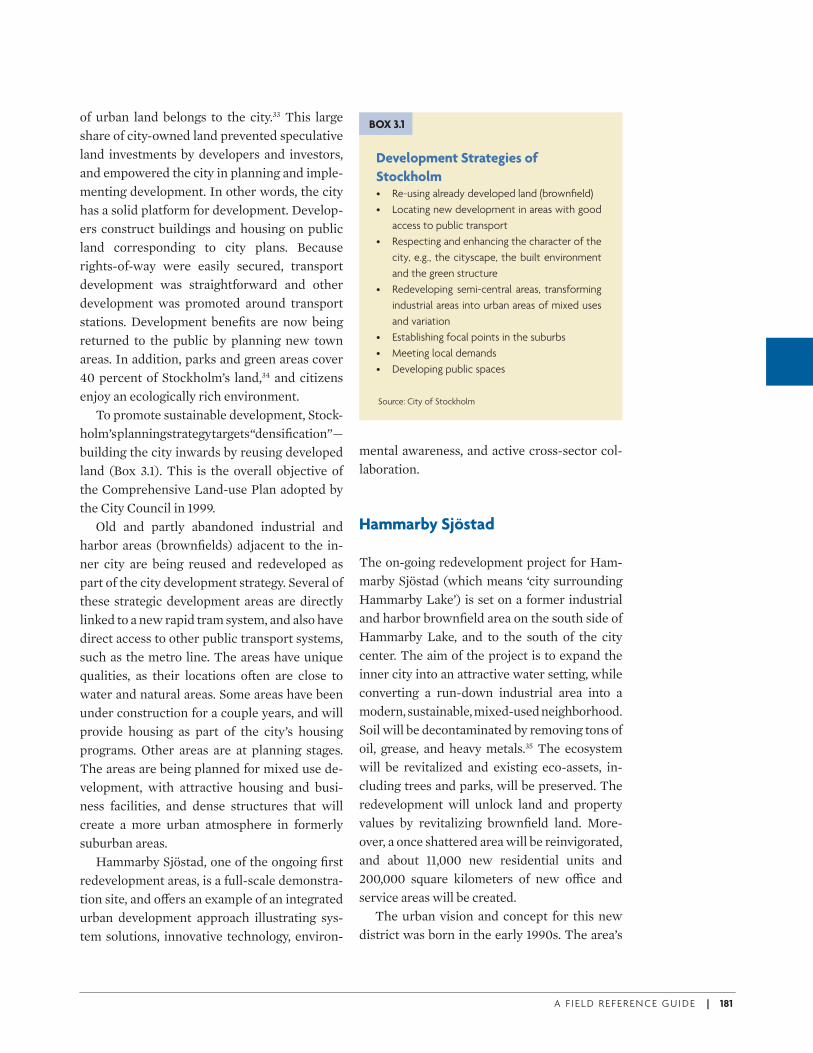
A F I E L D R E F E R E N C E G U I D E | 181
of urban land belongs to the city.33 This large share of city-owned land prevented speculative land investments by developers and investors, and empowered the city in planning and imple-menting development. In other words, the city has a solid platform for development. Develop-ers construct buildings and housing on public land corresponding to city plans. Because rights-of-way were easily secured, transport development was straightforward and other development was promoted around transport stations. Development benefi ts are now being returned to the public by planning new town areas. In addition, parks and green areas cover 40 percent of Stockholm’s land,34 and citizens enjoy an ecologically rich environment.
To promote sustainable development, Stock-holm’s planning strategy targets “densifi cation”—building the city inwards by reusing developed land (Box 3.1). This is the overall objective of the Comprehensive Land-use Plan adopted by the City Council in 1999.
Old and partly abandoned industrial and harbor areas (brownfi elds) adjacent to the in-ner city are being reused and redeveloped as part of the city development strategy. Several of these strategic development areas are directly linked to a new rapid tram system, and also have direct access to other public transport systems, such as the metro line. The areas have unique qualities, as their locations often are close to water and natural areas. Some areas have been under construction for a couple years, and will provide housing as part of the city’s housing programs. Other areas are at planning stages. The areas are being planned for mixed use de-velopment, with attractive housing and busi-ness facilities, and dense structures that will create a more urban atmosphere in formerly suburban areas.
Hammarby Sjöstad, one of the ongoing fi rst redevelopment areas, is a full-scale demonstra-tion site, and o& ers an example of an integrated urban development approach illustrating sys-tem solutions, innovative technology, environ-
mental awareness, and active cross-sector col-laboration.
Hammarby Sjöstad
The on-going redevelopment project for Ham-marby Sjöstad (which means ‘city surrounding Hammarby Lake’) is set on a former industrial and harbor brownfi eld area on the south side of Hammarby Lake, and to the south of the city center. The aim of the project is to expand the inner city into an attractive water setting, while converting a run-down industrial area into a modern, sustainable, mixed-used neighborhood. Soil will be decontaminated by removing tons of oil, grease, and heavy metals.35 The ecosystem will be revitalized and existing eco-assets, in-cluding trees and parks, will be preserved. The redevelopment will unlock land and property values by revitalizing brownfi eld land. More-over, a once shattered area will be reinvigorated, and about 11,000 new residential units and 200,000 square kilometers of new o* ce and service areas will be created.
The urban vision and concept for this new district was born in the early 1990s. The area’s
Development Strategies of
Stockholm• Re-using already developed land (brownfi eld)
• Locating new development in areas with good
access to public transport
• Respecting and enhancing the character of the
city, e.g., the cityscape, the built environment
and the green structure
• Redeveloping semi-central areas, transforming
industrial areas into urban areas of mixed uses
and variation
• Establishing focal points in the suburbs
• Meeting local demands
• Developing public spaces
BOX 3.1
Source: City of Stockholm
ECo2-Part3aREV_PREP 181 6/15/09 8:43:00 AM
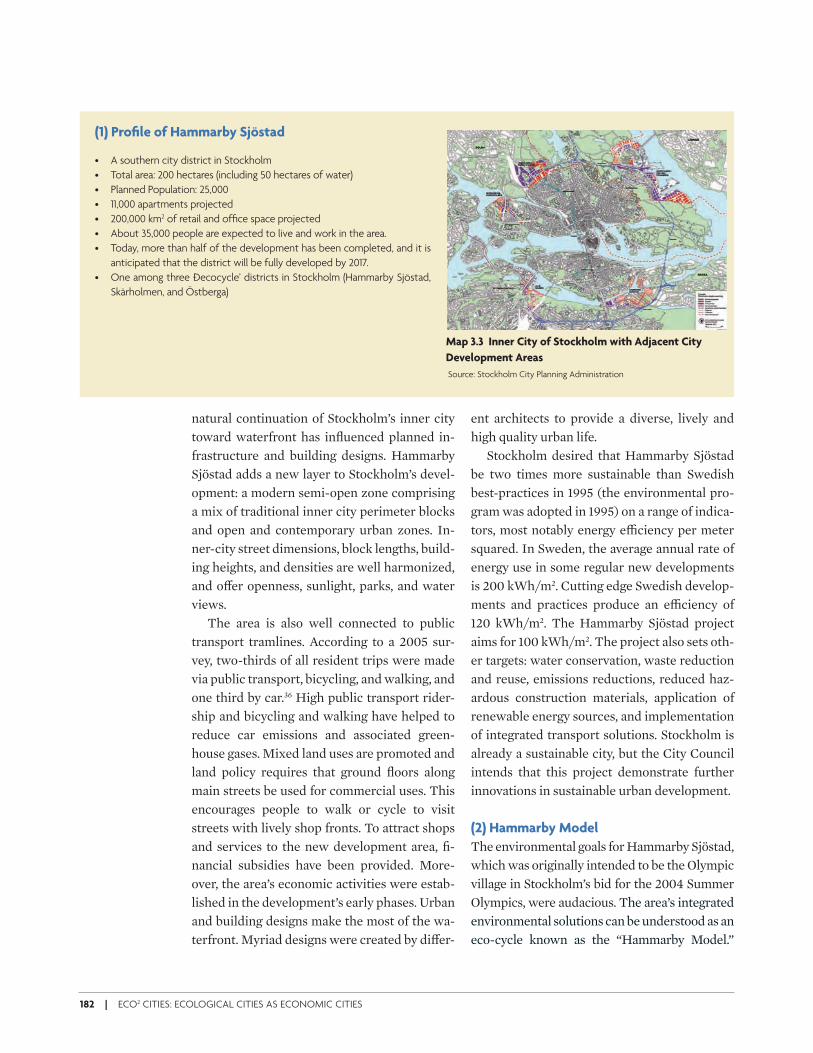
182 | ECO2 CITIES: ECOLOGICAL CITIES AS ECONOMIC CITIES
natural continuation of Stockholm’s inner city toward waterfront has infl uenced planned in-frastructure and building designs. Hammarby Sjöstad adds a new layer to Stockholm’s devel-opment: a modern semi-open zone comprising a mix of traditional inner city perimeter blocks and open and contemporary urban zones. In-ner-city street dimensions, block lengths, build-ing heights, and densities are well harmonized, and o& er openness, sunlight, parks, and water views.
The area is also well connected to public transport tramlines. According to a 2005 sur-vey, two-thirds of all resident trips were made via public transport, bicycling, and walking, and one third by car.36 High public transport rider-ship and bicycling and walking have helped to reduce car emissions and associated green-house gases. Mixed land uses are promoted and land policy requires that ground fl oors along main streets be used for commercial uses. This encourages people to walk or cycle to visit streets with lively shop fronts. To attract shops and services to the new development area, fi -nancial subsidies have been provided. More-over, the area’s economic activities were estab-lished in the development’s early phases. Urban and building designs make the most of the wa-terfront. Myriad designs were created by di& er-
ent architects to provide a diverse, lively and high quality urban life.
Stockholm desired that Hammarby Sjöstad be two times more sustainable than Swedish best-practices in 1995 (the environmental pro-gram was adopted in 1995) on a range of indica-tors, most notably energy e* ciency per meter squared. In Sweden, the average annual rate of energy use in some regular new developments is 200 kWh/m2. Cutting edge Swedish develop-ments and practices produce an e* ciency of 120 kWh/m2. The Hammarby Sjöstad project aims for 100 kWh/m2. The project also sets oth-er targets: water conservation, waste reduction and reuse, emissions reductions, reduced haz-ardous construction materials, application of renewable energy sources, and implementation of integrated transport solutions. Stockholm is already a sustainable city, but the City Council intends that this project demonstrate further innovations in sustainable urban development.
(2) Hammarby Model
The environmental goals for Hammarby Sjöstad, which was originally intended to be the Olympic village in Stockholm’s bid for the 2004 Summer Olympics, were audacious. The area’s integrated environmental solutions can be understood as an eco-cycle known as the “Hammarby Model.”
(1) Profi le of Hammarby Sjöstad
• A southern city district in Stockholm
• Total area: 200 hectares (including 50 hectares of water)
• Planned Population: 25,000
• 11,000 apartments projected
• 200,000 km2 of retail and offi ce space projected
• About 35,000 people are expected to live and work in the area.
• Today, more than half of the development has been completed, and it is
anticipated that the district will be fully developed by 2017.
• One among three Ðecocycle’ districts in Stockholm (Hammarby Sjöstad,
Skärholmen, and Östberga)
Map 3.3 Inner City of Stockholm with Adjacent City
Development Areas
Source: Stockholm City Planning Administration
ECo2-Part3aREV_PREP 182 6/15/09 8:43:00 AM
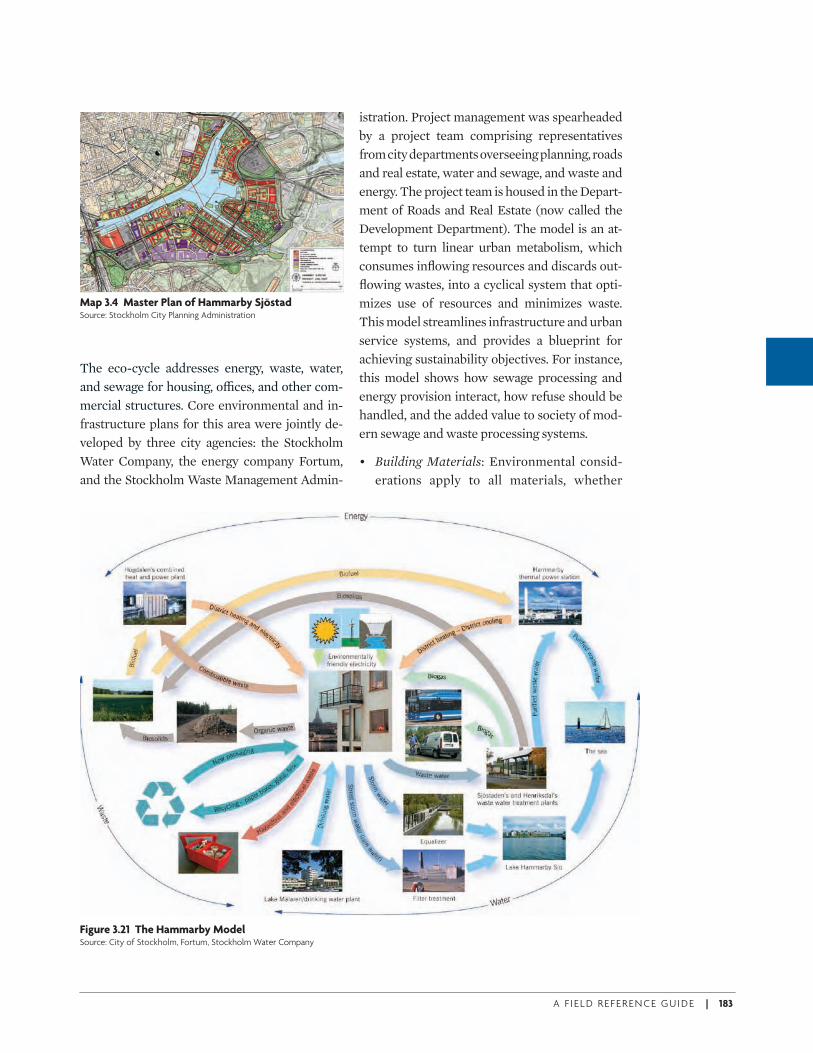
A F I E L D R E F E R E N C E G U I D E | 183
The eco-cycle addresses energy, waste, water, and sewage for housing, o* ces, and other com-mercial structures. Core environmental and in-frastructure plans for this area were jointly de-veloped by three city agencies: the Stockholm Water Company, the energy company Fortum, and the Stockholm Waste Management Admin-
istration. Project management was spearheaded by a project team comprising representatives from city departments overseeing planning, roads and real estate, water and sewage, and waste and energy. The project team is housed in the Depart-ment of Roads and Real Estate (now called the Development Department). The model is an at-tempt to turn linear urban metabolism, which consumes infl owing resources and discards out-fl owing wastes, into a cyclical system that opti-mizes use of resources and minimizes waste. This model streamlines infrastructure and urban service systems, and provides a blueprint for achieving sustainability objectives. For instance, this model shows how sewage processing and energy provision interact, how refuse should be handled, and the added value to society of mod-ern sewage and waste processing systems.
• Building Materials: Environmental consid-erations apply to all materials, whether
Map 3.4 Master Plan of Hammarby SjöstadSource: Stockholm City Planning Administration
Figure 3.21 The Hammarby ModelSource: City of Stockholm, Fortum, Stockholm Water Company
ECo2-Part3aREV_PREP 183 6/15/09 8:43:00 AM
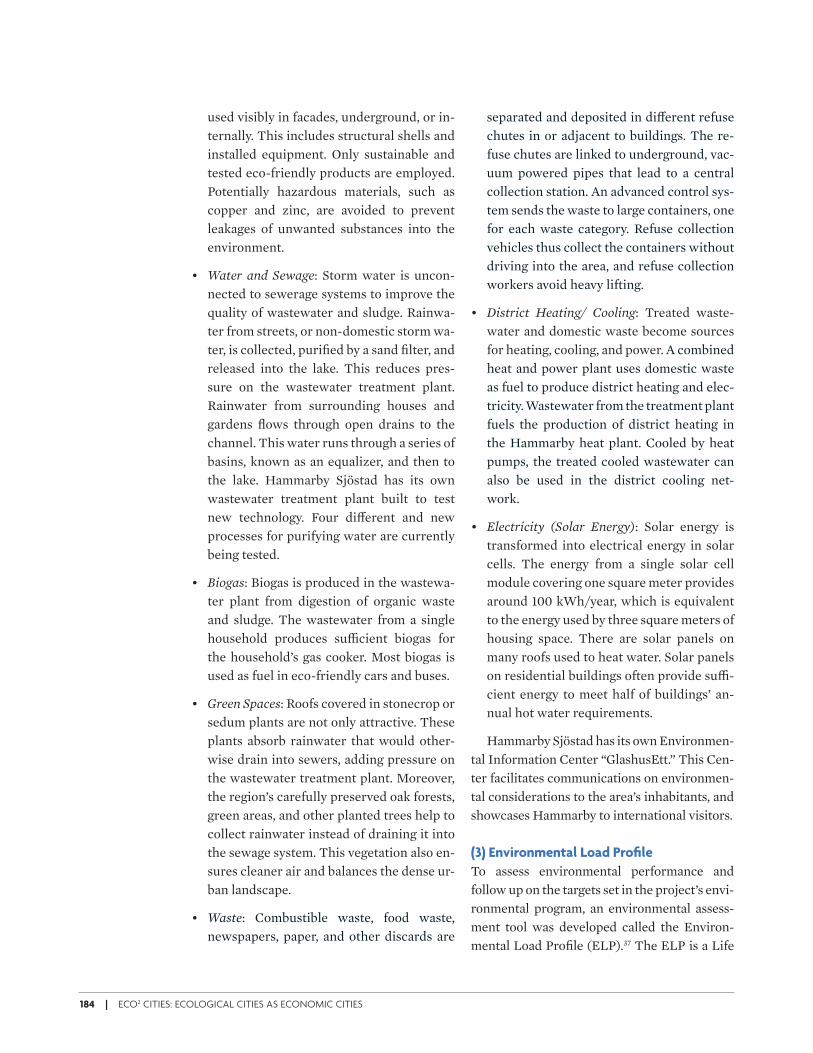
184 | ECO2 CITIES: ECOLOGICAL CITIES AS ECONOMIC CITIES
used visibly in facades, underground, or in-ternally. This includes structural shells and installed equipment. Only sustainable and tested eco-friendly products are employed. Potentially hazardous materials, such as copper and zinc, are avoided to prevent leakages of unwanted substances into the environment.
• Water and Sewage: Storm water is uncon-nected to sewerage systems to improve the quality of wastewater and sludge. Rainwa-ter from streets, or non-domestic storm wa-ter, is collected, purifi ed by a sand fi lter, and released into the lake. This reduces pres-sure on the wastewater treatment plant. Rainwater from surrounding houses and gardens fl ows through open drains to the channel. This water runs through a series of basins, known as an equalizer, and then to the lake. Hammarby Sjöstad has its own wastewater treatment plant built to test new technology. Four di& erent and new processes for purifying water are currently being tested.
• Biogas: Biogas is produced in the wastewa-ter plant from digestion of organic waste and sludge. The wastewater from a single household produces su* cient biogas for the household’s gas cooker. Most biogas is used as fuel in eco-friendly cars and buses.
• Green Spaces: Roofs covered in stonecrop or sedum plants are not only attractive. These plants absorb rainwater that would other-wise drain into sewers, adding pressure on the wastewater treatment plant. Moreover, the region’s carefully preserved oak forests, green areas, and other planted trees help to collect rainwater instead of draining it into the sewage system. This vegetation also en-sures cleaner air and balances the dense ur-ban landscape.
• Waste: Combustible waste, food waste, newspapers, paper, and other discards are
separated and deposited in di& erent refuse chutes in or adjacent to buildings. The re-fuse chutes are linked to underground, vac-uum powered pipes that lead to a central collection station. An advanced control sys-tem sends the waste to large containers, one for each waste category. Refuse collection vehicles thus collect the containers without driving into the area, and refuse collection workers avoid heavy lifting.
• District Heating/ Cooling: Treated waste-water and domestic waste become sources for heating, cooling, and power. A combined heat and power plant uses domestic waste as fuel to produce district heating and elec-tricity. Wastewater from the treatment plant fuels the production of district heating in the Hammarby heat plant. Cooled by heat pumps, the treated cooled wastewater can also be used in the district cooling net-work.
• Electricity (Solar Energy): Solar energy is transformed into electrical energy in solar cells. The energy from a single solar cell module covering one square meter provides around 100 kWh/year, which is equivalent to the energy used by three square meters of housing space. There are solar panels on many roofs used to heat water. Solar panels on residential buildings often provide su* -cient energy to meet half of buildings’ an-nual hot water requirements.
Hammarby Sjöstad has its own Environmen-tal Information Center “GlashusEtt.” This Cen-ter facilitates communications on environmen-tal considerations to the area’s inhabitants, and showcases Hammarby to international visitors.
(3) Environmental Load Profi le
To assess environmental performance and follow up on the targets set in the project’s envi-ronmental program, an environmental assess-ment tool was developed called the Environ-mental Load Profi le (ELP).37 The ELP is a Life
ECo2-Part3aREV_PREP 184 6/15/09 8:43:02 AM
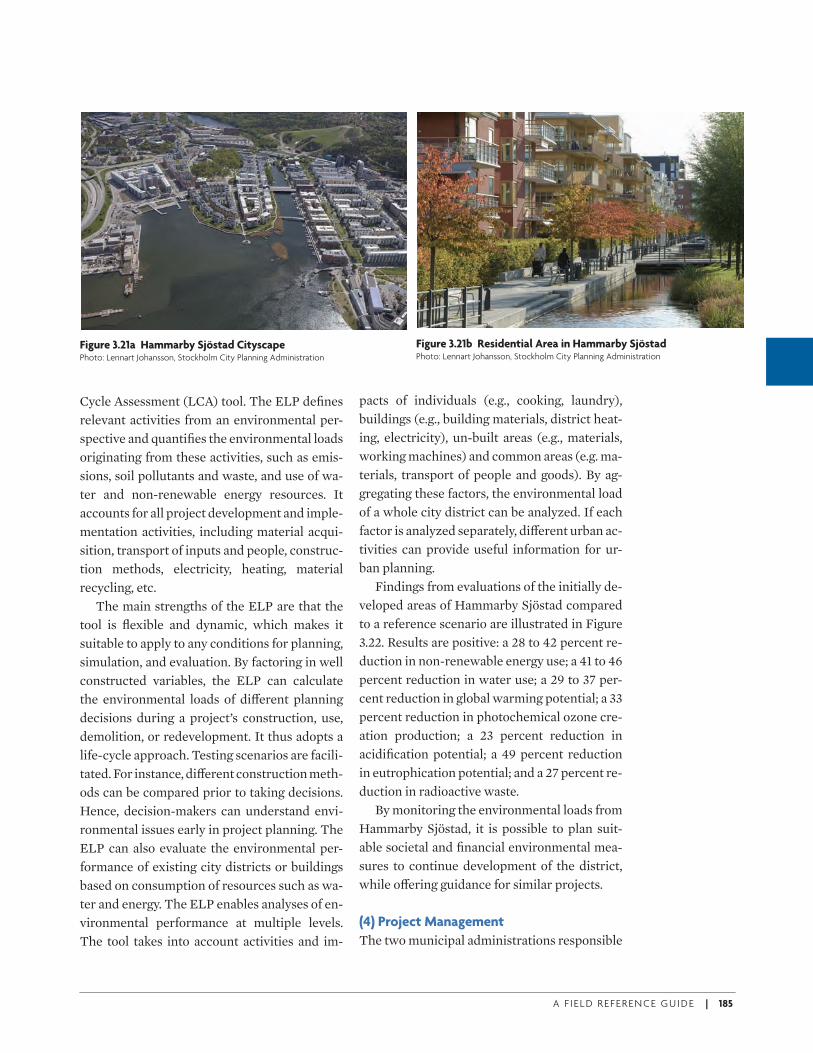
A F I E L D R E F E R E N C E G U I D E | 185
Cycle Assessment (LCA) tool. The ELP defi nes relevant activities from an environmental per-spective and quantifi es the environmental loads originating from these activities, such as emis-sions, soil pollutants and waste, and use of wa-ter and non-renewable energy resources. It accounts for all project development and imple-mentation activities, including material acqui-sition, transport of inputs and people, construc-tion methods, electricity, heating, material recycling, etc.
The main strengths of the ELP are that the tool is fl exible and dynamic, which makes it suitable to apply to any conditions for planning, simulation, and evaluation. By factoring in well constructed variables, the ELP can calculate the environmental loads of di& erent planning decisions during a project’s construction, use, demolition, or redevelopment. It thus adopts a life-cycle approach. Testing scenarios are facili-tated. For instance, di& erent construction meth-ods can be compared prior to taking decisions. Hence, decision-makers can understand envi-ronmental issues early in project planning. The ELP can also evaluate the environmental per-formance of existing city districts or buildings based on consumption of resources such as wa-ter and energy. The ELP enables analyses of en-vironmental performance at multiple levels. The tool takes into account activities and im-
pacts of individuals (e.g., cooking, laundry), buildings (e.g., building materials, district heat-ing, electricity), un-built areas (e.g., materials, working machines) and common areas (e.g. ma-terials, transport of people and goods). By ag-gregating these factors, the environmental load of a whole city district can be analyzed. If each factor is analyzed separately, di& erent urban ac-tivities can provide useful information for ur-ban planning.
Findings from evaluations of the initially de-veloped areas of Hammarby Sjöstad compared to a reference scenario are illustrated in Figure 3.22. Results are positive: a 28 to 42 percent re-duction in non-renewable energy use; a 41 to 46 percent reduction in water use; a 29 to 37 per-cent reduction in global warming potential; a 33 percent reduction in photochemical ozone cre-ation production; a 23 percent reduction in acidifi cation potential; a 49 percent reduction in eutrophication potential; and a 27 percent re-duction in radioactive waste.
By monitoring the environmental loads from Hammarby Sjöstad, it is possible to plan suit-able societal and fi nancial environmental mea-sures to continue development of the district, while o& ering guidance for similar projects.
(4) Project Management
The two municipal administrations responsible
Figure 3.21a Hammarby Sjöstad CityscapePhoto: Lennart Johansson, Stockholm City Planning Administration
Figure 3.21b Residential Area in Hammarby SjöstadPhoto: Lennart Johansson, Stockholm City Planning Administration
ECo2-Part3aREV_PREP 185 6/15/09 8:43:02 AM
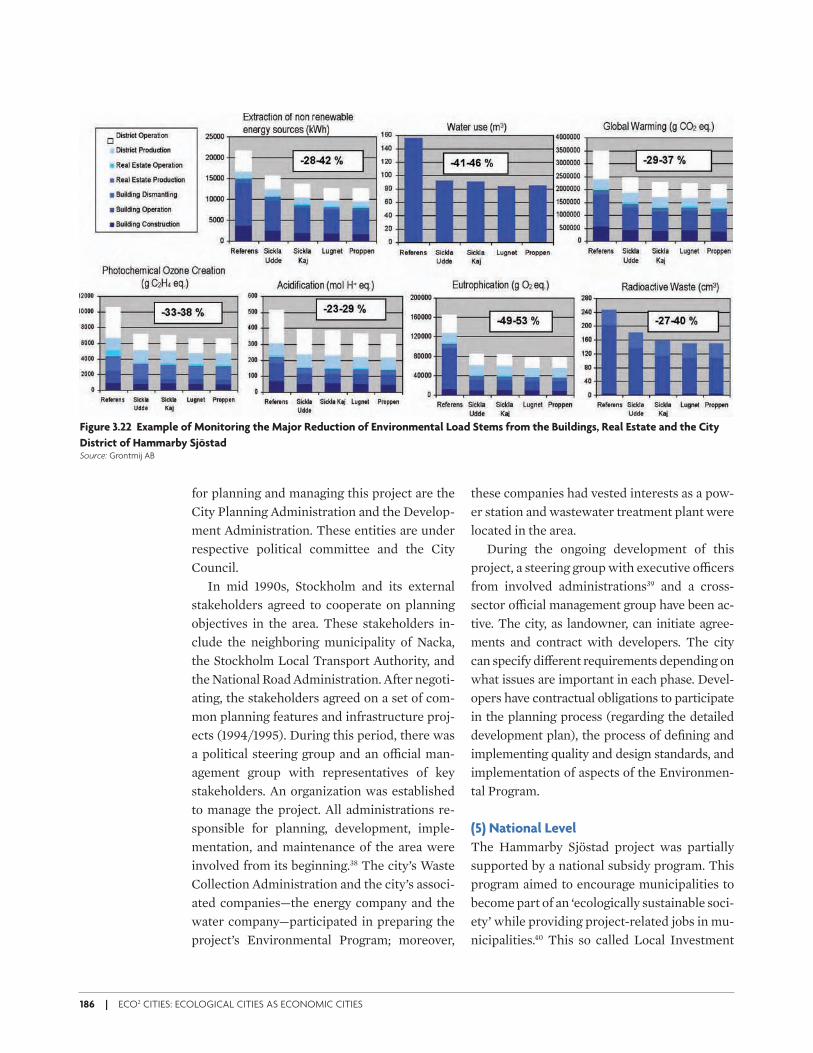
186 | ECO2 CITIES: ECOLOGICAL CITIES AS ECONOMIC CITIES
for planning and managing this project are the City Planning Administration and the Develop-ment Administration. These entities are under respective political committee and the City Council.
In mid 1990s, Stockholm and its external stakeholders agreed to cooperate on planning objectives in the area. These stakeholders in-clude the neighboring municipality of Nacka, the Stockholm Local Transport Authority, and the National Road Administration. After negoti-ating, the stakeholders agreed on a set of com-mon planning features and infrastructure proj-ects (1994/1995). During this period, there was a political steering group and an o* cial man-agement group with representatives of key stakeholders. An organization was established to manage the project. All administrations re-sponsible for planning, development, imple-mentation, and maintenance of the area were involved from its beginning.38 The city’s Waste Collection Administration and the city’s associ-ated companies—the energy company and the water company—participated in preparing the project’s Environmental Program; moreover,
these companies had vested interests as a pow-er station and wastewater treatment plant were located in the area.
During the ongoing development of this project, a steering group with executive o* cers from involved administrations39 and a cross-sector o* cial management group have been ac-tive. The city, as landowner, can initiate agree-ments and contract with developers. The city can specify di& erent requirements depending on what issues are important in each phase. Devel-opers have contractual obligations to participate in the planning process (regarding the detailed development plan), the process of defi ning and implementing quality and design standards, and implementation of aspects of the Environmen-tal Program.
(5) National Level
The Hammarby Sjöstad project was partially supported by a national subsidy program. This program aimed to encourage municipalities to become part of an ‘ecologically sustainable soci-ety’ while providing project-related jobs in mu-nicipalities.40 This so called Local Investment
Figure 3.22 Example of Monitoring the Major Reduction of Environmental Load Stems from the Buildings, Real Estate and the City
District of Hammarby SjöstadSource: Grontmij AB
ECo2-Part3aREV_PREP 186 6/15/09 8:43:03 AM
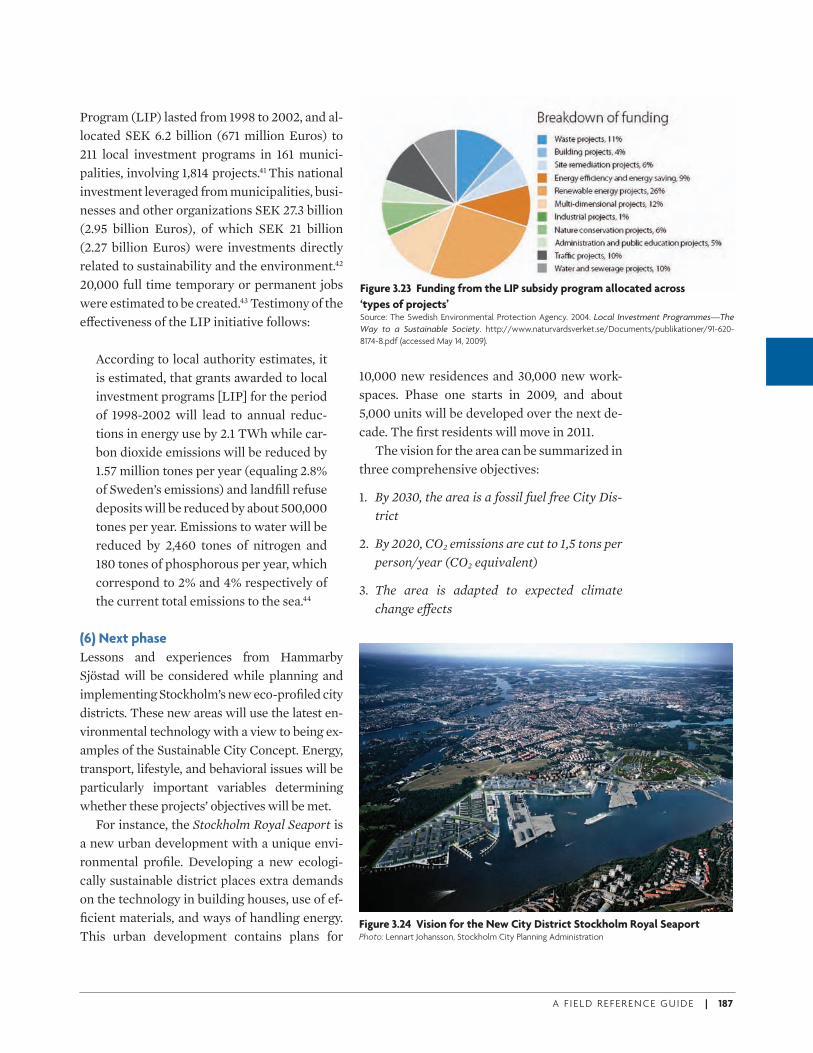
A F I E L D R E F E R E N C E G U I D E | 187
Program (LIP) lasted from 1998 to 2002, and al-located SEK 6.2 billion (671 million Euros) to 211 local investment programs in 161 munici-palities, involving 1,814 projects.41 This national investment leveraged from municipalities, busi-nesses and other organizations SEK 27.3 billion (2.95 billion Euros), of which SEK 21 billion (2.27 billion Euros) were investments directly related to sustainability and the environment.42 20,000 full time temporary or permanent jobs were estimated to be created.43 Testimony of the e& ectiveness of the LIP initiative follows:
According to local authority estimates, it is estimated, that grants awarded to local investment programs [LIP] for the period of 1998-2002 will lead to annual reduc-tions in energy use by 2.1 TWh while car-bon dioxide emissions will be reduced by 1.57 million tones per year (equaling 2.8% of Sweden’s emissions) and landfi ll refuse deposits will be reduced by about 500,000 tones per year. Emissions to water will be reduced by 2,460 tones of nitrogen and 180 tones of phosphorous per year, which correspond to 2% and 4% respectively of the current total emissions to the sea.44
(6) Next phase
Lessons and experiences from Hammarby Sjöstad will be considered while planning and implementing Stockholm’s new eco-profi led city districts. These new areas will use the latest en-vironmental technology with a view to being ex-amples of the Sustainable City Concept. Energy, transport, lifestyle, and behavioral issues will be particularly important variables determining whether these projects’ objectives will be met.
For instance, the Stockholm Royal Seaport is a new urban development with a unique envi-ronmental profi le. Developing a new ecologi-cally sustainable district places extra demands on the technology in building houses, use of ef-fi cient materials, and ways of handling energy. This urban development contains plans for
10,000 new residences and 30,000 new work-spaces. Phase one starts in 2009, and about 5,000 units will be developed over the next de-cade. The fi rst residents will move in 2011.
The vision for the area can be summarized in three comprehensive objectives:
1. By 2030, the area is a fossil fuel free City Dis-trict
2. By 2020, CO2 emissions are cut to 1,5 tons per
person/year (CO2 equivalent)
3. The area is adapted to expected climate
change e. ects
Figure 3.23 Funding from the LIP subsidy program allocated across
‘types of projects’Source: The Swedish Environmental Protection Agency. 2004. Local Investment Programmes—The
Way to a Sustainable Society. http://www.naturvardsverket.se/Documents/publikationer/91-620-
8174-8.pdf (accessed May 14, 2009).
Figure 3.24 Vision for the New City District Stockholm Royal Seaport Photo: Lennart Johansson, Stockholm City Planning Administration
ECo2-Part3aREV_PREP 187 6/15/09 8:43:04 AM
188 | ECO2 CITIES: ECOLOGICAL CITIES AS ECONOMIC CITIES
The project’s focus areas are energy con-sumption and e* ciency, sustainable transport, climate change adaptation, eco-cycle modeling, and maintenance of a quality lifestyle. Other im-portant goals include having a holistic and inte-grated process, continuous evaluation and fol-low-up, and assessment and cooperation among private, public, and academic stakeholders.
Lessons Learnt from Stockholm Case
Great leadership in planning and implementing sustainable urban development strategies shows Stockholm’s strong commitment to sus-tainable development. Success in a project such as Hammarby Sjöstad depends on good coordi-nation among key stakeholders. Stockholm’s various departments were integrated into a sin-gle fabric led by a project manager and an envi-ronmental o* cer whose responsibilities were to “guide and infl uence all stakeholders, public as well as private, to realize the environmental objectives of the project.”45 Moreover, integrat-ed planning and management through system-atic stakeholder collaboration can lead to sig-nifi cantly greater life cycle benefi ts.
The ELP can serve as a decision-making tool in cities in developing countries after a few modifi cations, as this ELP focused on a Swedish context. Nonetheless, the ELP provides a sys-tematic and standardized methodology to quan-tify costs and benefi ts of developments. To apply the ELP to developing countries, the fol-lowing are proposed:
• Expanding the ELP to include assessments of other input variables, such as the impacts that e* cient spatial planning, integrated land use, and improved management of sol-id waste can have on output indicators.
• Improving and fi ne-tuning the existing pro-gram by fi lling in gaps and streamlining the inclusion of the inputs noted above. More-over, the complete model needs to be adapt-ed to large scale use, and adjusted to fi t de-veloping country contexts.
• Outputs in the current ELP have environ-mental indicators, such as carbon emis-sions. Converting these indicators from en-vironmental indicators to economic and fi scal indicators is necessary to help policy-makers make better decisions.
ECo2-Part3aREV_PREP 188 6/15/09 8:43:04 AM
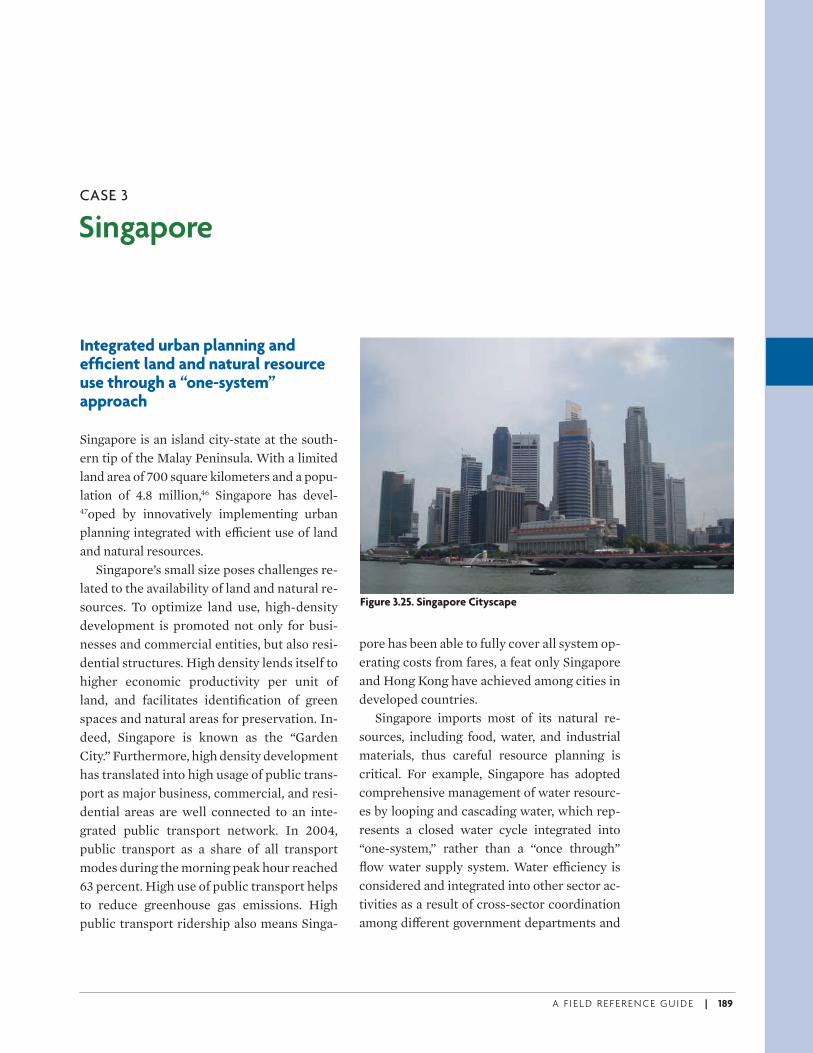
A F I E L D R E F E R E N C E G U I D E | 189
SingaporeCASE 3
Integrated urban planning and effi cient land and natural resource use through a “one-system” approach
Singapore is an island city-state at the south-ern tip of the Malay Peninsula. With a limited land area of 700 square kilometers and a popu-lation of 4.8 million,46 Singapore has devel-47oped by innovatively implementing urban planning integrated with e* cient use of land and natural resources.
Singapore’s small size poses challenges re-lated to the availability of land and natural re-sources. To optimize land use, high-density development is promoted not only for busi-nesses and commercial entities, but also resi-dential structures. High density lends itself to higher economic productivity per unit of land, and facilitates identifi cation of green spaces and natural areas for preservation. In-deed, Singapore is known as the “Garden City.” Furthermore, high density development has translated into high usage of public trans-port as major business, commercial, and resi-dential areas are well connected to an inte-grated public transport network. In 2004, public transport as a share of all transport modes during the morning peak hour reached 63 percent. High use of public transport helps to reduce greenhouse gas emissions. High public transport ridership also means Singa-
Figure 3.25. Singapore Cityscape
pore has been able to fully cover all system op-erating costs from fares, a feat only Singapore and Hong Kong have achieved among cities in developed countries.
Singapore imports most of its natural re-sources, including food, water, and industrial materials, thus careful resource planning is critical. For example, Singapore has adopted comprehensive management of water resourc-es by looping and cascading water, which rep-resents a closed water cycle integrated into “one-system,” rather than a “once through” fl ow water supply system. Water e* ciency is considered and integrated into other sector ac-tivities as a result of cross-sector coordination among di& erent government departments and
ECo2-Part3aREV_PREP 189 6/15/09 8:43:05 AM
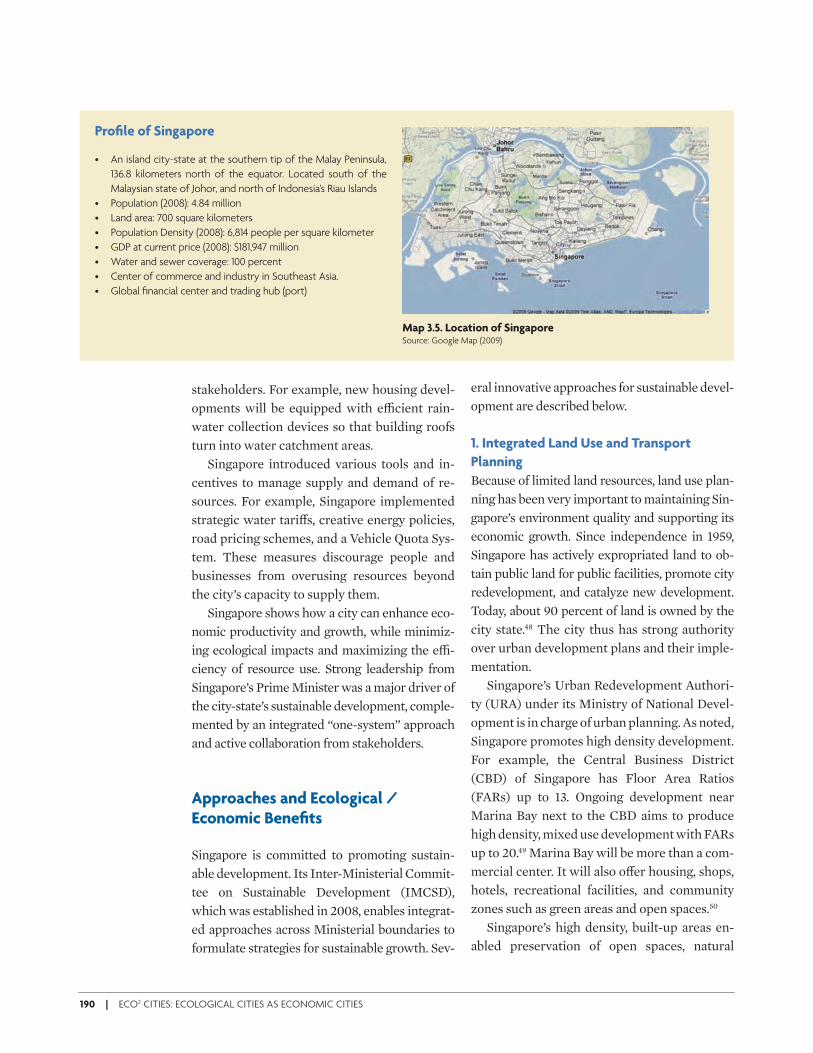
stakeholders. For example, new housing devel-opments will be equipped with e%cient rain-water collection devices so that building roofs turn into water catchment areas.
Singapore introduced various tools and in-centives to manage supply and demand of re-sources. For example, Singapore implemented strategic water tari&s, creative energy policies, road pricing schemes, and a Vehicle Quota Sys-tem. These measures discourage people and businesses from overusing resources beyond the city’s capacity to supply them.
Singapore shows how a city can enhance eco-nomic productivity and growth, while minimiz-ing ecological impacts and maximizing the e%-ciency of resource use. Strong leadership from Singapore’s Prime Minister was a major driver of the city-state’s sustainable development, comple-mented by an integrated “one-system” approach and active collaboration from stakeholders.
Singapore is committed to promoting sustain-able development. Its Inter-Ministerial Commit-tee on Sustainable Development (IMCSD), which was established in 2008, enables integrat-ed approaches across Ministerial boundaries to formulate strategies for sustainable growth. Sev-
eral innovative approaches for sustainable devel-opment are described below.
Because of limited land resources, land use plan-ning has been very important to maintaining Sin-gapore’s environment quality and supporting its economic growth. Since independence in 1959, Singapore has actively expropriated land to ob-tain public land for public facilities, promote city redevelopment, and catalyze new development. Today, about 90 percent of land is owned by the city state.48 The city thus has strong authority over urban development plans and their imple-mentation.
Singapore’s Urban Redevelopment Authori-ty (URA) under its Ministry of National Devel-opment is in charge of urban planning. As noted, Singapore promotes high density development. For example, the Central Business District (CBD) of Singapore has Floor Area Ratios (FARs) up to 13. Ongoing development near Marina Bay next to the CBD aims to produce high density, mixed use development with FARs up to 20.49 Marina Bay will be more than a com-mercial center. It will also o&er housing, shops, hotels, recreational facilities, and community zones such as green areas and open spaces.50
Singapore’s high density, built-up areas en-abled preservation of open spaces, natural
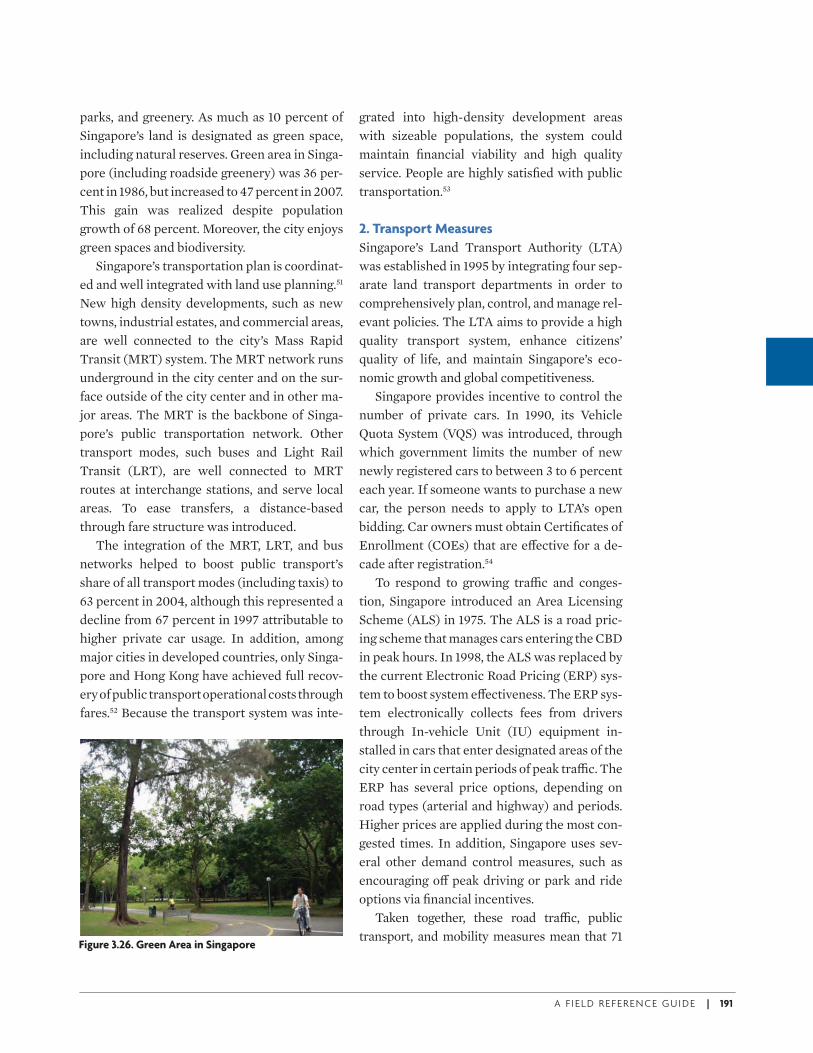
A F I E L D R E F E R E N C E G U I D E | 191
parks, and greenery. As much as 10 percent of Singapore’s land is designated as green space, including natural reserves. Green area in Singa-pore (including roadside greenery) was 36 per-cent in 1986, but increased to 47 percent in 2007. This gain was realized despite population growth of 68 percent. Moreover, the city enjoys green spaces and biodiversity.
Singapore’s transportation plan is coordinat-ed and well integrated with land use planning.51 New high density developments, such as new towns, industrial estates, and commercial areas, are well connected to the city’s Mass Rapid Transit (MRT) system. The MRT network runs underground in the city center and on the sur-face outside of the city center and in other ma-jor areas. The MRT is the backbone of Singa-pore’s public transportation network. Other transport modes, such buses and Light Rail Transit (LRT), are well connected to MRT routes at interchange stations, and serve local areas. To ease transfers, a distance-based through fare structure was introduced.
The integration of the MRT, LRT, and bus networks helped to boost public transport’s share of all transport modes (including taxis) to 63 percent in 2004, although this represented a decline from 67 percent in 1997 attributable to higher private car usage. In addition, among major cities in developed countries, only Singa-pore and Hong Kong have achieved full recov-ery of public transport operational costs through fares.52 Because the transport system was inte-
grated into high-density development areas with sizeable populations, the system could maintain fi nancial viability and high quality service. People are highly satisfi ed with public transportation.53
2. Transport Measures
Singapore’s Land Transport Authority (LTA) was established in 1995 by integrating four sep-arate land transport departments in order to comprehensively plan, control, and manage rel-evant policies. The LTA aims to provide a high quality transport system, enhance citizens’ quality of life, and maintain Singapore’s eco-nomic growth and global competitiveness.
Singapore provides incentive to control the number of private cars. In 1990, its Vehicle Quota System (VQS) was introduced, through which government limits the number of new newly registered cars to between 3 to 6 percent each year. If someone wants to purchase a new car, the person needs to apply to LTA’s open bidding. Car owners must obtain Certifi cates of Enrollment (COEs) that are e& ective for a de-cade after registration.54
To respond to growing tra* c and conges-tion, Singapore introduced an Area Licensing Scheme (ALS) in 1975. The ALS is a road pric-ing scheme that manages cars entering the CBD in peak hours. In 1998, the ALS was replaced by the current Electronic Road Pricing (ERP) sys-tem to boost system e& ectiveness. The ERP sys-tem electronically collects fees from drivers through In-vehicle Unit (IU) equipment in-stalled in cars that enter designated areas of the city center in certain periods of peak tra* c. The ERP has several price options, depending on road types (arterial and highway) and periods. Higher prices are applied during the most con-gested times. In addition, Singapore uses sev-eral other demand control measures, such as encouraging o& peak driving or park and ride options via fi nancial incentives.
Taken together, these road tra* c, public transport, and mobility measures mean that 71
Figure 3.26. Green Area in Singapore
ECo2-Part3aREV_PREP 191 6/15/09 8:43:06 AM
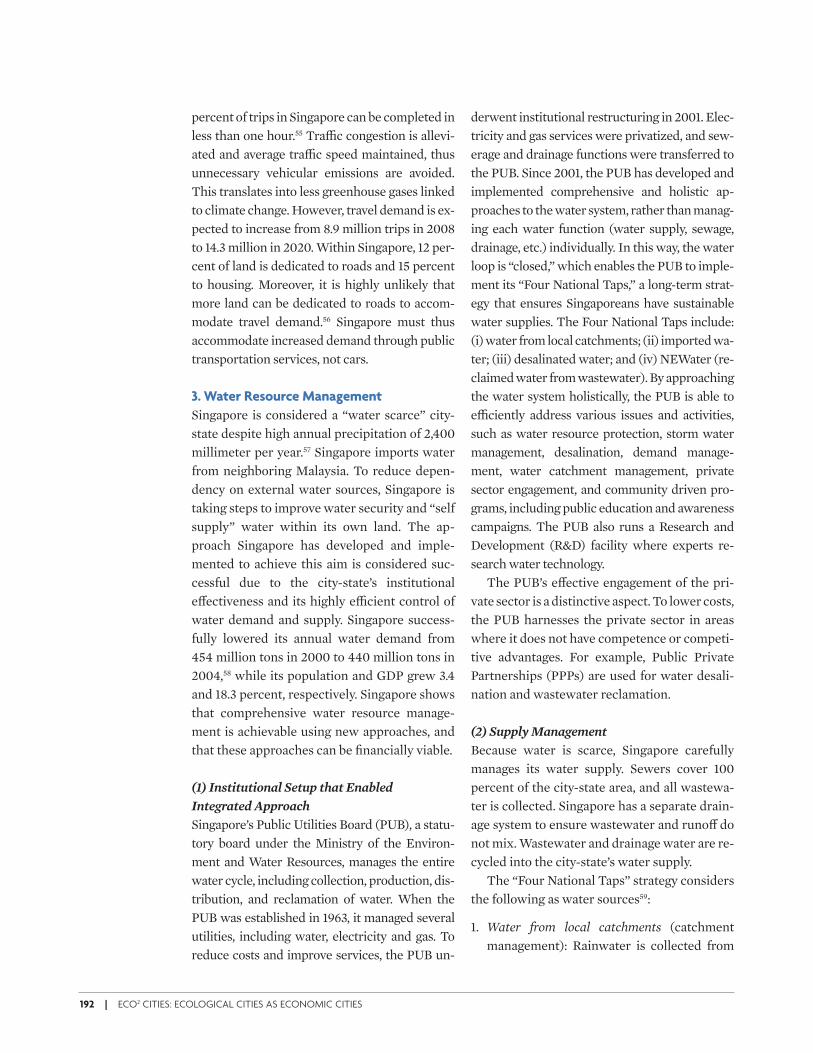
192 | ECO2 CITIES: ECOLOGICAL CITIES AS ECONOMIC CITIES
percent of trips in Singapore can be completed in less than one hour.55 Tra* c congestion is allevi-ated and average tra* c speed maintained, thus unnecessary vehicular emissions are avoided. This translates into less greenhouse gases linked to climate change. However, travel demand is ex-pected to increase from 8.9 million trips in 2008 to 14.3 million in 2020. Within Singapore, 12 per-cent of land is dedicated to roads and 15 percent to housing. Moreover, it is highly unlikely that more land can be dedicated to roads to accom-modate travel demand.56 Singapore must thus accommodate increased demand through public transportation services, not cars.
3. Water Resource Management
Singapore is considered a “water scarce” city-state despite high annual precipitation of 2,400 millimeter per year.57 Singapore imports water from neighboring Malaysia. To reduce depen-dency on external water sources, Singapore is taking steps to improve water security and “self supply” water within its own land. The ap-proach Singapore has developed and imple-mented to achieve this aim is considered suc-cessful due to the city-state’s institutional e& ectiveness and its highly e* cient control of water demand and supply. Singapore success-fully lowered its annual water demand from 454 million tons in 2000 to 440 million tons in 2004,58 while its population and GDP grew 3.4 and 18.3 percent, respectively. Singapore shows that comprehensive water resource manage-ment is achievable using new approaches, and that these approaches can be fi nancially viable.
(1) Institutional Setup that Enabled
Integrated Approach
Singapore’s Public Utilities Board (PUB), a statu-tory board under the Ministry of the Environ-ment and Water Resources, manages the entire water cycle, including collection, production, dis-tribution, and reclamation of water. When the PUB was established in 1963, it managed several utilities, including water, electricity and gas. To reduce costs and improve services, the PUB un-
derwent institutional restructuring in 2001. Elec-tricity and gas services were privatized, and sew-erage and drainage functions were transferred to the PUB. Since 2001, the PUB has developed and implemented comprehensive and holistic ap-proaches to the water system, rather than manag-ing each water function (water supply, sewage, drainage, etc.) individually. In this way, the water loop is “closed,” which enables the PUB to imple-ment its “Four National Taps,” a long-term strat-egy that ensures Singaporeans have sustainable water supplies. The Four National Taps include: (i) water from local catchments; (ii) imported wa-ter; (iii) desalinated water; and (iv) NEWater (re-claimed water from wastewater). By approaching the water system holistically, the PUB is able to e* ciently address various issues and activities, such as water resource protection, storm water management, desalination, demand manage-ment, water catchment management, private sector engagement, and community driven pro-grams, including public education and awareness campaigns. The PUB also runs a Research and Development (R&D) facility where experts re-search water technology.
The PUB’s e& ective engagement of the pri-vate sector is a distinctive aspect. To lower costs, the PUB harnesses the private sector in areas where it does not have competence or competi-tive advantages. For example, Public Private Partnerships (PPPs) are used for water desali-nation and wastewater reclamation.
(2) Supply Management
Because water is scarce, Singapore carefully manages its water supply. Sewers cover 100 percent of the city-state area, and all wastewa-ter is collected. Singapore has a separate drain-age system to ensure wastewater and runo& do not mix. Wastewater and drainage water are re-cycled into the city-state’s water supply.
The “Four National Taps” strategy considers the following as water sources59:
1. Water from local catchments (catchment management): Rainwater is collected from
ECo2-Part3aREV_PREP 192 6/15/09 8:43:06 AM
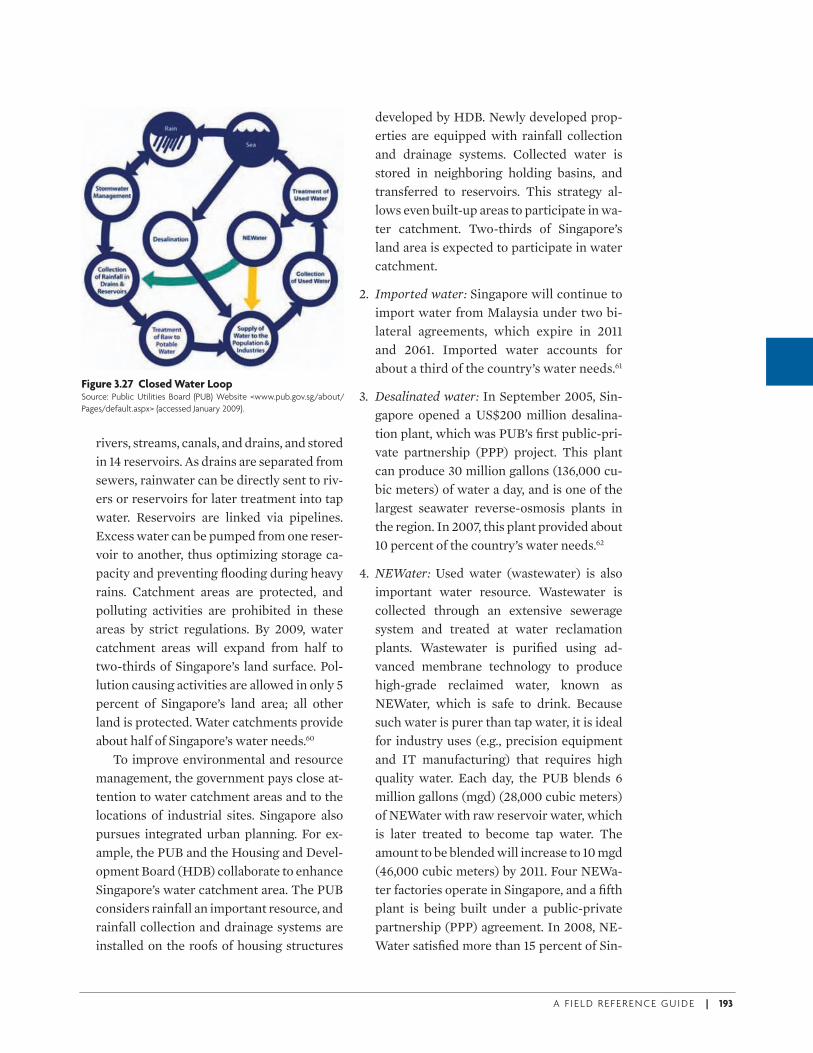
A F I E L D R E F E R E N C E G U I D E | 193
rivers, streams, canals, and drains, and stored in 14 reservoirs. As drains are separated from sewers, rainwater can be directly sent to riv-ers or reservoirs for later treatment into tap water. Reservoirs are linked via pipelines. Excess water can be pumped from one reser-voir to another, thus optimizing storage ca-pacity and preventing fl ooding during heavy rains. Catchment areas are protected, and polluting activities are prohibited in these areas by strict regulations. By 2009, water catchment areas will expand from half to two-thirds of Singapore’s land surface. Pol-lution causing activities are allowed in only 5 percent of Singapore’s land area; all other land is protected. Water catchments provide about half of Singapore’s water needs.60
To improve environmental and resource management, the government pays close at-tention to water catchment areas and to the locations of industrial sites. Singapore also pursues integrated urban planning. For ex-ample, the PUB and the Housing and Devel-opment Board (HDB) collaborate to enhance Singapore’s water catchment area. The PUB considers rainfall an important resource, and rainfall collection and drainage systems are installed on the roofs of housing structures
developed by HDB. Newly developed prop-erties are equipped with rainfall collection and drainage systems. Collected water is stored in neighboring holding basins, and transferred to reservoirs. This strategy al-lows even built-up areas to participate in wa-ter catchment. Two-thirds of Singapore’s land area is expected to participate in water catchment.
2. Imported water: Singapore will continue to import water from Malaysia under two bi-lateral agreements, which expire in 2011 and 2061. Imported water accounts for about a third of the country’s water needs.61
3. Desalinated water: In September 2005, Sin-gapore opened a US$200 million desalina-tion plant, which was PUB’s fi rst public-pri-vate partnership (PPP) project. This plant can produce 30 million gallons (136,000 cu-bic meters) of water a day, and is one of the largest seawater reverse-osmosis plants in the region. In 2007, this plant provided about 10 percent of the country’s water needs.62
4. NEWater: Used water (wastewater) is also important water resource. Wastewater is collected through an extensive sewerage system and treated at water reclamation plants. Wastewater is purifi ed using ad-vanced membrane technology to produce high-grade reclaimed water, known as NEWater, which is safe to drink. Because such water is purer than tap water, it is ideal for industry uses (e.g., precision equipment and IT manufacturing) that requires high quality water. Each day, the PUB blends 6 million gallons (mgd) (28,000 cubic meters) of NEWater with raw reservoir water, which is later treated to become tap water. The amount to be blended will increase to 10 mgd (46,000 cubic meters) by 2011. Four NEWa-ter factories operate in Singapore, and a fi fth plant is being built under a public-private partnership (PPP) agreement. In 2008, NE-Water satisfi ed more than 15 percent of Sin-
Figure 3.27 Closed Water LoopSource: Public Utilities Board (PUB) Website <www.pub.gov.sg/about/
Pages/default.aspx> (accessed January 2009).
ECo2-Part3aREV_PREP 193 6/15/09 8:43:06 AM
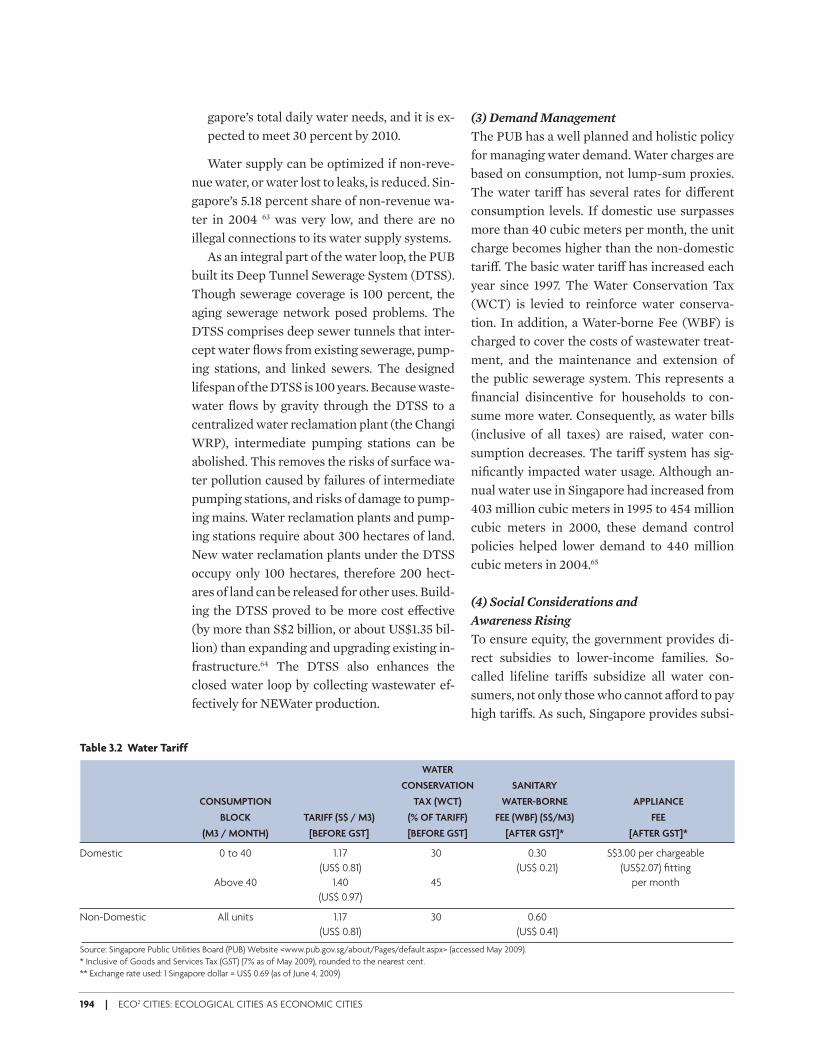
194 | ECO2 CITIES: ECOLOGICAL CITIES AS ECONOMIC CITIES
gapore’s total daily water needs, and it is ex-pected to meet 30 percent by 2010.
Water supply can be optimized if non-reve-nue water, or water lost to leaks, is reduced. Sin-gapore’s 5.18 percent share of non-revenue wa-ter in 2004 63 was very low, and there are no illegal connections to its water supply systems.
As an integral part of the water loop, the PUB built its Deep Tunnel Sewerage System (DTSS). Though sewerage coverage is 100 percent, the aging sewerage network posed problems. The DTSS comprises deep sewer tunnels that inter-cept water fl ows from existing sewerage, pump-ing stations, and linked sewers. The designed lifespan of the DTSS is 100 years. Because waste-water fl ows by gravity through the DTSS to a centralized water reclamation plant (the Changi WRP), intermediate pumping stations can be abolished. This removes the risks of surface wa-ter pollution caused by failures of intermediate pumping stations, and risks of damage to pump-ing mains. Water reclamation plants and pump-ing stations require about 300 hectares of land. New water reclamation plants under the DTSS occupy only 100 hectares, therefore 200 hect-ares of land can be released for other uses. Build-ing the DTSS proved to be more cost e& ective (by more than S$2 billion, or about US$1.35 bil-lion) than expanding and upgrading existing in-frastructure.64 The DTSS also enhances the closed water loop by collecting wastewater ef-fectively for NEWater production.
(3) Demand Management
The PUB has a well planned and holistic policy for managing water demand. Water charges are based on consumption, not lump-sum proxies. The water tari& has several rates for di& erent consumption levels. If domestic use surpasses more than 40 cubic meters per month, the unit charge becomes higher than the non-domestic tari& . The basic water tari& has increased each year since 1997. The Water Conservation Tax (WCT) is levied to reinforce water conserva-tion. In addition, a Water-borne Fee (WBF) is charged to cover the costs of wastewater treat-ment, and the maintenance and extension of the public sewerage system. This represents a fi nancial disincentive for households to con-sume more water. Consequently, as water bills (inclusive of all taxes) are raised, water con-sumption decreases. The tari& system has sig-nifi cantly impacted water usage. Although an-nual water use in Singapore had increased from 403 million cubic meters in 1995 to 454 million cubic meters in 2000, these demand control policies helped lower demand to 440 million cubic meters in 2004.65
(4) Social Considerations and
Awareness Rising
To ensure equity, the government provides di-rect subsidies to lower-income families. So-called lifeline tari& s subsidize all water con-sumers, not only those who cannot a& ord to pay high tari& s. As such, Singapore provides subsi-
Table 3.2 Water Tariff
WATER
CONSERVATION SANITARY
CONSUMPTION TAX (WCT) WATER-BORNE APPLIANCE
BLOCK TARIFF (S$ / M3) (% OF TARIFF) FEE (WBF) (S$/M3) FEE
(M3 / MONTH) [BEFORE GST] [BEFORE GST] [AFTER GST]* [AFTER GST]*
Domestic 0 to 40 1.17 30 0.30 S$3.00 per chargeable
(US$ 0.81) (US$ 0.21) (US$2.07) fi tting
Above 40 1.40 45 per month
(US$ 0.97)
Non-Domestic All units 1.17 30 0.60
(US$ 0.81) (US$ 0.41)
Source: Singapore Public Utilities Board (PUB) Website <www.pub.gov.sg/about/Pages/default.aspx> (accessed May 2009).
* Inclusive of Goods and Services Tax (GST) (7% as of May 2009), rounded to the nearest cent.
** Exchange rate used: 1 Singapore dollar = US$ 0.69 (as of June 4, 2009)
ECo2-Part3aREV_PREP 194 6/15/09 8:43:07 AM
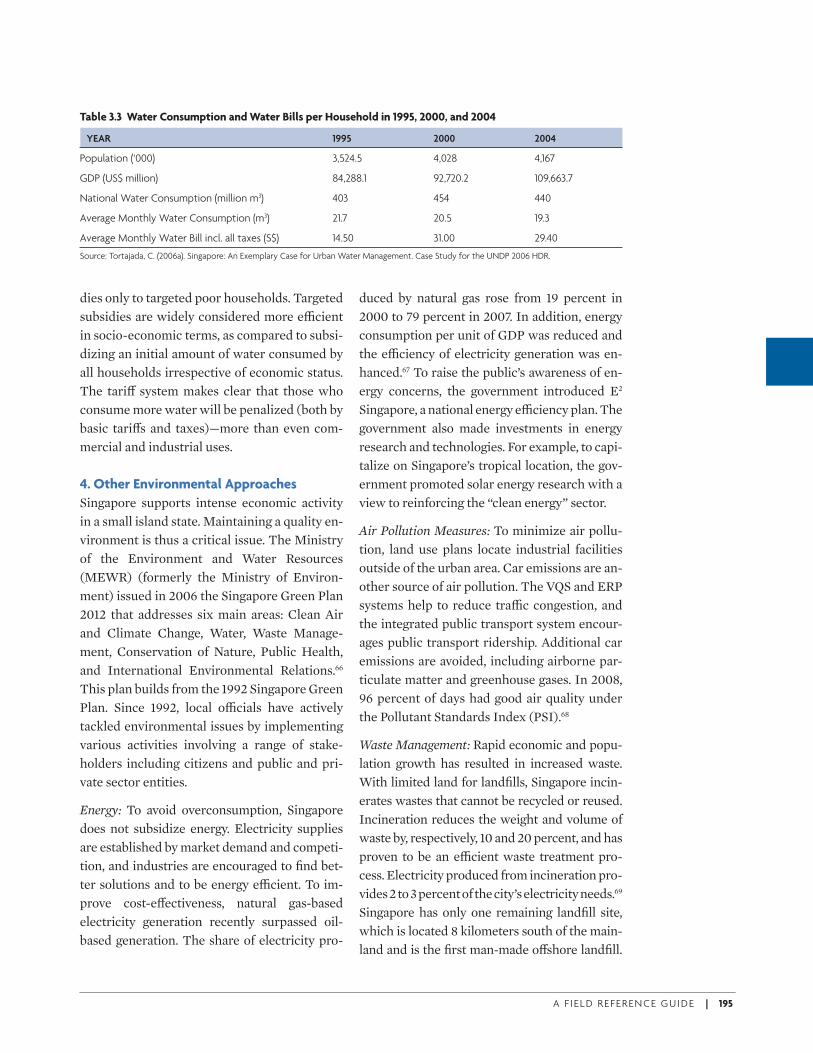
A F I E L D R E F E R E N C E G U I D E | 195
dies only to targeted poor households. Targeted subsidies are widely considered more e* cient in socio-economic terms, as compared to subsi-dizing an initial amount of water consumed by all households irrespective of economic status. The tari& system makes clear that those who consume more water will be penalized (both by basic tari& s and taxes)—more than even com-mercial and industrial uses.
4. Other Environmental Approaches
Singapore supports intense economic activity in a small island state. Maintaining a quality en-vironment is thus a critical issue. The Ministry of the Environment and Water Resources (MEWR) (formerly the Ministry of Environ-ment) issued in 2006 the Singapore Green Plan 2012 that addresses six main areas: Clean Air and Climate Change, Water, Waste Manage-ment, Conservation of Nature, Public Health, and International Environmental Relations.66 This plan builds from the 1992 Singapore Green Plan. Since 1992, local o* cials have actively tackled environmental issues by implementing various activities involving a range of stake-holders including citizens and public and pri-vate sector entities.
Energy: To avoid overconsumption, Singapore does not subsidize energy. Electricity supplies are established by market demand and competi-tion, and industries are encouraged to fi nd bet-ter solutions and to be energy e* cient. To im-prove cost-e& ectiveness, natural gas-based electricity generation recently surpassed oil-based generation. The share of electricity pro-
duced by natural gas rose from 19 percent in 2000 to 79 percent in 2007. In addition, energy consumption per unit of GDP was reduced and the e* ciency of electricity generation was en-hanced.67 To raise the public’s awareness of en-ergy concerns, the government introduced E2 Singapore, a national energy e* ciency plan. The government also made investments in energy research and technologies. For example, to capi-talize on Singapore’s tropical location, the gov-ernment promoted solar energy research with a view to reinforcing the “clean energy” sector.
Air Pollution Measures: To minimize air pollu-tion, land use plans locate industrial facilities outside of the urban area. Car emissions are an-other source of air pollution. The VQS and ERP systems help to reduce tra* c congestion, and the integrated public transport system encour-ages public transport ridership. Additional car emissions are avoided, including airborne par-ticulate matter and greenhouse gases. In 2008, 96 percent of days had good air quality under the Pollutant Standards Index (PSI).68
Waste Management: Rapid economic and popu-lation growth has resulted in increased waste. With limited land for landfi lls, Singapore incin-erates wastes that cannot be recycled or reused. Incineration reduces the weight and volume of waste by, respectively, 10 and 20 percent, and has proven to be an e* cient waste treatment pro-cess. Electricity produced from incineration pro-vides 2 to 3 percent of the city’s electricity needs.69 Singapore has only one remaining landfi ll site, which is located 8 kilometers south of the main-land and is the fi rst man-made o& shore landfi ll.
Table 3.3 Water Consumption and Water Bills per Household in 1995, 2000, and 2004
YEAR 1995 2000 2004
Population (‘000) 3,524.5 4,028 4,167
GDP (US$ million) 84,288.1 92,720.2 109,663.7
National Water Consumption (million m3) 403 454 440
Average Monthly Water Consumption (m3) 21.7 20.5 19.3
Average Monthly Water Bill incl. all taxes (S$) 14.50 31.00 29.40
Source: Tortajada, C. (2006a). Singapore: An Exemplary Case for Urban Water Management. Case Study for the UNDP 2006 HDR.
ECo2-Part3aREV_PREP 195 6/15/09 8:43:07 AM
196 | ECO2 CITIES: ECOLOGICAL CITIES AS ECONOMIC CITIES
There is no more land available for landfi lls and disposal of residue from incineration. It is ex-pected that the life of this o& shore landfi ll will surpass its 2040 closure due to citizens’ recycling e& orts. However, the city is facing waste man-agement challenges, especially as daily waste in-creased 6 times to 7,600 tons between 1970 and 2000 owing to economic growth, population in-creases, and improved living standards.70 To pro-mote recycling and waste reduction, Singapore’s National Recycling Program encourages various activities, and per capita domestic waste has fall-en despite economic growth. In 2008, the recy-cling rate reached 56 percent. Additionally, gov-ernment-industry collaboration has promoted reduced waste from packaging.71
River Clean-up: Singapore has successfully cleaned and restored the environmental con-ditions of once deteriorated rivers. In 1977, Singapore and its Prime Minister supported a major project to clean the Singapore River and Kallang Basin, which covers about one fi fth of the city-state’s land area. Uncontrolled waste and wastewater from farms, un-sewered hous-es, and squatters were directly discharging into the rivers. In response, houses and other polluting activities were relocated and e& orts were made to improve the physical conditions of the rivers. The riverbeds were dredged, wa-terfront facilities were upgraded, and greenery was added to riverbanks. Government agen-cies, grassroots communities, and NGOs con-tributed to the clean-up. The rivers were revi-talized in 10 years at a cost of S$200 million.72 Today, the river waterfronts, including canals and reservoirs, are well preserved and main-tained. These river zones act as water catch-ments and fl ood prevention areas, while pro-viding community recreational space.73
Singapore’s waterways, including its rivers and reservoirs, are designed to be people-friend-ly. These designs complement Singapore’s vision as a city of gardens and water. Waterways and embankments often are recreational sites; more-over, people are reluctant to contaminate a re-
source they eventually drink. The PUB provides educational opportunities through a visitor cen-tre and learning courses. The PUB also encour-ages water conservation by providing tips and devices for saving water in households.
Greening: Singapore’s “Garden City” campaign has been promoted since the 1970s to green the country by planting trees along roads as well as in vacant plots, reclaimed land, and new devel-opments. Flowers are added too. Since Singa-pore’s independence in 1959, more than a million trees have been planted, and a high standard of landscaping has been achieved in the country. 74
5. Housing
The government aims to supply a& ordable housing to its citizens. The Housing and Devel-opment Board (HDB) under the Ministry of National Development plans and develops pub-lic housing and facilities in new towns. As land is limited, high density development and high-rise buildings are promoted for commercial, business, and residential uses. Urban renova-tion and development of new and satellite towns are encouraged; 20 such towns have been con-structed. New towns are connected to public transportation and Singapore’s city center. In 2003, 84 percent of Singaporeans resided in publically built housing, and 92.8 percent had their own housing.75 Since 1989, the HDB has implemented an Ethnic Integration Policy (EIP) to ensure a balanced mix of ethnic groups in public housing. Singapore has myriad ethnic groups, including Chinese, Malays, Indians, and others. The EIP prevents establishment of ra-cial enclaves, and promotes diverse communi-ties and social integration.76
Lesson Learnt from Singapore
Singapore faces challenges related to the scar-city of land and natural resources amid strong economic and population growth. Singapore shows that innovative and comprehensive
ECo2-Part3aREV_PREP 196 6/15/09 8:43:07 AM

A F I E L D R E F E R E N C E G U I D E | 197
management of land and other resources is achievable. Singapore capitalized on its under-standing of local conditions to develop a high density city that preserves green and open spaces. Public transport works e* ciently, and is fi nancially viable and integrated with land
uses. Due to Singapore’s comprehensive and integrated management of resources, the city is successfully addressing ecological, econom-ic and social concerns while ensuring sustain-ability and productivity.
ECo2-Part3aREV_PREP 197 6/15/09 8:43:07 AM

ECo2-Part3aREV_PREP 198 6/15/09 8:43:07 AM
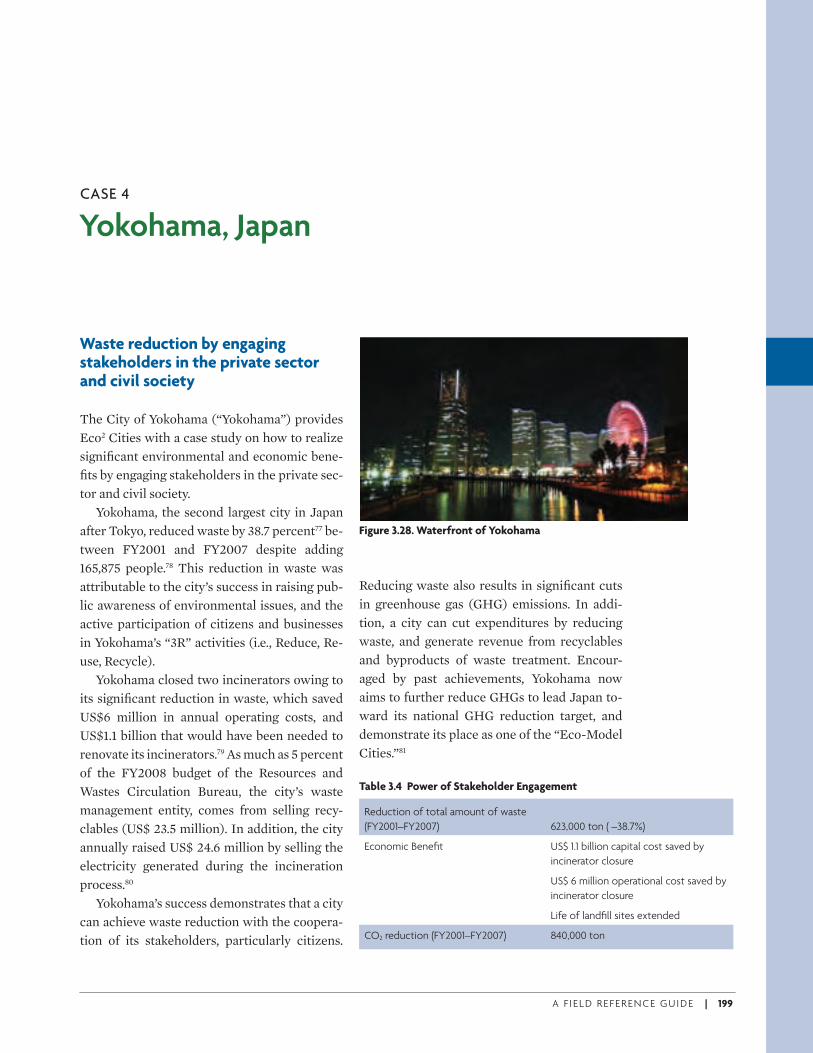
A F I E L D R E F E R E N C E G U I D E | 199
Waste reduction by engaging stakeholders in the private sector and civil society
The City of Yokohama (“Yokohama”) provides Eco2 Cities with a case study on how to realize signifi cant environmental and economic bene-fi ts by engaging stakeholders in the private sec-tor and civil society.
Yokohama, the second largest city in Japan after Tokyo, reduced waste by 38.7 percent77 be-tween FY2001 and FY2007 despite adding 165,875 people.78 This reduction in waste was attributable to the city’s success in raising pub-lic awareness of environmental issues, and the active participation of citizens and businesses in Yokohama’s “3R” activities (i.e., Reduce, Re-use, Recycle).
Yokohama closed two incinerators owing to its signifi cant reduction in waste, which saved US$6 million in annual operating costs, and US$1.1 billion that would have been needed to renovate its incinerators.79 As much as 5 percent of the FY2008 budget of the Resources and Wastes Circulation Bureau, the city’s waste management entity, comes from selling recy-clables (US$ 23.5 million). In addition, the city annually raised US$ 24.6 million by selling the electricity generated during the incineration process.80
Yokohama’s success demonstrates that a city can achieve waste reduction with the coopera-tion of its stakeholders, particularly citizens.
Reducing waste also results in signifi cant cuts in greenhouse gas (GHG) emissions. In addi-tion, a city can cut expenditures by reducing waste, and generate revenue from recyclables and byproducts of waste treatment. Encour-aged by past achievements, Yokohama now aims to further reduce GHGs to lead Japan to-ward its national GHG reduction target, and demonstrate its place as one of the “Eco-Model Cities.”81
Yokohama, Japan CASE 4
Figure 3.28. Waterfront of Yokohama
Table 3.4 Power of Stakeholder Engagement
Reduction of total amount of waste
(FY2001–FY2007) 623,000 ton ( –38.7%)
Economic Benefi t US$ 1.1 billion capital cost saved by
incinerator closure
US$ 6 million operational cost saved by
incinerator closure
Life of landfi ll sites extended
CO2 reduction (FY2001–FY2007) 840,000 ton
ECo2-Part3aREV_PREP 199 6/15/09 8:43:07 AM
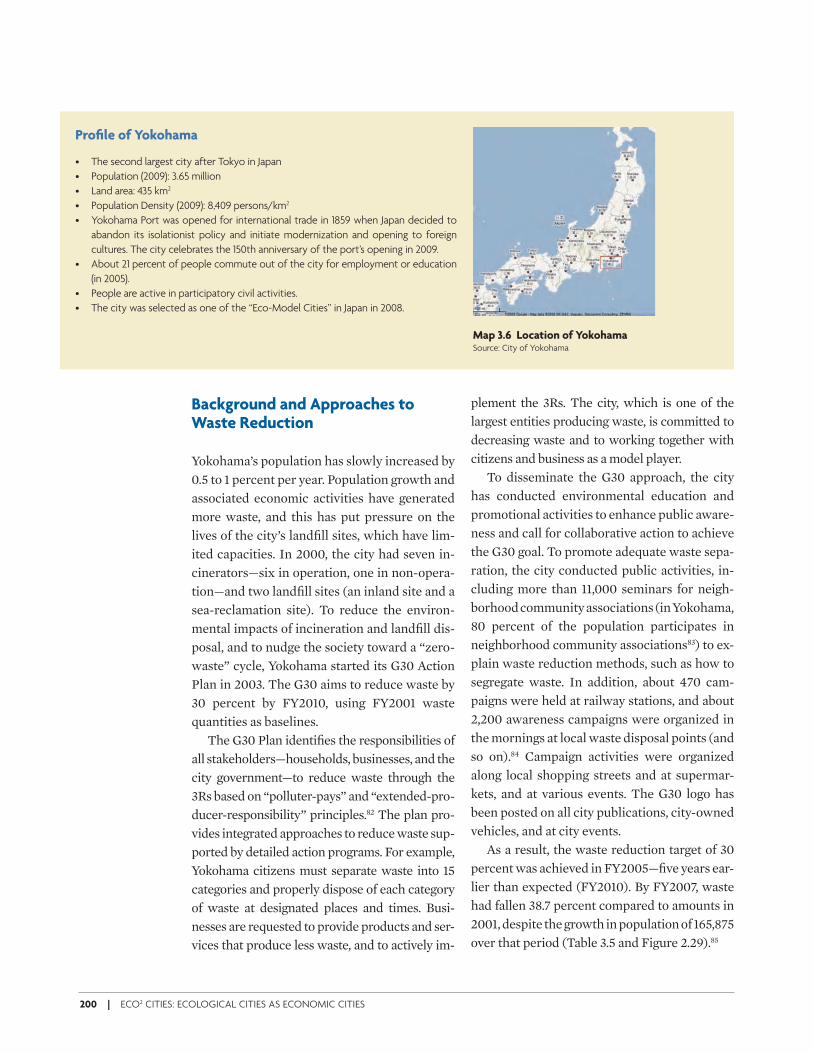
200 | ECO2 CITIES: ECOLOGICAL CITIES AS ECONOMIC CITIES
Background and Approaches to Waste Reduction
Yokohama’s population has slowly increased by 0.5 to 1 percent per year. Population growth and associated economic activities have generated more waste, and this has put pressure on the lives of the city’s landfi ll sites, which have lim-ited capacities. In 2000, the city had seven in-cinerators—six in operation, one in non-opera-tion—and two landfi ll sites (an inland site and a sea-reclamation site). To reduce the environ-mental impacts of incineration and landfi ll dis-posal, and to nudge the society toward a “zero-waste” cycle, Yokohama started its G30 Action Plan in 2003. The G30 aims to reduce waste by 30 percent by FY2010, using FY2001 waste quantities as baselines.
The G30 Plan identifi es the responsibilities of all stakeholders—households, businesses, and the city government—to reduce waste through the 3Rs based on “polluter-pays” and “extended-pro-ducer-responsibility” principles.82 The plan pro-vides integrated approaches to reduce waste sup-ported by detailed action programs. For example, Yokohama citizens must separate waste into 15 categories and properly dispose of each category of waste at designated places and times. Busi-nesses are requested to provide products and ser-vices that produce less waste, and to actively im-
plement the 3Rs. The city, which is one of the largest entities producing waste, is committed to decreasing waste and to working together with citizens and business as a model player.
To disseminate the G30 approach, the city has conducted environmental education and promotional activities to enhance public aware-ness and call for collaborative action to achieve the G30 goal. To promote adequate waste sepa-ration, the city conducted public activities, in-cluding more than 11,000 seminars for neigh-borhood community associations (in Yokohama, 80 percent of the population participates in neighborhood community associations83) to ex-plain waste reduction methods, such as how to segregate waste. In addition, about 470 cam-paigns were held at railway stations, and about 2,200 awareness campaigns were organized in the mornings at local waste disposal points (and so on).84 Campaign activities were organized along local shopping streets and at supermar-kets, and at various events. The G30 logo has been posted on all city publications, city-owned vehicles, and at city events.
As a result, the waste reduction target of 30 percent was achieved in FY2005—fi ve years ear-lier than expected (FY2010). By FY2007, waste had fallen 38.7 percent compared to amounts in 2001, despite the growth in population of 165,875 over that period (Table 3.5 and Figure 2.29).85
Profi le of Yokohama
• The second largest city after Tokyo in Japan
• Population (2009): 3.65 million
• Land area: 435 km2
• Population Density (2009): 8,409 persons/km2
• Yokohama Port was opened for international trade in 1859 when Japan decided to
abandon its isolationist policy and initiate modernization and opening to foreign
cultures. The city celebrates the 150th anniversary of the port’s opening in 2009.
• About 21 percent of people commute out of the city for employment or education
(in 2005).
• People are active in participatory civil activities.
• The city was selected as one of the “Eco-Model Cities” in Japan in 2008.
Map 3.6 Location of YokohamaSource: City of Yokohama
ECo2-Part3aREV_PREP 200 6/15/09 8:43:08 AM
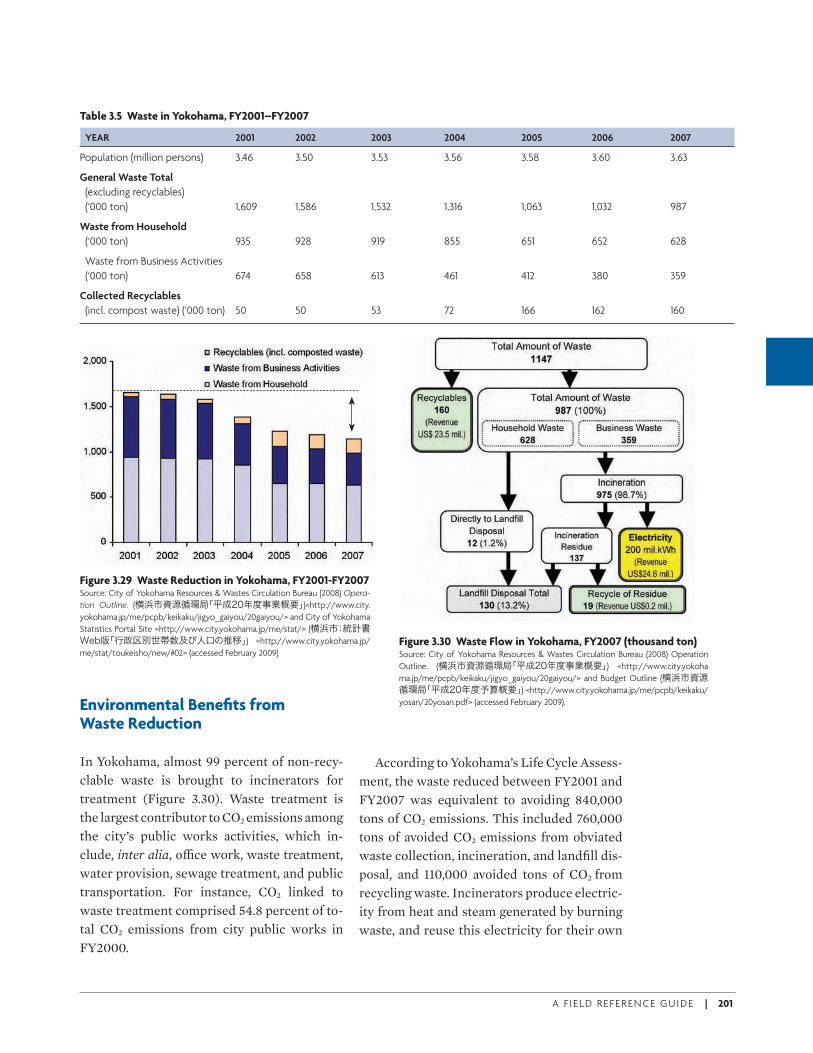
A F I E L D R E F E R E N C E G U I D E | 201
Environmental Benefi ts from Waste Reduction
In Yokohama, almost 99 percent of non-recy-clable waste is brought to incinerators for treatment (Figure 3.30). Waste treatment is the largest contributor to CO2 emissions among the city’s public works activities, which in-clude, inter alia, o* ce work, waste treatment, water provision, sewage treatment, and public transportation. For instance, CO2 linked to waste treatment comprised 54.8 percent of to-tal CO2 emissions from city public works in FY2000.
According to Yokohama’s Life Cycle Assess-ment, the waste reduced between FY2001 and FY2007 was equivalent to avoiding 840,000 tons of CO2 emissions. This included 760,000 tons of avoided CO2 emissions from obviated waste collection, incineration, and landfi ll dis-posal, and 110,000 avoided tons of CO2
from recycling waste. Incinerators produce electric-ity from heat and steam generated by burning waste, and reuse this electricity for their own
Table 3.5 Waste in Yokohama, FY2001–FY2007
YEAR 2001 2002 2003 2004 2005 2006 2007
Population (million persons) 3.46 3.50 3.53 3.56 3.58 3.60 3.63
General Waste Total
(excluding recyclables)
(‘000 ton) 1,609 1,586 1,532 1,316 1,063 1,032 987
Waste from Household
(‘000 ton) 935 928 919 855 651 652 628
Waste from Business Activities
(‘000 ton) 674 658 613 461 412 380 359
Collected Recyclables
(incl. compost waste) (‘000 ton) 50 50 53 72 166 162 160
Figure 3.29 Waste Reduction in Yokohama, FY2001-FY2007Source: City of Yokohama Resources & Wastes Circulation Bureau (2008) Opera-
tion Outline. (横浜市資源循環局「平成20年度事業概要」)<http://www.city.
yokohama.jp/me/pcpb/keikaku/jigyo_gaiyou/20gaiyou/> and City of Yokohama
Statistics Portal Site <http://www.city.yokohama.jp/me/stat/> (横浜市:統計書Web版「行政区別世帯数及び人口の推移」) <http://www.city.yokohama.jp/
me/stat/toukeisho/new/#02> (accessed February 2009)Figure 3.30 Waste Flow in Yokohama, FY2007 (thousand ton)Source: City of Yokohama Resources & Wastes Circulation Bureau (2008) Operation
Outline. (横浜市資源循環局「平成20年度事業概要」) <http://www.city.yokoha
ma.jp/me/pcpb/keikaku/jigyo_gaiyou/20gaiyou/> and Budget Outline (横浜市資源循環局「平成20年度予算概要」) <http://www.city.yokohama.jp/me/pcpb/keikaku/
yosan/20yosan.pdf> (accessed February 2009).
ECo2-Part3aREV_PREP 201 6/15/09 8:43:08 AM
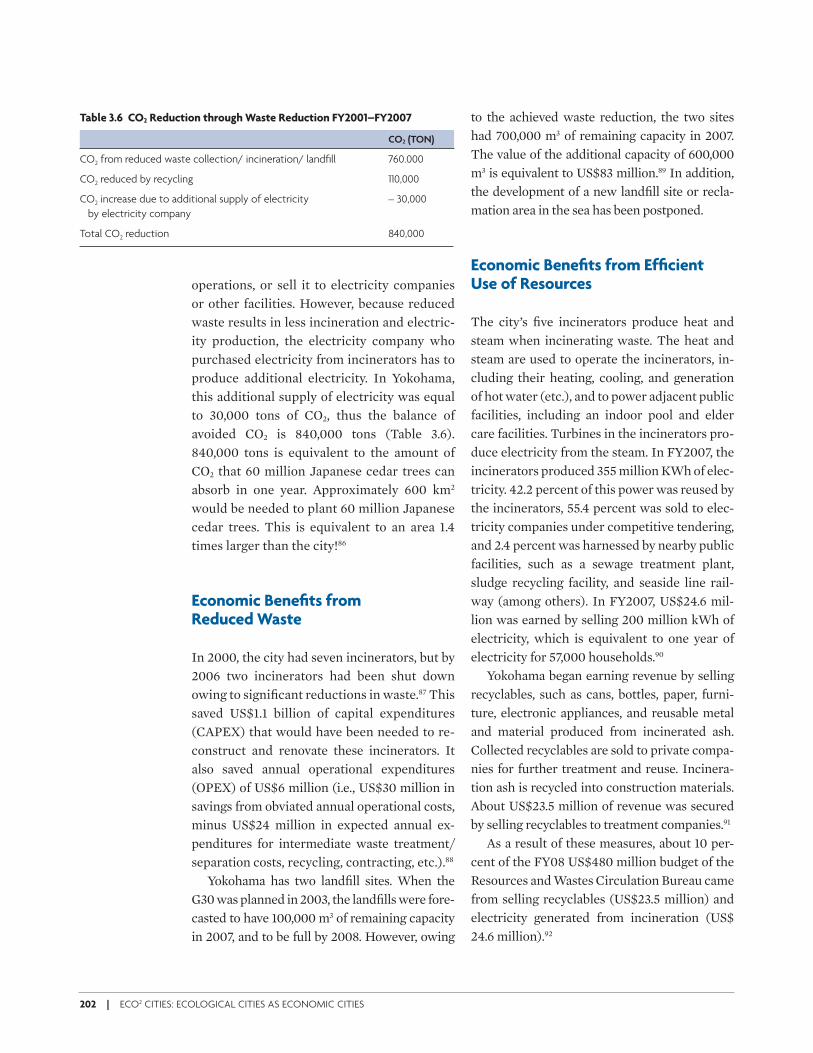
202 | ECO2 CITIES: ECOLOGICAL CITIES AS ECONOMIC CITIES
operations, or sell it to electricity companies or other facilities. However, because reduced waste results in less incineration and electric-ity production, the electricity company who purchased electricity from incinerators has to produce additional electricity. In Yokohama, this additional supply of electricity was equal to 30,000 tons of CO2, thus the balance of avoided CO2 is 840,000 tons (Table 3.6). 840,000 tons is equivalent to the amount of CO2 that 60 million Japanese cedar trees can absorb in one year. Approximately 600 km2 would be needed to plant 60 million Japanese cedar trees. This is equivalent to an area 1.4 times larger than the city!86
Economic Benefi ts from Reduced Waste
In 2000, the city had seven incinerators, but by 2006 two incinerators had been shut down owing to signifi cant reductions in waste.87 This saved US$1.1 billion of capital expenditures (CAPEX) that would have been needed to re-construct and renovate these incinerators. It also saved annual operational expenditures (OPEX) of US$6 million (i.e., US$30 million in savings from obviated annual operational costs, minus US$24 million in expected annual ex-penditures for intermediate waste treatment/separation costs, recycling, contracting, etc.).88
Yokohama has two landfi ll sites. When the G30 was planned in 2003, the landfi lls were fore-casted to have 100,000 m3 of remaining capacity in 2007, and to be full by 2008. However, owing
to the achieved waste reduction, the two sites had 700,000 m3 of remaining capacity in 2007. The value of the additional capacity of 600,000 m3 is equivalent to US$83 million.89 In addition, the development of a new landfi ll site or recla-mation area in the sea has been postponed.
Economic Benefi ts from Effi cient Use of Resources
The city’s fi ve incinerators produce heat and steam when incinerating waste. The heat and steam are used to operate the incinerators, in-cluding their heating, cooling, and generation of hot water (etc.), and to power adjacent public facilities, including an indoor pool and elder care facilities. Turbines in the incinerators pro-duce electricity from the steam. In FY2007, the incinerators produced 355 million KWh of elec-tricity. 42.2 percent of this power was reused by the incinerators, 55.4 percent was sold to elec-tricity companies under competitive tendering, and 2.4 percent was harnessed by nearby public facilities, such as a sewage treatment plant, sludge recycling facility, and seaside line rail-way (among others). In FY2007, US$24.6 mil-lion was earned by selling 200 million kWh of electricity, which is equivalent to one year of electricity for 57,000 households.90
Yokohama began earning revenue by selling recyclables, such as cans, bottles, paper, furni-ture, electronic appliances, and reusable metal and material produced from incinerated ash. Collected recyclables are sold to private compa-nies for further treatment and reuse. Incinera-tion ash is recycled into construction materials. About US$23.5 million of revenue was secured by selling recyclables to treatment companies.91
As a result of these measures, about 10 per-cent of the FY08 US$480 million budget of the Resources and Wastes Circulation Bureau came from selling recyclables (US$23.5 million) and electricity generated from incineration (US$ 24.6 million).92
Table 3.6 CO2 Reduction through Waste Reduction FY2001–FY2007
CO2 (TON)
CO2 from reduced waste collection/ incineration/ landfi ll 760.000
CO2 reduced by recycling 110,000
CO2 increase due to additional supply of electricity – 30,000
by electricity company
Total CO2 reduction 840,000
ECo2-Part3aREV_PREP 202 6/15/09 8:43:09 AM
A F I E L D R E F E R E N C E G U I D E | 203
To promote e* cient waste management, the city also began contracting key activities, such as waste collection and transportation, to the private sector, which often provides higher quality services at lower costs. Between 2003 and 2005, the city saved operational costs of US$26.4 million by contracting services to the private sector.93
Lesson Learned from the Yokohama Case
The Yokohama case shows that cooperation from stakeholders, particularly citizens, is im-portant to achieving city targets. Of course, sub-stantial and consistent e& orts are needed at grassroots levels to raise the awareness of citi-zens and businesses and attempt to change be-haviors. However, the measures in Yokohama did not require new technology or huge invest-ments. Moreover, cities can count on “citizen power” to make further headway, once people understand relevant issues, change their behav-ior, and become active players in implementing plans.
Encouraged by the G30 achievements, Yokohama now aims to further reduce GHGs to lead Japan and demonstrate its qualities as one of Japan’s Eco-Model Cities. In Yokoha-ma’s 2008 Climate Change Action Policy “CO-DO 30”, the city aims to reduce GHG emissions by more than 30 percent by FY2025, and by more than 60 percent by FY2050 (compared to FY2004 levels).94 Action plans are being es-tablished based on seven approaches to realize the plan’s targets.95 In addition, Yokohama aims to increase its use of renewable energy ten times compared to FY2004 baselines. Citi-zens are actively participating in these activi-ties, including by purchasing city-issued bonds to fund the construction of a new wind-power generator. Finally, in light of Yokohama’s re-duced waste and the need to soon undertake costly renovations of an aged incinerator, the city is planning to close one more incinerator by FY2010, and henceforth use only four in-cinerators. Further reductions in CO2 emis-sions and operational savings are expected.
ECo2-Part3aREV_PREP 203 6/15/09 8:43:10 AM

ECo2-Part3aREV_PREP 204 6/15/09 8:43:10 AM
A F I E L D R E F E R E N C E G U I D E | 205
Actions on climate change in a fast growing city in a subtropical region
Brisbane, the capital of the state of Queensland in Australia, was one of the fastest growing cap-ital cities in Australia with 2 percent population growth in 2006 and 2007.96 The population of Brisbane in 2007 was approximately 1.01 mil-lion, making it the fi rst local government area in Australia to exceed the milestone of one million people.97 Brisbane is among the top 10 fastest growing cities from OECD countries, and the second fastest growing city in the western world.98 Brisbane’s population is expected to grow further over the next two decades.99
Since 2000, Brisbane has experienced in-creased electricity consumption and annual growth in peak electricity loads.100 As the city is in a subtropical climate, increased domestic air-conditioning has been a major factor prompting higher demand for electricity, along with poor housing design, an energy-intensive economy, and growth in population and disposable income.101 Demand for elec-tricity is expected to rise consistently through 2030. Brisbane is also experiencing a shortage of potable water during a period when growth and climate change risks straining water re-sources, thus emphasizing the need to shift to a new form of water management.
In 2007, the Brisbane City Council issued Brisbane’s Plan for Action on Climate Change
and Energy, which delineates 22 complementa-
ry actions to be achieved in the short-term (about 18 months) and the long-term (more than 5 years). Brisbane has three major chal-lenges: climate change, high peak oil demand, and greenhouse gas emissions.102 Analyses sug-gest that if Brisbane responds intelligently to these challenges, the city can generate signifi -cant economic benefi ts by developing sustain-able industries, while saving resources. Bris-bane is actively introducing various approaches to sustainable development. In addition, in the city’s Our Shared Vision—Living in Brisbane
2026 policy document, authorities have com-mitted to cutting greenhouse gas emissions in half, reusing all wastewater, and restoring 40 percent of natural habitat by 2026.
Approaches and Ecological and Economic Benefi ts of the CitySmart Program
To implement actions in Brisbane’s Plan for Ac-tion on Climate Change and Energy, o* cials initi-ated the CitySmart Program. This program intro-duces residents and businesses to practical and a& ordable ways to implement actions indicated in the climate change action plan. These practical tips help residents and businesses to become en-ergy and resource e* cient, thus improving the environment and saving money (Box 3.2).
Residents, for instance, are provided tips re-lated to, inter alia, hot water use, heating and
Brisbane, AustraliaCASE 5
ECo2-Part3aREV_PREP 205 6/15/09 8:43:10 AM
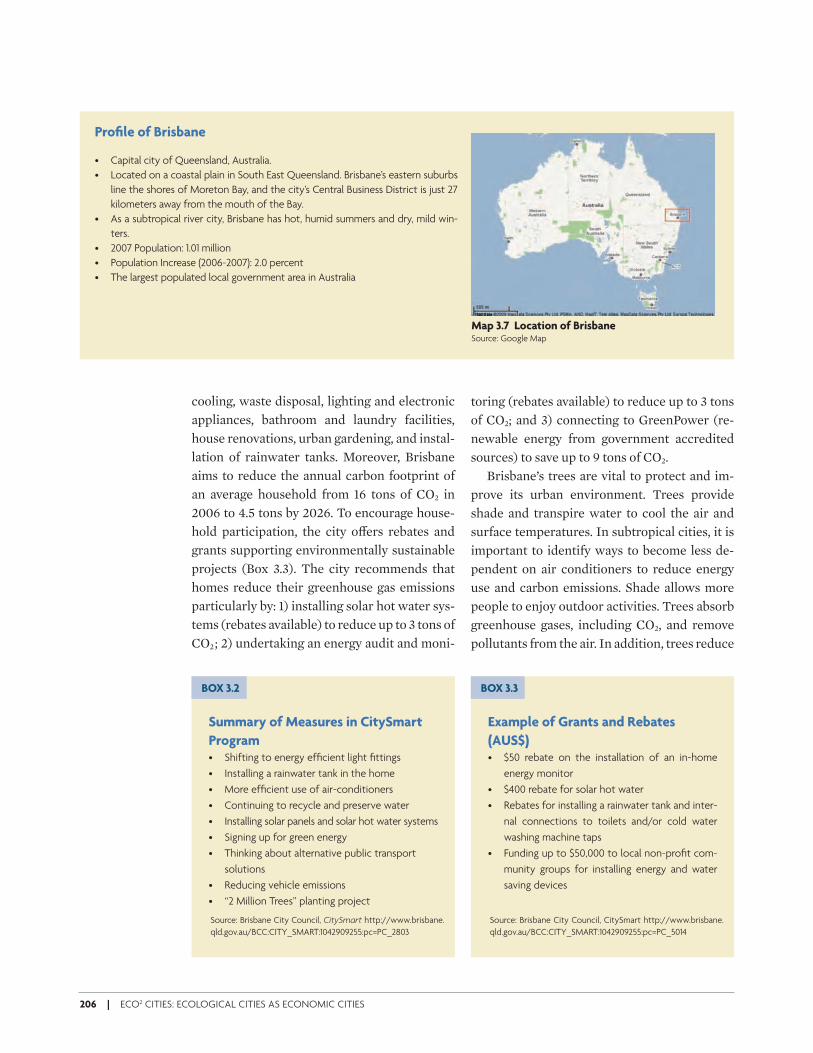
206 | ECO2 CITIES: ECOLOGICAL CITIES AS ECONOMIC CITIES
cooling, waste disposal, lighting and electronic appliances, bathroom and laundry facilities, house renovations, urban gardening, and instal-lation of rainwater tanks. Moreover, Brisbane aims to reduce the annual carbon footprint of an average household from 16 tons of CO2 in 2006 to 4.5 tons by 2026. To encourage house-hold participation, the city o& ers rebates and grants supporting environmentally sustainable projects (Box 3.3). The city recommends that homes reduce their greenhouse gas emissions particularly by: 1) installing solar hot water sys-tems (rebates available) to reduce up to 3 tons of CO2; 2) undertaking an energy audit and moni-
toring (rebates available) to reduce up to 3 tons of CO2; and 3) connecting to GreenPower (re-newable energy from government accredited sources) to save up to 9 tons of CO2.
Brisbane’s trees are vital to protect and im-prove its urban environment. Trees provide shade and transpire water to cool the air and surface temperatures. In subtropical cities, it is important to identify ways to become less de-pendent on air conditioners to reduce energy use and carbon emissions. Shade allows more people to enjoy outdoor activities. Trees absorb greenhouse gases, including CO2, and remove pollutants from the air. In addition, trees reduce
Profi le of Brisbane
• Capital city of Queensland, Australia.
• Located on a coastal plain in South East Queensland. Brisbane’s eastern suburbs
line the shores of Moreton Bay, and the city’s Central Business District is just 27
kilometers away from the mouth of the Bay.
• As a subtropical river city, Brisbane has hot, humid summers and dry, mild win-
ters.
• 2007 Population: 1.01 million
• Population Increase (2006-2007): 2.0 percent
• The largest populated local government area in Australia
Map 3.7 Location of BrisbaneSource: Google Map
Summary of Measures in CitySmart
Program• Shifting to energy effi cient light fi ttings
• Installing a rainwater tank in the home
• More effi cient use of air-conditioners
• Continuing to recycle and preserve water
• Installing solar panels and solar hot water systems
• Signing up for green energy
• Thinking about alternative public transport
solutions
• Reducing vehicle emissions
• “2 Million Trees” planting project
Example of Grants and Rebates
(AUS$)• $50 rebate on the installation of an in-home
energy monitor
• $400 rebate for solar hot water
• Rebates for installing a rainwater tank and inter-
nal connections to toilets and/or cold water
washing machine taps
• Funding up to $50,000 to local non-profi t com-
munity groups for installing energy and water
saving devices
BOX 3.2 BOX 3.3
Source: Brisbane City Council, CitySmart http://www.brisbane.
qld.gov.au/BCC:CITY_SMART:1042909255:pc=PC_2803
Source: Brisbane City Council, CitySmart http://www.brisbane.
qld.gov.au/BCC:CITY_SMART:1042909255:pc=PC_5014
ECo2-Part3aREV_PREP 206 6/15/09 8:43:10 AM
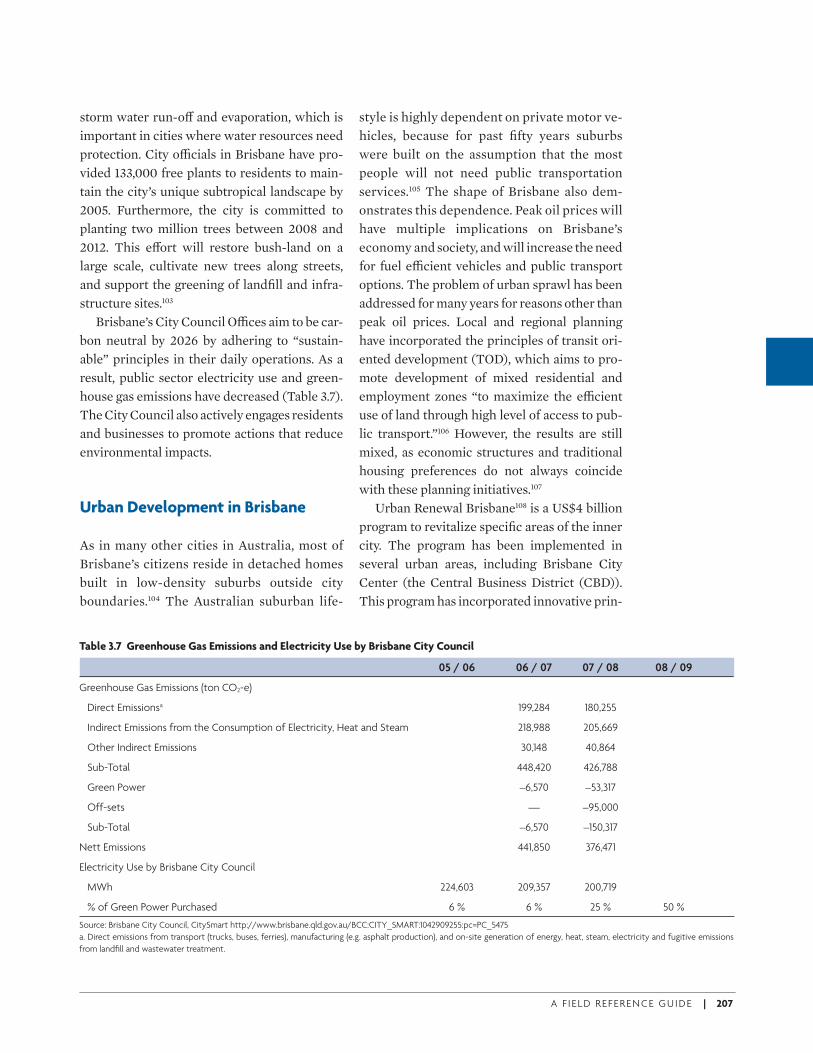
A F I E L D R E F E R E N C E G U I D E | 207
storm water run-o& and evaporation, which is important in cities where water resources need protection. City o* cials in Brisbane have pro-vided 133,000 free plants to residents to main-tain the city’s unique subtropical landscape by 2005. Furthermore, the city is committed to planting two million trees between 2008 and 2012. This e& ort will restore bush-land on a large scale, cultivate new trees along streets, and support the greening of landfi ll and infra-structure sites.103
Brisbane’s City Council O* ces aim to be car-bon neutral by 2026 by adhering to “sustain-able” principles in their daily operations. As a result, public sector electricity use and green-house gas emissions have decreased (Table 3.7). The City Council also actively engages residents and businesses to promote actions that reduce environmental impacts.
Urban Development in Brisbane
As in many other cities in Australia, most of Brisbane’s citizens reside in detached homes built in low-density suburbs outside city boundaries.104 The Australian suburban life-
style is highly dependent on private motor ve-hicles, because for past fi fty years suburbs were built on the assumption that the most people will not need public transportation services.105 The shape of Brisbane also dem-onstrates this dependence. Peak oil prices will have multiple implications on Brisbane’s economy and society, and will increase the need for fuel e* cient vehicles and public transport options. The problem of urban sprawl has been addressed for many years for reasons other than peak oil prices. Local and regional planning have incorporated the principles of transit ori-ented development (TOD), which aims to pro-mote development of mixed residential and employment zones “to maximize the e* cient use of land through high level of access to pub-lic transport.”106 However, the results are still mixed, as economic structures and traditional housing preferences do not always coincide with these planning initiatives.107
Urban Renewal Brisbane108 is a US$4 billion program to revitalize specifi c areas of the inner city. The program has been implemented in several urban areas, including Brisbane City Center (the Central Business District (CBD)). This program has incorporated innovative prin-
Table 3.7 Greenhouse Gas Emissions and Electricity Use by Brisbane City Council
05 / 06 06 / 07 07 / 08 08 / 09
Greenhouse Gas Emissions (ton CO2-e)
Direct Emissionsa 199,284 180,255
Indirect Emissions from the Consumption of Electricity, Heat and Steam 218,988 205,669
Other Indirect Emissions 30,148 40,864
Sub-Total 448,420 426,788
Green Power –6,570 –53,317
Off-sets — –95,000
Sub-Total –6,570 –150,317
Nett Emissions 441,850 376,471
Electricity Use by Brisbane City Council
MWh 224,603 209,357 200,719
% of Green Power Purchased 6 % 6 % 25 % 50 %
Source: Brisbane City Council, CitySmart http://www.brisbane.qld.gov.au/BCC:CITY_SMART:1042909255:pc=PC_5475
a. Direct emissions from transport (trucks, buses, ferries), manufacturing (e.g. asphalt production), and on-site generation of energy, heat, steam, electricity and fugitive emissions
from landfi ll and wastewater treatment.
ECo2-Part3aREV_PREP 207 6/15/09 8:43:10 AM
208 | ECO2 CITIES: ECOLOGICAL CITIES AS ECONOMIC CITIES
ciples and practices, such as high-quality urban designs, modern construction, mixed land use, higher density development, diverse transit op-tions, and enhanced accessibility.
The Brisbane City Council is working with the development industry to promote sustain-able living and working environments. The City Council has developed guidelines to help archi-tects, engineers, planners, developers, and build-ers incorporate principles the promote sustain-ability into development applications. While such principles o& er broad markers for sustain-able development, the guidelines explain how to practically apply them. For example, the buildings in Brisbane used to be designed to be open to breezes, with overhead ceiling fans, shaded areas, and good circulation. However, recent designs depend on air-conditioners that are energy dependent. Today, Brisbane is pro-moting new approaches to urban construction and spatial designs that create attractive living environments and walkable areas in this sub-tropical city.
Water Cycle and Water Catchment Management
Brisbane’s growing population is increasing pressure on the city’s supply of potable water. The average annual rainfall in Southeast Queen-sland is about 1,200 millimeters (as compared to 2,400 millimeters in Singapore). Although higher than in other Australian cities, Brisbane’s rainfall is less predictable, and careful water re-source management is required. In recent years, drought has become a serious national problem. States with authority in water management can undertake measures to conserve water, includ-ing by applying water use restrictions (with penalties for overuse) and subsidizing rainwa-ter tanks. Brisbane has also pursued integrated water cycle management encompassing water provision, wastewater treatment, storm water management, and strategic land management.
Poor land management in water catchments re-sults in lower quality water and higher water treatment costs. As a subtropical city, Brisbane is endowed with creeks and waterways and rich biodiversity. The city is working to restore the health of its waterways and creeks through var-ious means, including removing weeds, encour-aging communities to plant native seedlings, and reducing illegal dumping by sponsoring community campaigns.109
Public Transport—Bus Rapid Transit System
Brisbane has two Bus Rapid Transit (BRT) sys-tems: the Brisbane South East Busway, which opened in 2001, and the Brisbane Inner North-ern Busway, which opened in 2004. These BRTs fall under the jurisdiction of the Queensland Government as well as Queensland Transport, which is committed to public transport provi-sion to support growth and connectivity in greater Brisbane. Brisbane’s BRT networks are designed to provide public transportation ser-vices to areas that existing rail lines (Queen-sland Rail) do not cover. Brisbane’s South East Busway connects Brisbane’s CBD to the city’s southeastern suburbs, which edges a sprawling suburban area. The busways are two lane, bidi-rectional roads used exclusively by buses and emergency vehicles. This permits buses to by-pass congestion. The system also provides high-quality and well designed bus stations with good pedestrian access.110
Busways reduce the growth of car tra* c on roadways mainly due to their greater carrying capacity. One motorway lane can accommodate 2,000 passengers per hour, but one busway lane can carry 15,000 passengers per hour. In addi-tion, busways signifi cantly reduce travel time. For example, a typical route that takes 60 min-utes on a Brisbane motorway is reduced to 18 minutes by riding a bus on the South East Bus-way. Fewer cars and less travel time decrease
ECo2-Part3aREV_PREP 208 6/15/09 8:43:11 AM
A F I E L D R E F E R E N C E G U I D E | 209
vehicular emissions, which helps to mitigate climate change and improve air quality. In gen-eral, less time commuting translates into great-er urban productivity and economic activity. The BRT also a& ects land development. Along the South East Busway, property values within 6 miles of bus stations rose up to 20 percent; moreover, rates of growth in property values were 2 to 3 times higher than in areas farther from stations.111
Lesson Learned from Brisbane
Brisbane has responded to its unique local situa-tion as a subtropical city under growth pres-
sures. Climate change has already started to im-pact the city; water is scarce and temperatures are higher. Responding to its natural conditions, Brisbane protects water resources, plants trees to improve its urban ecology, and promotes a sustainable built environment. These actions save money for the city and its residents. Many developing country cities are in tropical and hot climates, and may be vulnerable to climatic changes. Some cities may be highly dependent on air-conditioning, which is relatively energy consuming compared to other viable strategies. In this context, Brisbane’s measures and actions may provide good examples for how cities might respond to such challenges while remaining ecologically and economically vibrant.
ECo2-Part3aREV_PREP 209 6/15/09 8:43:11 AM

ECo2-Part3aREV_PREP 210 6/15/09 8:43:11 AM
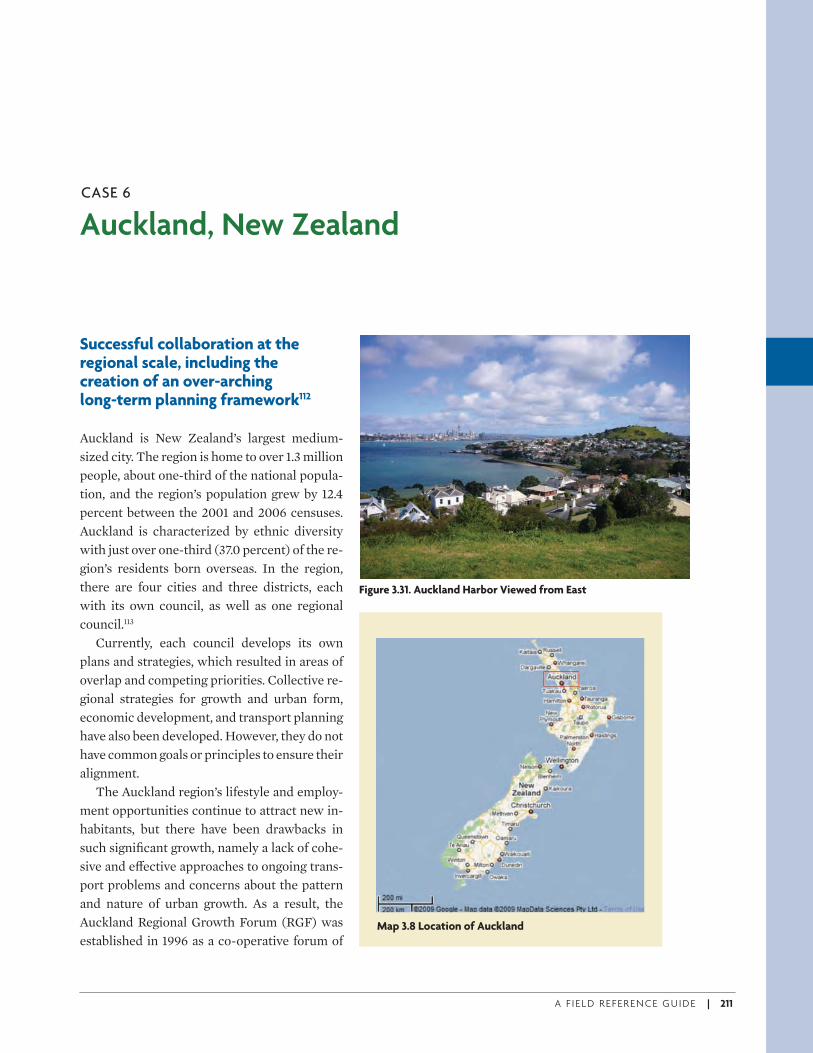
A F I E L D R E F E R E N C E G U I D E | 211
Successful collaboration at the regional scale, including the creation of an over-arching long-term planning framework112
Auckland is New Zealand’s largest medium-sized city. The region is home to over 1.3 million people, about one-third of the national popula-tion, and the region’s population grew by 12.4 percent between the 2001 and 2006 censuses. Auckland is characterized by ethnic diversity with just over one-third (37.0 percent) of the re-gion’s residents born overseas. In the region, there are four cities and three districts, each with its own council, as well as one regional council.113
Currently, each council develops its own plans and strategies, which resulted in areas of overlap and competing priorities. Collective re-gional strategies for growth and urban form, economic development, and transport planning have also been developed. However, they do not have common goals or principles to ensure their alignment.
The Auckland region’s lifestyle and employ-ment opportunities continue to attract new in-habitants, but there have been drawbacks in such signifi cant growth, namely a lack of cohe-sive and e& ective approaches to ongoing trans-port problems and concerns about the pattern and nature of urban growth. As a result, the Auckland Regional Growth Forum (RGF) was established in 1996 as a co-operative forum of
Auckland, New ZealandCASE 6
Map 3.8 Location of Auckland
Figure 3.31. Auckland Harbor Viewed from East
ECo2-Part3aREV_PREP 211 6/15/09 8:43:11 AM
212 | ECO2 CITIES: ECOLOGICAL CITIES AS ECONOMIC CITIES
political representatives from the Auckland Re-gional Council and the region’s territorial local authorities. The RGF’s aim is to develop and implement a strategy for managing the e& ects of growth.
Governments at every level recognize the
need for a collaborative, regional-scale
process
The interconnectedness of national and local Auckland issues, such as housing and educa-tion, with growth and innovation and the major required investments, particularly in land trans-port, created complex and di* cult decisions among multiple authorities. Despite Auckland’s importance to the New Zealand economy, and areas of common interest, such as transport and energy provision, the national government had not taken a close role in directing regional and local government planning. Concern emerged that without agreement on an overarching re-gional strategy and framework, decision-mak-ing in the region could be ad hoc and adversarial if each stakeholder tried to have a say from its own perspective, without viewing the region as a whole. As a result, there was a clear need for coordinated strategic planning across the Auck-land Region to ensure that Auckland could compete as a twenty-fi rst-century city. This was responded to by the preparation of a Regional Growth Strategy (2001), which aimed to pro-vide a vision for what Auckland could be like in 50 years. This was backed up by a spatial growth plan and a legislatively binding Metropolitan Urban limit
In parallel to the work on a regional growth strategy, a three-year Auckland Sustainable Cit-ies Programme (ASCP) was initiated in 2003. In 2006, as a result of the ASCP, the eight local au-thorities (Auckland City, Auckland Region, Franklin District, Manukau City, North Shore City, Papakura District, Rodney District, and Waitakere City) in collaboration with central government, and at the instigation of their Chief Executives’ joint forum, engaged with central
government to develop a long-term sustainabil-ity framework. Initially termed START (Sus-taining the Auckland Region Together), it at-tempted to evaluate ‘forces’ which might play a more signifi cant role in the long-term over a 100-year vision to align government e& orts and create strategic directions. Drivers for START included the need for resilient systems able to respond to persistent pressures over short and long time horizons with no obvious alternative solutions, and many vested interests with ap-parently irreconcilable implications.
Making a START: gathering information
The START working group developed a proto-type framework with a cascading set of deliver-ables, including a vision, goals, initial founda-tion and process principles, initial themes, some potential responses, which included catalyst projects and long-term sustainability goals, and development of indicators to measure progress. Critical to progressive development was con-sideration of the ‘forces’ which would shape Auckland’s future over the next 100 years. Also signifi cant to the development of the frame-work was the involvement of ‘expert groups’ including academics and experts from the busi-ness and community sectors, who through fa-cilitated workshops developed theme papers
Eight Goals Direct the Auckland
FrameworkThe Framework is built around eight interrelated
and long-term goals that will enable the region to
take a sustainable development approach:
Goal 1 A fair and connected society
Goal 2 Pride in who we are
Goal 3 A unique and outstanding environment
Goal 4 Prosperity through innovation
Goal 5 Te puawaitanga o te tangata—
Self sustaining Maori communities
Goal 6 A quality, compact urban form
Goal 7 Resilient infrastructure
Goal 8 Effective, collaborative leadership
BOX 3.4
ECo2-Part3aREV_PREP 212 6/15/09 8:43:12 AM
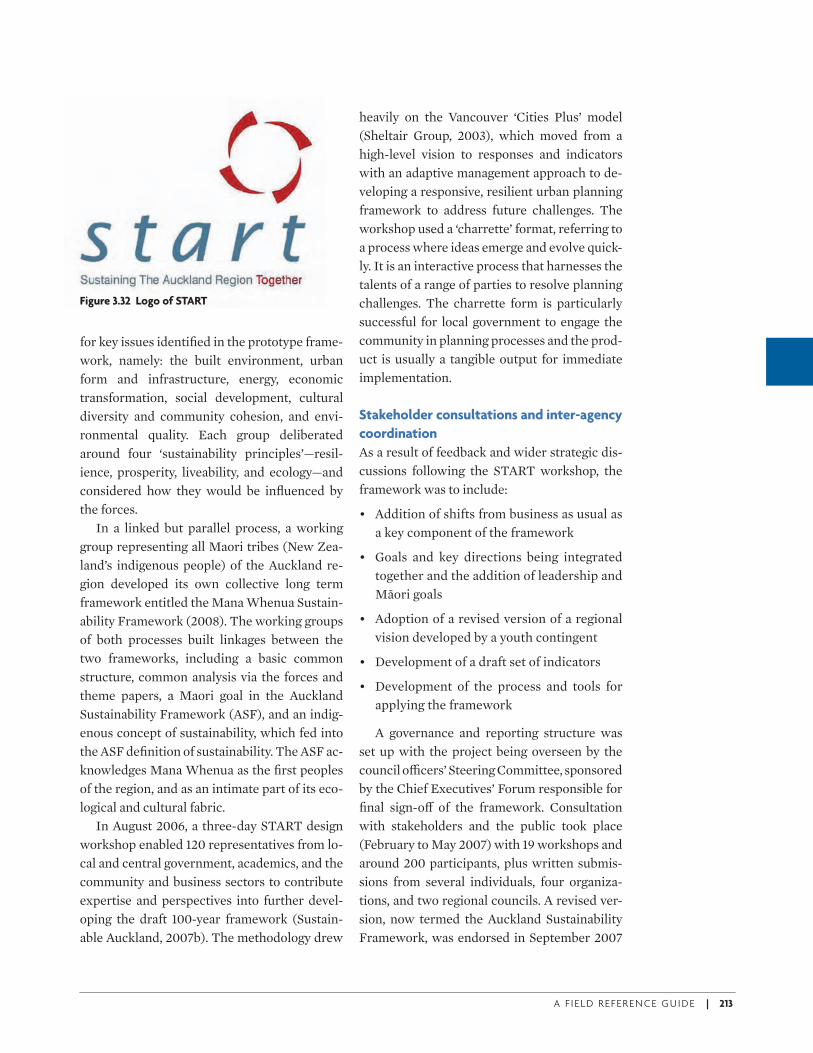
A F I E L D R E F E R E N C E G U I D E | 213
for key issues identifi ed in the prototype frame-work, namely: the built environment, urban form and infrastructure, energy, economic transformation, social development, cultural diversity and community cohesion, and envi-ronmental quality. Each group deliberated around four ‘sustainability principles’—resil-ience, prosperity, liveability, and ecology—and considered how they would be infl uenced by the forces.
In a linked but parallel process, a working group representing all Maori tribes (New Zea-land’s indigenous people) of the Auckland re-gion developed its own collective long term framework entitled the Mana Whenua Sustain-ability Framework (2008). The working groups of both processes built linkages between the two frameworks, including a basic common structure, common analysis via the forces and theme papers, a Maori goal in the Auckland Sustainability Framework (ASF), and an indig-enous concept of sustainability, which fed into the ASF defi nition of sustainability. The ASF ac-knowledges Mana Whenua as the fi rst peoples of the region, and as an intimate part of its eco-logical and cultural fabric.
In August 2006, a three-day START design workshop enabled 120 representatives from lo-cal and central government, academics, and the community and business sectors to contribute expertise and perspectives into further devel-oping the draft 100-year framework (Sustain-able Auckland, 2007b). The methodology drew
heavily on the Vancouver ‘Cities Plus’ model (Sheltair Group, 2003), which moved from a high-level vision to responses and indicators with an adaptive management approach to de-veloping a responsive, resilient urban planning framework to address future challenges. The workshop used a ‘charrette’ format, referring to a process where ideas emerge and evolve quick-ly. It is an interactive process that harnesses the talents of a range of parties to resolve planning challenges. The charrette form is particularly successful for local government to engage the community in planning processes and the prod-uct is usually a tangible output for immediate implementation.
Stakeholder consultations and inter-agency
coordination
As a result of feedback and wider strategic dis-cussions following the START workshop, the framework was to include:
• Addition of shifts from business as usual as a key component of the framework
• Goals and key directions being integrated together and the addition of leadership and Māori goals
• Adoption of a revised version of a regional vision developed by a youth contingent
• Development of a draft set of indicators
• Development of the process and tools for applying the framework
A governance and reporting structure was set up with the project being overseen by the council o* cers’ Steering Committee, sponsored by the Chief Executives’ Forum responsible for fi nal sign-o& of the framework. Consultation with stakeholders and the public took place (February to May 2007) with 19 workshops and around 200 participants, plus written submis-sions from several individuals, four organiza-tions, and two regional councils. A revised ver-sion, now termed the Auckland Sustainability Framework, was endorsed in September 2007
Figure 3.32 Logo of START
ECo2-Part3aREV_PREP 213 6/15/09 8:43:12 AM
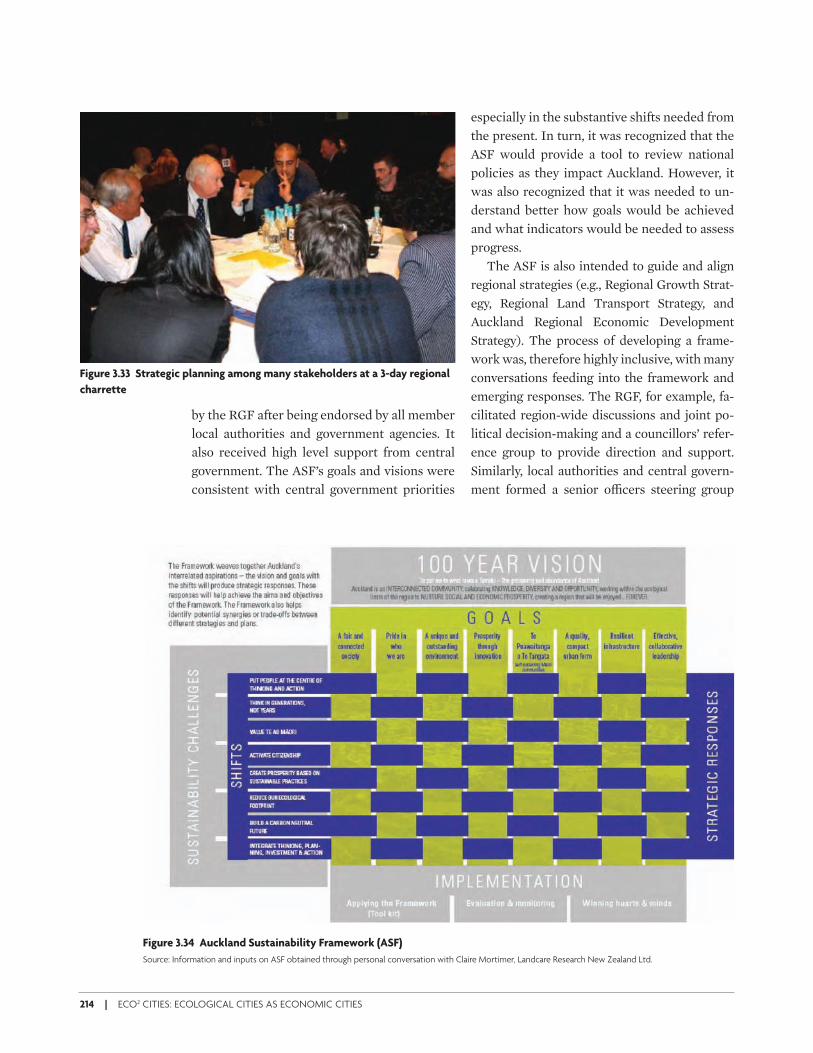
214 | ECO2 CITIES: ECOLOGICAL CITIES AS ECONOMIC CITIES
by the RGF after being endorsed by all member local authorities and government agencies. It also received high level support from central government. The ASF’s goals and visions were consistent with central government priorities
especially in the substantive shifts needed from the present. In turn, it was recognized that the ASF would provide a tool to review national policies as they impact Auckland. However, it was also recognized that it was needed to un-derstand better how goals would be achieved and what indicators would be needed to assess progress.
The ASF is also intended to guide and align regional strategies (e.g., Regional Growth Strat-egy, Regional Land Transport Strategy, and Auckland Regional Economic Development Strategy). The process of developing a frame-work was, therefore highly inclusive, with many conversations feeding into the framework and emerging responses. The RGF, for example, fa-cilitated region-wide discussions and joint po-litical decision-making and a councillors’ refer-ence group to provide direction and support. Similarly, local authorities and central govern-ment formed a senior o* cers steering group
Figure 3.33 Strategic planning among many stakeholders at a 3-day regional
charrette
Figure 3.34 Auckland Sustainability Framework (ASF)
Source: Information and inputs on ASF obtained through personal conversation with Claire Mortimer, Landcare Research New Zealand Ltd.
ECo2-Part3aREV_PREP 214 6/15/09 8:43:13 AM
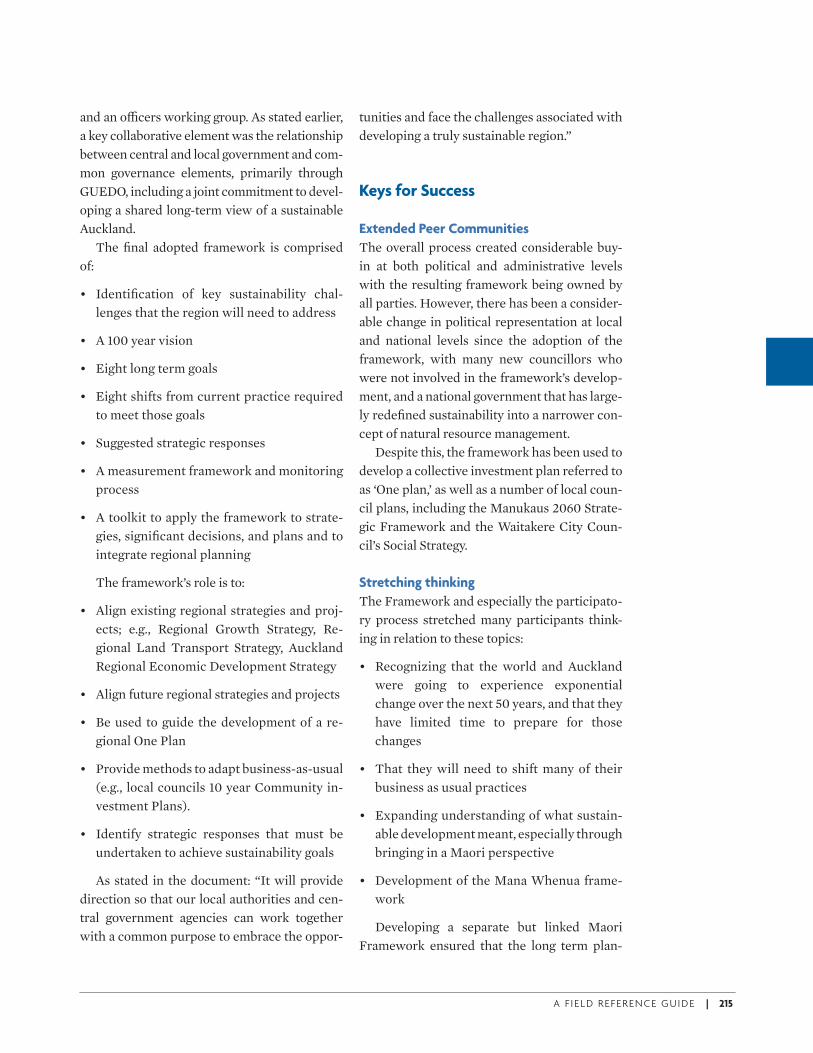
A F I E L D R E F E R E N C E G U I D E | 215
and an o* cers working group. As stated earlier, a key collaborative element was the relationship between central and local government and com-mon governance elements, primarily through GUEDO, including a joint commitment to devel-oping a shared long-term view of a sustainable Auckland.
The fi nal adopted framework is comprised of:
• Identifi cation of key sustainability chal-lenges that the region will need to address
• A 100 year vision
• Eight long term goals
• Eight shifts from current practice required to meet those goals
• Suggested strategic responses
• A measurement framework and monitoring process
• A toolkit to apply the framework to strate-gies, signifi cant decisions, and plans and to integrate regional planning
The framework’s role is to:
• Align existing regional strategies and proj-ects; e.g., Regional Growth Strategy, Re-gional Land Transport Strategy, Auckland Regional Economic Development Strategy
• Align future regional strategies and projects
• Be used to guide the development of a re-gional One Plan
• Provide methods to adapt business-as-usual (e.g., local councils 10 year Community in-vestment Plans).
• Identify strategic responses that must be undertaken to achieve sustainability goals
As stated in the document: “It will provide direction so that our local authorities and cen-tral government agencies can work together with a common purpose to embrace the oppor-
tunities and face the challenges associated with developing a truly sustainable region.”
Keys for Success
Extended Peer Communities
The overall process created considerable buy-in at both political and administrative levels with the resulting framework being owned by all parties. However, there has been a consider-able change in political representation at local and national levels since the adoption of the framework, with many new councillors who were not involved in the framework’s develop-ment, and a national government that has large-ly redefi ned sustainability into a narrower con-cept of natural resource management.
Despite this, the framework has been used to develop a collective investment plan referred to as ‘One plan,’ as well as a number of local coun-cil plans, including the Manukaus 2060 Strate-gic Framework and the Waitakere City Coun-cil’s Social Strategy.
Stretching thinking
The Framework and especially the participato-ry process stretched many participants think-ing in relation to these topics:
• Recognizing that the world and Auckland were going to experience exponential change over the next 50 years, and that they have limited time to prepare for those changes
• That they will need to shift many of their business as usual practices
• Expanding understanding of what sustain-able development meant, especially through bringing in a Maori perspective
• Development of the Mana Whenua frame-work
Developing a separate but linked Maori Framework ensured that the long term plan-
ECo2-Part3aREV_PREP 215 6/15/09 8:43:14 AM
216 | ECO2 CITIES: ECOLOGICAL CITIES AS ECONOMIC CITIES
ning for Maori was by Maori. The depth of in-digenous understanding of generational think-ing, and the holistic and spiritual understanding of the relationship between the environment and people, was fully realized in the Mana Whe-nua framework, and went on to challenge and stretch the thinking on the ASF.
Lessons Learnt
There appear to have been two groups less well represented: business representatives and devel-opers who would eventually implement strate-gies and activities based on the framework. A spe-cial process may be needed to engage these groups, since they are typically reluctant to at-tend open meetings, and require a process that is especially well facilitated and e* cient with time.
After the ASF was adopted, the region quick-ly focused on new priorities. As a consequence, one component of the framework entitled “win-ning hearts and minds” in Figure 3.34 did not
progress. Winning hearts and minds acknowl-edged the importance of the social learning process that councillors, key sta& , and stake-holders experienced through the Framework’s development. Continued dialogue and educa-tion on sustainability challenges and solutions was required for these key decision-makers and for the public.
While the ASF was adopted as a guiding framework, the ASF has not yet developed any hard targets that plans and strategies are re-quired to meet. The ASF has also not developed bottom line thresholds for public sector deci-sion-making. Without these elements, the ASF may become a useful tool for some parties, but something to ignore by others. The new nation-al government is restructuring all eight local government bodies within the region into a sin-gle unitary council, and it remains to be seen whether this new council will adopt the ASF as the region’s guiding framework.
ECo2-Part3aREV_PREP 216 6/15/09 8:43:14 AM
A F I E L D R E F E R E N C E G U I D E | 217
Introduction
As cities devise their Eco2 Pathways, it helps to survey these through the lens of each urban infrastructure sector. Ide-
ally, this leads to a kaleidoscopic view of the city that recognizes the interrelationships of energy, water, transport, and solid waste. These interre-lationships apply across sectors and vis-à-vis the built form of the city. In this context, the fi -nal note on managing the spatial structure of cities provides important lessons on how spa-tial planning and land use regulations can pow-erfully impact mobility and a( ordability.
It is clear that many of these sectors’ opera-tional and jurisdictional lines impede innova-tion and creativity in achieving better outcomes. It is also clear that investments made in one sector can result in savings in another sector (for example, investments in water e+ ciency usually result in large energy cost savings). Pooling scarce resources to invest in multifunc-tional and multipurpose common elements can also benefi t urban residents (for instance, through single purpose underground infra-structure corridors).
What emerges from a closer analysis is an understanding of how these infrastructure sys-tems interact with a city’s spatial form. Infra-
Eco2 Sector NotesA Sector by Sector Lens on Urban Infrastructure
structure investments trigger and enable ur-banization. However, urban planning and spatial development establish the locations, concentrations, distributions, and nature of de-mand nodes for sector infrastructure systems. Urban and spatial planning also identifi es the physical and economic constraints and param-eters for infrastructure systems, including ca-pacity limits, service delivery technologies, and cost-recovery requirements. Good urban plan-ning and spatial development provide proactive ‘demand side’ management and improve re-source e+ ciency by identifying and assessing the viability of technology and infrastructure options. For instance, public transportation is fi nancially viable only at certain threshold ur-ban densities and forms—and under good urban land use coordination.
In addition to illustrating the opportunities and strategies for realizing benefi ts within and across sectors, the following notes shed light on critical sector-specifi c issues that are not under direct control of city authorities, but nonethe-less impact city sustainability. These issues may need to be addressed on a sector by sector basis. Moreover, identifying critical pressure points beyond the direct control of city authorities is important to devising an expanded platform for collaboration.
ECo2-Part3brEV_PREP Sec1:217 6/15/09 9:04:18 AM

ECo2-Part3brEV_PREP Sec1:218 6/15/09 9:04:19 AM
A F I E L D R E F E R E N C E G U I D E | 219
Cities and EnergySECTOR NOTE 1
Overview
Cities, or urban areas, account for about two-thirds of the world’s annual energy consumption. In the coming decades, urbanization and income growth in developing countries are expected to push urban consumption even higher.114 As the main consumers of energy and as implementers of national and regional sustainable energy poli-cies and programs, cities can play a crucial role in improving our energy and environmental futures by making smart choices in urban development, energy demand management, and energy sup-plies. In return, cities stand to become more liv-able, a( ordable, and sustainable.
Traditionally, urban energy planning and management have aimed to improve access, se-curity, reliability, and a( ordability. These e( orts have focused on developing network-based en-ergy systems (on which cities have become de-pendent), such as electricity grids, district heat-ing networks, and natural gas pipelines. These e( orts remain essential because modern cities simply cannot function without such networks. However, the potential for dire environmental impacts of traditional urban energy use persists, as exemplifi ed in the London Smog disaster of 1952 that killed 12,000 people. Today, heavy ur-ban air pollution in many developing countries is a sober reminder that many growing cities cannot cope with the serious health related im-pacts of consuming fossil fuels. The fi rst oil cri-sis of 1973 further highlighted the importance
of energy e+ ciency, conservation, and renew-able energy. However, thirty-fi ve years later, achieving progress in energy e+ ciency and re-newable energy remains a tough challenge in both developed and developing countries. The emergence of climate change as a global devel-opment constraint, much of it related to the en-ergy consumption habits and infrastructure in cities, also calls for fundamental changes in how countries and cities approach urban develop-ment, manage energy demand, and secure en-ergy supplies.
How can cities address their multi-
dimensional energy challenges, which a$ ect
their success and long-term development
prospects? The evolution of urban energy agendas—from access, security, reliability, and a( ordability to environment and public health concerns, and, more recently, to climate change mitigation and adaptation—has challenged cit-ies and national and regional governments to break away from supply-centric practices and strengthen environmental rules in planning and management. The largely successful control of local and regional air pollution in cities in de-veloped countries is encouraging and suggests possibilities to expand e( orts in developing countries. This success relied mainly on relo-cating factories, switching to cleaner fuels, and adopting stringent national and regional emis-sions regulations for industries and motor ve-hicles. As a result, many cities have become more attractive and competitive. Controlling
ECo2-Part3brEV_PREP Sec1:219 6/15/09 9:04:19 AM
220 | ECO2 CITIES: ECOLOGICAL CITIES AS ECONOMIC CITIES
cities’ carbon footprints represents the greatest current energy challenge, but urban planners can tap this challenge to strengthen energy se-curity and enhance energy access, a( ordability, and reliability. To be successful, cities must manage energy demand by promoting energy e+ ciency across sectors and the uptake of e+ -cient and renewable energy supplies. It is also important, particularly in developing countries, that urban planners support solutions incorpo-rating energy e+ ciency and renewable energy in urban land use planning and land develop-ment. These e( orts require that cities are ac-tively involved in energy planning and manage-ment, and that they adopt long-term visions for urban development and redevelopment.
Visionary cities are adopting a new paradigm of integrated urban energy planning and man-agement. Recent examples include the PLANYC 2030 of New York City and Plan Climat de Par-is.115 However, implementation hurdles remain and the real test of turning visions into realities lies ahead. City governments are often faced with urgent tasks and competing interests and must prioritize actions against constraints in human and fi nancial resources. City adminis-trations often lack a single department with ad-equate authority to spearhead a cross-cutting agenda, with the exception of the mayor’s of-fi ce, which commonly cannot sustain e( orts be-cause of mayoral term limits. In addition, urban energy planning and management are not en-tirely within the jurisdiction of city govern-ments. In fact, prevailing urban energy infra-structures, with the exception of district heating systems, are usually not under the direct pur-view of local governments.116 Moreover, if cities are to succeed, they need strong support from their national and regional governments.
Why should a city government care about
being assertive and making and implement-
ing sustainable energy decisions? The short answer is that it pays. Most energy e+ ciency and conservation measures are not high-tech or expensive and initial costs can usually be quickly
recovered. The municipality of Emfuleni in South Africa, for example, initiated an energy and water e+ ciency project that cost US$1.8 million and achieved annual savings of about 7 billion liters of water and 14 million kWh. This equated with annual monetary savings of over US$4 million, thus the project paid for itself in under 6 months. Since the contract was fi nanced and implemented by an Energy Service Compa-ny (ESCO), the municipality not only saved money from reduced water losses and pumping costs, but also through less investment upfront. The ESCO, on the other hand, recouped its in-vestment quickly by sharing part of the cost sav-ings.117 As another example, the Växjö Munici-pality in Sweden began in 1994 to replace its street lights with high e+ ciency lamps, which reduced energy use by 50 percent. After a proj-ect investment of about US$3.6 million, the city saved US$0.75 million per year, which meant the project paid for itself in under 5 years.118 Cit-ies facing budget shortfalls are well-advised to consider mining current expenditures for ener-gy savings in their facilities and operations.
In cities in developing countries with serious air pollution, energy e+ ciency and cleaner en-ergy promotes reduced medical bills and pro-ductivity, which improves urban livability and competitiveness. A recent joint study by the Chinese Government and the World Bank esti-mated that the cost of ambient air pollution in China’s urban areas—in air pollution-related premature deaths and illnesses—amounted to US$63 billion in 2003, equivalent to 3.8 percent of China’s GDP.119 In fact, China’s e( orts in the past two decades to modernize energy infra-structure and improve energy e+ ciency have aimed to reduce the health impacts of air pollu-tion. This is evident in the fast penetration of gaseous cooking fuels, and the rapid expansion of district heating systems in northern Chinese cities, which are also implementing national building energy e+ ciency standards.
Among fast growing cities in developing countries, shifting to a new paradigm of urban
ECo2-Part3brEV_PREP Sec1:220 6/15/09 9:04:19 AM
A F I E L D R E F E R E N C E G U I D E | 221
energy planning and management is as much about contributing to global welfare as enhanc-ing capacity to serve growing energy needs at lower costs and with greater security. Good en-vironmental stewardship in energy planning and management is essential to mitigate region-al and global environmental impacts that a( ect the long-term well-being of cities (for example, acid rain, climate change-induced storms, and rising sea levels). Making cities more energy-e+ cient and more accessible to renewable en-ergy supplies also helps to hedge risks of higher energy costs if a global agreement is reached to drastically reduce anthropogenic GHG emis-sions. This does not, however, mean that devel-oping cities should address all sustainable en-ergy options at the same time. Pursuing actions on sustainable energy, however cost-e( ective they may be, requires public and private invest-ment, e( orts from city governments and citi-zens, and strong support of regional and nation-al governments. Cities should, moreover, tailor their e( orts to available resources and pursue initial steps toward sustainable energy that gen-erate signifi cant and immediate local benefi ts.
Where should a city start? In general, there are three areas where actions and interventions at the city level are critical and where city gov-ernments are in the driver’s seat:
Investing in sustainable energy retrofi ts and sup-
plies in city government facilities and operations. Cities can start with a range of energy e+ ciency and conservation measures in government-owned buildings and municipal services, such as water supply and wastewater treatment fa-cilities, public lighting, transport, and solid waste management. Large government com-plexes are often good candidates for distributed energy supply options such as co-generation of heat and power using natural gas. Local govern-ments can also expand renewable energy sup-plies by purchasing “green” electricity and ac-commodating renewable energy technologies, such as photovoltaic systems and solar water heating, in their own buildings and facilities;
Promoting energy e& ciency and application of
renewable energy technologies in the urban built
environment. City governments can promote energy e+ ciency and renewable energy options in non-municipally owned or operated sectors harnessing their dominant roles in shaping the urban built environment. One of the most criti-cal and e( ective interventions is enforcing na-tional or regional energy e+ ciency standards in new building construction and building renova-tions.120 A more ambitious green building agen-da can also include additional requirements for water e+ ciency and conservation, adoption of renewable energy technologies, incentive pro-grams for industry and residential users, and other measures to reduce the environmental impact of buildings;121 and
Promoting energy e& ciency and renewable ener-
gy through land use planning and land develop-
ment policies. Within their jurisdictions, city governments can shape or reshape land use and development patterns in ways that minimize their carbon footprints while ensuring lower overall operating costs. This is where energy planning meets and integrates with transporta-tion and other urban infrastructure planning to best serve a city’s growth ambitions and envi-ronmental aspirations.
Cities in developing countries face much tougher challenges than their counterparts in developed countries. Often technical capacity is lacking. Competition for resources is fi erce. Un-der growth pressures and capital constraints, compromise is often made to serve more in-stead of serving more and better.122 While cities must actively engage in promoting sustainable energy solutions, urban leaders need more sup-port and cooperation from regional and nation-al governments to be successful. Substantial donor support, knowledge, and fi nance are also needed to encourage cities to enact sustainable energy actions in these three areas.
This chapter reviews the general urban en-ergy landscape, particularly for cities in devel-oping countries. It reviews activities linked to
ECo2-Part3brEV_PREP Sec1:221 6/15/09 9:04:19 AM
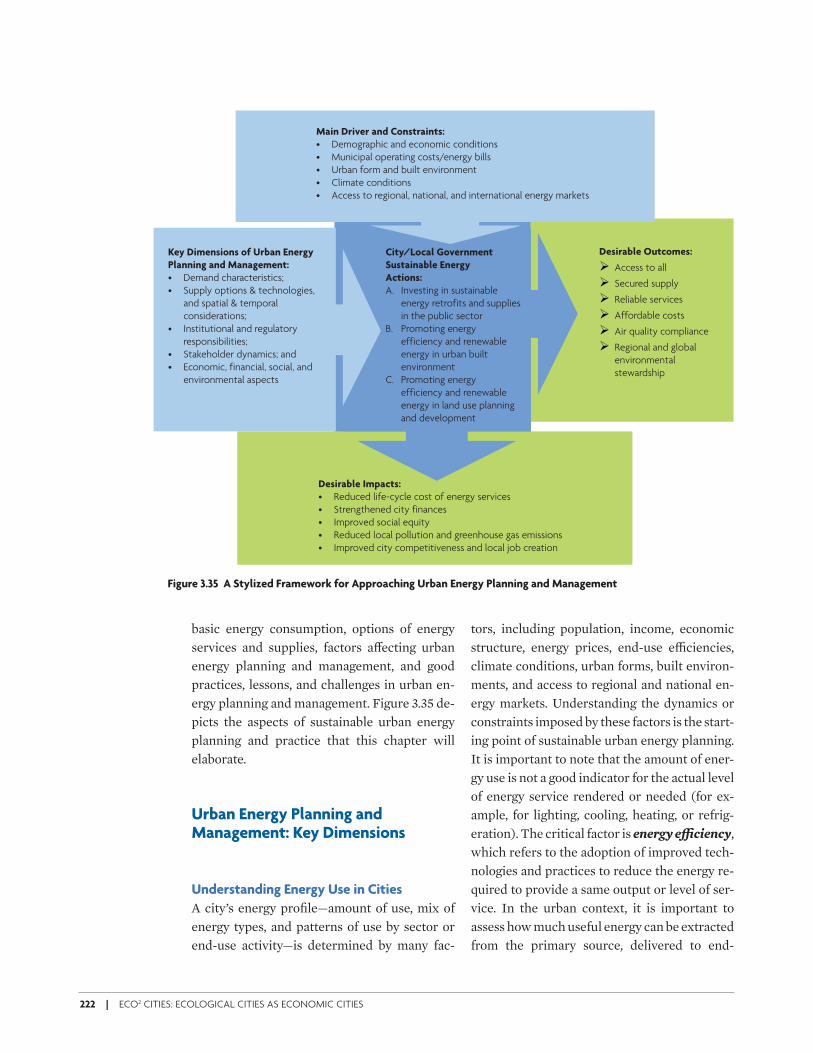
222 | ECO2 CITIES: ECOLOGICAL CITIES AS ECONOMIC CITIES
basic energy consumption, options of energy services and supplies, factors a( ecting urban energy planning and management, and good practices, lessons, and challenges in urban en-ergy planning and management. Figure 3.35 de-picts the aspects of sustainable urban energy planning and practice that this chapter will elaborate.
Urban Energy Planning and Management: Key Dimensions
Understanding Energy Use in Cities
A city’s energy profi le—amount of use, mix of energy types, and patterns of use by sector or end-use activity—is determined by many fac-
tors, including population, income, economic structure, energy prices, end-use e+ ciencies, climate conditions, urban forms, built environ-ments, and access to regional and national en-ergy markets. Understanding the dynamics or constraints imposed by these factors is the start-ing point of sustainable urban energy planning. It is important to note that the amount of ener-gy use is not a good indicator for the actual level of energy service rendered or needed (for ex-ample, for lighting, cooling, heating, or refrig-eration). The critical factor is energy e" ciency, which refers to the adoption of improved tech-nologies and practices to reduce the energy re-quired to provide a same output or level of ser-vice. In the urban context, it is important to assess how much useful energy can be extracted from the primary source, delivered to end-
Figure 3.35 A Stylized Framework for Approaching Urban Energy Planning and Management
Main Driver and Constraints:• Demographic and economic conditions
• Municipal operating costs/energy bills
• Urban form and built environment
• Climate conditions
• Access to regional, national, and international energy markets
Desirable Impacts:• Reduced life-cycle cost of energy services
• Strengthened city finances
• Improved social equity
• Reduced local pollution and greenhouse gas emissions
• Improved city competitiveness and local job creation
Key Dimensions of Urban EnergyPlanning and Management:
• Demand characteristics;
• Supply options & technologies,
and spatial & temporal
considerations;
• Institutional and regulatory
responsibilities;
• Stakeholder dynamics; and
• Economic, financial, social, and
environmental aspects
City/Local GovernmentSustainable Energy
Actions:
A. Investing in sustainable
energy retrofits and supplies
in the public sector
B. Promoting energy
efficiency and renewable
energy in urban built
environment
C. Promoting energy
efficiency and renewable
energy in land use planning
and development
Desirable Outcomes:
Ø Access to all
Ø Secured supply
Ø Reliable services
Ø Affordable costs
Ø Air quality compliance
Ø Regional and global
environmental
stewardship
ECo2-Part3brEV_PREP Sec1:222 6/15/09 9:04:19 AM
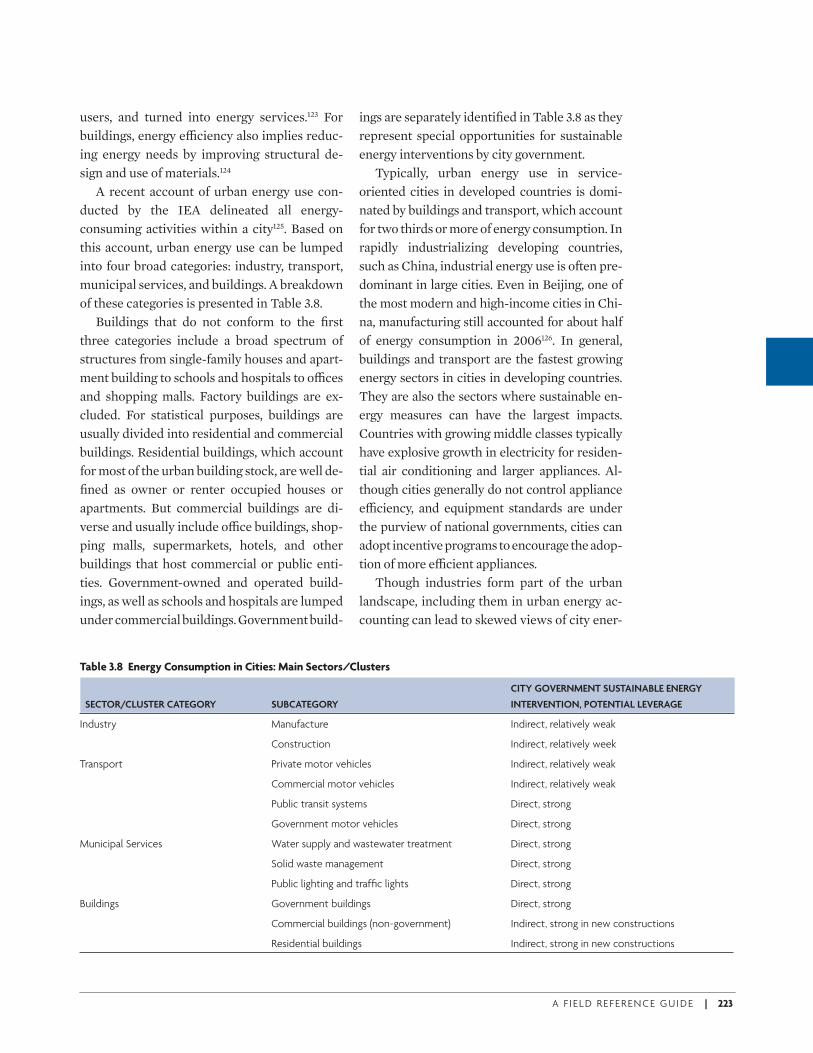
A F I E L D R E F E R E N C E G U I D E | 223
users, and turned into energy services.123 For buildings, energy e+ ciency also implies reduc-ing energy needs by improving structural de-sign and use of materials.124
A recent account of urban energy use con-ducted by the IEA delineated all energy-consuming activities within a city125. Based on this account, urban energy use can be lumped into four broad categories: industry, transport, municipal services, and buildings. A breakdown of these categories is presented in Table 3.8.
Buildings that do not conform to the fi rst three categories include a broad spectrum of structures from single-family houses and apart-ment building to schools and hospitals to o+ ces and shopping malls. Factory buildings are ex-cluded. For statistical purposes, buildings are usually divided into residential and commercial buildings. Residential buildings, which account for most of the urban building stock, are well de-fi ned as owner or renter occupied houses or apartments. But commercial buildings are di-verse and usually include o+ ce buildings, shop-ping malls, supermarkets, hotels, and other buildings that host commercial or public enti-ties. Government-owned and operated build-ings, as well as schools and hospitals are lumped under commercial buildings. Government build-
ings are separately identifi ed in Table 3.8 as they represent special opportunities for sustainable energy interventions by city government.
Typically, urban energy use in service-oriented cities in developed countries is domi-nated by buildings and transport, which account for two thirds or more of energy consumption. In rapidly industrializing developing countries, such as China, industrial energy use is often pre-dominant in large cities. Even in Beijing, one of the most modern and high-income cities in Chi-na, manufacturing still accounted for about half of energy consumption in 2006126. In general, buildings and transport are the fastest growing energy sectors in cities in developing countries. They are also the sectors where sustainable en-ergy measures can have the largest impacts. Countries with growing middle classes typically have explosive growth in electricity for residen-tial air conditioning and larger appliances. Al-though cities generally do not control appliance e+ ciency, and equipment standards are under the purview of national governments, cities can adopt incentive programs to encourage the adop-tion of more e+ cient appliances.
Though industries form part of the urban landscape, including them in urban energy ac-counting can lead to skewed views of city ener-
Table 3.8 Energy Consumption in Cities: Main Sectors/Clusters
CITY GOVERNMENT SUSTAINABLE ENERGY
SECTOR/CLUSTER CATEGORY SUBCATEGORY INTERVENTION, POTENTIAL LEVERAGE
Industry Manufacture Indirect, relatively weak
Construction Indirect, relatively week
Transport Private motor vehicles Indirect, relatively weak
Commercial motor vehicles Indirect, relatively weak
Public transit systems Direct, strong
Government motor vehicles Direct, strong
Municipal Services Water supply and wastewater treatment Direct, strong
Solid waste management Direct, strong
Public lighting and traffi c lights Direct, strong
Buildings Government buildings Direct, strong
Commercial buildings (non-government) Indirect, strong in new constructions
Residential buildings Indirect, strong in new constructions
ECo2-Part3brEV_PREP Sec1:223 6/15/09 9:04:19 AM
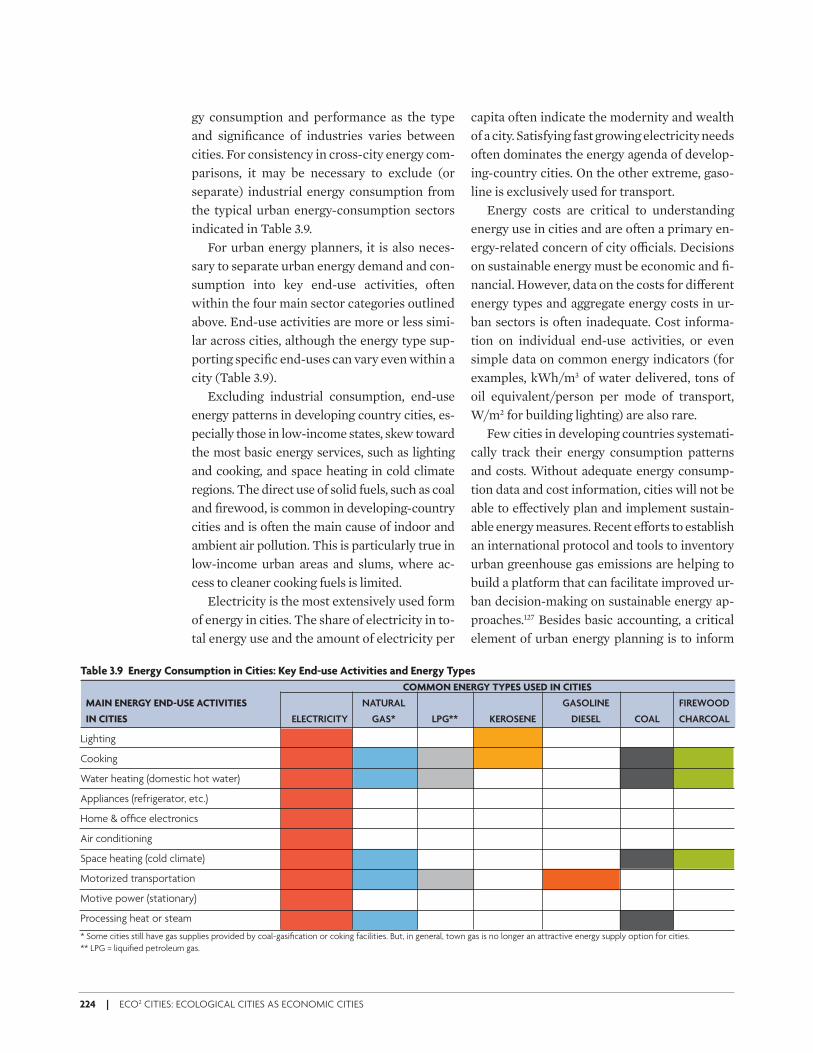
224 | ECO2 CITIES: ECOLOGICAL CITIES AS ECONOMIC CITIES
gy consumption and performance as the type and signifi cance of industries varies between cities. For consistency in cross-city energy com-parisons, it may be necessary to exclude (or separate) industrial energy consumption from the typical urban energy-consumption sectors indicated in Table 3.9.
For urban energy planners, it is also neces-sary to separate urban energy demand and con-sumption into key end-use activities, often within the four main sector categories outlined above. End-use activities are more or less simi-lar across cities, although the energy type sup-porting specifi c end-uses can vary even within a city (Table 3.9).
Excluding industrial consumption, end-use energy patterns in developing country cities, es-pecially those in low-income states, skew toward the most basic energy services, such as lighting and cooking, and space heating in cold climate regions. The direct use of solid fuels, such as coal and fi rewood, is common in developing-country cities and is often the main cause of indoor and ambient air pollution. This is particularly true in low-income urban areas and slums, where ac-cess to cleaner cooking fuels is limited.
Electricity is the most extensively used form of energy in cities. The share of electricity in to-tal energy use and the amount of electricity per
capita often indicate the modernity and wealth of a city. Satisfying fast growing electricity needs often dominates the energy agenda of develop-ing-country cities. On the other extreme, gaso-line is exclusively used for transport.
Energy costs are critical to understanding energy use in cities and are often a primary en-ergy-related concern of city o+ cials. Decisions on sustainable energy must be economic and fi -nancial. However, data on the costs for di( erent energy types and aggregate energy costs in ur-ban sectors is often inadequate. Cost informa-tion on individual end-use activities, or even simple data on common energy indicators (for examples, kWh/m3 of water delivered, tons of oil equivalent/person per mode of transport, W/m2 for building lighting) are also rare.
Few cities in developing countries systemati-cally track their energy consumption patterns and costs. Without adequate energy consump-tion data and cost information, cities will not be able to e( ectively plan and implement sustain-able energy measures. Recent e( orts to establish an international protocol and tools to inventory urban greenhouse gas emissions are helping to build a platform that can facilitate improved ur-ban decision-making on sustainable energy ap-proaches.127 Besides basic accounting, a critical element of urban energy planning is to inform
Table 3.9 Energy Consumption in Cities: Key End-use Activities and Energy Types
COMMON ENERGY TYPES USED IN CITIES
MAIN ENERGY END-USE ACTIVITIES NATURAL GASOLINE FIREWOOD
IN CITIES ELECTRICITY GAS* LPG** KEROSENE DIESEL COAL CHARCOAL
Lighting
Cooking
Water heating (domestic hot water)
Appliances (refrigerator, etc.)
Home & offi ce electronics
Air conditioning
Space heating (cold climate)
Motorized transportation
Motive power (stationary)
Processing heat or steam
* Some cities still have gas supplies provided by coal-gasifi cation or coking facilities. But, in general, town gas is no longer an attractive energy supply option for cities.
** LPG = liquifi ed petroleum gas.
ECo2-Part3brEV_PREP Sec1:224 6/15/09 9:04:19 AM
A F I E L D R E F E R E N C E G U I D E | 225
stakeholders of opportunities for demand man-agement through investments in energy e+ -ciency and conservation programs and alterna-tive supplies. Simple benchmark data, such as quantifi able measures of energy use for lighting and heating, can help city managers identify sec-tors that exceed norms and plan remedial inter-ventions. Options for additional supplies, such as cogeneration from wastewater treatment plants or methane capture from landfi lls, can also be assessed. Evaluations of such options re-quire evaluation tools that can help cities exam-ine and compare their energy performance with good/best practices, and understand cost and benefi t implications. Development of practical decision support tools and methods for sustain-able urban energy planning and management help cities to quickly identify and prioritize sus-tainable energy actions grounded on local ca-pacities and realities.
Energy Supply Options, Technologies, and Spatial and Temporal Considerations
Modern cities are highly dependent on net-work-based electricity and, to a lesser extent, natural gas supplies that are connected to re-gional and/or national networks. There are of-ten power plants located within city boundar-ies, but these are often owned and/or operated by regional or national electric utilities, or inde-pendent power producers.128 Developing cities generally aim to ensure secure and reliable ac-cess to regionally-integrated and network-based energy supplies. District heating systems repre-sent another network-based energy service common in cold climate cities, especially in Eu-rope and China. But they are limited to areas of a city with su+ ciently high building density. Supplies of solid and liquid fuels, such as coal and petroleum products, are usually decentral-ized: di( erent users may buy fuels from di( er-ent producers or local distributors. The supply
of transport fuels is usually vertically controlled by oil companies. In low-income country cities where peri-urban and slum population are sig-nifi cant, fi rewood and charcoal are often im-portant cooking and, in cold climates, heating fuels. Firewood is locally supplied and is often collected by individual households; charcoal is usually supplied by informal service providers. As a city grows in wealth, there is a progression toward higher dependence on network-based energy supplies and decreasing use of solid fu-els (coal and fi rewood) among households and other dispersed service points. In general, cities and urban areas are almost entirely dependent on external energy supplies (even power plants located in cities need to import fuels).
It is possible to conceive a city’s energy sup-ply options and technologies along the three main energy delivery channels depicted in Fig-ure 3.36. In mildly cold and warm climates, cen-tralized heat supply is generally not an econom-ically viable option and is not considered. Electricity and centralized heat are often sub-ject to urban energy optimization in cold cli-mates since they can be produced together through combined heat and power plants. Cool-ing can be provided by using heat energy to drive a cooling system using absorption chiller technology. Thus, district heating systems can provide cooling services in the summer if it is economically justifi ed. Distributed energy re-sources (DERs) often produce electricity while providing heating and cooling services. Natural gas not only provides a cleaner alternative to oil and coal, but also brings more fl exibility to ur-ban energy services through distributed gener-ation facilities. For a large city, fi tting all the pieces together to optimize sustainable energy outcomes is not an easy undertaking. This is es-pecially challenging in developing country cit-ies where energy supplies are less organized or streamlined compared to their developed coun-terparts, where energy supplies are primarily network-based.
The advance of centralized and distributed
ECo2-Part3brEV_PREP Sec1:225 6/15/09 9:04:19 AM
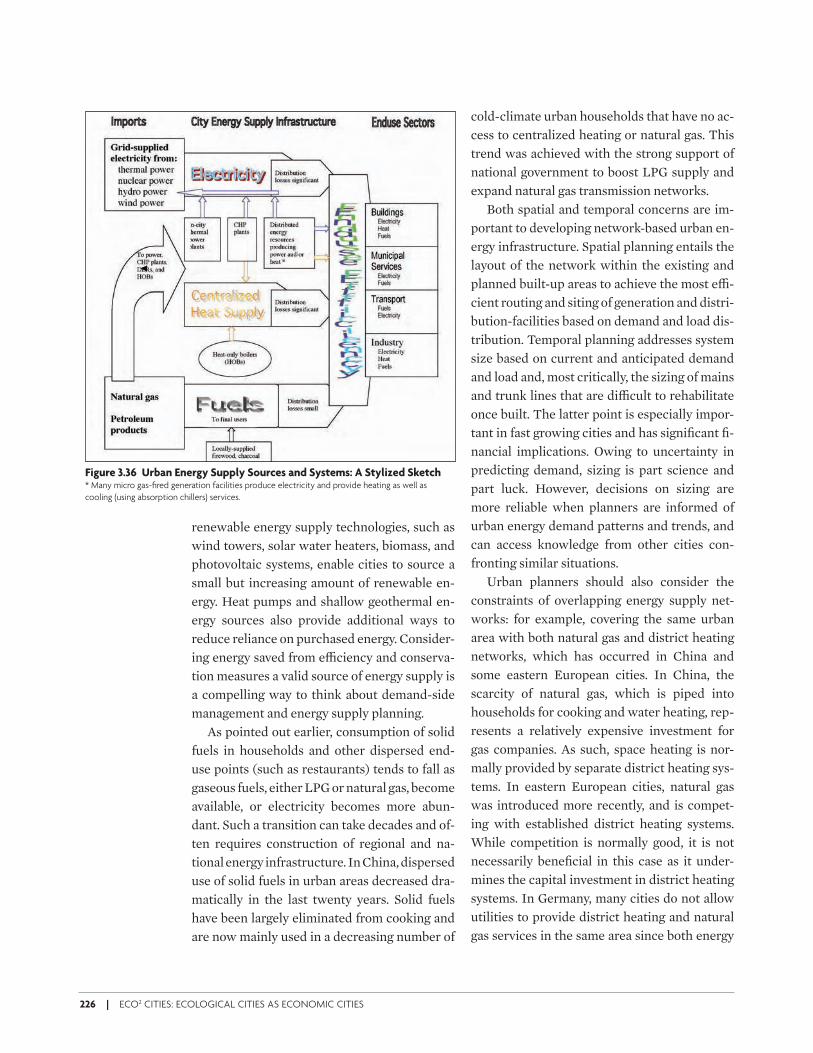
226 | ECO2 CITIES: ECOLOGICAL CITIES AS ECONOMIC CITIES
renewable energy supply technologies, such as wind towers, solar water heaters, biomass, and photovoltaic systems, enable cities to source a small but increasing amount of renewable en-ergy. Heat pumps and shallow geothermal en-ergy sources also provide additional ways to reduce reliance on purchased energy. Consider-ing energy saved from e+ ciency and conserva-tion measures a valid source of energy supply is a compelling way to think about demand-side management and energy supply planning.
As pointed out earlier, consumption of solid fuels in households and other dispersed end-use points (such as restaurants) tends to fall as gaseous fuels, either LPG or natural gas, become available, or electricity becomes more abun-dant. Such a transition can take decades and of-ten requires construction of regional and na-tional energy infrastructure. In China, dispersed use of solid fuels in urban areas decreased dra-matically in the last twenty years. Solid fuels have been largely eliminated from cooking and are now mainly used in a decreasing number of
cold-climate urban households that have no ac-cess to centralized heating or natural gas. This trend was achieved with the strong support of national government to boost LPG supply and expand natural gas transmission networks.
Both spatial and temporal concerns are im-portant to developing network-based urban en-ergy infrastructure. Spatial planning entails the layout of the network within the existing and planned built-up areas to achieve the most e+ -cient routing and siting of generation and distri-bution-facilities based on demand and load dis-tribution. Temporal planning addresses system size based on current and anticipated demand and load and, most critically, the sizing of mains and trunk lines that are di+ cult to rehabilitate once built. The latter point is especially impor-tant in fast growing cities and has signifi cant fi -nancial implications. Owing to uncertainty in predicting demand, sizing is part science and part luck. However, decisions on sizing are more reliable when planners are informed of urban energy demand patterns and trends, and can access knowledge from other cities con-fronting similar situations.
Urban planners should also consider the constraints of overlapping energy supply net-works: for example, covering the same urban area with both natural gas and district heating networks, which has occurred in China and some eastern European cities. In China, the scarcity of natural gas, which is piped into households for cooking and water heating, rep-resents a relatively expensive investment for gas companies. As such, space heating is nor-mally provided by separate district heating sys-tems. In eastern European cities, natural gas was introduced more recently, and is compet-ing with established district heating systems. While competition is normally good, it is not necessarily benefi cial in this case as it under-mines the capital investment in district heating systems. In Germany, many cities do not allow utilities to provide district heating and natural gas services in the same area since both energy
Figure 3.36 Urban Energy Supply Sources and Systems: A Stylized Sketch* Many micro gas-fi red generation facilities produce electricity and provide heating as well as
cooling (using absorption chillers) services.
ECo2-Part3brEV_PREP Sec1:226 6/15/09 9:04:20 AM
A F I E L D R E F E R E N C E G U I D E | 227
carriers provide to a large extent the same ser-vice: space heating (Box 3.5).
The future of urban energy supply still lies in network-based systems, which can facilitate the adoption of distributed energy generation and decentralized renewable power systems if the institutional barriers of traditional electric utili-ty operations are resolved. Thus, urban energy infrastructure investments should focus on de-veloping modern power grids and natural gas networks if long-term gas supplies are secure. In densely populated cold climate cities where nat-ural gas is scarce or unavailable, developing dis-trict heating systems is key to reducing air pollu-tion and improving space heating services. The planning and engineering of specifi c network-based systems (i.e., electric, gas, or heat) have become sophisticated and technologies are still advancing. For urban planners, the real chal-lenge and essential task is to foster the integra-tion and adaptation of network-based energy infrastructure to enhance the e+ ciency of en-ergy supplies and facilitate the uptake of distrib-uted energy resources, and other local low-car-bon energy sources (for example, methane from landfi lls and wastewater treatment plants).
Policies, Legislations, and Regulations
In general, national and regional legislators and governments are responsible for energy sector policies and regulations. Cities have limited in-fl uence on these political and legislative pro-cesses, except on localized energy services that require government interventions, such as dis-trict heating systems. The degree of regulation and government oversight in the energy sector varies by country. In many large economies, the energy sector is subjected to multiple policies and regulations, and is infl uenced by a mix of government institutions for reasons ranging from energy security to market competition to social and environmental concerns. Network-based energy services usually have regulated service charges to respond to social concerns (e.g., unduly high energy costs for the poor) and to protect against monopolistic price gouging. The prices of solid and liquid fuels are also often subjected to government intervention through taxes and subsidies. Energy sector policies and regulations used to be supply-centric, but have changed substantially since the fi rst oil crisis in 1973. Many countries now have regulations and
Energy Planning in the City of Mannheim
(Germany)
To strengthen energy planning, Mannheim was divided
into zones based on the type of energy network. A
municipal-owned utility supplies natural gas, electricity,
and district heating. Electricity is universally supplied.
Space heating is supplied by natural gas, district heating,
or electricity. In areas with high heat loads, district heat-
ing is provided and is the least-cost option. In areas
with medium heat loads, natural gas provides decentral-
ized heating. Areas with low heat demand are supplied
by electricity via off-peak electric heat storage devices.
Large customers such as department stores, hotels, and
offi ce buildings are cooled using absorption chillers
linked to the district heating system.
BOX 3.5
Source: Kalkum, 2008
By avoiding parallel gas and district heating net-
works, least-cost energy provision is achieved. In zones
served by district heating, gas is no longer offered. Elec-
tricity and district heat is produced by a CHP plant in
the city. The same utility operates public transport and
water supplies. In this way, energy demand and produc-
tion can be optimized for the most important needs of
a city.
An important result of Mannheim’s plan was the
conversion to cleaner energies. In 1983, 37 percent of all
residential buildings were heated by coal or oil-fi red
heating units. In 1995, this dropped to less than 10 per-
cent. In addition, SO2 emissions were reduced by about
85 percent, NOx by 40 percent, and CO2 by about 30
percent.
ECo2-Part3brEV_PREP Sec1:227 6/15/09 9:04:20 AM
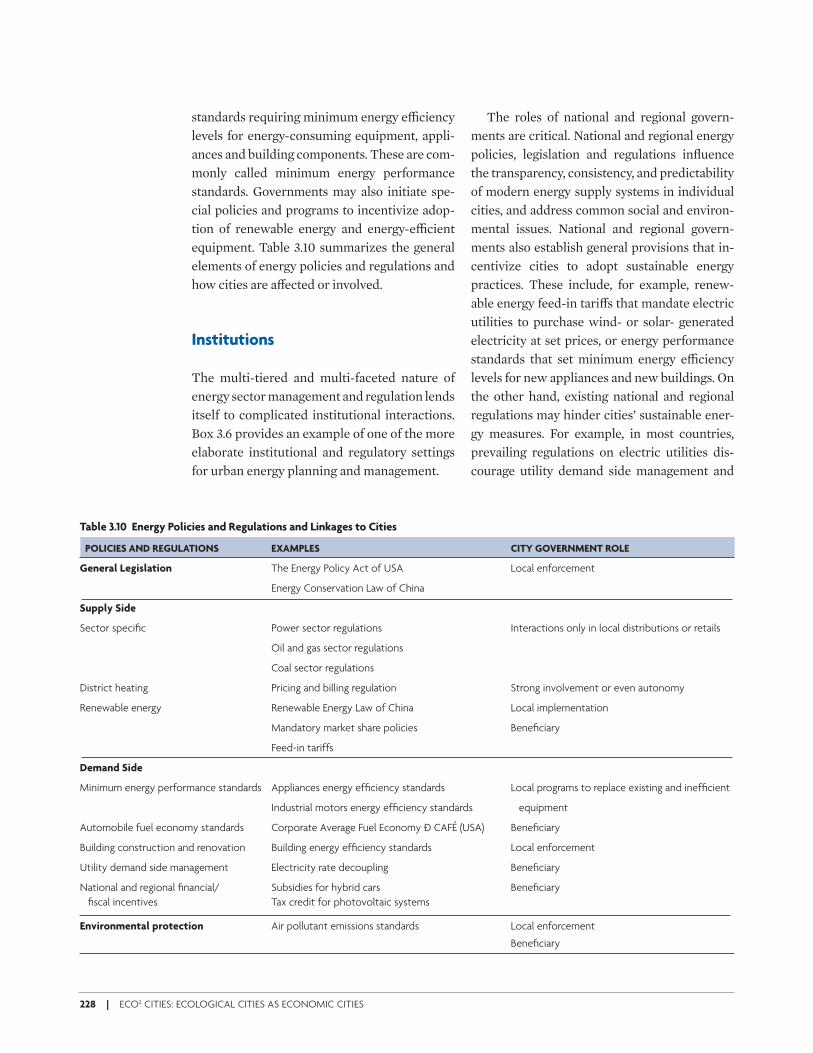
228 | ECO2 CITIES: ECOLOGICAL CITIES AS ECONOMIC CITIES
standards requiring minimum energy e+ ciency levels for energy-consuming equipment, appli-ances and building components. These are com-monly called minimum energy performance standards. Governments may also initiate spe-cial policies and programs to incentivize adop-tion of renewable energy and energy-e+ cient equipment. Table 3.10 summarizes the general elements of energy policies and regulations and how cities are a( ected or involved.
Institutions
The multi-tiered and multi-faceted nature of energy sector management and regulation lends itself to complicated institutional interactions. Box 3.6 provides an example of one of the more elaborate institutional and regulatory settings for urban energy planning and management.
The roles of national and regional govern-ments are critical. National and regional energy policies, legislation and regulations infl uence the transparency, consistency, and predictability of modern energy supply systems in individual cities, and address common social and environ-mental issues. National and regional govern-ments also establish general provisions that in-centivize cities to adopt sustainable energy practices. These include, for example, renew-able energy feed-in tari( s that mandate electric utilities to purchase wind- or solar- generated electricity at set prices, or energy performance standards that set minimum energy e+ ciency levels for new appliances and new buildings. On the other hand, existing national and regional regulations may hinder cities’ sustainable ener-gy measures. For example, in most countries, prevailing regulations on electric utilities dis-courage utility demand side management and
Table 3.10 Energy Policies and Regulations and Linkages to Cities
POLICIES AND REGULATIONS EXAMPLES CITY GOVERNMENT ROLE
General Legislation The Energy Policy Act of USA Local enforcement
Energy Conservation Law of China
Supply Side
Sector specifi c Power sector regulations Interactions only in local distributions or retails
Oil and gas sector regulations
Coal sector regulations
District heating Pricing and billing regulation Strong involvement or even autonomy
Renewable energy Renewable Energy Law of China Local implementation
Mandatory market share policies Benefi ciary
Feed-in tariffs
Demand Side
Minimum energy performance standards Appliances energy effi ciency standards Local programs to replace existing and ineffi cient
Industrial motors energy effi ciency standards equipment
Automobile fuel economy standards Corporate Average Fuel Economy Ð CAFÉ (USA) Benefi ciary
Building construction and renovation Building energy effi ciency standards Local enforcement
Utility demand side management Electricity rate decoupling Benefi ciary
National and regional fi nancial/ Subsidies for hybrid cars Benefi ciary
fi scal incentives Tax credit for photovoltaic systems
Environmental protection Air pollutant emissions standards Local enforcement
Benefi ciary
ECo2-Part3brEV_PREP Sec1:228 6/15/09 9:04:20 AM
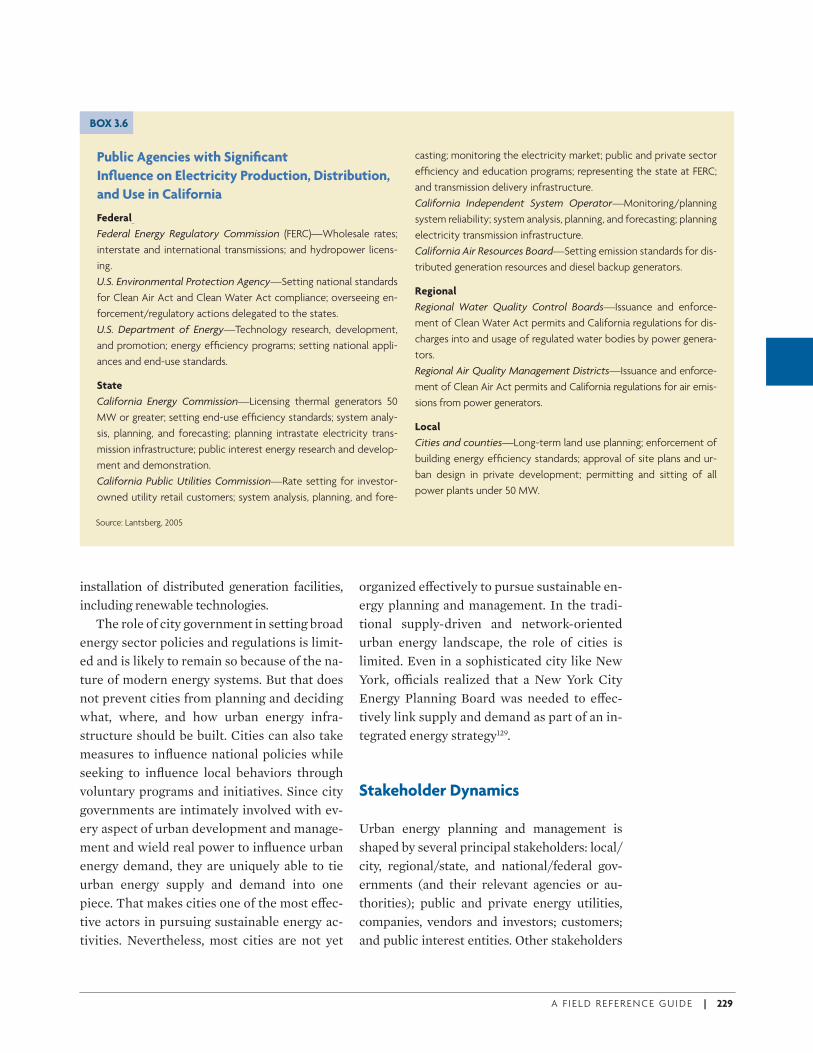
A F I E L D R E F E R E N C E G U I D E | 229
installation of distributed generation facilities, including renewable technologies.
The role of city government in setting broad energy sector policies and regulations is limit-ed and is likely to remain so because of the na-ture of modern energy systems. But that does not prevent cities from planning and deciding what, where, and how urban energy infra-structure should be built. Cities can also take measures to infl uence national policies while seeking to infl uence local behaviors through voluntary programs and initiatives. Since city governments are intimately involved with ev-ery aspect of urban development and manage-ment and wield real power to infl uence urban energy demand, they are uniquely able to tie urban energy supply and demand into one piece. That makes cities one of the most e( ec-tive actors in pursuing sustainable energy ac-tivities. Nevertheless, most cities are not yet
organized e( ectively to pursue sustainable en-ergy planning and management. In the tradi-tional supply-driven and network-oriented urban energy landscape, the role of cities is limited. Even in a sophisticated city like New York, o+ cials realized that a New York City Energy Planning Board was needed to e( ec-tively link supply and demand as part of an in-tegrated energy strategy129.
Stakeholder Dynamics
Urban energy planning and management is shaped by several principal stakeholders: local/city, regional/state, and national/federal gov-ernments (and their relevant agencies or au-thorities); public and private energy utilities, companies, vendors and investors; customers; and public interest entities. Other stakeholders
Public Agencies with Signifi cant
Infl uence on Electricity Production, Distribution,
and Use in California
Federal
Federal Energy Regulatory Commission (FERC)—Wholesale rates;
interstate and international transmissions; and hydropower licens-
ing.
U.S. Environmental Protection Agency—Setting national standards
for Clean Air Act and Clean Water Act compliance; overseeing en-
forcement/regulatory actions delegated to the states.
U.S. Department of Energy—Technology research, development,
and promotion; energy effi ciency programs; setting national appli-
ances and end-use standards.
State
California Energy Commission—Licensing thermal generators 50
MW or greater; setting end-use effi ciency standards; system analy-
sis, planning, and forecasting; planning intrastate electricity trans-
mission infrastructure; public interest energy research and develop-
ment and demonstration.
California Public Utilities Commission—Rate setting for investor-
owned utility retail customers; system analysis, planning, and fore-
BOX 3.6
casting; monitoring the electricity market; public and private sector
effi ciency and education programs; representing the state at FERC;
and transmission delivery infrastructure.
California Independent System Operator—Monitoring/planning
system reliability; system analysis, planning, and forecasting; planning
electricity transmission infrastructure.
California Air Resources Board—Setting emission standards for dis-
tributed generation resources and diesel backup generators.
Regional
Regional Water Quality Control Boards—Issuance and enforce-
ment of Clean Water Act permits and California regulations for dis-
charges into and usage of regulated water bodies by power genera-
tors.
Regional Air Quality Management Districts—Issuance and enforce-
ment of Clean Air Act permits and California regulations for air emis-
sions from power generators.
Local
Cities and counties—Long-term land use planning; enforcement of
building energy effi ciency standards; approval of site plans and ur-
ban design in private development; permitting and sitting of all
power plants under 50 MW.
Source: Lantsberg, 2005
ECo2-Part3brEV_PREP Sec1:229 6/15/09 9:04:20 AM
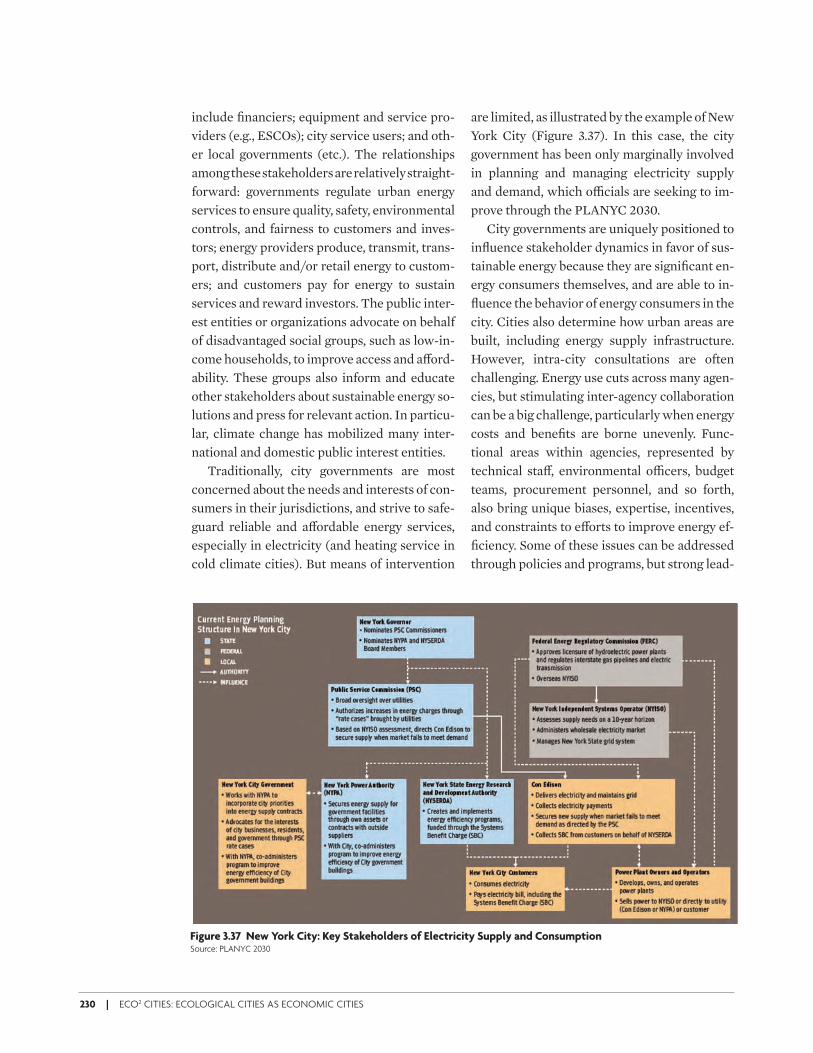
230 | ECO2 CITIES: ECOLOGICAL CITIES AS ECONOMIC CITIES
include fi nanciers; equipment and service pro-viders (e.g., ESCOs); city service users; and oth-er local governments (etc.). The relationships among these stakeholders are relatively straight-forward: governments regulate urban energy services to ensure quality, safety, environmental controls, and fairness to customers and inves-tors; energy providers produce, transmit, trans-port, distribute and/or retail energy to custom-ers; and customers pay for energy to sustain services and reward investors. The public inter-est entities or organizations advocate on behalf of disadvantaged social groups, such as low-in-come households, to improve access and a( ord-ability. These groups also inform and educate other stakeholders about sustainable energy so-lutions and press for relevant action. In particu-lar, climate change has mobilized many inter-national and domestic public interest entities.
Traditionally, city governments are most concerned about the needs and interests of con-sumers in their jurisdictions, and strive to safe-guard reliable and a( ordable energy services, especially in electricity (and heating service in cold climate cities). But means of intervention
are limited, as illustrated by the example of New York City (Figure 3.37). In this case, the city government has been only marginally involved in planning and managing electricity supply and demand, which o+ cials are seeking to im-prove through the PLANYC 2030.
City governments are uniquely positioned to infl uence stakeholder dynamics in favor of sus-tainable energy because they are signifi cant en-ergy consumers themselves, and are able to in-fl uence the behavior of energy consumers in the city. Cities also determine how urban areas are built, including energy supply infrastructure. However, intra-city consultations are often challenging. Energy use cuts across many agen-cies, but stimulating inter-agency collaboration can be a big challenge, particularly when energy costs and benefi ts are borne unevenly. Func-tional areas within agencies, represented by technical sta( , environmental o+ cers, budget teams, procurement personnel, and so forth, also bring unique biases, expertise, incentives, and constraints to e( orts to improve energy ef-fi ciency. Some of these issues can be addressed through policies and programs, but strong lead-
Figure 3.37 New York City: Key Stakeholders of Electricity Supply and ConsumptionSource: PLANYC 2030
ECo2-Part3brEV_PREP Sec1:230 6/15/09 9:04:21 AM
A F I E L D R E F E R E N C E G U I D E | 231
ership from the mayor’s o+ ce is often needed to compel parties to work together.
Economic, Financial, Social, and Environmental Aspects
Sustainable urban energy planning and prac-tices should be economically justifi able, fi nan-cially viable, socially equitable, and environ-mentally sensible. These considerations form the basis for cities to properly select and design sustainable energy actions.
Economic justifi cation requires cities to clearly and consistently account for and evaluate the costs and benefi ts of alternative urban energy solutions to facilitate robust comparisons. This is often challenging as it is di+ cult to value en-vironmental externalities, such as health ben-efi ts or hazards. A critical aspect of economic analysis is to calculate the lifecycle cost of al-ternative energy solutions. Many sustainable energy actions, especially energy e+ ciency measures, have lower lifecycle costs than busi-ness-as-usual alternatives. The Melbourne Council House 2 (Australia), for example, re-duced use of electricity by 82 percent, gas by 87 percent, water by 72 percent and corre-sponding CO2 emissions by 87 percent, with a fi nancial payback period of about 10 years.130 Though the commercial sector normally con-siders projects viable with payback periods of less than fi ve years, city governments tend to have longer investment horizons, since their built environment lasts for decades. Other sus-tainable energy options may have longer pay-back periods but may yield harder-to-quantify benefi ts, such as local investments, job cre-ation, improved competitiveness and enhanced quality of life (e.g., reduced commuting times, improved air quality and health, and more green and community space).
Financial viability requires city actors to be able to obtain su+ cient funds to implement sustain-able energy solutions, sustain outcomes, and
maintain a positive return on investment under prevailing and projected fi nancial cash fl ows. To acquire and sustain modern energy services (e.g., electricity, natural gas, or district heating), prices need to ensure cost-recovery. For energy e+ ciency measures to be viable, saved energy has to be as reliable as and cheaper than con-ventional supply options. In other words, a via-ble sustainable energy solution has to be a viable business proposition. As market valuations of-ten fail to account for environmental externali-ties, some renewable energy solutions, such as wind electricity and solar photovoltaic systems, may still need government subsidies or regula-tions (feed-in tari( s) to be viable. The recent expansion of carbon fi nancing markets should improve the fi nancial attractiveness of sustain-able energy investments by providing a new and sometimes more secure revenue stream for such projects. But many fi nancially viable en-ergy e+ ciency opportunities remain unimple-mented due to various market barriers.131
As shown in Table 3.11, the investments most likely to be undertaken will be partly driven by economic considerations. In this context, strong analytical work can identify short- to medium-term payback measures that a city may wish to pursue. The key challenge is developing the best overall package of investments that is be-low an acceptable payback or other investment threshold. Access to special funding, such as concessional donor funds or carbon fi nance revenues, can increase overall returns while maximizing the measures in the investment package.
Social equity requires cities to address access and a( ordability for the poor. Artifi cially sup-pressing energy prices or providing universal subsidies are not the right ways to approach these challenges. Instead, the city government should target subsidies only to those who can-not a( ord to pay, with others paying full cost-recovery prices for energy services. Social eq-uity also means that cities should link sustainable energy actions with energy equity objectives. A
ECo2-Part3brEV_PREP Sec1:231 6/15/09 9:04:21 AM
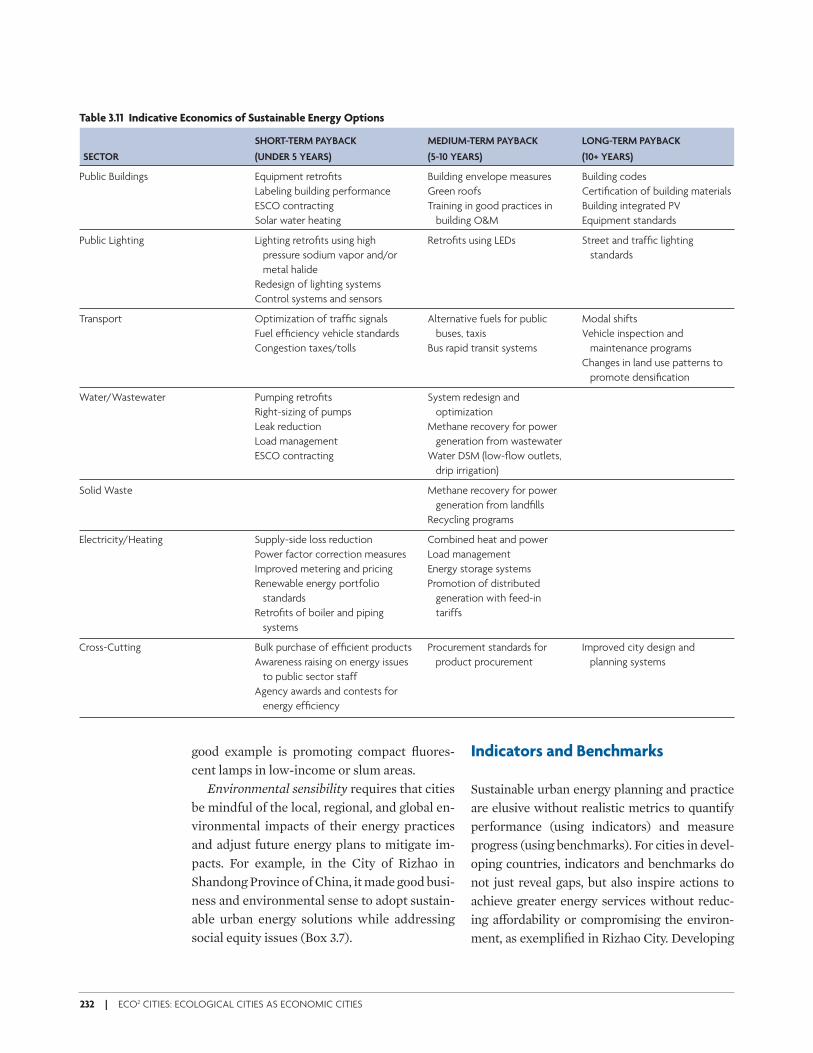
232 | ECO2 CITIES: ECOLOGICAL CITIES AS ECONOMIC CITIES
good example is promoting compact fl uores-cent lamps in low-income or slum areas.
Environmental sensibility requires that cities be mindful of the local, regional, and global en-vironmental impacts of their energy practices and adjust future energy plans to mitigate im-pacts. For example, in the City of Rizhao in Shandong Province of China, it made good busi-ness and environmental sense to adopt sustain-able urban energy solutions while addressing social equity issues (Box 3.7).
Indicators and Benchmarks
Sustainable urban energy planning and practice are elusive without realistic metrics to quantify performance (using indicators) and measure progress (using benchmarks). For cities in devel-oping countries, indicators and benchmarks do not just reveal gaps, but also inspire actions to achieve greater energy services without reduc-ing a( ordability or compromising the environ-ment, as exemplifi ed in Rizhao City. Developing
Table 3.11 Indicative Economics of Sustainable Energy Options
SHORT-TERM PAYBACK MEDIUM-TERM PAYBACK LONG-TERM PAYBACK
SECTOR (UNDER 5 YEARS) (5-10 YEARS) (10+ YEARS)
Public Buildings Equipment retrofi ts Building envelope measures Building codes
Labeling building performance Green roofs Certifi cation of building materials
ESCO contracting Training in good practices in Building integrated PV
Solar water heating building O&M Equipment standards
Public Lighting Lighting retrofi ts using high Retrofi ts using LEDs Street and traffi c lighting
pressure sodium vapor and/or standards
metal halide
Redesign of lighting systems
Control systems and sensors
Transport Optimization of traffi c signals Alternative fuels for public Modal shifts
Fuel effi ciency vehicle standards buses, taxis Vehicle inspection and
Congestion taxes/tolls Bus rapid transit systems maintenance programs
Changes in land use patterns to
promote densifi cation
Water/Wastewater Pumping retrofi ts System redesign and
Right-sizing of pumps optimization
Leak reduction Methane recovery for power
Load management generation from wastewater
ESCO contracting Water DSM (low-fl ow outlets,
drip irrigation)
Solid Waste Methane recovery for power
generation from landfi lls
Recycling programs
Electricity/Heating Supply-side loss reduction Combined heat and power
Power factor correction measures Load management
Improved metering and pricing Energy storage systems
Renewable energy portfolio Promotion of distributed
standards generation with feed-in
Retrofi ts of boiler and piping tariffs
systems
Cross-Cutting Bulk purchase of effi cient products Procurement standards for Improved city design and
Awareness raising on energy issues product procurement planning systems
to public sector staff
Agency awards and contests for
energy effi ciency
ECo2-Part3brEV_PREP Sec1:232 6/15/09 9:04:22 AM
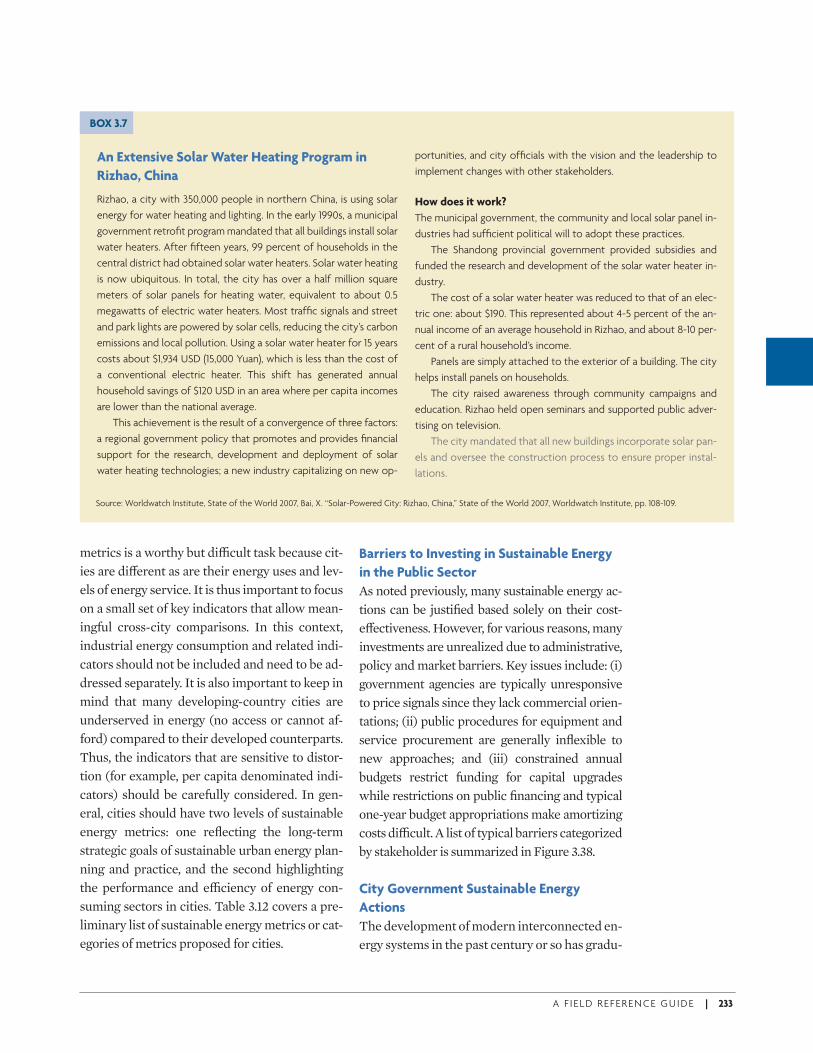
A F I E L D R E F E R E N C E G U I D E | 233
metrics is a worthy but di+ cult task because cit-ies are di( erent as are their energy uses and lev-els of energy service. It is thus important to focus on a small set of key indicators that allow mean-ingful cross-city comparisons. In this context, industrial energy consumption and related indi-cators should not be included and need to be ad-dressed separately. It is also important to keep in mind that many developing-country cities are underserved in energy (no access or cannot af-ford) compared to their developed counterparts. Thus, the indicators that are sensitive to distor-tion (for example, per capita denominated indi-cators) should be carefully considered. In gen-eral, cities should have two levels of sustainable energy metrics: one refl ecting the long-term strategic goals of sustainable urban energy plan-ning and practice, and the second highlighting the performance and e+ ciency of energy con-suming sectors in cities. Table 3.12 covers a pre-liminary list of sustainable energy metrics or cat-egories of metrics proposed for cities.
Barriers to Investing in Sustainable Energy
in the Public Sector
As noted previously, many sustainable energy ac-tions can be justifi ed based solely on their cost-e( ectiveness. However, for various reasons, many investments are unrealized due to administrative, policy and market barriers. Key issues include: (i) government agencies are typically unresponsive to price signals since they lack commercial orien-tations; (ii) public procedures for equipment and service procurement are generally infl exible to new approaches; and (iii) constrained annual budgets restrict funding for capital upgrades while restrictions on public fi nancing and typical one-year budget appropriations make amortizing costs di+ cult. A list of typical barriers categorized by stakeholder is summarized in Figure 3.38.
City Government Sustainable Energy
Actions
The development of modern interconnected en-ergy systems in the past century or so has gradu-
An Extensive Solar Water Heating Program in
Rizhao, China
Rizhao, a city with 350,000 people in northern China, is using solar
energy for water heating and lighting. In the early 1990s, a municipal
government retrofi t program mandated that all buildings install solar
water heaters. After fi fteen years, 99 percent of households in the
central district had obtained solar water heaters. Solar water heating
is now ubiquitous. In total, the city has over a half million square
meters of solar panels for heating water, equivalent to about 0.5
megawatts of electric water heaters. Most traffi c signals and street
and park lights are powered by solar cells, reducing the city’s carbon
emissions and local pollution. Using a solar water heater for 15 years
costs about $1,934 USD (15,000 Yuan), which is less than the cost of
a conventional electric heater. This shift has generated annual
household savings of $120 USD in an area where per capita incomes
are lower than the national average.
This achievement is the result of a convergence of three factors:
a regional government policy that promotes and provides fi nancial
support for the research, development and deployment of solar
water heating technologies; a new industry capitalizing on new op-
BOX 3.7
portunities, and city offi cials with the vision and the leadership to
implement changes with other stakeholders.
How does it work?
The municipal government, the community and local solar panel in-
dustries had suffi cient political will to adopt these practices.
The Shandong provincial government provided subsidies and
funded the research and development of the solar water heater in-
dustry.
The cost of a solar water heater was reduced to that of an elec-
tric one: about $190. This represented about 4-5 percent of the an-
nual income of an average household in Rizhao, and about 8-10 per-
cent of a rural household’s income.
Panels are simply attached to the exterior of a building. The city
helps install panels on households.
The city raised awareness through community campaigns and
education. Rizhao held open seminars and supported public adver-
tising on television.
The city mandated that all new buildings incorporate solar pan-
els and oversee the construction process to ensure proper instal-
lations.
Source: Worldwatch Institute, State of the World 2007, Bai, X. “Solar-Powered City: Rizhao, China,” State of the World 2007, Worldwatch Institute, pp. 108-109.
ECo2-Part3brEV_PREP Sec1:233 6/15/09 9:04:22 AM
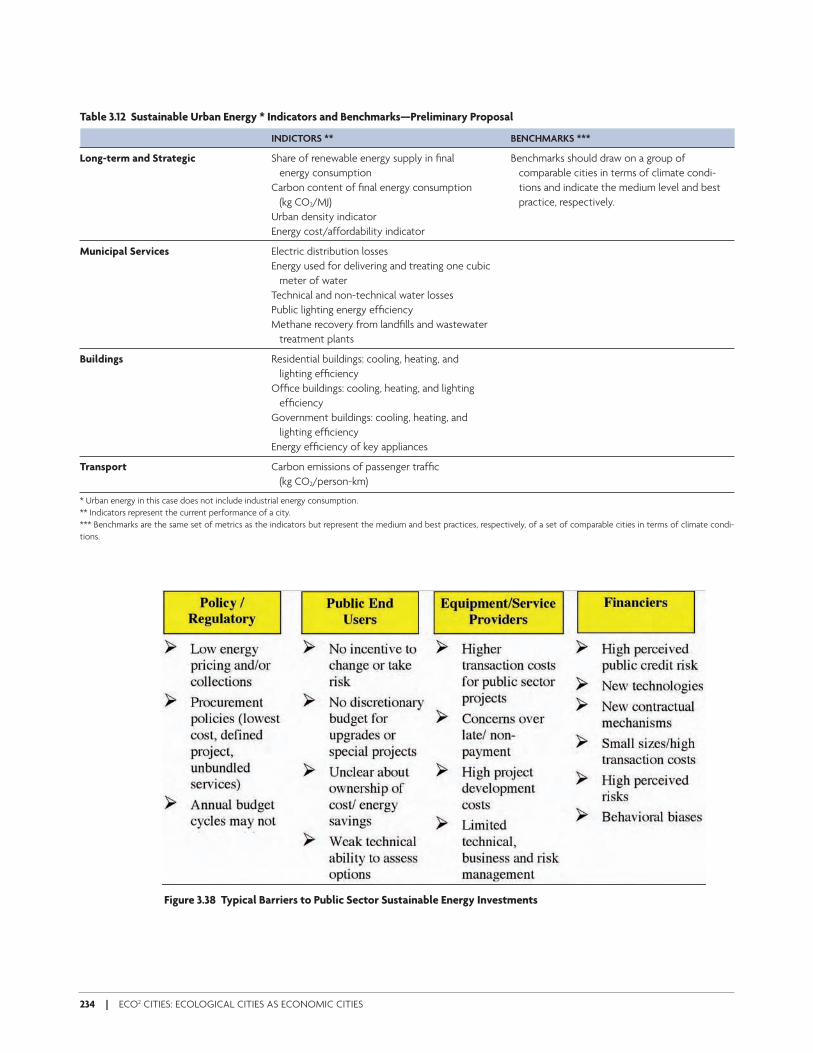
234 | ECO2 CITIES: ECOLOGICAL CITIES AS ECONOMIC CITIES
Table 3.12 Sustainable Urban Energy * Indicators and Benchmarks—Preliminary Proposal
INDICTORS ** BENCHMARKS ***
Long-term and Strategic Share of renewable energy supply in fi nal Benchmarks should draw on a group of
energy consumption comparable cities in terms of climate condi-
Carbon content of fi nal energy consumption tions and indicate the medium level and best
(kg CO2/MJ) practice, respectively.
Urban density indicator
Energy cost/affordability indicator
Municipal Services Electric distribution losses
Energy used for delivering and treating one cubic
meter of water
Technical and non-technical water losses
Public lighting energy effi ciency
Methane recovery from landfi lls and wastewater
treatment plants
Buildings Residential buildings: cooling, heating, and
lighting effi ciency
Offi ce buildings: cooling, heating, and lighting
effi ciency
Government buildings: cooling, heating, and
lighting effi ciency
Energy effi ciency of key appliances
Transport Carbon emissions of passenger traffi c
(kg CO2/person-km)
* Urban energy in this case does not include industrial energy consumption.
** Indicators represent the current performance of a city.
*** Benchmarks are the same set of metrics as the indicators but represent the medium and best practices, respectively, of a set of comparable cities in terms of climate condi-
tions.
Figure 3.38 Typical Barriers to Public Sector Sustainable Energy Investments
ECo2-Part3brEV_PREP Sec1:234 6/15/09 9:04:22 AM
A F I E L D R E F E R E N C E G U I D E | 235
ally reduced the capacity of cities to understand and plan for their energy needs. Cities have be-come passive participants in the urban energy agenda, leaving most responsibilities to regional and national governments and the private sec-tor. To pursue a sustainable urban energy agen-da, cities need to become more assertive and in-volved in decisions that a( ect energy demand and supply options. City governments need to become stronger partners of regional and na-tional governments, and guide and mobilize pri-vate sector participation. Most importantly, cit-ies need to act within their own authority to implement sustainable energy solutions. Cities can be e( ective in three areas of actions dis-cussed below.
Energy Effi ciency and Renewable Energy Solutions in the Public Sector
Energy costs often constitute a signifi cant por-tion of the operational budget of city govern-ments. In the State of California, energy is the second largest expenditure item in city govern-ment operations, after employee salaries and benefi ts132. The share of public sector consump-tion is particularly high in electricity and heat-ing. Nine percent of Brazil’s electricity is used by the public sector. 20 percent of Eastern Eu-rope’s electricity and heating loads are attrib-uted to public agencies, and about 10 percent of the European Union’s electricity and heating demand comes from the public sector.133 As a fi rst step, city governments should consider ini-tiating sustainable energy solutions within city boundaries, as this can produce rapid benefi ts and is easier to implement. Common targets for improvements include: government owned buildings and facilities, water supply and waste-water treatment, public lighting/tra+ c lights, and municipal services, such as solid waste management, public transport, and, in cold cli-mates, district heating.134
Government owned buildings and facilities.
Buildings consume about one third of global en-ergy and present signifi cant potential for energy savings. Government buildings, particularly those in developing countries, tend to be older and use more ine+ cient equipment, further un-derlining the potential for energy e+ ciency gains. Measures to realize gains can focus on building envelopes (windows, insulation), elec-trical appliances (lighting, pumping, and heat-ing and cooling) and o+ ce equipment (comput-ers, copiers, and printers). Though measures are benefi cial, public facilities often have rigid procurement practices that focus heavily on costs and lack discretionary budgets from which to make meaningful improvements. In addition, principal-agent relationships or split-incentives complicate investments. For example, a parent budget agency may determine a subsidiary’s capital budget and even specify equipment, de-spite the subordinate agency’s responsibility for paying monthly energy bills.
Energy e+ ciency programs often initially support relatively low cost and modulated mea-sures, such as lighting retrofi ts, or replacement of old equipment, such as Heating, Ventilation, and Air Conditioning (HVAC) systems. In pub-lic building complexes, such as city halls, schools, and hospitals, a whole-building ap-proach may be needed to achieve cost-e( ective control of the energy budget (annual energy consumption) of a building. Moreover, build-ings are complex energy systems and tradeo( s are often made to optimize energy-e+ ciency. For example, planners must evaluate the e+ -ciency of an HVAC system against the thermal pass-through of a building envelope, as either option reduces the e( ectiveness of the other. For new government buildings, adopting best practice in sustainable design and construction reduces lifecycle costs of buildings and serves as an example for the private sector. A compre-hensive analysis of the fi nancial costs and ben-efi ts of LEED135 certifi ed o+ ce and school buildings in the US found that a minimal up-
ECo2-Part3brEV_PREP Sec1:235 6/15/09 9:04:23 AM
236 | ECO2 CITIES: ECOLOGICAL CITIES AS ECONOMIC CITIES
front investment of about 2 percent of con-struction costs typically yields (20-year) life-cycle savings of over ten times the initial investment136.
Recently, some governments in developing countries have experimented with retrofi tting multiple municipal facilities under common authority. Though this can be more complex, it can substantially reduce transaction costs and allow for scaled-up investments. In Hungary, for example, the Ministry of Education issued a tender in 2006 for a single consortia to fi nance and retrofi t all the schools in the country under an ESCO contract. The International Finance Corporation provided a portfolio credit guaran-tee to the winning bidder for up to US$250 mil-lion. To date, about US$22 million has been in-vested in about 200 projects.
Water supply and wastewater treatment. The operation of water and wastewater systems is often the largest outlay in municipal energy budgets. For example, Californian cities spend over 50 percent of their energy budgets on water and wastewater pumping137. Estimates suggest that 2-3 percent of the world’s energy consump-tion is devoted to pumping and treating water, and that potential exists for related energy sav-ings of more than 25 percent. In many cities, en-ergy and water are scarce resources, and cities often introduce e+ ciency programs to save en-ergy and water simultaneously in light of link-ages between these sectors. In developing coun-tries, water and wastewater systems often have poor designs, employ outdated equipment, and su( er from high non-metered water losses ow-ing to inadequate investment and know-how. Many systems operate without adequate com-mercial incentives to be e+ cient. In light of these obstacles, the Alliance to Save Energy launched a new program called “Watergy” that demonstrates the signifi cant benefi ts of increas-ing clean water access by reducing energy costs and water losses.138 In Fortaleza in northeast Brazil, the Alliance to Save Energy worked with
its local utility, the Companhia de Água e Esgoto do Ceara (CAGECE), to develop and implement measures to improve water distribution and access to sanitation services, while reducing op-erational costs and environmental impacts. CAGECE invested about R$3 million (about US$1.1 million) in various activities such as in-stallation of an automatic control system. The utility saved 88GWh and US$2.5 million over four years. More importantly, the utility estab-lished an additional 88,000 new connections while decreasing overall energy costs.
E( orts to improve energy e+ ciency should consider both supply- and demand-side mea-sures and relevant linkages. For example, as wa-ter leakage and waste is reduced, additional ef-fi ciency gains might be realized by downsizing pumping stations. Other measures should also be considered to boost e+ ciency, such as system redesign, pressure management, pump impeller reduction, installation of low-friction pipes and variable speed pumps, load management, power factor improvements, improved maintenance procedures, improved metering and water recy-cling. Wastewater treatment plants might also be made more e+ cient by recovering waste heat, capturing methane for power generation, and improved pumping systems.
Many cities in developing countries have pressing needs to expand water supply and wastewater treatment capacities. Reclamation of runo( water and onsite treatment of domes-tic wastewater are increasingly prevalent in new real estate development projects. Such practices, if properly confi gured within urban water and wastewater networks, can enhance overall energy e+ ciency while relieving pres-sure on scarce freshwater resources.
Public lighting. Public lighting is often consid-ered an essential public service that enhances economic activity and improves the quality of life (e.g., by reducing crime and vehicular acci-dents). Street lights can be provided more e( ec-tively and extensively by using energy-e+ cient
ECo2-Part3brEV_PREP Sec1:236 6/15/09 9:04:23 AM
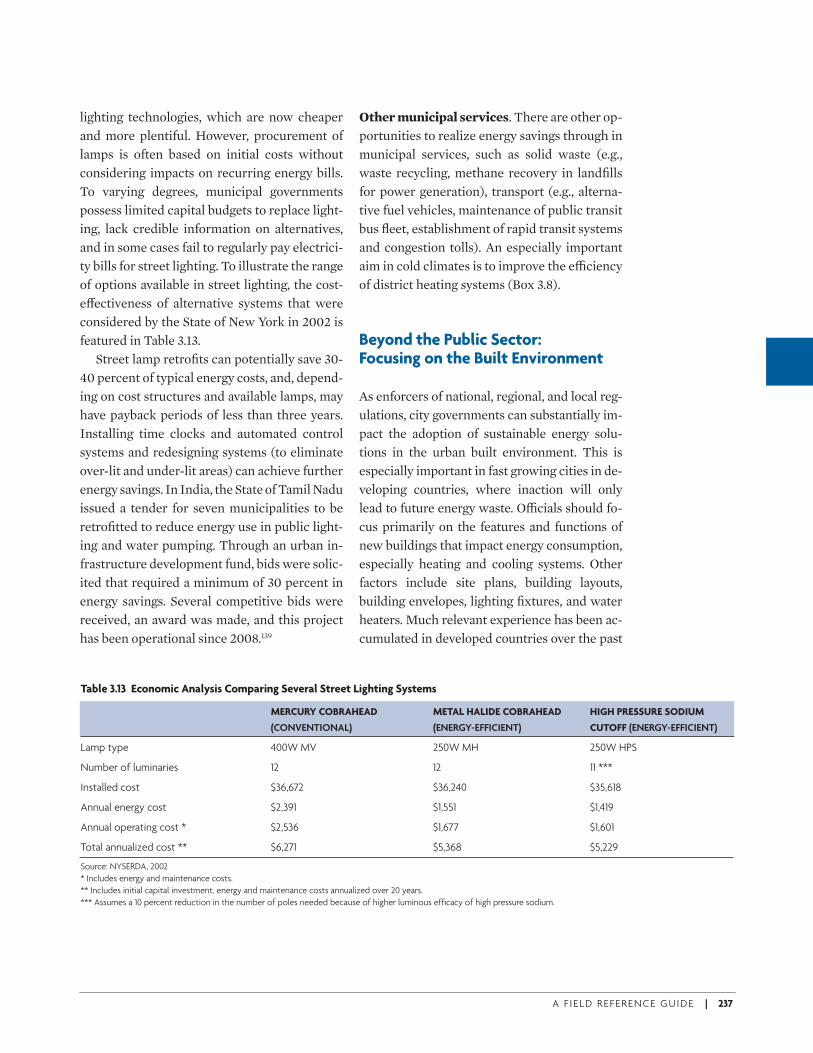
A F I E L D R E F E R E N C E G U I D E | 237
lighting technologies, which are now cheaper and more plentiful. However, procurement of lamps is often based on initial costs without considering impacts on recurring energy bills. To varying degrees, municipal governments possess limited capital budgets to replace light-ing, lack credible information on alternatives, and in some cases fail to regularly pay electrici-ty bills for street lighting. To illustrate the range of options available in street lighting, the cost-e( ectiveness of alternative systems that were considered by the State of New York in 2002 is featured in Table 3.13.
Street lamp retrofi ts can potentially save 30-40 percent of typical energy costs, and, depend-ing on cost structures and available lamps, may have payback periods of less than three years. Installing time clocks and automated control systems and redesigning systems (to eliminate over-lit and under-lit areas) can achieve further energy savings. In India, the State of Tamil Nadu issued a tender for seven municipalities to be retrofi tted to reduce energy use in public light-ing and water pumping. Through an urban in-frastructure development fund, bids were solic-ited that required a minimum of 30 percent in energy savings. Several competitive bids were received, an award was made, and this project has been operational since 2008.139
Other municipal services. There are other op-portunities to realize energy savings through in municipal services, such as solid waste (e.g., waste recycling, methane recovery in landfi lls for power generation), transport (e.g., alterna-tive fuel vehicles, maintenance of public transit bus fl eet, establishment of rapid transit systems and congestion tolls). An especially important aim in cold climates is to improve the e+ ciency of district heating systems (Box 3.8).
Beyond the Public Sector: Focusing on the Built Environment
As enforcers of national, regional, and local reg-ulations, city governments can substantially im-pact the adoption of sustainable energy solu-tions in the urban built environment. This is especially important in fast growing cities in de-veloping countries, where inaction will only lead to future energy waste. O+ cials should fo-cus primarily on the features and functions of new buildings that impact energy consumption, especially heating and cooling systems. Other factors include site plans, building layouts, building envelopes, lighting fi xtures, and water heaters. Much relevant experience has been ac-cumulated in developed countries over the past
Table 3.13 Economic Analysis Comparing Several Street Lighting Systems
MERCURY COBRAHEAD METAL HALIDE COBRAHEAD HIGH PRESSURE SODIUM
(CONVENTIONAL) (ENERGY-EFFICIENT) CUTOFF (ENERGY-EFFICIENT)
Lamp type 400W MV 250W MH 250W HPS
Number of luminaries 12 12 11 ***
Installed cost $36,672 $36,240 $35,618
Annual energy cost $2,391 $1,551 $1,419
Annual operating cost * $2,536 $1,677 $1,601
Total annualized cost ** $6,271 $5,368 $5,229
Source: NYSERDA, 2002
* Includes energy and maintenance costs.
** Includes initial capital investment, energy and maintenance costs annualized over 20 years.
*** Assumes a 10 percent reduction in the number of poles needed because of higher luminous effi cacy of high pressure sodium.
ECo2-Part3brEV_PREP Sec1:237 6/15/09 9:04:23 AM
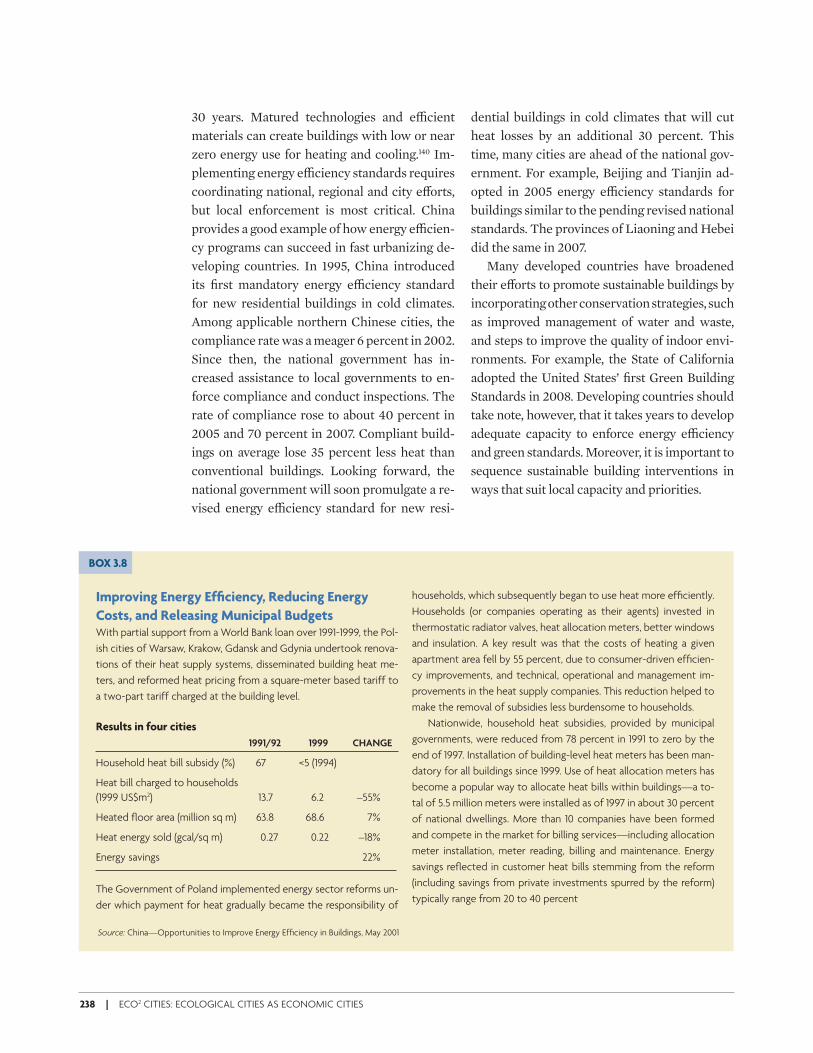
238 | ECO2 CITIES: ECOLOGICAL CITIES AS ECONOMIC CITIES
30 years. Matured technologies and e+ cient materials can create buildings with low or near zero energy use for heating and cooling.140 Im-plementing energy e+ ciency standards requires coordinating national, regional and city e( orts, but local enforcement is most critical. China provides a good example of how energy e+ cien-cy programs can succeed in fast urbanizing de-veloping countries. In 1995, China introduced its fi rst mandatory energy e+ ciency standard for new residential buildings in cold climates. Among applicable northern Chinese cities, the compliance rate was a meager 6 percent in 2002. Since then, the national government has in-creased assistance to local governments to en-force compliance and conduct inspections. The rate of compliance rose to about 40 percent in 2005 and 70 percent in 2007. Compliant build-ings on average lose 35 percent less heat than conventional buildings. Looking forward, the national government will soon promulgate a re-vised energy e+ ciency standard for new resi-
dential buildings in cold climates that will cut heat losses by an additional 30 percent. This time, many cities are ahead of the national gov-ernment. For example, Beijing and Tianjin ad-opted in 2005 energy e+ ciency standards for buildings similar to the pending revised national standards. The provinces of Liaoning and Hebei did the same in 2007.
Many developed countries have broadened their e( orts to promote sustainable buildings by incorporating other conservation strategies, such as improved management of water and waste, and steps to improve the quality of indoor envi-ronments. For example, the State of California adopted the United States’ fi rst Green Building Standards in 2008. Developing countries should take note, however, that it takes years to develop adequate capacity to enforce energy e+ ciency and green standards. Moreover, it is important to sequence sustainable building interventions in ways that suit local capacity and priorities.
Improving Energy Effi ciency, Reducing Energy
Costs, and Releasing Municipal BudgetsWith partial support from a World Bank loan over 1991-1999, the Pol-
ish cities of Warsaw, Krakow, Gdansk and Gdynia undertook renova-
tions of their heat supply systems, disseminated building heat me-
ters, and reformed heat pricing from a square-meter based tariff to
a two-part tariff charged at the building level.
Results in four cities
1991/92 1999 CHANGE
Household heat bill subsidy (%) 67 <5 (1994)
Heat bill charged to households
(1999 US$m2) 13.7 6.2 –55%
Heated fl oor area (million sq m) 63.8 68.6 7%
Heat energy sold (gcal/sq m) 0.27 0.22 –18%
Energy savings 22%
The Government of Poland implemented energy sector reforms un-
der which payment for heat gradually became the responsibility of
households, which subsequently began to use heat more effi ciently.
Households (or companies operating as their agents) invested in
thermostatic radiator valves, heat allocation meters, better windows
and insulation. A key result was that the costs of heating a given
apartment area fell by 55 percent, due to consumer-driven effi cien-
cy improvements, and technical, operational and management im-
provements in the heat supply companies. This reduction helped to
make the removal of subsidies less burdensome to households.
Nationwide, household heat subsidies, provided by municipal
governments, were reduced from 78 percent in 1991 to zero by the
end of 1997. Installation of building-level heat meters has been man-
datory for all buildings since 1999. Use of heat allocation meters has
become a popular way to allocate heat bills within buildings—a to-
tal of 5.5 million meters were installed as of 1997 in about 30 percent
of national dwellings. More than 10 companies have been formed
and compete in the market for billing services—including allocation
meter installation, meter reading, billing and maintenance. Energy
savings refl ected in customer heat bills stemming from the reform
(including savings from private investments spurred by the reform)
typically range from 20 to 40 percent
BOX 3.8
Source: China—Opportunities to Improve Energy Effi ciency in Buildings, May 2001
ECo2-Part3brEV_PREP Sec1:238 6/15/09 9:04:23 AM
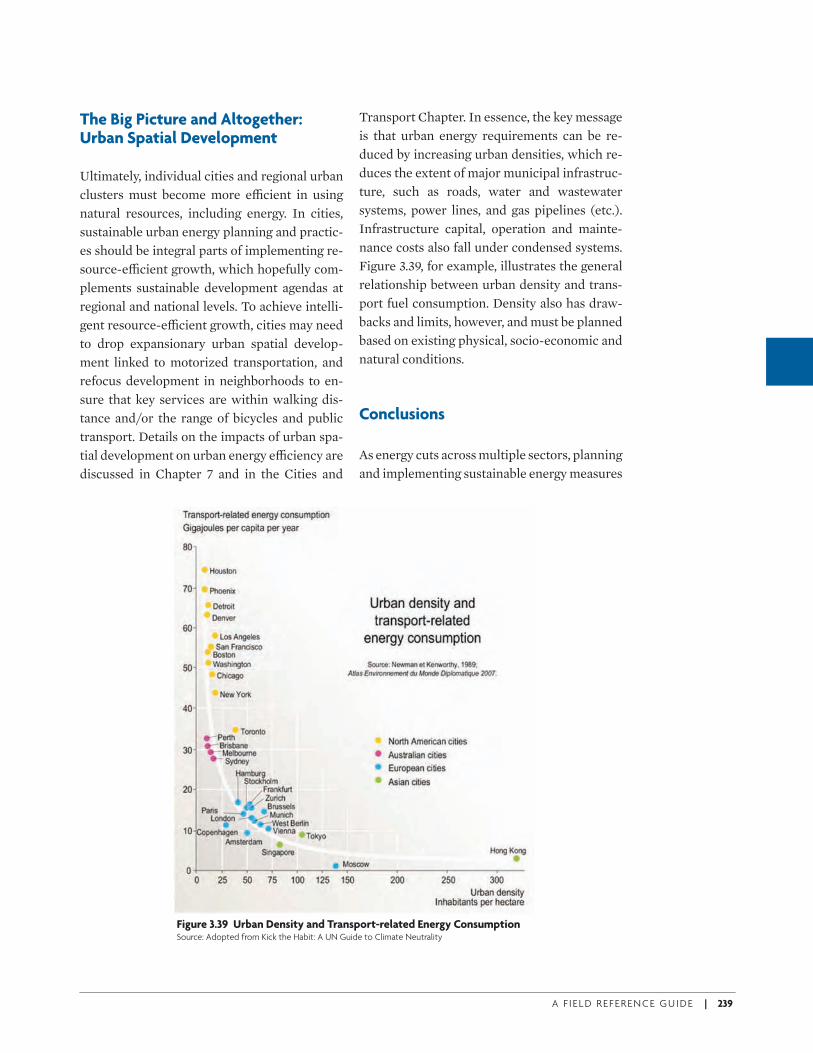
A F I E L D R E F E R E N C E G U I D E | 239
The Big Picture and Altogether: Urban Spatial Development
Ultimately, individual cities and regional urban clusters must become more e+ cient in using natural resources, including energy. In cities, sustainable urban energy planning and practic-es should be integral parts of implementing re-source-e+ cient growth, which hopefully com-plements sustainable development agendas at regional and national levels. To achieve intelli-gent resource-e+ cient growth, cities may need to drop expansionary urban spatial develop-ment linked to motorized transportation, and refocus development in neighborhoods to en-sure that key services are within walking dis-tance and/or the range of bicycles and public transport. Details on the impacts of urban spa-tial development on urban energy e+ ciency are discussed in Chapter 7 and in the Cities and
Transport Chapter. In essence, the key message is that urban energy requirements can be re-duced by increasing urban densities, which re-duces the extent of major municipal infrastruc-ture, such as roads, water and wastewater systems, power lines, and gas pipelines (etc.). Infrastructure capital, operation and mainte-nance costs also fall under condensed systems. Figure 3.39, for example, illustrates the general relationship between urban density and trans-port fuel consumption. Density also has draw-backs and limits, however, and must be planned based on existing physical, socio-economic and natural conditions.
Conclusions
As energy cuts across multiple sectors, planning and implementing sustainable energy measures
Figure 3.39 Urban Density and Transport-related Energy ConsumptionSource: Adopted from Kick the Habit: A UN Guide to Climate Neutrality
ECo2-Part3brEV_PREP Sec1:239 6/15/09 9:04:23 AM

240 | ECO2 CITIES: ECOLOGICAL CITIES AS ECONOMIC CITIES
in urban settings are complex. Though many energy investments can be justifi ed based on their fi nancial and/or economic returns, envi-ronmental concerns should be factored into project assessments. Some general recommen-dations for promoting sustainable energy and increasing energy e+ ciency and clean energy include:
• Get the energy sector to work properly. En-ergy sector restructuring, utility commer-cialization, pricing reform and other mea-sures can reduce energy costs while reducing energy waste. These e( orts are best led at the national level.
• Explore options to retrofi t the existing stock of infrastructure. This can be done by audit-ing energy sources and organizations, changing procurement guidelines, contract-ing ESCOs, and devising public agency tar-gets for energy e+ ciency (etc.). Access to fi nancing is key to realizing these gains.
• Consider options to address the new built en-vironment. This could entail adopting ener-gy e+ ciency standards for buildings and equipment, improving city planning and design processes, strengthening land use schemes, and so forth.
• Seek options to bundle city programs togeth-
er, such as combining procurement of equipment to negotiate better costs, com-bining similar services across cities, increas-ing infl uence at the national level, etc.
• Seek ways to better incentivize public agen-cies and sta' on sustainable energy options by o( ering environmentally sustainable awards, publishing agency energy and envi-ronmental performance records, providing incentive grants, etc.
• Create mechanisms for sharing cities experi-
ences across the country, through associa-tions, case studies, newsletters, and so forth.
ECo2-Part3brEV_PREP Sec1:240 6/15/09 9:04:24 AM
A F I E L D R E F E R E N C E G U I D E | 241
Overview
Water is indispensible to all human activity. An-cient civilizations fl ourished around water sources, including ancient Egypt, China and Rome. Water shaped the destinies of great cit-ies, like Cairo, Beijing, London, Paris, New York, Sidney, Frankfurt and Rome. On the other hand, many pioneering cities, like Babel and Sheba, diminished or disappeared because water sources dried up. Water plays an important role in economic growth, quality of life, and envi-ronment sustainability. Some people defi ne wa-ter as a divine gift, while others view it as an economic commodity. In any case, water is a limited resource that must often be processed to become usable, and there are costs associated with its transportation, distribution and man-agement. Water has social value, and access to su+ cient water to survive is a human right. In this context, politicians and managers typically take steps to guarantee that the poor have ac-cess to an equitable share of water services, par-ticularly in developing countries.
Water is a shared resource that plays a vital role in the development of other economic sec-tors. Given the importance of water, there is a need for integrated management at the sector and macro levels to ensure the resource is used in optimal and sustainable ways (i.e., Integrated Water Resources Management)
To ensure resource optimization and sus-tainability, governments must address key as-
pects of integrated water sector management and cross cutting issues between various sec-tors. These aspects and issues involve policies, regulations, planning activities, sector invest-ments, fi nancing methods, service provisions and institutional factors.
The input-output model for the water sector is shown in Figure 3.40. This fi gure specifi es in-put parameters, desired outputs, relevant inter-ventions, and undesired outputs that must be minimized. All interventions in a city should lead to desired objectives, which include: 1) ac-cessibility for all residents including the poor; 2) adequate service quality; 3) high operational e+ ciency; 4) service reliability; 5) supply secu-rity and sustainability; 6) environmental pres-ervation; and 7) service a( ordability. These ob-jectives are interlinked and trade-o( s must be recognized. Interventions can be related to: 1) planning; 2) water resource protection and en-hancement; 3) infrastructure; 4) service deliv-ery; and 5) management. These interventions are subject to relatively unchangeable input constraints (independent inputs) such as: 1) characteristics of water resources; 2) hydrology and hydrogeology; 3) climate and atmospheric conditions; 4) demographic and economic con-ditions; and 5) social norms and historical rights. Parameters that are manageable include: 1) policy, legislation, and regulations; 2) institu-tions; 3) physical systems technology and spa-tial planning; 4) stakeholders; and 5) economic and fi nancial aspects. Undesirable impacts
Cities and WaterSECTOR NOTE 2
ECo2-Part3brEV_PREP Sec1:241 6/15/09 9:04:24 AM
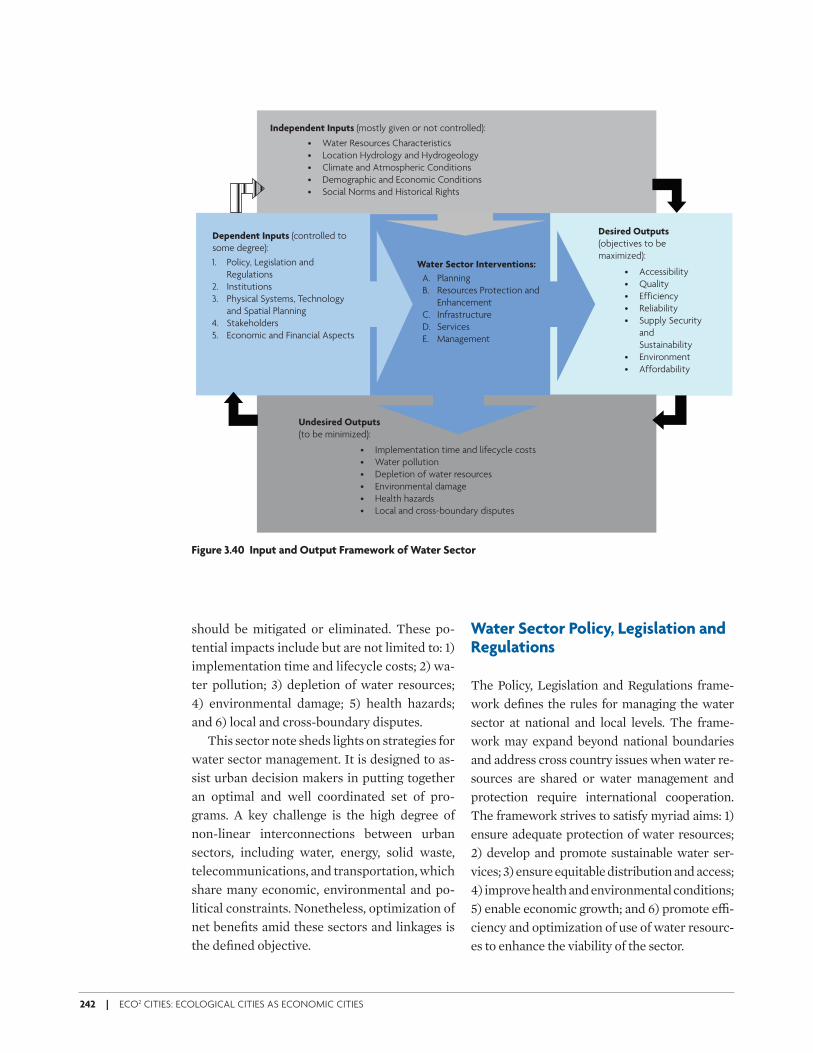
242 | ECO2 CITIES: ECOLOGICAL CITIES AS ECONOMIC CITIES
should be mitigated or eliminated. These po-tential impacts include but are not limited to: 1) implementation time and lifecycle costs; 2) wa-ter pollution; 3) depletion of water resources; 4) environmental damage; 5) health hazards; and 6) local and cross-boundary disputes.
This sector note sheds lights on strategies for water sector management. It is designed to as-sist urban decision makers in putting together an optimal and well coordinated set of pro-grams. A key challenge is the high degree of non-linear interconnections between urban sectors, including water, energy, solid waste, telecommunications, and transportation, which share many economic, environmental and po-litical constraints. Nonetheless, optimization of net benefi ts amid these sectors and linkages is the defi ned objective.
Water Sector Policy, Legislation and Regulations
The Policy, Legislation and Regulations frame-work defi nes the rules for managing the water sector at national and local levels. The frame-work may expand beyond national boundaries and address cross country issues when water re-sources are shared or water management and protection require international cooperation. The framework strives to satisfy myriad aims: 1) ensure adequate protection of water resources; 2) develop and promote sustainable water ser-vices; 3) ensure equitable distribution and access; 4) improve health and environmental conditions; 5) enable economic growth; and 6) promote e+ -ciency and optimization of use of water resourc-es to enhance the viability of the sector.
• Water Resources Characteristics
• Location Hydrology and Hydrogeology
• Climate and Atmospheric Conditions
• Demographic and Economic Conditions
• Social Norms and Historical Rights
Independent Inputs (mostly given or not controlled):
• Accessibility
• Quality
• Efficiency
• Reliability
• Supply Security
and
Sustainability
• Environment
• Affordability
Desired Outputs (objectives to be
maximized):
A. Planning
B. Resources Protection and
Enhancement
C. Infrastructure
D. Services
E. Management
Water Sector Interventions:
• Implementation time and lifecycle costs
• Water pollution
• Depletion of water resources
• Environmental damage
• Health hazards
• Local and cross-boundary disputes
Undesired Outputs
(to be minimized):
1. Policy, Legislation and
Regulations
2. Institutions
3. Physical Systems, Technology
and Spatial Planning
4. Stakeholders
5. Economic and Financial Aspects
Dependent Inputs (controlled to
some degree):
Figure 3.40 Input and Output Framework of Water Sector
ECo2-Part3brEV_PREP Sec1:242 6/15/09 9:04:24 AM
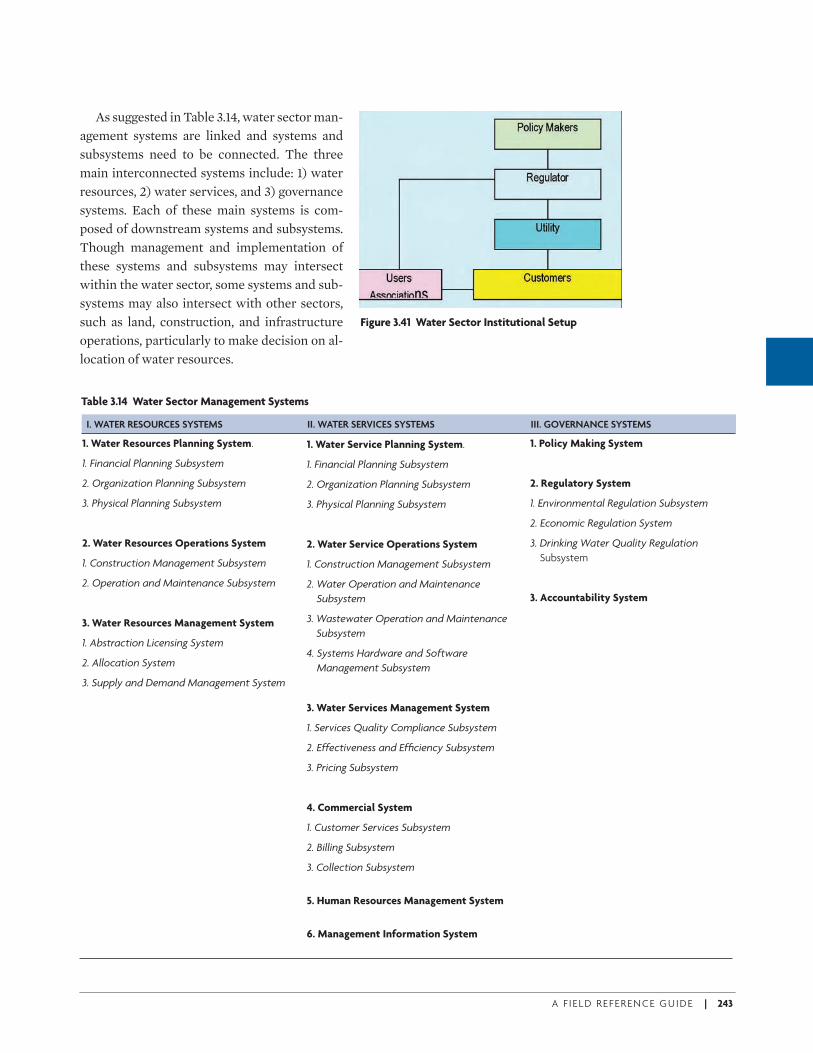
A F I E L D R E F E R E N C E G U I D E | 243
As suggested in Table 3.14, water sector man-agement systems are linked and systems and subsystems need to be connected. The three main interconnected systems include: 1) water resources, 2) water services, and 3) governance systems. Each of these main systems is com-posed of downstream systems and subsystems. Though management and implementation of these systems and subsystems may intersect within the water sector, some systems and sub-systems may also intersect with other sectors, such as land, construction, and infrastructure operations, particularly to make decision on al-location of water resources.
Table 3.14 Water Sector Management Systems
I. WATER RESOURCES SYSTEMS II. WATER SERVICES SYSTEMS III. GOVERNANCE SYSTEMS
1. Water Resources Planning System.
1. Financial Planning Subsystem
2. Organization Planning Subsystem
3. Physical Planning Subsystem
2. Water Resources Operations System
1. Construction Management Subsystem
2. Operation and Maintenance Subsystem
3. Water Resources Management System
1. Abstraction Licensing System
2. Allocation System
3. Supply and Demand Management System
1. Water Service Planning System.
1. Financial Planning Subsystem
2. Organization Planning Subsystem
3. Physical Planning Subsystem
2. Water Service Operations System
1. Construction Management Subsystem
2. Water Operation and Maintenance
Subsystem
3. Wastewater Operation and Maintenance
Subsystem
4. Systems Hardware and Software
Management Subsystem
3. Water Services Management System
1. Services Quality Compliance Subsystem
2. Effectiveness and Effi ciency Subsystem
3. Pricing Subsystem
4. Commercial System
1. Customer Services Subsystem
2. Billing Subsystem
3. Collection Subsystem
5. Human Resources Management System
6. Management Information System
1. Policy Making System
2. Regulatory System
1. Environmental Regulation Subsystem
2. Economic Regulation System
3. Drinking Water Quality Regulation
Subsystem
3. Accountability System
Figure 3.41 Water Sector Institutional Setup
ECo2-Part3brEV_PREP Sec1:243 6/15/09 9:04:24 AM
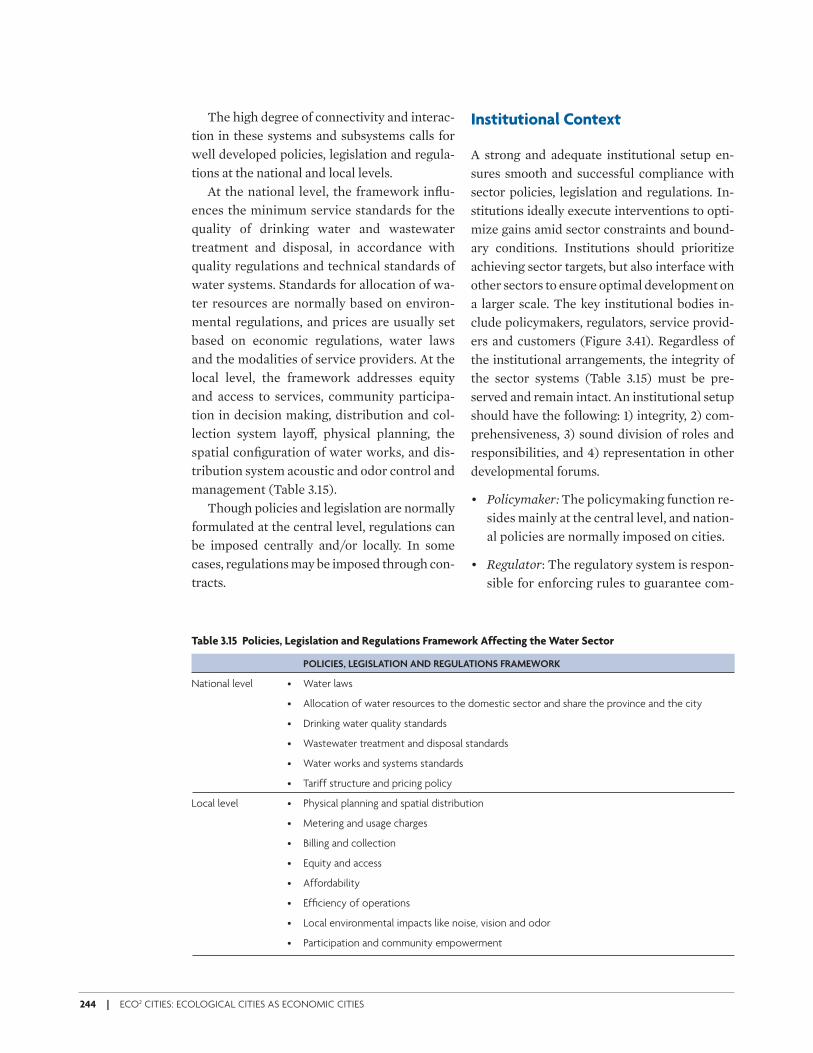
244 | ECO2 CITIES: ECOLOGICAL CITIES AS ECONOMIC CITIES
The high degree of connectivity and interac-tion in these systems and subsystems calls for well developed policies, legislation and regula-tions at the national and local levels.
At the national level, the framework infl u-ences the minimum service standards for the quality of drinking water and wastewater treatment and disposal, in accordance with quality regulations and technical standards of water systems. Standards for allocation of wa-ter resources are normally based on environ-mental regulations, and prices are usually set based on economic regulations, water laws and the modalities of service providers. At the local level, the framework addresses equity and access to services, community participa-tion in decision making, distribution and col-lection system layo( , physical planning, the spatial confi guration of water works, and dis-tribution system acoustic and odor control and management (Table 3.15).
Though policies and legislation are normally formulated at the central level, regulations can be imposed centrally and/or locally. In some cases, regulations may be imposed through con-tracts.
Institutional Context
A strong and adequate institutional setup en-sures smooth and successful compliance with sector policies, legislation and regulations. In-stitutions ideally execute interventions to opti-mize gains amid sector constraints and bound-ary conditions. Institutions should prioritize achieving sector targets, but also interface with other sectors to ensure optimal development on a larger scale. The key institutional bodies in-clude policymakers, regulators, service provid-ers and customers (Figure 3.41). Regardless of the institutional arrangements, the integrity of the sector systems (Table 3.15) must be pre-served and remain intact. An institutional setup should have the following: 1) integrity, 2) com-prehensiveness, 3) sound division of roles and responsibilities, and 4) representation in other developmental forums.
• Policymaker: The policymaking function re-sides mainly at the central level, and nation-al policies are normally imposed on cities.
• Regulator: The regulatory system is respon-sible for enforcing rules to guarantee com-
Table 3.15 Policies, Legislation and Regulations Framework Affecting the Water Sector
POLICIES, LEGISLATION AND REGULATIONS FRAMEWORK
National level • Water laws
• Allocation of water resources to the domestic sector and share the province and the city
• Drinking water quality standards
• Wastewater treatment and disposal standards
• Water works and systems standards
• Tariff structure and pricing policy
Local level • Physical planning and spatial distribution
• Metering and usage charges
• Billing and collection
• Equity and access
• Affordability
• Effi ciency of operations
• Local environmental impacts like noise, vision and odor
• Participation and community empowerment
ECo2-Part3brEV_PREP Sec1:244 6/15/09 9:04:25 AM
A F I E L D R E F E R E N C E G U I D E | 245
pliance with services standards and other sector policies to ensure sustainability. This requires providing adequate services at af-fordable prices. The three subsystems un-der the regulatory function include:– Environmental Regulation subsystem
(licensing for abstraction and disposal)– Quality Regulation subsystem (ensuring
compliance with standards for drinking water, wastewater treatment, and quality of works)
– Economic Regulation subsystem (re-viewing prices to ensure tari( s are pro-portionate to real costs, promote e+ -ciency and conservation, and enable sustainability and a( ordability among the poor)
In some cases, municipalities can propose and implement regulations. However, it is important to ensure separation between a regulator and service provider to avoid con-fl icts of interest. The regulator ensures that customers receive services up to agreed standards to mitigate the risk that service providers underperform. Both bodies should not be under the jurisdiction of the same entity. It is equally important that the policy making body and regulator(s) be sep-arate institutions. In the United Kingdom (UK), regulations are extensive. Environ-mental regulations are executed by the En-vironmental Agency, which is separate from the independent economic and quality regu-lator (O+ ce of Water, OFWAT). This separa-tion enhances the internal transparency and accountability of the regulatory system, as decisions are made in the open. However, regulatory agencies should coordinate close-ly to manage trade-o( s. The prime interest of the environmental regulator is to mini-mize abstraction from water resources and enforce stringent standards on disposed sewage. However, the main interest of the economic regulator is to ensure that levied tari( s cover costs, which often means sup-
porting relaxed disposal standards and maximizing the use of natural water re-sources before considering more expensive and non-conventional options, such as sea-water desalination.
• Service provider: Service providers are re-sponsible for providing water services in the city, including water treatment and dis-tribution and associated customer relations. Water sources can be located within the city and managed by the service provider, or outside the city and managed by a di( erent water provider. The same service provider should provide storm water collection, fl ood management and wastewater collec-tion and treatment services. Consolidating these services will help to improve control of all services, and promote accountability and more e+ cient operations. For instance, a water supplier normally encourages cus-tomers to reduce sewage when it is the same utility that handles the sewage. Suppliers will also promote protection of water re-sources if they bear the cost of water treat-ment. Service providers can be private com-panies (UK, France, Germany, etc.), public utilities (Germany, South Africa, Australia) or municipalities (Cairo, Jordan, France, Germany). In some cases, “multifunction” utilities o( er water, electricity and other services. The decision to combine utility services should depend on the scale of re-lated industries and potential cost savings. Moreover, public utilities may outsource some or all of their operations to increase their e+ ciency.
• Civil Society: The civil society should be in-stitutionalized by establishing user associa-tions and appropriate participation channels. This helps to ensure public participation in industry development and related decision making. Policymakers and regulators often consult user associations to assess and en-sure the adequacy of policies, legislation reg-
ECo2-Part3brEV_PREP Sec1:245 6/15/09 9:04:25 AM
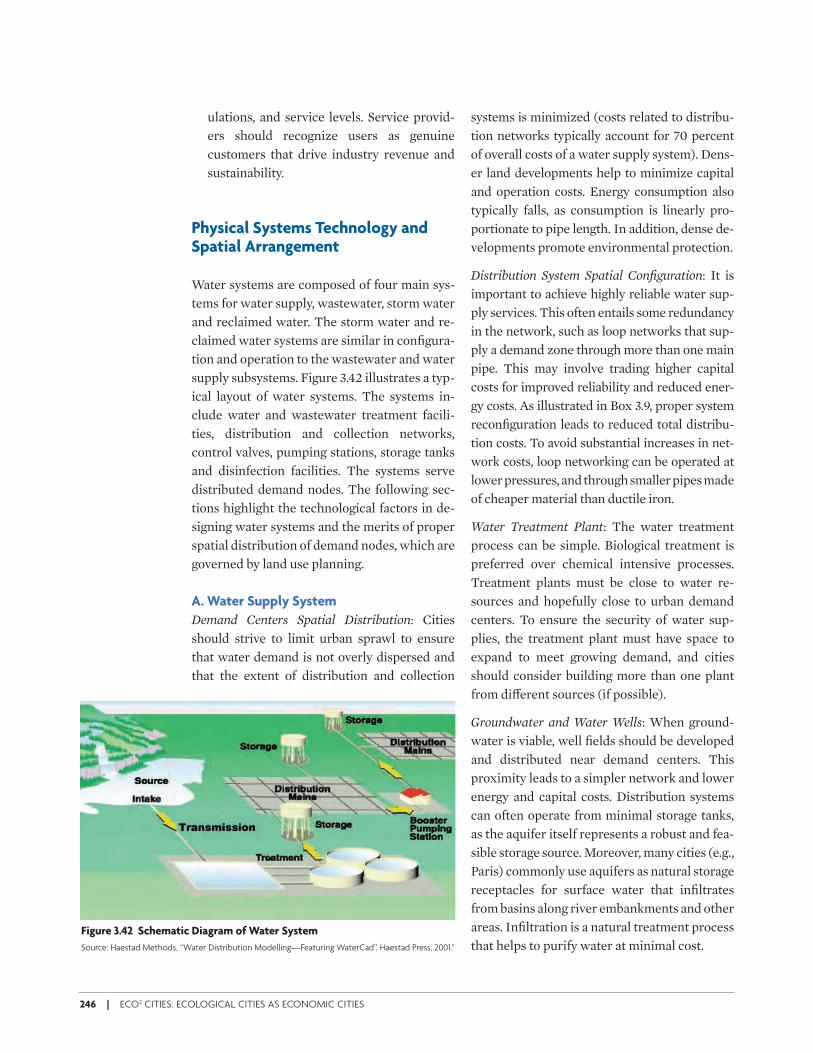
246 | ECO2 CITIES: ECOLOGICAL CITIES AS ECONOMIC CITIES
ulations, and service levels. Service provid-ers should recognize users as genuine customers that drive industry revenue and sustainability.
Physical Systems Technology and Spatial Arrangement
Water systems are composed of four main sys-tems for water supply, wastewater, storm water and reclaimed water. The storm water and re-claimed water systems are similar in confi gura-tion and operation to the wastewater and water supply subsystems. Figure 3.42 illustrates a typ-ical layout of water systems. The systems in-clude water and wastewater treatment facili-ties, distribution and collection networks, control valves, pumping stations, storage tanks and disinfection facilities. The systems serve distributed demand nodes. The following sec-tions highlight the technological factors in de-signing water systems and the merits of proper spatial distribution of demand nodes, which are governed by land use planning.
A. Water Supply System
Demand Centers Spatial Distribution: Cities should strive to limit urban sprawl to ensure that water demand is not overly dispersed and that the extent of distribution and collection
systems is minimized (costs related to distribu-tion networks typically account for 70 percent of overall costs of a water supply system). Dens-er land developments help to minimize capital and operation costs. Energy consumption also typically falls, as consumption is linearly pro-portionate to pipe length. In addition, dense de-velopments promote environmental protection.
Distribution System Spatial Confi guration: It is important to achieve highly reliable water sup-ply services. This often entails some redundancy in the network, such as loop networks that sup-ply a demand zone through more than one main pipe. This may involve trading higher capital costs for improved reliability and reduced ener-gy costs. As illustrated in Box 3.9, proper system reconfi guration leads to reduced total distribu-tion costs. To avoid substantial increases in net-work costs, loop networking can be operated at lower pressures, and through smaller pipes made of cheaper material than ductile iron.
Water Treatment Plant: The water treatment process can be simple. Biological treatment is preferred over chemical intensive processes. Treatment plants must be close to water re-sources and hopefully close to urban demand centers. To ensure the security of water sup-plies, the treatment plant must have space to expand to meet growing demand, and cities should consider building more than one plant from di( erent sources (if possible).
Groundwater and Water Wells: When ground-water is viable, well fi elds should be developed and distributed near demand centers. This proximity leads to a simpler network and lower energy and capital costs. Distribution systems can often operate from minimal storage tanks, as the aquifer itself represents a robust and fea-sible storage source. Moreover, many cities (e.g., Paris) commonly use aquifers as natural storage receptacles for surface water that infi ltrates from basins along river embankments and other areas. Infi ltration is a natural treatment process that helps to purify water at minimal cost.
Figure 3.42 Schematic Diagram of Water System
Source: Haestad Methods, “Water Distribution Modelling—Featuring WaterCad”, Haestad Press, 2001.”
ECo2-Part3brEV_PREP Sec1:246 6/15/09 9:04:25 AM
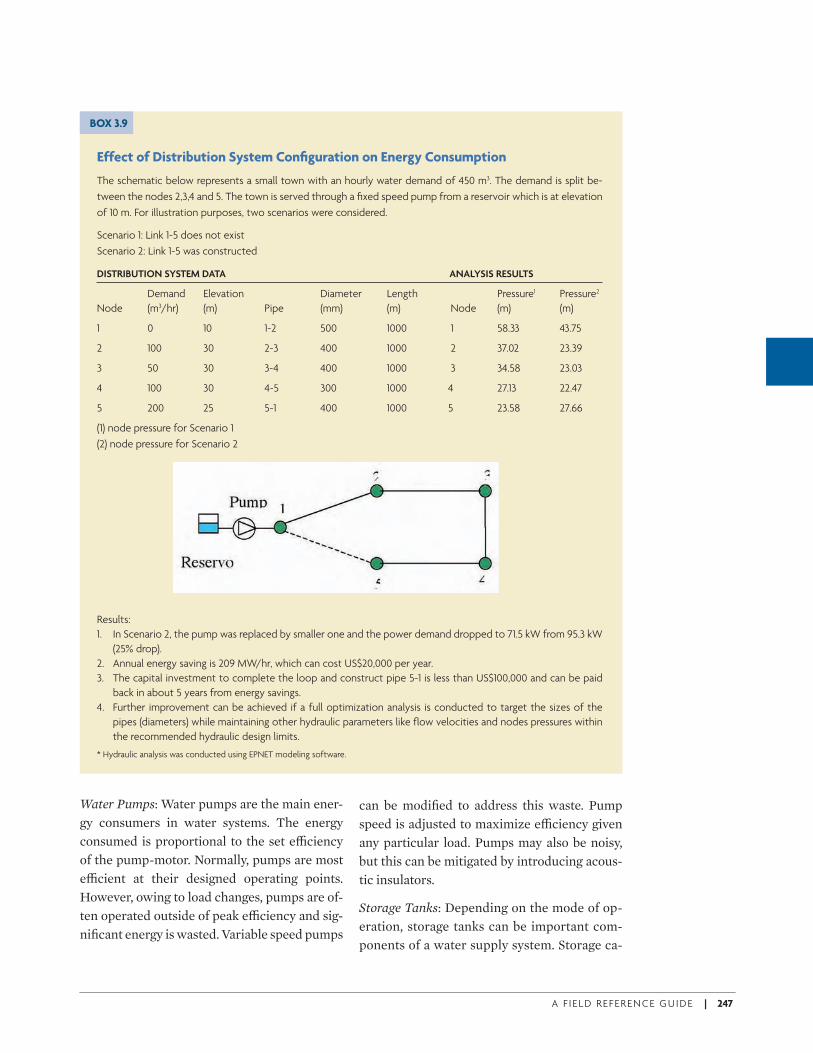
A F I E L D R E F E R E N C E G U I D E | 247
Water Pumps: Water pumps are the main ener-gy consumers in water systems. The energy consumed is proportional to the set e+ ciency of the pump-motor. Normally, pumps are most e+ cient at their designed operating points. However, owing to load changes, pumps are of-ten operated outside of peak e+ ciency and sig-nifi cant energy is wasted. Variable speed pumps
can be modifi ed to address this waste. Pump speed is adjusted to maximize e+ ciency given any particular load. Pumps may also be noisy, but this can be mitigated by introducing acous-tic insulators.
Storage Tanks: Depending on the mode of op-eration, storage tanks can be important com-ponents of a water supply system. Storage ca-
Effect of Distribution System Confi guration on Energy Consumption
The schematic below represents a small town with an hourly water demand of 450 m3. The demand is split be-
tween the nodes 2,3,4 and 5. The town is served through a fi xed speed pump from a reservoir which is at elevation
of 10 m. For illustration purposes, two scenarios were considered.
Scenario 1: Link 1-5 does not exist
Scenario 2: Link 1-5 was constructed
DISTRIBUTION SYSTEM DATA ANALYSIS RESULTS
Demand Elevation Diameter Length Pressure1 Pressure2
Node (m3/hr) (m) Pipe (mm) (m) Node (m) (m)
1 0 10 1-2 500 1000 1 58.33 43.75
2 100 30 2-3 400 1000 2 37.02 23.39
3 50 30 3-4 400 1000 3 34.58 23.03
4 100 30 4-5 300 1000 4 27.13 22.47
5 200 25 5-1 400 1000 5 23.58 27.66
(1) node pressure for Scenario 1
(2) node pressure for Scenario 2
Results:
1. In Scenario 2, the pump was replaced by smaller one and the power demand dropped to 71.5 kW from 95.3 kW
(25% drop).
2. Annual energy saving is 209 MW/hr, which can cost US$20,000 per year.
3. The capital investment to complete the loop and construct pipe 5-1 is less than US$100,000 and can be paid
back in about 5 years from energy savings.
4. Further improvement can be achieved if a full optimization analysis is conducted to target the sizes of the
pipes (diameters) while maintaining other hydraulic parameters like fl ow velocities and nodes pressures within
the recommended hydraulic design limits.
* Hydraulic analysis was conducted using EPNET modeling software.
BOX 3.9
ECo2-Part3brEV_PREP Sec1:247 6/15/09 9:04:26 AM
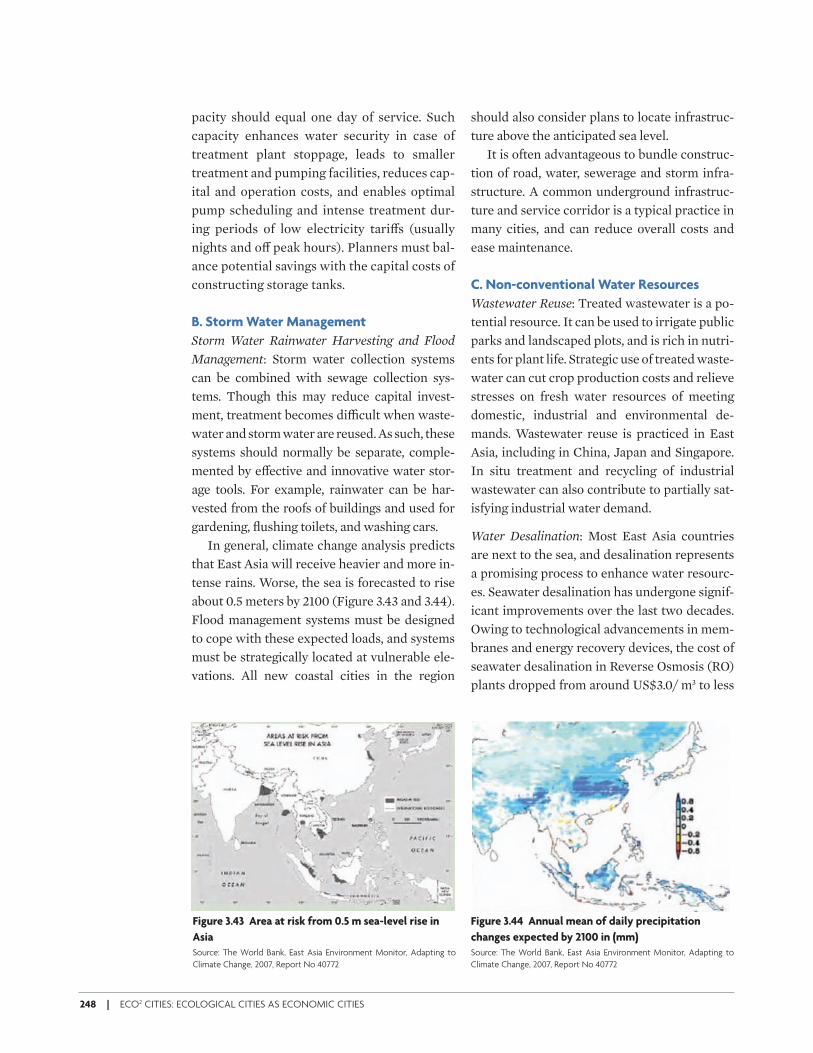
248 | ECO2 CITIES: ECOLOGICAL CITIES AS ECONOMIC CITIES
pacity should equal one day of service. Such capacity enhances water security in case of treatment plant stoppage, leads to smaller treatment and pumping facilities, reduces cap-ital and operation costs, and enables optimal pump scheduling and intense treatment dur-ing periods of low electricity tari( s (usually nights and o( peak hours). Planners must bal-ance potential savings with the capital costs of constructing storage tanks.
B. Storm Water Management
Storm Water Rainwater Harvesting and Flood
Management: Storm water collection systems can be combined with sewage collection sys-tems. Though this may reduce capital invest-ment, treatment becomes di+ cult when waste-water and storm water are reused. As such, these systems should normally be separate, comple-mented by e( ective and innovative water stor-age tools. For example, rainwater can be har-vested from the roofs of buildings and used for gardening, fl ushing toilets, and washing cars.
In general, climate change analysis predicts that East Asia will receive heavier and more in-tense rains. Worse, the sea is forecasted to rise about 0.5 meters by 2100 (Figure 3.43 and 3.44). Flood management systems must be designed to cope with these expected loads, and systems must be strategically located at vulnerable ele-vations. All new coastal cities in the region
should also consider plans to locate infrastruc-ture above the anticipated sea level.
It is often advantageous to bundle construc-tion of road, water, sewerage and storm infra-structure. A common underground infrastruc-ture and service corridor is a typical practice in many cities, and can reduce overall costs and ease maintenance.
C. Non-conventional Water Resources
Wastewater Reuse: Treated wastewater is a po-tential resource. It can be used to irrigate public parks and landscaped plots, and is rich in nutri-ents for plant life. Strategic use of treated waste-water can cut crop production costs and relieve stresses on fresh water resources of meeting domestic, industrial and environmental de-mands. Wastewater reuse is practiced in East Asia, including in China, Japan and Singapore. In situ treatment and recycling of industrial wastewater can also contribute to partially sat-isfying industrial water demand.
Water Desalination: Most East Asia countries are next to the sea, and desalination represents a promising process to enhance water resourc-es. Seawater desalination has undergone signif-icant improvements over the last two decades. Owing to technological advancements in mem-branes and energy recovery devices, the cost of seawater desalination in Reverse Osmosis (RO) plants dropped from around US$3.0/ m3 to less
Figure 3.43 Area at risk from 0.5 m sea-level rise in
Asia
Source: The World Bank, East Asia Environment Monitor, Adapting to
Climate Change, 2007, Report No 40772
Figure 3.44 Annual mean of daily precipitation
changes expected by 2100 in (mm)
Source: The World Bank, East Asia Environment Monitor, Adapting to
Climate Change, 2007, Report No 40772
ECo2-Part3brEV_PREP Sec1:248 6/15/09 9:04:26 AM
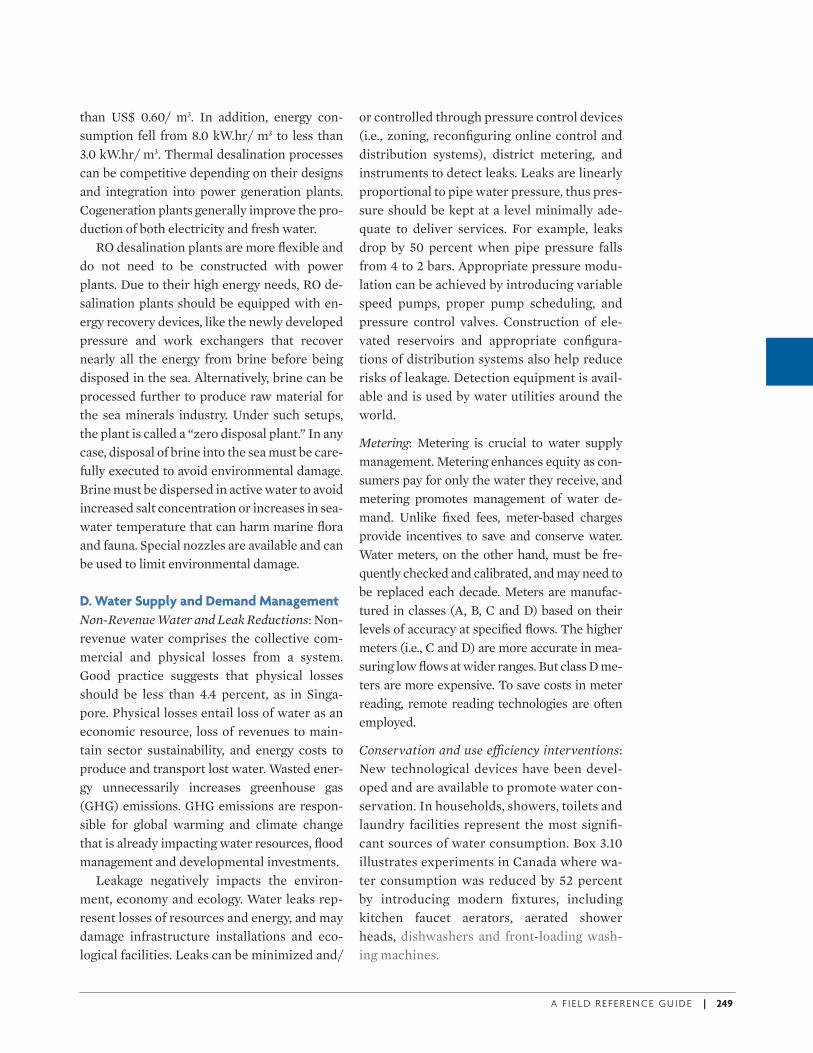
A F I E L D R E F E R E N C E G U I D E | 249
than US$ 0.60/ m3. In addition, energy con-sumption fell from 8.0 kW.hr/ m3 to less than 3.0 kW.hr/ m3. Thermal desalination processes can be competitive depending on their designs and integration into power generation plants. Cogeneration plants generally improve the pro-duction of both electricity and fresh water.
RO desalination plants are more fl exible and do not need to be constructed with power plants. Due to their high energy needs, RO de-salination plants should be equipped with en-ergy recovery devices, like the newly developed pressure and work exchangers that recover nearly all the energy from brine before being disposed in the sea. Alternatively, brine can be processed further to produce raw material for the sea minerals industry. Under such setups, the plant is called a “zero disposal plant.” In any case, disposal of brine into the sea must be care-fully executed to avoid environmental damage. Brine must be dispersed in active water to avoid increased salt concentration or increases in sea-water temperature that can harm marine fl ora and fauna. Special nozzles are available and can be used to limit environmental damage.
D. Water Supply and Demand Management
Non-Revenue Water and Leak Reductions: Non-revenue water comprises the collective com-mercial and physical losses from a system. Good practice suggests that physical losses should be less than 4.4 percent, as in Singa-pore. Physical losses entail loss of water as an economic resource, loss of revenues to main-tain sector sustainability, and energy costs to produce and transport lost water. Wasted ener-gy unnecessarily increases greenhouse gas (GHG) emissions. GHG emissions are respon-sible for global warming and climate change that is already impacting water resources, fl ood management and developmental investments.
Leakage negatively impacts the environ-ment, economy and ecology. Water leaks rep-resent losses of resources and energy, and may damage infrastructure installations and eco-logical facilities. Leaks can be minimized and/
or controlled through pressure control devices (i.e., zoning, reconfi guring online control and distribution systems), district metering, and instruments to detect leaks. Leaks are linearly proportional to pipe water pressure, thus pres-sure should be kept at a level minimally ade-quate to deliver services. For example, leaks drop by 50 percent when pipe pressure falls from 4 to 2 bars. Appropriate pressure modu-lation can be achieved by introducing variable speed pumps, proper pump scheduling, and pressure control valves. Construction of ele-vated reservoirs and appropriate confi gura-tions of distribution systems also help reduce risks of leakage. Detection equipment is avail-able and is used by water utilities around the world.
Metering: Metering is crucial to water supply management. Metering enhances equity as con-sumers pay for only the water they receive, and metering promotes management of water de-mand. Unlike fi xed fees, meter-based charges provide incentives to save and conserve water. Water meters, on the other hand, must be fre-quently checked and calibrated, and may need to be replaced each decade. Meters are manufac-tured in classes (A, B, C and D) based on their levels of accuracy at specifi ed fl ows. The higher meters (i.e., C and D) are more accurate in mea-suring low fl ows at wider ranges. But class D me-ters are more expensive. To save costs in meter reading, remote reading technologies are often employed.
Conservation and use e& ciency interventions: New technological devices have been devel-oped and are available to promote water con-servation. In households, showers, toilets and laundry facilities represent the most signifi -cant sources of water consumption. Box 3.10 illustrates experiments in Canada where wa-ter consumption was reduced by 52 percent by introducing modern fi xtures, including kitchen faucet aerators, aerated shower heads, dishwashers and front-loading wash-ing machines.
ECo2-Part3brEV_PREP Sec1:249 6/15/09 9:04:27 AM
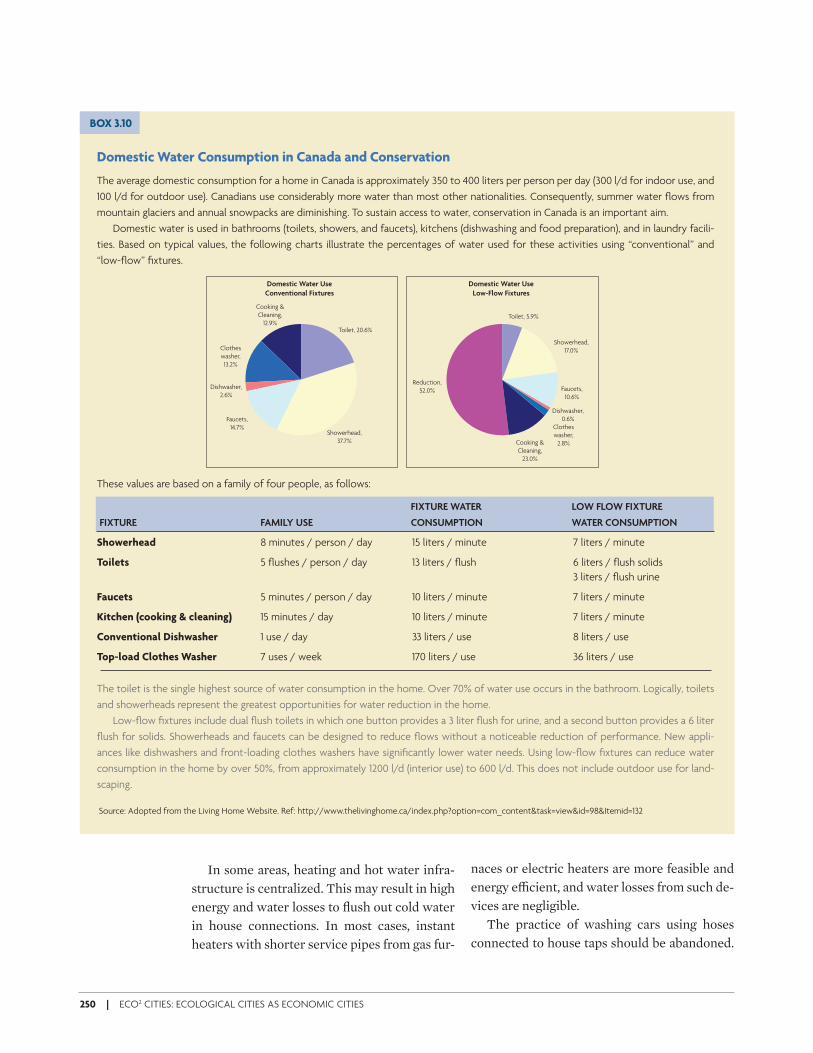
250 | ECO2 CITIES: ECOLOGICAL CITIES AS ECONOMIC CITIES
Domestic Water Consumption in Canada and Conservation
The average domestic consumption for a home in Canada is approximately 350 to 400 liters per person per day (300 l/d for indoor use, and
100 l/d for outdoor use). Canadians use considerably more water than most other nationalities. Consequently, summer water fl ows from
mountain glaciers and annual snowpacks are diminishing. To sustain access to water, conservation in Canada is an important aim.
Domestic water is used in bathrooms (toilets, showers, and faucets), kitchens (dishwashing and food preparation), and in laundry facili-
ties. Based on typical values, the following charts illustrate the percentages of water used for these activities using “conventional” and
“low-fl ow” fi xtures.
These values are based on a family of four people, as follows:
FIXTURE WATER LOW FLOW FIXTURE
FIXTURE FAMILY USE CONSUMPTION WATER CONSUMPTION
Showerhead 8 minutes / person / day 15 liters / minute 7 liters / minute
Toilets 5 fl ushes / person / day 13 liters / fl ush 6 liters / fl ush solids
3 liters / fl ush urine
Faucets 5 minutes / person / day 10 liters / minute 7 liters / minute
Kitchen (cooking & cleaning) 15 minutes / day 10 liters / minute 7 liters / minute
Conventional Dishwasher 1 use / day 33 liters / use 8 liters / use
Top-load Clothes Washer 7 uses / week 170 liters / use 36 liters / use
The toilet is the single highest source of water consumption in the home. Over 70% of water use occurs in the bathroom. Logically, toilets
and showerheads represent the greatest opportunities for water reduction in the home.
Low-fl ow fi xtures include dual fl ush toilets in which one button provides a 3 liter fl ush for urine, and a second button provides a 6 liter
fl ush for solids. Showerheads and faucets can be designed to reduce fl ows without a noticeable reduction of performance. New appli-
ances like dishwashers and front-loading clothes washers have signifi cantly lower water needs. Using low-fl ow fi xtures can reduce water
consumption in the home by over 50%, from approximately 1200 l/d (interior use) to 600 l/d. This does not include outdoor use for land-
scaping.
BOX 3.10
Source: Adopted from the Living Home Website. Ref: http://www.thelivinghome.ca/index.php?option=com_content&task=view&id=98&Itemid=132
Domestic Water Use
Conventional Fixtures
Cooking &
Cleaning,
12.9%
Cooking &
Cleaning,
23.0%
Reduction,
52.0%
Clothes
washer,
13.2%
Clothes
washer,
2.8%
Dishwasher,
2.6%
Dishwasher,
0.6%Faucets,
14.7%
Faucets,
10.6%
Showerhead,
37.7%
Showerhead,
17.0%
Toilet, 20.6%
Toilet, 5.9%
Domestic Water Use
Low-Flow Fixtures
In some areas, heating and hot water infra-structure is centralized. This may result in high energy and water losses to fl ush out cold water in house connections. In most cases, instant heaters with shorter service pipes from gas fur-
naces or electric heaters are more feasible and energy e+ cient, and water losses from such de-vices are negligible.
The practice of washing cars using hoses connected to house taps should be abandoned.
ECo2-Part3brEV_PREP Sec1:250 6/15/09 9:04:27 AM
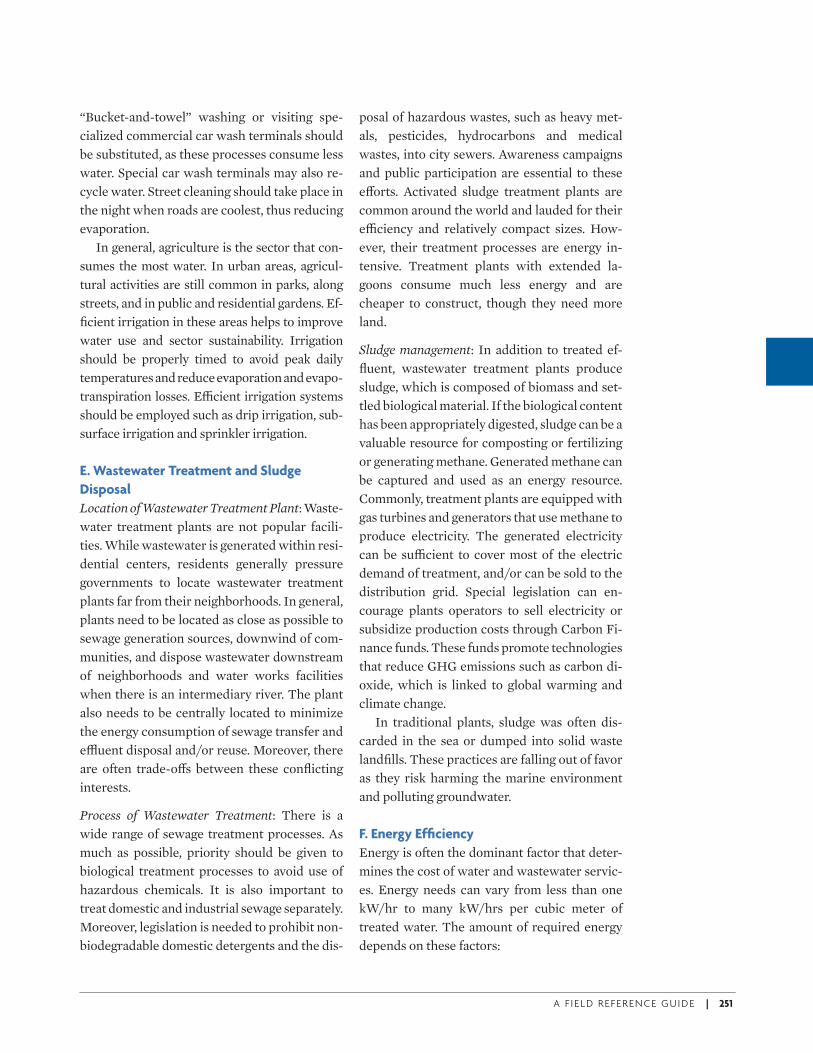
A F I E L D R E F E R E N C E G U I D E | 251
“Bucket-and-towel” washing or visiting spe-cialized commercial car wash terminals should be substituted, as these processes consume less water. Special car wash terminals may also re-cycle water. Street cleaning should take place in the night when roads are coolest, thus reducing evaporation.
In general, agriculture is the sector that con-sumes the most water. In urban areas, agricul-tural activities are still common in parks, along streets, and in public and residential gardens. Ef-fi cient irrigation in these areas helps to improve water use and sector sustainability. Irrigation should be properly timed to avoid peak daily temperatures and reduce evaporation and evapo-transpiration losses. E+ cient irrigation systems should be employed such as drip irrigation, sub-surface irrigation and sprinkler irrigation.
E. Wastewater Treatment and Sludge
Disposal
Location of Wastewater Treatment Plant: Waste-water treatment plants are not popular facili-ties. While wastewater is generated within resi-dential centers, residents generally pressure governments to locate wastewater treatment plants far from their neighborhoods. In general, plants need to be located as close as possible to sewage generation sources, downwind of com-munities, and dispose wastewater downstream of neighborhoods and water works facilities when there is an intermediary river. The plant also needs to be centrally located to minimize the energy consumption of sewage transfer and e\ uent disposal and/or reuse. Moreover, there are often trade-o( s between these confl icting interests.
Process of Wastewater Treatment: There is a wide range of sewage treatment processes. As much as possible, priority should be given to biological treatment processes to avoid use of hazardous chemicals. It is also important to treat domestic and industrial sewage separately. Moreover, legislation is needed to prohibit non-biodegradable domestic detergents and the dis-
posal of hazardous wastes, such as heavy met-als, pesticides, hydrocarbons and medical wastes, into city sewers. Awareness campaigns and public participation are essential to these e( orts. Activated sludge treatment plants are common around the world and lauded for their e+ ciency and relatively compact sizes. How-ever, their treatment processes are energy in-tensive. Treatment plants with extended la-goons consume much less energy and are cheaper to construct, though they need more land.
Sludge management: In addition to treated ef-fl uent, wastewater treatment plants produce sludge, which is composed of biomass and set-tled biological material. If the biological content has been appropriately digested, sludge can be a valuable resource for composting or fertilizing or generating methane. Generated methane can be captured and used as an energy resource. Commonly, treatment plants are equipped with gas turbines and generators that use methane to produce electricity. The generated electricity can be su+ cient to cover most of the electric demand of treatment, and/or can be sold to the distribution grid. Special legislation can en-courage plants operators to sell electricity or subsidize production costs through Carbon Fi-nance funds. These funds promote technologies that reduce GHG emissions such as carbon di-oxide, which is linked to global warming and climate change.
In traditional plants, sludge was often dis-carded in the sea or dumped into solid waste landfi lls. These practices are falling out of favor as they risk harming the marine environment and polluting groundwater.
F. Energy Effi ciency
Energy is often the dominant factor that deter-mines the cost of water and wastewater servic-es. Energy needs can vary from less than one kW/hr to many kW/hrs per cubic meter of treated water. The amount of required energy depends on these factors:
ECo2-Part3brEV_PREP Sec1:251 6/15/09 9:04:27 AM
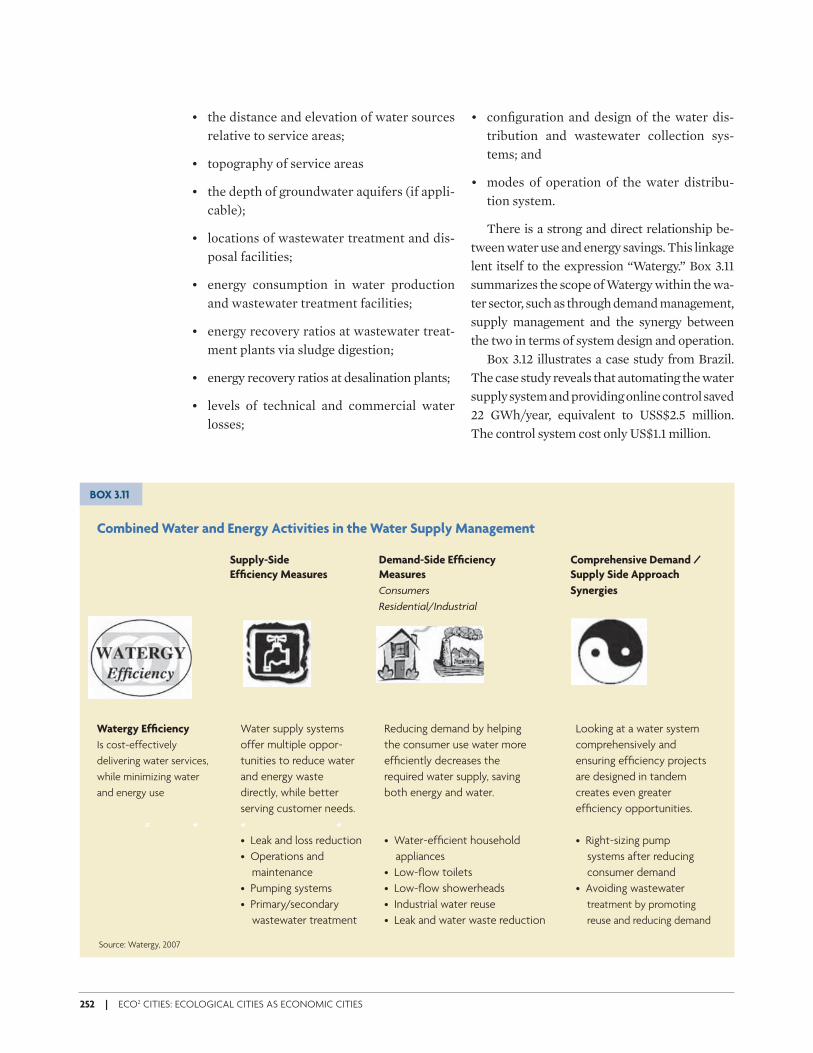
252 | ECO2 CITIES: ECOLOGICAL CITIES AS ECONOMIC CITIES
• the distance and elevation of water sources relative to service areas;
• topography of service areas
• the depth of groundwater aquifers (if appli-cable);
• locations of wastewater treatment and dis-posal facilities;
• energy consumption in water production and wastewater treatment facilities;
• energy recovery ratios at wastewater treat-ment plants via sludge digestion;
• energy recovery ratios at desalination plants;
• levels of technical and commercial water losses;
• confi guration and design of the water dis-tribution and wastewater collection sys-tems; and
• modes of operation of the water distribu-tion system.
There is a strong and direct relationship be-tween water use and energy savings. This linkage lent itself to the expression “Watergy.” Box 3.11 summarizes the scope of Watergy within the wa-ter sector, such as through demand management, supply management and the synergy between the two in terms of system design and operation.
Box 3.12 illustrates a case study from Brazil. The case study reveals that automating the water supply system and providing online control saved 22 GWh/year, equivalent to USS$2.5 million. The control system cost only US$1.1 million.
Combined Water and Energy Activities in the Water Supply Management
Supply-Side Demand-Side Effi ciency Comprehensive Demand /
Effi ciency Measures Measures Supply Side Approach
Consumers Synergies
Residential/Industrial
Watergy Effi ciency Water supply systems Reducing demand by helping Looking at a water system
Is cost-effectively offer multiple oppor- the consumer use water more comprehensively and
delivering water services, tunities to reduce water effi ciently decreases the ensuring effi ciency projects
while minimizing water and energy waste required water supply, saving are designed in tandem
and energy use directly, while better both energy and water. creates even greater
serving customer needs. effi ciency opportunities.
= + + +
• Leak and loss reduction • Water-effi cient household • Right-sizing pump
• Operations and appliances systems after reducing
maintenance • Low-fl ow toilets consumer demand
• Pumping systems • Low-fl ow showerheads • Avoiding wastewater
• Primary/secondary • Industrial water reuse treatment by promoting
wastewater treatment • Leak and water waste reduction reuse and reducing demand
BOX 3.11
Source: Watergy, 2007
ECo2-Part3brEV_PREP Sec1:252 6/15/09 9:04:27 AM
A F I E L D R E F E R E N C E G U I D E | 253
WATERGY Case Study
FORTALEZA, BRAZIL
CHALLENGES
The importance of this project was highlighted during BrazilÐs en-
ergy crisis in 2000 and 2001. 70% of BrazilÐs generated energy comes
from hydropower, thus droughts and energy shortages are inextrica-
bly linked. During droughts in 2000 and 2001, all consumers were re-
quired to reduce energy consumption by 20%. Since 2001, the Alli-
ance to Save Energy has worked with the Companhia de Água e
Esgoto do Ceara (CAGECE) in northeast Brazil to develop and imple-
ment measures to promote effi cient use of water and energy. This
partnership aimed to improve the distribution of water and access
to sanitation services, while reducing operational costs and environ-
mental impacts. The partnership reduced CAGECEÐs energy use and
serve as good practice for other national projects, which is impor-
tant as BrazilÐs water and sanitation sector represents 2.3% of the
nationÐs energy consumption.
BACKGROUND
The designs of water distribution systems are based on population
projections from statistical and historical data over a 20 or 30 year plan-
ning horizon. As such, many systems are over-designed, particularly the
sizes of storage, treatment and distribution facilities. Over-design en-
tails energy consumption much greater than needed to provide for
adequate demand, especially in booster stations. Design criteria affect
not only pumping stations, but also the size of pipes, capacity of reser-
voirs, and the construction of treatment facilities and booster stations.
Moreover, water systems need to be able to expand to satisfy increas-
ing demand, but not while sacrifi cing effi cient use of energy.
OBJECTIVES
The focus of the partnership between the Alliance and CAGECE was
to develop a methodology that provided CAGECE with the tools
and the know-how to produce initiatives that resulted in savings and
rational use of energy and distributed water. As the work progressed,
it became clear that the model would be useful to other water and
sanitation companies in Brazil exploring ways to increase effi ciency.
BOX 3.12
Source: Alliance Save Energy and Watergy, Energy Effi ciency. (Under USAID funded project)
APPROACH
An automated water distribution system allows operators to obtain
strategic data and control equipment in real time. The automation
of the system in the Fortaleza Metropolitan Region allows for cor-
rection of defi ciencies, particularly those linked to over-design.
Along with CAGECE’s efforts, Alliance actions in 2002 included:
• Establishing a baseline of energy consumed and water distribut-
ed for CAGECE.
• Implementing effi ciency measures that led to a reduction in op-
erational energy consumption
• Developing a fi nancing proposal with the Government of Brazil’s
Fight Against Electricity Waste Program (PROCEL) to implement
energy effi ciency projects with CAGECE’s operational staff. The
technical support provided by the Alliance resulted in the devel-
opment of energy effi ciency projects, cost/benefi t analysis, and
specifi cations of equipment that could be fi nanced.
• Arranging for R$5 million in fi nancing for energy effi ciency proj-
ects to CAGECE. These projects included automation of opera-
tions, rewinding and replacement of motors, maximizing existing
pump systems effi ciency, and increasing storage capacity to al-
low the shutdown of pumps during peak hours.
• Creating an operations procedures manual to serve as a refer-
ence for daily performance to operations crews and CAGECE
management.
Key Results
• Energy saved: 88 GWh over 4 years
• Households newly connected to water while water consump-
tion remained constant: 88,000
• $2.5 million saved per year under an investment of $1.1 million.
• Standardization of operational procedures and increased reliabil-
ity of operational data
• Ability to act in real time with system control devices
• CO2 Emissions Avoided: 220,000 tons/year
Stakeholders
The stakeholder dynamic illustrated in Figure 3.45 is important to the water sector. This dy-namic includes interfaces between customers, service providers, municipalities, regulators, and policymakers. As the water industry is of-ten highly monopolistic, transparency, account-
ability and public participation are needed. These factors allow strategic decisions to be made using top-down and bottom up approach-es. For instance, tari( s ensure sector sustain-ability by furnishing revenues to fi nance sector management expenses. Tari( s are usually set at the municipality level, which represents local government, though in some models tari( s are
ECo2-Part3brEV_PREP Sec1:253 6/15/09 9:04:28 AM
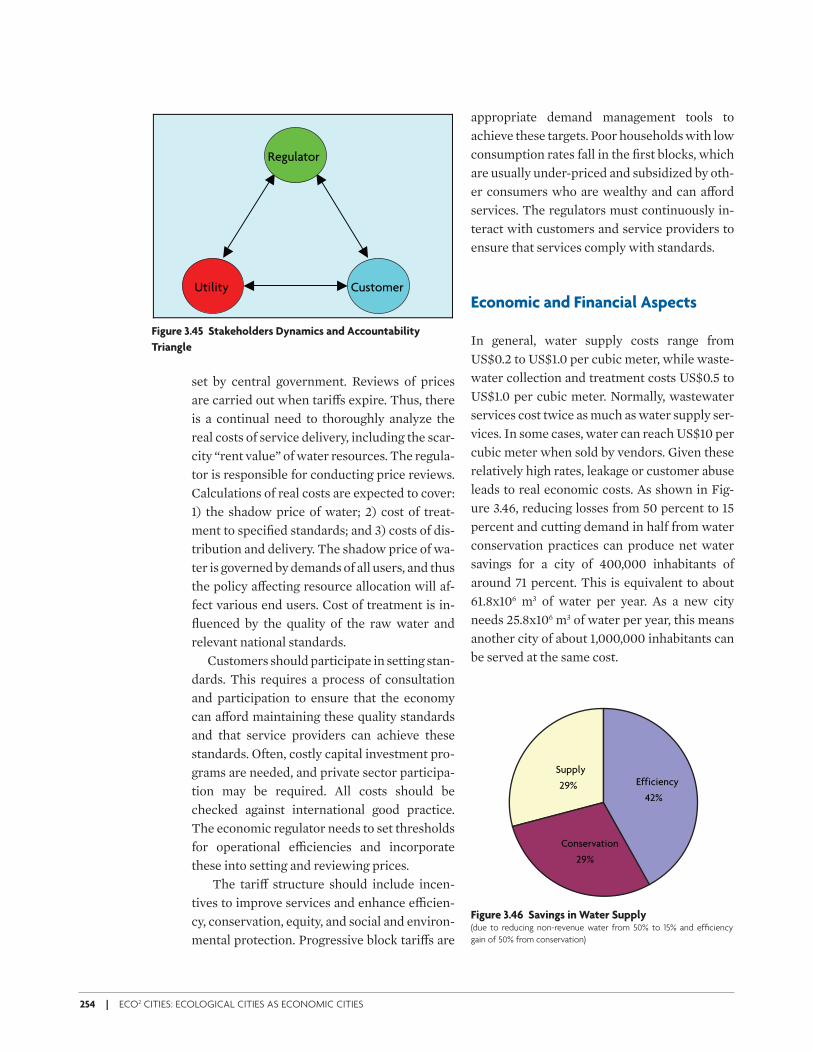
254 | ECO2 CITIES: ECOLOGICAL CITIES AS ECONOMIC CITIES
set by central government. Reviews of prices are carried out when tari( s expire. Thus, there is a continual need to thoroughly analyze the real costs of service delivery, including the scar-city “rent value” of water resources. The regula-tor is responsible for conducting price reviews. Calculations of real costs are expected to cover: 1) the shadow price of water; 2) cost of treat-ment to specifi ed standards; and 3) costs of dis-tribution and delivery. The shadow price of wa-ter is governed by demands of all users, and thus the policy a( ecting resource allocation will af-fect various end users. Cost of treatment is in-fl uenced by the quality of the raw water and relevant national standards.
Customers should participate in setting stan-dards. This requires a process of consultation and participation to ensure that the economy can a( ord maintaining these quality standards and that service providers can achieve these standards. Often, costly capital investment pro-grams are needed, and private sector participa-tion may be required. All costs should be checked against international good practice. The economic regulator needs to set thresholds for operational e+ ciencies and incorporate these into setting and reviewing prices.
The tari( structure should include incen-tives to improve services and enhance e+ cien-cy, conservation, equity, and social and environ-mental protection. Progressive block tari( s are
appropriate demand management tools to achieve these targets. Poor households with low consumption rates fall in the fi rst blocks, which are usually under-priced and subsidized by oth-er consumers who are wealthy and can a( ord services. The regulators must continuously in-teract with customers and service providers to ensure that services comply with standards.
Economic and Financial Aspects
In general, water supply costs range from US$0.2 to US$1.0 per cubic meter, while waste-water collection and treatment costs US$0.5 to US$1.0 per cubic meter. Normally, wastewater services cost twice as much as water supply ser-vices. In some cases, water can reach US$10 per cubic meter when sold by vendors. Given these relatively high rates, leakage or customer abuse leads to real economic costs. As shown in Fig-ure 3.46, reducing losses from 50 percent to 15 percent and cutting demand in half from water conservation practices can produce net water savings for a city of 400,000 inhabitants of around 71 percent. This is equivalent to about 61.8x10⁶ m3 of water per year. As a new city needs 25.8x10⁶ m3 of water per year, this means another city of about 1,000,000 inhabitants can be served at the same cost.
Utility
Regulator
Customer
Figure 3.45 Stakeholders Dynamics and Accountability
Triangle
Conservation
29%
Efficiency
42%
Supply
29%
Figure 3.46 Savings in Water Supply(due to reducing non-revenue water from 50% to 15% and effi ciency
gain of 50% from conservation)
ECo2-Part3brEV_PREP Sec1:254 6/15/09 9:04:28 AM
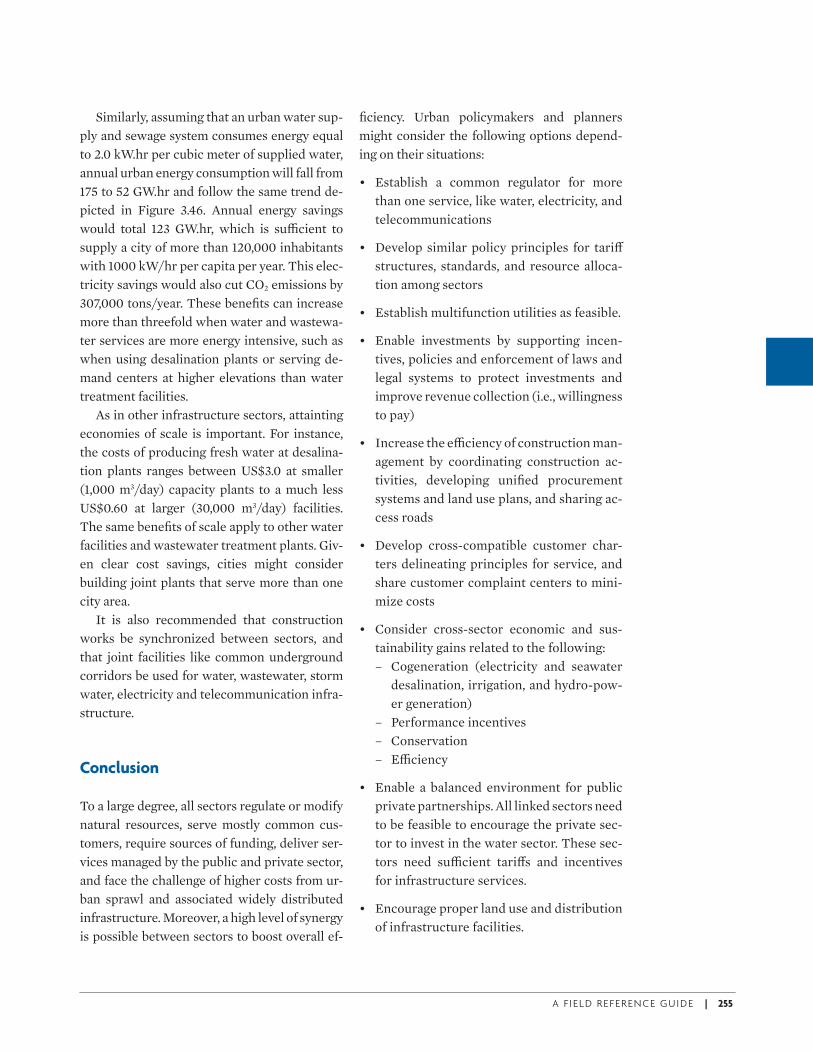
A F I E L D R E F E R E N C E G U I D E | 255
Similarly, assuming that an urban water sup-ply and sewage system consumes energy equal to 2.0 kW.hr per cubic meter of supplied water, annual urban energy consumption will fall from 175 to 52 GW.hr and follow the same trend de-picted in Figure 3.46. Annual energy savings would total 123 GW.hr, which is su+ cient to supply a city of more than 120,000 inhabitants with 1000 kW/hr per capita per year. This elec-tricity savings would also cut CO2 emissions by 307,000 tons/year. These benefi ts can increase more than threefold when water and wastewa-ter services are more energy intensive, such as when using desalination plants or serving de-mand centers at higher elevations than water treatment facilities.
As in other infrastructure sectors, attainting economies of scale is important. For instance, the costs of producing fresh water at desalina-tion plants ranges between US$3.0 at smaller (1,000 m3/day) capacity plants to a much less US$0.60 at larger (30,000 m3/day) facilities. The same benefi ts of scale apply to other water facilities and wastewater treatment plants. Giv-en clear cost savings, cities might consider building joint plants that serve more than one city area.
It is also recommended that construction works be synchronized between sectors, and that joint facilities like common underground corridors be used for water, wastewater, storm water, electricity and telecommunication infra-structure.
Conclusion
To a large degree, all sectors regulate or modify natural resources, serve mostly common cus-tomers, require sources of funding, deliver ser-vices managed by the public and private sector, and face the challenge of higher costs from ur-ban sprawl and associated widely distributed infrastructure. Moreover, a high level of synergy is possible between sectors to boost overall ef-
fi ciency. Urban policymakers and planners might consider the following options depend-ing on their situations:
• Establish a common regulator for more than one service, like water, electricity, and telecommunications
• Develop similar policy principles for tari( structures, standards, and resource alloca-tion among sectors
• Establish multifunction utilities as feasible.
• Enable investments by supporting incen-tives, policies and enforcement of laws and legal systems to protect investments and improve revenue collection (i.e., willingness to pay)
• Increase the e+ ciency of construction man-agement by coordinating construction ac-tivities, developing unifi ed procurement systems and land use plans, and sharing ac-cess roads
• Develop cross-compatible customer char-ters delineating principles for service, and share customer complaint centers to mini-mize costs
• Consider cross-sector economic and sus-tainability gains related to the following:– Cogeneration (electricity and seawater
desalination, irrigation, and hydro-pow-er generation)
– Performance incentives– Conservation– E+ ciency
• Enable a balanced environment for public private partnerships. All linked sectors need to be feasible to encourage the private sec-tor to invest in the water sector. These sec-tors need su+ cient tari( s and incentives for infrastructure services.
• Encourage proper land use and distribution of infrastructure facilities.
ECo2-Part3brEV_PREP Sec1:255 6/15/09 9:04:28 AM

ECo2-Part3brEV_PREP Sec1:256 6/15/09 9:04:28 AM
A F I E L D R E F E R E N C E G U I D E | 257
Cities and TransportSECTOR NOTE 3
Overview
The reasons that cities should care about the transport sector are myriad and complex: trans-port produces important benefi ts (principally mobility and accessibility) and enables the eco-nomic and social activity that sustains urban life. At the same time, transport consumes sig-nifi cant shares of land, energy, time, and other resources, and generates specifi c undesired outputs such as pollution and accidents. This chapter addresses urban transport issues, par-ticularly those in fast-growing cities that face challenges and various investment options.
Transport is not an end per se, but rather
a means to one or multiple ends such as ac-
cess to jobs, markets, and other social or
economic opportunities. For this reason, it is di+ cult to create a single objective recogniz-ing all relevant constraints and tradeo( s. An urban transport system requires many inputs —some more controllable than others—and produces numerous outputs—some desirable and others undesirable—which infl uence the inputs. These are described and illustrated be-low in Figure 3.47.
“Independent inputs”, which are mostly
given or not controllable, include: 1) demo-graphic and economic conditions (i.e., popula-tion, income, and types of industries), 2) geo-graphic constraints (e.g., rivers, lakes, coastline, mountains, etc.), 3) climatic and atmospheric conditions, and 4) social norms and historical
practices. Among other things, these inputs in-fl uence land development patterns (i.e., distri-bution of land uses and densities), the shape of the city (i.e., linear, circular, semi-circular), and the spatial and temporal travel patterns (e.g., ra-dial, circumferential, and polycentric patterns; and trip trends at di( erent daily hours, week-days, seasons, etc.).
The “dependent inputs” over which deci-
sion-makers retain some degree of control,
and the focus of this chapter, include: 1) poli-cy, legislation and regulations, 2) institutions, 3) physical systems, technology and spatial plan-ning, 4) stakeholder dynamics, and 5) economic and fi nancial factors. All these inputs should be considered when analyzing problems and po-tential interventions. Urban transport interven-tions, including for passengers and freight, in-volve one or more of the following:
• Land use and travel demand—interven-tions that infl uence travel behavior includ-ing origins and destinations (O-D), purpos-es, modes, frequencies, and trip distances.
• Infrastructure and services—interventions that enhance the supply or capacity of in-frastructure and services such as roads, public transport, tra+ c management, and other investments.
• Vehicle fl eet and fuel supply—interventions that alter the number, composition, tech-nologies, or use of vehicles and fuels.
ECo2-Part3brEV_PREP Sec1:257 6/15/09 9:04:28 AM
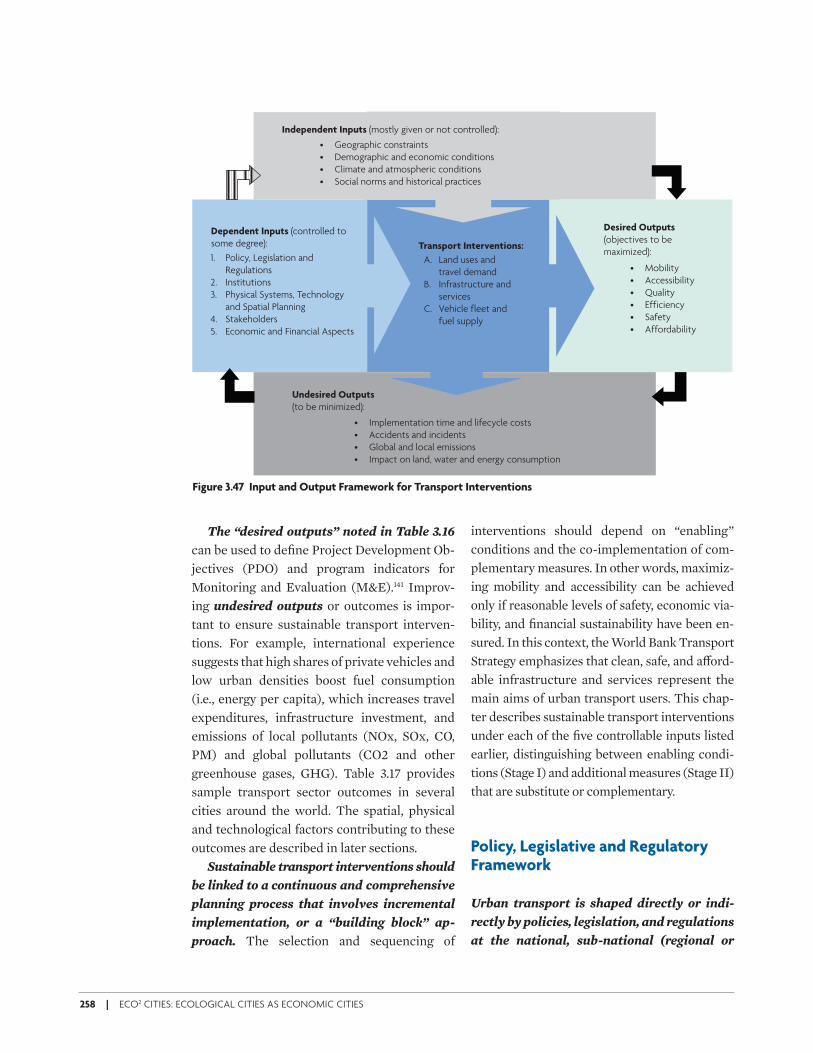
258 | ECO2 CITIES: ECOLOGICAL CITIES AS ECONOMIC CITIES
The “desired outputs” noted in Table 3.16 can be used to defi ne Project Development Ob-jectives (PDO) and program indicators for Monitoring and Evaluation (M&E).141 Improv-ing undesired outputs or outcomes is impor-tant to ensure sustainable transport interven-tions. For example, international experience suggests that high shares of private vehicles and low urban densities boost fuel consumption (i.e., energy per capita), which increases travel expenditures, infrastructure investment, and emissions of local pollutants (NOx, SOx, CO, PM) and global pollutants (CO2 and other greenhouse gases, GHG). Table 3.17 provides sample transport sector outcomes in several cities around the world. The spatial, physical and technological factors contributing to these outcomes are described in later sections.
Sustainable transport interventions should
be linked to a continuous and comprehensive
planning process that involves incremental
implementation, or a “building block” ap-
proach. The selection and sequencing of
interventions should depend on “enabling” conditions and the co-implementation of com-plementary measures. In other words, maximiz-ing mobility and accessibility can be achieved only if reasonable levels of safety, economic via-bility, and fi nancial sustainability have been en-sured. In this context, the World Bank Transport Strategy emphasizes that clean, safe, and a( ord-able infrastructure and services represent the main aims of urban transport users. This chap-ter describes sustainable transport interventions under each of the fi ve controllable inputs listed earlier, distinguishing between enabling condi-tions (Stage I) and additional measures (Stage II) that are substitute or complementary.
Policy, Legislative and Regulatory Framework
Urban transport is shaped directly or indi-
rectly by policies, legislation, and regulations
at the national, sub-national (regional or
• Geographic constraints
• Demographic and economic conditions
• Climate and atmospheric conditions
• Social norms and historical practices
Independent Inputs (mostly given or not controlled):
• Mobility
• Accessibility
• Quality
• Efficiency
• Safety
• Affordability
Desired Outputs
(objectives to be
maximized):A. Land uses and
travel demand
B. Infrastructure and
services
C. Vehicle fleet and
fuel supply
Transport Interventions:
• Implementation time and lifecycle costs
• Accidents and incidents
• Global and local emissions
• Impact on land, water and energy consumption
Undesired Outputs
(to be minimized):
1. Policy, Legislation and
Regulations
2. Institutions
3. Physical Systems, Technology
and Spatial Planning
4. Stakeholders
5. Economic and Financial Aspects
Dependent Inputs (controlled to
some degree):
Figure 3.47 Input and Output Framework for Transport Interventions
ECo2-Part3brEV_PREP Sec1:258 6/15/09 9:04:28 AM
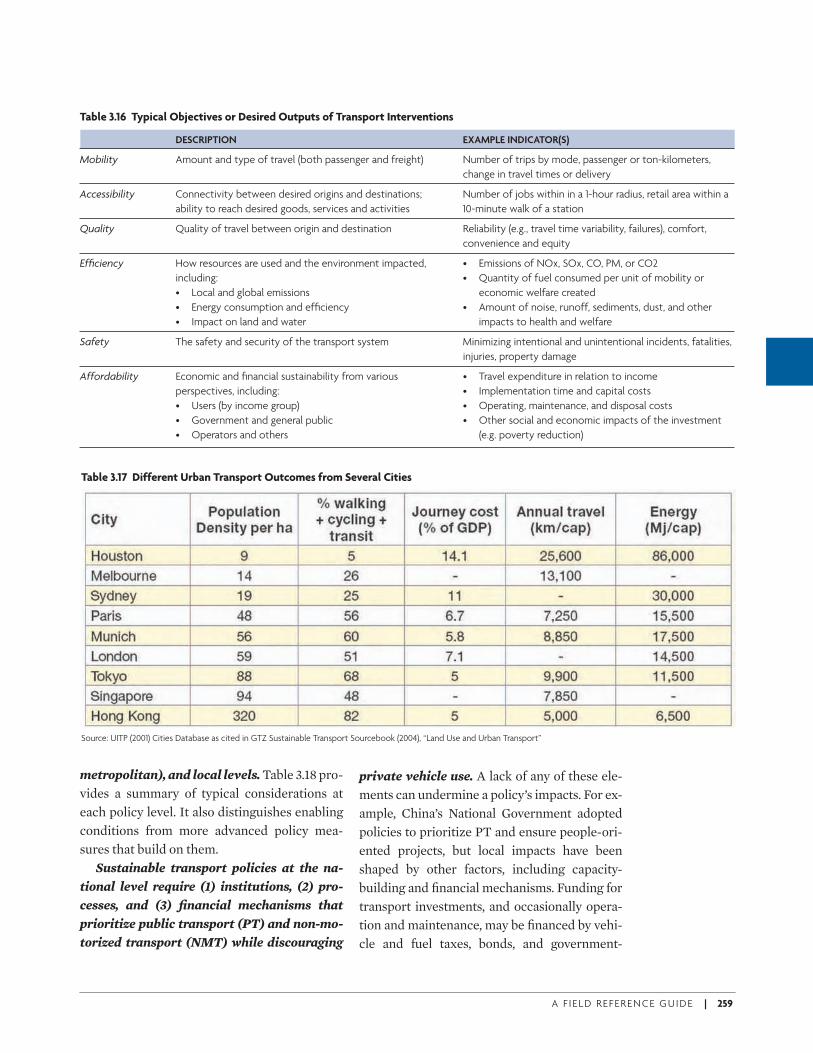
A F I E L D R E F E R E N C E G U I D E | 259
metropolitan), and local levels. Table 3.18 pro-vides a summary of typical considerations at each policy level. It also distinguishes enabling conditions from more advanced policy mea-sures that build on them.
Sustainable transport policies at the na-
tional level require (1) institutions, (2) pro-
cesses, and (3) fi nancial mechanisms that
prioritize public transport (PT) and non-mo-
torized transport (NMT) while discouraging
private vehicle use. A lack of any of these ele-ments can undermine a policy’s impacts. For ex-ample, China’s National Government adopted policies to prioritize PT and ensure people-ori-ented projects, but local impacts have been shaped by other factors, including capacity-building and fi nancial mechanisms. Funding for transport investments, and occasionally opera-tion and maintenance, may be fi nanced by vehi-cle and fuel taxes, bonds, and government-
Table 3.16 Typical Objectives or Desired Outputs of Transport Interventions
DESCRIPTION EXAMPLE INDICATOR(S)
Mobility Amount and type of travel (both passenger and freight) Number of trips by mode, passenger or ton-kilometers,
change in travel times or delivery
Accessibility Connectivity between desired origins and destinations; Number of jobs within in a 1-hour radius, retail area within a
ability to reach desired goods, services and activities 10-minute walk of a station
Quality Quality of travel between origin and destination Reliability (e.g., travel time variability, failures), comfort,
convenience and equity
Effi ciency How resources are used and the environment impacted, • Emissions of NOx, SOx, CO, PM, or CO2
including: • Quantity of fuel consumed per unit of mobility or
• Local and global emissions economic welfare created
• Energy consumption and effi ciency • Amount of noise, runoff, sediments, dust, and other
• Impact on land and water impacts to health and welfare
Safety The safety and security of the transport system Minimizing intentional and unintentional incidents, fatalities,
injuries, property damage
Affordability Economic and fi nancial sustainability from various • Travel expenditure in relation to income
perspectives, including: • Implementation time and capital costs
• Users (by income group) • Operating, maintenance, and disposal costs
• Government and general public • Other social and economic impacts of the investment
• Operators and others (e.g. poverty reduction)
Table 3.17 Different Urban Transport Outcomes from Several Cities
Source: UITP (2001) Cities Database as cited in GTZ Sustainable Transport Sourcebook (2004), “Land Use and Urban Transport”
ECo2-Part3brEV_PREP Sec1:259 6/15/09 9:04:28 AM
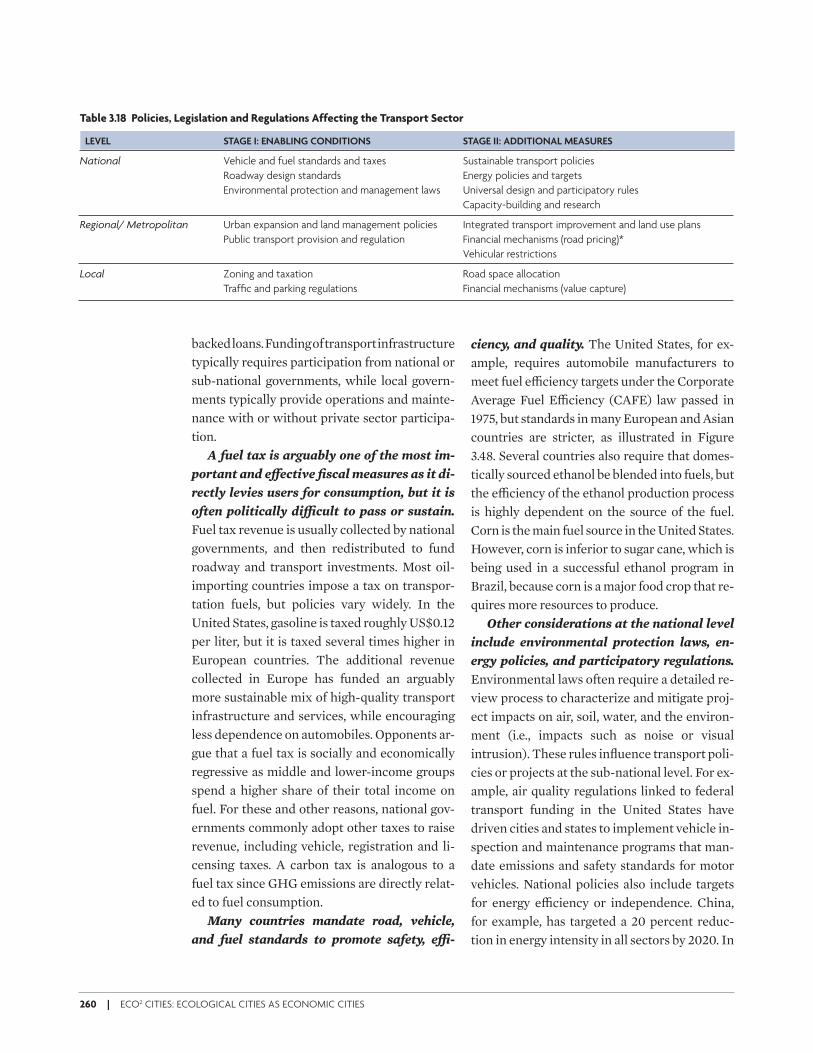
260 | ECO2 CITIES: ECOLOGICAL CITIES AS ECONOMIC CITIES
backed loans. Funding of transport infrastructure typically requires participation from national or sub-national governments, while local govern-ments typically provide operations and mainte-nance with or without private sector participa-tion.
A fuel tax is arguably one of the most im-
portant and e/ ective fi scal measures as it di-
rectly levies users for consumption, but it is
often politically di" cult to pass or sustain. Fuel tax revenue is usually collected by national governments, and then redistributed to fund roadway and transport investments. Most oil-importing countries impose a tax on transpor-tation fuels, but policies vary widely. In the United States, gasoline is taxed roughly US$0.12 per liter, but it is taxed several times higher in European countries. The additional revenue collected in Europe has funded an arguably more sustainable mix of high-quality transport infrastructure and services, while encouraging less dependence on automobiles. Opponents ar-gue that a fuel tax is socially and economically regressive as middle and lower-income groups spend a higher share of their total income on fuel. For these and other reasons, national gov-ernments commonly adopt other taxes to raise revenue, including vehicle, registration and li-censing taxes. A carbon tax is analogous to a fuel tax since GHG emissions are directly relat-ed to fuel consumption.
Many countries mandate road, vehicle,
and fuel standards to promote safety, e" -
ciency, and quality. The United States, for ex-ample, requires automobile manufacturers to meet fuel e+ ciency targets under the Corporate Average Fuel E+ ciency (CAFE) law passed in 1975, but standards in many European and Asian countries are stricter, as illustrated in Figure 3.48. Several countries also require that domes-tically sourced ethanol be blended into fuels, but the e+ ciency of the ethanol production process is highly dependent on the source of the fuel. Corn is the main fuel source in the United States. However, corn is inferior to sugar cane, which is being used in a successful ethanol program in Brazil, because corn is a major food crop that re-quires more resources to produce.
Other considerations at the national level
include environmental protection laws, en-
ergy policies, and participatory regulations. Environmental laws often require a detailed re-view process to characterize and mitigate proj-ect impacts on air, soil, water, and the environ-ment (i.e., impacts such as noise or visual intrusion). These rules infl uence transport poli-cies or projects at the sub-national level. For ex-ample, air quality regulations linked to federal transport funding in the United States have driven cities and states to implement vehicle in-spection and maintenance programs that man-date emissions and safety standards for motor vehicles. National policies also include targets for energy e+ ciency or independence. China, for example, has targeted a 20 percent reduc-tion in energy intensity in all sectors by 2020. In
Table 3.18 Policies, Legislation and Regulations Affecting the Transport Sector
LEVEL STAGE I: ENABLING CONDITIONS STAGE II: ADDITIONAL MEASURES
National Vehicle and fuel standards and taxes Sustainable transport policies
Roadway design standards Energy policies and targets
Environmental protection and management laws Universal design and participatory rules
Capacity-building and research
Regional/ Metropolitan Urban expansion and land management policies Integrated transport improvement and land use plans
Public transport provision and regulation Financial mechanisms (road pricing)*
Vehicular restrictions
Local Zoning and taxation Road space allocation
Traffi c and parking regulations Financial mechanisms (value capture)
ECo2-Part3brEV_PREP Sec1:260 6/15/09 9:04:29 AM
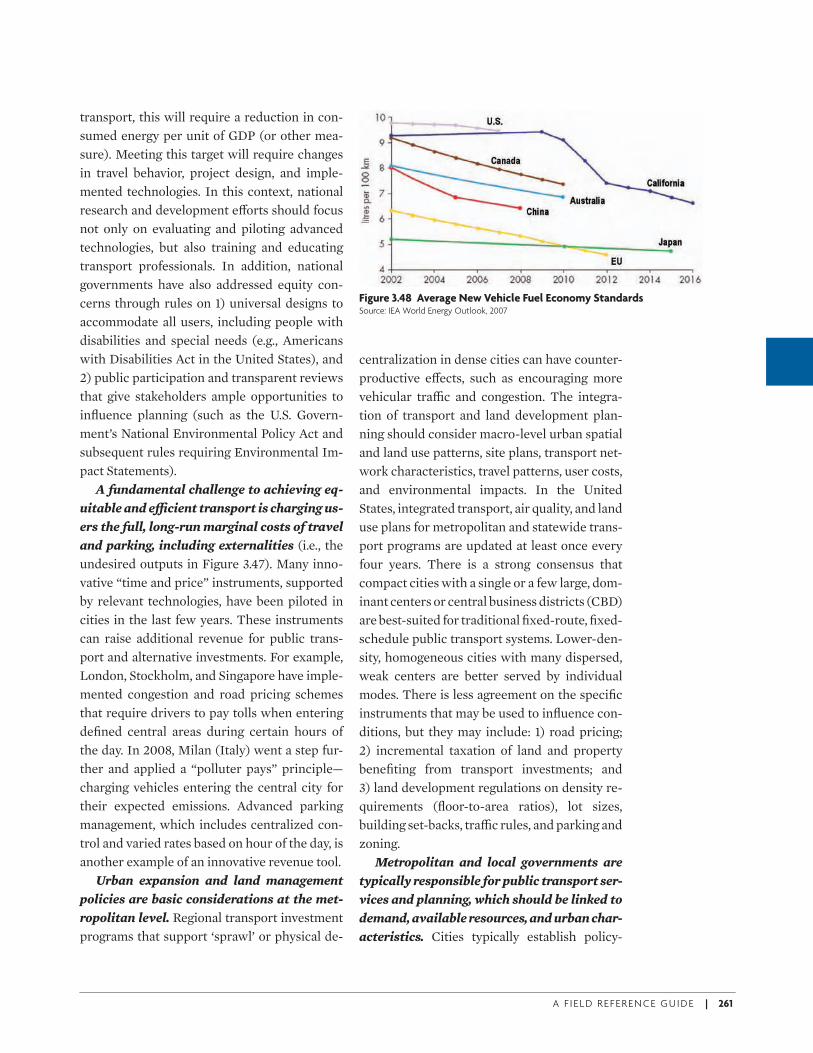
A F I E L D R E F E R E N C E G U I D E | 261
transport, this will require a reduction in con-sumed energy per unit of GDP (or other mea-sure). Meeting this target will require changes in travel behavior, project design, and imple-mented technologies. In this context, national research and development e( orts should focus not only on evaluating and piloting advanced technologies, but also training and educating transport professionals. In addition, national governments have also addressed equity con-cerns through rules on 1) universal designs to accommodate all users, including people with disabilities and special needs (e.g., Americans with Disabilities Act in the United States), and 2) public participation and transparent reviews that give stakeholders ample opportunities to infl uence planning (such as the U.S. Govern-ment’s National Environmental Policy Act and subsequent rules requiring Environmental Im-pact Statements).
A fundamental challenge to achieving eq-
uitable and e" cient transport is charging us-
ers the full, long-run marginal costs of travel
and parking, including externalities (i.e., the undesired outputs in Figure 3.47). Many inno-vative “time and price” instruments, supported by relevant technologies, have been piloted in cities in the last few years. These instruments can raise additional revenue for public trans-port and alternative investments. For example, London, Stockholm, and Singapore have imple-mented congestion and road pricing schemes that require drivers to pay tolls when entering defi ned central areas during certain hours of the day. In 2008, Milan (Italy) went a step fur-ther and applied a “polluter pays” principle—charging vehicles entering the central city for their expected emissions. Advanced parking management, which includes centralized con-trol and varied rates based on hour of the day, is another example of an innovative revenue tool.
Urban expansion and land management
policies are basic considerations at the met-
ropolitan level. Regional transport investment programs that support ‘sprawl’ or physical de-
centralization in dense cities can have counter-productive e( ects, such as encouraging more vehicular tra+ c and congestion. The integra-tion of transport and land development plan-ning should consider macro-level urban spatial and land use patterns, site plans, transport net-work characteristics, travel patterns, user costs, and environmental impacts. In the United States, integrated transport, air quality, and land use plans for metropolitan and statewide trans-port programs are updated at least once every four years. There is a strong consensus that compact cities with a single or a few large, dom-inant centers or central business districts (CBD) are best-suited for traditional fi xed-route, fi xed-schedule public transport systems. Lower-den-sity, homogeneous cities with many dispersed, weak centers are better served by individual modes. There is less agreement on the specifi c instruments that may be used to infl uence con-ditions, but they may include: 1) road pricing; 2) incremental taxation of land and property benefi ting from transport investments; and 3) land development regulations on density re-quirements (fl oor-to-area ratios), lot sizes, building set-backs, tra+ c rules, and parking and zoning.
Metropolitan and local governments are
typically responsible for public transport ser-
vices and planning, which should be linked to
demand, available resources, and urban char-
acteristics. Cities typically establish policy-
Figure 3.48 Average New Vehicle Fuel Economy Standards Source: IEA World Energy Outlook, 2007
ECo2-Part3brEV_PREP Sec1:261 6/15/09 9:04:29 AM
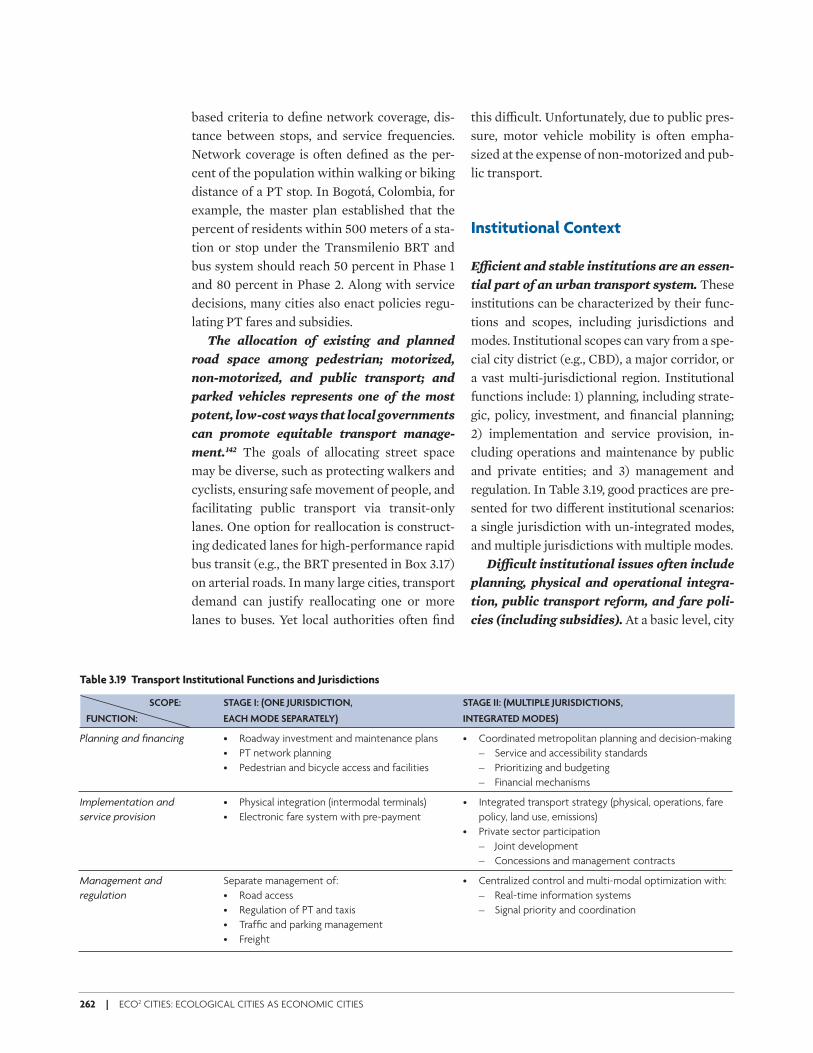
262 | ECO2 CITIES: ECOLOGICAL CITIES AS ECONOMIC CITIES
based criteria to defi ne network coverage, dis-tance between stops, and service frequencies. Network coverage is often defi ned as the per-cent of the population within walking or biking distance of a PT stop. In Bogotá, Colombia, for example, the master plan established that the percent of residents within 500 meters of a sta-tion or stop under the Transmilenio BRT and bus system should reach 50 percent in Phase 1 and 80 percent in Phase 2. Along with service decisions, many cities also enact policies regu-lating PT fares and subsidies.
The allocation of existing and planned
road space among pedestrian; motorized,
non-motorized, and public transport; and
parked vehicles represents one of the most
potent, low-cost ways that local governments
can promote equitable transport manage-
ment.142 The goals of allocating street space may be diverse, such as protecting walkers and cyclists, ensuring safe movement of people, and facilitating public transport via transit-only lanes. One option for reallocation is construct-ing dedicated lanes for high-performance rapid bus transit (e.g., the BRT presented in Box 3.17) on arterial roads. In many large cities, transport demand can justify reallocating one or more lanes to buses. Yet local authorities often fi nd
this di+ cult. Unfortunately, due to public pres-sure, motor vehicle mobility is often empha-sized at the expense of non-motorized and pub-lic transport.
Institutional Context
E" cient and stable institutions are an essen-
tial part of an urban transport system. These institutions can be characterized by their func-tions and scopes, including jurisdictions and modes. Institutional scopes can vary from a spe-cial city district (e.g., CBD), a major corridor, or a vast multi-jurisdictional region. Institutional functions include: 1) planning, including strate-gic, policy, investment, and fi nancial planning; 2) implementation and service provision, in-cluding operations and maintenance by public and private entities; and 3) management and regulation. In Table 3.19, good practices are pre-sented for two di( erent institutional scenarios: a single jurisdiction with un-integrated modes, and multiple jurisdictions with multiple modes.
Di" cult institutional issues often include
planning, physical and operational integra-
tion, public transport reform, and fare poli-
cies (including subsidies). At a basic level, city
Table 3.19 Transport Institutional Functions and Jurisdictions
SCOPE: STAGE I: (ONE JURISDICTION, STAGE II: (MULTIPLE JURISDICTIONS,
FUNCTION: EACH MODE SEPARATELY) INTEGRATED MODES)
Planning and fi nancing • Roadway investment and maintenance plans • Coordinated metropolitan planning and decision-making
• PT network planning – Service and accessibility standards
• Pedestrian and bicycle access and facilities – Prioritizing and budgeting
– Financial mechanisms
Implementation and • Physical integration (intermodal terminals) • Integrated transport strategy (physical, operations, fare
service provision • Electronic fare system with pre-payment policy, land use, emissions)
• Private sector participation
– Joint development
– Concessions and management contracts
Management and Separate management of: • Centralized control and multi-modal optimization with:
regulation • Road access – Real-time information systems
• Regulation of PT and taxis – Signal priority and coordination
• Traffi c and parking management
• Freight
ECo2-Part3brEV_PREP Sec1:262 6/15/09 9:04:30 AM
A F I E L D R E F E R E N C E G U I D E | 263
transport institutions create forums for discus-sion and coordination between road planners, economic planners, public transport operators, tra+ c management o+ cials, and police. In Chi-na, many cities have “leading groups” chaired by city o+ cials. At an advanced level, transport institutions can represent forums for joint deci-sion-making and priority-setting across multi-ple jurisdictions and multiple modes. Some good examples of this include Madrid (Consor-cio de Madrid), Paris (STIF), London (Transport for London), Vancouver (TransLink), and Sin-gapore (Land Transport Authority). Good ex-amples also exist in emerging countries. Box 3.13 summarizes the essential “pillars” of sus-tainable transport institutions based on inter-national experience in Latin America and other regions.
Ideally, there should be one metropolitan
authority overseeing all transport issues and
modes, particularly in regions with multiple
jurisdictions. This authority should plan mul-tiple modes, set priorities, and coordinate deci-sions on investments, taking into account land and environmental plans and the concerns of the public, civil society, and private sectors. The authority should oversee strategic policies and management of modes, including parking, taxis, public transport, highways, and arterial roads. The regulation and reform of public transport is challenging as it must balance the roles of the public and private sectors and respond to local conditions. An excerpt from recent World Bank operational guide illustrates challenges: “Insti-tutional approaches to providing public transport
services range from a single publicly-owned mo-
nopoly operator at one extreme, to numerous
weakly regulated or un-regulated small-scale,
privately owned providers at the other. In some
cities, a range of approaches coexist. The fi rst ex-
treme tends toward ine& cient operations and
uneconomic fares both of which map into high
subsidies. It may also produce poor services, es-
pecially when the subsidy mechanism fails and
operators are starved for funds. The other ex-
treme may produce good services at zero public
expenditure, but more often provides poor service
with high accident and pollution costs. When this
regulatory set-up is matched by low fares con-
strained by regulation or unfettered competition,
service levels and quality fall and externalities
rise.”143
Physical Systems, Technology and Spatial Planning
The design of systems, technologies, and spa-
tial plans should be driven by current or near-
term transport demand and a longer-term
credible and transparent transport plan. The transport plan is the product of a continuous, comprehensive, and inclusive process. Spatial planning should consider future land uses and existing travel and freight demand. Physical systems and technologies include the supply of infrastructure and services for passengers and
Four Pillars of Sustainable Urban Transport Institutions
Before fi nancing major urban transport projects, decision-makers should at-
tempt to put in place the basic elements that ensure long-term sustainabil-
ity of the sector. Specifi cally, policymakers should incorporate a four-point
agenda into any urban transport strategy:
Create a regional transport coordination commission in charge of coor-
dinating policies among federal, state, and municipal governments, giving
highest priority to major urban transport investments in the metropolitan
region and promoting modal integration; this will help improve the sector’s
economic effi ciency and long-term sustainability.
Adopt a strategy for integrated land use, urban transport, and air quality
that provides a framework for community and decision-makers to evaluate
future urban transport investments and policies.
Enact into law formal fi nancing mechanisms to ensure that long-run vari-
able costs of urban transport systems are covered by operating and non-
operating revenues and by appropriate user charges.
Promote private sector participation in the operation, maintenance, and
construction of urban transport systems to lessen the fi nancial burden on the
government (through, for example, concessions or management contracts).
BOX 3.13
Adapted from: Rebelo, J. (1996). “Essentials for Sustainable Urban Transport in Brazil’s Large
Metropolitan Areas.” World Bank Working Paper Series 1633.
ECo2-Part3brEV_PREP Sec1:263 6/15/09 9:04:30 AM
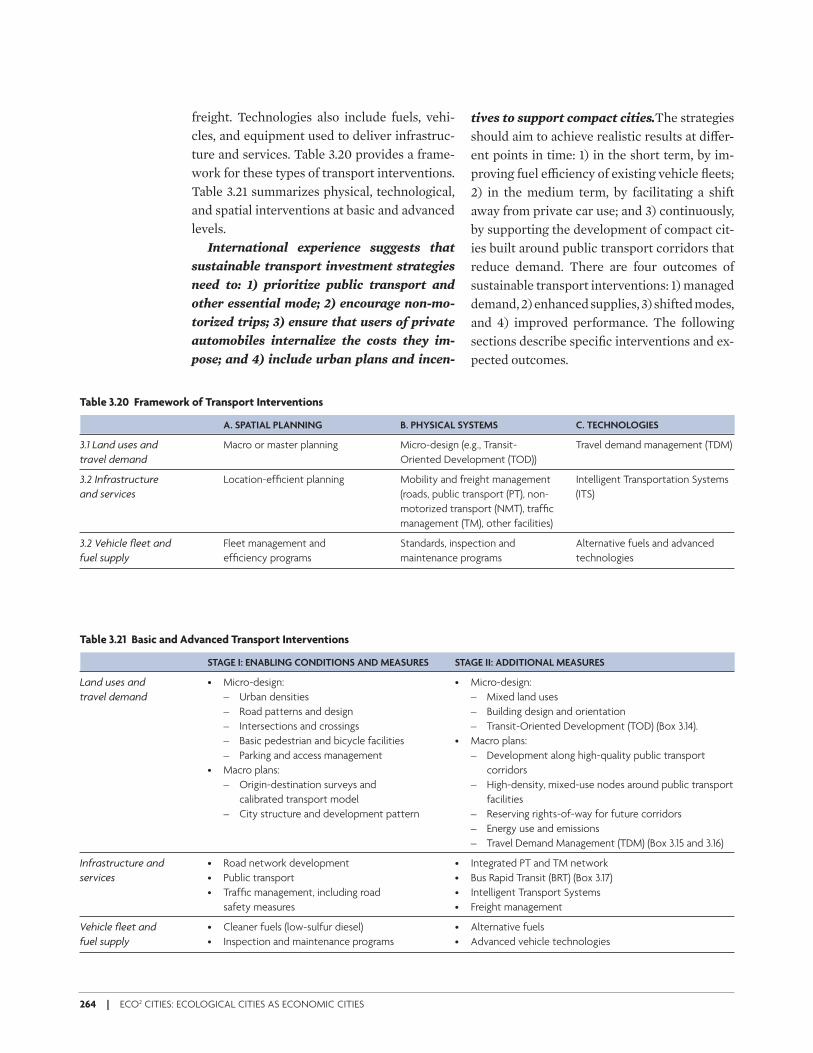
264 | ECO2 CITIES: ECOLOGICAL CITIES AS ECONOMIC CITIES
freight. Technologies also include fuels, vehi-cles, and equipment used to deliver infrastruc-ture and services. Table 3.20 provides a frame-work for these types of transport interventions. Table 3.21 summarizes physical, technological, and spatial interventions at basic and advanced levels.
International experience suggests that
sustainable transport investment strategies
need to: 1) prioritize public transport and
other essential mode; 2) encourage non-mo-
torized trips; 3) ensure that users of private
automobiles internalize the costs they im-
pose; and 4) include urban plans and incen-
tives to support compact cities.The strategies should aim to achieve realistic results at di( er-ent points in time: 1) in the short term, by im-proving fuel e+ ciency of existing vehicle fl eets; 2) in the medium term, by facilitating a shift away from private car use; and 3) continuously, by supporting the development of compact cit-ies built around public transport corridors that reduce demand. There are four outcomes of sustainable transport interventions: 1) managed demand, 2) enhanced supplies, 3) shifted modes, and 4) improved performance. The following sections describe specifi c interventions and ex-pected outcomes.
Table 3.20 Framework of Transport Interventions
A. SPATIAL PLANNING B. PHYSICAL SYSTEMS C. TECHNOLOGIES
3.1 Land uses and Macro or master planning Micro-design (e.g., Transit- Travel demand management (TDM)
travel demand Oriented Development (TOD))
3.2 Infrastructure Location-effi cient planning Mobility and freight management Intelligent Transportation Systems
and services (roads, public transport (PT), non- (ITS)
motorized transport (NMT), traffi c
management (TM), other facilities)
3.2 Vehicle fl eet and Fleet management and Standards, inspection and Alternative fuels and advanced
fuel supply effi ciency programs maintenance programs technologies
Table 3.21 Basic and Advanced Transport Interventions
STAGE I: ENABLING CONDITIONS AND MEASURES STAGE II: ADDITIONAL MEASURES
Land uses and • Micro-design: • Micro-design:
travel demand – Urban densities – Mixed land uses
– Road patterns and design – Building design and orientation
– Intersections and crossings – Transit-Oriented Development (TOD) (Box 3.14).
– Basic pedestrian and bicycle facilities • Macro plans:
– Parking and access management – Development along high-quality public transport
• Macro plans: corridors
– Origin-destination surveys and – High-density, mixed-use nodes around public transport
calibrated transport model facilities
– City structure and development pattern – Reserving rights-of-way for future corridors
– Energy use and emissions
– Travel Demand Management (TDM) (Box 3.15 and 3.16)
Infrastructure and • Road network development • Integrated PT and TM network
services • Public transport • Bus Rapid Transit (BRT) (Box 3.17)
• Traffi c management, including road • Intelligent Transport Systems
safety measures • Freight management
Vehicle fl eet and • Cleaner fuels (low-sulfur diesel) • Alternative fuels
fuel supply • Inspection and maintenance programs • Advanced vehicle technologies
ECo2-Part3brEV_PREP Sec1:264 6/15/09 9:04:30 AM
A F I E L D R E F E R E N C E G U I D E | 265
3.1 Land Uses and Travel Demand 144
The transport plan should recognize the ef-
fects of transport interventions on future
land development and travel demand. The interaction between transport supplies and land use is a complex, two-way relationship. Exist-ing land uses and developments are “served” by transport infrastructure and services, which in turn “induce” certain types of land develop-ment and travel patterns.
Spatial planning is one of the most impor-
tant factors infl uencing the demand, mode
choice, and fi nancing of urban transport in-
vestments. In turn, sustainable development can be the most important goal of transport in-vestments, particularly public transport. Land development planning should include two complementary approaches: a “macro” or top-down approach, and a “micro” or bottom-up approach. The macro approach entails viewing the city or region from “10,000 meters” with a time horizon of more than one decade. Strategic planning and alternative analysis are initial steps in the macro approach that allow selec-tion of appropriate modes and a city’s align-ment. The micro approach is more focused geo-graphically (i.e., on blocks or corridors) and anthropogenically. It also has a shorter time ho-rizon (<10 years) and requires more detailed preliminary designs.
At the macro level, the major determinants
of travel demand include the distribution
and character of land use. Transport invest-ments can positively infl uence the distribution and character of land use by creating accessible and visible development nodes. For example, properly located public transport stations can be focal points for development, thus increas-ing public transport demand, reducing ine+ -cient land consumption (“sprawl”) and creating NMT opportunities. Other macro level plan-ning issues include:
High-density, mixed-uses around PT—PT tradi-tionally serves the city center and major activity centers, and particularly work-related travel.
The locations of activity centers and job sites af-fect the designs and e( ectiveness of public transport. Traditionally, jobs are concentrated in the city center, but cheaper land or perverse incentives can attract development and jobs to urban peripheries where there is little or no in-frastructure. Development in the urban periph-ery reduces economies of scale for public trans-port, making it more di+ cult to operate without substantial subsidies. Developing dense devel-opments around public transport is therefore critical.
High-quality PT corridors—Focusing develop-ment along high-capacity, high-quality PT cor-ridors is important, particularly to prevent un-planned development elsewhere. Such a strategy can be pursued in cities in China, but it has not yet been practiced e( ectively except in Hong Kong. In Singapore and Stockholm, urban rail and mass transit have been used e( ectively to supply high-quality PT. Bus Rapid Transit (BRT) is another innovative and cost-e( ective PT approach that was developed and is now widely applied in Latin America. Road infra-structure also plays a critical role. For example, the ring road model in Chinese cities induces higher private vehicle use and leads to dispersed development that is di+ cult to serve with PT.
City structure and development pattern—Radial city development and structures best facilitate high-capacity rail and bus systems provided that major job and activity sites are located in urban centers or along arteries (radial lines from the center, see Figure 3.49 below). Curiti-ba, Brazil is a good example of a radial, transit-oriented city in the developing world with a high-capacity BRT system serving fi ve high-density corridors. These arteries were planned, and rights-of-way were reserved, decades be-fore they were fully developed. This degree of urban foresight required a long-term vision and institutions that had su+ cient capacity and po-litical independence. Ring road or circumferen-tial development places fewer constraints on
ECo2-Part3brEV_PREP Sec1:265 6/15/09 9:04:30 AM
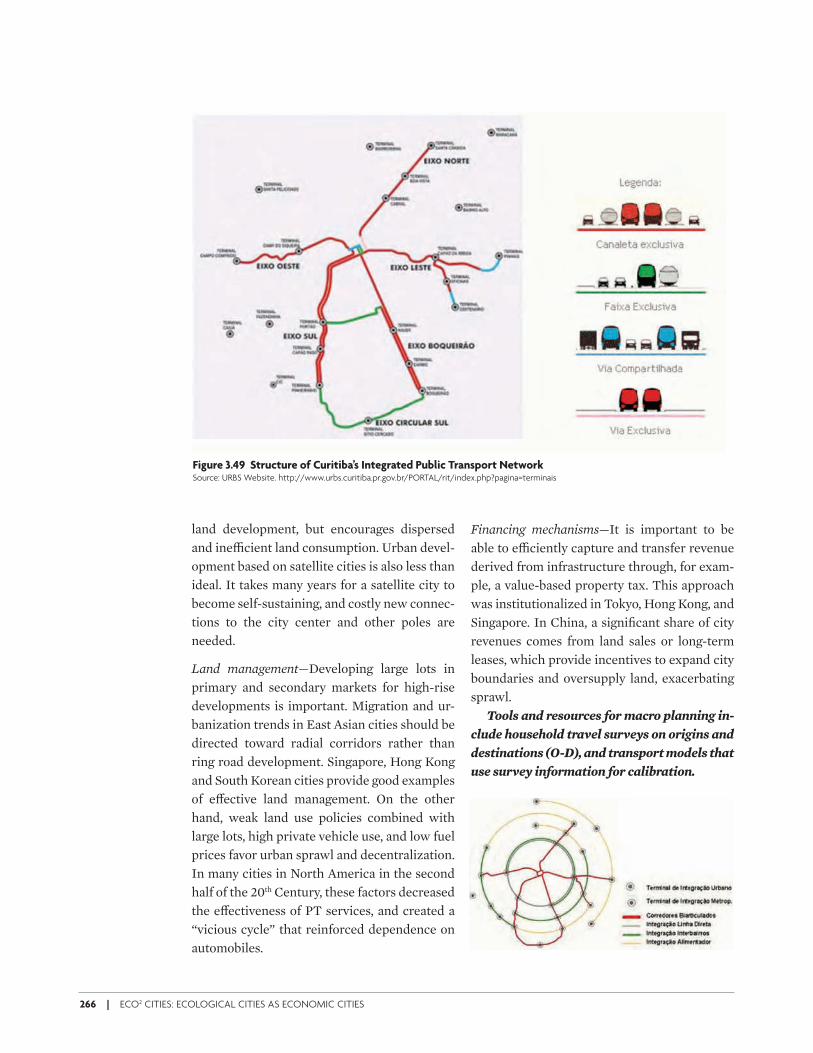
266 | ECO2 CITIES: ECOLOGICAL CITIES AS ECONOMIC CITIES
land development, but encourages dispersed and ine+ cient land consumption. Urban devel-opment based on satellite cities is also less than ideal. It takes many years for a satellite city to become self-sustaining, and costly new connec-tions to the city center and other poles are needed.
Land management—Developing large lots in primary and secondary markets for high-rise developments is important. Migration and ur-banization trends in East Asian cities should be directed toward radial corridors rather than ring road development. Singapore, Hong Kong and South Korean cities provide good examples of e( ective land management. On the other hand, weak land use policies combined with large lots, high private vehicle use, and low fuel prices favor urban sprawl and decentralization. In many cities in North America in the second half of the 20th Century, these factors decreased the e( ectiveness of PT services, and created a “vicious cycle” that reinforced dependence on automobiles.
Financing mechanisms—It is important to be able to e+ ciently capture and transfer revenue derived from infrastructure through, for exam-ple, a value-based property tax. This approach was institutionalized in Tokyo, Hong Kong, and Singapore. In China, a signifi cant share of city revenues comes from land sales or long-term leases, which provide incentives to expand city boundaries and oversupply land, exacerbating sprawl.
Tools and resources for macro planning in-
clude household travel surveys on origins and
destinations (O-D), and transport models that
use survey information for calibration.
Figure 3.49 Structure of Curitiba’s Integrated Public Transport NetworkSource: URBS Website. http://www.urbs.curitiba.pr.gov.br/PORTAL/rit/index.php?pagina=terminais
ECo2-Part3brEV_PREP Sec1:266 6/15/09 9:04:30 AM
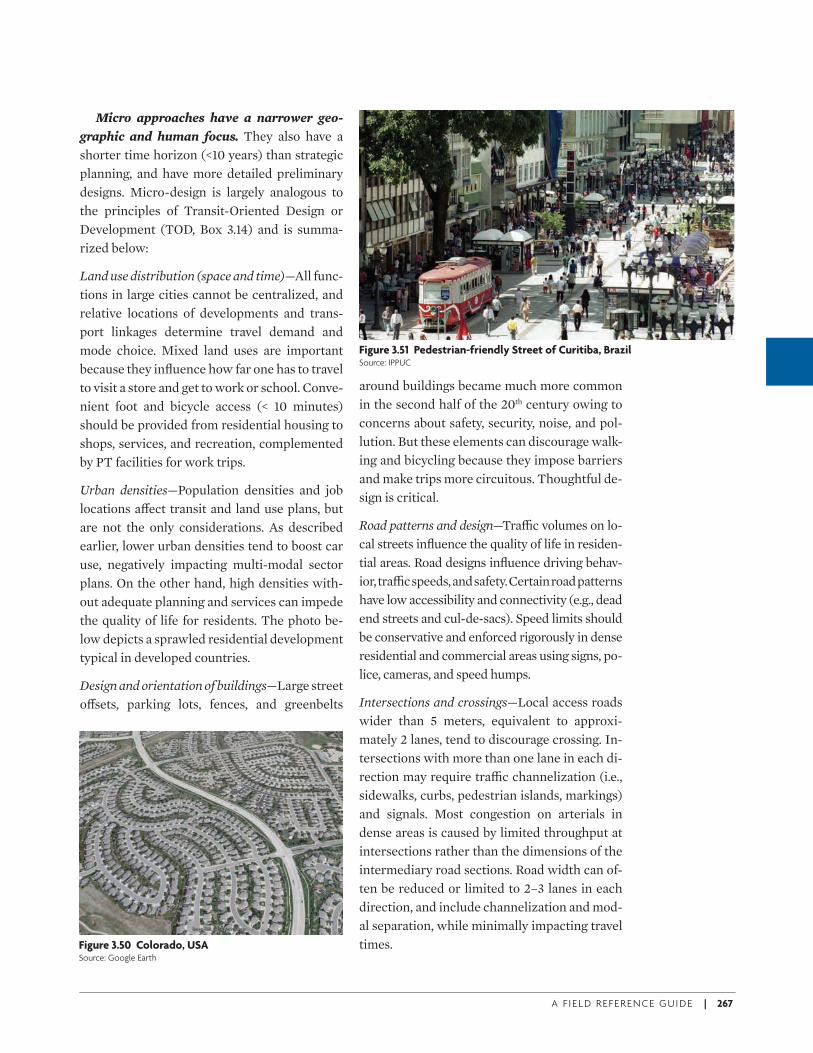
A F I E L D R E F E R E N C E G U I D E | 267
Micro approaches have a narrower geo-
graphic and human focus. They also have a shorter time horizon (<10 years) than strategic planning, and have more detailed preliminary designs. Micro-design is largely analogous to the principles of Transit-Oriented Design or Development (TOD, Box 3.14) and is summa-rized below:
Land use distribution (space and time)—All func-tions in large cities cannot be centralized, and relative locations of developments and trans-port linkages determine travel demand and mode choice. Mixed land uses are important because they infl uence how far one has to travel to visit a store and get to work or school. Conve-nient foot and bicycle access (< 10 minutes) should be provided from residential housing to shops, services, and recreation, complemented by PT facilities for work trips.
Urban densities—Population densities and job locations a( ect transit and land use plans, but are not the only considerations. As described earlier, lower urban densities tend to boost car use, negatively impacting multi-modal sector plans. On the other hand, high densities with-out adequate planning and services can impede the quality of life for residents. The photo be-low depicts a sprawled residential development typical in developed countries.
Design and orientation of buildings—Large street o( sets, parking lots, fences, and greenbelts
around buildings became much more common in the second half of the 20th century owing to concerns about safety, security, noise, and pol-lution. But these elements can discourage walk-ing and bicycling because they impose barriers and make trips more circuitous. Thoughtful de-sign is critical.
Road patterns and design—Tra+ c volumes on lo-cal streets infl uence the quality of life in residen-tial areas. Road designs infl uence driving behav-ior, tra+ c speeds, and safety. Certain road patterns have low accessibility and connectivity (e.g., dead end streets and cul-de-sacs). Speed limits should be conservative and enforced rigorously in dense residential and commercial areas using signs, po-lice, cameras, and speed humps.
Intersections and crossings—Local access roads wider than 5 meters, equivalent to approxi-mately 2 lanes, tend to discourage crossing. In-tersections with more than one lane in each di-rection may require tra+ c channelization (i.e., sidewalks, curbs, pedestrian islands, markings) and signals. Most congestion on arterials in dense areas is caused by limited throughput at intersections rather than the dimensions of the intermediary road sections. Road width can of-ten be reduced or limited to 2–3 lanes in each direction, and include channelization and mod-al separation, while minimally impacting travel times.Figure 3.50 Colorado, USA
Source: Google Earth
Figure 3.51 Pedestrian-friendly Street of Curitiba, BrazilSource: IPPUC
ECo2-Part3brEV_PREP Sec1:267 6/15/09 9:04:31 AM
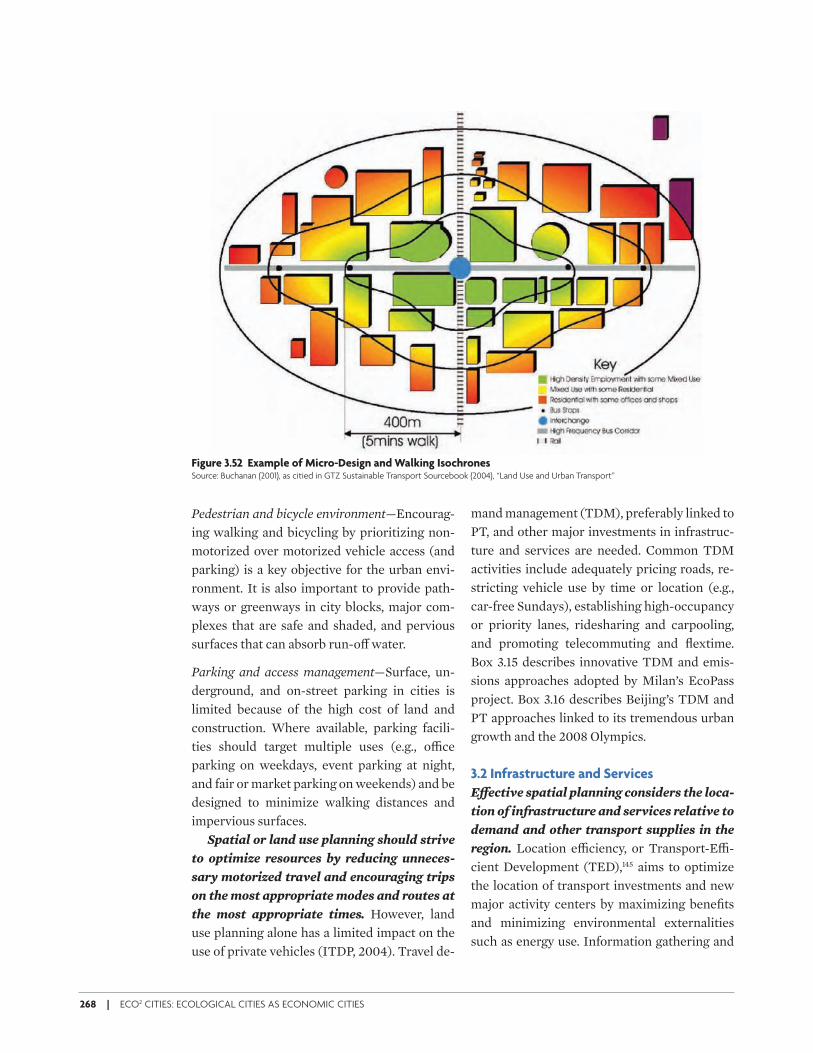
268 | ECO2 CITIES: ECOLOGICAL CITIES AS ECONOMIC CITIES
Pedestrian and bicycle environment—Encourag-ing walking and bicycling by prioritizing non-motorized over motorized vehicle access (and parking) is a key objective for the urban envi-ronment. It is also important to provide path-ways or greenways in city blocks, major com-plexes that are safe and shaded, and pervious surfaces that can absorb run-o( water.
Parking and access management—Surface, un-derground, and on-street parking in cities is limited because of the high cost of land and construction. Where available, parking facili-ties should target multiple uses (e.g., o+ ce parking on weekdays, event parking at night, and fair or market parking on weekends) and be designed to minimize walking distances and impervious surfaces.
Spatial or land use planning should strive
to optimize resources by reducing unneces-
sary motorized travel and encouraging trips
on the most appropriate modes and routes at
the most appropriate times. However, land use planning alone has a limited impact on the use of private vehicles (ITDP, 2004). Travel de-
mand management (TDM), preferably linked to PT, and other major investments in infrastruc-ture and services are needed. Common TDM activities include adequately pricing roads, re-stricting vehicle use by time or location (e.g., car-free Sundays), establishing high-occupancy or priority lanes, ridesharing and carpooling, and promoting telecommuting and fl extime. Box 3.15 describes innovative TDM and emis-sions approaches adopted by Milan’s EcoPass project. Box 3.16 describes Beijing’s TDM and PT approaches linked to its tremendous urban growth and the 2008 Olympics.
3.2 Infrastructure and Services
E/ ective spatial planning considers the loca-
tion of infrastructure and services relative to
demand and other transport supplies in the
region. Location e+ ciency, or Transport-E+ -cient Development (TED),145 aims to optimize the location of transport investments and new major activity centers by maximizing benefi ts and minimizing environmental externalities such as energy use. Information gathering and
Figure 3.52 Example of Micro-Design and Walking IsochronesSource: Buchanan (2001), as citied in GTZ Sustainable Transport Sourcebook (2004), “Land Use and Urban Transport”
ECo2-Part3brEV_PREP Sec1:268 6/15/09 9:04:32 AM
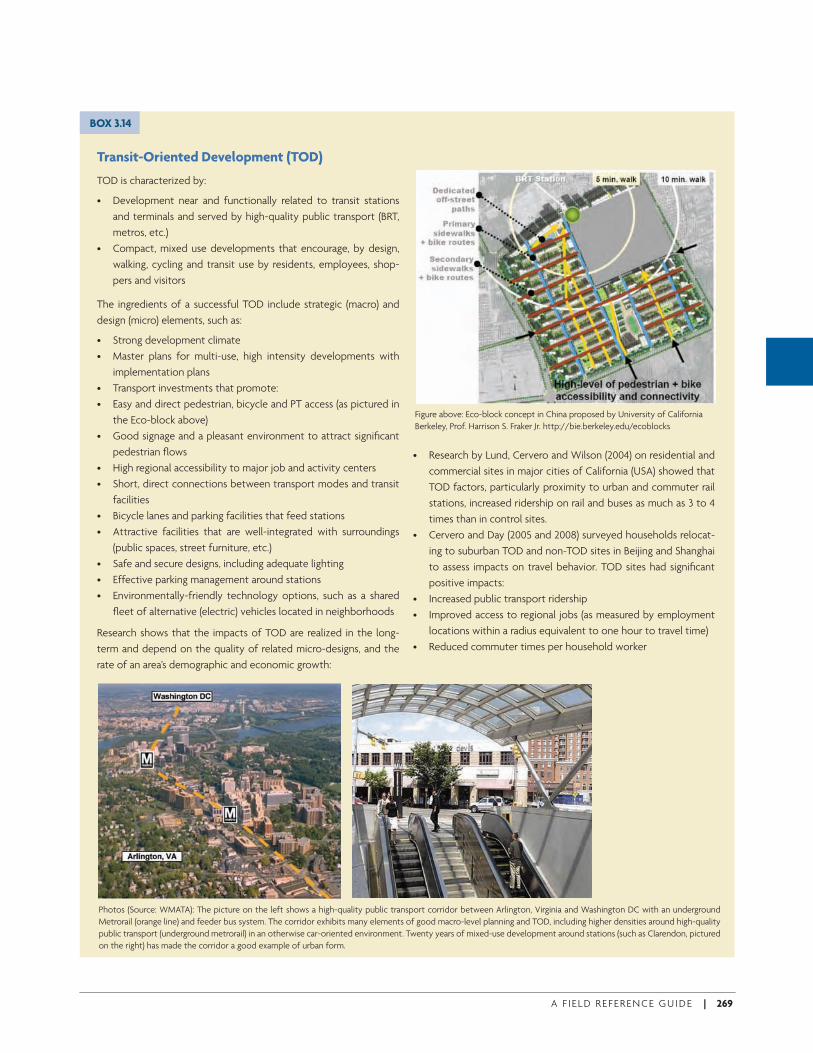
A F I E L D R E F E R E N C E G U I D E | 269
Urban Land Pooling and Land Readjustment
This is an innovative technique for managing and fi nancing urban
land development. Local and central governments are undertaking
such projects to assemble and convert rural land parcels in selected
urban-fringe areas into planned layouts of roads, public utility lines,
public open spaces, and serviced building plots. Some of the plots
are sold for cost recovery and the other plots are distributed to the
landowners in exchange for their rural land parcels. To be viable, the
values of urban plots distributed to landowners after subdivision
need to be signifi cantly higher than before the project begins.
In a typical project, the authorized land pooling and readjust-
ment agency selects and designates the urban-fringe area to be de-
veloped, and identifi es the land parcels and owners to be included.
A draft scheme is then prepared to plan, defi ne, and explain the
project, and to demonstrate its fi nancial viability.
Majority landowner support for each proposed project is a key
requirement for the successful application of the technique, and is
therefore an important consideration in selecting projects sites. Al-
though the emphasis is on landowner agreement and support for
each proposed project, the land pooling and readjustment agency
also has to be able and willing to use the government power of
compulsory purchase against any minority holdout landowners in
the designated project area, if this becomes necessary.
Transit-Oriented Development (TOD)
TOD is characterized by:
• Development near and functionally related to transit stations
and terminals and served by high-quality public transport (BRT,
metros, etc.)
• Compact, mixed use developments that encourage, by design,
walking, cycling and transit use by residents, employees, shop-
pers and visitors
The ingredients of a successful TOD include strategic (macro) and
design (micro) elements, such as:
• Strong development climate
• Master plans for multi-use, high intensity developments with
implementation plans
• Transport investments that promote:
• Easy and direct pedestrian, bicycle and PT access (as pictured in
the Eco-block above)
• Good signage and a pleasant environment to attract signifi cant
pedestrian fl ows
• High regional accessibility to major job and activity centers
• Short, direct connections between transport modes and transit
facilities
• Bicycle lanes and parking facilities that feed stations
• Attractive facilities that are well-integrated with surroundings
(public spaces, street furniture, etc.)
• Safe and secure designs, including adequate lighting
• Effective parking management around stations
• Environmentally-friendly technology options, such as a shared
fl eet of alternative (electric) vehicles located in neighborhoods
Research shows that the impacts of TOD are realized in the long-
term and depend on the quality of related micro-designs, and the
rate of an area’s demographic and economic growth:
BOX 3.14
Photos (Source: WMATA): The picture on the left shows a high-quality public transport corridor between Arlington, Virginia and Washington DC with an underground
Metrorail (orange line) and feeder bus system. The corridor exhibits many elements of good macro-level planning and TOD, including higher densities around high-quality
public transport (underground metrorail) in an otherwise car-oriented environment. Twenty years of mixed-use development around stations (such as Clarendon, pictured
on the right) has made the corridor a good example of urban form.
• Research by Lund, Cervero and Wilson (2004) on residential and
commercial sites in major cities of California (USA) showed that
TOD factors, particularly proximity to urban and commuter rail
stations, increased ridership on rail and buses as much as 3 to 4
times than in control sites.
• Cervero and Day (2005 and 2008) surveyed households relocat-
ing to suburban TOD and non-TOD sites in Beijing and Shanghai
to assess impacts on travel behavior. TOD sites had signifi cant
positive impacts:
• Increased public transport ridership
• Improved access to regional jobs (as measured by employment
locations within a radius equivalent to one hour to travel time)
• Reduced commuter times per household worker
Figure above: Eco-block concept in China proposed by University of California
Berkeley, Prof. Harrison S. Fraker Jr. http://bie.berkeley.edu/ecoblocks
ECo2-Part3brEV_PREP Sec1:269 6/15/09 9:04:33 AM
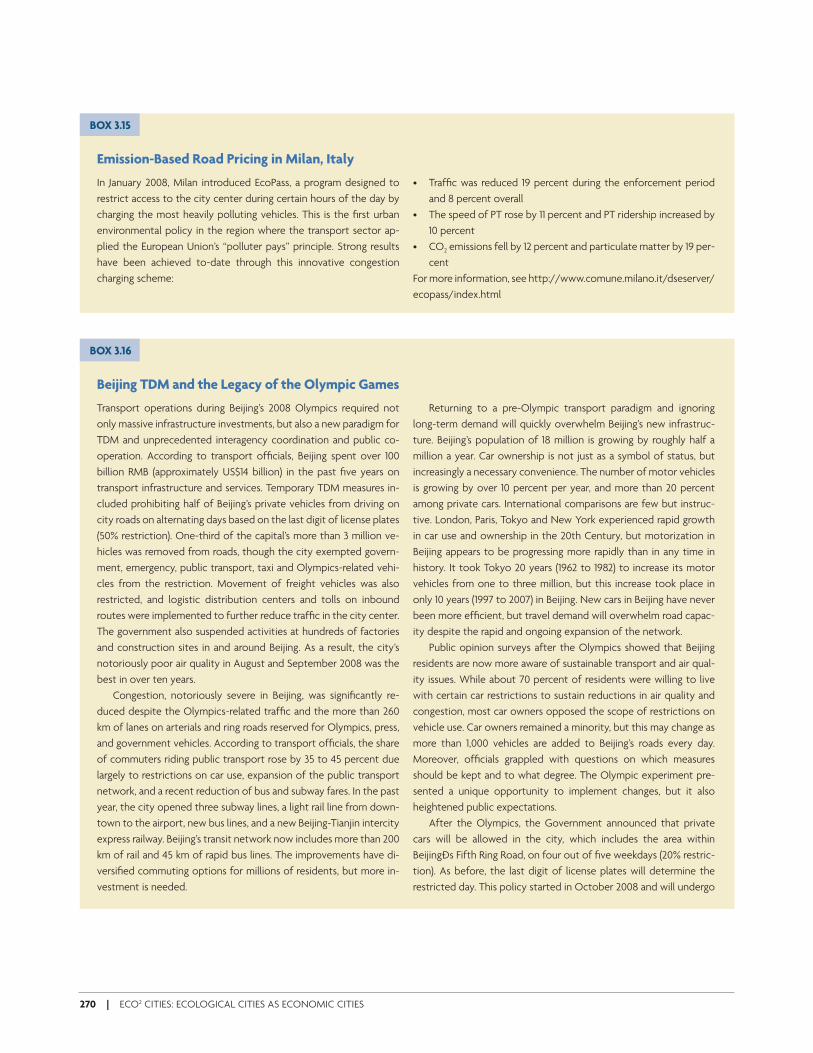
270 | ECO2 CITIES: ECOLOGICAL CITIES AS ECONOMIC CITIES
Emission-Based Road Pricing in Milan, Italy
In January 2008, Milan introduced EcoPass, a program designed to
restrict access to the city center during certain hours of the day by
charging the most heavily polluting vehicles. This is the fi rst urban
environmental policy in the region where the transport sector ap-
plied the European Union’s “polluter pays” principle. Strong results
have been achieved to-date through this innovative congestion
charging scheme:
BOX 3.15
• Traffi c was reduced 19 percent during the enforcement period
and 8 percent overall
• The speed of PT rose by 11 percent and PT ridership increased by
10 percent
• CO2 emissions fell by 12 percent and particulate matter by 19 per-
cent
For more information, see http://www.comune.milano.it/dseserver/
ecopass/index.html
Beijing TDM and the Legacy of the Olympic Games
Transport operations during Beijing’s 2008 Olympics required not
only massive infrastructure investments, but also a new paradigm for
TDM and unprecedented interagency coordination and public co-
operation. According to transport offi cials, Beijing spent over 100
billion RMB (approximately US$14 billion) in the past fi ve years on
transport infrastructure and services. Temporary TDM measures in-
cluded prohibiting half of Beijing’s private vehicles from driving on
city roads on alternating days based on the last digit of license plates
(50% restriction). One-third of the capital’s more than 3 million ve-
hicles was removed from roads, though the city exempted govern-
ment, emergency, public transport, taxi and Olympics-related vehi-
cles from the restriction. Movement of freight vehicles was also
restricted, and logistic distribution centers and tolls on inbound
routes were implemented to further reduce traffi c in the city center.
The government also suspended activities at hundreds of factories
and construction sites in and around Beijing. As a result, the city’s
notoriously poor air quality in August and September 2008 was the
best in over ten years.
Congestion, notoriously severe in Beijing, was signifi cantly re-
duced despite the Olympics-related traffi c and the more than 260
km of lanes on arterials and ring roads reserved for Olympics, press,
and government vehicles. According to transport offi cials, the share
of commuters riding public transport rose by 35 to 45 percent due
largely to restrictions on car use, expansion of the public transport
network, and a recent reduction of bus and subway fares. In the past
year, the city opened three subway lines, a light rail line from down-
town to the airport, new bus lines, and a new Beijing-Tianjin intercity
express railway. Beijing’s transit network now includes more than 200
km of rail and 45 km of rapid bus lines. The improvements have di-
versifi ed commuting options for millions of residents, but more in-
vestment is needed.
BOX 3.16
Returning to a pre-Olympic transport paradigm and ignoring
long-term demand will quickly overwhelm Beijing’s new infrastruc-
ture. Beijing’s population of 18 million is growing by roughly half a
million a year. Car ownership is not just as a symbol of status, but
increasingly a necessary convenience. The number of motor vehicles
is growing by over 10 percent per year, and more than 20 percent
among private cars. International comparisons are few but instruc-
tive. London, Paris, Tokyo and New York experienced rapid growth
in car use and ownership in the 20th Century, but motorization in
Beijing appears to be progressing more rapidly than in any time in
history. It took Tokyo 20 years (1962 to 1982) to increase its motor
vehicles from one to three million, but this increase took place in
only 10 years (1997 to 2007) in Beijing. New cars in Beijing have never
been more effi cient, but travel demand will overwhelm road capac-
ity despite the rapid and ongoing expansion of the network.
Public opinion surveys after the Olympics showed that Beijing
residents are now more aware of sustainable transport and air qual-
ity issues. While about 70 percent of residents were willing to live
with certain car restrictions to sustain reductions in air quality and
congestion, most car owners opposed the scope of restrictions on
vehicle use. Car owners remained a minority, but this may change as
more than 1,000 vehicles are added to Beijing’s roads every day.
Moreover, offi cials grappled with questions on which measures
should be kept and to what degree. The Olympic experiment pre-
sented a unique opportunity to implement changes, but it also
heightened public expectations.
After the Olympics, the Government announced that private
cars will be allowed in the city, which includes the area within
BeijingÐs Fifth Ring Road, on four out of fi ve weekdays (20% restric-
tion). As before, the last digit of license plates will determine the
restricted day. This policy started in October 2008 and will undergo
ECo2-Part3brEV_PREP Sec1:270 6/15/09 9:04:35 AM
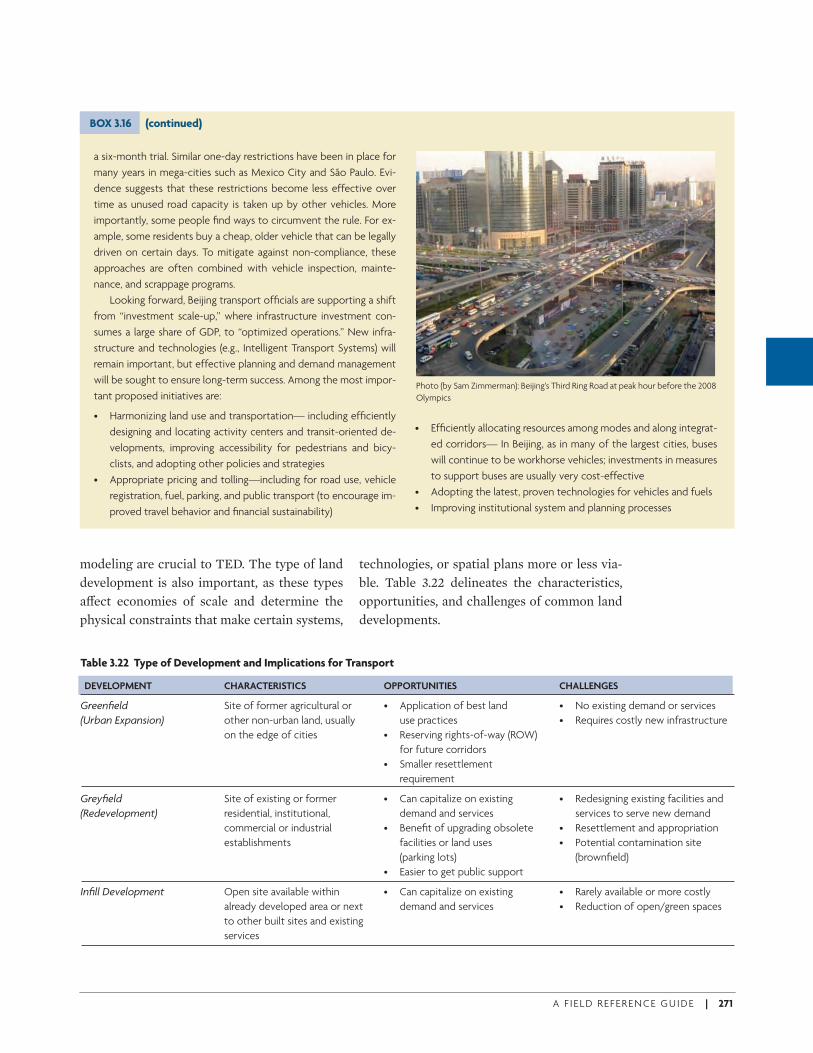
A F I E L D R E F E R E N C E G U I D E | 271
modeling are crucial to TED. The type of land development is also important, as these types a( ect economies of scale and determine the physical constraints that make certain systems,
technologies, or spatial plans more or less via-ble. Table 3.22 delineates the characteristics, opportunities, and challenges of common land developments.
BOX 3.16 (continued)
a six-month trial. Similar one-day restrictions have been in place for
many years in mega-cities such as Mexico City and São Paulo. Evi-
dence suggests that these restrictions become less effective over
time as unused road capacity is taken up by other vehicles. More
importantly, some people fi nd ways to circumvent the rule. For ex-
ample, some residents buy a cheap, older vehicle that can be legally
driven on certain days. To mitigate against non-compliance, these
approaches are often combined with vehicle inspection, mainte-
nance, and scrappage programs.
Looking forward, Beijing transport offi cials are supporting a shift
from “investment scale-up,” where infrastructure investment con-
sumes a large share of GDP, to “optimized operations.” New infra-
structure and technologies (e.g., Intelligent Transport Systems) will
remain important, but effective planning and demand management
will be sought to ensure long-term success. Among the most impor-
tant proposed initiatives are:
• Harmonizing land use and transportation— including effi ciently
designing and locating activity centers and transit-oriented de-
velopments, improving accessibility for pedestrians and bicy-
clists, and adopting other policies and strategies
• Appropriate pricing and tolling—including for road use, vehicle
registration, fuel, parking, and public transport (to encourage im-
proved travel behavior and fi nancial sustainability)
• Effi ciently allocating resources among modes and along integrat-
ed corridors— In Beijing, as in many of the largest cities, buses
will continue to be workhorse vehicles; investments in measures
to support buses are usually very cost-effective
• Adopting the latest, proven technologies for vehicles and fuels
• Improving institutional system and planning processes
Photo (by Sam Zimmerman): Beijing’s Third Ring Road at peak hour before the 2008
Olympics
Table 3.22 Type of Development and Implications for Transport
DEVELOPMENT CHARACTERISTICS OPPORTUNITIES CHALLENGES
Greenfi eld Site of former agricultural or • Application of best land • No existing demand or services
(Urban Expansion) other non-urban land, usually use practices • Requires costly new infrastructure
on the edge of cities • Reserving rights-of-way (ROW)
for future corridors
• Smaller resettlement
requirement
Greyfi eld Site of existing or former • Can capitalize on existing • Redesigning existing facilities and
(Redevelopment) residential, institutional, demand and services services to serve new demand
commercial or industrial • Benefi t of upgrading obsolete • Resettlement and appropriation
establishments facilities or land uses • Potential contamination site
(parking lots) (brownfi eld)
• Easier to get public support
Infi ll Development Open site available within • Can capitalize on existing • Rarely available or more costly
already developed area or next demand and services • Reduction of open/green spaces
to other built sites and existing
services
ECo2-Part3brEV_PREP Sec1:271 6/15/09 9:04:35 AM
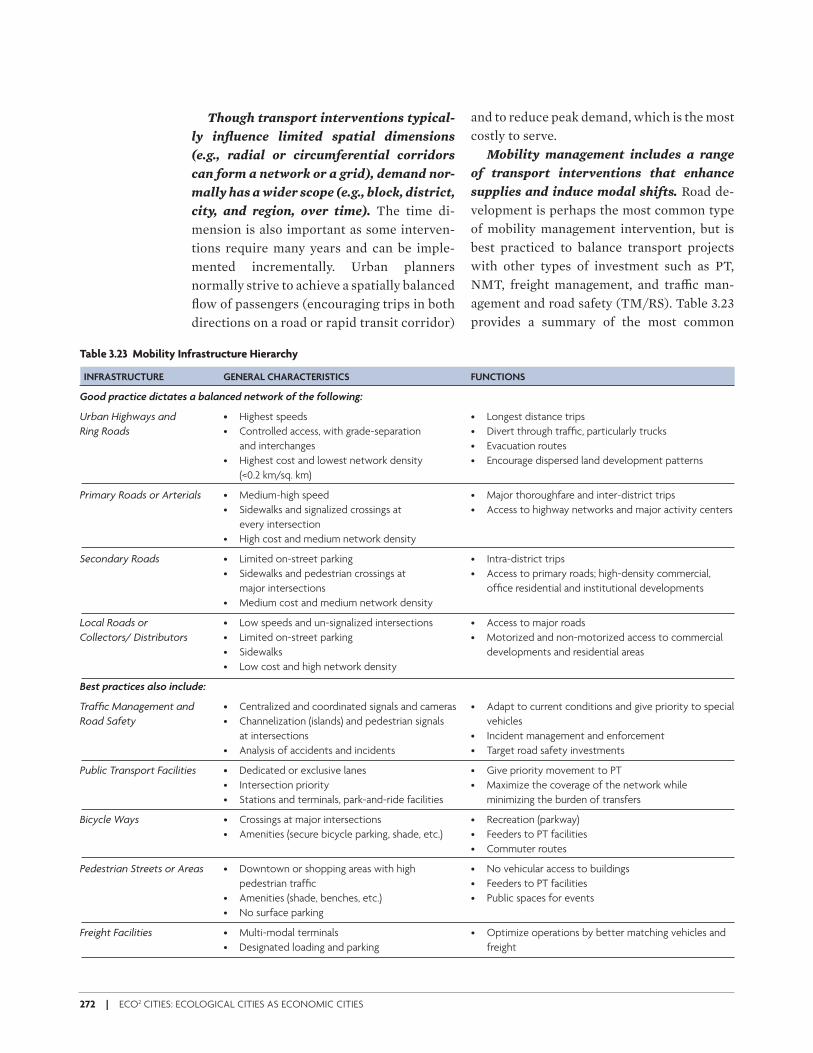
272 | ECO2 CITIES: ECOLOGICAL CITIES AS ECONOMIC CITIES
Though transport interventions typical-
ly infl uence limited spatial dimensions
(e.g., radial or circumferential corridors
can form a network or a grid), demand nor-
mally has a wider scope (e.g., block, district,
city, and region, over time). The time di-mension is also important as some interven-tions require many years and can be imple-mented incrementally. Urban planners normally strive to achieve a spatially balanced fl ow of passengers (encouraging trips in both directions on a road or rapid transit corridor)
and to reduce peak demand, which is the most costly to serve.
Mobility management includes a range
of transport interventions that enhance
supplies and induce modal shifts. Road de-velopment is perhaps the most common type of mobility management intervention, but is best practiced to balance transport projects with other types of investment such as PT, NMT, freight management, and tra+ c man-agement and road safety (TM/RS). Table 3.23 provides a summary of the most common
Table 3.23 Mobility Infrastructure Hierarchy
INFRASTRUCTURE GENERAL CHARACTERISTICS FUNCTIONS
Good practice dictates a balanced network of the following:
Urban Highways and • Highest speeds • Longest distance trips
Ring Roads • Controlled access, with grade-separation • Divert through traffi c, particularly trucks
and interchanges • Evacuation routes
• Highest cost and lowest network density • Encourage dispersed land development patterns
(<0.2 km/sq. km)
Primary Roads or Arterials • Medium-high speed • Major thoroughfare and inter-district trips
• Sidewalks and signalized crossings at • Access to highway networks and major activity centers
every intersection
• High cost and medium network density
Secondary Roads • Limited on-street parking • Intra-district trips
• Sidewalks and pedestrian crossings at • Access to primary roads; high-density commercial,
major intersections offi ce residential and institutional developments
• Medium cost and medium network density
Local Roads or • Low speeds and un-signalized intersections • Access to major roads
Collectors/ Distributors • Limited on-street parking • Motorized and non-motorized access to commercial
• Sidewalks developments and residential areas
• Low cost and high network density
Best practices also include:
Traffi c Management and • Centralized and coordinated signals and cameras • Adapt to current conditions and give priority to special
Road Safety • Channelization (islands) and pedestrian signals vehicles
at intersections • Incident management and enforcement
• Analysis of accidents and incidents • Target road safety investments
Public Transport Facilities • Dedicated or exclusive lanes • Give priority movement to PT
• Intersection priority • Maximize the coverage of the network while
• Stations and terminals, park-and-ride facilities minimizing the burden of transfers
Bicycle Ways • Crossings at major intersections • Recreation (parkway)
• Amenities (secure bicycle parking, shade, etc.) • Feeders to PT facilities
• Commuter routes
Pedestrian Streets or Areas • Downtown or shopping areas with high • No vehicular access to buildings
pedestrian traffi c • Feeders to PT facilities
• Amenities (shade, benches, etc.) • Public spaces for events
• No surface parking
Freight Facilities • Multi-modal terminals • Optimize operations by better matching vehicles and
• Designated loading and parking freight
ECo2-Part3brEV_PREP Sec1:272 6/15/09 9:04:36 AM
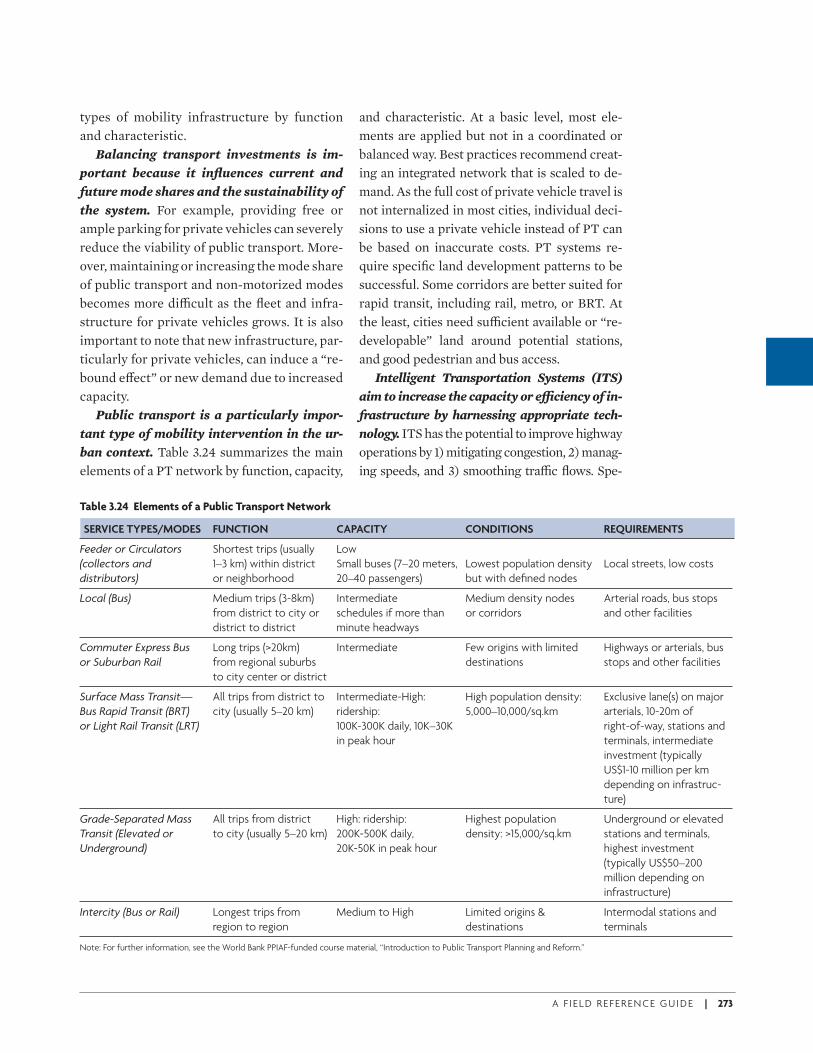
A F I E L D R E F E R E N C E G U I D E | 273
types of mobility infrastructure by function and characteristic.
Balancing transport investments is im-
portant because it infl uences current and
future mode shares and the sustainability of
the system. For example, providing free or ample parking for private vehicles can severely reduce the viability of public transport. More-over, maintaining or increasing the mode share of public transport and non-motorized modes becomes more di+ cult as the fl eet and infra-structure for private vehicles grows. It is also important to note that new infrastructure, par-ticularly for private vehicles, can induce a “re-bound e( ect” or new demand due to increased capacity.
Public transport is a particularly impor-
tant type of mobility intervention in the ur-
ban context. Table 3.24 summarizes the main elements of a PT network by function, capacity,
and characteristic. At a basic level, most ele-ments are applied but not in a coordinated or balanced way. Best practices recommend creat-ing an integrated network that is scaled to de-mand. As the full cost of private vehicle travel is not internalized in most cities, individual deci-sions to use a private vehicle instead of PT can be based on inaccurate costs. PT systems re-quire specifi c land development patterns to be successful. Some corridors are better suited for rapid transit, including rail, metro, or BRT. At the least, cities need su+ cient available or “re-developable” land around potential stations, and good pedestrian and bus access.
Intelligent Transportation Systems (ITS)
aim to increase the capacity or e" ciency of in-
frastructure by harnessing appropriate tech-
nology. ITS has the potential to improve highway operations by 1) mitigating congestion, 2) manag-ing speeds, and 3) smoothing tra+ c fl ows. Spe-
Table 3.24 Elements of a Public Transport Network
SERVICE TYPES/MODES FUNCTION CAPACITY CONDITIONS REQUIREMENTS
Feeder or Circulators Shortest trips (usually Low
(collectors and 1–3 km) within district Small buses (7–20 meters, Lowest population density Local streets, low costs
distributors) or neighborhood 20–40 passengers) but with defi ned nodes
Local (Bus) Medium trips (3-8km) Intermediate Medium density nodes Arterial roads, bus stops
from district to city or schedules if more than or corridors and other facilities
district to district minute headways
Commuter Express Bus Long trips (>20km) Intermediate Few origins with limited Highways or arterials, bus
or Suburban Rail from regional suburbs destinations stops and other facilities
to city center or district
Surface Mass Transit— All trips from district to Intermediate-High: High population density: Exclusive lane(s) on major
Bus Rapid Transit (BRT) city (usually 5–20 km) ridership: 5,000–10,000/sq.km arterials, 10-20m of
or Light Rail Transit (LRT) 100K-300K daily, 10K–30K right-of-way, stations and
in peak hour terminals, intermediate
investment (typically
US$1-10 million per km
depending on infrastruc-
ture)
Grade-Separated Mass All trips from district High: ridership: Highest population Underground or elevated
Transit (Elevated or to city (usually 5–20 km) 200K-500K daily, density: >15,000/sq.km stations and terminals,
Underground) 20K-50K in peak hour highest investment
(typically US$50–200
million depending on
infrastructure)
Intercity (Bus or Rail) Longest trips from Medium to High Limited origins & Intermodal stations and
region to region destinations terminals
Note: For further information, see the World Bank PPIAF-funded course material, “Introduction to Public Transport Planning and Reform.”
ECo2-Part3brEV_PREP Sec1:273 6/15/09 9:04:36 AM
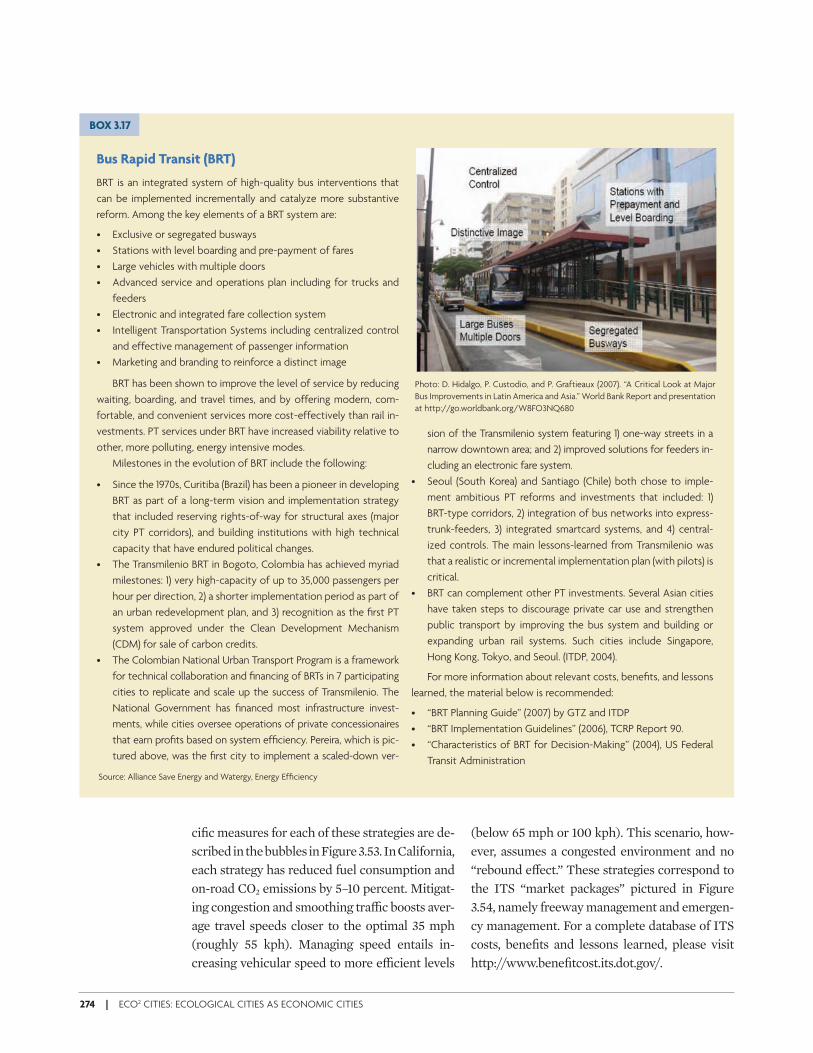
274 | ECO2 CITIES: ECOLOGICAL CITIES AS ECONOMIC CITIES
cifi c measures for each of these strategies are de-scribed in the bubbles in Figure 3.53. In California, each strategy has reduced fuel consumption and on-road CO2 emissions by 5–10 percent. Mitigat-ing congestion and smoothing tra+ c boosts aver-age travel speeds closer to the optimal 35 mph (roughly 55 kph). Managing speed entails in-creasing vehicular speed to more e+ cient levels
(below 65 mph or 100 kph). This scenario, how-ever, assumes a congested environment and no “rebound e( ect.” These strategies correspond to the ITS “market packages” pictured in Figure 3.54, namely freeway management and emergen-cy management. For a complete database of ITS costs, benefi ts and lessons learned, please visit http://www.benefi tcost.its.dot.gov/.
Bus Rapid Transit (BRT)
BRT is an integrated system of high-quality bus interventions that
can be implemented incrementally and catalyze more substantive
reform. Among the key elements of a BRT system are:
• Exclusive or segregated busways
• Stations with level boarding and pre-payment of fares
• Large vehicles with multiple doors
• Advanced service and operations plan including for trucks and
feeders
• Electronic and integrated fare collection system
• Intelligent Transportation Systems including centralized control
and effective management of passenger information
• Marketing and branding to reinforce a distinct image
BRT has been shown to improve the level of service by reducing
waiting, boarding, and travel times, and by offering modern, com-
fortable, and convenient services more cost-effectively than rail in-
vestments. PT services under BRT have increased viability relative to
other, more polluting, energy intensive modes.
Milestones in the evolution of BRT include the following:
• Since the 1970s, Curitiba (Brazil) has been a pioneer in developing
BRT as part of a long-term vision and implementation strategy
that included reserving rights-of-way for structural axes (major
city PT corridors), and building institutions with high technical
capacity that have endured political changes.
• The Transmilenio BRT in Bogoto, Colombia has achieved myriad
milestones: 1) very high-capacity of up to 35,000 passengers per
hour per direction, 2) a shorter implementation period as part of
an urban redevelopment plan, and 3) recognition as the fi rst PT
system approved under the Clean Development Mechanism
(CDM) for sale of carbon credits.
• The Colombian National Urban Transport Program is a framework
for technical collaboration and fi nancing of BRTs in 7 participating
cities to replicate and scale up the success of Transmilenio. The
National Government has fi nanced most infrastructure invest-
ments, while cities oversee operations of private concessionaires
that earn profi ts based on system effi ciency. Pereira, which is pic-
tured above, was the fi rst city to implement a scaled-down ver-
BOX 3.17
Source: Alliance Save Energy and Watergy, Energy Effi ciency
sion of the Transmilenio system featuring 1) one-way streets in a
narrow downtown area; and 2) improved solutions for feeders in-
cluding an electronic fare system.
• Seoul (South Korea) and Santiago (Chile) both chose to imple-
ment ambitious PT reforms and investments that included: 1)
BRT-type corridors, 2) integration of bus networks into express-
trunk-feeders, 3) integrated smartcard systems, and 4) central-
ized controls. The main lessons-learned from Transmilenio was
that a realistic or incremental implementation plan (with pilots) is
critical.
• BRT can complement other PT investments. Several Asian cities
have taken steps to discourage private car use and strengthen
public transport by improving the bus system and building or
expanding urban rail systems. Such cities include Singapore,
Hong Kong, Tokyo, and Seoul. (ITDP, 2004).
For more information about relevant costs, benefi ts, and lessons
learned, the material below is recommended:
• “BRT Planning Guide” (2007) by GTZ and ITDP
• “BRT Implementation Guidelines” (2006), TCRP Report 90.
• “Characteristics of BRT for Decision-Making” (2004), US Federal
Transit Administration
Photo: D. Hidalgo, P. Custodio, and P. Graftieaux (2007). “A Critical Look at Major
Bus Improvements in Latin America and Asia.” World Bank Report and presentation
at http://go.worldbank.org/W8FO3NQ680
ECo2-Part3brEV_PREP Sec1:274 6/15/09 9:04:36 AM
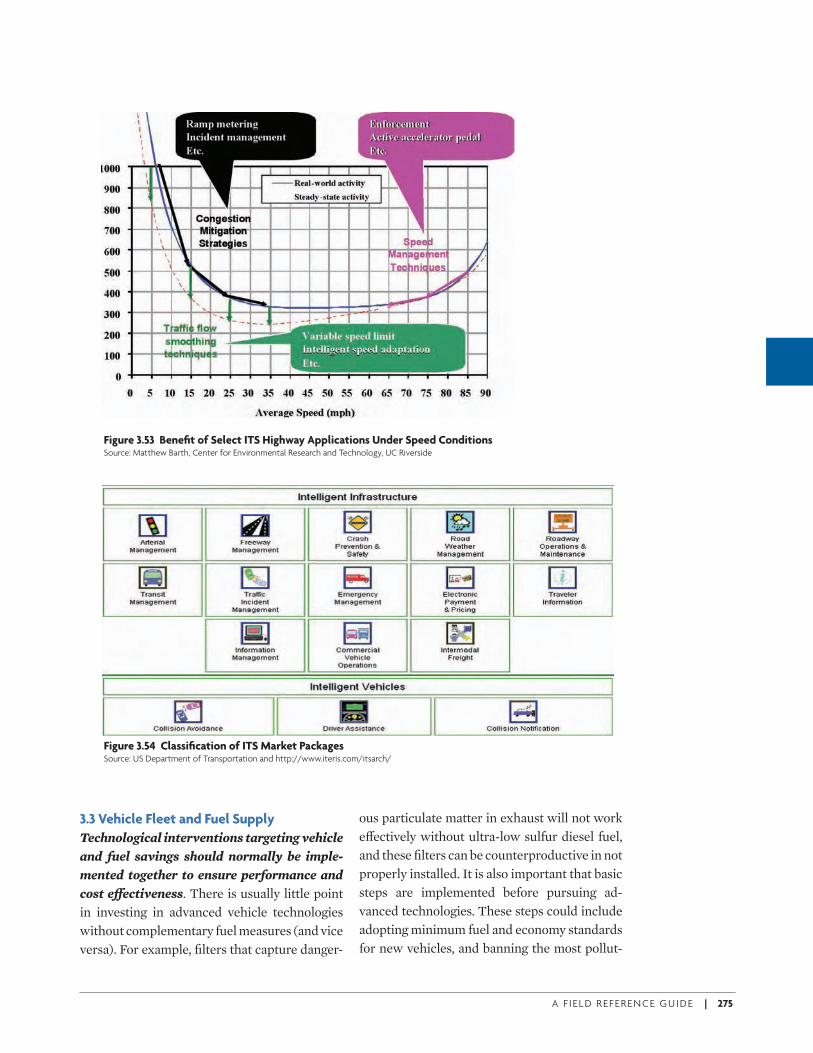
A F I E L D R E F E R E N C E G U I D E | 275
3.3 Vehicle Fleet and Fuel Supply
Technological interventions targeting vehicle
and fuel savings should normally be imple-
mented together to ensure performance and
cost e/ ectiveness. There is usually little point in investing in advanced vehicle technologies without complementary fuel measures (and vice versa). For example, fi lters that capture danger-
ous particulate matter in exhaust will not work e( ectively without ultra-low sulfur diesel fuel, and these fi lters can be counterproductive in not properly installed. It is also important that basic steps are implemented before pursuing ad-vanced technologies. These steps could include adopting minimum fuel and economy standards for new vehicles, and banning the most pollut-
Figure 3.53 Benefi t of Select ITS Highway Applications Under Speed ConditionsSource: Matthew Barth, Center for Environmental Research and Technology, UC Riverside
Figure 3.54 Classifi cation of ITS Market Packages Source: US Department of Transportation and http://www.iteris.com/itsarch/
ECo2-Part3brEV_PREP Sec1:275 6/15/09 9:04:37 AM
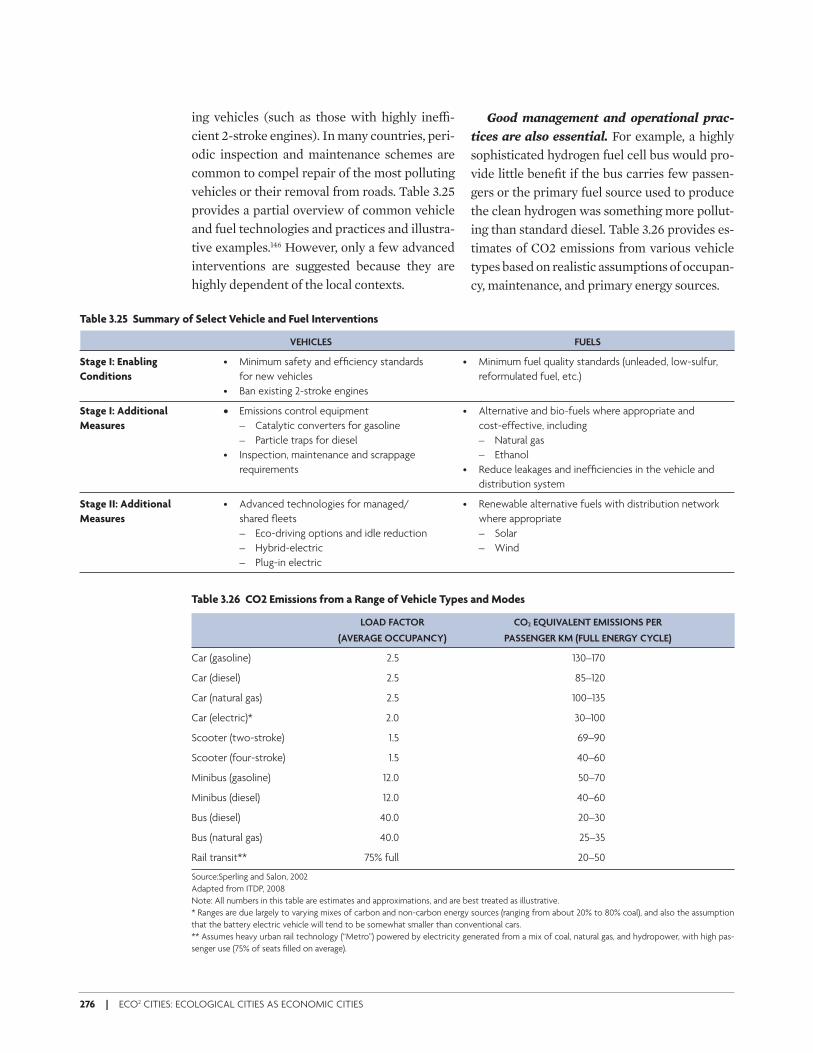
276 | ECO2 CITIES: ECOLOGICAL CITIES AS ECONOMIC CITIES
ing vehicles (such as those with highly ine+ -cient 2-stroke engines). In many countries, peri-odic inspection and maintenance schemes are common to compel repair of the most polluting vehicles or their removal from roads. Table 3.25 provides a partial overview of common vehicle and fuel technologies and practices and illustra-tive examples.146 However, only a few advanced interventions are suggested because they are highly dependent of the local contexts.
Good management and operational prac-
tices are also essential. For example, a highly sophisticated hydrogen fuel cell bus would pro-vide little benefi t if the bus carries few passen-gers or the primary fuel source used to produce the clean hydrogen was something more pollut-ing than standard diesel. Table 3.26 provides es-timates of CO2 emissions from various vehicle types based on realistic assumptions of occupan-cy, maintenance, and primary energy sources.
Table 3.25 Summary of Select Vehicle and Fuel Interventions
VEHICLES FUELS
Stage I: Enabling • Minimum safety and effi ciency standards • Minimum fuel quality standards (unleaded, low-sulfur,
Conditions for new vehicles reformulated fuel, etc.)
• Ban existing 2-stroke engines
Stage I: Additional • Emissions control equipment • Alternative and bio-fuels where appropriate and
Measures – Catalytic converters for gasoline cost-effective, including
– Particle traps for diesel – Natural gas
• Inspection, maintenance and scrappage – Ethanol
requirements • Reduce leakages and ineffi ciencies in the vehicle and
distribution system
Stage II: Additional • Advanced technologies for managed/ • Renewable alternative fuels with distribution network
Measures shared fl eets where appropriate
– Eco-driving options and idle reduction – Solar
– Hybrid-electric – Wind
– Plug-in electric
Table 3.26 CO2 Emissions from a Range of Vehicle Types and Modes
LOAD FACTOR CO2 EQUIVALENT EMISSIONS PER
(AVERAGE OCCUPANCY) PASSENGER KM (FULL ENERGY CYCLE)
Car (gasoline) 2.5 130–170
Car (diesel) 2.5 85–120
Car (natural gas) 2.5 100–135
Car (electric)* 2.0 30–100
Scooter (two-stroke) 1.5 69–90
Scooter (four-stroke) 1.5 40–60
Minibus (gasoline) 12.0 50–70
Minibus (diesel) 12.0 40–60
Bus (diesel) 40.0 20–30
Bus (natural gas) 40.0 25–35
Rail transit** 75% full 20–50
Source:Sperling and Salon, 2002
Adapted from ITDP, 2008
Note: All numbers in this table are estimates and approximations, and are best treated as illustrative.
* Ranges are due largely to varying mixes of carbon and non-carbon energy sources (ranging from about 20% to 80% coal), and also the assumption
that the battery electric vehicle will tend to be somewhat smaller than conventional cars.
** Assumes heavy urban rail technology (“Metro”) powered by electricity generated from a mix of coal, natural gas, and hydropower, with high pas-
senger use (75% of seats fi lled on average).
ECo2-Part3brEV_PREP Sec1:276 6/15/09 9:04:38 AM
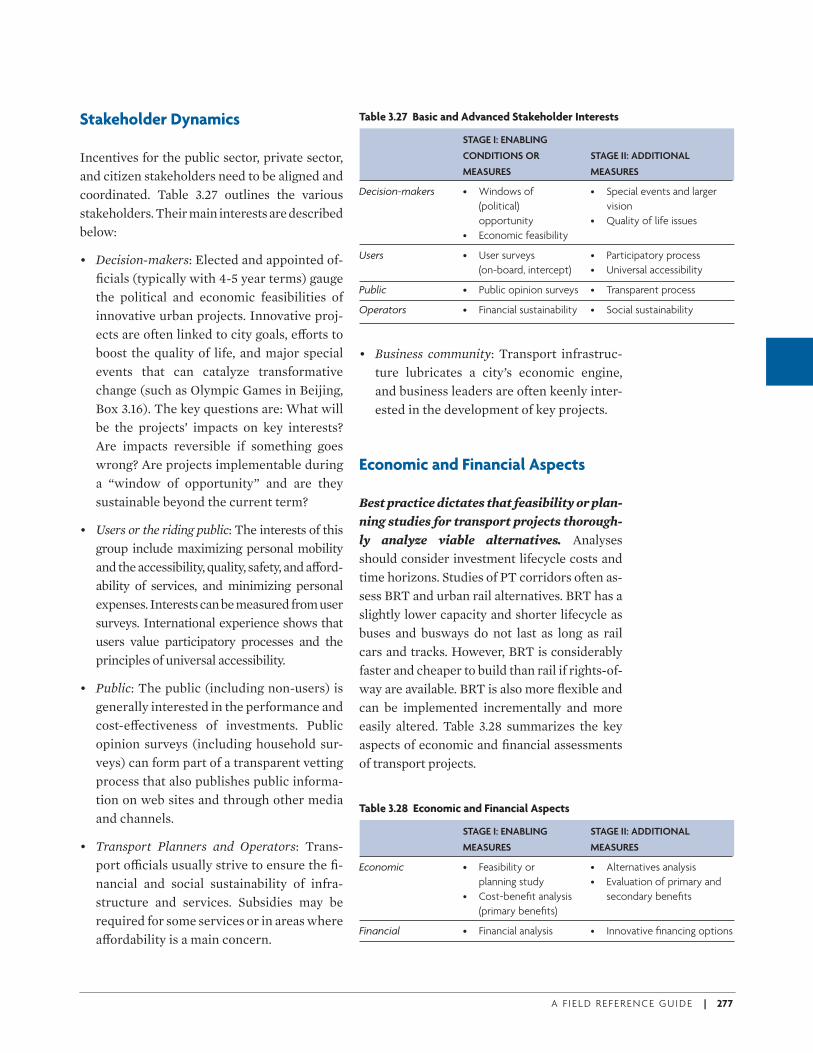
A F I E L D R E F E R E N C E G U I D E | 277
Stakeholder Dynamics
Incentives for the public sector, private sector, and citizen stakeholders need to be aligned and coordinated. Table 3.27 outlines the various stakeholders. Their main interests are described below:
• Decision-makers: Elected and appointed of-fi cials (typically with 4-5 year terms) gauge the political and economic feasibilities of innovative urban projects. Innovative proj-ects are often linked to city goals, e( orts to boost the quality of life, and major special events that can catalyze transformative change (such as Olympic Games in Beijing, Box 3.16). The key questions are: What will be the projects’ impacts on key interests? Are impacts reversible if something goes wrong? Are projects implementable during a “window of opportunity” and are they sustainable beyond the current term?
• Users or the riding public: The interests of this group include maximizing personal mobility and the accessibility, quality, safety, and a( ord-ability of services, and minimizing personal expenses. Interests can be measured from user surveys. International experience shows that users value participatory processes and the principles of universal accessibility.
• Public: The public (including non-users) is generally interested in the performance and cost-e( ectiveness of investments. Public opinion surveys (including household sur-veys) can form part of a transparent vetting process that also publishes public informa-tion on web sites and through other media and channels.
• Transport Planners and Operators: Trans-port o+ cials usually strive to ensure the fi -nancial and social sustainability of infra-structure and services. Subsidies may be required for some services or in areas where a( ordability is a main concern.
• Business community: Transport infrastruc-ture lubricates a city’s economic engine, and business leaders are often keenly inter-ested in the development of key projects.
Economic and Financial Aspects
Best practice dictates that feasibility or plan-
ning studies for transport projects thorough-
ly analyze viable alternatives. Analyses should consider investment lifecycle costs and time horizons. Studies of PT corridors often as-sess BRT and urban rail alternatives. BRT has a slightly lower capacity and shorter lifecycle as buses and busways do not last as long as rail cars and tracks. However, BRT is considerably faster and cheaper to build than rail if rights-of-way are available. BRT is also more fl exible and can be implemented incrementally and more easily altered. Table 3.28 summarizes the key aspects of economic and fi nancial assessments of transport projects.
Table 3.27 Basic and Advanced Stakeholder Interests
STAGE I: ENABLING
CONDITIONS OR STAGE II: ADDITIONAL
MEASURES MEASURES
Decision-makers • Windows of • Special events and larger
(political) vision
opportunity • Quality of life issues
• Economic feasibility
Users • User surveys • Participatory process
(on-board, intercept) • Universal accessibility
Public • Public opinion surveys • Transparent process
Operators • Financial sustainability • Social sustainability
Table 3.28 Economic and Financial Aspects
STAGE I: ENABLING STAGE II: ADDITIONAL
MEASURES MEASURES
Economic • Feasibility or • Alternatives analysis
planning study • Evaluation of primary and
• Cost-benefi t analysis secondary benefi ts
(primary benefi ts)
Financial • Financial analysis • Innovative fi nancing options
ECo2-Part3brEV_PREP Sec1:277 6/15/09 9:04:38 AM
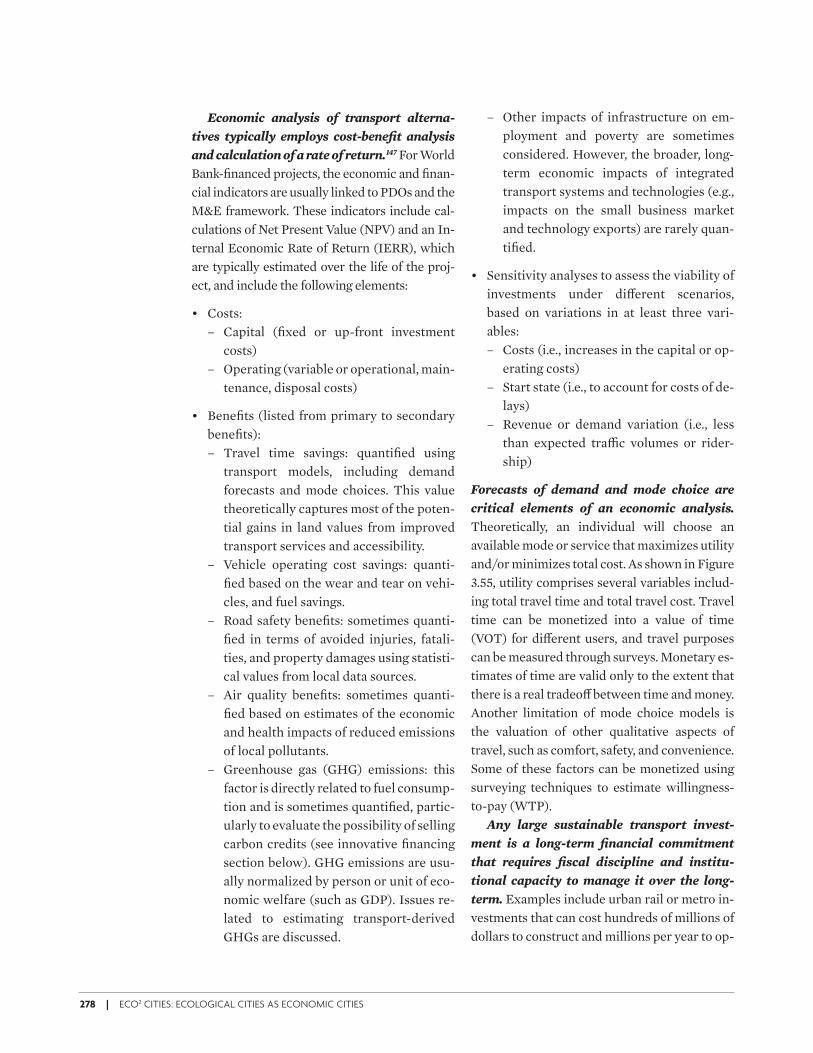
278 | ECO2 CITIES: ECOLOGICAL CITIES AS ECONOMIC CITIES
Economic analysis of transport alterna-
tives typically employs cost-benefi t analysis
and calculation of a rate of return.147 For World Bank-fi nanced projects, the economic and fi nan-cial indicators are usually linked to PDOs and the M&E framework. These indicators include cal-culations of Net Present Value (NPV) and an In-ternal Economic Rate of Return (IERR), which are typically estimated over the life of the proj-ect, and include the following elements:
• Costs: – Capital (fi xed or up-front investment
costs)– Operating (variable or operational, main-
tenance, disposal costs)
• Benefi ts (listed from primary to secondary benefi ts):– Travel time savings: quantifi ed using
transport models, including demand forecasts and mode choices. This value theoretically captures most of the poten-tial gains in land values from improved transport services and accessibility.
– Vehicle operating cost savings: quanti-fi ed based on the wear and tear on vehi-cles, and fuel savings.
– Road safety benefi ts: sometimes quanti-fi ed in terms of avoided injuries, fatali-ties, and property damages using statisti-cal values from local data sources.
– Air quality benefi ts: sometimes quanti-fi ed based on estimates of the economic and health impacts of reduced emissions of local pollutants.
– Greenhouse gas (GHG) emissions: this factor is directly related to fuel consump-tion and is sometimes quantifi ed, partic-ularly to evaluate the possibility of selling carbon credits (see innovative fi nancing section below). GHG emissions are usu-ally normalized by person or unit of eco-nomic welfare (such as GDP). Issues re-lated to estimating transport-derived GHGs are discussed.
– Other impacts of infrastructure on em-ployment and poverty are sometimes considered. However, the broader, long-term economic impacts of integrated transport systems and technologies (e.g., impacts on the small business market and technology exports) are rarely quan-tifi ed.
• Sensitivity analyses to assess the viability of investments under di( erent scenarios, based on variations in at least three vari-ables: – Costs (i.e., increases in the capital or op-
erating costs)– Start state (i.e., to account for costs of de-
lays)– Revenue or demand variation (i.e., less
than expected tra+ c volumes or rider-ship)
Forecasts of demand and mode choice are
critical elements of an economic analysis. Theoretically, an individual will choose an available mode or service that maximizes utility and/or minimizes total cost. As shown in Figure 3.55, utility comprises several variables includ-ing total travel time and total travel cost. Travel time can be monetized into a value of time (VOT) for di( erent users, and travel purposes can be measured through surveys. Monetary es-timates of time are valid only to the extent that there is a real tradeo( between time and money. Another limitation of mode choice models is the valuation of other qualitative aspects of travel, such as comfort, safety, and convenience. Some of these factors can be monetized using surveying techniques to estimate willingness-to-pay (WTP).
Any large sustainable transport invest-
ment is a long-term fi nancial commitment
that requires fi scal discipline and institu-
tional capacity to manage it over the long-
term. Examples include urban rail or metro in-vestments that can cost hundreds of millions of dollars to construct and millions per year to op-
ECo2-Part3brEV_PREP Sec1:278 6/15/09 9:04:38 AM
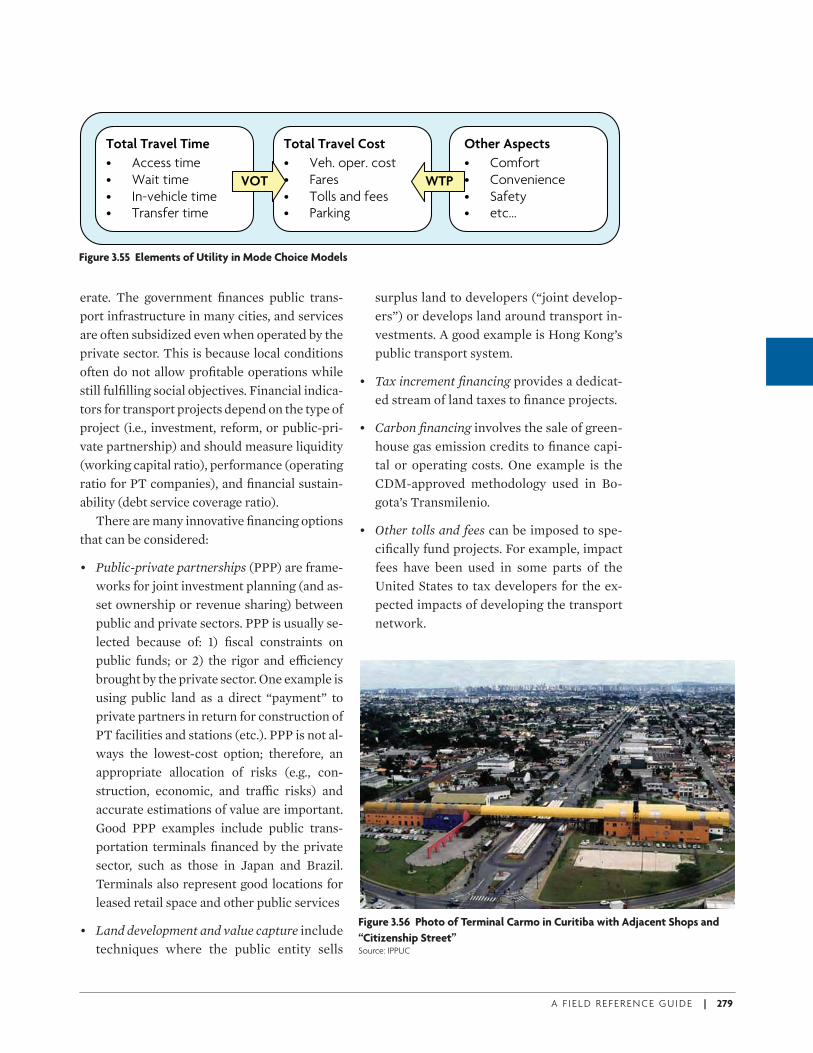
A F I E L D R E F E R E N C E G U I D E | 279
erate. The government fi nances public trans-port infrastructure in many cities, and services are often subsidized even when operated by the private sector. This is because local conditions often do not allow profi table operations while still fulfi lling social objectives. Financial indica-tors for transport projects depend on the type of project (i.e., investment, reform, or public-pri-vate partnership) and should measure liquidity (working capital ratio), performance (operating ratio for PT companies), and fi nancial sustain-ability (debt service coverage ratio).
There are many innovative fi nancing options that can be considered:
• Public-private partnerships (PPP) are frame-works for joint investment planning (and as-set ownership or revenue sharing) between public and private sectors. PPP is usually se-lected because of: 1) fi scal constraints on public funds; or 2) the rigor and e+ ciency brought by the private sector. One example is using public land as a direct “payment” to private partners in return for construction of PT facilities and stations (etc.). PPP is not al-ways the lowest-cost option; therefore, an appropriate allocation of risks (e.g., con-struction, economic, and tra+ c risks) and accurate estimations of value are important. Good PPP examples include public trans-portation terminals fi nanced by the private sector, such as those in Japan and Brazil. Terminals also represent good locations for leased retail space and other public services
• Land development and value capture include techniques where the public entity sells
surplus land to developers (“joint develop-ers”) or develops land around transport in-vestments. A good example is Hong Kong’s public transport system.
• Tax increment fi nancing provides a dedicat-ed stream of land taxes to fi nance projects.
• Carbon fi nancing involves the sale of green-house gas emission credits to fi nance capi-tal or operating costs. One example is the CDM-approved methodology used in Bo-gota’s Transmilenio.
• Other tolls and fees can be imposed to spe-cifi cally fund projects. For example, impact fees have been used in some parts of the United States to tax developers for the ex-pected impacts of developing the transport network.
Total Travel Time
• Access time• Wait time• In-vehicle time• Transfer time
Total Travel Cost
• Veh. oper. cost• Fares• Tolls and fees• Parking
Other Aspects
• Comfort• Convenience• Safety• etc…
VOT WTP
Figure 3.55 Elements of Utility in Mode Choice Models
Figure 3.56 Photo of Terminal Carmo in Curitiba with Adjacent Shops and
“Citizenship Street”Source: IPPUC
ECo2-Part3brEV_PREP Sec1:279 6/15/09 9:04:38 AM
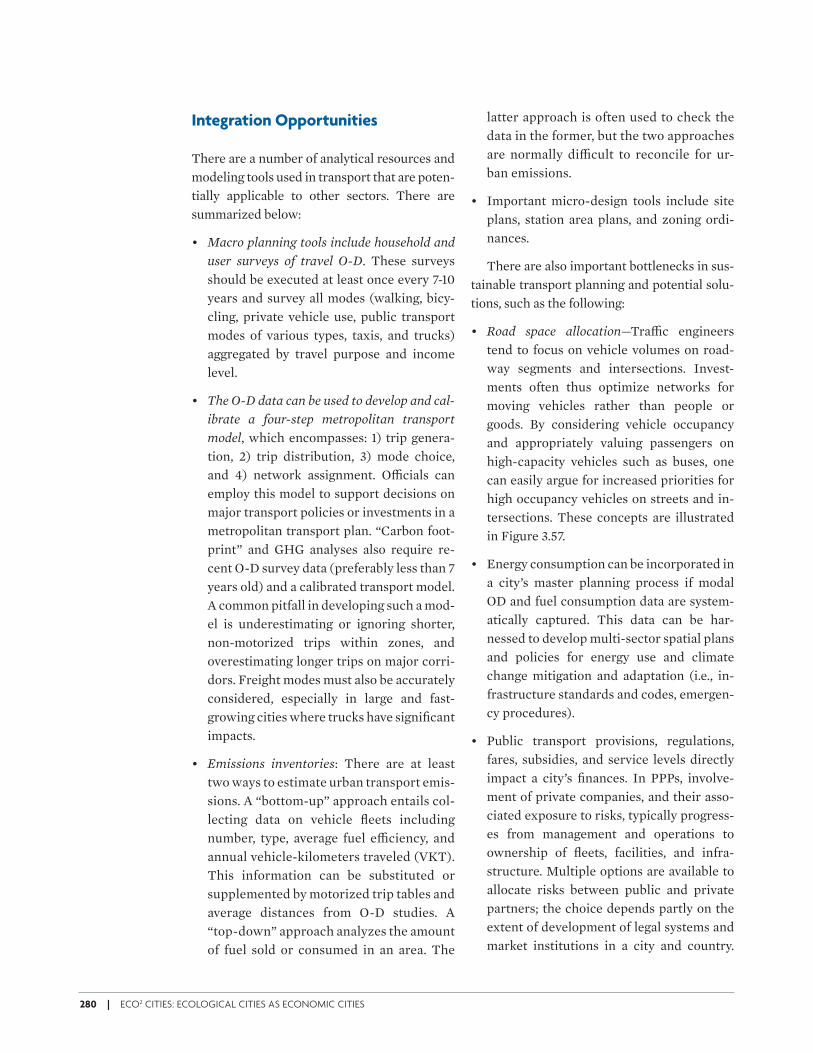
280 | ECO2 CITIES: ECOLOGICAL CITIES AS ECONOMIC CITIES
Integration Opportunities
There are a number of analytical resources and modeling tools used in transport that are poten-tially applicable to other sectors. There are summarized below:
• Macro planning tools include household and
user surveys of travel O-D. These surveys should be executed at least once every 7-10 years and survey all modes (walking, bicy-cling, private vehicle use, public transport modes of various types, taxis, and trucks) aggregated by travel purpose and income level.
• The O-D data can be used to develop and cal-
ibrate a four-step metropolitan transport
model, which encompasses: 1) trip genera-tion, 2) trip distribution, 3) mode choice, and 4) network assignment. O+ cials can employ this model to support decisions on major transport policies or investments in a metropolitan transport plan. “Carbon foot-print” and GHG analyses also require re-cent O-D survey data (preferably less than 7 years old) and a calibrated transport model. A common pitfall in developing such a mod-el is underestimating or ignoring shorter, non-motorized trips within zones, and overestimating longer trips on major corri-dors. Freight modes must also be accurately considered, especially in large and fast-growing cities where trucks have signifi cant impacts.
• Emissions inventories: There are at least two ways to estimate urban transport emis-sions. A “bottom-up” approach entails col-lecting data on vehicle fl eets including number, type, average fuel e+ ciency, and annual vehicle-kilometers traveled (VKT). This information can be substituted or supplemented by motorized trip tables and average distances from O-D studies. A “top-down” approach analyzes the amount of fuel sold or consumed in an area. The
latter approach is often used to check the data in the former, but the two approaches are normally di+ cult to reconcile for ur-ban emissions.
• Important micro-design tools include site plans, station area plans, and zoning ordi-nances.
There are also important bottlenecks in sus-tainable transport planning and potential solu-tions, such as the following:
• Road space allocation—Tra+ c engineers tend to focus on vehicle volumes on road-way segments and intersections. Invest-ments often thus optimize networks for moving vehicles rather than people or goods. By considering vehicle occupancy and appropriately valuing passengers on high-capacity vehicles such as buses, one can easily argue for increased priorities for high occupancy vehicles on streets and in-tersections. These concepts are illustrated in Figure 3.57.
• Energy consumption can be incorporated in a city’s master planning process if modal OD and fuel consumption data are system-atically captured. This data can be har-nessed to develop multi-sector spatial plans and policies for energy use and climate change mitigation and adaptation (i.e., in-frastructure standards and codes, emergen-cy procedures).
• Public transport provisions, regulations, fares, subsidies, and service levels directly impact a city’s fi nances. In PPPs, involve-ment of private companies, and their asso-ciated exposure to risks, typically progress-es from management and operations to ownership of fl eets, facilities, and infra-structure. Multiple options are available to allocate risks between public and private partners; the choice depends partly on the extent of development of legal systems and market institutions in a city and country.
ECo2-Part3brEV_PREP Sec1:280 6/15/09 9:04:39 AM
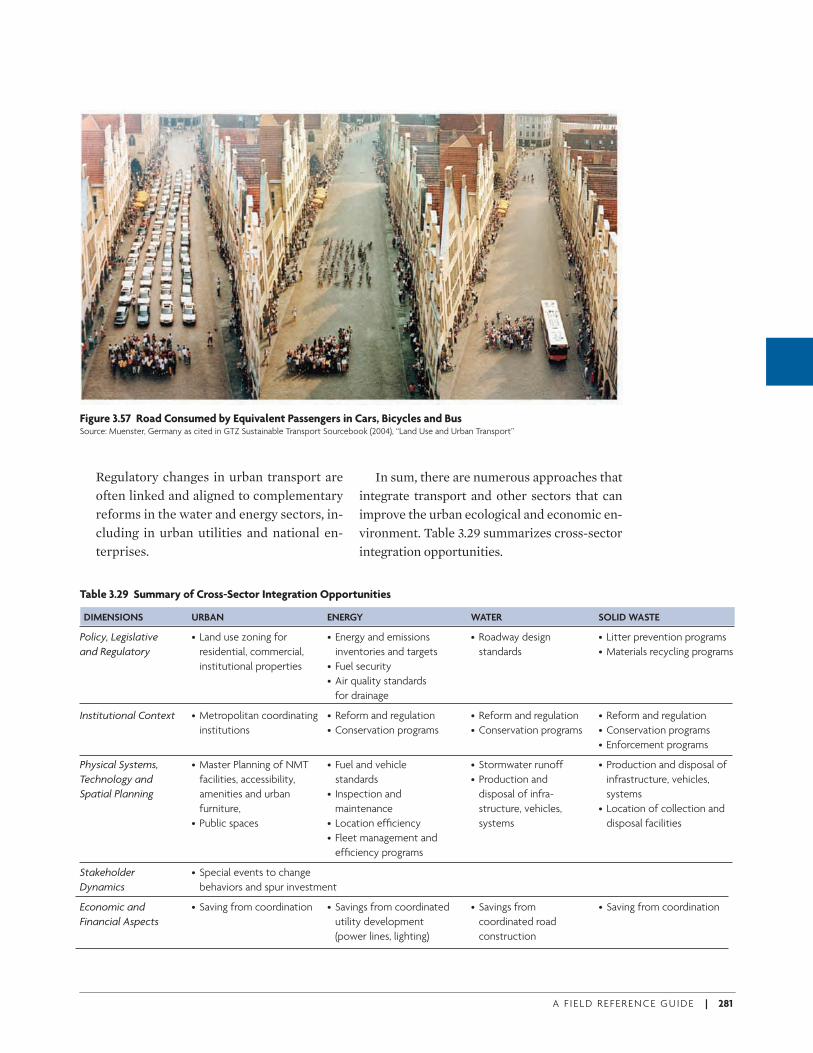
A F I E L D R E F E R E N C E G U I D E | 281
Regulatory changes in urban transport are often linked and aligned to complementary reforms in the water and energy sectors, in-cluding in urban utilities and national en-terprises.
In sum, there are numerous approaches that integrate transport and other sectors that can improve the urban ecological and economic en-vironment. Table 3.29 summarizes cross-sector integration opportunities.
Figure 3.57 Road Consumed by Equivalent Passengers in Cars, Bicycles and BusSource: Muenster, Germany as cited in GTZ Sustainable Transport Sourcebook (2004), “Land Use and Urban Transport”
Table 3.29 Summary of Cross-Sector Integration Opportunities
DIMENSIONS URBAN ENERGY WATER SOLID WASTE
Policy, Legislative • Land use zoning for • Energy and emissions • Roadway design • Litter prevention programs
and Regulatory residential, commercial, inventories and targets standards • Materials recycling programs
institutional properties • Fuel security
• Air quality standards
for drainage
Institutional Context • Metropolitan coordinating • Reform and regulation • Reform and regulation • Reform and regulation
institutions • Conservation programs • Conservation programs • Conservation programs
• Enforcement programs
Physical Systems, • Master Planning of NMT • Fuel and vehicle • Stormwater runoff • Production and disposal of
Technology and facilities, accessibility, standards • Production and infrastructure, vehicles,
Spatial Planning amenities and urban • Inspection and disposal of infra- systems
furniture, maintenance structure, vehicles, • Location of collection and
• Public spaces • Location effi ciency systems disposal facilities
• Fleet management and
effi ciency programs
Stakeholder • Special events to change
Dynamics behaviors and spur investment
Economic and • Saving from coordination • Savings from coordinated • Savings from • Saving from coordination
Financial Aspects utility development coordinated road
(power lines, lighting) construction
ECo2-Part3brEV_PREP Sec1:281 6/15/09 9:04:39 AM

ECo2-Part3brEV_PREP Sec1:282 6/15/09 9:04:40 AM
A F I E L D R E F E R E N C E G U I D E | 283
Cities and Solid WasteSECTOR NOTE 4
Overview
Waste management is often viewed as an end stage in a product’s life cycle. However, it also provides opportunities to renew materials’ use-ful life by recycling, composting, and recovering energy through thermal processes such as in-cineration or methane capture from landfi lls. The energy released from thermal treatment or methane combustion can then be used to gener-ate electricity or other power, creating a syner-gistic loop. The desired aims of a waste manage-ment system can be summarized thus:
“Waste management should fundamentally protect public health; while also maximiz-ing material and energy resource use e+ -ciency and protecting the natural ecology.”
Figure 3.58 delineates the main inputs, inter-ventions, and outputs of a waste management system. Inputs can be either independent or de-pendent based on their degree of controllability. For example, geography normally represent an independent input over which authorities have little if any control, while policy frameworks are dependent as cities do infl uence legislation. Outputs can work toward the aims above, or be undesirable, such as higher than expected air and water pollution.
Why is waste management important?
E( ective waste management is critical to the ecological and economic vitality of urban areas.
Fundamentally, a properly designed and oper-ated waste management system provides:
• Protection of Public Health. Inadequately col-lected waste and poor disposal are breeding grounds for disease-carrying vermin such as rodents and insects. vIn addition, bacteria like salmonella and shigella thrive in food waste, which accounts for over half of the municipal waste in developing countries.148
• Ecological Protection. An e( ective system will regulate or prohibit harmful practices, such as open burning and improper waste disposal, to protect local and regional ecolo-gies and mitigate impacts on air, land, and water.
• E' ective Budget Management. E+ cient sol-id waste management is very important to the fi scal health of a city because solid waste management in medium-sized cities can reach 40 to 50 percent of total municipal budgets.149
• Employment. Waste management provides signifi cant formal employment from collec-tion to disposal. Informal employment may also be important, such as waste collectors who recover materials for recycling prior to collection at disposal sites.
• Aesthetics. E( ective systems protect cities’ vi-sual and sensory appeal by ensuring that waste is e( ectively managed and that practices do not unduly impact residents and visitors.
ECo2-Part3brEV_PREP Sec1:283 6/15/09 9:04:41 AM
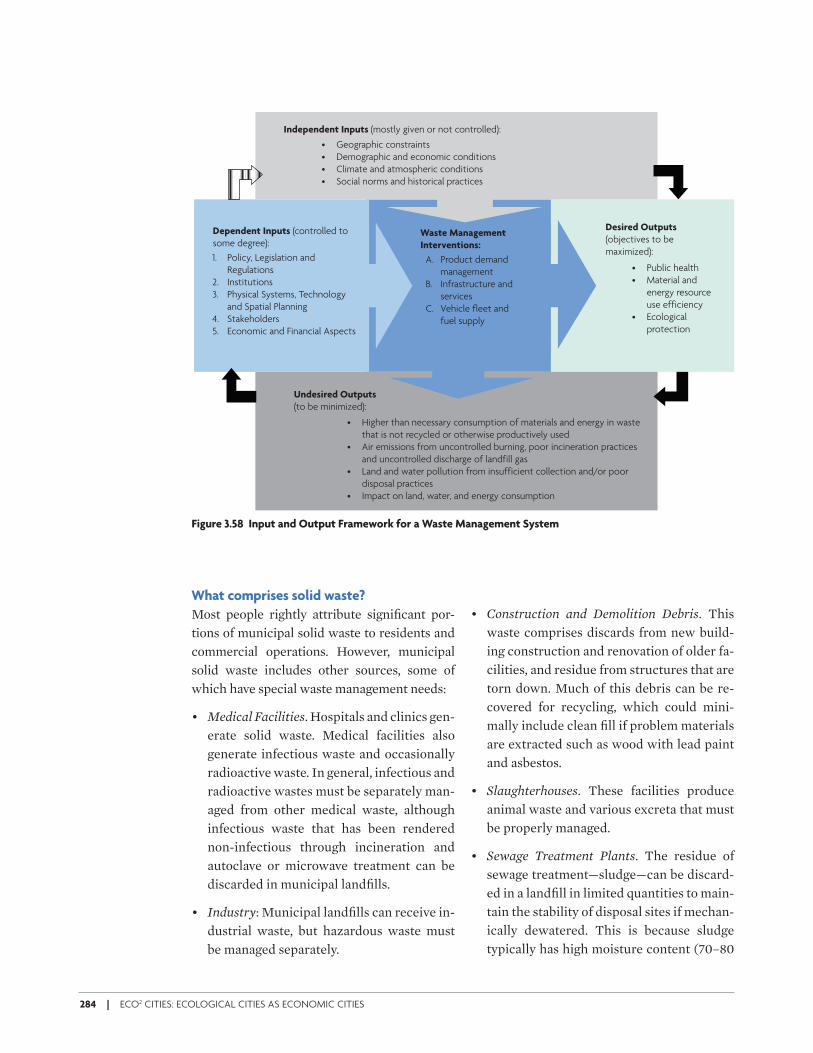
284 | ECO2 CITIES: ECOLOGICAL CITIES AS ECONOMIC CITIES
What comprises solid waste?
Most people rightly attribute signifi cant por-tions of municipal solid waste to residents and commercial operations. However, municipal solid waste includes other sources, some of which have special waste management needs:
• Medical Facilities. Hospitals and clinics gen-erate solid waste. Medical facilities also generate infectious waste and occasionally radioactive waste. In general, infectious and radioactive wastes must be separately man-aged from other medical waste, although infectious waste that has been rendered non-infectious through incineration and autoclave or microwave treatment can be discarded in municipal landfi lls.
• Industry: Municipal landfi lls can receive in-dustrial waste, but hazardous waste must be managed separately.
• Construction and Demolition Debris. This waste comprises discards from new build-ing construction and renovation of older fa-cilities, and residue from structures that are torn down. Much of this debris can be re-covered for recycling, which could mini-mally include clean fi ll if problem materials are extracted such as wood with lead paint and asbestos.
• Slaughterhouses. These facilities produce animal waste and various excreta that must be properly managed.
• Sewage Treatment Plants. The residue of sewage treatment—sludge—can be discard-ed in a landfi ll in limited quantities to main-tain the stability of disposal sites if mechan-ically dewatered. This is because sludge typically has high moisture content (70–80
• Geographic constraints
• Demographic and economic conditions
• Climate and atmospheric conditions
• Social norms and historical practices
Independent Inputs (mostly given or not controlled):
• Public health
• Material and
energy resource
use efficiency
• Ecological
protection
Desired Outputs (objectives to be
maximized):A. Product demand
management
B. Infrastructure and
services
C. Vehicle fleet and
fuel supply
Waste ManagementInterventions:
• Higher than necessary consumption of materials and energy in waste
that is not recycled or otherwise productively used
• Air emissions from uncontrolled burning, poor incineration practices
and uncontrolled discharge of landfill gas
• Land and water pollution from insufficient collection and/or poor
disposal practices
• Impact on land, water, and energy consumption
Undesired Outputs (to be minimized):
1. Policy, Legislation and
Regulations
2. Institutions
3. Physical Systems, Technology
and Spatial Planning
4. Stakeholders
5. Economic and Financial Aspects
Dependent Inputs (controlled to
some degree):
Figure 3.58 Input and Output Framework for a Waste Management System
ECo2-Part3brEV_PREP Sec1:284 6/15/09 9:04:41 AM
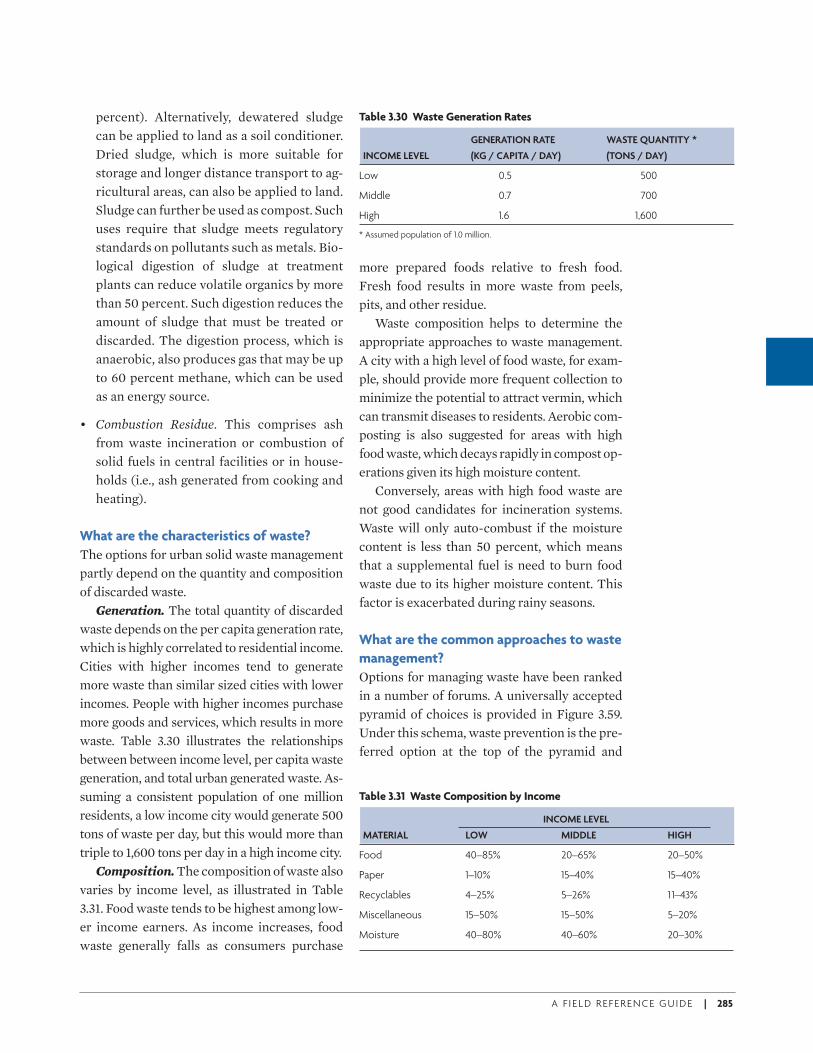
A F I E L D R E F E R E N C E G U I D E | 285
percent). Alternatively, dewatered sludge can be applied to land as a soil conditioner. Dried sludge, which is more suitable for storage and longer distance transport to ag-ricultural areas, can also be applied to land. Sludge can further be used as compost. Such uses require that sludge meets regulatory standards on pollutants such as metals. Bio-logical digestion of sludge at treatment plants can reduce volatile organics by more than 50 percent. Such digestion reduces the amount of sludge that must be treated or discarded. The digestion process, which is anaerobic, also produces gas that may be up to 60 percent methane, which can be used as an energy source.
• Combustion Residue. This comprises ash from waste incineration or combustion of solid fuels in central facilities or in house-holds (i.e., ash generated from cooking and heating).
What are the characteristics of waste?
The options for urban solid waste management partly depend on the quantity and composition of discarded waste.
Generation. The total quantity of discarded waste depends on the per capita generation rate, which is highly correlated to residential income. Cities with higher incomes tend to generate more waste than similar sized cities with lower incomes. People with higher incomes purchase more goods and services, which results in more waste. Table 3.30 illustrates the relationships between between income level, per capita waste generation, and total urban generated waste. As-suming a consistent population of one million residents, a low income city would generate 500 tons of waste per day, but this would more than triple to 1,600 tons per day in a high income city.
Composition. The composition of waste also varies by income level, as illustrated in Table 3.31. Food waste tends to be highest among low-er income earners. As income increases, food waste generally falls as consumers purchase
more prepared foods relative to fresh food. Fresh food results in more waste from peels, pits, and other residue.
Waste composition helps to determine the appropriate approaches to waste management. A city with a high level of food waste, for exam-ple, should provide more frequent collection to minimize the potential to attract vermin, which can transmit diseases to residents. Aerobic com-posting is also suggested for areas with high food waste, which decays rapidly in compost op-erations given its high moisture content.
Conversely, areas with high food waste are not good candidates for incineration systems. Waste will only auto-combust if the moisture content is less than 50 percent, which means that a supplemental fuel is need to burn food waste due to its higher moisture content. This factor is exacerbated during rainy seasons.
What are the common approaches to waste
management?
Options for managing waste have been ranked in a number of forums. A universally accepted pyramid of choices is provided in Figure 3.59. Under this schema, waste prevention is the pre-ferred option at the top of the pyramid and
Table 3.30 Waste Generation Rates
GENERATION RATE WASTE QUANTITY *
INCOME LEVEL (KG / CAPITA / DAY) (TONS / DAY)
Low 0.5 500
Middle 0.7 700
High 1.6 1,600
* Assumed population of 1.0 million.
Table 3.31 Waste Composition by Income
INCOME LEVEL
MATERIAL LOW MIDDLE HIGH
Food 40–85% 20–65% 20–50%
Paper 1–10% 15–40% 15–40%
Recyclables 4–25% 5–26% 1 1–43%
Miscellaneous 15–50% 15–50% 5–20%
Moisture 40–80% 40–60% 20–30%
ECo2-Part3brEV_PREP Sec1:285 6/15/09 9:04:41 AM
286 | ECO2 CITIES: ECOLOGICAL CITIES AS ECONOMIC CITIES
waste disposal the least favored option forming the pyramid’s foundation. Waste prevention and minimization are equivalent to waste re-duction, and involve:
‘…prevention of wastes at their source by redesigning products or changing pat-terns of production and consumption’.150
Waste reduction (i.e., prevention and minimi-zation) comprises demand management prac-tices such as creating durable products with lon-ger lives. Reuse implies products that can be used more than once, unlike “disposable” or sin-gle-use products such as diapers and soft drink containers. The recycling option includes com-posting. Energy recovery includes technologies such as methane capture that harness waste or byproducts to generate useable energy.
What are the key dimensions infl uencing a
waste management system?
Policy, Legislative, and Regulatory Dimensions
Policy Dimension. National and local govern-ments must be committed to improving their
urban environments to protect the health of residents. Additionally, governments, especially at the national level, should emphasize demand management to control the quantity of gener-ated waste. Demand management includes pro-grams to reduce waste, encourage reuse, and recycle.
In Japan, for example, the city of Yokohama took action to reduce demand for waste treat-ment (incineration) and disposal. In 2003, the city launched its G30 Plan (G = garbage; 30 = 30 percent reduction in waste generation by FY2010). The program targeted residents, busi-nesses and government, and focused on the 3Rs: Reduction, Reuse and Recycling. The program has exceeded its goals. In FY2007, waste was re-duced by 38.7 percent, or 0.1 million tons per year. The reduced waste enabled o+ cials to close two incinerators, yielding savings in opera-tional expenditure (OPEX) of US$30 million per year. After subtracting the US$24 million of OPEX costs for the additionally required opera-tions, such as separating waste and subcontract-ing recycling, the city realized net savings of US$6 million per year. The closing of the two in-cinerators also obviated the need for US$ 1.1 bil-lion in capital expenditures (CAPEX) that would have been required to renovate the incinerators.
Figure 3.59 Waste Hierarchy
Most Favored Options at the top of the Pyramid Declining to the Least Favored at the Bottom
ECo2-Part3brEV_PREP Sec1:286 6/15/09 9:04:41 AM
A F I E L D R E F E R E N C E G U I D E | 287
At the local level, e( ective wastewater man-agement and air pollution control are needed to address risks. In cities with open drains, for ex-ample, uncollected waste dumped into drains can block or hinder water fl ow, which can cause severe fl ooding during high rainfall. As waste disposal sites are often in low lying areas near waterways or wetlands, inappropriately de-signed landfi lls or discarded waste can also con-taminate surface and ground water, with con-comitant risks on drinking water and residents that live downstream.
Even when disposal sites are not near water bodies, ground water can still be contaminated. Leachate, which includes contaminated rain water and waste with high moisture content such as discarded food, can percolate through soil under an inadequately designed disposal site and pollute ground water. Leachate can be controlled by lining the bottom of a disposal site with clay and/or a synthetic material such as high density polyethylene. These materials in-hibit the fl ow of leachate, which can then be collected through pipes on top of the liner, and treated.
The combustion of solid waste, whether in an incinerator or a fi re at an open dump, can add particulates (smoke) to the atmosphere and other toxic and non-toxic air pollutants. Emis-sions from incineration can be controlled, but a comprehensive emissions control system can be nearly as expensive as a combustion system.
Government policies need to address dispos-al of other types of wastes, such as infectious medical waste, hazardous waste, sewage sludge, residue from livestock slaughterhouses in ur-ban areas, and residue from energy production facilities, especially those using solid fuel such as coal and/or biomass. These wastes should be managed separately from municipal waste, and may require treatment prior to disposal, such as to render medical waste non-infectious.
Whenever possible, policies should be benchmarked against those in other cities in the region and in developing and developed coun-
tries. Benchmarking helps to evaluate the ex-pected e( ects of policies through analysis of past practices and lessons learned.
Legislative Dimension. Appropriate laws at all levels of government are important to the development and operation of the waste man-agement sector. Legislation supporting a viable waste management framework should be insti-tuted, if they are not already in place.
Environmental protection and solid waste management measures are often complemen-tary. For example, improved waste management is often a component of environmental legisla-tion to protect water sources and reduce air pollution. Appropriate siting and operation of landfi lls strengthen e( orts to protect water sources. In addition, air quality can be improved by reducing open burning of waste, installing air pollution control equipment at incinerators, and eliminating poor operational practices.
Regulatory Dimension. Enactment of suit-able national and local legislation should be fol-lowed by passage of appropriate regulations and enforcement of waste management laws. In this context, multiple regulations should be considered and approved by governments based on waste management requirements and the existing environmental and waste management policy framework. Measures to consider are noted below.
• Waste classifi cation and standards for
collection, treatment, and disposal. Reg-ulatory defi nitions are important tools for setting standards for waste management practices. For example, management pro-grams for infectious medical waste should be much more rigorous than for non-infec-tious medical waste. Further, treatment standards for di( erent types of infectious medical waste such as sharps and body parts can di( er in terms of sterilization and destruction. The type of waste also infl u-ences the ways waste is disposed. Infectious waste, for example, which may undergo in-cineration, autoclave, and microwave treat-
ECo2-Part3brEV_PREP Sec1:287 6/15/09 9:04:42 AM
288 | ECO2 CITIES: ECOLOGICAL CITIES AS ECONOMIC CITIES
ment, might be buried in a disposal site with a secure perimeter that restricts access.
• Provision of cost recovery mechanisms, such as user fees, should be considered and tied to the amount of disposed waste. For example, if waste is collected from house-holds or taken to a sta( ed collection point, the generators of waste could be charged per container or bag. A lesser charge could be levied for recyclable and compostable materials to encourage reductions in waste. Other mechanism to cover the cost of waste management services, such as product charges (e.g., packaging taxes) and carbon fi nance to reduce greenhouse gas (GHG) emissions are addressed in a later section.
• A systematic program for monitoring and
measuring solid waste services can be a valuable tool to evaluate the performance of a public or private waste management sys-tem. The program should be developed based on appropriate metrics and bench-marks that provide a basis for evaluation of the performance trends. A performance da-tabase should be considered and include historic data whenever possible. Bench-mark information from other cities in the metropolitan area, region, and country could be added to this database. Evaluations of trends may suggest positive or negative performance or slower advances than an-ticipated by municipal o+ cials. By evaluat-ing trends, the program will be in a position to e( ectively respond to shortfalls or poor performance.
• Local and regional planning tools for waste management. Regional collabora-tion should be actively pursued to promote the most comprehensive solutions to waste management, and to achieve economies-of-scale. Though a city might be capable of achieving suitable economies-of-scale without pursuing regional solutions, a re-gional approach may enhance the benefi ts
of a project by expanding its scope beyond the urban area.
An important but often overlooked aspect of regulation is enforcement by an independent government agency. Enforcement is critical to implementing regulations and ensuring ongo-ing regulatory compliance. An e( ective enforce-ment program requires that enforcement agen-cies have the tools to address regulatory deviations. An enforcement agency or program should have the capacity to levy fi nes and other mechanisms to encourage compliance by pun-ishing non-compliance.
Institutional Context
An e( ective policy, legislative, and regulatory framework should be combined with institu-tional measures to eliminate gaps and overlaps in the operational structure of the waste man-agement sector.
Government. An e( ective program should involve ongoing, senior level coordination among municipal and national government of-fi cials and agencies. Local government pro-grams should involve more than just those di-rectly involved in the city, but also those from the metropolitan area to encourage regional co-operation. In the waste management sector, treatment and disposal programs are areas where regional cooperation could achieve e+ -ciencies and economies-of-scale. E( orts are also encouraged to strengthen regional coordi-nation in strategic planning.
Operational Structure. In many cities, a public agency provides solid waste services, which can be an e+ cient means of achieving a community’s public health and environmental goals. However, promoting competition in de-livering waste management services can often improve e+ ciency and services.
Promoting private sector participation (PSP) is an option to achieving competition in the waste management marketplace. PSP may make
ECo2-Part3brEV_PREP Sec1:288 6/15/09 9:04:42 AM
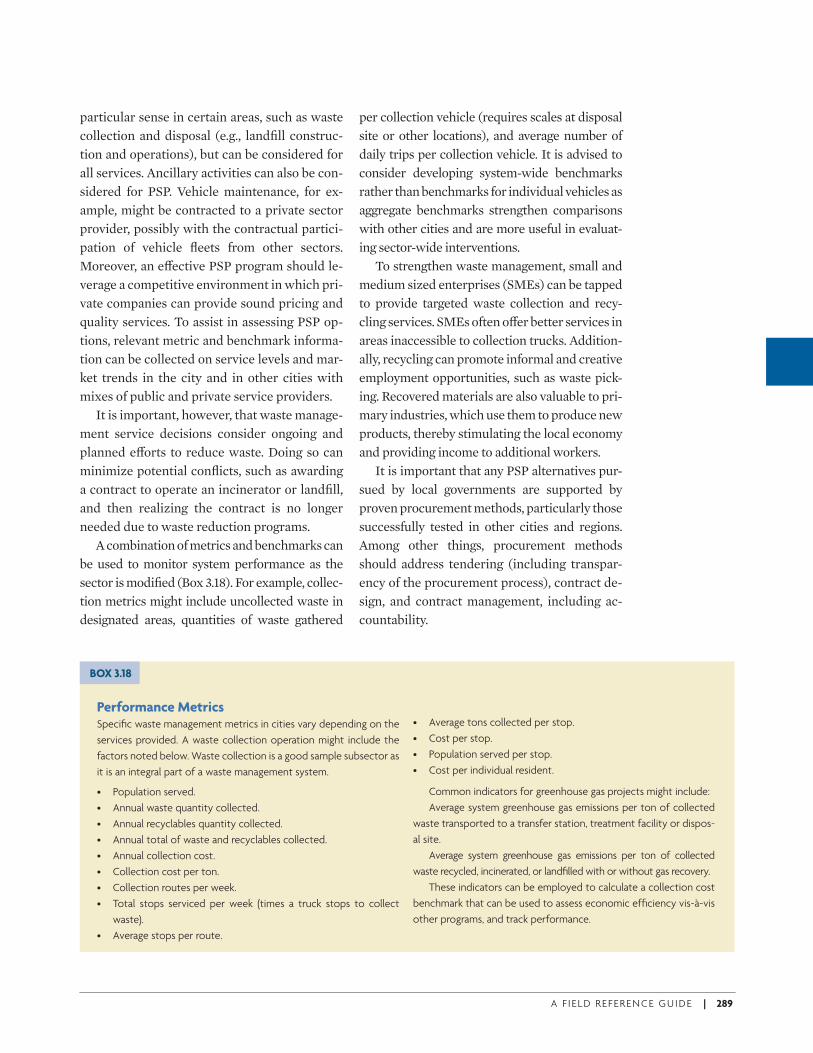
A F I E L D R E F E R E N C E G U I D E | 289
particular sense in certain areas, such as waste collection and disposal (e.g., landfi ll construc-tion and operations), but can be considered for all services. Ancillary activities can also be con-sidered for PSP. Vehicle maintenance, for ex-ample, might be contracted to a private sector provider, possibly with the contractual partici-pation of vehicle fl eets from other sectors. Moreover, an e( ective PSP program should le-verage a competitive environment in which pri-vate companies can provide sound pricing and quality services. To assist in assessing PSP op-tions, relevant metric and benchmark informa-tion can be collected on service levels and mar-ket trends in the city and in other cities with mixes of public and private service providers.
It is important, however, that waste manage-ment service decisions consider ongoing and planned e( orts to reduce waste. Doing so can minimize potential confl icts, such as awarding a contract to operate an incinerator or landfi ll, and then realizing the contract is no longer needed due to waste reduction programs.
A combination of metrics and benchmarks can be used to monitor system performance as the sector is modifi ed (Box 3.18). For example, collec-tion metrics might include uncollected waste in designated areas, quantities of waste gathered
per collection vehicle (requires scales at disposal site or other locations), and average number of daily trips per collection vehicle. It is advised to consider developing system-wide benchmarks rather than benchmarks for individual vehicles as aggregate benchmarks strengthen comparisons with other cities and are more useful in evaluat-ing sector-wide interventions.
To strengthen waste management, small and medium sized enterprises (SMEs) can be tapped to provide targeted waste collection and recy-cling services. SMEs often o( er better services in areas inaccessible to collection trucks. Addition-ally, recycling can promote informal and creative employment opportunities, such as waste pick-ing. Recovered materials are also valuable to pri-mary industries, which use them to produce new products, thereby stimulating the local economy and providing income to additional workers.
It is important that any PSP alternatives pur-sued by local governments are supported by proven procurement methods, particularly those successfully tested in other cities and regions. Among other things, procurement methods should address tendering (including transpar-ency of the procurement process), contract de-sign, and contract management, including ac-countability.
Performance MetricsSpecifi c waste management metrics in cities vary depending on the
services provided. A waste collection operation might include the
factors noted below. Waste collection is a good sample subsector as
it is an integral part of a waste management system.
• Population served.
• Annual waste quantity collected.
• Annual recyclables quantity collected.
• Annual total of waste and recyclables collected.
• Annual collection cost.
• Collection cost per ton.
• Collection routes per week.
• Total stops serviced per week (times a truck stops to collect
waste).
• Average stops per route.
BOX 3.18
• Average tons collected per stop.
• Cost per stop.
• Population served per stop.
• Cost per individual resident.
Common indicators for greenhouse gas projects might include:
Average system greenhouse gas emissions per ton of collected
waste transported to a transfer station, treatment facility or dispos-
al site.
Average system greenhouse gas emissions per ton of collected
waste recycled, incinerated, or landfi lled with or without gas recovery.
These indicators can be employed to calculate a collection cost
benchmark that can be used to assess economic effi ciency vis-à-vis
other programs, and track performance.
ECo2-Part3brEV_PREP Sec1:289 6/15/09 9:04:42 AM
290 | ECO2 CITIES: ECOLOGICAL CITIES AS ECONOMIC CITIES
Physical Systems, Technology, and Spatial Concerns
The physical, technological and spatial aspects of waste programs depend on factors unique to each city. It is initially critical to defi ne the physical pa-rameters of the existing waste management sys-tem, its employed technologies, and spatial re-quirements. A second step is to assess alternative options that fi t the guidelines of the program.
Spatial Characteristics. Understanding the physical nature of a city is critical to developing a clear defi nition of existing and potential di-rections. Baseline factors that need to be de-fi ned include:
• Population.
• Surface area (population density).
• Terrain/topography of a city and its sur-roundings
• Per capita income
• Mix and location of economic activities, in-cluding: – Industrial (types)– Transport (freight consolidation, ware-
housing)– Commercial (types)– Special institutions (types, such a medical
facilities that generate infectious wastes)– Residential (multifamily, single family)
Waste Characteristics. After establishing the factors that a( ect waste generation and waste management operations, it is important to understand the characteristics of generated waste in a target city. The two critical charac-teristics are waste quantity and composition.
Quantity. Quantity is critical for sizing the waste management system. As the population or economy of a city grows, per capita waste and total waste tend to increase (Table 3.30). Reli-able data on the quantity of waste being gener-ated and managed in di( erent urban areas are important to properly size the system, plan
equipment purchases, and determine the ser-vices needed to manage a city’s waste.
Composition. As noted, low income cities tend to produce substantial organic discards, mainly food waste. Food waste has a high moisture content, which can a( ect a waste stream’s suitability for alternative treatment processes. Systems that must treat high shares of food waste lend them-selves to composting rather than incineration, as food waste will not generally auto-combust.
Waste System Components. The processes used to manage solid waste could include:
• Waste storage at households or commer-
cial establishments, or at selected collection points that serve a number of these groups.
• Vehicle collection, which entails defi ning pickup frequency, equipment, and crew size. Besides truck collection, underground pneu-matic collection might o( er advantages in ur-ban areas with narrow streets that impede truck collection. Under this scenario, waste is drawn by vacuum pressure to a collection point where it is deposited into a container. A pneumatic system includes trash receiving stations, an un-derground piping system, a vacuum blower that pulls waste through pipes, air fi lters for particu-lates and odor, and a facility where collected material can be stored until it is hauled to a treatment or disposal facility. Pneumatic sys-tems have been used in some smaller urban ar-eas in Japan and Sweden, and in large complex-es such as airports, shopping centers, and hospitals. In many developing countries, par-ticularly in slums, waste collection in urban ar-eas with narrow streets can be accomplished through innovative solutions. For instance, lo-cal residents and the poor can be directly in-volved in waste collection (Box 3.19).
• Formal and informal (i.e., waste picking) re-
cycling. Recycling may take place at collection points, treatment facilities and/or disposal sites. In Curitiba (Box 3.20), the city generated employment and formalized informal activi-ties through an innovative recycling program.
ECo2-Part3brEV_PREP Sec1:290 6/15/09 9:04:42 AM
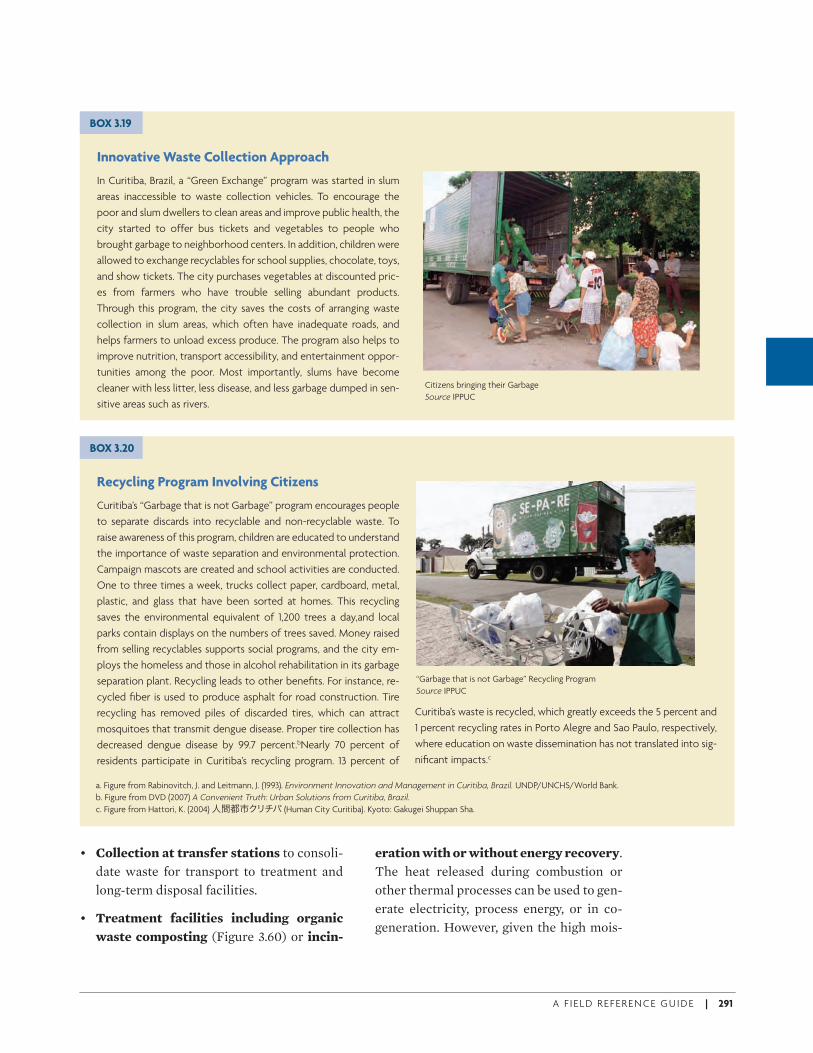
A F I E L D R E F E R E N C E G U I D E | 291
• Collection at transfer stations to consoli-date waste for transport to treatment and long-term disposal facilities.
• Treatment facilities including organic
waste composting (Figure 3.60) or incin-
Innovative Waste Collection Approach
In Curitiba, Brazil, a “Green Exchange” program was started in slum
areas inaccessible to waste collection vehicles. To encourage the
poor and slum dwellers to clean areas and improve public health, the
city started to offer bus tickets and vegetables to people who
brought garbage to neighborhood centers. In addition, children were
allowed to exchange recyclables for school supplies, chocolate, toys,
and show tickets. The city purchases vegetables at discounted pric-
es from farmers who have trouble selling abundant products.
Through this program, the city saves the costs of arranging waste
collection in slum areas, which often have inadequate roads, and
helps farmers to unload excess produce. The program also helps to
improve nutrition, transport accessibility, and entertainment oppor-
tunities among the poor. Most importantly, slums have become
cleaner with less litter, less disease, and less garbage dumped in sen-
sitive areas such as rivers.
Recycling Program Involving Citizens
Curitiba’s “Garbage that is not Garbage” program encourages people
to separate discards into recyclable and non-recyclable waste. To
raise awareness of this program, children are educated to understand
the importance of waste separation and environmental protection.
Campaign mascots are created and school activities are conducted.
One to three times a week, trucks collect paper, cardboard, metal,
plastic, and glass that have been sorted at homes. This recycling
saves the environmental equivalent of 1,200 trees a day,and local
parks contain displays on the numbers of trees saved. Money raised
from selling recyclables supports social programs, and the city em-
ploys the homeless and those in alcohol rehabilitation in its garbage
separation plant. Recycling leads to other benefi ts. For instance, re-
cycled fi ber is used to produce asphalt for road construction. Tire
recycling has removed piles of discarded tires, which can attract
mosquitoes that transmit dengue disease. Proper tire collection has
decreased dengue disease by 99.7 percent.bNearly 70 percent of
residents participate in Curitiba’s recycling program. 13 percent of
BOX 3.19
BOX 3.20
Citizens bringing their Garbage
Source IPPUC
“Garbage that is not Garbage” Recycling Program
Source IPPUC
a. Figure from Rabinovitch, J. and Leitmann, J. (1993). Environment Innovation and Management in Curitiba, Brazil. UNDP/UNCHS/World Bank.
b. Figure from DVD (2007) A Convenient Truth: Urban Solutions from Curitiba, Brazil.
c. Figure from Hattori, K. (2004) 人間都市クリチバ (Human City Curitiba). Kyoto: Gakugei Shuppan Sha.
Curitiba’s waste is recycled, which greatly exceeds the 5 percent and
1 percent recycling rates in Porto Alegre and Sao Paulo, respectively,
where education on waste dissemination has not translated into sig-
nifi cant impacts.c
eration with or without energy recovery. The heat released during combustion or other thermal processes can be used to gen-erate electricity, process energy, or in co-generation. However, given the high mois-
ECo2-Part3brEV_PREP Sec1:291 6/15/09 9:04:42 AM
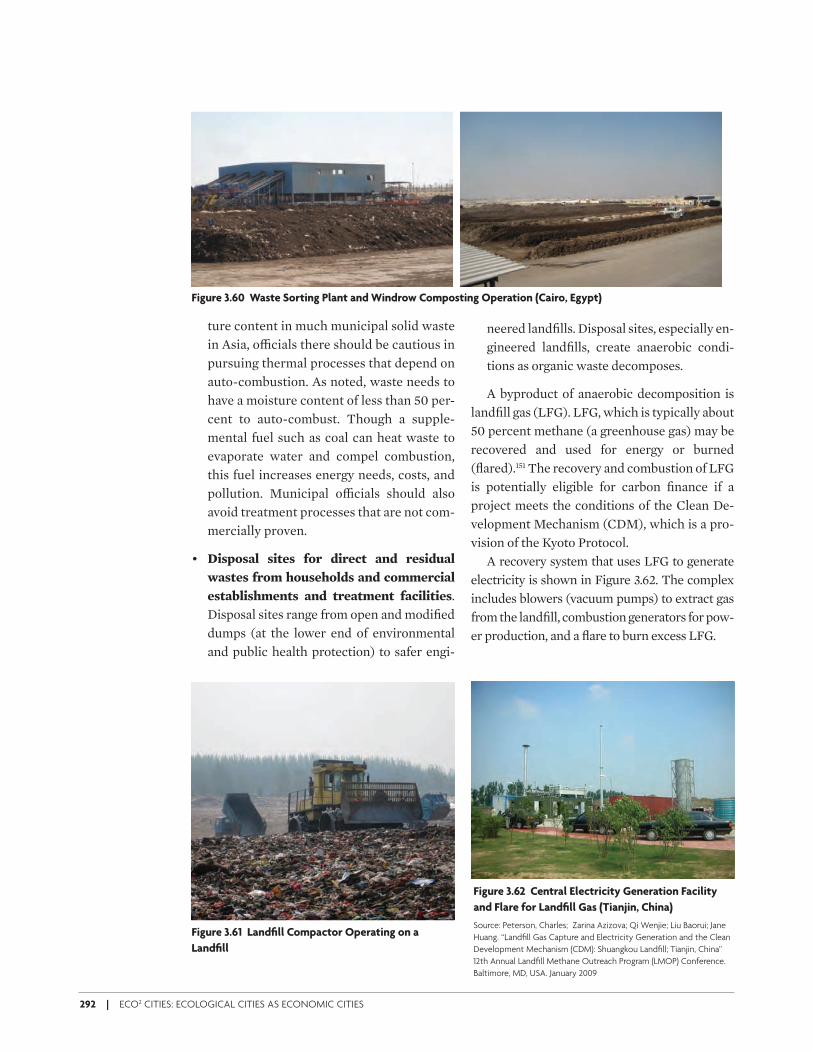
292 | ECO2 CITIES: ECOLOGICAL CITIES AS ECONOMIC CITIES
ture content in much municipal solid waste in Asia, o+ cials there should be cautious in pursuing thermal processes that depend on auto-combustion. As noted, waste needs to have a moisture content of less than 50 per-cent to auto-combust. Though a supple-mental fuel such as coal can heat waste to evaporate water and compel combustion, this fuel increases energy needs, costs, and pollution. Municipal o+ cials should also avoid treatment processes that are not com-mercially proven.
• Disposal sites for direct and residual
wastes from households and commercial
establishments and treatment facilities. Disposal sites range from open and modifi ed dumps (at the lower end of environmental and public health protection) to safer engi-
neered landfi lls. Disposal sites, especially en-gineered landfi lls, create anaerobic condi-tions as organic waste decomposes.
A byproduct of anaerobic decomposition is landfi ll gas (LFG). LFG, which is typically about 50 percent methane (a greenhouse gas) may be recovered and used for energy or burned (fl ared).151 The recovery and combustion of LFG is potentially eligible for carbon fi nance if a project meets the conditions of the Clean De-velopment Mechanism (CDM), which is a pro-vision of the Kyoto Protocol.
A recovery system that uses LFG to generate electricity is shown in Figure 3.62. The complex includes blowers (vacuum pumps) to extract gas from the landfi ll, combustion generators for pow-er production, and a fl are to burn excess LFG.
Figure 3.60 Waste Sorting Plant and Windrow Composting Operation (Cairo, Egypt)
Figure 3.61 Landfi ll Compactor Operating on a
Landfi ll
Figure 3.62 Central Electricity Generation Facility
and Flare for Landfi ll Gas (Tianjin, China)
Source: Peterson, Charles; Zarina Azizova; Qi Wenjie; Liu Baorui; Jane
Huang. “Landfi ll Gas Capture and Electricity Generation and the Clean
Development Mechanism (CDM): Shuangkou Landfi ll; Tianjin, China”
12th Annual Landfi ll Methane Outreach Program (LMOP) Conference.
Baltimore, MD, USA. January 2009
ECo2-Part3brEV_PREP Sec1:292 6/15/09 9:04:43 AM
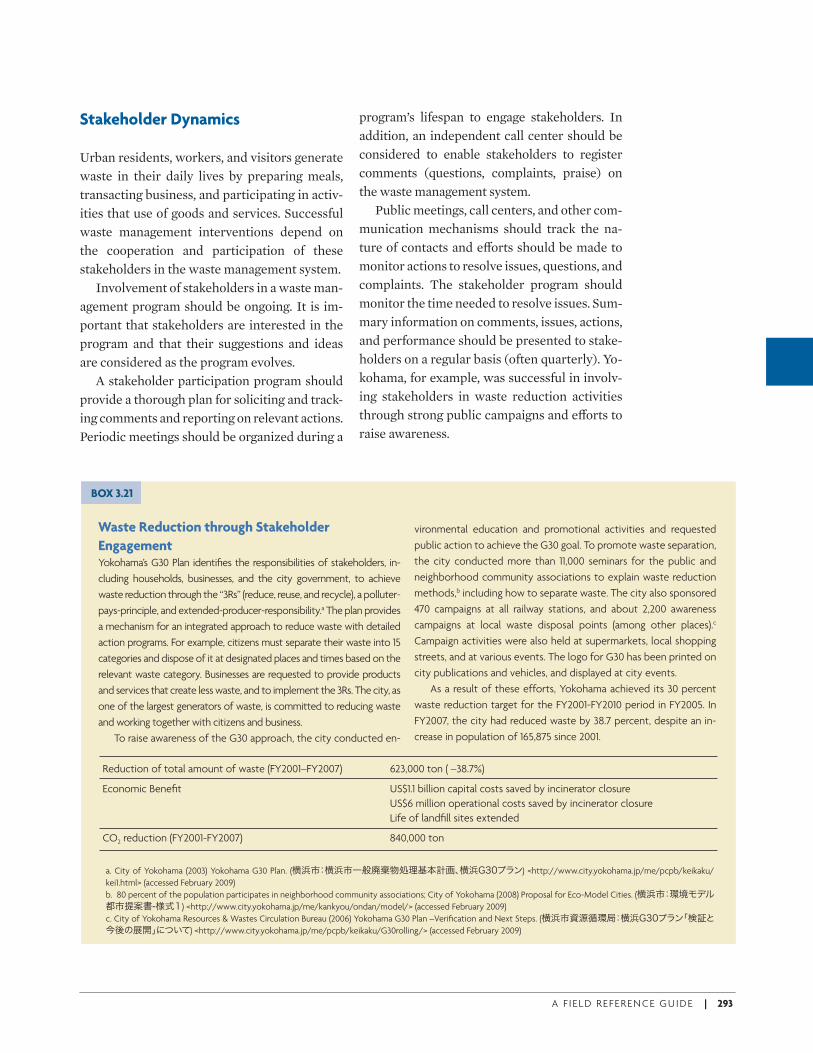
A F I E L D R E F E R E N C E G U I D E | 293
Stakeholder Dynamics
Urban residents, workers, and visitors generate waste in their daily lives by preparing meals, transacting business, and participating in activ-ities that use of goods and services. Successful waste management interventions depend on the cooperation and participation of these stakeholders in the waste management system.
Involvement of stakeholders in a waste man-agement program should be ongoing. It is im-portant that stakeholders are interested in the program and that their suggestions and ideas are considered as the program evolves.
A stakeholder participation program should provide a thorough plan for soliciting and track-ing comments and reporting on relevant actions. Periodic meetings should be organized during a
program’s lifespan to engage stakeholders. In addition, an independent call center should be considered to enable stakeholders to register comments (questions, complaints, praise) on the waste management system.
Public meetings, call centers, and other com-munication mechanisms should track the na-ture of contacts and e( orts should be made to monitor actions to resolve issues, questions, and complaints. The stakeholder program should monitor the time needed to resolve issues. Sum-mary information on comments, issues, actions, and performance should be presented to stake-holders on a regular basis (often quarterly). Yo-kohama, for example, was successful in involv-ing stakeholders in waste reduction activities through strong public campaigns and e( orts to raise awareness.
Waste Reduction through Stakeholder
EngagementYokohama’s G30 Plan identifi es the responsibilities of stakeholders, in-
cluding households, businesses, and the city government, to achieve
waste reduction through the “3Rs” (reduce, reuse, and recycle), a polluter-
pays-principle, and extended-producer-responsibility.a The plan provides
a mechanism for an integrated approach to reduce waste with detailed
action programs. For example, citizens must separate their waste into 15
categories and dispose of it at designated places and times based on the
relevant waste category. Businesses are requested to provide products
and services that create less waste, and to implement the 3Rs. The city, as
one of the largest generators of waste, is committed to reducing waste
and working together with citizens and business.
To raise awareness of the G30 approach, the city conducted en-
BOX 3.21
vironmental education and promotional activities and requested
public action to achieve the G30 goal. To promote waste separation,
the city conducted more than 11,000 seminars for the public and
neighborhood community associations to explain waste reduction
methods,b including how to separate waste. The city also sponsored
470 campaigns at all railway stations, and about 2,200 awareness
campaigns at local waste disposal points (among other places).c
Campaign activities were also held at supermarkets, local shopping
streets, and at various events. The logo for G30 has been printed on
city publications and vehicles, and displayed at city events.
As a result of these efforts, Yokohama achieved its 30 percent
waste reduction target for the FY2001-FY2010 period in FY2005. In
FY2007, the city had reduced waste by 38.7 percent, despite an in-
crease in population of 165,875 since 2001.
Reduction of total amount of waste (FY2001–FY2007) 623,000 ton ( –38.7%)
Economic Benefi t US$1.1 billion capital costs saved by incinerator closure
US$6 million operational costs saved by incinerator closure
Life of landfi ll sites extended
CO2 reduction (FY2001-FY2007) 840,000 ton
a. City of Yokohama (2003) Yokohama G30 Plan. (横浜市:横浜市一般廃棄物処理基本計画、横浜G30プラン) <http://www.city.yokohama.jp/me/pcpb/keikaku/
kei1.html> (accessed February 2009)
b. 80 percent of the population participates in neighborhood community associations; City of Yokohama (2008) Proposal for Eco-Model Cities. (横浜市:環境モデル都市提案書-様式1) <http://www.city.yokohama.jp/me/kankyou/ondan/model/> (accessed February 2009)
c. City of Yokohama Resources & Wastes Circulation Bureau (2006) Yokohama G30 Plan –Verifi cation and Next Steps. (横浜市資源循環局:横浜G30プラン「検証と今後の展開」について) <http://www.city.yokohama.jp/me/pcpb/keikaku/G30rolling/> (accessed February 2009)
ECo2-Part3brEV_PREP Sec1:293 6/15/09 9:04:46 AM
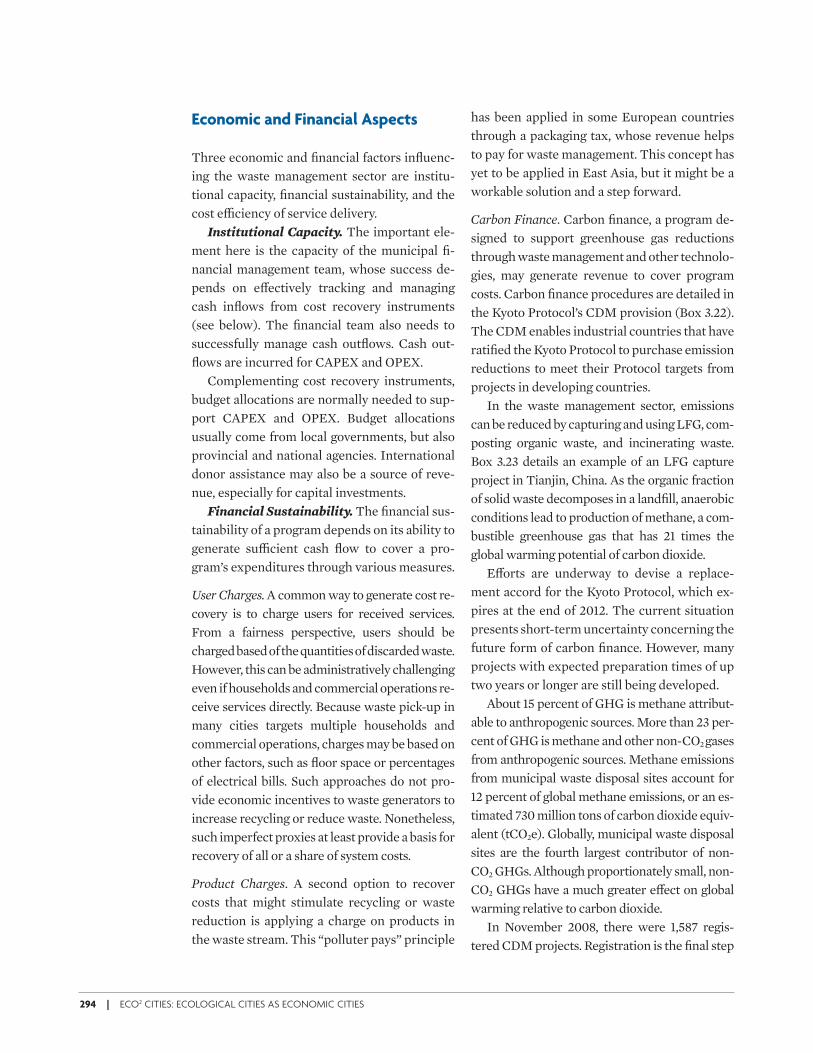
294 | ECO2 CITIES: ECOLOGICAL CITIES AS ECONOMIC CITIES
Economic and Financial Aspects
Three economic and fi nancial factors infl uenc-ing the waste management sector are institu-tional capacity, fi nancial sustainability, and the cost e+ ciency of service delivery.
Institutional Capacity. The important ele-ment here is the capacity of the municipal fi -nancial management team, whose success de-pends on e( ectively tracking and managing cash infl ows from cost recovery instruments (see below). The fi nancial team also needs to successfully manage cash outfl ows. Cash out-fl ows are incurred for CAPEX and OPEX.
Complementing cost recovery instruments, budget allocations are normally needed to sup-port CAPEX and OPEX. Budget allocations usually come from local governments, but also provincial and national agencies. International donor assistance may also be a source of reve-nue, especially for capital investments.
Financial Sustainability. The fi nancial sus-tainability of a program depends on its ability to generate su+ cient cash fl ow to cover a pro-gram’s expenditures through various measures.
User Charges. A common way to generate cost re-covery is to charge users for received services. From a fairness perspective, users should be charged based of the quantities of discarded waste. However, this can be administratively challenging even if households and commercial operations re-ceive services directly. Because waste pick-up in many cities targets multiple households and commercial operations, charges may be based on other factors, such as fl oor space or percentages of electrical bills. Such approaches do not pro-vide economic incentives to waste generators to increase recycling or reduce waste. Nonetheless, such imperfect proxies at least provide a basis for recovery of all or a share of system costs.
Product Charges. A second option to recover costs that might stimulate recycling or waste reduction is applying a charge on products in the waste stream. This “polluter pays” principle
has been applied in some European countries through a packaging tax, whose revenue helps to pay for waste management. This concept has yet to be applied in East Asia, but it might be a workable solution and a step forward.
Carbon Finance. Carbon fi nance, a program de-signed to support greenhouse gas reductions through waste management and other technolo-gies, may generate revenue to cover program costs. Carbon fi nance procedures are detailed in the Kyoto Protocol’s CDM provision (Box 3.22). The CDM enables industrial countries that have ratifi ed the Kyoto Protocol to purchase emission reductions to meet their Protocol targets from projects in developing countries.
In the waste management sector, emissions can be reduced by capturing and using LFG, com-posting organic waste, and incinerating waste. Box 3.23 details an example of an LFG capture project in Tianjin, China. As the organic fraction of solid waste decomposes in a landfi ll, anaerobic conditions lead to production of methane, a com-bustible greenhouse gas that has 21 times the global warming potential of carbon dioxide.
E( orts are underway to devise a replace-ment accord for the Kyoto Protocol, which ex-pires at the end of 2012. The current situation presents short-term uncertainty concerning the future form of carbon fi nance. However, many projects with expected preparation times of up two years or longer are still being developed.
About 15 percent of GHG is methane attribut-able to anthropogenic sources. More than 23 per-cent of GHG is methane and other non-CO2
gases from anthropogenic sources. Methane emissions from municipal waste disposal sites account for 12 percent of global methane emissions, or an es-timated 730 million tons of carbon dioxide equiv-alent (tCO2e). Globally, municipal waste disposal sites are the fourth largest contributor of non-CO2 GHGs. Although proportionately small, non-CO2 GHGs have a much greater e( ect on global warming relative to carbon dioxide.
In November 2008, there were 1,587 regis-tered CDM projects. Registration is the fi nal step
ECo2-Part3brEV_PREP Sec1:294 6/15/09 9:04:46 AM
A F I E L D R E F E R E N C E G U I D E | 295
in the development of a CDM project prior to start-up of operations. An independent validator must annually verify achieved emission reduc-tions. Registered projects cover a range of activi-ties designed to reduce GHG emissions, includ-
ing LFG capture. LFG projects account for about 5 percent of registered CDM projects, most of which use captured methane for energy recov-ery (typically electricity). Projects without suit-able access to energy markets and/or modest gas
CDM and Waste Management
Kyoto Protocol. One of the earlier efforts to address global warming
was the formation of the Inter-governmental Panel on Climate Change
(IPCC) by the World Meteorological Organization (WMO) and the
United Nations Environment Programme (UNEP) in 1988. The IPCC
compiles published scientifi c and technical literature on global warm-
ing, its potential impacts, and options for adaptation and mitigation.
A further effort to stabilize green house gas emissions was the
1994 establishment of a voluntary program under the United Na-
tions Framework Conventional on Climate Change (UNFCCC, http://
unfccc.int), following the Earth Summit in Rio de Janeiro, Brazil. Fail-
ure of the voluntary program to achieve its desired results led to the
legally binding Kyoto Protocol. The Kyoto Protocol became effec-
tive in February 2005.
Clean Development Mechanism. The CDM (http://cdm.unfccc.int/
index.html), a provision of the Kyoto Protocol, allows industrialized
countries listed in Annex 1 of the Protocol to purchase emission re-
duction credits from developing countries to meet their established
emission reduction targets. More specifi cally, Annex 1 countries gen-
erate credits by supporting projects that reduce emissions in devel-
oping countries, sometimes through new technologies in waste
management. Emission reductions under CDM programs can be
traded among buyers in Annex 1 countries. Since emission reduc-
tions are tied to performance, carbon fi nance programs are a source
of operational revenue rather than capital investment.
A range of methodologies has been approved by the CDM Execu-
tive Board to help determine eligible projects, including those in waste
management. A common feature of all methodologies is the require-
ment to establish baseline emissions that would have occurred in the
absence of a CDM project. In waste management, a common baseline
assumes waste disposal exclusively in landfi lls, and calculations of as-
sociated greenhouse gas emissions based on this assumption.
CDM interventions must also be “additional.” That is, they must
create additional emission reductions that would not have been
achieved without the project. Assessment of project “additionality”
is based on any of the following conditions. First, investment analy-
sis can demonstrate that the internal rate of return for a project
without carbon fi nance revenue would be insuffi cient to justify the
project from being implemented and maintained. Additionality can
also be demonstrated by showing that employed technology is not
used in the country where the project is located, or that the pro-
posed CDM project is not common practice in the host country.
BOX 3.22
Methane. The most frequent greenhouse gas associated with waste
management is methane, which is generated amid anaerobic condi-
tions in waste disposal sites. Methane has a global warming potential
that is 21 times greater than carbon dioxide.
Waste management programs offer several options to generate
emission reductions. Two common options are capturing and using
methane in landfi lls and avoiding methane by composting organic
waste. Emission reduction credits may be earned by incinerating
waste with or without energy recovery. The World Bank is also de-
veloping a methodology to earn emission reduction credits from
recycling.
Waste Management Methodologies. Since landfi ll disposal is the
baseline for assessing emission reductions, estimates of potential
emission reductions can be calculated using a fi rst order decay (FOD)
model, which relies on multiple variables and default values. Critical
variables include the composition rates of organics in a waste stream
(food, other putrescibles, paper/textiles, and wood), and average an-
nual precipitation and temperature. Areas with higher precipitation
and temperature normally have higher decomposition rates based
on data from the recent IPCC guidelines (see http://www.ipcc-ng-
gip.iges.or.jp/public/2006gl/vol5.html).
For LPG projects, estimates can provide reasonable forecasts of
emission reductions, but monitoring equipment is needed to track
actual gas fl ow and composition, which permits calculations of
combustion effi ciency and methane captured and destroyed. The
combustion of captured methane in a fl are or to produce energy
(commonly electricity) releases carbon dioxide. However, since car-
bon dioxide is from biomass, it is considered carbon neutral. Meth-
ane avoidance projects such as aerobic composting depend entirely
on calculated emission reductions, as there is no way to measure
methane that is not produced.
There are two common types of methodologies for waste man-
agement projects (LPG and methane avoidance). The specifi c meth-
odologies for both large and small scale (less than 60,000 tons of
carbon dioxide equivalent (tCO2e per year)) are provided in Box
3.23.
Emission reductions can be gained by displacing conventional
(fossil fuel) power generation sources on the electricity grid. Meth-
ane recovered from gas capture programs is used to generate elec-
tricity. The methodology listed below is for a small-scale power
generation project (less than 15 Megawatts (MW).
ECo2-Part3brEV_PREP Sec1:295 6/15/09 9:04:47 AM
296 | ECO2 CITIES: ECOLOGICAL CITIES AS ECONOMIC CITIES
fl ow rates fl are the recovered methane. In China, LFG projects recover energy and fl are only as a back-up, as the Designated National Authority (the entity responsible for CDM oversight in a country) encourages electrical generation.
Cost E" cient Service. Another economic factor in waste management is promoting cost e+ cient delivery of services through appropri-ate capital investments and operations.
Capital Investment. Investment in equipment is an important fi rst step in this process. Designa-tion of appropriate equipment begins before procurement when sector managers decide on relevant specifi cations. It is important to attain a balance between capital expenditures for equipment, their operation and maintenance costs, and useful lifespans, which are infl uenced by operating environments. Reforms to the waste management system can also have bene-
fi cial e( ects on capital and operating expendi-tures, as evident in Yokohama.
Following procurement of capital assets, a sound program of preventative and scheduled maintenance should be established to maximize value. Preventative maintenance helps to avoid unscheduled downtime, which has a monetary cost. It is important to keep a supply room well stocked with lubricants, supplies, and spare parts, in line with recommendations from equipment manufacturers.
Operations Services. Supporting PSP and reen-gineered public operations can improve the cost e+ ciency of services in the waste management sector. In either case, it is important to establish goals and metrics to track performance. In ad-dition, historical data and lessons from other cities and regions can be collected to compare options and devise strategies.
Landfi ll Gas Capture and Use—Tianjin, ChinaTianjin’s Shuangkou landfi ll, the fi rst modern landfi ll built in Tianjin,
conforms to China’s standards, which mandate a bottom liner and a
system for leachate collection and treatment. Design and construc-
tion of the landfi ll began in 1999, and the site began receiving waste
in 2001. The landfi ll was fi nanced by the World Bank as part of a
broader loan program for Tianjin.
A daily average of about 1,300 tons of household waste is deliv-
ered to the landfi ll. The 60 hectare landfi ll has a capacity of 8.5 mil-
lion cubic meters, equivalent to 7.4 million tons of waste and about
15 years of life at the current rate of infi ll. At closure, the depth of
waste will be about 34 meters.
Decomposition of waste in the anaerobic conditions of a landfi ll
generates methane. The methane is collected in pipes from a series
of wells that were drilled where waste was deposited. Additional
wells will be drilled as waste is deposited in new areas. The captured
gas is transported in pipes to a central facility where it is burned to
produce electricity that is sold to the North China Power Grid. A
fl are is used when there is excess methane or when the generators
are out of service, such as during maintenance. The recovery system
began operations in June 2008.
Landfi ll gas is about 50 percent methane, with the balance com-
posed of carbon dioxide and other gases. Combustion of the meth-
ane during power generation or fl aring destroys the methane. Under
the agreement signed with the World Bank, the Tianjin Clean Envi-
BOX 3.23
ronment and Environmental Engineering Co. Ltd (TCEEE) will sell
635,000 tCO2e of greenhouse gas emission reductions, which is 70
percent of the expected reductions during the fi rst seven years of
operation. The World Bank has an option to purchase an additional
470,000 tCO2e.
TCEEE. Formed in August 2005, the TCEEE is part of the Tianjin Con-
struction Commission. TCEEE was authorized by the Construction
Commission and Environmental Sanitation Commission, both under
the municipality of Tianjin, to implement the Shuangkou landfi ll gas
recovery and utilization project as project developer, operator, and
seller of emissions reductions. Operation of the Shuangkou landfi ll is
managed by the Tianjin Solid Waste Treatment Centre, a division of
the Environmental Sanitation Commission.
World Bank. The World Bank is a trustee for 12 funds and facilities
for which it negotiates long-term purchase agreements and manag-
es relations with associated projects. In the case of the Tianjin land-
fi ll gas recovery program, the World Bank is the trustee for the Span-
ish Carbon Fund.
Project Registration. The Tianjin project was registered with the
CDM Executive Board on August 27, 2008, which means the project
has been able to earn Certifi ed Emission Reductions (CERs) since
that date. For specifi c information on the project, please visit the
following link.
ECo2-Part3brEV_PREP Sec1:296 6/15/09 9:04:47 AM
A F I E L D R E F E R E N C E G U I D E | 297
Introduction
Cities enjoy high productivity because their large consumer and labor markets drive increasing re-turns to scale. Theoretical and empirical litera-ture correlating the wealth of cities to urban spa-tial concentration is abundant and no longer controversial. National data show that the eco-nomic output of large cities is much higher than is suggested by their shares of population. The World Bank’s 2009 World Development Report “Reshaping Economic Geography” and the 2009 Report of the Commission on Growth and De-velopment “Urbanization and Growth” summa-rize and document the theoretical and empirical arguments justifying the economic advantages of concentrating economic activities in large cities. Moreover, it is widely accepted that e( ective ur-ban management and the spatial structure of cit-ies are crucial to their success.
Cities in the 21st century will need to con-front myriad development challenges from rap-id growth in income, population, and built-up areas. However, developing “one size fi ts all” models or forms of urban development is unre-alistic given the diversity in urban culture, his-tory, economy, climate, and topography.
Nonetheless, cities face two fundamental spatial challenges as they absorb new popula-tions and manage urban transitions: 1) main-taining mobility; and 2) enabling the provision of a( ordable land and shelter for existing and new citizens.
Mobility is important because the pro-ductivity of large labor markets is impor-tant for cities, and lack of mobility frag-ments labor markets and decreases productivity.
A' ordability is crucial because poor rural migrants often transition to middle class citizens in cities. A city should have the capacity to shelter migrants during this transition. Ignoring migrants’ needs for adequate shelter impedes assimilation in the formal economy, and has a high social cost.
Maintaining mobility
Maximizing the economic advantages of spa-tial concentration hinges on workers’ capacity to fi nd work anywhere in a city, and employ-ers’ ability to select workers among a large and dispersed pool of labor. Maintaining mobility of people and goods within a metropolitan area is one of the conditions to realizing eco-nomic benefi ts. Congestion acts as a tax on city productivity because it impairs the free move-ment of goods and people. In 2000, congestion in 75 metropolitan areas in the United States caused fuel and time losses valued at US$ 67.5 billion.152 These losses exceeded the value of Kenya’s 2008 Gross Domestic Product of US$ 61.83 billion.153 When cities are unable to maintain mobility, the “tax” of severe conges-tion might surpass the economic benefi ts of spatial concentration. In the long-run, a city
Managing Spatial Structure of the Cities
ECo2-Part3brEV_PREP Sec1:297 6/15/09 9:04:47 AM
298 | ECO2 CITIES: ECOLOGICAL CITIES AS ECONOMIC CITIES
that cannot sustain mobility is bound to decay economically.
Maintaining mobility of people and goods should be a prime objective of land use plan-ning and infrastructure investments. Mobility has two aspects:
I. Location mobility for fi rms and households
II. Workers and consumers’ commuting mo-bility
Location mobility for fi rms and households
Location is important for residences and work-places. People and fi rms should be able to buy or rent residences or business facilities any-where in a city under as few restrictions as pos-sible. The traditional principle of locating low income housing close to industrial areas in dis-tant suburbs is based on a 19th century vision of labor. The service sector in a modern city em-ploys more unskilled labor than factories. Poor people should have access to all areas of a city, and zoning plans should not segregate low in-come housing into pre-designated areas.
Real estate transaction costs should be as low as possible to ensure that households and fi rms can select the best locations they can a( ord, and move quickly to better locations when economic circumstances or external conditions change.154 Tying housing subsidies for poor households to low income housing projects prevents mobility and tends to increase unemployment.
Zoning should not segregate land uses arbi-trarily, as this restricts fi rm and household mo-bility. Zoning in modern cities should segregate only those economic activities that create real hazards and nuisances. Zoning should not ap-ply inherited and arbitrary categories that need-lessly curtail mixed use development.
Workers and consumers’ commuting mobility
In all but the largest cities, workers and con-sumers should be able to reach any point in the metropolitan area within an hour. Ideally, mul-timodal transport systems can ensure su+ cient
mobility. However, urban planners often favor one transport mode at the expense of others. For instance, in cities where underground met-ros are being built, the high capital costs of the metro often divert needed funds from other modes of transport, such as buses. In other cit-ies, cars are heavily subsidized by low gasoline prices, free parking, and street designs. In both cases, less mobility is the result.
Though planners in the last decade have tried to privilege one mode of transport over others, planners must acknowledge that: 1) ev-ery city needs a multimode transport system; and 2) consumer safety, a( ordability, and con-venience are the main aims of transport modes.
Choosing a dominant transport mode or
other modes in a multimodal system should be
linked to a city’s spatial structure. City manag-ers should not arbitrarily select a city’s dominant transport mode, whether transit, car, or bicycle. Consumers decide for themselves which trans-port mode is the most convenient in terms of speed, comfort, and cost, considering among other things a city’s spatial structure. City man-agers, however, can infl uence a city’s spatial structure through regulations and infrastructure investments. In high density, mainly monocen-tric cities, mass transit can be an e+ cient choice for commuters. However, in low density polycen-tric cities, cars, motorcycles, and taxis are often the most convenient travel modes.
Mobility, spatial structures and transport
networks
Land developments and transport options de-termine the patterns of daily commuter trips to and from work. As household income rises, non-commuting trips to shop, pick up children, visit family, or undertake recreation become more important. The proportion of commuting trips over other trips thus decreases. Figure 3.63 illustrates the most usual trip patterns in met-ropolitan areas.
In monocentric cities (Figure 3.63-A) where most jobs and amenities are concentrated in
ECo2-Part3brEV_PREP Sec1:298 6/15/09 9:04:47 AM
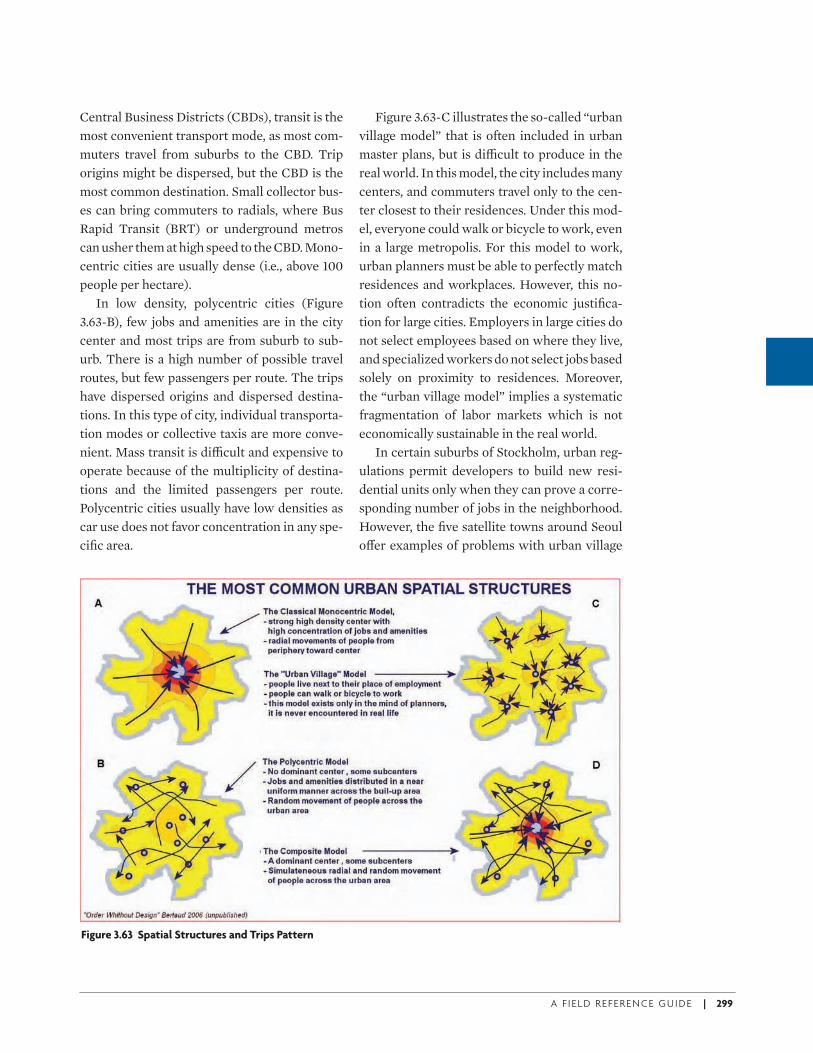
A F I E L D R E F E R E N C E G U I D E | 299
Central Business Districts (CBDs), transit is the most convenient transport mode, as most com-muters travel from suburbs to the CBD. Trip origins might be dispersed, but the CBD is the most common destination. Small collector bus-es can bring commuters to radials, where Bus Rapid Transit (BRT) or underground metros can usher them at high speed to the CBD. Mono-centric cities are usually dense (i.e., above 100 people per hectare).
In low density, polycentric cities (Figure 3.63-B), few jobs and amenities are in the city center and most trips are from suburb to sub-urb. There is a high number of possible travel routes, but few passengers per route. The trips have dispersed origins and dispersed destina-tions. In this type of city, individual transporta-tion modes or collective taxis are more conve-nient. Mass transit is di+ cult and expensive to operate because of the multiplicity of destina-tions and the limited passengers per route. Polycentric cities usually have low densities as car use does not favor concentration in any spe-cifi c area.
Figure 3.63-C illustrates the so-called “urban village model” that is often included in urban master plans, but is di+ cult to produce in the real world. In this model, the city includes many centers, and commuters travel only to the cen-ter closest to their residences. Under this mod-el, everyone could walk or bicycle to work, even in a large metropolis. For this model to work, urban planners must be able to perfectly match residences and workplaces. However, this no-tion often contradicts the economic justifi ca-tion for large cities. Employers in large cities do not select employees based on where they live, and specialized workers do not select jobs based solely on proximity to residences. Moreover, the “urban village model” implies a systematic fragmentation of labor markets which is not economically sustainable in the real world.
In certain suburbs of Stockholm, urban reg-ulations permit developers to build new resi-dential units only when they can prove a corre-sponding number of jobs in the neighborhood. However, the fi ve satellite towns around Seoul o( er examples of problems with urban village
Figure 3.63 Spatial Structures and Trips Pattern
ECo2-Part3brEV_PREP Sec1:299 6/15/09 9:04:47 AM
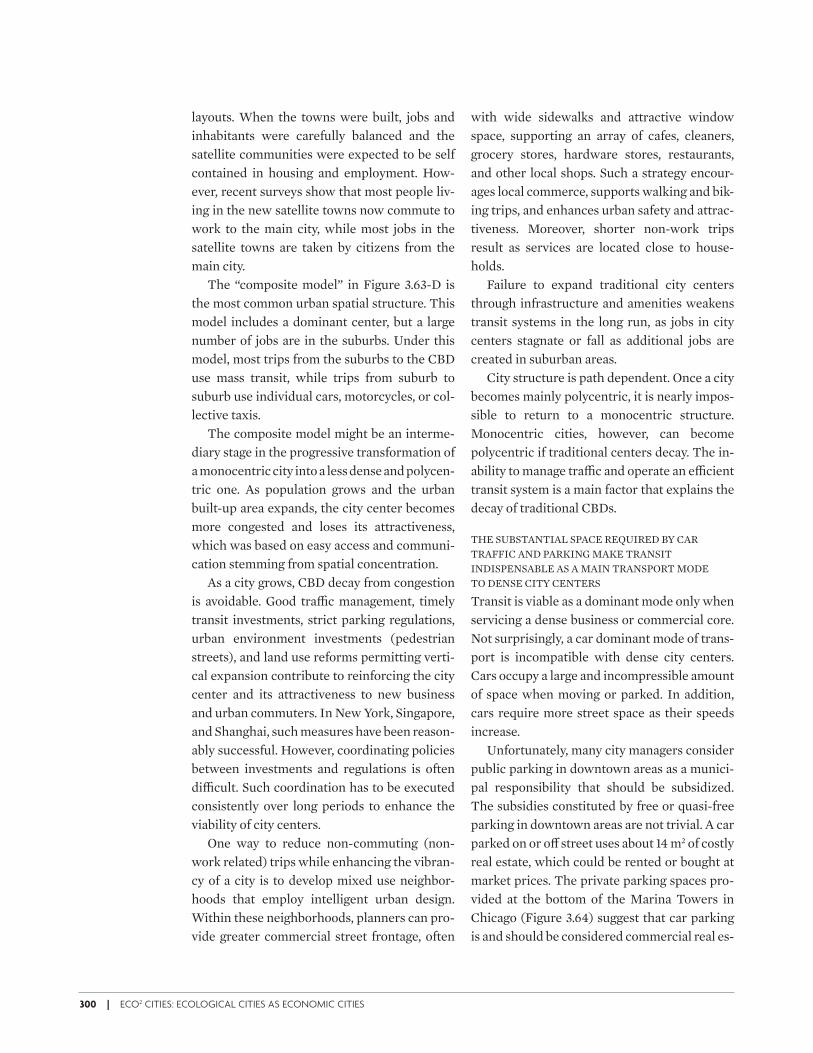
300 | ECO2 CITIES: ECOLOGICAL CITIES AS ECONOMIC CITIES
layouts. When the towns were built, jobs and inhabitants were carefully balanced and the satellite communities were expected to be self contained in housing and employment. How-ever, recent surveys show that most people liv-ing in the new satellite towns now commute to work to the main city, while most jobs in the satellite towns are taken by citizens from the main city.
The “composite model” in Figure 3.63-D is the most common urban spatial structure. This model includes a dominant center, but a large number of jobs are in the suburbs. Under this model, most trips from the suburbs to the CBD use mass transit, while trips from suburb to suburb use individual cars, motorcycles, or col-lective taxis.
The composite model might be an interme-diary stage in the progressive transformation of a monocentric city into a less dense and polycen-tric one. As population grows and the urban built-up area expands, the city center becomes more congested and loses its attractiveness, which was based on easy access and communi-cation stemming from spatial concentration.
As a city grows, CBD decay from congestion is avoidable. Good tra+ c management, timely transit investments, strict parking regulations, urban environment investments (pedestrian streets), and land use reforms permitting verti-cal expansion contribute to reinforcing the city center and its attractiveness to new business and urban commuters. In New York, Singapore, and Shanghai, such measures have been reason-ably successful. However, coordinating policies between investments and regulations is often di+ cult. Such coordination has to be executed consistently over long periods to enhance the viability of city centers.
One way to reduce non-commuting (non-work related) trips while enhancing the vibran-cy of a city is to develop mixed use neighbor-hoods that employ intelligent urban design. Within these neighborhoods, planners can pro-vide greater commercial street frontage, often
with wide sidewalks and attractive window space, supporting an array of cafes, cleaners, grocery stores, hardware stores, restaurants, and other local shops. Such a strategy encour-ages local commerce, supports walking and bik-ing trips, and enhances urban safety and attrac-tiveness. Moreover, shorter non-work trips result as services are located close to house-holds.
Failure to expand traditional city centers through infrastructure and amenities weakens transit systems in the long run, as jobs in city centers stagnate or fall as additional jobs are created in suburban areas.
City structure is path dependent. Once a city becomes mainly polycentric, it is nearly impos-sible to return to a monocentric structure. Monocentric cities, however, can become polycentric if traditional centers decay. The in-ability to manage tra+ c and operate an e+ cient transit system is a main factor that explains the decay of traditional CBDs.
THE SUBSTANTIAL SPACE REQUIRED BY CAR TRAFFIC AND PARKING MAKE TRANSIT INDISPENSABLE AS A MAIN TRANSPORT MODE TO DENSE CITY CENTERS
Transit is viable as a dominant mode only when servicing a dense business or commercial core. Not surprisingly, a car dominant mode of trans-port is incompatible with dense city centers. Cars occupy a large and incompressible amount of space when moving or parked. In addition, cars require more street space as their speeds increase.
Unfortunately, many city managers consider public parking in downtown areas as a munici-pal responsibility that should be subsidized. The subsidies constituted by free or quasi-free parking in downtown areas are not trivial. A car parked on or o( street uses about 14 m2 of costly real estate, which could be rented or bought at market prices. The private parking spaces pro-vided at the bottom of the Marina Towers in Chicago (Figure 3.64) suggest that car parking is and should be considered commercial real es-
ECo2-Part3brEV_PREP Sec1:300 6/15/09 9:04:48 AM
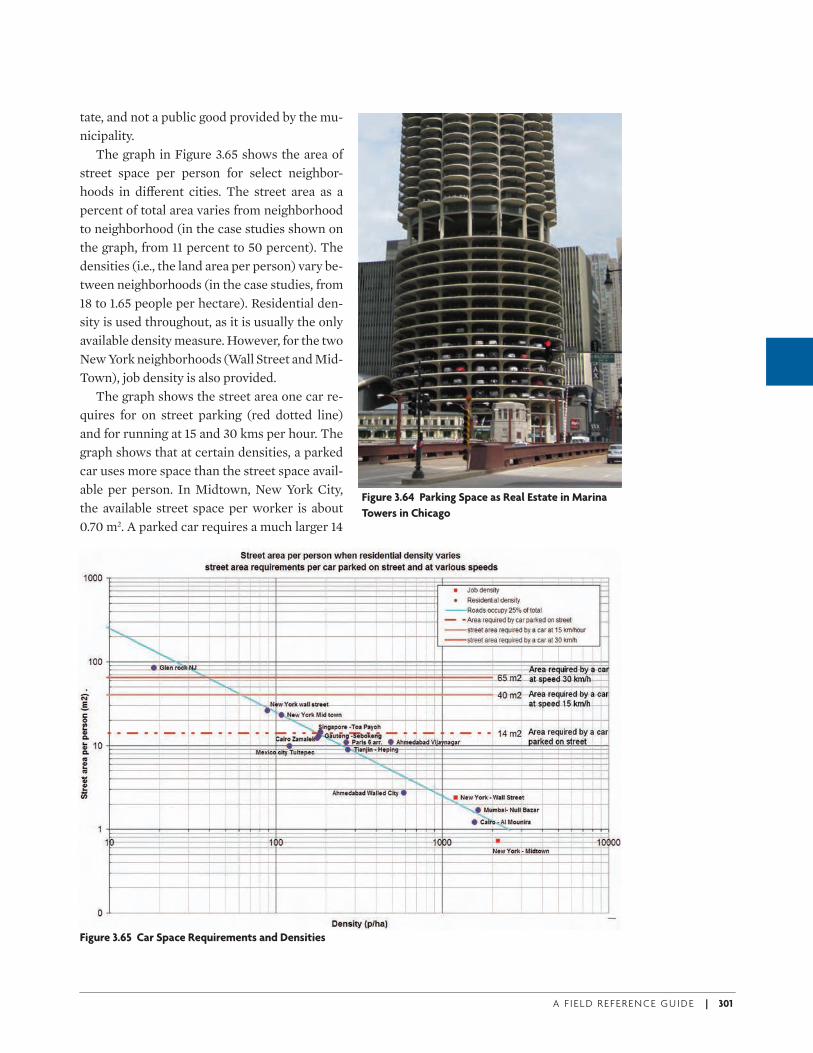
A F I E L D R E F E R E N C E G U I D E | 301
tate, and not a public good provided by the mu-nicipality.
The graph in Figure 3.65 shows the area of street space per person for select neighbor-hoods in di( erent cities. The street area as a percent of total area varies from neighborhood to neighborhood (in the case studies shown on the graph, from 11 percent to 50 percent). The densities (i.e., the land area per person) vary be-tween neighborhoods (in the case studies, from 18 to 1.65 people per hectare). Residential den-sity is used throughout, as it is usually the only available density measure. However, for the two New York neighborhoods (Wall Street and Mid-Town), job density is also provided.
The graph shows the street area one car re-quires for on street parking (red dotted line) and for running at 15 and 30 kms per hour. The graph shows that at certain densities, a parked car uses more space than the street space avail-able per person. In Midtown, New York City, the available street space per worker is about 0.70 m2. A parked car requires a much larger 14
Figure 3.64 Parking Space as Real Estate in Marina
Towers in Chicago
Figure 3.65 Car Space Requirements and Densities
ECo2-Part3brEV_PREP Sec1:301 6/15/09 9:04:48 AM
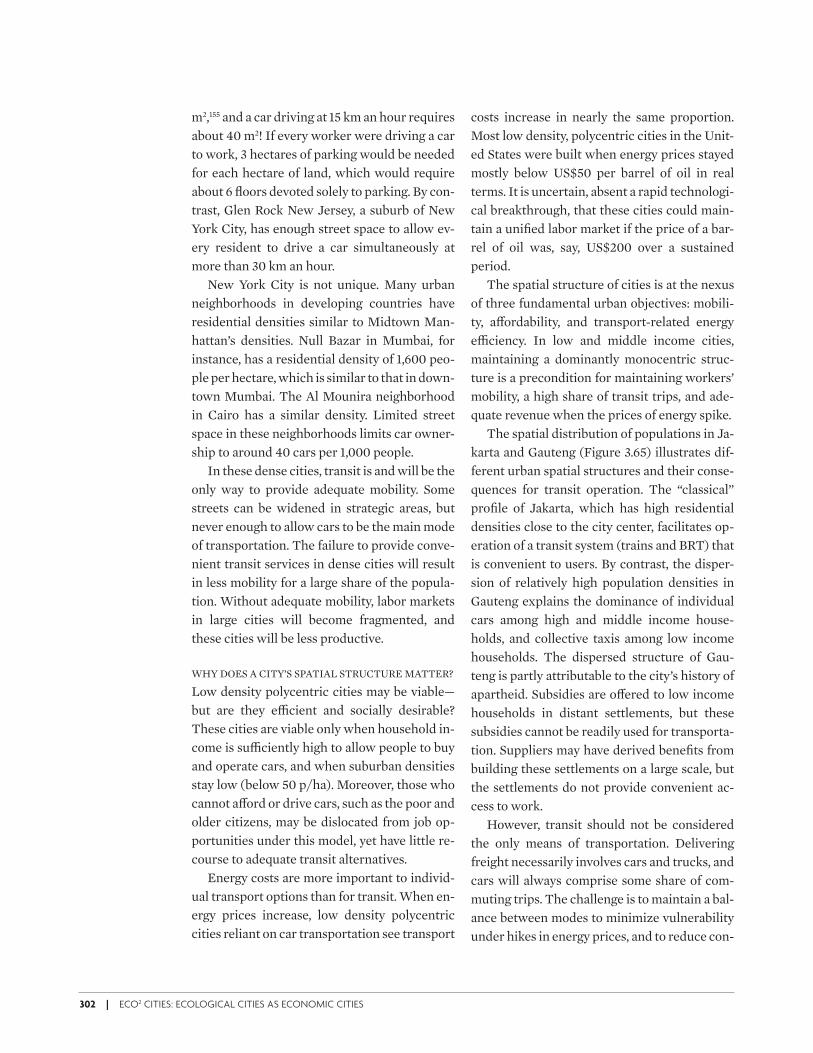
302 | ECO2 CITIES: ECOLOGICAL CITIES AS ECONOMIC CITIES
m2,155 and a car driving at 15 km an hour requires about 40 m2! If every worker were driving a car to work, 3 hectares of parking would be needed for each hectare of land, which would require about 6 fl oors devoted solely to parking. By con-trast, Glen Rock New Jersey, a suburb of New York City, has enough street space to allow ev-ery resident to drive a car simultaneously at more than 30 km an hour.
New York City is not unique. Many urban neighborhoods in developing countries have residential densities similar to Midtown Man-hattan’s densities. Null Bazar in Mumbai, for instance, has a residential density of 1,600 peo-ple per hectare, which is similar to that in down-town Mumbai. The Al Mounira neighborhood in Cairo has a similar density. Limited street space in these neighborhoods limits car owner-ship to around 40 cars per 1,000 people.
In these dense cities, transit is and will be the only way to provide adequate mobility. Some streets can be widened in strategic areas, but never enough to allow cars to be the main mode of transportation. The failure to provide conve-nient transit services in dense cities will result in less mobility for a large share of the popula-tion. Without adequate mobility, labor markets in large cities will become fragmented, and these cities will be less productive.
WHY DOES A CITY’S SPATIAL STRUCTURE MATTER?
Low density polycentric cities may be viable—but are they e+ cient and socially desirable? These cities are viable only when household in-come is su+ ciently high to allow people to buy and operate cars, and when suburban densities stay low (below 50 p/ha). Moreover, those who cannot a( ord or drive cars, such as the poor and older citizens, may be dislocated from job op-portunities under this model, yet have little re-course to adequate transit alternatives.
Energy costs are more important to individ-ual transport options than for transit. When en-ergy prices increase, low density polycentric cities reliant on car transportation see transport
costs increase in nearly the same proportion. Most low density, polycentric cities in the Unit-ed States were built when energy prices stayed mostly below US$50 per barrel of oil in real terms. It is uncertain, absent a rapid technologi-cal breakthrough, that these cities could main-tain a unifi ed labor market if the price of a bar-rel of oil was, say, US$200 over a sustained period.
The spatial structure of cities is at the nexus of three fundamental urban objectives: mobili-ty, a( ordability, and transport-related energy e+ ciency. In low and middle income cities, maintaining a dominantly monocentric struc-ture is a precondition for maintaining workers’ mobility, a high share of transit trips, and ade-quate revenue when the prices of energy spike.
The spatial distribution of populations in Ja-karta and Gauteng (Figure 3.65) illustrates dif-ferent urban spatial structures and their conse-quences for transit operation. The “classical” profi le of Jakarta, which has high residential densities close to the city center, facilitates op-eration of a transit system (trains and BRT) that is convenient to users. By contrast, the disper-sion of relatively high population densities in Gauteng explains the dominance of individual cars among high and middle income house-holds, and collective taxis among low income households. The dispersed structure of Gau-teng is partly attributable to the city’s history of apartheid. Subsidies are o( ered to low income households in distant settlements, but these subsidies cannot be readily used for transporta-tion. Suppliers may have derived benefi ts from building these settlements on a large scale, but the settlements do not provide convenient ac-cess to work.
However, transit should not be considered the only means of transportation. Delivering freight necessarily involves cars and trucks, and cars will always comprise some share of com-muting trips. The challenge is to maintain a bal-ance between modes to minimize vulnerability under hikes in energy prices, and to reduce con-
ECo2-Part3brEV_PREP Sec1:302 6/15/09 9:04:50 AM
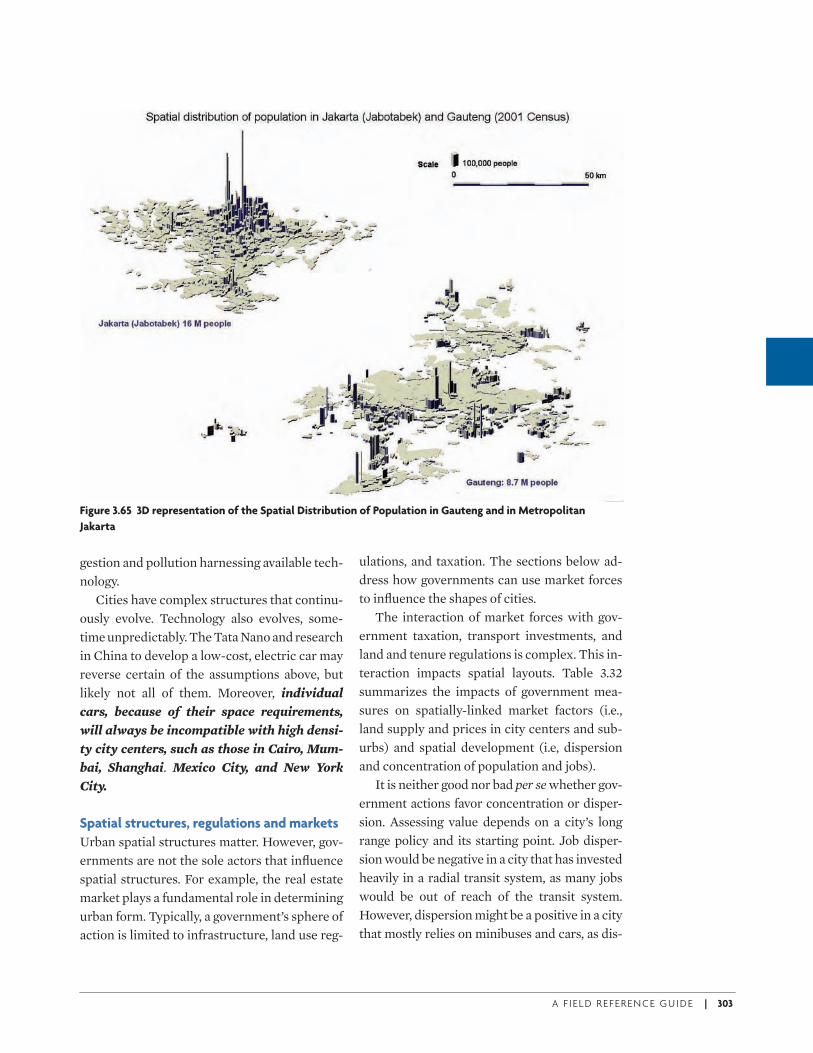
A F I E L D R E F E R E N C E G U I D E | 303
gestion and pollution harnessing available tech-nology.
Cities have complex structures that continu-ously evolve. Technology also evolves, some-time unpredictably. The Tata Nano and research in China to develop a low-cost, electric car may reverse certain of the assumptions above, but likely not all of them. Moreover, individual cars, because of their space requirements,
will always be incompatible with high densi-
ty city centers, such as those in Cairo, Mum-
bai, Shanghai. Mexico City, and New York
City.
Spatial structures, regulations and markets
Urban spatial structures matter. However, gov-ernments are not the sole actors that infl uence spatial structures. For example, the real estate market plays a fundamental role in determining urban form. Typically, a government’s sphere of action is limited to infrastructure, land use reg-
ulations, and taxation. The sections below ad-dress how governments can use market forces to infl uence the shapes of cities.
The interaction of market forces with gov-ernment taxation, transport investments, and land and tenure regulations is complex. This in-teraction impacts spatial layouts. Table 3.32 summarizes the impacts of government mea-sures on spatially-linked market factors (i.e., land supply and prices in city centers and sub-urbs) and spatial development (i.e, dispersion and concentration of population and jobs).
It is neither good nor bad per se whether gov-ernment actions favor concentration or disper-sion. Assessing value depends on a city’s long range policy and its starting point. Job disper-sion would be negative in a city that has invested heavily in a radial transit system, as many jobs would be out of reach of the transit system. However, dispersion might be a positive in a city that mostly relies on minibuses and cars, as dis-
Figure 3.65 3D representation of the Spatial Distribution of Population in Gauteng and in Metropolitan
Jakarta
ECo2-Part3brEV_PREP Sec1:303 6/15/09 9:04:50 AM
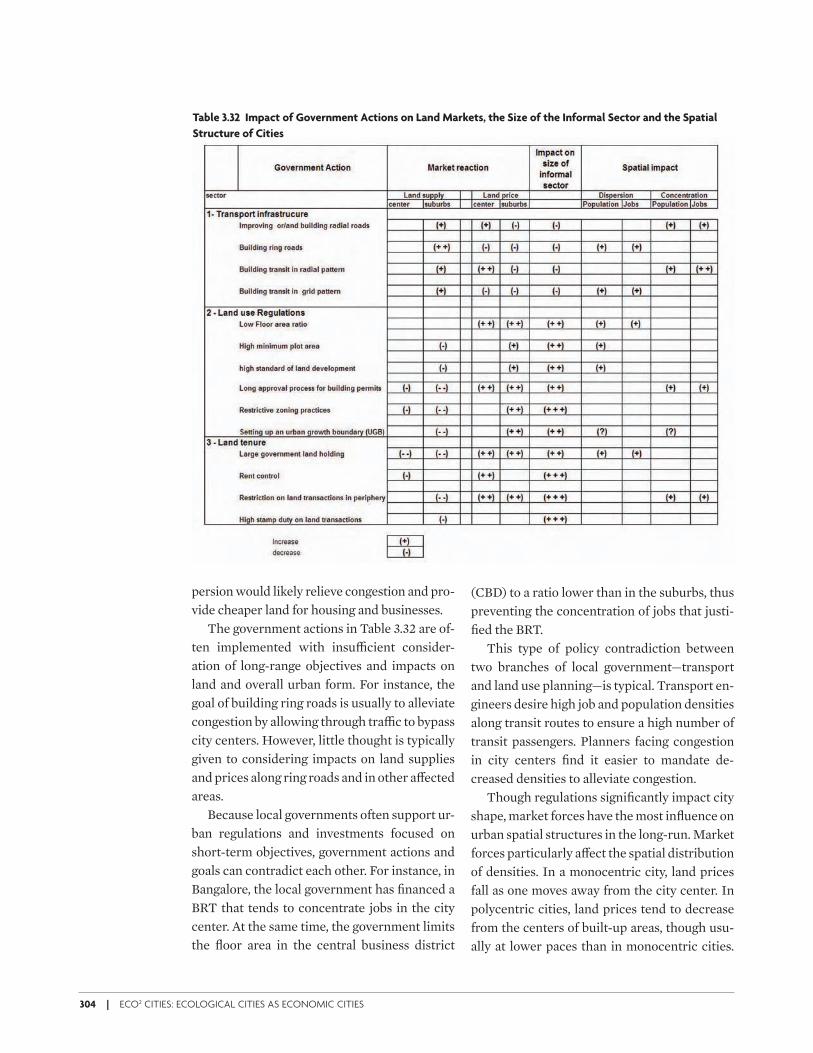
304 | ECO2 CITIES: ECOLOGICAL CITIES AS ECONOMIC CITIES
persion would likely relieve congestion and pro-vide cheaper land for housing and businesses.
The government actions in Table 3.32 are of-ten implemented with insu+ cient consider-ation of long-range objectives and impacts on land and overall urban form. For instance, the goal of building ring roads is usually to alleviate congestion by allowing through tra+ c to bypass city centers. However, little thought is typically given to considering impacts on land supplies and prices along ring roads and in other a( ected areas.
Because local governments often support ur-ban regulations and investments focused on short-term objectives, government actions and goals can contradict each other. For instance, in Bangalore, the local government has fi nanced a BRT that tends to concentrate jobs in the city center. At the same time, the government limits the fl oor area in the central business district
(CBD) to a ratio lower than in the suburbs, thus preventing the concentration of jobs that justi-fi ed the BRT.
This type of policy contradiction between two branches of local government—transport and land use planning—is typical. Transport en-gineers desire high job and population densities along transit routes to ensure a high number of transit passengers. Planners facing congestion in city centers fi nd it easier to mandate de-creased densities to alleviate congestion.
Though regulations signifi cantly impact city shape, market forces have the most infl uence on urban spatial structures in the long-run. Market forces particularly a( ect the spatial distribution of densities. In a monocentric city, land prices fall as one moves away from the city center. In polycentric cities, land prices tend to decrease from the centers of built-up areas, though usu-ally at lower paces than in monocentric cities.
Table 3.32 Impact of Government Actions on Land Markets, the Size of the Informal Sector and the Spatial
Structure of Cities
ECo2-Part3brEV_PREP Sec1:304 6/15/09 9:04:50 AM
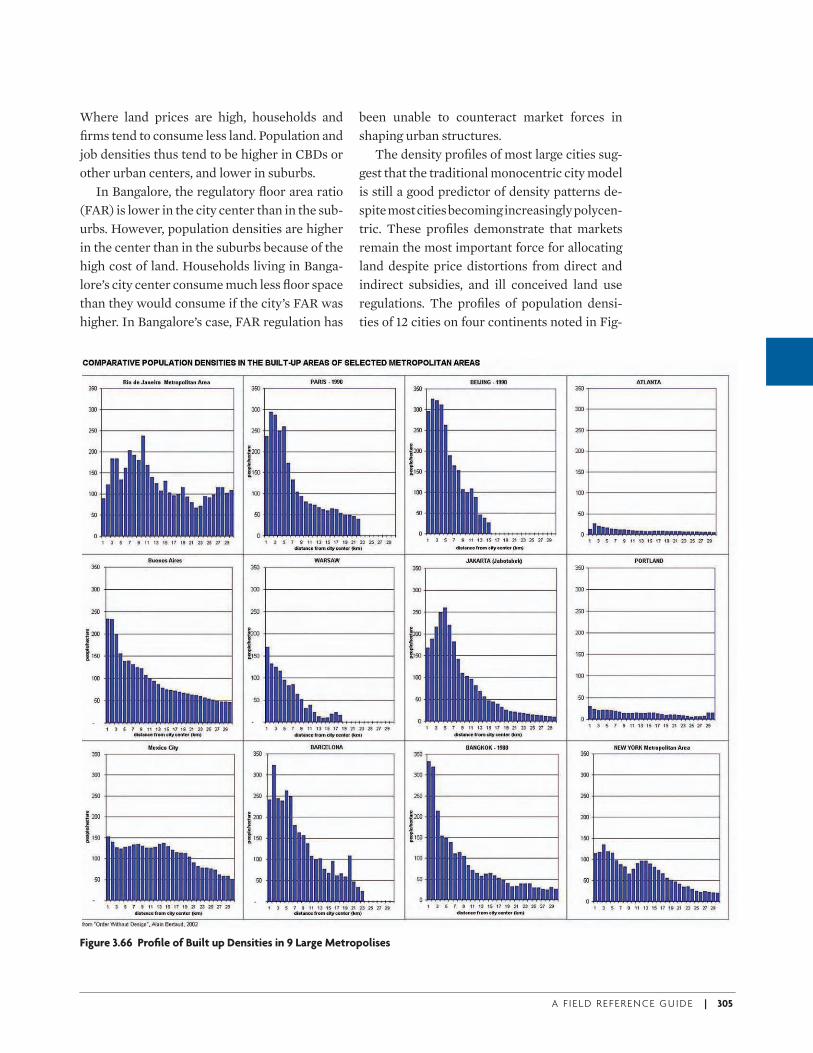
A F I E L D R E F E R E N C E G U I D E | 305
Where land prices are high, households and fi rms tend to consume less land. Population and job densities thus tend to be higher in CBDs or other urban centers, and lower in suburbs.
In Bangalore, the regulatory fl oor area ratio (FAR) is lower in the city center than in the sub-urbs. However, population densities are higher in the center than in the suburbs because of the high cost of land. Households living in Banga-lore’s city center consume much less fl oor space than they would consume if the city’s FAR was higher. In Bangalore’s case, FAR regulation has
been unable to counteract market forces in shaping urban structures.
The density profi les of most large cities sug-gest that the traditional monocentric city model is still a good predictor of density patterns de-spite most cities becoming increasingly polycen-tric. These profi les demonstrate that markets remain the most important force for allocating land despite price distortions from direct and indirect subsidies, and ill conceived land use regulations. The profi les of population densi-ties of 12 cities on four continents noted in Fig-
Figure 3.66 Profi le of Built up Densities in 9 Large Metropolises
ECo2-Part3brEV_PREP Sec1:305 6/15/09 9:04:51 AM
306 | ECO2 CITIES: ECOLOGICAL CITIES AS ECONOMIC CITIES
ure 3.66 show that despite these cities’ econom-ic and cultural di( erences, markets played important roles in shaping the distributions of populations around their centers. All the cities shown in Figure 3.66 closely follow the nega-tively sloped gradient predicted by the classical monocentric urban model.
Moreover, the spatial structure of most cities tends to follow these trends:
• Over the long run, average densities de-crease
• traditional CBDs tend to lose primacy (with notable exceptions)
• the evolution of spatial structure is often adversely a( ected by household mobility
Average densities fall over the long run for these reasons: (1) improvements to transport networks (i.e., length and speed) increase land supplies more rapidly than can be used by grow-ing populations; (2) increases in household in-come and decreases in household size allow people to consume more land and fl oor space; and (3) diversifi cation and specialization of economic activities require more land and fl oor space.
In China, for instance, cities managers have become increasingly alarmed by growing per capita land consumption, and they have taken measures to curb “sprawl” by making land de-velopment more di+ cult or expensive, or by imposing quotas on land development. Many cities in other countries have taken measures to constrain the supply of land by delineating boundaries for urban growth, or establishing quotas for land development that boost the prices of land and housing, which often ad-versely a( ect urban dispersion.
It is not possible to establish optimal per capita rates of urban density or land consump-tion that are completely consistent over time. Land is an input in the production of fl oor space. Where land is expensive, developers (regula-tions permitting) will substitute capital for land
by increasing FARs and densities. Where land is cheap, such as in suburbs, substituting capital for land is not justifi ed and FARs and densities are low. A fi nancially optimum density could be temporarily achieved during an area’s develop-ment provided that the prices of inputs (i.e., land and construction) are not too distorted by regulations or subsidies. Without price distor-tions and externalities, a fi nancially optimum density would equal the economically optimum density. However, the prices of land, capital, and other inputs will eventually change, possi-bly in di( erent directions, and the new opti-mum density will shift from the optimum achieved during development. When the new optimum density di( ers substantially from ac-tual density, land will be redeveloped.
The periodic recycling of land into new den-sities is indispensable to maintain land use e+ -ciency and urban productivity. Unfortunately, many land use regulations, such as rent control to maximum FAR, tend to prevent the recycling of land.
Traditionally, CBDs become larger as cities develop. The inability of local governments to manage tra+ c in CBDs and to maintain mobili-ty often results in deterioration of the CBD (Mexico City) or in the progressive abandon-ment of the CBD (San Salvador, El Salvador). As a result, jobs disperse into new locations, and transit networks are unable to adequately link residential areas to these areas. Minibuses and collective taxis gradually become more e+ cient ways to reach dispersed locations.
Coordination between Land Use and Transit
the example of Singapore
Though most dense, monocentric cities have become progressively less dense and polycen-tric, a few cities have kept a large share of jobs and amenities in CBDs despite population growth (e.g., New York City, Tianjin, and Shang-hai; Singapore has also pursued this strategy and its transit network is illustrated in Map 3.9). These cities maintained consistent land use and
ECo2-Part3brEV_PREP Sec1:306 6/15/09 9:04:52 AM
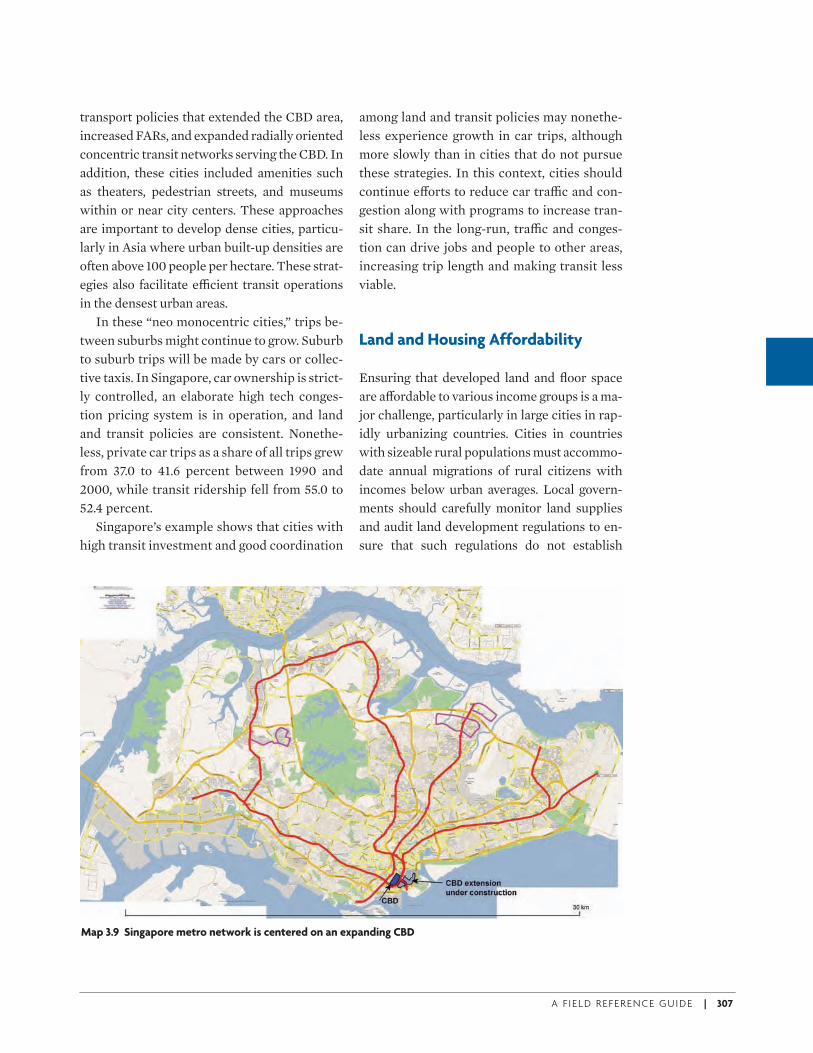
A F I E L D R E F E R E N C E G U I D E | 307
transport policies that extended the CBD area, increased FARs, and expanded radially oriented concentric transit networks serving the CBD. In addition, these cities included amenities such as theaters, pedestrian streets, and museums within or near city centers. These approaches are important to develop dense cities, particu-larly in Asia where urban built-up densities are often above 100 people per hectare. These strat-egies also facilitate e+ cient transit operations in the densest urban areas.
In these “neo monocentric cities,” trips be-tween suburbs might continue to grow. Suburb to suburb trips will be made by cars or collec-tive taxis. In Singapore, car ownership is strict-ly controlled, an elaborate high tech conges-tion pricing system is in operation, and land and transit policies are consistent. Nonethe-less, private car trips as a share of all trips grew from 37.0 to 41.6 percent between 1990 and 2000, while transit ridership fell from 55.0 to 52.4 percent.
Singapore’s example shows that cities with high transit investment and good coordination
among land and transit policies may nonethe-less experience growth in car trips, although more slowly than in cities that do not pursue these strategies. In this context, cities should continue e( orts to reduce car tra+ c and con-gestion along with programs to increase tran-sit share. In the long-run, tra+ c and conges-tion can drive jobs and people to other areas, increasing trip length and making transit less viable.
Land and Housing Affordability
Ensuring that developed land and fl oor space are a( ordable to various income groups is a ma-jor challenge, particularly in large cities in rap-idly urbanizing countries. Cities in countries with sizeable rural populations must accommo-date annual migrations of rural citizens with incomes below urban averages. Local govern-ments should carefully monitor land supplies and audit land development regulations to en-sure that such regulations do not establish
Map 3.9 Singapore metro network is centered on an expanding CBD
ECo2-Part3brEV_PREP Sec1:307 6/15/09 9:04:52 AM
308 | ECO2 CITIES: ECOLOGICAL CITIES AS ECONOMIC CITIES
thresholds below which low or middle income households are unable to buy or rent legal dwellings.
Infrastructure and land use regulations
have an impact on the supply and price of
land and fl oor space. This important role is
not always understood by city managers
Variations in the supply of land and fl oor space typically drive variations in rents and land pric-es. The supply of land and fl oor space is highly dependent on primary infrastructure, transport networks, and land use regulations, which are usually under the jurisdiction of local govern-ments. Unfortunately, local governments often ignore the links between land supply and land prices and rents. Unfamiliar with supply and demand, local o+ cials often attribute high pric-es to “speculation,” without realizing that bot-tlenecks in land supply and FARs are fueling high prices. When facing signifi cant increases in land prices and rents, o+ cials often fail to in-crease land supplies or FARs. Instead, they try to control prices by imposing higher transac-tions costs or tightening rent control legislation. These actions result in higher land and housing prices, which in turn generate more regulations in a vicious infl ationary spiral.
Because government actions have such im-portant impacts on real estate markets and urban spatial structures, it is worthwhile examining the direct and indirect impacts of infrastructure in-vestments and land use regulations.
The aims of land use regulations are to avoid externalities linked to changes in land use. Pre-venting a negative externality is benefi cial. However, regulations also have costs. Unin-tended side e( ects may increase the costs of many regulations beyond their supposed bene-fi ts. Many land use regulations are not tested for their impacts and may create social costs by ar-tifi cially increasing the costs of developed land and fl oor space.
In reality, most regulations are not formu-lated to correct explicit externalities, but refl ect
o+ cials’ utopian visions on what constitutes appropriate urban design. This explains why most land use regulations entail higher land consumption than had land use been driven by consumer demand. Normative regulations es-tablish arbitrary and enduring consumption thresholds for land and fl oor space (e.g., mini-mum plot sizes, maximum fl oor area ratios), and systematically fail to adapt to changing in-comes, technologies, and land and construction prices. In poor countries, regulations often im-pose minimum fi xed values on variables like plot size, apartment size, and fl oor area ratios. In utility and a( ordability equations for hous-ing and other land uses, these variables should not have fi xed minimum values and should be dependent variables linked to independent variables, such as the price of land, rate of inter-est, and the cost of construction.
Land use regulations for a given city may fi ll several volumes. However, only four types of regulations are really important. These regula-tions should be carefully audited owing to their impacts on land demand and a( ordability:
i. regulations establishing minimum plot siz-es and minimum apartment sizes (explicitly or implicitly)
ii. regulations limiting fl oor area ratios
iii. zoning plans limiting the type and intensity of urban land use
iv. land subdivision regulations establishing permissible ratios of developable and sal-able land in new greenfi eld developments
Regulations on minimum plot sizes and
apartment sizes
The goals of mandating minimum plot sizes are to prevent excessive densities and ensure a high quality urban environment. Households in all cultures tend to maximize the land and fl oor area they consume taking into account trade o( s between location and local real estate costs. For example, poor households may opt to live in
ECo2-Part3brEV_PREP Sec1:308 6/15/09 9:04:53 AM
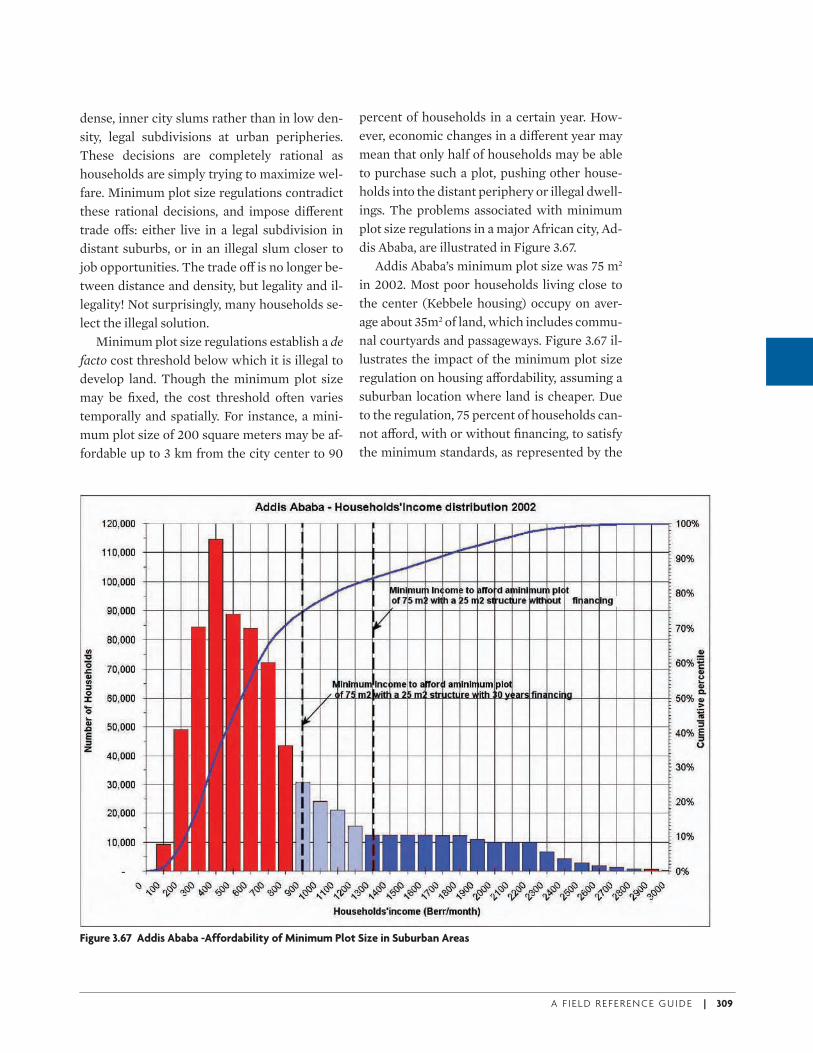
A F I E L D R E F E R E N C E G U I D E | 309
dense, inner city slums rather than in low den-sity, legal subdivisions at urban peripheries. These decisions are completely rational as households are simply trying to maximize wel-fare. Minimum plot size regulations contradict these rational decisions, and impose di( erent trade o( s: either live in a legal subdivision in distant suburbs, or in an illegal slum closer to job opportunities. The trade o( is no longer be-tween distance and density, but legality and il-legality! Not surprisingly, many households se-lect the illegal solution.
Minimum plot size regulations establish a de facto cost threshold below which it is illegal to develop land. Though the minimum plot size may be fi xed, the cost threshold often varies temporally and spatially. For instance, a mini-mum plot size of 200 square meters may be af-fordable up to 3 km from the city center to 90
percent of households in a certain year. How-ever, economic changes in a di( erent year may mean that only half of households may be able to purchase such a plot, pushing other house-holds into the distant periphery or illegal dwell-ings. The problems associated with minimum plot size regulations in a major African city, Ad-dis Ababa, are illustrated in Figure 3.67.
Addis Ababa’s minimum plot size was 75 m2 in 2002. Most poor households living close to the center (Kebbele housing) occupy on aver-age about 35m2 of land, which includes commu-nal courtyards and passageways. Figure 3.67 il-lustrates the impact of the minimum plot size regulation on housing a( ordability, assuming a suburban location where land is cheaper. Due to the regulation, 75 percent of households can-not a( ord, with or without fi nancing, to satisfy the minimum standards, as represented by the
Figure 3.67 Addis Ababa -Affordability of Minimum Plot Size in Suburban Areas
ECo2-Part3brEV_PREP Sec1:309 6/15/09 9:04:53 AM
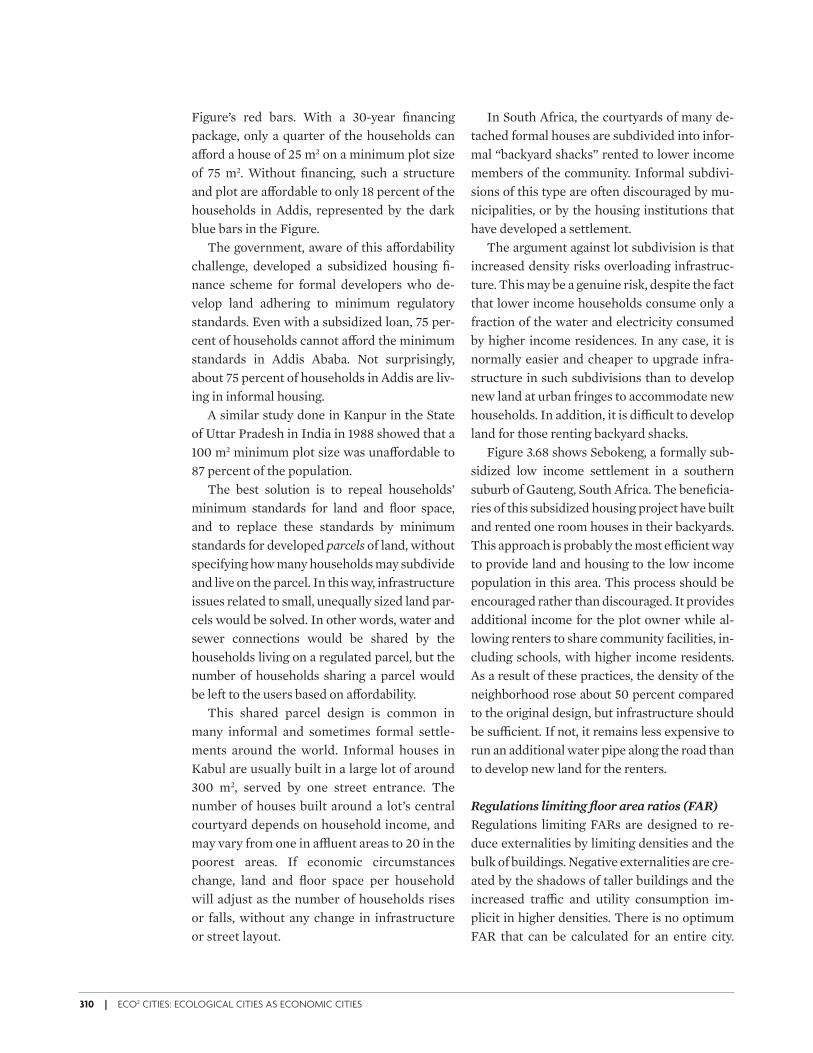
310 | ECO2 CITIES: ECOLOGICAL CITIES AS ECONOMIC CITIES
Figure’s red bars. With a 30-year fi nancing package, only a quarter of the households can a( ord a house of 25 m2 on a minimum plot size of 75 m2. Without fi nancing, such a structure and plot are a( ordable to only 18 percent of the households in Addis, represented by the dark blue bars in the Figure.
The government, aware of this a( ordability challenge, developed a subsidized housing fi -nance scheme for formal developers who de-velop land adhering to minimum regulatory standards. Even with a subsidized loan, 75 per-cent of households cannot a( ord the minimum standards in Addis Ababa. Not surprisingly, about 75 percent of households in Addis are liv-ing in informal housing.
A similar study done in Kanpur in the State of Uttar Pradesh in India in 1988 showed that a 100 m2 minimum plot size was una( ordable to 87 percent of the population.
The best solution is to repeal households’ minimum standards for land and fl oor space, and to replace these standards by minimum standards for developed parcels of land, without specifying how many households may subdivide and live on the parcel. In this way, infrastructure issues related to small, unequally sized land par-cels would be solved. In other words, water and sewer connections would be shared by the households living on a regulated parcel, but the number of households sharing a parcel would be left to the users based on a( ordability.
This shared parcel design is common in many informal and sometimes formal settle-ments around the world. Informal houses in Kabul are usually built in a large lot of around 300 m2, served by one street entrance. The number of houses built around a lot’s central courtyard depends on household income, and may vary from one in a\ uent areas to 20 in the poorest areas. If economic circumstances change, land and fl oor space per household will adjust as the number of households rises or falls, without any change in infrastructure or street layout.
In South Africa, the courtyards of many de-tached formal houses are subdivided into infor-mal “backyard shacks” rented to lower income members of the community. Informal subdivi-sions of this type are often discouraged by mu-nicipalities, or by the housing institutions that have developed a settlement.
The argument against lot subdivision is that increased density risks overloading infrastruc-ture. This may be a genuine risk, despite the fact that lower income households consume only a fraction of the water and electricity consumed by higher income residences. In any case, it is normally easier and cheaper to upgrade infra-structure in such subdivisions than to develop new land at urban fringes to accommodate new households. In addition, it is di+ cult to develop land for those renting backyard shacks.
Figure 3.68 shows Sebokeng, a formally sub-sidized low income settlement in a southern suburb of Gauteng, South Africa. The benefi cia-ries of this subsidized housing project have built and rented one room houses in their backyards. This approach is probably the most e+ cient way to provide land and housing to the low income population in this area. This process should be encouraged rather than discouraged. It provides additional income for the plot owner while al-lowing renters to share community facilities, in-cluding schools, with higher income residents. As a result of these practices, the density of the neighborhood rose about 50 percent compared to the original design, but infrastructure should be su+ cient. If not, it remains less expensive to run an additional water pipe along the road than to develop new land for the renters.
Regulations limiting fl oor area ratios (FAR)
Regulations limiting FARs are designed to re-duce externalities by limiting densities and the bulk of buildings. Negative externalities are cre-ated by the shadows of taller buildings and the increased tra+ c and utility consumption im-plicit in higher densities. There is no optimum FAR that can be calculated for an entire city.
ECo2-Part3brEV_PREP Sec1:310 6/15/09 9:04:54 AM
A F I E L D R E F E R E N C E G U I D E | 311
However, it is possible to calculate, for given prices of land and construction, a FAR that pro-duces the lowest cost of construction per square meter. In many cities such as Mumbai, FAR val-ues are much too low, leading to urban decay in the city center and favoring sprawl.
Zoning plans
Zoning plans aim to separate incompatible land uses and prevent development in environmen-tally sensitive areas. In addition, plans typically contain regulations for each zone that limit the intensity of land use, including regulations on plot coverage, maximum heights, setbacks, FARs, etc.
Zoning is an important tool to preserve sen-sitive areas, and can be employed to mandate green areas that absorb excess water and run-o( . However, zoning plans often do not clearly establish their objectives or the externalities they are designed to correct. Though zoning can be a useful tool, it must not obstruct the
provision of a( ordable land and shelter in rap-idly urbanizing cities.
Land subdivision regulations (LSRs)
LSRs are mostly employed for new greenfi eld developments. LSRs establish the standards for, inter alia, roads, block lengths, open spaces, and areas to be reserved for community facilities. The percentage of post-development salable land is arguably the most important parameter set by LSRs. Unfortunately, this parameter is seldom explicit, and has to be derived from oth-er LSR parameters. In many countries, the per-centage of such salable land, including residen-tial and commercial lots, is below 50 percent. This fi gure should be higher, which requires new developments to be land intensive. Typi-cally, LSRs are established for all new urban greenfi eld developments, and do not consider location or land prices.
Implicitly, LSRs also set maximum densities, but these are seldom explicitly calculated by
Figure 3.68 South Africa - Sharing of larger plot by lower income households
ECo2-Part3brEV_PREP Sec1:311 6/15/09 9:04:54 AM
312 | ECO2 CITIES: ECOLOGICAL CITIES AS ECONOMIC CITIES
regulators. Maximum densities are seldom compatible with land prices and developments that are a( ordable to low income households.
By imposing ill conceived standards, LSRs are often responsible for an exceedingly high proportion of informal sector settlements, as in Cairo, India, and Mexico. LSRs should be tested using land and infrastructure price models to establish the minimum household income that can a( ord a minimum standard plot in a new greenfi eld development.
Unlocking land supply and allowing a
higher intensity of use is a key factor to
increase the supply of affordable housing
Regulatory constraints a( ecting land supply are often ignored by governments that are other-wise eager to increase the supply of a( ordable housing. Subsidized interest rates are often the main tools employed to create a( ordable hous-ing. However, when regulatory constraints, like the one described above, prevent elasticity of supplies, more and cheaper housing is not the result, but housing infl ation.
Unlocking land supply is a prerequisite to stimulating housing demand. An audit of land use regulations should be conducted at least ev-ery 2 years. The audit should calculate the cost of building a house or apartment under current minimum standards in various areas of a city, incorporating current market prices for devel-oped land and construction. The cost of this “minimum” house should be compared with the incomes of various socio-economic groups. The results of the audit should be drawn on a map that clearly shows the parts of a city where legally developed land and shelter are a( ord-able to di( erent income groups. Land use regu-lations should then be amended through an it-erative process so that housing in sizable urban areas is a( ordable to unskilled migrants. The two key aims are to open the supply of land
through regulatory reform and primary in-
frastructure investments, and to allow poor
households to consume as little land and
fl oor space as needed in areas that are conve-
nient for fi nding employment. The low cost housing issue is at the nexus of mobility and af-fordability objectives.
A Plan for Active Management of Constantly Evolving Urban Spatial Structures
Methodology and training for urban
planners / urban managers
Urban managers should change their urban planning methodologies. Rather than collect data once each decade to devise a development plan that often faces a long approval process, managers should constantly monitor urban demographic and physical changes and real estate prices. Infrastructure investments and regulations should also be adjusted on a con-tinual basis.
Understanding the ways that markets work is essential to those who make decisions on in-frastructure investments and regulations. Be-cause acquiring economic knowledge consti-tutes a departure from the traditional role of urban planners, academic requirements should be modifi ed. All urban planners should have some formal training in urban economics re-gardless of their original fi elds.
Reorganization of Urban Planning
Departments
Urban planning units should be involved in ac-tively managing cities. Planning units cannot substitute for line agencies that design and maintain infrastructure such as roads and wa-ter treatment plants, but they should have a say in new infrastructure investments that a( ect mobility and land supplies.
Planning units should have monitoring and operational departments. The monitoring de-partment should constantly collect and analyze data on the evolution of the city. Whenever pos-sible, data should include spatial and demo-
ECo2-Part3brEV_PREP Sec1:312 6/15/09 9:04:55 AM

A F I E L D R E F E R E N C E G U I D E | 313
graphic dimensions, such as coordinates and census identifi ers. Data and indicators should include, inter alia, real estate prices, household income, building permit issuance, car owner-ship, commuting time, transport mode shares, and urban densities A synthesis of data should be issued annually, and describe trends in mo-bility and a( ordability.
The work of the operational planning de-partment should be guided by clear goals set by the mayor or the city council. The operational department should build on the monitoring re-port to propose complementary actions with
clear objectives and targets, including infra-structure investments and regulatory changes. After proposed actions are approved by the city government, program design and implementa-tion should be passed to traditional municipal line agencies (i.e., public works department, water supply utility, transit company, etc.).
Cities with decision processes fragmented across many departments that pursue their own agendas tend to produce undesired outcomes, including inconsistency and even incoherence. Clear objectives and targets are key factors in successful urban planning.
ECo2-Part3brEV_PREP Sec1:313 6/15/09 9:04:56 AM

ECo2-Part3brEV_PREP Sec1:314 6/15/09 9:04:56 AM
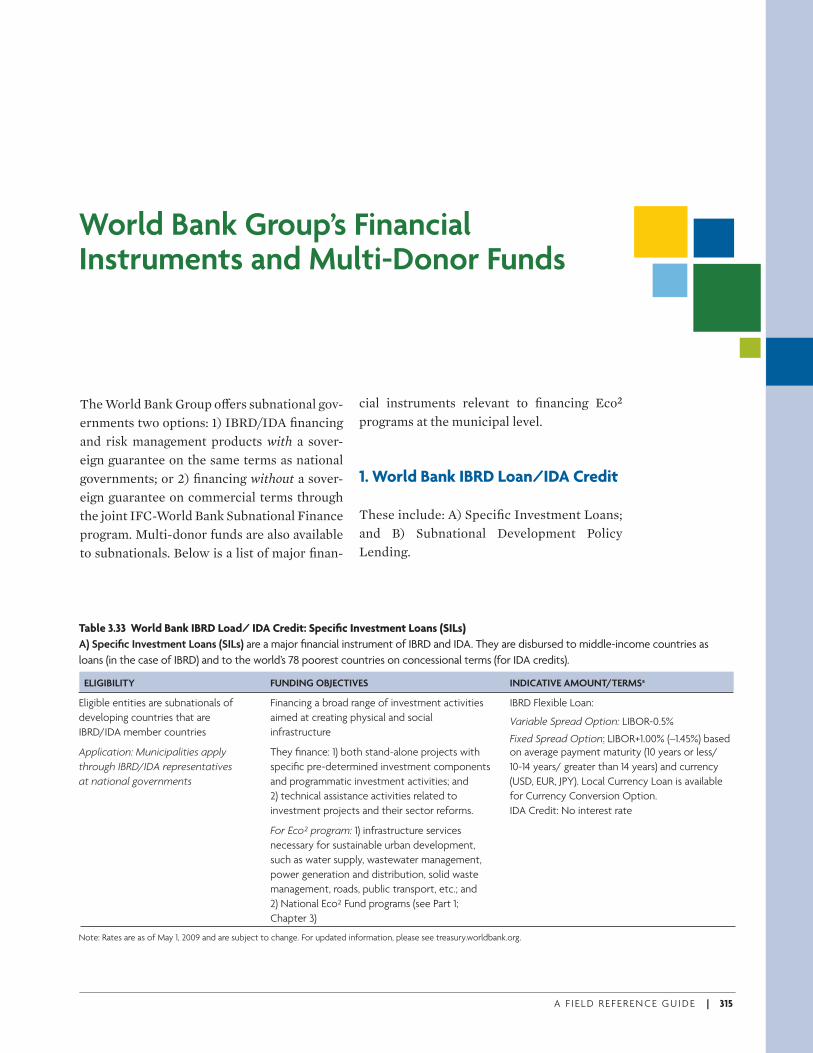
A F I E L D R E F E R E N C E G U I D E | 315
The World Bank Group o( ers subnational gov-ernments two options: 1) IBRD/IDA fi nancing and risk management products with a sover-eign guarantee on the same terms as national governments; or 2) fi nancing without a sover-eign guarantee on commercial terms through the joint IFC-World Bank Subnational Finance program. Multi-donor funds are also available to subnationals. Below is a list of major fi nan-
cial instruments relevant to fi nancing Eco2 programs at the municipal level.
1. World Bank IBRD Loan/IDA Credit
These include: A) Specifi c Investment Loans; and B) Subnational Development Policy Lending.
World Bank Group’s Financial Instruments and Multi-Donor Funds
Table 3.33 World Bank IBRD Load/ IDA Credit: Specifi c Investment Loans (SILs)
A) Specifi c Investment Loans (SILs) are a major fi nancial instrument of IBRD and IDA. They are disbursed to middle-income countries as
loans (in the case of IBRD) and to the world’s 78 poorest countries on concessional terms (for IDA credits).
ELIGIBILITY FUNDING OBJECTIVES INDICATIVE AMOUNT/TERMSa
Eligible entities are subnationals of Financing a broad range of investment activities IBRD Flexible Loan:
developing countries that are aimed at creating physical and social Variable Spread Option: LIBOR-0.5%IBRD/IDA member countries infrastructure
Fixed Spread Option: LIBOR+1.00% (–1.45%) basedApplication: Municipalities apply They fi nance: 1) both stand-alone projects with on average payment maturity (10 years or less/
through IBRD/IDA representatives specifi c pre-determined investment components 10-14 years/ greater than 14 years) and currency
at national governments and programmatic investment activities; and (USD, EUR, JPY). Local Currency Loan is available
2) technical assistance activities related to for Currency Conversion Option.
investment projects and their sector reforms. IDA Credit: No interest rate
For Eco² program: 1) infrastructure services
necessary for sustainable urban development,
such as water supply, wastewater management,
power generation and distribution, solid waste
management, roads, public transport, etc.; and
2) National Eco² Fund programs (see Part 1;
Chapter 3)
Note: Rates are as of May 1, 2009 and are subject to change. For updated information, please see treasury.worldbank.org.
ECo2-Part3brEV_PREP Sec1:315 6/15/09 9:04:56 AM
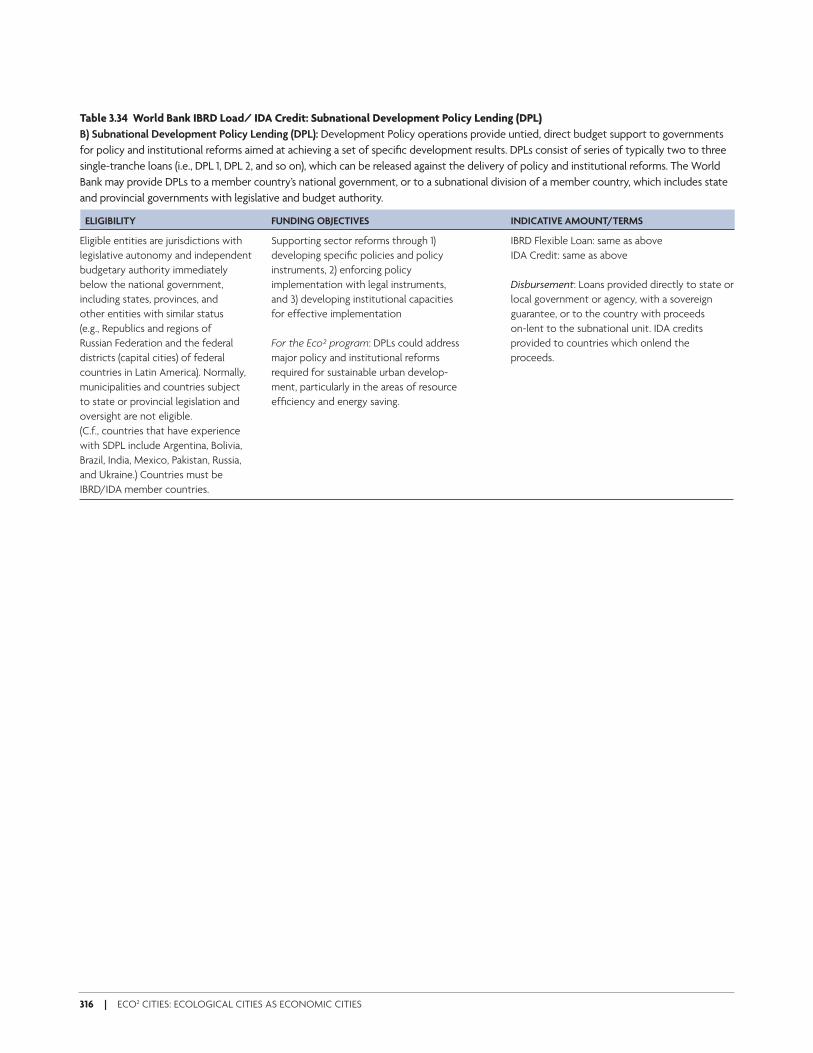
316 | ECO2 CITIES: ECOLOGICAL CITIES AS ECONOMIC CITIES
Table 3.34 World Bank IBRD Load/ IDA Credit: Subnational Development Policy Lending (DPL)
B) Subnational Development Policy Lending (DPL): Development Policy operations provide untied, direct budget support to governments
for policy and institutional reforms aimed at achieving a set of specifi c development results. DPLs consist of series of typically two to three
single-tranche loans (i.e., DPL 1, DPL 2, and so on), which can be released against the delivery of policy and institutional reforms. The World
Bank may provide DPLs to a member country’s national government, or to a subnational division of a member country, which includes state
and provincial governments with legislative and budget authority.
ELIGIBILITY FUNDING OBJECTIVES INDICATIVE AMOUNT/TERMS
Eligible entities are jurisdictions with Supporting sector reforms through 1) IBRD Flexible Loan: same as above
legislative autonomy and independent developing specifi c policies and policy IDA Credit: same as above
budgetary authority immediately instruments, 2) enforcing policy
below the national government, implementation with legal instruments, Disbursement: Loans provided directly to state or
including states, provinces, and and 3) developing institutional capacities local government or agency, with a sovereign
other entities with similar status for effective implementation guarantee, or to the country with proceeds
(e.g., Republics and regions of on-lent to the subnational unit. IDA credits
Russian Federation and the federal For the Eco² program: DPLs could address provided to countries which onlend the
districts (capital cities) of federal major policy and institutional reforms proceeds.
countries in Latin America). Normally, required for sustainable urban develop-
municipalities and countries subject ment, particularly in the areas of resource
to state or provincial legislation and effi ciency and energy saving.
oversight are not eligible.
(C.f., countries that have experience
with SDPL include Argentina, Bolivia,
Brazil, India, Mexico, Pakistan, Russia,
and Ukraine.) Countries must be
IBRD/IDA member countries.
ECo2-Part3brEV_PREP Sec1:316 6/15/09 9:04:56 AM

A F I E L D R E F E R E N C E G U I D E | 317
2. World Bank Group Financing
This includes A) Subnational Finance by the World Bank and IFC, B) fi nancing and services by IFC, and C) guarantees by MIGA.
Table 3.35 World Bank Group Financing: Joint IFC-World Bank Subnational Finance
A) Joint IFC-World Bank Subnational Finance: This provides eligible states, provinces, municipalities, and their enterprises with fi nancing and
access to capital markets, without sovereign guarantees, for investment in essential public services.
ELIGIBILITY FUNDING OBJECTIVES INDICATIVE AMOUNT/TERMS
Eligible applicants are: Strengthening the borrowers’ ability to Products are commercially priced, tailored to
1) State, Municipal, Provincial, Regional, deliver key infrastructure services such as client’s needs, and can be delivered in 3-6
or Local Governments and their water, wastewater management, transpor- months.
enterprises (including water and tation, gas, and electricity, and improving
sanitation utilities), their effi ciency and accountability as All products are provided without sovereign
2) Financial Intermediaries supporting service providers. guarantee, and may be available in local currency.
local infrastructure,
3) Nationally-owned Enterprises Investment selection criteria include Products:
operating in natural monopoly, a. Financial: Predictability of cash fl ows to a. Lending Instruments: Senior loans, Sub-
infrastructure sectors (selectively), service debt without sovereign guarantee ordinated loans and Convertible loans
and 4) Public-Private Partnership b. Socio-economic: Robust economic base b. Credit Enhancement: Partial credit guarantees,
entities (to cover commitments of c. Institutional: Operational effi ciency risk sharing facilities and Securitizations
the public partner). d. Regulatory: Functional system c. Equity and Quasi Equity: Equity and Other
Eligible projects must 1) be located e. Development Impact: Essentiality of hybrid instruments
in a developing country that is a investment and strong economic benefi ts.
member of IFC; 2) be in the public For details, please see www.ifc.org/
sector; 3) be technically, environ- subnationalfi nance.
mentally, and socially sound; and
4) benefi t the local economy.
Eligible sectors are water, wastewater,
solid waste, transportation, social
infrastructure (e.g. health and
education), power, gas distribution,
and district heating, and other
essential public services.
ECo2-Part3brEV_PREP Sec1:317 6/15/09 9:04:56 AM
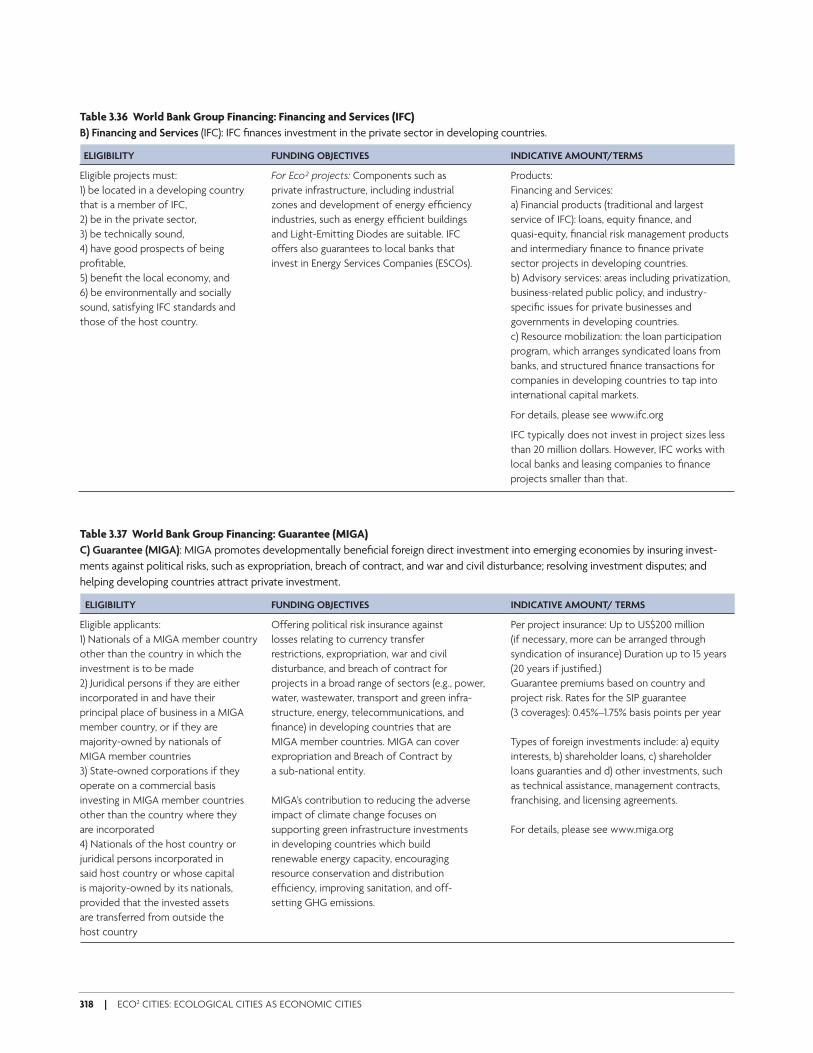
318 | ECO2 CITIES: ECOLOGICAL CITIES AS ECONOMIC CITIES
Table 3.36 World Bank Group Financing: Financing and Services (IFC)
B) Financing and Services (IFC): IFC fi nances investment in the private sector in developing countries.
ELIGIBILITY FUNDING OBJECTIVES INDICATIVE AMOUNT/TERMS
Eligible projects must: For Eco² projects: Components such as Products:
1) be located in a developing country private infrastructure, including industrial Financing and Services:
that is a member of IFC, zones and development of energy effi ciency a) Financial products (traditional and largest
2) be in the private sector, industries, such as energy effi cient buildings service of IFC): loans, equity fi nance, and
3) be technically sound, and Light-Emitting Diodes are suitable. IFC quasi-equity, fi nancial risk management products
4) have good prospects of being offers also guarantees to local banks that and intermediary fi nance to fi nance private
profi table, invest in Energy Services Companies (ESCOs). sector projects in developing countries.
5) benefi t the local economy, and b) Advisory services: areas including privatization,
6) be environmentally and socially business-related public policy, and industry-
sound, satisfying IFC standards and specifi c issues for private businesses and
those of the host country. governments in developing countries.
c) Resource mobilization: the loan participation
program, which arranges syndicated loans from
banks, and structured fi nance transactions for
companies in developing countries to tap into
international capital markets.
For details, please see www.ifc.org
IFC typically does not invest in project sizes less
than 20 million dollars. However, IFC works with
local banks and leasing companies to fi nance
projects smaller than that.
Table 3.37 World Bank Group Financing: Guarantee (MIGA)
C) Guarantee (MIGA): MIGA promotes developmentally benefi cial foreign direct investment into emerging economies by insuring invest-
ments against political risks, such as expropriation, breach of contract, and war and civil disturbance; resolving investment disputes; and
helping developing countries attract private investment.
ELIGIBILITY FUNDING OBJECTIVES INDICATIVE AMOUNT/ TERMS
Eligible applicants: Offering political risk insurance against Per project insurance: Up to US$200 million
1) Nationals of a MIGA member country losses relating to currency transfer (if necessary, more can be arranged through
other than the country in which the restrictions, expropriation, war and civil syndication of insurance) Duration up to 15 years
investment is to be made disturbance, and breach of contract for (20 years if justifi ed.)
2) Juridical persons if they are either projects in a broad range of sectors (e.g., power, Guarantee premiums based on country and
incorporated in and have their water, wastewater, transport and green infra- project risk. Rates for the SIP guarantee
principal place of business in a MIGA structure, energy, telecommunications, and (3 coverages): 0.45%–1.75% basis points per year
member country, or if they are fi nance) in developing countries that are
majority-owned by nationals of MIGA member countries. MIGA can cover Types of foreign investments include: a) equity
MIGA member countries expropriation and Breach of Contract by interests, b) shareholder loans, c) shareholder
3) State-owned corporations if they a sub-national entity. loans guaranties and d) other investments, such
operate on a commercial basis as technical assistance, management contracts,
investing in MIGA member countries MIGA’s contribution to reducing the adverse franchising, and licensing agreements.
other than the country where they impact of climate change focuses on
are incorporated supporting green infrastructure investments For details, please see www.miga.org
4) Nationals of the host country or in developing countries which build
juridical persons incorporated in renewable energy capacity, encouraging
said host country or whose capital resource conservation and distribution
is majority-owned by its nationals, effi ciency, improving sanitation, and off-
provided that the invested assets setting GHG emissions.
are transferred from outside the
host country
ECo2-Part3brEV_PREP Sec1:318 6/15/09 9:04:56 AM
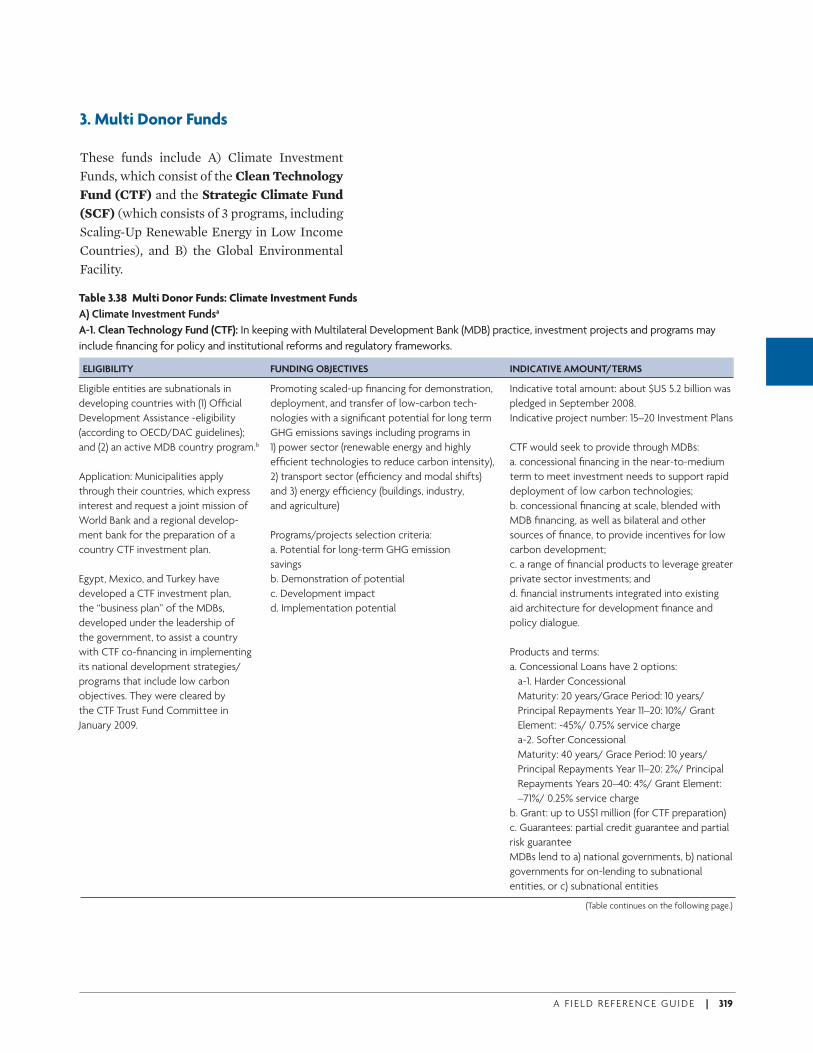
A F I E L D R E F E R E N C E G U I D E | 319
Table 3.38 Multi Donor Funds: Climate Investment Funds
A) Climate Investment Fundsa
A-1. Clean Technology Fund (CTF): In keeping with Multilateral Development Bank (MDB) practice, investment projects and programs may
include fi nancing for policy and institutional reforms and regulatory frameworks.
ELIGIBILITY FUNDING OBJECTIVES INDICATIVE AMOUNT/TERMS
Eligible entities are subnationals in Promoting scaled-up fi nancing for demonstration, Indicative total amount: about $US 5.2 billion was
developing countries with (1) Offi cial deployment, and transfer of low-carbon tech- pledged in September 2008.
Development Assistance -eligibility nologies with a signifi cant potential for long term Indicative project number: 15–20 Investment Plans
(according to OECD/DAC guidelines); GHG emissions savings including programs in
and (2) an active MDB country program.b 1) power sector (renewable energy and highly CTF would seek to provide through MDBs:
effi cient technologies to reduce carbon intensity), a. concessional fi nancing in the near-to-medium
Application: Municipalities apply 2) transport sector (effi ciency and modal shifts) term to meet investment needs to support rapid
through their countries, which express and 3) energy effi ciency (buildings, industry, deployment of low carbon technologies;
interest and request a joint mission of and agriculture) b. concessional fi nancing at scale, blended with
World Bank and a regional develop- MDB fi nancing, as well as bilateral and other
ment bank for the preparation of a Programs/projects selection criteria: sources of fi nance, to provide incentives for low
country CTF investment plan. a. Potential for long-term GHG emission carbon development;
savings c. a range of fi nancial products to leverage greater
Egypt, Mexico, and Turkey have b. Demonstration of potential private sector investments; and
developed a CTF investment plan, c. Development impact d. fi nancial instruments integrated into existing
the “business plan” of the MDBs, d. Implementation potential aid architecture for development fi nance and
developed under the leadership of policy dialogue.
the government, to assist a country
with CTF co-fi nancing in implementing Products and terms:
its national development strategies/ a. Concessional Loans have 2 options:
programs that include low carbon a-1. Harder Concessional
objectives. They were cleared by Maturity: 20 years/Grace Period: 10 years/
the CTF Trust Fund Committee in Principal Repayments Year 11–20: 10%/ Grant
January 2009. Element: ~45%/ 0.75% service charge
a-2. Softer Concessional
Maturity: 40 years/ Grace Period: 10 years/
Principal Repayments Year 11–20: 2%/ Principal
Repayments Years 20–40: 4%/ Grant Element:
–71%/ 0.25% service charge
b. Grant: up to US$1 million (for CTF preparation)
c. Guarantees: partial credit guarantee and partial
risk guarantee
MDBs lend to a) national governments, b) national
governments for on-lending to subnational
entities, or c) subnational entities
3. Multi Donor Funds
These funds include A) Climate Investment Funds, which consist of the Clean Technology Fund (CTF) and the Strategic Climate Fund
(SCF) (which consists of 3 programs, including Scaling-Up Renewable Energy in Low Income Countries), and B) the Global Environmental Facility.
(Table continues on the following page.)
ECo2-Part3brEV_PREP Sec1:319 6/15/09 9:04:56 AM
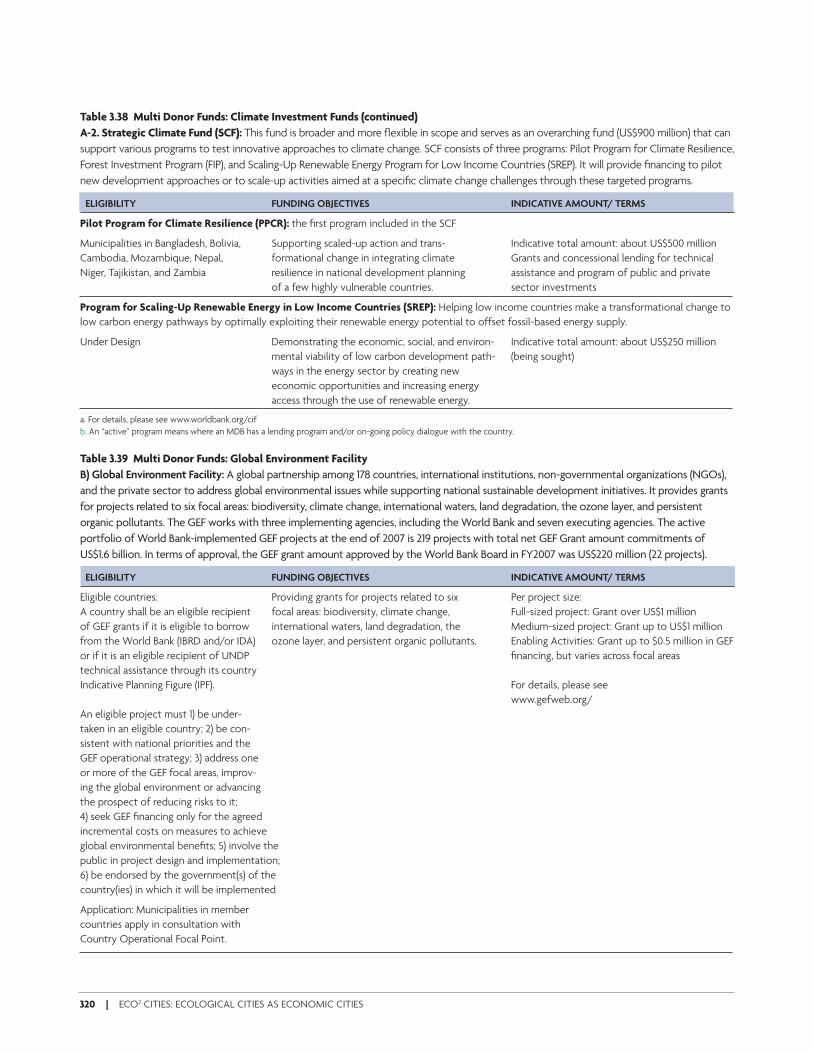
320 | ECO2 CITIES: ECOLOGICAL CITIES AS ECONOMIC CITIES
Table 3.38 Multi Donor Funds: Climate Investment Funds (continued)
A-2. Strategic Climate Fund (SCF): This fund is broader and more fl exible in scope and serves as an overarching fund (US$900 million) that can
support various programs to test innovative approaches to climate change. SCF consists of three programs: Pilot Program for Climate Resilience,
Forest Investment Program (FIP), and Scaling-Up Renewable Energy Program for Low Income Countries (SREP). It will provide fi nancing to pilot
new development approaches or to scale-up activities aimed at a specifi c climate change challenges through these targeted programs.
ELIGIBILITY FUNDING OBJECTIVES INDICATIVE AMOUNT/ TERMS
Pilot Program for Climate Resilience (PPCR): the fi rst program included in the SCF
Municipalities in Bangladesh, Bolivia, Supporting scaled-up action and trans- Indicative total amount: about US$500 million
Cambodia, Mozambique, Nepal, formational change in integrating climate Grants and concessional lending for technical
Niger, Tajikistan, and Zambia resilience in national development planning assistance and program of public and private
of a few highly vulnerable countries. sector investments
Program for Scaling-Up Renewable Energy in Low Income Countries (SREP): Helping low income countries make a transformational change to
low carbon energy pathways by optimally exploiting their renewable energy potential to offset fossil-based energy supply.
Under Design Demonstrating the economic, social, and environ- Indicative total amount: about US$250 million
mental viability of low carbon development path- (being sought)
ways in the energy sector by creating new
economic opportunities and increasing energy
access through the use of renewable energy.
a. For details, please see www.worldbank.org/cif
b. An “active” program means where an MDB has a lending program and/or on-going policy dialogue with the country.
Table 3.39 Multi Donor Funds: Global Environment Facility
B) Global Environment Facility: A global partnership among 178 countries, international institutions, non-governmental organizations (NGOs),
and the private sector to address global environmental issues while supporting national sustainable development initiatives. It provides grants
for projects related to six focal areas: biodiversity, climate change, international waters, land degradation, the ozone layer, and persistent
organic pollutants. The GEF works with three implementing agencies, including the World Bank and seven executing agencies. The active
portfolio of World Bank-implemented GEF projects at the end of 2007 is 219 projects with total net GEF Grant amount commitments of
US$1.6 billion. In terms of approval, the GEF grant amount approved by the World Bank Board in FY2007 was US$220 million (22 projects).
ELIGIBILITY FUNDING OBJECTIVES INDICATIVE AMOUNT/ TERMS
Eligible countries: Providing grants for projects related to six Per project size:
A country shall be an eligible recipient focal areas: biodiversity, climate change, Full-sized project: Grant over US$1 million
of GEF grants if it is eligible to borrow international waters, land degradation, the Medium-sized project: Grant up to US$1 million
from the World Bank (IBRD and/or IDA) ozone layer, and persistent organic pollutants. Enabling Activities: Grant up to $0.5 million in GEF
or if it is an eligible recipient of UNDP fi nancing, but varies across focal areas
technical assistance through its country
Indicative Planning Figure (IPF). For details, please see
www.gefweb.org/
An eligible project must 1) be under-
taken in an eligible country; 2) be con-
sistent with national priorities and the
GEF operational strategy; 3) address one
or more of the GEF focal areas, improv-
ing the global environment or advancing
the prospect of reducing risks to it;
4) seek GEF fi nancing only for the agreed
incremental costs on measures to achieve
global environmental benefi ts; 5) involve the
public in project design and implementation;
6) be endorsed by the government(s) of the
country(ies) in which it will be implemented
Application: Municipalities in member
countries apply in consultation with
Country Operational Focal Point.
ECo2-Part3brEV_PREP Sec1:320 6/15/09 9:04:56 AM
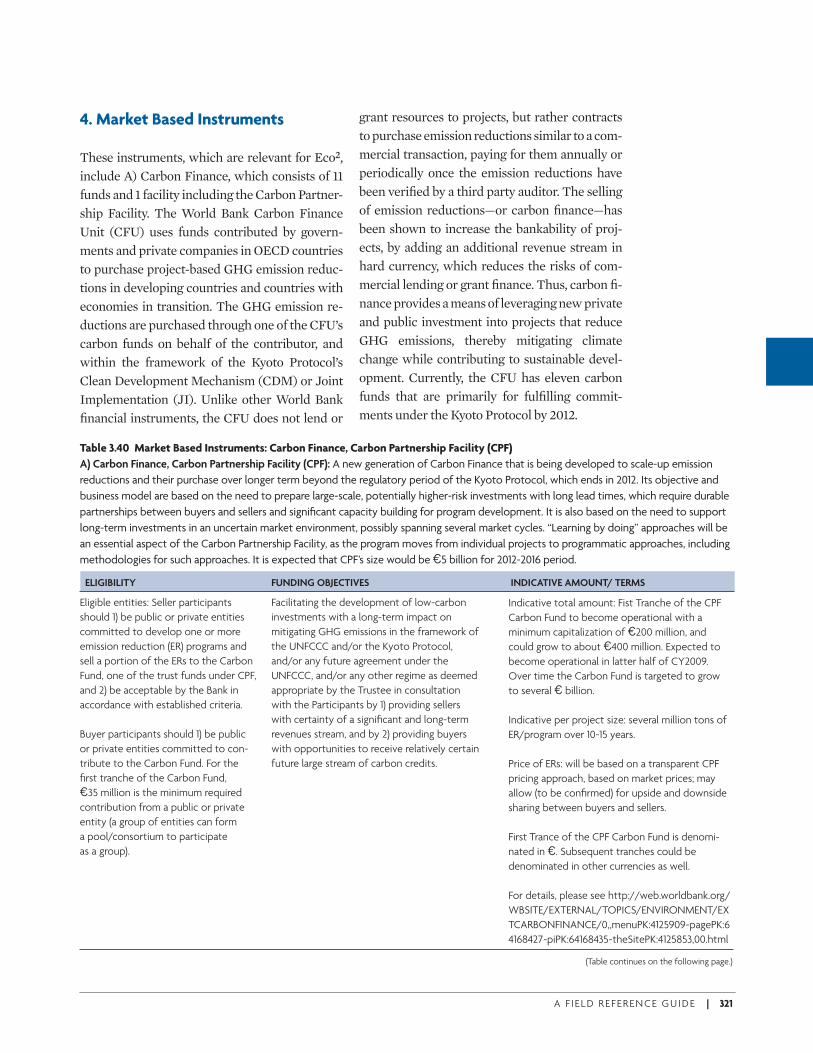
A F I E L D R E F E R E N C E G U I D E | 321
4. Market Based Instruments
These instruments, which are relevant for Eco2, include A) Carbon Finance, which consists of 11 funds and 1 facility including the Carbon Partner-ship Facility. The World Bank Carbon Finance Unit (CFU) uses funds contributed by govern-ments and private companies in OECD countries to purchase project-based GHG emission reduc-tions in developing countries and countries with economies in transition. The GHG emission re-ductions are purchased through one of the CFU’s carbon funds on behalf of the contributor, and within the framework of the Kyoto Protocol’s Clean Development Mechanism (CDM) or Joint Implementation (JI). Unlike other World Bank fi nancial instruments, the CFU does not lend or
grant resources to projects, but rather contracts to purchase emission reductions similar to a com-mercial transaction, paying for them annually or periodically once the emission reductions have been verifi ed by a third party auditor. The selling of emission reductions—or carbon fi nance—has been shown to increase the bankability of proj-ects, by adding an additional revenue stream in hard currency, which reduces the risks of com-mercial lending or grant fi nance. Thus, carbon fi -nance provides a means of leveraging new private and public investment into projects that reduce GHG emissions, thereby mitigating climate change while contributing to sustainable devel-opment. Currently, the CFU has eleven carbon funds that are primarily for fulfi lling commit-ments under the Kyoto Protocol by 2012.
Table 3.40 Market Based Instruments: Carbon Finance, Carbon Partnership Facility (CPF)
A) Carbon Finance, Carbon Partnership Facility (CPF): A new generation of Carbon Finance that is being developed to scale-up emission
reductions and their purchase over longer term beyond the regulatory period of the Kyoto Protocol, which ends in 2012. Its objective and
business model are based on the need to prepare large-scale, potentially higher-risk investments with long lead times, which require durable
partnerships between buyers and sellers and signifi cant capacity building for program development. It is also based on the need to support
long-term investments in an uncertain market environment, possibly spanning several market cycles. “Learning by doing” approaches will be
an essential aspect of the Carbon Partnership Facility, as the program moves from individual projects to programmatic approaches, including
methodologies for such approaches. It is expected that CPF’s size would be €5 billion for 2012-2016 period.
ELIGIBILITY FUNDING OBJECTIVES INDICATIVE AMOUNT/ TERMS
Eligible entities: Seller participants Facilitating the development of low-carbon
should 1) be public or private entities investments with a long-term impact on
committed to develop one or more mitigating GHG emissions in the framework of
emission reduction (ER) programs and the UNFCCC and/or the Kyoto Protocol,
sell a portion of the ERs to the Carbon and/or any future agreement under the
Fund, one of the trust funds under CPF, UNFCCC, and/or any other regime as deemed
and 2) be acceptable by the Bank in appropriate by the Trustee in consultation
accordance with established criteria. with the Participants by 1) providing sellers
with certainty of a signifi cant and long-term
Buyer participants should 1) be public revenues stream, and by 2) providing buyers
or private entities committed to con- with opportunities to receive relatively certain
tribute to the Carbon Fund. For the future large stream of carbon credits.
fi rst tranche of the Carbon Fund,
€35 million is the minimum required
contribution from a public or private
entity (a group of entities can form
a pool/consortium to participate
as a group).
(Table continues on the following page.)
Indicative total amount: Fist Tranche of the CPF
Carbon Fund to become operational with a
minimum capitalization of €200 million, and
could grow to about €400 million. Expected to
become operational in latter half of CY2009.
Over time the Carbon Fund is targeted to grow
to several € billion.
Indicative per project size: several million tons of
ER/program over 10-15 years.
Price of ERs: will be based on a transparent CPF
pricing approach, based on market prices; may
allow (to be confi rmed) for upside and downside
sharing between buyers and sellers.
First Trance of the CPF Carbon Fund is denomi-
nated in €. Subsequent tranches could be
denominated in other currencies as well.
For details, please see http://web.worldbank.org/
WBSITE/EXTERNAL/TOPICS/ENVIRONMENT/EX
TCARBONFINANCE/0,,menuPK:4125909~pagePK:6
4168427~piPK:64168435~theSitePK:4125853,00.html
ECo2-Part3brEV_PREP Sec1:321 6/15/09 9:04:56 AM
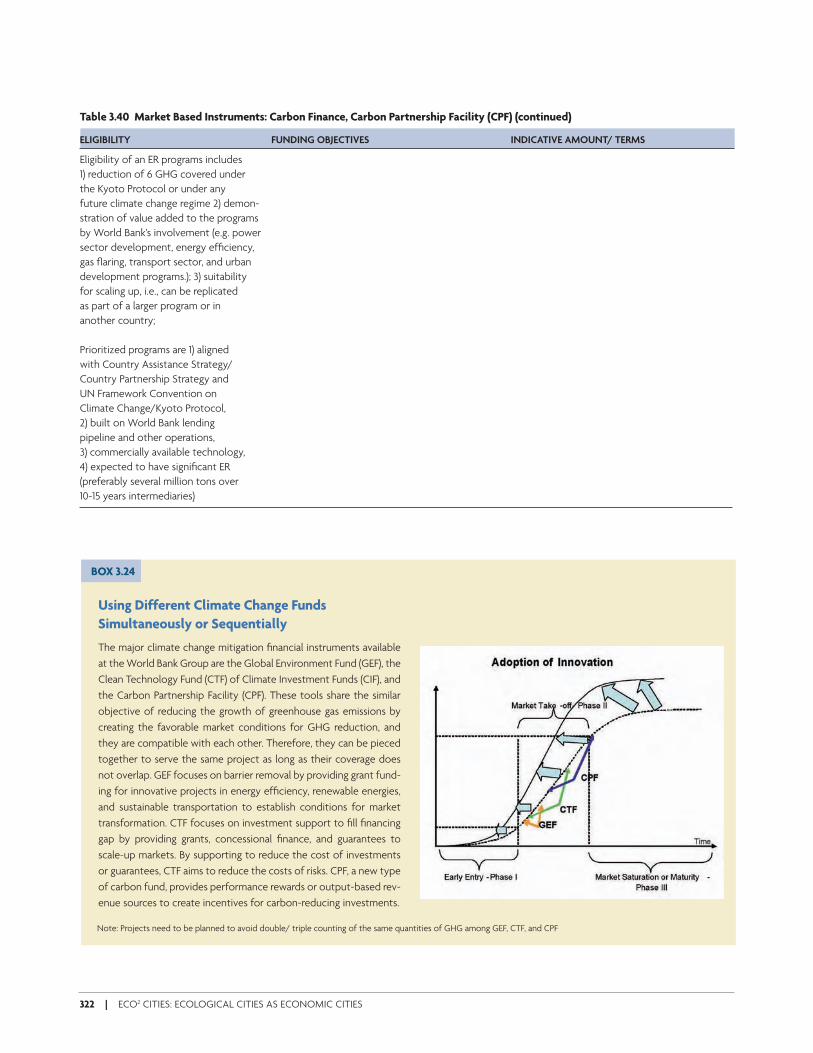
322 | ECO2 CITIES: ECOLOGICAL CITIES AS ECONOMIC CITIES
Table 3.40 Market Based Instruments: Carbon Finance, Carbon Partnership Facility (CPF) (continued)
ELIGIBILITY FUNDING OBJECTIVES INDICATIVE AMOUNT/ TERMS
Eligibility of an ER programs includes
1) reduction of 6 GHG covered under
the Kyoto Protocol or under any
future climate change regime 2) demon-
stration of value added to the programs
by World Bank’s involvement (e.g. power
sector development, energy effi ciency,
gas fl aring, transport sector, and urban
development programs.); 3) suitability
for scaling up, i.e., can be replicated
as part of a larger program or in
another country;
Prioritized programs are 1) aligned
with Country Assistance Strategy/
Country Partnership Strategy and
UN Framework Convention on
Climate Change/Kyoto Protocol,
2) built on World Bank lending
pipeline and other operations,
3) commercially available technology,
4) expected to have signifi cant ER
(preferably several million tons over
10-15 years intermediaries)
Using Different Climate Change Funds
Simultaneously or Sequentially
The major climate change mitigation fi nancial instruments available
at the World Bank Group are the Global Environment Fund (GEF), the
Clean Technology Fund (CTF) of Climate Investment Funds (CIF), and
the Carbon Partnership Facility (CPF). These tools share the similar
objective of reducing the growth of greenhouse gas emissions by
creating the favorable market conditions for GHG reduction, and
they are compatible with each other. Therefore, they can be pieced
together to serve the same project as long as their coverage does
not overlap. GEF focuses on barrier removal by providing grant fund-
ing for innovative projects in energy effi ciency, renewable energies,
and sustainable transportation to establish conditions for market
transformation. CTF focuses on investment support to fi ll fi nancing
gap by providing grants, concessional fi nance, and guarantees to
scale-up markets. By supporting to reduce the cost of investments
or guarantees, CTF aims to reduce the costs of risks. CPF, a new type
of carbon fund, provides performance rewards or output-based rev-
enue sources to create incentives for carbon-reducing investments.
BOX 3.24
Note: Projects need to be planned to avoid double/ triple counting of the same quantities of GHG among GEF, CTF, and CPF
ECo2-Part3brEV_PREP Sec1:322 6/15/09 9:04:56 AM
A F I E L D R E F E R E N C E G U I D E | 323
Citywide GHG Emission Reduction and
Carbon Finance
Emissions in urban areas are from a wide range of sources, including
transportation, electrical, and thermal energy consumption in build-
ings and industries, water and wastewater management, municipal
waste, and various public services. Under the Clean Development
Mechanism (CDM), there are around twenty methodologies relevant
to an urban authority, with the waste sector being the most ad-
dressed. Methodologies enable the projects to measure GHG re-
ductions in comparison with the baselines or the ‘business-as-usual’
trends for specifi c sources of emissions, and monitor emission re-
ductions. However, as the GHG impact of individual sources, such as
a single waste site or street-lighting is very small, many of these proj-
ects are unable to access carbon fi nance due to high transaction
costs. Furthermore, sectors such as buildings are not effectively ad-
dressed by current methodologies.
The Carbon Finance Unit of the World Bank is developing a
framework methodology that attempts to aggregate the GHG im-
pact of all individual sources in a single administrative area, allowing
for simplifi cation and streamlining of measurement and monitoring
approaches, as well as enabling development of a city-wide program
for GHG mitigation. For a typical existing city, the proposed baseline
is the current and projected future service provision. For a new city,
the baseline could be common practice in the region. Emission
sources are categorized into waste, transport, and energy use sec-
BOX 3.25
tors. These emissions can be reduced from a range of activities. In
the waste sector, methane avoidance, biogas generation, and recy-
cling facilities are key sources. Increasing the share of public trans-
port can have a signifi cant GHG mitigation benefi ts. Energy effi cien-
cy opportunities include, buildings, lighting in public areas such as
street-lights, water pumping, district heating, and integrated plan-
ning for heating-cooling supplies. Signifi cant emission reductions are
also achieved by using energy from renewable sources such as wind,
solar, and geothermal.
GHG emission reductions at the city level can be realized in each
sector either through projects or through regulatory and incentive-
based initiatives that facilitate the participation of private sector and
the general public. A typical program at the city level would be man-
aged by a city authority. Projects may be implemented by city au-
thorities, either through public-private partnerships or by contractors.
GHG mitigation projects are implemented in the above-mentioned
three sectors (waste, transport, and energy) over a period of time and
generate emission reduction credits based on their performance. De-
pending on the acceptance of a citywide aggregated methodology,
emission reduction credits can be traded and sold, either for use by
industrialized countries to meet a part of their emission reduction
targets under the Kyoto Protocol, or into the voluntary market for use
by industries, governments, or cities themselves.
ECo2-Part3brEV_PREP Sec1:323 6/15/09 9:04:57 AM

ECo2-Part3brEV_PREP Sec1:324 6/15/09 9:04:57 AM
E N D N OT ES | 325
PART ONE
1. Angel, Shlomo, Stephen C. Sheppard, and Daniel L. Civco. 2005. The Dynamics of Global Urban Expansion. Washington D.C.: The World Bank.
2. Ibid
3. The World Bank, “Urban Sector Strategy Update Draft Concept Note”
4. Ibid
5. Rees, William. 2001. “Global Change, Ecological Footprints, and Urban Sustainability.” In, How Green is the City? Sustainability Assessments and the Management of Urban Environments, ed. Dimitri Divuyst, 37–42. New York: Columbia University Press.
a. Boyden, S. et al, 1981, The Ecology of a City and its People—The Case of Hong Kong, ANU Press Canberra
b. Redrawn and adapted from Baccini, P. and Oswald, F. 1998 Netzstadt, Transdisziplinäre Methoden zum Umbau urbaner Systeme. VdF-ETH, Zürich
6. The World Bank Group consists of the following fi ve institutions: International Bank for Reconstruction and Development (IBRD), International Development Association (IDA), International Finance Corporation (IFC), Multilateral Investment Guarantee Agency (MIGA), and the International Centre for Settlement of Investment Disputes (ICSID)
7. Angel, Shlomo, Stephen C. Sheppard, and Daniel L. Civco. 2005. The Dynamics of Global Urban Expansion. Washington D.C.: The World Bank.
8. Ibid
9. Figures are from UN-Habitat. 2008. The State of the World’s Cities 2008/2009: Harmonious Cities. London: Earthscan Publications.
10. Ibid
11. Figures are from Gill, Indermit, and Homi Kharas. 2007. An East Asian Renaissance. Washington D.C.: World Bank.
12. Ibid
13. Figures are from United Nations World Urbanization Prospects Database
14. Figures are from UN-Habitat. 2008. The State of the World’s Cities 2008/2009: Harmonious Cities. London: Earthscan Publications.
15. Figures are from Gill, Indermit, and Homi Kharas. 2007. An East Asian Renaissance. Washington D.C.: World Bank.
16. The World Bank, “Urban Sector Strategy Update Draft Concept Note”
17. Ibid
18. Florida, Richard. 2002. Rise of the Creative Class: And How It’s Transforming Work, Leisure, Community and Everyday Life. New York: Basic Books.
19. World Development Draft Report 2009, World Bank
Endnotes
ECo2-Endnotes_PREP 325 6/15/09 9:06:06 AM

326 | ECO2 CITIES: ECOLOGICAL CITIES AS ECONOMIC CITIES
20. East Asia’s Urban Transformation, a note prepared by the East Asia Region Urban Sector of the World Bank.
21. UNFPA, op.cit., p.36 (urban strategy draft)
22. UN Habitat. 2003. The Challenge of Slums: Global Report on Human Settlements. London: Earthscan Publications.
23. Data from UN-Habitat. 2008. The State of the World’s Cities 2008/2009: Harmonious Cities. London: Earthscan Publications. p90.
24. UN Habitat. 2003. The Challenge of Slums: Global Report on Human Settlements. London: Earthscan Publications.
25. Rees, William. 2001. “Global Change, Ecological Footprints, and Urban Sustainability.” In, How Green is the City? Sustainability Assessments and the Management of Urban Environments, ed. Dimitri Divuyst, 37–42. New York: Columbia University Press.
26. World Bank. 2007. Cost of Pollution in China: Economic Estimates of Physical Damanges. Washington, DC: World Bank. http://sitere-sources.worldbank.org/INTEAPREGTOPEN-VIRONMENT/Resources/China_Cost_of_Pol-lution.pdf
27. Figures vary depending on sources/methodolo-gies. These fi gures are from International Energy Agency.
28. Figures from UN-Habitat. 2008. The State of the World’s Cities 2008/2009: Harmonious Cities. London: Earthscan Publications. pp132–133.
29. Stern, Nicholas. 2007. The Economics of Climate Change: The Stern Review. New York: Cambridge University Press.
30. City of Yokohama (2003) Yokohama G30 Plan (横浜市:横浜市一般廃棄物処理基本計画、横浜G30プラン) <http://www.city.yokohama.jp/me/pcpb/keikaku/kei1.html> (accessed February 2009)
31. City of Yokohama Resources & Wastes Circula-tion Bureau (2008) Operation Outline. (横浜市資源循環局「平成20年度事業概要」)<http://www.city.yokohama.jp/me/pcpb/keikaku/jigyo_gaiyou/20gaiyou/> (accessed February 2009)
32. City of Yokohama Statistics Portal Site <http://www.city.yokohama.jp/me/stat/> (横浜市:統計書Web版「行政区別世帯数及び人口の推移」) <http://www.city.yokohama.jp/me/stat/toukeisho/new/#02> (accessed February 2009)
33. City of Yokohama Resources & Wastes Circula-tion Bureau (2006) Yokohama G30 Plan –Verifi cation and Next Steps (横浜市資源循環局:横浜G30プラン「検証と今後の展開」について) <http://www.city.yokohama.jp/me/pcpb/
keikaku/G30rolling/> (accessed February 2009). Exchange rate of US$ 1 = JPY 100 was used for cost calculation.
34. City of Yokohama Resources & Wastes Circula-tion Bureau (2006) Yokohama G30 Plan —Verifi cation and Next Steps (横浜市資源循環局:横浜G30プラン「検証と今後の展開」について) <http://www.city.yokohama.jp/me/pcpb/keikaku/G30rolling/> (accessed February 2009)
35. City of Yokohama Resources & Wastes Circula-tion Bureau Website <http://www.city.yoko-hama.jp/me/pcpb/shisetsu/shigenkai/lca/> (accessed February 2009)
36. Bylund, Jonas R. What’s the Problem with Non-Conventional technology? The Stockholm Local Investment Program and the Eco-cycling Districts. European Council for an Energy E[ cient Economy, & Author, 2003
37. City of Stockholm, Fortum, Stockholm Water Company.
38. Karolina Brick, Barriers for Implementation of the Environmental Load Profi le and Other LCA-Based Tools (Stockholm: Royal Institute of Technology, 2008). Details on this tools are in the Annex.
39. City of Stockholm
40. Ibid
41. Ibid
42. Ibid
43. Ibid
44. IPPUC website
45. Downs, Anthony. Still Stuck in Tra[ c, 2004, Brookings Institution Press, Washington DC.
46. Wheeler and Beatley (eds), The Sustainable Urban Development Reader. 2007, Taylor & Francis
47. Ibid
48. USAID Energy Update, Issue 2, April/May 2005.
49. Pagiola, Stefano, Roberto Martin-Hurtado, Priya Shyamsundar, Muthukumara Mani, and Patricia Silva. 2002. Generating Public Sector Resources to Finance Sustainable Development: Revenue and Incentive E' ects. World Bank Technical Paper No. 538, Environment Series. World Bank, Washington DC.
50. Ibid
51. McKinsey. 2008. “Sustainable Urban Infrastruc-ture: London Edition—A View to 2025.” Siemens AG.
52. By contrast, in July 2005, hundreds of people were killed, and fi nancial losses of about US$100 million were incurred in the city of Mumbai, largely due to loss of natural mangrove
ECo2-Endnotes_PREP 326 6/15/09 9:06:06 AM
ENDNOTES | 327
ecosystems, and an unplanned speculation-driven construction frenzy in the northern suburbs. The new investments in drainage to compensate for bad planning will be exorbitant. Much of this might have been avoided.
53. The Eco2 program will make full use of innovative fi nancial products o] ered by the Bank, such as the new Climate Investment Funds that provide clients with a strong fi nancial incentives for transformative changes in energy e[ ciency and clean technologies. Carbon fi nance will also be leveraged.
c. Swedish Environmental Protection Agency. 2004. Local Investment Programmes—The Way to a Sustainable Society. http://www.naturvards-verket.se/Documents/publikation-er/91-620-8174-8.pdf (accessed May 14, 2009).
d. Swedish Environmental Protection Agency. 2004. Local Investment Programmes—The Way to a Sustainable Society. http://www.naturvard-sverket.se/Documents/publikation-er/91-620-8174-8.pdf (accessed May 14, 2009).
e. Swedish Environmental Protection Agency. 2004. Local Investment Programmes—The Way to a Sustainable Society. http://www.naturvard-sverket.se/Documents/publikation-er/91-620-8174-8.pdf (accessed May 14, 2009).
f. Boyden, S. et al, 1981, The Ecology of a City and its People—The Case of Hong Kong, ANU Press Canberra
g. Redrawn and adapted from Baccini, P. and Oswald, F. 1998 Netzstadt, Transdisziplinäre Methoden zum Umbau urbaner Systeme. VdF-ETH, Zürich
h. Kalkum, Bernd. 2008.
54. Singapore Public Utilities Board (PUB) Website <www.pub.gov.sg/about/Pages/default.aspx> (accessed January 2009).
i. Bai, X. “Solar-Powered City: Rizhao, China,” State of the World 2007, Worldwatch Institute, pp. 108–109.
j. Rutherford, Susan, 2007, The Green Infrastruc-ture, West Coast Environmental Law Associa-tion, ISBN 978-0-919365-31-5 www.wcel.org/wcelpub/2007/14255.pdf
k. Costs of Sprawl
55. The Town Planning Mechanism in Gujarat, India; Shirley Ballaney, World Bank, 2008, page 4
56. Ibid
57. In some applications, the LCC also attempts to include the ‘embodied’ or upstream costs that are associated with the use of construction materials, including energy inputs and emis-sions that result from their extraction, process-
ing, fabrication, and transportation. However, in most projects this information is not addressed in LCC, since the data is di[ cult to collect and the impacts tend to be most relevant to procurement policy, rather than design concepts.
58. Best Foot Forward Ltd. 2002. “City Limits: A Resource Flow and Ecological Footprint Analysis of Greater London.” City Limits London. http://www.citylimitslondon.com/downloads/Complete%20report.pdf
59. Ibid
60. Planning with Ecological Footprints: a sympa-thetic critique of theory and practice, McManus and Haughton, in Ecological Urbanization, Environment and Urbanization, Vol. 18 Number 1, April 2006, Sage publications.
l. European Science Foundation ESF/COST Publication. 2006. Towards Sustainable Urban Infrastructure. Assessment, Tools and Good Practice. 336 p. Helsinki ISBN 978-92-898-0035-8.
61. Ekins, P., et al, 2008 The Four-Capital Method of Sustainable Development Evaluation, European Environment 18, 63–80 www.interscience.wiley.com
62. As defi ned in Ekins, Paul and James Medhurst. 2003. “Evaluating the Contribution of the European Structural Funds to Sustainable Development: Methodology, Indicators and Results.“ Paper presented at the “Fifth Euro-pean Conference on Evaluation of Structural Funds,” Budapest, June 26–27. http://www.spatialnorth.org/spatial-planning-processes/the-spatialnorth-planning-wheel/resources/Evaluating%20The%20Contribution%20Of%20The%20European%20Structural%20Funds.pdf.
63. GHK, PSI, IEEP, CE, and National Evaluators. 2002. “Synthesis Report.” Vol. 1 of “The Thematic Evaluation on the Contribution of Structural Funds to Sustainable Development.” European Commission. http://ec.europa.eu/regional_policy/sources/docgener/evaluation/doc/sustainable_annexes_rev1.pdf
m. COST
64. The World Bank Group consists of the following fi ve institutions: International Bank for Reconstruction and Development (IBRD), International Development Association (IDA), International Finance Corporation (IFC), Multilateral Investment Guarantee Agency (MIGA), and the International Centre for Settlement of Investment Disputes (ICSID)
65. It is also required that the IBRD Loans or IDA Credit be covered by sovereign guarantees.
ECo2-Endnotes_PREP 327 6/15/09 9:06:06 AM
328 | ECO2 CITIES: ECOLOGICAL CITIES AS ECONOMIC CITIES
PART TWO
1. Lee D B, 1973, “Requiem for large-scale models” Journal of the American Institute of Planners 39 163–178.
2. Includes households and businesses.
3. Economist Intelligence Unit, Siemens. Sustain-able Urban Infrastructure London Edition—a View to 2025, Siemens, 2008, p. 64–65; see also www.siemens.com/sustainablecities
4. Lennertz, Bill and Lutzenhiser, Aarin. The Charrette Handbook: The Essential Guide to Accelerated, Collaborative Community Planning, APA Planners Press, 2006, Chicago, IL.
5. More information on developing and applying charettes can be acquired from these sources:
– Condon, Patrick M. Design charrettes for sustainable communities, Island Press, 2008.
– Lennertz, Bill and Lutzenhiser, Aarin. The Charrette Handbook: The Essential Guide to Accelerated, Collaborative Community Plan-ning, APA Planners Press, 2006, Chicago, IL.
– The CitiesPLUS Design Charrettes in Tools for Planning for Long-term Sustainability, A CMHC Report. Available from ftp://ftp.cmhc-schl.gc.ca/chic-ccdh/Research_Reports-Rapports_de_recherche/eng_unilingual/Final%20char-rette%20manual(w).pdf
6. McHarg, Ian. Design with Nature, Natural History Press, 1969, Garden City, New York. ISBN: 0385055099.
7. World Bank. Climate Resilient Cities 2008 Primer, World Bank, 2008, Washington, DC.
8. InfraCycle is another example of a commercial spreadsheet application that helps cities to calculate the capital, maintenance, replacement, and operating costs of all municipal infrastruc-ture and estimates future revenues. See http://www.infracycle.com/
PART THREE
1. Modal share: public transport (bus) 45 percent; bicycle 5 percent; walking 27 percent and private car 22 percent. Figures are from presentation by IPPUC (Institute for Research and Urban Planning of Curitiba). 2009. “The City of Curitiba: Planning for Sustainability—an Approach all Cities Can A] ord” presented at the World Bank, Washington D.C., March 31.
2. Hattori, Keiro. 2004. Ningen Toshi Curitiba 人間都市クリチバ [Human City Curitiba). Kyoto: Gakugei Shuppan Sha; and Prefeitura Munici-
pal de Curitiba. 2000. LEI N° 9.800 de 03 de janeiro de 2000 —Anexos.
3. Presentation by IPPUC (Institute for Research and Urban Planning of Curitiba). 2009. “Energy E[ ciency in Cities: Curitiba’s Green Line” presented at the World Bank Energy Week 2009, Washington D.C., April 1.
4. Presentation by IPPUC (Institute for Research and Urban Planning of Curitiba). 2009. “Energy E[ ciency in Cities: Curitiba’s Green Line” presented at the World Bank Energy Week 2009, Washington D.C., April 1.
5. Friberg, Lars. 2000. “Innovative Solutions for Public Transport: Curitiba, Brazil”. Sustainable Development International. 3rd Edition. pp. 153–156.
6. Leitmann, Josef. (1999) Sustaining Cities. New York: McGraw-Hill.
7. Figure from Friberg, L. (2000) “Innovative Solutions for Public Transport: Curitiba, Brazil”. Sustainable Development International. 3rd Edition. pp. 153–156.
8. Hattori, Keiro. 2004. Ningen Toshi Curitiba 人間都市クリチバ [Human City Curitiba). Kyoto: Gakugei Shuppan Sha.
9. Hattori, Keiro. 2004. Ningen Toshi Curitiba 人間都市クリチバ [Human City Curitiba). Kyoto: Gakugei Shuppan Sha.
10. Presentation by IPPUC at the World Bank on March 31, 2009. The City of Curitiba: Planning for Sustainabilit—an Approach all Cities Can A' ord.
11. IPPUC Website and Hattori, Keiro. 2004. Ningen Toshi Curitiba 人間都市クリチバ [Human City Curitiba). Kyoto: Gakugei Shuppan Sha.
12. Friberg, L. (2000) “Innovative Solutions for Public Transport: Curitiba, Brazil”. Sustainable Development International. 3rd Edition. pp. 153–156.
13. Hattori, Keiro. 2004. Ningen Toshi Curitiba 人間都市クリチバ [Human City Curitiba). Kyoto: Gakugei Shuppan Sha.
14. Comment in DVD (2007) A Convenient Truth: Urban Solutions from Curitiba, Brazil.
15. ICLEI (2002) Case Study 77 Curitiba –Orienting Urban Planning to Sustainability.
16. Figure from presentation by IPPUC at the World Bank on March 31, 2009. The City of Curitiba: Planning for Sustainability—an Approach all Cities Can A' ord.
17. Curitiba S.A. (2007). Municipal Bulletin 2007 of Socioeconomic Information.
18. Figure from Video of Curitiba, IPPUC presenta-tion at the World Bank Energy Week 2009 on April 1, 2009.
ECo2-Endnotes_PREP 328 6/15/09 9:06:06 AM

ENDNOTES | 329
19. Figure from Video of Curitiba, IPPUC presenta-tion at the World Bank Energy Week 2009 on April 1, 2009.
20. For example, in Huston, USA, the process of evapo-transpiration of trees can cool peak temperatures by 1.1 to 5 degree Celsius. Tree shadings provide Houston with annual energy savings of US$26 million. Houston Advanced Research Center (2004) Cool Houston!. <http://fi les.harc.edu/Projects/CoolHouston/CoolHoustonPlan.pdf> (accessed April 2009).
21. Figure from Rabinovitch, J. and Leitmann, J. (1993). Environment Innovation and Management in Curitiba, Brazil. UNDP/UNCHS/World Bank.
22. Figure from DVD (2007) A Convenient Truth: Urban Solutions from Curitiba, Brazil.
23. Figure from Hattori, Keiro. 2004. Ningen Toshi Curitiba 人間都市クリチバ [Human City Curitiba). Kyoto: Gakugei Shuppan Sha.
24. Figure from Hattori, Keiro. 2004. Ningen Toshi Curitiba 人間都市クリチバ [Human City Curitiba). Kyoto: Gakugei Shuppan Sha.
25. Figure from Curitiba presentation at the World Bank Transport Forum 2009 on March 31, 2009.
26. Hattori, Keiro. 2004. Ningen Toshi Curitiba 人間都市クリチバ [Human City Curitiba). Kyoto: Gakugei Shuppan Sha.
27. Hattori, Keiro. 2004. Ningen Toshi Curitiba 人間都市クリチバ [Human City Curitiba). Kyoto: Gakugei Shuppan Sha, and presentation of Mr. Hitoshi Nakamura, former Municipal Secretary of the Environment of Curitiba on July 13, 2007
28. Hattori, Keiro. 2004. Ningen Toshi Curitiba 人間都市クリチバ [Human City Curitiba). Kyoto: Gakugei Shuppan Sha.
29. Figures from Grontmij AB.
30. City of Stockholm. 2007. Vision 2030. http://www.stockholm.se/-/English/Stockholm-by-theme-/Urban-Development-/ (accessed May 14, 2009).
31. City of Stockholm. 2008. The Stockholm Environment Programme. http://www.stockholm.se/-/English/Stockholm-by-theme-/Environment/ (accessed May 14, 2009).
32. City of Stockholm. http://www.stockholm.se/KlimatMiljo/Klimat/Stockholms-Action-Programme-on-Climate-Change/ (accessed May 14, 2009).
33. Cervero, Robert. 1998. The Transit Metropolis. Washington D.C.: Island Press.
34. Stockholm O[ ce of Research and Statistics (2008) Data Guide Stockholm 2008.
35. Fryxell, Stellan. 2008. “Planning Hammarby Sjöstad, Stockholm” Presented at the Urban Land Institute, “ULI Europe Trends Confer-
ence—Stockholm 2008”, Stockholm, May 29. http://www.uli.org/~/media/Documents/Events/Conferences/Europe/Trends/Stockholm2008/1630EnergyHammarStellanFryxell_part1.ashx
36. Commission for Architecture and the Built Environment (CABE) UK. n.d. Hammarby Sjöstad. http://www.cabe.org.uk/case-studies/hammarby-sjostad (accessed May 14, 2009).
37. The ELP is developed in cooperation between the City of Stockholm, the Royal Institute of Technology and the consultancy company Grontmij AB.
38. The Planning Administration, the Real Estate, Streets and Tra[ c Administration (now divided into Development Administration and Tra[ c Administration), the City District Administra-tion and the Environment and Health Protec-tion Administration.
39. The City Planning Administration, The Development Administration, The Tra[ c Administration, The City District Administra-tion, The Environment and Health Protection Administration, and the Water Company and Housing Service Company.
40. Bylund, Jonas R. 2003. ”What’s the Problem with Non-conventional Technology? The Stockholm Local Investment Programme and the Eco-cycling Districts.” In ECEEE 2003 Summer Study Proceedings, ed. Sophie Attali, Eliane Métreau, Mélisande Prône, Kenya Tillerson, and International Consulting on Energy, Paris. Paris: ADEME Editions. http://www.eceee.org/conference_proceedings/eceee/2003c/Panel_4/4214bylund/ (accessed May 14, 2009).
41. Swedish Environmental Protection Agency. 2004. Local Investment Programmes—The Way to a Sustainable Society. http://www.naturvardsverket.se/Documents/publikationer/91-620- 8174-8.pdf (accessed May 14, 2009).
42. Swedish Environmental Protection Agency. 2004. Local Investment Programmes—The Way to a Sustainable Society. http://www.naturvardsverket.se/Documents/publikationer/91-620- 8174-8.pdf (accessed May 14, 2009).
43. Swedish Environmental Protection Agency. 2004. Local Investment Programmes—The Way to a Sustainable Society. http://www.naturvardsverket.se/Documents/publikationer/91-620-8174-8.pdf (accessed May 14, 2009).
44. United Nations. 2004. Human Settlement Country Profi le. http://www.un.org/esa/agenda21/natlinfo/countr/sweden/Sweden_HS.pdf (accessed May 14, 2009).
ECo2-Endnotes_PREP 329 6/15/09 9:06:06 AM
330 | ECO2 CITIES: ECOLOGICAL CITIES AS ECONOMIC CITIES
45. Johansson, Rolf and Örjan Svane. 2002. “Environmental Management in Large Scale Building projects — Learning from Hammarby Sjöstad.” Corporate Social Responsibility and Environmental Management 9 (4): 206–214.
46. Singapore Department of Statistics (2008). Includes resident and non-resident population. <http://www.singstat.gov.sg/stats/themes/people/hist/popn.html> (accessed January 2009).
47. Council of Local Authorities for International Relations (CLAIR) (2006).Singapore no Seisaku (Policies of Singapore). <http://www.clair.or.jp/j/forum/series/pdf/j21.pdf>
48. Bertaud, A. (2009) Urban Spatial Structures, Mobility and the Environment. Presentation at Urban Week 2009 at the World Bank on March 11, 2009.
49. Singapore Urban Redevelopment Authority— Marina Bay Website <http://www.marina-bay.sg/index.html>
50. Leitmann, J. (1999) Sustaining Cities. McGraw-Hill.
51. Singapore Land Transport Authority (2008) Land Transport Masterplan. <http://www.lta.gov.sg/ltmp/LTMP.html>
52. According to the Singapore Land Transport Authority (2008), 86.5 percent of citizens are satisfi ed with bus and rail services. About 80 percent are satisfi ed with overall travel times on buses and trains. About 85 percent are satisfi ed with accessibility and the locations of bus stops and MRT stations.
53. Leitmann, J. (1999) Sustaining Cities. McGraw-Hill. and Council of Local Authorities for International Relations (CLAIR) (2006).Singapore no Seisaku (Policies of Singapore). <http://www.clair.or.jp/j/forum/series/pdf/j21.pdf>
54. Singapore Ministry of the Environment and Water Resources and Minister of National Development (2009) A Lively and Liveable Singapore: Strategies for Sustainable Growth. <http://app.mewr.gov.sg/web/Contents/ContentsSSS.aspx?ContId=1299>
55. Singapore Land Transport Authority (2008) Land Transport Masterplan. <http://www.lta.gov.sg/ltmp/LTMP.html>
56. Japan Statistics Bureau (2008) World Statistics 2008. Data of Annual rainfall of major cities: Beijing—575 millimeters; Shanghai—1155 millimeters; Manila -1715 millimeters; Jakar-ta—1903 millimeters; Bangkok—1530 millime-ters; Kuala Lumpur—2390 millimeters; Tokyo—1467 millimeters; New York—1123 millimeters; London—751 millimeters.
57. Tortajada, C. (2006b). “Water Management in Singapore” in Biswas, A. and Tortajada, C. (Eds.) International Journal of Water Resources Development. Vol. 22, No. 2, pp. 227-240, June 2006.
58. Public Utilities Board (PUB) Website <www.pub.gov.sg/about/Pages/default.aspx> (accessed January 2009).
59. Public Utilities Board (PUB) Website <www.pub.gov.sg/about/Pages/default.aspx> (accessed January 2009).
60. Asian Development Bank (ADB) Website <http://www.adb.org/Water/Actions/sin/NEWater-Sewage-Safe.asp>
61. Asian Development Bank (ADB) Website < http://www.adb.org/Water/Actions/sin/NEWater-Sewage-Safe.asp>
62. Asian Development Bank (ADB) Website < http://www.adb.org/Water/Actions/sin/NEWater-Sewage-Safe.asp>
63. Non-revenue water in most Asian urban centers is around 40-60%.
64. Tan, Yok Gin. 2008. “Managing the Water Reclamation Infrastructure for Sustainability—the Singapore Water Story”. Presented at the International Water Association “World Water Congress 2008,” Vienna, September 9.
65. Tortajada, C. (2006b). “Water Management in Singapore” in Biswas, A. and Tortajada, C. (Eds.) International Journal of Water Resources Development. Vol. 22, No. 2, pp. 227-240, June 2006.
66. Singapore Ministry of the Environment and Water Resources Website <http://www.mewr.gov.sg/sgp2012/>
67. Singapore Ministry of the Environment and Water Resources and Minister of National Development (2009) A Lively and Liveable Singapore: Strategies for Sustainable Growth. <http://app.mewr.gov.sg/web/Contents/ContentsSSS.aspx?ContId=1299>
68 Singapore Ministry of the Environment and Water Resources and Minister of National Development (2009) A Lively and Liveable Singapore: Strategies for Sustainable Growth. <http://app.mewr.gov.sg/web/Contents/ContentsSSS.aspx?ContId=1299>
69. Singapore Ministry of the Environment and Water Resources and Minister of National Development (2009) A Lively and Liveable Singapore: Strategies for Sustainable Growth. <http://app.mewr.gov.sg/web/Contents/ContentsSSS.aspx?ContId=1299>
70. Leitmann, J. (1999) Sustaining Cities. McGraw-Hill. and Council of Local Authorities for
ECo2-Endnotes_PREP 330 6/15/09 9:06:07 AM
ENDNOTES | 331
International Relations (CLAIR) (2006).Singapore no Seisaku (Policies of Singapore). <http://www.clair.or.jp/j/forum/series/pdf/j21.pdf>
71. Singapore Ministry of the Environment and Water Resources and Minister of National Development (2009) A Lively and Liveable Singapore: Strategies for Sustainable Growth. <http://app.mewr.gov.sg/web/Contents/ContentsSSS.aspx?ContId=1299>
72. Asia Pacifi c Forum for Environment and Development (APFED) Website. <http://apfed-db.iges.or.jp/dtlbpp.php?no=23>
73. Singapore PUB (2008) Brochure on ABC Waters.
74. Leitmann, J. (1999) Sustaining Cities. McGraw-Hill.
75. Council of Local Authorities for International Relations (CLAIR) (2006).Singapore no Seisaku (Policies of Singapore). <http://www.clair.or.jp/j/forum/series/pdf/j21.pdf>
76. Singapore Housing Development Board Website <http://www.hdb.gov.sg/fi 10/fi 10004p.nsf/ECitizen/SELLING/$fi le/Selling_HDBEnq_FAQB.htm>
77. In this case study, waste denotes (i) waste produced from households, and (ii) waste from businesses (commercial and services). Indus-trial waste is not included in this defi nition.
78. City of Yokohama Resources & Wastes Circula-tion Bureau (2008) Operation Outline. (横浜市資源循環局「平成20年度事業概要」) <http://www.city.yokohama.jp/me/pcpb/keikaku/jigyo_gaiyou/20gaiyou/>, and City of Yokohama Statistics Portal Site <http://www.city.yokohama.jp/me/stat/> (横浜市:統計書Web版「行政区別世帯数及び人口の推移」) <http://www.city.yokohama.jp/me/stat/toukeisho/new/#02> (accessed February 2009)
79. City of Yokohama Resources & Wastes Circula-tion Bureau (2006) Yokohama G30 Plan –Verifi cation and Next Steps. (横浜市資源循環局:横浜G30プラン「検証と今後の展開」について) <http://www.city.yokohama.jp/me/pcpb/keikaku/G30rolling/> (accessed February 2009)
80. City of Yokohama Resources & Wastes Circula-tion Bureau (2008) Operation Outline. (横浜市資源循環局「平成20年度事業概要」) <http://www.city.yokohama.jp/me/pcpb/keikaku/jigyo_gaiyou/20gaiyou/> (accessed February 2009)
81. Eco-Model Cities: An initiative that the Government of Japan launched in 2008. A total of 13 cities were selected to serve as model cities. The selection was based on: (i) high
target of GHG reduction; (ii) comprehensive and original approach that can be referred to by other cities; (iii) local conditions and character; (iv) feasibility of the target/plans and wide stakeholder participation; and (v) long-term sustainable implementation. Other than Yokohama, Kita-Kyushu city, Obihiro city, Toyama city, Shimokawa town, Minamata city, Kyoto city, Sakai city, Iida city, Toyota city, Kasihara town, Miyakojima city, and the Tokyo Chiyoda ward were selected.
82. City of Yokohama (2003) Yokohama G30 Plan. (横浜市:横浜市一般廃棄物処理基本計画、横浜G30プラン) <http://www.city.yokohama.jp/me/pcpb/keikaku/kei1.html> (accessed February 2009)
83. City of Yokohama (2008) Proposal for Eco-Mod-el Cities. (横浜市:環境モデル都市提案書-様式1) <http://www.city.yokohama.jp/me/kankyou/ondan/model/> (accessed February 2009)
84. City of Yokohama Resources & Wastes Circula-tion Bureau (2006) Yokohama G30 Plan –Verifi cation and Next Steps. (横浜市資源循環局:横浜G30プラン「検証と今後の展開」について) <http://www.city.yokohama.jp/me/pcpb/keikaku/G30rolling/> (accessed February 2009)
85. City of Yokohama Resources & Wastes Circula-tion Bureau (2008) Operation Outline. (横浜市資源循環局「平成20年度事業概要」)<http://www.city.yokohama.jp/me/pcpb/keikaku/jigyo_gaiyou/20gaiyou/> and City of Yokohama Statistics Portal Site <http://www.city.yokohama.jp/me/stat/> (横浜市:統計書Web版「行政区別世帯数及び人口の推移」) <http://www.city.yokohama.jp/me/stat/toukeisho/new/#02> (accessed February 2009)
86. City of Yokohama Resources & Wastes Circula-tion Bureau Website <http://www.city.yokohama.jp/me/pcpb/shisetsu/shigenkai/lca/> (accessed February 2009)
87. City of Yokohama Statistics Portal Site <http://www.city.yokohama.jp/me/stat/> (横浜市:統計書Web版「処理施設別焼却処理量及び埋立処分量」) (accessed February 2009).
88. City of Yokohama Resources & Wastes Circula-tion Bureau (2006) Yokohama G30 Plan –Verifi cation and Next Steps. (横浜市資源循環局:横浜G30プラン「検証と今後の展開」について) <http://www.city.yokohama.jp/me/pcpb/keikaku/G30rolling/> (accessed February 2009)
89. City of Yokohama Resources & Wastes Circula-tion Bureau (2006) Yokohama G30 Plan—Verifi cation and Next Steps. (横浜市資源循環局:横浜G30プラン「検証と今後の展開」について) <http://www.city.yokohama.jp/me/pcpb/
ECo2-Endnotes_PREP 331 6/15/09 9:06:07 AM
332 | ECO2 CITIES: ECOLOGICAL CITIES AS ECONOMIC CITIES
keikaku/G30rolling/> (accessed February 2009)
90. City of Yokohama Resources & Wastes Circula-tion Bureau (2008) Operation Outline. (横浜市資源循環局「平成20年度事業概要」)<http://www.city.yokohama.jp/me/pcpb/keikaku/jigyo_gaiyou/20gaiyou/> (accessed February 2009)
91. City of Yokohama Resources & Wastes Circula-tion Bureau (2008) Operation Outline. (横浜市資源循環局「平成20年度事業概要」)<http://www.city.yokohama.jp/me/pcpb/keikaku/jigyo_gaiyou/20gaiyou/> (accessed February 2009)
92. City of Yokohama Resources & Wastes Circula-tion Bureau (2008) Operation Outline. (横浜市資源循環局「平成20年度事業概要」) <http://www.city.yokohama.jp/me/pcpb/keikaku/jigyo_gaiyou/20gaiyou/> and Budget Outline (横浜市資源循環局「平成20年度予算概要」) <http://www.city.yokohama.jp/me/pcpb/keikaku/yosan/20yosan.pdf> (accessed February 2009).
93. City of Yokohama Resources & Wastes Circula-tion Bureau (2006) Yokohama G30 Plan –Verifi cation and Next Steps. (横浜市資源循環局:横浜G30プラン「検証と今後の展開」について) <http://www.city.yokohama.jp/me/pcpb/keikaku/G30rolling/> (accessed February 2009)
94. City of Yokohama, Climate Change Policy Head-quarters (2008) Co-Do-30 Leafl et in English. <http://www.city.yokohama.jp/me/kankyou/ondan/plan/codo30/leaf_english.pdf>
95. Seven major approaches are: (i) Living: to change the society with anti-climate-change actions at individual level, (ii) Business: to change the society with anti-climate-change business styles, (iii) Building: to plan and develop a city with energy-e[ ciency building construction
, (iv) Transportation: to promote
city planning and development to create an attractive city where people can travel on foot, by bicycle or by public transportation, and to promote anti-climate-change measures on auto-mobiles, (v) Energy: to increase recyclable energy ten-fold, (vi) City and Green: to plan and develop a green city through urban heat island measures etc., and (vii) City hall: to develop an anti-climate-change city hall.
96. Australian Bureau of Statistics, “Regional Population Growth, Australia, 2006–07,” released on March 31, 2008
97. Australian Bureau of Statistics, “Regional Population Growth, Australia, 2006–07,” released on March 31, 2008
98. Our Shared Vision: Living in Brisbane 2026, p. 40
99. Our Shared Vision: Living in Brisbane 2026, p. 2. The state of Queensland will have to accommo-date one million new residents over the next two decades, 25 percent of whom will arrive in Brisbane.
100. Brisbane City Council, Brisbane: Long Term Infrastructure Plan (Brisbane City Council, 2007), p. 41. The state of Queensland has experienced a 53 percent increase in electric-ity consumption and an 8 percent annual increase in peak load growth.
101. Brisbane City Council, Brisbane: Long Term Infrastructure Plan (Brisbane City Council, 2007), p. 41
102. Brisbane City Council, Climate Change and Energy Taskforce Report: A Call for Action (March 12, 2007), pp. 16–28
103. Brisbane City Council, CitySmart http://www.brisbane.qld.gov.au/BCC:CITY_SMART:1042909255:pc=PC_2645
104. Tony Dingle, “‘Gloria Soame’: The Spread of Suburbia in Post-War Australia,” in Richard Harris and Peter J. Larkheim, eds., Changing Suburbs: Foundation, Form and Function (Routledge, 1999), p. 189
105. Peter Newman, “Transport: Reducing Automo-bile Dependence,” in David Satterthwaite, ed., The Earthscan Reader in Sustainable Cities (Earthscan Publications Ltd., 1999), p. 192
106. Urban Renewal Brisbane, http://www.brisbane.qld.gov.au/BCC:BASE:306686453:pc=PC_1745#TOD
107. Brisbane City Council, Climate Change and Energy Taskforce Report, p. 24
108. Brisbane City Council, Urban Renewal Brisbane http://www.brisbane.qld.gov.au/BCC:BASE::pc=PC_1726
109. Brisbane City Council, Know Your Kreek- Mog-gill Creek http://www.brisbane.qld.gov.au/BCC:BASE::pc=PC_3127
110. Queensland Transport (2008) South East Busway—Plannign to Springwood Project Guide.
111. Currie G (2006) “BRT in Australasia: Perfor-mance, Lessons Learned and Futures” Journal of Public Transportation Volume 9, No. 3, 2006 Special Edition: Bus Rapid Transit < http://www.nctr.usf.edu/jpt/pdf/JPT%209-3S%20Currie.pdf >
112. Case Study description extracted from: ‘Wicked’, ‘messy’ and ‘clumsy’: Long-term Frameworks for Sustainability, Bob Frame, Sustainability and Society, Manaaki Whenua - Landcare Research, New Zealand
ECo2-Endnotes_PREP 332 6/15/09 9:06:07 AM
ENDNOTES | 333
113. The NZ Government is in the process of restructuring Auckland’s local government and will replace the existing 7 local councils and one regional council with one super council and 20–30 local community boards.
114. World Energy Outlook 2008, International Energy Agency (IEA). This paper adopts IEA’s defi nition of cities as a general and interchange-able reference for urban areas, which may be large metropolitan city-regions, such as New York City, or small urban settlements that have only a few thousand people. The exact defi ni-tion of urban areas varies by country.
115. www.nyc.gov/planyc and http://www.paris.fr/portail/Environnement/Portal.lut?page_id=8412
116. For example, grid-based electricity supply and prices are generally regulated by regional or national governments.
117. USAID Energy Update, Issue 2, April/May 2005.
118. C40 Cities, Lighting Best Practices (http://www.c40cities.org/bestpractices/lighting/vaxjo_streetlight.jsp).
119. Cost of Pollution in China, 2007, the World Bank.
120. In general, building energy codes are regulated at regional (province or state) or national levels depending on the country. But compliance is completely dependent on local and city-level enforcement.
121. Refer to California Green Building Standards Code, State of California, USA, 2008
122. Energy e[ ciency-enhanced alternatives are often more expensive upfront, requiring higher capital investment. But the lifecycle costs of more energy-e[ cient alternatives are generally lower than those of business-as-usual practices because of lowered recurring cost such as energy bills.
123. Electric lighting is a good example. On average, about 70 percent of the energy content of coal is already lost (through conversion, transmission and distribution) by the time electricity reaches a light bulb. A compact fl uorescent lamp can deliver the same amount of lighting service (i.e., brightness per square meter) using about 20 percent of the electricity of an incandescent lamp.
124. Passive houses using ultra low energy for space cooling and heating are already demonstrated in Europe and the United States. http://www.nytimes.com/2008/12/27/world/europe/27house.html?ref=world&pagewanted=all
125. (IEA, 2008)
126. (IEA, 2008)
127. International Local Government GHG Emis-sions Analysis Protocol, http://www.iclei.org
128. There are also distributed energy resources (DER) in urban areas. They are parallel and stand-alone electric generation units located within the electric distribution system at or near the end user, for example a micro gas turbine system, a wind turbine system, a fuel cell, or a rooftop photovoltaic system. Distrib-uted generation can be benefi cial to both electricity consumers and, if the properly integrated, the electric utility.
129. (PLANYC 2030)
130. C40 Cities, Buildings Best Practices (http://www.c40cities.org/bestpractices/buildings/melbourne_eco.jsp).
131. Market barriers to energy e[ ciency invest-ments refer to factors, usually social and institutional, that prevent the realization of the full economic potential of energy e[ ciency opportunities. They are o] ered to explain the di] erence between observed actual energy e[ ciency choices and decisions, and those predicted by economic theory. Some common market barriers include misplaced incentives, lack of access to fi nancing, high transaction costs, regulatory distortion on pricing, and lack of information or misinformation.
132. (Lantsberg, 2005)
133. Sources: Ringel 2007, Bharvirkar et al. 2008, BEG 2006, McGrory et al. 2006, Borg et al. 2003, Harris et al. 2005, Meyer and Johnson 2008, PROST 2003.
134. District heating systems are the only modern urban energy infrastructure which is entirely city-bound. The ownership structure has under-gone signifi cant changes. But city governments still have large infl uence on the development and management of district heating systems.
135. LEED—Leadership in Energy and Environmen-tal Design—is a green building rating system, developed by the U.S. Green Building Council. It provides a suite of criteria for environmentally sustainable construction. The main fi nancial benefi ts of meeting LEED criteria include lower costs of energy, water, and waste disposal.
136. (Kats, 2003)
137. (Lantsberg, 2005)
138. See the Alliance to Save Energy’s 2007 Watergy Handbook for a discussion on the barriers and opportunities for tapping water and energy e[ ciency in water utilities: http://www.watergy.net/resources/publications/watergy.pdf.
ECo2-Endnotes_PREP 333 6/15/09 9:06:07 AM
334 | ECO2 CITIES: ECOLOGICAL CITIES AS ECONOMIC CITIES
139. ESMAP (forthcoming). “Public Procurement of Energy E[ ciency Services.” 2009
140. No Furnaces but Heat Aplenty in ‘Passive Houses’, New York Times, December 26, 2008
141. It is good practice and the policy of World Bank-fi nanced projects to require ex-ante identifi cation of PDOs and continuous monitor-ing of M&E indicators with respect to future targets in a “results framework.”
142. World Bank (2008). “A Framework for Urban Transport Projects.” Operational Guidance,TP-15.
143. Ibid.
144. Discussions related to public transport, micro-design and macro-level approaches are based on presentations at the World Bank 2008 Urban Rail Workshop in Beijing (publication forthcoming) and discussions with World Bank experts Sam Zimmerman and Shomik Mehndiratta.
145. Zegras, C., Y. Chen and J. Grutter (2009). “Potentials and Challenges for Using Clean Development Mechanism for Transport-E[ -cient Development: A Case Study of Nanchang, China.” TRB Annual Meeting.
146. A more comprehensive review is available in World Bank publications, including “Vehicular Air Pollution: Setting Priorities” (2001). A review of economic instruments such as fuel taxes and e[ ciency incentives can be found in “Fiscal policy instruments for reducing congestion and atmospheric emissions in the transport sector” (2008).
147. For more detailed information, the reader is referred to the World Bank’s guidance available on its web site. Notes on Economic Evaluation of Transport Projects: (TRN-5) provides the context within which we use economic evaluation in the transport sector, (TRN-6 to TRN—10) provide criteria for selection a particular evaluation technique or approach; (TRN-11 to TRN-17) address the selection of values of various inputs to the evaluation, and (TRN-18 to TRN-26) deal with specifi c prob-lematic issues in economic evaluation.
148. http://www.straight.com/article-102902/rats-yes-but-bacteria-love-garbage-strikes-too
149. Pagiola, S. et al. Generating Public Sector Resources to Finance Sustainable Development, Revenue and Incentive E] ects. World Bank Technical Paper No. 538, Environment Series.
150. Peterson, Charles. What Does ‘Waste Reduc-tion’ Mean? http://www.p2pays.org/ref/10/09702.pdf
151. Note: Natural gas is composed of about 99% methane.
152. Downs, Anthony. Still Stuck in Tra[ c, 2004, Brookings Institution Press, Washington DC.
153. CIA World Fact book
154. Lowering real estate transaction costs includes decreasing stamp duties and excessive capital gain taxes.
155. A Tata Nano would require only slightly less space.
ECo2-Endnotes_PREP 334 6/15/09 9:06:07 AM


