Embed Size (px)
Citation preview

2 | A N N U A L R E P O R T
Table Of ContentsMISSION AND VISION STATEMENTS
CORPORATE INFORMATION
BOARD MEMBERS
BOARD COMMITTEES
MANAGEMENT TEAM & SENIOR STAFF
CHAIRMAN’S REPORT
CONSOLIDATED FINANCIAL STATEMENTS
STATISTICAL APPENDIX
3
4
5
6
7
8
22
79

A N N U A L R E P O R T | 3
MISSION STATEMENTTo ensure that every St. Lucian enjoys social and financial protection and to assist in the development of our nation through the efficient collection of contributions, payment of relevant benefits, prudent management of assets, use of cutting edge technology and a cadre of highly skilled staff.
VISION STATEMENTAn effective, transparent and financially sound institution which is customer- focused, provides social protection to the St. Lucian population and plays a leading role in national development.
4 | A N N U A L R E P O R T
HEAD OFFICE
National Insurance CorporationFrancis Compton BuildingWaterfrontCastriesSt. LuciaTel: 452-2808 Fax: 451-9882
SUB OFFICES
National Insurance CorporationAntoine L. Theodore BuildingCnr. of Theodore and Hospital StreetsVieux FortSt. LuciaTel: 454-6758Fax: 454-5001
National Insurance CorporationSir Darnley Alexander BuildingBay StreetSoufriereSt. LuciaTel: 459-7241Fax: 459-5434
National Insurance CorporationProvidence Commercial CentreRodney BayGros IsletSt. LuciaTel: 457-4074/75Fax: 452-0576
CORPORATEINFORMATION
BANKERS
Bank of Saint Lucia Ltd.Bridge Street
CastriesSt. Lucia
AUDITORS
BDO Mercury Court
Choc EstateP.O. Box 364
CastriesSt. Lucia
ATTORNEYS
Mrs. Cadie St. Rose-Albertini LLB, LEC, LLM Ms. Kit-Juelle Frank-Amoroso LLB, LEC, MCI Arb
First FloorFrancis Compton Building
WaterfrontCastriesSt. Lucia

A N N U A L R E P O R T | 5
BOARD MEMBERS
Lisle Chase
(Chairman)
Trevor Louisy
(Deputy Chairman)
Keigan Cox
(Member)
Margaret Monplaisir
(Member)
Matthew Mathurin
(Member)
Michelle Phillips
(Member)
Peter Alexander
(Member)

6 | A N N U A L R E P O R T
BOARD COMMITTEESAUDIT COMMITTEE
Keigan Cox ChairpersonLisle Chase
Peter Alexander
Ryan Devaux HUMAN RESOURCE COMMITTEE
Margaret Monplaisir ChairpersonTrevor Louisy
Michelle Phillips
Matthew Mathurin
GOVERNANCE COMMITTEE
Trevor Louisy ChairpersonLisle Chase
APPEALS COMMITTEE
Lisle Chase ChairpersonTrevor Louisy
Michelle Phillips
Peter Alexander
INVESTMENT COMMITTEE
Dr. Reginald Darius ChairpersonAlvin MalaykhanHuanna LeonMatthew Mathurin

A N N U A L R E P O R T | 7
MANAGEMENT TEAM & SENIOR STAFFMANAGEMENT TEAM
Mr. Matthew Mathurin Mr. Desmond Dujon-Henry Mrs. Cadie St. Rose Albertini Mrs. Paula Bleasdille Mr. Irwin Jean Mr. Aloysius Burke Mr. Augustin Louis Ms. Allison Delmede Mrs. Sue-Ann Charlery-Payne Ms. Callixta Emmanuel Mr. Bernard Jankie Ms. Joan Leon
SENIOR OFFICERS
Mr. Paul Kallicharan Mrs. Theresa Cox Mrs. Elmona Leonce Mrs. Semanthia Wells-Joseph Ms. Merle Regis Mr. Timothy John
Director
Assistant Director (Operations)
Senior Legal Counsel/Corporate Secretary
Chief Accountant
Investment Manager
Systems Manager
Marketing and Corporate Communications Manager
Human Resource Manager
Head of Group Internal Audit
Manager, Compliance and Records Department
Manager, Branch Offices
Manager, Customer Service Department
Statistician
Customer Service Supervisor
Benefits Supervisor
Executive Assistant
Records Supervisor
Chief Security Officer
8 | C H A I R M A N ’ S R E P O R T
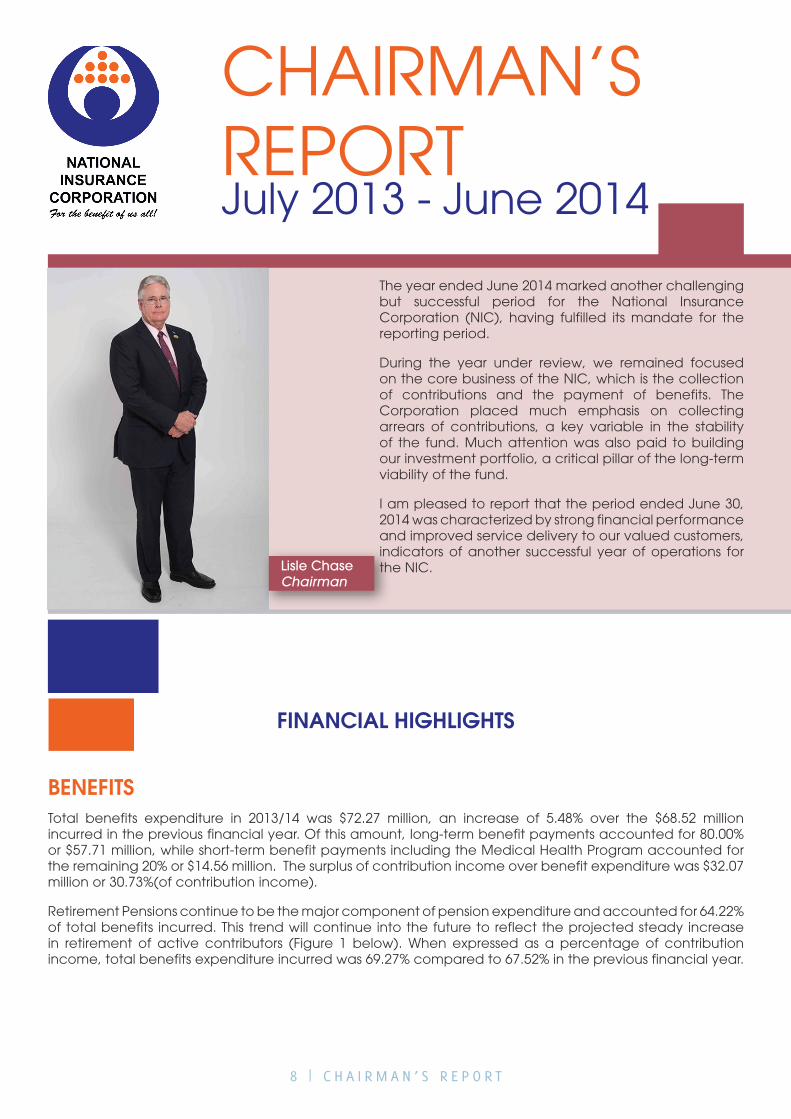
The year ended June 2014 marked another challenging but successful period for the National Insurance Corporation (NIC), having fulfilled its mandate for the reporting period.
During the year under review, we remained focused on the core business of the NIC, which is the collection of contributions and the payment of benefits. The Corporation placed much emphasis on collecting arrears of contributions, a key variable in the stability of the fund. Much attention was also paid to building our investment portfolio, a critical pillar of the long-term viability of the fund.
I am pleased to report that the period ended June 30, 2014 was characterized by strong financial performance and improved service delivery to our valued customers, indicators of another successful year of operations for the NIC.
FINANCIAL HIGHLIGHTS
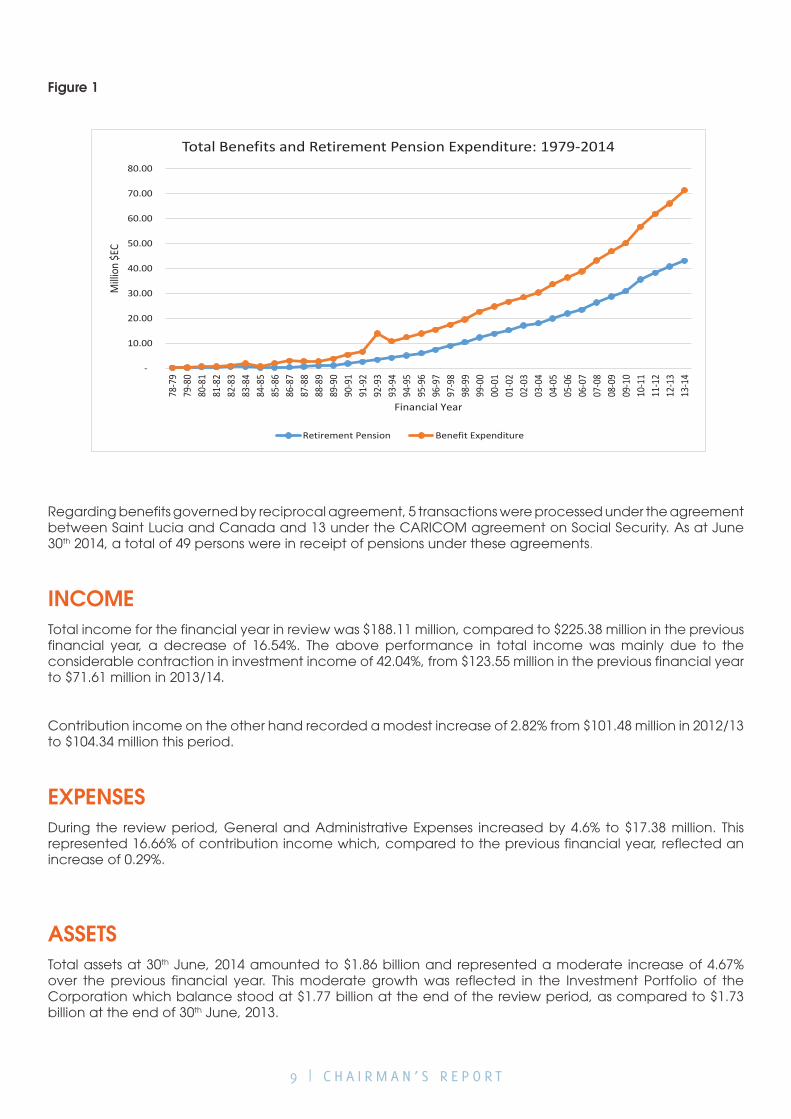
BENEFITSTotal benefits expenditure in 2013/14 was $72.27 million, an increase of 5.48% over the $68.52 million incurred in the previous financial year. Of this amount, long-term benefit payments accounted for 80.00% or $57.71 million, while short-term benefit payments including the Medical Health Program accounted for the remaining 20% or $14.56 million. The surplus of contribution income over benefit expenditure was $32.07 million or 30.73%(of contribution income).
Retirement Pensions continue to be the major component of pension expenditure and accounted for 64.22% of total benefits incurred. This trend will continue into the future to reflect the projected steady increase in retirement of active contributors (Figure 1 below). When expressed as a percentage of contribution income, total benefits expenditure incurred was 69.27% compared to 67.52% in the previous financial year.
CHAIRMAN’S REPORTJuly 2013 - June 2014
Lisle ChaseChairman
9 | C H A I R M A N ’ S R E P O R T
Figure 1
-
10.00
20.00
30.00
40.00
50.00
60.00
70.00
80.0078
-79
79-8
080
-81
81-8
282
-83
83-8
484
-85
85-8
686
-87
87-8
888
-89
89-9
090
-91
91-9
292
-93
93-9
494
-95
95-9
696
-97
97-9
898
-99
99-0
000
-01
01-0
202
-03
03-0
404
-05
05-0
606
-07
07-0
808
-09
09-1
010
-11
11-1
212
-13
13-1
4
Milli
on $E
C
Financial Year
Total Benefits and Retirement Pension Expenditure: 1979-2014
Retirement Pension Benefit Expenditure
Regarding benefits governed by reciprocal agreement, 5 transactions were processed under the agreement between Saint Lucia and Canada and 13 under the CARICOM agreement on Social Security. As at June 30th 2014, a total of 49 persons were in receipt of pensions under these agreements.
INCOMETotal income for the financial year in review was $188.11 million, compared to $225.38 million in the previous financial year, a decrease of 16.54%. The above performance in total income was mainly due to the considerable contraction in investment income of 42.04%, from $123.55 million in the previous financial year to $71.61 million in 2013/14.
Contribution income on the other hand recorded a modest increase of 2.82% from $101.48 million in 2012/13 to $104.34 million this period.
EXPENSESDuring the review period, General and Administrative Expenses increased by 4.6% to $17.38 million. This represented 16.66% of contribution income which, compared to the previous financial year, reflected an increase of 0.29%.
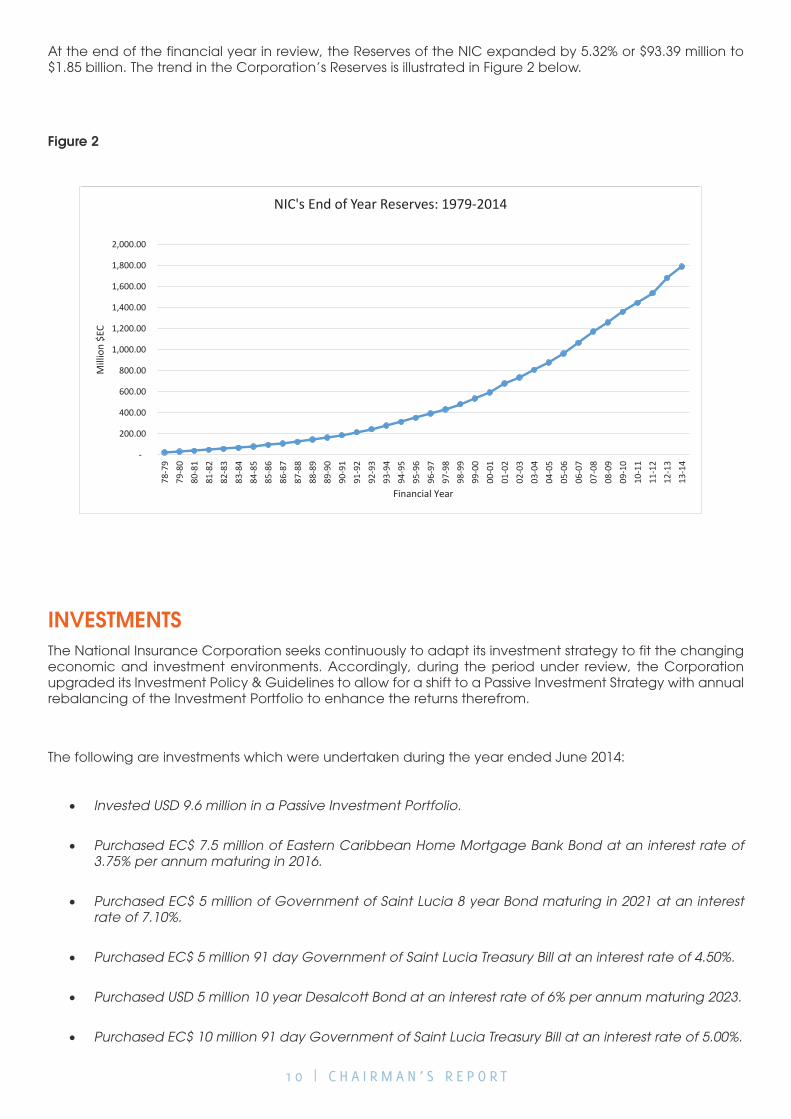
ASSETSTotal assets at 30th June, 2014 amounted to $1.86 billion and represented a moderate increase of 4.67% over the previous financial year. This moderate growth was reflected in the Investment Portfolio of the Corporation which balance stood at $1.77 billion at the end of the review period, as compared to $1.73 billion at the end of 30th June, 2013.
1 0 | C H A I R M A N ’ S R E P O R T
At the end of the financial year in review, the Reserves of the NIC expanded by 5.32% or $93.39 million to $1.85 billion. The trend in the Corporation’s Reserves is illustrated in Figure 2 below.
Figure 2
NIC's End Of Year Reserves: 1979-2014
-
200.00
400.00
600.00
800.00
1,000.00
1,200.00
1,400.00
1,600.00
1,800.00
2,000.00
19791980
19811982
19831984
19851986
19871988
19891990
19911992
19931994
19951996
19971998
19992000
20012002
20032004
20052006
20072008
20092010
20112012
20132014
Financial Year
Millio
n $EC
INVESTMENTSThe National Insurance Corporation seeks continuously to adapt its investment strategy to fit the changing economic and investment environments. Accordingly, during the period under review, the Corporation upgraded its Investment Policy & Guidelines to allow for a shift to a Passive Investment Strategy with annual rebalancing of the Investment Portfolio to enhance the returns therefrom.
The following are investments which were undertaken during the year ended June 2014:
• Invested USD 9.6 million in a Passive Investment Portfolio.
• Purchased EC$ 7.5 million of Eastern Caribbean Home Mortgage Bank Bond at an interest rate of 3.75% per annum maturing in 2016.
• Purchased EC$ 5 million of Government of Saint Lucia 8 year Bond maturing in 2021 at an interest rate of 7.10%.
• Purchased EC$ 5 million 91 day Government of Saint Lucia Treasury Bill at an interest rate of 4.50%.
• Purchased USD 5 million 10 year Desalcott Bond at an interest rate of 6% per annum maturing 2023.
• Purchased EC$ 10 million 91 day Government of Saint Lucia Treasury Bill at an interest rate of 5.00%.
-
200.00
400.00
600.00
800.00
1,000.00
1,200.00
1,400.00
1,600.00
1,800.00
2,000.00
78-7
979
-80
80-8
181
-82
82-8
383
-84
84-8
585
-86
86-8
787
-88
88-8
989
-90
90-9
191
-92
92-9
393
-94
94-9
595
-96
96-9
797
-98
98-9
999
-00
00-0
101
-02
02-0
303
-04
04-0
505
-06
06-0
707
-08
08-0
909
-10
10-1
111
-12
12-1
313
-14
Mill
ion
$EC
Financial Year
NIC's End of Year Reserves: 1979-2014
1 1 | C H A I R M A N ’ S R E P O R T
• Purchased EC$ 10 million 1 year Government of Saint Lucia Treasury Bill at an interest rate of 4.75%.
• Purchased USD 4 million Government of Bermuda Bond at an interest rate of 4.85% per annum maturing 2024.
• Purchased EC$ 10 million of 7.25% Government of Saint Lucia 8 year Bonds maturing in 2021.
• Purchased EC$ 6 million of 7.00% Government of Saint Lucia 6 year bond maturing 2019.
• Purchased EC$ 25 million of Government of Saint Lucia Bond at an interest rate of 7.00% per annum maturing in 2019.
• Purchased EC$ 5 million 91 day Government of Saint Lucia Treasury Bill at an interest rate of 2.99%.
• Purchased EC$ 10 million 91 day Government of Saint Lucia Treasury Bill at an interest rate of 5.00%.
• Purchased EC$ 4 million 1 year Government of Saint Lucia Treasury Bill at an interest rate of 4.75%.
• Purchased USD 5 million of Government of Trinidad & Tobago Bond at an interest rate of 4.375% per annum maturing in 2023.
• Disbursed EC$ 3 million in loan funding to Saint Lucia Mortgage and Finance Corporation.
• Purchased EC$ 10 million of Eastern Caribbean Home Mortgage Bank Bond at an interest rate of 4.25% per annum maturing in 2017.
• Purchased EC$ 5.4 million 180 day Government of Saint Lucia Treasury Bill at an interest rate of 6.00%.
• Purchased EC$ 4.9 million 91 day Government of Saint Lucia Treasury Bill at an interest rate of 4.00%.
• Purchased EC$ 10 million of 7.50% Government of Saint Lucia 10 year bond maturing 2024.
• Purchased EC$ 4.9 million 91 day Government of Saint Lucia Treasury Bill at an interest rate of 4.00%.
• Converted EC$ 10 million Government of Saint Lucia Treasury Bills into a 10 year Government of Saint Lucia bond at an interest rate of 7.5% maturing 2024.
• Purchased EC$ 10 million 91 day Government of Saint Lucia Treasury bill at an interest rate of 5.00%.
1 2 | C H A I R M A N ’ S R E P O R T
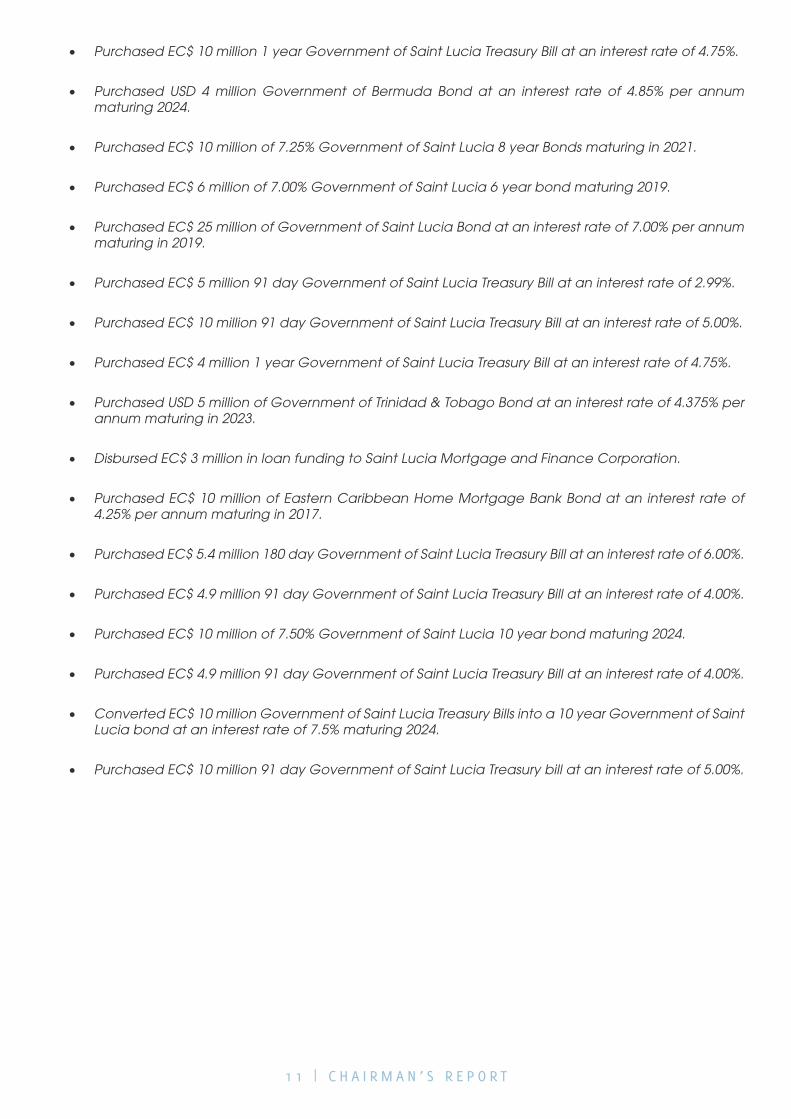
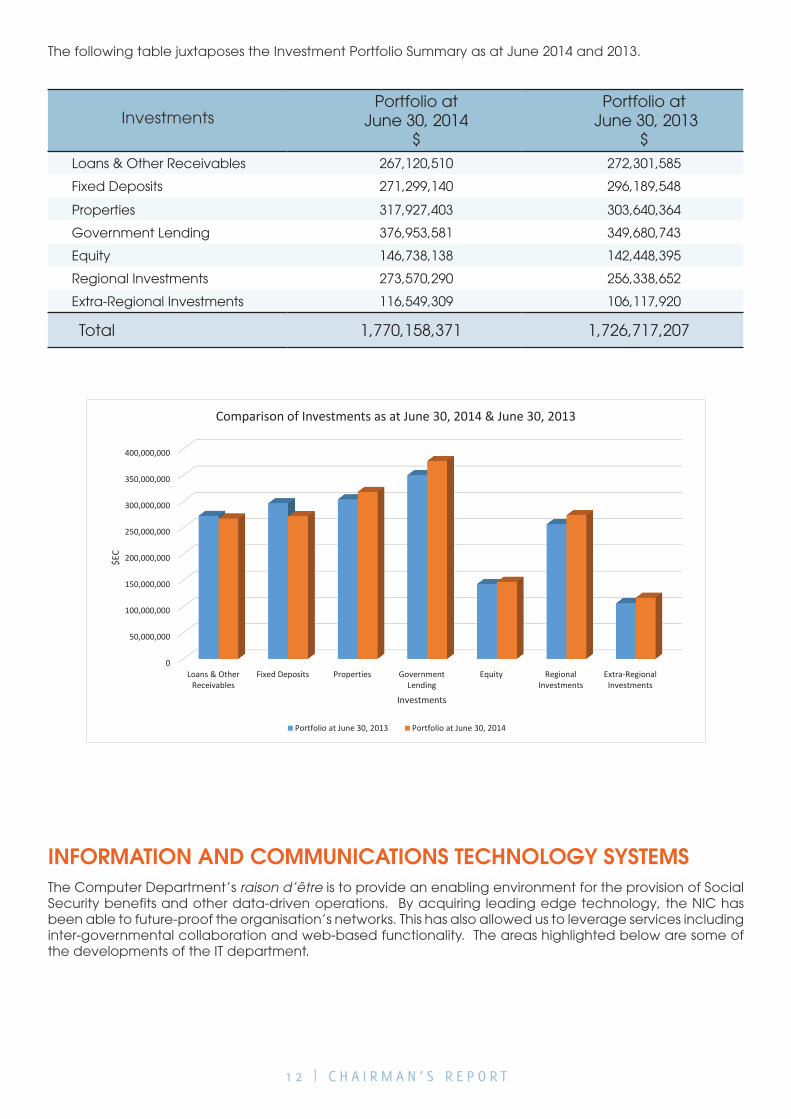
The following table juxtaposes the Investment Portfolio Summary as at June 2014 and 2013.
InvestmentsPortfolio at
June 30, 2014$
Portfolio at June 30, 2013
$Loans & Other Receivables 267,120,510 272,301,585
Fixed Deposits 271,299,140 296,189,548
Properties 317,927,403 303,640,364
Government Lending 376,953,581 349,680,743
Equity 146,738,138 142,448,395
Regional Investments 273,570,290 256,338,652
Extra-Regional Investments 116,549,309 106,117,920
Total 1,770,158,371 1,726,717,207
INFORMATION AND COMMUNICATIONS TECHNOLOGY SYSTEMS The Computer Department’s raison d’être is to provide an enabling environment for the provision of Social Security benefits and other data-driven operations. By acquiring leading edge technology, the NIC has been able to future-proof the organisation’s networks. This has also allowed us to leverage services including inter-governmental collaboration and web-based functionality. The areas highlighted below are some of the developments of the IT department.
0
50,000,000
100,000,000
150,000,000
200,000,000
250,000,000
300,000,000
350,000,000
400,000,000
Loans & OtherReceivables
Fixed Deposits Properties GovernmentLending
Equity RegionalInvestments
Extra-RegionalInvestments
$EC
Investments
Comparison of Investments as at June 30, 2014 & June 30, 2013
Portfolio at June 30, 2013 Portfolio at June 30, 2014
1 3 | C H A I R M A N ’ S R E P O R T
Web Services
We are in Beta testing phase of our C3 Online contribution system, and currently collaborating with the Government to simplify the submission process. After successful completion of testing, the systems will be introduced to the public as the medium for submitting contributions to the NIC via the Web. This system will allow employers throughout the country to submit contributions on behalf of their employees to the NIC from the comfort of their offices.
Network Expansion
As a means of future-proofing our network, we have upgraded our network plant at the main offices from CAT4 to CAT6 cables, increasing our bandwidth capacity up to 10 GBits. This allows us to support any future applications or technology with minimal disruption to the architecture.
Documentation
We have completed the documentation of NIC core Social Security System. This allows the organisation to increase retention and transfer of institutional knowledge.
Security
In addition to Intrusion Protection System (IDS/IPS), monitoring the entire network has been enhanced, and alerts are sent when important services such as servers and printers are not functional. Additionally, we monitor rejected emails against received emails, to analyse the rate of spammed email from external sources. This includes social network sites and illegal sites.
IT Audit
The audit of our Information Technology System was undertaken and completed during the period. The reviews addressed personnel, security, application quality, system development life cycle, project management and internal controls.
Software Maintenance and Expansion
The IT Department software development team continues to engage departments to develop software solutions for efficiency enhancements. An Asset Tracking System has been developed for the Accounts Department and is in the process of implementation.

1 4 | C H A I R M A N ’ S R E P O R T
HUMAN RESOURCE
Training & Development
Cognizant of the critical role our employees play in the success of the Corporation, and to ensure that our employees are equipped with the necessary skills, significant attention was devoted to the area of training and development. To this end, employees received customized training in: Supervising for Quality, ACL Training, Productivity in Focus, Customer Service and Stress Management. Managers, Supervisors and employees received training on the performance review instrument to provide a common understanding of the tool, and to ensure that all employees are assessed in a standard manner.
Occupational Health & Safety
The safety & health of employees is of paramount importance to the Corporation. To that end, and in keeping with the requirements of the Labour Act, the NIC established a Health and Safety Committee which proceeded to develop its work plan to guide its activities. Notable, was the undertaking of the NIC’s bi-annual Diabetes and Hypertension screening program.
The Corporation also commenced the formulation of its Occupational Health and Safety Policy during the period.
Scholarships
Two, five-year scholarships were awarded to the children of staff members to support their education at secondary school level, consistent with the Corporation’s efforts at keeping our staff motivated.
Other
The Corporation continued to assist secondary and tertiary institutions by providing students with the opportunity to gain work experience as well as exposure to positive work ethics.
CORPORATE COMMUNICATIONS
Communication with stakeholders is an essential part of the work programme of the NIC. The emphasis of the Corporation’s public relations efforts focused on the provision of information to advise the public of its rights and obligations, and enforce compliance with the provisions of the National Insurance Act and Regulations.
This manifested itself in inter alia: various outreach programmes involving government ministries, schools, pensioners, self-employed, and business houses.

1 5 | C H A I R M A N ’ S R E P O R T
SUBSIDIARIES
The following profiles the Corporation and its subsidiaries at 30 June, 2014.
Company % Holding by NIC Business
Date Incorporated
Total Assets
$
Net Assets / (Liabilities)
$
NIC - Provision of Social Security services.
April 1979 1,823,246,952 1,813,499,091
NIPRO 100 Provides property development, management, and maintenance services.
April 1999 26,615,968 8,338,814
SMFC 75 Providing loans for the purchase, construction, extension or completion of dwelling houses and the purchase of developed plots.
January 1968 40,869,828 9,441,496
BCL 100 Rental of space for office and commercial use. Proprietor of Blue Coral Mall Building.
April 2003 18,184,226 (19,201,247)
CCFL 100 Provision of car parking facilities and rental of space for office and commercial use.
January 1998 27,652,777 16,477,481
1 6 | C H A I R M A N ’ S R E P O R T
SAINT LUCIA MORTGAGE FINANCE COMPANY LIMITED (SMFC)
July 2013 to June 30, 2014
The Company continued to provide residential mortgages in accordance with the terms of its Operating Agreement with the Government of Saint Lucia.
The Financial year ended June 30, 2014 was yet another challenging year for the Company. The Banking sector continues to be highly competitive as commercial banks aggressively pursue residential mortgages.
Over the twelve month period, SMFC disbursed the sum of $3,784,939 (2013 - $3,692,351) bringing cumulative disbursements from inception to $174,993,956. Mortgage Assets (net of loss provisions) decreased by 1.03%. There was a marginal reduction in mortgage assets mainly due to an increase in the provision for loan impairment leading to net profits of $348,158 i.e. $54,721 (13.58%) less than the previous year.
SMFC withdrew $2,600,000 in new loans but repaid $3,065,000 of its existing debt to the NIC bringing the total indebtedness at June 30, 2014 to $30,377,500 (2013 - $30,842,500); a dividend of 5% of issued shares (2013 – 5%) was declared and paid to Shareholders.
NATIONAL INSURANCE PROPERTY DEVELOPMENT &
MANAGEMENT COMPANY LIMITED (NIPRO)
INTRODUCTION
Net loss for the Company for the period ending June 30, 2014 was $83,946. This represents a significant decrease from the previous year when the net income was $404,009.
This decline was due primarily to the following:
1. The slow rate of implementation of capital projects, which represents the main profit centre for the Company.
2. Lower than projected expenditure by one of our two principal clients on the repair and other capital improvements of the BOLT facilities.

1 7 | C H A I R M A N ’ S R E P O R T
Operations Review
The Company continued to seek opportunities to generate net additional revenue by utilizing its human resources more effectively. This met with limited success. A need was recognized then for greater investment in capacity building and retooling.
During the year, the Company continued with the review of systems, processes and procedures that was started in the previous year. In the medium term, this should result in improvements in the planning, control and monitoring of the business of the Company.
With the assistance of the Internal Audit Department of the National Insurance Corporation and the Accounting firm BDO, several initiatives to examine and correct deficiencies in the systems were undertaken.
Additionally, the computer-based facilities maintenance system was upgraded and the users were trained in order to optimize the use of the software and increase productivity of the maintenance technicians.
In an attempt to decrease the time between conceptualization and commencement of construction of new BOLT facilities, there has been greater emphasis placed on collaboration and communication between NIPRO and the Government of Saint Lucia.
Financial Review
For the period under review, NIPRO recorded a net loss of just under eighty four thousand dollars ($83,946). This is a dramatic reduction in performance when compared to the period 2012/2013 when recorded net income was four hundred and four thousand and nine dollars ($404,009)
Total operating income (excluding interest income) for the year was $4,140,662 compared to $5,110,359 in the previous year.
Total expenses of $4,471,159, inclusive of interest payments, decreased from $4,754,948 in 2012/2013.
Total assets at June 30, 2014 were $26.61 million, a decrease from $27.23 million at June 30, 2013.
The cash and cash equivalents held by the Company at the end of the financial year were significantly more than it held at June 30, 2013, although total current assets were less by approximately $2.03 million at June 30, 2014.
During the financial year, NIPRO was engaged in thirteen capital projects and at June 30, 2014, several of these projects were at an advanced stage of completion. Most of these projects were being undertaken and managed on behalf of the National Insurance Corporation.
The most capital intensive project, the construction of the Babonneau Police Station, under a BOLT arrangement with the Government of Saint Lucia, was completed in June 2014.
Management Services
NIPRO continues to manage, maintain as well as provide accounting services to the Castries Car Park Facility.
1 8 | C H A I R M A N ’ S R E P O R T
Property Maintenance
NIPRO is responsible for the maintenance of all NIC-owned facilities and BOLT projects undertaken on behalf of the Government of Saint Lucia and, in the main, executed the planned preventative maintenance and repair of facilities during the period under review.
CASTRIES CAR PARK FACILITY LIMITED (CCFL)
Strategic Focus
The focus continues to be on reversing the decline in car parking revenue and ensuring that tenants of the office spaces are retained by continuing to keep the facilities well-maintained. Additionally, attention continues to be paid to preserving the integrity of the revenue collection and accounting processes at the car park.
Financial performance for the year ended June 30, 2014
Total revenue for the period ending June 2014 was $3,115,261, which represented a slight decline when compared to $3,134,331 recorded for the year ending June 2013.
Revenue from rental income increased marginally from $2,635,205 to $2,674,513. However, revenue from parking fees showed a 12% decline from $499,126 to $440,748 over the same period. This is despite an increase in clients on monthly plans.
Total general and administrative expenses increased from $1,267,980 to $1,554,100 (23%) while interest expenses incurred for the period were reduced marginally to $952,098. This increase in administrative cost was due primarily to significantly increased payments of property taxes from $113,940 in 2013 to $552,637 in 2014, as a result of which net Income for the period under review decreased by 35% from $904,942 in the previous year to $587,409.
There was a slight improvement in financial position at the end of June 30, 2014 with total assets of $27,652,777 compared to $27,030,263 at June 30, 2013.
The Company’s liquidity improved over the June 30, 2013 position, with current assets increasing to $944,147 as compared to $380,255, with cash and cash equivalents amounting to 60% of current assets.
Overall, performance declined during the year, but the Company was able to meet all of its short-term obligations during the period.
1 9 | C H A I R M A N ’ S R E P O R T
BLUE CORAL LIMITED (BCL)
Blue Coral Limited registered a profit for the first time since it began its operations. This was as a result of the restructuring plan that was implemented to enable the Company to address its debts. During the period under review, the parent company had purchased all outstanding minority interest in the Company.
There was a slight decrease in rental income in 2014. However, the two biggest expense heads - utilities and repairs and maintenance - decreased as well, by 5% and 12% respectively.
Though there was no change in the methodology used to assess the value of the investment property, there was a significant decrease in 2014 with a reduction of $2,960,912 in the fair value of the investment property from its previous fair value of $20,696,001 in 2013.
The Company’s total liabilities and shareholders’ deficiency at the end of the review period amounted to $18,184,226.
AFFILIATE
NATIONAL COMMUNITY FOUNDATION
The National Community Foundation (NCF) is a philanthropic, nonprofit, community-based, non-governmental organization that functions primarily as a grant-making institution. The NCF was established in August 2002 and supports initiatives that engender self-development and social upliftment.
Areas of Focus
The National Community Foundation focuses its attention in six main areas. The amounts spent on each focus areas are:
1. Youth at Risk - $12,270 (3 projects) including grooming project, purchase of sports gear.
2. Elderly Persons - $28,475 (feeding programme).
3. Disadvantaged Children (scholarship programme) – $254,229.
4. Health Care - $239,013.
5. Homeless- $4397 (5 families benefited) - Help for fire victims and one landslide victim.
6. Persons with Disabilities - $19,940 (5 projects) including Beehive project, transportation programme, craft skills projects.
Over 1,169 people benefited from NCF’s activities and projects this year.
2 0 | C H A I R M A N ’ S R E P O R T
Telethon
The NCF raised $151,720 during the period 1st July, 2013 – 30th June, 2014. These funds, in addition to other donations, are used to finance philanthropic activities.
APPRECIATION
The Corporation has continued to play its supporting role in the social fabric of our nation, and to meet its mandate to its main constituents, its contributors. We commend those employers whose ongoing fulfilment of their responsibilities under the National Insurance Corporation Act makes it easier to ensure the long-term sustainability of the National Insurance System. I also express sincere thanks to all our other valued customers who continue to provide the impetus in our quest for even higher levels of service excellence.
I wish to place on record our gratitude to the Government of Saint Lucia, and the Prime Minister as Minister responsible for Social Security for the continued support of the work of the Corporation.
To the Board I say thank-you for your input and the spirit of collaboration that has facilitated the process of decision-making in the discharge of our responsibilities as trustees of the funds of the Corporation.
On behalf of the Board of Directors, I thank the Director and his management team for another outstanding year. I thank the staff for their dedication and service to the people of Saint Lucia. Without this, the NIC would not have registered such admirable performance during the financial year.
Lisle ChaseChairman
2 1 | C H A I R M A N ’ S R E P O R T
NATIONAL INSURANCE CORPORATIONConsolidated Financial Statements
June 30, 2014(expressed in Eastern Caribbean dollars)
2 2 | C O N S O L I D A T E D F I N A N C I A L S T A T E M E N T S
National Insurance Corporation Consolidated Financial Statements Year Ended June 30, 2014 (Expressed in Eastern Caribbean Dollars)
2 3 | C O N S O L I D A T E D F I N A N C I A L S T A T E M E N T S
National Insurance Corporation
Corporate Information
BANKER Bank of Saint Lucia Limited AUDITORS BDO Chartered Accountants
REGISTERED OFFICE Francis Compton Building John Compton Highway Castries St. Lucia DIRECTORS Mr. Lisle Chase (Chairman)Mr. Trevor Louisy (Deputy Chairman) Mr. Keigan CoxMrs. Margaret MonplaisirMr. Matthew MathurinMrs. Michelle Phillips Mr. Peter Alexander
SOLICITORS Mrs. Cadie St. Rose-Albertini, LLB, LEC, LCMMs. Kit-Juelle Frank-Amoroso, LLB, LEC, MCI Arb
Contents
Page 24 Corporate Information Page 25 Independent Auditors‟ Report Page 26 Consolidated Statement of Financial Position Page 27 Consolidated Statement of Changes in Reserves Page 28 Consolidated Statement of Comprehensive Income Page 29 Consolidated Statement of Cash Flows Page 30 – 78 Notes to the Consolidated Financial Statements
2 4 | C O N S O L I D A T E D F I N A N C I A L S T A T E M E N T S
National Insurance Corporation
Corporate Information
BANKER Bank of Saint Lucia Limited AUDITORS BDO Chartered Accountants
REGISTERED OFFICE Francis Compton Building John Compton Highway Castries St. Lucia DIRECTORS Mr. Lisle Chase (Chairman)Mr. Trevor Louisy (Deputy Chairman) Mr. Keigan CoxMrs. Margaret MonplaisirMr. Matthew MathurinMrs. Michelle Phillips Mr. Peter Alexander
SOLICITORS Mrs. Cadie St. Rose-Albertini, LLB, LEC, LCMMs. Kit-Juelle Frank-Amoroso, LLB, LEC, MCI Arb
2 5 | C O N S O L I D A T E D F I N A N C I A L S T A T E M E N T S
Tel: 758-452-2500 Fax: 758-452-7317 www.bdo.lc
Mercury Court Choc Estate P.O. Box 364 Castries St. Lucia
BDO Eastern Caribbean, a partnership registered in St. Lucia and St. Vincent and the Grenadines, is a member of BDO International Limited, a UK company limited by guarantee, and forms part of the international BDO network of independent member firms.
2
INDEPENDENT AUDITORS’ REPORT To the Board of Directors of National Insurance Corporation Report on the Financial Statements
Management is responsible for the preparation and fair presentation of these financial statements in accordance with International Financial Reporting Standards. This responsibility includes: designing, implementing and maintaining internal controls relevant to the preparation and fair presentation of financial statements that are free from material misstatements, whether due to fraud or error; selecting and applying appropriate accounting policies; and making accounting estimates that are reasonable in the circumstances. Auditors’ Responsibility
Our responsibility is to express an opinion on these consolidated financial statements based on our audit. We conducted our audit in accordance with International Standards on Auditing. Those standards require that we comply with ethical requirements and plan and perform the audit to obtain reasonable assurance whether the financial statements are free from material misstatement. An audit involves performing procedures to obtain audit evidence about the amounts and disclosures in the consolidated financial statements. The procedures selected depend on the auditors’ judgement, including the assessment of the risks of material misstatement of the financial statements, whether due to fraud or error. In making those risk assessments, the auditors consider internal controls relevant to the entity’s preparation and fair presentation of the financial statements in order to design audit procedures that are appropriate in the circumstances, but not for the purpose of an opinion on the effectiveness of the entity’s internal controls. An audit also includes evaluating the appropriateness of accounting policies used and the reasonableness of accounting estimates made by management, as well as evaluating the overall presentation of the financial statements. We believe that the audit evidence we have obtained is sufficient and appropriate to provide a basis for our audit opinion. Opinion
We have audited the accompanying consolidated financial statements of National Insurance Corporation, which comprise the consolidated statement of financial position as at June 30, 2014, and the consolidated statements of changes in reserves, comprehensive income and cash flows for the year then ended, and a summary of significant accounting policies and other explanatory notes. Management’s Responsibility for the Financial Statements
In our opinion, the consolidated financial statements present fairly, in all material respects, the financial position of National Insurance Corporation as at June 30, 2014, and the results of its financial performance and cash flows for the year then ended in accordance with International Financial Reporting Standards. August 6, 2015

2 6 | C O N S O L I D A T E D F I N A N C I A L S T A T E M E N T S
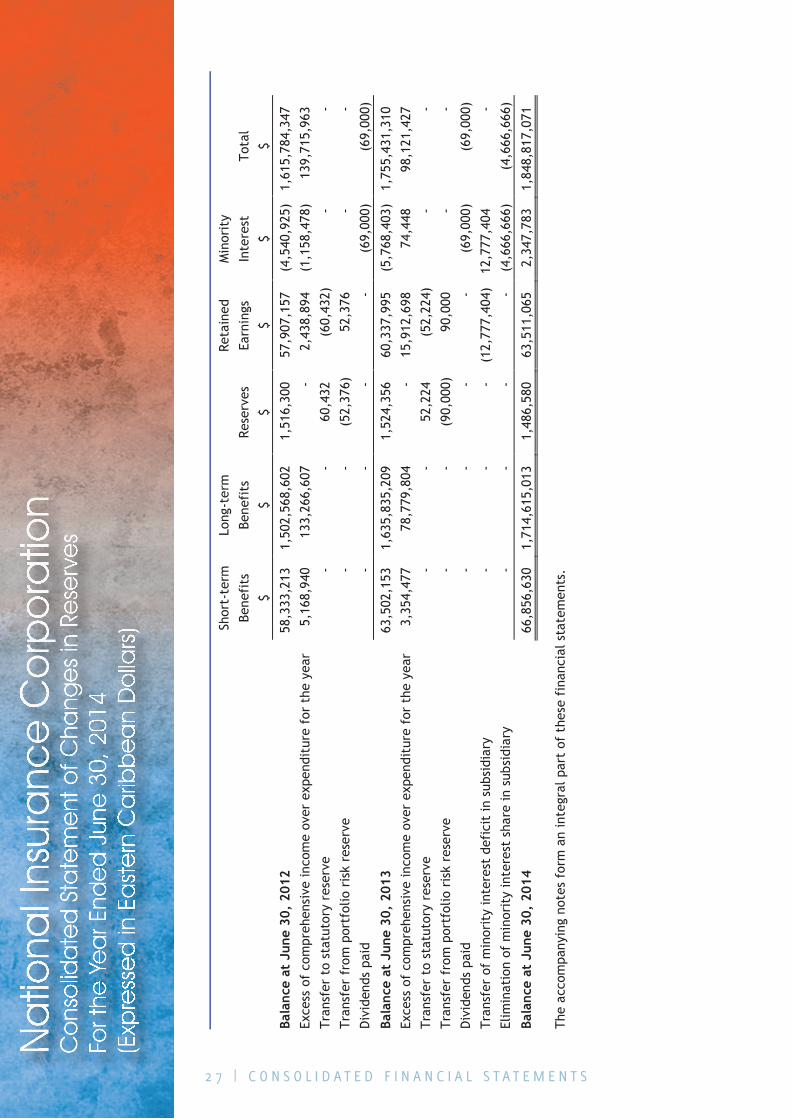
National Insurance CorporationConsolidated Statement of Financial Position For the Year Ended June 30, 2014(Expressed in Eastern Caribbean Dollars)
2014 2013
Notes $ $
Assets
Cash and cash equivalents 6 88,331,391 45,252,506 Financial assets 7 1,452,230,968 1,423,076,843 Investment properties 10 317,927,403 303,640,364 Property, plant and equipment 11 4,501,903 4,716,260 Projects in progress
190,049 3,430,102
Inventory
22,868 21,997 Income tax recoverable
25,560 -
TOTAL ASSETS
1,863,230,142 1,780,138,072
Liabilities
Trade and other accounts payable 12 14,404,659 12,012,577 Borrowings 13 - 12,591,133 Income tax liability
- 90,095
Deferred tax liability
8,412 12,957
14,413,071 24,706,762
63,511,065 60,337,995
1,846,469,288 1,761,199,713
Minority interest in reserves
2,347,783 (5,768,403)
1,848,817,071 1,755,431,310
TOTAL LIABILITIES AND RESERVES
1,863,230,142 1,780,138,072 The accompanying notes form an integral part of these financial statements.
APPROVED ON BEHALF OF THE BOARD:-
Chairman Director
Reserves
Short-term benefits 16 66,856,630 63,502,153 Long-term benefits 16 1,714,615,013 1,635,835,209 Reserves 15 1,486,580 1,524,356
Retained earnings
2 7 | C O N S O L I D A T E D F I N A N C I A L S T A T E M E N T S
Na
tiona
l Ins
ura
nce
Co
rpo
ratio
nC
ons
olid
ate
d S
tate
me
nt o
f Cha
nge
s in
Re
serv
es
For t
he Y
ea
r End
ed
Jun
e 3
0, 2
014
(Exp
ress
ed
in E
ast
ern
Ca
ribb
ea
n D
olla
rs) Sh
ort-
term
Lo
ng-t
erm
Reta
ined
M
inor
ity
Bene
fits
Be
nefi
ts
Rese
rves
Ea
rnin
gs
Inte
rest
To
tal
$
$ $
$ $
$
Bala
nce
at J
une
30,
2012
58
,333
,213
1,
502,
568,
602
1,51
6,30
0 57
,907
,157
(4
,540
,925
) 1,
615,
784,
347
Exce
ss o
f co
mpr
ehen
sive
inco
me
over
exp
endi
ture
for
the
yea
r 5,
168,
940
133,
266,
607
- 2,
438,
894
(1,1
58,4
78)
139,
715,
963
Tran
sfer
to
stat
utor
y re
serv
e -
- 60
,432
(6
0,43
2)
- -
Tran
sfer
fro
m p
ortf
olio
ris
k re
serv
e -
- (5
2,37
6)
52,3
76
- -
Div
iden
ds p
aid
- -
- -
(69,
000)
(6
9,00
0)
Bala
nce
at J
une
30,
2013
63
,502
,153
1,
635,
835,
209
1,52
4,35
6 60
,337
,995
(5
,768
,403
) 1,
755,
431,
310
Exce
ss o
f co
mpr
ehen
sive
inco
me
over
exp
endi
ture
for
the
yea
r 3,
354,
477
78,7
79,8
04
- 15
,912
,698
74
,448
98
,121
,427
Tr
ansf
er t
o st
atut
ory
rese
rve
- -
52,2
24
(52,
224)
-
- Tr
ansf
er f
rom
por
tfol
io r
isk
rese
rve
- -
(90,
000)
90
,000
-
- D
ivid
ends
pai
d -
- -
- (6
9,00
0)
(69,
000)
Tr
ansf
er o
f m
inor
ity
inte
rest
def
icit
in s
ubsi
diar
y -
- -
(12,
777,
404)
12
,777
,404
-
Elim
inat
ion
of m
inor
ity
inte
rest
sha
re in
sub
sidi
ary
- -
- -
(4,6
66,6
66)
(4,6
66,6
66)
Bala
nce
at J
une
30,
2014
66
,856
,630
1,
714,
615,
013
1,48
6,58
0 63
,511
,065
2,
347,
783
1,84
8,81
7,07
1 Th
e ac
com
pany
ing
note
s fo
rm a
n in
tegr
al p
art
of t
hese
fin
anci
al s
tate
men
ts.

2 8 | C O N S O L I D A T E D F I N A N C I A L S T A T E M E N T S
National Insurance CorporationConsolidated Statement of Comprehensive Income For the Year Ended June 30, 2014(Expressed in Eastern Caribbean Dollars)
2014 2013
Notes $ $
Contribution income 17 104,336,132 101,478,977
Benefits expenses
Short-term benefits 18 (9,557,197) (8,932,773) Long-term benefits 18 (57,713,157) (54,083,932) Medical health programme 17 (5,000,000) (5,500,000)
(72,270,354) (68,516,705)
Surplus of contribution over benefits
32,065,778 32,962,272 General and administrative expenses 19 (17,380,691) (16,615,838)
14,685,087 16,346,434
Other income
Investment income - net 21 71,613,280 123,551,967 Decrease in fair value of investment properties 10 (3,629,038) (1,183,705) Gain on debt restructuring
9,296,703 -
Gain on acquisition of shares
4,666,666 - Other
1,821,794 1,533,212
83,769,405 123,901,474
Excess of income over expenditure before finance costs and taxation
98,454,492 140,247,908
Finance costs
(337,610) (443,697)
Excess of income over expenditure before taxation
98,116,882 139,804,211 Taxation 23 4,545 (88,248)
EXCESS OF COMPREHENSIVE INCOME OVER EXPENDITURE FOR THE YEAR
98,121,427 139,715,963
Attributable to:
Reserves
98,046,979 140,874,441
Minority interest
74,448 (1,158,478)
EXCESS OF COMPREHENSIVE INCOME OVER EXPENDITURE FOR THE YEAR
98,121,427 139,715,963
The accompanying notes form an integral part of these financial statements.

2 9 | C O N S O L I D A T E D F I N A N C I A L S T A T E M E N T S
National Insurance CorporationConsolidated Statement of Cash Flows For the Year Ended June 30, 2014(Expressed in Eastern Caribbean Dollars)
2014 2013
$ $
Cash Flows from Operating Activities
Excess of comprehensive income over expenditure before taxation 98,116,882 139,804,211 Adjustments for:
Interest income (72,442,196) (68,785,600) Decrease/(increase) in fair value of financial assets at fair value through income 6,660,013 (45,683,089) Decrease in fair value of investment properties 3,629,038 1,183,705 Provision for loan impairment 1,691,379 1,397,476 Dividend income (4,242,077) (3,951,981) Depreciation 696,450 715,263 Finance costs 337,610 443,697 Gain on debt restructuring (9,296,703) - Gain on acquisition of shares (4,666,666) - Gain on disposal of property, plant and equipment (89,860) (4,306) Operating income before working capital changes 20,393,870 25,119,376 Decrease in loans and receivables 6,619,758 35,902,378 Purchase of held-to-maturity financial assets (42,010,592) (47,708,138) Decrease/(increase) in loans and receivables investment securities 22,669,679 (4,419,340) Increase in financial assets at fair value through income (21,381,148) (14,756,218) Decrease/(increase) in projects in progress 3,240,053 (1,536,689) Increase in inventory (871) (2,540) Decrease in other assets - 6,853,358 Increase/(decrease) in trade and other payables 2,392,082 (1,218,287) Cash used in operations (8,077,169) (1,766,100) Interest received 69,038,982 29,742,991 Dividends received 4,242,077 3,951,981 Finance costs paid (337,610) (443,697) Taxation paid (115,655) - Net cash generated from operating activities 64,750,625 31,485,175 Cash Flows from Investing Activities
(Repayment of)/proceeds from borrowings (3,294,430) 170,955 Dividends paid to minority interest (69,000) (69,000) Net cash (used in)/generated from financing activities (3,363,430) 101,955 Increase in Cash and Cash Equivalents 43,078,885 8,369,531 Cash and Cash Equivalents at Beginning of Year 45,252,506 36,882,975 Cash and Cash Equivalents at End of Year 88,331,391 45,252,506 The accompanying notes form an integral part of these financial statements.
Improvements to investment properties (18,224,507) (22,840,383) Proceeds from disposal of investment properties 308,430 128,538 Purchase of property, plant and equipment (487,093) (510,341) Proceeds from disposal of property, plant and equipment 94,860 4,587 Net cash used in Investing Activities (18,308,310) (23,217,599) Cash Flows from Financing Activities
3 0 | C O N S O L I D A T E D F I N A N C I A L S T A T E M E N T S
National Insurance Corporation
National Insurance Corporation Index to Notes to the Consolidated Financial Statements Note 1 Introduction
Note 2 Date of Authorisation of Issue
Note 3 Significant Accounting Policies
Note 4 Financial Risk Management
Note 5 Critical Accounting Estimates and Judgements
Note 6 Cash and Cash Equivalents
Note 7 Financial Assets
Note 8 Loans and Receivables
Note 9 Finance Lease Receivable
Note 10 Investment Properties
Note 11 Property, Plant and Equipment
Note 12 Trade and Other Accounts Payable
Note 13 Borrowings
Note 14 Principal Subsidiary Undertakings
Note 15 Reserves
Note 16 Short-term and Long-term Benefits Fund
Note 17 Detailed Statement of Income and Expenditure
Note 18 Short-term and Long-term Benefits Expenses
Note 19 Expenses by Nature
Note 20 Employee and Management Costs
Note 21 Investment Income – Net
Note 22 Related Party Transactions
Note 23 Taxation
Note 24 Actuarial Review
Note 25 Commitments
3 1 | C O N S O L I D A T E D F I N A N C I A L S T A T E M E N T S
National Insurance CorporationNotes to the Consolidated Financial Statements For the Year Ended June 30, 2014(Expressed in Eastern Caribbean Dollars)
1. Introduction
The National Insurance Corporation (the Corporation) is governed by the National Insurance Corporation Act CAP 16.01 of the revised laws of Saint Lucia 2001. The principal activity of the Corporation is to provide social security services in the country of Saint Lucia.
The consolidated financial statements include the statements of National Insurance Corporation and its subsidiaries (together “the Group”) whose activities are as follows:-
(a) St. Lucia Mortgage Finance Company Limited
The principal activity of the company is to operate a mortgage finance company.
The company is currently engaged in the development and management of the Government of Saint Lucia Build-Own-Lease-Transfer (BOLT) and refurbishment projects; the provision of property development, management and maintenance services to NIC and its subsidiaries.
(c) Castries Car Park Facility Limited
The company provides car parking facilities, all other matters incidental thereto and rental of office block and commercial space.
2. Date of Authorisation of Issue
The principal accounting policies adopted are stated in order to assist in a general understanding of the financial statements. These policies have been consistently applied to the years presented, unless otherwise stated.
(a) Basis of Preparation
The consolidated financial statements of National Insurance Corporation have been prepared in accordance with the International Financial Reporting Standards (IFRS), and under the historical cost convention as modified by the revaluation of financial assets classified at fair value through income and investment properties.
The preparation of financial statements in conformity with IFRS requires the use of certain critical accounting estimates. It also requires management to exercise its judgement in the process of applying the Group‟s accounting policies. The areas involving a higher degree of judgement or complexity, or areas where assumptions and estimates are significant to the financial statements are disclosed in Note 5.
(b) National Insurance Property Development and Management Company Limited.
(d) Blue Coral Limited
The company provides rental of office and commercial space.
The registered office and principal place of business of the Corporation is Francis ComptonBuilding, John Compton Highway, Castries, Saint Lucia.
These financial statements were authorised for issue by the Board of Directors on August 6, 2015.
3. Significant Accounting Policies
3 2 | C O N S O L I D A T E D F I N A N C I A L S T A T E M E N T S
National Insurance CorporationNotes to the Consolidated Financial Statements For the Year Ended June 30, 2014(Expressed in Eastern Caribbean Dollars)
3. Significant Accounting Policies (Cont’d)
(a) Basis of Preparation (Cont’d)
Amendments to International Financial Reporting Standards effective in the 2014 financial year
IAS 27 (Revised), „Separate Financial Statements‟
A revised version of IAS 27 was issued in May 2011. It contains accounting and disclosure requirements for investment in subsidiaries, joint ventures and associates when an entity prepares separate financial statements. The revised standard requires an entity preparing separate financial statements to account for those investments at cost or in accordance with IFRS 9 Financial Instruments. These amendments became effective January 1, 2013.
IFRS 12, „Disclosures of Interest in Other Entities‟
IFRS 12 was issued in May 2011. This new standard applies to entities that have an interest in a subsidiary, a joint arrangement, an associate or an unconsolidated structured entity. The IFRS requires an entity to disclose information that enables users of financial statements to evaluate:
(a) the nature of, and risks associated with, its interests in other entities; and
(b) the effects of those interests on its financial position, financial performance and cash flows.
This standard became effective January 1, 2013.
IFRS 13, „Fair Value Measurement‟
IFRS 13 was issued in May 2011. This new standard defines fair value, provides a framework for measuring fair value and requires disclosures about fair value measurements. IFRS 13 applies both to financial and non-financial instruments for which other IFRSs require or permit fair value measurement and disclosures about fair value measures, except in specified circumstances. This standard became effective January 1, 2013.
IFRS 9, „Financial Instruments Part 1: Classification and Measurement‟
IFRS 9 issued in November 2009 replaces those parts of IAS 39 relating to the classification and measurement of financial assets. Financial assets are required to be classified into two measurement categories: those to be measured subsequently at fair value, and those to be measured subsequently at amortised cost. The decision is to be made at initial recognition and the classification depends on the entity‟s business model for managing its financial assets and the contractual cash flow characteristics of the assets. In October 2010, the requirements for classification and measurement of financial liabilities, as well as the requirements for derecognition of financial assets and liabilities, were moved from IAS 39 to IFRS 9. This standard is effective for financial periods beginning on or after January 1, 2018; however, earlier application is allowed.
There are no other IFRS‟s or IFRIC interpretations that are not yet effective that would be expected to have a material impact on the Group.
New and revised International Financial Reporting Standards that have been issued but are not yet effective and have not been early adopted
3 3 | C O N S O L I D A T E D F I N A N C I A L S T A T E M E N T S
National Insurance CorporationNotes to the Consolidated Financial Statements For the Year Ended June 30, 2014(Expressed in Eastern Caribbean Dollars)
3. Significant Accounting Policies (Cont’d)
(b) Consolidation
Subsidiaries
Subsidiaries are all entities over which the Corporation has the power to govern the financial and operating policies generally accompanying a shareholding of more than one-half of the voting rights. The existence and effect of potential voting rights that are currently exercisable or convertible are considered when assessing whether the Corporation controls another entity. Subsidiaries are fully consolidated from the date on which control is transferred to the Corporation. They are de-consolidated from the date that control ceases.
The purchase method of accounting is used to account for the acquisition of subsidiaries by the Corporation. The cost of an acquisition is measured as the fair value of the assets given, equity instruments issued and liabilities incurred or assumed at the date of exchange, plus costs directly attributable to the acquisition. Identifiable assets acquired and liabilities and contingent liabilities assumed in a business combination are measured initially at their fair values at the acquisition date, irrespective of the extent of any minority interest. The excess of the cost of acquisition over the fair value of the Corporation‟s share of the identifiable net assets acquired is recorded as goodwill. If the cost of acquisition is less than the fair value of the net assets of the subsidiary acquired, the difference is recognised directly in the Consolidated Statement of Comprehensive Income.
Inter-company transactions, balances and unrealised gains on transactions between group companies are eliminated. Unrealised losses are also eliminated but considered an impairment indicator of the asset transferred. Accounting policies of subsidiaries have been changed where necessary to ensure consistency with the policies adopted by the Corporation.
Transactions and non-controlling interests
The Group treats transactions with non-controlling interests as transactions with equity owners of the Group. For purchases from non-controlling interests, the difference between any consideration paid and the relevant share acquired of the carrying value of net assets of the subsidiary is recorded in reserves. Gains or losses on disposals to non-controlling interests are also recorded in reserves.
When the Group ceases to have control or significant influence, any retained interest in the entity is remeasured to its fair value, with the change in carrying amount recognised in the Consolidated Statement of Comprehensive Income. The fair value is the initial carrying amount for the purposes of subsequently accounting for the retained interest as an associate, joint venture or financial asset. In addition, any amounts previously recognised in other comprehensive income in respect of that entity are accounted for as if the Group had directly disposed of the related assets or liabilities. This may mean that amounts previously recognised in other comprehensive income are reclassified to the Consolidated Statement of Comprehensive Income. If the ownership interest in an associate is reduced but significant influence is retained, only a proportionate share of the amounts previously recognised in other comprehensive income are reclassified to the Consolidated Statement of Comprehensive Income where appropriate.
3. Significant Accounting Policies (Cont’d)
(c) Foreign Currencies
The financial statements are presented in Eastern Caribbean dollars which is the currency of the primary economic environment in which the Group operates (its functional currency).
Assets and liabilities expressed in foreign currencies are translated into the functional currency at the rates of exchange ruling at the date of the financial statements. Transactions arising during the year involving foreign currencies are translated into the functional currency and recorded at the rates of exchange prevailing on the dates of the transactions. Differences arising from fluctuations in exchange rates as well as including differences between buying and selling rates, are included in the Consolidated Statement of Comprehensive Income.
(d) Cash and Cash Equivalents
Cash and cash equivalents represent cash on hand and deposits held on call with financial institutions. For the purposes of the cash flow statement, cash and cash equivalents comprise balances with less than three months‟ maturity from the date of acquisition, including cash on hand and in financial institutions. Bank overdrafts are shown within borrowings on the Consolidated Statement of Financial Position.
(e) Financial Assets
The Group classifies its financial assets into these categories:-
1. Fair value through income
2. Loans and receivables
3. Held-to-maturity financial assets
4. Available-for-sale financial assets
Financial Assets at Fair Value through Income
A financial asset is classified into the „financial assets at fair value through income‟ category at inception if acquired principally for the purpose of selling in the short term, if it forms part of a portfolio of financial assets in which there is evidence of short term profit-taking, or if so designated by management.
Financial assets designated as fair value through income at inception are those that are:-
Held in internal funds to match insurance and investment contracts liabilities that are linked to the changes in fair value of these assets. The designation of these assets to be at fair value through income eliminates or significantly reduces a measurement or recognition inconsistency (sometimes referred to as „an accounting mismatch‟) that would otherwise arise from measuring assets or liabilities or recognising the gains and losses on them on different bases; and
Managed and whose performance is evaluated on a fair value basis. Information about these financial assets is provided internally on a fair value basis to the Group‟s key management personnel. The Group‟s investment strategy is to invest in equity and debt securities and to evaluate them with reference to their fair values. Assets that are part of these portfolios are designated upon initial recognition at fair value through income (see Note 7 for additional details on the Group‟s portfolio structure).
3 4 | C O N S O L I D A T E D F I N A N C I A L S T A T E M E N T S
National Insurance CorporationNotes to the Consolidated Financial Statements For the Year Ended June 30, 2014(Expressed in Eastern Caribbean Dollars)
3. Significant Accounting Policies (Cont’d)
(c) Foreign Currencies
The financial statements are presented in Eastern Caribbean dollars which is the currency of the primary economic environment in which the Group operates (its functional currency).
Assets and liabilities expressed in foreign currencies are translated into the functional currency at the rates of exchange ruling at the date of the financial statements. Transactions arising during the year involving foreign currencies are translated into the functional currency and recorded at the rates of exchange prevailing on the dates of the transactions. Differences arising from fluctuations in exchange rates as well as including differences between buying and selling rates, are included in the Consolidated Statement of Comprehensive Income.
(d) Cash and Cash Equivalents
Cash and cash equivalents represent cash on hand and deposits held on call with financial institutions. For the purposes of the cash flow statement, cash and cash equivalents comprise balances with less than three months‟ maturity from the date of acquisition, including cash on hand and in financial institutions. Bank overdrafts are shown within borrowings on the Consolidated Statement of Financial Position.
(e) Financial Assets
The Group classifies its financial assets into these categories:-
1. Fair value through income
2. Loans and receivables
3. Held-to-maturity financial assets
4. Available-for-sale financial assets
Financial Assets at Fair Value through Income
A financial asset is classified into the „financial assets at fair value through income‟ category at inception if acquired principally for the purpose of selling in the short term, if it forms part of a portfolio of financial assets in which there is evidence of short term profit-taking, or if so designated by management.
Financial assets designated as fair value through income at inception are those that are:-
Held in internal funds to match insurance and investment contracts liabilities that are linked to the changes in fair value of these assets. The designation of these assets to be at fair value through income eliminates or significantly reduces a measurement or recognition inconsistency (sometimes referred to as „an accounting mismatch‟) that would otherwise arise from measuring assets or liabilities or recognising the gains and losses on them on different bases; and
Managed and whose performance is evaluated on a fair value basis. Information about these financial assets is provided internally on a fair value basis to the Group‟s key management personnel. The Group‟s investment strategy is to invest in equity and debt securities and to evaluate them with reference to their fair values. Assets that are part of these portfolios are designated upon initial recognition at fair value through income (see Note 7 for additional details on the Group‟s portfolio structure).
3 5 | C O N S O L I D A T E D F I N A N C I A L S T A T E M E N T S
National Insurance CorporationNotes to the Consolidated Financial Statements For the Year Ended June 30, 2014(Expressed in Eastern Caribbean Dollars)
3. Significant Accounting Policies (Cont’d)
(e) Financial Assets (Cont’d)
Loans and Receivables
Loans and receivables are non-derivative financial assets with fixed or determinable payments that are not quoted in an active market other than those that the Group intends to sell in the short term or that it has designated as at fair value through income or available-for-sale. Loans and receivables are recognised initially at fair value and subsequently measured at amortised cost using the effective interest method, less provision for impairment. A provision for impairment of loans and receivables is established when there is objective evidence that the Group will not be able to collect all amounts due according to their original terms.
Held-to-Maturity Financial Assets
Held-to-maturity financial assets are non-derivative financial assets with fixed or determinable payments and fixed maturities other than those that meet the definition of loans and receivables that the Group‟s management has the positive intention and ability to hold to maturity. These assets are recognised initially at fair value and subsequently measured at amortised cost using the effective interest method, less provision for impairment. A provision for impairment of held-to-maturity debt securities is established when there is objective evidence that the Group will not be able to collect all amounts due according to their original terms.
Available-for-sale Financial Assets
Available-for-sale financial assets are non-derivative financial assets that are either designated in this category or not classified in any of the other categories.
Regular-way purchases and sales of financial assets are recognised on trade date – the date on which the Group commits to purchase or sell the asset. Financial assets are initially recognised at fair value plus, in the case of all financial assets not carried at fair value through income, transaction costs that are directly attributable to their acquisition. Financial assets carried at fair value through income are initially recognised at fair value, and transaction costs are expensed in the Consolidated Statement of Comprehensive Income.
Financial assets are derecognised when the rights to receive cash flows from them have expired or where they have been transferred and the Group has also transferred substantially all risks and rewards of ownership.
Available-for-sale financial assets and financial assets at fair value through income are subsequently carried at fair value. Loans and receivables and held-to-maturity financial assets are carried at amortised cost using the effective interest method. Realised and unrealised gains and losses arising from changes in the fair value of the „financial assets at fair value through income‟ category are included in the Consolidated Statement of Comprehensive Income in the period in which they arise.
Unrealised changes in the fair value of monetary securities denominated in a foreign currency and classified as available-for-sale are analysed between translation differences resulting from changes in amortised cost of the security and other changes in the carrying amount of the security. The translation differences on monetary securities are recognised in the Statement of Comprehensive Income; translation differences on non-monetary securities are recognised in equity. Unrealised changes in the fair value of monetary and non-monetary securities classified as available-for-sale are recognised in equity.

3 6 | C O N S O L I D A T E D F I N A N C I A L S T A T E M E N T S
National Insurance CorporationNotes to the Consolidated Financial Statements For the Year Ended June 30, 2014(Expressed in Eastern Caribbean Dollars)
3. Significant Accounting Policies (Cont’d)
(e) Financial Assets (Cont’d)
Available-for-sale Financial Assets (Cont‟d)
When securities classified as available-for-sale are sold or impaired, the accumulated fair value adjustments recognised in equity are included in the Consolidated Statement of Comprehensive Income as net realised gains on financial assets.
Interest on debt securities calculated using the effective interest method is recognised in the Consolidated Statement of Comprehensive Income. Dividends on equity instruments are recognised in the Consolidated Statement of Comprehensive Income when the Group‟s right to receive payments is established. Both are included in the investment income line.
The fair values of quoted investments are based on current bid prices. If the market for a financial asset is not active, the Group establishes fair value by using valuation techniques. These include the use of recent arm‟s length transactions, reference to other instruments that are substantially the same, discounted cash flow analysis and option pricing models making maximum use of market inputs and relying as little as possible on entity-specific inputs.
(f) Impairment of Assets
Financial Assets Carried at Amortised Cost
The Group assesses at each date of the financial statements whether there is objective
Objective evidence that a financial asset or group of assets is impaired includes observable data that comes to the attention of the Group about the following loss events:-
i. Significant financial difficulty of the issuer or debtor;
ii. A breach of contract, such as a default or delinquency in payments;
iii. It becoming probable that the borrower will enter bankruptcy or other financial reorganisation;
iv. The disappearance of an active market for that financial asset because of financial difficulties; or
v. Observable data indicating that there is a measurable decrease in the estimated future cash flows from a group of financial assets since the initial recognition of those assets, although the decrease cannot yet be identified with the individual financial assets in the group, including:-
- Adverse changes in the payment status of borrowers in the group; or
- National or local economic conditions that correlate with defaults on the assets in the group.
evidence that a financial asset or group of financial assets is impaired. A financial asset or a group of financial assets is impaired and impairment losses are incurred if, and only if, there is objective evidence that impairment as a result of one or more events occurred after the initial recognition of the asset (a „loss event‟) and that loss event (or events) has an impact on the estimated future cash flows of the financial asset or group of financial assets that can be reliably estimated.

3 7 | C O N S O L I D A T E D F I N A N C I A L S T A T E M E N T S
National Insurance CorporationNotes to the Consolidated Financial Statements For the Year Ended June 30, 2014(Expressed in Eastern Caribbean Dollars)
3. Significant Accounting Policies (Cont’d)
(f) Impairment of Assets (Cont’d)
Financial Assets Carried at Amortised Cost (Cont‟d)
The Group first assesses whether objective evidence of impairment exists individually for financial assets that are individually significant, and individually or collectively for financial assets that are not individually significant. If the Group determines that no objective evidence of impairment exists for an individually assessed financial asset, whether significant or not, it includes the asset in a group of financial assets with similar credit risk characteristics and collectively assesses them for impairment. Assets that are individually assessed for impairment and for which an impairment loss is or continues to be recognised are not included in a collective assessment of impairment.
If there is objective evidence that an impairment loss has been incurred on loans and receivables or held-to-maturity investments carried at amortised cost, the amount of the loss is measured as the difference between the asset‟s carrying amount and the present value of estimated future cash flows (excluding future credit losses that have not been incurred) discounted at the financial asset‟s original effective interest rate. The carrying amount of the asset is reduced through the use of an allowance account and the amount of the loss is recognised in the Consolidated Statement of Comprehensive Income. If the debt securities has a variable interest rate, the discount rate for measuring any impairment loss is the current effective interest rate determined under the contract.
For the purposes of a collective evaluation of impairment, financial assets are grouped on the basis of similar credit characteristics (i.e., on the basis of the Group‟s grading process that considers asset type, industry, collateral type, past-due status and other relevant factors). Those characteristics are relevant to the estimation of future cash flows for groups of such assets by being indicative of the debtors‟ ability to pay all amounts due according to the contractual terms of the asset being evaluated.
If in a subsequent period, the amount of the impairment loss decreases and the decrease can be related objectively to an event occurring after the impairment was recognised (such as an improvement in the debtor‟s credit rating), the previously recognised impairment loss is reversed by adjusting the allowance account. The amount of the reversal is recognised in the Consolidated Statement of Comprehensive Income.
Financial Assets Carried at Fair Value
The Group assesses at each date of the financial statements whether there is objective evidence that an available-for-sale financial asset is impaired, including in the case of equity investments classified as available-for-sale, a significant or prolonged decline in the fair value of the security below its cost. If any such evidence exists for available-for-sale financial assets, the cumulative loss – measured as the difference between the acquisition cost and current fair value, less any impairment loss on the financial asset previously recognised in the Consolidated Statement of Comprehensive Income – is removed from equity and recognised in the Consolidated Statement of Comprehensive Income. Impairment losses recognised in the Consolidated Statement of Comprehensive Income on equity instruments are not subsequently reversed. The impairment loss is reversed through the Consolidated Statement of Comprehensive Income, if in a subsequent period the fair value of a debt instrument classified as available-for-sale increases and the increase can be objectively related to an event occurring after the impairment loss was recognised in the Consolidated Statement of Comprehensive Income.

3 8 | C O N S O L I D A T E D F I N A N C I A L S T A T E M E N T S
National Insurance CorporationNotes to the Consolidated Financial Statements For the Year Ended June 30, 2014(Expressed in Eastern Caribbean Dollars)
3. Significant Accounting Policies (Cont’d)
(f) Impairment of Assets (Cont’d)
Impairment of Other Non-Financial Assets
Assets that have an indefinite useful life are not subject to amortisation and are tested annually for impairment. Assets that are subject to amortisation are reviewed for impairment whenever events or changes in circumstances indicate that the carrying amount may not be recoverable. An impairment loss is recognised for the amount by which the asset‟s carrying amount exceeds its recoverable amount. The recoverable amount is the higher of an asset‟s fair value less costs to sell and value in use. For the purposes of assessing impairment, assets are grouped at the lowest levels for which there are separately identifiable cash flows (cash generating units).
(g) Investment Property
Property held for long-term rental yields is classified as investment property.
Investment property comprises freehold land and office buildings. It is measured initially at cost and all subsequent assessments are carried at fair value. Fair value is based on active market prices, adjusted, if necessary, for any difference in the nature, location or condition of the specific asset. These valuations are reviewed by an independent valuation expert. Investment property that is being redeveloped for continuing use as investment property, or for which the market has become less active, continues to be measured at fair value.
Changes in fair values are recorded in the Consolidated Statement of Comprehensive Income.
If an investment property becomes owner-occupied, it is reclassified as property, plant and equipment, and its fair value at the date of reclassification becomes its cost for subsequent accounting purposes.
If an item of property, plant and equipment becomes an investment property because its use has changed, any difference arising between the carrying amount and the fair value of this item at the date of transfer is recognised in equity as a revaluation of property, plant and equipment. However, if a fair value gain reverses a previous impairment loss, the gain is recognised in the Consolidated Statement of Comprehensive Income. Upon the disposal of such investment property, any surplus previously recorded in equity is transferred to retained earnings; the transfer is not made through the Consolidated Statement of Comprehensive Income.

3 9 | C O N S O L I D A T E D F I N A N C I A L S T A T E M E N T S
National Insurance CorporationNotes to the Consolidated Financial Statements For the Year Ended June 30, 2014(Expressed in Eastern Caribbean Dollars)
3. Significant Accounting Policies (Cont’d)
(h) Property, Plant and Equipment
Items of property, plant and equipment are stated at historical cost less accumulated depreciation. Historical cost includes expenditure directly attributable to the acquisition of the items.
Depreciation is calculated on a straight-line basis, so as to write down the cost of property, plant and equipment over their estimated useful lives as follows:-
Assets Estimated Useful Lives Building 50 years Leasehold improvements 2 – 10 years Motor vehicles 3 - 5 years Furniture and equipment 4 - 10 years Computer hardware 5 years Computer software 5 years Generators 5 years Maintenance equipment 10 years
Gains or losses arising on the disposal or retirement of an item of property, plant and equipment are determined as the difference between the sales proceeds and the carrying amount of the asset and are recognised in the Consolidated Statement of Comprehensive Income.
(i) Projects in Progress
Build-Own-Lease-Transfer (BOLT) Projects
These include all costs associated with the construction and furnishing of the buildings. Direct costs of construction are recognised when an interim valuation is done. On completion, they are accounted for as finance leases.
(j) Inventory
Inventory is valued at the lower of cost and net realisable value. Net realisable value is the price at which the inventory can be realised in the normal course of business after allowing for the cost of realisation. Provision is made for slow moving and obsolete stocks.
(k) Borrowings and Borrowings Costs
Borrowings are recognised initially at fair value, net of transaction costs incurred. Borrowings are subsequently stated at amortised cost; any difference between the proceeds (net of transaction costs) and the redemption value is recognised in the Consolidated Statement of Comprehensive Income over the period of the borrowings using the effective interest method.
Borrowings are classified as current liabilities unless the Group has an unconditional right to defer settlement of the liability for at least 12 months after the date of the financial statements. Interest costs on borrowings to finance the construction of a qualifying asset are capitalised during the period of time that is required to complete and prepare the asset for its intended use. Other borrowing costs are expensed.
(l) Financial Liabilities
Financial liabilities comprise trade and other accounts payable and borrowings and are measured at amortised cost.
4 0 | C O N S O L I D A T E D F I N A N C I A L S T A T E M E N T S
National Insurance CorporationNotes to the Consolidated Financial Statements For the Year Ended June 30, 2014(Expressed in Eastern Caribbean Dollars)
3. Significant Accounting Policies (Cont’d)
(m) Provisions
Provisions are recognised when the Group has a present legal or constructive obligation as a result of past events; it is probable that an outflow of resources will be required to settle the obligation; and a reliable estimate of the amount can be made.
(n) Recognition of Income and Expenses
(a) Contribution Income and Benefits
Contribution income is accounted for on an accrual basis to take account of all collections subsequent to the year-end that relate to the current year, and to recognise all known significant receivables.
Benefits expense is accounted for on an accrual basis to take account of all benefits paid subsequent to the year-end that relate to the current year, and to recognise all known significant benefits payable.
(b) Dividend income
Dividend income for investment in equity securities is recognised when the right to receive payment is established – this is the ex-dividend date for equity securities.
(c) Interest income and expense
Interest income and expense for all interest-bearing financial instruments, including financial instruments measured at fair value through income, are recognised within investment income in the Consolidated Statement of Comprehensive Income using the effective interest rate method. When a receivable is impaired, the Group reduces the carrying amount to its recoverable amount, being the estimated future cash flow discounted at the original effective interest rate of the instrument, and continues unwinding the discount as interest income.
(d) Leases
Leases in which a significant portion of the risks and rewards of ownership are retained by the lessor are classified as operating leases. Payments made under operating leases are charged to the Consolidated Statement of Comprehensive Income on a straight-line basis over the period of the lease.
(e) Other income and expenses
All other income and expenses are accounted for on the accruals basis.

4 1 | C O N S O L I D A T E D F I N A N C I A L S T A T E M E N T S
National Insurance CorporationNotes to the Consolidated Financial Statements For the Year Ended June 30, 2014(Expressed in Eastern Caribbean Dollars)
3. Significant Accounting Policies (Cont’d)
(o) Basis of Allocation of Income and Expenses
(a) Contributions
Contribution income, as recommended by the seventh actuarial review, is allocated as follows:-
% %
Short-term benefits fund 17 17 Long-term benefits fund 83 83 100 100
(b) Investment income and expenses
Investment income and expenses are allocated to the benefit fund in the ratio of the beginning of year reserve of each fund to the total beginning of year reserves.
Investment expenses comprise all costs relating to the management of investment properties and financial assets and provision for impairment of financial assets.
(c) Changes in fair value of investment properties
Changes in fair value of investment properties are allocated to the benefit fund in the ratio of the beginning of year reserve of each fund to the total beginning of year reserves.
(d) Expenses
General and administrative expenses and amortisation and impairment of intangible assets are allocated in proportion to the sum of contributions and benefits.
(e) Other income
Other income is allocated in the same proportion as contribution income.
2014 2013
4 2 | C O N S O L I D A T E D F I N A N C I A L S T A T E M E N T S
National Insurance CorporationNotes to the Consolidated Financial Statements For the Year Ended June 30, 2014(Expressed in Eastern Caribbean Dollars)
3. Significant Accounting Policies (Cont’d)
(p) Income Tax
National Insurance Corporation is exempt from the payment of income tax under the Income Tax Act.
As per Cabinet conclusions, the following exemptions have been granted to the subsidiary companies:
St. Lucia Mortgage Finance Company Limited is exempt from income tax on any income accruing to the company by way of interest on loans up to $500,000.
National Insurance Property Development and Management Company Ltd. is exempt from income tax on the profits earned by the company, which are specific to refurbishment and BOLT projects. All other income is subject to income taxes at a rate of 30% per annum.
Castries Car Park Facility Limited has been granted a tax holiday for the first ten years of operation, which expired October 2008. A further ten year tax holding was granted to the Company as per Cabinet Conclusion No.1031 with effect from November 2009.
Blue Coral Limited is subject to income taxes at a rate of 30% per annum.
Current Income Tax
The current income tax charge is calculated on the basis of the tax laws enacted or substantively enacted at the date of the financial statements. Management periodically evaluates positions taken in tax returns with respect to situations where applicable tax regulations are subject to interpretation and establishes provisions where appropriate on the basis of amounts expected to be paid to the tax authorities.
Deferred Income Tax
The Group follows the liability method of accounting for deferred tax whereby all temporary differences arising between the tax bases of assets and liabilities and their carrying values for financial reporting purposes are provided for at the Group tax rates which are expected to apply when the related deferred income tax asset is realised or the deferred income tax liability is settled.
Deferred tax assets are only recognised when it is probable that taxable profits will be available against which the assets may be utilised.
(q) Comparatives
Except when a standard or an interpretation permits or requires otherwise, all amounts are reported or disclosed with comparative information.
4 3 | C O N S O L I D A T E D F I N A N C I A L S T A T E M E N T S
National Insurance CorporationNotes to the Consolidated Financial Statements For the Year Ended June 30, 2014(Expressed in Eastern Caribbean Dollars)
4. Financial Risk Management
The Board of Directors has overall responsibility for the establishment of a risk management framework. The following are the systems and structures put in place to ensure that the Group‟s exposure to risk is minimised:-
The investment policy and guidelines establish asset categories with targeted asset allocations.
Credit Risk
The Group takes on exposure to credit risk, which is the risk that a counterparty will cause a financial loss for the Group by failing to discharge an obligation. Significant changes in the economy, or in the health of a particular industry segment that represents a concentration in the Group‟s portfolio, could result in losses that are different from those provided for at the balance sheet date. Management therefore carefully manages its exposure to credit risk. Credit risk exposures arise principally in lending activities that lead to loans and advances, and investment activities that bring debt securities and other bills into the Group‟s asset portfolio. There is also credit risk in off-balance sheet financial instruments such as loan commitments. The credit risk management and control are centralised and report to the Board of Directors.
Credit Risk Measurement
(a) Loans and Advances
If customers are independently rated, their ratings are used. Otherwise, if there is no independent rating, the Investment Committee assesses the credit quality of the customer, taking into account its financial position, past experience and other factors.
(b) Debt Securities and Other Bills
The Group‟s activities expose it to a variety of financial risks: market risk (including currency risk, fair value interest rate risk, cash flow interest rate risk and price risk), credit risk and liquidity risk. In particular, the key financial risk is that the proceeds from its financial assets will not be sufficient to fund its obligations arising from claims. The Group‟s overall risk management programme focuses on the unpredictability of financial markets and seeks to minimise potential adverse effects on the Group‟s financial performance. Income earned from investments, together with the excess of contributions after benefits are paid, is used to earn interest rate margins through investment in high quality, high yielding assets with acceptable level of risks.
• Investment Section, which conducts regular due diligence exercises based on published financial reports and other available data. Detailed monthly and quarterly reports are submitted to the Executive Director and to the Investment Committee.
• The Investment Committee, whose role is to review the results of the due diligence exercises conducted by the Investment Manager. Decisions/recommendations are submitted to the Board of Directors for ratification.
Investment decisions are made in the context of Section 21 of the National Insurance Corporation Act Cap 16.01 of the revised laws of Saint Lucia 2001 and the Group‟s Investment policy and guidelines.
The Group uses the historical information about counterparty default rates to classify the customers in different groups. Clients of the Group are segmented into two rating classes, customers with no history of default and customers with history of default. The Group regularly validates the performance of the rating and its predictive power with regard to default events.
For debt securities and other bills, external ratings such as Moody‟s Investment Service, Standard & Poor‟s rating, CariCRIS or their equivalents are used by the Board for managing of the credit risk exposures.
4 4 | C O N S O L I D A T E D F I N A N C I A L S T A T E M E N T S
National Insurance CorporationNotes to the Consolidated Financial Statements For the Year Ended June 30, 2014(Expressed in Eastern Caribbean Dollars)
4. Financial Risk Management (Cont’d)
Credit Risk (Cont’d)
Risk Limit Control and Mitigation Policies
The Group manages, limits and controls concentrations of credit risk wherever they are identified − in particular, to individual counterparties and groups, and to industries.
The Group limits its credit risk exposure with respect to its debt securities portfolio by investing only in financial instruments with a minimum rating of BAA (Moody‟s Investment Service) or BBB (Standard & Poor Corporation) and Regional Governments or institutions with high credit worthiness. The Board through the Investments Section and the Investment Committee consistently monitors the performance of these instruments.
The Group structures the levels of credit risk it undertakes by placing limits on the amount of risk accepted in relation to one borrower, or groups of borrowers, and to the industry segments as established by the investment policy. Such risks are monitored regularly by the Board of Directors.
The exposure to any one borrower including banks and brokers is further restricted by sub-limits covering on- and off-balance sheet exposures, and daily delivery risk limits in relation to trading items. Actual exposures against limits are monitored daily.
Exposure to credit risk is also managed through regular analysis of the ability of borrowers and potential borrowers to meet interest and capital repayment obligations and by changing these lending limits where appropriate.
Some other specific control and mitigation measures are outlined below.
Collateral
The Group implements guidelines on the acceptability of specific classes of collateral or credit risk mitigation. The principal collateral types for loans and advances are:
• Government guarantee; and
• Charges over business assets such as premises, inventory and accounts receivable.
Longer-term finance and lending to corporate entities are generally secured. In addition, in order to minimise the credit loss the Group will seek additional collateral from the counterparty as soon as impairment indicators are noticed for the relevant individual loans and advances.
Collateral held as security for financial assets other than loans and advances is determined by the nature of the instrument. Debt securities, treasury and other eligible bills are generally unsecured.
The Group constantly monitors its Loans and advances portfolio and outstanding contributions. The necessary contact with debtors and employers is maintained to ensure that payments are received in a timely manner. Where necessary, re-scheduling of repayments is done, which considers the borrower's new financial position. In the event where recovery may seem doubtful, provisions are set aside to cover any potential losses.
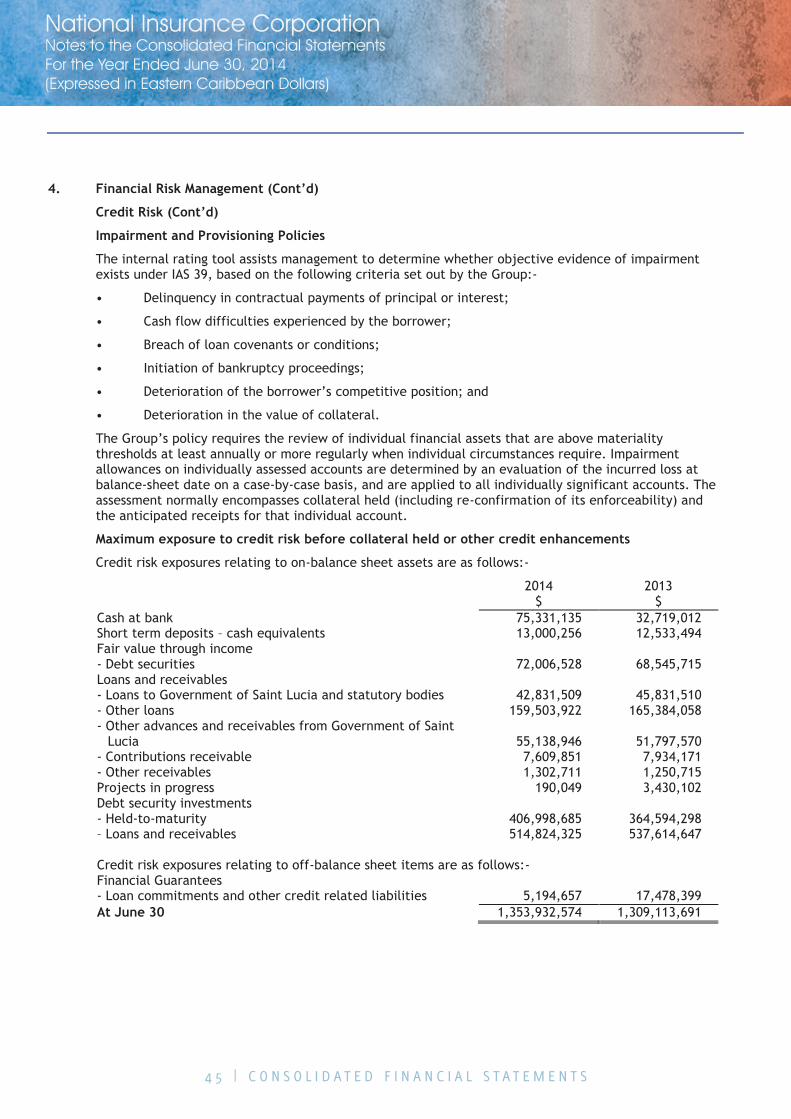
4 5 | C O N S O L I D A T E D F I N A N C I A L S T A T E M E N T S
National Insurance CorporationNotes to the Consolidated Financial Statements For the Year Ended June 30, 2014(Expressed in Eastern Caribbean Dollars)
4. Financial Risk Management (Cont’d)
Credit Risk (Cont’d)
Impairment and Provisioning Policies
The internal rating tool assists management to determine whether objective evidence of impairment exists under IAS 39, based on the following criteria set out by the Group:-
• Delinquency in contractual payments of principal or interest;
• Cash flow difficulties experienced by the borrower;
• Breach of loan covenants or conditions;
• Initiation of bankruptcy proceedings;
• Deterioration of the borrower‟s competitive position; and
• Deterioration in the value of collateral.
The Group‟s policy requires the review of individual financial assets that are above materiality thresholds at least annually or more regularly when individual circumstances require. Impairment allowances on individually assessed accounts are determined by an evaluation of the incurred loss at balance-sheet date on a case-by-case basis, and are applied to all individually significant accounts. The assessment normally encompasses collateral held (including re-confirmation of its enforceability) and the anticipated receipts for that individual account.
Maximum exposure to credit risk before collateral held or other credit enhancements
Credit risk exposures relating to on-balance sheet assets are as follows:-
2014 2013 $ $ Cash at bank 75,331,135 32,719,012 Short term deposits – cash equivalents 13,000,256 12,533,494 Fair value through income - Debt securities 72,006,528 68,545,715 Loans and receivables - Loans to Government of Saint Lucia and statutory bodies 42,831,509 45,831,510 - Other loans 159,503,922 165,384,058 - Other advances and receivables from Government of Saint
Lucia 55,138,946 51,797,570 - Contributions receivable 7,609,851 7,934,171 - Other receivables 1,302,711 1,250,715 Projects in progress 190,049 3,430,102 Debt security investments - Held-to-maturity 406,998,685 364,594,298 – Loans and receivables 514,824,325 537,614,647 Credit risk exposures relating to off-balance sheet items are as follows:- Financial Guarantees - Loan commitments and other credit related liabilities 5,194,657 17,478,399 At June 30 1,353,932,574 1,309,113,691
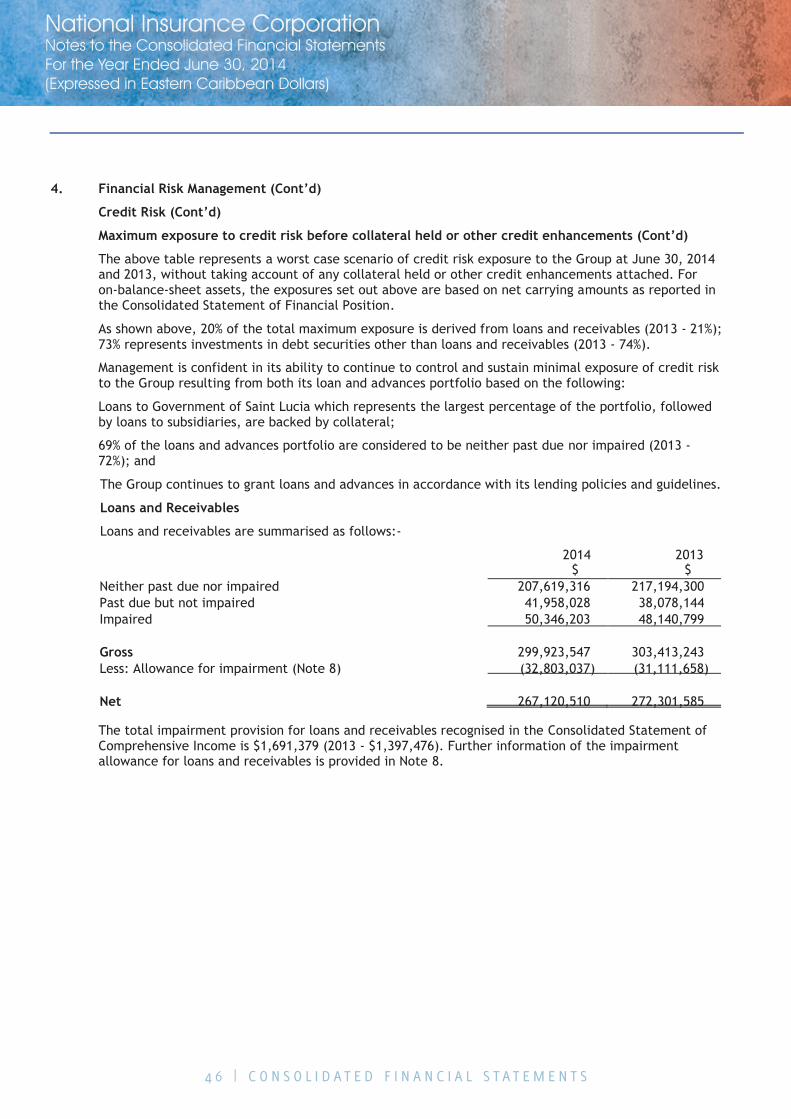
4 6 | C O N S O L I D A T E D F I N A N C I A L S T A T E M E N T S
National Insurance CorporationNotes to the Consolidated Financial Statements For the Year Ended June 30, 2014(Expressed in Eastern Caribbean Dollars)
4. Financial Risk Management (Cont’d)
Credit Risk (Cont’d)
Maximum exposure to credit risk before collateral held or other credit enhancements (Cont’d)
The above table represents a worst case scenario of credit risk exposure to the Group at June 30, 2014 and 2013, without taking account of any collateral held or other credit enhancements attached. For on-balance-sheet assets, the exposures set out above are based on net carrying amounts as reported in the Consolidated Statement of Financial Position.
Management is confident in its ability to continue to control and sustain minimal exposure of credit risk to the Group resulting from both its loan and advances portfolio based on the following:
Loans to Government of Saint Lucia which represents the largest percentage of the portfolio, followed by loans to subsidiaries, are backed by collateral;
69% of the loans and advances portfolio are considered to be neither past due nor impaired (2013 - 72%); and
The total impairment provision for loans and receivables recognised in the Consolidated Statement of Comprehensive Income is $1,691,379 (2013 - $1,397,476). Further information of the impairment allowance for loans and receivables is provided in Note 8.
The Group continues to grant loans and advances in accordance with its lending policies and guidelines.
Loans and Receivables
Loans and receivables are summarised as follows:-
2014 2013 $ $ Neither past due nor impaired 207,619,316 217,194,300 Past due but not impaired 41,958,028 38,078,144 Impaired 50,346,203 48,140,799 Gross 299,923,547 303,413,243 Less: Allowance for impairment (Note 8) (32,803,037) (31,111,658) Net 267,120,510 272,301,585
As shown above, 20% of the total maximum exposure is derived from loans and receivables (2013 - 21%);73% represents investments in debt securities other than loans and receivables (2013 - 74%).
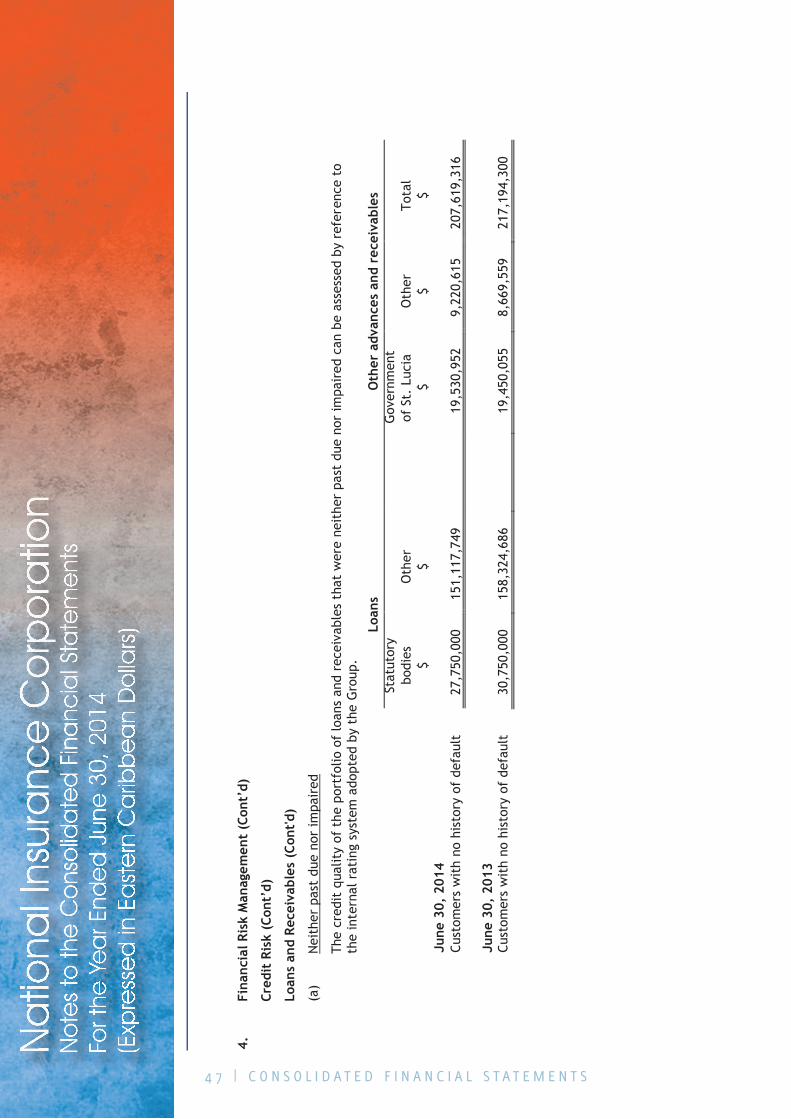
4 7 | C O N S O L I D A T E D F I N A N C I A L S T A T E M E N T S
Na
tiona
l Ins
ura
nce
Co
rpo
ratio
nN
ote
s to
the
Co
nso
lida
ted
Fin
anc
ial S
tate
me
nts
For t
he Y
ea
r End
ed
Jun
e 3
0, 2
014
(Exp
ress
ed
in E
ast
ern
Ca
ribb
ea
n D
olla
rs)
4.
Fina
ncia
l Ris
k M
anag
emen
t (C
ont’
d)
Cred
it R
isk
(Con
t’d)
Loan
s an
d Re
ceiv
able
s (C
ont'd
)
(a)
Nei
ther
pas
t du
e no
r im
pair
ed
The
cred
it q
ualit
y of
the
por
tfol
io o
f lo
ans
and
rece
ivab
les
that
wer
e ne
ithe
r pa
st d
ue n
or im
pair
ed c
an b
e as
sess
ed b
y re
fere
nce
to
the
inte
rnal
rat
ing
syst
em a
dopt
ed b
y th
e G
roup
.
Ju
ne 3
0, 2
013
Cust
omer
s w
ith
no h
isto
ry o
f de
faul
t 30
,750
,000
15
8,32
4,68
6
19,4
50,0
55
8,66
9,55
9 21
7,19
4,30
0
Lo
ans
O
ther
adv
ance
s an
d re
ceiv
able
s
Stat
utor
y
G
over
nmen
t
bodi
es
Oth
er
of
St.
Luc
ia
Oth
er
Tota
l
$ $
$
$ $
June
30,
201
4
Cu
stom
ers
wit
h no
his
tory
of
defa
ult
27,7
50,0
00
151,
117,
749
19
,530
,952
9,
220,
615
207,
619,
316
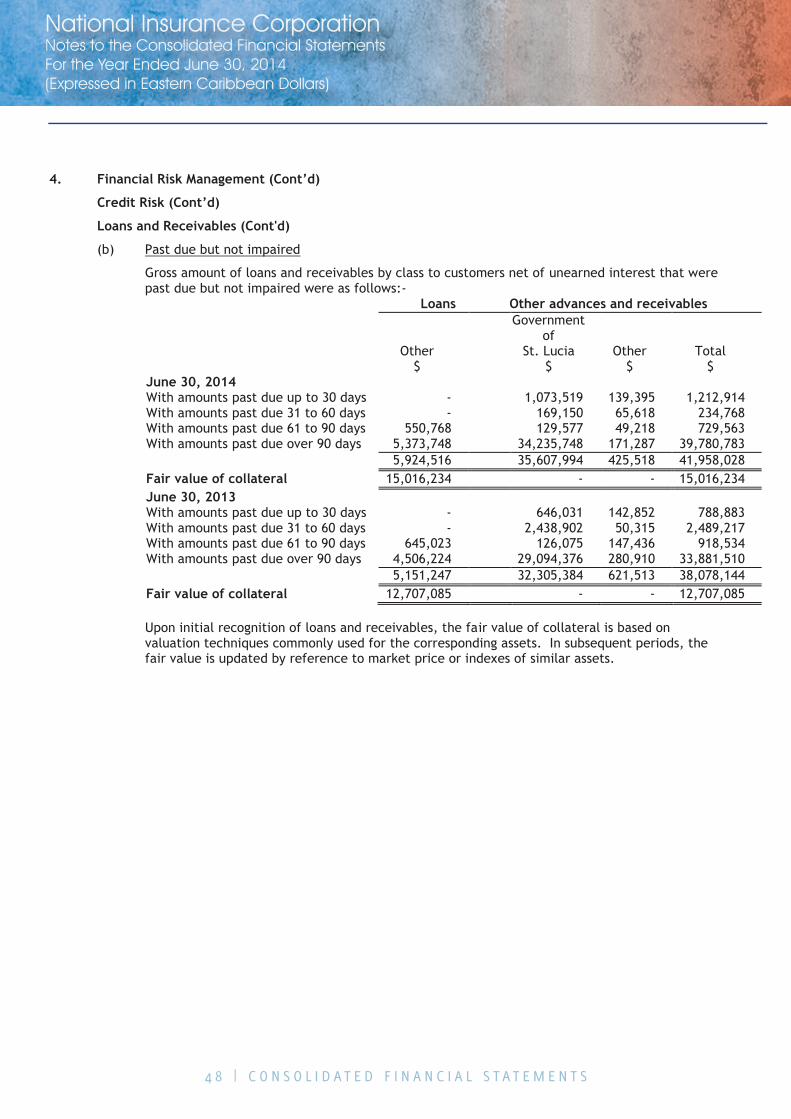
4 8 | C O N S O L I D A T E D F I N A N C I A L S T A T E M E N T S
National Insurance CorporationNotes to the Consolidated Financial Statements For the Year Ended June 30, 2014(Expressed in Eastern Caribbean Dollars)
4. Financial Risk Management (Cont’d)
Credit Risk (Cont’d)
Loans and Receivables (Cont'd)
(b) Past due but not impaired
Gross amount of loans and receivables by class to customers net of unearned interest that were past due but not impaired were as follows:- Loans Other advances and receivables Government of Other St. Lucia Other Total $ $ $ $ June 30, 2014 With amounts past due up to 30 days - 1,073,519 139,395 1,212,914 With amounts past due 31 to 60 days - 169,150 65,618 234,768 With amounts past due 61 to 90 days 550,768 129,577 49,218 729,563 With amounts past due over 90 days 5,373,748 34,235,748 171,287 39,780,783 5,924,516 35,607,994 425,518 41,958,028 Fair value of collateral 15,016,234 - - 15,016,234 June 30, 2013 With amounts past due up to 30 days - 646,031 142,852 788,883 With amounts past due 31 to 60 days - 2,438,902 50,315 2,489,217 With amounts past due 61 to 90 days 645,023 126,075 147,436 918,534 With amounts past due over 90 days 4,506,224 29,094,376 280,910 33,881,510 5,151,247 32,305,384 621,513 38,078,144 Fair value of collateral 12,707,085 - - 12,707,085
Upon initial recognition of loans and receivables, the fair value of collateral is based on valuation techniques commonly used for the corresponding assets. In subsequent periods, the fair value is updated by reference to market price or indexes of similar assets.
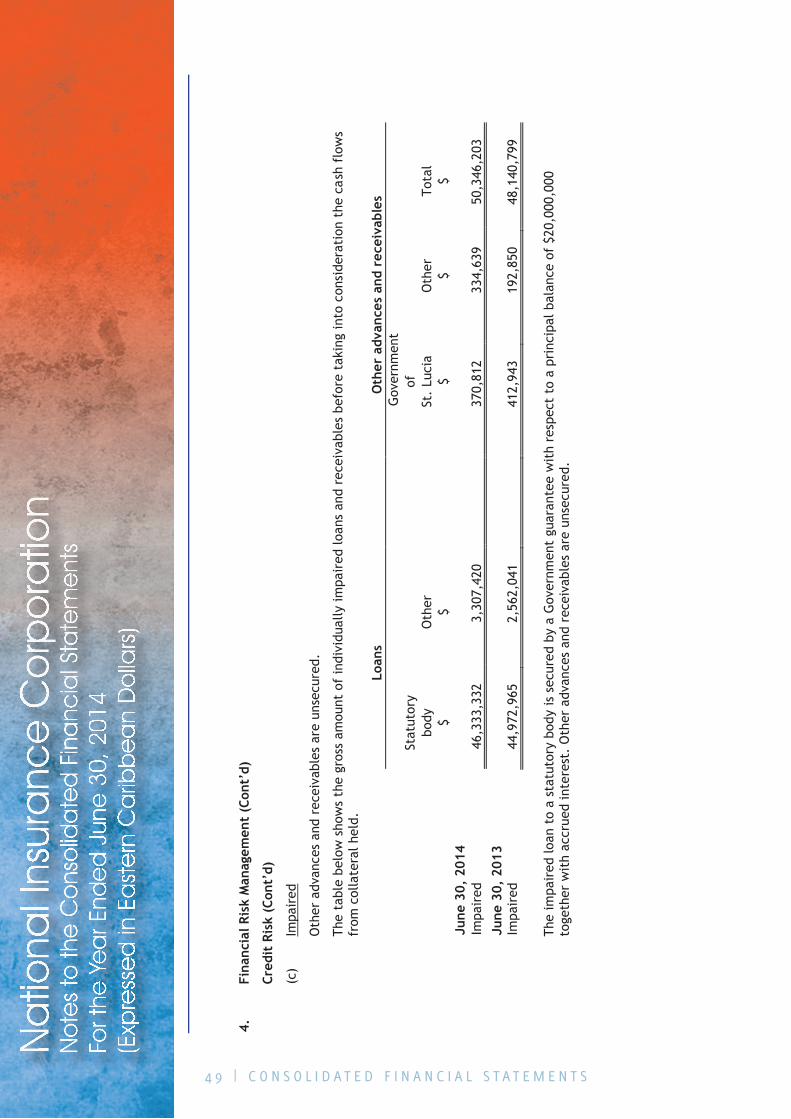
4 9 | C O N S O L I D A T E D F I N A N C I A L S T A T E M E N T S
Na
tiona
l Ins
ura
nce
Co
rpo
ratio
nN
ote
s to
the
Co
nso
lida
ted
Fin
anc
ial S
tate
me
nts
For t
he Y
ea
r End
ed
Jun
e 3
0, 2
014
(Exp
ress
ed
in E
ast
ern
Ca
ribb
ea
n D
olla
rs)
4.
Fina
ncia
l Ris
k M
anag
emen
t (C
ont’
d)
Cred
it R
isk
(Con
t’d)
(c)
Impa
ired
Oth
er a
dvan
ces
and
rece
ivab
les
are
unse
cure
d.
The
tabl
e be
low
sho
ws
the
gros
s am
ount
of
indi
vidu
ally
impa
ired
loan
s an
d re
ceiv
able
s be
fore
tak
ing
into
con
side
rati
on t
he c
ash
flow
s fr
om c
olla
tera
l hel
d.
June
30,
201
3
Im
pair
ed
44,9
72,9
65
2,56
2,04
1
412,
943
192,
850
48,1
40,7
99
Th
e im
pair
ed lo
an t
o a
stat
utor
y bo
dy is
sec
ured
by
a G
over
nmen
t gu
aran
tee
wit
h re
spec
t to
a p
rinc
ipal
bal
ance
of
$20,
000,
000
toge
ther
wit
h ac
crue
d in
tere
st.
Oth
er a
dvan
ces
and
rece
ivab
les
are
unse
cure
d.
Lo
ans
O
ther
adv
ance
s an
d re
ceiv
able
s
Gov
ernm
ent
St
atut
ory
of
bo
dy
Oth
er
St
. Lu
cia
O
ther
To
tal
$
$
$
$
$ Ju
ne 3
0, 2
014
Impa
ired
46
,333
,332
3,
307,
420
37
0,81
2 33
4,63
9 50
,346
,203
4. Financial Risk Management (Cont’d)
Credit Risk (Cont’d)
Debt securities, treasury bills and other eligible bills
The table below presents an analysis of debt securities, treasury bills and other eligible bills by rating
Treasury Debt bills securities Total $ $ $ A- to A+ - 143,062,928 143,062,928 Lower than A- 33,150,038 359,725,408 392,875,446 Unrated - 457,891,164 457,891,164 33,150,038 960,679,500 993,829,538
agency designation at June 30, 2014, based on Standard & Poor‟s ratings, CariCRIS or their equivalent:-
The table below presents an analysis of debt securities, treasury bills and other eligible bills by rating agency designation at June 30, 2013, based on Standard & Poor‟s ratings, CariCRIS or their equivalent:- Treasury Debt bills securities Total $ $ $ A- to A+ - 151,107,974 151,107,974 Lower than A- 63,061,684 302,140,171 365,201,855 Unrated – 454,444,831 454,444,831 63,061,684 907,692,976 970,754,660
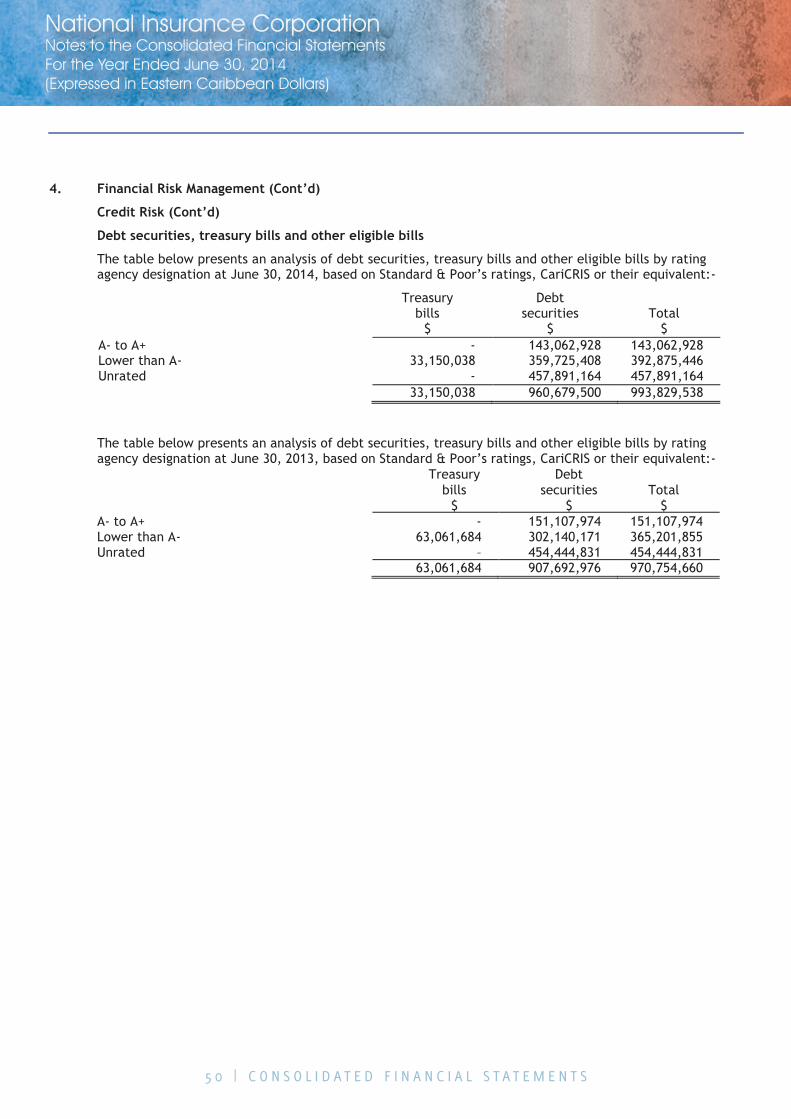
5 0 | C O N S O L I D A T E D F I N A N C I A L S T A T E M E N T S
National Insurance CorporationNotes to the Consolidated Financial Statements For the Year Ended June 30, 2014(Expressed in Eastern Caribbean Dollars)
4. Financial Risk Management (Cont’d)
Credit Risk (Cont’d)
Debt securities, treasury bills and other eligible bills
The table below presents an analysis of debt securities, treasury bills and other eligible bills by rating
Treasury Debt bills securities Total $ $ $ A- to A+ - 143,062,928 143,062,928 Lower than A- 33,150,038 359,725,408 392,875,446 Unrated - 457,891,164 457,891,164 33,150,038 960,679,500 993,829,538
agency designation at June 30, 2014, based on Standard & Poor‟s ratings, CariCRIS or their equivalent:-
The table below presents an analysis of debt securities, treasury bills and other eligible bills by rating agency designation at June 30, 2013, based on Standard & Poor‟s ratings, CariCRIS or their equivalent:- Treasury Debt bills securities Total $ $ $ A- to A+ - 151,107,974 151,107,974 Lower than A- 63,061,684 302,140,171 365,201,855 Unrated – 454,444,831 454,444,831 63,061,684 907,692,976 970,754,660

5 1 | C O N S O L I D A T E D F I N A N C I A L S T A T E M E N T S
National Insurance CorporationNotes to the Consolidated Financial Statements For the Year Ended June 30, 2014(Expressed in Eastern Caribbean Dollars)
4. Financial Risk Management (Cont’d)
Credit Risk (Cont’d)
Concentration of risks of financial assets with credit risk exposure
(a) Geographical Sectors
The following table breaks down the Group‟s main credit exposure at their carrying amounts, as categorised by the geographical sectors of our counterparties.
Extra Local Regional Regional Total $ $ $ $ As at June 2014 Cash and cash equivalents 88,331,391 - - 88,331,391 Financial assets: - Fair value through
As at June 2013 Cash and cash equivalents 45,252,506 - - 45,252,506 Financial assets: - Fair value through
income - - 72,006,528 72,006,528 - Loans and receivables 266,386,939 - - 266,386,939 Investment securities: - Held-to-maturity 376,953,581 30,045,104 - 406,998,685 - Loans and receivables 273,581,832 241,242,493 - 514,824,325 On balance sheet financial position 1,005,253,743 271,287,597 72,006,528 1,348,547,868 Credit commitments 5,194,657 - - 5,194,657 1,010,448,400 271,287,597 72,006,528 1,353,742,525
income - - 68,545,715 68,545,715 - Loans and receivables 272,198,024 - - 272,198,024 Investment securities: - Held-to-maturity 349,680,743 14,913,555 - 364,594,298 - Loans and receivables 298,377,749 239,236,898 - 537,614,647 On balance sheet financial position 965,509,022 254,150,453 68,545,715 1,288,205,190 Credit commitments 17,478,399 - - 17,478,399 982,987,421 254,150,453 68,545,715 1,305,683,589
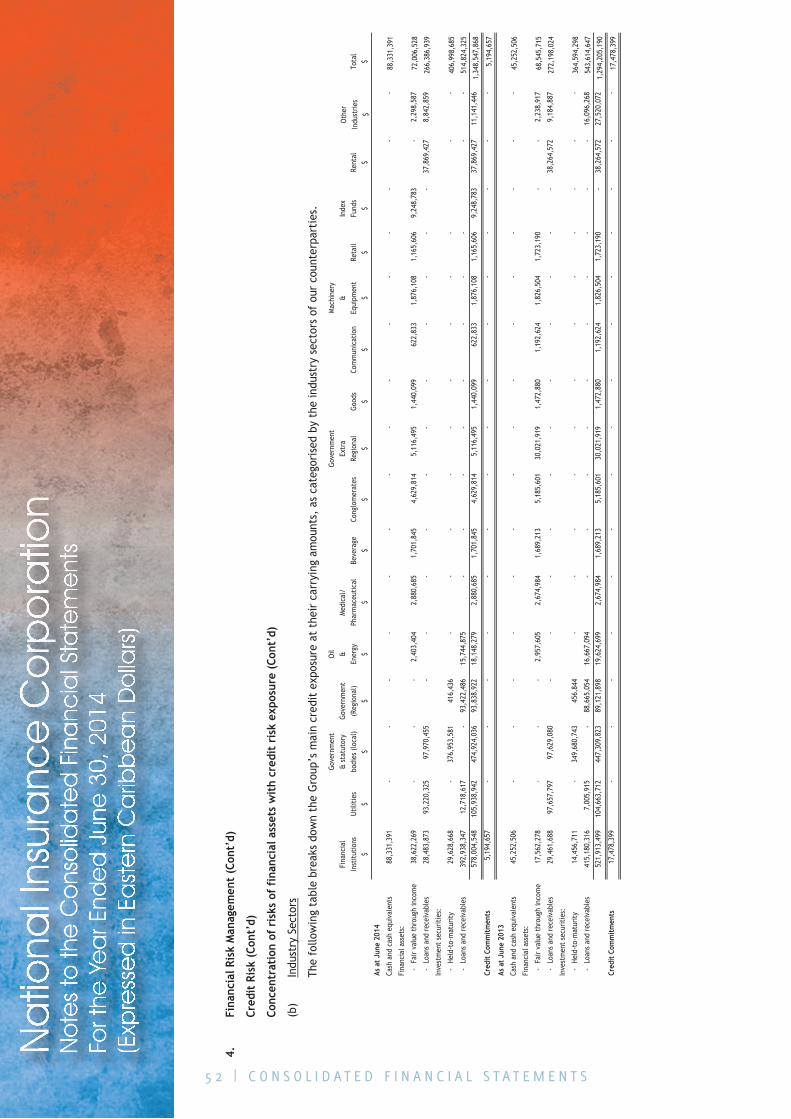
5 2 | C O N S O L I D A T E D F I N A N C I A L S T A T E M E N T S
Na
tiona
l Ins
ura
nce
Co
rpo
ratio
nN
ote
s to
the
Co
nso
lida
ted
Fin
anc
ial S
tate
me
nts
For t
he Y
ea
r End
ed
Jun
e 3
0, 2
014
(Exp
ress
ed
in E
ast
ern
Ca
ribb
ea
n D
olla
rs)
4.
Fina
ncia
l Ris
k M
anag
emen
t (C
ont’
d)
Cred
it R
isk
(Con
t’d)
Conc
entr
atio
n of
ris
ks o
f fi
nanc
ial a
sset
s w
ith
cred
it r
isk
expo
sure
(Co
nt’d
)
(b)
Indu
stry
Sec
tors
The
follo
win
g ta
ble
brea
ks d
own
the
Gro
up‟s
mai
n cr
edit
exp
osur
e at
the
ir c
arry
ing
amou
nts,
as
cate
gori
sed
by t
he in
dust
ry s
ecto
rs o
f ou
r co
unte
rpar
ties
. G
over
nmen
tOi
lG
over
nmen
tM
achi
nery
Fina
ncia
l &
sta
tuto
ryG
over
nmen
t&
Med
ical
/Ex
tra
&In
dex
Othe
rIn
stit
utio
nsUt
iliti
esbo
dies
(loc
al)
(Reg
iona
l)En
ergy
Phar
mac
euti
cal
Beve
rage
Cong
lom
erat
esRe
gion
alG
oods
Com
mun
icat
ion
Equi
pmen
tRe
tail
Fund
sRe
ntal
Indu
strie
sTo
tal
$$
$$
$$
$$
$$
$$
$$
$$
$
As a
t Jun
e 20
14
Cash
and
cas
h eq
uiva
lent
s
88
,331
,391
-
--
-
-
-
-
-
-
-
-
-
-
--
88,3
31,3
91
Fina
ncia
l ass
ets:
- F
air
valu
e th
roug
h in
com
e
38
,622
,269
-
-
-
2,
403,
404
2
,880
,685
1,
701,
845
4
,629
,814
5,
116,
495
1,44
0,09
9
6
22,8
33
1,87
6,10
8
1,1
65,6
06
9
,248
,783
-
2,
298,
587
266,
386,
939
In
vest
men
t se
curit
ies:
- H
eld-
to-m
atur
ity
29,6
28,6
68
-
376,
953,
581
416
,436
-
-
-
-
-
-
-
-
-
-
-
514,
824,
325
578
,004
,548
105,
938,
942
474,
924,
036
9
3,83
8,92
2
18,
148,
279
2
,880
,685
1,
701,
845
4
,629
,814
5,
116,
495
1,44
0,09
9
6
22,8
33
1,87
6,10
8
1,1
65,6
06
9
,248
,783
37,
869,
427
1
1,14
1,44
6 1,
348,
547,
868
Cred
it Co
mm
itmen
ts
5
,194
,657
-
--
-
-
-
-
-
-
-
-
--
--
5,19
4,65
7
As a
t Jun
e 20
13
Cash
and
cas
h eq
uiva
lent
s
45
,252
,506
-
--
-
-
-
-
-
-
-
-
-
-
--
45,2
52,5
06
Fina
ncia
l ass
ets:
- F
air
valu
e th
roug
h in
com
e
17
,562
,278
-
- -
2,95
7,60
5
2,6
74,9
84
1,68
9,21
3
5,1
85,6
01
3
0,02
1,91
9
1,
472,
880
1
,192
,624
1,
826,
504
1
,723
,190
-
-
2,
238,
917
- H
eld-
to-m
atur
ity
14,4
56,7
11
-
34
9,68
0,74
3
4
56,8
44
-
-
-
-
-
-
-
-
-
-
- -
543,
614,
647
521
,913
,499
104,
663,
712
447,
309,
823
8
9,12
1,89
8
19,
624,
699
2
,674
,984
1,
689,
213
5
,185
,601
30,
021,
919
1,47
2,88
0
1,1
92,6
24
1,82
6,50
4
1,7
23,1
90
-
38,
264,
572
2
7,52
0,07
2 1,
294,
205,
190
Cred
it Co
mm
itmen
ts
17
,478
,399
-
--
-
-
-
-
-
-
-
-
--
--
17,4
78,3
99
72
,006
,528
- L
oans
and
rec
eiva
bles
28,4
83,8
73
9
3,22
0,32
5
9
7,97
0,45
5
-
-
-
-
-
-
-
-
-
-
-
3
7,86
9,42
7
8,
842,
859
364
,594
,298
- L
oans
and
rec
eiva
bles
4
15,1
80,3
16
7,0
05,9
15
-
88,
665,
054
1
6,66
7,09
4
-
-
-
-
-
-
-
-
-
-
16,
096,
268
406
,998
,685
- L
oans
and
rec
eiva
bles
3
92,9
38,3
47
1
2,71
8,61
7
-
9
3,42
2,48
6
15,
744,
875
-
-
-
-
-
-
- -
-
-
272
,198
,024
Inve
stm
ent
secu
ritie
s:
68
,545
,715
- L
oans
and
rec
eiva
bles
29,4
61,6
88
9
7,65
7,79
7
9
7,62
9,08
0
-
-
-
-
-
-
-
-
-
-
-
3
8,26
4,57
2
9,
184,
887
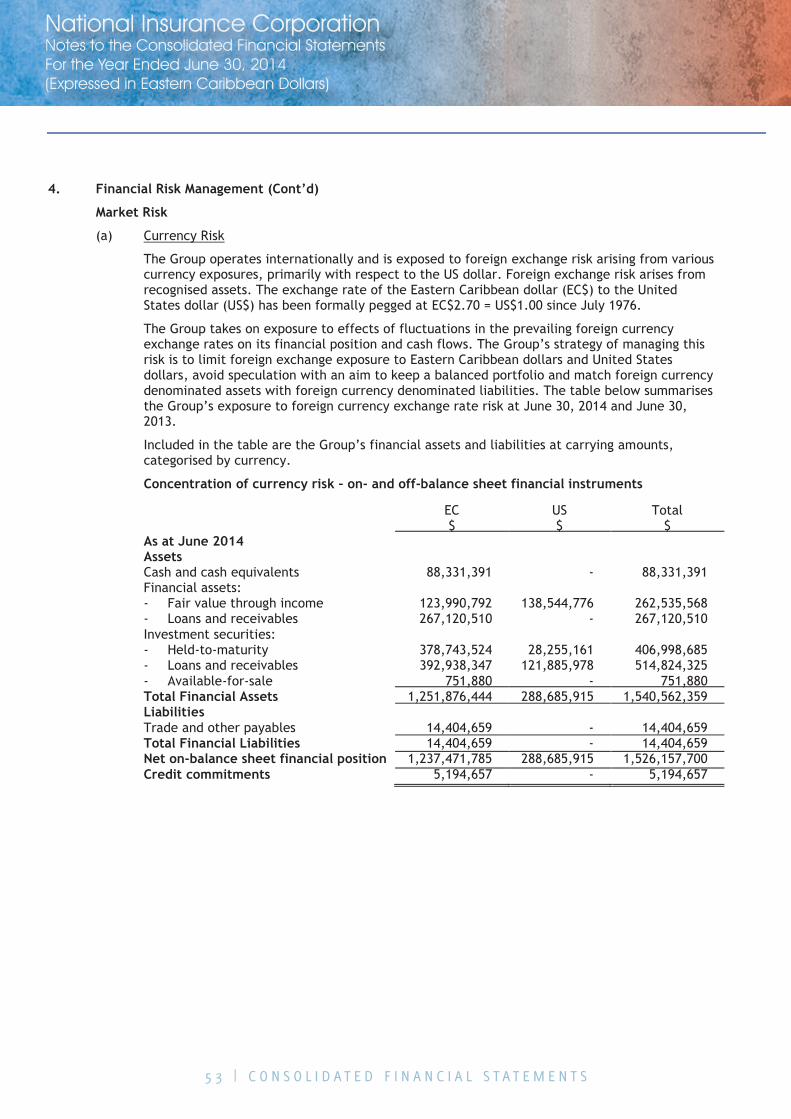
5 3 | C O N S O L I D A T E D F I N A N C I A L S T A T E M E N T S
National Insurance CorporationNotes to the Consolidated Financial Statements For the Year Ended June 30, 2014(Expressed in Eastern Caribbean Dollars)
The Group operates internationally and is exposed to foreign exchange risk arising from various currency exposures, primarily with respect to the US dollar. Foreign exchange risk arises from recognised assets. The exchange rate of the Eastern Caribbean dollar (EC$) to the United States dollar (US$) has been formally pegged at EC$2.70 = US$1.00 since July 1976.
The Group takes on exposure to effects of fluctuations in the prevailing foreign currency exchange rates on its financial position and cash flows. The Group‟s strategy of managing this risk is to limit foreign exchange exposure to Eastern Caribbean dollars and United States dollars, avoid speculation with an aim to keep a balanced portfolio and match foreign currency denominated assets with foreign currency denominated liabilities. The table below summarises the Group‟s exposure to foreign currency exchange rate risk at June 30, 2014 and June 30, 2013.
Included in the table are the Group‟s financial assets and liabilities at carrying amounts, categorised by currency.
Concentration of currency risk – on- and off-balance sheet financial instruments
EC US Total $ $ $ As at June 2014 Assets Cash and cash equivalents 88,331,391 - 88,331,391 Financial assets: - Fair value through income 123,990,792 138,544,776 262,535,568 - Loans and receivables 267,120,510 - 267,120,510 Investment securities: - Held-to-maturity 378,743,524 28,255,161 406,998,685 - Loans and receivables 392,938,347 121,885,978 514,824,325 - Available-for-sale 751,880 - 751,880 Total Financial Assets 1,251,876,444 288,685,915 1,540,562,359 Liabilities Trade and other payables 14,404,659 - 14,404,659 Total Financial Liabilities 14,404,659 - 14,404,659 Net on-balance sheet financial position 1,237,471,785 288,685,915 1,526,157,700 Credit commitments 5,194,657 - 5,194,657
4. Financial Risk Management (Cont’d)
Market Risk
(a) Currency Risk
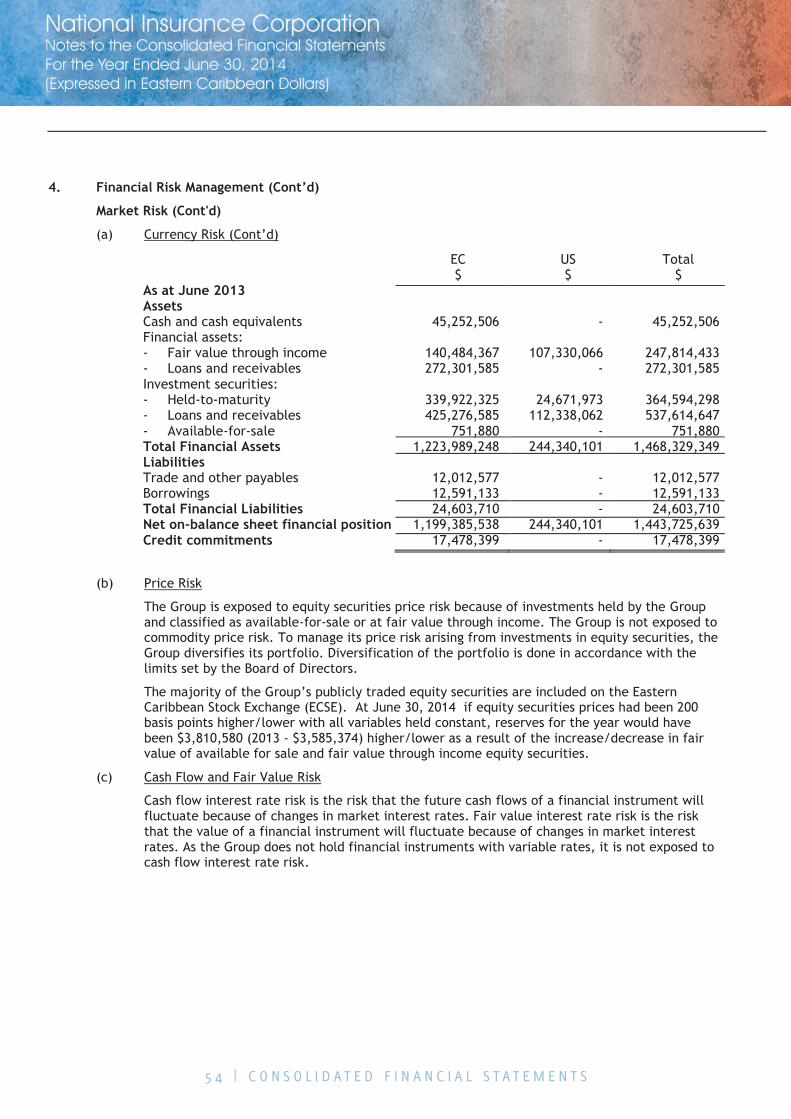
5 4 | C O N S O L I D A T E D F I N A N C I A L S T A T E M E N T S
National Insurance CorporationNotes to the Consolidated Financial Statements For the Year Ended June 30, 2014(Expressed in Eastern Caribbean Dollars)
(b) Price Risk
The Group is exposed to equity securities price risk because of investments held by the Group and classified as available-for-sale or at fair value through income. The Group is not exposed to commodity price risk. To manage its price risk arising from investments in equity securities, the Group diversifies its portfolio. Diversification of the portfolio is done in accordance with the limits set by the Board of Directors.
(c) Cash Flow and Fair Value Risk
Cash flow interest rate risk is the risk that the future cash flows of a financial instrument will fluctuate because of changes in market interest rates. Fair value interest rate risk is the risk that the value of a financial instrument will fluctuate because of changes in market interest rates. As the Group does not hold financial instruments with variable rates, it is not exposed to cash flow interest rate risk.
4. Financial Risk Management (Cont’d)
Market Risk (Cont'd)
(a) Currency Risk (Cont‟d)
EC US Total $ $ $ As at June 2013 Assets Cash and cash equivalents 45,252,506 - 45,252,506 Financial assets: - Fair value through income 140,484,367 107,330,066 247,814,433 - Loans and receivables 272,301,585 - 272,301,585 Investment securities: - Held-to-maturity 339,922,325 24,671,973 364,594,298 - Loans and receivables 425,276,585 112,338,062 537,614,647 - Available-for-sale 751,880 - 751,880 Total Financial Assets 1,223,989,248 244,340,101 1,468,329,349 Liabilities Trade and other payables 12,012,577 - 12,012,577 Borrowings 12,591,133 - 12,591,133 Total Financial Liabilities 24,603,710 - 24,603,710 Net on-balance sheet financial position 1,199,385,538 244,340,101 1,443,725,639 Credit commitments 17,478,399 - 17,478,399
The majority of the Group‟s publicly traded equity securities are included on the Eastern Caribbean Stock Exchange (ECSE). At June 30, 2014 if equity securities prices had been 200 basis points higher/lower with all variables held constant, reserves for the year would have been $3,810,580 (2013 - $3,585,374) higher/lower as a result of the increase/decrease in fair value of available for sale and fair value through income equity securities.
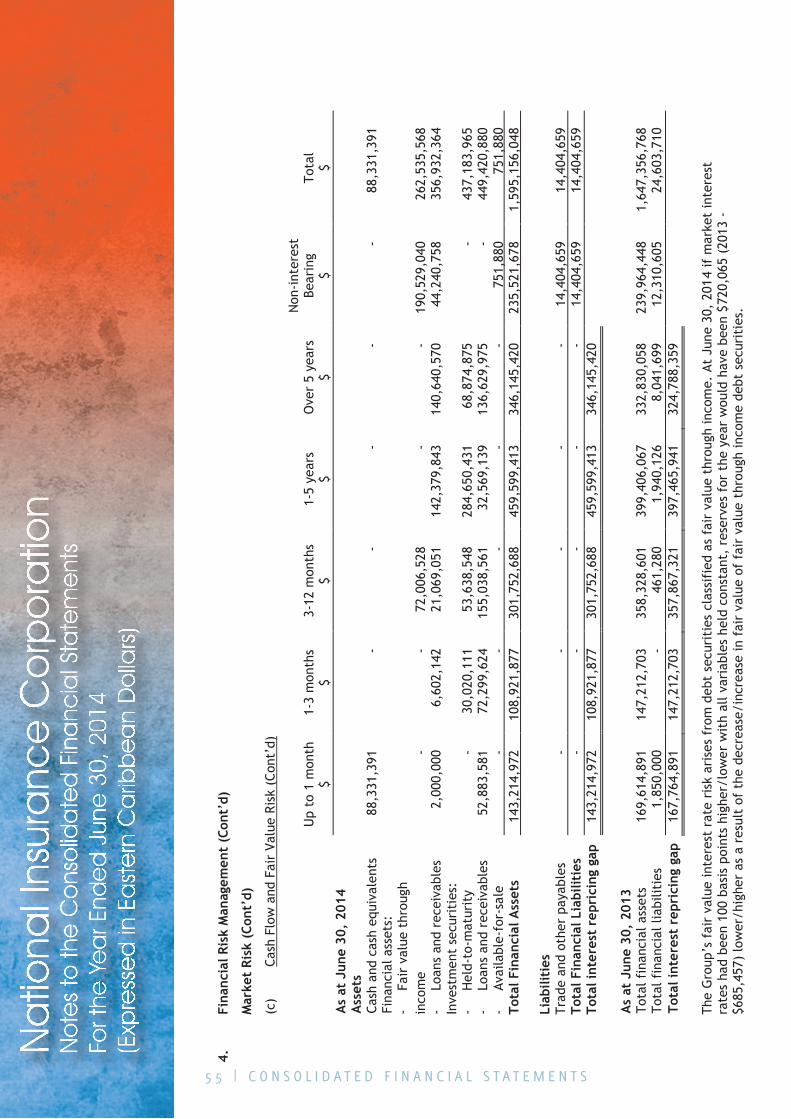
5 5 | C O N S O L I D A T E D F I N A N C I A L S T A T E M E N T S
Na
tiona
l Ins
ura
nce
Co
rpo
ratio
nN
ote
s to
the
Co
nso
lida
ted
Fin
anc
ial S
tate
me
nts
For t
he Y
ea
r End
ed
Jun
e 3
0, 2
014
(Exp
ress
ed
in E
ast
ern
Ca
ribb
ea
n D
olla
rs)
4.Fi
nanc
ial R
isk
Man
agem
ent
(Con
t’d)
Mar
ket
Risk
(Co
nt’d
)
(c)
Cash
Flo
w a
nd F
air
Valu
e Ri
sk (
Con
t’d)
Non
-int
eres
t
U
p to
1 m
onth
1-
3 m
onth
s 3-
12 m
onth
s 1-
5 ye
ars
Ove
r 5
year
s Be
arin
g To
tal
$
$ $
$ $
$ $
As
at J
une
30,
2014
Ass
ets
Ca
sh a
nd c
ash
equi
vale
nts
88,3
31,3
91
- -
- -
- 88
,331
,391
Fi
nanc
ial a
sset
s:
-
Fair
val
ue t
hrou
gh
As
at J
une
30,
2013
Tota
l fin
anci
al a
sset
s 16
9,61
4,89
1 14
7,21
2,70
3 35
8,32
8,60
1 39
9,40
6,06
7 33
2,83
0,05
8 23
9,96
4,44
8 1,
647,
356,
768
Tota
l fin
anci
al li
abili
ties
1,
850,
000
- 46
1,28
0 1,
940,
126
8,04
1,69
9 12
,310
,605
24
,603
,710
To
tal i
nter
est
repr
icin
g ga
p 16
7,76
4,89
1 14
7,21
2,70
3 35
7,86
7,32
1 39
7,46
5,94
1 32
4,78
8,35
9
Th
e G
roup
’s f
air
valu
e in
tere
st r
ate
risk
ari
ses
from
deb
t se
curi
ties
cla
ssif
ied
as f
air
valu
e th
roug
h in
com
e. A
t Ju
ne 3
0, 2
014
if m
arke
t in
tere
st
rate
s ha
d be
en 1
00 b
asis
poi
nts
high
er/l
ower
wit
h al
l var
iabl
es h
eld
cons
tant
, re
serv
es f
or t
he y
ear
wou
ld h
ave
been
$72
0,06
5 (2
013
- $6
85,4
57)
low
er/h
ighe
r as
a r
esul
t of
the
dec
reas
e/in
crea
se in
fai
r va
lue
of f
air
valu
e th
roug
h in
com
e de
bt s
ecur
itie
s.
inco
me
- -
72,0
06,5
28
- -
190,
529,
040
262,
535,
568
-Lo
ans
and
rece
ivab
les
2,00
0,00
0 6,
602,
142
21,0
69,0
51
142,
379,
843
140,
640,
570
44,2
40,7
58
356,
932,
364
Inve
stm
ent
secu
riti
es:
-
Hel
d-to
-mat
urit
y -
30,0
20,1
11
53,6
38,5
48
284,
650,
431
68,8
74,8
75
- 43
7,18
3,96
5 -
Loan
s an
d re
ceiv
able
s 52
,883
,581
72
,299
,624
15
5,03
8,56
1 32
,569
,139
13
6,62
9,97
5 -
449,
420,
880
-Av
aila
ble-
for-
sale
-
- -
- -
751,
880
751,
880
Tota
l Fin
anci
al A
sset
s 14
3,21
4,97
2 10
8,92
1,87
7 30
1,75
2,68
8 45
9,59
9,41
3 34
6,14
5,42
0 23
5,52
1,67
8 1,
595,
156,
048
Liab
ilities
Trad
e an
d ot
her
paya
bles
-
- -
- -
14,4
04,6
59
14,4
04,6
59
Tota
l Fin
anci
al L
iabi
litie
s -
- -
- -
14,4
04,6
59
14,4
04,6
59
Tota
l int
eres
t re
pric
ing
gap
143,
214,
972
108,
921,
877
301,
752,
688
459,
599,
413
346,
145,
420
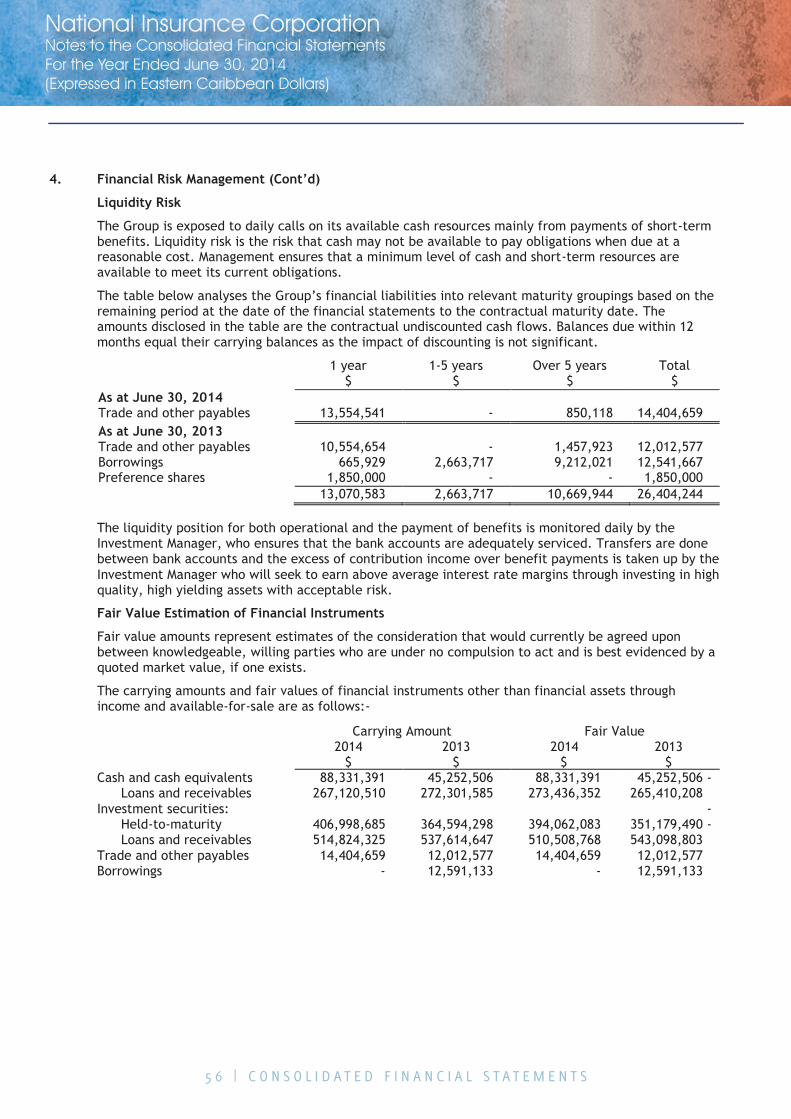
5 6 | C O N S O L I D A T E D F I N A N C I A L S T A T E M E N T S
National Insurance CorporationNotes to the Consolidated Financial Statements For the Year Ended June 30, 2014(Expressed in Eastern Caribbean Dollars)
4. Financial Risk Management (Cont’d)
Liquidity Risk
The Group is exposed to daily calls on its available cash resources mainly from payments of short-term benefits. Liquidity risk is the risk that cash may not be available to pay obligations when due at a reasonable cost. Management ensures that a minimum level of cash and short-term resources are available to meet its current obligations.
The table below analyses the Group‟s financial liabilities into relevant maturity groupings based on the remaining period at the date of the financial statements to the contractual maturity date. The amounts disclosed in the table are the contractual undiscounted cash flows. Balances due within 12 months equal their carrying balances as the impact of discounting is not significant.
1 year 1-5 years Over 5 years Total $ $ $ $ As at June 30, 2014 Trade and other payables 13,554,541 - 850,118 14,404,659 As at June 30, 2013 Trade and other payables 10,554,654 - 1,457,923 12,012,577 Borrowings 665,929 2,663,717 9,212,021 12,541,667 Preference shares 1,850,000 - - 1,850,000 13,070,583 2,663,717 10,669,944 26,404,244
Fair Value Estimation of Financial Instruments
Fair value amounts represent estimates of the consideration that would currently be agreed upon between knowledgeable, willing parties who are under no compulsion to act and is best evidenced by a quoted market value, if one exists.
The carrying amounts and fair values of financial instruments other than financial assets through income and available-for-sale are as follows:-
The liquidity position for both operational and the payment of benefits is monitored daily by the Investment Manager, who ensures that the bank accounts are adequately serviced. Transfers are done between bank accounts and the excess of contribution income over benefit payments is taken up by the Investment Manager who will seek to earn above average interest rate margins through investing in high quality, high yielding assets with acceptable risk.
Carrying Amount Fair Value 2014 2013 2014 2013 $ $ $ $ Cash and cash equivalents 88,331,391 45,252,506 88,331,391 45,252,506 -
Loans and receivables 267,120,510 272,301,585 273,436,352 265,410,208 Investment securities: -
Held-to-maturity 406,998,685 364,594,298 394,062,083 351,179,490 -Loans and receivables 514,824,325 537,614,647 510,508,768 543,098,803
Trade and other payables 14,404,659 12,012,577 14,404,659 12,012,577 Borrowings - 12,591,133 - 12,591,133
5 7 | C O N S O L I D A T E D F I N A N C I A L S T A T E M E N T S
National Insurance CorporationNotes to the Consolidated Financial Statements For the Year Ended June 30, 2014(Expressed in Eastern Caribbean Dollars)
4. Financial Risk Management (Cont’d)
Fair Value Estimation of Financial Instruments (Cont’d)
The carrying value of cash and cash equivalents, other advances and receivables, and trade and other payables approximate their fair values due to the short-term maturity of these items.
The fair value of held-to-maturity and other loans and receivables financial assets for disclosure purposes are estimated by discounting the future contractual cash flows at the current market rate of 7.5% (2013 - 7.58%) that is available to the Group in respect of similar financial instruments.
The Group is not able to reliably estimate the fair value of available-for-sale financial assets since the shares are not traded in an active market and the future cash flows relating to the investment cannot be reliably estimated.
IFRS 7 specifies a hierarchy of valuation techniques based on whether the inputs to those valuation techniques are observable or unobservable. Observable inputs reflect market data obtained from independent sources; unobservable inputs reflect the Group‟s market assumptions. These two types of inputs have created the following fair value hierarchy:
Level 1 – Quoted prices (unadjusted) in active markets for identical assets or liabilities. This level includes listed equity securities and debt instruments on exchanges.
Level 2 – Inputs other than quoted prices included within Level 1 that are observable for the asset or liability, either directly (that is, as prices) or indirectly (that is, derived from prices).
Level 3 – inputs for the asset or liability that are not based on observable market data (unobservable inputs). This level includes equity investments and debt instruments with significant unobservable components.
This hierarchy requires the use of observable market data when available. The Group considers relevant and observable market prices in its valuations where possible.
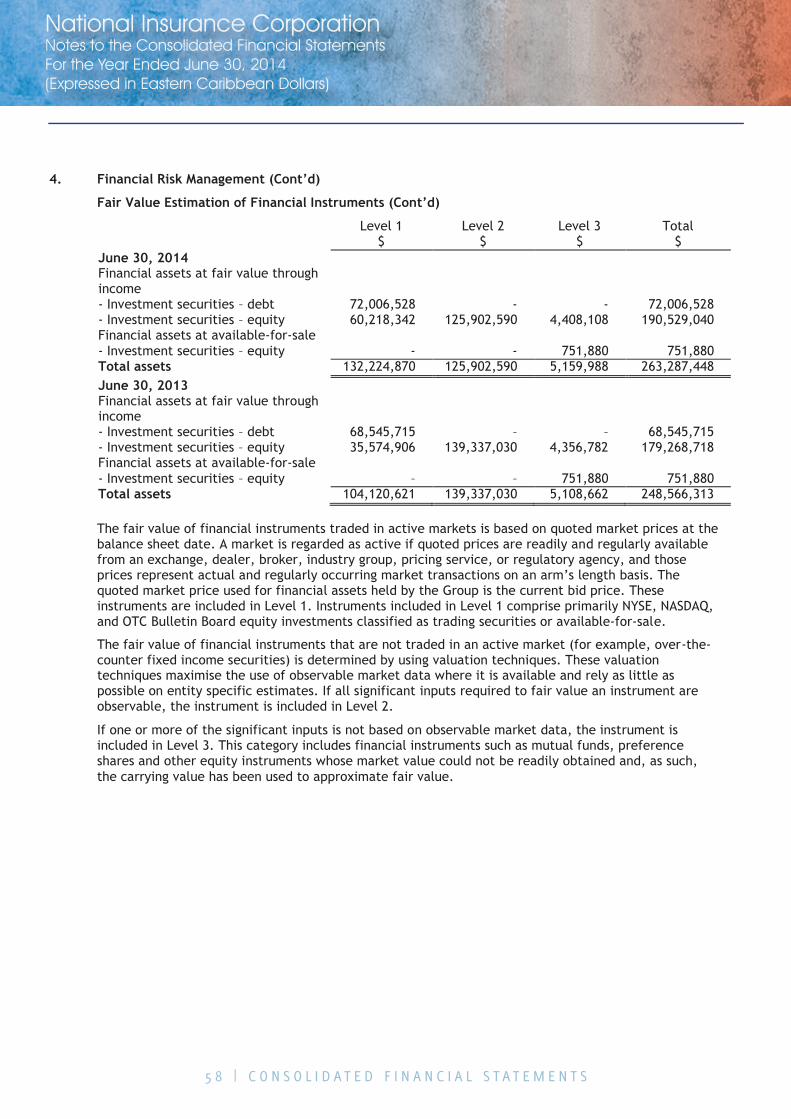
5 8 | C O N S O L I D A T E D F I N A N C I A L S T A T E M E N T S
National Insurance CorporationNotes to the Consolidated Financial Statements For the Year Ended June 30, 2014(Expressed in Eastern Caribbean Dollars)
4. Financial Risk Management (Cont’d)
Fair Value Estimation of Financial Instruments (Cont’d)
Level 1 Level 2 Level 3 Total $ $ $ $ June 30, 2014 Financial assets at fair value through income
June 30, 2013 Financial assets at fair value through income
The fair value of financial instruments that are not traded in an active market (for example, over-the-counter fixed income securities) is determined by using valuation techniques. These valuation techniques maximise the use of observable market data where it is available and rely as little as possible on entity specific estimates. If all significant inputs required to fair value an instrument are observable, the instrument is included in Level 2.
- Investment securities – debt 72,006,528 - - 72,006,528 - Investment securities – equity 60,218,342 125,902,590 4,408,108 190,529,040 Financial assets at available-for-sale - Investment securities – equity - - 751,880 751,880 Total assets 132,224,870 125,902,590 5,159,988 263,287,448
- Investment securities – debt 68,545,715 – – 68,545,715 - Investment securities – equity 35,574,906 139,337,030 4,356,782 179,268,718 Financial assets at available-for-sale - Investment securities – equity – – 751,880 751,880 Total assets 104,120,621 139,337,030 5,108,662 248,566,313
The fair value of financial instruments traded in active markets is based on quoted market prices at the balance sheet date. A market is regarded as active if quoted prices are readily and regularly available from an exchange, dealer, broker, industry group, pricing service, or regulatory agency, and those prices represent actual and regularly occurring market transactions on an arm‟s length basis. The quoted market price used for financial assets held by the Group is the current bid price. These instruments are included in Level 1. Instruments included in Level 1 comprise primarily NYSE, NASDAQ, and OTC Bulletin Board equity investments classified as trading securities or available-for-sale.
If one or more of the significant inputs is not based on observable market data, the instrument is included in Level 3. This category includes financial instruments such as mutual funds, preference shares and other equity instruments whose market value could not be readily obtained and, as such, the carrying value has been used to approximate fair value.

5 9 | C O N S O L I D A T E D F I N A N C I A L S T A T E M E N T S
National Insurance CorporationNotes to the Consolidated Financial Statements For the Year Ended June 30, 2014(Expressed in Eastern Caribbean Dollars)
2013.
Total loss for the period included in profit or loss for assets held at the end of the reporting period, under “Investment income” (337) Change in unrealised gains or losses for the period included in profit or loss for assets held at the end of the reporting period (337)
Total loss for the period included in profit or loss for assets held at the end of the reporting period, under “Investment income” (3,447) Change in unrealised gains or losses for the period included in profit or loss for assets held at the end of the reporting period (3,447)
The Group‟s policy is to recognize transfers into and transfers out of fair value hierarchy levels as of the date of the event or change in circumstances that caused the transfer. The transfers noted in 2014 and 2013 are due to the availability of observable data for those financial instruments held which were unavailable in the prior period.
Capital Risk Management
As further discussed in Note 24, actuarial reviews are conducted periodically in order to ensure that the Group‟s management has all the information required to adjust the rate of contribution to ensure that the statutory requirements to pensioners and contributors are met.
4. Financial Risk Management (Cont’d)
Fair Value Estimation of Financial Instruments (Cont’d)
Assets measured at fair value
The following table presents the changes in Level 3 instruments for the year ended June 30, 2014 and
Financial assets at fair value through income Equity securities $ June 30, 2014 At beginning of year 4,356,782 Loss recognized in profit and loss (337) Other changes 51,663 At end of year 4,408,108
June 30, 2013 At beginning of year 4,432,840 Transfers from Level 3 (42,750) Sale of securities (29,861) Loss recognized in profit and loss (3,447) At end of year 4,356,782
The Group‟s objectives when managing capital are to safeguard its ability to continue as a going concern and to meet its statutory obligation to pensioners and contributors.
6 0 | C O N S O L I D A T E D F I N A N C I A L S T A T E M E N T S
National Insurance CorporationNotes to the Consolidated Financial Statements For the Year Ended June 30, 2014(Expressed in Eastern Caribbean Dollars)
5. Critical Accounting Estimates and Judgements
Impairment of Loans and Advances
The Group reviews its loan portfolio to assess impairment annually. Management uses estimates based on historical loss experience for assets with credit risk characteristics and objective evidence of impairment similar to those in the portfolio when scheduling its future cash flows. The methodology and assumptions used for estimating both the amount and timing of future cash flows are reviewed regularly to reduce any differences between loss estimates and actual loss experience.
Held-to-maturity Investments
The Group follows the guidance of IAS 39 on classifying non-derivative financial assets with fixed or determinable payments and fixed maturity as held-to-maturity. This classification requires significant judgement. In making this judgement, the Group evaluates its intention and ability to hold such investments to maturity. If the Group fails to keep these investments to maturity other than for the specific circumstances – for example, selling an insignificant amount close to maturity – it will be required to reclassify the entire class as available-for-sale. The investments would therefore be measured at fair value not amortised cost. If the entire held-to-maturity investments are tainted, the carrying value would decrease by $12,936,602 (2013 - $13,414,808) with a corresponding entry in the fair value reserve in reserves.
Basis of Allocation of Income and Expenditure
The Group allocates income and expenditure to short-term and long-term benefits in accordance with the approved recommendations of the actuarial review. This allocation involves the use of estimates concerning factors such as demographic, economic and financial assumptions. Assumptions to project benefits and expenses are based on the Group‟s experience and are updated in each actuarial review.
Fair Value of Investment Properties
The Group makes estimates and assumptions that affect the reported amounts of assets and liabilities within the next financial year. Estimates and judgements are continually evaluated and based on historical experience and other factors, including expectations of future events that are believed to be reasonable under the circumstances.
The fair value of buildings included in investment properties as at June 30, 2014 is determined by using valuation techniques. The Group uses its judgement to select a variety of methods and make assumptions that are mainly based on market conditions existing at the end of each reporting period. Fair value of buildings is estimated by discounting expected rentals at market yields. If net cash flows had been 5% higher/lower with all variables held constant, the fair value of investment properties determined using the valuation model would have been $7,867,430 higher/lower (2013 - $4,432,947).
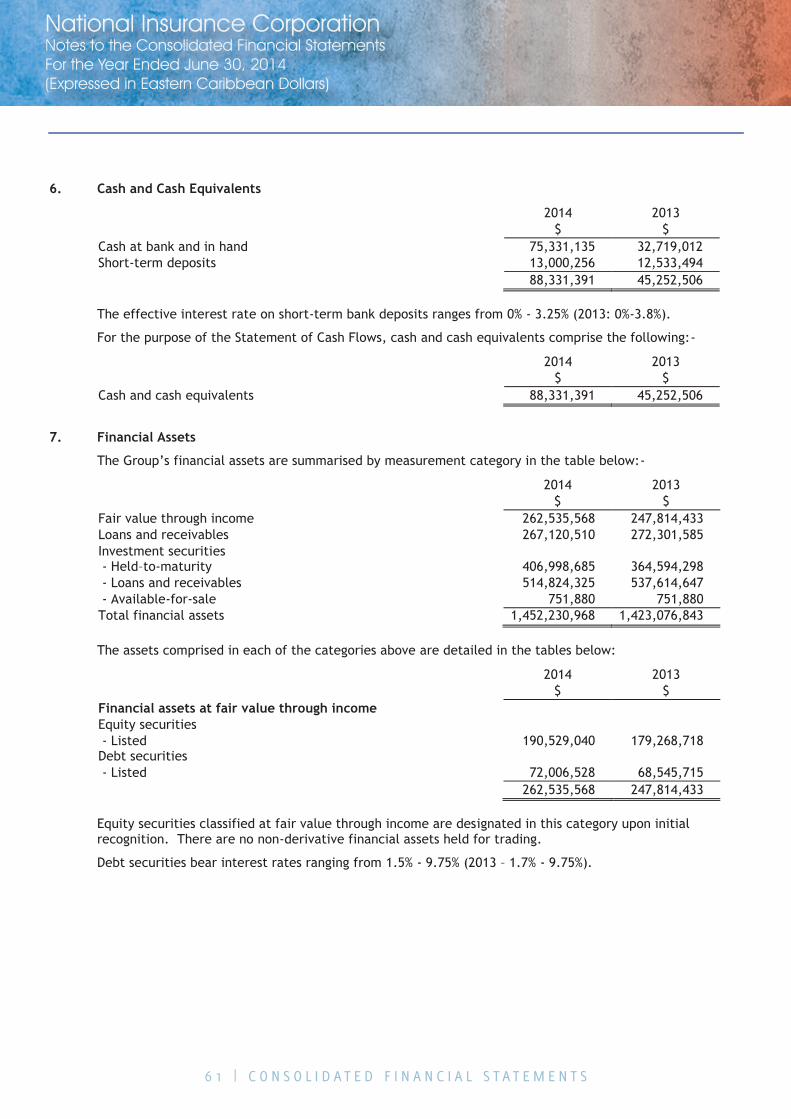
6 1 | C O N S O L I D A T E D F I N A N C I A L S T A T E M E N T S
National Insurance CorporationNotes to the Consolidated Financial Statements For the Year Ended June 30, 2014(Expressed in Eastern Caribbean Dollars)
6. Cash and Cash Equivalents
2014 2013
$ $
Cash at bank and in hand 75,331,135 32,719,012 Short-term deposits 13,000,256 12,533,494
88,331,391 45,252,506
2014 2013
$ $
Cash and cash equivalents 88,331,391 45,252,506
7. Financial Assets
The Group‟s financial assets are summarised by measurement category in the table below:-
2014 2013
$ $
Fair value through income 262,535,568 247,814,433 Loans and receivables 267,120,510 272,301,585 Investment securities
The assets comprised in each of the categories above are detailed in the tables below:
2014 2013
$ $
Financial assets at fair value through income
Equity securities
- Listed 190,529,040 179,268,718 Debt securities
- Listed 72,006,528 68,545,715
262,535,568 247,814,433
Equity securities classified at fair value through income are designated in this category upon initial recognition. There are no non-derivative financial assets held for trading.
Debt securities bear interest rates ranging from 1.5% - 9.75% (2013 – 1.7% - 9.75%).
- Held–to-maturity 406,998,685 364,594,298 - Loans and receivables 514,824,325 537,614,647 - Available-for-sale 751,880 751,880 Total financial assets 1,452,230,968 1,423,076,843
For the purpose of the Statement of Cash Flows, cash and cash equivalents comprise the following:-
The effective interest rate on short-term bank deposits ranges from 0% - 3.25% (2013: 0%-3.8%).
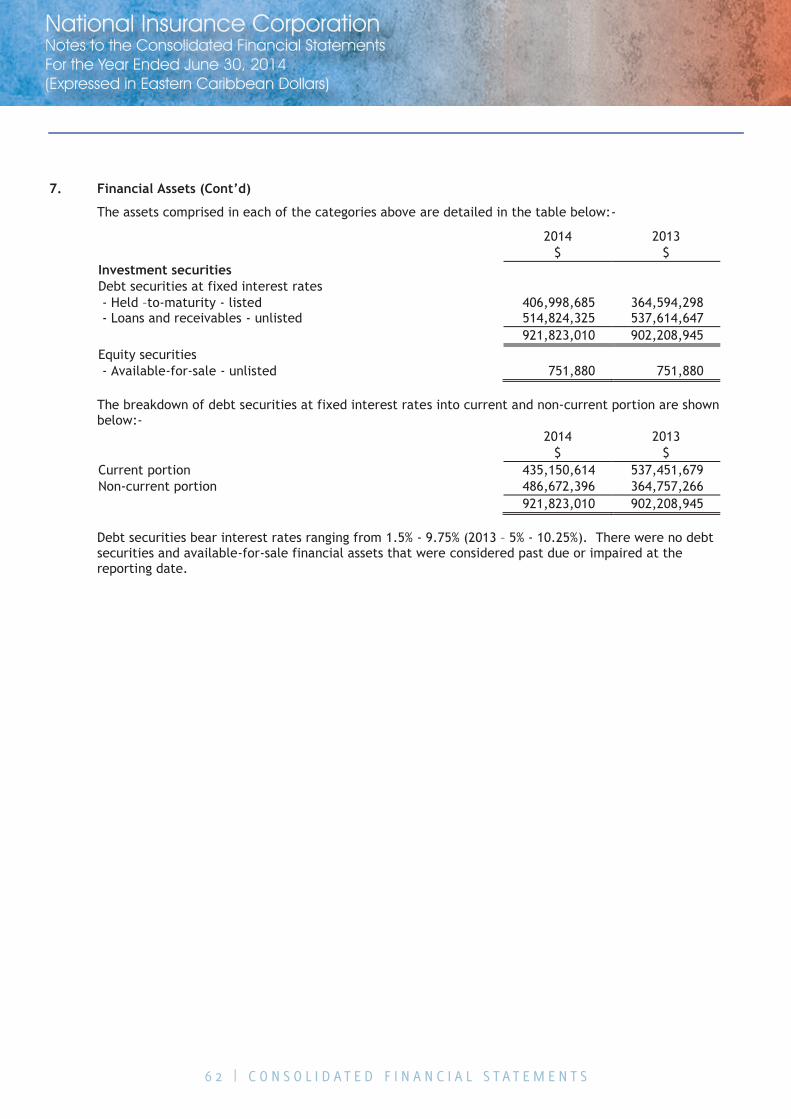
6 2 | C O N S O L I D A T E D F I N A N C I A L S T A T E M E N T S
National Insurance CorporationNotes to the Consolidated Financial Statements For the Year Ended June 30, 2014(Expressed in Eastern Caribbean Dollars)
7. Financial Assets (Cont’d)
The assets comprised in each of the categories above are detailed in the table below:-
2014 2013
$ $
Investment securities
Debt securities at fixed interest rates
- Held –to-maturity - listed 406,998,685 364,594,298 - Loans and receivables - unlisted 514,824,325 537,614,647
921,823,010 902,208,945
Equity securities
- Available-for-sale - unlisted 751,880 751,880 The breakdown of debt securities at fixed interest rates into current and non-current portion are shown below:-
2014 2013
$ $
Current portion 435,150,614 537,451,679 Non-current portion 486,672,396 364,757,266
921,823,010 902,208,945
Debt securities bear interest rates ranging from 1.5% - 9.75% (2013 – 5% - 10.25%). There were no debt securities and available-for-sale financial assets that were considered past due or impaired at the reporting date.
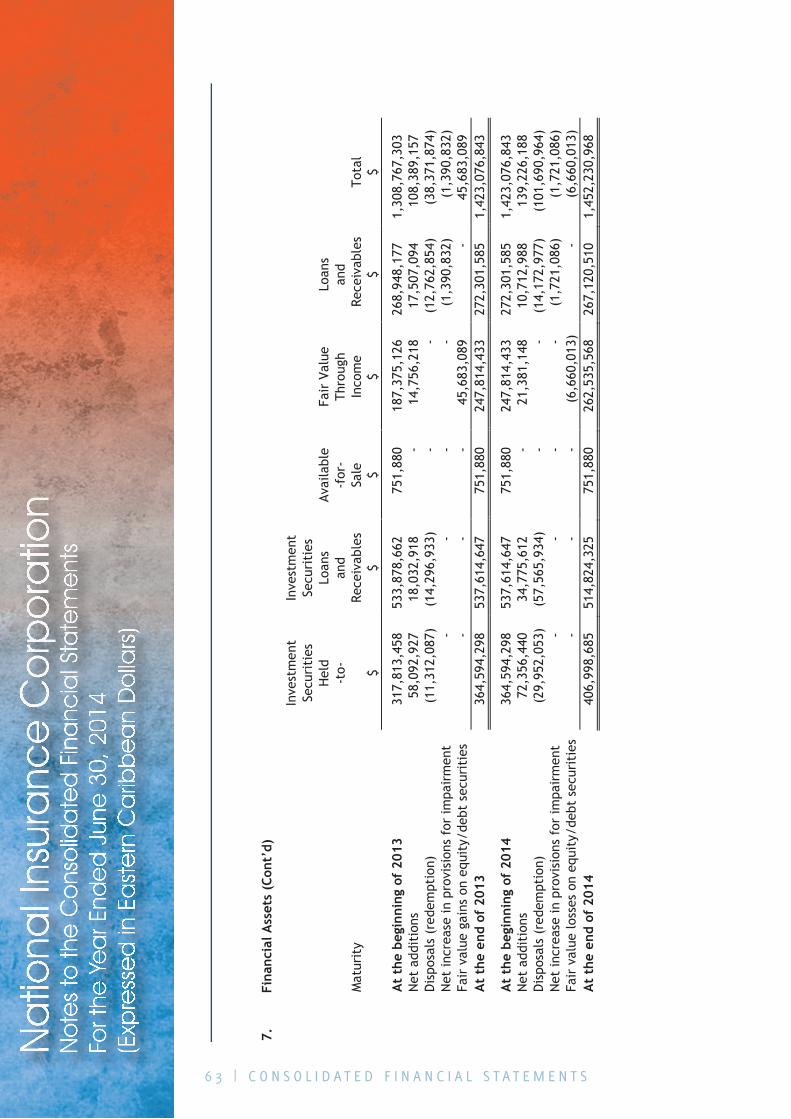
6 3 | C O N S O L I D A T E D F I N A N C I A L S T A T E M E N T S
Na
tiona
l Ins
ura
nce
Co
rpo
ratio
nN
ote
s to
the
Co
nso
lida
ted
Fin
anc
ial S
tate
me
nts
For t
he Y
ea
r End
ed
Jun
e 3
0, 2
014
(Exp
ress
ed
in E
ast
ern
Ca
ribb
ea
n D
olla
rs)
7.
Fina
ncia
l Ass
ets
(Con
t’d)
In
vest
men
t In
vest
men
t
Secu
riti
es
Secu
riti
es
H
eld
Loan
s
Avai
labl
e Fa
ir V
alue
Lo
ans
-t
o-
and
-for
- Th
roug
h an
d
$
$ $
$ $
$
At
the
begi
nnin
g of
201
3
317,
813,
458
533,
878,
662
751,
880
187,
375,
126
268,
948,
177
1,30
8,76
7,30
3 N
et a
ddit
ions
58
,092
,927
18
,032
,918
-
14,7
56,2
18
17,5
07,0
94
108,
389,
157
Dis
posa
ls (
rede
mpt
ion)
(1
1,31
2,08
7)
(14,
296,
933)
-
- (1
2,76
2,85
4)
(38,
371,
874)
N
et in
crea
se in
pro
visi
ons
for
impa
irm
ent
- -
- -
(1,3
90,8
32)
(1,3
90,8
32)
Fair
val
ue g
ains
on
equi
ty/d
ebt
secu
riti
es
- -
- 45
,683
,089
-
45,6
83,0
89
At
the
end
of 2
013
364,
594,
298
537,
614,
647
751,
880
247,
814,
433
272,
301,
585
1,42
3,07
6,84
3
At
the
begi
nnin
g of
201
4 36
4,59
4,29
8 53
7,61
4,64
7 75
1,88
0 24
7,81
4,43
3 27
2,30
1,58
5 1,
423,
076,
843
Net
add
itio
ns
72,3
56,4
40
34,7
75,6
12
- 21
,381
,148
10
,712
,988
13
9,22
6,18
8 D
ispo
sals
(re
dem
ptio
n)
(29,
952,
053)
(5
7,56
5,93
4)
- -
(14,
172,
977)
(1
01,6
90,9
64)
Net
incr
ease
in p
rovi
sion
s fo
r im
pair
men
t -
- -
- (1
,721
,086
) (1
,721
,086
) Fa
ir v
alue
los
ses
on e
quit
y/de
bt s
ecur
itie
s -
- -
(6,6
60,0
13)
- (6
,660
,013
) A
t th
e en
d of
201
4 40
6,99
8,68
5 51
4,82
4,32
5 75
1,88
0 26
2,53
5,56
8 26
7,12
0,51
0 1,
452,
230,
968
Mat
urit
y Re
ceiv
able
s Sa
le
Inco
me
Rece
ivab
les
Tota
l

6 4 | C O N S O L I D A T E D F I N A N C I A L S T A T E M E N T S
National Insurance CorporationNotes to the Consolidated Financial Statements For the Year Ended June 30, 2014(Expressed in Eastern Caribbean Dollars)
8. Loans and Receivables 2014 2013 $ $ Loans and receivables Loans to Government of Saint Lucia and statutory bodies 74,083,332 75,722,965 Provision for impairment on loans (31,251,823) (29,891,455) 42,831,509 45,831,510 Other loans 160,349,685 166,037,974 Provision for impairment (845,763) (653,916) 159,503,922 165,384,058 202,335,431 211,215,568 Other advances and receivables Due from Government of Saint Lucia Other receivables 35,339,819 32,523,268 Finance lease receivables 19,912,164 18,479,407 Contributions receivable 257,775 1,165,707 Provision for impairment (370,812) (370,812) 55,138,946 51,797,570 Other receivables Contributions receivable 7,609,851 7,934,171 Other receivables 2,370,921 1,549,751 Provision for impairment (334,639) (195,475) 9,646,133 9,288,447 Total loans and receivables 267,120,510 272,301,585
2014 2013
$ $
Current portion 50,436,164 44,982,469 Non-current portion 216,684,346 227,319,116
267,120,510 272,301,585
The estimated fair values of loans and receivables are the discounted amount of the estimated future cash flows expected to be received. Expected cash flows are discounted at current market rates to determine fair value.
Interest rates range from 2% - 8.75% (2013 – 2% - 8.75%).
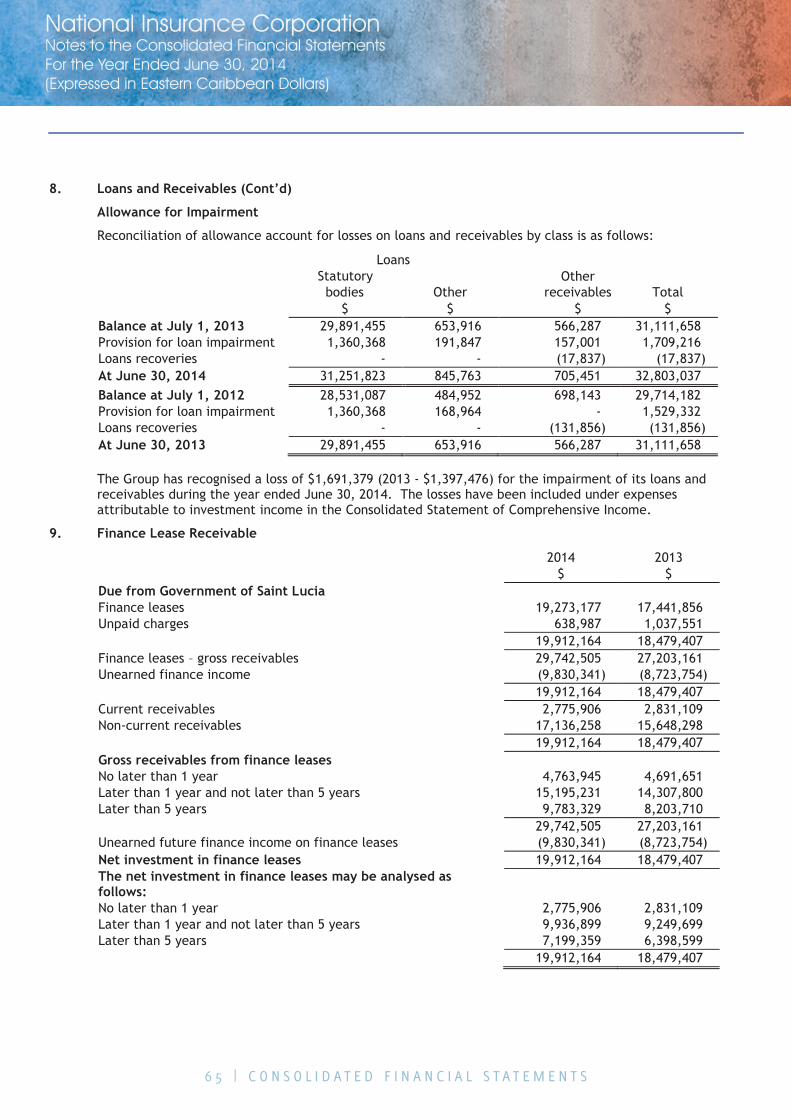
6 5 | C O N S O L I D A T E D F I N A N C I A L S T A T E M E N T S
National Insurance CorporationNotes to the Consolidated Financial Statements For the Year Ended June 30, 2014(Expressed in Eastern Caribbean Dollars)
8. Loans and Receivables (Cont’d)
Allowance for Impairment
Reconciliation of allowance account for losses on loans and receivables by class is as follows:
Loans
Statutory
Balance at July 1, 2012 28,531,087 484,952 698,143 29,714,182 Provision for loan impairment 1,360,368 168,964 - 1,529,332 Loans recoveries - - (131,856) (131,856) At June 30, 2013 29,891,455 653,916 566,287 31,111,658 The Group has recognised a loss of $1,691,379 (2013 - $1,397,476) for the impairment of its loans and receivables during the year ended June 30, 2014. The losses have been included under expenses attributable to investment income in the Consolidated Statement of Comprehensive Income.
9. Finance Lease Receivable
2014 2013
$ $
Due from Government of Saint Lucia Finance leases 19,273,177 17,441,856 Unpaid charges 638,987 1,037,551
19,912,164 18,479,407
Finance leases – gross receivables 29,742,505 27,203,161 Unearned finance income (9,830,341) (8,723,754)
19,912,164 18,479,407
Current receivables 2,775,906 2,831,109 Non-current receivables 17,136,258 15,648,298
19,912,164 18,479,407
Gross receivables from finance leases No later than 1 year 4,763,945 4,691,651 Later than 1 year and not later than 5 years 15,195,231 14,307,800 Later than 5 years 9,783,329 8,203,710
29,742,505 27,203,161
Unearned future finance income on finance leases (9,830,341) (8,723,754) Net investment in finance leases 19,912,164 18,479,407 The net investment in finance leases may be analysed as follows: No later than 1 year 2,775,906 2,831,109 Later than 1 year and not later than 5 years 9,936,899 9,249,699 Later than 5 years 7,199,359 6,398,599
19,912,164 18,479,407
Balance at July 1, 2013 29,891,455 653,916 566,287 31,111,658 Provision for loan impairment 1,360,368 191,847 157,001 1,709,216 Loans recoveries - - (17,837) (17,837) At June 30, 2014 31,251,823 845,763 705,451 32,803,037
Other bodies Other receivables Total
$ $ $ $

6 6 | C O N S O L I D A T E D F I N A N C I A L S T A T E M E N T S
National Insurance CorporationNotes to the Consolidated Financial Statements For the Year Ended June 30, 2014(Expressed in Eastern Caribbean Dollars)
10. Investment Properties
2014 2013
$ $
Beginning of year 303,640,364 282,112,224 Additions 18,224,507 22,840,383 Disposals (308,430) (128,538) Decrease in fair value (3,629,038) (1,183,705) End of year 317,927,403 303,640,364 The Group‟s investment properties are carried at fair value. Fair values of land included in investment properties are based on valuations performed by independent, professionally qualified valuers as at June 30, 2014 and 2013. Fair value of investment properties are estimated by discounting expected rentals at market yields.
The following amounts have been recognised in the Consolidated Statement of Comprehensive Income:-
2014 2013
$ $
Rental income 11,942,360 11,881,680 Direct operating expenses arising from investment properties that generate rental income 4,828,838 3,955,145
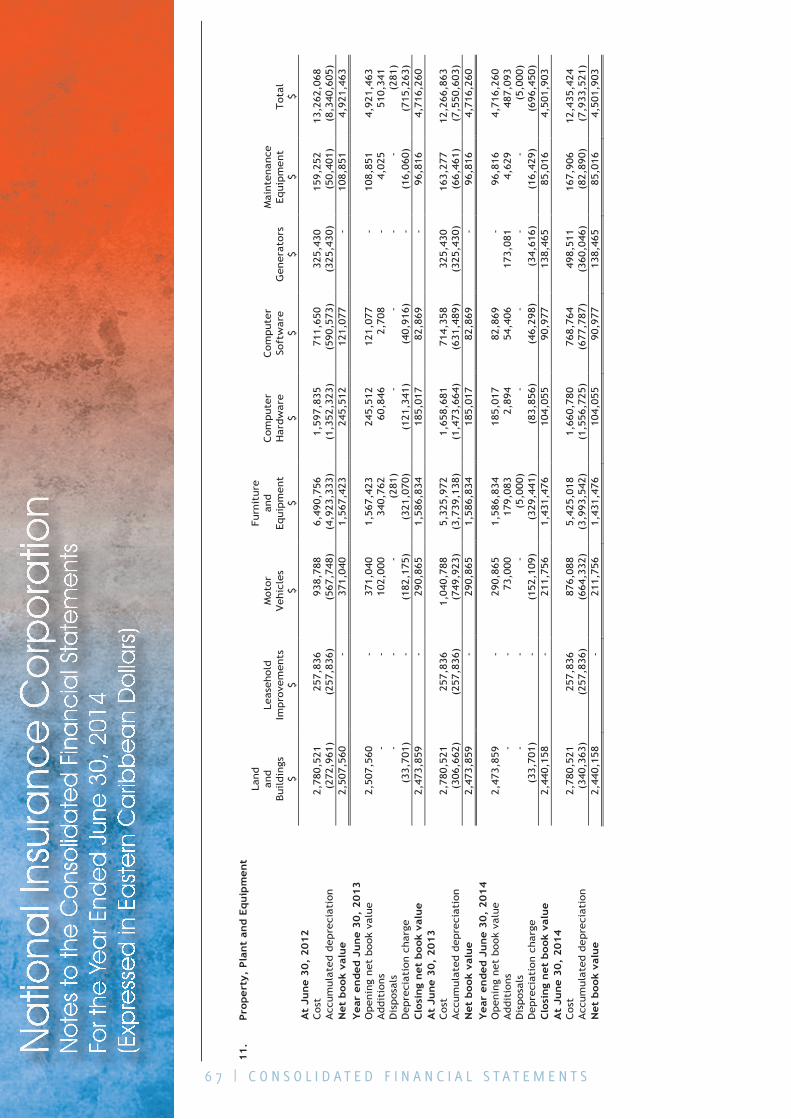
6 7 | C O N S O L I D A T E D F I N A N C I A L S T A T E M E N T S
Na
tiona
l Ins
ura
nce
Co
rpo
ratio
nN
ote
s to
the
Co
nso
lida
ted
Fin
anc
ial S
tate
me
nts
For t
he Y
ea
r End
ed
Jun
e 3
0, 2
014
(Exp
ress
ed
in E
ast
ern
Ca
ribb
ea
n D
olla
rs)
11.
Pro
pert
y, P
lant
and E
quip
ment
La
nd
Furn
iture
an
d
Leas
eho
ld
Moto
r an
d
Com
pute
r Com
pute
r
Mai
nte
nance
$
$ $
$ $
$ $
$ $
At
June 3
0,
2012
C
ost
2,
780,
521
257,
836
938,
788
6,49
0,75
6 1,
597,
835
711,
650
325,
430
159,
252
13,2
62,0
68
Acc
um
ula
ted d
epre
ciat
ion
(272
,961
) (2
57,8
36)
(567
,748
) (4
,923
,333
) (1
,352
,323
) (5
90,5
73)
(325
,430
) (5
0,40
1)
(8,3
40,6
05)
Net
book
valu
e
2,50
7,56
0 -
371,
040
1,56
7,42
3 24
5,51
2 12
1,07
7 -
108,
851
4,92
1,46
3 Y
ear
ended J
une 3
0,
2013
O
penin
g net
book
valu
e
2,50
7,56
0 -
371,
040
1,56
7,42
3 24
5,51
2 12
1,07
7 -
108,
851
4,92
1,46
3 Addit
ions
-
- 10
2,00
0 34
0,76
2 60
,846
2,
708
- 4,
025
510,
341
Dis
pos
als
- -
- (2
81)
- -
- -
(281
) D
epre
ciat
ion c
har
ge
(33,
701)
-
(182
,175
) (3
21,0
70)
(121
,341
) (4
0,91
6)
- (1
6,06
0)
(715
,263
) C
losi
ng
net
book
valu
e
2,47
3,85
9 -
290,
865
1,58
6,83
4 18
5,01
7 82
,869
-
96,8
16
4,71
6,26
0 A
t Ju
ne 3
0,
2013
C
ost
2,
780,
521
257,
836
1,04
0,78
8 5,
325,
972
1,65
8,68
1 71
4,35
8 32
5,43
0 16
3,27
7 12
,266
,863
Acc
um
ula
ted d
epre
ciat
ion
(306
,662
) (2
57,8
36)
(749
,923
) (3
,739
,138
) (1
,473
,664
) (6
31,4
89)
(325
,430
) (6
6,46
1)
(7,5
50,6
03)
Net
book
valu
e
2,47
3,85
9 -
290,
865
1,58
6,83
4 18
5,01
7 82
,869
-
96,8
16
4,71
6,26
0 Y
ear
ended J
une 3
0,
201
4
O
penin
g net
book
valu
e
2,47
3,85
9 -
290,
865
1,58
6,83
4 18
5,01
7 82
,869
-
96,8
16
4,71
6,26
0 Addit
ions
-
- 73
,000
17
9,08
3 2,
894
54,4
06
173,
081
4,62
9 48
7,09
3 D
ispos
als
- -
- (5
,000
) -
- -
- (5
,000
) D
epre
ciat
ion c
har
ge
(33,
701)
-
(152
,109
) (3
29,4
41)
(83,
856)
(4
6,29
8)
(34,
616)
(1
6,42
9)
(696
,450
) C
losi
ng
net
book
valu
e
2,44
0,15
8 -
211,
756
1,43
1,47
6 10
4,05
5 90
,977
13
8,46
5 85
,016
4,
501,
903
At
June 3
0,
2014
C
ost
2,
780,
521
257,
836
876,
088
5,42
5,01
8 1,
660,
780
768,
764
498,
511
167,
906
12,4
35,4
24
Acc
um
ula
ted d
epre
ciat
ion
(340
,363
) (2
57,8
36)
(664
,332
) (3
,993
,542
) (1
,556
,725
) (6
77,7
87)
(360
,046
) (8
2,89
0)
(7,9
33,5
21)
Net
book
valu
e
2,44
0,15
8 -
211,
756
1,43
1,47
6 10
4,05
5 90
,977
13
8,46
5 85
,016
4,
501,
903
Buildin
gs
Impro
vem
ent
s Vehi
cles
Equip
ment
Har
dw
are
Soft
war
e
Genera
tors
Eq
uip
ment
Tot
al

6 8 | C O N S O L I D A T E D F I N A N C I A L S T A T E M E N T S
National Insurance CorporationNotes to the Consolidated Financial Statements For the Year Ended June 30, 2014(Expressed in Eastern Caribbean Dollars)
June 30, 2013 Furniture and equipment 1,505,546 (1,505,265) 281 4,587 (4,306)
12. Trade and Other Accounts Payable
2014 2013
$ $
Trade payables 5,354,937 5,139,185 Benefits payable 1,089,363 882,051 Other payables 7,960,359 5,991,341
14,404,659 12,012,577
2014 2013
$ $
Current 13,554,541 10,554,654 Non-current 850,118 1,457,923
14,404,659 12,012,577
13. Borrowings
2014 2013
$ $
Bank borrowings - 10,741,133 Redeemable preference shares - 1,850,000 Total borrowings - 12,591,133 Current - 1,850,000 Non-current - 10,741,133
- 12,591,133
Borrowings from Bank of Saint Lucia Limited were settled through the restructuring of debt plan.
Cost Depreciation Value Proceeds loss $ $ $ $ $ June 30, 2014 Motor vehicles 237,700 (237,700) - 54,860 (54,860) Computer hardware 795 (795) - - - Furniture and equipment 80,037 (75,037) 5,000 40,000 (35,000) 318,532 (313,532) 5,000 94,860 (89,860)
11. Property, Plant and Equipment (Cont’d)
Gain on Disposal
Accumulated Net Book (Gain)/

6 9 | C O N S O L I D A T E D F I N A N C I A L S T A T E M E N T S
National Insurance CorporationNotes to the Consolidated Financial Statements For the Year Ended June 30, 2014(Expressed in Eastern Caribbean Dollars)
14. Principal Subsidiary Undertakings
% %
St. Lucia Mortgage Finance Company Limited 75 75 Castries Car Park Facility Limited 100 100 National Insurance Property Development and Management Company Ltd. (NIPRO) 100 100 Blue Coral Limited 100 66 2/3
All holdings are in the ordinary share capital of the undertaking concerned. The companies noted above are all incorporated and domiciled in Saint Lucia.
15. Reserves
Statutory Portfolio
Reserve Risk Reserve Total
$ $ $
Statutory Reserve
This reserve is maintained in accordance with Section 14(1) of the Banking Act, 1991 which requires
Excess Loan Fees
It is the policy of St. Lucia Mortgage Finance Company Limited to provide finance not exceeding 80% of the value of the asset. If finance is in excess of 80%, an additional charge of 2.5% of the loan amount is requested and kept as a reserve. In prior years, these fees were recognised as income when the loans were repaid. In the current year the deferred excess loan fees were transferred to the loan balances and it will be accounted for as an adjustment to the effective interest rate of the corresponding loan.
Portfolio Risk Reserve
This reserve represents amounts set aside for impairment losses on loans and advances to comply with the Prudential Credit Guidelines issued by the Eastern Caribbean Central Bank (ECCB) in addition to those losses that have been recognised under IAS 39. The Prudential Credit Guidelines require a provision to be made in respect of the portion of the portfolio where loans are three payments or more in arrears.
No further regulatory provision was required as at June 30, 2014.
2014 2013
By letter dated 23rd July, 2009, the ECCB clarified that only when the regulatory requirement for loan loss provisions exceeds provisions determined for accounting purposes are licensees required to establish a special reserve for the amount by which the regulatory requirement exceeds that computed under the applicable accounting standard.
Balances as at June 30, 2012 1,326,465 189,835 1,516,300 Transfer to statutory reserve 60,432 (52,376) 8,056 Balances as at June 30, 2013 1,386,897 137,459 1,524,356 Transfer to statutory reserve 52,224 (90,000) (37,776) Balances as at June 30, 2014 1,439,121 47,459 1,486,580
that every licensed financial institution maintain a reserve fund and shall, out of its net profit of each year, transfer to that fund a sum equal to not less than 20% of such profits whenever the amount of the fund is less than one hundred percent of the paid-up capital of the financial institution.
7 0 | C O N S O L I D A T E D F I N A N C I A L S T A T E M E N T S
National Insurance CorporationNotes to the Consolidated Financial Statements For the Year Ended June 30, 2014(Expressed in Eastern Caribbean Dollars)
16. Short-term and Long-term Benefits Fund
Short-term benefits fund is held to cover sickness benefit, maternity allowance and grant, funeral grant, employment injury benefit, hospitalization and medical benefits in respect of qualifying persons.
Long-term benefits fund is held to cover retirement pensions, retirement grants, death and disablement, invalidity and survivors‟ benefits in respect of qualifying persons.
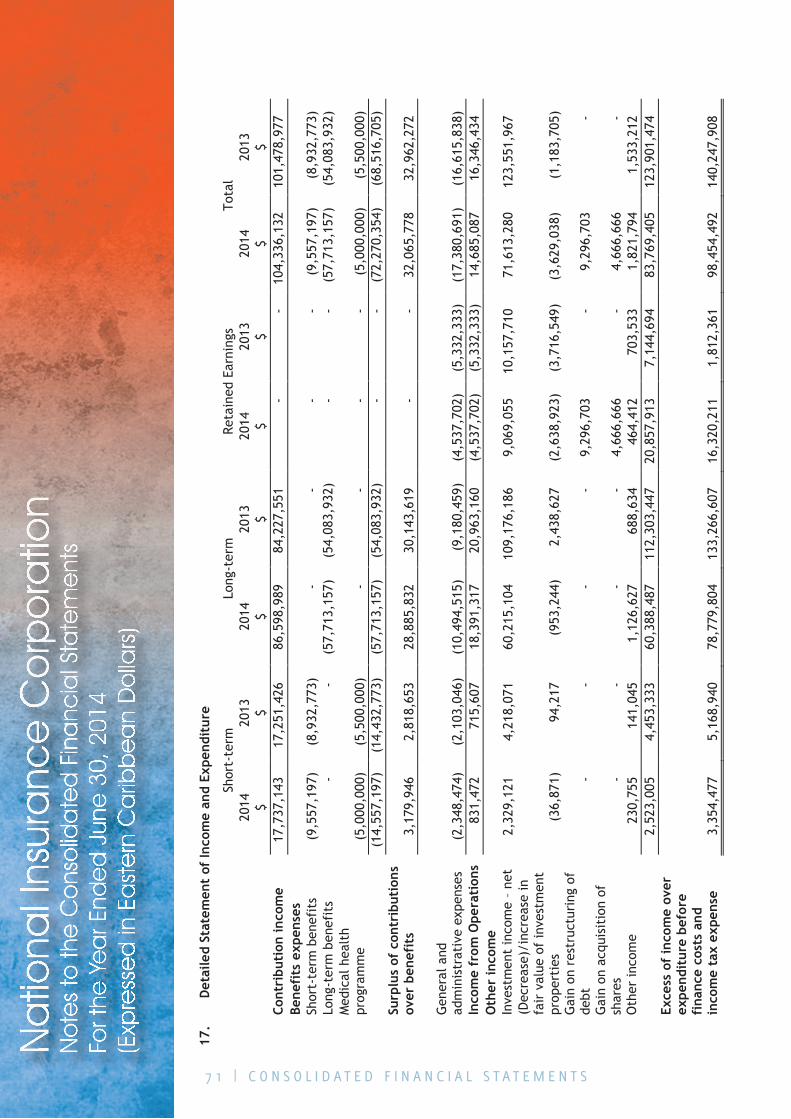
7 1 | C O N S O L I D A T E D F I N A N C I A L S T A T E M E N T S
Na
tiona
l Ins
ura
nce
Co
rpo
ratio
nN
ote
s to
the
Co
nso
lida
ted
Fin
anc
ial S
tate
me
nts
For t
he Y
ea
r End
ed
Jun
e 3
0, 2
014
(Exp
ress
ed
in E
ast
ern
Ca
ribb
ea
n D
olla
rs)
17
.D
etai
led
Stat
emen
t of
Inco
me
and
Expe
ndit
ure
Sh
ort-
term
Lo
ng-t
erm
Re
tain
ed E
arni
ngs
Tota
l
2014
20
13
2014
20
13
2014
20
13
2014
20
13
$
$ $
$ $
$ $
$ Co
ntri
buti
on in
com
e 17
,737
,143
17
,251
,426
86
,598
,989
84
,227
,551
-
- 10
4,33
6,13
2 10
1,47
8,97
7 Be
nefi
ts e
xpen
ses
Shor
t-te
rm b
enef
its
(9,5
57,1
97)
(8,9
32,7
73)
- -
- -
(9,5
57,1
97)
(8,9
32,7
73)
Long
-ter
m b
enef
its
- -
(57,
713,
157)
(5
4,08
3,93
2)
- -
(57,
713,
157)
(5
4,08
3,93
2)
Med
ical
hea
lth
prog
ram
me
(5,0
00,0
00)
(5,5
00,0
00)
- -
- -
(5,0
00,0
00)
(5,5
00,0
00)
(1
4,55
7,19
7)
(14,
432,
773)
(5
7,71
3,15
7)
(54,
083,
932)
-
- (7
2,27
0,35
4)
(68,
516,
705)
Su
rplu
s of
con
trib
utio
ns
over
ben
efit
s 3,
179,
946
2,81
8,65
3 28
,885
,832
30
,143
,619
-
- 32
,065
,778
32
,962
,272
Gen
eral
and
ad
min
istr
ativ
e ex
pens
es
(2,3
48,4
74)
(2,1
03,0
46)
(10,
494,
515)
(9
,180
,459
) (4
,537
,702
) (5
,332
,333
) (1
7,38
0,69
1)
(16,
615,
838)
In
com
e fr
om O
pera
tion
s 83
1,47
2 71
5,60
7 18
,391
,317
20
,963
,160
(4
,537
,702
) (5
,332
,333
) 14
,685
,087
16
,346
,434
O
ther
inco
me
Inve
stm
ent
inco
me
– ne
t 2,
329,
121
4,21
8,07
1 60
,215
,104
10
9,17
6,18
6 9,
069,
055
10,1
57,7
10
71,6
13,2
80
123,
551,
967
(Dec
reas
e)/i
ncre
ase
in
fair
val
ue o
f in
vest
men
t pr
oper
ties
(3
6,87
1)
94,2
17
(953
,244
) 2,
438,
627
(2,6
38,9
23)
(3,7
16,5
49)
(3,6
29,0
38)
(1,1
83,7
05)
Gai
n on
res
truc
turi
ng o
f de
bt
- -
- -
9,29
6,70
3 -
9,29
6,70
3 -
Gai
n on
acq
uisi
tion
of
shar
es
- -
- -
4,66
6,66
6 -
4,66
6,66
6 -
Oth
er in
com
e 23
0,75
5 14
1,04
5 1,
126,
627
688,
634
464,
412
703,
533
1,82
1,79
4 1,
533,
212
2,
523,
005
4,45
3,33
3 60
,388
,487
11
2,30
3,44
7 20
,857
,913
7,
144,
694
83,7
69,4
05
123,
901,
474
Exce
ss o
f in
com
e ov
er
expe
ndit
ure
befo
re
fina
nce
cost
s an
d in
com
e ta
x ex
pens
e 3,
354,
477
5,16
8,94
0 78
,779
,804
13
3,26
6,60
7 16
,320
,211
1,
812,
361
98,4
54,4
92
140,
247,
908
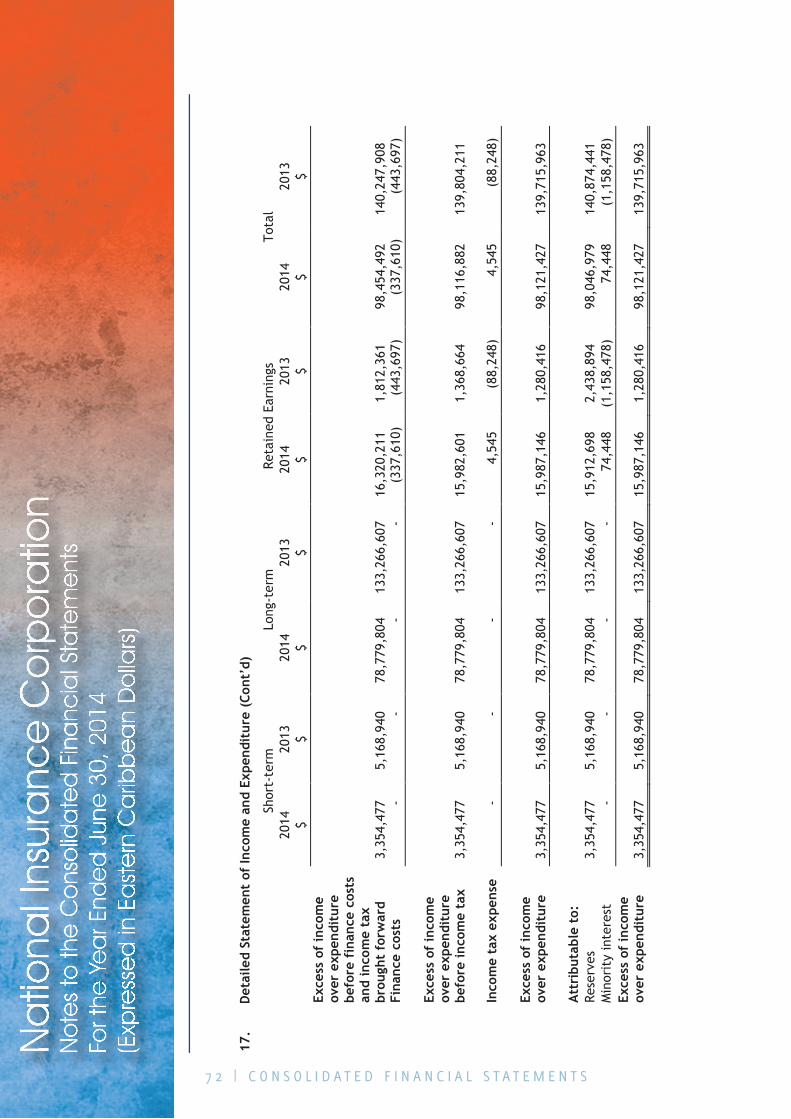
7 2 | C O N S O L I D A T E D F I N A N C I A L S T A T E M E N T S
Na
tiona
l Ins
ura
nce
Co
rpo
ratio
nN
ote
s to
the
Co
nso
lida
ted
Fin
anc
ial S
tate
me
nts
For t
he Y
ea
r End
ed
Jun
e 3
0, 2
014
(Exp
ress
ed
in E
ast
ern
Ca
ribb
ea
n D
olla
rs)
17.
Det
aile
d St
atem
ent
of In
com
e an
d Ex
pend
itur
e (C
ont’
d)
Sh
ort-
term
Lo
ng-t
erm
Re
tain
ed E
arni
ngs
Tota
l
2014
20
13
2014
20
13
2014
20
13
2014
20
13
$
$ $
$ $
$ $
$ Ex
cess
of
inco
me
over
exp
endi
ture
be
fore
fin
ance
cos
ts
and
inco
me
tax
brou
ght
forw
ard
3,35
4,47
7 5,
168,
940
78,7
79,8
04
133,
266,
607
16,3
20,2
11
1,81
2,36
1 98
,454
,492
14
0,24
7,90
8 Fi
nanc
e co
sts
- -
- -
(337
,610
) (4
43,6
97)
(337
,610
) (4
43,6
97)
Ex
cess
of
inco
me
over
exp
endi
ture
be
fore
inco
me
tax
3,
354,
477
5,16
8,94
0 78
,779
,804
13
3,26
6,60
7 15
,982
,601
1,
368,
664
98,1
16,8
82
139,
804,
211
In
com
e ta
x ex
pens
e -
- -
- 4,
545
(88,
248)
4,
545
(88,
248)
Exce
ss o
f in
com
e ov
er e
xpen
ditu
re
3,35
4,47
7 5,
168,
940
78,7
79,8
04
133,
266,
607
15,9
87,1
46
1,28
0,41
6 98
,121
,427
13
9,71
5,96
3
Att
ribu
tabl
e to
:
Re
serv
es
3,35
4,47
7 5,
168,
940
78,7
79,8
04
133,
266,
607
15,9
12,6
98
2,43
8,89
4 98
,046
,979
14
0,87
4,44
1 M
inor
ity
inte
rest
-
- -
- 74
,448
(1
,158
,478
) 74
,448
(1
,158
,478
) Ex
cess
of
inco
me
over
exp
endi
ture
3,
354,
477
5,16
8,94
0 78
,779
,804
13
3,26
6,60
7 15
,987
,146
1,
280,
416
98,1
21,4
27
139,
715,
963
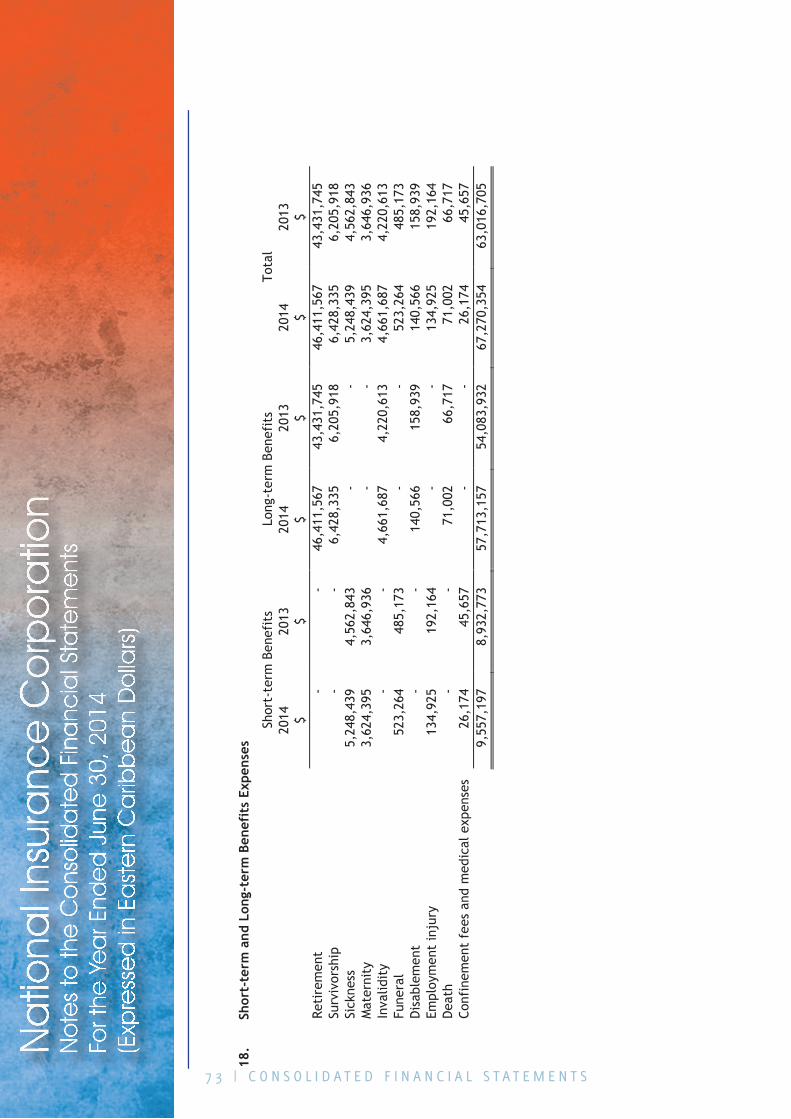
7 3 | C O N S O L I D A T E D F I N A N C I A L S T A T E M E N T S
Na
tiona
l Ins
ura
nce
Co
rpo
ratio
nN
ote
s to
the
Co
nso
lida
ted
Fin
anc
ial S
tate
me
nts
For t
he Y
ea
r End
ed
Jun
e 3
0, 2
014
(Exp
ress
ed
in E
ast
ern
Ca
ribb
ea
n D
olla
rs)
18
.Sh
ort-
term
and
Lon
g-te
rm B
enef
its
Expe
nses
Sh
ort-
term
Ben
efit
s Lo
ng-t
erm
Ben
efit
s To
tal
20
14
2013
20
14
2013
20
14
2013
$ $
$ $
$ $
Reti
rem
ent
- -
46,4
11,5
67
43,4
31,7
45
46,4
11,5
67
43,4
31,7
45
Surv
ivor
ship
-
- 6,
428,
335
6,20
5,91
8 6,
428,
335
6,20
5,91
8 Si
ckne
ss
5,24
8,43
9 4,
562,
843
- -
5,24
8,43
9 4,
562,
843
Mat
erni
ty
3,62
4,39
5 3,
646,
936
- -
3,62
4,39
5 3,
646,
936
Inva
lidit
y -
- 4,
661,
687
4,22
0,61
3 4,
661,
687
4,22
0,61
3 Fu
nera
l 52
3,26
4 48
5,17
3 -
- 52
3,26
4 48
5,17
3 D
isab
lem
ent
- -
140,
566
158,
939
140,
566
158,
939
Empl
oym
ent
inju
ry
134,
925
192,
164
- -
134,
925
192,
164
Dea
th
- -
71,0
02
66,7
17
71,0
02
66,7
17
Conf
inem
ent
fees
and
med
ical
exp
ense
s 26
,174
45
,657
-
- 26
,174
45
,657
9,55
7,19
7 8,
932,
773
57,7
13,1
57
54,0
83,9
32
67,2
70,3
54
63,0
16,7
05
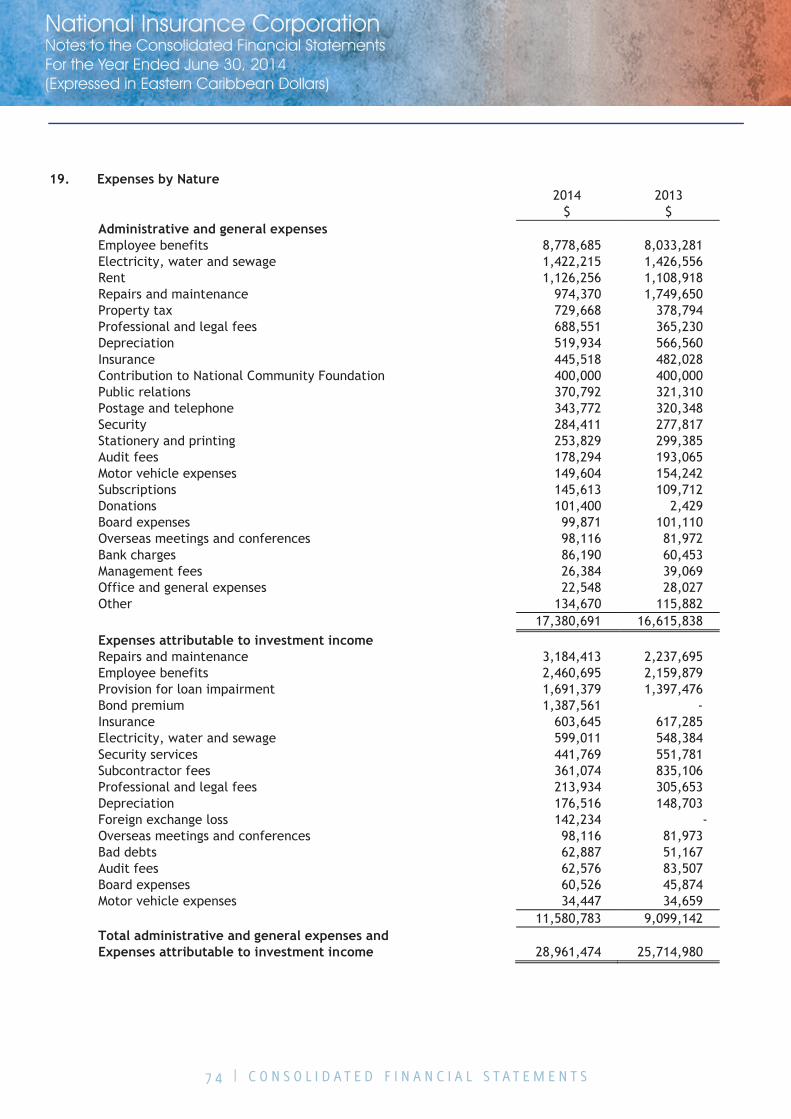
7 4 | C O N S O L I D A T E D F I N A N C I A L S T A T E M E N T S
National Insurance CorporationNotes to the Consolidated Financial Statements For the Year Ended June 30, 2014(Expressed in Eastern Caribbean Dollars)
19. Expenses by Nature
2014 2013
$ $
Administrative and general expenses Employee benefits 8,778,685 8,033,281 Electricity, water and sewage 1,422,215 1,426,556 Rent 1,126,256 1,108,918 Repairs and maintenance 974,370 1,749,650 Property tax 729,668 378,794 Professional and legal fees 688,551 365,230 Depreciation 519,934 566,560 Insurance 445,518 482,028 Contribution to National Community Foundation 400,000 400,000 Public relations 370,792 321,310 Postage and telephone 343,772 320,348 Security 284,411 277,817 Stationery and printing 253,829 299,385 Audit fees 178,294 193,065 Motor vehicle expenses 149,604 154,242 Subscriptions 145,613 109,712 Donations 101,400 2,429 Board expenses 99,871 101,110 Overseas meetings and conferences 98,116 81,972 Bank charges 86,190 60,453 Management fees 26,384 39,069 Office and general expenses 22,548 28,027 Other 134,670 115,882 17,380,691 16,615,838 Expenses attributable to investment income Repairs and maintenance 3,184,413 2,237,695 Employee benefits 2,460,695 2,159,879 Provision for loan impairment 1,691,379 1,397,476 Bond premium 1,387,561 - Insurance 603,645 617,285 Electricity, water and sewage 599,011 548,384 Security services 441,769 551,781 Subcontractor fees 361,074 835,106 Professional and legal fees 213,934 305,653 Depreciation 176,516 148,703 Foreign exchange loss 142,234 - Overseas meetings and conferences 98,116 81,973 Bad debts 62,887 51,167 Audit fees 62,576 83,507 Board expenses 60,526 45,874 Motor vehicle expenses 34,447 34,659 11,580,783 9,099,142 Total administrative and general expenses and Expenses attributable to investment income 28,961,474 25,714,980
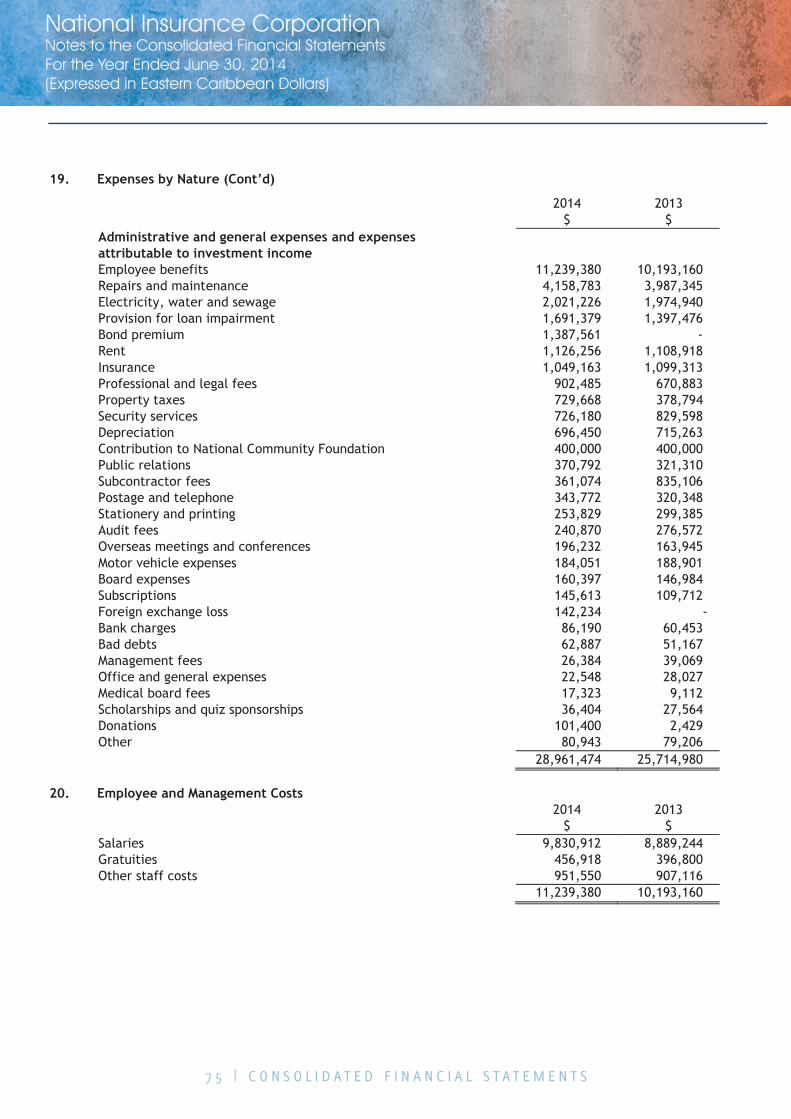
7 5 | C O N S O L I D A T E D F I N A N C I A L S T A T E M E N T S
National Insurance CorporationNotes to the Consolidated Financial Statements For the Year Ended June 30, 2014(Expressed in Eastern Caribbean Dollars)
19. Expenses by Nature (Cont’d)
2014 2013
$ $
Administrative and general expenses and expenses attributable to investment income Employee benefits 11,239,380 10,193,160 Repairs and maintenance 4,158,783 3,987,345 Electricity, water and sewage 2,021,226 1,974,940 Provision for loan impairment 1,691,379 1,397,476 Bond premium 1,387,561 - Rent 1,126,256 1,108,918 Insurance 1,049,163 1,099,313 Professional and legal fees 902,485 670,883 Property taxes 729,668 378,794 Security services 726,180 829,598 Depreciation 696,450 715,263 Contribution to National Community Foundation 400,000 400,000 Public relations 370,792 321,310 Subcontractor fees 361,074 835,106 Postage and telephone 343,772 320,348 Stationery and printing 253,829 299,385 Audit fees 240,870 276,572 Overseas meetings and conferences 196,232 163,945 Motor vehicle expenses 184,051 188,901 Board expenses 160,397 146,984 Subscriptions 145,613 109,712 Foreign exchange loss 142,234 - Bank charges 86,190 60,453 Bad debts 62,887 51,167 Management fees 26,384 39,069 Office and general expenses 22,548 28,027 Medical board fees 17,323 9,112 Scholarships and quiz sponsorships 36,404 27,564 Donations 101,400 2,429 Other 80,943 79,206 28,961,474 25,714,980
20. Employee and Management Costs
2014 2013
$ $
Salaries 9,830,912 8,889,244 Gratuities 456,918 396,800 Other staff costs 951,550 907,116 11,239,380 10,193,160

7 6 | C O N S O L I D A T E D F I N A N C I A L S T A T E M E N T S
National Insurance CorporationNotes to the Consolidated Financial Statements For the Year Ended June 30, 2014(Expressed in Eastern Caribbean Dollars)
21. Investment Income – Net
2014 2013
$ $
Cash and cash equivalents interest income 2,752,571 3,463,773 Fair value through income:
- Dividend income 4,242,077 3,951,981 - Fair value (losses)/gains on equity/debt securities (6,660,013) 45,683,089 - Interest income on debt securities 2,163,350 1,428,267 Loans and receivables interest income 20,823,621 20,762,811 Investment securities interest income - Held-to-maturity 24,958,998 21,297,160 - Loans and receivables 21,743,656 21,833,589 Rental income 11,942,360 11,881,680 Development income 16,691 61,454 Maintenance fees 758,949 1,087,148 Parking fees 440,748 499,126 Management fees 11,055 701,031 83,194,063 132,651,109 Expenses attributable to investment income (11,580,783) (9,099,142) 71,613,280 123,551,967
22. Related Party Transactions
The following transactions were carried out with related parties:- 2014 2013 $ $ Finance lease interest income 2,211,963 2,044,514 Rental income 4,731,015 4,731,015 Interest income 3,486,491 4,240,930
Key management compensation is as follows:- Salaries and wages 2,592,659 2,430,397 Other benefits 404,129 389,995 2,996,788 2,820,392 Year-end balances with related parties are as follows:-
Loans to Government of St. Lucia and Statutory Bodies
Held-to-maturity investment securities 343,803,543 286,619,060 Loans 42,831,509 45,831,510 Other advances and receivables 34,969,007 32,152,456 Contributions receivable 257,775 1,165,707 Finance lease receivable 19,912,164 18,479,407
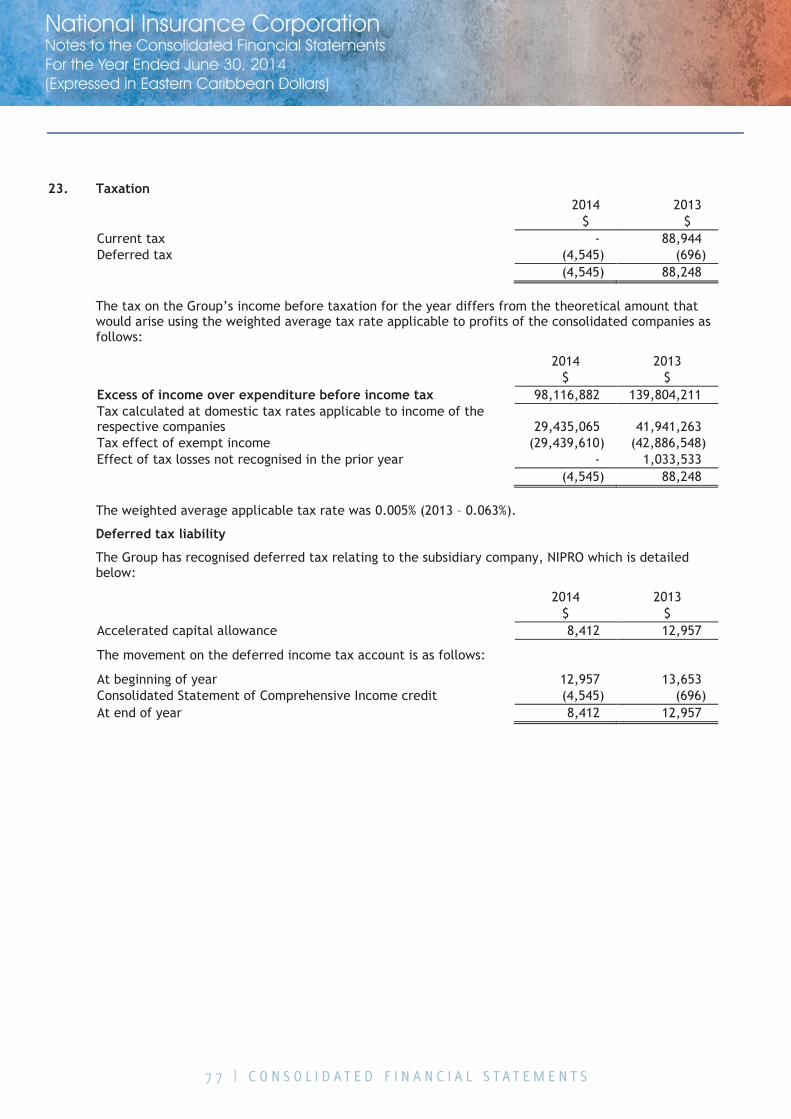
7 7 | C O N S O L I D A T E D F I N A N C I A L S T A T E M E N T S
National Insurance CorporationNotes to the Consolidated Financial Statements For the Year Ended June 30, 2014(Expressed in Eastern Caribbean Dollars)
23. Taxation
2014 2013
$ $
Current tax - 88,944 Deferred tax (4,545) (696) (4,545) 88,248
The tax on the Group‟s income before taxation for the year differs from the theoretical amount that would arise using the weighted average tax rate applicable to profits of the consolidated companies as follows:
2014 2013
$ $
Excess of income over expenditure before income tax 98,116,882 139,804,211 Tax calculated at domestic tax rates applicable to income of the respective companies 29,435,065 41,941,263 Tax effect of exempt income (29,439,610) (42,886,548) Effect of tax losses not recognised in the prior year - 1,033,533 (4,545) 88,248
The weighted average applicable tax rate was 0.005% (2013 – 0.063%).
Deferred tax liability
The Group has recognised deferred tax relating to the subsidiary company, NIPRO which is detailed below:
2014 2013
$ $
Accelerated capital allowance 8,412 12,957
The movement on the deferred income tax account is as follows:
At beginning of year 12,957 13,653 Consolidated Statement of Comprehensive Income credit (4,545) (696) At end of year 8,412 12,957
7 8 | C O N S O L I D A T E D F I N A N C I A L S T A T E M E N T S
National Insurance CorporationNotes to the Consolidated Financial Statements For the Year Ended June 30, 2014(Expressed in Eastern Caribbean Dollars)
24. Actuarial Review
Section 24 of the National Insurance Act requires an actuarial review of the National Insurance Fund to be conducted at least every five years.
The tenth actuarial review of the National Insurance Fund as at June 30, 2010 was conducted by an Actuary of the International Labour Organisation.
Key results of the financial and demographic projections based on the contribution and benefit provisions in place as of the valuation date:
The total population of St. Lucia is expected to increase from 165,568 in 2010 to 183,365 in 2038 and decrease thereafter to 175,497 in 2060.
The employed population is expected to increase from 67,704 in 2010 to 88,776 in 2036, decreasing thereafter to 78,828 in 2060.
The aging of the general population will have a significant impact on the ratio of workers to retirees. Those aged 65 and over represent an increasing percentage of the total population, up from 8.6 percent in 2010 to 16.5% in 2035 and 24.6% in 2060.
Contribution income is expected to be sufficient to meet total expenditure through 2051.
25. Commitments
As at end of year, loans and receivables approved by the Group but not yet disbursed amounted to approximately $5,194,657 (2013 - $17,478,399).
The pay-as-you-go rate or the contribution rate that would be required to produce just enough income to meet expenditure if there is no fund will increase gradually from 6.1% in 2011 to over 20% in the long term. This indicates that there will be a need to eventually increase the contribution rate of the branch in order to face its long-term cost.
Reserves are expected to begin decreasing in 2036 when total expenditure will begin to exceed total income for the first time. In 2051 projected reserves will be exhausted unless relevant measures are taken to reverse the projected trend.
The NIC is relatively young, so the long-term benefits branch has not yet reached a state of maturity and the cost of pensions expressed as a percentage of insurable earnings is still increasing. In 2011, the annual expenditure represented 6.1% of total insurable earnings and will gradually increase to 28.7% in 2063.
STATISTICAL APPENDIX
The following Statistics have been prepared on a cash basis.
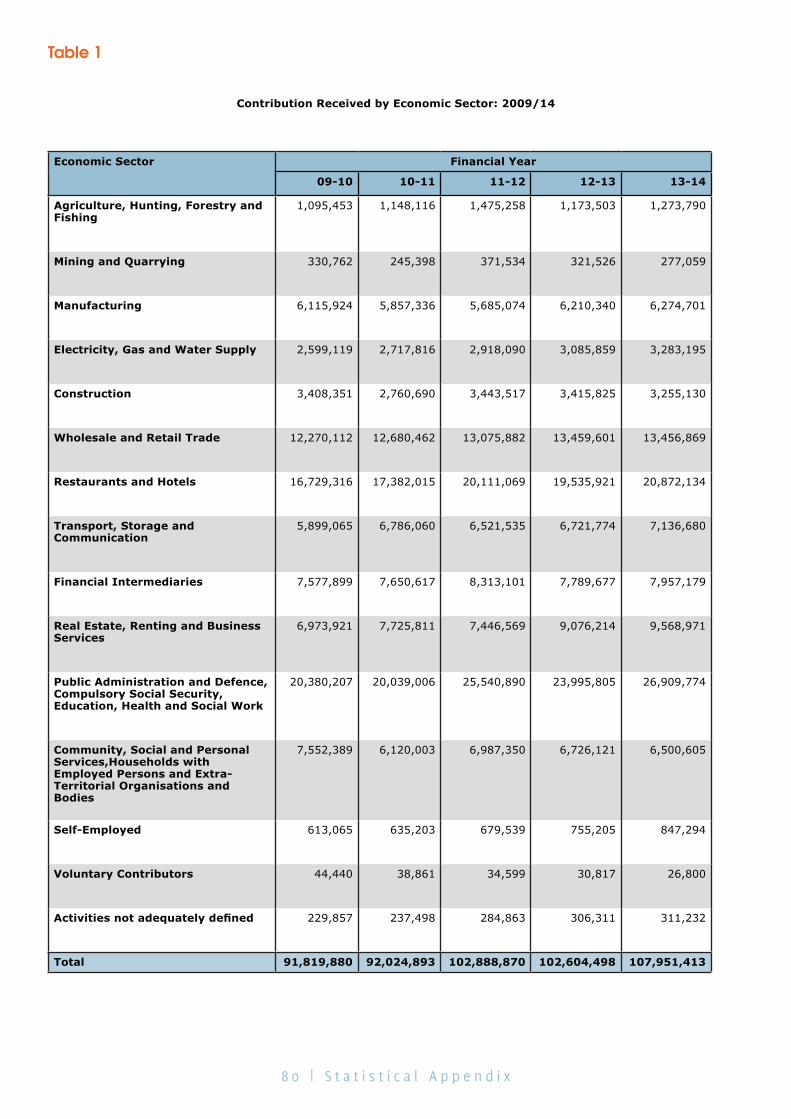
8 0 | S t a t i s t i c a l A p p e n d i x
Table 1
Contribution Received by Economic Sector: 2009/14
Economic Sector
Financial Year
09-10 10-11 11-12 12-13 13-14
Agriculture, Hunting, Forestry and Fishing
1,095,453 1,148,116 1,475,258 1,173,503 1,273,790
Mining and Quarrying
330,762 245,398 371,534 321,526 277,059
Manufacturing
6,115,924 5,857,336 5,685,074 6,210,340 6,274,701
Electricity, Gas and Water Supply
2,599,119 2,717,816 2,918,090 3,085,859 3,283,195
Construction
3,408,351 2,760,690 3,443,517 3,415,825 3,255,130
Wholesale and Retail Trade
12,270,112 12,680,462 13,075,882 13,459,601 13,456,869
Restaurants and Hotels
16,729,316 17,382,015 20,111,069 19,535,921 20,872,134
Transport, Storage and Communication
5,899,065 6,786,060 6,521,535 6,721,774 7,136,680
Financial Intermediaries
7,577,899 7,650,617 8,313,101 7,789,677 7,957,179
Real Estate, Renting and Business Services
6,973,921 7,725,811 7,446,569 9,076,214 9,568,971
Public Administration and Defence, Compulsory Social Security, Education, Health and Social Work
20,380,207 20,039,006 25,540,890 23,995,805 26,909,774
Community, Social and Personal Services,Households with Employed Persons and Extra-Territorial Organisations and Bodies
7,552,389 6,120,003 6,987,350 6,726,121 6,500,605
Self-Employed 613,065
635,203
679,539
755,205
847,294
Voluntary Contributors 44,440
38,861
34,599
30,817
26,800
Activities not adequately defined
229,857
237,498
284,863
306,311
311,232
Total 91,819,880 92,024,893 102,888,870 102,604,498 107,951,413
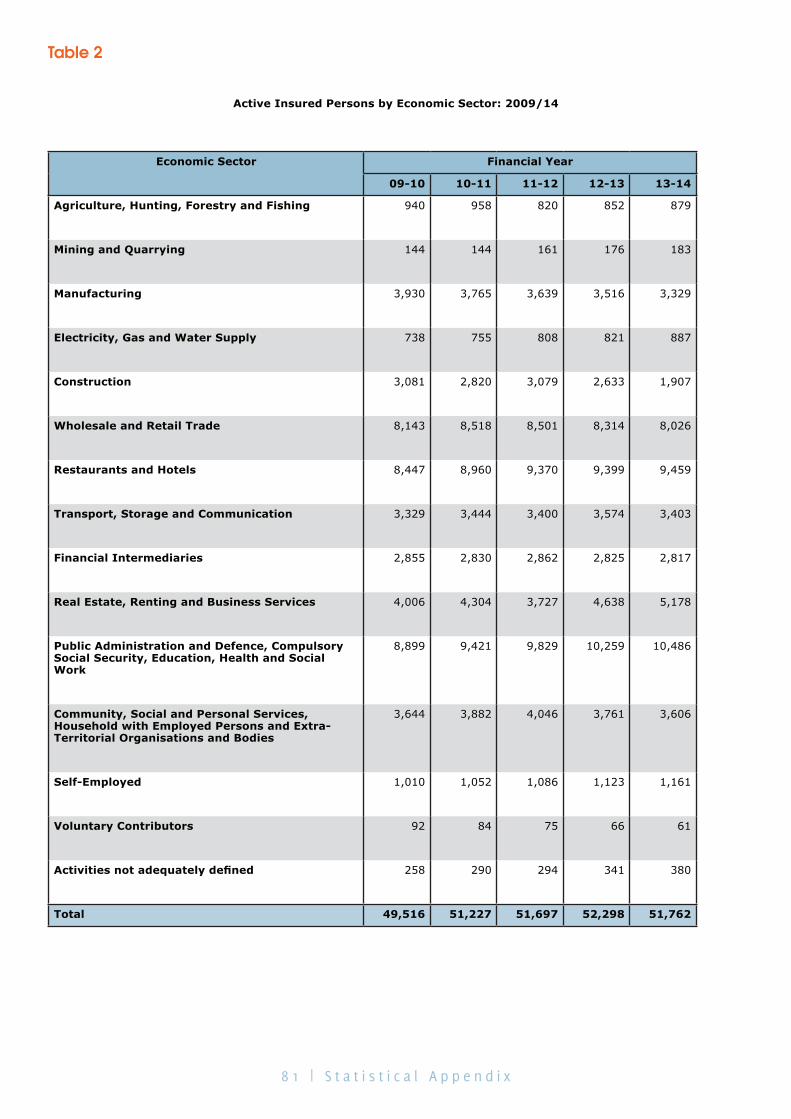
8 1 | S t a t i s t i c a l A p p e n d i x
Table 2
Active Insured Persons by Economic Sector: 2009/14
Economic Sector
Financial Year
09-10 10-11 11-12 12-13 13-14
Agriculture, Hunting, Forestry and Fishing
940 958 820 852 879
Mining and Quarrying
144 144 161 176 183
Manufacturing
3,930 3,765 3,639 3,516 3,329
Electricity, Gas and Water Supply
738 755 808 821 887
Construction
3,081 2,820 3,079 2,633 1,907
Wholesale and Retail Trade
8,143 8,518 8,501 8,314 8,026
Restaurants and Hotels
8,447 8,960 9,370 9,399 9,459
Transport, Storage and Communication
3,329 3,444 3,400 3,574 3,403
Financial Intermediaries
2,855 2,830 2,862 2,825 2,817
Real Estate, Renting and Business Services
4,006 4,304 3,727 4,638 5,178
Public Administration and Defence, Compulsory Social Security, Education, Health and Social Work
8,899 9,421 9,829 10,259 10,486
Community, Social and Personal Services, Household with Employed Persons and Extra-Territorial Organisations and Bodies
3,644 3,882 4,046 3,761 3,606
Self-Employed 1,010 1,052 1,086 1,123 1,161
Voluntary Contributors 92 84 75 66 61
Activities not adequately defined 258 290 294 341 380
Total 49,516 51,227 51,697 52,298 51,762

8 2 | S t a t i s t i c a l A p p e n d i x
Table 3
Active Employers by Economic Sector: 2010/14
Economic Sector
Financial Year Ending
June 2010
June 2011
June 2012
June 2013
June 2014
Agriculture, Hunting, Forestry and Fishing 129 131 125 127 132
Mining and Quarrying 8 8 9 9 8
Manufacturing 257 261 259 256 250
Electricity, Gas and Water Supply 15 15 17 17 19
Construction 171 172 165 167 168
Wholesale and Retail Trade 623 644 639 633 625
Restaurants and Hotels 370 392 378 375 362
Transport, Storage and Communication 162 163 167 170 171
Financial Intermediaries 126 125 135 135 140
Real Estate, Renting and Business Services 392 386 394 398 405
Public Administration and Defence, Compulsory Social Security, Education, Health and Social Work
256 263 258 264 274
Community, Social and Personal Services, Households with Employed Persons and Extra-Territorial Organisations and Bodies
895 914 933 955 923
Activities not adequately defined 191 210 202 208 192
Total 3,595 3,684 3,681 3,714 3,669
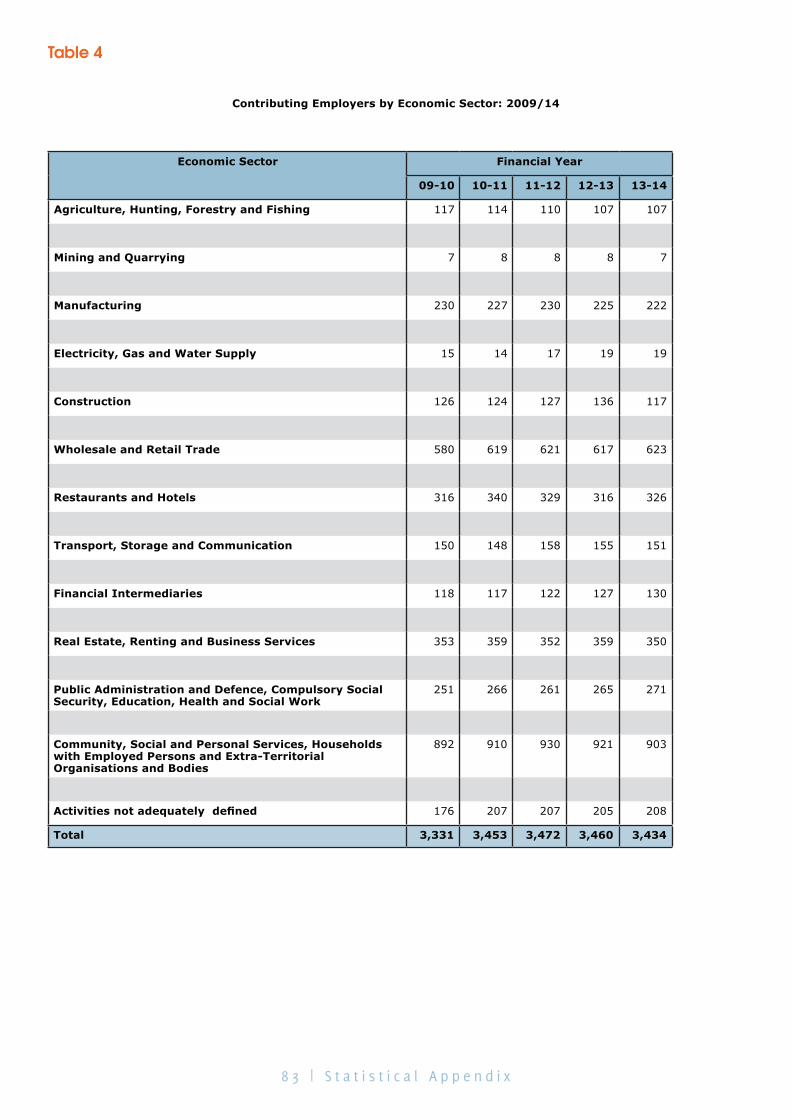
8 3 | S t a t i s t i c a l A p p e n d i x
Table 4
Contributing Employers by Economic Sector: 2009/14
Economic Sector
Financial Year
09-10 10-11 11-12 12-13 13-14
Agriculture, Hunting, Forestry and Fishing 117 114 110 107 107
Mining and Quarrying 7 8 8 8 7
Manufacturing 230 227 230 225 222
Electricity, Gas and Water Supply 15 14 17 19 19
Construction 126 124 127 136 117
Wholesale and Retail Trade 580 619 621 617 623
Restaurants and Hotels 316 340 329 316 326
Transport, Storage and Communication 150 148 158 155 151
Financial Intermediaries 118 117 122 127 130
Real Estate, Renting and Business Services 353 359 352 359 350
Public Administration and Defence, Compulsory Social Security, Education, Health and Social Work
251 266 261 265 271
Community, Social and Personal Services, Households with Employed Persons and Extra-Territorial Organisations and Bodies
892 910 930 921 903
Activities not adequately defined 176 207 207 205 208
Total 3,331 3,453 3,472 3,460 3,434

8 4 | S t a t i s t i c a l A p p e n d i x
Table 5
Newly Registered Employers by Economic Sector: 2009/14
Economic Sector
Financial Year
09-10 10-11 11-12 12-13 13-14
Agriculture, Hunting, Forestry and Fishing 7 8 3 7 6
Mining and Quarrying 0 0 0 0 0
Manufacturing 28 18 15 26 20
Electricity, Gas and Water Supply 0 2 2 1 2
Construction 29 30 20 43 14
Wholesale and Retail Trade 56 72 46 67 58
Restaurants and Hotels 59 65 41 35 39
Transport, Storage and Communication 16 12 18 16 7
Financial Intermediaries 9 4 13 5 10
Real Estate, Renting and Business Services 42 44 35 40 30
Public Administration and Defence, Compulsory Social Security, Education, Health and Social Work
22 23 13 19 18
Community, Social and Personal Services, Households with Employed Persons and Extra-Territorial Organisations and Bodies
106 118 120 123 83
Activities not adequately defined 63 73 39 38 32
Total 437 469 365 420 319
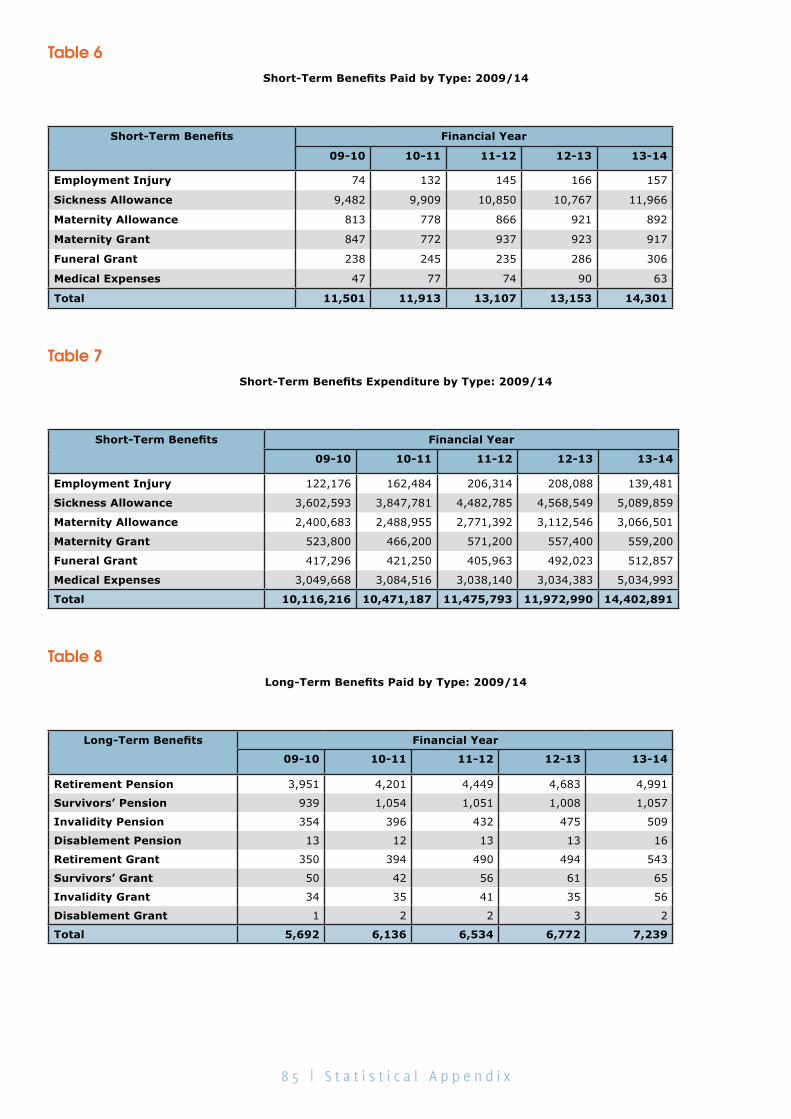
8 5 | S t a t i s t i c a l A p p e n d i x
Table 6Short-Term Benefits Paid by Type: 2009/14
Short-Term Benefits
Financial Year
09-10 10-11 11-12 12-13 13-14
Employment Injury 74 132 145 166 157
Sickness Allowance 9,482 9,909 10,850 10,767 11,966
Maternity Allowance 813 778 866 921 892
Maternity Grant 847 772 937 923 917
Funeral Grant 238 245 235 286 306
Medical Expenses 47 77 74 90 63
Total 11,501 11,913 13,107 13,153 14,301
Table 7Short-Term Benefits Expenditure by Type: 2009/14
Short-Term Benefits
Financial Year
09-10 10-11 11-12 12-13 13-14
Employment Injury 122,176 162,484 206,314 208,088 139,481
Sickness Allowance 3,602,593 3,847,781 4,482,785 4,568,549 5,089,859
Maternity Allowance 2,400,683 2,488,955 2,771,392 3,112,546 3,066,501
Maternity Grant 523,800 466,200 571,200 557,400 559,200
Funeral Grant 417,296 421,250 405,963 492,023 512,857
Medical Expenses 3,049,668 3,084,516 3,038,140 3,034,383 5,034,993
Total 10,116,216 10,471,187 11,475,793 11,972,990 14,402,891
Table 8Long-Term Benefits Paid by Type: 2009/14
Long-Term Benefits
Financial Year
09-10 10-11 11-12 12-13 13-14
Retirement Pension 3,951 4,201 4,449 4,683 4,991
Survivors’ Pension 939 1,054 1,051 1,008 1,057
Invalidity Pension 354 396 432 475 509
Disablement Pension 13 12 13 13 16
Retirement Grant 350 394 490 494 543
Survivors’ Grant 50 42 56 61 65
Invalidity Grant 34 35 41 35 56
Disablement Grant 1 2 2 3 2
Total 5,692 6,136 6,534 6,772 7,239
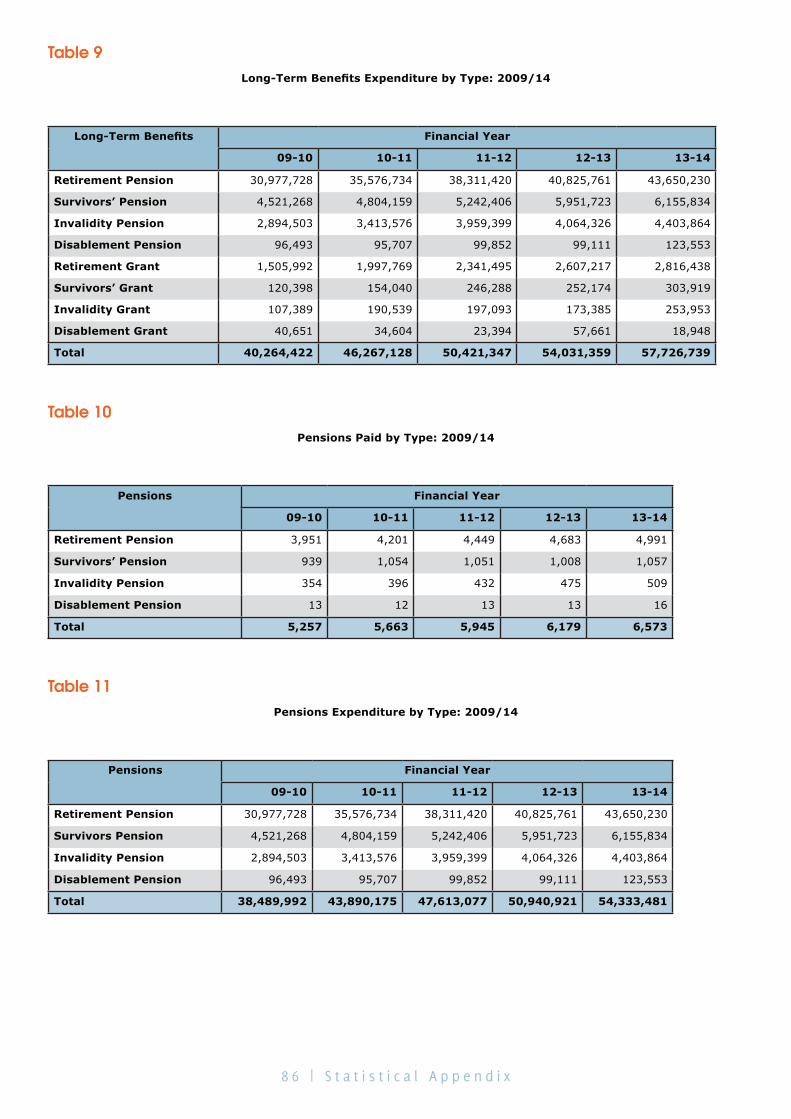
8 6 | S t a t i s t i c a l A p p e n d i x
Table 9Long-Term Benefits Expenditure by Type: 2009/14
Long-Term Benefits
Financial Year
09-10 10-11 11-12 12-13 13-14
Retirement Pension 30,977,728 35,576,734 38,311,420 40,825,761 43,650,230
Survivors’ Pension 4,521,268 4,804,159 5,242,406 5,951,723 6,155,834
Invalidity Pension 2,894,503 3,413,576 3,959,399 4,064,326 4,403,864
Disablement Pension 96,493 95,707 99,852 99,111 123,553
Retirement Grant 1,505,992 1,997,769 2,341,495 2,607,217 2,816,438
Survivors’ Grant 120,398 154,040 246,288 252,174 303,919
Invalidity Grant 107,389 190,539 197,093 173,385 253,953
Disablement Grant 40,651 34,604 23,394 57,661 18,948
Total 40,264,422 46,267,128 50,421,347 54,031,359 57,726,739
Table 10Pensions Paid by Type: 2009/14
Pensions
Financial Year
09-10 10-11 11-12 12-13 13-14
Retirement Pension 3,951 4,201 4,449 4,683 4,991
Survivors’ Pension 939 1,054 1,051 1,008 1,057
Invalidity Pension 354 396 432 475 509
Disablement Pension 13 12 13 13 16
Total 5,257 5,663 5,945 6,179 6,573
Table 11Pensions Expenditure by Type: 2009/14
Pensions
Financial Year
09-10 10-11 11-12 12-13 13-14
Retirement Pension 30,977,728 35,576,734 38,311,420 40,825,761 43,650,230
Survivors Pension 4,521,268 4,804,159 5,242,406 5,951,723 6,155,834
Invalidity Pension 2,894,503 3,413,576 3,959,399 4,064,326 4,403,864
Disablement Pension 96,493 95,707 99,852 99,111 123,553
Total 38,489,992 43,890,175 47,613,077 50,940,921 54,333,481
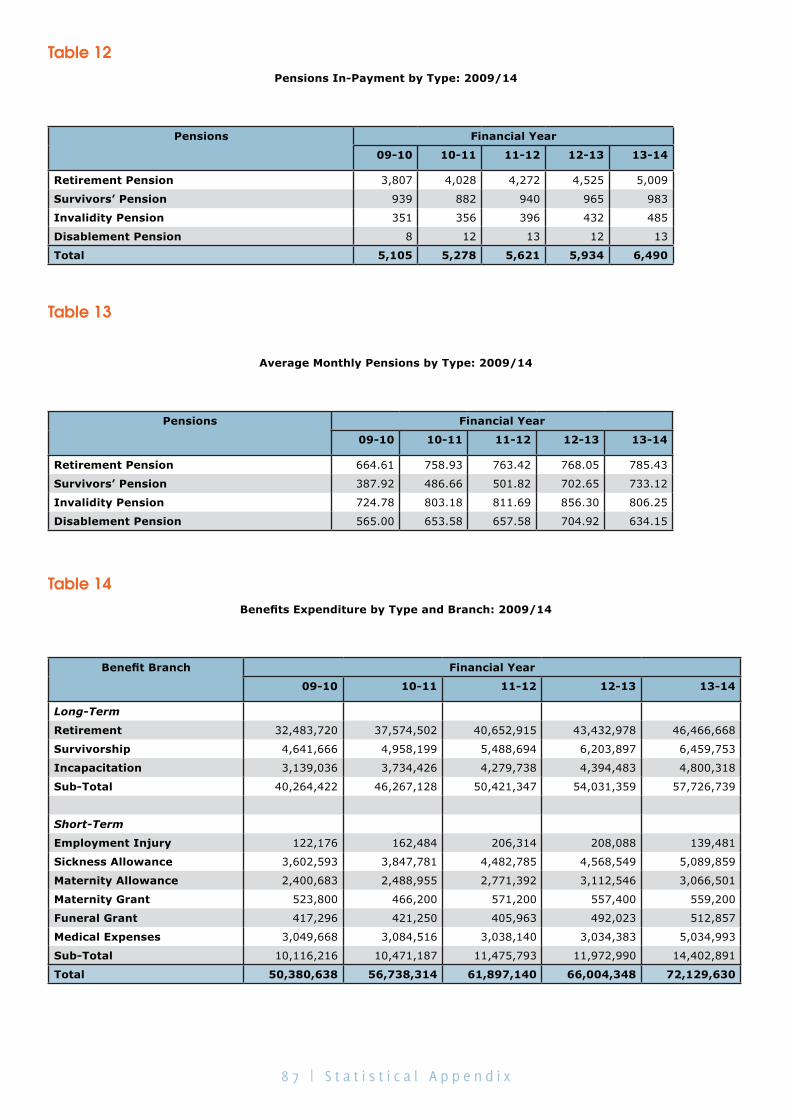
8 7 | S t a t i s t i c a l A p p e n d i x
Table 12Pensions In-Payment by Type: 2009/14
Pensions
Financial Year
09-10 10-11 11-12 12-13 13-14
Retirement Pension 3,807 4,028 4,272 4,525 5,009
Survivors’ Pension 939 882 940 965 983
Invalidity Pension 351 356 396 432 485
Disablement Pension 8 12 13 12 13
Total 5,105 5,278 5,621 5,934 6,490
Table 13
Average Monthly Pensions by Type: 2009/14
Pensions
Financial Year
09-10 10-11 11-12 12-13 13-14
Retirement Pension 664.61 758.93 763.42 768.05 785.43
Survivors’ Pension 387.92 486.66 501.82 702.65 733.12
Invalidity Pension 724.78 803.18 811.69 856.30 806.25
Disablement Pension 565.00 653.58 657.58 704.92 634.15
Table 14Benefits Expenditure by Type and Branch: 2009/14
Benefit Branch
Financial Year
09-10 10-11 11-12 12-13 13-14
Long-Term
Retirement 32,483,720 37,574,502 40,652,915 43,432,978 46,466,668
Survivorship 4,641,666 4,958,199 5,488,694 6,203,897 6,459,753
Incapacitation 3,139,036 3,734,426 4,279,738 4,394,483 4,800,318
Sub-Total 40,264,422 46,267,128 50,421,347 54,031,359 57,726,739
Short-Term
Employment Injury 122,176 162,484 206,314 208,088 139,481
Sickness Allowance 3,602,593 3,847,781 4,482,785 4,568,549 5,089,859
Maternity Allowance 2,400,683 2,488,955 2,771,392 3,112,546 3,066,501
Maternity Grant 523,800 466,200 571,200 557,400 559,200
Funeral Grant 417,296 421,250 405,963 492,023 512,857
Medical Expenses 3,049,668 3,084,516 3,038,140 3,034,383 5,034,993
Sub-Total 10,116,216 10,471,187 11,475,793 11,972,990 14,402,891
Total 50,380,638 56,738,314 61,897,140 66,004,348 72,129,630