Embed Size (px)
Citation preview
ANNUAL REPORT OF THE
F E D E R A L D E P O S I T I N S U R A N C E C O R P O R A T I O N
1964
Digitized for FRASER http://fraser.stlouisfed.org/ Federal Reserve Bank of St. Louis

Digitized for FRASER http://fraser.stlouisfed.org/ Federal Reserve Bank of St. Louis
LETTER OF T R A N S M I T T A L
FEDERAL DEPOSIT INSURANCE CORPORATION Washington, D. C., October 29, 1965
SIRS: Pursuant to the provisions of Section 17(a) of the Federal Deposit Insurance Act, the Federal Deposit Insurance Corporation is pleased to submit its annual report. Part One of the report, separately submitted earlier in the year, is included in this volume.
Respectfully yours,
K. A. RANDALL,Chairman
THE PRESIDENT OF THE SENATE
THE SPEAKER OF THE HOUSE OF REPRESENTATIVES
iiiDigitized for FRASER http://fraser.stlouisfed.org/ Federal Reserve Bank of St. Louis
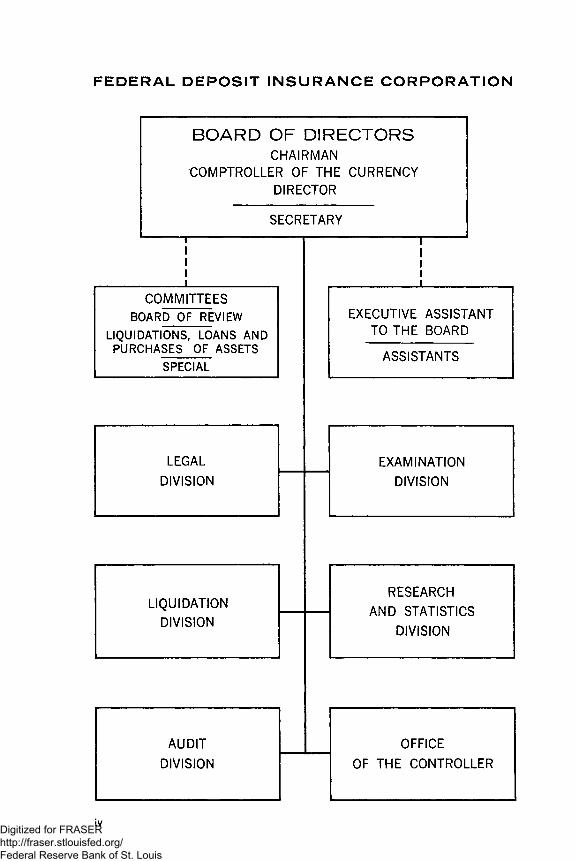
FEDERAL DEPOSIT INSURANCE CORPORATION
ivDigitized for FRASER http://fraser.stlouisfed.org/ Federal Reserve Bank of St. Louis

F E D E R A L D E P O S I T I N S U R A N C E C O R P O R A T I O N5 5 0 17th S t r e e t , N .W. , W a s h i n g t o n , D.C. 2 0 4 2 9
BOARD OF DIRECTORS
Chairman__ __________________________________K. A. Randal!
Comptroller of the Currency-__________________ James J. Saxon
Secretary______________________ E. F. Downey
OFFICIALS
Assistant to the Chairman________________________ John F. Lee
Administrative Assistant to the Chairman_______ John L. Flannery
Chief, Division of Examination_____________ Edward H. DeHority
General Counsel_________________________ William M. Moroney
Executive Assistant to the Board________ Timothy J. Reardon, Jr.
Controller______________________________ Edward F. Phelps, Jr.
Chief, Division of Liquidation__________________ A. E. Anderson
Chief, Division of Research and Statistics___ Raymond E. Hengren
Chief, Audit Division_________________________ James J. Bogart
Assistant to the Board________________________ Frank E. Tracy
Assistant to the Board______________________ Raoul D. Edwards
October 29, T965
Digitized for FRASER http://fraser.stlouisfed.org/ Federal Reserve Bank of St. Louis
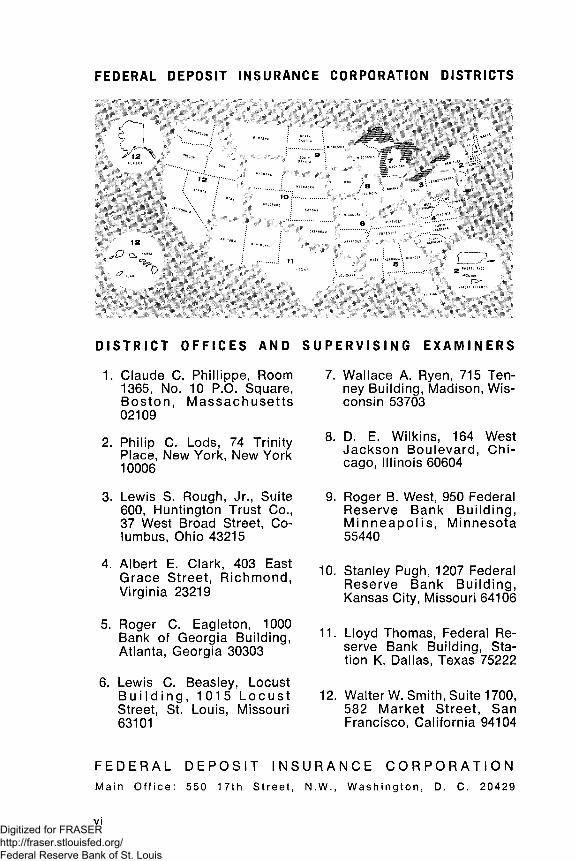
FEDERAL DE PO SIT I N S U R A N C E CORP OR ATIO N D IS T R IC T S
/ ‘’CCW,;'V
to :.............
K-rr...1 2
£? H,WA" ! 0
L _ 72 PUEB,° l"co
DISTRICT OFFICES AND SUPERVISING EXAMINERS
1. Claude C. Phillippe, Room 1365, No. 10 P.O. Square, Boston, M assachusetts 02109
2. Philip C. Lods, 74 Trinity Place, New York, New York 10006
3. Lewis S. Rough, Jr., Suite 600, Huntington Trust Co., 37 West Broad Street, Columbus, Ohio 43215
4. Albert E. Clark, 403 East Grace Street, Richmond, Virginia 23219
5. Roger C. Eagleton, 1000 Bank of Georgia Building, Atlanta, Georgia 30303
6. Lewis C. Beasley, Locust B u i l d i n g , 1015 Loc u s t Street, St. Louis, Missouri 63101
7. Wallace A. Ryen, 715 Tenney Building, Madison, Wisconsin 53703
8. D. E. Wilkins, 164 West Jackson Boulevard, Chicago, Illinois 60604
9. Roger B. West, 950 Federal Reserve Bank Building, Minneapol i s, Minnesota 55440
10. Stanley Pugh, 1207 Federal Reserve Bank Building, Kansas City, Missouri 64106
11. Lloyd Thomas, Federal Reserve Bank Building, Station K, Dallas, Texas 75222
12. Walter W. Smith, Suite 1700, 582 Market Street, San Francisco, California 94104
F E D E R A L D E P O S I T I N S U R A N C E C O R P O R A T I O NM ain O ffic e : 550 1 7th S tre e t, N.W., W a sh in g to n , D. C. 20429
Digitized for FRASER http://fraser.stlouisfed.org/ Federal Reserve Bank of St. Louis
CONT ENT S
Summary________________________________________ ___________________ xv
PART ONE
OPERATIONS OF THE CORPORATIONPage
Introduction_________________________________________________________ 3Federal deposit insurance coverage___________________________________ 8Insurance operations to protect depositors of failing banks______________ 9Supervisory activities________________________________________________ 13Legal developments_______________________________________ _________ 18Administration of the Corporation_____________________________________ 21Finances of the Corporation ___ ______________________________ 23
PART TWO
LEGISLATION AND REGULATIONS
Federal banking legislation— 1964_____________________________________ 63Rules and regulations of the Corporation_______________________________ 66State banking legislation— 1964__________________ __________________ 67
PART THREE
DEPOSIT ACCOUNTS AND INSURANCE COVERAGE
Introduction__________________________________________________________77Accounts and deposits at four special call dates_________________________77Distributions of accounts and deposits in 1964_________________________ _82Depositor protection under different coverage limitations__________________87Detailed statistics_________________________________ ________________ ___ 89Appendix______________________________________ ________ _____________ 89
PART FOUR
BANKING DEVELOPMENTS
Supervisory status of banks_______________________ ______ 133Changes in number of banking offices_________________________________ 136Concentration and location of banking facilities_________________________ 139Assets and liabilities of banks________________________________________ 147Income of insured banks______________________________________ _____ 150
PART FIVE
STATISTICS OF BANKS AND DEPOSIT INSURANCE
Number, offices, and deposits of banks________________________________ 156Assets and liabilities of banks_______________________________________ 170Income of insured banks_____________________________________________ 192Banks closed because of financial difficulties,
and deposit insurance disbursements_________ .... 220
vii
Digitized for FRASER http://fraser.stlouisfed.org/ Federal Reserve Bank of St. Louis

LIST OF TABLES
PART ONE
OPERATIONS OF THE CORPORATION INSURANCE OPERATIONS TO PROTECT DEPOSITORS IN FAILING BANKS:
1. Insured banks closed during 1964 requiring disbursements by theFederal Deposit Insurance Corporation__________________________ 10
2. Protection of depositors of insured banks requiring disbursements bythe Federal Deposit Insurance Corporation, 1934-1964____________ 11
3. Analysis of disbursements, recoveries and losses in deposit insurancetransactions, January 1, 1934-December 31, 1964________________ 12
SUPERVISORY ACTIVITIES:
4. Applications acted upon by the Board of Directors of the FederalDeposit Insurance Corporation during 1964______________________ 14
5. Mergers, consolidations, acquisitions of assets and assumptions ofliabilities approved under section 18(c) of the Federal Deposit Insurance Act during 1964________________________________________ 15
6. Bank examination activities of the Federal Deposit Insurance Corporation in 1963 and 1964_______________________________________ 16
7. Actions to terminate insured status of banks charged with unsafe orunsound banking practices or violations of law or regulations, 1936- 1964 _______________________________________________________ 17
15. Description of each merger, consolidation, acquisition of assets orassumption of liabilities approved by the Corporation during 1964___ 31
ADMINISTRATION OF THE CORPORATION:
8. Number of officers and employees of the Federal Deposit InsuranceCorporation, December 31, 1963 and 1964______________________ 22
FINANCES OF THE CORPORATION:
9. Statement of financial condition, Federal Deposit Insurance Corporation, December 31, 1964_______________________________________ 24
10. Statement of income and the deposit insurance fund, Federal DepositInsurance Corporation, year ended December 31, 1964___________ 25
11. Determination and distribution of net assessment income, Federal Deposit Insurance Corporation, year ended December 31, 1964_____ 26
12. Sources and application of funds, Federal Deposit Insurance Corporation, year ended December 31, 1964____________________________ 26
13. Income and expenses, Federal Deposit Insurance Corporation, by years,from beginning of operations, September 11, 1933, to December 31, 1964, adjusted to December 31, 1964____________________________ 27
14. Insured deposits and the deposit insurance fund, 1934-1964_________ 28
viii
Digitized for FRASER http://fraser.stlouisfed.org/ Federal Reserve Bank of St. Louis
PART THREE
DEPOSIT ACCOUNTS AND INSURANCE COVERAGE TABLES ACCOMPANYING TEXT:
16. Accounts and deposits, all insured banks, special call dates, 1964, 1955,1945, and 1936_______________________________________________ 78
17. Percentage changes in number of accounts and amount of deposits,all insured banks, selected periods____________________________ 79
18. Accounts and deposits in insured commercial banks, grouped by sizeof account, September 21, 1955 and November 18, 1964_________ 82
19. Proportions of fully protected to total accounts and insured to totaldeposits, by class of bank, September 21, 1955, and November 18,1964 _______________________________________________________ 83
20. Accounts fully protected and deposits insured with specified amounts ofmaximum coverage, all insured banks, November 18, 1964_______ 88
DISTRIBUTION OF ACCOUNTS AND DEPOSITS, ALL INSURED BANKS:
21. Accounts fully and partially protected and deposits insured, all insuredbanks, November 18, 1964
Banks grouped by Federal Deposit Insurance Corporation district and State ___________________________________________________ 94
22. Accounts fully and partially protected and deposits insured, all insuredbanks, November 18,1964
Banks grouped by amount of deposits, population of center in which located, class, and percent of deposits insured; and accounts grouped by type _________ _____________ ___________ _________________ 96
23. Accounts fully and partially protected and deposits insured, all insuredbanks, November 18,1964
Banks grouped by standard metropolitan statistical area and city ________________________________________________________ 98
DISTRIBUTION OF ACCOUNTS OF INSURED COMMERCIAL BANKS ACCORDING TO SIZE OF ACCOUNT:
24. Distribution of accounts according to size, insured commercial banks,November 18, 1964
Banks grouped by Federal Deposit Insurance Corporation district and State __________________________________________________ 100
25. Distribution of accounts according to size, insured commercial banks,November 18,1964
Banks grouped by amount of deposits, population of center in which located, class, and percent of deposits insured; and accounts grouped by type _____________________________________________________ 102
26. Distribution of demand accounts of individuals, partnerships, and corporations acording to size of account, insured commercial banks, November 18, 1964
Banks grouped by Federal Deposit Insurance Corporation district and State ___________________________________________________ 104
Digitized for FRASER http://fraser.stlouisfed.org/ Federal Reserve Bank of St. Louis
27. Distribution of savings and time accounts of individuals, partnerships,and corporations according to size of account, insured commercial banks, November 18, 1964
Banks grouped by Federal Deposit Insurance Corporation district and State _________________________________________________ 106
28. Distribution of demand accounts of individuals, partnerships, andcorporations according to size of account, insured commercial banks, November 18, 1964
Banks grouped by amount of deposits_____________________ 108
29. Distribution of savings and time accounts of individuals, partnerships,and corporations according to size of account, insured commercial banks, November 18,1964
Banks grouped by amount of deposits________ 109
DISTRIBUTION OF DEPOSITS IN INSURED COMMERCIAL BANKS ACCORDING TO SIZE OF ACCOUNT:
30. Distribution of deposits according to size of account, insured commercialbanks, November 18, 1964
Banks grouped by Federal Deposit Insurance Corporation district and State ___________________________________________________ 110
31. Distribution of Deposits according to size of account, insured commercialbanks, November 18, 1964
Banks grouped by amount of deposits, population of center in which located, class, and percent of deposits insured; and accounts grouped by type _____________________________________________________ 112
32. Distribution of demand deposits of individuals, partnerships, and corporations according to size of account, insured commercial banks, November 18, 1964
Banks grouped by Federal Deposit Insurance Corporation district and State ___________________________________________________ 114
33. Distribution of savings and time deposits of individuals, partnerships,and corporations according to size of account, insured commercial banks, November 18, 1964
Banks grouped by Federal Deposit Insurance Corporation district and State ___________________________________________________ 116
34. Distribution of demand deposits of individuals, partnerships, and corporations according to size of account, insured commercial banks, November 18, 1964
Banks grouped by amount of deposits________________________ 118
35. Distribution of savings and time deposits of individuals, partnerships,and corporations according to size of account, insured commercial banks, November 18, 1964
Banks grouped by amount of deposits________________________ 119
DISTRIBUTION OF ACCOUNTS AND DEPOSITS BY SIZE OF ACCOUNT, INSURED MUTUAL SAVINGS BANKS:
36. Distribution of accounts according to size, insured mutual savings banks, November 18, 1964
Digitized for FRASER http://fraser.stlouisfed.org/ Federal Reserve Bank of St. Louis
Banks grouped by Federal Deposit Insurance Corporation district, State, amount of deposits, population of center, and percent of deposits insured; and accounts by type__________________________ 120
37. Distribution of deposits according to size of account, insured mutualsavings banks, November 18, 1964
Banks grouped by Federal Deposit Insurance Corporation district, State, amount of deposits, population of center, and percent of deposits insured; and accounts by type .... _________________ 122
ACCOUNTS FULLY PROTECTED AND DEPOSITS INSURED ASSUMING ALTERNATIVE AMOUNTS OF MAXIMUM COVERAGE PER ACCOUNT:
38. Number of accounts fully protected and deposits insured assumingalternative amounts of maximum coverage per account, insured commercial banks, November 18, 1964
Banks grouped by Federal Deposit Insurance Corporation district and State_________ ____________ _____________________________ 124
39. Number of accounts fully protected and deposits insured assumingalternative amounts of maximum coverage per account, insured commercial banks, November 18, 1964
Banks grouped by amount of total deposits, population of center of location, class, and percent of total deposits insured; and accounts grouped by type______________ __ __________ _________________ 126
40. Number of accounts fully protected and deposits insured assumingalternative amounts of maximum coverage per account, insured mutual savings banks, November 18, 1964
Banks grouped by Federal Deposit Insurance Corporation district, State, size of total deposits, population of center of location, and percent of total deposits insured; and accounts grouped by type______ 128
41. Distribution of insured banks by percentage of deposits insured assuming alternative amounts of maximum coverage, November 18, 1964 130
PART FOUR
BANKING DEVELOPMENTS SUPERVISORY STATUS OF BANKS:
42. All banks in the United States classified by supervisory status andFederal deposit insurance participation, December 31, 1964_______ 133
43. Assets of banks classified by supervisory status and Federal depositinsurance participation, December 31, 1964_____________________ 134
44. Deposits of banks classified by supervisory status and Federal depositinsurance participation, December 31, 1964_____________________ 135
45. Ratios of capital accounts to assets of banks of deposit classified bysupervisory status and Federal deposit insurance participation, December 31, 1964 ____ ______________________________ 135
CHANGES IN NUMBER OF BANKING OFFICES:
46. Analysis of changes in number of banks and branches in the UnitedStates during 1964 __________________________________ 136
Digitized for FRASER http://fraser.stlouisfed.org/ Federal Reserve Bank of St. Louis

CHANGES IN NUMBER OF BANKING OFFICES:
46. Analysis of changes in number of banks and branches in the UnitedStates during 1964 ___ __________________________________ 136
CONCENTRATION AND LOCATION OF BANKING FACILITIES:
47. Commercial bank deposits and proportions of total held by the largestcommercial banks or bank groups, December 31, 1964 ... _______ 140
48. Relative size of largest commercial banks or bank groups in Statesclassified by status of branch banking, December 31, 1964_________ 141
49. Relative size of largest banks or bank groups in 65 metropolitan areas,June 30, 1964________________________________________________ 142
50. Banks, banking offices, and population per bank and office in eachState, December 31, 1964, with change from December 31, 1960___ 144
51. Commercial banking offices in the United States grouped by locationin different-sized population centers with selected numbers of offices, December 31, 1964 ___________________________________________ 145
52. Commercial banking offices, banks, and branches in metropolitan andother areas grouped according to status of branch banking, Decemb.er31, 1964___ .... ______________________________________ 146
ASSETS AND LIABILITIES OF BANKS:
53. Assets and liabilities of all banks in the United States, by type of bank,December 31, 1964 ________________________________ 148
INCOME OF INSURED BANKS:
54. Sources and disposition of total income of insured commercial banks,1962-1964 ___________________________________________________ 151
55. Distribution by deposit size of insured commercial banks operatingthroughout 1964 and percentages of selected banking totals in each size group... ___________ ________ __________________ 151
56. Operating data of insured commercial banks in operation throughoutselected years, 1950, 1955, 1960-1964_________________________ 153
57. Sources and disposition of total income of insured mutual savingsbanks, 1962-1964 ___________________________ 154
PART FIVE
STATISTICS OF BANKS AND DEPOSIT INSURANCENUMBER, OFFICES AND DEPOSITS OF BANKS:
Explanatory note____________________________________________________ 156
101. Changes in number and classification of banks and branches in theUnited States (States and other areas) during 1964______________ 158
102. Number of banking offices in the United States (States and otherareas), December 31, 1964
Grouped according to insurance status and class of bank, and by State or areas and type of office________________________________ 160
Digitized for FRASER http://fraser.stlouisfed.org/ Federal Reserve Bank of St. Louis
103. Number and deposits of all banks in the United States (States andother areas), December 31, 1964
Banks grouped according to insurance status and by district and State _______________________________________________________ 168
ASSETS AND LIABILITIES OF BANKS:
Explanatory note____________________________________________________ 170
104. Assets and liabilities of all banks in the United States (States and otherareas), June 30, 1964
Banks grouped according to insurance status and type of bank__ 172
105. Assets and liabilities of all banks in the United States (States and otherareas), December 31, 1964
Banks grouped according to insurance status and type of bank__ 174
106. Assets and liabilities of all banks in the United States (States and otherareas), December 31, 1964
Banks grouped by district and State___________________________ 176
107. Assets and liabilities of all insured banks in the United States (Statesand other areas), June and December call dates, 1961 through 1964 178
108. Assets and liabilities of insured commercial and insured mutual savingsbanks in the United States (States and other areas), December and June call dates, 1962 through 1964_____________________________ 182
109. Average assets and liabilities and assets and liabilities per $100 oftotal assets of insured commercial banks in the United States (States and other areas), 1964
By ciass of bank__________ ____________________________ ____ 186
110. Assets and liabilities and assets and liabilities per $100 of total assetsof insured commercial banks operating throughout 1964 in the United States (States and other areas), December 31, 1964
Banks grouped according to amount of deposits______________ 187
111. Average assets and liabilities of insured commercial banks in the UnitedStates (States and other areas), by State, 1964__________________ 188
112. Distribution of insured commercial banks in the United States (Statesand other areas), December 31, 1964
Banks grouped according to amount of deposits and by ratios of selected items to assets _____________________________________ 190
INCOME OF INSURED BANKS:
Explanatory note____________________ ____________________________ 192
113. Income of insured commercial banks in the United States (States andother areas), 1956-1964 ____ ______________________________ 194
114. Ratios of income of insured commercial banks in the United States(States and other areas), 1956-1964 ___________________________ 196
115. Income of insured commercial banks in the United States (States andother areas), 1964
By class of bank _________ 198
Digitized for FRASER http://fraser.stlouisfed.org/ Federal Reserve Bank of St. Louis

116. Ratios of income of insured commercial banks in the United States(States and other areas), 1964
By class of bank____________________________________________ 200
117. Income of insured commercial banks operating throughout 1964 in theUnited States (States and other areas)
Banks grouped according to amount of deposits ____________ 202
118. Ratios of income of insured commercial banks operating throughout1964 in the United States (States and other areas)
Banks grouped according to amount of deposits _____________ 204
119. Income of insured commercial banks in the United States (States andother areas), by State, 1964 ___________________________________ 206
120. Income of insured mutual savings banks, 1956-1964________________ 216
121. Ratios of income of insured mutual savings banks, 1956-1964_______ 218
BANKS CLOSED BECAUSE OF FINANCIAL DIFFICULTIES,AND DEPOSIT INSURANCE DISBURSEMENTS
Explanatory note____________________________________________________ 220
122. Number and deposits of banks closed because of financial difficulties,1934-1964, by years___________________ _______________________ 222
123. Insured banks requiring disbursements by the Federal Deposit InsuranceCorporation during 1964______________________________________ 223
124. Depositors, deposits, and disbursements in insured banks requiring disbursements by the Federal Deposit Insurance Corporation, 1934-1964
Banks grouped by class of bank, year of deposit payoff or deposit assumption, amount of deposits, and State_____________________ 224
125. Recoveries and losses by the Federal Deposit Insurance Corporation onprincipal disbursements for protection of depositors, 1934-1964____ 226
xiv
Digitized for FRASER http://fraser.stlouisfed.org/ Federal Reserve Bank of St. Louis
SU M M A R Y
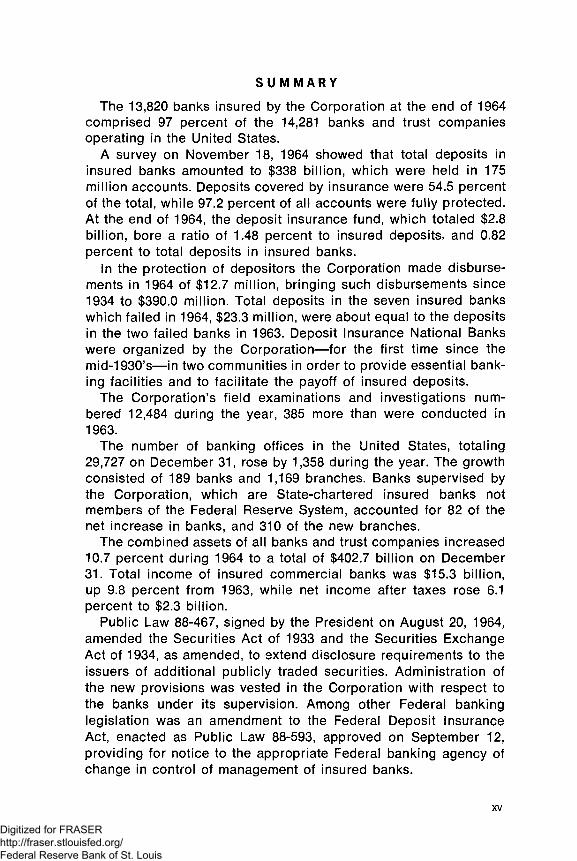
The 13,820 banks insured by the Corporation at the end of 1964 comprised 97 percent of the 14,281 banks and trust companies operating in the United States.
A survey on November 18, 1964 showed that total deposits in insured banks amounted to $338 billion, which were held in 175 million accounts. Deposits covered by insurance were 54.5 percent of the total, while 97.2 percent of all accounts were fully protected. At the end of 1964, the deposit insurance fund, which totaled $2.8 billion, bore a ratio of 1.48 percent to insured deposits, and 0.82 percent to total deposits in insured banks.
In the protection of depositors the Corporation made disbursements in 1964 of $12.7 million, bringing such disbursements since 1934 to $390.0 million. Total deposits in the seven insured banks which failed in 1964, $23.3 million, were about equal to the deposits in the two failed banks in 1963. Deposit Insurance National Banks were organized by the Corporation— for the first time since the mid-1930’s— in two communities in order to provide essential banking facilities and to facilitate the payoff of insured deposits.
The Corporation’s field examinations and investigations numbered 12,484 during the year, 385 more than were conducted in1963.
The number of banking offices in the United States, totaling 29,727 on December 31, rose by 1,358 during the year. The growth consisted of 189 banks and 1,169 branches. Banks supervised by the Corporation, which are State-chartered insured banks not members of the Federal Reserve System, accounted for 82 of the net increase in banks, and 310 of the new branches.
The combined assets of all banks and trust companies increased 10.7 percent during 1964 to a total of $402.7 billion on December 31. Total income of insured commercial banks was $15.3 billion, up 9.8 percent from 1963, while net income after taxes rose 6.1 percent to $2.3 billion.
Public Law 88-467, signed by the President on August 20, 1964, amended the Securities Act of 1933 and the Securities Exchange Act of 1934, as amended, to extend disclosure requirements to the issuers of additional publicly traded securities. Administration of the new provisions was vested in the Corporation with respect to the banks under its supervision. Among other Federal banking legislation was an amendment to the Federal Deposit Insurance Act, enacted as Public Law 88-593, approved on September 12, providing for notice to the appropriate Federal banking agency of change in control of management of insured banks.
XV
Digitized for FRASER http://fraser.stlouisfed.org/ Federal Reserve Bank of St. Louis

Digitized for FRASER http://fraser.stlouisfed.org/ Federal Reserve Bank of St. Louis

OPERATIONS
OF THE CORPORATION
P A R T O N E
Digitized for FRASER http://fraser.stlouisfed.org/ Federal Reserve Bank of St. Louis

Digitized for FRASER http://fraser.stlouisfed.org/ Federal Reserve Bank of St. Louis
INTRODUCTION
The Federal Deposit Insurance Corporation has completed thirty-one years of operation. Established by the Banking Act of 1933 at the depth of the most severe banking crisis in the nation’s history, its immediate contribution was the restoration of public confidence in banks, and over the years it has helped to strengthen our banking system. The insurance of bank deposits, effective on January 1, 1934, has sustained their use as the major means for settling accounts. Thereafter, both the reduction in bank failures and the ready availability of insured deposits in those insured banks which closed because of financial difficulties have clearly exerted a stabilizing influence upon our economy.
Most people who know about the Federal Deposit Insurance Corporation recognize it as the agency which insures bank deposits up to $10,000 for each depositor. Less well known, but equally significant, have been its responsibilities in the field of bank supervision deriving from its role as insurer. Actually the Corporation has very limited powers; it can neither charter a bank nor close a bank, and has power to pass upon only about one-half of the new banks admitted to insurance. Nevertheless, the supervisory powers accorded the Corporation complement and strengthen the supervision of banks exercised by State and other Federal agencies, particularly in the area of bank examinations.
As the principal source of money used in transacting the nation’s business, banks have long been recognized as institutions uniquely affecting the public interest and therefore properly subject to special governmental supervision. Long before checks drawn on bank deposits became the predominant means of payment, this function was performed by other obligations, specifically bank notes. Failures in banking impaired the usefulness of bank notes and led to efforts well over a century ago to create a mechanism which would assure their safety.
New York was the first of 14 States which adopted plans, over a period from 1829 to 1917, to insure or guarantee bank obligations which served as currency. The confinement of the plans to individual States and to State-chartered banks, along with varied individual weaknesses, limited their usefulness, although some of them were notably successful. Three of the six pre-Civil War plans expired when member banks converted into national banks following the prohibitive tax levied upon State bank notes in 1865. National bank notes were expected to supersede State bank
3Digitized for FRASER http://fraser.stlouisfed.org/ Federal Reserve Bank of St. Louis
4 FEDERAL DEPOSIT INSURANCE CORPORATION
notes, and they were further expected to provide an adequate and reliable means of payment, because of their guarantee by the Federal government.
It was not foreseen that another type of bank obligation— bank deposits— would soon overshadow bank notes as the dominant circulating medium, and that their vulnerability as a result of continuing bank failures would seriously weaken our monetary structure. When this happened, several States attempted to meet the problem through the guaranty or insurance of deposits. Eight States established such programs during the decade following 1907, but none of them survived the avalanche of bank failures during the 1920's and early 1930’s. Meanwhile, proposals blossomed for a nation-wide system of depositor protection; among the 150 bills introduced in the Congress on the subject between 1886 and 1933 may be found several of the features incorporated in the act providing for Federal deposit insurance. This background of experience and experimentation enabled the architects of Federal deposit insurance to design a better plan than otherwise would have been possible.
Few substantive changes have been made in the character of the Corporation during its 31 years of operation. Insurance coverage was increased from an initial maximum of $2,500 to $5,000 per depositor on July 1, 1934, where it remained until raised to the present $10,000 limit on September 21, 1950. The original basis for assessments was changed to a regular rate basis in 1935, and in 1950 a credit was provided against future assessments based on Corporation losses and expenses. The Corporation’s supervisory powers have also been clarified and strengthened by different statutes.
That the Corporation has come to perform a key function in the economy derives in large part from the fact that it insures all but 461 of the 14,281 banks comprising our nation’s diverse banking system. Insured banks vary greatly in size, conduct different types of business, and operate under the varied laws of 50 States as well as the Federal government. Quite unlike banking elsewhere, most banks in the United States are small. As of November 18, 1964, 12,812 commercial banks, none with deposits of more than $50 million, accounted for 95 percent of the total number of commercial banks insured by the Corporation and held 32 percent of the deposits in insured commercial banks. At the same time, the largest 34 insured commercial banks, each with deposits of $1 billion or more, held 33 percent of the deposits.
A banking system of this type, characterized by diversity and decentralization, contains elements of instability. In nations where a few huge institutions dominate the banking scene, failures are
Digitized for FRASER http://fraser.stlouisfed.org/ Federal Reserve Bank of St. Louis
INTRODUCTION 5
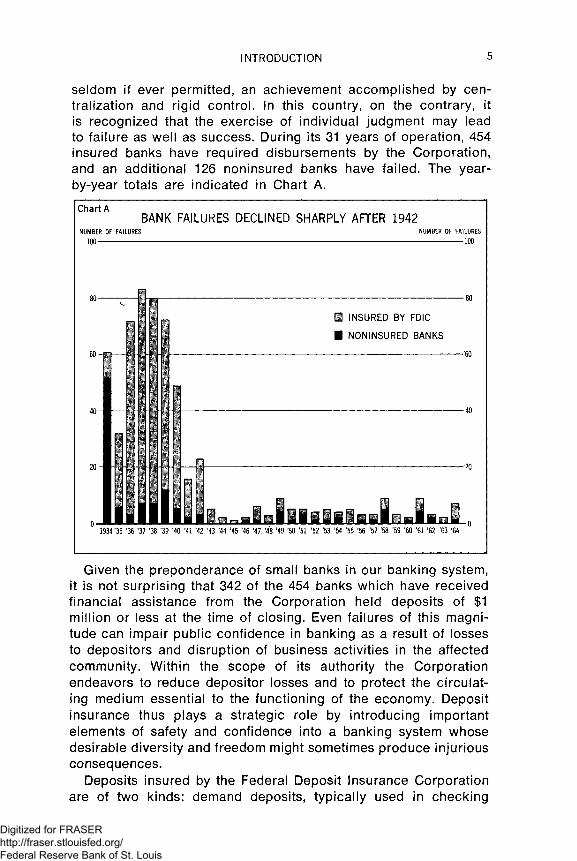
seldom if ever permitted, an achievement accomplished by centralization and rigid control. In this country, on the contrary, it is recognized that the exercise of individual judgment may lead to failure as well as success. During its 31 years of operation, 454 insured banks have required disbursements by the Corporation, and an additional 126 noninsured banks have failed. The year- by-year totals are indicated in Chart A.
Chart ABANK FAILURES DECLINED SHARPLY AFTER 1942
NUMBER OF FAILURES -------------------- 100
NUMBER OF FAILURES 100--------------------
Given the preponderance of small banks in our banking system, it is not surprising that 342 of the 454 banks which have received financial assistance from the Corporation held deposits of $1 million or less at the time of closing. Even failures of this magnitude can impair public confidence in banking as a result of losses to depositors and disruption of business activities in the affected community. Within the scope of its authority the Corporation endeavors to reduce depositor losses and to protect the circulating medium essential to the functioning of the economy. Deposit insurance thus plays a strategic role by introducing important elements of safety and confidence into a banking system whose desirable diversity and freedom might sometimes produce injurious consequences.
Deposits insured by the Federal Deposit Insurance Corporation are of two kinds: demand deposits, typically used in checking
Digitized for FRASER http://fraser.stlouisfed.org/ Federal Reserve Bank of St. Louis
6 FEDERAL DEPOSIT INSURANCE CORPORATION
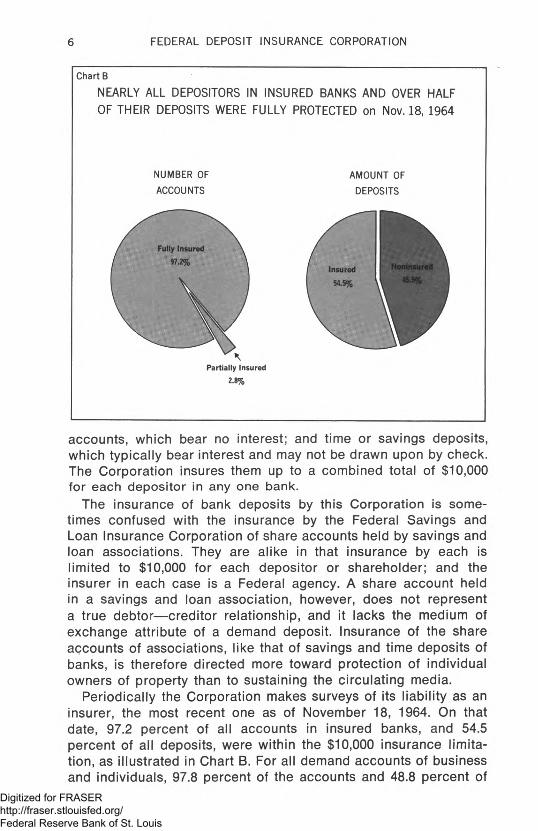
Partially Insured
2. 8%
Chart B
NEARLY ALL DEPOSITORS IN INSURED BANKS AND OVER HALF
OF THEIR DEPOSITS WERE FULLY PROTECTED on Nov. 18, 1964
NUMBER OF
ACCOUNTSAMOUNT OF
DEPOSITS
accounts, which bear no interest; and time or savings deposits, which typically bear interest and may not be drawn upon by check. The Corporation insures them up to a combined total of $10,000 for each depositor in any one bank.
The insurance of bank deposits by this Corporation is sometimes confused with the insurance by the Federal Savings and Loan Insurance Corporation of share accounts held by savings and loan associations. They are alike in that insurance by each is limited to $10,000 for each depositor or shareholder; and the insurer in each case is a Federal agency. A share account held in a savings and loan association, however, does not represent a true debtor— creditor relationship, and it lacks the medium of exchange attribute of a demand deposit. Insurance of the share accounts of associations, like that of savings and time deposits of banks, is therefore directed more toward protection of individual owners of property than to sustaining the circulating media.
Periodically the Corporation makes surveys of its liability as an insurer, the most recent one as of November 18, 1964. On that date, 97.2 percent of all accounts in insured banks, and 54.5 percent of all deposits, were within the $10,000 insurance limitation, as illustrated in Chart B. For all demand accounts of business and individuals, 97.8 percent of the accounts and 48.8 percent of
Digitized for FRASER http://fraser.stlouisfed.org/ Federal Reserve Bank of St. Louis
INTRODUCTION 7
the deposits were fully insured under the $10,000 limitation. A slightly smaller percentage— 96.5 percent— of the savings and time accounts of business and individuals were fully protected, but a substantially higher percentage— 75.6 percent— of their deposits were fully protected.
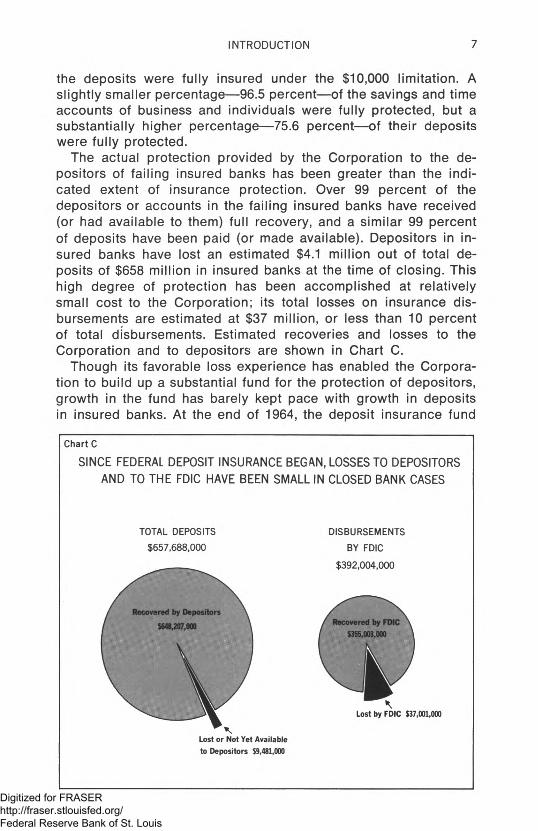
The actual protection provided by the Corporation to the depositors of failing insured banks has been greater than the indicated extent of insurance protection. Over 99 percent of the depositors or accounts in the failing insured banks have received (or had available to them) full recovery, and a similar 99 percent of deposits have been paid (or made available). Depositors in insured banks have lost an estimated $4.1 million out of total deposits of $658 million in insured banks at the time of closing. This high degree of protection has been accomplished at relatively small cost to the Corporation; its total losses on insurance disbursements are estimated at $37 million, or less than 10 percent of total disbursements. Estimated recoveries and losses to the Corporation and to depositors are shown in Chart C.
Though its favorable loss experience has enabled the Corporation to build up a substantial fund for the protection of depositors, growth in the fund has barely kept pace with growth in deposits in insured banks. At the end of 1964, the deposit insurance fund
SINCE FEDERAL DEPOSIT INSURANCE BEGAN, LOSSES TO DEPOSITORS
AND TO THE FDIC HAVE BEEN SMALL IN CLOSED BANK CASES
Chart C
TOTAL DEPOSITS $657,688,000
DISBURSEMENTS
BY FDIC
$392,004,000
Lost or Not Yet Available
to Depositors $9,481,000
Lost by FDIC $37,001,000
Digitized for FRASER http://fraser.stlouisfed.org/ Federal Reserve Bank of St. Louis
8 FEDERAL DEPOSIT INSURANCE CORPORATION
amounted to $2.8 billion, or less than one percent of total deposits. In addition to its insurance fund the Corporation has authority to borrow up to $3 billion from the U. S. Treasury to meet its insurance obligations.
Both the Corporation and the banking industry take satisfaction from the fact that deposit insurance requires no tax revenue. The original capital of $289 million advanced by the Federal government and the Federal Reserve Banks at the start of the Corporation has been repaid, with interest amounting to $81 million. Assessments paid by insured banks have provided a surplus over losses and expenses which is invested in U. S. Government obligations; continuing assessments and income from these investments provide practically all the Corporation’s income.
The Corporation is an independent agency of the executive branch of the government administered by a bipartisan Board of Directors. It has achieved the respect of many critics who initially opposed insurance as the enemy of soundness in banking. And it has realized that ultimate accolade of being taken for granted by a constituency largely unfamiliar with the ills which brought it into being.
FEDERAL DEPOSIT INSURANCE COVERAGE
Banks insured by the Corporation totaled 13,820 at the end of 1964. These represented about 97 percent of the 14,281 banks and trust companies in operation. The proportion so insured has never been less than the 86 percent covered at the very beginning of Federal deposit insurance.
Insurance is available to qualified incorporated banks and trust companies which receive deposits. National banks authorized to do business by the Comptroller of the Currency are automatically insured, as are State banks which are members of the Federal Reserve System. Other banks become insured upon application to and approval by the Corporation’s Board of Directors. During 1964, 200 national banks, 3 State banks members of the Federal Reserve System, and 140 State nonmember banks became insured. Except for 20 of the banks in the last group, all were new banks.
Both commercial and mutual savings banks may become insured. About two-fifths of the 461 banks not insured by the Corporation are mutual savings banks, and nearly all of these are members of a State insurance system. Most of the remaining uninsured banks are institutions ineligible for insurance, either because of their unusual character— such as private banks or non-deposit trust companies— or because of their inability to meet insurance standards.
Digitized for FRASER http://fraser.stlouisfed.org/ Federal Reserve Bank of St. Louis
FEDERAL DEPOSIT INSURANCE COVERAGE 9
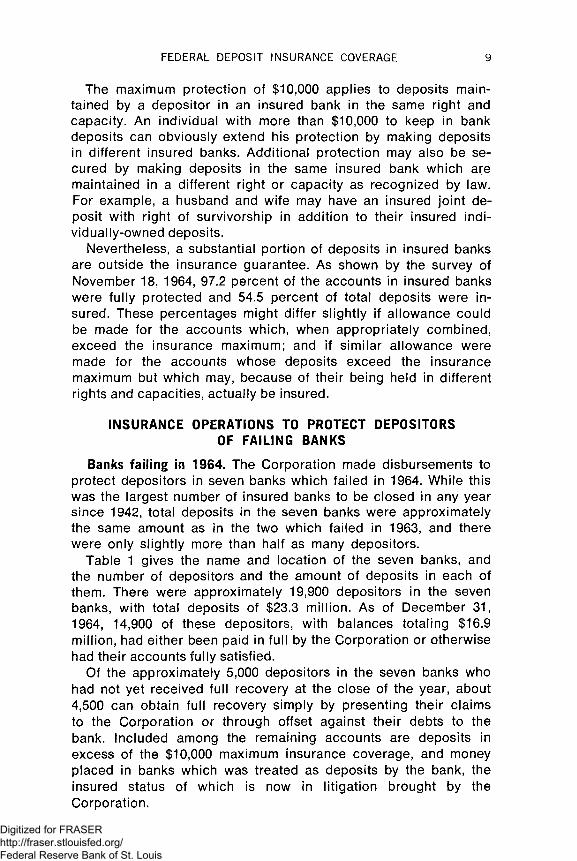
The maximum protection of $10,000 applies to deposits maintained by a depositor in an insured bank in the same right and capacity. An individual with more than $10,000 to keep in bank deposits can obviously extend his protection by making deposits in different insured banks. Additional protection may also be secured by making deposits in the same insured bank which are maintained in a different right or capacity as recognized by law. For example, a husband and wife may have an insured joint deposit with right of survivorship in addition to their insured individually-owned deposits.
Nevertheless, a substantial portion of deposits in insured banks are outside the insurance guarantee. As shown by the survey of November 18, 1964, 97.2 percent of the accounts in insured banks were fully protected and 54.5 percent of total deposits were insured. These percentages might differ slightly if allowance could be made for the accounts which, when appropriately combined, exceed the insurance maximum; and if similar allowance were made for the accounts whose deposits exceed the insurance maximum but which may, because of their being held in different rights and capacities, actually be insured.
INSURANCE OPERATIONS TO PROTECT DEPOSITORS OF FAILING BANKS
Banks failing in 1964. The Corporation made disbursements to protect depositors in seven banks which failed in 1964. While this was the largest number of insured banks to be closed in any year since 1942, total deposits in the seven banks were approximately the same amount as in the two which failed in 1963, and there were only slightly more than half as many depositors.
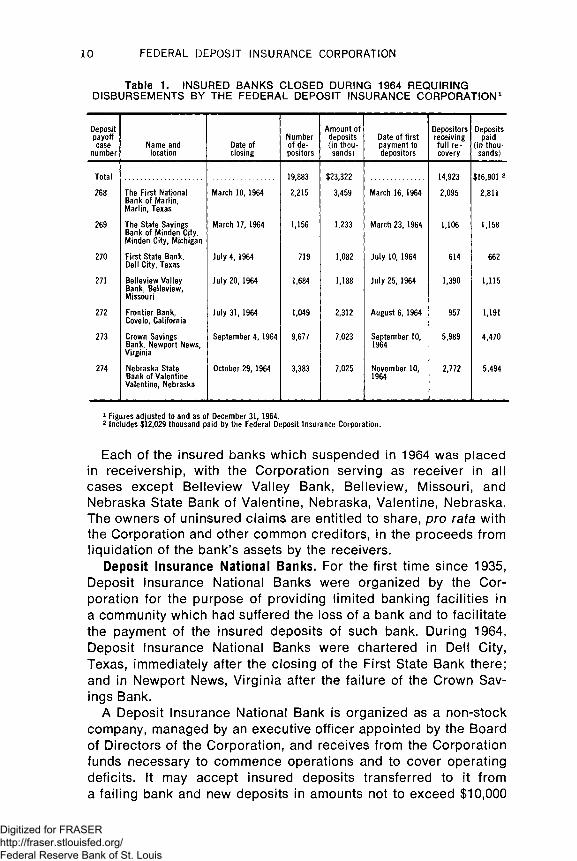
Table 1 gives the name and location of the seven banks, and the number of depositors and the amount of deposits in each of them. There were approximately 19,900 depositors in the seven banks, with total deposits of $23.3 million. As of December 31, 1964, 14,900 of these depositors, with balances totaling $16.9 million, had either been paid in full by the Corporation or otherwise had their accounts fully satisfied.
Of the approximately 5,000 depositors in the seven banks who had not yet received full recovery at the close of the year, about 4,500 can obtain full recovery simply by presenting their claims to the Corporation or through offset against their debts to the bank. Included among the remaining accounts are deposits in excess of the $10,000 maximum insurance coverage, and money placed in banks which was treated as deposits by the bank, the insured status of which is now in litigation brought by the Corporation.
Digitized for FRASER http://fraser.stlouisfed.org/ Federal Reserve Bank of St. Louis
10 FEDERAL DEPOSIT INSURANCE CORPORATION
Table 1. INSURED BANKS CLOSED DURING 1964 REQUIRING DISBURSEMENTS BY THE FEDERAL DEPOSIT INSURANCE CORPORATION1
Depositpayoffcase
numberName and
locationDate of closing
Number of depositors
Amount of deposits (in thousands)
Date of first payment to depositors
Depositors receiving fu ll recovery
Deposits paid
(in thousands)
Total 19,883
2,215
$23,322
3,459
14,923
2,095
$16,901 2
2,811268The First National Bank of Marlin, Marlin, Texas
March 10, 1964 March 16, 1964
269 The State Savings Bank of Minden City, Minden City, Michigan
March 17, 1964 1,156 1,233 March 23, 1964 1,106 1,158
270 First State Bank, Dell City, Texas
July 4, 1964 719 1,082 July 10, 1964 614 662
271 Belleview Valley Bank, Belleview, Missouri
July 20, 1964 1,684 1,188 July 25,1964 1,390 1,115
272 Frontier Bank, Covelo, California
July 31,1964 1,049 2,312 August 6, 1964 957 1,191
273 Crown Savings Bank, Newport News, Virginia
September 4,1964 9,677 7,023 September 10, 1964
5,989 4,470
274 Nebraska State Bank of Valentine, Valentine, Nebraska
October 29,1964 3,383 7,025 November 10, 1964
2,772 5,494
1 Figures adjusted to and as of December 31, 1964.2 Includes $12,029 thousand paid by the Federal Deposit Insurance Corporation.
Each of the insured banks which suspended in 1964 was placed in receivership, with the Corporation serving as receiver in all cases except Belleview Valley Bank, Belleview, Missouri, and Nebraska State Bank of Valentine, Nebraska, Valentine, Nebraska. The owners of uninsured claims are entitled to share, pro rata with the Corporation and other common creditors, in the proceeds from liquidation of the bank’s assets by the receivers.
Deposit Insurance National Banks. For the first time since 1935, Deposit Insurance National Banks were organized by the Corporation for the purpose of providing limited banking facilities in a community which had suffered the loss of a bank and to facilitate the payment of the insured deposits of such bank. During 1964, Deposit Insurance National Banks were chartered in Dell City, Texas, immediately after the closing of the First State Bank there; and in Newport News, Virginia after the failure of the Crown Savings Bank.
A Deposit Insurance National Bank is organized as a non-stock company, managed by an executive officer appointed by the Board of Directors of the Corporation, and receives from the Corporation funds necessary to commence operations and to cover operating deficits. It may accept insured deposits transferred to it from a failing bank and new deposits in amounts not to exceed $10,000
Digitized for FRASER http://fraser.stlouisfed.org/ Federal Reserve Bank of St. Louis
INSURANCE OPERATIONS TO PROTECT DEPOSITORS 11
from any depositor, except that such limitation is lifted in cases where the Deposit Insurance National Bank is the only bank in the community. Funds of the bank may be invested in direct or fully guaranteed obligations of the United States. The bank is not authorized to make loans. Unless ownership of the bank has been disposed of by the Corporation within two years from the date of its organization, the activity of the bank must be terminated, and the Corporation assumes its assets and obligations.
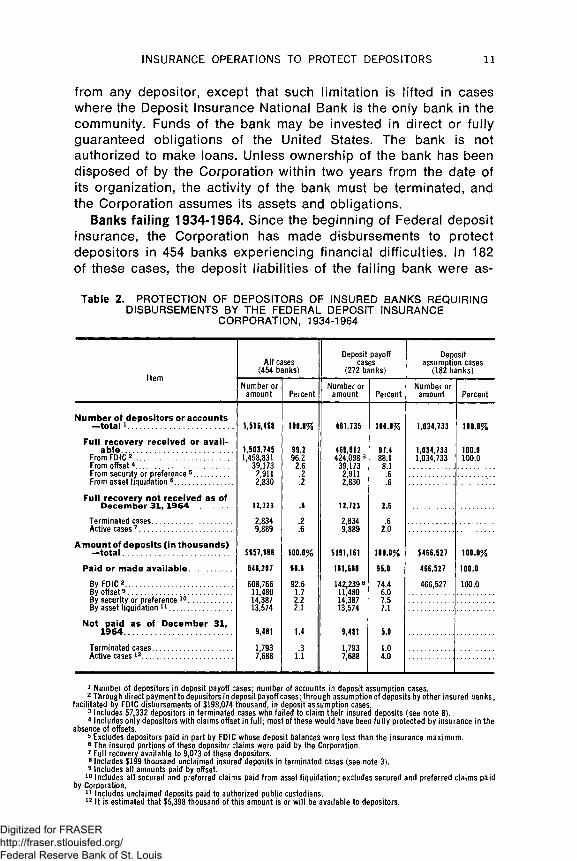
Banks failing 1934-1964. Since the beginning of Federal deposit insurance, the Corporation has made disbursements to protect depositors in 454 banks experiencing financial difficulties. In 182 of these cases, the deposit liabilities of the failing bank were as-
Table 2. PROTECTION OF DEPOSITORS OF INSURED BANKS REQUIRING DISBURSEMENTS BY THE FEDERAL DEPOSIT INSURANCE
CORPORATION, 1934-1964
Item
All cases (454 banks)
Deposit payoff cases
(272 banks)
Deposit assumption cases
(182 banks)
Number or amount Percent
Number or amount Percent
Number or amount Percent
N um ber of depositors or accounts —to ta l1................................................ 1,516,468
1,503,745
100.0%
99.2
481,735
469,012424,098 3
39,173 2,911 2,830
12,723
2,8349,889
$191,161
181,680
100.0%
97.4
1.034.733
1.034.7331.034.733
100.0%
100.0Full recovery received or avail
a b le ..................................................From FDIC2.................................................From offset4................................................
1,458,83139,1732,9112,830
12,723
96.22.6
88.18.1
100.0
From security or preference 5................... .2 .6From asset liquidation 6............................. .2 .6
Full recovery not received as of December 31t 1964.............. .8 2.6
Terminated cases........................................ 2,8349,889
.2 .6Active cases 7 .............................................. .6 2.0
A m ount of deposits (in thousands) —to ta l.................................................. $657,688 100.0%
98.6
100.0%
95.0
$466,527
466,527
100.0%
100.0Paid or m ade ava ila b le ................... 648,207
By FDIC2..................................................... 608,76611,48014,38713,574
9,481
1,7937,688
92.6 142,239 8 11,480 14,387 13,574
74.4 466,527 100.0By offset9 .................................................... 1.7 6.0By security or preference 10...................... 2.2 7.5By asset liquidation 11............................... 2.1 7.1
N ot^paid as of Decem ber 31 f1.4 9,481
1,7937,688
5.0
Terminated cases........................................ .3 1.0Active cases12............................................. 1.1 4.0
1 Number of depositors in deposit payoff cases; number of accounts in deposit assumption cases.2 Through direct payment to depositors in deposit payoff cases; thro ugh assumption of deposits by other insured banks,
facilitated by FDIC disbursements of $198,074 thousand, in deposit assumption cases.3 Includes 57,332 depositors in terminated cases who failed to claim their insured deposits (see note 8).4 Includes only depositors with claims offset in fu ll; most of these would have been fully protected by insurance in the
absence of offsets.5 Excludes depositors paid in part by FDIC whose deposit balances were less than the insurance maximum.6 The insured portions of these depositor claims were paid by the Corporation.7 Full recovery available to 9,073 of these depositors.8 Includes $199 thousand unclaimed insured deposits in terminated cases (see note 3).9 Includes all amounts paid by offset.
10 Includes all secured and preferred claims paid from asset liquidation; excludes secured and preferred claims paid by Corporation.
11 Includes unclaimed deposits paid to authorized public custodians.12 It is estimated that $5,398 thousand of this amount is or will be available to depositors.
Digitized for FRASER http://fraser.stlouisfed.org/ Federal Reserve Bank of St. Louis

12 FEDERAL DEPOSIT INSURANCE CORPORATION
Table 3. ANALYSIS OF DISBURSEMENTS, RECOVERIES, AND LOSSES IN DEPOSIT INSURANCE TRANSACTIONS JANUARY 1, 1 9 3 4 -DECEMBER 31, 1964
(In thousands)
Type of disbursement Disbursements Recoveries 1 Losses
All d isbursem ents—tota l.
P rincipal d isbursem ents in deposit assum ption and payoff cases—to ta l...............................................
Loans and assets purchased (182 deposit assumption cases):To December 31, 1964.............................................................Estimated additional................................................................
Deposits paid (272 deposit payoff cases):To December 31,1964.............................................................Estimated additional................................................................
Advances and expenses in deposit assumption and payoff cases—to ta l..............................................
Expenses in liquidating assets in 182 deposit assumption cases:Advances to protect assets..................................................................Liquidation expenses............................................................................Insurance expenses..............................................................................
Field payoff and other insurance expenses in 272 deposit payoff cases.
Other disbursem ents—to ta l..................................................
Assets purchased to facilitate termination of liquidations:To December 31, 1964..........................................................Estimated additional............................................................
Unallocated insurance expenses............................................
$392,004
$340,675
198,074 1
142,0401 561J
$ 49,348
32,87214,424
2141,838
$ 1,981
1,7711
' ‘ ’210
$355,003 $37,001
$305,276 $35,399
184,779 \ 241 / 13,054
106,373 \ 13,883 / 22,345
$ 47,296 $ 2,052
32,87214,4240(2)
2141,838
$ 2,431 $ (450)
2,399 \ 3 2 /
(2)(660)4
210
1 Excludes recoveries in excess of the amounts due the Corporation, which were returned to stockholders and holders of capital obligations of failed banks. Does not include $9.1 million of interest and allowable return received by the Corporation on its advances.
2 Not recoverable.3 Net recovery in excess of disbursements.4 Net profit and net income.
sumed by another insured bank with the aid of funds made available by the Corporation. Under the deposit assumption procedure, deposits are immediately available in full to all depositors. There were 272 deposit payoff cases in which the Corporation, as soon as possible after the closing of the bank, paid the insured deposits. Payments on uninsured deposits depend upon the results of asset liquidation. Table 2 shows that there have been more than 1.5 million depositors with deposits of $657.7 million in the 454 banks. It is estimated that about 3,700 depositors will lose approximately $4.1 million of uninsured deposits.
Corporation disbursements and losses. Table 3 shows that since Federal deposit insurance became effective January 1, 1934, the Corporation has disbursed $390.0 million to protect depositors in 454 insured banks and $1.8 million to purchase assets from receivers and liquidators of closed insured banks in order to facilitate the termination of liquidation activities. Total recoveries made and estimated additional recoveries of such disbursements amount to $355.0 million, resulting in an estimated loss to the Corporation of $37.0 million, including $0.2 million of non-recoverable insurance expenses.
Digitized for FRASER http://fraser.stlouisfed.org/ Federal Reserve Bank of St. Louis

SUPERVISORY ACTIVITIES13
The establishment and operation of banks have long been subject to public regulation. Each of the States has statutes and regulations covering the chartering and operation of banks within its jurisdiction. National banks are chartered and supervised by the Comptroller of the Currency. Further regulations apply to banks which are members of the Federal Reserve System; that is, to all national banks and to those State banks which choose to join the System. The Federal Deposit Insurance Corporation supervises certain aspects of the operation of all insured banks, with direct supervision of insured State banks which are not members of the Federal Reserve System.
Applications to become insured or operate a branch. Care in the chartering of banks and establishment of branches is one way of avoiding excessive failures among banks. At the same time, however, chartering authorities seek to bring about the benefits of effective competition by avoiding unwarranted limitations on entry into the banking business.
The Corporation does not charter banks but insures banks, after approval by the appropriate Federal chartering or supervisory authority, upon consideration of the following factors: the financial history and condition of the bank, the adequacy of its capital structure, its future earnings prospects, the general character of its management, the convenience and needs of the community to be served by the bank, and the consistency of its corporate powers with the purposes of the Federal Deposit Insurance Act. When national banks are chartered by the Comptroller of the Currency and when State banks are admitted to the Federal Reserve System, they become insured upon certification that the above factors have been considered by their respective supervisory authority. Other banks apply directly to the Corporation for deposit insurance.
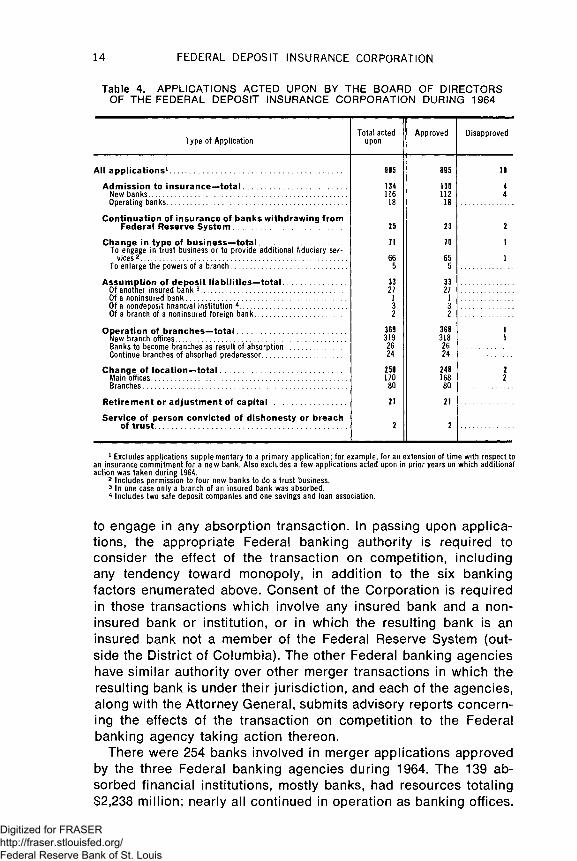
During 1964 the Corporation acted upon 134 applications for admission to insurance, and approved 130. The number of branches approved for operation totaled 368. Other applications acted upon during 1964 are classified in Table 4. The relatively small number of disapprovals reflects in part the withdrawal or improvement of some proposals after preliminary discussion, before their formal submission to the Board of Directors.
Merger transactions. The Corporation along with other Federal bank supervisory agencies had, prior to 1960, limited responsibilities in regulating bank mergers. These responsibilities were increased by the Bank Merger Act of 1960, which requires approval by the appropriate Federal banking authority for an insured bank
Digitized for FRASER http://fraser.stlouisfed.org/ Federal Reserve Bank of St. Louis
14 FEDERAL DEPOSIT INSURANCE CORPORATION
Table 4. APPLICATIONS ACTED UPON BY THE BOARD OF DIRECTORS OF THE FEDERAL DEPOSIT INSURANCE CORPORATION DURING 1964
Type of ApplicationTotal acted
uponApproved Disapproved
All app lications1..............................................................................
Adm ission to insurance—to ta l.............................................New banks....................................................... .........................................Operating banks.......................................................................................
C ontinuation of insurance of banks withdrawing from Federal Reserve S ystem .................................................
Change in type of business—to ta l.....................................To engage in trust business or to provide additional fiduciary ser
vices 2.....................................................................................................To enlarge the powers of a branch........................................................
Assum ption of deposit liab ilitie s —to ta l..........................Of another insured bank 3.......................................................................Of a noninsured bank..............................................................................Of a nondeposit financial institution 4...................................................Of a branch of a noninsured foreign bank...........................................
O peration of branches—to ta l...............................................New branch offices...................................................................................Banks to become branches as result of absorption............................Continue branches of absorbed predecessor.......................................
Change of location—to ta l.......................................................Main offices...............................................................................................Branches....................................................................................................
R etirem ent or ad ju stm ent of c a p ita l................................
Service of person convicted of dishonesty or breach of tru s t.....................................................................................
905
13411618
25
71
665
3327132
36931926 24
25017080
895
13011218
23
70
655
3327132
3683182624
24816880
1 Excludes applications supple mentary to a primary application; for example, for an extension of time with respect to an insurance commitment for a new bank. Also excludes a few applications acted upon in prior years on which additional action was taken during 1964.
2 Includes permission to four new banks to do a trust business.3 In one case only a branch of an insured bank was absorbed.4 Includes two safe deposit companies and one savings and loan association.
to engage in any absorption transaction. In passing upon applications, the appropriate Federal banking authority is required to consider the effect of the transaction on competition, including any tendency toward monopoly, in addition to the six banking factors enumerated above. Consent of the Corporation is required in those transactions which involve any insured bank and a noninsured bank or institution, or in which the resulting bank is an insured bank not a member of the Federal Reserve System (outside the District of Columbia). The other Federal banking agencies have similar authority over other merger transactions in which the resulting bank is under their jurisdiction, and each of the agencies, along with the Attorney General, submits advisory reports concerning the effects of the transaction on competition to the Federal banking agency taking action thereon.
There were 254 banks involved in merger applications approved by the three Federal banking agencies during 1964. The 139 absorbed financial institutions, mostly banks, had resources totaling $2,238 million; nearly all continued in operation as banking offices.
Digitized for FRASER http://fraser.stlouisfed.org/ Federal Reserve Bank of St. Louis

SUPERVISORY ACTIVITIES 15
Further information regarding the applications approved during 1964 is given in Table 5.
The Corporation approved 29 merger applications during 1964. These involved the absorption of 31 financial institutions with resources of $573 million. Most of these, with resources totaling $490 million, were nonmember banks. Data concerning these cases, with a statement giving the basis for approval and a summary
Table 5. MERGERS, CONSOLIDATIONS, ACQUISITIONS OF ASSETS AND ASSUMPTIONS OF LIABILITIES APPROVED UNDER SECTION 18(c)
OF THE FEDERAL DEPOSIT INSURANCE ACT DURING 1964
Offices operated 2
Banks Number of
banks1
Resources(in
thousands)2
Prior to transaction
Aftertransaction
ALL CASES
Banks invo lved ...........................................................................Absorbing banks.....................................................................................Absorbed banks 3...................................................................................
254115139
$27,561,78625,323,619
2,238,1671,120,103
407,505695,940
14,619
1,8401,597
243
1.8371.837
National............................................................................................... 66 120State banks members FRS............................................................... 16 38Not members FRS.............................................................................. 52 82Noninsured institutions..................................................................... 5 3
CASES WITH RESULTING BANK A NATIONAL BANK
Banks in vo lved ........................................................................... 168 $13,130,756 1,121 1,115Absorbing banks.....................................................................................Absorbed banks......................................................................................
7593
11,740,8731,389,883
890,459350,986148,438
964157
1,115
National............................................................................................... 52 89State banks members FRS............................................................... 12 31Not members FRS.............................................................................. 28 37Noninsured institutions 4................................................................... 1
CASES WITH RESULTING BANK A STATE BANK MEMBER OF THE
FEDERAL RESERVE SYSTEM
Banks invo lved........................................................................... 33 $12,412,02412,126,181
285,843174,37654,41957,048
521 524Absorbing banks..................................................................................... 15 485 524Absorbed banks...................................................................................... 18 36
National ............................................................................................. 7 18State banks members FRS............................................................... 3 6.Not members FRS.............................................................................. 6 12Noninsured institutions 5.................................................................. 2
CASES WITH RESULTING BANK NOT A MEMBER OF THE
FEDERAL RESERVE SYSTEM
Banks invo lved...........................................................................Absorbing banks.....................................................................................
5325
$ 2,019,006 1,456,565
562,441 55,268 2,100
490,454
198148
198198
Absorbed banks...................................................................................... 28 50National................................................................................................ 7 13
1State banks members FRS............................................................... 1Not members FRS 6........................................................................... 18 33Noninsured institutions 7.................................................................. 2 14,619 3
1 The number of resulting banks is smaller than the number of transactions, which totaled 133, because a few banks engaged in more than one transaction.
2 In cases where an absorbing bank engaged in more than one transaction, the resources included are those of the bank before the latest transaction, and the number of offices before the first and after the last transaction.
3 Includes 3 institutions other than banks.4 Includes one case in which a bank with resources of $4,039 billion, and operating one office in the United States
acquired the assets, amounting to $10,979 million, and assumed the liabilities of 2 branches of a foreign corporation. The2 branches were in foreign countries, and are, therefore, not included in FDIC statistics of banks and branches. The resources and number of offices operated by both the absorbing bank and the absorbed offices are omitted from this table.
5 One bank absorbed 2 safe deposit companies which were affiliated with it. Assets and offices of the 2 companies are omitted from this table.
6 Includes one case where a branch only was absorbed by a newly organized bank. The resources and office of the branch are included in this table.
7 Includes one case in which a savings and loan association was absorbed.
Digitized for FRASER http://fraser.stlouisfed.org/ Federal Reserve Bank of St. Louis
16 FEDERAL DEPOSIT INSURANCE CORPORATION
by the Attorney General of his report regarding the competitive factors involved, are shown in Table 15, pp. 31-60.
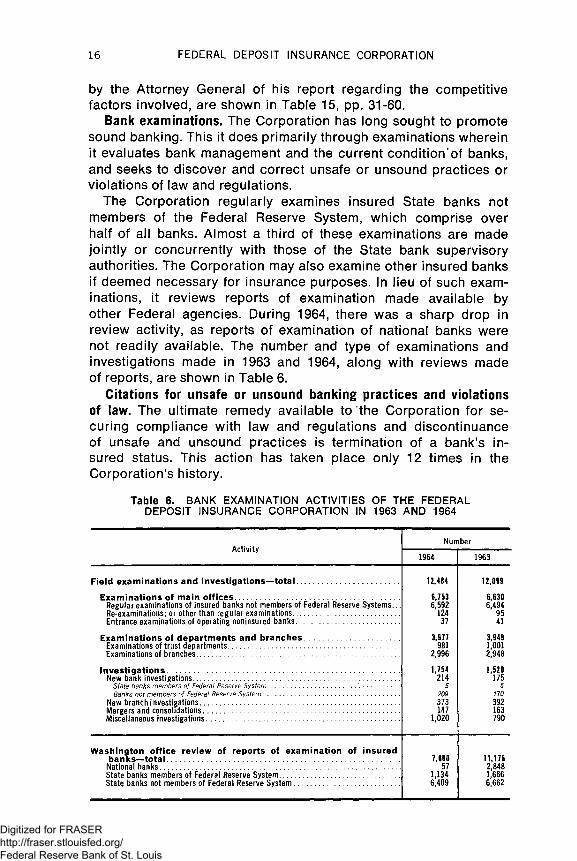
Bank examinations. The Corporation has long sought to promote sound banking. This it does primarily through examinations wherein it evaluates bank management and the current condition'of banks, and seeks to discover and correct unsafe or unsound practices or violations of law and regulations.
The Corporation regularly examines insured State banks not members of the Federal Reserve System, which comprise over half of all banks. Almost a third of these examinations are made jointly or concurrently with those of the State bank supervisory authorities. The Corporation may also examine other insured banks if deemed necessary for insurance purposes. In lieu of such examinations, it reviews reports of examination made available by other Federal agencies. During 1964, there was a sharp drop in review activity, as reports of examination of national banks were not readily available. The number and type of examinations and investigations made in 1963 and 1964, along with reviews made of reports, are shown in Table 6.
Citations for unsafe or unsound banking practices and violations of law. The ultimate remedy available to the Corporation for securing compliance with law and regulations and discontinuance of unsafe and unsound practices is termination of a bank’s insured status. This action has taken place only 12 times in the Corporation’s history.
Table 6. BANK EXAMINATION ACTIVITIES OF THE FEDERAL DEPOSIT INSURANCE CORPORATION IN 1963 AND 1964
Activity
Field exam inations and investigations—to ta l..........................................
Exam inations off m ain offffices......................................................................Regular examinations of insured banks not members of Federal Reserve SystemsRe-examinations; or other than regular examinations.................................................Entrance examinations of operating noninsured banks................................................
Exam inations of departm ents and branches .......................................Examinations of trust departments..................................................................................Examinations of branches..................................................................................................
In vestig a tio ns ......................................................................................................New bank investigations...................................................................................................
State banks members o f Federal Reserve System .................................................. .....................Banks not members o f Federal Reserve System ...........................................................................
New branch investigations................................................................................................Mergers and consolidations..............................................................................................Miscellaneous investigations.............................................................................................
Number
1964 1963
12,484 12,099
6,753 6,6306,592 6,494
124 9537 41
3,977 3,949981 1,001
2,996 2,948
1,754 1,520214 175
5 5209 170373 392147 163
1,020 790
7,600 11,17657 2,848
1,134 1,6666,409 6,662
W ashington office review off reports of exam ination of insured banks—-to ta l........................................................................................................
National banks......................................................................................................................State banks members of Federal Reserve System..........................................................State banks not members of Federal Reserve System...................................................
Digitized for FRASER http://fraser.stlouisfed.org/ Federal Reserve Bank of St. Louis
SUPERVISORY ACTIVITIES 17
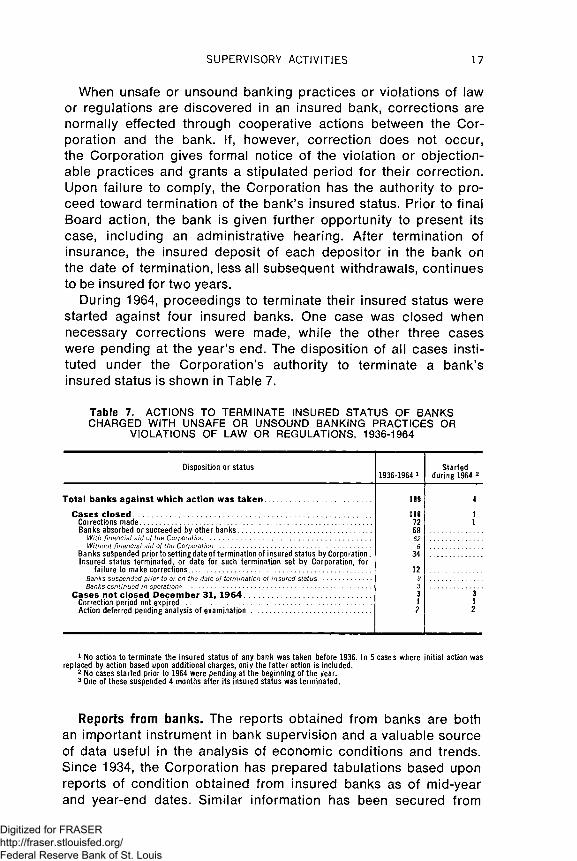
When unsafe or unsound banking practices or violations of law or regulations are discovered in an insured bank, corrections are normally effected through cooperative actions between the Corporation and the bank. If, however, correction does not occur, the Corporation gives formal notice of the violation or objectionable practices and grants a stipulated period for their correction. Upon failure to comply, the Corporation has the authority to proceed toward termination of the bank’s insured status. Prior to final Board action, the bank is given further opportunity to present its case, including an administrative hearing. After termination of insurance, the insured deposit of each depositor in the bank on the date of termination, less all subsequent withdrawals, continues to be insured for two years.
During 1964, proceedings to terminate their insured status were started against four insured banks. One case was closed when necessary corrections were made, while the other three cases were pending at the year’s end. The disposition of all cases instituted under the Corporation’s authority to terminate a bank’s insured status is shown in Table 7.
Table 7. ACTIONS TO TERMINATE INSURED STATUS OF BANKS CHARGED WITH UNSAFE OR UNSOUND BANKING PRACTICES OR
VIOLATIONS OF LAW OR REGULATIONS, 1936-1964
Disposition or status1936-1964 1
Started during 1964 2
Total banks against which action was ta k e n ................................................ 189 4
Cases c lo s e d ............................................................................................................ 186 1Corrections made.................................................................................................................... 72 1Banks absorbed or succeeded by other banks................................................................... 68
W ith fin a n c ia l a id o f the Corporation .............................. .... ................................................................ 6 2QW ithout fin a n c ia l a id o f the Corporation ...........................................................................................
Banks suspended prior to setting date of termination of insured status by Corporation. Insured status terminated, or date for such termination set by Corporation, for
failure to make corrections ....................................................................................................................................................................................................
34
12Banks suspended p rio r to or on the date o f te rm ina tion o f insu red s ta tus ................................................... 9Banks con tinued in operation ̂ .............................................................................................................................................................. .................... .... 3
Cases not closed D ecem ber 31, 1964 ........................................................................................................................................Correction period not expired ............................................................................................................................................................................................................Action deferred pending analysis of examination ....................................................................................................................................
312
312
1 No action to terminate the insured status of any bank was taken before 1936. In 5 cases where initial action was replaced by action based upon additional charges, only the latter action is included.
2 No cases started prior to 1964 were pending at the beginning of the year.3 One of these suspended 4 months after its insured status was terminated.
Reports from banks. The reports obtained from banks are both an important instrument in bank supervision and a valuable source of data useful in the analysis of economic conditions and trends. Since 1934, the Corporation has prepared tabulations based upon reports of condition obtained from insured banks as of mid-year and year-end dates. Similar information has been secured from
Digitized for FRASER http://fraser.stlouisfed.org/ Federal Reserve Bank of St. Louis
18 FEDERAL DEPOSIT INSURANCE CORPORATION
noninsured banks since 1935, permitting tabulation of condition data for all banks.
As a result of statutory changes in the method of computing deposit insurance assessments, each insured bank has filed four reports of condition a year since the beginning of 1961. In 1964, reports were required for April 15, June 30, October 1, and December 31. Tabulations of semiannual condition reports, classified by State, are published separately by the Corporation.
Reports of income of all banks participating in Federal deposit insurance are submitted on a calendar year basis. No information is received by the Corporation on the income of noninsured banks.
In addition to the regular calls, a special call was issued as of November 18, 1964, for information concerning the number of and amounts in deposit accounts of insured banks. Like the last previous comparable call made as of September 21, 1955, its purpose was to determine the extent of insurance coverage under present and selected higher limitations and to estimate the Corporation’s contingent liability.
Tabulations of the assets and liabilities of both insured and noninsured banks and data on the income of insured banks are presented in Parts Four and Five. Results of the special deposit survey are presented in Part Three.
LEGAL DEVELOPMENTSFederal legislation. Probably the most significant Federal bank
ing legislation enacted in 1964 was that requiring disclosure of certain information by banks. Approved by the President on August 20, 1964, Public Law 88-467 provides that the powers, functions, and duties vested in the Securities and Exchange Commission to administer certain registration, reporting, and disclosure provisions of the Securities and Exchange Act of 1934 be vested in the Federal Deposit Insurance Corporation with respect to securities issued by insured State banks which are not members of the Federal Reserve System. The same authority was vested in the Comptroller of the Currency with respect to securities issued by national banks, and in the Board of Governors of the Federal Reserve System with respect to securities issued by State member banks.
The statute imposes the following requirements on banks having assets of at least $1 million and a minimum of 750 shareholders: (1) the filing of an initial registration statement containing information of a financial, legal, administrative, and historical nature; (2) the filing of supplemental and amendatory documents to the original registration statement, as well as annual and periodic reports; (3) the submission, before use, of proxy informa
Digitized for FRASER http://fraser.stlouisfed.org/ Federal Reserve Bank of St. Louis
LEGAL DEVELOPMENTS 1.9
tion; and (4) the filing by certain stockholders, directors, and officers of a monthly report listing changes in their holdings of securities in their banks.
Other Federal banking legislation of major importance enacted in 1964 included Public Law 88-593, which was signed by the President on September 12, 1964. This statute amends the Federal Deposit Insurance Act to require the president or other chief executive officer of an insured bank, either State or national, to report to the appropriate Federal banking authority any change in ownership in the bank’s outstanding voting stock resulting in a change in the control of the bank. This act also requires such banks to report loans which are secured by 25 percent or more of the stock of any insured bank. When there has been a change in control, the bank is also required to report promptly to the appropriate Federal banking agency any changes or replacements in the chief executive officer or directors occurring in the next 12- month period, including in its report a statement of the past and current business and professional affiliations of the new chief executive officer or directors.
Public Law 88-563 was signed by the President on September 2, 1964, imposing a tax retroactive to July 19, 1963, on the acquisition of stock, securities, or other obligations of foreign issuers, and depository receipts, or other evidence of interest in or rights to acquire such interest. Normally, the tax is not applicable to loans made by commercial banks in the ordinary course of banking business. However, the Act empowers the President to extend the tax to commercial bank loans to foreign borrowers when he determines that the acquisition of such obligations by commercial banks has materially impaired the effectiveness of the tax inasmuch as the loans replace acquisitions by individual citizens of debt obligations of foreign obligors which are subject to the tax.
Public Law 88-341, signed by the President on June 30, 1964, liberalizes the restrictions on loans by national banks with respect to forest tracts. The act increases the permitted amount of loans by national banks on forest tracts, including land improvements thereon, from the previously existing 40 percent to 60 percent of the appraised value offered as security for a term of up to three years, and, in the case of amortization, permits an extension of such loans up to 15 years.
Finally, on September 2, 1964, Public Law 88-560 was approved. This provides for additional authorizations and funds to continue existing Federal housing programs for another year, and increases the limitations on certain real estate loans made by national banks from 20 to 25 years maturity and from 75 to 80 percent of the appraised value of the real estate securing the loan.
Digitized for FRASER http://fraser.stlouisfed.org/ Federal Reserve Bank of St. Louis

20 FEDERAL DEPOSIT INSURANCE CORPORATION
Rules and regulations of the Corporation. Upon enactment of the Securities Acts amendments of 1964 on August 20, 1964, responsibility was placed in the Federal Deposit Insurance Corporation for administering sections 12, 13, 14(a), 14(c), and 16 of the Securities Exchange Act of 1934, as amended, with respect to insured State banks which are not members of the Federal Reserve System. In implementation of this new law, proposed rules and regulations of the Corporation were published in two instalments on August 26 and September 17, 1964, and interested parties were afforded an opportunity to submit their comments, views, and arguments. Revised rules and regulations were adopted on December 31,1964, and became effective on January 1, 1965. These new regulations appear as a new Part 335 to Title 12 of the Code of Federal Regulations. They cover six general areas: (1) registration statements and reports of banks; (2) inspection and publication of information; (3) proxy information; (4) individual officer, director, and stockholder holding reports; (5) form and content of financial and reporting statements; and (6) forms for annual and stockholder reports.
On November 24, 1964, Part 329 of the Corporation’s regulations was amended to conform with an amendment adopted by the Board of Governors of the Federal Reserve System providing for payment of a maximum p e rm is s ib le rate of interest of 41/2 percent per annum on certain deposits by national and other member banks. Section 329.6 was amended to permit insured State nonmember banks to pay a maximum permissible rate of 41/2 percent per annum, compounded quarterly, on time deposits which have maturities of 90 days or more from the date of deposit, and to pay a maximum permissible rate of 4 percent per annum, compounded quarterly, on savings deposits and time deposits with maturities of less than 90 days.
On May 7, 1964, an official interpretation was added to Part 330 (Recognition of Deposit Ownership Not on Bank Records) of the Corporation’s regulation dealing with the computation of interests of beneficial owners of commingled funds on deposit in custodial accounts in insured banks. Section 330.4 provides that if the name and interest of an owner of any portion of a specifically designated custodial deposit is disclosed on the records of the person in whose name the deposit is maintained and such records are maintained in good faith and in the regular course of business, such owner will be recognized for all purposes of claim for insured deposits to the same extent as if his name and interest were disclosed on the records of the bank.
Heretofore, Section 330.4 has been interpreted to mean that where a portion of commingled funds, held in custody by a
Digitized for FRASER http://fraser.stlouisfed.org/ Federal Reserve Bank of St. Louis

LEGAL DEVELOPMENTS 21
depositor for the benefit of various beneficiaries, is deposited in one or more insured banks, the exact interest, in dollars and cents, of each beneficial owner must, at all times, be shown on the records of the depositor and that such interest could not be computed on a fractional or percentage basis.
The new interpretation provides that if the records of the depositor, maintained in good faith and in the regular course of business, reflect, at ail times, the name and ascertainable interest of each beneficial owner in a specifically designated custodial deposit, such interest may be determined on a fractional or percentage basis and each beneficial interest shall be separately insured. This may be accomplished in any manner which indicates that where the funds of a beneficial owner are commingled with other funds held in custody and a portion thereof is placed on deposit in one or more insured banks, his interest in a custodial deposit in any one insured bank would represent at any given time the same fractional share as his share of the total commingled funds.
Pertinent provisions of the foregoing statutes, regulations, amendment, and interpretation, along with a summary of significant State banking legislation, are presented in Part Two of this report.
Deposit insurance litigation. The Corporation in 1964 instituted several declaratory judgment actions to determine the insured status of funds shown on the bank’s records as deposits, on which the person placing the funds in the bank received more compensation than permitted to be paid on deposits under applicable Federal regulations. This action was taken pursuant to the provision of section 11(f) of the Federal Deposit Insurance Act that in any case where the Corporation is not satisfied as to the validity of a claim for an insured deposit, it may require the final determination of a court of competent jurisdiction before paying such claim. It is the position of the Corporation that the funds involved in the litigation were not received in the usual course of business as required by the definition of the term “ deposit” in the Federal Deposit Insurance Act but were actually borrowings by the bank.
ADMINISTRATION OF THE CORPORATION
Structure and employees. Management of the Federal Deposit Insurance Corporation is vested in a bipartisan Board of Directors of three members appointed by the President by and with the advice and consent of the Senate. The two directors appointed specifically to the Board are named for terms of six years; one of them serves as Chairman. The Comptroller of the Currency serves
Digitized for FRASER http://fraser.stlouisfed.org/ Federal Reserve Bank of St. Louis

22 FEDERAL DEPOSIT INSURANCE CORPORATION
ex officio as the third director. No more than two directors may be members of the same political party.
Mr. Joseph W. Barr was appointed to a six-year term as a member of the Board of Directors on January 22, 1964, and was elected Chairman the following day. Mr. James J. Saxon, the Comptroller of the Currency, served as a director throughout 1964 and acted as Chairman until Mr. Barr’s election to that office. Following expiration of the term of office of Mr. Jesse P. Wolcott on January 26, 1964, Mr. Kenneth A. Randall was appointed to a six-year term as director on March 10, 1964, and was elected Chairman on April 21, 1965, after the designation of Mr. Barr to become Undersecretary of the Treasury. Mr. Barr continued as director until his resignation effective April 29, 1965.
Corporation officials are listed on page v of this report, adjacent to an organization chart of the Corporation. The location of each district office and the area it serves, with the names of the respective Supervising Examiners, are given on page vi.
Greater activity in handling bank liquidations and the filling of vacancies resulted in an increase of 139 in the personnel of the Corporation during the year. Almost one-fourth of the added employees were temporary, being engaged in liquidation activity at the site of each liquidation and released in accordance with the progress of the particular liquidation. At the end of 1964, there were 67 temporary employees as compared with 36 at the end of 1963. During the course of the year 215 temporary field liquidation employees were hired and 185 separated. A distribution of the Corporation’s employees at the end of 1963 and 1964, by Division and location, is shown in Table 8.
Table 8. NUMBER OF OFFICERS AND EMPLOYEES OF THE FEDERALDEPOSIT INSURANCE CORPORATION, DECEMBER 31, 1963 AND 1964
Division
Total Washingtonoffice
District and other field offices
1964 1963 1964 1963 1964 1963
T o t a l ....................................................... 1,388 1,249 346 289 1,042 960
Directors.............................................. 3 2 3 2 0 0Executive Offices................................. 29 19 29 19 0 0Legal Division...................................... 26 21 26 21 0 0Division of Examination..................... 1,013 958 58 55 955 903Division of Liquidation....................... 108 64 41 28 67 36Division of Research and Statistics.. 65 47 65 47 0 0Audit Division...................................... 38 40 18 19 20 21Office of the Controller...................... 106 98 106 98 0 0
The turnover rate among employees was about the same as in 1963. For all employees (excluding temporary field liquidation personnel) it was 16 per 100, compared with 17 per 100 in 1963. Among field examiners, who comprise the largest group of employees, it continued at 12 per 100. Of the 91 examiners who left
Digitized for FRASER http://fraser.stlouisfed.org/ Federal Reserve Bank of St. Louis
ADMINISTRATION OF THE CORPORATION 23
the Corporation’s employ in 1964, 32 went to banks or to other bank supervisory agencies.
Employee benefits and programs. Nearly all Corporation employees have elected, where they have an option, to avail themselves of the benefits which generally apply to employees of the Federal government. All are covered by retirement annuity systems, 89 percent participate in the Federal Employees Group Life Insurance program, and 87 percent participate in the Federal Employees Health Insurance program.
The high qualifications required of examiners and the demand elsewhere for their skills caused the Corporation to start an on-the- job training program in 1946 which has evolved into an educational program with several facets. The program consists primarily of correspondence courses, but encompasses also participation in graduate schools of banking at nine leading universities, a bank examination school staffed by Corporation and Federal Reserve System personnel, and regional training programs in automation. At the end of 1964, about three-fourths of all examiners were enrolled in such study courses.
FINANCES OF THE CORPORATION
Assets and liabilities. Assets of the Corporation totaled $3,008.9 million on December 31, 1964. United States Government obligations, valued at amortized cost, with accrued interest, comprised $2,981.5 million. About half of the remaining $27.4 million consisted of the estimated net value of assets acquired in insurance transactions. The Corporation’s headquarters building and site were valued at $8.2 million, and cash at hand amounted to $4.9 million.
Liabilities of the Corporation on December 31, 1964, totaled $164.2 million. Net assessment income credits and other credits due insured banks, amounting to $161.1 million, were the principal liability items. The excess of the Corporation’s assets over its liabilities, consisting of the accumulated net income since inception, constitutes the deposit insurance fund. At the end of 1964 this fund amounted to $2,844.7 million. Assets and liabilities of the Corporation on December 31, 1964, are presented in Table 9.
Further resources are available to the Corporation through its borrowing authority. The Corporation has authorization to borrow from the U. S. Treasury, and the Secretary of the Treasury is authorized and directed to loan to the Corporation, on such terms as they may agree upon, not to exceed $3 billion outstanding at any one time, when in the judgment of the Corporation’s Board of Directors such funds are required for insurance purposes. This borrowing power has never been used.
Digitized for FRASER http://fraser.stlouisfed.org/ Federal Reserve Bank of St. Louis

24 FEDERAL DEPOSIT INSURANCE CORPORATION
Table 9. STATEMENT OF FINANCIAL CONDITION, FEDERAL DEPOSIT INSURANCE CORPORATION, DECEMBER 31, 1964
ASSETS
!ji
] $ 4,884,751
U.S. G overnm ent obligations:Securities at amortized cost (face value $2,969,620,500; market or redemption
value $2,869,798,878)............................................................................................Accrued interest receivable......................................................................................
$2,955,054,328 26,456,824 j 2,981,511,152
iAssets acquired in receivership and deposit assum ption
transactions: 1Subrogated claims of depositors against closed insured banks..........................Net insured balances of depositors in closed insured banks, to be subrogated
when paid— see related liability 2 ....................................................................... 1Loans to insured banks.............................................................................................Equity in assets acquired under purchase agreements........................................Assets purchased outright........................................................................................
$
I
21,164,000 :
560,939953,791
1,464,32032,553
Less reserves for losses........................................$ 24,175,603
10,019,669 14,155,934
M iscellaneous assets ................................................................................ 145,175
Land and office build ing, less depreciation on b u ild in g ......... 8,176,151
Furn iture , fix tures, and equ ipm en t (cost $ 8 8 5 ,0 4 7 ) ................. 1
Total asse ts ........................................................................... $3,008,873,164
LIABILITIES AND DEPOSIT INSURANCE FUND 3
Accounts payable and accrued liab ilitie s ........................................ $ 1,104,110
Earnest money, escrow funds, and collections held foro th ers .................................................................................................... 179,885
Accrued annual leave of em ployees.................................................. 1,271,724
Due insured banks:Net assessment income credits available July 1,1965 4 (See Table 11)................Other assessment credits available immediately..................................................
$ 145,189,58815,901,702 161,091,290
N et insured balances of depositors in closed insured banks —see related asset......................................................................... 560,939
Total lia b ilit ie s ..................................................................... $ 164,207,948
Deposit insurance fund, net incom e accum ulated since inception 5 (See Table 1 0 ) ........................................................... 2,844,665,216
Total liab ilities and deposit insurance fu n d ..........l
$3,008,873,164
The following notes are an integral part of this statement.1 Reported hereunder is the book value of assets in process of liqiudation. An analysis of all assets acquired in receiver
ship and deposit assumption transactions, including those assets which have been liquidated, is furnished in Table 3.2 The amount reported under this caption does not include any portion of certain Certificates of Deposit, carried on the
books of some of the closed banks as "deposits” , which are in litigation to determine whether they represent funds received by the banks in the usual course of business. If the Courts find that all such Certificates of Deposit were acquired in the usual course of business, the holders would be entitled to recover the insured portion from the Corporation, amounting to about $1.3 million. The Corporation would in turn have a common claim against the banks’ assets in like amount.
3 Capital stock was retired by payments to the United States Treasury in 1947 and 1948 pursuant to the Acts of August 5, 1947 (61 Stat. 773) and June 29, 1948 (62 Stat. 1092), with total interest payments made thereon in 1950 and 1951, pursuant to the Act of September 21, 1950 (64 Stat. 873).
4 Represents the portion of the Corporation’s net assessment income for 1964 which, pursuant to the Federal Deposit Insurance Act (12 U.S.C. 1817), shall be credited to assessments becoming due from insured banks after June 30, 1965. These credits in effect reduce insured banks’ assessments for 1964 from the statutory rate of one-twelfth of one percent of assessable deposits to an effective rate of almost one th irty-first of one percent of such deposits.
5 The deposit insurance fund of $2.8 billion as of December 31, 1964, represents the accumulated net income of the Corporation and is available for insuring deposits and payment of expenses. The Fund amounts to 1.48 percent of insured deposits, estimated at $191.8 b illion; and to 0.82 percent of total deposits in all insured banks, amounting to approximately $349.0 billion. In addition to this Fund, the Corporation is authorized to borrow from the United States Treasury, and the Secretary of the Treasury is authorized and directed to loan to the Corporation on such terms as may be fixed by the Corporation and the Secretary, not to exceed $3 billion outstanding at any one time, when in the judgment of the Board of Directors of the Corporation such funds are required for insurance purposes. No borrowings have been made under this authorization.
NOTE: This statement does not include accountability for the assets and liabilities of either the closed insured banks for which the Corporation acts as receiver or liquidating agent or those of the two wholly owned Deposit Insurance National Banks in operation on December 31,1964. Periodic and final accountability reports of its activities as receiver or liquidating agent are furnished by the Corporation to the Courts, supervisory authorities, and others, as required. The operating deficits of the two Deposit Insurance National Banks, amounting to $27,908, are reflected in the Corporation’s statement of income and deposit insurance fund.
Digitized for FRASER http://fraser.stlouisfed.org/ Federal Reserve Bank of St. Louis
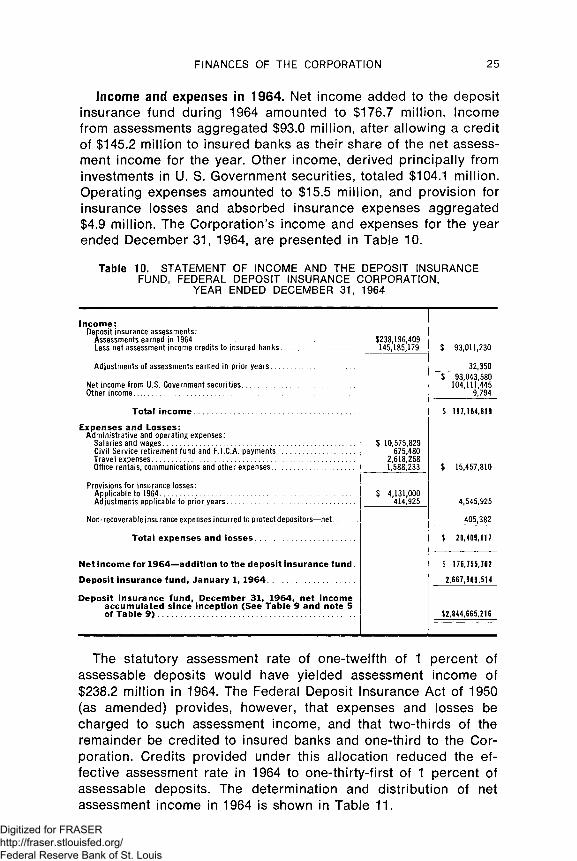
FINANCES OF THE CORPORATION 25
Income and expenses in 1964. Net income added to the deposit insurance fund during 1964 amounted to $176.7 million. Income from assessments aggregated $93.0 million, after allowing a credit of $145.2 million to insured banks as their share of the net assessment income for the year. Other income, derived principally from investments in U. S. Government securities, totaled $104.1 million. Operating expenses amounted to $15.5 million, and provision for insurance losses and absorbed insurance expenses aggregated $4.9 million. The Corporation’s income and expenses for the year ended December 31, 1964, are presented in Table 10.
Table 10. STATEMENT OF INCOME AND THE DEPOSIT INSURANCE FUND, FEDERAL DEPOSIT INSURANCE CORPORATION,
YEAR ENDED DECEMBER 31, 1964
Incom e:Deposit insurance assessments:
Assessments earned in 1964............................................Less net assessment income credits to insured banks....................................
$238,196,409145,185,179 $ 93,011,230
Adjustments of assessments earned in prior years...................... 32,350
Net income from U.S. Government securities........................................................Other income..............................................................................................................
$ 93,043,580104,111,445
9,794
Total in co m e......................................................................... $ 197,164,819
Expenses and Losses:Administrative and operating expenses:
Salaries and wages....................................................Civil Service retirement fund and F.I.C.A. payments.....................Travel expenses.....................................................................................................Office rentals, communications and other expenses......................
$ 10,575,829 675,480
2,618,268 1,588,233 $ 15,457,810
Provisions for insurance losses:Applicable to 1964.................................................................................................Adjustments applicable to prior years................................................................
$ 4,131,000 414,925 4,545,925
Non-recoverable insurance expenses incurred to protect depositors— net............ 405,382
Total expenses and losses ............................................. $ 20,409,117
N et incom e for 1 9 6 4 —addition to the deposit insurance fu n d . $ 176,755,702
Deposit insurance fund, January 1, 1 9 6 4 ....................................... 2,667,909,514
D eposit insurance fund , D ecem ber 31, 1964 , net incom e accum ulated since inception (See Tab le 9 and note 5 of Tab le 9 ) .......................................................................................... $2,844,665,216
The statutory assessment rate of one-twelfth of 1 percent of assessable deposits would have yielded assessment income of $238.2 million in 1964. The Federal Deposit Insurance Act of 1950 (as amended) provides, however, that expenses and losses be charged to such assessment income, and that two-thirds of the remainder be credited to insured banks and one-third to the Corporation. Credits provided under this allocation reduced the effective assessment rate in 1964 to one-thirty-first of 1 percent of assessable deposits. The determination and distribution of net assessment income in 1964 is shown in Table 11.
Digitized for FRASER http://fraser.stlouisfed.org/ Federal Reserve Bank of St. Louis

26 FEDERAL DEPOSIT INSURANCE CORPORATION
Table 11. DETERMINATION AND DISTRIBUTION OF NET ASSESSMENT INCOME, FEDERAL DEPOSIT INSURANCE CORPORATION,
YEAR ENDED DECEMBER 31, 1964
D eterm ination of net assessm ent incom e:
Total assessments which became due during the calendar year.............Less:
Administrative and operating expenses..............................................................Net additions to reserve to provide for insurance losses:
Provisions applicable to 1964.......................................................................Adjustments to provisions made in prior years........................................
Insurance expenses...............................................................................................
Total deductions.....................................................................................
N et assessm ent incom e for 1964...................................
$ 4,131,000 421,925 1
$238,196,409
$ 15,457,810
4,552,925
407,906 *
$145,185,1794,409
$ 20,418,641
$217,777,768
D istribution of net assessm ent incom e, D ecem ber 31,1964:
Net assessment income for 1964:33V^% transferred to the deposit insurance fu n d ............................................ $ 72,592,589
145,185,17966% % credited to insured banks........................................................................
T o ta l.......................................................................................... $217,777,768
Allocation of net assessm ent incom e cred it among insured banks, D ecem ber 31, 1964:
Credit for 1964...........................................................
Percentage of total assessment
becoming due in 1964
60.952%.002Adjustments of credits for prior years...................................................................
T o ta l.......................................................................................... $145,189,588 60.954%
1 Adjustments reported on Table 10 reflect a reduction in provision for loss of $7,000 not applicable to net assessment income.
2 Insurance expenses reported on Table 10 are net after applying a credit of $2,524, representing income not applicable to net assessment income.
In addition to its income, the roll-over of its investments and minor miscellaneous sources provide funds which the Corporation has at its disposal. As shown in Table 12, most of the activity is in its securities account, i.e. redemption and sale of U. S. Government securities on one hand, and their purchase on the other.
Table 12. SOURCES AND APPLICATION OF FUNDS, FEDERAL DEPOSIT INSURANCE CORPORATION, YEAR ENDED DECEMBER 31, 1964
Funds provided by:Net deposit insurance assessments............................................................................................................Income from U.S. Government securities, less amortized net discounts..............................................Maturities and sales of U.S. Government securities.................................................................................Collections on assets acquired in receivership and deposit assumption transactions........................Increase in assessment credits due insured banks..................................................................................
Total funds p rov id ed .........................................................................................
$ 93,043,580 102,955,164 529,829,159
8,368,421 8,951,926
$743,148,250
Funds applied to:Administrative, operating and insurance expenses, less miscellaneous credits..................................Acquisition of assets in receivership and deposit assumption transactions.........................................
$ 15,718,008 12,201,824
43,652 710,889,028
4,295,738
Construction costs of office building............................................................................................................Purchases of U.S. Government securities..................................................................................................Net change in other assets and liab ilities..................................................................................................
Total funds a p p lie d ............................................................................................ $743,148,250
Digitized for FRASER http://fraser.stlouisfed.org/ Federal Reserve Bank of St. Louis
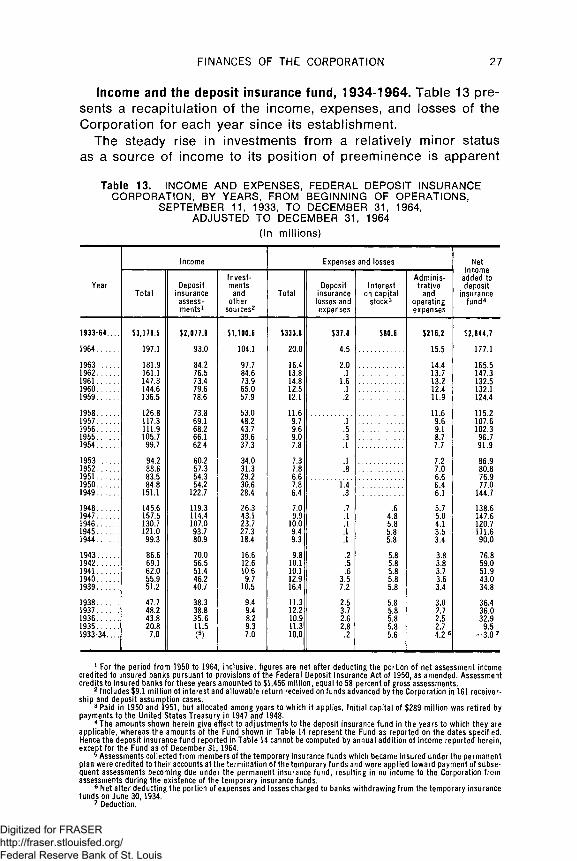
FINANCES OF THE CORPORATION 27
Income and the deposit insurance fund, 1934-1964. Table 13 presents a recapitulation of the income, expenses, and losses of the Corporation for each year since its establishment.
The steady rise in investments from a relatively minor status as a source of income to its position of preeminence is apparent
Table 13. INCOME AND EXPENSES, FEDERAL DEPOSIT INSURANCE CORPORATION, BY YEARS, FROM BEGINNING OF OPERATIONS,
SEPTEMBER 11, 1933, TO DECEMBER 31, 1964,ADJUSTED TO DECEMBER 31, 1964
(In millions)
Year
Income
TotalDeposit
insuranceassessments1
Investments
andother
sources2
Expenses and losses
TotalDeposit
insurance losses and expenses
Interest on capital
stock3
Administrative
andoperatingexpenses
Net income
added to deposit
insurance fund4
1933-64.
1 9 6 4 ....
1 9 6 3 ....1 9 6 2 ....1 9 6 1 .... 1960. 1959.
1 9 5 8 ....1 9 5 7 ....1 9 5 6 ....19 5 5 ....1 9 5 4 ....
1 9 5 3 ....1 9 5 2 ....1951.. ..1950.. .. 1949
1948.19471946.1 9 4 5 ....1 9 4 4 ....
1 9 4 3 .... 1942. 1941 1940. 1939.
1938.1 9 3 7 ....1 9 3 6 ....1 9 3 5 .... 1933-34.
$3,178.5
197.1
181.9161.1147.3144.6136.5
126.8117.3111.9105.799.7
94.2 88.683.584.8
151.1
145.6 157.5130.7 121.099.3
86.669.1 62.055.951.2
47.748.243.820.8 7.0
$2,077.9
93.0
84.276.573.479.678.6
73.869.168.2 66.162.4
60.257.354.354.2
122.7
119.3114.4 107.093.780.9
70.056.551.446.240.7
38.338.835.611.5(5)
$1 ,1 0 0 .6
104.1
97.784.673.965.057.9
53.048.243.739.637.3
34.031.329.230.628.4
26.343.123.727.318.4
16.612.610.69.7
10.5
9.49.4 8.2 9.3 7.0
$333.8
20.0
16.413.814.812.5 12.1
11.69.79.69.07.8
7.37.86.67.86.4
7.09.9
10.09.49.3
9.810.110.112.916.4
11.3 12.210.911.3 10.0
$37.0
4.5
2.0.1
1.6 .1 .2
1.4 .3
.7
.1
.1
.1
.1
.2
.5
.63.5 7.2
2.53.72.62.8
.2
$80.6
.64.85.85.85.8
5.85.85.85.85.8
5.85.85.85.8 5.6
$216.2 $2,844.7
15.5 177.1
14.4 165.513.7 147.313.2 132.512.4 132.111.9 124.4
11.6 115.29.6 107.69.1 102.38.7 96.77.7 91.9
7.2 86.97.0 80.86.6 76.96.4 77.06.1 144.7
5.7 138.65.0 147.64.1 120.73.5 111.63.4 90.0
3.8 76.83.8 59.03.7 51.93.6 43.03.4 34.8
3.0 36.42.7 36.02.5 32.92.7 9.54.2 6 -3 .0 7
1 For the period from 1950 to 1964, inclusive, figures are net after deducting the portion of net assessment income credited to insured banks pursuant to provisions of the Federal Deposit Insurance Act of 1950, as amended. Assessment credits to insured banks for these years amounted to $1,456 million, equal to 58 percent of gross assessments.
2 Includes $9.1 million of interest and allowable return received on funds advanced by the Corporation in 161 receivership and deposit assumption cases.
3 Paid in 1950 and 1951, but allocated among years to which it applies. Initial capital of $289 million was retired by payments to the United States Treasury in 1947 and 1948.
4 The amounts shown herein give effect to adjustments to the deposit insurance fund in the years to which they are applicable, whereas the amounts of the Fund shown in Table 14 represent the Fund as reported on the dates specified. Hence the deposit insurance fund reported in Table 14 cannot be computed by annual addition of income reported herein, except for the Fund as of December 31,1964.
5 Assessments collected from members of the temporary insurance funds which became insured under the permanent plan were credited to their accounts at the termination of the temporary funds and were applied toward payment of subsequent assessments becoming due under the permanent insurance fund, resulting in no income to the Corporation from assessments during the existence of the temporary insurance funds.
6 Net after deducting the portion of expenses and losses charged to banks withdrawing from the temporary insurance funds on June 30,1934.
7 Deduction.
Digitized for FRASER http://fraser.stlouisfed.org/ Federal Reserve Bank of St. Louis
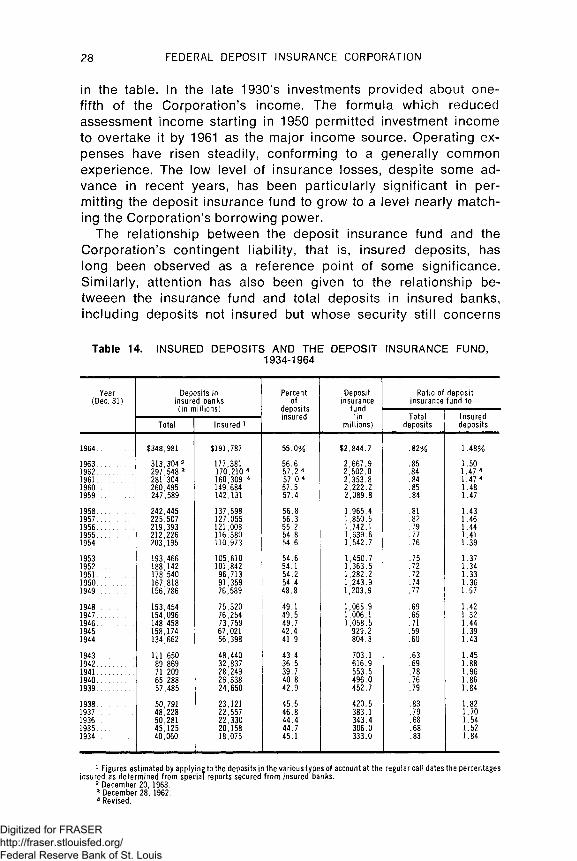
28 FEDERAL DEPOSIT INSURANCE CORPORATION
in the table. In the late 193Q’s investments provided about one- fifth of the Corporation’s income. The formula which reduced assessment income starting in 1950 permitted investment income to overtake it by 1961 as the major income source. Operating expenses have risen steadily, conforming to a generally common experience. The low level of insurance losses, despite some advance in recent years, has been particularly significant in permitting the deposit insurance fund to grow to a level nearly matching the Corporation’s borrowing power.
The relationship between the deposit insurance fund and the Corporation’s contingent liability, that is, insured deposits, has long been observed as a reference point of some significance. Similarly, attention has also been given to the relationship be- tweeen the insurance fund and total deposits in insured banks, including deposits not insured but whose security still concerns
Table 14. INSURED DEPOSITS AND THE DEPOSIT INSURANCE FUND,1934-1964
Year (Dec. 31)
Deposits in insured banks (in millions)
Percentof
depositsinsured
Depositinsurance
fund(in
millions)
Ratio of deposit insurance fund to—
Totaldeposits
InsureddepositsTotal Insured 1
1964.................. $348,981 $191,787 55.0% $2,844.7 .82% 1.48%
1963.................. 313,3042 177,381 56.6 2,667.9 .85 1.501962.................. 297,548 3 170,210 4 57.2 4 2,502.0 .84 1.47 41961.................. 281,304 160,309 4 57.0 4 2,353.8 .84 1.47 41960.................. 260,495 149,684 57.5 2,222.2 .85 1.481959.................. 247,589 142,131 57.4 2,089.8 .84 1.47
1958.................. 242,445 137,698 56.8 1,965.4 .81 1.431957.................. 225,507 127,055 56.3 1,850.5 .82 1.461956.................. 219,393 121,008 55.2 1,742.1 .79 1.441955.................. 212,226 116,380 54.8 1,639.6 .77 1.411954.................. 203,195 110,973 54.6 1,542.7 .76 1.39
1953.................. 193,466 105,610 54.6 1,450.7 .75 1.371952.................. 188,142 101,842 54.1 1,363.5 .72 1.341951.................. 178,540 96,713 54.2 1,282.2 .72 1.331950.................. 167,818 91,359 54.4 1,243.9 .74 1.361949.................. 156,786 76,589 48.8 1,203.9 .77 1.57
1948.................. 153,454 75,320 49.1 1,065.9 .69 1.421947.................. 154,096 76,254 49.5 1,006.1 .65 1.321946.................. 148,458 73,759 49.7 1,058.5 .71 1.441945.................. 158,174 67,021 42.4 929.2 .59 1.391944.................. 134,662 56,398 41.9 804.3 .60 1.43
1943.................. 111,650 48,440 43.4 703.1 .63 1.451942.................. 89,869 32,837 36.5 616.9 .69 1.881941.................. 71,209 28,249 39.7 553.5 .78 1.961940.................. 65,288 26,638 40.8 496.0 .76 1.861939.................. 57,485 24,650 42.9 452.7 .79 1.84
1938.................. 50,791 23,121 45.5 420.5 .83 1.821937.................. 48,228 22,557 46.8 383.1 .79 1.701936.................. 50,281 22,330 44.4 343.4 .68 1.541935.................. 45,125 20,158 44.7 306.0 .68 1.521934.................. 40,060 18,075 45.1 333.0 .83 1.84
1 Figures estimated by applying to the deposits in the various types of account at the regular call dates the percentages insured as determined from special reports secured from insured banks.
2 December 20, 1963.3 December 28, 1962.4 Revised.
Digitized for FRASER http://fraser.stlouisfed.org/ Federal Reserve Bank of St. Louis

FINANCES OF THE CORPORATION 29
both depositors and the Corporation. The overriding observation that might be made about these ratios is their remarkable stability over the years, as indicated in Table 14. The ratio of the deposit insurance fund to insured deposits has varied within a range of 1.3 to 2.0 percent; and the ratio of the fund to total deposits in insured banks has stayed within a range of 0.6 to 0.9 percent. At the end of 1964, the respective ratios were 1.5 percent and 0.8 percent.
Ratios of the deposit insurance fund to insured or total deposits do not, of course, measure all the elements of the Corporation’s risk. There are specific areas of risk, such as those represented by banks with inadequate capital, or large amounts of substandard assets, or in situations especially vulnerable to adverse developments. Other risks come from the concentration of deposits, in geographic areas as in individual banks.
At the same time, it is well to remember that means other than the deposit insurance fund protect bank depositors. The different supervising agencies provide a continuing basis for confidence through examinations, required reports, and other supervisory powers and actions. Depositors, particularly large depositors, exert a disciplinary influence through their preference for doing business with banks which show strength in the various dimensions of financial soundness. Banks themselves possess great financial strength in the form of high quality assets which exceed liabilities by a substantial capital margin. Validating these various elements of depositor security is the determination to promote the full employment, improving productivity, and price stability characteristic of a dynamic economy.
Audit. The Audit Division of the Corporation conducts a continuing internal audit of its financial operations, including the Corporation’s fiscal involvement in liquidation activities. Insurance assessments computed and paid by insured banks are verified by field audits on a sample basis and by routine verification in the office of the Fiscal Agent.
Outside audits of the Corporation have been made each year since its beginning, first by private firms, and since 1945 by the General Accounting Office. The report on audit conducted by the Comptroller General for the year ended June 30, 1964, was not available in time for inclusion in this report.
Digitized for FRASER http://fraser.stlouisfed.org/ Federal Reserve Bank of St. Louis

Digitized for FRASER http://fraser.stlouisfed.org/ Federal Reserve Bank of St. Louis
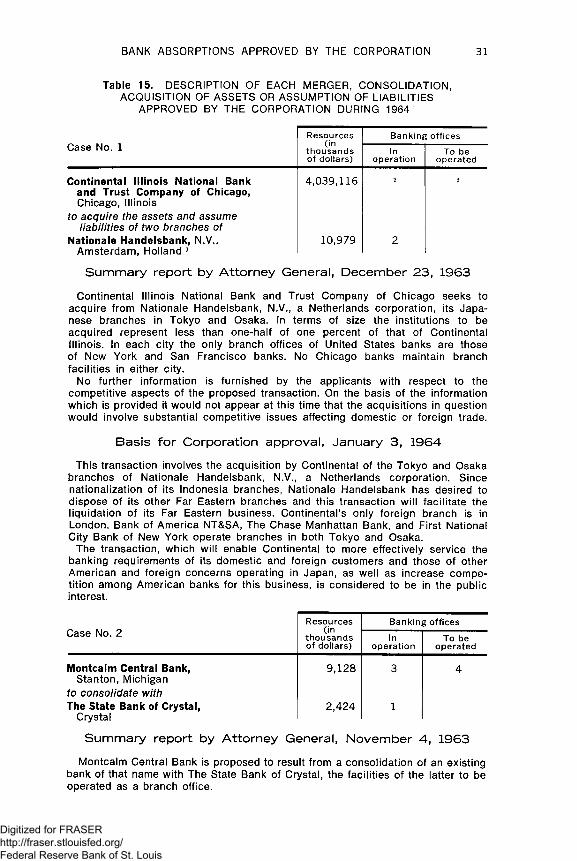
BANK ABSORPTIONS APPROVED BY THE CORPORATION 31
Table 15. DESCRIPTION OF EACH MERGER, CONSOLIDATION, ACQUISITION OF ASSETS OR ASSUMPTION OF LIABILITIES
APPROVED BY THE CORPORATION DURING 1964'
Case No. 1Resources
(inthousands of dollars)
Banking offices
Inoperation
To be operated
Continental Illinois National Bank and Trust Company of Chicago,Chicago, Illinois
to acquire the assets and assume liabilities of two branches of
4,039,116 2 2
Nationale Handelsbank, N.V., Amsterdam, Holland 3
10,979 2
Sum m ary report by A ttorney General, D ecem ber 23 , 1963
Continental Illinois National Bank and Trust Company of Chicago seeks to acquire from Nationale Handelsbank, N.V., a Netherlands corporation, its Japanese branches in Tokyo and Osaka. In terms of size the institutions to be acquired represent less than one-half of one percent of that of Continental Illinois. In each city the only branch offices of United States banks are those of New York and San Francisco banks. No Chicago banks maintain branch facilities in either city.
No further information is furnished by the applicants with respect to the competitive aspects of the proposed transaction. On the basis of the information which is provided it would not appear at this time that the acquisitions in question would involve substantial competitive issues affecting domestic or foreign trade.
Basis for Corporation approval, January 3 , 1964
This transaction involves the acquisition by Continental of the Tokyo and Osaka branches of Nationale Handelsbank, N.V., a Netherlands corporation. Since nationalization of its Indonesia branches, Nationale Handelsbank has desired to dispose of its other Far Eastern branches and this transaction will facilitate the liquidation of its Far Eastern business. Continental’s only foreign branch is in London. Bank of America NT&SA, The Chase Manhattan Bank, and First National City Bank of New York operate branches in both Tokyo and Osaka.
The transaction, which will enable Continental to more effectively service the banking requirements of its domestic and foreign customers and those of other American and foreign concerns operating in Japan, as well as increase competition among American banks for this business, is considered to be in the public interest.
Case No. 2Resources
(inthousands of dollars)
Banking offices
inoperation
To be operated
Montcalm Central Bank,Stanton, Michigan
to consolidate with The State Bank of Crystal,
Crystal
9,128
2,424
Sum m ary report by A ttorney General, Novem ber 4 , 1963
Montcalm Central Bank is proposed to result from a consolidation of an existing bank of that name with The State Bank of Crystal, the facilities of the latter to be operated as a branch office.
Digitized for FRASER http://fraser.stlouisfed.org/ Federal Reserve Bank of St. Louis
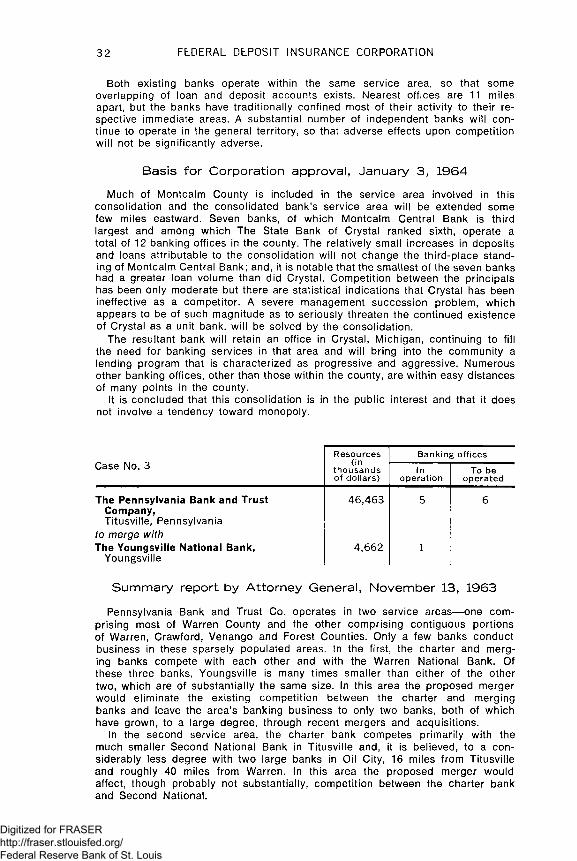
32 FEDERAL DEPOSIT INSURANCE CORPORATION
Both existing banks operate within the same service area, so that some overlapping of loan and deposit accounts exists. Nearest offices are 11 miles apart, but the banks have traditionally confined most of their activity to their respective immediate areas. A substantial number of independent banks will continue to operate in the general territory, so that adverse effects upon competition will not be significantly adverse.
Basis for Corporation approval, January 3 , 1964
Much of Montcalm County is included in the service area involved in this consolidation and the consolidated bank’s service area will be extended some few miles eastward. Seven banks, of which Montcalm Central Bank is third largest and among which The State Bank of Crystal ranked sixth, operate a total of 12 banking offices in the county. The relatively small increases in deposits and loans attributable to the consolidation will not change the third-place standing of Montcalm Central Bank; and, it is notable that the smallest of the seven banks had a greater loan volume than did Crystal. Competition between the principals has been only moderate but there are statistical indications that Crystal has been ineffective as a competitor. A severe management succession problem, which appears to be of such magnitude as to seriously threaten the continued existence of Crystal as a unit bank, will be solved by the consolidation.
The resultant bank will retain an office in Crystal, Michigan, continuing to fill the need for banking services in that area and will bring into the community a lending program that is characterized as progressive and aggressive. Numerous other banking offices, other than those within the county, are within easy distances of many points in the county.
It is concluded that this consolidation is in the public interest and that it does not involve a tendency toward monopoly.
Case No. 3Resources
(inthousands of dollars)
Banking offices
Inoperation
To be operated
The Pennsylvania Bank and Trust Company,Titusville, Pennsylvania
to merge with
46,463 5 6
The Youngsville National Bank,Youngsville
4,662 1
Sum m ary report by A ttorney General, Novem ber 13, 1963
Pennsylvania Bank and Trust Co. operates in two service areas— one comprising most of Warren County and the other comprising contiguous portions of Warren, Crawford, Venango and Forest Counties. Only a few banks conduct business in these sparsely populated areas. In the first, the charter and merging banks compete with each other and with the Warren National Bank. Of these three banks, Youngsville is many times smaller than either of the other two, which are of substantially the same size. In this area the proposed merger would eliminate the existing competition between the charter and merging banks and leave the area’s banking business to only two banks, both of which have grown, to a large degree, through recent mergers and acquisitions.
In the second service area, the charter bank competes primarily with the much smaller Second National Bank in Titusville and, it is believed, to a considerably less degree with two large banks in Oil City, 16 miles from Titusville and roughly 40 miles from Warren. In this area the proposed merger would affect, though probably not substantially, competition between the charter bank and Second National.
Digitized for FRASER http://fraser.stlouisfed.org/ Federal Reserve Bank of St. Louis
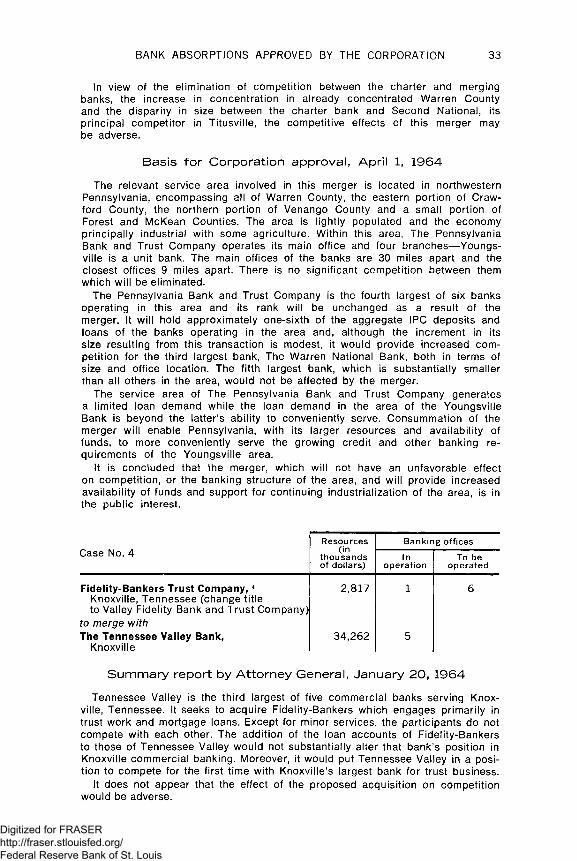
BANK ABSORPTIONS APPROVED BY THE CORPORATION 33
In view of the elimination of competition between the charter and merging banks, the increase in concentration in already concentrated Warren County and the disparity in size between the charter bank and Second National, its principal competitor in Titusville, the competitive effects of this merger may be adverse.
Basis for Corporation approval, April 1, 1964
The relevant service area involved in this merger is located in northwestern Pennsylvania, encompassing all of Warren County, the eastern portion of Crawford County, the northern portion of Venango County and a small portion of Forest and McKean Counties. The area is lightly populated and the economy principally industrial with some agriculture. Within this area, The Pennsylvania Bank and Trust Company operates its main office and four branches— Youngs- ville is a unit bank. The main offices of the banks are 30 miles apart and the closest offices 9 miles apart. There is no significant competition between them which will be eliminated.
The Pennsylvania Bank and Trust Company is the fourth largest of six banks operating in this area and its rank will be unchanged as a result of the merger. It will hold approximately one-sixth of the aggregate IPC deposits and loans of the banks operating in the area and, although the increment in its size resulting from this transaction is modest, it would provide increased competition for the third largest bank, The Warren National Bank, both in terms of size and office location. The fifth largest bank, which is substantially smaller than all others in the area, would not be affected by the merger.
The service area of The Pennsylvania Bank and Trust Company generates a limited loan demand while the loan demand in the area of the Youngsville Bank is beyond the latter’s ability to conveniently serve. Consummation of the merger will enable Pennsylvania, with its larger resources and availability of funds, to more conveniently serve the growing credit and other banking requirements of the Youngsville area.
It is concluded that the merger, which will not have an unfavorable effect on competition, or the banking structure of the area, and will provide increased availability of funds and support for continuing industrialization of the area, is in the public interest.
Case No. 4Resources
( i nBanking offices
thousands of dollars)
Inoperation
To be operated
Fidelity-Bankers Trust Company,4Knoxville, Tennessee (change title to Valley Fidelity Bank and Trust Company)
to merge with
2,817 1 6
The Tennessee Valley Bank,Knoxville
34,262 5
Sum m ary report by A ttorney General, January 20 , 1964
Tennessee Valley is the third largest of five commercial banks serving Knoxville, Tennessee. It seeks to acquire Fidelity-Bankers which engages primarily in trust work and mortgage loans. Except for minor services, the participants do not compete with each other. The addition of the loan accounts of Fidelity-Bankers to those of Tennessee Valley would not substantially alter that bank’s position in Knoxville commercial banking. Moreover, it would put Tennessee Valley in a position to compete for the first time with Knoxville’s largest bank for trust business.
It does not appear that the effect of the proposed acquisition on competition would be adverse.
Digitized for FRASER http://fraser.stlouisfed.org/ Federal Reserve Bank of St. Louis
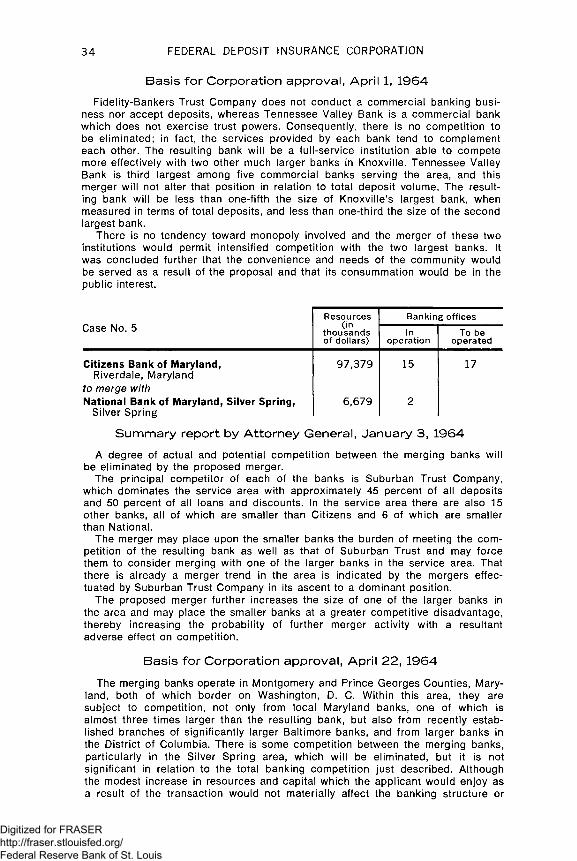
34 FEDERAL DEPOSIT INSURANCE CORPORATION
Basis for Corporation approval, April 1, 1964
Fidelity-Bankers Trust Company does not conduct a commercial banking business nor accept deposits, whereas Tennessee Valley Bank is a commercial bank which does not exercise trust powers. Consequently, there is no competition to be eliminated; in fact, the services provided by each bank tend to complement each other. The resulting bank will be a full-service institution able to compete more effectively with two other much larger banks in Knoxville. Tennessee Valley Bank is third largest among five commercial banks serving the area, and this merger will not alter that position in relation to total deposit volume. The resulting bank will be less than one-fifth the size of Knoxville’s largest bank, when measured in terms of total deposits, and less than one-third the size of the second largest bank.
There is no tendency toward monopoly involved and the merger of these two institutions would permit intensified competition with the two largest banks. It was concluded further that the convenience and needs of the community would be served as a result of the proposal and that its consummation would be in the public interest.
Case No. 5Resources
/ i nBanking offices
Unthousands of dollars)
Inoperation
To be operated
Citizens Bank of Maryland,Riverdale, Maryland
to merge with
97,379 15 17
National Bank of Maryland, Silver Spring,Silver Spring
6,679 2
Sum m ary report by A ttorney General, January 3, 1964
A degree of actual and potential competition between the merging banks will be eliminated by the proposed merger.
The principal competitor of each of the banks is Suburban Trust Company, which dominates the service area with approximately 45 percent of all deposits and 50 percent of all loans and discounts. In the service area there are also 15 other banks, all of which are smaller than Citizens and 6 of which are smaller than National.
The merger may place upon the smaller banks the burden of meeting the competition of the resulting bank as well as that of Suburban Trust and may force them to consider merging with one of the larger banks in the service area. That there is already a merger trend in the area is indicated by the mergers effectuated by Suburban Trust Company in its ascent to a dominant position.
The proposed merger further increases the size of one of the larger banks in the area and may place the smaller banks at a greater competitive disadvantage, thereby increasing the probability of further merger activity with a resultant adverse effect on competition.
Basis for Corporation approval, April 22 , 1964
The merging banks operate in Montgomery and Prince Georges Counties, Maryland, both of which border on Washington, D. C. Within this area, they are subject to competition, not only from local Maryland banks, one of which is almost three times larger than the resulting bank, but also from recently established branches of significantly larger Baltimore banks, and from larger banks in the District of Columbia. There is some competition between the merging banks, particularly in the Silver Spring area, which will be eliminated, but it is not significant in relation to the total banking competition just described. Although the modest increase in resources and capital which the applicant would enjoy as a result of the transaction would not materially affect the banking structure or
Digitized for FRASER http://fraser.stlouisfed.org/ Federal Reserve Bank of St. Louis

BANK ABSORPTIONS APPROVED BY THE CORPORATION 35
competition among banks in the two counties, Citizens Bank of Maryland feels that the increase will enable it to provide more effective competition to these larger banks, and to offer better banking services required by the constantly expanding economy of its service area.
Since favorable findings have been made on all factors required to be considered by law, it is concluded the merger is in the public interest.
Case No. 6Resources
(inthousands of dollars)
Banking offices
Inoperation
To be operated
The City Savings Bank of Brooklyn,New York (Brooklyn), New York (change title to The Greater New York Savings Bank)
to merge with
111,154 3 8
The Greater New York Savings Bank,New York (Brooklyn)
367,326 5
Sum m ary report by A ttorney General, April 22 , 1964
The City Savings Bank and The Greater New York Savings Bank are both mutual savings banks. All of the 5 offices of Greater New York Savings Bank are located in Brooklyn, as are 2 of the 3 offices of City Savings Bank.
City Savings Bank is the smallest of 21 savings banks in Brooklyn and ranks 47th in size among 52 savings banks in New York City.
The Greater New York Savings Bank is 7th in size among Brooklyn savings banks and ranks 23rd among all savings banks in New York City. The bank resulting from the merger will rank 5th in Brooklyn and 18th in the City. It will hold 5.97 percent of the total deposits in Brooklyn savings banks and 2.46 percent of the deposits held by all savings banks, savings and loan associations, and commercial banks in the area.
The merger would result in the elimination of substantial competition between the merging banks. Moreover, another major objection to the proposal from the viewpoint of its effect on competition stems from the competitive advantage which the New York Banking Law gives to a merged savings bank. While savings banks which are not a product of a merger are limited to a maximum of five offices in the City, merged banks not only are permitted to retain all existing branches of the merging banks, but retain as well all unexercised branching privileges. Even without taking advantage of the unexercised branching privileges, the resulting bank will have more Brooklyn offices than any other savings bank, over 10 percent of the total of such offices in the borough. This is a competitive advantage which can be duplicated by other savings banks only through the same merger route and thus raises the distinct possibility that a merger trend may be precipitated.
In view of the elimination of competition, increase in concentration in banking offices which would result from the merger, and the threat of the precipitation of a merger trend thereby, it is our conclusion that the competitive effects of the proposed merger would be significantly adverse.
Basis fo r Corporation approval, April 22 , 1964
This merger involves The City Savings Bank of Brooklyn, with $102,559,000 in deposits and three offices, and The Greater New York Savings Bank, Brooklyn, with $321,598,000 in deposits and five offices. The merger was prompted by serious problems in management, internal operations and controls, and loan administration at the City Savings Bank whose trustees concluded, after diligent study, that it would be in the public interest and that of its depositors to correct its problems through merger with another savings bank.
Digitized for FRASER http://fraser.stlouisfed.org/ Federal Reserve Bank of St. Louis
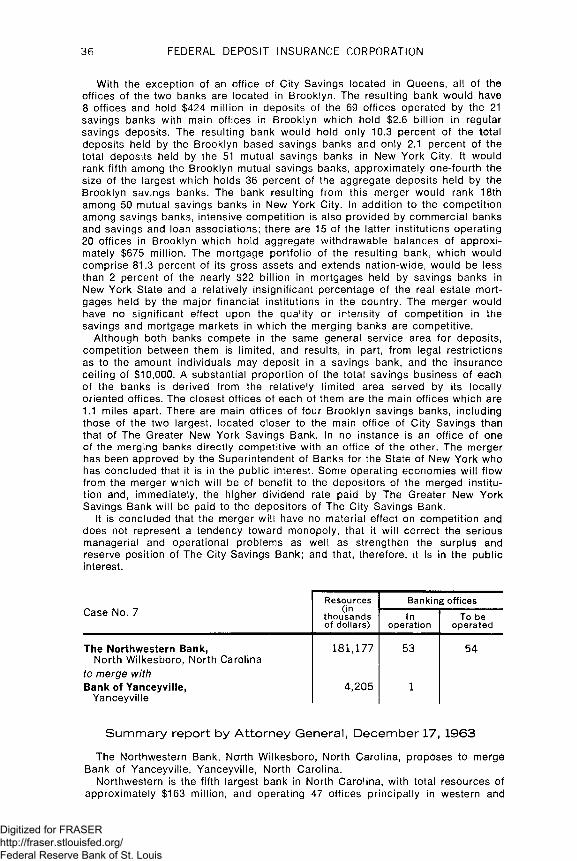
36 FEDERAL DEPOSIT INSURANCE CORPORATION
With the exception of an office of City Savings located in Queens, all of the offices of the two banks are located in Brooklyn. The resulting bank would have 8 offices and hold $424 million in deposits of the 69 offices operated by the 21 savings banks with main offices in Brooklyn which hold $2.6 billion in regular savings deposits. The resulting bank would hold only 10.3 percent of the total deposits held by the Brooklyn based savings banks and only 2.1 percent of the total deposits held by the 51 mutual savings banks in New York City. It would rank fifth among the Brooklyn mutual savings banks, approximately one-fourth the size of the largest which holds 36 percent of the aggregate deposits held by the Brooklyn savings banks. The bank resulting from this merger would rank 18th among 50 mutual savings banks in New York City. In addition to the competition among savings banks, intensive competition is also provided by commercial banks and savings and loan associations; there are 15 of the latter institutions operating 20 offices in Brooklyn which hold aggregate withdrawable balances of approximately $675 million. The mortgage portfolio of the resulting bank, which would comprise 81.3 percent of its gross assets and extends nation-wide, would be less than 2 percent of the nearly $22 billion in mortgages held by savings banks in New York State and a relatively insignificant percentage of the real estate mortgages held by the major financial institutions in the country. The merger would have no significant effect upon the quality or intensity of competition in the savings and mortgage markets in which the merging banks are competitive.
Although both banks compete in the same general service area for deposits, competition between them is limited, and results, in part, from legal restrictions as to the amount individuals may deposit in a savings bank, and the insurance ceiling of $10,000. A substantial proportion of the total savings business of each of the banks is derived from the relatively limited area served by its locally oriented offices. The closest offices of each of them are the main offices which are 1.1 miles apart. There are main offices of four Brooklyn savings banks, including those of the two largest, iocated closer to the main office of City Savings than that of The Greater New York Savings Bank. In no instance is an office of one of the merging banks directly competitive with an office of the other. The merger has been approved by the Superintendent of Banks for the State of New York who has concluded that it is in the public interest. Some operating economies will flow from the merger which will be of benefit to the depositors of the merged institution and, immediately, the higher dividend rate paid by The Greater New York Savings Bank will be paid to the depositors of The City Savings Bank.
It is concluded that the merger will have no material effect on competition and does not represent a tendency toward monopoly, that it will correct the serious managerial and operational problems as well as strengthen the surplus and reserve position of The City Savings Bank; and that, therefore, it is in the public interest.
Case No. 7Resources
fin Banking offices
thousands of dollars)
Inoperation
To be operated
The Northwestern Bank,North Wilkesboro, North Carolina
181,177 53 54
to merge with Bank of Yanceyville,
Yanceyville4,205 1
Sum m ary report by A ttorney General, D ecem ber 17, 1963
The Northwestern Bank, North Wilkesboro, North Carolina, proposes to merge Bank of Yanceyville, Yanceyville, North Carolina.
Northwestern is the fifth largest bank in North Carolina, with total resources of approximately $163 million, and operating 47 offices principally in western and
Digitized for FRASER http://fraser.stlouisfed.org/ Federal Reserve Bank of St. Louis
BANK ABSORPTIONS APPROVED BY THE CORPORATION 37
central North Carolina. During the past seven years it has acquired nine other banks with total deposits of more than $48 million. Northwestern holds approximately 4.7 percent of total banking resources in the State.
Bank of Yanceyville, operating one office in a community of 1,100 people located in a rural tobacco growing county, has total assets of $3.5 million. It has no commercial loans outstanding and does not make instalment loans, although the application indicates such business may be available in the area. The Bank of Yanceyville has doubled its net current operating income since 1957. The application states that the merger is desired because Bank of Yanceyville has been unable to meet the present needs of the area. The application fails to substantiate this statement.
While this particular merger will not have a significant effect on competition, the continuing trend toward banking concentration by merger and acquisition on the part of the larger banks in North Carolina will bring about a seriously adverse effect on competition in commercial banking in the State. Since 1960, of the total resources involved in bank mergers in the State, four of the five largest banks have accounted for 91.9 percent. Northwestern Bank has contributed significantly to this trend.
Basis for Corporation approval, April 22 , 1964
The Northwestern Bank is the fifth largest bank in North Carolina, operating its main office in North Wilkesboro and a network of branches serving the western, northwestern, and central sections of North Carolina. It is a satisfactorily operated bank that has aggressively increased its service potential in recent years through the establishment of de novo branches and through the absorption of other banks. Although it does not compete throughout all of North Carolina with the larger banks, it does effectively compete with their offices located within its service area. The Northwestern Bank holds 4.5 percent of the aggregate deposits of all banks in North Carolina and this merger would increase the proportion only 0.1 percent. This compares with 21.5 percent for the largest bank in the State— Wachovia Bank & Trust Company, and 17.9 percent for the second largest— North Carolina National Bank. The Northwestern Bank is one-fifth the size of the largest bank in the State and one-half the size of the fourth largest, and consummation of this merger would have no significant effect on the concentration of banking resources in North Carolina, nor will it affect the relative position of The Northwestern Bank or competition in its service area.
The Bank of Yanceyville is a small unit bank located in Yanceyville (Caswell County), in north-central North Carolina, about 15 miles south of Danville, Virginia. Its 1960 population was 1,113, a decline of 278 in the preceding decade. The area is rural and the economy agricultural, with tobacco accounting for four- fifths of the farm income. The bank has been operated most conservatively— only 14 percent of its assets is in loans— and the larger resources and more progressive policies of The Northwestern Bank could be expected to more adequately support an expansion and diversification of the local economy. Specifically, Northwestern would offer commercial and instalment loans, and its agricultural advisory department in the Yanceyvilie service area where such services are not available on a local level.
There are no other banks in the service area of The Bank of Yanceyville, although there are many larger banks outside the service area that solicit business therein. A branch of the applicant would provide increased competition for these banks. The closest office of Northwestern to Yanceyville is 27 miles away in Burlington and there is no important competition between them that will be eliminated.
The merger, which will provide broader banking services in greater depth, particularly commercial and instalment loans, in the Yanceyville area with no unfavorable effects on competition, either in the broad service area of Northwestern or the restricted service area of the Bank of Yanceyville, is concluded to be in the public interest.
Digitized for FRASER http://fraser.stlouisfed.org/ Federal Reserve Bank of St. Louis
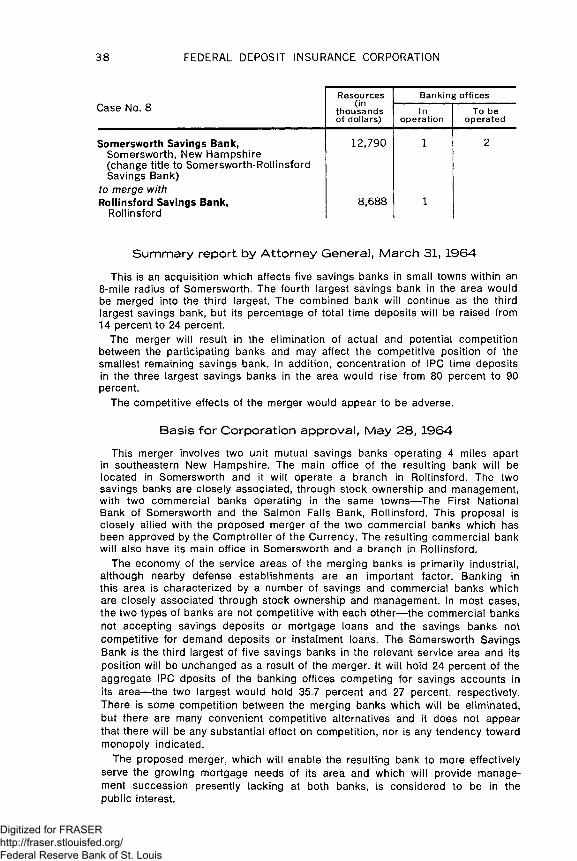
38 FEDERAL DEPOSIT INSURANCE CORPORATION
Resources(in
thousands of dollars)
Banking officesCase No. 8 In
operationTo be
operated
Somersworth Savings Bank,Somersworth, New Hampshire (change title to Somersworth-Rollinsford Savings Bank)
to merge with
12,790 1 2
Rollinsford Savings Bank,Rollinsford
8,688 1
Sum m ary report by A ttorney General, M arch 31, 1964
This is an acquisition which affects five savings banks in small towns within an 8-mile radius of Somersworth. The fourth largest savings bank in the area would be merged into the third largest. The combined bank will continue as the third largest savings bank, but its percentage of total time deposits will be raised from 14 percent to 24 percent.
The merger will result in the elimination of actual and potential competition between the participating banks and may affect the competitive position of the smallest remaining savings bank. In addition, concentration of IPC time deposits in the three largest savings banks in the area would rise from 80 percent to 90 percent.
The competitive effects of the merger would appear to be adverse.
Basis for Corporation approval, M ay 28 , 1964
This merger involves two unit mutual savings banks operating 4 miles apart in southeastern New Hampshire. The main office of the resulting bank will be located in Somersworth and it will operate a branch in Rollinsford. The two savings banks are closely associated, through stock ownership and management, with two commercial banks operating in the same towns— The First National Bank of Somersworth and the Salmon Falls Bank, Rollinsford. This proposal is closely allied with the proposed merger of the two commercial banks which has been approved by the Comptroller of the Currency. The resulting commercial bank will also have its main office in Somersworth and a branch in Rollinsford.
The economy of the service areas of the merging banks is primarily industrial, although nearby defense establishments are an important factor. Banking in this area is characterized by a number of savings and commercial banks which are closely associated through stock ownership and management. In most cases, the two types of banks are not competitive with each other— the commercial banks not accepting savings deposits or mortgage loans and the savings banks not competitive for demand deposits or instalment loans. The Somersworth Savings Bank is the third largest of five savings banks in the relevant service area and its position will be unchanged as a result of the merger. It will hold 24 percent of the aggregate IPC dposits of the banking offices competing for savings accounts in its area— the two largest would hold 35.7 percent and 27 percent, respectively. There is some competition between the merging banks which will be eliminated, but there are many convenient competitive alternatives and it does not appear that there will be any substantial effect on competition, nor is any tendency toward monopoly indicated.
The proposed merger, which will enable the resulting bank to more effectively serve the growing mortgage needs of its area and which will provide management succession presently lacking at both banks, is considered to be in the public interest.
Digitized for FRASER http://fraser.stlouisfed.org/ Federal Reserve Bank of St. Louis
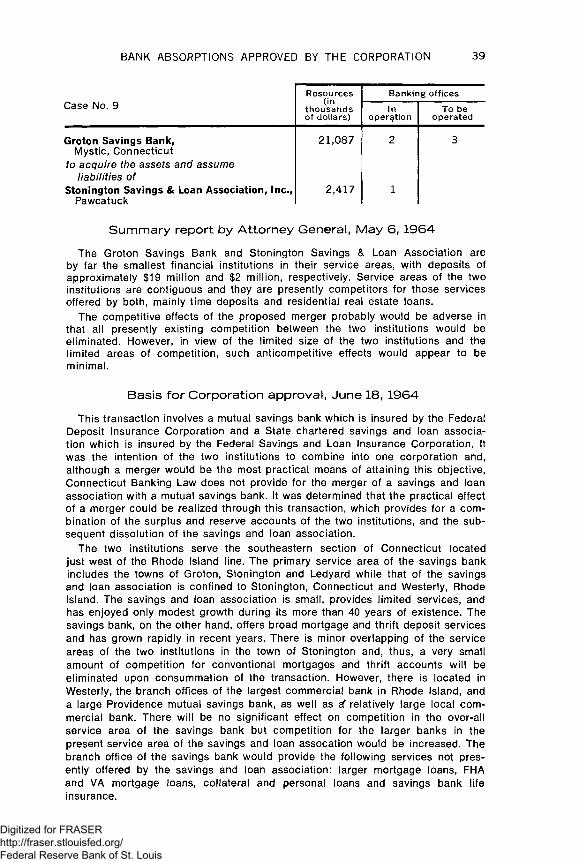
BANK ABSORPTIONS APPROVED BY THE CORPORATION 39
Case No. 9Resources
finBanking offices
thousands of dollars)
Inoperation
To be operated
Groton Savings Bank,Mystic, Connecticut
to acquire the assets and assume liabilities of
2 1 ,0 8 7 2 3
Stonington Savings & Loan Association, Inc.,Pawcatuck
2 ,4 1 7 1
Sum m ary report by A ttorney General, M ay 6, 1964
The Groton Savings Bank and Stonington Savings & Loan Association are by far the smallest financial institutions in their service areas, with deposits of approximately $19 million and $2 million, respectively. Service areas of the two institutions are contiguous and they are presently competitors for those services offered by both, mainly time deposits and residential real estate loans.
The competitive effects of the proposed merger probably would be adverse in that all presently existing competition between the two institutions would be eliminated. However, in view of the limited size of the two institutions and the limited areas of competition, such anticompetitive effects would appear to be minimal.
Basis for Corporation approval, June 18, 1964
This transaction involves a mutual savings bank which is insured by the Federal Deposit Insurance Corporation and a State chartered savings and loan association which is insured by the Federal Savings and Loan Insurance Corporation. It was the intention of the two institutions to combine into one corporation and, although a merger would be the most practical means of attaining this objective, Connecticut Banking Law does not provide for the merger of a savings and loan association with a mutual savings bank. It was determined that the practical effect of a merger could be realized through this transaction, which provides for a combination of the surplus and reserve accounts of the two institutions, and the subsequent dissolution of the savings and loan association.
The two institutions serve the southeastern section of Connecticut located just west of the Rhode Island line. The primary service area of the savings bank includes the towns of Groton, Stonington and Ledyard while that of the savings and loan association is confined to Stonington, Connecticut and Westerly, Rhode Island. The savings and loan association is small, provides limited services, and has enjoyed only modest growth during its more than 40 years of existence. The savings bank, on the other hand, offers broad mortgage and thrift deposit services and has grown rapidly in recent years. There is minor overlapping of the service areas of the two institutions in the town of Stonington and, thus, a very small amount of competition for conventional mortgages and thrift accounts will be eliminated upon consummation of the transaction. However, there is located in Westerly, the branch offices of the largest commercial bank in Rhode Island, and a large Providence mutual savings bank, as well as at relatively large local commercial bank. There will be no significant effect on competition in the over-all service area of the savings bank but competition for the larger banks in the present service area of the savings and loan assocation would be increased. The branch office of the savings bank would provide the following services not presently offered by the savings and loan association: larger mortgage loans, FHA and VA mortgage loans, collateral and personal loans and savings bank life insurance.
Digitized for FRASER http://fraser.stlouisfed.org/ Federal Reserve Bank of St. Louis
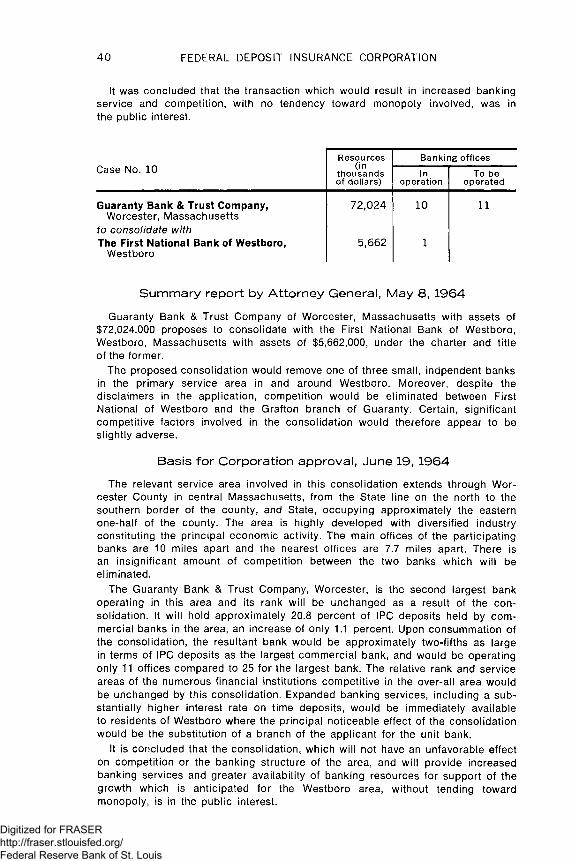
40 FEDERAL DEPOSIT INSURANCE CORPORATION
It was concluded that the transaction which would result in increased banking service and competition, with no tendency toward monopoly involved, was in the public interest.
Case No. 10Resources
( i nBanking offices
Unthousands of dollars)
Inoperation
To be operated
Guaranty Bank & Trust Company,Worcester, Massachusetts
72,024 10 11
to consolidate withThe First National Bank of Westboro,
Westboro5,662 1
Sum m ary report by A ttorney General, M ay 8, 1964
Guaranty Bank & Trust Company of Worcester, Massachusetts with assets of $72,024,000 proposes to consolidate with the First National Bank of Westboro, Westboro, Massachusetts with assets of $5,662,000, under the charter and title of the former.
The proposed consolidation would remove one of three small, indpendent banks in the primary service area in and around Westboro. Moreover, despite the disclaimers in the application, competition would be eliminated between First National of Westboro and the Grafton branch of Guaranty. Certain, significant competitive factors involved in the consolidation would therefore appear to be slightly adverse.
Basis for Corporation approval, June 19, 1964
The relevant service area involved in this consolidation extends through Worcester County in central Massachusetts, from the State line on the north to the southern border of the county, and State, occupying approximately the eastern one-half of the county. The area is highly developed with diversified industry constituting the principal economic activity. The main offices of the participating banks are 10 miles apart and the nearest offices are 7.7 miles apart. There is an insignificant amount of competition between the two banks which will be eliminated.
The Guaranty Bank & Trust Company, Worcester, is the second largest bank operating in this area and its rank will be unchanged as a result of the consolidation. It will hold approximately 20.8 percent of IPC deposits held by commercial banks in the area, an increase of only 1.1 percent. Upon consummation of the consolidation, the resultant bank would be approximately two-fifths as large in terms of IPC deposits as the largest commercial bank, and would be operating only 11 offices compared to 25 for the largest bank. The relative rank and service areas of the numerous financial institutions competitive in the over-all area would be unchanged by this consolidation. Expanded banking services, including a substantially higher interest rate on time deposits, would be immediately available to residents of Westboro where the principal noticeable effect of the consolidation would be the substitution of a branch of the applicant for the unit bank.
It is concluded that the consolidation, which will not have an unfavorable effect on competition or the banking structure of the area, and will provide increased banking services and greater availability of banking resources for support of the growth which is anticipated for the Westboro area, without tending toward monopoly, is in the public interest.
Digitized for FRASER http://fraser.stlouisfed.org/ Federal Reserve Bank of St. Louis
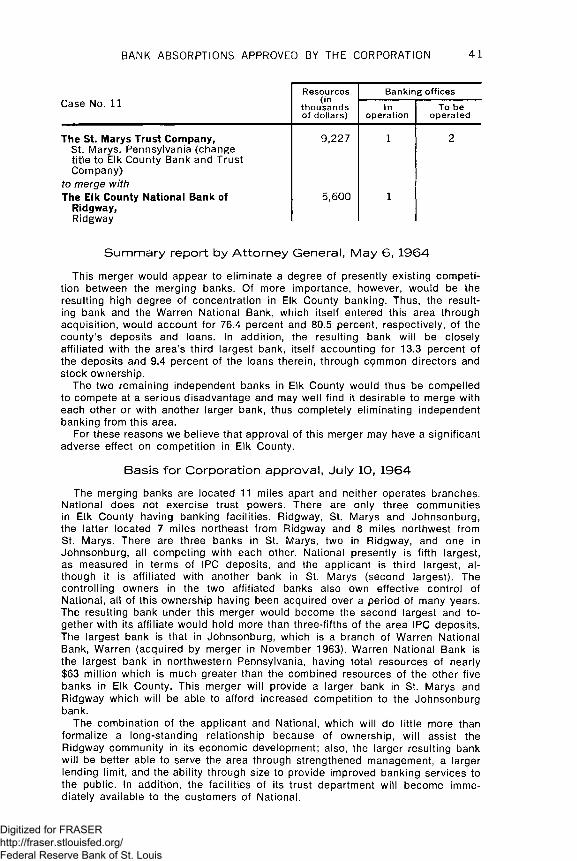
BANK ABSORPTIONS APPROVED BY THE CORPORATION 41
Case No. 11Resources
(inthousands of dollars)
Banking offices
Inoperation
To be operated
The St. Marys Trust Company,St. Marys, Pennsylvania (change title to Elk County Bank and Trust Company)
to merge with
9,227 1 2
The Elk County National Bank of Ridgway,Ridgway
5,600 1
Sum m ary report by A ttorney General, M ay 6, 1964
This merger would appear to eliminate a degree of presently existing competition between the merging banks. Of more importance, however, would be the resulting high degree of concentration in Elk County banking. Thus, the resulting bank and the Warren National Bank, which itself entered this area through acquisition, would account for 76.4 percent and 80.5 percent, respectively, of the county’s deposits and loans. In addition, the resulting bank will be closely affiliated with the area’s third largest bank, itself accounting for 13.3 percent of the deposits and 9.4 percent of the loans therein, through common directors and stock ownership.
The two remaining independent banks in Elk County would thus be compelled to compete at a serious disadvantage and may well find it desirable to merge with each other or with another larger bank, thus completely eliminating independent banking from this area.
For these reasons we believe that approval of this merger may have a significant adverse effect on competition in Elk County.
Basis for Corporation approval, July 10, 1964
The merging banks are located 11 miles apart and neither operates branches. National does not exercise trust powers. There are only three communities in Elk County having banking facilities. Ridgway, St. Marys and Johnsonburg, the latter located 7 miles northeast from Ridgway and 8 miles northwest from St. Marys. There are three banks in St. Marys, two in Ridgway, and one in Johnsonburg, all competing with each other. National presently is fifth largest, as measured in terms of IPC deposits, and the applicant is third largest, although it is affiliated with another bank in St. Marys (second largest). The controlling owners in the two affiliated banks also own effective control of National, all of this ownership having been acquired over a period of many years. The resulting bank under this merger would become the second largest and together with its affiliate would hold more than three-fifths of the area IPC deposits. The largest bank is that in Johnsonburg, which is a branch of Warren National Bank, Warren (acquired by merger in November 1963). Warren National Bank is the largest bank in northwestern Pennsylvania, having total resources of nearly $63 million which is much greater than the combined resources of the other five banks in Elk County. This merger will provide a larger bank in St. Marys and Ridgway which will be able to afford increased competition to the Johnsonburg bank.
The combination of the applicant and National, which will do little more than formalize a long-standing relationship because of ownership, will assist the Ridgway community in its economic development; also, the larger resulting bank will be better able to serve the area through strengthened management, a larger lending limit, and the ability through size to provide improved banking services to the public. In addition, the facilities of its trust department will become immediately available to the customers of National.
Digitized for FRASER http://fraser.stlouisfed.org/ Federal Reserve Bank of St. Louis
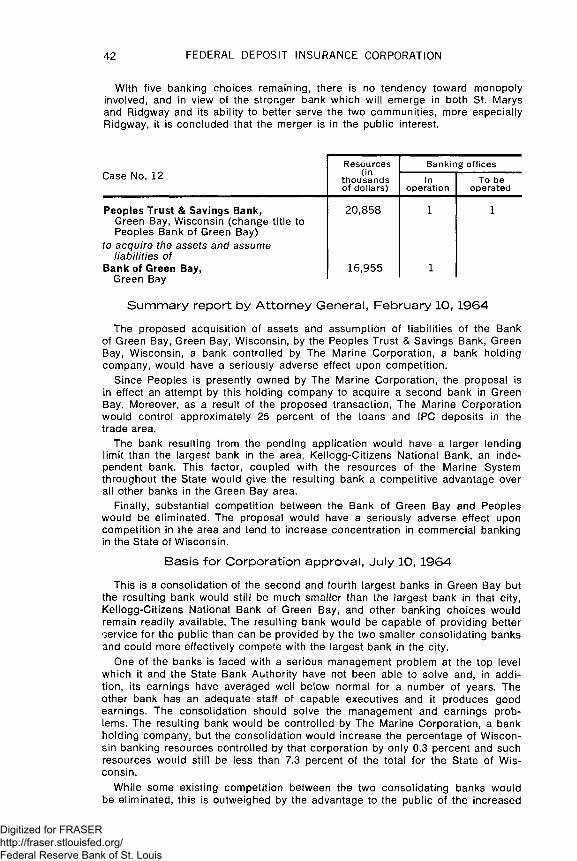
42 FEDERAL DEPOSIT INSURANCE CORPORATION
With five banking choices remaining, there is no tendency toward monopoly involved, and in view of the stronger bank which will emerge in both St. Marys and Ridgway and its ability to better serve the two communities, more especially Ridgway, it is concluded that the merger is in the public interest.
Case No. 12Resources
(inthousands of dollars)
Banking offices
Inoperation
To be operated
Peoples Trust & Savings Bank,Green Bay, Wisconsin (change title to Peoples Bank of Green Bay)
to acquire the assets and assume liabilities of
Bank of Green Bay,Green Bay
20,858
16,955
Sum m ary report by A ttorney General, February 10, 1964
The proposed acquisition of assets and assumption of liabilities of the Bank of Green Bay, Green Bay, Wisconsin, by the Peoples Trust & Savings Bank, Green Bay, Wisconsin, a bank controlled by The Marine Corporation, a bank holding company, would have a seriously adverse effect upon competition.
Since Peoples is presently owned by The Marine Corporation, the proposal is in effect an attempt by this holding company to acquire a second bank in Green Bay. Moreover, as a result of the proposed transaction, The Marine Corporation would control approximately 25 percent of the loans and IPC deposits in the trade area.
The bank resulting from the pending application would have a larger lending limit than the largest bank in the area, Kellogg-Citizens National Bank, an independent bank. This factor, coupled with the resources of the Marine System throughout the State would give the resulting bank a competitive advantage over all other banks in the Green Bay area.
Finally, substantial competition between the Bank of Green Bay and Peoples would be eliminated. The proposal would have a seriously adverse effect upon competition in the area and tend to increase concentration in commercial banking in the State of Wisconsin.
Basis for Corporation approval, July 10, 1964
This is a consolidation of the second and fourth largest banks in Green Bay but the resulting bank would still be much smaller than the largest bank in that city, Kellogg-Citizens National Bank of Green Bay, and other banking choices would remain readily available. The resulting bank would be capable of providing better Bervice for the public than can be provided by the two smaller consolidating banks and could more effectively compete with the largest bank in the city.
One of the banks is faced with a serious management problem at the top level which it and the State Bank Authority have not been able to solve and, in addition, its earnings have averaged well below normal for a number of years. The other bank has an adequate staff of capable executives and it produces good earnings. The consolidation should solve the management and earnings problems. The resulting bank would be controlled by The Marine Corporation, a bank holding company, but the consolidation would increase the percentage of Wisconsin banking resources controlled by that corporation by only 0.3 percent and such resources would still be less than 7.3 percent of the total for the State of Wisconsin.
While some existing competition between the two consolidating banks would be eliminated, this is outweighed by the advantage to the public of the increased
Digitized for FRASER http://fraser.stlouisfed.org/ Federal Reserve Bank of St. Louis
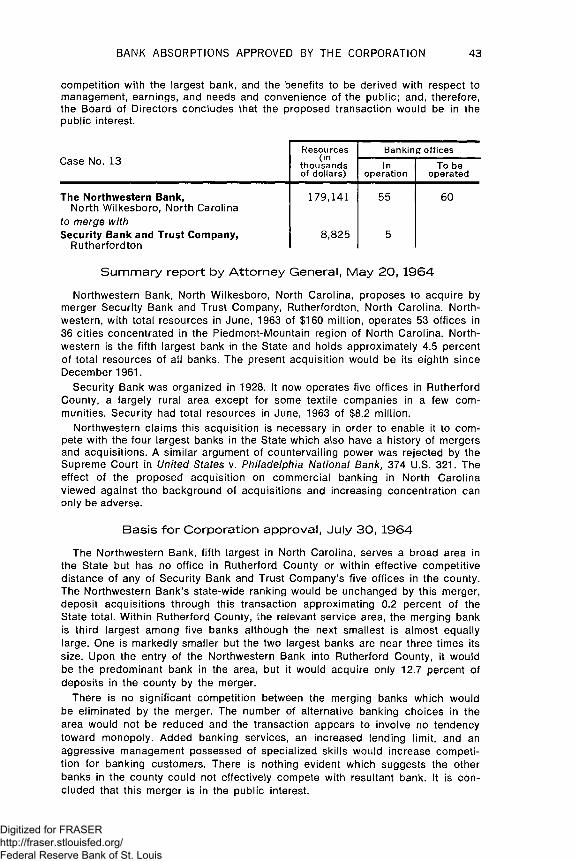
BANK ABSORPTIONS APPROVED BY THE CORPORATION 43
competition with the largest bank, and the benefits to be derived with respect to management, earnings, and needs and convenience of the public; and, therefore, the Board of Directors concludes that the proposed transaction would be in the public interest.
Case No. 13Resources
/ inBanking offices
U nthousands of dollars)
Inoperation
To be operated
The Northwestern Bank,North Wilkesboro, North Carolina
1 7 9 ,1 4 1 55 60
to merge withSecurity Bank and Trust Company,
Rutherfordton8,825 5
Sum m ary report by A ttorney General, M ay 20 , 1964
Northwestern Bank, North Wilkesboro, North Carolina, proposes to acquire by merger Security Bank and Trust Company, Rutherfordton, North Carolina. Northwestern, with total resources in June, 1963 of $160 million, operates 53 offices in 36 cities concentrated in the Piedmont-Mountain region of North Carolina. Northwestern is the fifth largest bank in the State and holds approximately 4.5 percent of total resources of all banks. The present acquisition would be its eighth since December 1961.
Security Bank was organized in 1928. It now operates five offices in Rutherford County, a largely rural area except for some textile companies in a few communities. Security had total resources in June, 1963 of $8.2 million.
Northwestern claims this acquisition is necessary in order to enable it to compete with the four largest banks in the State which also have a history of mergers and acquisitions. A similar argument of countervailing power was rejected by the Supreme Court in United States v. Philadelphia National Bank, 374 U.S. 321. The effect of the proposed acquisition on commercial banking in North Carolina viewed against the background of acquisitions and increasing concentration can only be adverse.
Basis for Corporation approval, July 3 0 , 1964
The Northwestern Bank, fifth largest in North Carolina, serves a broad area in the State but has no office in Rutherford County or within effective competitive distance of any of Security Bank and Trust Company’s five offices in the county. The Northwestern Bank’s state-wide ranking would be unchanged by this merger, deposit acquisitions through this transaction approximating 0.2 percent of the State total. Within Rutherford County, the relevant service area, the merging bank is third largest among five banks although the next smallest is almost equally large. One is markedly smaller but the two largest banks are near three times its size. Upon the entry of the Northwestern Bank into Rutherford County, it would be the predominant bank in the area, but it would acquire only 12.7 percent of deposits in the county by the merger.
There is no significant competition between the merging banks which would be eliminated by the merger. The number of alternative banking choices in the area would not be reduced and the transaction appears to involve no tendency toward monopoly. Added banking services, an increased lending limit, and an aggressive management possessed of specialized skills would increase competition for banking customers. There is nothing evident which suggests the other banks in the county could not effectively compete with resultant bank. It is concluded that this merger is in the public interest.
Digitized for FRASER http://fraser.stlouisfed.org/ Federal Reserve Bank of St. Louis
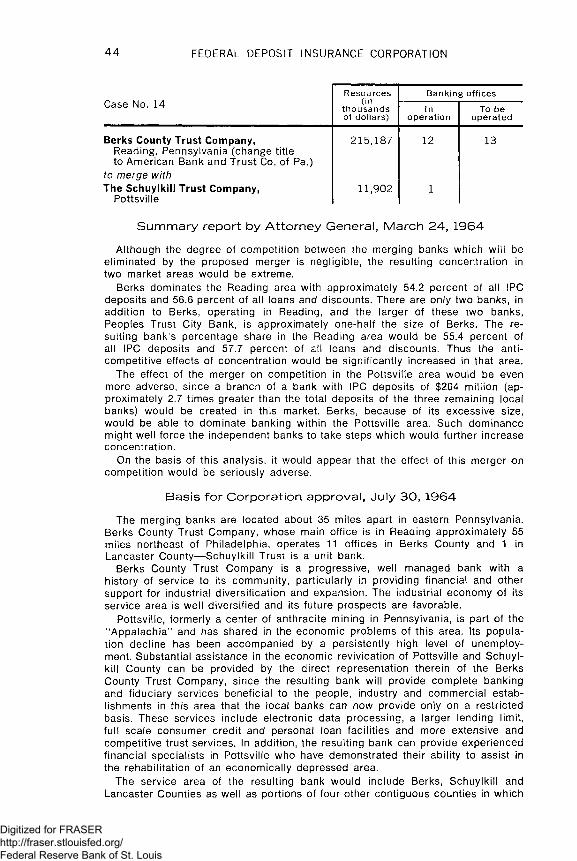
44 FEDERAL DEPOSIT INSURANCE CORPORATION
Case No. 14Resources
(inthousands of dollars)
Banking offices
Inoperation
To be operated
Berks County Trust Company,Reading, Pennsylvania (change title to American Bank and Trust Co. of Pa.)
to merge with
215,187 12 13
The Schuylkill Trust Company,Pottsville
11,902 1
Sum m ary report by A ttorney General, M arch 24 , 1964
Although the degree of competition between the merging banks which will be eliminated by the proposed merger is negligible, the resulting concentration in two market areas would be extreme.
Berks dominates the Reading area with approximately 54.2 percent of all !PC deposits and 56.6 percent of all loans and discounts. There are only two banks, in addition to Berks, operating in Reading, and the larger of these two banks, Peoples Trust City Bank, is approximately one-half the size of Berks. The resulting bank’s percentage share in the Reading area would be 55.4 percent of all IPC deposits and 57.7 percent of all loans and discounts. Thus the anticompetitive effects of concentration would be significantly increased in that area.
The effect of the merger on competition in the Pottsville area would be even more adverse, since a branch of a bank with IPC deposits of $204 million (approximately 2.7 times greater than the total deposits of the three remaining local banks) would be created in this market. Berks, because of its excessive size, would be able to dominate banking within the Pottsville area. Such dominance might well force the independent banks to take steps which would further increase concentration.
On the basis of this analysis, it would appear that the effect of this merger on competition would be seriously adverse.
Basis for Corporation approval, July 3 0 , 1964
The merging banks are located about 35 miles apart in eastern Pennsylvania. Berks County Trust Company, whose main office is in Reading approximately 55 miles northeast of Philadelphia, operates 11 offices in Berks County and 1 in Lancaster County— Schuylkill Trust is a unit bank.
Berks County Trust Company is a progressive, well managed bank with a history of service to its community, particularly in providing financial and other support for industrial diversification and expansion. The industrial economy of its service area is well diversified and its future prospects are favorable.
Pottsville, formerly a center of anthracite mining in Pennsylvania, is part of the “Appalachia” and has shared in the economic problems of this area. Its population decline has been accompanied by a persistently high level of unemployment. Substantial assistance in the economic revivication of Pottsville and Schuylkill County can be provided by the direct representation therein of the Berks County Trust Company, since the resulting bank will provide complete banking and fiduciary services beneficial to the people, industry and commercial establishments in this area that the local banks can now provide only on a restricted basis. These services include electronic data processing, a larger lending limit, full scale consumer credit and personal loan facilities and more extensive and competitive trust services. In addition, the resulting bank can provide experienced financial specialists in Pottsville who have demonstrated their ability to assist in the rehabilitation of an economically depressed area.
The service area of the resulting bank would include Berks, Schuylkill and Lancaster Counties as well as portions of four other contiguous counties in which
Digitized for FRASER http://fraser.stlouisfed.org/ Federal Reserve Bank of St. Louis
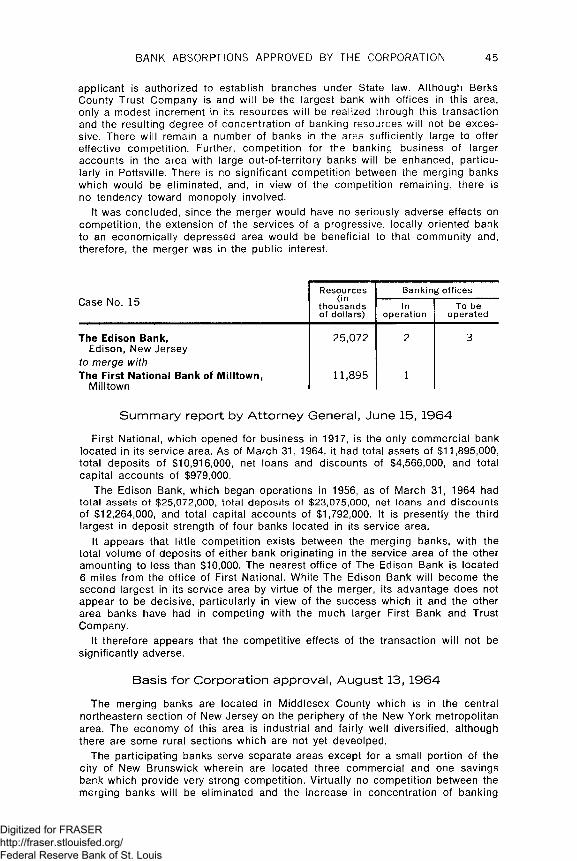
BANK ABSORPTIONS APPROVED BY THE CORPORATION 45
applicant is authorized to establish branches under State law. Although Berks County Trust Company is and will be the largest bank with offices in this area, only a modest increment in its resources will be realized through this transaction and the resulting degree of concentration of banking resources will not be excessive. There will remain a number of banks in the area sufficiently large to offer effective competition. Further, competition for the banking business of larger accounts in the area with large out-of-territory banks will be enhanced, particularly in Pottsville. There is no significant competition between the merging banks which would be eliminated, and, in view of the competition remaining, there is no tendency toward monopoly involved.
It was concluded, since the merger would have no seriously adverse effects on competition, the extension of the services of a progressive, locally oriented bank to an economically depressed area would be beneficial to that community and, therefore, the merger was in the public interest.
Case No. 15Resources
(inthousands of dollars)
Banking offices
Inoperation
To be operated
The Edison Bank,Edison, New Jersey
to merge with
25,072 2 3
The First National Bank of Milltown,Milltown
11,895 1
Sum m ary report by A ttorney General, June 15, 1964
First National, which opened for business in 1917, is the only commercial bank located in its service area. As of March 31, 1964, it had total assets of $11,895,000, total deposits of $10,916,000, net loans and discounts of $4,566,000, and total capital accounts of $979,000.
The Edison Bank, which began operations in 1956, as of March 31, 1964 had total assets of $25,072,000, total deposits of $23,075,000, net loans and discounts of $12,264,000, and total capital accounts of $1,792,000. It is presently the third largest in deposit strength of four banks located in its service area.
It appears that little competition exists between the merging banks, with the total volume of deposits of either bank originating in the service area of the other amounting to less than $10,000. The nearest office of The Edison Bank is located 6 miles from the office of First National. While The Edison Bank will become the second largest in its service area by virtue of the merger, its advantage does not appear to be decisive, particularly in view of the success which it and the other area banks have had in competing with the much larger First Bank and Trust Company.
It therefore appears that the competitive effects of the transaction will not be significantly adverse.
Basis for Corporation approval, A ugust 13, 1964
The merging banks are located in Middlesex County which is in the central northeastern section of New Jersey on the periphery of the New York metropolitan area. The economy of this area is industrial and fairly well diversified, although there are some rural sections which are not yet deveolped.
The participating banks serve separate areas except for a small portion of the city of New Brunswick wherein are located three commercial and one savings bank which provide very strong competition. Virtually no competition between the merging banks will be eliminated and the increase in concentration of banking
Digitized for FRASER http://fraser.stlouisfed.org/ Federal Reserve Bank of St. Louis
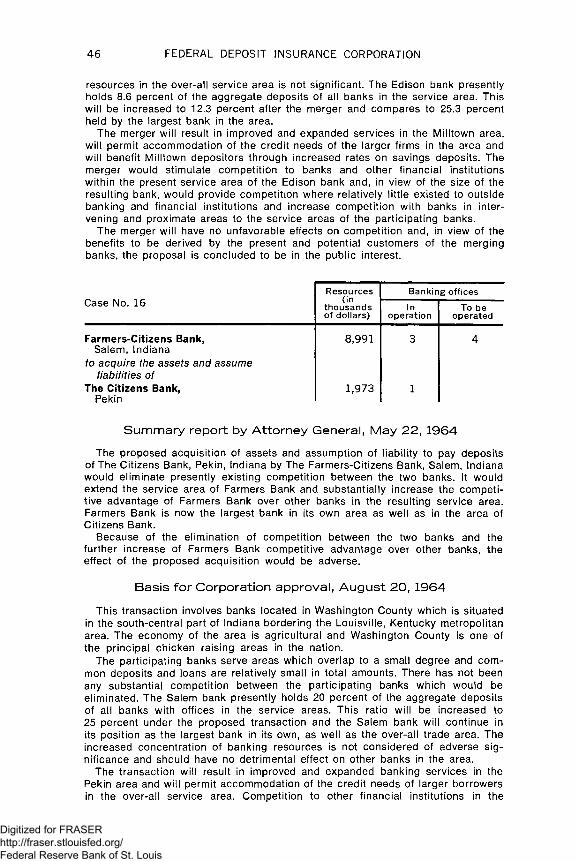
46 FEDERAL DEPOSIT INSURANCE CORPORATION
resources in the over-all service area is not significant. The Edison bank presently holds 8.6 percent of the aggregate deposits of all banks in the service area. This will be increased to 12.3 percent after the merger and compares to 25.3 percent held by the largest bank in the area.
The merger will result in improved and expanded services in the Milltown area, will permit accommodation of the credit needs of the larger firms in the area and will benefit Milltown depositors through increased rates on savings deposits. The merger would stimulate competition to banks and other financial institutions within the present service area of the Edison bank and, in view of the size of the resulting bank, would provide competition where relatively little existed to outside banking and financial institutions and increase competition with banks in intervening and proximate areas to the service areas of the participating banks.
The merger will have no unfavorable effects on competition and, in view of the benefits to be derived by the present and potential customers of the merging banks, the proposal is concluded to be in the public interest.
Case No. 16Resources
/in Banking officesv.1 n
thousands of dollars)
Inoperation
To be operated
Farmers-Citizens Bank,Salem, Indiana
to acquire the assets and assume liabilities of
8,991 3 4
The Citizens Bank,Pekin
1,973 1
Sum m ary report by A ttorney General, M ay 22 , 1964
The proposed acquisition of assets and assumption of liability to pay deposits of The Citizens Bank, Pekin, Indiana by The Farmers-Citizens Bank, Salem, Indiana would eliminate presently existing competition between the two banks. It would extend the service area of Farmers Bank and substantially increase the competitive advantage of Farmers Bank over other banks in the resulting service area. Farmers Bank is now the largest bank in its own area as well as in the area of Citizens Bank.
Because of the elimination of competition between the two banks and the further increase of Farmers Bank competitive advantage over other banks, the effect of the proposed acquisition would be adverse.
Basis for Corporation approval, A ugust 20 , 1964
This transaction involves banks located in Washington County which is situated in the south-central part of Indiana bordering the Louisville, Kentucky metropolitan area. The economy of the area is agricultural and Washington County is one of the principal chicken raising areas in the nation.
The participating banks serve areas which overlap to a small degree and common deposits and loans are relatively small in total amounts. There has not been any substantial competition between the participating banks which would be eliminated. The Salem bank presently holds 20 percent of the aggregate deposits of all banks with offices in the service areas. This ratio will be increased to 25 percent under the proposed transaction and the Salem bank will continue in its position as the largest bank in its own, as well as the over-all trade area. The increased concentration of banking resources is not considered of adverse significance and should have no detrimental effect on other banks in the area.
The transaction will result in improved and expanded banking services in the Pekin area and will permit accommodation of the credit needs of larger borrowers in the over-all service area. Competition to other financial institutions in the
Digitized for FRASER http://fraser.stlouisfed.org/ Federal Reserve Bank of St. Louis

BANK ABSORPTIONS APPROVED BY THE CORPORATION 47
county, which is described as intense, would be stimulated and also would be increased to larger banks located out of the county and service area. The credit needs of larger farmers and industries which must presently use these outside facilities will be adequately accommodated, in most cases, by the increased lending limit under the proposed transaction.
The transaction will have no unfavorable effect upon competition and is concluded to be in the public interest in view of the benefits to be derived by the present and future customers of the partcipating banks.
Case No. 17Resources
(inthousands of dollars)
Banking offices
Inoperation
To be operated
First State Bank of Oregon,Milwaukie, Oregon
to merge with
23,077 4 7
Gresham State Bank,Gresham and
5,429 1
Peoples Bank of Oregon,Beaverton
8,853 2
Sum m ary report by A ttorney General, June 3 , 1964
The First State Bank of Oregon (State Bank), Milwaukie, Oregon, has requested permission to merge with the Gresham State Bank (Gresham), Gresham, Oregon, and the Peoples Bank of Oregon (Peoples), Beaverton, Oregon. The State Bank intends to operate the acquired banking facilities as branches.
Robert W. Franz and Elsie M. Franz are among the principal stockholders in the three banks proposing to merge. They own, either individually or jointly, 48 percent of the stock of the Gresham Bank, 80 percent of the stock of the Peoples Bank, and 38 percent of the stock of the State Bank. In addition, Robert W. Franz is a director on each of the boards of the three merging banks, and Elsie M. Franz is a director on the board of the Peoples Bank and she is also an officer of the State Bank. Therefore, there is presently to a large extent a common ownership and direction of the three participating banks.
The service areas of the three banks to be merged do not overlap; for this reason, there is no direct or substantial competition between these banks. However, the service area of the resulting bank includes much of the Portland Metropolitan Area and in this area there are two large statewide banking chains (First National Bank of Oregon and U.S. National Bank of Oregon) which control 80 percent of the deposits and loans throughout the entire State and are also substantial factors in the area. Although the resulting bank will have only slightly over 1 percent in deposits and loans and will be next to the smallest bank in its service area, this consolidation would reduce the number of competing banks from nine to seven.
Thus, as an outcome of this increased concentration, similar pressures may be placed on other small banks in the area to consolidate, and consequently to this extent the effect of the consummation of the proposed merger on competition may be adverse.
Basis fo r Corporation approval, A ugust 20 , 1964
The three banks to be merged under this proposal are located in three different counties and serve essentially different primary service areas, although all three are located within the Portland metropolitan area. Although each bank derives some business from Portland, there is no significant competition between them that will be eliminated. The resulting bank will have total resources of less than $38 million, and its 7 offices will be in direct competition with 18 offices of Oregon’s two largest banks, with main offices in Portland, and each of which has
Digitized for FRASER http://fraser.stlouisfed.org/ Federal Reserve Bank of St. Louis
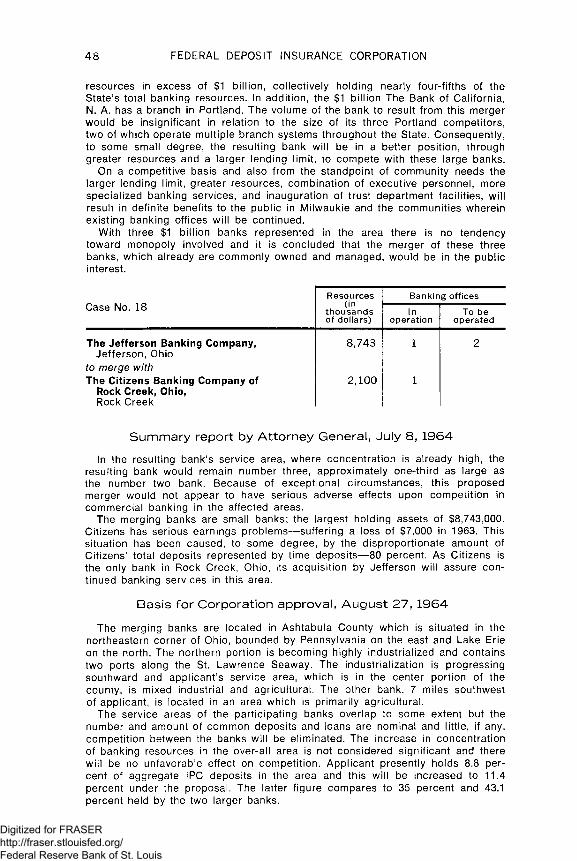
48 FEDERAL DEPOSIT INSURANCE CORPORATION
resources in excess of $1 billion, collectively holding nearly four-fifths of the State’s total banking resources. In addition, the $1 billion The Bank of California, N. A. has a branch in Portland. The volume of the bank to result from this merger would be insignificant in relation to the size of its three Portland competitors, two of which operate multiple branch systems throughout the State. Consequently, to some small degree, the resulting bank will be in a better position, through greater resources and a larger lending limit, to compete with these large banks.
On a competitive basis and also from the standpoint of community needs the larger lending limit, greater resources, combination of executive personnel, more specialized banking services, and inauguration of trust department facilities, will result in definite benefits to the public in Milwaukie and the communities wherein existing banking offices will be continued.
With three $1 billion banks represented in the area there is no tendency toward monopoly involved and it is concluded that the merger of these three banks, which already are commonly owned and managed, would be in the public interest.
Case No. 18Resources
(inthousands of dollars)
Banking offices
Inoperation
To be operated
The Jefferson Banking Company,Jefferson, Ohio
8,743 1 2
to merge withThe Citizens Banking Company of
Rock Creek, Ohio,Rock Creek
2,100 1
Sum m ary report by A ttorney General, July 8, 1964
In the resulting bank’s service area, where concentration is already high, the resulting bank would remain number three, approximately one-third as large as the number two bank. Because of exceptional circumstances, this proposed merger would not appear to have serious adverse effects upon competition in commercial banking in the affected areas.
The merging banks are small banks; the largest holding assets of $8,743,000. Citizens has serious earnings problems— suffering a loss of $7,000 in 1963. This situation has been caused, to some degree, by the disproportionate amount of Citizens’ total deposits represented by time deposits— 80 percent. As Citizens is the only bank in Rock Creek, Ohio, its acquisition by Jefferson will assure continued banking services in this area.
Basis for Corporation approval, August 27 , 1964
The merging banks are located in Ashtabula County which is situated in the northeastern corner of Ohio, bounded by Pennsylvania on the east and Lake Erie on the north. The northern portion is becoming highly industrialized and contains two ports along the St. Lawrence Seaway. The industrialization is progressing southward and applicant’s service area, which is in the center portion of the county, is mixed industrial and agricultural. The other bank, 7 miles southwest of applicant, is located in an area which is primarily agricultural.
The service areas of the participating banks overlap to some extent but the number and amount of common deposits and loans are nominal and little, if any, competition between the banks will be eliminated. The increase in concentration of banking resources in the over-all area is not considered significant and there will be no unfavorable effect on competition. Applicant presently holds 8.8 percent of aggregate IPC deposits in the area and this will be increased to 11.4 percent under the proposal. The latter figure compares to 35 percent and 43.1 percent held by the two larger banks.
Digitized for FRASER http://fraser.stlouisfed.org/ Federal Reserve Bank of St. Louis
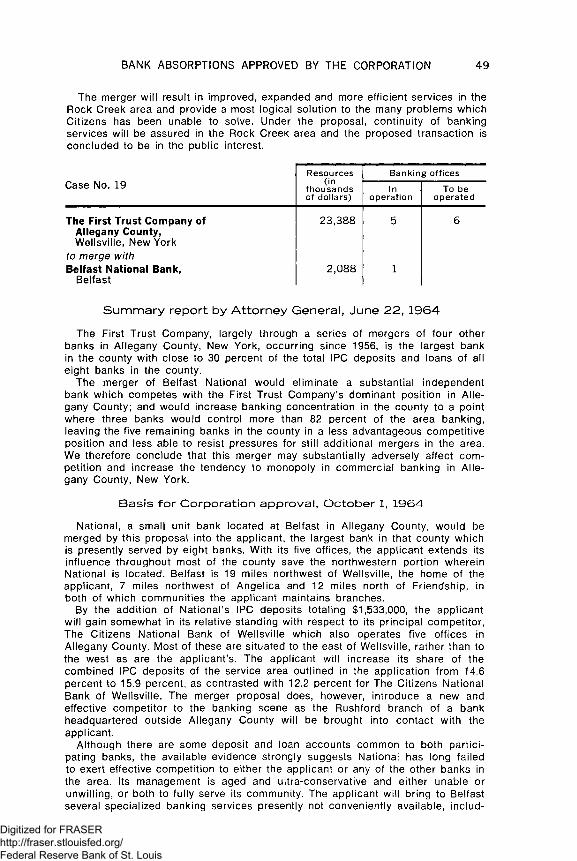
BANK ABSORPTIONS APPROVED BY THE CORPORATION 49
The merger will result in improved, expanded and more efficient services in the Rock Creek area and provide a most logical solution to the many problems which Citizens has been unable to solve. Under the proposal, continuity of banking services will be assured in the Rock Creek area and the proposed transaction is concluded to be in the public interest.
Case No. 19Resources
(inthousands of dollars)
Banking offices
Inoperation
To be operated
The First Trust Company of Allegany County,Wellsville, New York
23,388 5 6
to merge with Belfast National Bank,
Belfast2,088 1
Sum m ary report by A ttorney General, June 22 , 1964
The First Trust Company, largely through a series of mergers of four other banks in Allegany County, New York, occurring since 1956, is the largest bank in the county with close to 30 percent of the total IPC deposits and loans of all eight banks in the county.
The merger of Belfast National would eliminate a substantial independent bank which competes with the First Trust Company’s dominant position in Allegany County; and would increase banking concentration in the county to a point where three banks would control more than 82 percent of the area banking, leaving the five remaining banks in the county in a less advantageous competitive position and less able to resist pressures for still additional mergers in the area. We therefore conclude that this merger may substantially adversely affect competition and increase the tendency to monopoly in commercial banking in Allegany County, New York.
Basis for Corporation approval, October 1, 1964
National, a small unit bank located at Belfast in Allegany County, would be merged by this proposal into the applicant, the largest bank in that county which is presently served by eight banks. With its five offices, the applicant extends its influence throughout most of the county save the northwestern portion wherein National is located. Belfast is 19 miles northwest of Wellsville, the home of the applicant, 7 miles northwest of Angelica and 12 miles north of Friendship, in both of which communities the applicant maintains branches.
By the addition of National’s IPC deposits totaling $1,533,000, the applicant will gain somewhat in its relative standing with respect to its principal competitor, The Citizens National Bank of Wellsville which also operates five offices in Allegany County. Most of these are situated to the east of Wellsville, rather than to the west as are the applicant’s. The applicant will increase its share of the combined IPC deposits of the service area outlined in the application from 14.6 percent to 15.9 percent, as contrasted with 12.2 percent for The Citizens National Bank of Wellsville. The merger proposal does, however, introduce a new and effective competitor to the banking scene as the Rushford branch of a bank headquartered outside Allegany County will be brought into contact with the applicant.
Although there are some deposit and loan accounts common to both participating banks, the available evidence strongly suggests National has long failed to exert effective competition to either the applicant or any of the other banks in the area. Its management is aged and ultra-conservative and either unable or unwilling, or both to fully serve its community. The applicant will bring to Belfast several specialized banking services presently not conveniently available, includ
Digitized for FRASER http://fraser.stlouisfed.org/ Federal Reserve Bank of St. Louis

50 FEDERAL DEPOSIT INSURANCE CORPORATION
ing a comprehensive trust department and various specialized checking account and loan features. The county has suffered the virtual loss of a principal industry as the importance of oil production has progressively declined here and attempts to attract new industry should be enhanced by the expansion of its banking capabilities, however slight.
It is believed the proposed merger will have little effect on bank competition except in the Belfast service area, where there likely will be a significant increase. The merger is concluded to be in the public interest.
Case No. 20Resources
(inthousands of dollars)
Banking offices
Inoperation
To be operated
Citizens Marine Jefferson Bank,Newport News, Virginia (change title to Citizens and Marine Bank)
to merge with
26,929 4 10
The Citizens National Bank of Hampton,Hampton
18,682 6
Sum m ary report by A ttorney General, A ugust 18, 1964
Citizens Marine Jefferson Bank with deposits in excess of $25 million, is a subsidiary of United Virginia Bankshares, a bank holding company with combined assets of over $484 million operating 6 banks with 45 offices in 11 communities in Virginia. Of the 4 other banks in Newport News, one is a branch of First and Merchants National Bank, the largest bank in Virginia; two, The Bank of Virginia, (fourth largest bank in Virginia) and The Bank of Warwick, are subsidiaries of Virginia Commonwealth Corporation, a bank holding company, with combined assets in excess of $230 million. The remaining bank, The Bank of Hampton Roads with assets of only slightly over $11 million, is the only independent bank in Newport News.
The city of Hampton, where Citizens National Bank of Hampton is located, adjoins Newport News. With deposits of $17,875,482, it is the largest bank in Hampton. The other three banks in Hampton, each slightly smaller than Citizens National, are all independent banks. The application discloses that competition between the merging banks is substantial, and the advantages accruing to the resulting bank from the merger will give it a decided competitive advantage over the three remaining independent banks in Hampton.
Approval of this merger will act as a precedent for the other large banking organizations in Newport News to absorb the three remaining independent banks in Hampton.
The effect of this proposed merger upon competition will be adverse. It will not only result in a substantial lessening of competition but will foster and encourage the rapidly increasing concentration of banking in Virginia.
Basis for Corporation approval, O ctober 1, 1964
Newport News and Hampton are adjoining independent cities serving the important Hampton Roads port area of Virginia. Together with a small portion of York County, these expansive communities comprise the service area relevant to this proposal. Jefferson, the second largest bank in terms of local IPC deposits, holding 13.1 percent thereof, presently serves Newport News through 4 offices, all within the city limits. It is owned by United Virginia Bankshares, Incorporated, a registered bank holding company, presently controlling 5 banks in other communities. National, the fourth largest of the 10 banks located in this area, holding 9.6 percent of aggregate local IPC deposits, operates 5 offices in Hampton and extends its influence slightly into York County through a branch
Digitized for FRASER http://fraser.stlouisfed.org/ Federal Reserve Bank of St. Louis
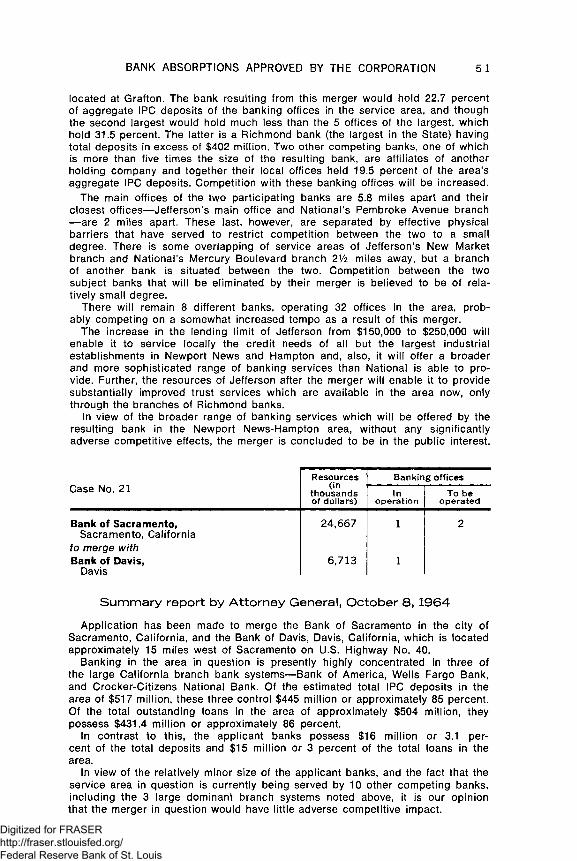
BANK ABSORPTIONS APPROVED BY THE CORPORATION
located at Grafton. The bank resulting from this merger would hold 22.7 percent of aggregate IPC deposits of the banking offices in the service area, and though the second largest would hold much less than the 5 offices of the largest, which hold 31.5 percent. The latter is a Richmond bank (the largest in the State) having total deposits in excess of $402 million. Two other competing banks, one of which is more than five times the size of the resulting bank, are affiliates of another holding company and together their local offices held 19.5 percent of the area’s aggregate IPC deposits. Competition with these banking offices will be increased.
The main offices of the two participating banks are 5.8 miles apart and their closest offices— Jefferson’s main office and National’s Pembroke Avenue branch — are 2 miles apart. These last, however, are separated by effective physical barriers that have served to restrict competition between the two to a small degree. There is some overlapping of service areas of Jefferson’s New Market branch and National’s Mercury Boulevard branch 2Vz miles away, but a branch of another bank is situated between the two. Competition between the two subject banks that will be eliminated by their merger is believed to be of relatively small degree.
There will remain 8 different banks, operating 32 offices in the area, probably competing on a somewhat increased tempo as a result of this merger.
The increase in the lending limit of Jefferson from $150,000 to $250,000 will enable it to service locally the credit needs of all but the largest industrial establishments in Newport News and Hampton and, also, it will offer a broader and more sophisticated range of banking services than National is able to provide. Further, the resources of Jefferson after the merger will enable it to provide substantially improved trust services which are available in the area now, only through the branches of Richmond banks.
In view of the broader range of banking services which will be offered by the resulting bank in the Newport News-Hampton area, without any significantly adverse competitive effects, the merger is concluded to be in the public interest.
Case No. 21Resources
(inthousands of dollars)
Banking offices
Inoperation
To be operated
Bank of Sacramento, 24,667 1 2Sacramento, California
to merge withBank of Davis, 6,713 1
Davis
Sum m ary report by A ttorney General, O ctober 8 , 1964
Application has been made to merge the Bank of Sacramento in the city of Sacramento, California, and the Bank of Davis, Davis, California, which is located approximately 15 miles west of Sacramento on U.S. Highway No. 40.
Banking in the area in question is presently highly concentrated in three of the large California branch bank systems— Bank of America, Wells Fargo Bank, and Crocker-Citizens National Bank. Of the estimated total IPC deposits in the area of $517 million, these three control $445 million or approximately 85 percent. Of the total outstanding loans in the area of approximately $504 million, they possess $431.4 million or approximately 86 percent.
In contrast to this, the applicant banks possess $16 million or 3.1 percent of the total deposits and $15 million or 3 percent of the total loans in the area.
In view of the relatively minor size of the applicant banks, and the fact that the service area in question is currently being served by 10 other competing banks, including the 3 large dominant branch systems noted above, it is our opinion that the merger in question would have little adverse competitive impact.
Digitized for FRASER http://fraser.stlouisfed.org/ Federal Reserve Bank of St. Louis
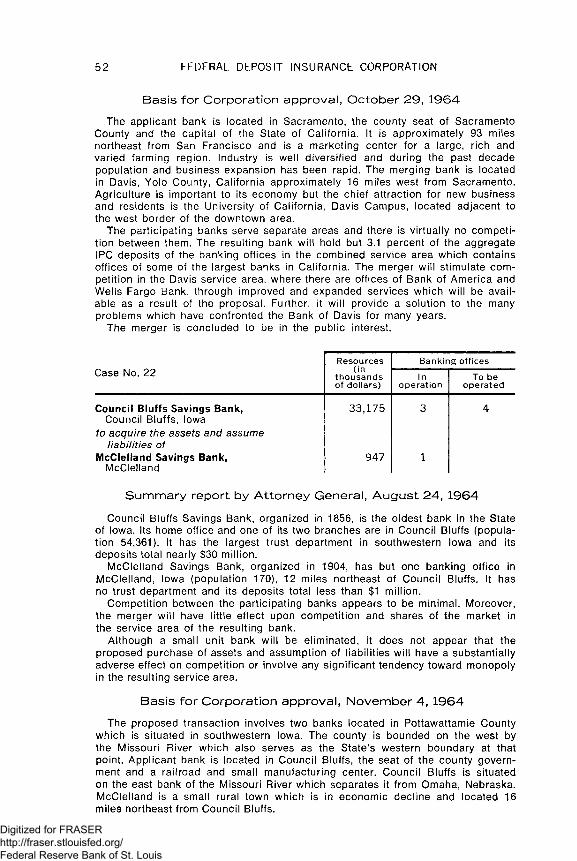
52 FEDERAL DEPOSIT INSURANCE CORPORATION
Basis for Corporation approval, O ctober 29 , 1964
The applicant bank is located in Sacramento, the county seat of Sacramento County and the capital of the State of California. It is approximately 93 miles northeast from San Francisco and is a marketing center for a large, rich and varied farming region. Industry is well diversified and during the past decade population and business expansion has been rapid. The merging bank is located in Davis, Yolo County, California approximately 16 miles west from Sacramento. Agriculture is important to its economy but the chief attraction for new business and residents is the University of California, Davis Campus, located adjacent to the west border of the downtown area.
The participating banks serve separate areas and there is virtually no competition between them. The resulting bank will hold but 3.1 percent of the aggregate IPC deposits of the banking offices in the combined service area which contains offices of some of the largest banks in California. The merger will stimulate competition in the Davis service area, where there are offices of Bank of America and Wells Fargo Bank, through improved and expanded services which will be available as a result of the proposal. Further, it will provide a solution to the many problems which have confronted the Bank of Davis for many years.
The merger is concluded to be in the public interest.
Case No. 22Resources
(inthousands of dollars)
Banking offices
Inoperation
To be operated
Council Bluffs Savings Bank,Council Bluffs, Iowa
to acquire the assets and assume liabilities of
33,175 3 4
McClelland Savings Bank,McClelland
947 1
Sum m ary report by A ttorney General, A ugust 24 , 1964
Council Bluffs Savings Bank, organized in 1856, is the oldest bank in the State of Iowa. Its home office and one of its two branches are in Council Bluffs (population 54,361). It has the largest trust department in southwestern Iowa and its deposits total nearly $30 million.
McClelland Savings Bank, organized in 1904, has but one banking office in McClelland, Iowa (population 170), 12 miles northeast of Council Bluffs. It has no trust department and its deposits total less than $1 million.
Competition between the participating banks appears to be minimal. Moreover, the merger will have little effect upon competition and shares of the market in the service area of the resulting bank.
Although a small unit bank will be eliminated, it does not appear that the proposed purchase of assets and assumption of liabilities will have a substantially adverse effect on competition or involve any significant tendency toward monopoly in the resulting service area.
Basis for Corporation approval, N ovem ber 4 , 1964
The proposed transaction involves two banks located in Pottawattamie County which is situated in southwestern Iowa. The county is bounded on the west by the Missouri River which also serves as the State’s western boundary at that point. Applicant bank is located in Council Bluffs, the seat of the county government and a railroad and small manufacturing center. Council Bluffs is situated on the east bank of the Missouri River which separates it from Omaha, Nebraska. McClelland is a small rural town which is in economic decline and located 16 miles northeast from Council Bluffs.
Digitized for FRASER http://fraser.stlouisfed.org/ Federal Reserve Bank of St. Louis
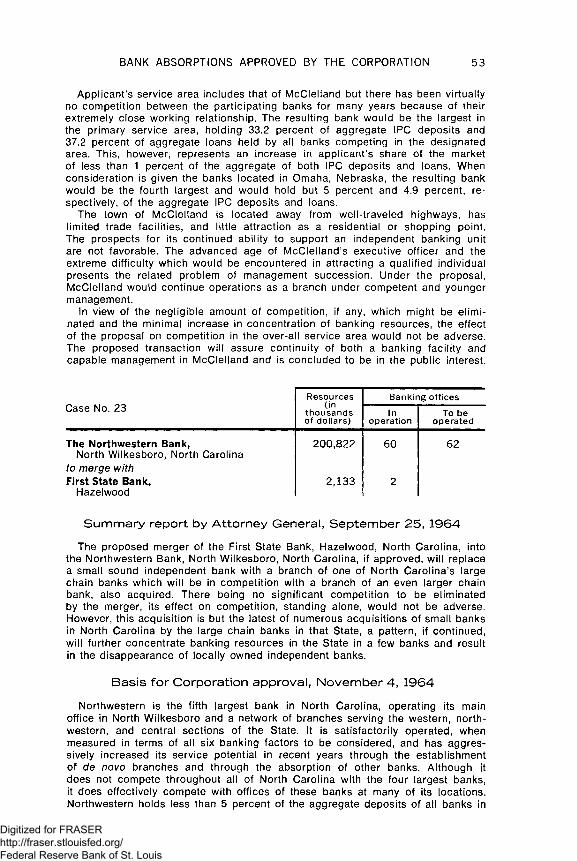
BANK ABSORPTIONS APPROVED BY THE CORPORATION 53
Applicant’s service area includes that of McClelland but there has been virtually no competition between the participating banks for many years because of their extremely close working relationship. The resulting bank would be the largest in the primary service area, holding 33.2 percent of aggregate IPC deposits and 37.2 percent of aggregate loans held by all banks competing in the designated area. This, however, represents an increase in applicant’s share of the market of less than 1 percent of the aggregate of both IPC deposits and loans. When consideration is given the banks located in Omaha, Nebraska, the resulting bank would be the fourth largest and would hold but 5 percent and 4.9 percent, respectively, of the aggregate IPC deposits and loans.
The town of McClelland is located away from well-traveled highways, has limited trade facilities, and little attraction as a residential or shopping point. The prospects for its continued ability to support an independent banking unit are not favorable. The advanced age of McClelland’s executive officer and the extreme difficulty which would be encountered in attracting a qualified individual presents the related problem of management succession. Under the proposal, McClelland would continue operations as a branch under competent and younger management.
In view of the negligible amount of competition, if any, which might be eliminated and the minimal increase in concentration of banking resources, the effect of the proposal on competition in the over-all service area would not be adverse. The proposed transaction will assure continuity of both a banking facility and capable management in McClelland and is concluded to be in the public interest.
Case No. 23Resources/ i n Banking offices
unthousands of dollars)
Inoperation
To be operated
The Northwestern Bank,North Wilkesboro, North Carolina
200,822 60 62
to merge with First State Bank,
Hazelwood2,133 2
Sum m ary report by A ttorney General, Septem ber 2 5 , 1964
The proposed merger of the First State Bank, Hazelwood, North Carolina, into the Northwestern Bank, North Wilkesboro, North Carolina, if approved, will replace a small sound independent bank with a branch of one of North Carolina’s large chain banks which will be in competition with a branch of an even larger chain bank, also acquired. There being no significant competition to be eliminated by the merger, its effect on competition, standing alone, would not be adverse. However, this acquisition is but the latest of numerous acquisitions of small banks in North Carolina by the large chain banks in that State, a pattern, if continued, will further concentrate banking resources in the State in a few banks and result in the disappearance of locally owned independent banks.
Basis for Corporation approval, Novem ber 4 , 1964
Northwestern is the fifth largest bank in North Carolina, operating its main office in North Wilkesboro and a network of branches serving the western, northwestern, and central sections of the State. It is satisfactorily operated, when measured in terms of all six banking factors to be considered, and has aggressively increased its service potential in recent years through the establishment of de novo branches and through the absorption of other banks. Although it does not compete throughout all of North Carolina with the four largest banks, it does effectively compete with offices of these banks at many of its locations. Northwestern holds less than 5 percent of the aggregate deposits of all banks in
Digitized for FRASER http://fraser.stlouisfed.org/ Federal Reserve Bank of St. Louis

54 FEDERAL DEPOSIT INSURANCE CORPORATION
North Carolina and the merger with First State would increase this proportion only infinitesimally. This compares with 22 percent for the largest bank in the State, 16 percent for the second largest, 11 percent for the third largest, and 9 percent for the fourth largest. The sixth largest holds 3.4 percent of the total. Northwestern is only about one-fifth the size of the largest bank in the State and about one-half the size of the fourth largest. The merger would have no significant effect on the concentration of banking resources in North Carolina, nor will it affect the relative position of Northwestern or competition in its service area.
First State is a relatively small bank, operating two offices only about one mile apart, for which principal competition is provided by three branches of the State’s third largest bank and one branch of the fourth largest. The entry of Northwestern into the Hazelwood area in place of the small bank would increase competition for the two larger banks. The nearest offices of the merging banks are more than 30 miles apart and there is no competition between them which would be eliminated. Specifically, Northwestern would offer a larger lending limit in competition with the two larger banks, and would bring trust services and a wider range of loan services, particularly an agricultural advisory department, to the customers of First State. The larger lending limit should benefit the rapidly expanding industrial economy of the Hazelwood and Waynesville area and will result in a better balance in that area’s banking structure.
There is no tendency toward monopoly involved, and in view of the foregoing competitive aspects which are favorably resolved, it is concluded that the merger would be in the public interest.
Case No. 24Resources(i n
Banking offices
thousands of dollars)
Inoperation
To be operated
Union Bank and Trust Company,Pottsville, Pennsylvania
to merge with
10,899 3 4
Silver Creek State Bank,New Philadelphia
3,707 1
Sum m ary report by A ttorney General, Septem ber 3 0 , 1964The merger in question will eliminate all competition between Union Bank and
Silver Creek Bank, which are in communities only 6 miles apart, and will eliminate the latter as an independent bank. However, the competition thus eliminated does not appear critically significant in the context of the several alternative banking sources available in the relevant market area. Silver Creek Bank, with less than $3 million in IPC deposits, is the smallest of the 10 commercial banks in the area, accounting for less than 3 percent of the total IPC deposits. While the resulting bank will have 11.2 percent of the total IPC deposits, it will be less than one-half the size of each of the 2 leading banks competing in the area and not disproportionately larger than the other 6 remaining. The addition of less than 3 percentage points to Union Bank’s present share of IPC deposits and 2.2 percentage points to its present share of loans would not seem to place the remaining banks in the area at any significant competitive disadvantage.
The proposed merger will not have a substantially adverse effect upon competition.
Basis for Corporation approval, N ovem ber 12, 1964The merging banks are located about 6 miles apart in Schuylkill County which
is situated in the east-central part of Pennsylvania. Applicant operates its main office and two branches in Pottsville. Silver Creek, located in New Philadelphia, is a unit bank.
Digitized for FRASER http://fraser.stlouisfed.org/ Federal Reserve Bank of St. Louis
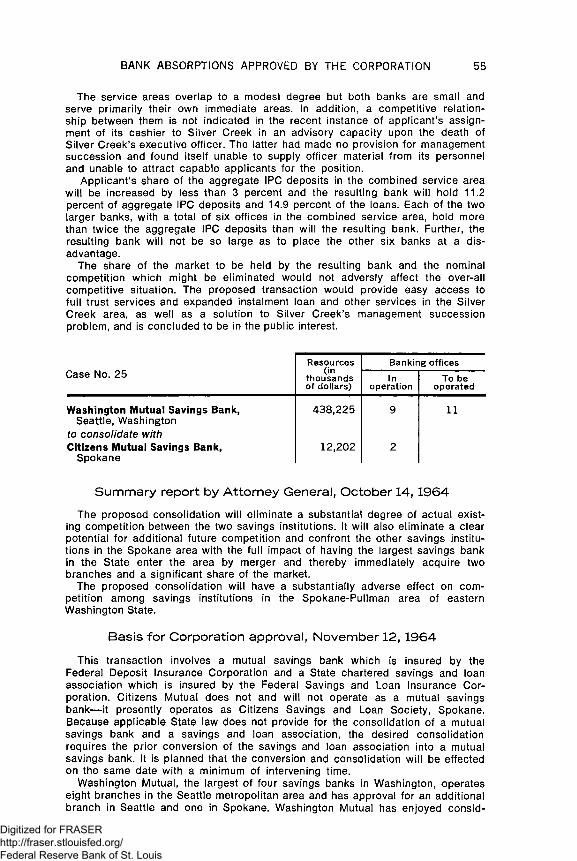
BANK ABSORPTIONS APPROVED BY THE CORPORATION 55
The service areas overlap to a modest degree but both banks are small and serve primarily their own immediate areas. In addition, a competitive relationship between them is not indicated in the recent instance of applicant’s assignment of its cashier to Silver Creek in an advisory capacity upon the death of Silver Creek’s executive officer. The latter had made no provision for management succession and found itself unable to supply officer material from its personnel and unable to attract capable applicants for the position.
Applicant’s share of the aggregate IPC deposits in the combined service area will be increased by less than 3 percent and the resulting bank will hold 11.2 percent of aggregate IPC deposits and 14.9 percent of the loans. Each of the two larger banks, with a total of six offices in the combined service area, hold more than twice the aggregate IPC deposits than will the resulting bank. Further, the resulting bank will not be so large as to place the other six banks at a disadvantage.
The share of the market to be held by the resulting bank and the nominal competition which might be eliminated would not adversly affect the over-all competitive situation. The proposed transaction would provide easy access to full trust services and expanded instalment loan and other services in the Silver Creek area, as well as a solution to Silver Creek’s management succession problem, and is concluded to be in the public interest.
Case No. 25Resources
(inthousands of dollars)
Banking offices
Inoperation
To be operated
Washington Mutual Savings Bank,Seattle, Washington
to consolidate with
438,225 9 11
Citizens Mutual Savings Bank,Spokane
12,202 2
Sum m ary report by A ttorney General, O ctober 14, 1964
The proposed consolidation will eliminate a substantial degree of actual existing competition between the two savings institutions. It will also eliminate a clear potential for additional future competition and confront the other savings institutions in the Spokane area with the full impact of having the largest savings bank in the State enter the area by merger and thereby immediately acquire two branches and a significant share of the market.
The proposed consolidation will have a substantially adverse effect on competition among savings institutions in the Spokane-Pullman area of eastern Washington State.
Basis for Corporation approval, Novem ber 12, 1964
This transaction involves a mutual savings bank which is insured by the Federal Deposit Insurance Corporation and a State chartered savings and loan association which is insured by the Federal Savings and Loan Insurance Corporation. Citizens Mutual does not and will not operate as a mutual savings bank— it presently operates as Citizens Savings and Loan Society, Spokane. Because applicable State law does not provide for the consolidation of a mutual savings bank and a savings and loan association, the desired consolidation requires the prior conversion of the savings and loan association into a mutual savings bank. It is planned that the conversion and consolidation will be effected on the same date with a minimum of intervening time.
Washington Mutual, the largest of four savings banks in Washington, operates eight branches in the Seattle metropolitan area and has approval for an additional branch in Seattle and one in Spokane. Washington Mutual has enjoyed consid
Digitized for FRASER http://fraser.stlouisfed.org/ Federal Reserve Bank of St. Louis
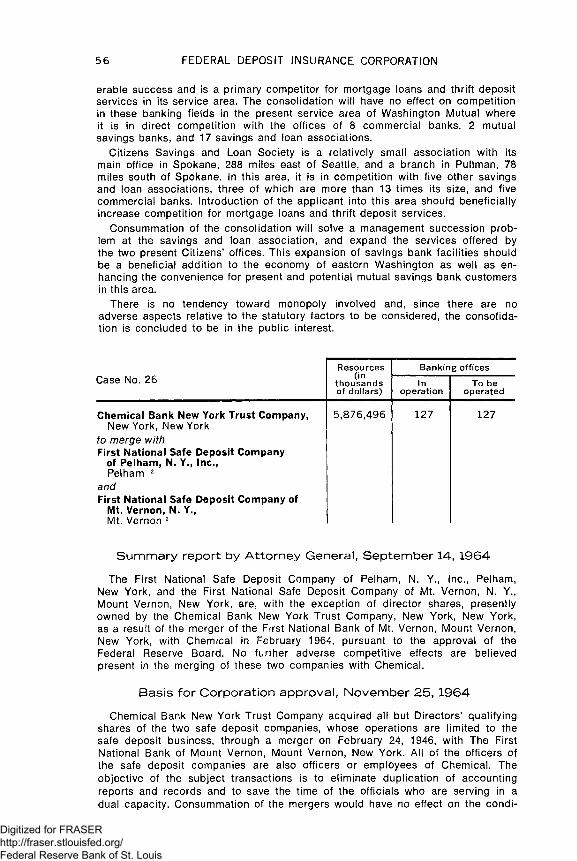
56 FEDERAL DEPOSIT INSURANCE CORPORATION
erable success and is a primary competitor for mortgage loans and thrift deposit services in its service area. The consolidation will have no effect on competition in these banking fields in the present service area of Washington Mutual where it is in direct competition with the offices of 8 commercial banks, 2 mutual savings banks, and 17 savings and loan associations.
Citizens Savings and Loan Society is a relatively small association with its main office in Spokane, 288 miles east of Seattle, and a branch in Pullman, 78 miles south of Spokane. In this area, it is in competition with five other savings and loan associations, three of which are more than 13 times its size, and five commercial banks. Introduction of the applicant into this area should beneficially increase competition for mortgage loans and thrift deposit services.
Consummation of the consolidation will solve a management succession problem at the savings and loan association, and expand the services offered by the two present Citizens’ offices. This expansion of savings bank facilities should be a beneficial addition to the economy of eastern Washington as well as enhancing the convenience for present and potential mutual savings bank customers in this area.
There is no tendency toward monopoly involved and, since there are no adverse aspects relative to the statutory factors to be considered, the consolidation is concluded to be in the public interest.
Resources(in
thousands of dollars)
Banking officesCase No. 26 In
operationTo be
operated
Chemical Bank New York Trust Company,New York, New York
to merge withFirst National Safe Deposit Company
of Pelham, N. Y., Inc.,Pelham 2
andFirst National Safe Deposit Company of
Mt. Vernon, N. Y.,Mt. Vernon 3
5,876,496 127 127
Sum m ary report by A ttorney General, Septem ber 14, 1964
The First National Safe Deposit Company of Pelham, N. Y., Inc., Pelham, New York, and the First National Safe Deposit Company of Mt. Vernon, N. Y., Mount Vernon, New York, are, with the exception of director shares, presently owned by the Chemical Bank New York Trust Company, New York, New York, as a result of the merger of the First National Bank of Mt. Vernon, Mount Vernon, New York, with Chemical in February 1964, pursuant to the approval of the Federal Reserve Board. No further adverse competitive effects are believed present in the merging of these two companies with Chemical.
Basis for Corporation approval, N ovem ber 25 , 1964
Chemical Bank New York Trust Company acquired all but Directors’ qualifying shares of the two safe deposit companies, whose operations are limited to the safe deposit business, through a merger on February 24, 1946, with The First National Bank of Mount Vernon, Mount Vernon, New York. All of the officers of the safe deposit companies are also officers or employees of Chemical. The objective of the subject transactions is to eliminate duplication of accounting reports and records and to save the time of the officials who are serving in a dual capacity. Consummation of the mergers would have no effect on the condi
Digitized for FRASER http://fraser.stlouisfed.org/ Federal Reserve Bank of St. Louis
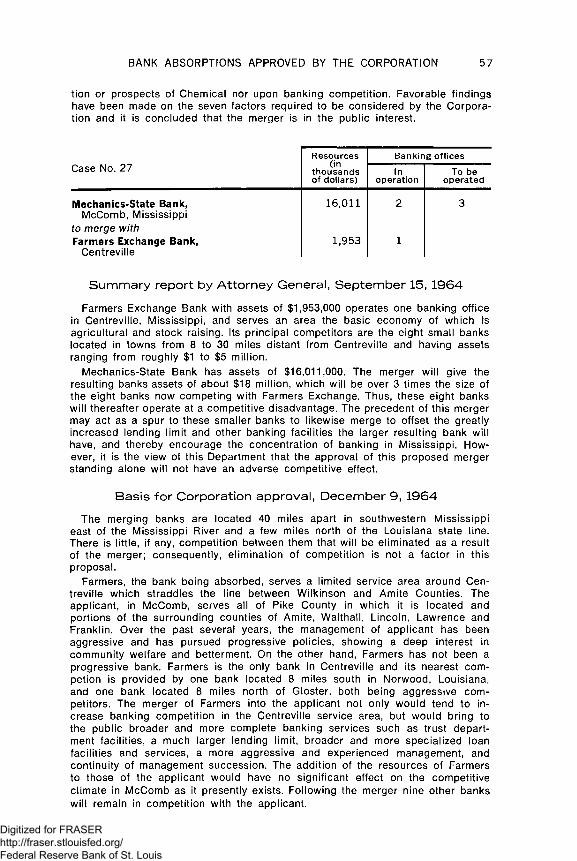
BANK ABSORPTIONS APPROVED BY THE CORPORATION 57
tion or prospects of Chemical nor upon banking competition. Favorable findings have been made on the seven factors required to be considered by the Corporation and it is concluded that the merger is in the public interest.
Case No. 27Resources
(inthousands of dollars)
Banking offices
Inoperation
To be operated
Mechanics-State Bank,McComb, Mississippi
to merge with
1 6 ,0 1 1 2 3
Farmers Exchange Bank,Centreville
1 ,9 5 3 1
Sum m ary report by A ttorney General, Septem ber 15, 1964
Farmers Exchange Bank with assets of $1,953,000 operates one banking office in Centreville, Mississippi, and serves an area the basic economy of which is agricultural and stock raising. Its principal competitors are the eight small banks located in towns from 8 to 30 miles distant from Centreville and having assets ranging from roughly $1 to $5 million.
Mechanics-State Bank has assets of $16,011,000. The merger will give the resulting banks assets of about $18 million, which will be over 3 times the size of the eight banks now competing with Farmers Exchange. Thus, these eight banks will thereafter operate at a competitive disadvantage. The precedent of this merger may act as a spur to these smaller banks to likewise merge to offset the greatly increased lending limit and other banking facilities the larger resulting bank will have, and thereby encourage the concentration of banking in Mississippi. However, it is the view of this Department that the approval of this proposed merger standing alone will not have an adverse competitive effect.
Basis for Corporation approval, Decem ber 9 , 1964
The merging banks are located 40 miles apart in southwestern Mississippi east of the Mississippi River and a few miles north of the Louisiana state line. There is little, if any, competition between them that will be eliminated as a result of the merger; consequently, elimination of competition is not a factor in this proposal.
Farmers, the bank being absorbed, serves a limited service area around Centreville which straddles the line between Wilkinson and Amite Counties. The applicant, in McComb, serves all of Pike County in which it is located and portions of the surrounding counties of Amite, Walthall, Lincoln, Lawrence and Franklin. Over the past several years, the management of applicant has been aggressive and has pursued progressive policies, showing a deep interest in community welfare and betterment. On the other hand, Farmers has not been a progressive bank. Farmers is the only bank in Centreville and its nearest com- petion is provided by one bank located 8 miles south in Norwood, Louisiana, and one bank located 8 miles north of Gloster, both being aggressive competitors. The merger of Farmers into the applicant not only would tend to increase banking competition in the Centreville service area, but would bring to the public broader and more complete banking services such as trust department facilities, a much larger lending limit, broader and more specialized loan facilities and services, a more aggressive and experienced management, and continuity of management succession. The addition of the resources of Farmers to those of the applicant would have no significant effect on the competitive climate in McComb as it presently exists. Following the merger nine other banks will remain in competition with the applicant.
Digitized for FRASER http://fraser.stlouisfed.org/ Federal Reserve Bank of St. Louis

58 FEDERAL DEPOSIT INSURANCE CORPORATION
There is no tendency toward monopoly involved and in view of the foregoing it is concluded that the merger is in the public interest.
Case No. 28Resources
(inthousands of dollars)
Banking offices
Inoperation
To be operated
Page State Bank,Page, North Dakota (Proposed new bank)
to acquire the assets and assume liabilities of 1 branch of
1
First State Bank of Hope,Hope
1,260 5 1 6
Sum m ary report by A ttorney General, Novem ber 13, 1964The Page State Bank is a newly organized State bank having received its
charter in April 1964.The First State Bank of Hope has since July 1, 1944, operated a paying and
receiving station at Page, 14 miles south of Hope. The Page station, with limited banking authority, has been the only banking facility at Page. The Page State Bank was organized to supplant the Page station with an institution providing full banking authority to the Page community. Under the proposed plan of acquisition, the Page State Bank would acquire all property and accounts of the First State Bank of Hope applicable to the Page community in exchange for its capital stock. The stock of Page State Bank and of First State Bank of Hope will be closely held and the banks will have common shareholders.
After the acquisition (scheduled to take place, according to the application, on or after October 1, 1964) the First State Bank of Hope will have total deposits of $3,069,750 and total loans of $2,030,490. Page State Bank will have total deposits of $1,063,341 and total loans of $892,816.
There will be no discernible adverse competitive effects as a result of the acquisition of the paying station’s assets and assumption of the deposit liabilities applicable to the Page community by the newly organized Page State Bank as the acquisition merely results in the supplanting of a limited banking facility with an institution providing full banking authority.
Basis for Corporation approval, D ecem ber 22 , 1964The transaction involves an operating bank in Hope, North Dakota, and a
proposed new bank to be located in Page, North Dakota, at the site of the Hope bank’s paying and receiving station. Hope and Page are 14 miles apart and each serves a strictly agricultural area.
The effect of the transaction will be to supplant the limited power station by a full service bank to be capitalized by a spin-off of capital funds from the Hope bank offset by the transfer of certain assets and deposits to the proposed new bank. The number of banking facilities in the area will not be diminished and there will be no elimination of competition. The concentration of banking resources will be decreased by the acquisition and assumption transaction and no adverse effects on over-all competition are apparent.
The State authority in recent months has instituted a program of bringing the operation of banking stations into conformity with State law which does not permit stations to make and service loans. The station at Page has been granting loans, and enforcement of the program will curtail its services to the community while the proposed new bank, which will be under similar management and control as the station, will have full banking authority.
The proposed transaction will have no unfavorable competitive effects but will insure continuation of full banking service in the Page area and is concluded to be in the public interest.
Digitized for FRASER http://fraser.stlouisfed.org/ Federal Reserve Bank of St. Louis
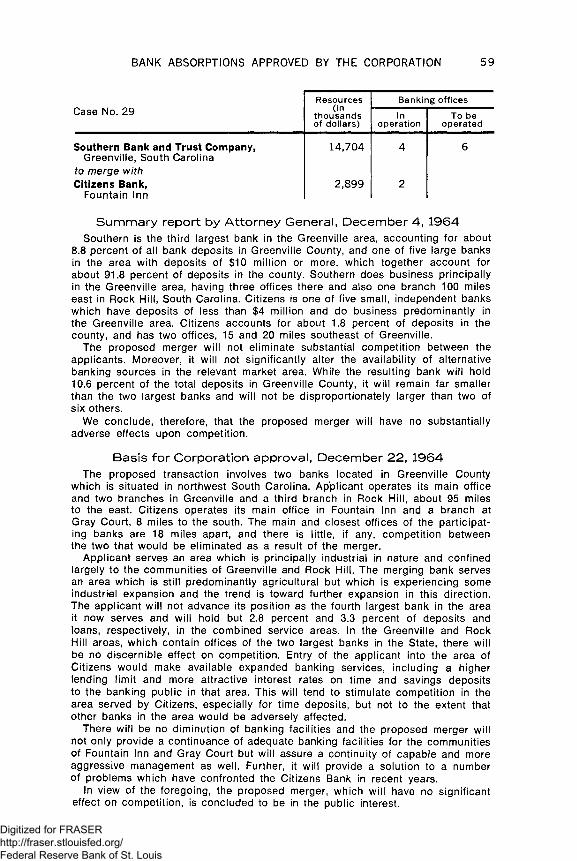
BANK ABSORPTIONS APPROVED BY THE CORPORATION 59
Case No. 29Resources
(inthousands of dollars)
Banking offices
Inoperation
To be operated
Southern Bank and Trust Company,Greenville, South Carolina
to merge with
14,704 4 6
Citizens Bank,Fountain Inn
2,899 2
Sum m ary report by A ttorney General, Decem ber 4, 1964Southern is the third largest bank in the Greenville area, accounting for about
8.8 percent of all bank deposits in Greenville County, and one of five large banks in the area with deposits of $10 million or more, which together account for about 91.8 percent of deposits in the county. Southern does business principally in the Greenville area, having three offices there and also one branch 100 miles east in Rock Hill, South Carolina. Citizens is one of five small, independent banks which have deposits of less than $4 million and do business predominantly in the Greenville area. Citizens accounts for about 1.8 percent of deposits in the county, and has two offices, 15 and 20 miles southeast of Greenville.
The proposed merger will not eliminate substantial competition between the applicants. Moreover, it will not significantly alter the availability of alternative banking sources in the relevant market area. While the resulting bank will hold 10.6 percent of the total deposits in Greenville County, it will remain far smaller than the two largest banks and will not be disproportionately larger than two of six others.
We conclude, therefore, that the proposed merger will have no substantially adverse effects upon competition.
Basis for Corporation approval, Decem ber 22 , 1964The proposed transaction involves two banks located in Greenville County
which is situated in northwest South Carolina. Applicant operates its main office and two branches in Greenville and a third branch in Rock Hill, about 95 miles to the east. Citizens operates its main office in Fountain Inn and a branch at Gray Court, 8 miles to the south. The main and closest offices of the participating banks are 18 miles apart, and there is little, if any, competition between the two that would be eliminated as a result of the merger.
Applicant serves an area which is principally industrial in nature and confined largely to the communities of Greenville and Rock Hill. The merging bank serves an area which is still predominantly agricultural but which is experiencing some industrial expansion and the trend is toward further expansion in this direction. The applicant will not advance its position as the fourth largest bank in the area it now serves and will hold but 2.8 percent and 3.3 percent of deposits and loans, respectively, in the combined service areas. In the Greenville and Rock Hill areas, which contain offices of the two largest banks in the State, there will be no discernible effect on competition. Entry of the applicant into the area of Citizens would make available expanded banking services, including a higher lending limit and more attractive interest rates on time and savings deposits to the banking public in that area. This will tend to stimulate competition in the area served by Citizens, especially for time deposits, but not to the extent that other banks in the area would be adversely affected.
There will be no diminution of banking facilities and the proposed merger will not only provide a continuance of adequate banking facilities for the communities of Fountain Inn and Gray Court but will assure a continuity of capable and more aggressive management as well. Further, it will provide a solution to a number of problems which have confronted the Citizens Bank in recent years.
In view of the foregoing, the proposed merger, which will have no significant effect on competition, is concluded to be in the public interest.
Digitized for FRASER http://fraser.stlouisfed.org/ Federal Reserve Bank of St. Louis
60 FEDERAL DEPOSIT INSURANCE CORPORATION
1 Unless otherwise indicated, the first named bank is a resulting insured nonmember bank. Cases are listed in chronological order of determination.
2 Prior to this transaction the Continental Illinois National Bank and Trust Company of Chicago was operating 1 office in the United States (States and other areas). FDIC statistics do not include offices in foreign countries.
3 Corporation approval is required for absorption of a noninsured bank or institution by an insured bank. In Case No. 1, absorption is by a national bank; in Case No. 26, absorbing bank is a State bank member of the Federal Reserve System.
4 Fidelity-Bankers Trust Company, a noninsured institution, also applied for admission to Federal deposit insurance effective simultaneously with consummation of the merger.
5 Deposits in branch being absorbed.6 Branch only is being absorbed. First State Bank of Hope will continue to
operate its main office.
Digitized for FRASER http://fraser.stlouisfed.org/ Federal Reserve Bank of St. Louis
LEGISLATION
AND REGULATIONS
P A R T T W O
Digitized for FRASER http://fraser.stlouisfed.org/ Federal Reserve Bank of St. Louis

Digitized for FRASER http://fraser.stlouisfed.org/ Federal Reserve Bank of St. Louis
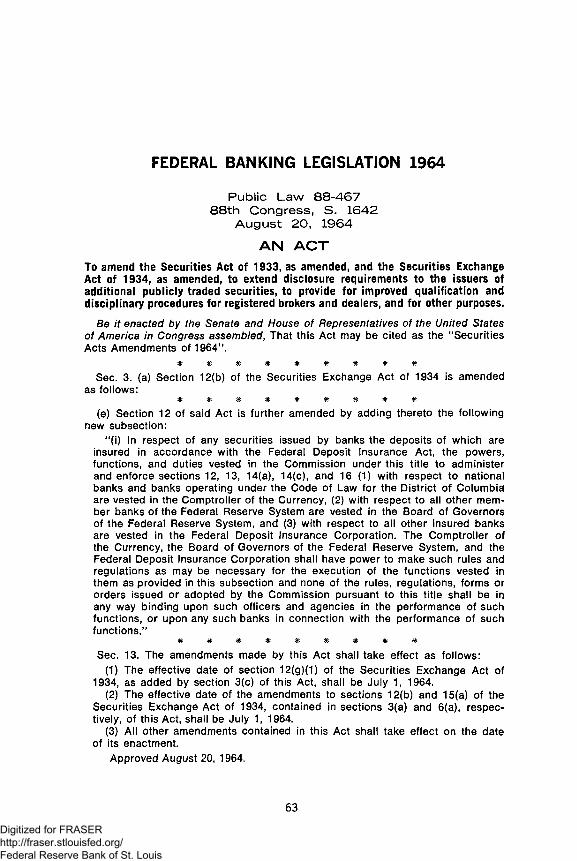
FEDERAL BANKING LEGISLATION 1964
Public Law 8 8 -4 6 7 8 8 th Congress, S. 1642
A ugust 20 , 1964
AN ACTTo amend the Securities Act of 1933y as amended, and the Securities Exchange Act of 1934, as amended, to extend disclosure requirements to the issuers of additional publicly traded securities, to provide for improved qualification and disciplinary procedures for registered brokers and dealers, and for other purposes.
Be it enacted by the Senate and House of Representatives of the United States of America in Congress assembled, That this Act may be cited as the “ Securities Acts Amendments of 1964” .
# # # # # # # # #Sec. 3. (a) Section 12(b) of the Securities Exchange Act of 1934 is amended
as follows:# # # # # # * # #
(e) Section 12 of said Act is further amended by adding thereto the following new subsection:
“ (i) In respect of any securities issued by banks the deposits of which are insured in accordance with the Federal Deposit Insurance Act, the powers, functions, and duties vested in the Commission under this title to administer and enforce sections 12, 13, 14(a), 14(c), and 16 (1) with respect to national banks and banks operating under the Code of Law for the District of Columbia are vested in the Comptroller of the Currency, (2) with respect to all other member banks of the Federal Reserve System are vested in the Board of Governors of the Federal Reserve System, and (3) with respect to all other insured banks are vested in the Federal Deposit Insurance Corporation. The Comptroller of the Currency, the Board of Governors of the Federal Reserve System, and the Federal Deposit Insurance Corporation shall have power to make such rules and regulations as may be necessary for the execution of the functions vested in them as provided in this subsection and none of the rules, regulations, forms or orders issued or adopted by the Commission pursuant to this title shall be in any way binding upon such officers and agencies in the performance of such functions, or upon any such banks in connection with the performance of such functions.”
# # # # # * # # *Sec. 13. The amendments made by this Act shall take effect as follows:
(1) The effective date of section 12(g)(1) of the Securities Exchange Act of 1934, as added by section 3(c) of this Act, shall be July 1, 1964.
(2) The effective date of the amendments to sections 12(b) and 15(a) of the Securities Exchange Act of 1934, contained in sections 3(a) and 6(a), respectively, of this Act, shall be July 1, 1964.
(3) All other amendments contained in this Act shall take effect on the date of its enactment.
Approved August 20, 1964.
63
Digitized for FRASER http://fraser.stlouisfed.org/ Federal Reserve Bank of St. Louis
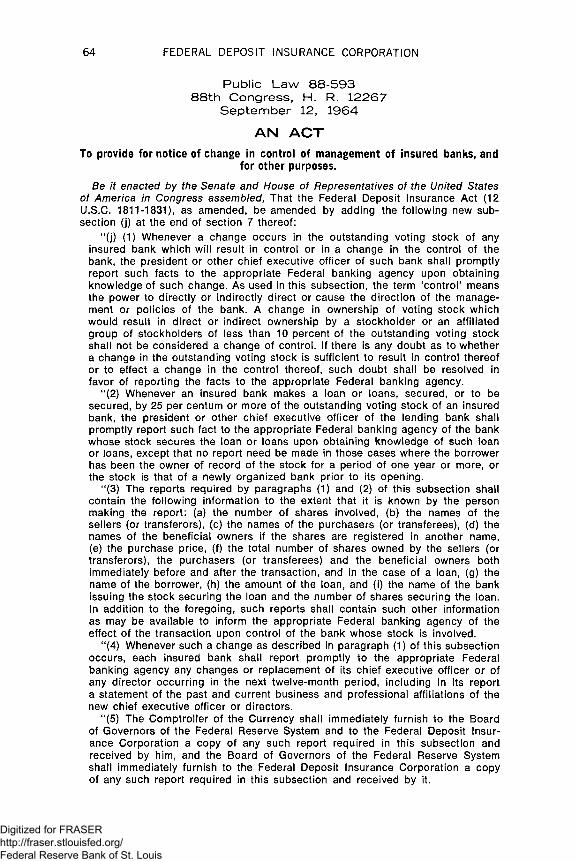
64 FEDERAL DEPOSIT INSURANCE CORPORATION
Public Law 8 8 -5 9 3 8 8 th Congress, H. R. 12267
Septem ber 12, 1964
AN ACTTo provide for notice of change in control of management of insured banks, and
for other purposes.
Be it enacted by the Senate and House of Representatives of the United States of America in Congress assembled, That the Federal Deposit Insurance Act (12 U.S.C. 1811-1831), as amended, be amended by adding the following new subsection (j) at the end of section 7 thereof:
“ (j) (1) Whenever a change occurs in the outstanding voting stock of any insured bank which will result in control or in a change in the control of the bank, the president or other chief executive officer of such bank shall promptly report such facts to the appropriate Federal banking agency upon obtaining knowledge of such change. As used in this subsection, the term ‘control’ means the power to directly or indirectly direct or cause the direction of the management or policies of the bank. A change in ownership of voting stock which would result in direct or indirect ownership by a stockholder or an affiliated group of stockholders of less than 10 percent of the outstanding voting stock shall not be considered a change of control. If there is any doubt as to whether a change in the outstanding voting stock is sufficient to result in control thereof or to effect a change in the control thereof, such doubt shall be resolved in favor of reporting the facts to the appropriate Federal banking agency.
“ (2) Whenever an insured bank makes a loan or loans, secured, or to be secured, by 25 per centum or more of the outstanding voting stock of an insured bank, the president or other chief executive officer of the lending bank shall promptly report such fact to the appropriate Federal banking agency of the bank whose stock secures the loan or loans upon obtaining knowledge of such loan or loans, except that no report need be made in those cases where the borrower has been the owner of record of the stock for a period of one year or more, or the stock is that of a newly organized bank prior to its opening.
“ (3) The reports required by paragraphs (1) and (2) of this subsection shall contain the following information to the extent that it is known by the person making the report: (a) the number of shares involved, (b) the names of the sellers (or transferors), (c) the names of the purchasers (or transferees), (d) the names of the beneficial owners if the shares are registered in another name, (e) the purchase price, (f) the total number of shares owned by the sellers (or transferors), the purchasers (or transferees) and the beneficial owners both immediately before and after the transaction, and in the case of a loan, (g) the name of the borrower, (h) the amount of the loan, and (i) the name of the bank issuing the stock securing the loan and the number of shares securing the loan. In addition to the foregoing, such reports shall contain such other information as may be available to inform the appropriate Federal banking agency of the effect of the transaction upon control of the bank whose stock is involved.
“ (4) Whenever such a change as described in paragraph (1) of this subsection occurs, each insured bank shall report promptly to the appropriate Federal banking agency any changes or replacement of its chief executive officer or of any director occurring in the next twelve-month period, including in its report a statement of the past and current business and professional affiliations of the new chief executive officer or directors.
“ (5) The Comptroller of the Currency shall immediately furnish to the Board of Governors of the Federal Reserve System and to the Federal Deposit Insurance Corporation a copy of any such report required in this subsection and received by him, and the Board of Governors of the Federal Reserve System shall immediately furnish to the Federal Deposit Insurance Corporation a copy of any such report required in this subsection and received by it.
Digitized for FRASER http://fraser.stlouisfed.org/ Federal Reserve Bank of St. Louis
FEDERAL BANKING LEGISLATION 65
“ (6) As used in this section, the term ‘appropriate Federal banking agency’ shall mean (a) the Comptroller of the Currency in the case of a national banking association or a district bank, (b) the Board of Governors of the Federal Reserve System in the case of a State member insured bank (except a district bank), and (c) the Federal Deposit Insurance Corporation in the case of a State nonmember insured bank (except a district bank).”
Approved September 12, 1964.
Public Law 88-341 8 8 th Congress, H. R. 8 2 3 0
June 3 0 , 1964
AN ACTTo amend section 24 of the Federal Reserve Act (12 U.S.C. 371) to liberalize the
conditions of loans by national banks on forest tracts.
Be it enacted by the Senate and House of Representatives of the United States of America in Congress assembled, That the second paragraph of section 24 of the Federal Reserve Act (12 U.S.C. 371) is amended to read:
“ Any national banking association may make real estate loans secured by first liens upon forest tracts which are properly managed in all respects. Such loans shall be in the form of an obligation or obligations secured by mortgage, trust deed, or other such instrument; and any national banking association may purchase any obligation so secured when the entire amount of such obligation is sold to the association. The amount of any such loan shall not exceed 60 per centum of the appraised fair market value of the growing timber, lands, and improvements thereon offered as security and the loan shall be made upon such terms and conditions as to assure that at no time shall the loan balance exceed 60 per centum of the original appraised total value of the property then remaining. No such loan shall be made for a longer term than three years; except that any such loan may be made for a term not longer than fifteen years if the loan is secured by an amortized mortgage, deed of trust, or other such instrument under the terms of which the installment payments are sufficient to amortize the principal of the loan within a period of not more than fifteen years and at a rate of at least 6% per centum per annum. All such loans secured by first liens upon forest tracts shall be included in the permissible aggregate of all real estate loans prescribed in the preceding paragraph, but no national banking association shall make forest-tract loans in an aggregate sum in excess of 50 per centum of its capital stock paid in and unimpaired plus 50 per centum of its unimpaired surplus fund.”
Approved June 30, 1964.
Public Law 8 8 -5 6 0 8 8th Congress, S. 3 0 4 9
Septem ber 2, 1964
AN ACTTo extend and amend laws relating to housing, urban renewal, and community
facilities, and for other purposes.
Be it enacted by the Senate and House of Representatives of the United States of America in Congress assembled, That this Act may be cited as the “ Housing Act of 1964” .
TITLE X— MISCELLANEOUS
Digitized for FRASER http://fraser.stlouisfed.org/ Federal Reserve Bank of St. Louis
6 6 FEDERAL DEPOSIT INSURANCE CORPORATION
# # # # # * # # #R E A L E S T A T E L O A N S B Y N A T IO N A L B A N K S
Sec. 1004. Clause (3) of the third sentence of the first paragraph of section 24 of the Federal Reserve Act is amended to read as follows:
“ (3) any such loan may be made in an amount not to exceed 80 per centum of the appraised value of the real estate offered as security and for a term not longer than twenty-five years if the loan is secured by an amortized mortgage, deed of trust, or other such instrument under the terms of which the installment payments are sufficient to amortize the entire principal of the loan within the period ending on the date of its maturity, and” .
# # # # # # # # #
Approved September 2, 1964.
RULES AND REGULATIONS OF THE CORPORATIONTITLE 12— BANKS AND BANKING
CHAPTER III— FEDERAL DEPOSIT INSURANCE CORPORATIONPART 329— PAYMENT OF DEPOSITS AND INTEREST THEREON
BY INSURED NONMEMBER BANKS
§ 329.6 Maximum rates 12 of interest payable on time and savings deposits by insured non member banks— (a) Maximum rate of 4Vz percent.
No insured nonmember bank shall pay interest accruing at a rate in excess of 41/2 percent per annum, compounded quarterly 13 regardless of the basis upon which such interest may be computed, on any time deposit having a maturity date 90 days or more after the date of deposit or payable upon written notice of 90 days or more.
(b) Maximum rate of 4 percent. No insured nonmember bank shall pay interest accruing at a rate in excess of 4 percent per annum, compounded quarterly,13 regardless of the basis upon which such interest may be computed:
(1) On any savings deposit, or(2) On any time deposit having a maturity date less than 90 days after the
date of deposit or payable upon written notice of less than 90 days. EffectiveNov. 24, 1964 (Sec. 9, 64 Stat. 881; 12 U.S.C. 1819. Interprets or applies Sec. 18, 64 Stat. 891; 12 U.S.C. 1828). [F.R. Doc. 64-12135; Filed Nov. 30, 1964, 8:45 a.m., 29 F.R. 15944]
i2The maximum rates of interest payable by insured nonmember banks on tim e and savings deposits as prescribed herein are not applicable to any deposit which is payable only at an office of an insured nonmember bank located outside of the States of the United States and the District of Columbia.
I3 This lim itation is not to be interpreted as preventing the compounding of interest at other than quarterly intervals: Provided, That the aggregate amount of such interest so compounded does not exceed the aggregate amount of interest at the rate above prescribed when compounded quarterly.
IN T E R P R E T A T IO NThe question has been raised as to the maximum rate of interest payable under
revised section 329.6 of the Corporation’s rules and regulations on savings deposits that had remained in a bank less than twelve months prior to November 24, 1964, the effective date of the revised section. New maximum rates are not retroactive. Consequently, a savings deposit that has remained on deposit for less than twelve months prior to November 24, 1964, may bear interest at a rate not exceeding 4 percent only for the period beginning with such date and at a rate not in excess of 31/2 percent for the period prior to such date, except that if and when a savings deposit, which was in the bank prior to November 24, 1964, has remained in the bank for a full twelve-month period, interest may be adjusted to provide for a yield not in excess of 4 percent from the date of deposit.
Digitized for FRASER http://fraser.stlouisfed.org/ Federal Reserve Bank of St. Louis
RULES AND REGULATIONS OF THE CORPORATION 67
PART 330— RECOGNITION OF DEPOSIT OWNERSHIP NOT ON BANKRECORDS
Sec. 330.4— Deposits in Custodial Accounts
IN T E R P R E T A T IO N§ 330.401 Recognition of deposit ownership in custodial accounts. The opinion
of the Board of Directors has been requested as to whether a fractional or percentage computation of the interests of beneficial owners of commingled funds on deposit in custodial accounts in banks insured by the Federal Deposit Insurance Corporation meets the requirements of section 330.4 of the Corporation’s rules and regulations.
Section 330.4 provides that if the name and interest of an owner of any portion of a specifically designated custodial deposit is disclosed on the records of the person in whose name the deposit is maintained and such records are maintained in good faith and in the regular course of business, such owner will be recognized for all purposes of claim for insured deposits to the same extent as if his name and interest were disclosed on the records of the bank.
Heretofore, section 330.4 has been interpreted to mean that where a portion of commingled funds, held in custody by a depositor for the benefit of various beneficiaries, is deposited in one or more insured banks, the exact interest, in dollars and cents, of each beneficial owner must, at all times, be shown on the records of the depositor and that such interest could not be computed on a fractional or percentage basis.
The Board of Directors has concluded that, if the records of the depositor, maintained in good faith and in the regular course of business, reflect, at all times, the name and ascertainable interest of each beneficial owner in a specifically designated custodial deposit, such interest may be determined on a fractional or percentage basis and each beneficial interest shall be separately insured. This may be accomplished in any manner which indicates that where the funds of a beneficial owner are commingled with other funds held in custody and a portion thereof is placed on deposit in one or more insured banks, his interest in a custodial deposit in any one insured bank would represent at any given time the same fractional share as his share of the total commingled funds. (Sec. 9, 64 Stat. 881, 12 U.S.C. 1819. Interpret or apply Sec. 12, 64 Stat. 887, 12 U.S.C. 1822) [F.R. Doc. 64-4553; Filed, May 6, 1964, 8:45 a.m.; 29 F.R. 6003]
PART 335— SECURITIES OF INSURED STATE NONMEMBER BANKSNOTE: On December 31, 1964 the Board of Directors of the Corporation
adopted a new Part 335 to the Corporation’s Rules and Regulations. This new Part, which became effective January 1, 1965, prescribes rules and regulations governing the issuance of securities issued by insured State banks which are not members of the Federal Reserve System. These regulations were issued under the authority of Public Law 88-467 of the 88th Congress, 2d session and were published in the Federal Register of January 12, 1965.
STATE BANKING LEGISLATION 1964In 1964, the legislatures of 22 States held regular sessions and seven held
special sessions. Some of the more important State banking legislation enacted during 1964 is summarized below on a State-by-State basis.
A L A B A M A (Special Session)Authority for certain banks to establish branches based upon Act 24amount of capital stock and population of county location of SB 107— XXXbank ___________________________________________________ HB 160— XXX
HB 238— XXX
Digitized for FRASER http://fraser.stlouisfed.org/ Federal Reserve Bank of St. Louis
6 8 FEDERAL DEPOSIT INSURANCE CORPORATION
A L A S K A (R e g u la r S e s s io n )Authorization of trust company to establish common trust fund Ch. 14for self-investment _______________________________________ HB 174Nominees of banks permitted to hold investments of banks acting Ch. 25in a fiduciary capacity ___________________________________ HB 175Federally-chartered banks and savings and loan associations Ch. 71exempt from net income tax ______________________________ SB 288Restrictions on banking interests of State banking officers Ch. 86and employees __________________________________________ SB 316
A R IZ O N A (R e g u la r S e s s io n )Conditions and effect of issuance, conversion and retirement of Ch. 41capital notes and debentures ______________________________ HB 230Bonus plan restrictions upon savings and loan associations___ HB 337Furnishing of bond, securities, or safekeeping receipt by banks Ch. 82receiving deposits ________________________________________ SB 158
C A L IF O R N IA (R e g u la r S e s s io n )Acceptance of deposits by foreign banks____________________ Ch. 37
HB 21— XTaxation of banks, corporations, associations and MassachusettsTrusts __________________________________________________ SB 70— X
G E O R G IA (R e g u la r S e s s io n )Legal status and nonliability of fiduciary under certain Act 732conditions ______________________________________________ HB 542Application for renewal of bank charter ___________________ Ch. 547
HB 787Legal investments for trust funds of savings and loan Act 664associations ___________________________________________ HB 795“ Industrial Loan Act of 1964” ______________________________ Act 758
HB 949Fees for application for bank charter _______________________ Act 978
SB 71
K E N T U C K Y (R e g u la r S e ss io n )Time and attendance of meetings of credit union members____ HB 140Establishment of Industrial Finance A uthority_________________ SB 207Settlement of estates of contested value ____________________ SB 27Establishment of Savings and Loan Association Act _________ SB 244Filing exclusion of certain security interests _________________ SB 143Constructive knowledge of certain financing transactions bycustodian bank __________________________________________ SB 212
L O U IS IA N A (R e g u la r S e s s io n )
Authorization of deposit of shares of savings and loan association Act 279into cemetery trust funds _________________________________ HB 589Saturday as a banking ho liday_____________________________ Act 250
SB 279Authority of State Market Commission to make and participate Act 298in loans ________________________________________________ HB 909Restrictions on loans by State building and loan associationsand Federal savings and loan associations relative to security Act 348and purpose of loan _____________________________________ HB 584
Digitized for FRASER http://fraser.stlouisfed.org/ Federal Reserve Bank of St. Louis
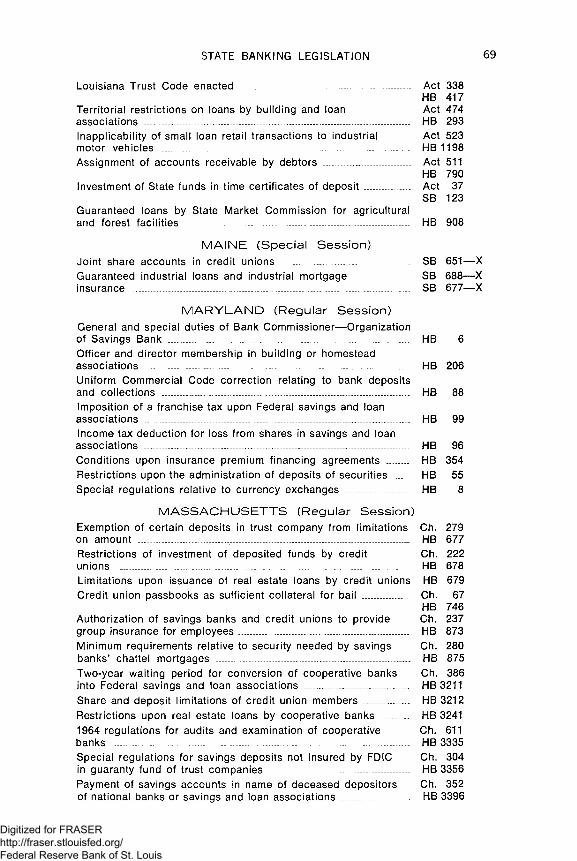
STATE BANKING LEGISLATION 69
Louisiana Trust Code enacted _____________________________ Act 338HB 417
Territorial restrictions on loans by building and loan Act 474associations _____________________________________________ HB 293Inapplicability of small loan retail transactions to industrial Act 523motor vehicles __________________________________________ HB1198Assignment of accounts receivable by debtors _______________ Act 511
HB 790Investment of State funds in time certificates of deposit_______ Act 37
SB 123Guaranteed loans by State Market Commission for agriculturaland forest facilities ______________________________________ HB 908
M A IN E (S p e c ia l S e s s io n )
Joint share accounts in credit unions _____________ SB 651— XGuaranteed industrial loans and industrial mortgage SB 688— Xinsurance _______________________________________________ SB 677— X
M A R Y L A N D (R e g u la r S e s s io n )
General and special duties of Bank Commissioner— Organizationof Savings Bank _________________________________________ HB 6Officer and director membership in building or homesteadassociations _____________________________________________ HB 206Uniform Commercial Code correction relating to bank depositsand collections __________________________________________ HB 88Imposition of a franchise tax upon Federal savings and loanassociations _____________________________________________ HB 99Income tax deduction for loss from shares in savings and loanassociations ________________________ _____________________ HB 96Conditions upon insurance premium financing agreements ___ HB 354Restrictions upon the administration of deposits of securities__ HB 55Special regulations relative to currency exchanges __________ HB 8
M A S S A C H U S E T T S (R e g u la r S e s s io n )Exemption of certain deposits in trust company from limitations Ch. 279on amount _______________ ______________________________ HB 677Restrictions of investment of deposited funds by credit Ch. 222unions _________________________________________________ HB 678Limitations upon issuance of real estate loans by credit unions HB 679Credit union passbooks as sufficient collateral for bail _______ Ch. 67
HB 746Authorization of savings banks and credit unions to provide Ch. 237group insurance for employees_____________________________ HB 873Minimum requirements relative to security needed by savings Ch. 280banks’ chattel mortgages _________________________________ HB 875Two-year waiting period for conversion of cooperative banks Ch. 386into Federal savings and loan associations __________________ HB3211Share and deposit limitations of credit union members _______ HB3212Restrictions upon real estate loans by cooperative banks ____ HB 32411964 regulations for audits and examination of cooperative Ch. 611banks __________________________________________________ HB 3335Special regulations for savings deposits not insured by FDIC Ch. 304in guaranty fund of trust companies ________________________ HB 3356Payment of savings accounts in name of deceased depositors Ch. 352of national banks or savings and loan associations____________ HB 3396
Digitized for FRASER http://fraser.stlouisfed.org/ Federal Reserve Bank of St. Louis
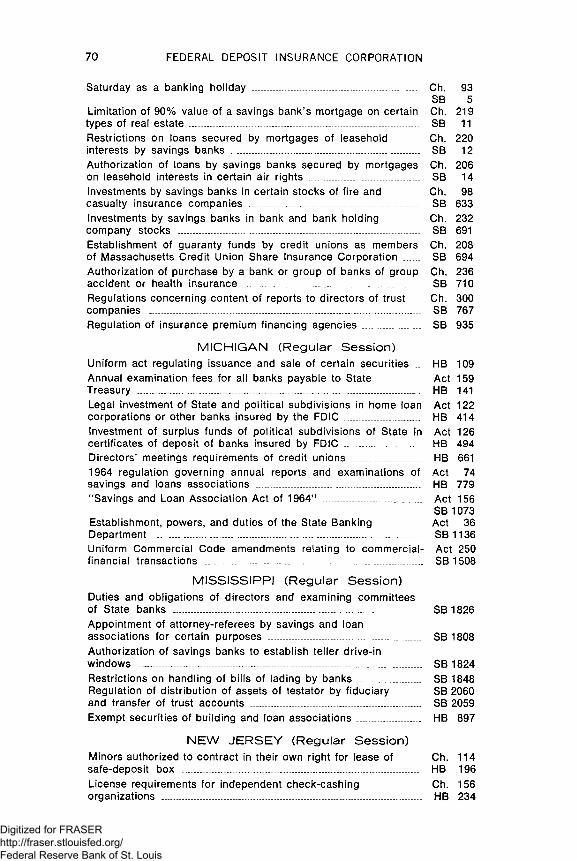
70 FEDERAL DEPOSIT INSURANCE CORPORATION
Saturday as a banking holiday ____________________________ Ch. 93SB 5
Limitation of 90% value of a savings bank’s mortgage on certain Ch. 219types of real esta te_______________________________________ SB 11Restrictions on loans secured by mortgages of leasehold Ch. 220interests by savings banks ________________________________ SB 12Authorization of loans by savings banks secured by mortgages Ch. 206on leasehold interests in certain air r ig h ts___________________ SB 14Investments by savings banks in certain stocks of fire and Ch. 98casualty insurance companies _____________________________ SB 633Investments by savings banks in bank and bank holding Ch. 232company stocks _________________________________________ SB 691Establishment of guaranty funds by credit unions as members Ch. 208of Massachusetts Credit Union Share Insurance Corporation __ SB 694Authorization of purchase by a bank or group of banks of group Ch. 236accident or health insurance ______________________________ SB 710Regulations concerning content of reports to directors of trust Ch. 300companies ______________________________________________ SB 767Regulation of insurance premium financing agencies_________ SB 935
M IC H IG A N (R e g u la r S e s s io n )
Uniform act regulating issuance and sale of certain securities.— HB 109Annual examination fees for all banks payable to State Act 159Treasury __________________________________________ _____ HB 141Legal investment of State and political subdivisions in home loan Act 122corporations or other banks insured by the FD IC _____________ HB 414Investment of surplus funds of political subdivisions of State in Act 126certificates of deposit of banks insured by FDIC _____________ HB 494Directors’ meetings requirements of credit unions ____________ HB 6611964 regulation governing annual reports and examinations of Act 74savings and loans associations ____________________________ HB 779“ Savings and Loan Association Act of 1964” _____ ____________ Act 156
SB 1073Establishment, powers, and duties of the State Banking Act 36Department ______________________ ______________________ SB 1136Uniform Commercial Code amendments relating to commercial- Act 250financial transactions _____________________________________ SB 1508
M IS S IS S IP P I (R e g u la r S e s s io n )
Duties and obligations of directors and examining committeesof State banks __________________________________________ SB 1826Appointment of attorney-referees by savings and loanassociations for certain purposes __________________________ SB 1808Authorization of savings banks to establish teller drive-inwindows __________ _____ ________________________________ SB 1824Restrictions on handling of bills of lading by banks__________ SB 1848Regulation of distribution of assets of testator by fiduciary SB 2060and transfer of trust accounts ____________________________ SB 2059Exempt securities of building and loan associations ___________ HB 897
N E W J E R S E Y (R e g u la r S e s s io n )
Minors authorized to contract in their own right for lease of Ch. 114safe-deposit box _________________ ______________________ HB 196License requirements for independent check-cashing Ch. 156organizations ____________________________________________ HB 234
Digitized for FRASER http://fraser.stlouisfed.org/ Federal Reserve Bank of St. Louis
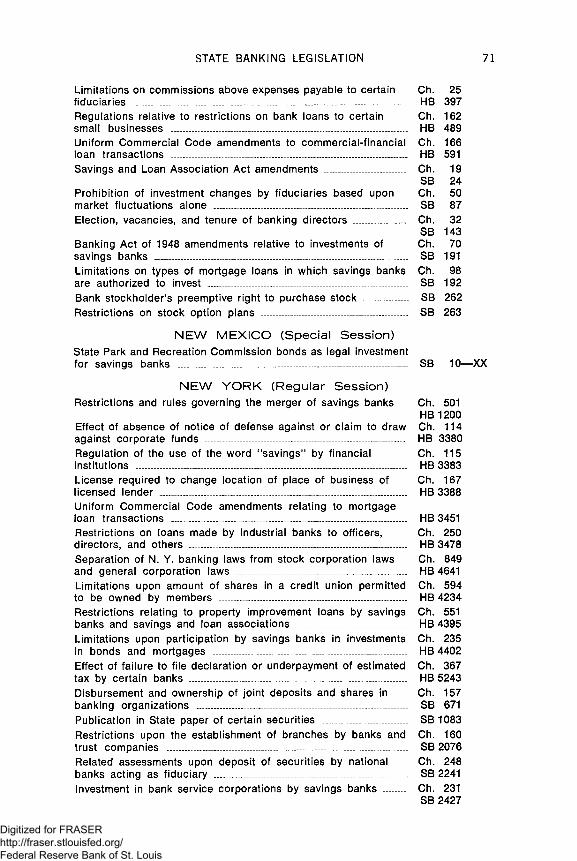
Limitations on commissions above expenses payable to certain Ch. 25fiduciaries ______________________________________________ HB 397Regulations relative to restrictions on bank loans to certain Ch. 162small businesses ________________________________________ HB 489Uniform Commercial Code amendments to commercial-financial Ch. 166loan transactions ________________________________________ HB 591Savings and Loan Association Act amendments______________ Ch. 19
SB 24Prohibition of investment changes by fiduciaries based upon Ch. 50market fluctuations alone _________________________________ SB 87Election, vacancies, and tenure of banking directors _________ Ch. 32
SB 143Banking Act of 1948 amendments relative to investments of Ch. 70savings banks ___________________________________________ SB 191Limitations on types of mortgage loans in which savings banks Ch. 98are authorized to invest __________________________________ SB 192Bank stockholder’s preemptive right to purchase s to ck_______ SB 262Restrictions on stock option plans _________________________ SB 263
N E W M E X IC O (S p e c ia l S e s s io n )State Park and Recreation Commission bonds as legal investmentfor savings banks _______________________________________ SB 10— XX
N E W Y O R K (R e g u la r S e s s io n )Restrictions and rules governing the merger of savings banks Ch. 501
HB 1200Effect of absence of notice of defense against or claim to draw Ch. 114against corporate funds __________________________________ HB 3380Regulation of the use of the word “ savings” by financial Ch. 115institutions ______________________________________________ HB 3383License required to change location of place of business of Ch. 167licensed lender __________________________________________ HB 3388Uniform Commercial Code amendments relating to mortgageloan transactions ________________________________________ HB 3451Restrictions on loans made by industrial banks to officers, Ch. 250directors, and others ________________ ____________________ HB 3478Separation of N. Y. banking laws from stock corporation laws Ch. 849and general corporation laws _____________________________ HB 4641Limitations upon amount of shares in a credit union permitted Ch. 594to be owned by members ________________________________ HB 4234Restrictions relating to property improvement loans by savings Ch. 551banks and savings and loan associations ___________________ HB 4395Limitations upon participation by savings banks in investments Ch. 235in bonds and mortgages _________________________________ HB 4402Effect of failure to file declaration or underpayment of estimated Ch. 367tax by certain banks _____________________________________ HB 5243Disbursement and ownership of joint deposits and shares in Ch. 157banking organizations ____________________________________ SB 671Publication in State paper of certain securities_______________ SB 1083Restrictions upon the establishment of branches by banks and Ch. 160trust companies _________________________________________ SB 2076Related assessments upon deposit of securities by national Ch. 248banks acting as fiduciary _________________________________ SB 2241Investment in bank service corporations by savings banks ___ Ch. 231
SB 2427
STATE BANKING LEGISLATION 71
Digitized for FRASER http://fraser.stlouisfed.org/ Federal Reserve Bank of St. Louis
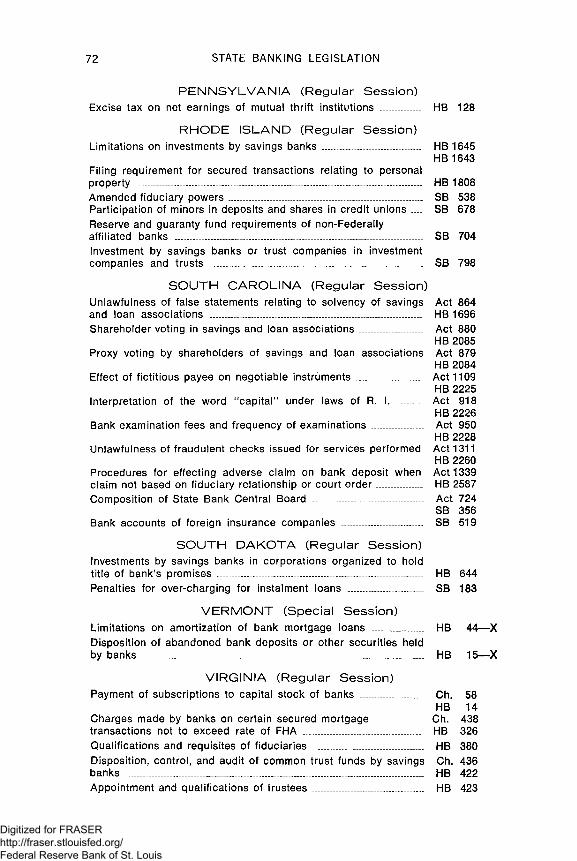
72 STATE BANKING LEGISLATION
P E N N S Y L V A N IA (R e g u la r S e s s io n )Excise tax on net earnings of mutual thrift institutions ___ HB 128
R H O D E IS L A N D (R e g u la r S e s s io n )
Limitations on investments by savings banks_________________ HB 1645HB 1643
Filing requirement for secured transactions relating to personalproperty _____________________ __________________________ HB1808Amended fiduciary powers_________________________________ SB 538Participation of minors in deposits and shares in credit unions .... SB 678 Reserve and guaranty fund requirements of non-Federallyaffiliated banks __________________________________________ SB 704Investment by savings banks or trust companies in investmentcompanies and trusts ____________________________________ SB 798
S O U T H C A R O L IN A (R e g u la r S e s s io n )
Unlawfulness of false statements relating to solvency of savings Act 864and loan associations ____________________________________ HB1696Shareholder voting in savings and loan associations___________ Act 880
HB 2085Proxy voting by shareholders of savings and loan associations Act 879
HB 2084Effect of fictitious payee on negotiable instruments___________ Act 1109
HB 2225Interpretation of the word “ capital” under laws of R. I. ___ Act 918
HB 2226Bank examination fees and frequency of examinations_________ Act 950
HB 2228Unlawfulness of fraudulent checks issued for services performed Act 1311
HB 2260Procedures for effecting adverse claim on bank deposit when Act 1339claim not based on fiduciary relationship or court o rde r_______ HB 2587Composition of State Bank Central Board ___________________ Act 724
SB 356Bank accounts of foreign insurance companies ______________ SB 519
S O U T H D A K O T A (R e g u la r S e s s io n )Investments by savings banks in corporations organized to holdtitle of bank’s premises ___________________________________ HB 644Penalties for over-charging for instalment loans _____________ SB 183
V E R M O N T (S p e c ia l S e s s io n )
Limitations on amortization of bank mortgage loans ________ HB 44— XDisposition of abandoned bank deposits or other securities heldby banks________________________________________________ HB 15— X
V IR G IN IA (R e g u la r S e s s io n )
Payment of subscriptions to capital stock of banks__________ Ch. 58HB 14
Charges made by banks on certain secured mortgage Ch. 438transactions not to exceed rate of FHA ____________________ HB 326Qualifications and requisites of fiduciaries___________________ HB 380Disposition, control, and audit of common trust funds by savings Ch. 436banks __________________________________________________ HB 422Appointment and qualifications of trustees___________________ HB 423
Digitized for FRASER http://fraser.stlouisfed.org/ Federal Reserve Bank of St. Louis

Disposition and disbursement of abandoned funds by savingsbanks __________________________________________________ HB 425Limitations on loans secured by secondary lien on real property Ch. 150
HB 482Interest rates payable by banks on savings deposits___________ Ch. 486
HB 483Taxation of stock of bank holding companies_________________ Ch. 52
SB 39Savings and loan associations permitted to act as custodian Act 55under Uniform Gifts to Minors Act ________________________ SB 62Legal investments of savings and loan associations___________ Act 151
SB 160Uniform Commercial Code amendments relating to negotiable Ch. 314instruments _____________________________________________ SB 222Adoption of Uniform Commercial C ode______________________ Ch. 219
SB 1
STATE BANKING LEGISLATION
Digitized for FRASER http://fraser.stlouisfed.org/ Federal Reserve Bank of St. Louis

Digitized for FRASER http://fraser.stlouisfed.org/ Federal Reserve Bank of St. Louis

DEPOSIT ACCOUNTS AND
INSURANCE COVERAGE
P A RT T H R E E
Digitized for FRASER http://fraser.stlouisfed.org/ Federal Reserve Bank of St. Louis

Digitized for FRASER http://fraser.stlouisfed.org/ Federal Reserve Bank of St. Louis
INTRODUCTION
The survey of November 18, 1964, was the ninth request for special reports of deposits in all insured banks. These surveys have been made at irregular dates back to October 1, 1934, to aid the Corporation in estimating its liability in insuring bank deposits.
The 13,795 banks insured by the Federal Deposit Insurance Corporation on November 18, 1964 reported 175 million deposit accounts totaling $338 billion. Of these accounts, 97.2 percent had balances of $10,000 or less and, therefore, were fully protected by Federal deposit insurance. The amount of deposits insured in these accounts and in larger accounts in which the first $10,000 was covered by insurance totaled $184 billion, or 54.5 percent of all deposits in insured banks.1
Since the last previous comparable survey in 1955, the number of accounts in insured banks increased by 45 million, and the amount of deposits by $135 billion. Despite this growth and a signifi- cent increase in the average size of account, the proportion of accounts fully insured declined only slightly from the 1955 figure of98.2 percent. The percentage of total deposits covered by deposit insurance was also slightly below the 1955 level (55.1 percent).
ACCOUNTS AND DEPOSITS AT FOUR SPECIAL CALL DATES
Table 16 summarizes key data from four special calls at intervals of approximately a decade, dating back to the 1936 survey. Changes in the amounts and proportions of insured accounts between the 1945 and the 1955 calls were influenced primarily by the statutory increase in maximum insurance coverage from $5,000 to $10,000 per depositor enacted in 1950. Table 17 shows percentage changes in the number and average size of accounts and in the amount of total and insured deposits in insured banks during each of three periods.
While the number of insured banks has not changed significantly over the past three decades, dramatic increases have occurred in the number of bank accounts and in the amount of deposits. The 175 million bank accounts in 1964 were almost three times the number in 1936. Total deposits experienced a six-fold increase over the period and reached $337.5 billion. Deposits per capita rose from $354 in 1936 to $1,738 in 1964, a four-fold increase.
1 Deposits reported in the special deposit surveys differ slightly in concept from the legal definition of deposits applied by the Corporation when a bank is placed in receivership, and from deposits reported in the regular call reports of condition. These differences are explained in the Appendix at the end of this section.
77Digitized for FRASER http://fraser.stlouisfed.org/ Federal Reserve Bank of St. Louis
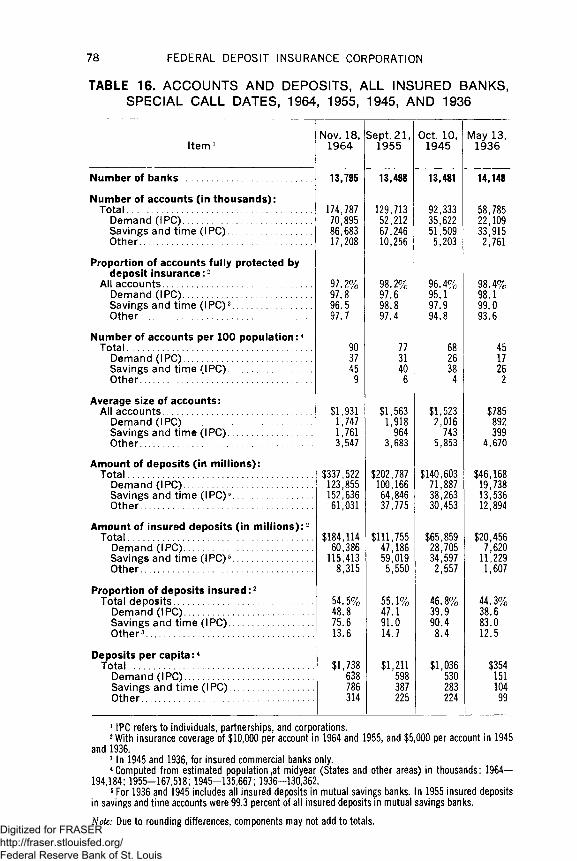
78 FEDERAL DEPOSIT INSURANCE CORPORATION
TABLE 16. ACCOUNTS AND DEPOSITS, ALL INSURED BANKS, SPECIAL CALL DATES, 1964, 1955, 1945, AND 1936
Item 1Nov. 18,
1964Sept. 21,
1955Oct. 10,
1945May 13,
1936
Number of banks............................................ 13,795 13,498 13,481 14,148
Number of accounts (in thousands):Total............................................................... 174,787 129,713 92,333 58,785
Demand (IPC)............................................ 70,895 52,212 35,622 22,109Savings and time (IPC)............................ 86,683 67,246 51,509 33,915Other.......................................................... 17,208 10,256 5,203 2,761
Proportion of accounts fully protected by deposit insurance:2
All accounts.................................................. 97.2% 98.2% 96.4% 98.4%Demand (IPC)........................................... 97.8 97.6 95.1 98.1Savings and time (IPC)3........................... 96.5 98.8 97.9 99.0Other.......................................................... 97.7 97.4 94.8 93.6
Number of accounts per 100 population:4Total............................................................... 90 77 68 45
Demand (IPC)........................................... 37 31 26 17Savings and time (IPC)............................ 45 40 38 26Other.......................................................... 9 6 4 2
Average size of accounts:All accounts.................................................. $1,931 $1,563 $1,523 $785
Demand (IPC)............................................ 1,747 1,918 2,016 892Savings and time (IPC)............................ 1,761 964 743 399Other.......................................................... 3,547 3,683 5,853 4,670
Amount of deposits (in millions):Total............................................................... $337,522 $202,787 $140,603 $46,168
Demand (IPC)............................................ 123,855 100,166 71,887 19,738Savings and time (IPC)5........................... 152,636 64,846 38,263 13,536Other.......................................................... 61,031 37,775 30,453 12,894
Amount of insured deposits (in millions):2Total............................................................... $184,114 $111,755 $65,859 $20,456
Demand (IPC)............................................ 60,386 47,186 28,705 7,620Savings and time (IPC)5........................... 115,413 59,019 34,597 11,229Other.......................................................... 8,315 5,550 2,557 1,607
Proportion of deposits insured:255.1% 44.3%Total deposits............................................... 54.5% 46.8%
Demand (IPC)............................................ 48.8 47.1 39.9 38.6Savings and time (IPC)............................ 75.6 91.0 90.4 83.0Other3......................................................... 13.6 14.7 8.4 12.5
Deposits per capita:4Total............................................................... $1,738 $1,211 $1,036 $354
Demand (IPC)............................................ 638 598 530 151Savings and time (IPC)............................ 786 387 283 104Other.......................................................... 314 225 224 99
11 IPC refers to individuals, partnerships, and corporations.2 With insurance coverage of $10,000 per account in 1964 and 1955, and $5,000 per account in 1945
and 1936.3 In 1945 and 1936, for insured commercial banks only.4 Computed from estimated population ,at midyear (States and other areas) in thousands: 1964—
194,184; 1955-167,518; 1945-135,667; 1936-130,362.5 For 1936 and 1945 includes all insured deposits in mutual savings banks. In 1955 insured deposits
in savings and time accounts were 99.3 percent of all insured deposits in mutual savings banks.
Note: Due to rounding differences, components may not add to totals.Digitized for FRASER http://fraser.stlouisfed.org/ Federal Reserve Bank of St. Louis
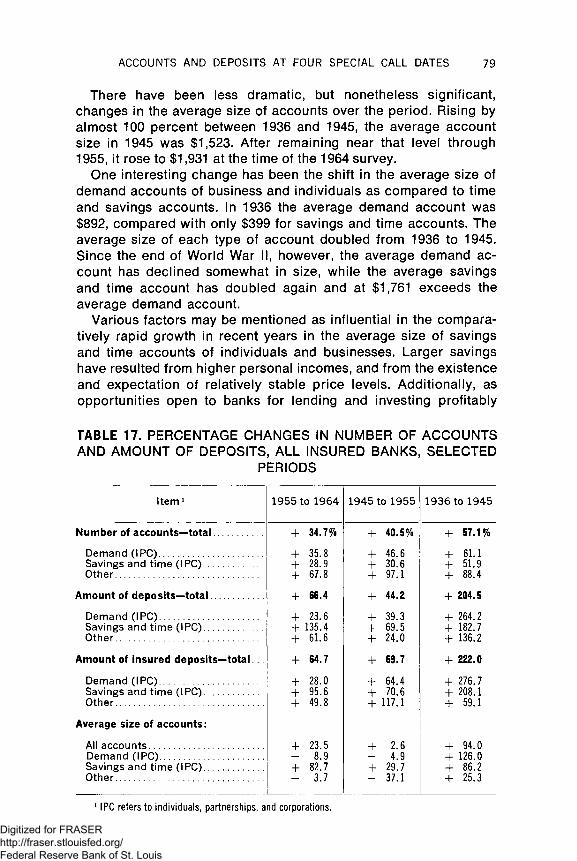
ACCOUNTS AND DEPOSITS AT FOUR SPECIAL CALL DATES 79
There have been less dramatic, but nonetheless significant, changes in the average size of accounts over the period. Rising by almost 100 percent between 1936 and 1945, the average account size in 1945 was $1,523. After remaining near that level through 1955, it rose to $1,931 at the time of the 1964 survey.
One interesting change has been the shift in the average size of demand accounts of business and individuals as compared to time and savings accounts. In 1936 the average demand account was $892, compared with only $399 for savings and time accounts. The average size of each type of account doubled from 1936 to 1945. Since the end of World War II, however, the average demand account has declined somewhat in size, while the average savings and time account has doubled again and at $1,761 exceeds the average demand account.
Various factors may be mentioned as influential in the comparatively rapid growth in recent years in the average size of savings and time accounts of individuals and businesses. Larger savings have resulted from higher personal incomes, and from the existence and expectation of relatively stable price levels. Additionally, as opportunities open to banks for lending and investing profitably
TABLE 17. PERCENTAGE CHANGES IN NUMBER OF ACCOUNTS AND AMOUNT OF DEPOSITS, ALL INSURED BANKS, SELECTED
PERIODS
Item 1 1955 to 1964 1945 to 1955 1936 to 1945
Number of accounts—total................ + 34.7% + 40.5% + 57.1%
Demand (IPC)................................... + 35.8 + 46.6 + 61.1Savings and time (IPC).................... + 28.9 + 30.6 + 51.9Other.................................................. + 67.8 + 97.1 + 88.4
Amount of deposits—total.................. + 66.4 + 44.2 + 204.5
Demand (IPC)................................... + 23.6 + 39.3 + 264.2Savings and time (IPC).................... + 135.4 + 69.5 + 182.7Other.................................................. + 61.6 + 24.0 + 136.2
Amount of insured deposits—total... + 64.7 + 69.7 + 222.0
Demand (IPC)................................... + 28.0 + 64.4 + 276.7Savings and time (IPC).................... + 95.6 + 70.6 + 208.1Other.................................................. + 49.8 + 117.1 + 59.1
Average size of accounts:
All accounts....................................... + 23.5 + 2.6 + 94.0Demand (IPC)................................... 8.9 4.9 + 126.0Savings and time (IPC).................... + 82.7 + 29.7 + 86.2Other.................................................. — 3.7 — 37.1 + 25.3
1 IPC refers to individuals, partnerships, and corporations.
Digitized for FRASER http://fraser.stlouisfed.org/ Federal Reserve Bank of St. Louis
80 FEDERAL DEPOSIT INSURANCE CORPORATION
have increased, they have bid more aggressively for funds, through greater use of certificates of deposit in large denominations and by paying higher interest rates on savings and time deposits, the latter permitted by a liberalization of interest rate regulations. At the same time, growth of demand deposits has been slowed in part by the prohibition of interest on them in a period of rising interest rates and by the development of various means of economizing on the size of demand deposit balances.
With respect to the proportions of accounts fully protected and of dbposits insured, Table 16 reveals, for the most part, only slight differences among the survey dates. Between 1936 and 1945 there was a decline in the proportion of fully insured accounts but an increase in the percentage of total deposits insured. Both ratios rose following the 1950 increase in coverage from $5,000 to $10,- 000, and both declined between 1955 and 1964.
Changes in the proportion of fully insured accounts. Between 1955 and 1964 the proportion of accounts fully protected declined from98.2 percent to 97.2 percent. Declines occurred in both commercial banks and mutual savings banks, but not in all types of accounts. There was a slight increase in the proportion of demand accounts of business and individuals that were fully protected, as well as in such United States Government accounts.
The most notable change was in time and savings accounts of business and individuals, where the proportion below $10,000 declined from 98.8 percent in 1955 to 96.5 percent in 1964. Since this type of account predominates in mutual savings banks, the decline there was sharper, from 98.2 percent to 94.0 percent. There was substantial relative growth in accounts of $10,000 to $25,000 in both mutual savings and commercial banks, and also sharp increases in accounts over $100,000.
Changes in the proportion of insured to total deposits. Deposits protected by insurance have increased relatively faster than total deposits in insured banks over the past three decades. From 1936 to 1964 the proportion of total deposits insured rose from 44.3 percent to 54.5 percent. The chief factor in this change was the 1950 statutory increase in insurance coverage; this is indicated by the rise in deposits insured from 48.8 percent to 54.3 percent between the 1949 and 1951 survey dates. This interpretation is further supported by the finding in the 1951 survey that the percentage of deposits insured would have declined between 1949 and 1951 had insurance coverage remained at the old level. Other factors tending to increase the proportion of insured deposits have been the latitude for growth in the average account before it
Digitized for FRASER http://fraser.stlouisfed.org/ Federal Reserve Bank of St. Louis
ACCOUNTS AND DEPOSITS AT FOUR SPECIAL CALL DATES 81
reaches the insurance maximum and the opening of many new accounts below the insured limit, notably the sharp rise in small- size special checking accounts.
Nevertheless, between 1955 and 1964 the proportion of insured to total deposits declined slightly. One possible factor in this development has been the obscuration of the insured limit in the attitude of depositors as deposit insurance comes to be taken for granted. Also contributing to this result has been the substantial growth in the demand balances of business, which cannot be split as readily as personal deposits for purposes of extending insurance coverage. The development of the time certificate of deposit in recent years as an instrument for conserving or attracting bank funds may also have tended to reduce the proportion of insured deposits, depending upon the source of the funds, for such certificates are issued in large denominations far in excess of the insured maximum.2 From a level of about $3 billion in 1955, representing about 6 per cent of savings and time deposits,3 certificates of deposit outstanding (both negotiable and non-negotiable) have risen to upwards of $30 billion, and currently account for over one-fourth of all savings and time deposits in commercial banks.
In commercial banks’ business and personal savings and time accounts of more than $100,000, which include substantial amounts of certificates of deposit, deposits reached $20 billion, a nine-fold increase over 1955. Smaller size accounts also increased, but much less rapidly: deposits in accounts between $25,000 and $100,000 increased less than four times while deposits in accounts from $10,000 to $25,000 slightly more than doubled. Meanwhile, for deposits in accounts of $10,000 or less, the increase was only four-fifths during the period.
The decline between 1955 and 1964 in the proportion of deposits insured was reflected sharply in the experience of mutual savings banks, which showed an upsurge of deposits in accounts above $10,000. In 1955, 84.1 percent of all deposits in mutual savings banks were in accounts of $10,000 or less; by 1964 this ratio had dropped to 60.2 percent. Conversely, the proportion of total deposits in accounts of $10,000 to $25,000 rose from 15.0 percent to35.2 percent, and larger-size accounts also had greater proportions of total deposits than in 1955.
“ A 1963 Federal Reserve Survey showed that 90 percent of the negotiable certificates of deposit were issued in denominations of $100,000 and larger. The rapid increase in the use of negotiable certificates of deposit began in 1961. Federal Reserve Bulletin, April, 1963, p. 460.
5 Estimated. On June 6, 1957 insured commercial banks had outstanding $3.2 billion of certificates of deposit and time and savings deposits of $50.8 billion.
Digitized for FRASER http://fraser.stlouisfed.org/ Federal Reserve Bank of St. Louis
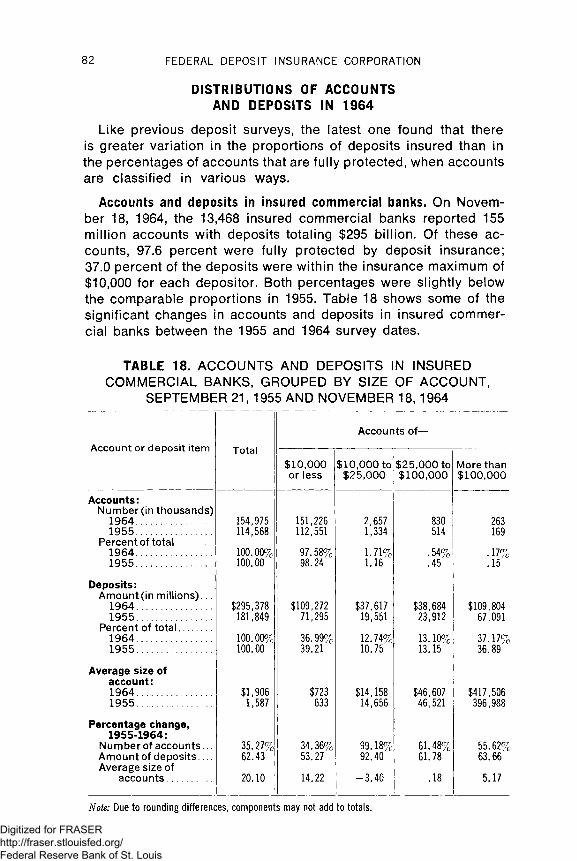
82 FEDERAL DEPOSIT INSURANCE CORPORATION
DISTRIBUTIONS OF ACCOUNTS AND DEPOSITS IN 1964
Like previous deposit surveys, the latest one found that there is greater variation in the proportions of deposits insured than in the percentages of accounts that are fully protected, when accounts are classified in various ways.
Accounts and deposits in insured commercial banks. On November 18, 1964, the 13,468 insured commercial banks reported 155 million accounts with deposits totaling $295 billion. Of these accounts, 97.6 percent were fully protected by deposit insurance;37.0 percent of the deposits were within the insurance maximum of $10,000 for each depositor. Both percentages were slightly below the comparable proportions in 1955. Table 18 shows some of the significant changes in accounts and deposits in insured commercial banks between the 1955 and 1964 survey dates.
TABLE 18. ACCOUNTS AND DEPOSITS IN INSURED COMMERCIAL BANKS, GROUPED BY SIZE OF ACCOUNT,
SEPTEMBER 21,1955 AND NOVEMBER 18,1964
Account or deposit item Total
Accounts of—
$10,000 or less
$10,000 to $25,000
$25,000 to $100,000
More than $100,000
Accounts:Number (in thousands)
1964......................... 154,975 151,226 2,657 830 2631955......................... 114,568 112,551 1,334 514 169
Percent of to ta l............1964......................... 100.00% 97.58% 1.71% .54% .17%1955......................... 100.00 98.24 1.16 .45 .15
Deposits:Amount(in m illions)...
1964......................... $295,378 $109,272 $37,617 $38,684 $109,8041955......................... 181,849 71,295 19,551 23,912 67,091
Percent of to ta l...........1964......................... 100.00% 36.99% 12.74% 13.10% 37.17%1955......................... 100.00 39.21 10.75 13.15 36.89
Average size of account:1964......................... $1,906 $723 $14,158 $46,607 $417,5061955......................... 1,587 633 14,656 46,521 396,988
Percentage change, 1955-1964:
Number of accounts... 35.27% 34.36% 99.18% 61.48% 55.62%Amount of deposits.... 62.43 53.27 92.40 61.78 63.66Average size of
accounts............... 20.10 14.22 -3.40 .18 5.17
Note: Due to rounding differences, components may not add to totals.
Digitized for FRASER http://fraser.stlouisfed.org/ Federal Reserve Bank of St. Louis
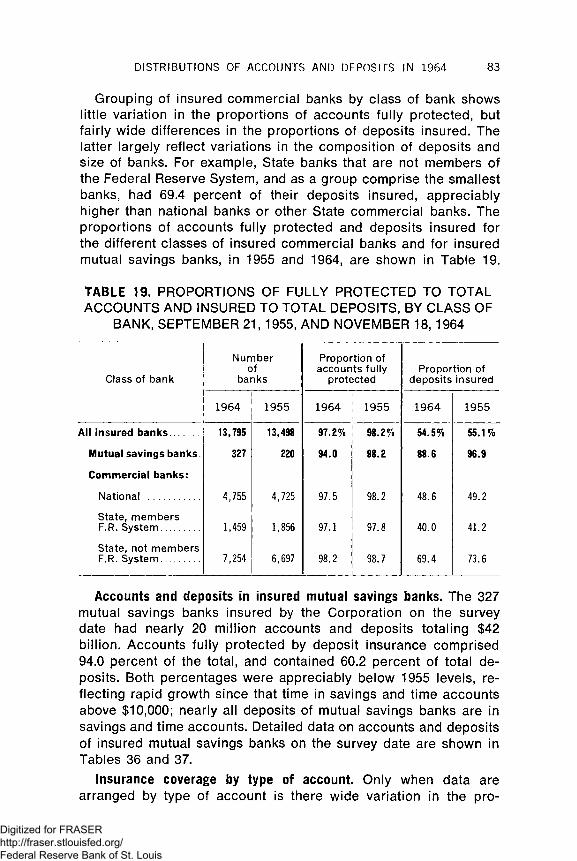
DISTRIBUTIONS OF ACCOUNTS AND DEPOSITS IN 1964 83
Grouping of insured commercial banks by class of bank shows little variation in the proportions of accounts fully protected, but fairly wide differences in the proportions of deposits insured. The latter largely reflect variations in the composition of deposits and size of banks. For example, State banks that are not members of the Federal Reserve System, and as a group comprise the smallest banks, had 69.4 percent of their deposits insured, appreciably higher than national banks or other State commercial banks. The proportions of accounts fully protected and deposits insured for the different classes of insured commercial banks and for insured mutual savings banks, in 1955 and 1964, are shown in Table 19.
TABLE 19. PROPORTIONS OF FULLY PROTECTED TO TOTAL ACCOUNTS AND INSURED TO TOTAL DEPOSITS, BY CLASS OF
BANK, SEPTEMBER 21, 1955, AND NOVEMBER 18,1964
Class of bank
Numberof
banks
Proportion of accounts fully
protectedProportion of
deposits insured
1964 1955 1964 1955 1964 1955
All insured banks.......... 13,795 13,498 97.2% 98.2% 54.5% 55.1%
Mutual savings banks. 327 220 94.0 98.2 88.6 96.9
Commercial banks:
National................... 4,755 4,725 97.5 98.2 48.6 49.2
State, members F.R. System............. 1,459 1,856 97.1 97.8 40.0 41.2
State, not members F.R. System............. 7,254 6,697 98.2 98.7 69.4 73.6
Accounts and deposits in insured mutual savings banks. The 327mutual savings banks insured by the Corporation on the survey date had nearly 20 million accounts and deposits totaling $42 billion. Accounts fully protected by deposit insurance comprised94.0 percent of the total, and contained 60.2 percent of total deposits. Both percentages were appreciably below 1955 levels, reflecting rapid growth since that time in savings and time accounts above $10,000; nearly all deposits of mutual savings banks are in savings and time accounts. Detailed data on accounts and deposits of insured mutual savings banks on the survey date are shown in Tables 36 and 37.
Insurance coverage by type of account. Only when data are arranged by type of account is there wide variation in the pro
Digitized for FRASER http://fraser.stlouisfed.org/ Federal Reserve Bank of St. Louis
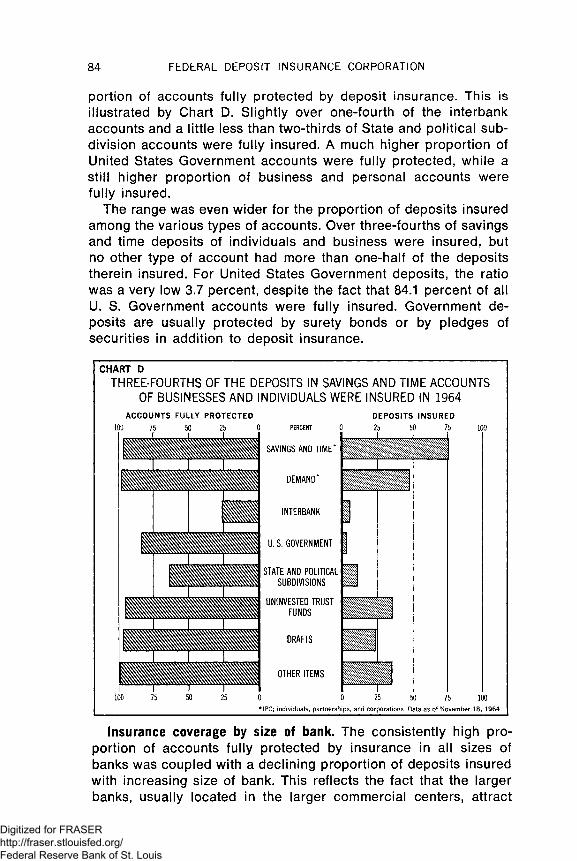
84 FEDERAL DEPOSIT INSURANCE CORPORATION
portion of accounts fully protected by deposit insurance. This is illustrated by Chart D. Slightly over one-fourth of the interbank accounts and a little less than two-thirds of State and political subdivision accounts were fully insured. A much higher proportion of United States Government accounts were fully protected, while a still higher proportion of business and personal accounts were fully insured.
The range was even wider for the proportion of deposits insured among the various types of accounts. Over three-fourths of savings and time deposits of individuals and business were insured, but no other type of account had more than one-half of the deposits therein insured. For United States Government deposits, the ratio was a very low 3.7 percent, despite the fact that 84.1 percent of all U. S. Government accounts were fully insured. Government deposits are usually protected by surety bonds or by pledges of securities in addition to deposit insurance.
CHART DTHREE-FOURTHS OF THE DEPOSITS IN SAVINGS AND TIME ACCOUNTS
OF BUSINESSES AND INDIVIDUALS WERE INSURED IN 1964ACCOUNTS FULLY PROTECTED
100 75 50 25 0 PERCENT 0
SAVINGS AND TIME*
DEMAND*
INTERBANK
U.S. GOVERNMENT
STATE AND POLITICAL SUBDIVISIONS
UNINVESTED TRUST FUNDS
DRAFTS
OTHER ITEMS
DEPOSITS INSURED
25 50 75
0 0 25 50 75 100*IPC; individuals, partnerships, and corporations. Data as of N ovem ber 18, 1964
Insurance coverage by size of bank. The consistently high proportion of accounts fully protected by insurance in all sizes of banks was coupled with a declining proportion of deposits insured with increasing size of bank. This reflects the fact that the larger banks, usually located in the larger commercial centers, attract
Digitized for FRASER http://fraser.stlouisfed.org/ Federal Reserve Bank of St. Louis

DISTRIBUTIONS OF ACCOUNTS AND DEPOSITS IN 1964 85
accounts with very large balances. This characteristic is illustrated in Chart E, which shows that in banks of all sizes upwards of 95 percent of the accounts were fully protected, but that the proportion of deposits insured varied widely by size of bank. The range was from 87.8 percent in the smallest banks to 31.9 percent in the 14 largest banks.
CHART EIN ALL INSURED BANKS THE PROPORTION OF INSURED
TO TOTAL DEPOSITS DECLINED WITH INCREASING SIZE OF BANK
$1 million million million million $500 $2,500 or moremillion million
SIZE OF BANK (Amount of Deposits)
Insurance coverage by size of population center. The grouping of banks by population center exhibits a pattern similar to that shown by size of bank. Again, while most accounts were fully protected, the coverage of deposits ranged downward from 83.9 percent in the smallest communities to 43.1 percent in the largest metropolitan centers. These disparities reflect substantial interbank and corporate deposits and large savings and time deposits in the larger population centers.
Accounts and deposits in banks grouped geographically. The 1964 survey exhibited little variation among the States in the percent of accounts with balances of $10,000 or less. New York had the smallest proportion of such accounts, 95.0 percent, influenced in large part by the New York City ratio of 93.8 percent. South Carolina with 98.5 percent had the highest State ratio. In other States,
Digitized for FRASER http://fraser.stlouisfed.org/ Federal Reserve Bank of St. Louis
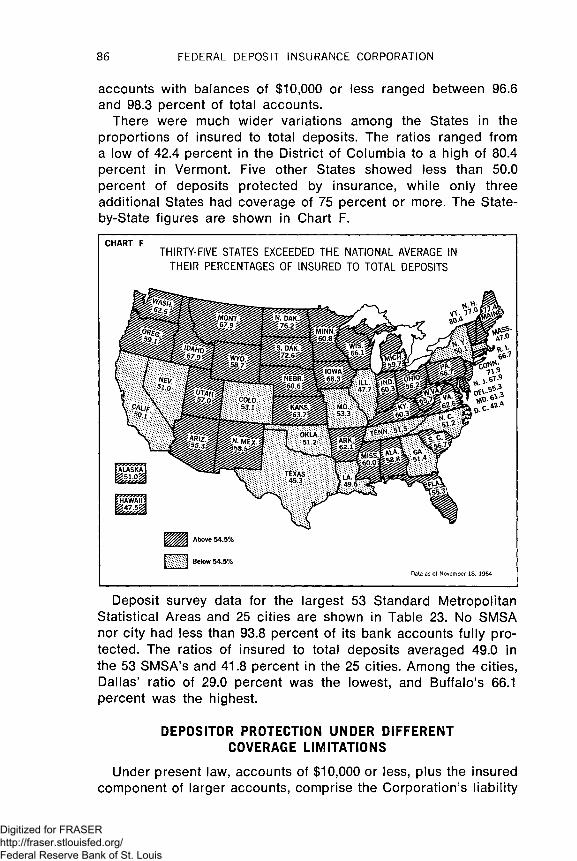
8 6 FEDERAL DEPOSIT INSURANCE CORPORATION
accounts with balances of $10,000 or less ranged between 96.6 and 98.3 percent of total accounts.
There were much wider variations among the States in the proportions of insured to total deposits. The ratios ranged from a low of 42.4 percent in the District of Columbia to a high of 80.4 percent in Vermont. Five other States showed less than 50.0 percent of deposits protected by insurance, while only three additional States had coverage of 75 percent or more. The State- by-State figures are shown in Chart F.
CHART FTHIRTY-FIVE STATES EXCEEDED THE NATIONAL AVERAGE IN
THEIR PERCENTAGES OF INSURED TO TOTAL DEPOSITS
p l f f l Below 54.5%
Data as of Novem ber 18, 1964
Deposit survey data for the largest 53 Standard Metropolitan Statistical Areas and 25 cities are shown in Table 23. No SMSA nor city had less than 93.8 percent of its bank accounts fully protected. The ratios of insured to total deposits averaged 49.0 in the 53 SMSA’s and 41.8 percent in the 25 cities. Among the cities, Dallas’ ratio of 29.0 percent was the lowest, and Buffalo’s 66.1 percent was the highest.
DEPOSITOR PROTECTION UNDER DIFFERENT COVERAGE LIMITATIONS
Under present law, accounts of $10,000 or less, plus the insured component of larger accounts, comprise the Corporation’s liability
Digitized for FRASER http://fraser.stlouisfed.org/ Federal Reserve Bank of St. Louis

DEPOSITOR PROTECTION UNDER DIFFERENT COVERAGES 87
in insuring bank deposits. What the liability might be if coverage were extended is also a matter of considerable interest. Accordingly, the surveys have obtained data on accounts and deposits above the insured limit as a tentative basis for projecting possible liability, a procedure which necessarily assumes that the distribution of accounts and deposits would remain the same under a higher insurance limit.
Insurance protection under alternative coverages. In both the 1955 and the 1964 surveys each insured bank was asked to report the number of its deposit accounts and the amount of deposits in those accounts by the following sizes: $10,000 or less; $10,000 to $25,000; $25,000 to $100,000; and more than $100,000. Such data are useful for evaluating proposals to extend coverage to higher deposit maximums, and for other analytical purposes. Table 20 shows for all insured banks, as of November 18, 1964, the number of accounts fully protected and deposits insured, assuming alternative amounts of maximum coverage per account. As noted in the Appendix, these data relate to accounts, and deposits therein, whereas the insurance limitation applies to each depositor.
The survey shows that raising the insurance limit from $10,000 to $25,000 per depositor would add an additional 3.8 million accounts to those fully protected, and would increase by $31 billion the amount of deposits insured by the Corporation. Further extension of coverage from $25,000 to $100,000 would add about900,000 accounts to the number fully protected, and would increase the amount of insured deposits by $38 billion. Telescoping the two step-ups, an increase in coverage from $10,000 to $100,000 per account would increase by 2.8 percent the number of accounts fully protected and by 37.7 percent the amount of insured deposits.
An extension of the insurance program from the present $10,000 limitation to full coverage of all deposits would add less than 5 million accounts to the number fully protected, but it would increase insured deposits by $153 billion. The increase in the number of accounts fully protected would be 3 percent as compared to a rise in the amount of insured deposits of 83 percent.
The percentage of accounts fully protected, if the insurance limit were $25,000, would increase to 99.4 percent, and deposit coverage would rise to 63.9 percent. If the insurance limit were $100,000, again assuming no change in the distribution of deposits because of the higher coverage, the percentage of fully protected accounts would be 99.9 percent, and deposit coverage, 75.1 percent. The first upward step in coverage, from $10,000 to $25,000, would thus add slightly more to the proportion of accounts fully
Digitized for FRASER http://fraser.stlouisfed.org/ Federal Reserve Bank of St. Louis
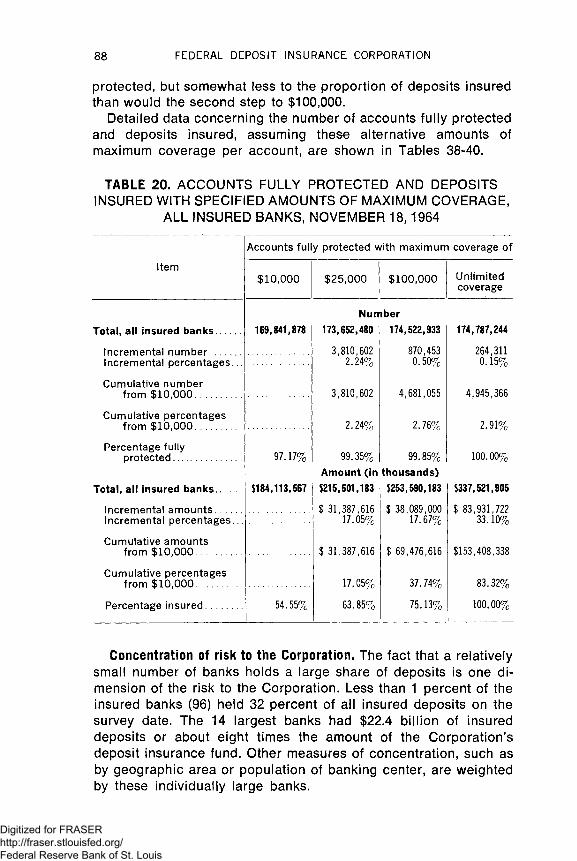
8 8 FEDERAL DEPOSIT INSURANCE CORPORATION
protected, but somewhat less to the proportion of deposits insured than would the second step to $100,000.
Detailed data concerning the number of accounts fully protected and deposits insured, assuming these alternative amounts of maximum coverage per account, are shown in Tables 38-40.
TABLE 20. ACCOUNTS FULLY PROTECTED AND DEPOSITS INSURED WITH SPECIFIED AMOUNTS OF MAXIMUM COVERAGE,
ALL INSURED BANKS, NOVEMBER 18,1964
Item
Accounts fully protected with maximum coverage of
$10,000 $25,000 $100,000 Unlimitedcoverage
NumberTotal, all insured banks........ 169,841,878 173,652,480 174,522,933 174,787,244
Incremental number . . . 3,810,602 870,453 264,311Incremental percentages 2.24% 0.50% 0.15%
Cumulative numberfrom $10,000 . . . . 3,810,602 4,681,055 4,945,366
Cumulative percentagesfrom $10,000 2.24% 2.76% 2.91%
Percentage fullyprotected....................... 97.17% 99.35% 99.85% 100.00%
Amount (in thousands)Total, all insured banks........ $184,113,567 $215,501,183 $253,590,183 $337,521,905
Incremental amounts......... $ 31,387,616 $ 38,089,000 $ 83,931,722Incremental percentages 17.05% 17.67% 33.10%
Cumulative amountsfrom $10,000............... $ 31,387,616 $ 69,476,616 $153,408,338
Cumulative percentagesfrom $10,000 17.05% 37.74% 83.32%
Percentage insured............ 54.55% 63.85% 75.13% 100.00%
Concentration of risk to the Corporation. The fact that a relatively small number of banks holds a large share of deposits is one dimension of the risk to the Corporation. Less than 1 percent of the insured banks (96) held 32 percent of all insured deposits on the survey date. The 14 largest banks had $22.4 billion of insured deposits or about eight times the amount of the Corporation’s deposit insurance fund. Other measures of concentration, such as by geographic area or population of banking center, are weighted by these individually large banks.
Digitized for FRASER http://fraser.stlouisfed.org/ Federal Reserve Bank of St. Louis
DEPOSITOR PROTECTION UNDER DIFFERENT COVERAGES 89
The distribution of total deposits in insured banks also has an important bearing on the potential liability of the Corporation. Banks with a large proportion of their deposits uninsured generally hold large amounts of interbank deposits; these uninsured deposits are more highly concentrated than insured deposits in the large banks and in banks in large cities. Failure of such a bank could cause difficulties in correspondent banks with relatively larger amounts of insured deposits. Thus consideration of insured deposits alone does not portray accurately the total impact of these large banks upon the Corporation’s possible liability.
DETAILED STATISTICS
For those interested in more detailed information than that offered in the preceding pages, additional data are presented in Tables 21-41. The data are presented in various configurations: by type and size of account, type of bank, by Federal Deposit Insurance Corporation District, by State, by population of center in which located, and by percent of deposits insured.
Comparisons may be made with the 1955 survey as follows: Tables 21 and 24-41 correspond with Tables 35 and 37-54, respectively, of the Corporation’s 1955 Annual Report. Tables 23-24 expand Table 36 of the 1955 Annual Report by including data for additional cities and for each of the 53 Standard Metropolitan Statistical Areas with a population of 500,000 or more in 1960.
Where percentages occur in the detailed tables, they have been rounded to the nearest one-tenth of 1 percent. Due to rounding differences, neither percentages nor deposit data necessarily add to totals.
APPENDIX
In these special surveys banks have been asked to report the number of their deposit accounts of various types, and balances in these accounts grouped in size categories. While data showing deposits in the combined accounts of each depositor holding more than one account would have been desirable, only in the first survey were banks asked to undertake the additional task of reporting this information.
The deposit insurance law provides for insurance protection to a maximum of $10,000 in an insured bank for each depositor. For this purpose, all deposits held in the same right and capacity in a given bank, including deposits in branches, are combined, and from this total a deduction is made for any matured debt owed the bank by the depositor.
Digitized for FRASER http://fraser.stlouisfed.org/ Federal Reserve Bank of St. Louis
90 FEDERAL DEPOSIT INSURANCE CORPORATION
The amount of insured deposits computed from the deposit surveys thus does not agree exactly with the amount obtaining when a bank is placed in receivership. Differences result from the fact that when an insured bank is placed in receivership, some accounts on the bank's books, such as those of estates of decedents or of beneficial trusts, must be divided to ascertain amounts due each depositor on funds maintained by him in different rights and capacities. In addition, banks placed in receivership frequently are found to have various accounts not shown on the bank’s books.
The number of accounts reported in the deposit surveys exceeds the number of depositors, probably by a sizeable amount; however, it is estimated that the Corporation’s insurance liability under the definitions and procedures applicable to banks placed in receivership is only slightly smaller than its liability calculated from the survey data. It was shown, for example, in the 1951 survey that 95 percent of the demand accounts of individuals, partnerships and corporations and 96 percent of their savings and time accounts, had balances of less than $5,000. The average balance in all accounts of less than $10,000 was $690 in 1951 and $793 in 1964. These data suggest that the vast majority of depositors holding more than one account have had less than $10,000 in the combined accounts.
★ * * *
Figures of deposits in the special survey differ from deposits as given in the “ reports of condition” obtained by the Federal supervisory agencies on at least four dates each year. Outstanding bank drafts and advices or authorizations to charge a bank’s balance in another bank, and reciprocal demand deposits with other banks, are included in the survey as deposit liabilities insured by the Corporation, but are excluded from deposits in the reports of condition. The latter are also used with modification as the base for the computation of deposit insurance assessments.
INSTRUCTIONS FOR PREPARATION OF SUMMARY OF DEPOSITS, FORM 89— CALL NO. 8, AS OF THE CLOSE OF
BUSINESS NOVEMBER 18, 1964
GENERAL INSTRUCTIONS
Each bank operating a branch or branches is requested to submit a consolidated report for the bank as a whole including deposits of all domestic branches and of those branches in Puerto Rico, Guam, or the Virgin Islands, the deposits of which are accorded insurance coverage. Do not include interbranch deposits (amounts due to branches and head office) in making the consolidated report.
An entry should be made in every space on the form. Where there are no figures to report, the word “ None” must be written or stamped.
Digitized for FRASER http://fraser.stlouisfed.org/ Federal Reserve Bank of St. Louis
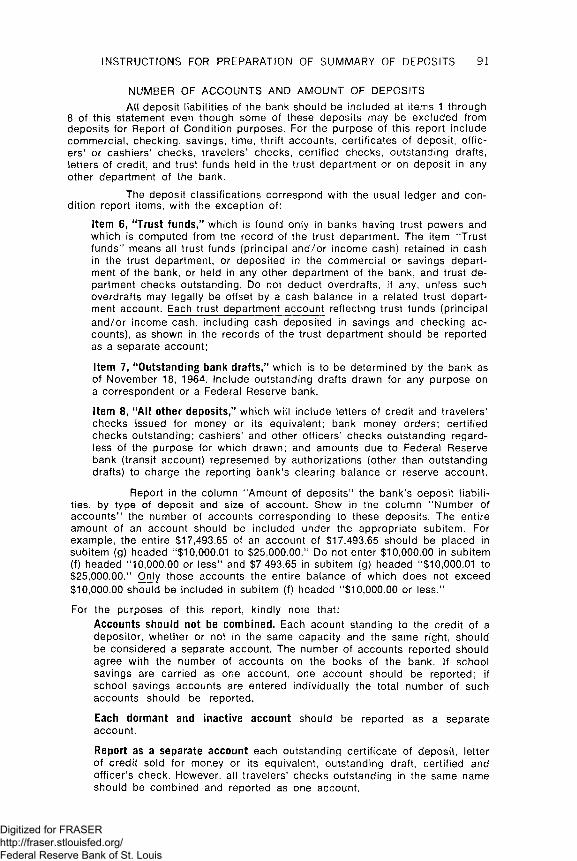
INSTRUCTIONS FOR PREPARATION OF SUMMARY OF DEPOSITS 91
NUMBER OF ACCOUNTS AND AMOUNT OF DEPOSITSAll deposit liabilities of the bank should be included at items 1 through
8 of this statement even though some of these deposits may be excluded from deposits for Report of Condition purposes. For the purpose of this report include commercial, checking, savings, time, thrift accounts, certificates of deposit, officers’ or cashiers’ checks, travelers’ checks, certified checks, outstanding drafts, letters of credit, and trust funds held in the trust department or on deposit in any other department of the bank.
The deposit classifications correspond with the usual ledger and condition report items, with the exception of:
Item 6, “Trust funds,” which is found only in banks having trust powers and which is computed from the record of the trust department. The item “ Trust funds” means all trust funds (principal and/or income cash) retained in cash in the trust department, or deposited in the commercial or savings department of the bank, or held in any other department of the bank, and trust department checks outstanding. Do not deduct overdrafts, if any, unless such overdrafts may legally be offset by a cash balance in a related trust department account. Each trust department account reflecting trust funds (principal and/or income cash, including cash deposited in savings and checking accounts), as shown in the records of the trust department should be reported as a separate account;
Item 7, “Outstanding bank drafts,” which is to be determined by the bank as of November 18, 1964. Include outstanding drafts drawn for any purpose on a correspondent or a Federal Reserve bank.
Item 8, “All other deposits,” which will include letters of credit and travelers’ checks issued for money or its equivalent; bank money orders; certified checks outstanding; cashiers’ and other officers’ checks outstanding regardless of the purpose for which drawn; and amounts due to Federal Reserve bank (transit account) represented by authorizations (other than outstanding drafts) to charge the reporting bank’s clearing balance or reserve account.
Report in the column “ Amount of deposits” the bank’s deposit liabilities, by type of deposit and size of account. Show in the column “ Number of accounts” the number of accounts corresponding to these deposits. The entire amount of an account should be included under the appropriate subitem. For example, the entire $17,493.65 of an account of $17,493.65 should be placed in subitem (g) headed “ $10,000.01 to $25,000.00.” Do not enter $10,000.00 in subitem (f) headed “ 10,000.00 or less” and $7,493.65 in subitem (g) headed “ $10,000.01 to $25,000.00.” Only those accounts the entire balance of which does not exceed $10,000.00 should be included in subitem (f) headed “ $10,000.00 or less.”
For the purposes of this report, kindly note that:Accounts should not be combined. Each acount standing to the credit of a depositor, whether or not in the same capacity and the same right, should be considered a separate account. The number of accounts reported should agree with the number of accounts on the books of the bank. If school savings are carried as one account, one account should be reported; if school savings accounts are entered individually the total number of such accounts should be reported.
Each dormant and inactive account should be reported as a separate account.
Report as a separate account each outstanding certificate of deposit, letter of credit sold for money or its equivalent, outstanding draft, certified and officer’s check. However, all travelers’ checks outstanding in the same name should be combined and reported as one account.
Digitized for FRASER http://fraser.stlouisfed.org/ Federal Reserve Bank of St. Louis
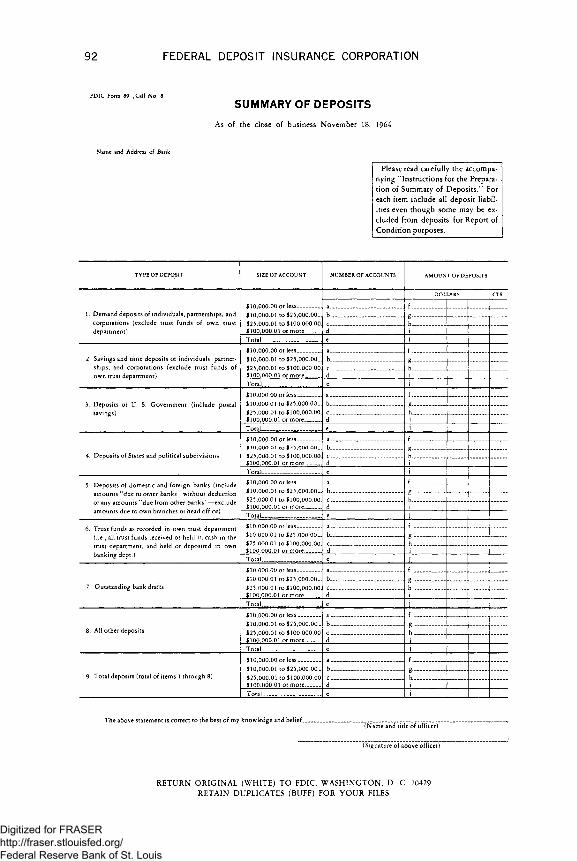
92 FEDERAL DEPOSIT INSURANCE CORPORATION
SUMMARY OF DEPOSITS
As of the close of business November 18, 1964
Name and Address of Bank
Please read carefully the accompanying "Instructions for the Preparation o f Summary o f Deposits.” For each item include all deposit liabilities even though some may be excluded from deposits for Report of Condition purposes.
TYPE OF DEPOSIT SIZE OF ACCOUNT NUMBER OF ACCOUNTS AMOUNT OF DEPOSITS
1. Demand deposits o f individuals, partnerships, and
corporations (exclude trust funds o f own trust department)
$10,000.00 or less_________
DOLLARS CTS.
a f ____________
110,000.01 to $25,000.00..
$25,000.01 to $100,000.00 $100,000.01 or m ore_____
b.__________________________
h._ ___d
Total______________________ e j
2. Savings and time deposits o f individuals, partnerships, and corporations (exclude trust funds o f own trust department)
$10,000.00 or less_________ a___________ _______________ _ f ____________
$10,000.01 to $25,000.00..
$25,000.01 to $100,000.00. $100,000.01 or more______ d
h____________i
e i
3. Deposits o f U. S. Government (include postal
savings)
110,000 00 or less_________ a__________________ _______ f ____________
$10,000.01 to $25,000.00..
$25,000.01 to $100,000.00. $100,000.01 or more______
b__________ ________________
h____________d i
e j
4. Deposits o f States and political subdivisions
$10,000.00 or less_________ a___________________________ f ....................$10,000.01 to $25,000.00..
$25,000.01 to $100,000.00 $100,000.01 or more______
b _________ _____ ____c___________________________ h____________d
Total______________________ e )
5. Deposits o f domestic and foreign banks (include amounts "due to other banks" without deduction
o f any amounts "due from other banks"— exclude amounts due to own branches or head office)
$10,000.00 or less_________ a___________________________ f ____________
$10,000.01 to $25,000.00..
$25,000.01 to $100,000.00. $100,000.01 or more______
b___________________________
c ___________ _____________ h____________d
Total______________________ e j
6. Trust funds as recorded in own trust department (i.e., all trust funds received or held in cash in the
trust department, and held or deposited in own
banking dept.)
$10,000.00 or less_______ _ f ____________
$10,000.01 to 125,000.00..
125,000.01 to 1100,000.00, $100,000.01 or more______
b.__________________________j
h____________d i
Total______________________ e j
7 . Outstanding bank drafts
$10,000.00 or less_________ a___________________________ f ___________
$10,000.01 to $25,000.00..
$25,000.01 to $100,000.00. $100,000.01 or more______
b____________________________c___________________________ h ___________d
Total__________________. . . . e j
8. All other deposits
$10 000 00 or less________ a ___________________________ f ___________
$10,000.01 to $25,000.00..
$25,000.01 to $100,000.00 $100,000.01 or more______
b___________________________
h ___________--------- . . . . . .
c ___________________________d
Total______________________ e j
9. Total deposits (total o f items 1 through 8)
$10,000.00 or less________ a ___________________________ f ____________
110.000.01 to $25,000.00..
125.000.01 to $100,000.001100.000.01 or more______
b___________________________ g____________
c __________________________ h.............. .....d
T ota l______________________ e j
T he above statem ent is correct to the best o f m y know led g e and be lie f__________________________________________________(N a m e and title o f o fficer)
(Signature o f above o fficer)
RETURN O R IG IN A L (W H ITE ) TO FDIC, W A SH IN G TO N , D. C. 20429 RE TA IN DUPLICATES (BUFF) FOR YO U R FILES
Digitized for FRASER http://fraser.stlouisfed.org/ Federal Reserve Bank of St. Louis

Digitized for FRASER http://fraser.stlouisfed.org/ Federal Reserve Bank of St. Louis

Table 21. ACCOUNTS FULLY AND PARTIALLY PROTECTED AND DEPOSITS INSURED, ALL INSURED BANKS, NOVEMBER 18, 1964BANKS GROUPED BY FEDERAL DEPOSIT INSURANCE CORPORATION DISTRICT AND STATE
FDIC D is tr ic t and S tate
Total United States
50 States and D. C.
Other a reas.................
FDIC D istric tD istrict 1 ...................D istrict 2 ...................D istrict 3 ...................D istrict 4 ...................D istrict 5 ...................D istrict 6 ...................D istrict 7 .................D istrict 8 .................D istrict 9 .................D istrict 1 0 ...............D istrict 1 1 ...............D istrict 1 2 ................
StateA labam a..................Arizona....................A rkansas.................C alifornia................Colorado.................
C onnecticut............Delaware.................D istrict of ColumbiaFlorida.....................Georgia....................
N u m b e ro f
ban ks
13,795
13,787
530735
1,145883
1,2411,5051,3651,6801,1721,7021,399
438
25215
242186203
1312215
415380
N u m b e r o f accounts
T o ta l
174,787,244
174,201,759
585,485
11,677,78034,714,22120,126,33412,126,5789,173,6359,764,686
15,212,87311,764,1185,529,9516,704,760
11,101,65226,890,656
1,900,8341,127,1561,194,461
20,148,4141,430,359
4,096,604528,213779,328
3,588,2262,466,666
Fully p ro te c te d 1
169,841,878
169,263,799
578,079
11,337,931 33,163,067 19,637,358 11,893,541 8,962,249 9,542,344
14,886,118 11,402,112 5,416,165 6;535,675
10,802,908 26,262,410
1,859,0441,097,7601,166,493
19,687,3111,389,351
3,962,562512,417754,894
3,493,0482,418,901
Partia lly p ro te c te d 2
4,945,366
4,937,960
7,406
339,8491,551,154
488,976233,037211,386222,342326,755362,006113,786169,085298,744628,246
41,79029,39627,968
461,10341,008
134,04215,79624,43495,17847,765
Percen t o f a ccou nts
Fullypro tected
97.2%
97.2
98.7
97.195.597.698.197.797.797.996.997.9 97.5 97.397.7
97.8 97.497.797.7 97.1
96.797.096.9 97.398.1
P artia llyp ro te c te d
2.8%
2.8
1.3
2.9 4.52.41.92.32.3 2.13.12.12.5 2.72.3
2.22.62.32.32.9
3.33.03.1 2.71.9
D eposits (in th o u sa n d s)
Tota l
$337,521,905
336,846,875
675,030
19,766,44095,019,92734,887,18817,308,96015,233,77217,272,83124,288,65627,261,7158,999,142
11,956,73622,085,13643,441,402
2,870,4111,886,4351,926,402
32,746,2162,715,187
6,529,623987,948
2,021,5646,535,8763,960,796
Insured
Tota linsured
$184,113,567
183,738,751
374,816
12,302,57349,668,01519,722,0289,894,6688,455,5209,488,672
14,910,59513,858,7755.808.4076.812.407
10,474,368 22,717,539
1,688,0991,043,0211,196,611
16,400,0851,440,534
4,693,088546,311856,508
3,612,1832,034,704
In fu lly p ro tec ted accou n ts
$134,659,907
134,359,151
300,756
8,904,08334,156,47514,832,2687,564,2986,341,6607,265,252
11,643,04510,238,7154,670,5475,121,5577,486,928
16,435,079
1,270,199749,061916,931
11,789,0551,030,454
3,352,668388,351612,168
2,660,4031,557,054
In p artia lly p ro tec ted accou n ts
$49,453,660
49,379,600
74,060
3,398,49015,511,5404,889,7602,330,3702.113.860 2,223,420 3,267,550 3,620,0601.137.860 1,690,850 2,987,440 6,282,460
417,900293.960 279,680
4,611,030410,080
1,340,420157.960 244,340 951,780 477,650
U n insured in p a rtia lly p ro tec ted accou nts
$153,408,338
153,108,124
300,214
7,463,86745,351,91215,165,1607,414,2926,778,2527,784,1599,378,061
13,402,9403,190,7355,144,329
11,610,76820,723,863
1,182,312843,414729,791
16,346,1311,274,653
1,836,535441,637
1,165,0562,923,6931,926,092
P ercent o f to ta l
d eposits insured
54.5%
54.5
55.5
62.252.356.557.255.5 54.961.4 50.864.5 57.0 47.452.3
58.855.3 62.150.153.1
71.955.342.455.351.4
FEDERAL DEPO
SIT IN
SUR
ANC
E C
OR
POR
ATIO
N
Digitized for FRASER http://fraser.stlouisfed.org/ Federal Reserve Bank of St. Louis
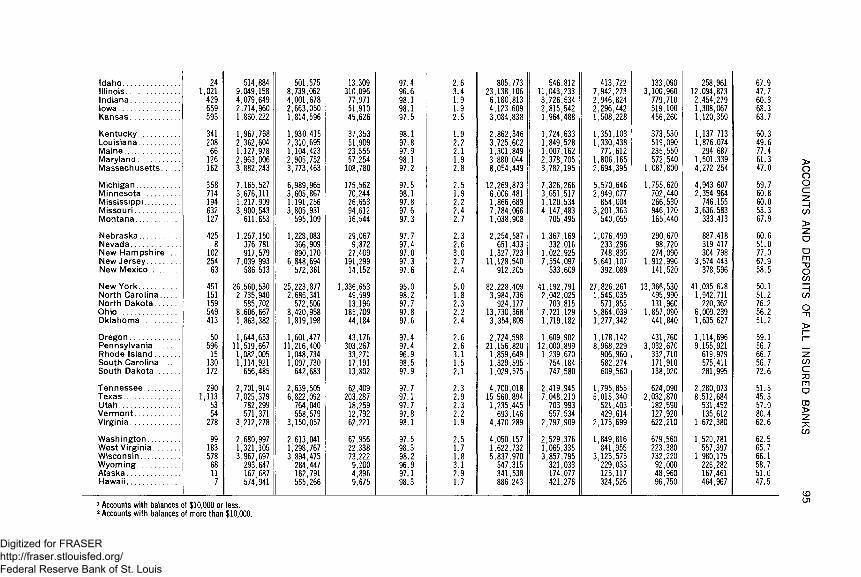
Id a h o ............................ 24 514,884 501,575 13,309 97.4I llin o is .......................... 1,021 9,049,158 8,739,062 310,096 96.6In d ia n a ........................ 429 4,079,649 4,001,678 77,971 98.1Io w a .............................. 659 2,714,960 2,663,050 51,910 98.1K a n s a s ......................... 593 1,860,222 1,814,596 45,626 97.5
K e n tu c k y .................... 341 1,967,768 1,930,415 37,353 98.1L o u is ia n a .................... 208 2,362,604 2,310,695 51,909 97.8M a in e ........................... 66 1,127,978 1,104,423 23,555 97.9M a ry la n d ..................... 126 2,963,006 2,905,752 57,254 98.1M a ssa ch u se tts 162 3,882,243 3,773,463 108,780 97.2
M ic h ig a n ..................... 358 7,165,527 6,989,965 175,562 97.5M in n e s o ta .................. 714 3,676,111 3,605,867 70,244 98.1M is s is s ip p i................. 194 1,217,909 1,191,256 26,653 97.8M is s o u r i...................... 632 3,900,543 3,805,931 94,612 97.6M o n ta n a ...................... 127 611,653 595,109 16,544 97.3
N e b ra s k a .................... 425 1,257,150 1,228,083 29,067 97.7N e va d a ........................ 8 376,781 366,909 9,872 97.4New H a m p s h ire . . . . 102 917,579 890,170 27,409 97.0New J e rs e y ................ 254 7,039,993 6,848,694 191,299 97.3New M e x ic o ............... 63 586,513 572,361 14,152 97.6
New Y o rk .................... 451 26,560,530 25,223,877 1,336,653 95.0N o rth C a ro lin a ......... 151 2,735,940 2,686,341 49,599 98.2N o rth D a k o ta ............ 159 585,702 572,506 13,196 97.7O h io .............................. 549 8,606,667 8,420,958 185,709 97.8O k la h o m a ................... 413 1,863,382 1,819,198 44,184 97.6
O re g o n ......................... 50 1,644,653 1,601,477 43,176 97.4P e n n sy lva n ia ............ 596 11,519,667 11,216,400 303,267 97.4R hode Is la n d ............ 15 1,082,005 1,048,734 33,271 96.9South C a ro lin a ......... 130 1,114,921 1,097,730 17,191 98.5S outh D a k o ta ............ 172 656,485 642,683 13,802 97.9
T e n n e s s e e ................. 290 2,701,914 2,639,505 62,409 97.7T e x a s ............................ 1,113 7,025,379 6,822,092 203,287 97.1U ta h .............................. 53 782,299 764,040 18,259 97.7V e rm o n t...................... 54 571,371 558,579 12,792 97.8V irg in ia ......................... 278 3,212,278 3,150,057 62,221 98.1
W a s h in g to n ................ 99 2,680,997 2,613,041 67,956 97.5W est V irg in ia ............. 183 1,321,105 1,298,767 22,338 98.3W is c o n s in ................... 578 3,967,697 3,894,475 73,222 98.2W y o m in g ..................... 68 293,647 284,447 9,200 96.9A la s k a .......................... 11 167,687 162,791 4,896 97.1H a w a ii.......................... 7 574,941 565,266 9,675 98.3
1 Accounts with balances of $10,000 or less.2 Accounts with balances of more than $10,000.
2.6 805,773 546,812 413,722 133,090 258,961 67.93.4 23,138,106 11,043,233 7,942,273 3,100,960 12,094,873 47.71.9 6,180,813 3,726,534 2,946,824 779,710 2,454,279 60.31.9 4,123,609 2,815,542 2,296,442 519,100 1,308,067 68.32.5 3,084,838 1,964,488 1,508,228 456,260 1,120,350 63.7
1.9 2,862,346 1,724,633 1,351,103 373,530 1,137,713 60.32.2 3,725,602 1,849,528 1,330,438 519,090 1,876,074 49.62.1 1,301,849 1,007,162 771,612 235,550 294,687 77.41.9 3,880,044 2,378,705 1,806,165 572,540 1,501,339 61.32.8 8,054,449 3,782,195 2,694,395 1,087,800 4,272,254 47.0
2.5 12,269,873 7,326,266 5,570,646 1,755,620 4,943,607 59.71.9 6,006,481 3,651,517 2,949,077 702,440 2,354,964 60.82.2 1,866,689 1,120,534 854,004 266,530 746,155 60.02.4 7,784,066 4,147,483 3,201,363 946,120 3,636,583 53.32.7 1,038,908 705,495 540,055 165,440 333,413 67.9
2.3 2,254,587 1,367,169 1,076,499 290,670 887,418 60.62.6 651,433 332,016 233,296 98,720 319,417 51.03.0 1,327,723 1,022,925 748,835 274,090 304,798 77.02.7 11,128,540 7,554,097 5,641,107 1,912,990 3,574,443 67.92.4 912,205 533,609 392,089 141,520 378,596 58.5
5.0 82,228,409 41,192,791 27,826,261 13,366,530 41,035,618 50.11.8 3,984,736 2,042,025 1,546,035 495,990 1,942,711 51.22.3 924,177 703,815 571,855 131,960 220,362 76.22.2 13,730,368 7,721,129 5,864,039 1,857,090 6,009,239 56.22.4 3,354,809 1,719,182 1,277,342 441,840 1,635,627 51.2
2.6 2,724,598 1,609,902 1,178,142 431,760 1,114,696 59.12.6 21,156,820 12,000,899 8,968,229 3,032,670 9,155,921 56.73.1 1,859,649 1,239,670 906,960 332,710 619,979 66.71.5 1,329,595 754,184 582,274 171,910 575,411 56.72.1 1,029,575 747,580 609,560 138,020 281,995 72.6
2.3 4,700,018 2,419,945 1,795,855 624,090 2,280,073 51.52.9 15,560,894 7,048,210 5,015,340 2,032,870 8,512,684 45.32.3 1,235,445 703,993 521,403 182,590 531,452 57.02.2 693,146 557,534 429,614 127,920 135,612 80.41.9 4,470,289 2,797,909 2,175,699 622,210 1,672,380 62.6
2.5 4,050,157 2,529,376 1,849,816 679,560 1,520,781 62.51.7 1,622,732 1,065,335 841,955 223,380 557,397 65.71.8 5,837,970 3,857,795 3,125,575 732,220 1,980,175 66.13.1 547,315 321,033 229,033 92,000 226,282 58.72.9 341,538 174,077 125,117 48,960 167,461 51.01.7 886,243 421,276 324,526 96,750 464,967 47.5
ACCOUNTS
AND DEPO
SITS OF
ALL INSURED
BA
NK
S
Digitized for FRASER http://fraser.stlouisfed.org/ Federal Reserve Bank of St. Louis
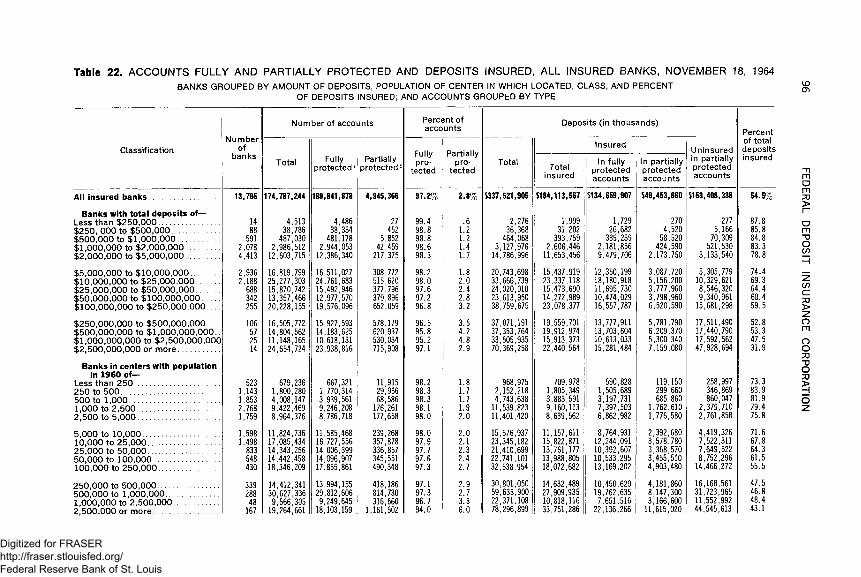
Table 22. ACCOUNTS FULLY AND PARTIALLY PROTECTED AND DEPOSITS INSURED, ALL INSURED BANKS, NOVEMBER 18, 1964B A N K S GROUPED BY AM O U N T OF DEPOSITS, POPULATION OF CENTER IN W HICH LOCATED, CLASS, AND PERCENT
OF DEPOSITS INSURED; AND ACCO UNTS GROUPED BY TYPE
N u m b e ro f
N u m b e r o f accounts P e rcen t o f accou n ts
D eposits (in th o u sa n d s)P ercent
C lass ifica tion Fullyp ro
tec ted
P artia llyp ro
te c te d
In suredU n insured
o f to ta l dep osits
ban ksTota l Fully
p ro te c te d 1Partia lly
p ro te c te d 2Total
Totalinsured
In fu lly p ro te c te d accou n ts
In p a rtia lly p ro te c te d acco u n ts
in p a rtia lly p ro te c te d accou n ts
insured
All insured banks................................ 13,795 174,787,244 169,841,878 4,945,366 97.2% 2.8% $337,521,905 $184,113,567 $134,659,907 $49,453,660 $153,408,338 54.5%
Banks with total deposits of—Less th a n $ 2 5 0 ,0 0 0 .............................. 14 4,513 4,486 27 99.4 .6 2,276 1,999 1,729 270 277 87.8$ 2 5 0 , 0 0 0 to $ 5 0 0 ,0 0 0 ........................ 88 38,786 38,334 452 98.8 1.2 36,368 31,202 26,682 4,520 5,166 85.8$ 5 0 0 ,0 0 0 to $ 1 ,0 0 0 ,0 0 0 ..................... 591 487,030 481,178 5,852 98.8 1.2 464,068 393,759 335,239 58,520 70,309 84.8$ 1 ,0 0 0 ,0 0 0 to $ 2 ,0 0 0 ,0 0 0 ................ 2,078 2,986,512 2,944,053 42,459 98.6 1.4 3,127,976 2,606,446 2,181,856 424,590 521,530 83.3$ 2 ,0 0 0 ,0 0 0 to $ 5 ,0 0 0 ,0 0 0 ................. 4,413 12,603,715 12,386,340 217,375 98.3 1.7 14,786,996 11,653,456 9,479,706 2,173,750 3,133,540 78.8
$ 5 ,0 0 0 ,0 0 0 to $ 1 0 ,0 0 0 ,0 0 0 .............. 2,936 16,819,799 16,511,027 308,772 98.2 1.8 20,743,698 15,437,919 12,350,199 3,087,720 5,305,779 74.4$ 1 0 ,0 0 0 ,0 0 0 to $ 2 5 ,0 0 0 ,0 0 0 ........... 2,188 25,277,303 24,761,683 515,620 98.0 2.0 33,666,739 23,337,118 18,180,918 5,156,200 10,329,621 69.3$ 2 5 ,0 0 0 ,0 0 0 to $ 5 0 ,0 0 0 ,0 0 0 ........... 688 15,870,742 15,492,946 377,796 97.6 2.4 24,020,010 15,473,690 11,695,730 3,777,960 8,546,320 64.4$ 5 0 ,0 0 0 ,0 0 0 to $ 1 0 0 ,0 0 0 ,0 0 0 342 13,357,466 12,977,570 379,896 97.2 2.8 23,613,950 14,272,989 10,474,029 3,798,960 9,340,961 60.4$ 1 0 0 ,0 0 0 ,0 0 0 to $ 2 5 0 ,0 0 0 ,0 0 0 . . . 255 20,228,155 19,576,096 652,059 96.8 3.2 38,759,675 23,078,377 16,557,787 6,520,590 15,681,298 59.5
$ 2 5 0 ,0 0 0 ,0 0 0 to $ 5 0 0 ,0 0 0 ,0 0 0 . . . 106 16,505,772 15,927,593 578,179 96.5 3.5 37,071,191 19,559,701 13,777,911 5,781,790 17,511,490 52.8$ 5 0 0 ,0 0 0 ,0 0 0 to $ 1 ,0 0 0 ,0 0 0 ,0 0 0 .. 57 14,804,562 14,183,625 620,937 95.8 4.2 37,353,764 19,912,974 13,703,604 6,209,370 17,440,790 53.3$ 1 ,0 0 0 ,0 0 0 ,0 0 0 to $ 2 ,5 0 0 ,0 0 0 ,0 0 0 25 11,148,165 10,618,131 530,034 95.2 4.8 33,505,935 15,913,373 10,613,033 5,300,340 17,592,562 47.5$ 2 ,5 0 0 ,0 0 0 ,0 0 0 o r m o re .................... 14 24,654,724 23,938,816 715,908 97.1 2.9 70,369,258 22,440,564 15,281,484 7,159,080 47,928,694 31.9
Banks in centers with population in 1960 of—
73.3Less th a n 2 5 0 .......................................... 523 679,236 667,321 11,915 98.2 1.8 968,975 709,978 590,828 119,150 258,9972 5 0 to 5 0 0 ................................................. 1,143 1,800,280 1,770,314 29,966 98.3 1.7 2,152,218 1,805,349 1,505,689 299,660 346,869 83.95 0 0 to 1 ,0 0 0 ..................................... 1,853 4,008,147 3,939,561 68,586 98.3 1.7 4,743,638 3,883,591 3,197,731 685,860 860,047 81.91 ,0 0 0 to 2 ,5 0 0 ......................................... 2,768 9,422,469 9,246,208 176,261 98.1 1.9 11,539,823 9,160,113 7,397,503 1,762,610 2,379,710 79.42 ,5 0 0 to 5 ,0 0 0 ......................................... 1,759 8,964,376 8,786,718 177,658 98.0 2.0 11,401,420 8,639,562 6,862,982 1,776,580 2,761,858 75.8
5 ,0 0 0 to 1 0 ,0 0 0 ...................................... 1,598 11,824,736 11,585,468 239,268 98.0 2.0 15,576,937 11,157,611 8,764,931 2,392,680 4,419,326 71.610 ,0 0 0 to 2 5 ,0 0 0 ................................... 1,498 17,085,434 16,727,556 357,878 97.9 2.1 23,345,182 15,822,871 12,244,091 3,578,780 7,522,311 67.82 5 ,0 0 0 to 5 0 ,0 0 0 ................................... 833 14,343,256 14,006,399 336,857 97.7 2.3 21,410,699 13,761,177 10,392,607 3,368,570 7,649,522 64.35 0 ,0 0 0 to 1 0 0 ,0 0 0 ................................. 548 14,442,458 14,096,907 345,551 97.6 2.4 22,741,101 13,988,805 10,533,295 3,455,510 8,752,296 61.51 0 0 ,0 0 0 to 2 5 0 ,0 0 0 .............................. 430 18,346,209 17,855,861 490,348 97.3 2.7 32,538,954 18,072,682 13,169,202 4,903,480 14,466,272 55.5
2 5 0 ,0 0 0 to 5 0 0 ,0 0 0 .............................. 339 14,412,341 13,994,155 418,186 97.1 2.9 30,801,050 14,632,489 10,450,629 4,181,860 16,168,561 47.55 0 0 ,0 0 0 to 1 ,0 0 0 ,0 0 0 .......................... 288 30,627,336 29,812,606 814,730 97.3 2.7 59,633,900 27,909,935 19,762,635 8,147,300 31,723,965 46.8
1 ,0 0 0 ,0 0 0 to 2 ,5 0 0 ,0 0 0 ...................... 48 9,566,305 9,249,645 316,660 96.7 3.3 22,371,108 10,818,116 7,651,516 3,166,600 11,552,992 48.4
2 ,5 0 0 ,0 0 0 o r m o re ................................ 167 19,264,661 18,103,159 1,161,502 94.0 6.0 78,296,899 33,751,286 22,136,266 11,615,020 44,545,613 43.1
FEDERAL DEPO
SIT IN
SUR
ANC
E C
OR
POR
ATIO
N
Digitized for FRASER http://fraser.stlouisfed.org/ Federal Reserve Bank of St. Louis
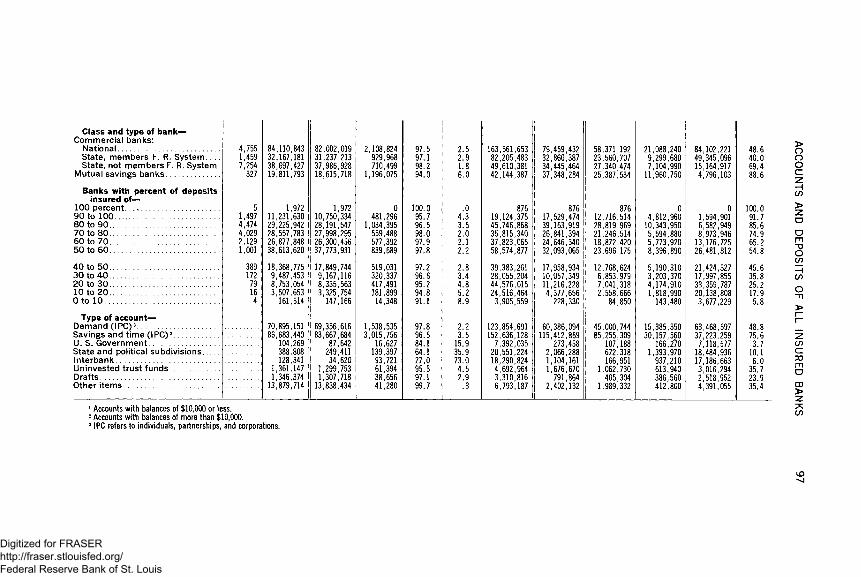
Class and type of bank—C o m m e rc ia l ban ks:
N a tio n a l................................................... 4,755 84,110,843 82,002,019 2,108,824 97.5S ta te , m e m b e rs F. R. S y s te m .. . 1,459 32,167,181 31,237,213 929,968 97.1S ta te , n o t m e m b e rs F. R. System 7,254 38,697,427 37,986,928 710,499 98.2
M u tu a l sav ings b a n k s ........................... 327 19,811,793 18,615,718 1,196,075 94.0
Banks with percent of deposits insured of—
100 p e rc e n t............................................... 5 1,972 1,972 0 100.09 0 to 1 0 0 .................................................... 1,497 11,231,630 10,750,334 481,296 95.78 0 to 9 0 ...................................................... 4,474 29,225,942 28,191,547 1,034,395 96.570 to 8 0 ...................................................... 4,029 28,557,783 27,998,295 559,488 98.06 0 to 7 0 ...................................................... 2,129 26,877,848 26,300,456 577,392 97.950 to 6 0 ...................................................... 1,001 38,613,620 37,773,931 839,689 97.8
4 0 to 5 0 ...................................................... 389 18,368,775 17,849,744 519,031 97.23 0 to 4 0 ...................................................... 172 9,487,453 9,167,116 320,337 96.620 to 3 0 ...................................................... 79 8,753,054 8,335,563 417,491 95.210 to 2 0 ...................................................... 16 3,507,653 3,325,754 181,899 94.80 to 1 0 ......................................................... 4 161,514 147,166 14,348 91.1
Type of account—D e m an d ( IP C )3......................................... 70,895,151
86,683,440104,269388,808
69,356,61683,667,684
87,642249,411
1,538,5353,015,756
16,627139,39793,72161,39438,65641,280
97.8S avings and t im e ( IP C )3...................... 96.5U. S. G o v e rn m e n t................................... 84.1S ta te and po litica l s u b d iv is io n s ....... 64.1In te rb a n k ............................................... 128,341
1,361,1471,346,374
13,879,714
34,6201,299,7531,307,718
13,838,434
27,095.5U n in ve s te d t ru s t fu n d s ........................
D ra f ts ........................................................... 97.1O th e r i te m s ............................................... 99.7
1 Accounts with balances of $10,000 or less.2 Accounts with balances of more than $10,000.3 1 PC refers to individuals, partnerships, and corporations.
2.5 163,561,653 79,459,432 58,371,192 21,088,240 84,102,221 48.62.9 82,205,483 32,860,387 23,560,707 9,299,680 49,345,096 40.01.8 49,610,381 34,445,464 27,340,474 7,104,990 15,164,917 69.46.0 42,144,387 37,348,284 25,387,534 11,960,750 4,796,103 88.6
.0 876 876 876 0 0 100.04.3 19,124,375 17,529,474 12,716,514 4,812,960 1,594,901 91.73.5 45,746,868 39,163,919 28,819,969 10,343,950 6,582,949 85.62.0 35,815,340 26,841,394 21,246,514 5,594,880 8,973,946 74.92.1 37,823,065 24,646,340 18,872,420 5,773,920 13,176,725 65.22.2 58,574,877 32,093,065 23,696,175 8,396,890 26,481,812 54.8
2.8 39,383,261 17,958,934 12,768,624 5,190,310 21,424,327 45.63.4 28,055,204 10,057,349 6,853,979 3,203,370 17,997,855 35.84.8 44,576,015 11,216,228 7,041,318 4,174,910 33,359,787 25.25.2 24,516,464 4,377,656 2,558,666 1,818,990 20,138,808 17.98.9 3,905,559 228,330 84,850 143,480 3,677,229 5.8
2.2 123,854,691 60,386,094 45,000,744 15,385,350 63,468,597 48.83.5 152,636,128 115,412,869 85,255,309 30,157,560 37,223,259 75.6
15.9 7,392,035 273,458 107,188 166,270 7,118,577 3.735.9 20,551,224 2,066,288 672,318 1,393,970 18,484,936 10.173.0 18,290,824 1,104,161 166,951 937,210 17,186,663 6.04.5 4,692,964 1,676,670 1,062,730 613,940 3,016,294 35.72.9 3,310,816 791,864 405,304 386,560 2,518,952 23.9
.3 6,793,187 2,402,132 1,989,332 412,800 4,391,055 35.4
<£>
ACCOUNTS
AND DEPO
SITS OF
ALL INSURED
BA
NK
S
Digitized for FRASER http://fraser.stlouisfed.org/ Federal Reserve Bank of St. Louis
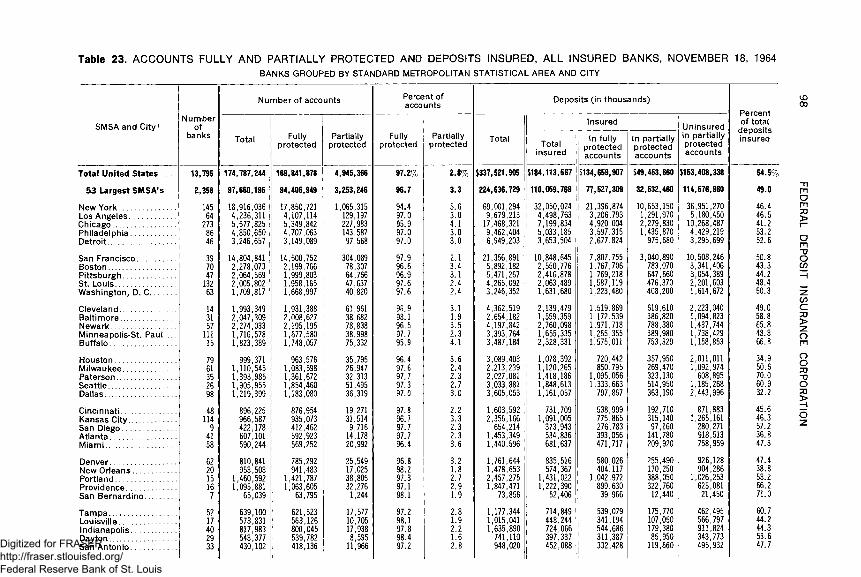
Table 23. ACCOUNTS FULLY AND PARTIALLY PROTECTED AND DEPOSITS INSURED, ALL INSURED BANKS, NOVEMBER 18, 1964BANKS GROUPED BY STANDARD M ETROPOLITAN ST ATISTICAL AREA AND CITY
SMSA a nd C ity 1N u m b e r
o fbanks
N u m b e r o f accounts Percent o f accounts
D eposits (in th o u sa n d s)
P ercen t o f to ta l
dep osits insuredT ota l Fully
p ro te c te dP artia lly
pro tectedFully
pro tectedP artia lly
p ro tec tedTota l
Tota lin su re d
Insured
In fu lly p ro te c te d a ccou n ts
In p a rtia lly p ro te c te d accou n ts
U n insured in p a rtia lly p ro te c te d accou n ts
Total United States....... 13,795 174,787,244 169,841,878 4,945,366 97.2% 2.8% $337,521,905 $184,113,567 $134,659,907 $49,453,660 $153,408,338 54.5%
53 Largest SMSA’s 2,358 97,660,195 94,406,949 3,253,246 96.7 3.3 224,636,729 110,059,769 77,527,309 32,532,460 114,576,960 49.0
New Y o rk ............................ 145 18,916,036 17,850,721 1,065,315 94.4 5.6 69,001,294 32,050,024 21,396,874 10,653,150 36,951,270 46.4Los A n g e le s ....................... 64 4,236,311 4,107,114 129,197 97.0 3.0 9,679,213 4,498,763 3,206,793 1,291,970 5,180,450 46.5C h ic a g o ............................... 273 5,577,825 5,349,842 227,983 95.9 4.1 17,468,321 7,199,834 4,920,004 2,279,830 10,268,487 41.2P h ila d e lp h ia ...................... 86 4,850,650 4,707,063 143,587 97.0 3.0 9,462,404 5,033,185 3,597,315 1,435,870 4,429,219 53.2D e tro it .................................. 46 3,246,657 3,149,089 97,568 97.0 3.0 6,949,203 3,653,504 2,677,824 975,680 3,295,699 52.6
San F ra n c isco ................... 39 14,804,841 14,500,752 304,089 97.9 2.1 21,356,891 10,848,645 7,807,755 3,040,890 10,508,246 50.8B o s to n ................................. 70 2,278,073 2,199,766 78,307 96.6 3.4 5,892,182 2,550,776 1,767,706 783,070 3,341,406 43.3P it ts b u rg h .......................... 47 2,064,569 1,999,803 64,766 96.9 3.1 5,471,267 2,416,878 1,769,218 647,660 3,054,389 44.2St. L o u is .............................. 132 2,005,802 1,958,165 47,637 97.6 2.4 4,265,092 2,063,489 1,587,119 476,370 2,201,603 48.4W ash ing ton , D. C ............. 63 1,709,817 1,668,997 40,820 97.6 2.4 3,246,352 1,631,680 1,223,480 408,200 1,614,672 50.3
C le ve la n d ............................ 14 1,993,349 1,931,388 61,961 96.9 3.1 4,362,519 2,139,479 1,519,869 619,610 2,223,040 49.0B a ltim o re ............................ 31 2,047,309 2,008,627 38,682 98.1 1.9 2,654,182 1,559,359 1,172,539 386,820 1,094,823 58.8N e w a rk ................................ 57 2,274,033 2,195,195 78,838 96.5 3.5 4,197,842 2,760,098 1,971,718 788,380 1,437,744 65.8M inneap o lis -S t. Paul . . . 111 1,716,578 1,677,580 38,998 97.7 2.3 3,393,764 1,655,335 1,265,355 389,980 1,738,429 48.8B u ffa lo ................................. 15 1,823,389 1,748,057 75,332 95.9 4.1 3,487,184 2,328,331 1,575,011 753,320 1,158,853 66.8
H o u s to n .............................. 79 999,371 963,576 35,795 96.4 3.6 3,089,403 1,078,392 720,442 357,950 2,011,011 34.9M ilw a u k e e .......................... 61 1,110,545 1,083,598 26,947 97.6 2.4 2,213,239 1,120,265 850,795 269,470 1,092,974 50.6P a te rs o n ............................. 35 1,393,985 1,361,672 32,313 97.7 2.3 2,027,081 1,418,186 1,095,056 323,130 608,895 70.0S e a ttle .................................. 26 1,905,955 1,854,460 51,495 97.3 2.7 3,033,881 1,848,613 1,333,663 514,950 1,185,268 60.9D a lla s ................................... 98 1,219,399 1,183,080 36,319 97.0 3.0 3,605,053 1,161,057 797,867 363,190 2,443,996 32.2
C in c in n a t i........................... 48 896,225 876,954 19,271 97.8 2.2 1,603,592 731,709 538,999 192,710 871,883 45.6Kansas C ity ....................... 114 966,587 935,073 31,514 96.7 3.3 2,356,166 1,091,005 775,865 315,140 1,265,161 46.3San D ie g o ........................... 9 422,178 412,462 9,716 97.7 2.3 654,214 373,943 276,783 97,160 280,271 57.2A tla n ta ................................. 41 607,101 592,923 14,178 97.7 2.3 1,453,349 534,836 393,056 141,780 918,513 36.8M ia m i................................... 58 590,244 569,252 20,992 96.4 3.6 1,440,596 681,637 471,717 209,920 758,959 47.3
D e n ve r................................. 62 810,841 785,292 25,549 96.8 3.2 1,761,644 835,516 580,026 255,490 926,128 47.4New O rle a n s ;.................... 20 958,508 941,483 17,025 98.2 1.8 1,478,653 574,367 404,117 170,250 904,286 38.8P o rtla n d .............................. 15 1,460,592 1,421,787 38,805 97.3 2.7 2,457,275 1,431,022 1,042,972 388,050 1,026,253 58.2P ro v id e n c e ......................... 16 1,095,881 1,063,605 32,276 97.1 2.9 1,847,471 1,222,390 899,630 322,760 625,081 66.2San B e rn a rd in o ............... 7 65,039 63,795 1,244 98.1 1.9 73,856 52,406 39,966 12,440 21,450 71.0
T a m p a . ................................ 52 639,100 621,523 17,577 97.2 2.8 1,177,344 714,849 539,079 175,770 462,495 60.7L o u isv ille ............................. 17 573,831 563,126 10,705 98.1 1.9 1,015,041 448,244 341,194 107,050 566,797 44.2In d ia n a p o lis ...................... 40 817,983 800,045 17,938 97.8 2.2 1,635,890 724,066 544,686 179,380 911,824 44.3D a y to n ................................. 29 548,377 539,782 8,595 98.4 1.6 741,110 397,337 311,387 85,950 343,773 53.6San A n to n io ....................... 33 430,102 418,136 11,966 97.2 2.8 948,020 452,088 332,428 119,660 495,932 47.7
FEDERAL DEPO
SIT IN
SUR
ANC
E C
OR
POR
ATIO
N
Digitized for FRASER http://fraser.stlouisfed.org/ Federal Reserve Bank of St. Louis
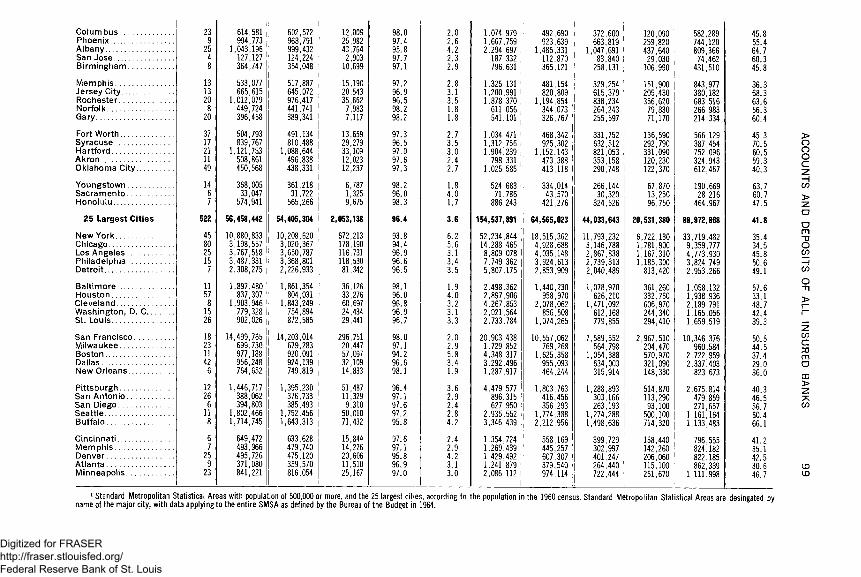
C o lu m b u s ........................... 23 614,581 602,572 12,009 98.0 2.0 1,074,979 492,690 372,600 120,090 582,289 45.8P h o e n ix ............................... 9 994,773 968,791 25,982 97.4 2.6 1,667,759 923,639 663,819 259,820 744,120 55.4A lb a n y .................................. 25 1,043,196 999,432 43,764 95.8 4.2 2,294,697 1,485,331 1,047,691 437,640 809,366 64.7San J o s e ............................. 4 127,127 124,224 2,903 97.7 2.3 187,332 112,870 83,840 29.030 74,462 60.3B irm in g h a m ...................... 8 364,747 354,048 10,699 97.1 2.9 796,631 365,121 258,131 106,990 431,510 45.8
M e m p h is ............................. 13 533,077 517,887 15,190 97.2 2.8 1,325,131 481,154 329,254 151,900 843,977 36.3Jersey C ity ......................... 13 665,615 645,072 20,543 96.9 3.1 1,200,991 820,809 615,379 205,430 380,182 68.3R o c h e s te r ........................... 20 1,012,079 976,417 35,662 96.5 3.5 1,878,370 1,194,854 838,234 356,620 683,516 63.6N o rfo lk ................................. 8 449,724 441,741 7,983 98.2 1.8 611,056 344,073 264,243 79,830 266,983 56.3G a ry ...................................... 20 396,458 389,341 7,117 98.2 1.8 541,101 326,767 255,597 71,170 214,334 60.4
Fort W o rth .......................... 37 504,793 491,134 13,659 97.3 2.7 1,034,471 468,342 331,752 136,590 566,129 45.3S yra cu se ............................. 17 839,767 810,488 29,279 96.5 3.5 1,312,756 925,302 632,512 292,790 387,454 70.5H a rt fo rd .............................. 21 1,121,753 1,088,644 33,109 97.0 3.0 1,904,239 1,152,143 821,053 331,090 752,096 60.5A k ro n .................................... 11 508,861 496,838 12,023 97.6 2.4 798,331 473,388 353,158 120,230 324,943 59.3O klahom a C ity .................. 49 450,568 438,331 12,237 97.3 2.7 1,025,585 413,118 290,748 122,370 612,467 40.3
Y o u n g s to w n ...................... 14 368,005 361,218 6,787 98.2 1.8 524,683 334,014 266,144 67,870 190,669 63.7S a c ra m e n to ....................... 6 33,047 31,722 1,325 96.0 4.0 71,786 43,570 30,320 13,250 28,216 60.7H o n o lu lu ............................. 7 574,941 565,266 9,675 98.3 1.7 886,243 421,276 324,526 96,750 464,967 47.5
25 Largest Cities 522 56,458,442 54,405,304 2,053,138 96.4 3.6 154,537,891 64,565,023 44,033,643 20,531,380 89,972,868 41.8
New Y o rk ............................ 45 10,880,833 10,208,620 672,213 93.8 6.2 52,234,844 18,515,362 11,793,232 6,722,130 33,719,482 35.4C h ica g o ................................ 80 3,198,557 3,020,367 178,190 94.4 5.6 14,288,465 4,928,688 3,146,788 1,781,900 9,359,777 34.5Los A n g e le s ....................... 25 3,767,518 3,650,787 116,731 96.9 3.1 8,809,078 4,035,148 2,867,838 1,167,310 4,773,930 45.8P h ila d e lp h ia ...................... 15 3,487,331 3,368,801 118,530 96.6 3.4 7,749,362 3,924,613 2,739,313 1,185,300 3,824,749 50.6D e tro it .................................. 7 2,308,275 2,226,933 81,342 96.5 3.5 5,807,175 2,853,909 2,040,489 813,420 2,953,266 49.1
B a ltim o re ............................ 11 1,897,480 1,861,354 36,126 98.1 1.9 2,498,362 1,440,230 1,078,970 361,260 1,058,132 57.6H o u s to n ............................... 57 837,307 804,031 33,276 96.0 4.0 2,897,906 958,970 626,210 332,760 1,938,936 33.1C le v e la n d ............................ 8 1,903,946 1,843,249 60,697 96.8 3.2 4,267,853 2,078,062 1,471,092 606,970 2,189,791 48.7W ash ing ton , D. C ............. 15 779,328 754,894 24,434 96.9 3.1 2,021,564 856,508 612,168 244,340 1,165,056 42.4St. L o u is .............................. 26 902,026 872,585 29,441 96.7 3.3 2,733,784 1,074,265 779,855 294,410 1,659,519 39.3
San F ra n c is c o ................... 18 14,499,765 14,203,014 296,751 98.0 2.0 20,903,438 10,557,062 7,589,552 2,967,510 10,346,376 50.5M ilw a u k e e .......................... 23 699,730 679,283 20,447 97.1 2.9 1,729,852 769,268 564,798 204,470 960,584 44.5B o s to n ................................. 11 977,188 920,091 57,097 94.2 5.8 4,348,317 1,625,358 1,054,388 570,970 2,722,959 37.4D a lla s .................................... 42 956,248 924,139 32,109 96.6 3.4 3,292,496 955,093 634,003 321,090 2,337,403 29.0New O rle a n s ...................... 6 764,652 749,819 14,833 98.1 1.9 1,287,917 464,244 315,914 148,330 823,673 36.0
P it ts b u rg h .......................... 12 1,446,717 1,395,230 51,487 96.4 3.6 4.479,577 1,803,763 1,288,893 514,870 2,675,814 40.3San A n to n io ....................... 26 388,062 376,733 11,329 97.1 2.9 896,315 416,456 303,166 113,290 479,859 46.5San D ie g o ........................... 6 394,803 385,493 9,310 97.6 2.4 627,950 356,293 263,193 93,100 271,657 56.7S e a tt le .................................. 11 1,802,466 1,752,456 50,010 97.2 2.8 2,935,552 1,774,388 1,274,288 500,100 1,161,164 60.4B u ffa lo ................................. 8 1,714,745 1,643,313 71,432 95.8 4.2 3,346,439 2,212,956 1,498,636 714,320 1,133,483 66.1
C in c in n a t i........................... 6 649,472 633,628 15,844 97.6 2.4 1,354,724 558,169 399,729 158,440 796,555 41.2M e m p h is ............................. 7 493,966 479,740 14,226 97.1 2.9 1,269,439 445,257 302,997 142,260 824,182 35.1D e n v e r ................................. 25 495,726 475,120 20,606 95.8 4.2 1,429,492 607,307 401,247 206,060 822,185 42.5A t la n ta ................................. 9 371,080 359,570 11,510 96.9 3.1 1,241,879 379,540 264,440 115,100 862,339 30.6M in n e a p o lis ....................... 23 841,221 816,054 25,167 97.0 3.0 2,086,112 974,114 722,444 251,670 1,111,998 46.7
1 Standard Metropolitan Statistical Areas with population of 500,000 or more, and the 25 largest cities, according to the population in the 1960 census. Standard Metropolitan Statistical Areas are desingated by name of the major city, with data applying to the entire SMSA as defined by the Bureau of the Budget in 1964.
ACCOUNTS
AND DEPO
SITS OF
ALL INSURED
BA
NK
S
Digitized for FRASER http://fraser.stlouisfed.org/ Federal Reserve Bank of St. Louis

Table 24. DISTRIBUTION OF ACCOUNTS ACCORDING TO SIZE, INSURED COMMERCIAL BANKS, NOVEMBER 18, 1964BANKS GROUPED BY FEDERAL DEPOSIT INSURANCE CORPORATION DISTRICT AND STATE
N u m be r o f accou nts Percen t o f to ta l accou n ts
FDIC D is tr ic t and S ta te N u m b e r o f banks
Total$10 ,000 o r less
$ 1 0 ,0 0 0to
$ 2 5 ,0 0 0
$ 2 5 ,0 0 0to
$ 1 0 0 ,0 0 0
M orethan
$ 1 0 0 ,0 0 0
$ 1 0 ,0 0 0 or less
$ 1 0 ,0 0 0to
$ 2 5 ,0 0 0
$ 2 5 ,0 0 0to
$ 1 0 0 ,0 0 0
M orethan
$ 1 0 0 ,0 0 0
Total United States.................................................. 13,468 154,975,451 151,226,160 2,657,034 829,741 262,516 97.6% 1.7% • 5% • 2%
50 States and D. C................................................ 13,460 154,389,966 150,648,081 2,652,018 827,945 261,922 97.6 1.7 .5 .2
Other Areas............................................................. 8 585,485 578,079 5,016 1,796 594 98.7 .9 .3 .1
FDIC DistrictD is tr ic t 1 ..................................................................... 380 7,539,248 7,384,795 103,780 37,989 12,684 98.0 1.4 .5 .2D is tr ic t 2 ..................................................................... 587 21,942,490 21,280,917 441,989 157,188 62,396 97.0 2.0 .7 .3D is tr ic t 3 ..................................................................... 1,136 18,458,136 18,044,685 304,604 82,697 26,150 97.8 1.7 .4 .1D is tr ic t 4 ..................................................................... 877 11,585,614 11,366,505 154,699 49,767 14,643 98.1 1.3 .4 .1D is tr ic t 5 ..................................................................... 1,241 9,173,635 8,962,249 146,983 49,989 14,414 97.7 1.6 .5 .2D is tr ic t 6 ..................................................................... 1,505 9,764,686 9,542,344 155,189 51,406 15,747 97.7 1.6 .5 .2D is tr ic t 7 ..................................................................... 1,358 15,127,377 14,802,450 243,869 63,616 17,442 97.9 1.6 .4 .1D is tr ic t 8 ..................................................................... 1,680 11,764,118 11,402,112 265,525 73,071 23,410 96.9 2.3 .6 .2D is tr ic t 9 ..................................................................... 1,171 5,264,958 5,160,404 76,173 21,968 6,413 98.0 1.4 .4 .1D is tr ic t 1 0 .................................................................. 1,702 6,704,760 6,535,675 120,883 37,546 10,656 97.5 1.8 .6 .2D is tr ic t 1 1 .................................................................. 1,399 11,101,652 10,802,908 203,072 72,797 22,875 97.3 1.8 .7 .2D is tr ic t 1 2 .................................................................. 432 26,548,777 25,941,116 440,268 131,707 35,686 97.7 1.7 .5 .1
StateA la b a m a ..................................................................... 252 1,900,834 1,859,044 29,722 9,464 2,604 97.8 1.6 .5 .1A r iz o n a ........................................................................ 15 1,127,156 1,097,760 22,284 5,717 1,395 97.4 2.0 .5 .1A rk a n s a s ..................................................................... 242 1,194,461 1,166., 493 19,784 6,518 1,666 97.7 1.7 .5 .1C a lifo rn ia .................................................................... 186 20,148,414 19,687,311 332,166 101,496 27,441 97.7 1.6 .5 .1C o lo ra d o ..................................................................... 203 1,430,359 1,389,351 29,220 9,136 2,652 97.1 2.0 .6 .2
C o n n e c tic u t............................................................... 60 1,988,887 1,946,956 30,079 9,290 2,562 97.9 1.5 .5 .1D e law are .................................................................... 20 423,434 413,279 7,183 2,313 659 97.6 1.7 .5 .2D is tr ic t o f C o lu m b ia ............................................... 15 779,328 754,894 15,801 6,512 2,121 96.9 2.0 .8 .3F lo rid a ......................................................................... 415 3,588,226 3,493,048 67,740 21,336 6,102 97.3 1.9 .6 .2G eorg ia ........................................................................ 380 2,466,666 2,418,901 31,279 12,331 4,155 98.1 1.3 .5 .2
100 FEDERAL
DEPOSIT
INSU
RAN
CE
CO
RP
OR
ATIO
N
Digitized for FRASER http://fraser.stlouisfed.org/ Federal Reserve Bank of St. Louis
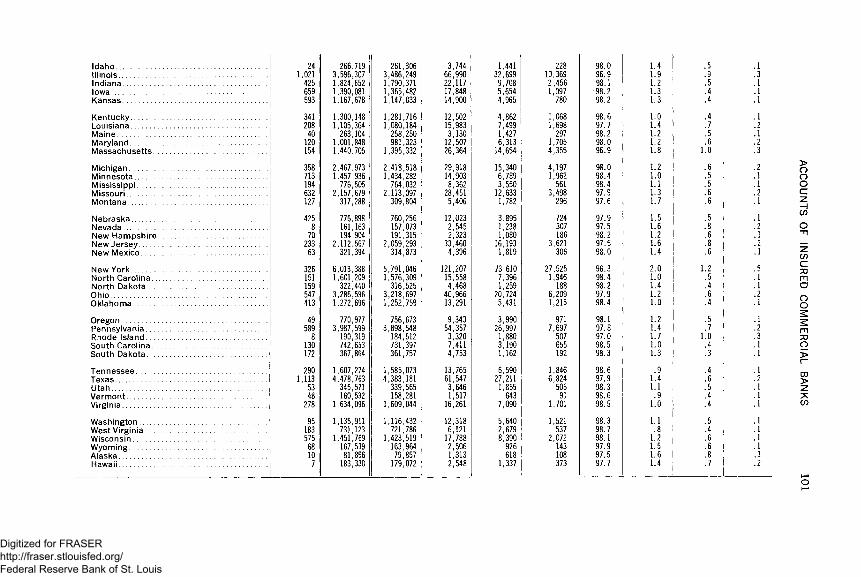
Id a h o ........................................................................... 24 266,719 261,306Illin o is .......................................................................... 1,021 3,596,307 3,486,249In d ia n a ........................................................................ 425 1,824,652 1,790,371
659 1,390,081 1,365,482K a nsas........................................................................ 593 1,167,678 1,147,033
K e n tu c k y .................................................................... 341 1,300,148 1,281,716Lou is iana .................................................................... 208 1,105,364 1,080,184M a in e ........................................................................... 40 263,104 258,250M a ry la n d .................................................................... 120 1,001,848 981,323M a ssa ch u se tts ......................................................... 154 1,440,705 1,395,332
M ich ig a n ..................................................................... 358 2,467,973 2,418,518M in n e so ta .................................................................. 713 1,457,936 1,434,282M iss iss ip p i................................................................. 194 776,505 764,032M isso u ri...................................................................... 632 2,157,679 2,113,097M o n ta n a ..................................................................... 127 317,288 309,804
N e b ra ska ................................................................... 425 776,898 760,256N e va d a ........................................................................ 8 161,163 157,073New H a m p s h ire ...................................................... 70 194,904 191,315New J e rs e y ................................................................ 233 2,112,567 2,059,293New M e x ico ............................................................... 63 321,394 314,873
New Y o rk .................................................................... 326 6,013,388 5,791,046N o rth C a ro lin a ......................................................... 151 1,601,209 1,576,309N o rth D a ko ta ............................................................ 159 322,440 316,525O h io .............................................................................. 547 3,286,596 3,218,697O k la h o m a ................................................................... 413 1,272,696 1,252,759
O re g o n ......................................................................... 49 770,977 756,673P e nnsy lvan ia ............................................................ 589 3,987,599 3,898,548Rhode Is la n d ............................................................ 8 190,319 184,612South C a ro lin a ......................................................... 130 742,653 731,397South D a ko ta ............................................................ 172 367,864 361,757
T e n n e sse e ................................................................. 290 1,607,274 1,585,073T e xa s ............................................................................ 1,113 4,478,763 4,383,181U ta h ............................................................................. 53 345,571 339,565V e rm o n t...................................................................... 48 160,532 158,281V irg in ia ........................................................................ 278 1,634,096 1,609,044
W a sh in g to n ............................................................... 95 1,135,911 1,116,432W est V irg in ia ............................................................. 183 731,123 721,786W isco n s in ................................................................... 575 1,451,769 1,423,519W yo m in g ..................................................................... 68 167,539 163,964A la s k a .......................................................................... 10 81,896 79,857H a w a ii......................................................................... 7 183,330 179,072
3,74466,99022,11717,84814,900
12,50215,9833,130
12,50726,364
29,91814,9038,362
28,4515,406
12,0232,5452,323
33,4604,396
121,20715,5584,468
40,96613,291
9,34354,3573,3207,4114,753
13,76561,5473,6461,517
16,261
12,3186,121
17,7882,5061,3132,548
1,441 228 98.0 1.4 .532,699 10,369 96.9 1.9 .99,708 2,456 98.1 1.2 .55,654 1,097 98.2 1.3 .44,965 780 98.2 1.3 .4
4,862 1,068 98.6 1.0 .47,499 1,698 97.7 1.4 .71,427 297 98.2 1.2 .56,313 1,705 98.0 1.2 .6
14,654 4,355 96.9 1.8 1.0
15,340 4,197 98.0 1.2 .66,789 1,962 98.4 1.0 .53,550 561 98.4 1.1 .5
12,633 3,498 97.9 1.3 .61,782 296 97.6 1.7 .6
3,895 724 97.9 1.5 .51,238 307 97.5 1.6 .81,080 186 98.2 1.2 .6
16,193 3,621 97.5 1.6 .81,819 306 98.0 1.4 .6
73,610 27,525 96.3 2.0 1.27,396 1,946 98.4 1.0 .51,259 188 98.2 1.4 .4
20,724 6,209 97.9 1.2 .65,431 1,215 98.4 1.0 .4
3,990 971 98.1 1.2 .526,997 7,697 97.8 1.4 .7
1,880 507 97.0 1.7 1.03,190 655 98.5 1.0 .41,162 192 98.3 1.3 .3
6,590 1,846 98.6 .9 .427,211 6,824 97.9 1.4 .6
1,855 505 98.3 1.1 .5643 91 98.6 .9 .4
7,090 1,701 98.5 1.0 .4
5,640 1,521 98.3 1.1 .52,679 537 98.7 .8 .48,390 2,072 98.1 1.2 .6
926 143 97.9 1.5 .6618 108 97.5 1.6 .8
1,337 373 97.7 1.4 .7
ACCOUNTS
OF INSURED
CO
MM
ERC
IAL BANKS
101
Digitized for FRASER http://fraser.stlouisfed.org/ Federal Reserve Bank of St. Louis
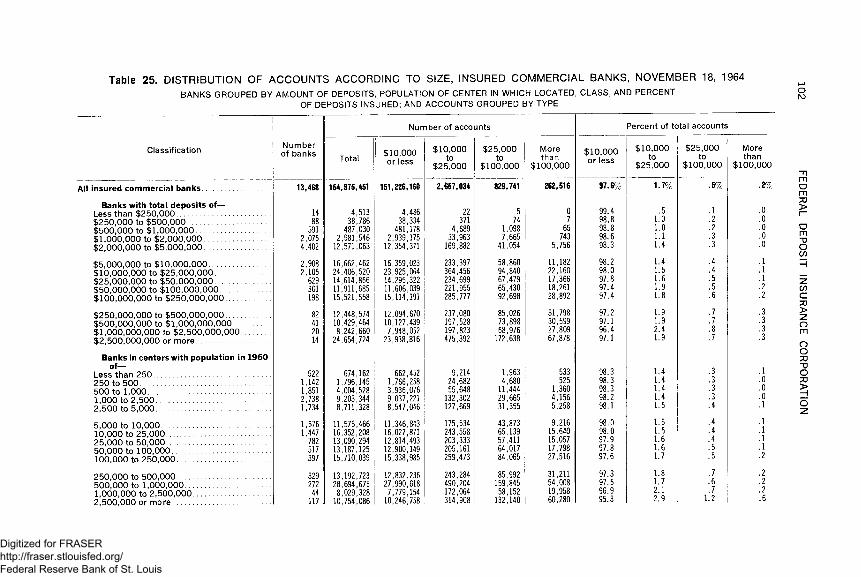
Table 25. DISTRIBUTION OF ACCOUNTS ACCORDING TO SIZE, INSURED COMMERCIAL BANKS, NOVEMBER 18, 1964 BA NKS GROUPED BY AM O UNT OF DEPOSITS, POPULATION OF CENTER IN W HICH LOCATED, CLASS, AND PERCENT
OF DEPOSITS INSURED; AND ACCOUNTS GROUPED BY TYPE
C lass ifica tion
A ll in su re d co m m e rc ia l b a n k s ...............................
B a nks w ith to ta l d e p o s its o f—Less th a n $ 2 5 0 ,0 0 0 ............................................$ 2 5 0 ,0 0 0 to $ 5 0 0 ,0 0 0 .......................................$ 5 0 0 ,0 0 0 to $ 1 ,0 0 0 ,0 0 0 ...................................$ 1 ,0 0 0 ,0 0 0 to $ 2 ,0 0 0 ,0 0 0 ...............................$ 2 ,0 0 0 ,0 0 0 to $ 5 ,0 0 0 ,0 0 0 ...............................
$ 5 ,0 0 0 ,0 0 0 to $ 1 0 ,0 0 0 ,0 0 0 ............................$ 1 0 ,0 0 0 ,0 0 0 to $ 2 5 ,0 0 0 ,0 0 0 .........................$ 2 5 ,0 0 0 ,0 0 0 to $ 5 0 ,0 0 0 ,0 0 0 .........................$ 5 0 ,0 0 0 ,0 0 0 to $ 1 0 0 ,0 0 0 ,0 0 0 .......................$ 1 0 0 ,0 0 0 ,0 0 0 to $ 2 5 0 ,0 0 0 ,0 0 0 ....................
$ 2 5 0 ,0 0 0 ,0 0 0 to $ 5 0 0 ,0 0 0 ,0 0 0 ....................$ 5 0 0 ,0 0 0 ,0 0 0 to $ 1 ,0 0 0 ,0 0 0 ,0 0 0 ................$ 1 ,0 0 0 ,0 0 0 ,0 0 0 to $ 2 ,5 0 0 ,0 0 0 ,0 0 0 ............$ 2 ,5 0 0 ,0 0 0 ,0 0 0 o r m o re ...................................
B a nks in c e n te rs w ith p o p u la tio n in 1960 o f—
Less th a n 2 5 0 ........................................................2 5 0 to 5 0 0 ...............................................................5 0 0 to 1 ,0 0 0 ...........................................................1 .000 to 2 ,5 0 0 .......................................................2 ,5 0 0 to 5 ,0 0 0 .......................................................
5 .0 0 0 to 1 0 ,0 0 0 ....................................................10 .0 0 0 to 2 5 ,0 0 0 ..................................................2 5 .0 0 0 to 5 0 ,0 0 0 .................................................5 0 .0 0 0 to 1 0 0 ,0 0 0 ...............................................1 0 0 .0 0 0 to 2 5 0 ,0 0 0 ............................................
2 5 0 .0 0 0 to 5 0 0 ,0 0 0 ............................................5 0 0 .0 0 0 to 1 ,0 0 0 ,0 0 0 ........................................1 ,0 0 0 ,0 0 0 to 2 ,5 0 0 ,0 0 0 ....................................2 .5 0 0 .0 0 0 or m o re ...............................................
N u m be r o f banks
13,468
1488
5912,0754,402
2,9082,105
629301198
5221,1421,8512,7381,734
1,5761,447
782517397
32927244
117
N um ber o f accounts Percen t o f to ta l accounts
Total$10 ,000 or less
$ 1 0 ,0 0 0to
$ 2 5 ,0 0 0
$25 ,0 0 0to
$ 1 0 0 ,0 0 0
Morethan
$ 1 0 0 ,0 0 0
$ 1 0 ,0 0 0 o r less
$ 1 0 ,0 0 0to
$25 ,0 0 0
$25 ,0 0 0to
$ 1 0 0 ,0 0 0
Morethan
$1 0 0 ,0 0 0
154,975,451 151,226,160 2,657,034 829,741 262,516 97.6% 1.7% ■ 5% ■ 2%
4,513 4,486 22 5 0 99.4 .5 .1 .038,786 38,334 371 74 7 98.8 1.0 .2 .0
487,030 481,178 4,689 1,098 65 98.8 1.0 .2 .02,981,546 2,939,175 33,963 7,665 743 98.6 1.1 .3 .0
12,571,063 12,354,371 169,882 41,054 5,756 98.3 1.4 .3 .0
16,662,462 16,359,023 233,397 58,860 11,182 98.2 1.4 .4 .124,406,520 23,925,064 364,456 94,840 22,160 98.0 1.5 .4 .114,614,866 14,295,322 234,699 67,479 17,366 97.8 1.6 .5 .111,911,685 11,606,039 221,955 65,430 18,261 97.4 1.9 .5 .215,521,558 15,114,191 285,777 92,698 28,892 97.4 1.8 .6 .2
12,448,574 12,094,670 237,080 85,026 31,798 97.2 1.9 .7 .310,429,464 10,127,439 197,528 73,898 30,599 97.1 1.9 .7 .38,242,660 7,948,052 197,823 68,976 27,809 96.4 2.4 .8 .3
24,654,724 23,938,816 475,392 172,638 67,878 97.1 1.9 .7 .3
674,162 662,452 9,214 1,963 533 98.3 1.4 .3 .11,796,145 1,766,258 24,682 4,680 525 98.3 1.4 .3 .0
4,004,528 3,936,076 55,648 11,444 1,360 98.3 1.4 .3 .09,203,344 9,037,221 132,302 29,665 4,156 98.2 1.4 .3 .08,711,328 8,547,046 127,669 31,355 5,258 98.1 1.5 .4 .1
11,575,466 11,346,843 175,534 43,873 9,216 98.0 1.5 .4 .116,352,208 16,027,871 243,558 65,139 15,640 98.0 1.5 .4 .113,090,294 12,814,493 203,333 57,411 15,057 97.9 1.6 .4 .1
.113,187,125 12,900,149 205,161 64,017 17,798 97.8 1.6 .515,710,039 15,338,985 259,473 84,065 27,516 97.6 1.7 .5 .2
13,192,723 12,832,236 243,284 85,992 31,211 97.3 1.8 .7 .2
28,694,675 27,990,618 490,204 159,845 54,008 97.5 1.7 .6 .2
8,029,328 7,779,154 172,064 58,152 19,958 96.9 2.1 .7 .2
10,754,086 10,246,758 314,908 132,140 60,280 95.3 2.9 1.2 .6
102 FEDERAL
DEPOSIT
INSU
RAN
CE
CO
RP
OR
ATIO
N
Digitized for FRASER http://fraser.stlouisfed.org/ Federal Reserve Bank of St. Louis

C lass o f b a n kN a tio n a l......................................................................S ta te , m e m b e rs F. R. S y s te m ...........................S tate, n o t m e m b e rs F. R. S y s te m ..................
4,7551,4597,254
84,110,84332,167,18138,697,427
82,002,01931,237,21337,986,928
B a nks w ith p e rc e n t o f d e p o s its in su re d o f—
100 p e rc e n t..............................................................90 to 1 0 0 ...................................................................80 to 9 0 ......................................................................70 to 8 0 ......................................................................60 to 7 0 ......................................................................50 to 6 0 ......................................................................
51,3254,3234,0252,1291,001
1,9723,055,996
17,635,28928,512,27726,877,84838,613,620
1,9723,022,852
17,346,29027,955,31626,300,45637,773,931
4 0 to 5 0 ......................................................................3 0 to 4 0 ......................................................................20 to 3 0 ......................................................................10 to 2 0 ......................................................................O to 1 0 .........................................................................
38917279164
18,368,7759,487,4538,753,0543,507,653
161,514
17,849,7449,167,1168,335,5633,325,754
147,166
Type o f acco u n tD em and ( IP C )1........................................................ 69,986,658
68,631,26196,634
68,449,173 66,807,568
80 077Savings and tim e ( IP C )1......................................U. S. G o ve rn m e n t...................................................S tate and po litica l s u b d iv is io n s ........................ 381,276 242,503
34,3541,299,073
898,32413,415,088
In te rb a n k ................................................................... 128,016U n invested tru s t fu n d s ........................................ 1,360,398
935,31313,455,895
D ra fts ...................................................O the r ite m s ...............................................................
1 IPC refers to individuals, partnerships, and corporations.
,486,535 469,512 152,777 97.5 1.8 .6 .2631,377 218,485 80,106 97.1 2.0 .7 .2539,122 141,744 29,633 98.2 1.4 .4 .1
0 0 0 100.0 .0 .0 .029,535 3,527 82 98.9 1.0 .1 .0
240,440 43,748 4,811 98.4 1.4 .2 .0439,440 99,374 18,147 98.0 1.5 .3 .1432,109 117,831 27,452 97.9 1.6 .4 .1607,531 183,060 49,098 97.8 1.6 .5 .1
352,717 124,905 41,409 97.2 1.9 .7 .2201,748 84,578 34,011 96.6 2.1 .9 .4249,145 113,870 54,476 95.2 2.8 1.3 .699,405 54,005 28,489 94.8 2.8 1.5 .84,964 4,843 4,541 91.1 3.1 3.0 2.8
954,135 455,982 127,368 97.8 1.4 .7 .2,550,060 231,254 42,379 97.3 2.3 .3 .1
5,531 5,915 5,111 82.9 5.7 6.1 5.350,559 54,839 33,375 63.6 13.3 14.4 8.822,265 34,504 36,893 26.8 17.4 27.0 28.835,763 19,849 5,713 95.5 2.6 1.5 .415,288 15,670 6,031 96.0 1.6 1.7 .623,433 11,728 5,646 99.7 .2 .1 .0
ACCOUNTS
OF INSURED
CO
MM
ERC
IAL BANKS
103
Digitized for FRASER http://fraser.stlouisfed.org/ Federal Reserve Bank of St. Louis

Table 26. DISTRIBUTION OF DEMAND ACCOUNTS OF INDIVIDUALS, PARTNERSHIPS, AND CORPORATIONS ACCORDING TO SIZEOF ACCOUNT, INSURED COMMERCIAL BANKS, NOVEMBER 18, 1964
BANKS GROUPED BY FEDERAL DEPOSIT INSURANCE CORPORATION DISTRICT AND STATE
FDIC D is tr ic t and S ta teN u m b e r o f banks
N u m be r o f accou n ts P e rcen t o f to ta l acco u n ts
Total$ 1 0 ,0 0 0 or less
$ 1 0 ,0 0 0to
$ 2 5 ,0 0 0
$ 2 5 ,0 0 0to
$ 1 0 0 ,0 0 0
M oreth a n
$ 1 0 0 ,0 0 0
$ 1 0 ,0 0 0 o r less
$ 1 0 ,0 0 0to
$ 2 5 ,0 0 0
$ 2 5 ,0 0 0to
$ 1 0 0 ,0 0 0
M orethan
$ 1 0 0 ,0 0 0
Total United States................................................... 13,468 69,986,658 68,449,173 954,135 455,982 127,368 97.8% 1.4% ■ 7% • 2%
50 States and D. C................................................. 13,460 69,878,492 68,343,785 952,442 455,112 127,153 97.8 1.4 .7 .2
Other Areas............................................................. 8 108,166 105,388 1,693 870 215 97.4 1.6 .8 .2
FDIC DistrictD is tr ic t 1 ..................................................................... 380 3,109,055 3,025,915 49,875 26,217 7,048 97.3 1.6 .8 .2
D is tr ic t 2 ..................................................................... 587 8,439,015 8,155,472 159,523 92,204 31,816 96.6 1.9 1.1 .4
D is tr ic t 3 ..................................................................... 1,136 7,274,195 7,117,245 95,323 47,721 13,906 97.8 1.3 .7 .2D is tr ic t 4 ............................................................... 877 6,097,952 5,993,138 65,635 31,180 7,999 98.3 1.1 .5 .1
D is tr ic t 5 ..................................................................... 1,241 5,526,669 5,429,665 62,731 27,892 6,381 98.2 1.1 .5 .1D is tr ic t 6 ..................................................................... 1,505 5,851,517 5,752,461 64,206 27,754 7,096 98.3 1.1 .5 .1
D is tr ic t 7 ..................................................................... 1,358 5,744,394 5,632,408 69,823 33,438 8,725 98.1 1.2 .6 .2
D is tr ic t 8 ..................................................................... 1,680 4,986,388 4,851,731 84,838 38,353 11,466 97.3 1.7 .8 .2
D is tr ic t 9 ..................................................................... 1,171 2,465,528 2,422,368 29,530 10,992 2,638 98.2 1.2 .4 .1
D is tr ic t 1 0 .................................................................. 1,702 4,170,545 4,093,378 53,344 19,863 3,960 98.1 1.3 .5 .1
D is tr ic t 1 1 .................................................................. 1,399 6,445,978 6,309,060 88,114 39,311 9,493 97.9 1.4 C .1
D is tr ic t 1 2 .................................................................. 432 9,875,422 9,666,332 131,193 61,057 16,840 97.9 1.3 ’.6 .2
StateA la b a m a ...................................................................... 252 1,152,028 1,134,673 11,087 5,096 1,172 98.5 1.0 .4 .1
A riz o n a ........................................................................ 15 540,457 530,822 6,188 2,782 665 98.2 1.1 .5 .1
A rk a n s a s ..................................................................... 242 786,416 772,575 9,488 3,669 684 98.2 1.2 .5 .1
C a lifo rn ia .................................................................... 186 6,929,855 6,776,354 95,736 44,938 12,827 97.8 1.4 .6 .2
C o lo ra d o ..................................................................... 203 785,734 769,366 10,624 4,646 1,098 97.9 1.4 .6 .1
C o n n e c tic u t............................................................... 60 859,491 838,125 13,221 6,533 1,612 97.5 1.5 .8 .2
D e law are ..................................................................... 20 204,894 199,745 3,163 1,531 455 97.5 1.5 .7 .2
D is tr ic t o f C o lu m b ia ............................................... 15 387,023 373,279 7,777 4,512 1,455 96.4 2.0 1.2 .4Florida ...................................................... 415 2,126,890 2,084,156 27,994 12,133 2,607 98.0 1.3 .6 .1
G e o rg ia ........................................................................ 380 1,471,246 1,446,804 15,288 7,113 2,041 98.3 1.0 .5 .1
104 FEDERAL
DEPOSIT
INSU
RAN
CE
CO
RP
OR
ATIO
N
Digitized for FRASER http://fraser.stlouisfed.org/ Federal Reserve Bank of St. Louis
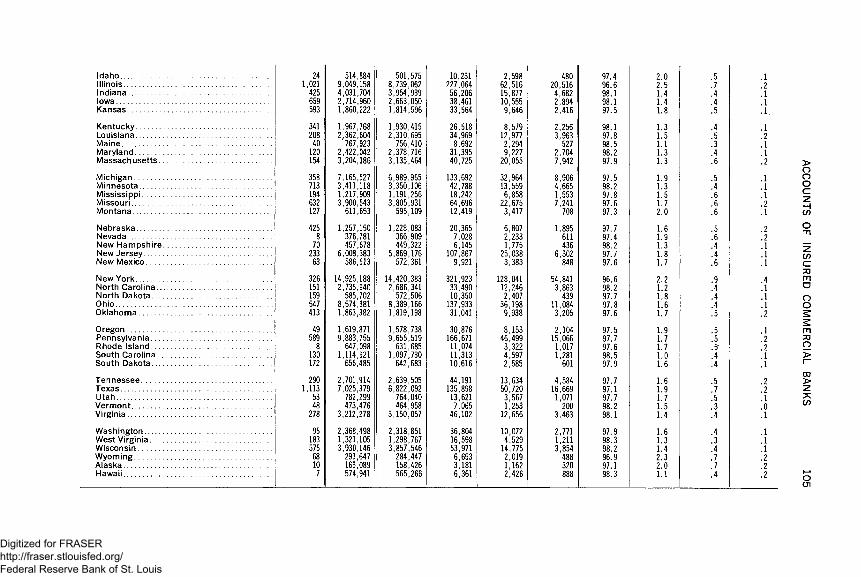
Id a h o ........................................................................... 24 514,884 501,575Illin o is .......................................................................... 1,021 9,049,158 8,739,062In d ia n a ........................................................................ 425 4,031,704 3,954,939
659 2,714,960 2,663,050K a n sa s ........................................................................ 593 1,860,222 1,814,596
K e n tu c k y .................................................................... 341 1,967,768 1,930,415Lo u is ia n a .................................................................... 208 2.362,604 2,310,695M a in e ........................................................................... 40 767,923 756,410M a ry la n d .................................................................... 120 2,422,042 2,378,716M a ssa ch u se tts ........................................................ 154 3,204,186 3,135,464
M ic h ig a n ..................................................................... 358 7,165,527 6,989,965M in n e so ta .................................................................. 713 3,411,118 3,350,106M is s is s ip p i................................................................. 194 1,217,909 1,191,256M is s o u ri...................................................................... 632 3,900,543 3,805,931M o n ta n a ..................................................................... 127 611,653 595,109
N e b ra s k a ................................................................... 425 1,257,150 1,228,083N e va d a ........................................................................ 8 376,781 366,909New H a m p s h ire ...................................................... 70 457,678 449,322New J e rs e y ................................................................ 233 6,008,383 5,869,176New M e x ico ............................................................... 63 586,513 572,361
New Y o rk .................................................................... 326 14,925,188 14,420,383N o rth C a ro lin a ......................................................... 151 2,735,940 2,686,341N o rth D a k o ta ............................................................ 159 585,702 572,506O h io .............................................................................. 547 8,574,381 8,389,166O k la h o m a .................................................................. 413 1,863,382 1,819,198
O re g o n ........................................................................ 49 1,619,871 1,578,738P e nnsy lvan ia ............................................................ 589 9,883,755 9,655,519Rhode Is la n d ............................................................ 8 647,098 631,685South C a ro lin a ......................................................... 130 1,114,921 1,097,730South D a ko ta ............................................................ 172 656,485 642,683
T e n n e sse e ................................................................. 290 2,701,914 2,639,505T e xa s ........................................................................... 1,113 7,025,379 6,822,092U ta h ............................................................................. 53 782,299 764,040V e rm o n t...................................................................... 48 473,476 464,958V irg in ia ........................................................................ 278 3,212,278 3,150,057
W a sh in g to n ............................................................... 95 2,368,498 2,318,851W est V irg in ia ............................................................. 183 1,321,105 1,298,767W isco n s in ................................................................... 575 3,930,146 3,857,546W yo m in g ..................................................................... 68 293,647 284,447A la s k a .......................................................................... 10 163,089 158,426H a w a ii.......................................................................... 7 574,941 565,266
10,231227,06456,20638,46133,564
26,51834,9698,692
31,39540,725
133,69242,78818,24264,69612,419
20,3657,0286,145
107,8679,921
321,92333,49010,350
137,93331,041
30,876166,67111,07411,31310,616
44,191 135. 13,621 7,065
46,102
36,804 16,598 53,971 6,1 3,181 6,361
2,598 480 97.4 2.0 .562,516 20,516 96.6 2.5 .715,877 4,682 98.1 1.4 .410,555 2,894 98.1 1.4 .49,646 2,416 97.5 1.8 .5
8,579 2,256 98.1 1.3 .412,977 3,963 97.8 1.5 .52,294 527 98.5 1.1 .39,227 2,704 98.2 1.3 .4
20,055 7,942 97.9 1.3 .6
32,964 8,906 97.5 1.9 .513,559 4,665 98.2 1.3 .46,858 1,553 97.8 1.5 .6
22,675 7,241 97.6 1.7 .63,417 708 97.3 2.0 .6
6,807 1,895 97.7 1.6 .52,233 611 97.4 1.9 .61,775 436 98.2 1.3 .4
25,038 6,302 97.7 1.8 .43,383 848 97.6 1.7 .6
128,041 54,841 96.6 2.2 .912,246 3,863 98.2 1.2 .42,407 439 97.7 1.8 .4
36,198 11,084 97.8 1.6 .49,938 3,205 97.6 1.7 .5
8,153 2,104 97.5 1.9 .546,499 15,066 97.7 1.7 .53,322 1,017 97.6 1.74,597 1,281 98.5 1.0 .42,585 601 97.9 1.6 .4
13,634 4,584 97.7 1.6 .550,720 16,669 97.1 1.9 .73,567 1,071 97.7 1.7 .51,253 200 98.2 1.5 .3
12,656 3,463 98.1 1.4 .4
10,072 2,771 97.9 1.6 .44,529 1,211 98.3 1.3 .3
14,775 3,854 98.2 1.4 .42,019 488 96.9 2.3 .71,162 320 97.1 2.0 .72,426 888 98.3 1.1 .4
ACCOUNTS
OF INSURED
CO
MM
ERC
IAL BANKS
105
Digitized for FRASER http://fraser.stlouisfed.org/ Federal Reserve Bank of St. Louis
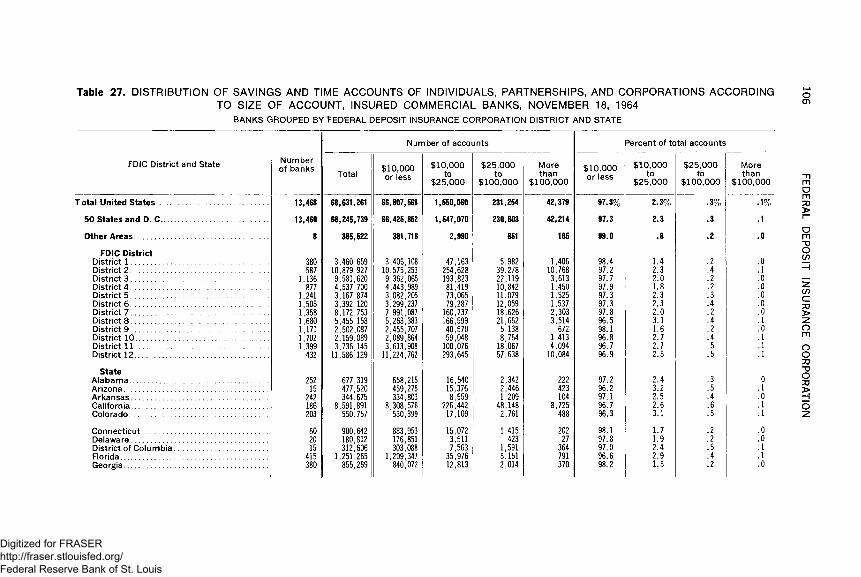
Table 27. DISTRIBUTION OF SAVINGS AND TIME ACCOUNTS OF INDIVIDUALS, PARTNERSHIPS, AND CORPORATIONS ACCORDINGTO SIZE OF ACCOUNT, INSURED COMMERCIAL BANKS, NOVEMBER 18, 1964
BANKS GROUPED BY FEDERAL DEPOSIT INSURANCE CORPORATION DISTRICT AND STATE
FDIC D is tric t and State N u m b e r o f banks
N u m be r o f accou n ts P e rcen t o f to ta l accou n ts
Total$10 ,0 0 0 or less
$ 1 0 ,0 0 0to
$ 2 5 ,0 0 0
$ 2 5 ,0 0 0to
$ 1 0 0 ,0 0 0
M oreth a n
$ 1 0 0 ,0 0 0
$ 1 0 ,0 0 0 o r less
$ 1 0 ,0 0 0to
$ 2 5 ,0 0 0
$ 2 5 ,0 0 0to
$ 1 0 0 ,0 0 0
M orethan
$ 1 0 0 ,0 0 0
T otal United States.................................................. 13,468 68,631,261 66,807,568 1,550,060 231,254 42,379 97.3% 2.3% ■ 3% ■ 1%
50 States and D. C................................................. 13,460 68,245,739 66,425,852 1,547,070 230,603 42,214 97.3 2.3 .3 .1
Other Areas............................................................. 8 385,522 381,716 2,990 651 165 99.0 .8 .2 .0
FDIC DistrictD is tr ic t 1 ..................................................................... 380 3,460,659 3,406,108 47,163 5,982 1,406 98.4 1.4 .2 .0D is tr ic t 2 ..................................................................... 587 10,879,927 10,575,253 254,628 39,278 10,768 97.2 2.3 .4 .1D is tr ic t 3 ..................................................................... 1,136 9,581,620 9,362,065 193,823 22,119 3,613 97.7 2.0 .2 .0D is tr ic t 4 ..................................................................... 877 4,537,700 4,443,989 81,419 10,842 1,450 97.9 1.8 .2 .0D is tr ic t 5 ..................................................................... 1,241 3,167,874 3,082,205 73,065 11,079 1,525 97.3 2.3 .3 .0D is tr ic t 6 ..................................................................... 1,505 3,392,120 3,299,237 79,287 12,059 1,537 97.3 2.3 .4 .0D is tr ic t 7 ..................................................................... 1,358 8,172,753 7,991,087 160,737 18,626 2,303 97.8 2.0 .2 .0D is tr ic t 8 ..................................................................... 1,680 5,455,158 5,263,383 166,599 21,662 3,514 96.5 3.1 .4 .1D is tr ic t 9 ..................................................................... 1,171 2,502,087 2,455,707 40,570 5,138 672 98.1 1.6 .2 .0D is tr ic t 1 0 .................................................................. 1,702 2,159,089 2,089,864 59,048 8,764 1,413 96.8 2.7 .4 .1D is tr ic t 1 1 .................................................................. 1,399 3,736,145 3,613,908 100,076 18,067 4,094 96.7 2.7 .5 .1D is tr ic t 1 2 ................................................................... 432 11,586,129 11,224,762 293,645 57,638 10,084 96.9 2.5 .5 .1
StateA la b a m a ..................................................................... 252 677,319 658,215 16,540 2,342 222 97.2 2.4 .3 0A riz o n a ........................................................................ 15 477,520 459,275 15,376 2,446 423 96.2 3.2 .5 .1A rk a n s a s .................................................................... 242 344,675 334,803 8,559 1,209 104 97.1 2.5 .4 .0C a lifo rn ia .................................................................... 186 8,591,891 8,308,576 226,442 48,148 8,725 96.7 2.6 .6 .1C o lo ra d o ..................................................................... 203 550,757 530,399 17,109 2,761 488 96.3 3.1 .5 .1
C o n n e c ticu t............................................................... 60 900,642 883,953 15,072 1,415 202 98.1 1.7 .2 .0D e law are .................................................................... 20 180,812 176,851 3,511 423 27 97.8 1.9 .2 .0D is tr ic t o f C o lu m b ia ............................................... 15 312,606 303,088 7,563 1,591 364 97.0 2.4 .5 .1F lo rid a ......................................................................... 415 1,251,265 1,209,347 35,976 5,151 791 96.6 2.9 .4 .1G eorg ia ........................................................................ 380 855,269 840,072 12,813 2,014 370 98.2 1.5 .2 .0
106 FEDERAL
DEPOSIT
INSU
RAN
CE
CO
RP
OR
ATIO
N
Digitized for FRASER http://fraser.stlouisfed.org/ Federal Reserve Bank of St. Louis
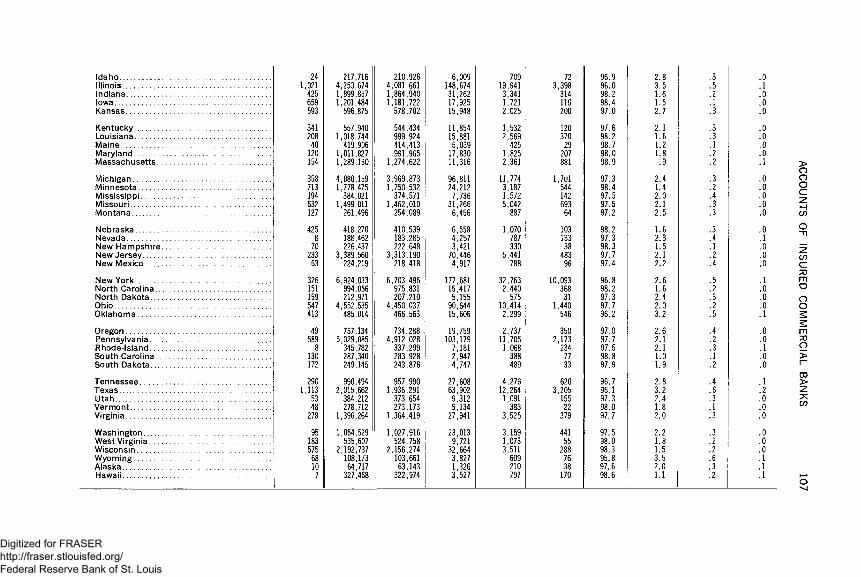
Id a h o ........................................................................... 24 217,716 210,926Illin o is .......................................................................... 1,021 4,253,674 4,081,661In d ia n a ....................................................................... 425 1,899,857 1,864,940
659 1,201,484 1,181,722K a nsas ........................................................................ 593 596,875 578,702
K e n tu c k y .................................................................... 341 557,940 544,434L ou is ia n a .................................................................... 208 1,018,744 999,924M a in e .......................................................................... 40 419,906 414,413M a ry la n d .................................................................... 120 1,011,827 991,965M a ssa ch u se tts ........................................................ 154 1,289,180 1,274,622
M ich ig a n ..................................................................... 358 4,080,159 3,969,873M in n e so ta .................................................................. 713 1,778,475 1,750,532M iss iss ip p i................................................................. 194 384,021 374,571M is s o u ri...................................................................... 632 1,499,011 1,462,010M o n ta n a ..................................................................... 127 261,496 254,089
N e b ra s k a ................................................................... 425 418,270 410,539N e va d a ........................................................................ 8 188,462 183,285New H a m p s h ire ...................................................... 70 226,437 222,648New J e rs e y ................................................................ 233 3,389,560 3,313,190New M e x ico ............................................................... 63 224,219 218,418
New Y o rk ................................................................... 326 6,924,033 6,703,496N o rth C a ro lin a ......................................................... 151 994,056 975,831N o rth D a ko ta ........................................................... 159 212,971 207,210O h io .............................................................................. 547 4,552,535 4,450,037O k la h o m a .................................................................. 413 485,014 466,563
O re g o n ........................................................................ 49 757,134 734,288P e nnsy lvan ia ............................................................ 589 5,029,085 4,912,028R h o d e -ls la n d ............................................................ 8 345,782 337,299South C a ro lin a ......................................................... 130 287,340 283,928South D a ko ta ........................................................... 172 249,145 243,876
T e n nessee ................................................................. 290 990,494 957,990T e xa s ........................................................................... 1,113 2,015,662 1,936,291U ta h ............................................................................. 53 384,212 373,654V e rm o n t...................................................................... 48 278,712 273,173V irg in ia ........................................................................ 278 1,396,264 1,364,419
W a sh in g to n ............................................................... 95 1,054,529 1,027,916W est V irg in ia ............................................................. 183 535,607 524,758W isco n s in ................................................................... 575 2,192,737 2,156,274W yo m in g .................................................................... 68 108,173 103,661A la ska .......................................................................... 10 64,717 63,143H a w a ii.......................................................................... 7 327,468 322,974
6,009 709 72 96.9 2.8 .3 .0148,674 19,941 3,398 96.0 3.5 .5 .131,262 3,341 314 98.2 1.6 .2 .017,925 1,721 116 98.4 1.5 .1 .015,948 2,025 200 97.0 2.7 .3 .0
11,854 1,532 120 97.6 2.1 .3 .015,881 2,569 370 98.2 1.6 .3 .05,039 425 29 98.7 1.2 .1 .0
17,830 1,825 207 98.0 1.8 .2 .011,316 2,361 881 98.9 .9 .2 .1
96,811 11,774 1,701 97.3 2.4 .3 .024,212 3,187 544 98.4 1.4 .2 .07,736 1,572 142 97.5 2.0 .4 .0
31,266 5,042 693 97.5 2.1 .3 .06,456 887 64 97.2 2.5 .3 .0
6,558 1,070 103 98.2 1.6 .3 .04,257 787 133 97.3 2.3 .4 .13,421 330 38 98.3 1.5 .1 .0
70,446 5,441 483 97.7 2.1 .2 .04,917 788 96 97.4 2.2 .4 .0
177,681 32,763 10,093 96.8 2.6 .5 .115,417 2,440 368 98.2 1.6 .2 .05,155 575 31 97.3 2.4 .3 .0
90,644 10,414 1,440 97.7 2.0 .2 .015,606 2,299 546 96.2 3.2 .5 .1
19,759 2,737 350 97.0 2.6 .4 .0103,179 11,705 2,173 97.7 2.1 .2 .0
7,181 1,068 234 97.5 2.1 .3 .12,947 388 77 98.8 1.0 .1 .04,747 489 33 97.9 1.9 .2 .0
27,608 4,276 620 96.7 2.8 .4 .163,902 12,264 3,205 96.1 3.2 .6 .29,312 1,091 155 97.3 2.4 .3 .05,134 383 22 98.0 1.8 .1 .0
27,941 3,525 379 97.7 2.0 .3 .0
23,013 3,159 441 97.5 2.2 .3 .09,721 1,073 55 98.0 1.8 .2 .0
32,664 3,511 288 98.3 1.5 .2 .03,827 609 76 95.8 3.5 .6 .11,326 210 38 97.6 2.0 .3 .13,527 797 170 98.6 1.1 .2 .1
ACCOUNTS
OF INSURED
CO
MM
ERC
IAL BANKS
107
Digitized for FRASER http://fraser.stlouisfed.org/ Federal Reserve Bank of St. Louis
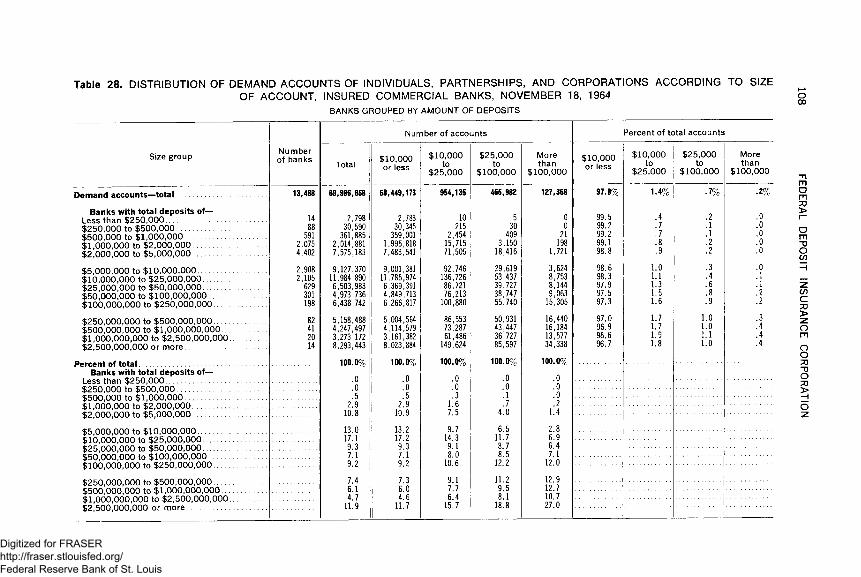
Table 28. DISTRIBUTION OF DEMAND ACCOUNTS OF INDIVIDUALS, PARTNERSHIPS, AND CORPORATIONS ACCORDING TO SIZEOF ACCOUNT, INSURED COMMERCIAL BANKS, NOVEMBER 18, 1964
BANKS GROUPED BY AM OUNT OF DEPOSITS
N u m be r o f accou n ts P e rcen t o f to ta l a ccou n ts
Size g ro u pN u m b e r o f banks
Total$10 ,0 0 0 o r less
$ 1 0 ,0 0 0to
$ 2 5 ,0 0 0
$ 2 5 ,0 0 0to
$ 1 0 0 ,0 0 0
M oreth a n
$ 1 0 0 ,0 0 0
$ 1 0 ,0 0 0 o r less
$ 1 0 ,0 0 0to
$ 2 5 ,0 0 0
$ 2 5 ,0 0 0to
$ 1 0 0 ,0 0 0
M orethan
$ 1 0 0 ,0 0 0
13,468 69,986,658 68,449,173 954,135 455,982 127,368 97.8% 1.4% .7% .2%
Banks with total deposits of—14 2,798 2,783 10 5 0 99.5 .4 .2 .0
$ 2 5 0 0 0 0 to $ 5 0 0 0 0 0 ........................ 88 30,590 30,345 215 30 0 99.2 .7 .1 .0
$ 5 0 0 0 0 0 to $1 0 0 0 ,0 0 0 ................................... 591 361,885 359,001 2,454 409 21 99.2 .7 .1 .0
$1 0 0 0 0 0 0 to $2 0 0 0 0 0 0 ................ 2,075 2,014,881 1,995,818 15,715 3,150 198 99.1 .8 .2 .0
$2 0 0 0 0 0 0 to $5 0 0 0 ,0 0 0 ........................ 4,402 7,575,183 7,483,541 71,505 18,416 1,721 98.8 .9 .2 .0
$5 0 0 0 0 0 0 to $ 1 0 ,0 0 0 ,0 0 0 .................................. 2,908 9,127,370 9,001,381 92,746 29,619 3,624 98.6 1.0 .3 .0
$ 1 0 0 0 0 0 0 0 to $ 2 5 ,0 0 0 ,0 0 0 ............................... 2,105 11,984,890 11,785,974 136,726 53,437 8,753 98.3 1.1 .4 .1
$ 2 5 0 0 0 0 0 0 to $ 5 0 ,0 0 0 ,0 0 0 ........................ 629 6,503,983 6,369,391 86,721 39,727 8,144 97.9 1.3 .6 .1
$ 5 0 0 0 0 0 0 0 to $ 1 0 0 ,0 0 0 ,0 0 0 ........................ 301 4,973,736 4,849,713 76,213 38,747 9,063 97.5 1.5 .8 .2
$ 1 0 0 ,0 0 0 ,0 0 0 to $ 2 5 0 ,0 0 0 ,0 0 0 .......................... 198 6,438,742 6,266,817 100,880 55,740 15,305 97.3 1.6 .9 .2
$ 2 5 0 ,0 0 0 ,0 0 0 to $ 5 0 0 ,0 0 0 ,0 0 0 ..........................$ 5 0 0 0 0 0 ,0 0 0 to $ 1 ,0 0 0 ,0 0 0 ,0 0 0 ......................
8241
5,158,4884,247,497
5,004,5644,114,579
86,55373,287
50,93143,447
16,44016,184
97.096.9
1.71.7
1.01.0
.3
.4
$1 0 0 0 0 0 0 ,0 0 0 to $ 2 ,5 0 0 ,0 0 0 ,0 0 0 .................. 20 3,273,172 3,161,382 61,486 36,727 13,577 96.6 1.9 1.1 .4
$ 2 ,5 0 0 ,0 0 0 ,0 0 0 o r m o re ........................................ 14 8,293,443 8,023,884 149,624 85,597 34,338 96.7 1.8 1.0 .4
100.0%
.0
100.0%
.0
100.0%
.0
100.0%
.0
100.0%Banks with total deposits of—
i acc thsn RH nnn .0O K n nnn +r* CPinn nnn o .0 .0 .0 .0ic o n nnn +r* t i nnn nnn ’.5
2.9 10.8
13.017.19.37.19.2
7.4 6.1 4.7
11.9
.5 .3 .1 .0c 1 nnn nnn co nnn nnn 2.9 1.6 .7 .2co nnn nnn nnn nnn 10.9 7.5 4.0 1.4
n n n n n n tn t i n nnn nnn 13.217.2 9.3 7 1
9.7 6.5 2.8c i n nnn nnn cor nnn nnn 14.3 11.7 6.9cok n n n n n n fn i ^ n nnn nnn 9.1 8.7 6.4Je n n n n n n n tn i i nn n n n n n n 8.0 8.5 7.1c i n n n n n n n n tA c o ^ n n n n n n n 9.2
7.3 6 0
10.6 12.2 12.0
to K n n n n n n n tn tRnn nnn nnn 9.1 11.2 12.9tc n n n n n n n n +r* i i n n n n n n n n n 7.7 9.5 12.7ci n n n n n n nnn tn to cnn nnn nnn 4.6
11.76.4 8.1 10.7%plfUUUfUUU,UUU TO f^ . fOUUrUUU,UUU..................
co c ah n n n n n n ak maka 15.7 18.8 27.0
108 FEDERAL
DEPOSIT
INSU
RAN
CE
CO
RP
OR
ATIO
N
Digitized for FRASER http://fraser.stlouisfed.org/ Federal Reserve Bank of St. Louis

Table 29. DISTRIBUTION OF SAVINGS AND TIME ACCOUNTS OF INDIVIDUALS, PARTNERSHIPS, AND CORPORATIONS ACCORDINGTO SIZE OF ACCOUNT, INSURED COMMERCIAL BANKS, NOVEMBER 18, 1964
BANKS GROUPED BY AMOUNT OF DEPOSITS
Size group Number of banks
Number of accounts
Total$10,000 or less
$10,000to
$25,000
$25,000to
$100,000
Morethan
$ 100,000
Percent of total accounts
$10,000 or less
$10,000to
$25,000
$25,000to$100,000
Morethan
$ 100,000
Savings and time accounts—total
Banks with total deposits of—Less than $250 ,0 0 0 .......................$250,000 to $50 0 ,0 0 0 ..................$500,000 to $1,000 ,000 ..............$1,000,000 to $ 2 ,000 ,000 ...........$2,000,000 to $5 ,000 ,000 ...........
$5,000,000 to $10 ,000 ,000 .......$10,000,000 to $25,000,000 .... $25,000,000 to $ 5 0 ,00 0 ,0 0 0 .... $50,000,000 to $100,000,000. . $100,000,000 to $250,000,000.
$250,000,000 to $500 ,0 0 0 ,0 00 .......$500,000,000 to $1,000,000,000 ... $1,000,000,000 to $2,500,000,000. $2,500,000,000 or m ore ....................
13,468
1488
5912,0754,402
2,9082,105
629301198
Percent of to ta l....................................Banks with total deposits of—
Less than $250 ,0 0 0 ........................$250,000 to $50 0 ,0 0 0 ...................$500,000 to $ 1 ,000 ,000 ...............$1,000,000 to $2,0 00 ,0 0 0 ...........$2,000,000 to $5 ,0 00 ,0 0 0 ...........
$5,000,000 to $10 ,00 0 ,0 0 0 .......$10,000,000 to $25 ,00 0 ,0 0 0 ......$25,000,000 to $50 ,00 0 ,0 0 0 ......$50,000,000 to $100,000,000. . $100,000,000 to $250,000,000.
$250,000,000 to $ 500 ,000 ,000 .......$500,000,000 to $1,000,000,000 .. $1,000,000,000 to $2,500,000,000. $2,500,000,000 or m ore ....................
68,631,261
1,3766,171
104,262843,327
4,436,517
6,644,77310,714,5476,988,6615,855,7907,620,326
6,063,3494,790,6934,002,688
10,558,781
100. 0%
.0
.0
.21.26.5
9.715.610.28.5
11.1
7.05.8
15.4
66,807,568
1,3726,101
102,890829,373
4,347,620
6,506,92510,479,9656,832,6535,700,7217,422,717
5,898,8394,655,5953,848,042
10,174,755
100.0%.0.0.2
1.26.5
9.715.7 10.28.5
11.1
7.05.8
15.2
1,
464
1,26413,04881,659
124,708209,345136,896135,445169,856
137,369111,744125,844302,814
100.0%.0.0.1.8
5.3
8.013.5 8.8 8.7
11.0
8.97.28.1
19.5
231,254
06
105873
6,909
12,35023,19017,15017,34323,946
22,13118,87522,85465,522
100.0%
.0
.0
.0
.43.0
5.3 10.07.47.5
10.4
9.68.29.9
28.3
42,379
003
33329
7902,0471,9622,2813,807
5,0104,4795,948
15,690
100.0%
.0
.0
.0
.1
1.94.8 4.6 5.4 9.0
11.8 10.614.037.0
97.3'
99.798.998.798.398.0
97.997.897.897.497.4
97.3 97.296.196.4
2.3
.31.01.21.51.8
1.92.02.02.3 2.2
2.32.3 3.12.9
.3% • 1%
ACCOUNTS
OF INSURED
CO
MM
ERC
IAL BANKS
109
Digitized for FRASER http://fraser.stlouisfed.org/ Federal Reserve Bank of St. Louis

Table 30. DISTRIBUTION OF DEPOSITS ACCORDING TO SIZE OF ACCOUNT, INSURED COMMERCIAL BANKS, NOVEMBER 18, 1964BANKS GROUPED BY FEDERAL DEPOSIT INSURANCE CORPORATION DISTRICT AND STATE
FDIC D is tr ic t and S ta te N u m b e r o f banks
Deposits (in th o u sa n d s) in accou n ts o fPe rcen t o f to ta l dep os its
in accou n ts o f—
Total$ 1 0 ,0 0 0 o r less
$ 1 0 ,0 0 0to
$ 2 5 ,0 0 0
$ 2 5 ,0 0 0to
$ 1 0 0 ,0 0 0
M orethan
$ 1 0 0 ,0 0 0
$ 1 0 ,0 0 0 o r less
$ 1 0 ,0 0 0to
$ 2 5 ,0 0 0
$ 2 5 ,0 0 0to
$ 1 0 0 ,0 0 0
Morethan
$ 1 0 0 ,0 0 0
Total United States.................................................. 13,468 $295,377,500 $109,272,373 $37,616,613 $38,684,460 $109,804,054 37.0% 12.7% 13.1% 37.2%
50 States and D. C................................................ 13,460 294,702,470 108,971,617 37,541,730 38,605,788 109,583,335 37.0 12.7 13.1 37.2
Other Areas............................................................. 8 675,030 300,756 74,882 78,672 220,719 44.6 11.1 11.7 32.7
FDIC DistrictD is tr ic t 1 ..................................................................... 380 12,552,505 4,417,378 1,501,428 1,764,374 4,869,325 35.2 12.0 14.1 38.8D is tr ic t 2 ...................................................................... 587 64,818,219 16,095,173 6,287,650 7,321,055 35,114,341 24.8 9.7 11.3 54.2D is tr ic t 3 ..................................................................... 1,136 31,998,353 13,151,334 4,261,552 3,827,693 10,757,773' 41.1 13.3 12.0 33.6D is tr ic t 4 ..................................................................... 877 16,635,155 7,120,965 2,194,331 2,301,435 5,018,424 42.8 13.2 13.8 30.2D is tr ic t 5 ..................................................................... 1,241 15,233,770 6,341,660 2,103,281 2,348,782 4,440,047 41.6 13.8 15.4 29.1D is tr ic t 6 ..................................................................... 1,505 17,272,829 7,265,252 2,235,582 2,409,573 5,362,423 42.1 12.9 14.0 31.0D is tr ic t 7 ..................................................................... 1,358 24,194,084 11,577,628 3,397,908 2,963,974 6,254,573 47.9 14.0 12.3 25.9D is tr ic t 8 ..................................................................... 1,680 27,261,713 10,238,715 3,707,523 3,384,628 9,930,847 37.6 13.6 12.4 36.4D is tr ic t 9 ..................................................................... 1,171 8,560,892 4,373,410 1,092,435 1,026,450 2,068,597 51.1 12.8 12.0 24.2D is tr ic t 1 0 .................................................................. 1,702 11,956,734 5,121,557 1,721,738 1,761,667 3,351,771 42.8 14.4 14.7 28.0D is tric t 1 1 .................................................................. 1,399 22,085,135 7,486,928 2,916,201 3,519,275 8,162,731 33.9 13.2 15.9 37.0D is tr ic t 1 2 .................................................................. 432 42,808,111 16,082,372 6,196,983 6,055,555 14,473,201 37.6 14.5 14.1 33.8
StateA la b a m a ..................................................................... 252 2,870,411 1,270,199 420,113 436,322 743,777 44.3 14.6 15.2 25.9A riz o n a ........................................................................ 15 1,886,435 749,061 307,347 265,441 564,586 39.7 16.3 14.1 29.9A rk a n s a s .................................................................... 242 1,926,401 916,931 284,453 303,252 421,765 47.6 14.8 15.7 21.9C a lifo rn ia .................................................................... 186 32,746,215 11,789,055 4,682,631 4,658,249 11,616,280 36.0 14.3 14.2 35.5C o lo ra d o ..................................................................... 203 2,715,186 1,030,454 414,253 429,768 840,711 38.0 15.3 15.8 31.0
C o n n e c tic u t............................................................... 60 3,071,127 1,222,976 432,901 425,084 990,165 39.8 14.1 13.8 32.2D e law are .................................................................... 20 784,207 270,899 103,112 104,818 305,379 34.5 13.1 13.4 38.9D is tr ic t o f C o lu m b ia ............................................... 15 2,021,564 612,168 230,381 297,072 881,943 30.3 11.4 14.7 43.6F lo rid a ......................................................................... 415 6,535,875 2,660,403 959,298 1,001,140 1,915,034 40.7 14.7 15.3 29.3G eorg ia ........................................................................ 380 3,960,795 1,557,054 456,989 586,415 1,360,337 39.3 11.5 14.8 34.3
110 FEDERAL
DEPOSIT
INSU
RAN
CE
CO
RP
OR
ATIO
N
Digitized for FRASER http://fraser.stlouisfed.org/ Federal Reserve Bank of St. Louis
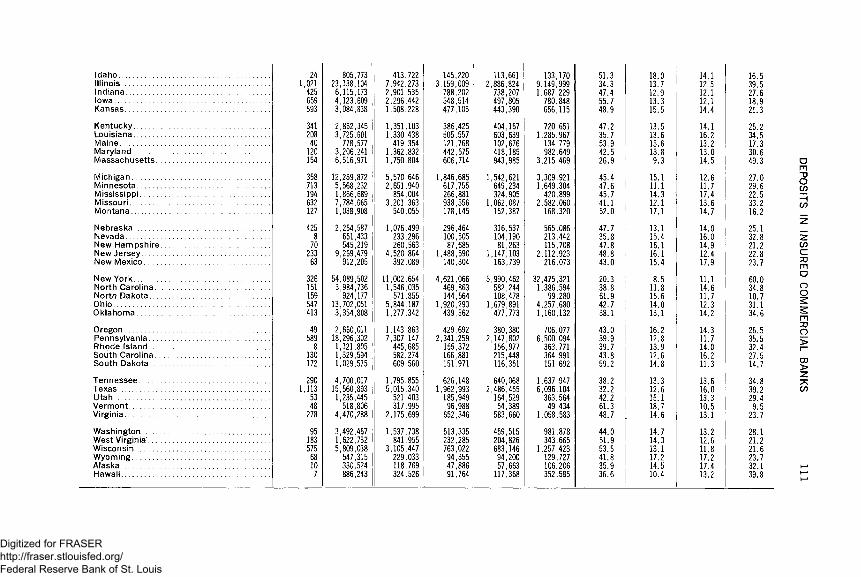
Id a h o ........................................................................... 24 805,773 413,722 145,220 113,661 133,170 51.3 18.0 14.1 16.5I llin o is .......................................................................... 1,021 23,138,104 7,942,273 3,159,009 2,886,824 9,149,999 34.3 13.7 12.5 39.5In d ia n a ........................................................................ 425 6,115,173 2,901,535 788,202 738,207 1,687,229 47.4 12.9 12.1 27.6Io w a ............................................................................. 659 4,123,609 2,296,442 548,514 497,805 780,848 55.7 13.3 12.1 18.9K a nsas ........................................................................ 593 3,084,838 1,508,228 477,105 443,390 656,115 48.9 15.5 14.4 21.3
K e n tu c k y .................................................................... 341 2,862,345 1,351,103 386,425 404,167 720,651 47.2 13.5 14.1 25.2Lo u is ia n a .................................................................... 208 3,725,601 1,330,438 505,557 603,639 1,285,967 35.7 13.6 16.2 34.5M a in e ........................................................................... 40 778,577 419,354 121,768 102,676 134,779 53.9 15.6 13.2 17.3M a ry la n d .................................................................... 120 3,206,241 1,362,832 442,575 418,185 982,649 42.5 13.8 13.0 30.6M a ssa ch u se tts ........................................................ 154 6,516,971 1,750,804 606,714 943,985 3,215,469 26.9 9.3 14.5 49.3
M ic h ig a n ..................................................................... 358 12,269,872 5,570,646 1,846,685 1,542,621 3,309,921 45.4 15.1 12.6 27.0M in n e so ta .................................................................. 713 5,568,232 2,651,940 617,755 649,234 1,649,304 47.6 11.1 11.7 29.6M iss iss ip p i................................................................. 194 1,866,689 854,004 266,881 324,905 420,899 45.7 14.3 17.4 22.5M is s o u ri...................................................................... 632 7,784,065 3,201,363 938,556 1,062,087 2,582,060 41.1 12.1 13.6 33.2M o n ta n a ..................................................................... 127 1,038,908 540,055 178,145 152,387 168,320 52.0 17.1 14.7 16.2
N e b ra s k a ................................................................... 425 2,254,587 1,076,499 296,464 316,537 565,086 47.7 13.1 14.0 25.1N e vada ........................................................................ 8 651,433 233,296 100,505 104,190 213,442 35.8 15.4 16.0 32.8New H a m p s h ire ...................................................... 70 545,219 260,563 87,685 81,263 115,708 47.8 16.1 14.9 21.2New J e rs e y ................................................................ 233 9,269,479 4,520,864 1,488,590 1,147,103 2,112,923 48.8 16.1 12.4 22.8New M e x ico ............................................................... 63 912,205 392,089 140,304 163,739 216,073 43.0 15.4 17.9 23.7
New Y o rk ................................................................... 326 54,089,502 11,002,654 4,621,066 5,990,462 32,475,321 20.3 8.5 11.1 60.0N o rth C a ro lin a ......................................................... 151 3,984,736 1,546,035 469,863 582,244 1,386,594 38.8 11.8 14.6 34.8N o rth D a ko ta ............................................................ 159 924,177 571,855 144,564 108,478 99,280 61.9 15.6 11.7 10.7O h io .............................................................................. 547 13,702,051 5,844,187 1,920,293 1,679,891 4,257,680 42.7 14.0 12.3 31.1O k la h o m a .................................................................. 413 3,354,808 1,277,342 439,562 477,773 1,160,132 38.1 13.1 14.2 34.6
O re g o n ........................................................................ 49 2,660,011 1,143,863 429,692 380,380 706,077 43.0 16.2 14.3 26.5P e nnsy lvan ia ............................................................ 589 18,296,302 7,307,147 2,341,259 2,147,802 6,500,094 39.9 12.8 11.7 35.5Rhode Is la n d ............................................................ 8 1,121,805 445,685 155,372 156,977 363,771 39.7 13.9 14.0 32.4South C a ro lin a ......................................................... 130 1,329,594 582,274 166,881 215,448 364,991 43.8 12.6 16.2 27.5South D a ko ta ........................................................... 172 1,029,575 609,560 151,971 116,351 151,692 59.2 14.8 11.3 14.7
T e n n e sse e ................................................................. 290 4,700,017 1,795,855 626,148 640,068 1,637,947 38.2 13.3 13.6 34.8T e xa s ........................................................................... 1,113 15,560,893 5,015,340 1,962,993 2,486,455 6,096,104 32.2 12.6 16.0 39.2U ta h ............................................................................. 53 1,235,445 521,403 185,949 164,529 363,564 42.2 15.1 13.3 29.4V e rm o n t...................................................................... 48 518,806 317,995 96,988 54,389 49,434 61.3 18.7 10.5 9.5V irg in ia ........................................................................ 278 4,470,288 2,175,699 652,346 583,660 1,058,583 48.7 14.6 13.1 23.7
W a sh in g to n ............................................................... 95 3,492,467 1,537,738 513,335 459,515 981,878 44.0 14.7 13.2 28.1W est V irg in ia ............................................................. 183 1,622,732 841,955 232,285 204,826 343,665 51.9 14.3 12.6 21.2W isco n s in ................................................................... 575 5,809,038 3,105,447 763,022 683,146 1,257,423 53.5 13.1 11.8 21.6W yo m in g ..................................................................... 68 547,315 229,033 94,355 94,200 129,727 41.8 17.2 17.2 23.7A la s k a .......................................................................... 10 330,524 118,769 47,886 57,663 106,206 35.9 14.5 17.4 32.1H a w a ii.......................................................................... 7 886,243 324,526 91,764 117,368 352,585 36.6 10.4 13.2 39.8
DEPOSITS
IN INSURED
CO
MM
ERC
IAL BANKS
111
Digitized for FRASER http://fraser.stlouisfed.org/ Federal Reserve Bank of St. Louis
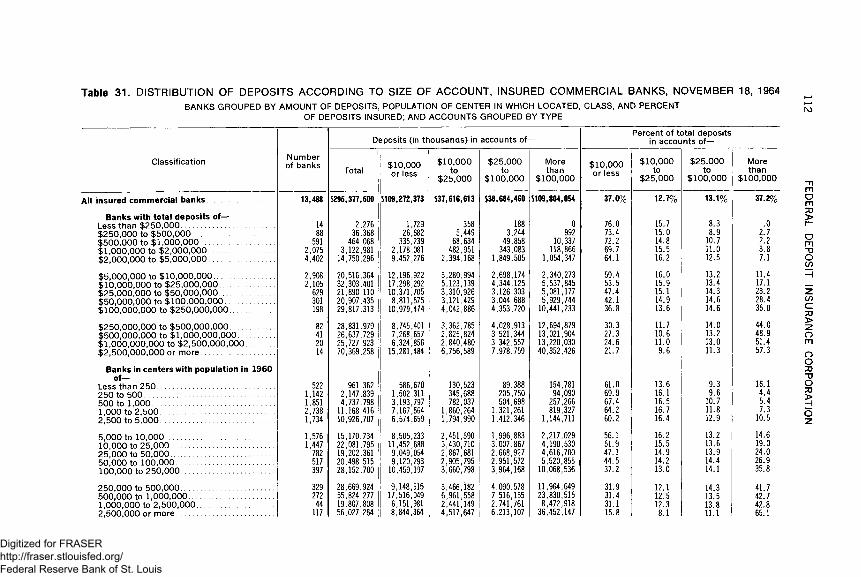
Table 31. DISTRIBUTION OF DEPOSITS ACCORDING TO SIZE OF ACCOUNT, INSURED COMMERCIAL BANKS, NOVEMBER 18, 1964BA N K S G ROUPED BY AM O UNT OF DEPOSITS, POPULATION OF CENTER IN W HICH LOCATED, CLASS, AND PERCENT
OF DEPOSITS INSURED; AND ACCOUNTS GROUPED BY TYPE
C lass ifica tionN u m b e r o f banks
Deposits (in th o u sa n d s) in accou n ts of-P e rcen t o f to ta l dep os its
in accou n ts o f—
Total$ 10 ,000 or less
$ 1 0 ,0 0 0to
$ 2 5 ,0 0 0
$ 2 5 ,0 0 0to
$ 1 0 0 ,0 0 0
M orethan
$ 1 0 0 ,0 0 0
$ 1 0 ,0 0 0 o r less
$ 1 0 ,0 0 0to
$ 2 5 ,0 0 0
$ 2 5 ,0 0 0to
$ 1 0 0 ,0 0 0
M orethan
$ 1 0 0 ,0 0 0
All insured commercial banks.............................. 13,468 $295,377,500 $109,272,373 $37,616,613 $38,684,460 $109,804,054 37.0% 12.7% 13.1% 37.2%
Banks with total deposits of—Less th a n $ 2 5 0 ,0 0 0 .............................................. 14 2,276 1,729 358 188 0 76.0 15.7 8.3 .0$ 2 5 0 ,0 0 0 to $ 5 0 0 ,0 0 0 ......................................... 88 36,368 26,682 5,449 3,244 992 73.4 15.0 8.9 2.7$ 5 0 0 ,0 0 0 to $ 1 ,0 0 0 ,0 0 0 ..................................... 591 464,068 335,239 68,634 49,858 10,337 72.2 14.8 10.7 2.2$ 1 ,0 0 0 ,0 0 0 to $ 2 ,0 0 0 ,0 0 0 ................................. 2,075 3,122,981 2,178,081 482,951 343,083 118,866 69.7 15.5 11.0 3.8$ 2 ,0 0 0 ,0 0 0 to $ 5 ,0 0 0 ,0 0 0 ................................. 4,402 14,750,296 9,452,276 2,394,168 1,849,505 1,054,347 64.1 16.2 12.5 7.1
$ 5 ,0 0 0 ,0 0 0 to $ 1 0 ,0 0 0 ,0 0 0 .............................. 2,908 20,516,364 12,196,922 3,280,994 2,698,174 2,340,273 59.4 16.0 13.2 11.4$ 1 0 ,0 0 0 ,0 0 0 to $ 2 5 ,0 0 0 ,0 0 0 ........................... 2,105 32,303,401 17,298,292 5,123,139 4,344,125 5,537,845 53.5 15.9 13.4 17.1$ 2 5 ,0 0 0 ,0 0 0 to $ 5 0 ,0 0 0 ,0 0 0 ........................... 629 21,890,110 10,371,705 3,310,926 3,126,303 5,081,177 47.4 15.1 14.3 23.2$ 5 0 ,0 0 0 ,0 0 0 to $ 1 0 0 ,0 0 0 ,0 0 0 ........................ 301 20,907,435 8,811,575 3,121,429 3,044,688 5,929,744 42.1 14.9 14.6 28.4$ 1 0 0 ,0 0 0 ,0 0 0 to $ 2 5 0 ,0 0 0 ,0 0 0 ...................... 198 29,817,313 10,979,474 4,042,886 4,353,720 10,441,233 36.8 13.6 14.6 35.0
$ 2 5 0 ,0 0 0 ,0 0 0 to $ 5 0 0 ,0 0 0 ,0 0 0 ...................... 82 28,831,979 8,745,401 3,362,785 4,028,913 12,694,879 30.3 11.7 14.0 44.0$ 5 0 0 ,0 0 0 ,0 0 0 to $ 1 ,0 0 0 ,0 0 0 ,0 0 0 .................. 41 26,637,729 7,268,657 2,825,824 3,521,344 13,021,904 27.3 10.6 13.2 48.9$ 1 ,0 0 0 ,0 0 0 ,0 0 0 to $ 2 ,5 0 0 ,0 0 0 ,0 0 0 .............. 20 25,727,923 6,324,856 2,840,480 3,342,557 13,220,030 24.6 11.0 13.0 51.4$ 2 ,5 0 0 ,0 0 0 ,0 0 0 o r m o re ..................................... 14 70,369,258 15,281,484 6,756,589 7,978,759 40,352,426 21.7 9.6 11.3 57.3
Banks in centers with population in 1960of—
Less th a n 2 5 0 .......................................................... 522 961,362 586,670 130,523 89,388 154,781 61.0 13.6 9.3 16.12 5 0 to 5 0 0 ................................................................. 1,142 2,147,839 1,502,311 345,688 205,750 94,090 69.9 16.1 9.6 4.45 00 to 1 ,0 0 0 ............................................................. 1,851 4,737,798 3,193,797 782,037 504,698 257,266 67.4 16.5 10.7 5.41 ,000 to 2 ,5 0 0 ......................................................... 2,738 11,168,416 7,167,564 1,860,264 1,321,261 819,327 64.2 16.7 11.8 7.32 ,5 0 0 to 5 ,0 0 0 ......................................................... 1,734 10,926,707 6,574,659 1,794,990 1,412,346 1,144,711 60.2 16.4 12.9 10.5
5 ,0 0 0 to 1 0 ,0 0 0 ...................................................... 1,576 15,170,734 8,505,233 2,451,590 1,996,883 2,217,029 56.1 16.2 13.2 14.61 0 ,0 0 0 to 2 5 ,0 0 0 ................................................... 1,447 22,081,795 11,452,688 3,430,710 3,007,867 4,190,530 51.9 15.5 13.6 19.02 5 ,0 0 0 to 5 0 ,0 0 0 ................................................... 782 19,202,361 9,049,054 2,867,681 2,668,927 4,616,700 47.1 14.9 13.9 24.05 0 ,0 0 0 to 1 0 0 ,0 0 0 ................................................. 517 20,498,515 9,120,293 2,905,795 2,951,572 5,520,855 44.5 14.2 14.4 26.91 0 0 ,0 0 0 to 2 5 0 ,0 0 0 .............................................. 397 28,152,700 10,459,197 3,660,798 3,964,168 10,068,536 37.2 13.0 14.1 35.8
2 5 0 ,0 0 0 to 5 0 0 ,0 0 0 .............................................. 329 28,669,924 9,148,515 3,466,182 4,090,578 11,964,649 31.9 12.1 14.3 41.75 0 0 ,0 0 0 to 1 ,0 0 0 ,0 0 0 .......................................... 272 55,824,277 17,516,049 6,961,558 7,516,155 23,830,515 31.4 12.5 13.5 42.71 ,00 0 ,0 0 0 to 2 ,5 0 0 ,0 0 0 ...................................... 44 19,807,808 6,151,981 2,441,149 2,741,761 8,472,918 31.1 12.3 13.8 42.82 ,5 0 0 ,0 0 0 o r m o re ................................................. 117 56,027,264 8,844,364 4,517,647 6,213,107 36,452,147 15.8 8.1 11.1 65.1
112 FEDERAL
DEPOSIT
INSU
RAN
CE
CO
RP
OR
ATIO
N
Digitized for FRASER http://fraser.stlouisfed.org/ Federal Reserve Bank of St. Louis
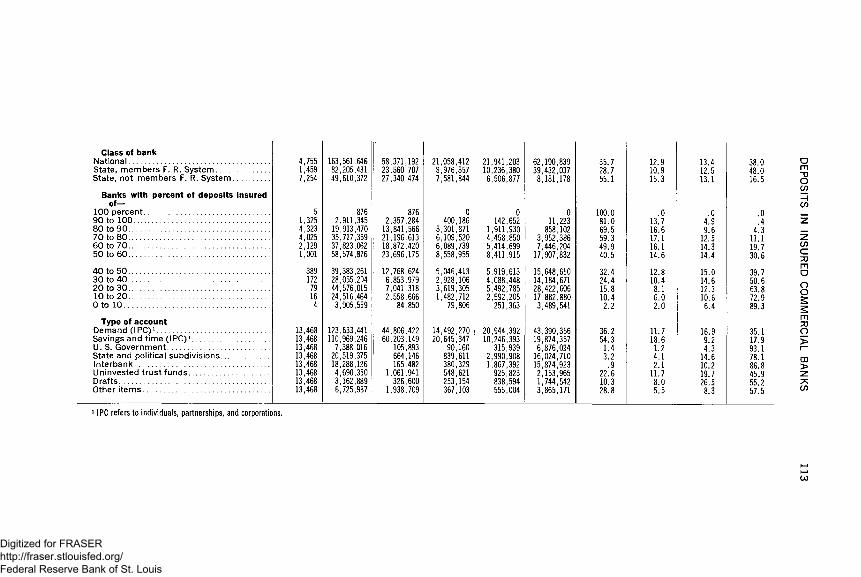
Class of bankN a tio n a l...................................................................... 4,755 163,561,646 58,371,192 21,058,412 21,941,203 62,190,839 35.7 12.9 13.4 38.0S tate, m e m b e rs F. R. S y s te m .......................... 1,459 82,205,481 23,560,707 8,976,357 10,236,380 39,432,037 28.7 10.9 12.5 48.0S tate, n o t m e m b e rs F. R. S y s te m .................. 7,254 49,610,372 27,340,474 7,581,844 6,506,877 8,181,178 55.1 15.3 13.1 16.5
Banks with percent of deposits insured of—
100 p e rc e n t.............................................................. 5 876 876 0 0 0 100.0 .0 .0 .09 0 to 1 0 0 .................................................................... 1,325 2,911,345 2,357,284 400,186 142,652 11,223 81.0 13.7 4.9 .48 0 to 9 0 ...................................................................... 4,323 19,913,470 13,841,566 3,301,871 1,911,930 858,102 69.5 16.6 9.6 4.370 to 8 0 ...................................................................... 4,025 35,717,369 21,196,613 6,109,520 4,458,850 3,952,386 59.3 17.1 12.5 11.16 0 to 7 0 ...................................................................... 2,129 37,823,062 18,872,420 6,089,739 5,414,699 7,446,204 49.9 16.1 14.3 19.750 to 6 0 ...................................................................... 1,001 58,574,876 23,696,175 8,558,955 8,411,915 17,907,832 40.5 14.6 14.4 30.6
4 0 to 5 0 ...................................................................... 389 39,383,261 12,768,624 5,046,413 5,919,613 15,648,610 32.4 12.8 15.0 39.73 0 to 4 0 ...................................................................... 172 28,055,204 6,853,979 2,928,106 4,088,448 14,184,671 24.4 10.4 14.6 50.620 to 3 0 ...................................................................... 79 44,576,015 7,041,318 3,619,305 5,492,785 28,422,606 15.8 8.1 12.3 63.810 to 2 0 ...................................................................... 16 24,516,464 2,558,666 1,482,712 2,592,205 17,882,880 10.4 6.0 10.6 72.90 to 1 0 ........................................................................ 4 3,905,559 84,850 79,806 251,363 3,489,541 2.2 2.0 6.4 89.3
Type of accountD em and ( IP C )1........................................................ 13,468 123,633,441 44,806,422 14,492,270 20,944,392 43,390,356 36.2 11.7 16.9 35.1Savings and tim e ( IP C )1...................................... 13,468 110,969,246 60,203,149 20,645,347 10,246,393 19,874,357 54.3 18.6 9.2 17.9U. S. G o v e rn m e n t................................................... 13,468 7,388,016 105,893 90,160 315,939 6,876,024 1.4 1.2 4.3 93.1S tate and p o litica l s u b d iv is io n s ........................ 13,468 20,519,375 664,146 839,611 2,990,908 16,024,710 3.2 4.1 14.6 78.1In te rb a n k ................................................................... 13,468 18,288,126 165,482 380,329 1,867,392 15,874,923 .9 2.1 10.2 86.8U n invested t ru s t fu n d s ........................................ 13,468 4,690,350 1,061,941 548,621 925,823 2,153,965 22.6 11.7 19.7 45*9D ra fts ........................................................................... 13,468 3,162,889 326,600 253,154 838,594 1,744,542 10.3 8.0 26.5 55.2O ther i te m s ............................................................... 13,468 6,725,987 1,938,709 367,103 555,004 3,865,171 28.8 5.5 8.3 57.5
1 IPC refers to individuals, partnerships, and corporations.
DEPOSITS
IN INSURED
CO
MM
ERC
IAL BANKS
113
Digitized for FRASER http://fraser.stlouisfed.org/ Federal Reserve Bank of St. Louis
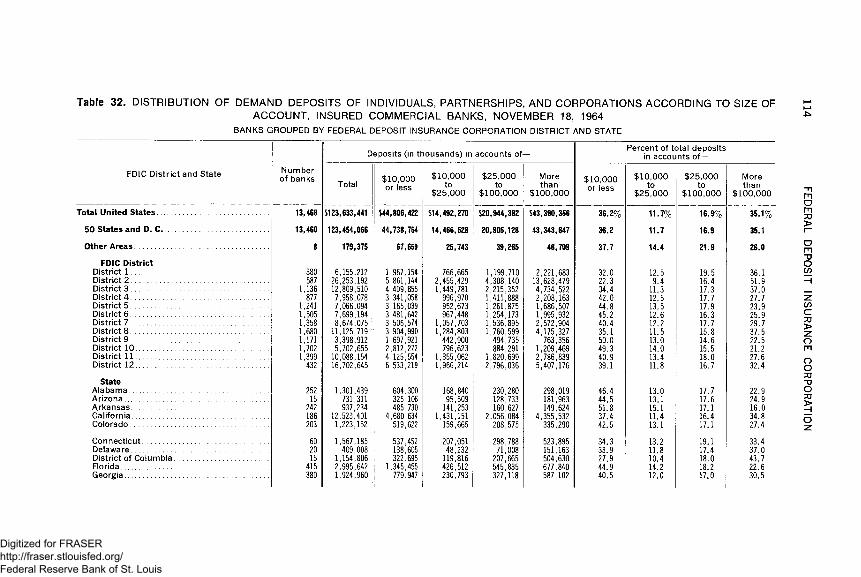
Table 32. DISTRIBUTION OF DEMAND DEPOSITS OF INDIVIDUALS, PARTNERSHIPS, AND CORPORATIONS ACCORDING TO SIZE OFACCOUNT, INSURED COMMERCIAL BANKS, NOVEMBER 18, 1964
BANKS GROUPED BY FEDERAL DEPOSIT INSURANCE CORPORATION DISTRICT AND STATE
FDIC D is tr ic t and S tate N u m b e r o f banks
D eposits (in th o u sa n d s) in a ccou n ts o fPercen t o f to ta l dep os its
in accou n ts o f—
Total$ 1 0 ,0 0 0 or less
$ 1 0 ,0 0 0to
$ 2 5 ,0 0 0
$ 2 5 ,0 0 0to
$ 1 0 0 ,0 0 0
M orethan
$ 1 0 0 ,0 0 0
$ 1 0 ,0 0 0 o r less
$ 1 0 ,0 0 0to
$ 2 5 ,0 0 0
$ 2 5 ,0 0 0to
$ 1 0 0 ,0 0 0
M orethan
$ 1 0 0 ,0 0 0
Total United States................................................... 13,468 $123,633,441 $44,806,422 $14,492,270 $20,944,392 $43,390,356 36.2% 11.7% 16.9% 35.1%
50 States and D. C................................................. 13,460 123,454,066 44,738,764 14,466,528 20,905,128 43,343,647 36.2 11.7 16.9 35.1
Other Areas............................................................. 8 179,375 67,659 25,743 39,265 46,709 37.7 14.4 21.9 26.0
FDIC DistrictD is tr ic t 1 ..................................................................... 380 6,155,212 1,967,154 766,665 1,199,710 2,221,683 32.0 12.5 19.5 36.1D is tr ic t 2 ..................................................................... 587 26,253,192 5,861,144 2,455,429 4,308,140 13,628,479 22.3 9.4 16.4 51.9D is tric t 3 ..................................................................... 1,136 12,809,510 4,409,855 1,449,781 2,215,352 4,734,522 34.4 11.3 17.3 37.0D is tr ic t 4 ..................................................................... 877 7,958,078 3,341,058 996,970 1,411,888 2,208,163 42.0 12.5 17.7 27.7D is tr ic t 5 ..................................................................... 1,241 7,066,094 3,165,039 952,673 1,261,875 1,686,507 44.8 13.5 17.9 23.9D is tr ic t 6 ..................................................................... 1,505 7,699,194 3,481,642 967,448 1,254,173 1,995,932 45.2 12.6 16.3 25.9D is tr ic t 7 ..................................................................... 1,358 8,674,075 3,506,574 1,057,703 1,536,895 2,572,904 40.4 12.2 17.7 29.7D is tr ic t 8 ..................................................................... 1,680 11,125,719 3,904,990 1,284,803 1,760,599 4,175,327 35.1 11.5 15.8 37.5D is tr ic t 9 ..................................................................... 1,171 3,398,912 1,697,921 442,900 494,735 763,356 50.0 13.0 14.6 22.5D is tr ic t 1 0 .................................................................. 1,702 5,702,655 2,812,272 796,623 884,291 1,209,469 49.3 14.0 15.5 21.2D is tr ic t 1 1 .................................................................. 1,399 10,088,154 4,125,554 1,355,062 1,820,699 2,786,839 40.9 13.4 18.0 27.6D is tr ic t 1 2 .................................................................. 432 16,702,645 6,533,219 1,966,214 2,796,036 5,407,176 39.1 11.8 16.7 32.4
StateA la b a m a ..................................................................... 252 1,301,439 604,300 168,840 230,280 298,019 46.4 13.0 17.7 22.9A riz o n a ........................................................................ 15 731,311 325,106 95,509 128,733 181,963 44.5 13.1 17.6 24.9A rk a n s a s .................................................................... 242 937,234 485,730 141,253 160,627 149,624 51.8 15.1 17.1 16.0C a lifo rn ia .................................................................... 186 12,523,401 4,680,634 1,431,151 2,056,084 4,355,532 37.4 11.4 16.4 34.8C o lo ra d o ..................................................................... 203 1,223,152 519,622 159,665 208,575 335,290 42.5 13.1 17.1 27.4
C o n n e c tic u t............................................................... 60 1,567,185 537,452 207,051 298,788 523,895 34.3 13.2 19.1 33.4D e law are .................................................................... 20 409,008 138,605 48,232 71,008 151,163 33.9 11.8 17.4 37.0D is tr ic t o f C o lu m b ia ............................................... 15 1,154,806 322,695 119,816 207,665 504,630 27.9 10.4 18.0 43.7F lo rid a ......................................................................... 415 2,995,642 1,345,455 426,512 545,835 677,840 44.9 14.2 18.2 22.6G eorg ia ........................................................................ 380 1,924,960 779,947 230,793 327,118 587,102 40.5 12.0 17.0 30.5
114 FEDERAL
DEPOSIT
INSU
RAN
CE
CO
RPO
RA
TION
Digitized for FRASER http://fraser.stlouisfed.org/ Federal Reserve Bank of St. Louis
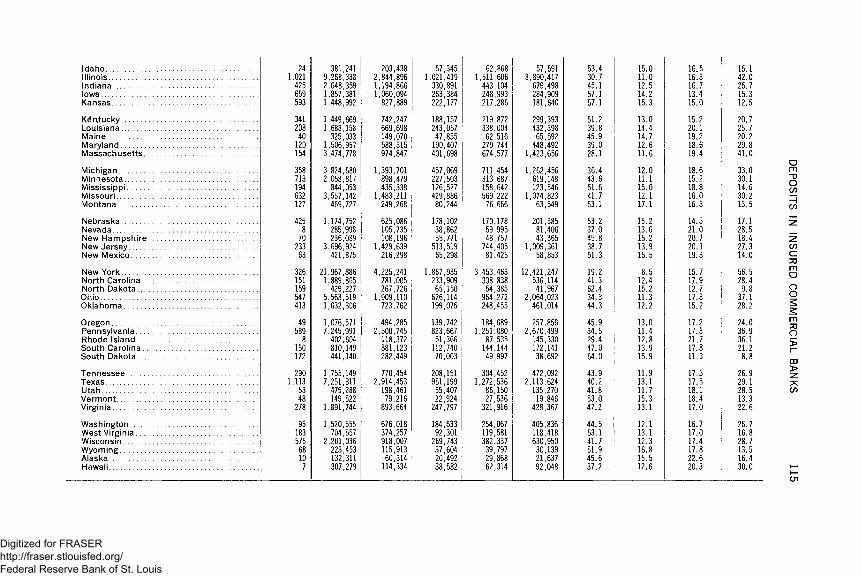
Id a h o ............................................................................ 24 381,241 203,438Illin o is .......................................................................... 1,021 9,268,338 2,844,896In d ia n a ........................................................................ 425 2,648,359 1,194,866
659 1,857,381 1,060,094K a nsas......................................................................... 593 1,448,992 827,889
K e n tu c k y .................................................................... 341 1,449,669 742,247Lo u is ia n a .................................................................... 208 1,683,158 669,698M a in e ........................................................................... 40 325,033 149,070M a ry la n d ..................................................................... 120 1,506,957 588,315M a ssa ch u se tts ......................................................... 154 3,474,778 974,847
M ic h ig a n ..................................................................... 358 3,824,680 1,393,701M in n e so ta .................................................................. 713 2,058,817 898,479M is s is s ip p i....................................................... . ........ 194 844,053 435,338M is s o u ri...................................................................... 632 3,557,142 1,483,211M o n ta n a ...................................................................... 127 469,727 249,268
N e b ra ska .................................................................... 425 1,174,752 625,086N e vada ........................................................................ 8 285,998 105,735New H a m p s h ire ...................................................... 70 236,089 108,196New J e rs e y ................................................................ 233 3,696,924 1,429,639New M e x ico ............................................................... 63 421,875 216,298
New Y o rk .................................................................... 326 21,967,886 4,225,241N o rth C a ro lin a ......................................................... 151 1,889,865 781,005N o rth D a k o ta ............................................................ 159 429,227 267,726O h io .............................................................................. 547 5,563,519 1,909,110O k la h o m a ................................................................... 413 1,632,306 723,762
O re g o n ......................................................................... 49 1,076,571 494,285P e nnsy lvan ia ............................................................. 589 7,245,991 2,500,745Rhode Is la n d ............................................................ 8 402,604 118,372South C a ro lin a ......................................................... 130 810,149 381,123South D a ko ta ............................................................ 172 441,140 282,449
Te n n e sse e ................................................................. 290 1,755,149 770,454T e xa s ............................................................................ 1,113 7,251,811 2,914,453U ta h .............................................................................. 53 475,288 198,461V e rm o n t...................................................................... 48 149,522 79,216V irg in ia ........................................................................ 278 1,891,744 893,664
W a sh in g to n ............................................................... 95 1,520,555 676,018W est V irg in ia ............................................................. 183 704,557 374,257W isco n s in ................................................................... 575 2,201,036 918,007W yo m in g ..................................................................... 68 223,453 115,913A la ska .......................................................................... 10 132,311 60,314H a w a ii.................................................................. 7 307,279 114,334
57,345 62,868 57,591 53.4 15.0 16.5 15.11,021,419 1,511,606 3,890,417 30.7 11.0 16.3 42.0
330,891 443,104 679,498 45.1 12.5 16.7 25.7263,384 248,993 284,909 57.1 14.2 13.4 15.3222,177 217,286 181,640 57.1 15.3 15.0 12.5
188,157 219,872 299,393 51.2 13.0 15.2 20.7243,057 338,004 432,398 39.8 14.4 20.1 25.747,855 62,516 65,592 45.9 14.7 19.2 20.2
190,407 279,744 448,492 39.0 12.6 18.6 29.8401,698 674,577 1,423,656 28.1 11.6 19.4 41.0
457,069 711,454 1,262,456 36.4 12.0 18.6 33.0227,503 313,687 619,148 43.6 11.1 15.2 30.1126,527 158,642 123,546 51.6 15.0 18.8 14.6429,886 569,222 1,074,823 41.7 12.1 16.0 30.280,244 76,666 63,549 53.1 17.1 16.3 13.5
178,102 170,178 201,385 53.2 15.2 14.5 17.138,862 59,995 81,406 37.0 13.6 21.0 28.535,771 48,757 43,365 45.8 15.2 20.7 18.4
513,519 744,405 1,009,361 38.7 13.9 20.1 27.365,298 81,425 58,853 51.3 15.5 19.3 14.0
1,867,935 3,453,463 12,421,247 19.2 8.5 15.7 56.5233,909 338,838 536,114 41.3 12.4 17.9 28.465,150 54,385 41,967 62.4 15.2 12.7 9.8
626,114 964,272 2,064,023 34.3 11.3 17.3 37.1199,075 248,455 461,014 44.3 12.2 15.2 28.2
139,742 184,689 257,856 45.9 13.0 17.2 24.0823,667 1,251,080 2,670,499 34.5 11.4 17.3 36.951,366 87,535 145,330 29.4 12.8 21.7 36.1
112,740 144,144 172,141 47.0 13.9 17.8 21.270,003 49,997 38,692 64.0 15.9 11.3 8.8
208,151 304,452 472,092 43.9 11.9 17.3 26.9951,199 1,272,536 2,113,624 40.2 13.1 17.5 29.155,407 86,150 135,270 41.8 11.7 18.1 28.522,924 27,536 19,846 53.0 15.3 18.4 13.3
247,797 321,916 428,367 47.2 13.1 17.0 22.6
184,633 254,067 405,836 44.5 12.1 16.7 26.792,301 119,581 118,418 53.1 13.1 17.0 16.8
269,743 382,337 630,950 41.7 12.3 17.4 28.737,604 39,797 30,139 51.9 16.8 17.8 13.520,492 29,868 21,637 45.6 15.5 22.6 16.438,582 62,314 92,048 37.2 12.6 20.3 30.0
DEPOSITS
IN INSURED
CO
MM
ERC
IAL BANKS
115
Digitized for FRASER http://fraser.stlouisfed.org/ Federal Reserve Bank of St. Louis
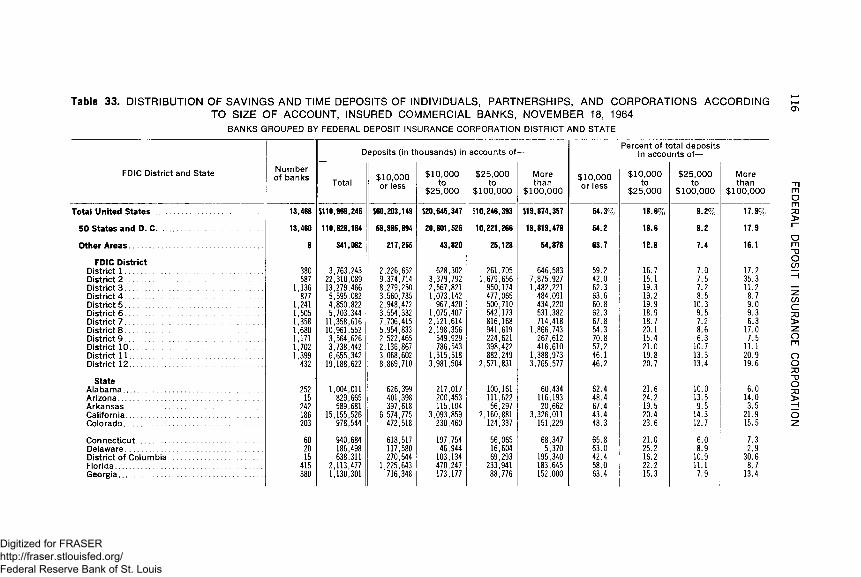
Table 33. DISTRIBUTION OF SAVINGS AND TIME DEPOSITS OF INDIVIDUALS, PARTNERSHIPS, AND CORPORATIONS ACCORDINGTO SIZE OF ACCOUNT, INSURED COMMERCIAL BANKS, NOVEMBER 18, 1964
BANKS GROUPED BY FEDERAL DEPOSIT INSURANCE CORPORATION DISTRICT AND STATE
FDIC D is tr ic t and S tate N u m b e r o f banks
D eposits (in th o u sa n d s) in accou n ts o f—Pe rcen t o f to ta l dep os its
in accou n ts o f—
Total$ 1 0 ,0 0 0 o r less
$ 1 0 ,0 0 0to
$ 2 5 ,0 0 0
$ 2 5 ,0 0 0to
$ 1 0 0 ,0 0 0
M oreth a n
$ 1 0 0 ,0 0 0
$ 1 0 ,0 0 0 o r less
$ 1 0 ,0 0 0to
$ 2 5 ,0 0 0
$ 2 5 ,0 0 0to
$ 1 0 0 ,0 0 0
M oreth a n
$ 1 0 0 ,0 0 0
Total United States.................................................. 13,468 $110,969,246 $60,203,149 $20,645,347 $10,246,393 $19,874,357 54.3% 18.6% 9.2% 17.9%
50 States and D. C................................................ 13,460 110,628,164 59,985,894 20,601,526 10,221,266 19,819,478 54.2 18.6 9.2 17.9
Other Areas............................................................. 8 341,082 217,255 43,820 25,128 54,878 63.7 12.8 7.4 16.1
FDIC DistrictD is tr ic t 1 .................................................................... 380 3,763,243 2,226,652 628,302 261,705 646,583 59.2 16.7 7.0 17.2D is tr ic t 2 .................................................................... 587 22,310,089 9,374,714 3,379,792 1,679,656 7,875,927 42.0 15.1 7.5 35.3D is tr ic t 3 ..................................................................... 1,136 13,279,466 8,279,250 2,567,821 950,174 1,482,221 62.3 19.3 7.2 11.2D is tr ic t 4 .............................................................. 877 5,595,082 3,560,785 1,073,142 477,065 484,091 63.6 19.2 8.5 8.7D is tr ic t 5 .................................................................... 1,241 4,850,822 2,948,472 967,420 500,710 434,220 60.8 19.9 10.3 9.0D is tr ic t 6 ..................................................................... 1,505 5,703,344 3,554,382 1,075,407 542,173 531,382 62.3 18.9 9.5 9.3D is tr ic t 7 .................................................................... 1,358 11,358,616 7,706,415 2,121,614 816,168 714,418 67.8 18.7 7.2 6.3D is tr ic t 8 ..................................................................... 1,680 10,961,552 5,954,833 2,198,356 941,619 1,866,743 54.3 20.1 8.6 17.0D is tr ic t 9 ..................................................................... 1,171 3,564,626 2,522,465 549,929 224,621 267,612 70.8 15.4 6.3 7.5D is tr ic t 1 0 .................................................................. 1,702 3,738,442 2,136,867 786,543 398,422 416,610 57.2 21.0 10.7 11.1D is tr ic t 1 1 .................................................................. 1,399 6,655,342 3,068,602 1,315,518 882,249 1,388,973 46.1 19.8 13.3 20.9D is tr ic t 1 2 .................................................................. 432 19,188,622 8,869,710 3,981,504 2,571,831 3,765,577 46.2 20.7 13.4 19.6
StateA la b a m a ..................................................................... 252 1,004,011 626,399 217,017 100,161 60,434 62.4 21.6 10.0 6.0A riz o n a ........................................................................ 15 829,665 401,398 200,453 111,622 116,193 48.4 24.2 13.5 14.0A rka n sa s .................................................................... 242 589,681 397,618 115,104 56,297 20,662 67.4 19.5 9.5 3.5C a lifo rn ia .................................................................... 186 15,155,526 6,574,775 3,093,859 2,160,881 3,326,011 43.4 20.4 14.3 21.9C o lo ra d o ..................................................................... 203 978,544 472,518 230,460 124,337 151,229 48.3 23.6 12.7 15.5
C o n n e c tic u t............................................................... 60 940,684 618,517 197,754 56,065 68,347 65.8 21.0 6.0 7.3D e law are .................................................................... 20 186,498 117,580 46,944 16,604 5,370 63.0 25.2 8.9 2.9D is tr ic t o f C o lu m b ia ............................................... 15 638,311 270,544 103,134 69,293 195,340 42.4 16.2 10.9 30.6F lo rid a ......................................................................... 415 2,113,477 1,225,643 470,247 233,941 183,645 58.0 22.2 11.1 8.7G eorg ia ........................................................................ 380 1,130,301 716,348 173,177 88,776 152,000 63.4 15.3 7.9 13.4
116 FEDERAL
DEPOSIT
INSU
RAN
CE
CO
RPO
RA
TION
Digitized for FRASER http://fraser.stlouisfed.org/ Federal Reserve Bank of St. Louis
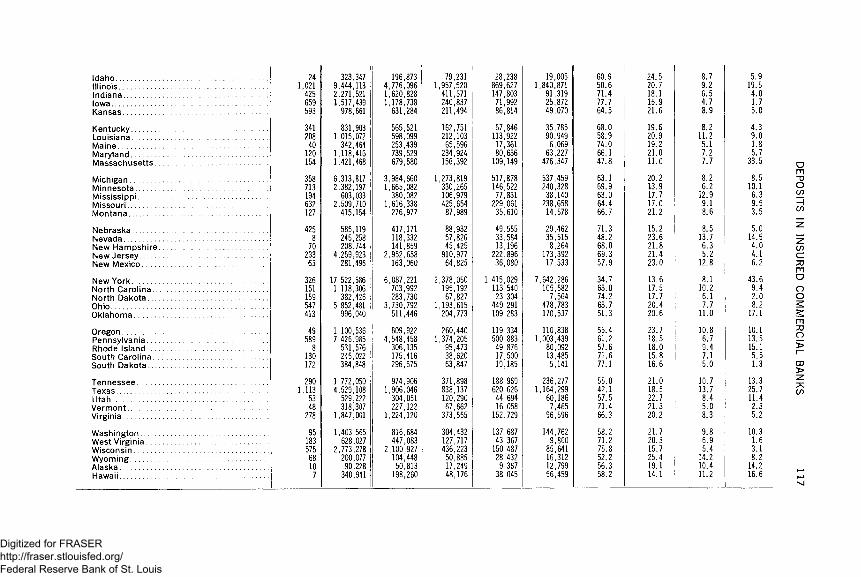
Id a h o ...................I ll in o is ..................In d ia n a ...............Io w a ......................K a nsas................
K e n tu c k y ............L o u is ia n a ...........M a in e ...................M a ry la n d ............M a ssa ch u se tts .
M ic h ig a n .............M in n e s o ta ..........M is s is s ip p i.........M is s o u ri..............M o n ta n a .............
N e b ra s k a ...........N e va d a ................New H a m p sh ireNew J e rs e y ........New M e x ic o . . . .
New Y o rk ............N o rth C a ro lin a .. N o rth D a k o ta ...O h io ......................O k la h o m a ..........
O re g o n ................P e n n s y lv a n ia ... Rhode I s la n d . . . South C a ro lin a . . South D a k o ta ...
T e n n e sse e .........T e xa s ...................U ta h .....................V e rm o n t..............V irg in ia ................
W a s h in g to n .......W est V irg in ia . . .W is c o n s in . ........W y o m in g ............A la s k a ..................H a w a ii..................
24 323,347 196,8731,021 9,444,113 4,776,096
425 2,271,521 1,620,828659 1,517,439 1,178,738593 978,661 631,284
341 831,903 565,521208 1,015,072 598,09940 342,464 253,439
120 1,118,416 739,629154 1,421,468 679,580
358 6,313,817 3,984,660713 2,382,197 1,665,082194 603,033 380,082632 2,509,710 1,616,338127 415,154 276,977
425 585,119 417,1718 245,258 118,332
70 208,744 141,859233 4,259,923 2,952,65863 281,496 163,060
326 17,522,586 6,087,221151 1,118,306 703,992159 382,426 283,730547 5,852,481 3,730,792413 996,040 511,446
49 1,100,536 609,922589 7,426,985 4,548,458
8 531,576 306,135130 245,022 175,416172 384,848 296,675
290 1,772,050 974,9061,113 4,529,108 1,906,046
53 529,222 304,05148 318,307 227,122
278 1,847,001 1,224,120
95 1,403,565 816,684183 628,027 447,083575 2,773,278 2,100,92768 200,077 104,44810 90,228 50,8137 340,941 198,260
79,231 28,238 19,005 60.9 24.5 8.7 5.91,957,520 869,627 1,840,871 50.6 20.7 9.2 19.5
411,571 147,803 91,319 71.4 18.1 6.5 4.0240,837 71,992 25,872 77.7 15.9 4.7 1.7211,494 86,814 49,070 64.5 21.6 8.9 5.0
162,751 67,846 35,785 68.0 19.6 8.2 4.3212,103 113,922 90,949 58.9 20.9 11.2 9.065,596 17,361 6,069 74.0 19.2 5.1 1.8
234,924 80,636 63,227 66.1 21.0 7.2 5.7156,392 109,149 476,347 47.8 11.0 7.7 33.5
1,273,819 517,878 537,459 63.1 20.2 8.2 8.5330,265 146,522 240,328 69.9 13.9 6.2 10.1106,979 77,831 38,140 63.0 17.7 12.9 6.3425,654 229,061 238,658 64.4 17.0 9.1 9.587,989 35,610 14,578 66.7 21.2 8.6 3.5
88,932 49,555 29,462 71.3 15.2 8.5 5.057,826 33,584 35,515 48.2 23.6 13.7 14.545,425 13,196 8,264 68.0 21.8 6.3 4.0
910,977 222,896 173,392 69.3 21.4 5.2 4.164,825 36,080 17,533 57.9 23.0 12.8 6.2
2,378,050 1,415,029 7,642,286 34.7 13.6 8.1 43.6195,192 113,540 105,582 63.0 17.5 10.2 9.467,827 23,304 7,564 74.2 17.7 6.1 2.0
1,193,615 449,291 478,783 63.7 20.4 7.7 8.2204,773 109,283 170,537 51.3 20.6 11.0 17.1
260,440 119,334 110,838 55.4 23.7 10.8 10.11,374,205 500,883 1,003,439 61.2 18.5 6.7 13.5
95,473 49,876 80,092 57.6 18.0 9.4 15.138,620 17,500 13,485 71.6 15.8 7.1 5.563,847 19,185 5,141 77.1 16.6 5.0 1.3
371,898 188,969 236,277 55.0 21.0 10.7 13.3838,137 620,626 1,164,299 42.1 18.5 13.7 25.7120,290 44,694 60,186 57.5 22.7 8.4 11.467,662 16,058 7,465 71.4 21.3 5.0 2.3
373,555 152,729 96,596 66.3 20.2 8.3 5.2
304,432 137,687 144,762 58.2 21.7 9.8 10.3127,717 43,367 9,860 71.2 20.3 6.9 1.6436,223 150,487 85,641 75.8 15.7 5.4 3.1
50,885 28,432 16,312 52.2 25.4 14.2 8.217,249 9,367 12,799 56.3 19.1 10.4 14.248,176 38,045 56,459 58.2 14.1 11.2 16.6
DEPOSITS
IN INSURED
CO
MM
ERC
IAL BANKS
117
Digitized for FRASER http://fraser.stlouisfed.org/ Federal Reserve Bank of St. Louis
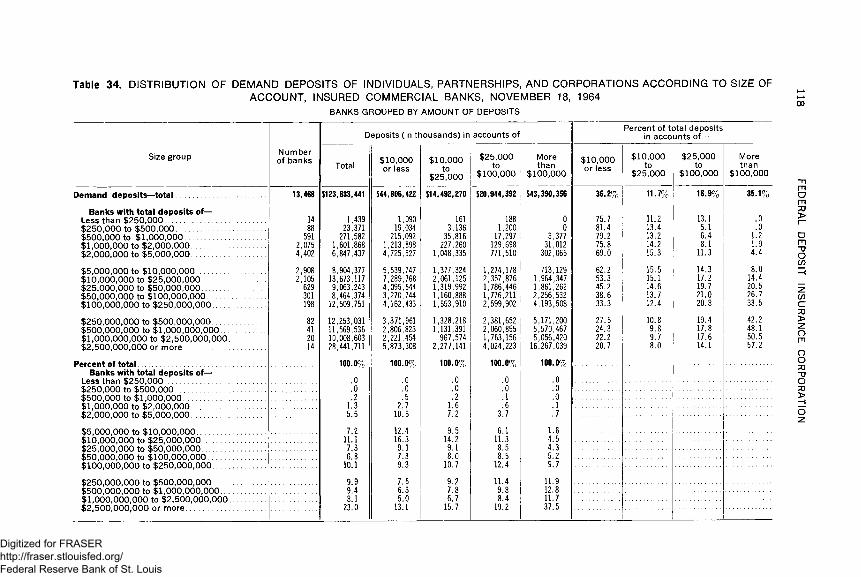
Table 34. DISTRIBUTION OF DEMAND DEPOSITS OF INDIVIDUALS, PARTNERSHIPS, AND CORPORATIONS ACCORDING TO SIZE OFACCOUNT, INSURED COMMERCIAL BANKS, NOVEMBER 18, 1964
BANKS GROUPED BY AMOUNT OF DEPOSITS
Size g ro u pN u m b e r o f banks
Deposits (in th o u sa n d s) in accou n ts o f -Pe rcen t o f to ta l dep osits
in accou n ts o f —
Total$ 1 0 ,0 0 0 o r less
$ 1 0 ,0 0 0to
$ 2 5 ,0 0 0
$ 2 5 ,0 0 0to
$ 1 0 0 ,0 0 0
M orethan
$ 1 0 0 ,0 0 0
$ 1 0 ,0 0 0 o r less
$ 1 0 ,0 0 0to
$ 2 5 ,0 0 0
$ 2 5 ,0 0 0to
$ 1 0 0 ,0 0 0
M orethan
$ 1 0 0 ,0 0 0
Demand deposits—tota l......................................... 13,468 $123,633,441 $44,806,422 $14,492,270 $20,944,392 $43,390,356 36.2% 11.7% 16.9% 35.1%
Banks with total deposits of—Less th a n $ 2 5 0 ,0 0 0 .................................................. 14 1,439 1,090 161 188 0 75.7 11.2 13.1 .0$ 2 5 0 ,0 0 0 to $ 5 0 0 ,0 0 0 ............................................ 88 23,371 19,034 3,136 1,200 0 81.4 13.4 5.1 .0$ 5 0 0 ,0 0 0 to $ 1 ,0 0 0 ,0 0 0 ........................................ 591 271,582 215,092 35,816 17,297 3,377 79.2 13.2 6.4 1.2$ 1 ,0 0 0 ,0 0 0 to $ 2 ,0 0 0 ,0 0 0 ..................................... 2,075 1,601,868 1,213,898 227,260 129,698 31,012 75.8 14.2 8.1 1.9$ 2 ,0 0 0 ,0 0 0 to $ 5 ,0 0 0 ,0 0 0 ..................................... 4,402 6,847,437 4,725,527 1,048,335 771,510 302,065 69.0 15.3 11.3 4.4
$ 5 ,0 0 0 ,0 0 0 to $ 1 0 ,0 0 0 ,0 0 0 .................................. 2,908 8,904,377 5,539,747 1,377,324 1,274,178 713,129 62.2 15.5 14.3 8.0$ 1 0 ,0 0 0 ,0 0 0 to $ 2 5 ,0 0 0 ,0 0 0 ............................... 2,105 13,673,117 7,289,768 2,061,125 2,357,876 1,964,347 53.3 15.1 17.2 14.4$ 2 5 ,0 0 0 ,0 0 0 to $ 5 0 ,0 0 0 ,0 0 0 ............................... 629 9,063,243 4,095,544 1,319,992 1,786,446 1,861,262 45.2 14.6 19.7 20.5$ 5 0 ,0 0 0 ,0 0 0 to $ 1 0 0 ,0 0 0 ,0 0 0 ............................. 301 8,464,374 3,270,744 1,160,888 1,776,211 2,256,532 38.6 13.7 21.0 26.7$ 1 0 0 ,0 0 0 ,0 0 0 to $ 2 5 0 ,0 0 0 ,0 0 0 .......................... 198 12,509,751 4,162,433 1,553,910 2,599,902 4,193,508 33.3 12.4 20.8 33.5
$ 2 5 0 ,0 0 0 ,0 0 0 to $ 5 0 0 ,0 0 0 ,0 0 0 .......................... 82 12,253,031 3,371,961 1,328,218 2,381,652 5,171,200 27.5 10.8 19.4 42.2$ 5 0 0 ,0 0 0 ,0 0 0 to $ 1 ,0 0 0 ,0 0 0 ,0 0 0 ...................... 41 11,569,536 2,806,823 1,131,391 2,060,855 5,570,467 24.3 9.8 17.8 48.1$ 1 ,0 0 0 ,0 0 0 ,0 0 0 to $ 2 ,5 0 0 ,0 0 0 ,0 0 0 .................. 20 10,008,603 2,221,454 967,574 1,763,156 5,056,420 22.2 9.7 17.6 50.5$ 2 ,5 0 0 ,0 0 0 ,0 0 0 o r m o re ........................................ 14 28,441,711 5,873,308 2,277,141 4,024,223 16,267,039 20.7 8.0 14.1 57.2
Percent of total 100.0% 100.0% 100.0% 100.0% 100.0%Banks with total deposits of—
Less th a n $ 2 5 0 0 0 0 .0 .0 .0 .0 .0$ 2 5 0 0 0 0 to $ 5 0 0 0 0 0 .0 .0 .0 .0 .0$ 5 0 0 0 0 0 to $1 0 0 0 0 0 0 .2 .5 .2 .1 .0$1 0 0 0 0 0 0 to $2 0 0 0 0 0 0 1.3 2.7 1.6 .6 .1$2 0 0 0 0 0 0 to $5 0 0 0 0 0 0 5.5 10.5 7.2 3.7 .7
$5 0 0 0 0 0 0 to $ 1 0 0 0 0 0 0 0 7.2 12.4 9.5 6.1 1.6$ 1 0 0 0 0 0 0 0 to $ 25 0 0 0 0 0 0 11.1 16.3 14.2 11.3 4.5$25 0 0 0 0 0 0 to $ 5 0 0 0 0 0 0 0 7.3 9.1 9.1 8.5 4.3$ 5 0 0 0 0 0 0 0 to $ 1 0 0 0 0 0 0 0 0 6.8 7.3 8.0 8.5 5.2$ 1 0 0 0 0 0 0 0 0 to $ 2 5 0 0 0 0 0 0 0 10.1 9.3 10.7 12.4 9.7
$ 2 5 0 0 0 0 0 0 0 to $ 5 0 0 0 0 0 0 0 0 9 9 7.5 9.2 11.4 11.9$ 5 0 0 0 0 0 0 0 0 to $1 0 0 0 0 0 0 0 0 0 9.4 6.3 7.8 9.8 12.8$1 0 0 0 0 0 0 0 0 0 to $2 5 0 0 0 0 0 0 0 0 8.1 5.0 6.7 8.4 11.7$2 5 0 0 0 0 0 0 0 0 o r m ore 23.0 13.1 15.7 19.2 37.5
118 FEDERAL
DEPOSIT
INSU
RAN
CE
CO
RPO
RA
TION
Digitized for FRASER http://fraser.stlouisfed.org/ Federal Reserve Bank of St. Louis
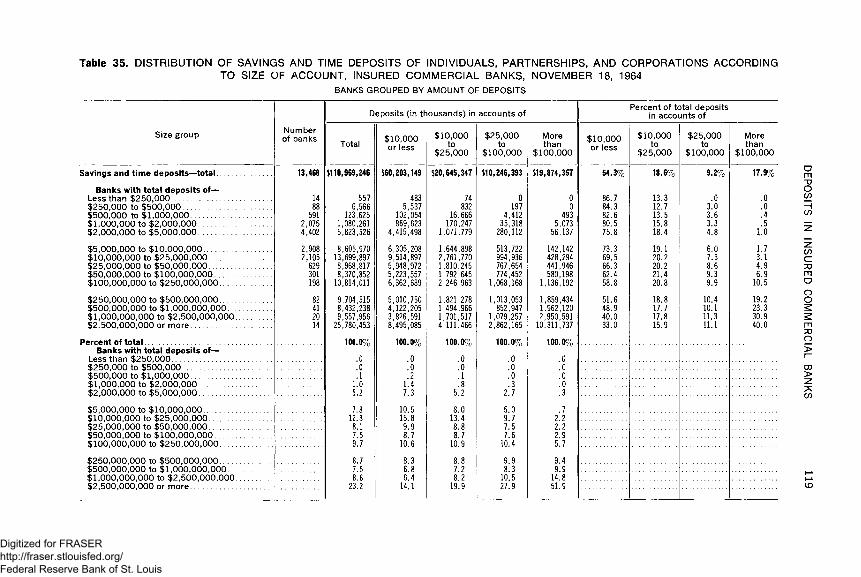
Table 35. DISTRIBUTION OF SAVINGS AND TIME DEPOSITS OF INDIVIDUALS, PARTNERSHIPS, AND CORPORATIONS ACCORDINGTO SIZE OF ACCOUNT, INSURED COMMERCIAL BANKS, NOVEMBER 18, 1964
BANKS GROUPED BY AMOUNT OF DEPOSITS
Size group Number of banks
Deposits (in thousands) in accounts o f-
Total$10,000 or less
$10,000to
$25,000
$25,000to
$ 100,000
Morethan
$100,000
Percent of total deposits in accounts of—
$ 10,000 or less
$10,000to
$25,000
$25,000to
$ 100,000
Morethan
$100,000
Savings and time deposits—tota l..
Banks with total deposits of—Less than $ 2 5 0 ,0 0 0 .......................$250,000 to $50 0 ,0 0 0 ..................$500,000 to $1 ,000 ,000 ...............$1,000,000 to $2 ,0 00 ,0 0 0 ...........$2,000,000 to $5 ,0 00 ,0 0 0 ...........
$5,000,000 to $10 ,00 0 ,0 0 0 .......$10,000,000 to $25 ,00 0 ,0 0 0 ......$25,000,000 to $50 ,00 0 ,0 0 0 ......$50,000,000 to $100 ,000 ,000 .. $100,000,000 to $250,000,000.
$250,000,000 to $ 500 ,000 ,000 .......$500,000,000 to $1,000,000,000 ... $1,000,000,000 to $2,500,000,000. $2,500,000,000 or m o re ....................
Percent of to ta l....................................Banks with total deposits of—
Less than $25 0 ,0 0 0 ......................$250,000 to $50 0 ,0 0 0 .................$500,000 to $1 ,0 00 ,0 0 0 ...............$1,000,000 to $2 ,000 ,000 ...........$2,000,000 to $5 ,0 00 ,0 0 0 ..........
$5,000,000 to $ 10 ,00 0 ,0 0 0 .......$10,000,000 to $ 2 5 ,0 0 0 ,0 0 0 .... $25,000,000 to $50,000,000 .. . . $50,000,000 to $100,000,000. . $100,000,000 to $250,000,000.
$250,000,000 to $500 ,0 0 0 ,0 00 .........$500,000,000 to $1,000,000,000 .. $1,000,000,000 to $2,500,000,000. $2,500,000,000 or m ore .....................
13,468
1488
5912,0754,402
2,9082,105
629301198
$110,969,246
5576,566
123,6251,080,2615,823,526
8,605,97013,699,8978,968,8178,370,852
10,814,011
9,704,5158,432,2389,557,956
25,780,453
100.0%.0.0.1
1.05.2
7.812.3
8.17.59.7
8.77.68.6
23.2
$60,203,149
4835,537
102,054869,623
4,415,498
6,305,2089,514,8975,948,9725,223,5576,362,689
5,010,7504,122,2053,826,5918,495,085
100. 0%
.0
.0.21.47.3
10.5 15.89.98.7
10.6
8.36.86.4
14.1
$20,645,347
74832
16,666170,247
1,071,779
1,644,8982,761,7701,810,2451,792,6452,246,963
1,821,2781,494,9661,701,5174,111,466
100. 0%.0.0.1.8
5.2
8.013.48.88.7
10.9
7.28.2
19.9
$10,246,393
0197
4,41235,318
280,112
513,722994,936767,654774,452
1,068,168
1,013,053852,947
1,079,2572,862,165
100.0%.0.0.0.3
2.7
5.09.77.57.6
10.4
9.98.3
10.5 27.9
$19,874,357
00
4935,073
56,137
142,142428,294441,946580,198
1,136,192
1,859,4341,962,1202,950,591
10,311,737
100. 0%.0.0.0.0.3
.72.22.22.9 5.7
9.49.9
14.851.9
54.3
86.784.3 82.680.575.8
73.369.566.362.458.8
51.648.940.033.0
18.6
13.312.7 13.515.818.4
19.120.2 20.221.420.8
18.817.717.815.9
9.2%
.03.03.63.34.8
6.07.38.69.39.9
10.410.111.311.1
17.9%
.0
.0
.4
.51.0
1.73.14.96.9
10.5
19.223.3 30.9 40.0
DEPOSITS
IN INSURED
CO
MM
ERC
IAL BANKS
119
Digitized for FRASER http://fraser.stlouisfed.org/ Federal Reserve Bank of St. Louis
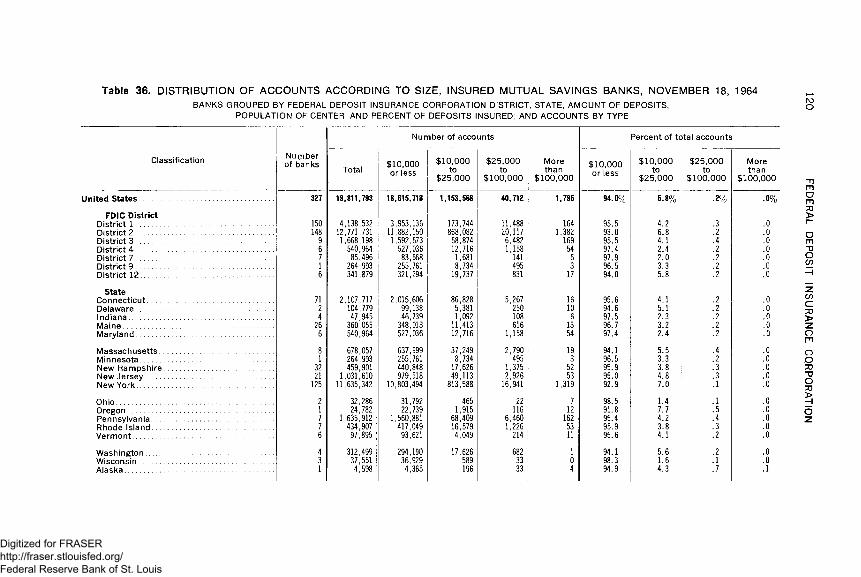
Table 36. DISTRIBUTION OF ACCOUNTS ACCORDING TO SIZE, INSURED MUTUAL SAVINGS BANKS, NOVEMBER 18, 1964 BANKS GROUPED BY FEDERAL DEPOSIT INSURANCE CORPORATION DISTRICT, STATE, AM O UNT OF DEPOSITS,
PO PULATIO N OF CENTER, AND PERCENT OF DEPOSITS INSURED; AND ACCO UNTS BY TYPE
C lassifica tion N u m b e r o f banks
N u m be r o f accou n ts P e rcen t o f to ta l accou n ts
Total$10 ,000 or less
$ 1 0 ,0 0 0to
$ 2 5 ,0 0 0
$ 2 5 ,0 0 0to
$ 1 0 0 ,0 0 0
M oreth a n
$ 1 0 0 ,0 0 0
$ 1 0 ,0 0 0 or less
$ 1 0 ,0 0 0to
$ 2 5 ,0 0 0
$ 2 5 ,0 0 0to
$ 1 0 0 ,0 0 0
Morethan
$1 0 0 ,0 0 0
United States 327 19,811,793 18,615,718 1,153,568 40,712 1,795 94.0% 5.8% • 2% • 0%
FDIC DistrictD is tr ic t 1 ........................ ............................................ 150 4,138,532 3,953,136 173,744 11,488 164 95.5 4.2 .3 .0D is tr ic t 2 ..................................................................... 148 12,771,731 11,882,150 868,082 20,117 1,382 93.0 6.8 .2 .0D is tr ic t 3 ..................................................................... 9 1,668,198 1,592,673 68,874 6,482 169 95.5 4.1 .4 .0D is tr ic t 4 ..................................................................... 6 540,964 527,036 12,716 1,158 54 97.4 2.4 .2 .0D is tr ic t 7 ..................................................................... 7 85,496 83,668 1,681 141 6 97.9 2.0 .2 .0D is tr ic t 9 ..................................................................... 1 264,993 255,761 8,734 495 3 96.5 3.3 .2 .0D is tr ic t 1 2 .................................................................. 6 341,879 321,294 19,737 831 17 94.0 5.8 .2 .0
StateC o n n e c tic u t............................................................... 71 2,107,717 2,015,606 86,828 5,267 16 95.6 4.1 .2 .0D e law are ..................................................................... 2 104,779 99,138 5,381 250 10 94.6 5.1 .2 .0In d ia n a ........................................................................ 4 47,945 46,739 1,092 108 6 97.5 2.3 .2 .0M a in e ........................................................................... 26 360,055 348,013 11,413 616 13 96.7 3.2 .2 .0M a ry la n d ..................................................................... 6 540,964 527,036 12,716 1,158 54 97.4 2.4 .2 .0
M a ssa ch u se tts ......................................................... 8 678,057 637,999 37,249 2,790 19 94.1 5.5 .4 .0M in n e s o ta .................................................................. 1 264,993 255,761 8,734 495 3 96.5 3.3 .2 .0New H a m p s h ire ....................................................... 32 459,901 440,848 17,626 1,375 52 95.9 3.8 .3 .0New J e rs e y ................................................................ 21 1,031,610 979,518 49,113 2,926 53 95.0 4.8 .3 .0New Y o rk .................................................................... 125 11,635,342 10,803,494 813,588 16,941 1,319 92.9 7.0 .1 .0
O h io .............................................................................. 2 32,286 31,792 465 22 7 98.5 1.4 .1 .0O re g o n ......................................................................... 1 24,782 22,739 1,915 116 12 91.8 7.7 .5 .0P e nnsy lvan ia ............................................................. 7 1,635,912 1,560,881 68,409 6,460 162 95.4 4.2 .4 .0Rhode Is la n d ............................................................ 7 434,907 417,049 16,579 1,226 53 95.9 3.8 .3 .0V e rm o n t...................................................................... 6 97,895 93,621 4,049 214 11 95.6 4.1 .2 .0
W a sh in g to n ................................................................W isco n s in ...................................................................
4 312,499 294,190 17,626 682 1 94.1 5.6 .2 .03 37,551 36,929 589 33 0 98.3 1.6 .1 .0
A la s k a .......................................................................... 1 4,598 4,365 196 33 4 94.9 4.3 .7 .1
120 FEDERAL
DEPOSIT
INSU
RAN
CE
CQ
RPO
RA
TION
Digitized for FRASER http://fraser.stlouisfed.org/ Federal Reserve Bank of St. Louis
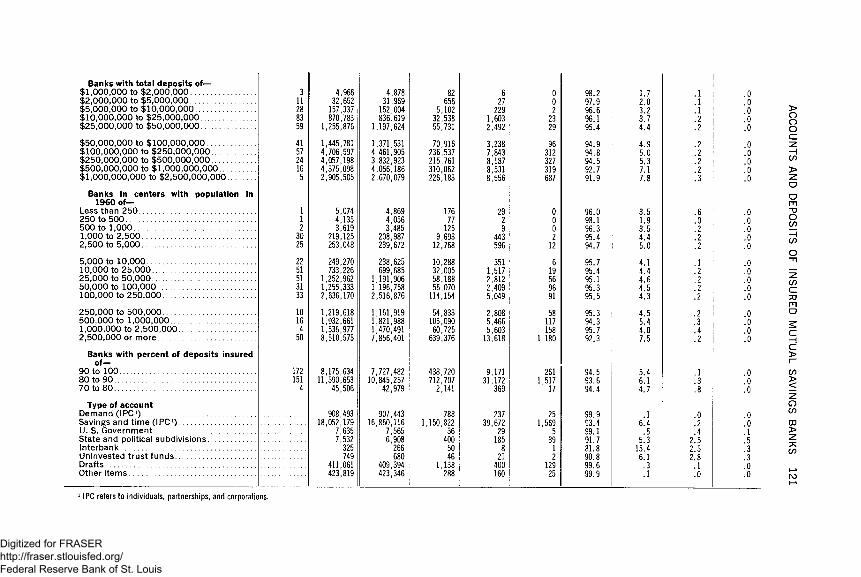
Banks with total deposits of—$ 1 ,0 0 0 ,0 0 0 to $ 2 ,0 0 0 ,0 0 0 ................................$ 2 ,0 0 0 ,0 0 0 to $ 5 ,0 0 0 ,0 0 0 ................................$ 5 ,0 0 0 ,0 0 0 to $ 1 0 ,0 0 0 ,0 0 0 ..............................$ 1 0 ,0 0 0 ,0 0 0 to $ 2 5 ,0 0 0 ,0 0 0 ...........................$ 2 5 ,0 0 0 ,0 0 0 to $ 5 0 ,0 0 0 ,0 0 0 ...........................
311288359
4,96632,652
157,337870,783
1,255,876
4,87831,969
152,004836,619
1,197,624
$ 5 0 ,0 0 0 ,0 0 0 to $ 1 0 0 ,0 0 0 ,0 0 0 ........................$ 1 0 0 ,0 0 0 ,0 0 0 to $ 2 5 0 ,0 0 0 ,0 0 0 ......................$ 2 5 0 ,0 0 0 ,0 0 0 to $ 5 0 0 ,0 0 0 ,0 0 0 ......................$ 5 0 0 ,0 0 0 ,0 0 0 to $ 1 ,0 0 0 ,0 0 0 ,0 0 0 ..................$ 1 ,0 0 0 ,0 0 0 ,0 0 0 to $ 2 ,5 0 0 ,0 0 0 ,0 0 0 ..............
415724165
1,445,7814,706,5974,057,1984,375,0982,905,505
1,371,5314,461,9053,832,9234,056,1862,670,079
Banks in centers with population in 1960 of—
Less th a n 2 5 0 ..........................................................2 5 0 to 5 0 0 .................................................................5 0 0 to 1 ,0 0 0 .............................................................1 ,000 to 2 ,5 0 0 .........................................................2 ,5 0 0 to 5 ,0 0 0 .........................................................
112
3025
5,0744,1353,619
219,125253,048
4,8694,0563,485
208,987239,672
5 .0 0 0 to 1 0 ,0 0 0 ......................................................1 0 .0 0 0 to 2 5 ,0 0 0 ...................................................2 5 .0 0 0 to 5 0 ,0 0 0 ...................................................5 0 .0 0 0 to 1 0 0 ,0 0 0 .................................................1 0 0 .0 0 0 to 2 5 0 ,0 0 0 ..............................................
2251513133
249,270733,226
1,252,9621,255,3332,636,170
238,625699,685
1,191,9061,196,7582,516,876
2 5 0 .0 0 0 to 5 0 0 ,0 0 0 ..............................................5 0 0 .0 0 0 to 1 ,0 0 0 ,0 0 0 ..........................................1 ,0 0 0 ,0 0 0 to 2 ,5 0 0 ,0 0 0 ......................................2 .5 0 0 .0 0 0 o r m o re ................................................
10164
50
1,219,6181,932,6611,536,9778,510,575
1,161,9191,821,9881,470,4917,856,401
Banks with percent of deposits insured of—
9 0 to 1 0 0 ....................................................................8 0 to 9 0 ......................................................................70 to 8 0 ......................................................................
172151
4
8,175,63411,590,653
45,506
7,727,48210,845,257
42,979
Type of accountD em and ( IP C 1) ........................................................ 908,493
18,052,1797,635
907,44316,860,116
7,5656,908
266
Savings and t im e ( IP C 1) ......................................U. S. G o v e rn m e n t..................................................S tate and po litica l s u b d iv is io n s ....................... 7,532
325In te rb a n k ...................................................................U n invested t ru s t fu n d s ........................................ 749 680D ra fts ........................................................................... 411,061
423,819409,394423,346O ther ite m s ...............................................................
1 IPC refers to individuals, partnerships, and corporations.
82 6 0 98.2 1.7 .1 .0656 27 0 97.9 2.0 .1 .0
5,102 229 2 96.6 3.2 .1 .032,538 1,603 23 96.1 3.7 .2 .055,731 2,492 29 95.4 4.4 .2 .0
70,916 3,238 96 94.9 4.9 .2 .0236,537 7,843 312 94.8 5.0 .2 .0215,761 8,187 327 94.5 5.3 .2 .0310,062 8,531 319 92.7 7.1 .2 .0226,183 8,556 687 91.9 7.8 .3 .0
176 29 0 96.0 3.5 .6 .077 2 0 98.1 1.9 .0 .0
125 9 0 96.3 3.5 .2 .09,693 443 2 95.4 4.4 .2 .0
12,768 596 12 94.7 5.0 .2 .0
10,288 351 6 95.7 4.1 .1 .032,005 1,517 19 95.4 4.4 .2 .058,188 2,812 56 95.1 4.6 .2 .056,070 2,409 96 95.3 4.5 .2 .0
114,154 5,049 91 95.5 4.3 .2 .0
54,833 2,808 58 95.3 4.5 .2 .0105,090 5,466 117 94.3 5.4 .3 .060,725 5,603 158 95.7 4.0 .4 .0
639,376 13,618 1,180 92.3 7.5 .2 .0
438,720 9,171 261 94.5 5.4 .1 .0712,707 31,172 1,517 93.6 6.1 .3 .0
2,141 369 17 94.4 4.7 .8 .0
788 237 25 99.9 .1 .0 .01,150,822 39,672 1,569 93.4 6.4 .2 .0
36 29 5 99.1 .5 .4 .1400 185 39 91.7 5.3 2.5 .5
50 8 1 81.8 15.4 2.5 .346 21 2 90.8 6.1 2.8 .3
1,138 400 129 99.6 .3 .1 .0288 160 25 99.9 .1 .0 .0
ACCOUNTS
AND DEPO
SITS OF
INSURED M
UTU
AL SAVING
S BANKS
121
Digitized for FRASER http://fraser.stlouisfed.org/ Federal Reserve Bank of St. Louis
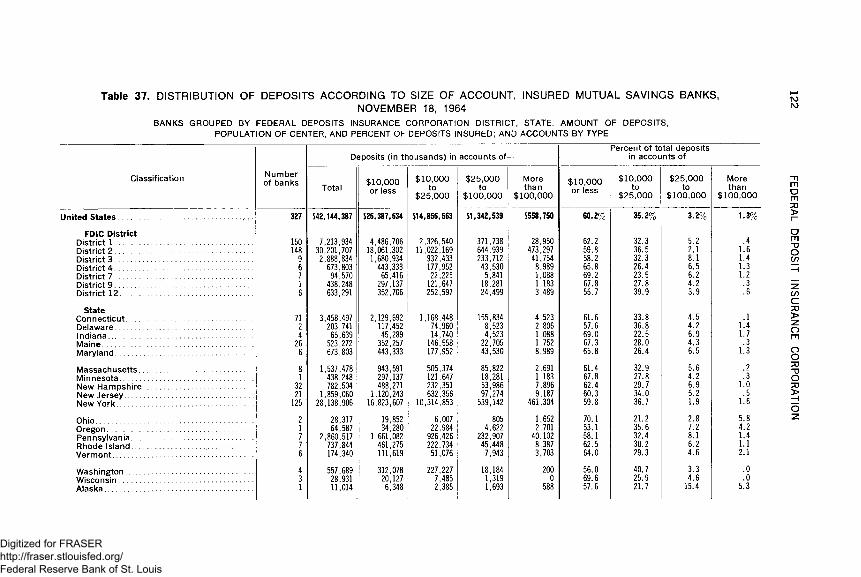
Table 37. DISTRIBUTION OF DEPOSITS ACCORDING TO SIZE OF ACCOUNT, INSURED MUTUAL SAVINGS BANKS,NOVEMBER 18, 1964
BANKS GROUPED BY FEDERAL DEPOSITS INSURANCE CORPORATION DISTRICT, STATE, AM O UNT OF DEPOSITS, PO PULATIO N OF CENTER, AND PERCENT OF DEPOSITS INSURED; AND ACCO UNTS BY TYPE
C lassifica tion N u m b e r o f ban ks
Deposits (in th o u sa n d s) in acco u n ts of-Pe rcen t o f to ta l dep osits
in acco u n ts o f—
Total$ 1 0 ,0 0 0 or less
$ 1 0 ,0 0 0to
$ 2 5 ,0 0 0
$ 2 5 ,0 0 0to
$ 1 0 0 ,0 0 0
M orethan
$ 1 0 0 ,0 0 0
$ 1 0 ,0 0 0 o r less
$ 1 0 ,0 0 0to
$ 2 5 ,0 0 0
$ 2 5 ,0 0 0to
$ 1 0 0 ,0 0 0
M oreth a n
$ 1 0 0 ,0 0 0
United States......................................................... 327 $42,144,387 $25,387,534 $14,855,563 $1,342,539 $558,750 60.2% 35.2% 3.2% 1.3%
FDIC DistrictD is tr ic t 1 ..................................................................... 150 7,213,934 4,486,706 2,326,540 371,738 28,950 62.2 32.3 5.2 .4D is tr ic t 2 ..................................................................... 148 30,201,707 18,061,302 11,022,169 644,939 473,297 59.8 36.5 2.1 1.6D is tr ic t 3 ..................................................................... 9 2,888,834 1,680,934 932,433 233,712 41,754 58.2 32.3 8.1 1.4D is tr ic t 4 ..................................................................... 6 673,803 443,333 177,952 43,530 8,989 65.8 26.4 6.5 1.3D is tr ic t 7 ..................................................................... 7 94,570 65,416 22,225 5,841 1,088 69.2 23.5 6.2 1.2D is tr ic t 9 ..................................................................... 1 438,248 297,137 121,647 18,281 1,183 67.8 27.8 4.2 .3D is tr ic t 1 2 .................................................................. 6 633,291 352,706 252,597 24,499 3,489 55.7 39.9 3.9 .6
StateC o n n e c tic u t............................................................... 71 3,458,497 2,129,692 1,168,448 155,834 4,523 61.6 33.8 4.5 .1D e law are ..................................................................... 2 203,741 117,452 74,960 8,523 2,806 57.6 36.8 4.2 1.4In d ia n a ........................................................................ 4 65,639 45,289 14,740 4,523 1,088 69.0 22.5 6.9 1.7M a in e ........................................................................... 26 523,272 352,257 146,558 22,705 1,752 67.3 28.0 4.3 .3M a ry la n d ..................................................................... 6 673,803 443,333 177,952 43,530 8,989 65.8 26.4 6.5 1.3
M a ssa ch u se tts ......................................................... 8 1,537,478 943,591 505,374 85,822 2,691 61.4 32.9 5.6 .2M in n e s o ta .................................................................. 1 438,248 297,137 121,647 18,281 1,183 67.8 27.8 4.2 .3New H a m p s h ire ....................................................... 32 782,504 488,271 232,351 53,986 7,896 62.4 29.7 6.9 1.0New J e rs e y ................................................................ 21 1,859,060 1,120,243 632,356 97,274 9,187 60.3 34.0 5.2 .5New Y o rk .................................................................... 125 28,138,906 16,823,607 10,314,853 539,142 461,304 59.8 36.7 1.9 1.6
O h io .............................................................................. 2 28,317 19,852 6,007 805 1,652 70.1 21.2 2.8 5.8O re g o n ......................................................................... 1 64,587 34,280 22,984 4,622 2,701 53.1 35.6 7.2 4.2P e nnsy lvan ia ............................................................. 7 2,860,517 1,661,082 926,426 232,907 40,102 58.1 32.4 8.1 1.4Rhode Is la n d ............................................................ 7 737,844 461,275 222,734 45,448 8,387 62.5 30.2 6.2 1.1V e rm o n t...................................................................... 6 174,340 111,619 51,076 7,943 3,703 64.0 29.3 4.6 2.1
W a sh in g to n ................................................................ 4 557,689 312,078 227,227 18,184 200 56.0 40.7 3.3 .0W isco n s in ................................................................... 3 28,931 20,127 7,485 1,319 0 69.6 25.9 4.6 .0A la s k a .......................................................................... 1 11,014 6,348 2,385 1,693 588 57.6 21.7 15.4 5.3
122 FEDERAL
DEPOSIT
INSU
RAN
CE
CO
RP
OR
ATIO
N
Digitized for FRASER http://fraser.stlouisfed.org/ Federal Reserve Bank of St. Louis
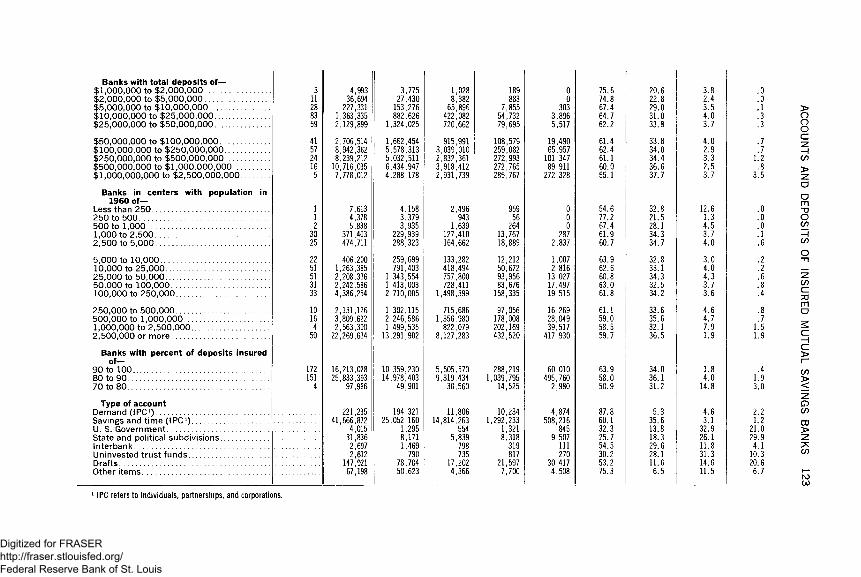
Banks with total deposits of—$ 1 ,0 0 0 ,0 0 0 to $ 2 ,0 0 0 ,0 0 0 .................................$ 2 ,0 0 0 ,0 0 0 to $ 5 ,0 0 0 ,0 0 0 ................................$ 5 ,0 0 0 ,0 0 0 to $ 1 0 ,0 0 0 ,0 0 0 ..............................$ 1 0 ,0 0 0 ,0 0 0 to $ 2 5 ,0 0 0 ,0 0 0 ...........................$ 2 5 ,0 0 0 ,0 0 0 to $ 5 0 ,0 0 0 ,0 0 0 ...........................
311288359
4,99336,694
227,3311,363,3352,129,899
3,77527,430
153,276882,626
1,324,025
$ 5 0 ,0 0 0 ,0 0 0 to $ 1 0 0 ,0 0 0 ,0 0 0 ........................$ 1 0 0 ,0 0 0 ,0 0 0 to $ 2 5 0 ,0 0 0 ,0 0 0 ......................$ 2 5 0 ,0 0 0 ,0 0 0 to $ 5 0 0 ,0 0 0 ,0 0 0 ......................$ 5 0 0 ,0 0 0 ,0 0 0 to $ 1 ,0 0 0 ,0 0 0 ,0 0 0 ..................$ 1 ,0 0 0 ,0 0 0 ,0 0 0 to $ 2 ,5 0 0 ,0 0 0 ,0 0 0 ..............
415724165
2,706,5148,942,3628,239,212
10,716,0357,778,012
1,662,4545,578,3135,032,5116,434,9474,288,178
Banks in centers with population in 1960 of—
Less th a n 2 5 0 ..........................................................2 5 0 to 5 0 0 .................................................................5 0 0 to 1 ,0 0 0 .............................................................1 ,000 to 2 ,5 0 0 .........................................................2 ,5 0 0 to 5 ,0 0 0 .........................................................
112
3025
7,6134,3785,838
371,403474,711
4,1583,3793,935
229,939288,323
5 .0 0 0 to 1 0 ,0 0 0 ......................................................1 0 .0 0 0 to 2 5 ,0 0 0 ...................................................2 5 .0 0 0 to 5 0 ,0 0 0 ....................................................5 0 .0 0 0 to 1 0 0 ,0 0 0 .................................................1 0 0 .0 0 0 to 2 5 0 ,0 0 0 ..............................................
2251513133
406,2001,263,3852,208,3362,242,5864,386,254
259,699791,403
1,343,5541,413,0032,710,005
2 5 0 .0 0 0 to 5 0 0 ,0 0 0 ..............................................5 0 0 .0 0 0 to 1 ,0 0 0 ,0 0 0 ..........................................1 ,0 0 0 ,0 0 0 to 2 ,5 0 0 ,0 0 0 ......................................2 .5 0 0 .0 0 0 or m o re .................................................
10164
50
2,131,1263,809,6222,563,300
22,269,634
1,302,1152,246,5861,499,535
13,291,902
Banks with percent of deposits insured of—
9 0 to 1 0 0 ....................................................................8 0 to 9 0 ......................................................................7 0 to 8 0 ......................................................................
172151
4
16,213,02825,833,393
97,966
10,359,23014,978,403
49,901
Type of accountD em and ( IP C 1) ...................................................... 221,235
41,666,8724,015
31,8362,6972,612
194,32125,052,160Savings and t im e ( IP C 1) ......................................
U. S. G o v e rn m e n t................................................... 1,295State and po litica l s u b d iv is io n s ........................ 8,171
1,469790
In te rb a n k ...................................................................U n invested t ru s t fu n d s ........................................D ra f ts ........................................................................... 147,921 78,704O ther ite m s ............................................................... 67,198 50,623
1 IPC refers to individuals, partnerships, and corporations.
1,028 189 0 75.6 20.6 3.8 .08,382 883 0 74.8 22.8 2.4 .0
65,896 7,855 303 67.4 29.0 3.5 .1422,082 54,732 3,896 64.7 31.0 4.0 .3720,662 79,695 5,517 62.2 33.8 3.7 .3
915,991 108,579 19,490 61.4 33.8 4.0 .73,039,010 259,082 65,957 62.4 34.0 2.9 .72,832,361 272,993 101,347 61.1 34.4 3.3 1.23,918,412 272,765 89,911 60.0 36.6 2.5 .82,931,739 285,767 272,328 55.1 37.7 3.7 3.5
2,496 959 0 54.6 32.8 12.6 .0943 56 0 77.2 21.5 1.3 .0
1,639 264 0 67.4 28.1 4.5 .0127,410 13,767 287 61.9 34.3 3.7 .1164,662 18,889 2,837 60.7 34.7 4.0 .6
133,282 12,212 1,007 63.9 32.8 3.0 .2418,494 50,672 2,816 62.6 33.1 4.0 .2757,800 93,956 13,027 60.8 34.3 4.3 .6728,411 83,676 17,497 63.0 32.5 3.7 .8
1,498,399 158,335 19,515 61.8 34.2 3.6 .4
715,686 97,056 16,269 61.1 33.6 4.6 .81,356,980 178,008 28,049 59.0 35.6 4.7 .7
822,079 202,169 39,517 58.5 32.1 7.9 1.58,127,283 432,520 417,930 59.7 36.5 1.9 1.9
5,505,570 288,219 60,010 63.9 34.0 1.8 .49,319,434 1,039,795 495,760 58.0 36.1 4.0 1.9
30,560 14,525 2,980 50.9 31.2 14.8 3.0
11,806 10,234 4,874 87.8 5.3 4.6 2.214,814,263 1,292,233 508,216 60.1 35.6 3.1 1.2
554 1,321 845 32.3 13.8 32.9 21.05,839 8,318 9,507 25.7 18.3 26.1 29.9
798 319 111 54.5 29.6 11.8 4.1735 817 270 30.2 28.1 31.3 10.3
17,202 21,597 30,417 53.2 11.6 14.6 20.64,366 7,700 4,508 75.3 6.5 11.5 6.7
ACCOUNTS
AND DEPO
SITS OF
INSURED M
UTU
AL SAVING
S BANKS
123
Digitized for FRASER http://fraser.stlouisfed.org/ Federal Reserve Bank of St. Louis

Table 38. NUMBER OF ACCOUNTS FULLY PROTECTED AND DEPOSITS INSURED ASSUMING ALTERNATIVE AMOUNTS OF MAXIMUMCOVERAGE PER ACCOUNT, INSURED COMMERCIAL BANKS, NOVEMBER 18, 1964
BANKS GROUPED BY FEDERAL DEPOSIT INSURANCE CORPORATION DISTRICT AND STATE
FDIC D is tr ic t and S tate
N u m b e r o f a cco u n ts fu lly p ro tec ted a ssu m in g m a x im u m coverage
per a cco u n t o f—
P ercent o f accounts fu lly p ro tected assum ing m axim um coverage
per account o f—
Deposits (in th o u sa n d s) insured assu m in g m ax im um
coverage per acco u n t o f—
Percen t o f dep os its insu re d assu m in g
m a x im u m coverage per a cco u n t o f—
$ 1 0 ,0 0 0 $ 2 5 ,0 0 0 $ 1 0 0 ,0 0 0 $ 1 0 ,0 0 0 $ 25 ,0 0 0 $ 1 0 0 ,0 0 0 $ 1 0 ,0 0 0 $ 2 5 ,0 0 0 $ 1 0 0 ,0 0 0 $ 1 0 ,0 0 0 $ 2 5 ,0 0 0 $ 1 0 0 ,0 0 0
otal United States....... 151,226,160 153,883,194 154,712,935 97.6% 99.3% 99.8% $146,765,283 $174,195,411 $211,825,046 49.7% 59.0% 71.7%
50 States and D. C. . . 150,648,081 153,300,099 154,128,044 97.6 99.3 99.8 146,390,467 173,760,022 211,311,335 49.7 59.0 71.7
Other areas.................. 578,079 583,095 584,891 98.7 99.6 99.9 374,816 435,388 513,711 55.5 64.5 76.1
FDIC District8,951,580 47.5 57.2 71.3D is tr ic t 1 ..................... 7,384,795 7,488,575 7,526,564 98.0 99.3 99.8 5,961,908 7,185,630
D is tr ic t 2 ..................... 21,280,917 21,722,906 21,880,094 97.0 99.0 99.7 22,710,903 27,872,423 35,943,478 35.0 43.0 55.5
D is tr ic t 3 ..................... 18,044,685 18,349,289 18,431,986 97.8 99.4 99.9 17,285,844 20,134,061 23,855,579 54.0 62.9 74.6
D is tr ic t 4 ..................... 11,366,505 11,521,204 11,570,971 98.1 99.4 99.9 9,312,055 10,925,546 13,081,031 56.0 65.7 78.6
D is tr ic t 5 ..................... 8,962,249 9,109,232 9,159,221 97.7 99.3 99.8 8,455,520 10,055,016 12,235,123 55.5 66.0 80.3
D is tr ic t 6 ..................... 9,542,344 9,697,533 9,748,939 97.7 99.3 99.8 9,488,672 11,179,659 13,485,106 54.9 64.7 78.1
D is tr ic t 7 ..................... 14,802,450 15,046,319 15,109,935 97.9 99.5 99.9 14,826,898 17,001,987 19,683,711 61.3 70.3 81.4
D is tr ic t 8 ..................... 11,402,112 11,667,637 11,740,708 96.9 99.2 99.8 13,858,775 16,358,263 19,671,866 50.8 60.0 72.2
D is tr ic t 9 ..................... 5,160,404 5,236,577 5,258,545 98.0 99.5 99.9 5,418,950 6,175,370 7,133,595 63.3 72.1 83.3
D is tr ic t 1 0 .................. 6,535,675 6,656,558 6,694,104 97.5 99.3 99.8 6,812,407 8,048,345 9,670,563 57.0 67.3 80.9
D is tr ic t 1 1 .................. 10,802,908 11,005,980 11,078,777 97.3 99.1 99.8 10,474,368 12,794,929 16,209,904 47.4 57.9 73.4
D is tr ic t 1 2 .................. 25,941,116 26,381,384 26,513,091 97.7 99.4 99.9 22,158,982 26,464,180 31,903,510 51.8 61.8 74.5
StateA la b a m a ...................... 1,859,044 1,888,766 1,898,230 97.8 99.4 99.9 1,688,099 1,992,012 2,387,033 58.8 69.4 83.2
A r iz o n a ........................ 1,097,760 1,120,044 1,125,761 97.4 99.4 99.9 1,043,021 1,234,208 1,461,349 55.3 65.4 77.5
A rk a n s a s .................... 1,166,493 1,186,277 1,192,795 97.7 99.3 99.9 1,196,611 1,405,984 1,671,236 62.1 73.0 86.8
C a lifo rn ia .................... 19,687,311 20,019,477 20,120,973 97.7 99.4 99.9 16,400,085 19,695,111 23,874,035 50.1 60.1 72.9
C o lo ra d o ..................... 1,389,351 1,418,571 1,427,707 97.1 99.2 99.8 1,440,534 1,739,407 2,139,675 53.1 64.1 78.8
C o n n e c tic u t............... 1,946,956 1,977,035 1,986,325 97.9 99.4 99.9 1,642,286 1,952,177 2,337,161 53.5 63.6 76.1
Delaware ................ 413,279 420,462 422,775 97.6 99.3 99.8 372,449 448,311 544,729 47.5 57.2 69.5
D is tric t o f C o lu m b ia . 754,894 770,695 777,207 96.9 98.9 99.7 856,508 1,058,374 1,351,721 42.4 52.4 66.9
Florida .................... 3,493,048 3,560,788 3,582,124 97.3 99.2 99.8 3,612,183 4,305,651 5,231,041 55.3 65.9 80.0
G e o rg ia ........................ 2,418,901 2,450,180 2,462,511 98.1 99.3 99.8 2,034,704 2,426,193 3,015,958 51.4 61.3 76.1
124 FEDERAL
DEPOSIT
INSU
RAN
CE
CO
RPO
RA
TION
Digitized for FRASER http://fraser.stlouisfed.org/ Federal Reserve Bank of St. Louis

Id a h o ............................ 501,575 511,806 514,404 97.4 99.4I l lin o is .......................... 8,739,062 8,966,126 9,028,642 96.6 99.1In d ia n a ........................ 3,954,939 4,011,145 4,027,022 98.1 99.5Io w a .............................. 2,663,050 2,701,511 2,712,066 98.1 99.5K a n s a s ......................... 1,814,596 1,848,160 1,857,806 97.5 99.4
K e n tu c k y .................... 1,930,415 1,956,933 1,965,512 98.1 99.4L o u is ia n a .................... 2,310,695 2,345,664 2,358,641 97.8 99.3M a in e ........................... 756,410 765,102 767,396 98.5 99.6M a ry la n d .................... 2,378,716 2,410,111 2,419,338 98.2 99.5M a ssa ch u se tts . . . 3,135,464 3,176,189 3,196,244 97.9 99.1
M ic h ig a n ..................... 6,989,965 7,123,657 7,156,621 97.5 99.4M in n e s o ta .................. 3,350,106 3,392,894 3,406,453 98.2 99.5M is s is s ip p i................. 1,191,256 1,209,498 1,216,356 97.8 99.3M is s o u r i...................... 3,805,931 3,870,627 3,893,302 97.6 99.2M o n ta n a ...................... 595,109 607,528 610,945 97.3 99.3
N e b ra s k a .................... 1,228,083 1,248,448 1,255,255 97.7 99.3N e va d a ........................ 366,909 373,937 376,170 97.4 99.2New H a m p sh ire . . . . 449,322 455,467 457,242 98.2 99.5New J e rs e y ................ 5,869,176 5,977,043 6,002,081 97.7 99.5New M e x ic o ............... 572,361 582,282 585,665 97.6 99.3
New Y o rk .................... 14,420,383 14,742,306 14,870,347 96.6 98.8N o rth C a ro lin a .......... 2,686,341 2,719,831 2,732,077 98.2 99.4N o rth D a k o ta ............ 572,506 582,856 585,263 97.7 99.5O h io .............................. 8,389,166 8,527,099 8,563,297 97.8 99.4O k la h o m a ................... 1,819,198 1,850,239 1,860,177 97.6 99.3
O re g o n ......................... 1,578,738 1,609,614 1,617,767 97.5 99.4P e n n sy lva n ia ............ 9,655,519 9,822,190 9,868,689 97.7 99.4Rhode Is la n d ............ 631,685 642,759 646,081 97.6 99.3So uth C a ro lin a ......... 1,097,730 1,109,043 1,113,640 98.5 99.5S o uth D a k o ta ............ 642,683 653,299 655,884 97.9 99.5
T e n n e s s e e ................. 2,639,505 2,683,696 2,697,330 97.7 99.3T e x a s ............................ 6,822,092 6,957,990 7,008,710 97.1 99.0U ta h .............................. 764,040 777,661 781,228 97.7 99.4V e rm o n t...................... 464,958 472,023 473,276 98.2 99.7V irg in ia ......................... 3,150,057 3,196,159 3,208,815 98.1 99.5
W a s h in g to n ................ 2,318,851 2,355,655 2,365,727 97.9 99.5W est V irg in ia ............. 1,298,767 1,315,365 1,319,894 98.3 99.6W is c o n s in ................... 3,857,546 3,911,517 3,926,292 98.2 99.5W y o m in g ..................... 284,447 291,140 293,159 96.9 99.1A la s k a ........................... 158,426 161,607 162,769 97.1 99.1H a w a ii.......................... 565,266 571,627 574,053 98.3 99.4
99.9 546,812 635,892 720,603 67.9 78.9 89.499.8 11,043,233 13,177,082 16,039,705 47.7 56.9 69.399.9 3,669,185 4,203,712 4,896,144 60.0 68.7 80.199.9 2,815,542 3,181,181 3,632,161 68.3 77.1 88.199.9 1,964,488 2,286,883 2,670,322 63.7 74.1 86.6
99.9 1,724,633 2,008,403 2,367,294 60.3 70.2 82.799.8 1,849,528 2,259,495 2,835,934 49.6 60.6 76.199.9 534,484 611,647 696,499 68.6 78.6 89.599.9 1,796,092 2,103,682 2,493,992 56.0 65.6 77.899.8 2,438,024 3,057,443 4,095,702 37.4 46.9 62.8
99.9 7,326,266 8,464,081 9,850,552 59.7 69.0 80.399.9 3,262,060 3,725,294 4,385,428 58.6 66.9 78.899.9 1,120,534 1,331,160 1,601,090 60.0 71.3 85.899.8 4,147,483 4,887,819 5,926,105 53.3 62.8 76.199.9 705,495 821,326 941,388 67.9 79.1 90.6
99.8 1,367,169 1,590,513 1,879,001 60.6 70.5 83.399.8 332,016 404,901 499,091 51.0 62.2 76.699.9 344,123 403,524 473,112 63.1 74.0 86.899.9 5,912,934 6,792,954 7,786,757 63.8 73.3 84.099.9 533,609 638,168 780,932 58.5 70.0 85.6
99.6 16,050,704 20,195,770 27,098,282 29,7 37.3 50.199.9 2,042,025 2,418,623 2,984,442 51.2 60.7 74.999.9 703,815 787,569 868,797 76.2 85.2 94.099.9 7,696,337 8,946,530 10,552,771 56.2 65.3 77.099.8 1,719,182 2,045,479 2,515,177 51.2 61.0 75.0
99.9 1,555,193 1,829,979 2,164,334 58.5 68.8 81.499.8 9,589,507 11,187,531 13,302,808 52.4 61.1 72.799.8 599,815 709,531 859,734 53.5 63.2 76.699.9 754,184 896,106 1,092,704 56.7 67.4 82.299.9 747,580 841,181 937,983 72.6 81.7 91.1
99.8 2,419,945 2,877,453 3,520,471 51.5 61.2 74.999.8 7,048,210 8,663,058 11,131,689 45.3 55.7 71.599.9 703,993 823,302 978,981 57.0 66.6 79.2
100.0 403,175 451,308 489,372 77.7 87.0 94.399.9 2,797,909 3,231,020 3,758,006 62.6 72.3 84.1
99.9 2,034,208 2,372,148 2,787,689 58.2 67.9 79.899.9 1,065,335 1,217,740 1,400,166 65.7 75.0 86.399.9 3,831,447 4,334,194 4,937,015 66.0 74.6 85.099.8 321,033 386,063 466,388 58.7 70.5 85.299.8 165,399 203,705 256,318 50.0 61.6 77.599.8 421,276 499,140 622,458 47.5 56.3 70.2
INSU
RAN
CE
PROTECTIO
N ASSU
MIN
G
ALTERN
ATIVE CO
VERAGES
125
Digitized for FRASER http://fraser.stlouisfed.org/ Federal Reserve Bank of St. Louis

BA NKS G ROUPED BY AM O UNT OF TO TAL DEPOSITS, POPULATION OF CENTER OF LO CATIO N, CLASS, AND PERCENT OF TO TAL DEPOSITS INSURED; AND ACCO UNTS GROUPED BY TYPE
Table 39. NUMBER OF ACCOUNTS FULLY PROTECTED AND DEPOSITS INSURED ASSUMING ALTERNATIVE AMOUNTS OF MAXIMUMCOVERAGE PER ACCOUNT, INSURED COMMERCIAL BANKS, NOVEMBER 18, 1964
C lass ifica tion
N u m b e r o f accounts fu lly p ro tected a ssu m in g m ax im um coverage
per a ccou n t o f—
P ercen t o f accou n ts fu lly p ro te c te d assum ing m a x im u m coverage
per a ccou n t o f—
D eposits (in th o u sa n d s) insu re d a ssu m in g m a x im u m
coverage per a ccou n t o f—
Pe rcen t o f dep osits insured assum ing
m a x im u m coverage per a cco u n t o f—
$10,000 $25,000 $100,000 $10,000 $25,000 $100,000 $10,000 $25,000 $100,000 $10,000 $25,000 $100,000
All insured commercial banks............... 151,226,160 153,883,194 154,712,935 97.6% 99.3% 99.8% $146,765,283 $174,195,411 $211,825,046 49.7% 59.0% 71.7%
Banks with total deposits of—4,486 4,508 4,513 99.4 99.9 100.0 1,999 2,212 2,276 87.8 97.2 100.0
$ 2 5 0 ,0 0 0 to $ 5 0 0 ,0 0 0 ................................ 38,334 38,705 38,779 98.8 99.8 100.0 31,202 34,156 36,076 85.8 93.9 99.2
$ 5 0 0 ,0 0 0 to $ 1 ,0 0 0 ,0 0 0 ............................ 481,178 485,867 486,965 98.8 99.8 100.0 393,759 432,947 460,230 84.8 93.3 99.2
$1 0 0 0 ,0 0 0 to $ 2 ,0 0 0 ,0 0 0 ....................... 2,939,175 2,973,138 2,980,803 98.6 99.7 100.0 2,601,791 2.871,232 3,078,415 83.3 91.9 98.6
$ 2 ,0 0 0 ,0 0 0 to $ 5 ,0 0 0 ,0 0 0 12,354,371 12,524,253 12,565,307 98.3 99.6 100.0 11,619,196 13,016,694 14,271,549 78.8 88.2 96.8
$5 0 0 0 ,0 0 0 to $ 1 0 ,0 0 0 ,0 0 0 ..................... 16,359,023 16,592,420 16,651,280 98.2 99.6 99.9 15,231,312 17,228,967 19,294,291 74.2 84.0 94.0
$ 1 0 ,0 0 0 ,0 0 0 to $ 2 5 ,0 0 0 ,0 0 0 .................. 23,925,064 24,289,520 24,384,360 98.0 99.5 99.9 22,112,852 25,346,431 28,981,556 68.5 78.5 89.7
$ 2 5 ,0 0 0 ,0 0 0 to $ 5 0 ,0 0 0 ,0 0 0 .................. 14,295,322 14.530,021 14,597,500 97.8 99.4 99.9 13,567,145 15,803,756 18,545,534 62.0 72.2 84.7
$ 5 0 ,0 0 0 ,0 0 0 to $ 1 0 0 ,0 0 0 ,0 0 0 ............... 11,606,039 11i 827,994 11,893,424 97.4 99.3 99.8 11,868,035 14,025,279 16,803,791 56.8 67.1 80.4
$ 1 0 0 ,0 0 0 ,0 0 0 to $ 2 5 0 ,0 0 0 ,0 0 0 ............ 15,114,191 15,399,968 15,492,666 97.4 99.2 99.8 15,053,144 18,062,110 22,265,280 50.5 60.6 74.7
$ 2 5 0 ,0 0 0 ,0 0 0 to $ 5 0 0 ,0 0 0 ,0 0 0 ............. 12,094,670 12,331,750 12,416,776 97.2 99.1 99.7 12,284,441 15,028,786 19,316,899 42.6 52.1 67.0
$ 5 0 0 ,0 0 0 ,0 0 0 to $ 1 ,0 0 0 ,0 0 0 ,0 0 0 10,127,439 10,324,967 10,398,865 97.1 99.0 99.7 10,288,907 12,706,906 16,675,725 38.6 47.7 62.6
$ 1 ,0 0 0 ,0 0 0 ,0 0 0 to $ 2 ,5 0 0 ,0 0 0 ,0 0 0 . 7,948,052 8,145,875 8,214,851 96.4 98.8 99.7 9,270,936 11,584,961 15,288,793 36.0 45.0 59.4
$ 2 ,5 0 0 ,0 0 0 ,0 0 0 o r m o re ........................... 23,938,816 24,414,208 24,586,846 97.1 99.0 99.7 22,440,564 28,050,973 36,804,632 31.9 39.9 52.3
Banks in centers with population inI9 6 0 of—
Less th a n 2 5 0 .................................. 662,452 671,666 673,629 98.3 99.6 99.9 703,770 779,593 859,881 73.2 81.1 89.4
2 5 0 to 5 0 0 ............................ 1,766,258 1,790,940 1,795,620 98.3 99.7 100.0 1,801,181 1,978,124 2,106,249 83.9 92.1 98.1
5 0 0 to 1 0 0 0 3,936,076 3,991,724 4,003,168 98.3 99.7 100.0 3,878,317 4,295,934 4,616,532 81.9 90.7 97.4
1 ,0 0 0 to 2 ,5 0 0 ................................................2 ,5 0 0 to 5 ,0 0 0 ................................................
9,037.221 9,169,523 9,199,188 98.2 99.6 100.0 8,828,794 9,873,353 10,764,689 79.1 88.4 96.4
8,547;046 8,674,715 8,706,070 98.1 99.6 99.9 8,217,479 9,284,974 10,307,795 75.2 85.0 94.3
5 0 0 0 to 10 0 0 0 .................................... 11,346,843 11,522,377 11,566,250 98.0 99.5 99.9 10,791,463 12,284,048 13,875,306 71.1 81.0 91.5
1 0 .0 0 0 to 2 5 ,0 0 0 ..........................................2 5 .0 0 0 to 5 0 ,0 0 0 ..........................................SO 0 0 0 to 100 0 0 0 ......................................
16,027,871 16,271,429 16,336,568 98.0 99.5 99.9 14,696,058 16,902,873 19,455,265 66.6 76.5 88.1
12,814,493 13,017,826 13,075,237 97.9 99.4 99.9 11,807,064 13,728,435 16,091,361 61.5 71.5 83.8
12,900,149 13,105,310 13,169,327 97.8 99.4 99.9 11,990,053 14,071,463 16,757,460 58.5 68.6 81.7
1 0 0 ,0 0 0 to 2 5 0 ,0 0 0 ..................................... 15,338,985 15,598,458 15,682,523 97.6 99.3 99.8 14,169,737 16,909,520 20,835,764 50.3 60.1 74.0
2 5 0 ,0 0 0 to 5 0 0 ,0 0 0 .....................................50 0 0 0 0 to 1 0 0 0 ,0 0 0 .................................
12,832,236 13,075,520 13,161,512 97.3 99.1 99.8 12,753,385 15,544,772 19,826,375 44.5 54.2 69.2
27,990,618 28,480,822 28,640,667 97.5 99.3 99.8 24,556,619 29,823,932 37,394,562 44.0 53.4 67.0
1 ,0 0 0 ,0 0 0 to 2 ,5 0 0 ,0 0 0 .............................2 ,5 0 0 ,0 0 0 or m o re ............................. —
7,779,154 7,951,218 8,009,370 96.9 99.0 99.8 8,653,721 10,545,880 13,330,691 43.7 53.2 67.3
10,246,758 10,561,666 10,693,806 95.3 98.2 99.4 13,917,644 18,172,511 25,603,118 24.8 32.4 45.7
126 FEDERAL
DEPOSIT
INSU
RAN
CE
CO
RP
OR
ATIO
N
Digitized for FRASER http://fraser.stlouisfed.org/ Federal Reserve Bank of St. Louis
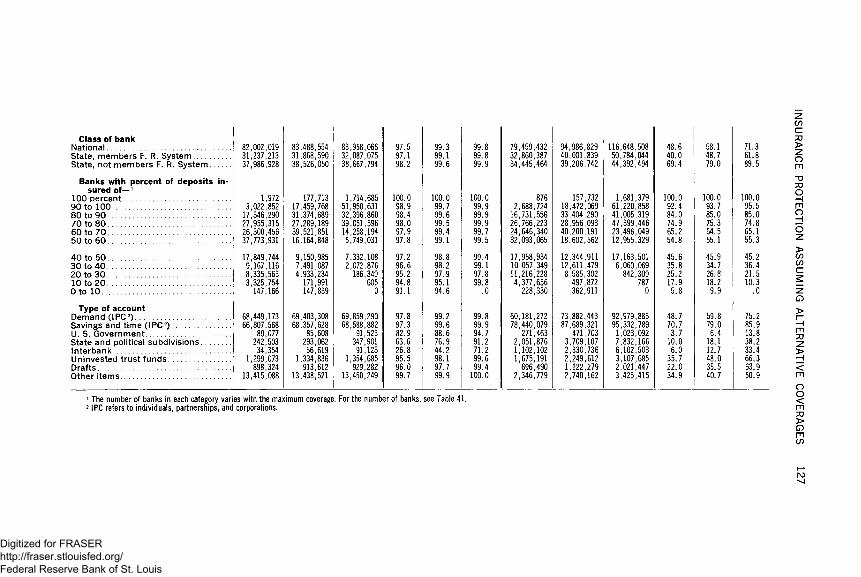
Class of bankN a tio n a l.............................................................. 82,002,019 83,488,554 83,958,066 97.5 99.3 99.8 79,459,432 94,986,829 116,648,508 48.6 58.1 71.3S ta te , m e m b e rs F. R. S y s te m .................. 31,237,213 31,868,590 32,087,075 97.1 99.1 99.8 32,860,387 40,001,839 50,784,044 40.0 48.7 61.8State, n o t m e m b e rs F. R. S y s te m .......... 37,986,928 38,526,050 38,667,794 98.2 99.6 99.9 34,445,464 39,206,742 44,392,494 69.4 79.0 89.5
Banks with percent of deposits insured of— 1
100 p e rc e n t ...................................................... 1,972 177,713 1,714,685 100.0 100.0 100.0 876 157,732 1,681,379 100.0 100.0 100.09 0 to 1 0 0 ........................................................... 3,022,852 17,459,768 51,950,631 98.9 99.7 99.9 2,688,724 18,472,069 61,220,858 92.4 93.7 95.58 0 to 9 0 ............................................................. 17,346,290 31,374,689 32,396,860 98.4 99.6 99.9 16,731,556 33,404,290 41,005,319 84.0 85.0 85.070 to 8 0 ............................................................. 27,955,316 27,289,189 39,051,596 98.0 99.5 99.9 26,766,223 28,956,093 47,399,446 74.9 75.3 74.860 to 7 0 ............................................................. 26,300,456 39,521,851 14,258,194 97.9 99.4 99.7 24,646,340 40,200,191 23,496,049 65.2 64.5 65.150 to 6 0 ............................................................. 37,773,931 16,164,848 5,749,031 97.8 99.1 99.5 32,093,065 18,602,562 12,955,329 54.8 55.1 55.3
4 0 to 5 0 ............................................................. 17,849,744 9,150,985 7,332,108 97.2 98.8 99.4 17,958,934 12,344,911 17,163,501 45.6 45.9 45.23 0 to 4 0 ............................................................. 9,167,116 7,491,087 2,072,876 96.6 98.2 99.1 10,057,349 12,611,479 6,060,069 35.8 34.7 36.42 0 to 3 0 ............................................................. 8,335,563 4,933,234 186,349 95.2 97.9 97.8 11,216,228 8,585,302 842,309 25.2 26.8 21.510 to 2 0 ............................................................. 3,325,754 171,991 605 94.8 95.1 99.8 4,377,656 497,872 787 17.9 18.2 10.3O to 1 0 ................................................................ 147,166 147,839 0 91.1 94.6 .0 228,330 362,911 0 5.8 9.9 .0
Type of accountD em and ( IP C 2) ................................................ 68,449,173 69,403,308 69,859,290 97.8 99.2 99.8 60,181,272 73,882,443 92,979,885 48.7 59.8 75.2Savings and tim e ( IP C 2) ............................. 66,807,568 68,357,628 68,588,882 97.3 99.6 99.9 78,440,079 87,689,321 95,332,789 70.7 79.0 85.9U. S. G o v e rn m e n t.......................................... 80,077 85,608 91,523 82.9 88.6 94.7 271,463 471,703 1,023,092 3.7 6.4 13.8S ta te a nd p o litica l s u b d iv is io n s ............... 242,503 293,062 347,901 63.6 76.9 91.2 2,051,876 3,709,107 7,832,166 10.0 18.1 38.2In te rb a n k .......................................................... 34,354 56,619 91,123 26.8 44.2 71.2 1,102,102 2,330,736 6,102,503 6.0 12.7 33.4U n inves ted t ru s t fu n d s ............................... 1,299,073 1,334,836 1,354,685 95.5 98.1 99.6 1,675,191 2,249,612 3,107,685 35.7 48.0 66.3D ra fts .................................................................. 898,324 913,612 929,282 96.0 97.7 99.4 696,490 1,122,279 2,021,447 22.0 35.5 63.9O ther ite m s ....................................................... 13,415,088 13,438,521 13,450,249 99.7 99.9 100.0 2,346,779 2,740,162 3,425,415 34.9 40.7 50.9
1 The number of banks in each category varies with the maximum coverage. For the number of banks, see Table 41.2 IPC refers to individuals, partnerships, and corporations.
INSU
RAN
CE
PROTECTIO
N ASSU
MIN
G
ALTERN
ATIVE CO
VERAGES
127
Digitized for FRASER http://fraser.stlouisfed.org/ Federal Reserve Bank of St. Louis
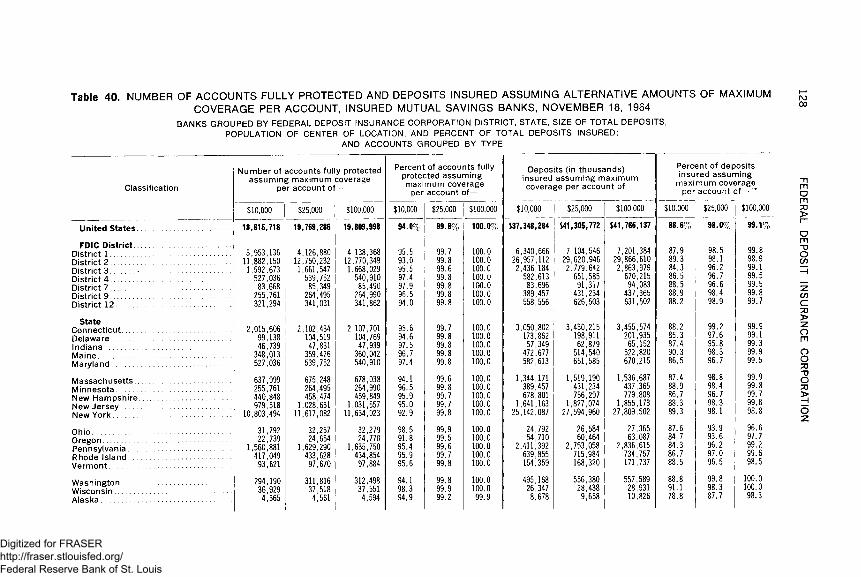
Table 40. NUMBER OF ACCOUNTS FULLY PROTECTED AND DEPOSITS INSURED ASSUMING ALTERNATIVE AMOUNTS OF MAXIMUM COVERAGE PER ACCOUNT, INSURED MUTUAL SAVINGS BANKS, NOVEMBER 18, 1964
BANKS GROUPED BY FEDERAL DEPOSIT INSURANCE CORPORATION DISTRICT, STATE, SIZE OF TO TAL DEPOSITS,PO PU LATIO N OF CENTER OF LOCATION, AND PERCENT OF TO TAL DEPOSITS INSURED;
AND ACCOUNTS GROUPED BY TYPE
C lassifica tion
N u m b e r o f accou nts fu lly p ro tected a ssu m in g m a x im u m coverage
per a ccou n t o f—
Percen t o f accou n ts fu lly p ro tec ted assu m in g m axim um coverage
per account o f—
D eposits (in th o u sa n d s) in su re d assu m in g m a x im u m coverage per a cco u n t o f
Percen t o f d ep os its in su re d a ssu m in g
m a x im u m coverage per a cco u n t o f— ’
$10,000 $25,000 $100,000 $10,000 $25,000 $100,000 $10,000 $25,000 $100,000 $10,000 $25,000 $100,000
United States.......................................... 18,615,718 19,769,286 19,809,998 94.0% 99.8% 100.0% $37,348,284 $41,305,772 $41,765,137 88.6% 98.0% 99.1%
FDIC DistrictD is tr ic t 1 ..................................................... 3,953,136 4,126,880 4,138,368 95.5 99.7 100.0 6,340,666 7,104,546 7,201,384 87.9 98.5 99.8
D is tr ic t 2 ................................ 11,882,150 12,750,232 12,770,349 93.0 99.8 100.0 26,957,112 29,620,946 29,866,610 89.3 98.1 98.9
D is tr ic t 3 1,592,673 1,661,547 1,668,029 95.5 99.6 100.0 2,436,184 2,779,642 2,863,979 84.3 96.2 99.1
D is tr ic t 4 .............................. 527,036 539,752 540,910 97.4 99.8 100.0 582,613 651,585 670,215 86.5 96.7 99.5
D is tr ic t 7 ...................................... 83,668 85,349 85,490 97.9 99.8 100.0 83,696 91,317 94,083 88.5 96.6 99.5
D is tr ic t 9 ................................................... 255,761 264,495 264,990 96.5 99.8 100.0 389,457 431,234 437,365 88.9 98.4 99.8
D is tr ic t 1 2 ......................................................... 321,294 341,031 341,862 94.0 99.8 100.0 558,556 626,503 631,502 88.2 98.9 99.7
StateC o n n e c ticu t ................................................... 2,015,606 2,102,434 2,107,701 95.6 99.7 100.0 3,050,802 3,430,215 3,455,574 88.2 99.2 99.9
Delaw are .......................................................... 99,138 104,519 104,769 94.6 99.8 100.0 173,862 198,911 201,935 85.3 97.6 99.1
Ind iana ............................................ 46,739 47,831 47,939 97.5 99.8 100.0 57,349 62,879 65,152 87.4 95.8 99.3
M aine .................. 348,013 359,426 360,042 96.7 99.8 100.0 472,677 514,540 522,820 90.3 98.3 99.9
M a ry la n d ........................................................... 527,036 539,752 540,910 97.4 99.8 100.0 582,613 651,585 670,215 86.5 96.7 99.5
M a s s a c h u s e tts ................................................ 637,999 675,248 678,038 94.1 99.6 100.0 1,344,171 1,519,190 1,536,687 87.4 98.8 99.9
M in n e so ta ....................................... 255,761 264,495 264,990 96.5 99.8 100.0 389,457 431,234 437,365 88.9 98.4 99.8
New H a m p s h ire ............................................ 440,848 458,474 459,849 95.9 99.7 100.0 678,801 756,297 779,808 86.7 96.7 99.7
New Jersey .................................... 979,518 1,028,631 1,031,557 95.0 99.7 100.0 1,641,163 1,827,074 1,855,173 8&.3 98.3 99.8
New Y o rk ........................................................... 10,803,494 11,617,082 11,634,023 92.9 99.8 100.0 25,142,087 27,594,960 27,809,502 89.3 98.1 98.8
O hio .......... 31,792 32,257 32,279 98.5 99.9 100.0 24,792 26,584 27,365 87.6 93.9 96.6
O re g o n ................................................................P e n n s y lv a n ia ...................................................Rhode Is land ....................................
22,739 24,654 24,770 91.8 99.5 100.0 54,710 60,464 63,087 84.7 93.6 97.7
1,560,881 1,629,290 1,635,750 95.4 99.6 100.0 2,411,392 2,753,058 2,836,615 84.3 96.2 99.2
417,049 433,628 434,854 95.9 99.7 100.0 639,855 715,984 734,757 86.7 97.0 99.6
V e rm o n t............................................................. 93,621 97,670 97,884 95.6 99.8 100.0 154,359 168,320 171,737 88.5 96.5 98.5
W a s h in g to n .......................................................W isconsin ....................................
294,190 311,816 312,498 94.1 99.8 100.0 495,168 556,380 557,589 88.8 99.8 100.0
36,929 37,518 37,551 98.3 99.9 100.0 26,347 28,438 28,931 91.1 98.3 100.0
A la s k a ................................................................. 4,365 4,561 4,594 94.9 99.2 99.9 8,678 9,658 10,826 78.8 87.7 98.3
128 FEDERAL
DEPOSIT
INSU
RAN
CE
CO
RP
OR
ATIO
N
Digitized for FRASER http://fraser.stlouisfed.org/ Federal Reserve Bank of St. Louis
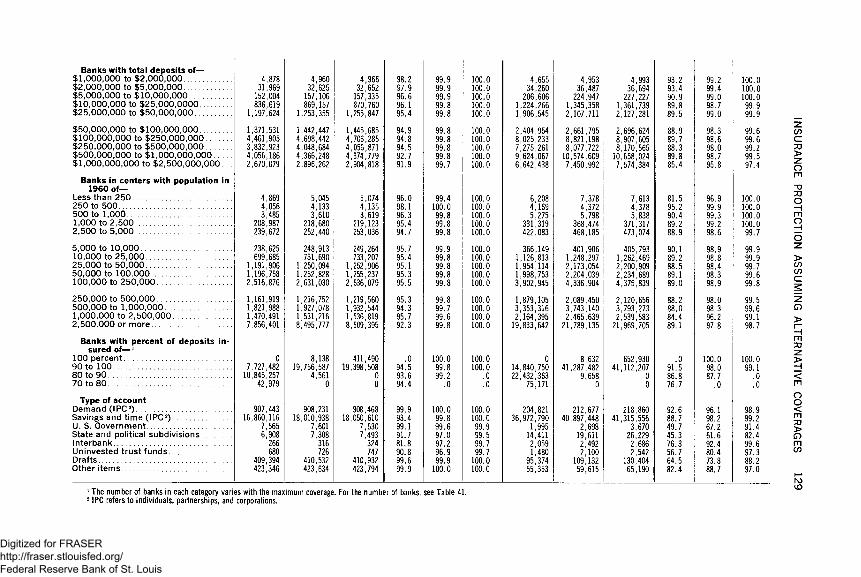
B a nks w ith to ta l d e p o s its o f—$ 1 ,0 0 0 ,0 0 0 to $ 2 ,0 0 0 ,0 0 0 ........................ 4,878 4,960 4,966 98.2 99.9 100.0 4,655 4,953 4,993 93.2 99.2 100.0$ 2 ,0 0 0 ,0 0 0 to $ 5 ,0 0 0 ,0 0 0 ........................ 31,969 32,625 32,652 97.9 99.9 100.0 34,260 36,487 36,694 93.4 99.4 100.0$ 5 ,0 0 0 ,0 0 0 to $ 1 0 ,0 0 0 ,0 0 0 ..................... 152,004 157,106 157,335 96.6 99.9 100.0 206,606 224,947 227,227 90.9 99.0 100.0$ 1 0 ,0 0 0 ,0 0 0 to $ 2 5 ,0 0 0 ,0 0 0 0 ............... 836,619 869,157 870,760 96.1 99.8 100.0 1,224,266 1,345,358 1,361,739 89.8 98.7 99.9$ 2 5 ,0 0 0 ,0 0 0 to $ 5 0 ,0 0 0 ,0 0 0 .................. 1,197,624 1,253,355 1,255,847 95.4 99.8 100.0 1,906,545 2,107,711 2,127,281 89.5 99.0 99.9
$ 5 0 ,0 0 0 ,0 0 0 to $ 1 0 0 ,0 0 0 ,0 0 0 ................ 1,371,531 1,442,447 1,445,685 94.9 99.8 100.0 2,404,954 2,661,795 2,696,624 88.9 98.3 99.6$ 1 0 0 ,0 0 0 ,0 0 0 to $ 2 5 0 ,0 0 0 ,0 0 0 ............. 4,461,905 4,698,442 4,706,285 94.8 99.8 100.0 8,025,233 8,821,198 8,907,605 89.7 98.6 99.6$ 2 5 0 ,0 0 0 ,0 0 0 to $ 5 0 0 ,0 0 0 ,0 0 0 ............. 3,832,923 4,048,684 4,056,871 94.5 99.8 100.0 7,275,261 8,077,722 8,170,565 88.3 98.0 99.2$ 5 0 0 ,0 0 0 ,0 0 0 to $ 1 ,0 0 0 ,0 0 0 ,0 0 0 ......... 4,056,186 4,366,248 4,374,779 92.7 99.8 100.0 9,624,067 10,574,609 10,658,024 89.8 98.7 99.5$ 1 ,0 0 0 ,0 0 0 ,0 0 0 to $ 2 ,5 0 0 ,0 0 0 ,0 0 0 . . . 2,670,079 2,896,262 2,904,818 91.9 99.7 100.0 6,642,438 7,450,992 7,574,384 85.4 95.8 97.4
B a n ks in c e n te rs w ith p o p u la tio n in 1960 o f—
Less th a n 2 5 0 ................................................. 4,869 5,045 5,074 96.0 99.4 100.0 6,208 7,378 7,613 81.5 96.9 100.02 5 0 to 5 0 0 ........................................................ 4,056 4,133 4,135 98.1 100.0 100.0 4,169 4,372 4,378 95.2 99.9 100.0500 to 1 ,0 0 0 .................................................... 3,485 3,610 3,619 96.3 99.8 100.0 5,275 5,798 5,838 90.4 99.3 100.01 ,000 to 2 ,5 0 0 ................................................ 208,987 218,680 219,123 95.4 99.8 100.0 331,319 368,474 371,317 89.2 99.2 100.02 ,5 0 0 to 5 ,0 0 0 ................................................ 239,672 252,440 253,036 94.7 99.8 100.0 422,083 468,185 473,074 88.9 98.6 99.7
5 ,0 0 0 to 1 0 ,0 0 0 ............................................. 238,625 248,913 249,264 95.7 99.9 100.0 366,149 401,906 405,793 90.1 98.9 99.910 ,0 0 0 to 2 5 ,0 0 0 .......................................... 699,685 731,690 733,207 95.4 99.8 100.0 1,126,813 1,248,297 1,262,469 89.2 98.8 99.92 5 ,0 0 0 to 5 0 ,0 0 0 ........................................... 1,191,906 1,250,094 1,252,906 95.1 99.8 100.0 1,954,114 2,173,054 2,200,909 88.5 98.4 99.75 0 ,0 0 0 to 1 0 0 ,0 0 0 ........................................ 1,196,758 1,252,828 1,255,237 95.3 99.8 100.0 1,998,753 2,204,039 2,234,689 89.1 98.3 99.61 0 0 ,0 0 0 to 2 5 0 ,0 0 0 ..................................... 2,516,876 2,631,030 2,636,079 95.5 99.8 100.0 3,902,945 4,336,904 4,375,839 89.0 98.9 99.8
2 5 0 ,0 0 0 to 5 0 0 ,0 0 0 ..................................... 1,161,919 1,216,752 1,219,560 95.3 99.8 100.0 1,879,105 2,089,450 2,120,656 88.2 98.0 99.55 0 0 ,0 0 0 to 1 ,0 0 0 ,0 0 0 ................................. 1,821,988 1,927,078 1,932,544 94.3 99.7 100.0 3,353,316 3,743,140 3,793,273 88.0 98.3 99.61 ,0 0 0 ,0 0 0 to 2 ,5 0 0 ,0 0 0 ............................. 1,470,491 1,531,216 1,536,819 95.7 99.6 100.0 2,164,395 2,465,639 2,539,583 84.4 96.2 99.12 ,5 0 0 ,0 0 0 o r m o re ........................................ 7,856,401 8,495,777 8,509,395 92.3 99.8 100.0 19,833,642 21,789,135 21,969,705 89.1 97.8 98.7
B a nks w ith p e rce n t o f d e p o s its in sured o f— 1
100 p e rc e n t...................................................... 0 8,138 411,490 .0 100.0 100.0 0 8,632 652,930 .0 100.0 100.09 0 to 1 0 0 ........................................................... 7,727,482 19,756,587 19,398,508 94.5 99.8 100.0 14,840,750 41,287,482 41,112,207 91.5 98.0 99.180 to 9 0 ............................................................. 10,845,257 4,561 0 93.6 99.2 .0 22,432,363 9,658 0 86.8 87.7 .070 to 8 0 ............................................................. 42,979 0 0 94.4 .0 .0 75,171 0 0 76.7 .0 .0
Type o f a cco u n tD em and ( IP C 2) ............................................... 907,443 908,231 908,468 99.9 100.0 100.0 204,821 212,677 218,860 92.6 96.1 98.9Savings and tim e ( IP C 2) ............................. 16,860,116 18,010,938 18,050,610 93.4 99.8 100.0 36,972,790 40,897,448 41,315,556 88.7 98.2 99.2U. S. G o v e rn m e n t.......................................... 7,565 7,601 7,630 99.1 99.6 99.9 1,995 2,698 3,670 49.7 67.2 91.4S tate and p o litica l s u b d iv is io n s .............. 6,908 7,308 7,493 91.7 97.0 99.5 14,411 19,611 26,229 45.3 61.6 82.4In te rb a n k .......................................................... 266 316 324 81.8 97.2 99.7 2,059 2,492 2,686 76.3 92.4 99.6U n in ve ste d t ru s t fu n d s ............................... 680 726 747 90.8 96.9 99.7 1,480 2,100 2,542 56.7 80.4 97.3D ra f ts .................................................................. 409,394 410,532 410,932 99.6 99.9 100.0 95,374 109,132 130,404 64.5 73.8 88.2O th e r ite m s ...................................................... 423,346 423,634 423,794 99.9 100.0 100.0 55,353 59,615 65,190 82.4 88.7 97.0
1 The number of banks in each category varies with the maximum coverage. For the number of banks, see Table 41.2 IPC refers to individuals, partnerships, and corporations.
INSU
RAN
CE
PROTECTIO
N ASSU
MIN
G
ALTERN
ATIVE CO
VERAGES
129
Digitized for FRASER http://fraser.stlouisfed.org/ Federal Reserve Bank of St. Louis
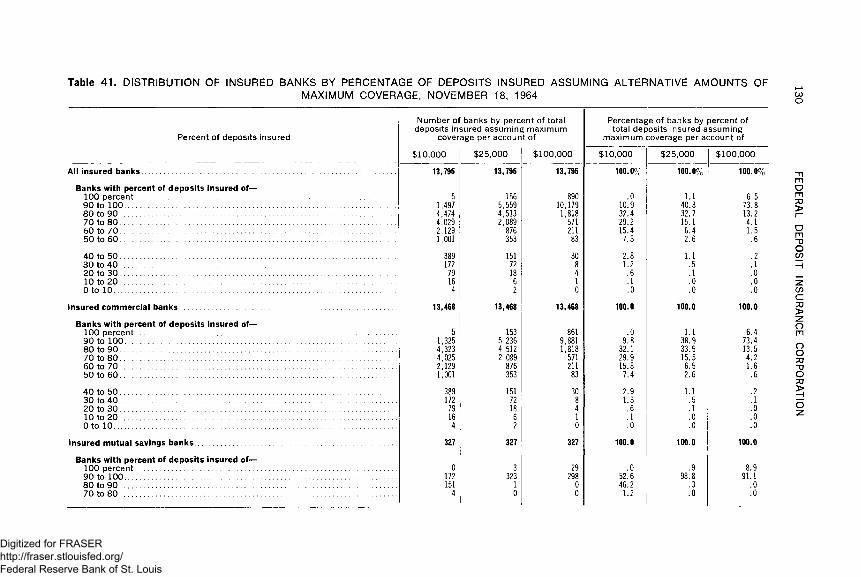
Table 41. DISTRIBUTION OF INSURED BANKS BY PERCENTAGE OF DEPOSITS INSURED ASSUMING ALTERNATIVE AMOUNTS OFMAXIMUM COVERAGE, NOVEMBER 18, 1964
P e rce n t o f d e p o s its insured
N u m b e r o f banks by p e rce n t o f to ta l dep os its insured a ssu m in g m ax im um
coverage per a cco u n t o f—
P ercentage o f banks by p e rce n t o f to ta l d e p o s its insured assu m in g
m ax im um coverage per a cco u n t o f—
$ 1 0 ,0 0 0 $ 2 5 ,0 0 0 $ 1 0 0 ,0 0 0 $ 1 0 ,0 0 0 $ 2 5 ,0 0 0 $ 1 0 0 ,0 0 0
All insured banks................................................................................................................... 13,795 13,795 13,795 100.0% 100.0% 100.0%
Banks with percent of deposits insured of—1 00 p e rc e n t .................................................................................................................................. 5 156 890 .0 1.1 6.59 0 to 1 0 0 ....................................................................................................................................... 1,497 5,559 10,179 10.9 40.3 73.88 0 to 9 0 .......................................................................................................................................... 4,474 4,513 1,818 32.4 32.7 13.270 to 8 0 .......................................................................................................................................... 4,029 2,089 571 29.2 15.1 4.16 0 to 7 0 .......................................................................................................................................... 2,129 876 211 15.4 6.4 1.550 to 6 0 .......................................................................................................................................... 1,001 353 83 7.3 2.6 .6
4 0 to 5 0 .......................................................................................................................................... 389 151 30 2.8 1.1 .23 0 to 4 0 .......................................................................................................................................... 172 72 8 1.2 .5 .12 0 to 3 0 .......................................................................................................................................... 79 18 4 .6 .1 .010 to 2 0 .......................................................................................................................................... 16 6 1 .1 .0 .0O to 1 0 ............................................................................................................................................. 4 2 0 .0 .0 .0
Insured commercial banks........................................ .................................... 13,468 13,468 13,468 100.0 100.0 100.0
Banks with percent of deposits insured of—100 p e rc e n t.................................................................................................................................. 5 153 861 .0 1.1 6.49 0 to 1 0 0 ........................................................................................................................................ 1,325 5,236 9,881 9.8 38.9 73.48 0 to 9 0 .......................................................................................................................................... 4,323 4,512 1,818 32.1 33.5 13.570 to 8 0 .......................................................................................................................................... 4,025 2,089 571 29.9 15.5 4.260 to 7 0 .......................................................................................................................................... 2,129 876 211 15.8 6.5 1.650 to 6 0 .......................................................................................................................................... 1,001 353 83 7.4 2.6 .6
4 0 to 5 0 .......................................................................................................................................... 389 151 30 2.9 1.1 .23 0 to 4 0 .......................................................................................................................................... 172 72 8 1.3 .5 .12 0 to 3 0 .......................................................................................................................................... 79 18 4 .6 .1 .010 to 2 0 .......................................................................................................................................... 16 6 1 .1 .0 .0O to 1 0 ............................................................................................................................................. 4 2 0 .0 .0 .0
Insured mutual savings banks............................................................................................ 327 327 327 100.0 100.0 100.0
Banks with percent of deposits insured of—100 p e rc e n t................................................................................................................................... 0 3 29 .0 .9 8.99 0 to 1 0 0 ........................................................................................................................................ 172 323 298 52.6 98.8 91.180 to 9 0 .......................................................................................................................................... 151 1 0 46.2 .3 .070 to 8 0 .......................................................................................................................................... 4 0 0 1.2 .0 .0
130 FEDERAL
DEPOSIT
INSU
RAN
CE
CO
RP
OR
ATIO
N
Digitized for FRASER http://fraser.stlouisfed.org/ Federal Reserve Bank of St. Louis

BANKING DEVELOPMENTS
P A R T F O U R
Digitized for FRASER http://fraser.stlouisfed.org/ Federal Reserve Bank of St. Louis

Digitized for FRASER http://fraser.stlouisfed.org/ Federal Reserve Bank of St. Louis
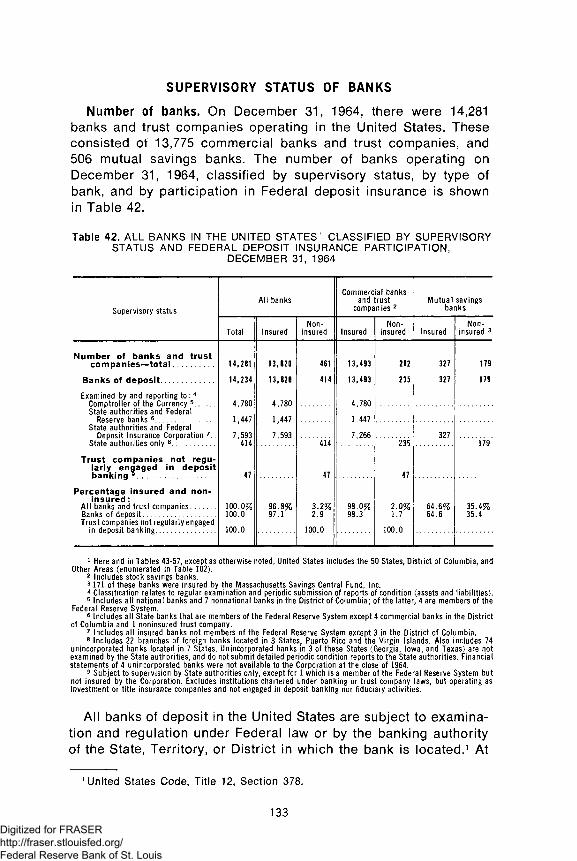
SUPERVISORY STATUS OF BANKS
Number of banks. On December 31, 1964, there were 14,281 banks and trust companies operating in the United States. These consisted of 13,775 commercial banks and trust companies, and 506 mutual savings banks. The number of banks operating on December 31, 1964, classified by supervisory status, by type of bank, and by participation in Federal deposit insurance is shown in Table 42.
Table 42. ALL BANKS IN THE UNITED STATES' CLASSIFIED BY SUPERVISORY STATUS AND FEDERAL DEPOSIT INSURANCE PARTICIPATION,
DECEMBER 31, 1964
Supervisory statusAll banks
Commercial banks and trust
companies 2Mutual savings
banks
Total InsuredNon
insured InsuredNon
insured InsuredNon
insured 3
Number of banks and trust companies—total.............. 14,281 13,820 461 13,493 282 327 179
Banks of deposit.................. 14,234 13,820 414 13,493 235 327 179
Examined by and reporting to: 4 Comptroller of the Currency 5.......... 4,780
1,447
7,593414
4,780
1,447
7,593
4,780
1 f 447State authorities and Federal
Reserve banks 6 ............................State authorities and Federal
Deposit Insurance Corporation 7.. State authorities only 8.....................
7,266 327414 235 179
Trust companies not regularly engaged in deposit banking 9 47 47 47
Percentage insured and noninsured :
A ll banks and trust companies............ 100.0%100.0
100.0
96.8%97.1
3.2%2.9
100.0
98.0%98.3
2.0%1.7
100.0
64.6%64.6
35.4%Banks of deposit....................................Trust companies not regularly engaged
in deposit banking ..........................
35.4
1 Here and in Tables 43-57, except as otherwise noted, United States includes the 50 States, District of Columbia, and Other Areas (enumerated in Table 102).
2 Includes stock savings banks.3 171 of these banks were insured by the Massachusetts Savings Central Fund, Inc.4 Classification relates to regular examination and periodic submission of reports of condition (assets and liabilities).5 Includes all national banks and 7 nonnational banks in the District of Columbia; of the latter, 4 are members of the
Federal Reserve System.6 Includes all State banks that are members of the Federal Reserve System except 4 commercial banks in the District
of Columbia and 1 noninsured trust company.7 Includes all insured banks not members of the Federal Reserve System except 3 in the District of Columbia.8 Includes 22 branches of foreign banks located in 3 States, Puerto Rico and the Virgin Islands. Also includes 74
unincorporated banks located in 7 States. Unincorporated banks in 3 of these States (Georgia, Iowa, and Texas) are not examined by the State authorities, and do not submit detailed periodic condition reports to the State authorities. Financial statements of 4 unincorporated banks were not available to the Corporation at the close of 1964.
9 Subject to supervision by State authorities only, except for 1 which is a member of the Federal Reserve System but not insured by the Corporation. Excludes institutions chartered under banking or trust company laws, but operating as investment or title insurance companies and not engaged in deposit banking nor fiduciary activities.
All banks of deposit in the United States are subject to examination and regulation under Federal law or by the banking authority of the State, Territory, or District in which the bank is located.1 At
‘ United States Code, Title 12, Section 378.
133
Digitized for FRASER http://fraser.stlouisfed.org/ Federal Reserve Bank of St. Louis
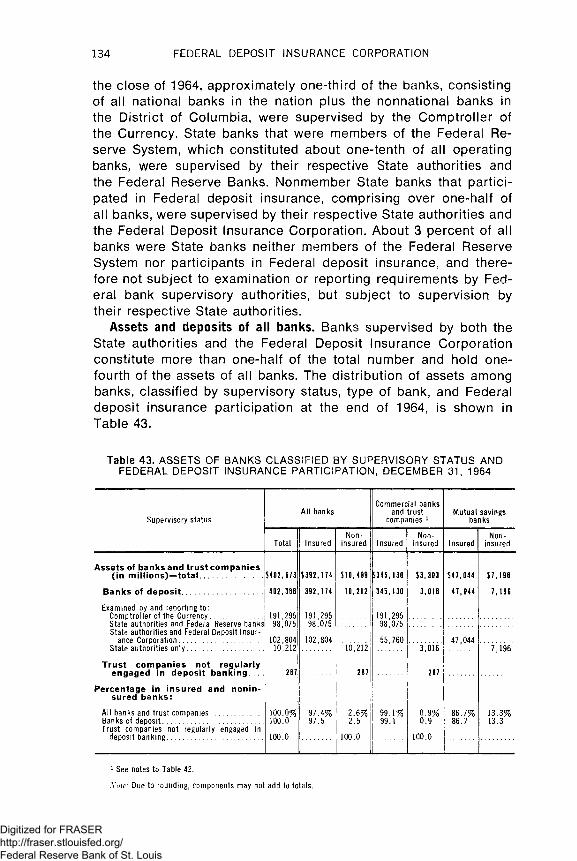
134 FEDERAL DEPOSIT INSURANCE CORPORATION
the close of 1964, approximately one-third of the banks, consisting of all national banks in the nation plus the nonnational banks in the District of Columbia, were supervised by the Comptroller of the Currency. State banks that were members of the Federal Reserve System, which constituted about one-tenth of all operating banks, were supervised by their respective State authorities and the Federal Reserve Banks. Nonmember State banks that participated in Federal deposit insurance, comprising over one-half of all banks, were supervised by their respective State authorities and the Federal Deposit Insurance Corporation. About 3 percent of all banks were State banks neither members of the Federal Reserve System nor participants in Federal deposit insurance, and therefore not subject to examination or reporting requirements by Federal bank supervisory authorities, but subject to supervision by their respective State authorities.
Assets and deposits of all banks. Banks supervised by both the State authorities and the Federal Deposit Insurance Corporation constitute more than one-half of the total number and hold one- fourth of the assets of all banks. The distribution of assets among banks, classified by supervisory status, type of bank, and Federal deposit insurance participation at the end of 1964, is shown in Table 43.
Table 43. ASSETS OF BANKS CLASSIFIED BY SUPERVISORY STATUS AND FEDERAL DEPOSIT INSURANCE PARTICIPATION, DECEMBER 31, 1964
Supervisory statusAll banks
Commercial banks and trust
companies 1Mutual savings
banks
Total InsuredNon-
insured InsuredNon
insured InsuredNon
insured
Assets of banks and trust companies (in millions)—total..................... $402,673
402,386
191,29598,075
102,80410,212
287
100.0%100.0
100.0
$392,174
392,174
191,29598,075
102,804
$10,499
10,212
$345,130
345,130
191,29598,075
55,760
$3,303
3,016
$47,044
47,044
$7,196
7,196Banks of deposit...........................
Examined by and reporting to:Comptroller of the Currency..........................State authorities and Federal Reserve banks State authorities and Federal Deposit Insur
ance Corporation.......................................... 47,044State authorities on ly ...................................... 10,212
287
i
2.6%2.5
100.0
3,016
287
0.9%0.9
100.0
7,196
Trust companies not regularly engaged in deposit banking. ..
Percentage in insured and noninsured banks:
All banks and trust companies.......................... 97.4%97.5
99.1%99.1
86.7%86.7
13.3%13.3Banks of deposit..................................................
Trust companies not regularly engaged in deposit banking................................................
1 See notes to Table 42.
N o te: Due to rounding, components may not add to totals.
Digitized for FRASER http://fraser.stlouisfed.org/ Federal Reserve Bank of St. Louis
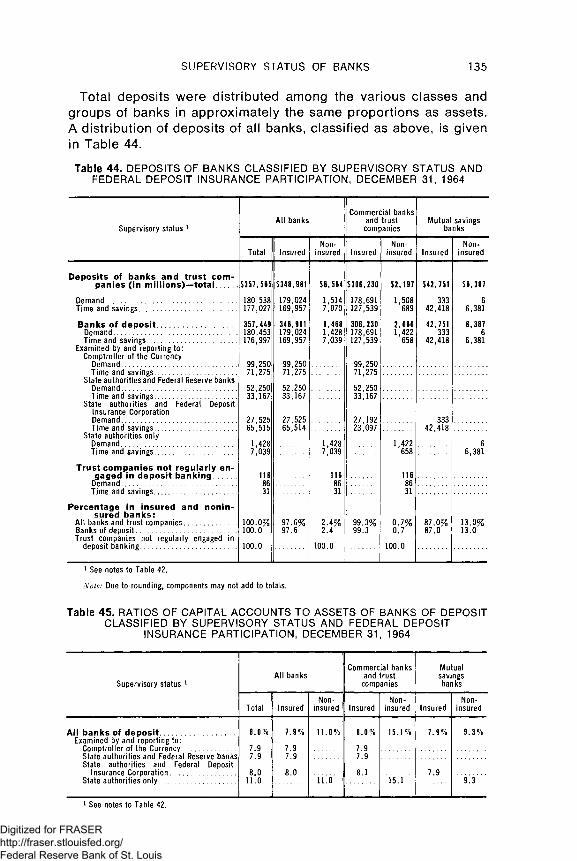
SUPERVISORY STATUS OF BANKS 135
Total deposits were distributed among the various classes and groups of banks in approximately the same proportions as assets. A distribution of deposits of all banks, classified as above, is given in Table 44.
Table 44. DEPOSITS OF BANKS CLASSIFIED BY SUPERVISORY STATUS AND FEDERAL DEPOSIT INSURANCE PARTICIPATION, DECEMBER 31, 1964
Supervisory status 1All banks
Commercial banks and trust companies
Mutual savings banks
Total InsuredNon
insured InsuredNon
insured InsuredNon-
insured
Deposits of banks and trust companies (in millions)—total....... $357,565 $348,981 $8,584 $306,230 $2,197 $42,751 $6,387
Demand................................................................. 180,538177,027
357,449
179,024169,957
348,981
1,5147,070
178,691127,539
306,230
1,508689
333 6Time and savings................................................. 42,418
42,751
6,381
Banks of deposit........................... 8,468 2,080 6,387Demand.............................................................. 180,453
176,997
99.250 71,275
52.250 33,167
27,52565,515
1,4287,039
116
179,024169,957
99.250 71,275
52.250 33,167
27,52565,514
1,4287,039
178,691127,539
99.250 71,275
52.250 33,167
27,19223,097
1,422658
333 6Time and savings............................................. 42,418 6,381
Examined by and reporting to:Comptroller of the Currency
Demand.........................................................Time and savings.........................................
State authorities and Federal Reserve banks Demand.........................................................Time and sav ings.......................................
State authorities and Federal Deposit Insurance Corporation Demand......................................................... 333Time and savings......................................... 42,418
State authorities only Demand.......................................................... 1,428
7,039
116
1,422658
6Time and savings......................................... 6,381
Trust companies not regularly engaged in deposit banking....... 116
Demand......................................................... 86 86 86Time and savings......................................... 31 31 31
Percentage in insured and noninsured banks:
All banks and trust companies.......................... 100.0%100.0
97.6% 2.4%2.4
99.3% 0.7% 87.0% 13.0%13.0Banks of deposit.................................................. 97.6 99.3 0.7 87.0
Trust companies not regularly engaged in deposit banking................................................ 100.0 100.0 100.0
1 See notes to Table 42.
N ote: Due to rounding, components may not add to totals.
Table 45. RATIOS OF CAPITAL ACCOUNTS TO ASSETS OF BANKS OF DEPOSIT CLASSIFIED BY SUPERVISORY STATUS AND FEDERAL DEPOSIT
INSURANCE PARTICIPATION, DECEMBER 31, 1964
Supervisory status 1All banks
Commercial banks and trust
companies
Mutualsavingsbanks
Total InsuredNon-
insured InsuredNon
insured InsuredNon
insured
All banks of deposit......................... 8.0% 7.9% 11.0% 8.0% 15.1% 7.9% 9.3%Examined by and reporting to:
Comptroller of the Currency.......................... 7.9 7.9 7.9State authorities and Federal Reserve banks 7.9 7.9 7.9State authorities and Federal Deposit
Insurance Corporation. . . . . . 8.0 8.0 8.1 7.9State authorities on ly ...................................... 11.0 11.0 15.1 9.3
1 See notes to Table 42.
Digitized for FRASER http://fraser.stlouisfed.org/ Federal Reserve Bank of St. Louis
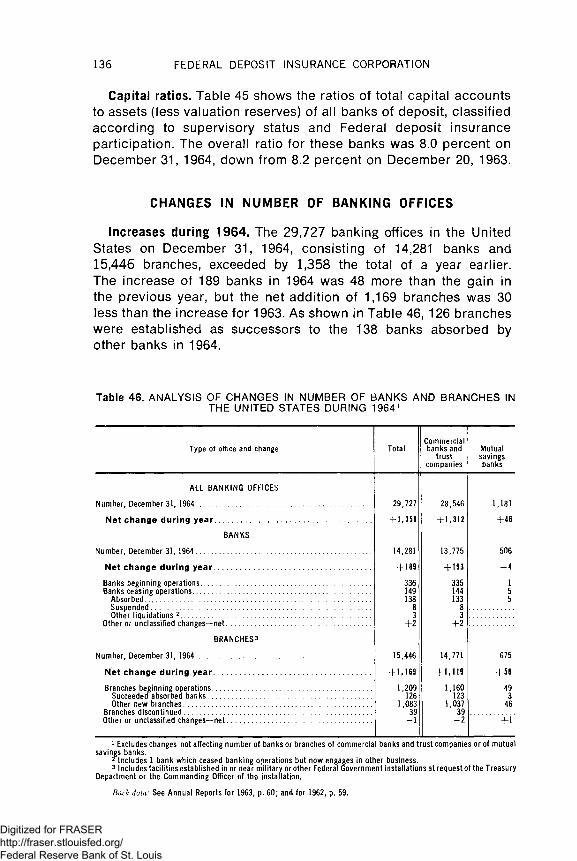
136 FEDERAL DEPOSIT INSURANCE CORPORATION
Capital ratios. Table 45 shows the ratios of total capital accounts to assets (less valuation reserves) of all banks of deposit, classified according to supervisory status and Federal deposit insurance participation. The overall ratio for these banks was 8.0 percent on December 31, 1964, down from 8.2 percent on December 20, 1963.
CHANGES IN NUMBER OF BANKING OFFICES
Increases during 1964. The 29,727 banking offices in the United States on December 31, 1964, consisting of 14,281 banks and 15,446 branches, exceeded by 1,358 the total of a year earlier. The increase of 189 banks in 1964 was 48 more than the gain in the previous year, but the net addition of 1,169 branches was 30 less than the increase for 1963. As shown in Table 46, 126 branches were established as successors to the 138 banks absorbed by other banks in 1964.
Table 46. ANALYSIS OF CHANGES IN NUMBER OF BANKS AND BRANCHES IN THE UNITED STATES DURING 1964'
Type of office and change TotalCommercial banks and
trust companies
Mutualsavingsbanks
ALL BANKING OFFICES
Number, December 31, 1964........................................................................................ 29,727
+ 1,358
28,546
+ 1,312
1,181
+46N et change during y e a r.......................................................................
BANKS
Number, December 31, 1964........................................................................................ 14,281
+ 189
13,775
+193
335
506
N et change during y ea r....................................................................... - 4
Banks beginning operations..................................................................................... 336 1Banks ceasing operations......................................................................................... 149 144 5
Absorbed................................................................................................................. 138 133 5Suspended.............................................................................................................. 8 8Other liquidations 2 ........................................................................................... 3 3
Other or unclassified changes— net........................................................................ + 2 + 2
BRANCHES3
Number, December 31, 1964........................................................................................ 15,446
+ 1,169
14,771
+1,119
675
N et change during y ea r....................................................................... +50
Branches beginning operations............................................................................... 1,209126
1,160123
49Succeeded absorbed banks.................................................................................. 3Other new branches.............................................................................................. 1,083
391,037
3946
Branches discontinued..............................................................................................Other or unclassified changes— net........................................................................ - 1 - 2 + 1
1 Excludes changes not affecting number of banks or branches of commercial banks and trust companies or of mutual savings banks.
2 Includes 1 bank which ceased banking operations but now engages in other business.3 Includes facilities established in or near military or other Federal Government installations at request of the Treasury
Department or the Commanding Officer of the installation.
Back data: See Annual Reports for 1963, p. 60; and for 1962, p. 59.
Digitized for FRASER http://fraser.stlouisfed.org/ Federal Reserve Bank of St. Louis
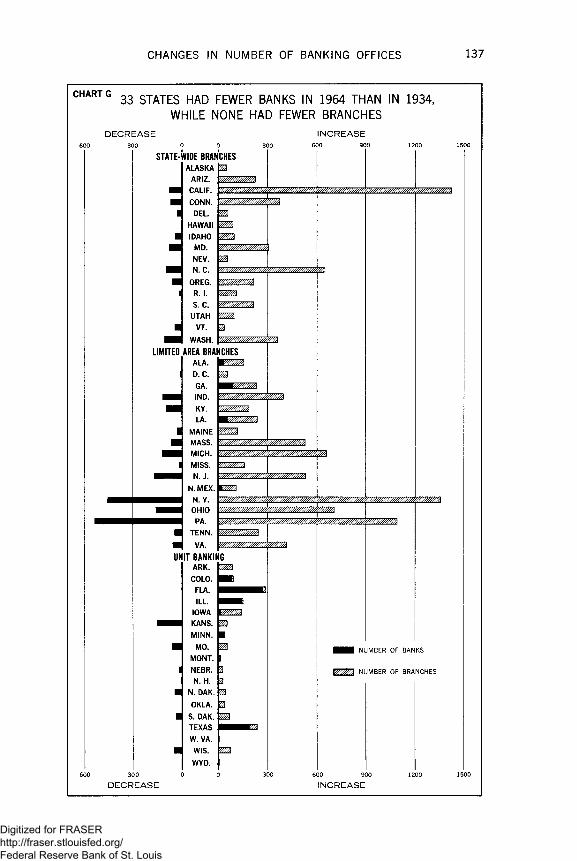
CHANGES IN NUMBER OF BANKING OFFICES 137
CHART G 33 STATES HAD FEWER BANKS IN 1964 THAN IN 1934, WHILE NONE HAD FEWER BRANCHES
DECREASE300
INCREASE
300
DECREASE600 900
INCREASE
Digitized for FRASER http://fraser.stlouisfed.org/ Federal Reserve Bank of St. Louis
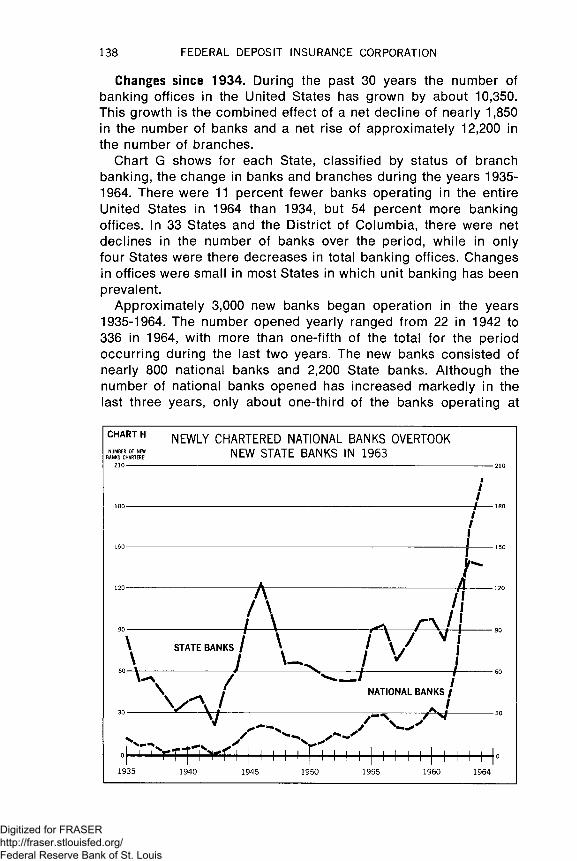
138 FEDERAL DEPOSIT INSURANCE CORPORATION
Changes since 1934. During the past 30 years the number of banking offices in the United States has grown by about 10,350. This growth is the combined effect of a net decline of nearly 1,850 in the number of banks and a net rise of approximately 12,200 in the number of branches.
Chart G shows for each State, classified by status of branch banking, the change in banks and branches during the years 1935- 1964. There were 11 percent fewer banks operating in the entire United States in 1964 than 1934, but 54 percent more banking offices. In 33 States and the District of Columbia, there were net declines in the number of banks over the period, while in only four States were there decreases in total banking offices. Changes in offices were small in most States in which unit banking has been prevalent.
Approximately 3,000 new banks began operation in the years 1935-1964. The number opened yearly ranged from 22 in 1942 to 336 in 1964, with more than one-fifth of the total for the period occurring during the last two years. The new banks consisted of nearly 800 national banks and 2,200 State banks. Although the number of national banks opened has increased markedly in the last three years, only about one-third of the banks operating at
CHARTh NEWLY CHARTERED NATIONAL BANKS OVERTOOK “ V T NEW STATE BANKS IN 1963
«II
- f -//I
JL_
r -
/ \ / i
H ------------------ i x f ^\ STATE BANKS / \ / \ / j\ I \ _ / v J
^ — / ------------------- ;\ _ f NATIONAL BANKS /
I * 13 0 -------------^ — \ j ---------------------------------------- — y s / --------------------- 30
/•' — y N—
° f 'T T > T 7 l V f 1 I I I I I [ I I I I I I 1 I ! I ! I I I |°1964
Digitized for FRASER http://fraser.stlouisfed.org/ Federal Reserve Bank of St. Louis

CHANGES IN NUMBER OF BANKING OFFICES 139
the close of 1964 had national charters, slightly below the proportion 30 years earlier. Chart H shows the numbers of national and State banks opened in each year, 1935-1964.
New branches opened during the 30-year period, exclusive of branches succeeding absorbed banks, totaled about 11,000. The number opening has increased rapidly in recent years, rising from fewer than 500 each year prior to 1956 to more than 1,000 in each of the last two years. Of the 2,155 new branches opened in 1963- 1964, 57 percent were branches of national banks. National bank branches comprised 53 percent of all bank branches in 1964, compared to 40 percent thirty years ago.
CONCENTRATION AND LOCATION OF BANKING FACILITIES
Share of deposits in largest commercial banks in the United States.Table 47 shows the proportion of deposits in all commercial banks held by the largest banks and bank groups on December 31, 1964. In the bank-group classification, deposits of all banks controlled by an individual company registered under the Bank Holding Company Act of 1956, and one additional group controlled by common stock ownership, were treated as the deposits of one bank.
About one-fifth of the deposits of all commercial banks were in the largest 10 banks, and slightly over one-half of all deposits were in the largest 1 percent (134) of the banks or bank groups. In most cases, percentages for the banks had not changed substantially since 1962, although they were higher than in 1960.
Banking concentration in areas grouped by type of banking structure. Data showing percentages of deposits in commercial banks in each State on December 31, 1964 held by the largest banks or bank groups are given in Table 48. The States are grouped according to the status of branch banking under the laws of each State as of December 31, 1958, in order to facilitate comparison with similar tables in earlier annual reports. In spite of some changes in State statutes since that date, the status of branching in the individual States still conforms in general with the classification adopted.
Concentration of deposits among banks is highest in States in which statewide branch banking is prevalent; in five of these States, the largest five banks held more than 90 percent of the deposits of all banks in the State. In only two of the States with limited-area branch banking, and in no State with unit banking, was as much as 50 percent of the deposits held by the largest five banks. However, in certain unit banking States where group banking is prominent, e.g., Minnesota and Montana, deposits in the five largest
Digitized for FRASER http://fraser.stlouisfed.org/ Federal Reserve Bank of St. Louis
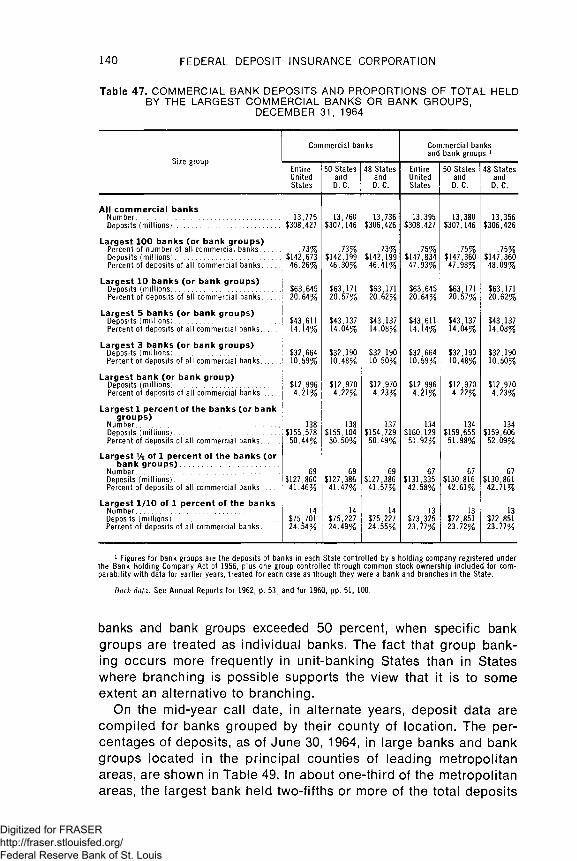
140 FEDERAL DEPOSIT INSURANCE CORPORATION
Table 47. COMMERCIAL BANK DEPOSITS AND PROPORTIONS OF TOTAL HELD BY THE LARGEST COMMERCIAL BANKS OR BANK GROUPS,
DECEMBER 31, 1964
Commercial banks Commercial banks and bank groups 1
EntireUnitedStates
50 States and D. C.
48 States and D. C.
EntireUnitedStates
50 States and D. C.
48 States and
D. C.
All com m ercial banksNumber .................................................................... 13,775 13,760
$307,146
.73%$142,19946.30%
13,736$306,426
.73%$142,199
46.41%
13,395$308,427
.75%$147,83447.93%
13,380$307,146
.75%$147,36047.98%
13,356$306,426
.75%$147,36048.09%
Deposits (millions) .............................................. $308,427
• 73% $142,673 46.26%
Largest 100 banks (or bank groups)Percent of number of all commercial banks..........Deposits (m illions)................ ....................Percent of deposits of all commercial banks.........
Largest 10 banks (or bank groups)Deposits (m illions)............... ........................ $63,645
20.64%$63,171 $63,171
20.62%$63,64520.64%
$63,17120.57%
$63,17120.62%Percent of deposits of all commercial banks.........20.57%
Largest 5 banks (or bank groups)Deposits (m illions).................................................. $43,611
14.14%$43,137 $43,137 $43,611
14.14%$43,13714.04%
$43,137Percent of deposits of all commercial banks......... 14.04% 14.08% 14.08%
Largest 3 banks (or bank groups)Deposits (m illions). . . . .................... $32,664
10.59%$32,19010.48%
$32,19010.50%
$32,66410.59%
$32,19010.48%
$32,19010.50%Percent of deposits of all commercial banks.........
Largest bank (or bank group)Deposits (m illions)............ ....................
i
$12,9964.21%
$12,9704.22%
$12,9704.23%
$12,9964.21%
$12,9704.22%
$12,9704.23%Percent of deposits of all commercial banks.........
Largest 1 percent of the banks (or bank groups)
Number........................................................................Deposits (m illions)....................................................Percent of deposits of all commercial banks.........
' 138 $155,578
50.44%
138$155,104
50.50%
137$154,729
50.49%
134$160,129
51.92%
134$159,655
51.98%
134$159,606
52.09%
Largest V2 of 1 percent of the banks (or bank g ro u p s ).............................................
Number........................................................................Deposits (m illions)....................................................Percent of deposits of all commercial banks.........
69$127,860
! 41.46%
69$127,386
41.47%
69$127,386
41.57%
67$131,335
42.58%
67$130,816
42.61%
67$130,861
42.71%
Largest 1 /1 0 of 1 percent of the banksNumber.......................................................................Deposits (m illions)....................................................Percent of deposits of all commercial banks.........
14$75,70124.54%
14$75,22724.49%
14$75,22724.55%
13$73,32523.77%
13$72,85123.72%
13$72,85123.77%
1 Figures for bank groups are the deposits of banks in each State controlled by a holding company registered under the Bank Holding Company Act of 1956, plus one group controlled through common stock ownership included for comparability with data for earlier years, treated for each case as though they were a bank and branches in the State.
Back data: See Annual Reports for 1962, p. 53; and for 1960, pp. 51, 100.
banks and bank groups exceeded 50 percent, when specific bank groups are treated as individual banks. The fact that group banking occurs more frequently in unit-banking States than in States where branching is possible supports the view that it is to some extent an alternative to branching.
On the mid-year call date, in alternate years, deposit data are compiled for banks grouped by their county of location. The percentages of deposits, as of June 30, 1964, in large banks and bank groups located in the principal counties of leading metropolitan areas, are shown in Table 49. In about one-third of the metropolitan areas, the largest bank held two-fifths or more of the total deposits
Digitized for FRASER http://fraser.stlouisfed.org/ Federal Reserve Bank of St. Louis
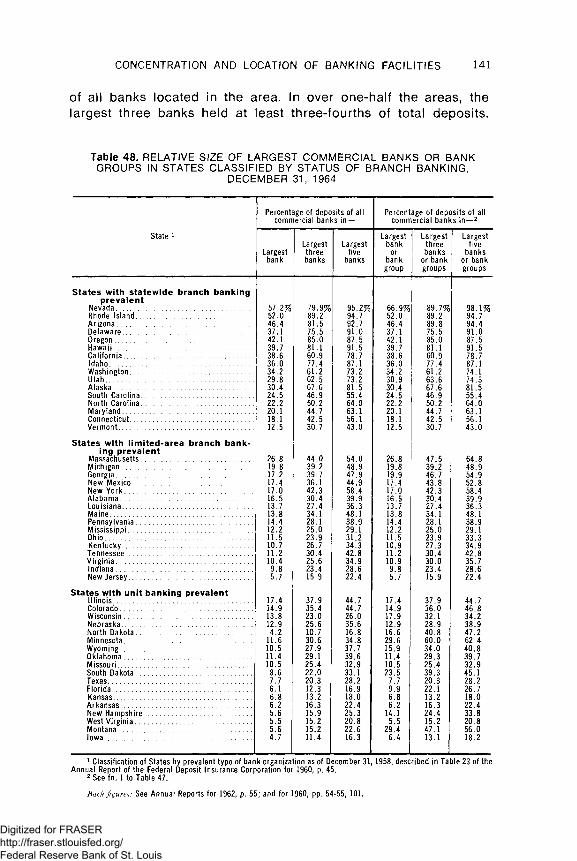
CONCENTRATION AND LOCATION OF BANKING FACILITIES 141
of all banks located in the area. In over one-half the areas, the largest three banks held at least three-fourths of total deposits.
Table 48. RELATIVE SIZE OF LARGEST COMMERCIAL BANKS OR BANK GROUPS IN STATES CLASSIFIED BY STATUS OF BRANCH BANKING,
DECEMBER 31, 1964
Percentage of deposits of all commercial banks in—
Percentage of deposits of all commercial banks in— 2
State 1
Largestbank
Largestthreebanks
Largestfive
banks
Largestbank
orbank
group
Largest three banks
or bank groups
Largest five
banks or bank groups
S tates w ith statew ide branch banking prevalen t
Nevada..................................................................... 57.2%52.0
79.9%89.2
95.2%94.7
66.9%52.0
89.7%89.2
98.1%94.7Rhode Island...........................................................
Arizona.................................................................... 46.4 81.5 92.7 46.4 89.8 94.4Delaware................................................................. 37.1 75.5 91.0 37.1 75.5 91.0Oregon..................................................................... 42.1 85.0 87.5 42.1 85.0 87.5Hawa i i ...................................................................... 39.7 81.1 91.5 39.7 81.1 91.5California................................................................. 38.6 60.9 78.7 38.6 60.9 78.7Idaho........................................................................ 36.0 77.4 87.1 36.0 77.4 87.1Washington............................................................. 34.2 61.2 73.2 34.2 61.2 74.1Utah.......................................................................... 29.8 62.5 73.2 30.9 63.6 74.3Alaska...................................................................... 30.4 67.6 81.5 30.4 67.6 81.5South Carolina........................................................ 24.5 46.9 55.4 24.5 46.9 55.4North Carolina........................................................ 22.2 50.2 64.0 22.2 50.2 64.0Maryland................................................................. 20.1 44.7 63.1 20.1 44.7 63.1Connecticut............................................................. 18.1 42.5 56.1 18.1 42.5 56.1Vermont................................................................... 12.5 30.7 43.0 12.5 30.7 43.0
States with lim ited -area branch banking prevalent
Massachusetts........................................................ 26.8 44.0 54.0 26.8 47.5 64.8Michigan.................................................................. 19.8 39.2 48.9 19.8 39.2 48.9Georgia.................................................................... 17.2 39.7 47.9 19.9 46.7 54.9New Mexico............................................................ 17.4 36.1 44.9 17.4 43.8 52.8New York................................................................ 17.0 42.3 58.4 17.0 42.3 58.4Alabama.................................................................. 16.5 30.4 39.9 16.5 30.4 39.9Louisiana................................................................. 13.7 27.4 36.3 13.7 27.4 36.3Maine....................................................................... 13.8 34.1 48.1 13.8 34.1 48.1Pennsylvania.......................................................... 14.4 28.1 38.9 14.4 28.1 38.9Mississippi.............................................................. 12.2 25.0 29.1 12.2 25.0 29.1Ohio.......................................................................... 11.5 23.9 31.2 11.5 23.9 33.3Kentucky................................................................. 10.7 26.7 34.3 10.9 27.3 34.9Tennessee............................................................... 11.2 30.4 42.8 11.2 30.4 42.8Virgin ia.................................................................... 10.4 25.6 34.9 10.9 30.0 35.7Indiana.................................................................... 9.8 23.4 28.6 9.8 23.4 28.6New Jersey.............................................................. 5.7 15.9 22.4 5.7 15.9 22.4
States with un it banking prevalentIllino is...................................................................... 17.4 37.9 44.7 17.4 37.9 44.7Colorado.................................................................. 14.9 35.4 44.7 14.9 36.0 46.8Wisconsin................................................................ 13.8 23.0 26.0 17.9 32.1 34.2Nebraska................................................................. 12.9 25.6 35.6 12.9 28.9 38.9North Dakota.......................................................... 4.2 10.7 16.8 16.6 40.8 47.2Minnesota................................................................ 11.6 30.6 34.8 29.6 60.0 62.4Wyoming.................................................................. 10.5 27.9 37.7 15.9 34.0 40.8Oklahoma................................................................ 11.4 29.1 39.6 11.4 29.3 39.7Missouri................................................................... 10.5 25.4 32.9 10.5 25.4 32.9South Dakota.......................................................... 8.6 22.0 33.1 23.5 39.3 45.1Texas........................................................................ 7.7 20.3 28.2 7.7 20.3 28.2Florida...................................................................... 6.1 12.3 16.9 9.9 22.1 26.7Kansas..................................................................... 6.8 13.2 18.0 6.8 13.2 18.0Arkansas................................................................. 6.2 16.3 22.4 6.2 16.3 22.4New Hampshire...................................................... 5.6 15.9 25.3 14.1 24.4 33.8West Virginia.......................................................... 5.5 15.2 20.8 5.5 15.2 20.8Montana.................................................................. 5.6 15.2 22.6 29.4 47.1 56.0Iowa......................................................................... 4.7 11.4 16.3 6.4 13.1 18.2
1 Classification of States by prevalent type of bank organization as of December 31,1958, described in Table 23 of the Annual Report of the Federal Deposit Insurance Corporation for 1960, p. 45.
2 See fn. 1 to Table 47.
B a c k fig u re s: See Annual Reports for 1962, p. 55; and for 1960, pp. 54-55, 101.
Digitized for FRASER http://fraser.stlouisfed.org/ Federal Reserve Bank of St. Louis
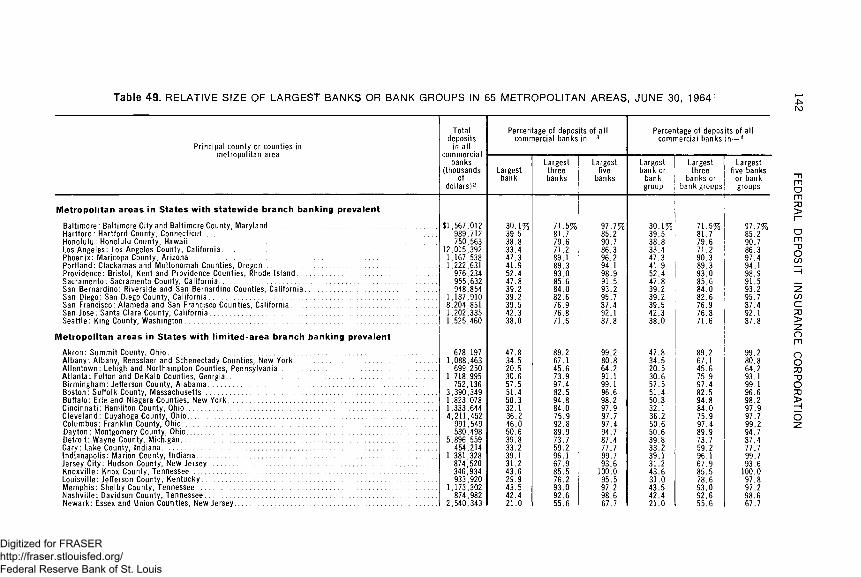
Table 49. RELATIVE SIZE OF LARGEST BANKS OR BANK GROUPS IN 65 METROPOLITAN AREAS, JUNE 30, 1964'
Principal county or counties in metropolitan area
Total deposits
in all commercia 1
banks (thousands
ofdollars)2
Percentage of deposits of a II commercial banks in— 3
Percentage of deposits of all commercial banks in— 4
Largestbank
Largestthreebanks
Largestfive
banks
Largest bank or
bank group
Largest three
banks or bank groups
Largest five banks
or bank groups
M etropo litan areas in States with s tatew ide branch banking prevalent
Baltimore: Baltimore City and Baltimore County, Maryland................................................................................... $1,567,012 30.1% 71.5% 97.7% 30.1% 71.5% 97.7%Hartford: Hartford County, Connecticut..................................................................................................................... 989,712 39.5 81.7 85.2 39.5 81.7 85.2Honolulu: Honolulu County, Hawaii........................................................................................................................... 750,563 38.8 79.6 90.7 38.8 79.6 90.7Los Angeles: Los Angeles County, California........................................................................................................... 12,015,392 33.4 71.2 86.3 33.4 71.2 86.3Phoenix: Maricopa County, Arizona........................................................................................................................... 1,167,538 47.3 89.1 96.2 47.3 90.3 97.4Portland: Clackamas and Multonomah Counties, Oregon...................................................................................... 1,222,631 41.9 89.3 94.1 41.9 89.3 94.1Providence: Bristol, Kent and Providence Counties, Rhode Island..................................................................... 976,234 52.4 93.0 98.9 52.4 93.0 98.9Sacramento: Sacramento County, California............................................................................................................ 955,632 47.8 85.6 91.5 47.8 85.6 91.5San Bernardino: Riverside and San Bernardino Counties, California.................................................................. 948,854 39.2 84.0 93.2 39.2 84.0 93.2San Diego: San Diego County, California.................................................................................................................. 1,187,910 39.2 82.6 95.7 39.2 82.6 95.7San Francisco: Alameda and San Francisco Counties, California......................................................................... 8,204,851 39.5 76.9 87.4 39.5 76.9 87.4San Jose: Santa Clara County, California................................................................................................................. 1.202,335 42.3 76.8 92.1 42.3 76.8 92.1Seattle: King County, Washington.............................................................................................................................. I ! 525,460 38.0 71.6 87.8 38.0 71.6 87.8
M etropolitan areas in S tates with lim ited -area branch banking prevalent
Akron: Summit County, Ohio...................................................................................................................................... 678,197 47.8 89.2 99.2 47.8 89.2 99.2Albany: Albany, Rensslaer and Schenectady Counties, New York....................................................................... 1,088,463 34.5 67.1 80.8 34.5 67.1 80.8Allentown: Lehigh and Northampton Counties, Pennsylvania............................................................................... 699,250 20.5 45.6 64.2 20.5 45.6 64.2Atlanta: Fulton and DeKalb Counties, Georgia......................................................................................................... 1,718,995 30.6 73.9 91.1 30.6 75.9 93.1Birmingham: Jefferson County, Alabama.................................................................................................................. 752,136 57.5 97.4 99.1 57.5 97.4 99.1Boston: Suffolk County, Massachusetts..................................................................................................................... 3,390,349 51.4 82.5 96.6 51.4 82.5 96.6Buffalo: Erie and Niagara Counties, New York........................................................................................................ 1,823,078 50.3 94.8 98.2 50.3 94.8 98.2Cincinnati: Hamilton County, Ohio............................................................................................................................. 1,333,644 32.1 84.0 97.9 32.1 84.0 97.9Cleveland: Cuyahoga County, Ohio............................................................................................................................. 4,211,452 36.2 75.9 97.7 36.2 75.9 97.7Columbus: Franklin County, Ohio............................................................................................................................... 991,549 46.0 92.8 97.4 50.6 97.4 99.2Dayton: Montgomery County, Ohio............................................................................................................................. 530,498 50.6 89.9 94.7 50.6 89.9 94.7Detroit: Wayne County, Michigan................................................................................................................................ 5,896,559 39.8 73.7 87.4 39.8 73.7 87.4Gary: Lake County, Indiana......................................................................................................................................... 454,214 33.2 59.2 77.7 33.2 59.2 77.7Indianapolis: Marion County, Indiana........................................................................................................................ 1,381,328 39.1 96.1 99.7 39.1 96.1 99.7Jersey City: Hudson County, New Jersey.................................................................................................................. 874,520 31.2 67.9 93.6 31.2 67.9 93.6Knoxville: Knox County, Tennessee........................................................................................................................... 346,934 43.6 85.5 100.0 43.6 85.5 100.0Louisville: Jefferson County, Kentucky..................................................................................................................... 933,920 29.9 76.2 95.5 31.0 78.6 97.8Memphis: Shelby County, Tennessee........................................................................................................................ 1,173,302 43.5 93.0 97.2 43.5 93.0 97.2Nashville: Davidson County, Tennessee.................................................................................................................... 874,982 42.4 92.6 98.6 42.4 92.6 98.6Newark: Essex and Union Counties, New Jersey..................................................................................................... 2,540,343 21.0 55.6 67.7 21.0 55.6 67.7
142 FED
ERAL
DEPOSIT
INSU
RAN
CE
CO
RP
OR
ATIO
N
Digitized for FRASER http://fraser.stlouisfed.org/ Federal Reserve Bank of St. Louis
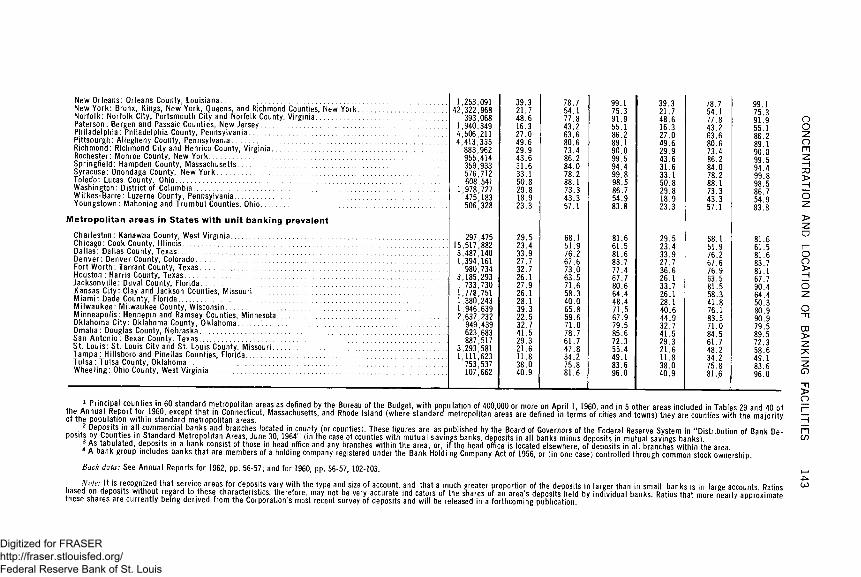
New Orleans: Orleans County, Louisiana...................................................................New York: Bronx, Kings, New York, Queens, and Richmond Counties, New YorkNorfolk: Norfolk City, Portsmouth City and Norfolk County, Virginia....................Paterson: Bergen and Passaic Counties, New Jersey...............................................Philadelphia: Philadelphia County, Pennsylvania.....................................................Pittsburgh: Allegheny County, Pennsylvania............................................................Richmond: Richmond City and Henrico County, Virginia.........................................Rochester: Monroe County, New York...............................................................Springfield: Hampden County, Massachusetts...........................................................Syracuse: Onondaga County, New York.....................................................................Toledo: Lucas County, Ohio..........................................................................................Washington: District of Columbia.................................................................................W ilkes-Barre: Luzerne County, Pennsylvania............................................................Youngstown : Mahoning and Trumbul Counties, Ohio...............................................
M etro po litan areas in S tates with un it banking prevalent
Charleston: Kanawha County, West Virginia..............................................................Chicago: Cook County, Illino is.......................................................................................Dallas: Dallas County, Texas.........................................................................................Denver: Denver County, Colorado................................................................................Fort W orth: Tarrant County, Texas..............................................................................Houston : Harris County, Texas.....................................................................................Jacksonville: Duval County, Florida.............................................................................Kansas City: Clay and Jackson Counties, Missouri...................................................M iami: Dade County, Florida.........................................................................................M ilwaukee: Milwaukee County, Wisconsin.................................................................Minneapolis: Hennepin and Ramsey Counties, Minnesota......................................Oklahoma City: Oklahoma County, Oklahoma...........................................................Omaha: Douglas County, Nebraska..............................................................................San Antonio: Bexar County, Texas..............................................................................St. Louis: St. Louis City and St. Louis County, Missouri.........................................Tampa: Hillsboro and Pinellas Counties, Florida.......................................................Tulsa: Tulsa County, Oklahoma..............................................................Wheeling: Ohio County, West V irginia...................................................................
253,091322,968393,068940,349
,506,211,413,335883,962955,414359,933576,712608,541
,978,727475,183506,328
297,475,517,882,487,140,394,161980,734
,185,293733,730
,778,751,380,243,946,639,637,232949,439623,683887,517
,293,581,111,623753,537107,662
39.321.748.616.327.049.6 29.943.631.633.150.829.818.923.3
29.523.433.927.732.7 26.127.9 26.1 28.139.322.532.741.529.32 1 . 61 1 . 8 38.040.9
78.754.177.843.263.680.6 73.48 6 . 284.078.28 8 . 173.343.3 57.1
6 8 . 151.976.2 67.673.063.571.658.340.0 65.859.671.078.761.747.8 34.275.8 81.6
99.175.3 91.955.18 6 . 2 89.1 90.0 99.594.499.898.586.754.983.8
81.661.581.683.777.467.7 80.664.448.471.5 67.979.585.672.355.4 49.183.6 96.0
39.321.748.616.327.049.6 29.943.631.633.150.829.818.923.3
29.523.433.9 27.736.6 26.133.7 26.1 28.140.644.932.741.5 29.32 1 . 61 1 . 8 38.040.9
78.754.177.843.263.680.6 73.48 6 . 284.078.28 8 . 173.343.3 57.1
6 8 . 151.976.267.676.963.581.558.3 41.876.183.5 71.084.561.748.234.275.881.6
99.175.3 91.955.18 6 . 2 89.1 90.0 99.594.499.898.586.754.983.8
81.661.581.683.7 81.167.790.464.450.380.990.979.589.572.358.6 49.183.6 96.0
tho A ^ n n J f 'R fL T f^ Q R n 60 a[eas as defined by the Bureau of the Budget, with population of 400,000 or more on April 1, 1960, and in 5 other areas included in Tables 29 and 40 ofoMhe population within ^a'ndard metfop'olitan^areas Massachusetts- and Rhode lsland (where standard metropolitan areas are defined in terms of cities and towns) they are counties with the majority
nocit! commer^iaI ba n k s a n d branches located in county (or counties). These figures are as published by the Board of Governors of the Federal Reserve System in “ Distribution of Bank Deposits by Counties m Standard Metropolitan Areas June 30, 1964 (in the case of counties with mutual savings banks, deposits in all banks minus deposits in mutual savings banks).
a " sJ a“ u'a^ec*» deposits in a bank consist of those in head office and any branches within the area, or, if the head office is located elsewhere, of deposits in all branches within the area.A bank group includes banks that are members of a holding company registered under the Bank Holdi ng Company Act of 1956, or (in one case) controlled through common stock ownership.
B ack data : See Annual Reports for 1962, pp. 56-57; and for I960, pp. 56-57, 102-103.
basedN ote: It is recognized that service areas for deposits vary with the type and size of account, and that a much greater proportion of the deposits in larger than in small banks is in large accounts Ratios icJ oni deposits> without regard to these characteristics, therefore, may not be very accurate indicators of the shares of an area's deposits held by individual banks. Ratios that more nearly approximate, ■ - |_ • _! •----. * ------ ,------------ * ' -..W. W. w. w, ..vv UVSVUIUVW HIUIVUIUIU V» 111 G OllCIt CO Ul ail OICO O UC}JUOlld I l£ It
these snares are currently being derived from the Corporation s most recent survey of deposits and will be released in a forthcoming publication,
CO
NC
ENTR
ATION
AND
LOC
ATION
OF
BANKIN
G
FAC
ILITIES
143
Digitized for FRASER http://fraser.stlouisfed.org/ Federal Reserve Bank of St. Louis
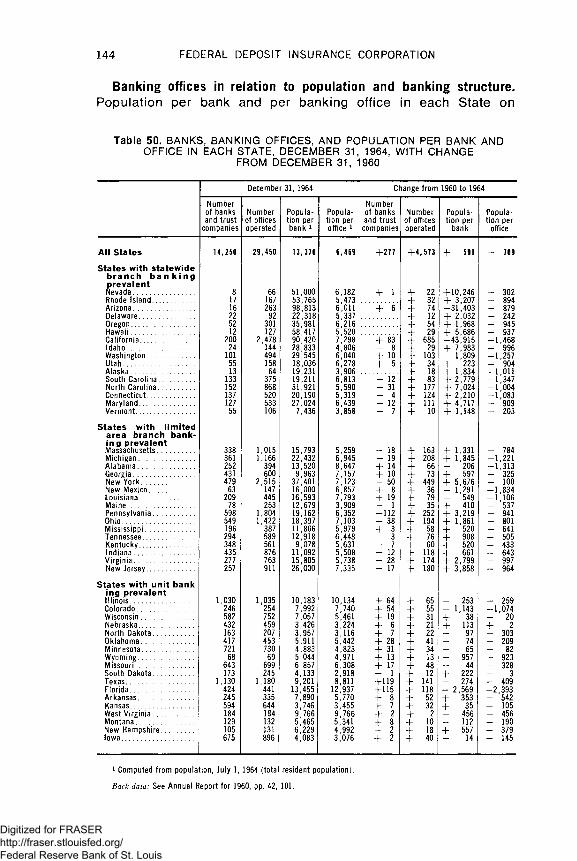
144 FEDERAL DEPOSIT INSURANCE CORPORATION
Banking offices in relation to population and banking structure.Population per bank and per banking office in each State on
Table 50. BANKS, BANKING OFFICES, AND POPULATION PER BANK AND OFFICE IN EACH STATE, DECEMBER 31, 1964, WITH CHANGE
FROM DECEMBER 31, 1960
December 31, 1964 Change from 1960 to 1964
Number of banks and trust
companies
Number of offices operated
Population per bank 1
Population per office 1
Number of banks and trust
companies
Number of offices operated
Population per
bank
Population per
office
All States 14,250 29,450 13,370 6,469 +277 +4,573 + 591 - 709
States with statew ide b ra n c h b a n k in g prevalentNevada.............................. 8 66 51,000 6,182 + 1 + 22 +10,246 - 302Rhode Island..................... 17 167 53,765
98,8135,4736,011
+ 32 + 3,207 -31 ,403
- 894Arizona.............................. 16 263 + 6 + 74 - 879Delaware............................ 22 92 22,318
35,98158,41790,420
5,3376,2165,5207,298
+ 12 + 2,032 + 1,968 + 5,686 -43 ,915
- 242Oregon............................... 52 301 + 54 - 945Hawaii................................ 12 127 + 29 - 937California........................... 200 2,478 + 83 + 685 -1 ,4 6 8Idaho.................................. 24 144 28,833 4,806 - 8 + 29 + 7,983 - 996Washington........................ 101 494 29,545 6,040 + 10 + 103 - 1,809 -1 ,2 5 7Utah.................................... 55 158 18,036 6,278 + 5 + 34 + 223 - 904Alaska................................ 13 64 19,231
19,2113,9066,813
+ 18 + 1,834 + 2,779
-1 ,0 1 1-1 ,3 4 7South Carolina.................. 133 375 - 12 + 83
North Carolina.................... 152 868 31,921 5,590 - 31 + 177 + 7,024 -1 ,0 0 4Connecticut....................... 137 520 20,190 5,319 - 4 + 124 + 2,210 -1 ,0 8 3Maryland........................... 127 533 27,024 6,439 - 12 + 111 + 4,717 - 909Vermont............................. 55 106 7,436 3,858 - 7 + 10 + 1,148 - 203
States with lim ited area branch banking prevalentMassachusetts.................. 338 1,015 15,793 5,259 - 18 + 163 + 1,331 - 784Michigan............................ 361 1,166 22,432 6,945 - 19 + 208 + 1,845 -1 ,2 2 1Alabama............................ 252 394 13,520 8,647 + 14 + 66 - 206 -1 ,3 1 3Georgia.............................. 431 600 9,963 7,157 + 10 + 73 + 597 - 325New York.......................... 479 2,515 37,401 7,123 - 50 + 449 + 5,676 - 100New Mexico...................... 63 147 16,000 6,857 + 8 + 36 - 1,291 -1 ,8 3 4Louisiana........................... 209 445 16,593 7,793 + 19 + 79 - 549 -1 ,1 0 6Maine................................. 78 253 12,679 3,909 - 1 + 35 + 410 - 537Pennsylvania.................... 598 1,804 19,162 6,352 -1 1 2 + 252 + 3,219 - 941Ohio.................................... 549 1,422 18,397 7,103 - 38 + 194 + 1,861 - 801Mississippi........................ 196 387 11,806 5,979 + 3 + 58 + 520 - 641Tennessee......................... 294 589 12,918 6,448 - 3 + 76 + 908 - 505Kentucky........................... 348 561 9,078 5,631 - 7 + 60 + 520 - 433Indiana.............................. 435 876 11,092 5,508 - 12 + 118 + 661 - 643Virginia .............................. 277 763 15,805 5,738 - 28 + 174 + 2,799 - 997New Jersey........................ 257 911 26,000 7,335 - 17 + 180 + 3,858 - 964
States with un it bank ing prevalentIllino is ................................ 1,030 1,035 10,183 10,134 + 64 + 65 - 253 - 259Colorado............................ 246 254 7,992 7,740 + 54 + 55 - 1,143 -1 ,0 7 4Wisconsin.......................... 582 752 7,057 5,461 + 19 + 31 + 38 - 20Nebraska........................... 432 459 3,426 3,224 + 6 + 21 + 113 + 2North Dakota.................... 163 207 3,957 3,116 + 7 + 22 97 - 303Oklahoma.......................... 417 453 5,911 5,442 + 28 + 41 74 - 209Minnesota.......................... 721 730 4,883 4,823 + 31 + 34 - 65 - 82Wyoming............................ 68 69 5,044 4,971 + 13 + 13 - 957 - 923Missouri............................. 643 699 6,857 6,308 + 17 + 48 44 - 328South Dakota.................... 173 245 4,133 2,918 - 1 + 12 + 222 3Texas................................. 1,130 1,180 9,201 8,811 +119 + 141 - 274 - 409Florida............................... 424 441 13,455 12,937 +115 + 118 - 2,569 -2 ,3 9 3Arkansas........................... 245 335 7,890 5,770 + 8 + 52 + 353 - 542Kansas............................... 594 644 3,746 3,455 + 7 + 32 + 35 - 105West V irgin ia.................... 184 184 9,766 9,766 + 2 + 2 - 456 - 456Montana............................. 129 132 5,465 5,341 + 8 + 10 - 112 - 190New Hampshire................ 105 131 6,229 4,992 - 2 + 18 + 557 - 379Iowa................................... 675 896 4,083 3,076 + 2 + 40 14 - 145
1 Computed from population, July 1, 1964 (total resident population).
Back data: See Annual Report for I960, pp. 42, 101.
Digitized for FRASER http://fraser.stlouisfed.org/ Federal Reserve Bank of St. Louis
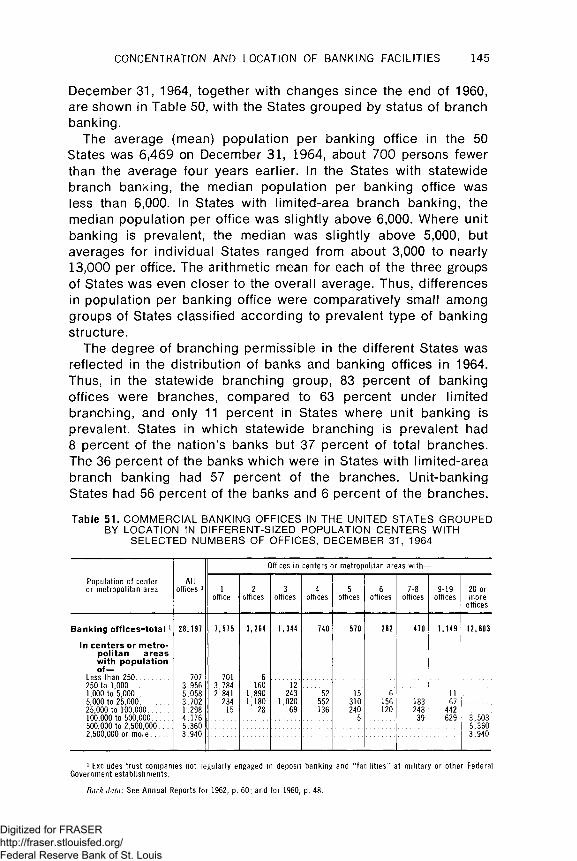
CONCENTRATION AND LOCATION OF BANKING FACILITIES 145
December 31, 1964, together with changes since the end of 1960, are shown in Table 50, with the States grouped by status of branch banking.
The average (mean) population per banking office in the 50 States was 6,469 on December 31, 1964, about 700 persons fewer than the average four years earlier. In the States with statewide branch banking, the median population per banking office was less than 6,000. In States with limited-area branch banking, the median population per office was slightly above 6,000. Where unit banking is prevalent, the median was slightly above 5,000, but averages for individual States ranged from about 3,000 to nearly13,000 per office. The arithmetic mean for each of the three groups of States was even closer to the overall average. Thus, differences in population per banking office were comparatively small among groups of States classified according to prevalent type of banking structure.
The degree of branching permissible in the different States was reflected in the distribution of banks and banking offices in 1964. Thus, in the statewide branching group, 83 percent of banking offices were branches, compared to 63 percent under limited branching, and only 11 percent in States where unit banking is prevalent. States in which statewide branching is prevalent had 8 percent of the nation’s banks but 37 percent of total branches. The 36 percent of the banks which were in States with limited-area branch banking had 57 percent of the branches. Unit-banking States had 56 percent of the banks and 6 percent of the branches.
Table 51. COMMERCIAL BANKING OFFICES IN THE UNITED STATES GROUPED BY LOCATION IN DIFFERENT-SIZED POPULATION CENTERS WITH
SELECTED NUMBERS OF OFFICES, DECEMBER 31, 1964
Population of center or metropolitan area
Alloffices
Offices in centers or metropolitan areas with—
1office
2offices
3offices
4offices
5offices
6offices
7-8offices
9-19offices
20 or more
offices
7,575 3,264 1,344 740 570 282 470 1,149 12,803
701 63,7842,841
234
160 121,890 243 52 15 6 111,180
281,020
69552 310 156 183 67
15 136 240 120 248 4425 39 629 3,503
5,3603,940
Banking offices-total1
In centers or metropolitan areas with population of—
Less than 250................250 to 1,000...................1.000 to 5,000................5.000 to 25,000..............25.000 to 100,000..........100.000 to 500,000........500.000 to 2,500,000...2.500.000 or more........
28,197
7073,9565,0583,7021,2984,1765,3603,940
1 Excludes trust companies not regularly engaged in deposit banking and “ facilities" at military or other Federal Government establishments.
B ack d a ta : See Annual Reports for 1962, p. 60; and for I960, p. 48.
Digitized for FRASER http://fraser.stlouisfed.org/ Federal Reserve Bank of St. Louis
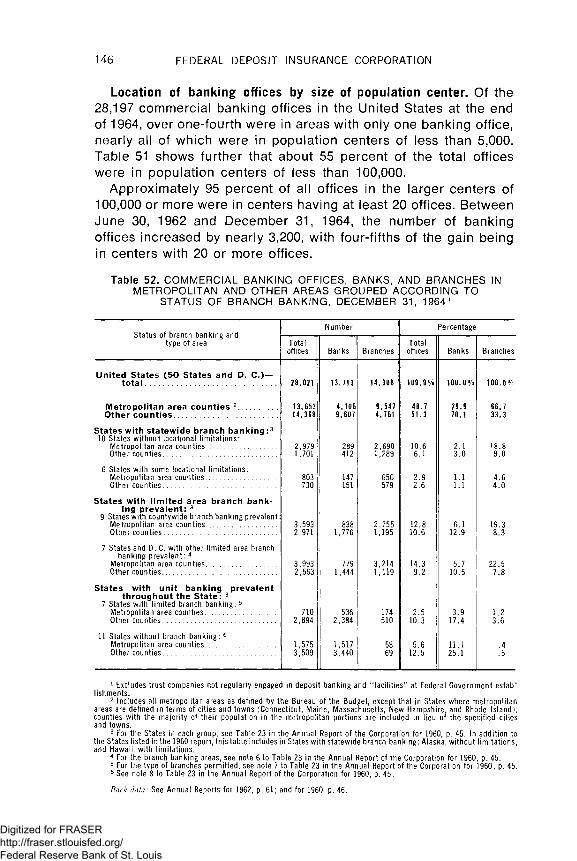
146 FEDERAL DEPOSIT INSURANCE CORPORATION
Location of banking offices by size of population center. Of the28,197 commercial banking offices in the United States at the end of 1964, over one-fourth were in areas with only one banking office, nearly all of which were in population centers of less than 5,000. Table 51 shows further that about 55 percent of the total offices were in population centers of less than 100,000.
Approximately 95 percent of all offices in the larger centers of100,000 or more were in centers having at least 20 offices. Between June 30, 1962 and December 31, 1964, the number of banking offices increased by nearly 3,200, with four-fifths of the gain being in centers with 20 or more offices.
Table 52. COMMERCIAL BANKING OFFICES, BANKS, AND BRANCHES IN METROPOLITAN AND OTHER AREAS GROUPED ACCORDING TO
STATUS OF BRANCH BANKING, DECEMBER 31, 1964'
Status of branch banking and type of area
Number Percentage
Totaloffices Banks Branches
Totaloffices Banks Branches
United States (50 States and D. C.)— total............................................ 28,021 13,713 14,308 100.0% 100.0% 100.0%
Metropolitan area counties 2............. 13,653 4,106 9,547 48.7 29.9 66.7Other counties................................... 14,368 9,607 4,761 51.3 70.1 33.3
States with statewide branch banking :310 States without locational limitations:
Metropolitan area counties................................... 2,979 289 2,690 10.6 2.1 18.8Other counties......................................................... 1,701 412 1,289 6.1 3.0 9.0
6 States with some locational limitations: Metropolitan area counties................................... 803 147 656 2.9 1.1 4.6Other counties........................................................ 730 151 579 2.6 1.1 4.0
States with limited area branch banking prevalent: 3
9 States with countywide branch banking prevalent: Metropolitan area counties................................... 3,593 838 2,755 12.8 6.1 19.3Other counties........................................................ 2,971 1,776 1,195 10.6 12.9 8.3
7 States and D. C. with other limited area branch banking prevalent: 4
Metropolitan area counties................................... 3,993 779 3,214 14.3 5.7 22.5Other counties......................................................... 2,563 1,444 1,119 9.2 10.5 7.8
States with unit banking prevalent throughout the State: 3
7 States with limited branch banking: 5 Metropolitan area counties................................... 710 536 174 2.5 3.9 1.2Other counties........................................................ 2,894 2,384 510 10.3 17.4 3.6
11 States without branch banking: 6Metropolitan area counties................................... 1,575 1,517 58 5.6 11.1 .4Other counties........................................................ 3,509 3,440 69 12.5 25.1 .5
1 Excludes trust companies not regularly engaged in deposit banking and “ facilities” at Federal Government estab' lishments.
2 Includes all metropolitan areas as defined by the Bureau of the Budget, except that in States where metropolitan areas are defined in terms of cities and towns (Connecticut, Maine, Massachusetts, New Hampshire, and Rhode Island), counties with the majority of their population in the metropolitan portions are included in lieu of the specified cities and towns.
3 For the States in each group, see Table 23 in the Annual Report of the Corporation for 1960, p. 45. In addition to the States listed in the 1960 report, this table includes in States with statewide branch banking: Alaska, without limitations, and Hawaii, with limitations.
4 For the branch banking areas, see note 6 to Table 23 in the Annual Report of the Corporation for 1960, p. 45.5 For the type of branches permitted, see note 7 to Table 23 in the Annual Report of the Corporation for 1960, p. 45.6 See note 8 to Table 23 in the Annual Report of the Corporation for 1960, p. 45.
B ack d a ta : See Annual Reports for 1962, p. 61; and for 1960, p. 46.
Digitized for FRASER http://fraser.stlouisfed.org/ Federal Reserve Bank of St. Louis
CONCENTRATION AND LOCATION OF BANKING FACILITIES 147
Counties in Standard Metropolitan Statistical Areas contained almost one-half the banking offices of the nation’s commercial banks at the end of 1964, as shown in Table 52. Only three-tenths of the commercial banks were located in metropolitan area counties, while two-thirds of the branches were in those counties.
ASSETS AND LIABILITIES OF BANKS
Assets and liabilities at the close of 1964. Total assets of all banks in the United States on December 31, 1964 amounted to $402.7 billion, an increase of 10.7 percent over the figure as of December 20, 1963. Percentage increases in recent years, influenced somewhat by differences in the year-end call dates, were 5.6 percent in 1963, 6.8 percent in 1962, and 7.8 percent in 1961.' Banks participating in Federal deposit insurance held 97.4 percent of the assets of all banks on December 31, 1964.
The increase of $39 billion in total assets in 1964 was comprised of gains of $24 billion in loans, $10 billion in cash, $4 billion in securities other than obligations of the United States Government, and $1 billion in other assets. There was a decline of $302 million in holdings of United States Government obligations. These increases were balanced by gains of $37 billion in deposits, and $2 billion in the capital accounts of banks.
Some of the differences between the operations of commercial banks and mutual savings banks are reflected in Table 53. Commercial banks, on December 31, 1964, had 35.5 percent of their assets in cash and United States Government obligations; however, mutual savings banks, needing fewer such assets to satisfy liquidity or legal reserve requirements, had only 12.5 percent. On the other hand, loans constituted 75.8 percent of the assets of mutual savings banks, but only 50.7 percent of the assets of commercial banks. Almost all the loans held by mutual savings banks were secured by real estate. One-third of the loans of commercial banks were classified as commercial and industrial, one-fourth were secured by real estate, and more than one-fifth were loans to individuals for household, family, and other personal expenditures. Time and savings deposits of individuals constitute nearly all deposits in mutual savings banks, while demand deposits exceed time and savings deposits in commercial banks.
Changes in assets and liabilities since 1934. During the last 30 years, total assets of all banks increased from $59 billion to nearly $403 billion. There were also notable changes in the composition of assets. Cash and funds due from banks declined from 20 percent to 15 percent of total assets. Securities were also lower, falling
' Call dates for banks participating in Federal deposit insurance were December 31, 1964; December 20, 1963; December 28, 1962; and December 30, 1961.
Digitized for FRASER http://fraser.stlouisfed.org/ Federal Reserve Bank of St. Louis

148 FEDERAL DEPOSIT INSURANCE CORPORATION
Table 53. ASSETS AND LIABILITIES OF ALL BANKS IN THE UNITED STATES, BY TYPE OF BANK, DECEMBER 31, 1964
Amount (in millions) Percentage distribution
Asset or liability item All banksCommercial banks and
trust companies
Mutualsavingsbanks
All banksCommercial banks and
trust companies
Mutualsavingsbanks
Assets—total........................ $402,673 $348,433 $54,240 100.0% 100.0% 100.0%Cash and funds due from banks__ 61,644 60,640 ! 1,004 15.3 17.4 1.8U. S. Government obligations........... 68,921 63,133 ! 5,788 17.1 18.1 10.7Other securities.................................. 44,362 38,872 i 5,490 11.0 11.2 10.1Loans and discounts 1....................... 217,658 176,573 j 41,085 54.1 50.7 75.8Other assets........................................ 10,088 9,216 ! 873 2.5 2.6 1.6
Liabilities and capital ac icounts—total.................. 402,673 348,433 i 54,240 100.0 100.0 100.0
Deposits— total................................... 357,565 308,427 49,139 88.8 88.5 90.6Other liab ilities.................................. 12,812 12,112 700 3.2 3.5 1.3Capital accounts— to ta l...................... 32,295 27,895 4,401 8.0 8.0 8.1
Loans—gross total 2............. 221,446 180,137 41,309 100.0 100.0 100.0Commercial and industrial............... 60,776 ! 60,612 164 27.5 33.6 .4Agricultural (except real estate).. . . 7,523 7,520 2 3.4 4.2 ( 3)For carrying securities...................... 8,419 i 8,387 32 3.8 4.7 .1Real estate loans................................ 84,532 i 43,976 40,556 38.2 24.4 98.2Other loans to individuals................ 40,521 40,011 510 18.3 22.2 1.2To financial institutions.................... 14,469 i 14,443 26 6.5 8.0 .1All other............................................... 5,206 j 5,187 19 2.3 2.9 ( 3)
Deposits—total.....................Business and personal deposits:
357,565 308,427 49,139 100.0 100.0 100.0
Demand 4........................................ 141,562 141,232 330 39.6 45.8 .7Time and savings.......................... 162,054 113,284 48,770 45.3 36.7 99.2
Government deposits:States and subdivisions................ 23,504 23,475 29 6.6 7.6 .1United States.................................. 6,814 6,807 7 1.9 2.2 ( 3)
Interbank deposits 5.......................... 23,631 23,629 2 6.6 7.7 ( 3)
1 Net of valuation reserves.2 Includes valuation reserves.3 Less than .05 percent.4 Includes certified checks, letters of credit, etc.5 Includes postal savings deposits.
N ote: Due to rounding, components may not add to totals.
from 39 percent to 28 percent of the total. However, loans increased to 54 percent of assets, up from 35 percent at the end of 1934.
The last decade has been one of notable acceleration in rates of change, and of significant changes in the composition of assets and deposits. Almost one-half of the growth in bank assets which took place during the past 30 years occurred in the 10 years ending December 31, 1964. Total loans and the obligations of States and their subdivisions expanded at more than twice the percentage change of total assets. Other major categories of assets increased at differing rates, while holdings of United States Government obligations declined 12 percent.
Significant changes also took place in the composition of deposits during the last decade. Time and savings deposits rose from 36 percent to nearly 50 percent of the total, with the rise particularly rapid in the last three years. A prosperous and expanding
Digitized for FRASER http://fraser.stlouisfed.org/ Federal Reserve Bank of St. Louis
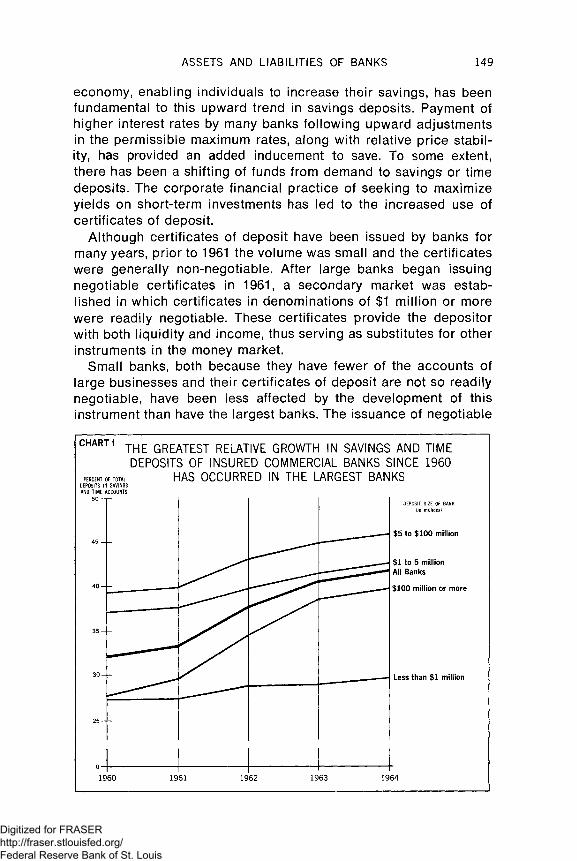
ASSETS AND LIABILITIES OF BANKS 149
economy, enabling individuals to increase their savings, has been fundamental to this upward trend in savings deposits. Payment of higher interest rates by many banks following upward adjustments in the permissible maximum rates, along with relative price stability, has provided an added inducement to save. To some extent, there has been a shifting of funds from demand to savings or time deposits. The corporate financial practice of seeking to maximize yields on short-term investments has led to the increased use of certificates of deposit.
Although certificates of deposit have been issued by banks for many years, prior to 1961 the volume was small and the certificates were generally non-negotiable. After large banks began issuing negotiable certificates in 1961, a secondary market was established in which certificates in denominations of $1 million or more were readily negotiable. These certificates provide the depositor with both liquidity and income, thus serving as substitutes for other instruments in the money market.
Small banks, both because they have fewer of the accounts of large businesses and their certificates of deposit are not so readily negotiable, have been less affected by the development of this instrument than have the largest banks. The issuance of negotiable
Digitized for FRASER http://fraser.stlouisfed.org/ Federal Reserve Bank of St. Louis
150 FEDERAL DEPOSIT INSURANCE CORPORATION
certificates of deposit has contributed to the relatively rapid increase in time and savings deposits held by large banks shown in Chart I. Changes in the percentages of time and savings deposits to total deposits among banks of different sizes have also been influenced by various other factors, such as differences among banks in rates of deposit growth and in interest rates paid on time and savings accounts.
INCOME OF INSURED BANKS
Income of all insured banks in 1964. Banks insured by the Corporation reported total income in 1964 of $17.6 billion. Insured commercial banks had income of $15.3 billion, or 87 percent of the total, while the income of insured mutual savings banks comprised the remainder. Total income was 9.8 percent greater than in 1963, compared to an increase of 10.5 percent in assets.
Sources and disposition of income of insured commercial banks in 1964. Current operating revenue, consisting of income from loans, securities, and other sources amounted to $15 billion in the year. Net current operating earnings were $4.1 billion, after deduction of current operating expenses. These included salaries and wages, interest on deposits, and other expenses.
Items of income and expense also arise when assets are disposed of, or charge-offs and recoveries are made, such transactions being based in part upon considerations of tax advantage and alternative uses for the funds. Net income after taxes reached nearly $2.3 billion in 1964, and for the first time dividends to shareholders exceeded $1 billion.
Table 54 shows the amounts and percentage distribution of sources of income and its disposition for insured commercial banks in 1962,1963, and 1964. Each item of current operating income and expense increased in amount during both 1963 and 1964. However, income from loans and from obligations of States and political subdivisions produced larger shares in 1964, while interest on United States Government obligations declined as a percentage of the total. Slightly more than one-half of total income was required for salaries and wages and interest on deposits. While there was a decline in the percentage of income needed to pay wages and salaries, the share needed for payment of interest on deposits rose sharply.
Figures related to bank assets and earnings are dominated by a relatively few large banks. As shown in Table 55, fewer than 3 percent of the insured commercial banks operating throughout 1964 had deposits of $100 million or more, but they held more than three-fifths of the assets and earned approximately the same
Digitized for FRASER http://fraser.stlouisfed.org/ Federal Reserve Bank of St. Louis
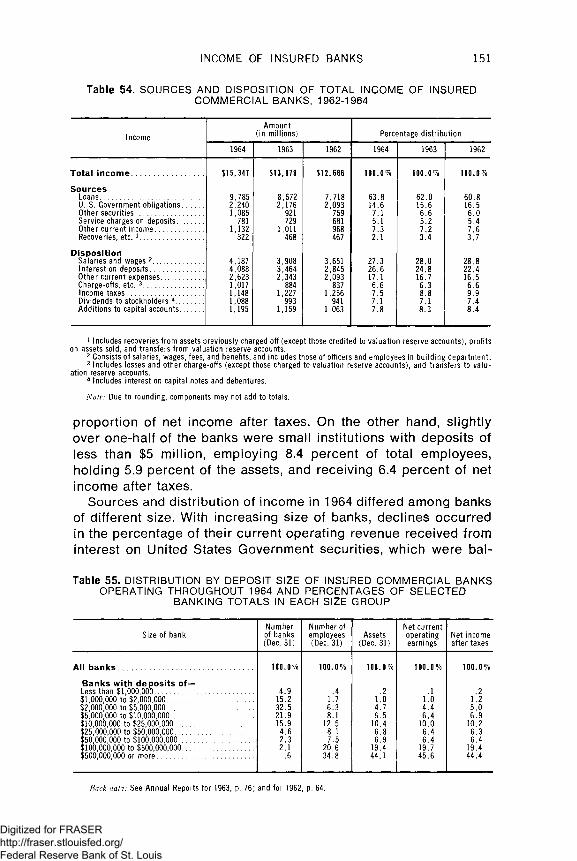
INCOME OF INSURED BANKS 151
Table 54. SOURCES AND DISPOSITION OF TOTAL INCOME OF INSUREDCOMMERCIAL BANKS, 1962-1964
Income
Amount (in millions) Percentage distribution
1964 1963 1962 1964 1963 1962
Total income........................ $15,347 $13,978 $12,686 100.0% 100.0% 100.0%
SourcesLoans.................................................... 9,785 8,672 7,718 63.8 62.0 60.8U. S. Government obligations.......... 2,240 2,176 2,093 14.6 15.6 16.5Other securities.................................. 1,085 921 759 7.1 6.6 6.0Service charges on deposits............. 781 729 681 5.1 5.2 5.4Other current income........................ 1,132 1,011 968 7.3 7.2 7.6Recoveries, etc. 1............................... 322 468 467 2.1 3.4 3.7
DispositionSalaries and wages 2......................... 4,187 3,908 3,651 27.3 28.0 28.8Interest on deposits.......................... 4,088 3,464 2,845 26.6 24.8 22.4Other current expenses..................... 2,623 2,343 2,093 17.1 16.7 16.5Charge-offs, etc. 3.............................. 1,017 884 837 6.6 6.3 6.6Income taxes...................................... 1,148 1,227 1,256 7.5 8.8 9.9Dividends to stockholders 4............. 1,088 993 941 7.1 7.1 7.4Additions to capital accounts........... 1,195 1,159 1,063 7.8 8.3 8.4
1 Includes recoveries from assets previously charged off (except those credited to valuation reserve accounts), profits on assets sold, and transfers from valuation reserve accounts.
2 Consists of salaries, wages, fees, and benefits, and includes those of officers and employees in building department.3 Includes losses and other charge-offs (except those charged to valuation reserve accounts), and transfers to valu
ation reserve accounts.4 Includes interest on capital notes and debentures.
N o te : Due to rounding, components may not add to totals.
proportion of net income after taxes. On the other hand, slightly over one-half of the banks were small institutions with deposits of less than $5 million, employing 8.4 percent of total employees, holding 5.9 percent of the assets, and receiving 6.4 percent of net income after taxes.
Sources and distribution of income in 1964 differed among banks of different size. With increasing size of banks, declines occurred in the percentage of their current operating revenue received from interest on United States Government securities, which were bal-
Table 55. DISTRIBUTION BY DEPOSIT SIZE OF INSURED COMMERCIAL BANKS OPERATING THROUGHOUT 1964 AND PERCENTAGES OF SELECTED
BANKING TOTALS IN EACH SIZE GROUP
Size of bankNumber of banks (Dec. 31)
Number of employees (Dec. 31)
Assets (Dec. 31)
Net current operating earnings
Net income after taxes
All banks.............................................. 100.0% 100.0% 100.0% 100.0% 100.0%
Banks with deposits of—Less than $1,000,000................................................. 4.9 .4 .2 .1 .2$1,000,000 to $2,000,000........................................... 15.2 1.7 1.0 1.0 1.2$2,000,000 to $5,000,000........................................... 32.5 6.3 4.7 4.4 5.0$5,000,000 to $10,000,000......................................... 21.9 8.1 6.5 6.4 6.9$10,000,000 to $25,000,000....................................... 15.9 12.5 10.4 10.0 10.2$25,000,000 to $50,000,000....................................... 4.6 8.1 6.8 6.4 6.3$50,000,000 to $100,000,000..................................... 2.3 7.5 6.9 6.4 6.4$100,000,000 to $500,000,000................................... 2.1 20.6 19.4 19.7 19.4$500,000,000 or m ore ............................................... .6 34.8 44.1 45.6 44.4
B ack d a ta : See Annual Reports for 1963, p. 76; and for 1962, p. 64.
Digitized for FRASER http://fraser.stlouisfed.org/ Federal Reserve Bank of St. Louis
152 FEDERAL DEPOSIT INSURANCE CORPORATION
anced in part by increases in the proportion generated by loans. Wages and salaries accounted for a larger part of current operating expense in small-sized banks than in medium or large-sized banks. Interest on deposits, on the other hand, was highest in relation to total current operating expense in the largest banks of $500 million or more in deposits, and lowest in the smaller banks with deposits below $5 million.
Trends in income and expense of insured commercial banks. Both total current operating revenue and current operating expenses have increased from year to year for the past quarter of a century. Net current operating earnings have fluctuated around 35-38 percent of total current operating revenue during most of this period. Since 1960 there has been a steady decline in this percentage, reaching 27.5 percent in 1964, the lowest proportion since 1940.
The $2.4 billion of net income after taxes received in 1964 represented a return of 8.4 percent on total capital accounts, higher than in 1950 or 1955, but lower than in the years 1960-1963. Net current operating earnings on assets showed a similar pattern. Banks have, in recent years, experienced a rising volume of assets from which higher rates of income were received, but which entailed costs at times rising more rapidly than income. Table 56 gives selected data reflecting items of income and expense of insured commercial banks in the years 1950, 1955, and 1960-1964.
Total salaries, wages, fees, and benefits for officers, directors, and employees have declined slightly in recent years relative to current operating revenue. While average salaries have risen steadily, the amount of assets per employee and current operating revenue per employee have also increased.
Interest on time and savings deposits absorbed 27 percent of total current operating revenue in 1964, almost as much as compensation paid to employees. Interest payments in 1960, following a rising trend in both dollar volume and in relation to current operating revenues, amounted to 17 percent of revenues. Since then the upward movement has accelerated, resulting from higher rates paid by banks, permitted under revised regulations, as well as from the relatively rapid growth in the amount of time and savings deposits, particularly certificates of deposit.
Sources and disposition of income of insured mutual savings banks in 1964. The sources and disposition of income of mutual savings banks are greatly influenced by the mutual form of organization and by the fact that almost all the deposits in these banks consist of savings accounts. Because of the relative stability of the deposits, these banks are not required to maintain the degree of liquidity needed by commercial banks. Mutual savings banks
Digitized for FRASER http://fraser.stlouisfed.org/ Federal Reserve Bank of St. Louis

INCOME OF INSURED BANKS 153
Table 56. OPERATING DATA OF INSURED COMMERCIAL BANKS IN OPERATION THROUGHOUT SELECTED YEARS, 1950, 1955, 1960-1964
Item 1950 1955 1960 1961 1962 1963 1964
Net current operating earnings per $100 of total capital accounts.................... $13.22 $16.09 $18.34 $16.40 $15.33 $15.06 $15.18
Net income after taxes per $100 of total capital accounts.................................. 8.32 7.69 9.69 9.02 8.47 8.56 8.41
Current operating revenue per $100 of total assets.......................................... 2.36 3.03 4.17 3.98 4.13 4.32 4.36
Net current operating earnings per $100 of total assets..................................... .89 1.15 1.48 1.31 1.23 1.22 1.20
Income on loans per $100 of loans.......... 3.90 4.47 5.78 5.61 5.51 5.55 5.60
Income on U. S. Government obligations per $100 of U. S. Government obligations................................................. 1.66 2.18 2.95 2.87 3.17 3.45 3.58
Income on other securities per $100 of other securities.................................. 1.87 2.14 2.81 2.66 2.62 2.65 2.82
Current operating expense per $100 of current operating revenue................ 62.15 62.00 64.60 67.12 70.24 71.79 72.47
Current operating expense per $100 of total assets.......................................... 1.47 1.88 2.69 2.67 2.90 3.10 3.16
Salaries, wages, fees, and benefits per $100 of current operating revenue.. 31.19 30.28 26.58 30.93 29.86 28.88 27.83
Interest on time and savings deposits per $100 of current operating revenue................................................ 8.73 10.67 16.67 19.00 23.28 25.63 27.25
Interest paid per $100 of time and savings deposits................................. .94 1.35 2.43 2.54 2.90 3.09 3.21
Salaries, etc. per $100 of total assets .74 .92 1.11 1.23 1.23 1.25 1.21
Assets per employee (in thousands of dollars)................................................ 433.4 425.3 420.8 438.2 450.9 458.7 491.2
Current operating revenue per employee (in thousands of dollars).................. 10.2 12.9 17.6 17.4 18.6 19.8 21.4
receive most of their income from mortgage loans.Higher payments to time and savings depositors are made by
mutual savings banks than by commercial banks: 4.13 percent compared to 3.42 percent in 1964. Since almost all deposits of mutual savings banks are of this type, dividends and interest on deposits absorb a large part of total income— more than seven- tenths in 1964. The virtual absence of demand deposit accounting is chiefly responsible for the ability of mutual savings banks to operate with an average of more than four times as much assets and receive five times as much current operating income per employee as the average commercial bank.
A distribution of the income of insured mutual savings banks in 1962, 1963, and 1964, by amounts and percentages, is shown in Table 57.
Digitized for FRASER http://fraser.stlouisfed.org/ Federal Reserve Bank of St. Louis
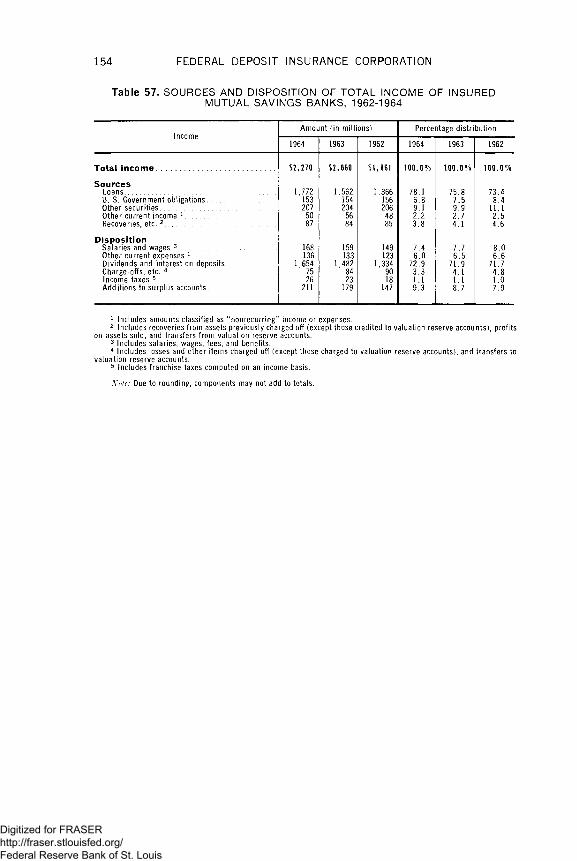
154 FEDERAL DEPOSIT INSURANCE CORPORATION
Table 57. SOURCES AND DISPOSITION OF TOTAL INCOME OF INSURED MUTUAL SAVINGS BANKS, 1962-1964
IncomeAmount (in millions) Percentage distribution
1964 1963 1962 1964 1963 1962
Total income........................................ $2,270 $2,060 $1,861 100.0% 100.0% 100.0%
SourcesLoans........................................................................... 1,772 1,562 1,366 78.1 75.8 73.4U. S. Government obligations.................................. 153 154 156 6.8 7.5 8.4Other securities.......................................................... 207 204 206 9.1 9.9 11.1Other current income 1............................................. 50 56 48 2.2 2.7 2.5Recoveries, etc. 2....................................................... 87 84 85 3.8 4.1 4.6
DispositionSalaries and wages 3................................................. 168 159 149 7.4 7.7 8.0Other current expenses 1.......................................... 136 133 123 6.0 6.5 6.6Dividends and interest on deposits........................ 1,654 1,482 1,334 72.9 71.9 71.7Charge-offs, etc. 4...................................................... 75 84 90 3.3 4.1 4.8Income taxes 5........................................................... 26 23 18 1.1 1.1 1.0Additions to surplus accounts.................................. 211 179 147 9.3 8.7 7.9
1 Includes amounts classified as “ nonrecurring” income or expenses.2 Includes recoveries from assets previously charged off (except those credited to valuation reserve accounts), profits
on assets sold, and transfers from valuation reserve accounts.3 Includes salaries, wages, fees, and benefits.4 Includes losses and other items charged off (except those charged to valuation reserve accounts), and transfers to
valuation reserve accounts.5 Includes franchise taxes computed on an income basis.
Note: Due to rounding, components may not add to totals.
Digitized for FRASER http://fraser.stlouisfed.org/ Federal Reserve Bank of St. Louis
STATISTICS OF BANKS
AND DEPOSIT INSURANCE
P A R T F I V E
Digitized for FRASER http://fraser.stlouisfed.org/ Federal Reserve Bank of St. Louis
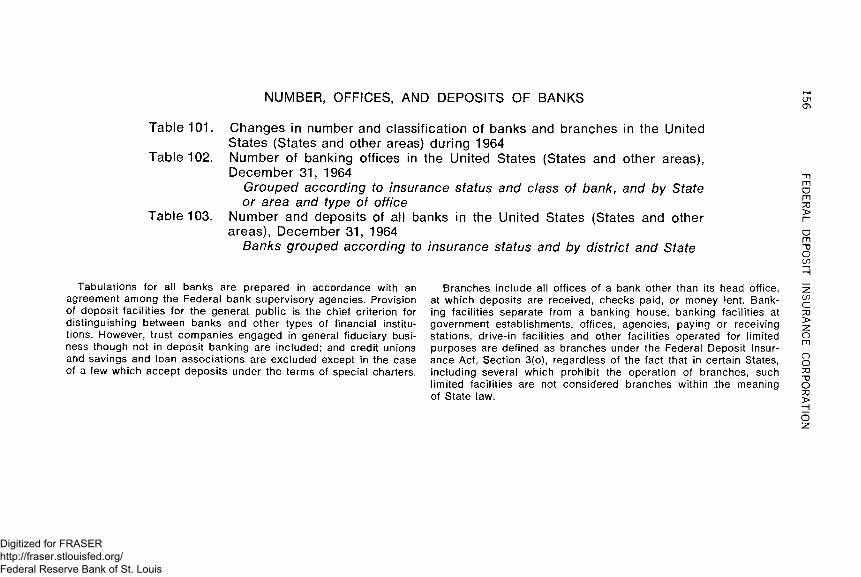
NUMBER, OFFICES, AND DEPOSITS OF BANKS
Table 101. Changes in number and classification of banks and branches in the United States (States and other areas) during 1964
Table 102. Number of banking offices in the United States (States and other areas), December 31, 1964
Grouped according to insurance status and class of bank, and by State or area and type of office
Table 103. Number and deposits of all banks in the United States (States and other areas), December 31, 1964
Banks grouped according to insurance status and by district and State
Tabulations for all banks are prepared in accordance with an agreement among the Federal bank supervisory agencies. Provision of deposit facilities for the general public is the chief criterion for distinguishing between banks and other types of financial institutions. However, trust companies engaged in general fiduciary business though not in deposit banking are included; and credit unions and savings and loan associations are excluded except in the case of a few which accept deposits under the terms of special charters.
Branches include all offices of a bank other than its head office, at which deposits are received, checks paid, or money lent. Banking facilities separate from a banking house, banking facilities at government establishments, offices, agencies, paying or receiving stations, drive-in facilities and other facilities operated for limited purposes are defined as branches under the Federal Deposit Insurance Act, Section 3(o), regardless of the fact that in certain States, including several which prohibit the operation of branches, such limited facilities are not considered branches within the meaning of State law.
156 FED
ERAL
DEPO
SIT IN
SUR
ANC
E C
OR
PO
RA
TION
Digitized for FRASER http://fraser.stlouisfed.org/ Federal Reserve Bank of St. Louis
Commercial and stock savings banks include the following categories of banking institutions:
National banks;Incorporated State banks, trust companies, and bank and trust
companies, regularly engaged in the business of receiving deposits, whether demand or time, except mutual savings banks;
Stock savings banks, including guaranty savings banks in New Hampshire;
Industrial and Morris Plan banks which operate under general banking codes, or are specifically authorized by law to accept deposits and in practice do so, or the obligations of which are regarded as deposits for deposit insurance;
Special types of banks of deposit: cash depositories in South Carolina; a cooperative exchange in Arkansas; a savings and loan company operating under Superior Court charter in Georgia; government operated banks in American Samoa, North Dakota, and Puerto Rico; a cooperative bank, usually classified as a credit union, operating under a special charter in New Hampshire; a savings institution, known as a “ trust company,” operating under special charter in Texas; an employes’ mutual banking association in Pennsylvania; the Savings Banks Trust Company in New York; and branches of foreign banks engaged in a general deposit business in New York, Oregon, Washington, Puerto Rico, and Virgin Islands.
Private banks under State supervision, and such other private banks as are reported by reliable unofficial sources to be engaged in deposit banking.
Nondeposit trust companies include institutions operating under trust company charters which are not regularly engaged in deposit banking but are engaged in fiduciary business other than that incidental to real estate title or investment activities.
Mutual savings banks include all banks operating under State banking codes applying to mutual savings banks.
Institutions excluded. Institutions in the following categories are excluded, though such institutions may perform many of the same functions as commercial and savings banks:
Banks which have suspended operations or have ceased to accept new deposits and are proceeding to liquidate their assets and pay off existing deposits;
Building and loan associations, savings and loan associations, credit unions, personal loan companies, and similar institutions, chartered under laws applying to such institutions or under general incorporation laws, regardless of whether such institutions are authorized to accept deposits from the public or from their members and regardless of whether such institutions are called “ banks” (a few institutions accepting deposits under powers granted in special charters are included) ;
Morris Plan companies, industrial banks, loan and investment companies, and similar institutions except those mentioned in the description of institutions included;
Branches of foreign banks, and private banks, which confine their business to foreign exchange dealings and do not receive “ deposits” as that term is commonly understood;
Institutions chartered under banking or trust company laws, but operating as investment or title insurance companies and not engaged in deposit banking or fiduciary activities;
Federal Reserve banks and other banks, such as the Federal Home Loan banks and the Savings and Loan Bank of the State of New York, which operate as rediscount banks and do not accept deposits except from financial institutions;
The postal savings system.
NU
MB
ER
, O
FFICE
S,
AND D
EPOSITS
OF BANKS
157
Digitized for FRASER http://fraser.stlouisfed.org/ Federal Reserve Bank of St. Louis
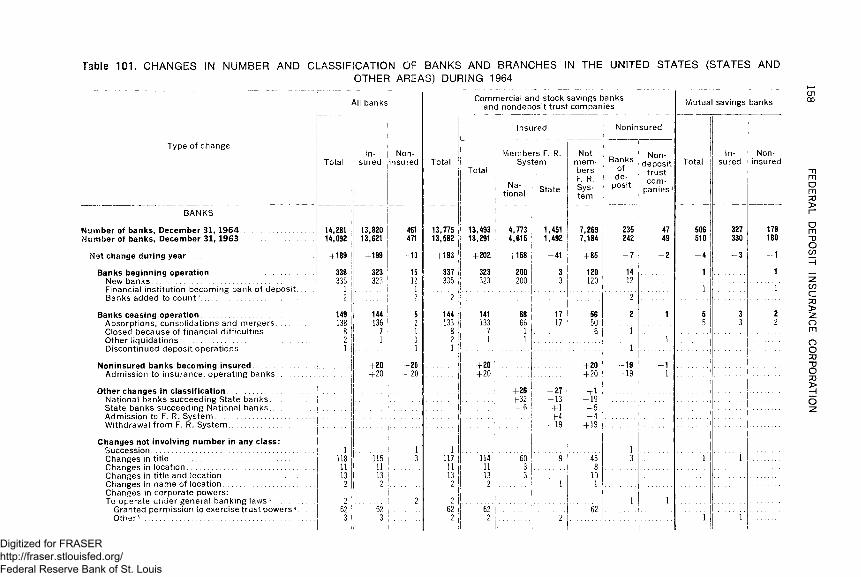
Table 101. CHANGES IN NUMBER AND CLASSIFICATION OF BANKS AND BRANCHES IN THE UNITED STATES (STATES ANDOTHER AREAS) DURING 1964
Type o f change
BANKS
N u m b e r o f banks, December 31, 1964 N u m b e r of banks, December 31, 1963
N e t change during year
Banks beginning ope ra tion .......................................New b a n k s .........................................................................F inancia l in s t itu tio n b e co m in g bank o f d e p o s it. Banks add ed to c o u n t2................................................
Banks ceasing ope ra tion ...................................A b s o rp tio n s , c o n so lid a tio n s and m e rg e rs . Closed because o f f in a n c ia l d iffic u ltie s .O ther l iq u id a t io n s .................................D isco n tin u e d d e p o s it o p e ra tio n s .
Noninsured banks becoming in su re d ...........A d m iss io n to in su ra n ce , o p e ra tin g banks
Other changes in c la ss ifica tio n ...................N a tion a l ban ks su cce e d in g S ta te b an ks . S ta te ban ks su cce e d in g N a tion a l ban ks .A d m iss io n to F. R. S y s te m ...........................W ith d ra w a l fro m F. R. S y s te m ....................
Changes not involving num ber in any class:S u cce ss io n .......................................................................Changes in t i t le .............................................................Changes in lo c a tio n .....................................................Changes in t itle and lo c a tio n ...................................C hanges in nam e o f lo c a tio n ...................................Changes in co rp o ra te pow ers:To ope ra te u nd er genera l b an k ing la w s :i..........
G ran ted p e rm iss io n to exerc ise t ru s t p o w e rs 4 O th e r5..................... .. .................................... ............
All banks
Total
14,28114,092
+189
33512
149138
1118
1 113
In sured
13,82013,621
+199
323323
Noninsured
144136
71
+ 2 0+ 2 0
1151 113
2
461471
- 1 0
- 2 0- 2 0
C om m ercia l and stock savings banks and n o n depos it t ru s t com panie s
Total
13,77513,582
+193
337335
144133
1117
1 113
2
262
2
Total
13,49313,291
+ 2 0 2
323323
141133
71
+ 2 0+ 2 0
1141 113
2
M em b ers F. R. System
Nationa l
4,7734,615
+158
200200
+26+32
- 6
State
1,4511,492
-27-1 3
+ 1+4
-1 9
Not m e m bers F. R. System
7,2697,184
+85
1 2 01 2 0
+ 2 0+ 2 0
+ 1-1 9
+ 5- 4
+19
N oninsured
Banksof
de pos it
235242
N onde p o s it
t ru s t co m
pan ies 1
- 1- 1
M utua l savings banks
Tota l
506510
In sured
327330
Noninsured
179180
158 FEDERAL
DEPOSIT
INSU
RAN
CE
CO
RPO
RA
TION
Digitized for FRASER http://fraser.stlouisfed.org/ Federal Reserve Bank of St. Louis

BRANCHES
Number of branches, December 31, 19646 Number of branches, December 31, 19636
Net change during year..............................
Branches opened for business..................................Facilities provided as agents o f the g o ve rn m e n t8Absorbed banks converted to b ranche s.................Branches rep lacing head offices re located...........O ther branches o p e n e d 9..............................................Branches added to c o u n t2...........................................
Branches d iscontinued...............Facilities..........................................B ranch es........................................Branches deleted fro m c o u n t11
Other changes in classification.....................................Branches changing class as resu lt of su c c e s s io n -
n e t ........................................................................................Branches of insured banks w ithdraw ing from F. R.
S ys te m ................................................................................Branches o f non insured banks adm itted to
in su ra n ce ...........................................................................Branches tra n s fe rre d th rough sale or as result of
a b s o rp tio n .........................................................................
Changes not involving number in any class:Branches tran sfe rred as resu lt of absorption or
succession.........................................................................Changes in title , location or name of loca tion..........Changes in ope ra ting powers of branches................
ALL BANKING OFFICES
Number of offices, December 31, 19646 Number of offices, December 31, 196367
Net change during year............................
Offices opened.B a n ks.............B ranch es.......
Offices closed.B a nks............B ra n ch e s ....
Changes in classification:Am ong b a n ks ....................Am ong b ra n ch e s............
15,44614,277
+1,169
1,2163
12514
1,0677
471
38
47281
6
29,72728,369
+1,358
1,554338
1,216
19614947
15,25214,087
+1,165
1,2083
12413
1,0617
471
38
+4
+3
+ 1
45281
6
29,07227,708
+1,364
1,531323
1,208
19114447
+24+ 2 0+4
194190
+4
655
14,77113,652
+1,119
1,1663
1 2 213
1 , 0 2 26
471
38
41274
6
28,54627,234
+1,312
1,503337
1,166
19114447
14,70313,585
+1,118
1,1623
1 2 212
1,0196
471
+3
+3
41274
6
28,19626,876
+1,320
1,485323
1,162
14147
+23+ 2 0+3
8,1817,434
+747
6792
853
5872
201
181
+ 8 8
+75
+ 13
27153
12,95412,049
+905
879200679
+114+26+ 8 8
3,3083,200
+108
194
1771
+3
4,7594,692
+67
1973
194
351718
-95-2 7
3,2142,951
+263
12 19
2553
1
-17
-1 7
+ 13
+3
-1 6
10,48310,135
+348
1 2 0289
569
+4+ 2 1-1 7
+ 1
4
-3
- 3
288294
- 2 2-1 9- 3
675625
+50
50
1,1811,135
+46
511
50
55
549502
+47
46
+ 1
+ 1
876832
+44
46
'46'
33
+ 1
+r
126123
+3
4. . . . .
. . . 3.
- 1
+ 2
514
22
- 1
’- i '
1 Includes one trust company member of the Federal Reserve System.2 Opened prior to 1964 but not included in the count as of December 31,1963.3 One private bank incorporated, and one nondeposit trust company amended its charter and began deposit banking.4 Information available only for insured banks not members of Federal Reserve System.5 Absorbtion of nonbanking financial institutions by insured banks.6 Includes a few seasonal offices of State banks members of the Federal Reserve System and insured State banks not members of the F.R.S. which were not in operation December 31,1964.7 Figures differ from those published in the annual report for 1963 due to reclassification of the following branches previously tabulated as insured not members of the Federal Reserve Svstem ■ Pacific Islands 3
to national; Puerto Rico, 11 to national, and 4 to State members; Virgin Islands, 4 to State members. ’8 Facilities established in or near military or other Federal Government installations at request of the Treasury Department or the commanding officer of the installation9 Excludes opening and closing of seasonal offices (except those newly established in 1964).
10 Closed prior to 1964 but included in count as of December 31, 1963.
NU
MBER
, O
FFICES,
AND DEPO
SITS OF
BANKS 159
Digitized for FRASER http://fraser.stlouisfed.org/ Federal Reserve Bank of St. Louis
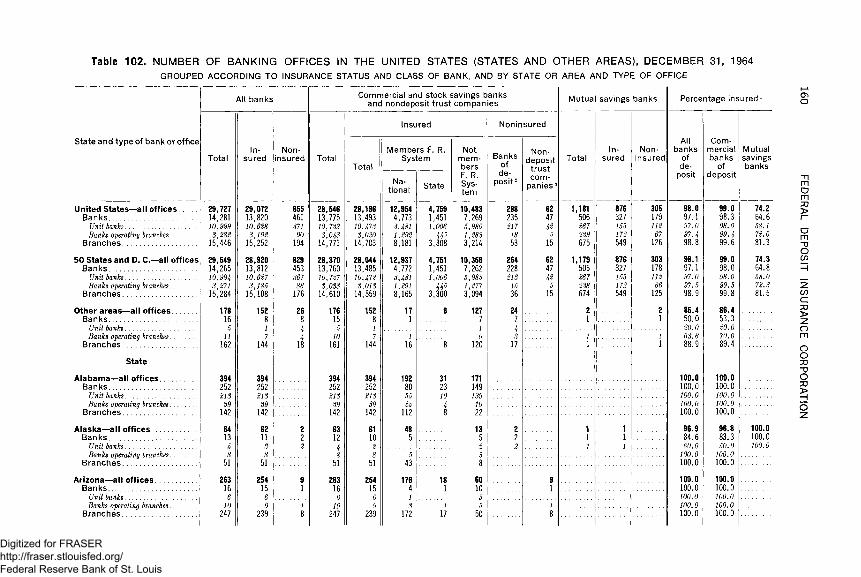
Table 102. NUMBER OF BANKING OFFICES IN THE UNITED STATES (STATES AND OTHER AREAS), DECEMBER 31, 1964GROUPED ACCORDING TO INSURANCE STATUS AND CLASS OF BANK, AND BY STATE OR AREA AND TYPE OF OFFICE
S tate and ty p e o f bank o r o ffice
All banks Com m ercia l and s tock savings banks and non deposit t ru s t com pan ie s
M u tu a l savings banks Percentage in s u re d 1
Tota lIn
su redN o n
insured Total
Insured N o n insured
Tota lIn
suredN o n
insured
Allbanks
o fde
posit
Com m ercia lbanks
o fd ep os it
M utualsavingsbanksTotal
M em beSys1
National
rs F. R. tem
State
Not m e m bers F. R. System
Banksof
d e p o s it2
N ond e p o s it
t ru s tco m
p a n ie s 3
United States—all offices 29,727 29,072 655 28,546 28,196 12,954 4,759 10,483 288 62 1,181 876 305 98.0 99.0 74.2B a n k s ............................................ 14,281 13,820 461 13,775 13,493 4,773 1,451 7,269 235 47 506 327 179 97.1 98.3 64.6
Unit banks.............................. 1 0 ,9 9 9 1 0 ,6 2 8 371 1 0 ,7 3 2 1 0 ,4 7 3 3 ,4 81 1 ,0 0 6 5 ,9 8 6 217 42 267 155 112 9 7 .0 9 8 .0 58 .1
Banks operating branches........... 3 ,2 8 2 3 ,1 9 2 90 3 ,0 4 3 3 ,0 2 0 1 ,2 9 2 445 1 ,2 8 3 18 5 239 172 67 9 7 .4 9 9 .4 7 2 .0
B ra n c h e s ..................................... 15,446 15,252 194 14,771 14,703 8,181 3,308 3,214 53 15 675 549 126 98.8 99.6 81.3
50 States and D. C.—all offices 29,549 28,920 629 28,370 28,044 12,937 4,751 10,356 264 62 1,179 876 303 98.1 99.0 74.3B a n k s ............................................ 14,265 13,812 453 13,760 13,485 4,772 1,451 7,262 228 47 505 327 178 97.1 98.0 64.8
Unit banks.............................. 1 0 ,9 9 4 1 0 ,6 2 7 367 1 0 ,7 2 7 1 0 ,4 7 2 3 ,4 81 1 ,0 0 6 5 ,9 8 5 213 42 267 155 112 9 7 .0 9 8 .0 5 8 .0
Banks operating branches........... 3 ,2 7 1 3 ,1 8 5 86 3 ,0 3 3 3 ,0 1 3 1 ,291 445 1 ,2 7 7 15 5 238 172 66 9 7 .5 9 9 .5 7 2 .3
B ra n c h e s ..................................... 15,284 15,108 176 14,610 14,559 8,165 3,300 3,094 36 15 674 549 125 98.9 99.8 81.5
Other areas—all offices ....... 178 152 26 176 152 17 8 127 24 2 2 85.4 86.4B a n k s ............................................ 16 8 8 15 8 1 7 7 1 1 50.0 53.3
Unit banks 1 4 5 1 1 4 20.0 20.0Banks operating branches 11 7 A 10 7 1 6 3 1 1 6 3 .6 7 0 .0
B r a n c h e s ............... 162 144 18 161 144 16 8 120 17 1 1 88.9 89.4
State
Alabama—all offices 394 394 394 394 192 31 171 100.0 100.0B a n k s ............................................ 252 252 252 252 80 23 149 100.0 100.0
Unit banks 213 213 213 213 55 19 139 100.0 100.0Banks operating branches 39 39 39 39 25 4 10 100.0 100.0
B ra n c h e s ..................................... 142 142 142 142 112 8 22 100.0 100.0
Alaska—all o f f ic e s ................ 64 62 2 63 61 48 13 2 1 1 96.9 96.8 100.0B a n k s ............................................ 13 11 2 12 10 5 5 2 1 1 84.6 83.3 100.0
Unit banks.............................. 5 3 2 4 2 2 1 1 6 0 .0 5 0 .0 100.0Banks operating branches........... 8 8 8 8 5 3 100.0 100.0
B ra n ch e s ................................. 51 51 51 51 43 8 100.0 100.0
Arizona—all offices................... 263 254 9 263 254 176 18 60 9 100.0 100.0B a n k s ............................................ 16 15 1 16 15 4 1 10 1 100.0 100.0
Unit banks . . 6 6 6 6 1 5 100.0 100.0Banks operating branches 10 9 1 10 9 3 1 5 1 100.0 100.0
B ranches .................... 247 239 8 247 239 172 17 50 8 100.0 100.0
160 FEDERAL
DEPOSIT
INSU
RAN
CE
CO
RP
OR
ATIO
N
Digitized for FRASER http://fraser.stlouisfed.org/ Federal Reserve Bank of St. Louis
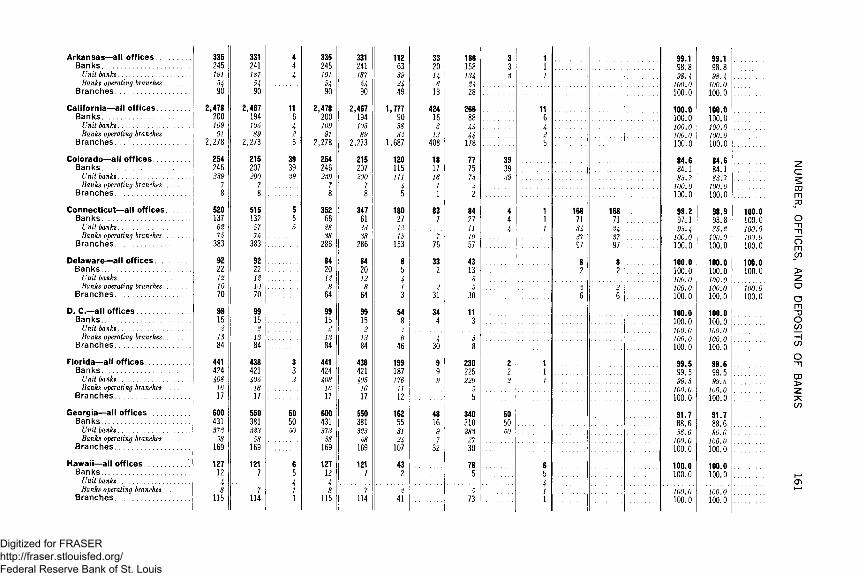
Arkansas—all offices............... 335 331 4B a n k s ............................................ 245 241 4
Unit banks.............................. 191 187 454 54
B ra n c h e s ..................................... 90 90
California—all offices............... 2,478 2,467 11B a n k s ............................................ 200 194 6
Unit banks.............................. 109 105 4Banks operating branches........... 91 89 2
B ra n c h e s ............................... 2,278 2,273 5
Colorado—all offices................ 254 215 39B a n k s ............................................ 246 207 39
Unit banks.............................. 239 200 397 7
B ra n c h e s ..................................... 8 8
Connecticut—all offices........... 520 515 5B a n k s ............................................ 137 132 5
Unit banks.............................. 62 57 ,575 75
B ra n c h e s ..................................... 383 383
Delaware—all offices................ 92 92B a n k s ............................................ 22 22
Unit banks. . ................. 12 12Banks operating branches........... 10 10
B ra n c h e s ..................................... 70 70
D. C.—all offices........................ 99 99B a n k s ............................................ 15 15
Unit banks........................... 2Banks operating branches........... 13 13
B ra n c h e s ..................................... 84 84
Florida—all offices.................... 441 438 3B a n k s ............................................ 424 421 3
Unit banks.............................. 408 405 3Banks operating branches........... 16 16
B ra n c h e s ..................................... 17 17
Georgia—all offices.................. 600 550 50B a n k s ............................................ 431 381 50
Unit banks.............................. 3 73 323 50Banks operating branches........... 58 58
B ra n c h e s ..................................... 169 169
Hawaii—all offices.................. 127 121 6B a n k s ............................................ 12 7 5
Unit banks............................. 4 4Banks operating branches........... 8 7 1
B ra n c h e s ..................................... 115 114 1
335 331 112245 241 63191 187 3954 54 2490 90 49
2,478 2,467 1,777200 194 90109 105 58
91 89 322,278 2,273 1,687
254 215 120246 207 115239 200 111
7 7 48 8 5
352 347 18066 61 2728 23 1238 38 15
286 286 153
84 84 820 20 512 12 4
8 8 164 64 3
99 99 5415 15 8
2 2 213 13 684 84 46
441 438 199424 421 187408 405 176
16 16 1117 17 12
600 550 162431 381 55373 323 31
58 58 24169 169 107
127 121 4312 7 248 7 2
115 114 41
42416
313
408
18171611
186 3 1 99.1 99.1158 3 1 98.8 98.8134 3 1 9 8 .4 9 8 .424 1 0 0 .0 1 0 0 .028 100.0 100.0
266 11 100.0 100.088 6 100.0 100.044 4 1 0 0 .0 1 0 0 .0
44 2 1 0 0 .0 100.0178 5 100.0 100.0
77 39 84.6 84.675 39 84.1 84.173 39 8 3 .7 8 3 .7
2 1 0 0 .0 1 0 0 .02 100.0 100.0
84 4 1 168 168 99.2 98.9 100.027 4 1 71 71 97.1 93.8 100.011 4 1 34 34 9 3 .4 8 5 .2 100.016 37 37 1 0 0 .0 1 0 0 .0 100.057 97 97 100.0 100.0 100.0
43 8 8 100.0 100.0 100.013 2 2 100.0 100.0 100.0
8 100.0 1 0 0 .02 2 100.0 1 0 0 .0 100.0
30 6 6 100.0 100.0 100.0
11 100.0 100.03 100.0 100.0
100.0 1 0 0 .03 100.0 1 0 0 .08 100.0 100.0
230 2 1 99.5 99.5225 2 1 99.5 99.5220 2 1 99.5 9 9 .5
100.0 1 0 0 .05 100.0 100.0
340 50 91.7 91.7310 50 88.6 88.6283 50 8 6 .6 8 6 .6
27 1 0 0 .0 1 0 0 .030 100.0 100.0
78 6 100.0 100.05 5 100.0 100.0
4j 1 100 .0 100 0
73 1 100.0 100.0
NU
MB
ER
, O
FFICES,
AND DEPO
SITS OF
BANKS 161
Digitized for FRASER http://fraser.stlouisfed.org/ Federal Reserve Bank of St. Louis
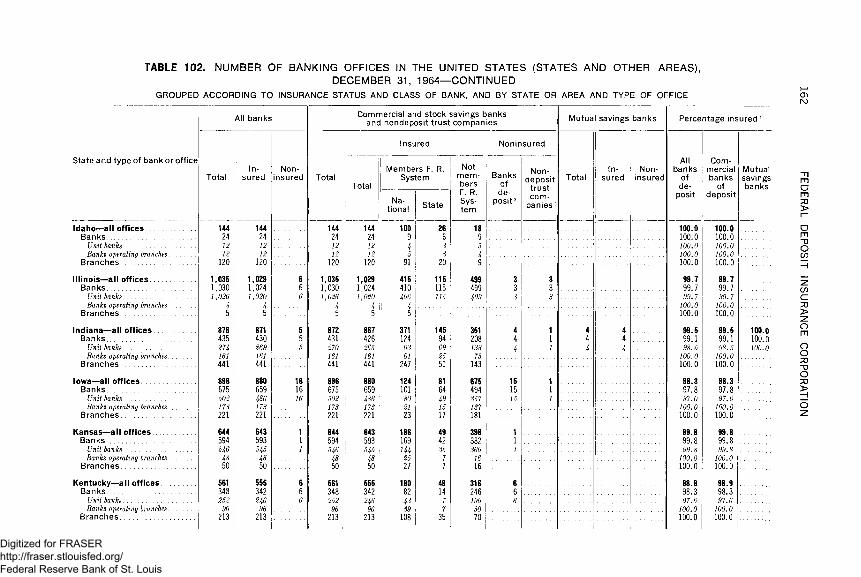
TABLE 102. NUMBER OF BANKING OFFICES IN THE UNITED STATES (STATES AND OTHER AREAS),DECEMBER 31, 1964— CONTINUED
GROUPED ACCORDING TO INSURANCE STATUS AND CLASS OF BANK, AND BY STATE OR AREA AND TYPE OF OFFICE
All banks Com m ercia l and s tock savings banks and non deposit t ru s t com pan ie s M utu a l savings banks
Insured N oninsured
T ota lIn
su redN on
insu re d TotalTotal
M em bers F. R. System
Notm e m bers
Banksof
N ond e p o s it
tru s tco m
p a n ie s 3
Tota lIn
suredN on
insured
Nationa l State
F. R. System
de p o s it2
144 144 144 144 100 26 1824 24 24 24 9 6 912 12 12 12 4 3 512 12 12 12 5 3 4
120 120 120 120 91 20 9
1,0351,0301 ,0 2 6
4
1,0291,0241,020
6 1,0351,0301 ,0 2 6
1,0291,0241,020
4
415 115 499 3 36 410 115 499 3 36 406 115 499 3 3
4 4 45 5 5 5 5
876 871 5 872 867 371 145 351 4 1 4 4435 430 5 431 426 124 94 208 4 1
14 4
274 269 5 270 265 63 69 133 4 4 4161 161 161 161 61 25 75441 441 441 441 247 51 143
896 880 16 896 880 124 81 675 15 1675 659 16 675 659 101 64 494 15 1502 486 16 502 486 80 49
15357 15 1
173 173 173 173 21 137221 221 221 221 23 17 181
644 643 1 644 643 196 49 398 1594 593 1 594 593 169 42 382 1
154648
545 1 54648
54548
14425
35 36648 7 16
50 50 50 50 27 1 16
561 555 6 561 555 190 49 316 6348 342 6 348 342 82 14 246 6252 246 6 252 246 43 7 196 6
96 96 96 96 39 7 50213 213 213 213 108 35 70
Sta te and typ e o f ban k o r o ffice
Percentage in s u re d 1
Allbanks
ofde
posit
Com m ercia lbanks
ofde p o s it
M utua lsavingsbanks
100.0 100.0100.0 100.0100.0 100.0100.0 100.0100.0 100.0
99.7 99.799.7 99.799.7 99.7
100.0 100.0100.0 100.0
99.5 99.5 100.099.1 99.1 100.09 8 .5 9 8 .5 100.0
1 0 0 .0 1 0 0 .0100.0 100.0
98.397.8
98.397.8
9 7 .0 9 7 .01 0 0 .0 1 0 0 .0100.0 100.0
99.8 99.899.8 99.89 9 .8 9 9 .8
1 0 0 .0 1 0 0 .0100.0 100.0
98.9 98.998.3 98.39 7 .6 9 7 .6
1 0 0 .0 1 0 0 .0100.0 100.0
Idaho— all o ffice s .........Banks...........................
Unit banks..................Banks operating branches
Branches.....................
Illino is— a ll o ffices.......B anks...........................
Unit banks..................Banks operating branches
Branches.....................
Indiana— all offices. . . .Banks...........................
Unit banks..................Banks operating branches
Branches.....................
Iowa— all o ffices...........Banks...........................
Unit banks.................Banks operating branches
Branches.....................
Kansas— a ll o ffice s......Banks...........................
Unit banks.................Banks operating branches
Branches.....................
Kentucky— all officesBanks...........................
Unit banks...................Banks operating branches
B ranches.....................
162 FEDERAL
DEPOSIT
INSU
RAN
CE
CO
RP
OR
ATIO
N
Digitized for FRASER http://fraser.stlouisfed.org/ Federal Reserve Bank of St. Louis
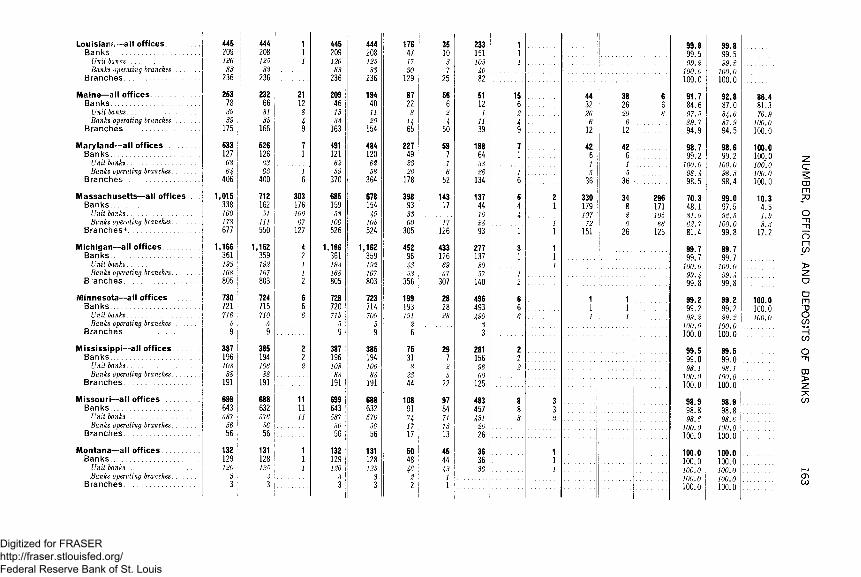
L o u is ia n a -a ll o ffic e s ...............Banks........................................
Unit banks..............................Banks operating branches...........
Branches..................................
Maine— all o ffice s ......................Banks........................................
Unit banks...............................Banks operating branches...........
Branches..................................
Maryland— all o ffic e s ...............Banks. .....................................
Unit banks...............................Banks operating branches...........
Branches..................................
Massachusetts— all o ffic e s ....Banks........................................
Unit banks...............................Banks operating branches...........
Branches4................................
M ichigan— all o ffice s ................Banks........................................
Unit banks...............................Banks operating branches...........
B ranches..................................
M innesota— all o ffice s .............Banks........................................
Unit banks...............................Banks operating branches.........
Branches..................................
M ississipp i— all o ffice s ............Banks........................................
Unit banks...............................Banks operating branches...........
Branches............................
M issouri— a ll o ffice s .................Banks...................................... .
Unit banks...............................Banks operating branches.........
Branches..................................
Montana— all o ffic e s .................Banks........................................
Unit banks...............................Banks operating branches...........
Branches..................................
445 444209 208126 125
83 83236 236
253 23278 6639 3139 35
175 166
533 526127 126
63 6364 63
406 400
1,015 712338 162160 51178 111677 550
1,166 1,162361 359193 192168 167805 803
730 724721 715716 710
5 59 9
387 385196 194108 106
88 88191 191
699 688643 632587 576
56 5656 56
132 131129 128126 125
3 33 3
1 4451 2091 126
83236
21 20912 46
8 13
4 339 163
7 4911 121
621 596 370
303 685176 159109 53
67 106127 526
4 1,1662 3611 1931 1682 805
6 7296 7206 715
59
2 3872 1962 108
88191
11 69911 64311 587
5656
1 1321 1291 126
33
444 176208 47125 1783 30
236 129
194 8740 2211 829 H
154 65
484 227120 49
62 2358 26
364 178
678 398154 93
49 33105 60524 305
1,162 452359 96192 43167 53803 356
723 199714 193709 191
5 29 6
385 75194 31106 8
88 23191 44
688 108632 91576 74
56 1756 17
131 50128 48125 46
3 23 2
14317
17126
433126
6957
307
2828
233 1151 1105 1
4682
51 15 44 38 612 6 32 26 6
1 2 26 20 611 4 6 639 9 12 12
198 7 42 4264 1 6 638 1 126 1 5 5
134 6 36 36
137 5 2 330 34 29644 4 1 179 8 17116 4 107 2 10528 1 72 6 6693 1 1 151 26 125
277 3 1137 1 1
80 157 1
140 2
496 6 1 1493 6 1 1490 6 1 1
3
281 2156 2
96 260
125
483 8 3457 8 3431 8 3
2626
36 136 136 1
99.899.59 9 .2
100.0 100.0
91.784.6 9 7 .58 9 .794.9
98.799.2
100.09 8 .498.5
70.348.13 1 .96 2 .781.4
99.799.7
100.09 9 .499.8
99.299.29 9 .2
100.0 100.0
99.599.09 8 .1
100.0 100.0
100.0100.0
100.0100.01 0 0 . 0100.0100.0
99.59 9 .2
100.0 100.0
92.887.08̂ .68 7 .994.5
98.699.2
1 0 0 . 09 8 .398.4
99.097.59 2 .5
100.099.8
99.799.7
100.09 9 .499.8
99.299.29 9 .2
100.0 100.0
99.599.09 8 .1
100.0 100.0
100.0100.0
100.0100.0100.01 0 0 . 0100.0
86.481.37 6 .9
100.0100.0
100.0100.010 0 . 0100.0100.0
10.34.51 .98 .3
17.2
100.0100.0100.0
NU
MB
ER
, O
FFICES,
AND DEPO
SITS OF
BANKS 163
Digitized for FRASER http://fraser.stlouisfed.org/ Federal Reserve Bank of St. Louis
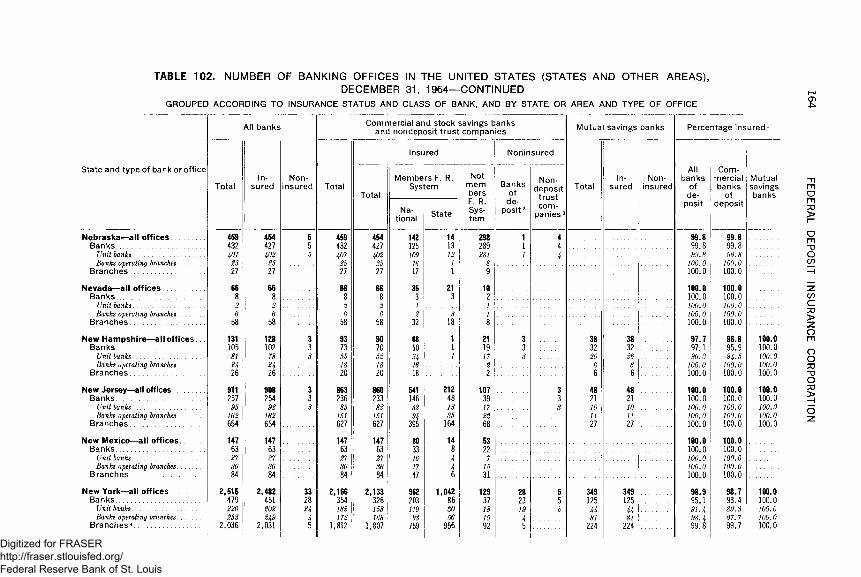
TABLE 102. NUMBER OF BANKING OFFICES IN THE UNITED STATES (STATES AND OTHER AREAS),DECEMBER 31, 1964— CONTINUED
GROUPED ACCORDING TO INSURANCE STATUS AND CLASS OF BANK, AND BY STATE OR AREA AND TYPE OF OFFICE
State and type o f bank o r o ffice
All banks C om m ercia l and s tock savings banks and non deposit t ru s t com pan ie s
Insured N on insured
Tota lIn
su redN on
in su re d TotalTotal
M em bers F. R. System
Notm e m bers
Banksof
N ond e p o s it
t ru s tco m
p a n ie s 3
TotalIn
suredNon
insured
National
State
F. R. Syste m
de p o s it2
459 454 5 459 454 142 14 298 1 4432 427 5 432 427 125 13 289 1
14
40725
402 5 40725
402 109 121
281 425 25 16 8
27 27 27 27 17 1 9
66 66 66 66 35 21 108 8 8 8 3 3 2
12 2 2 2 16 6 6 6 3 1
58 58 58 58 32 18 8
131 128 3 93 90 68 1 21 3 38 38105 102 3 73 70 50 1 19 3 32 32
81 78 3 55 52 34 1 17 3 26 2624 24 18 18 16 6 626 26 20 20 18 2 6 6
911 908 3 863 860 541 212 107 3 48 48257 254 3 236 233 146 48 39 3 21 21
95 92 85 82 52 13 17 3 10 10162 162 151 151 94 35 22 11 11654 654 627 627 395 164 68 27 27
147 147 147 147 80 14 5363 63 63 63 33 8 2227 27 27 27 16 4 736 36 36 36 17 4 1584 84 84 84 47 6 31
2,515479
2,482 33 2,166354
2,133326
962 1,04286
129 28 5 349 349451 28 203 37 23 5 125 125202 24 182 158 n o 30 18 19 5 44
814481253 249 4 172 168 93 56 19 4
2,036 2,031 5 1,812 1,807 759 956 92 5 224 224
M utu a l savings banks Percentage in s u re d 1
Allbanks
ofde
posit
C om m ercia lbanks
ofd ep os it
99.8 99.899.8 99.89 9 .8 9 9 .8
100.0 100.0100.0 100.0
100.0 100.0100.0 100.0100.0 100.0100.0 100.0100.0 100.0
97 .7 96.897.1 95.99 6 .3 9 4 .5
100.0 100.0100.0 100.0
100.0 100.0100.0 100.0100.0 100.0100.0 100.0100.0 100.0
100.0 100.0100.0 100.0100.0 100.0100.0 100.0100.0 100.0
98.9 98.795.1 93.491.4 8 9 .3
9 8 .4 9 7 .799.8 99.7
M utualsavingsbanks
Nebraska—all offices.........B a n k s ......................................
Unit banks.........................Banks operating branches......
B ra n c h e s ...............................
Nevada—all offices.............B a n k s ......................................
Unit banks.........................Banks operating branches......
B ra n c h e s ...............................
New Hampshire—all officesB a n k s ......................................
Unit banks.........................Banks operating branches......
B ra n c h e s ...............................
New Jersey—all offices.........B a n k s ......................................
Unit banks.........................Banks operating branches......
B ra n c h e s ...............................
New Mexico—all o ffices....B a n k s ......................................
Unit banks..........................Banks operating branches......
B ra n c h e s ...............................
New York—all offices..........B a n k s ......................................
Unit banks.........................Banks operating branches......
B ra n c h e s 4. . .........................
100.0100.0100.0100.0100.0
100.0100.0100.0100.0100.0
100.0100.0100.0100.0100.0
164 FEDERAL
DEPOSIT
INSU
RAN
CE
CO
RP
OR
ATIO
N
Digitized for FRASER http://fraser.stlouisfed.org/ Federal Reserve Bank of St. Louis
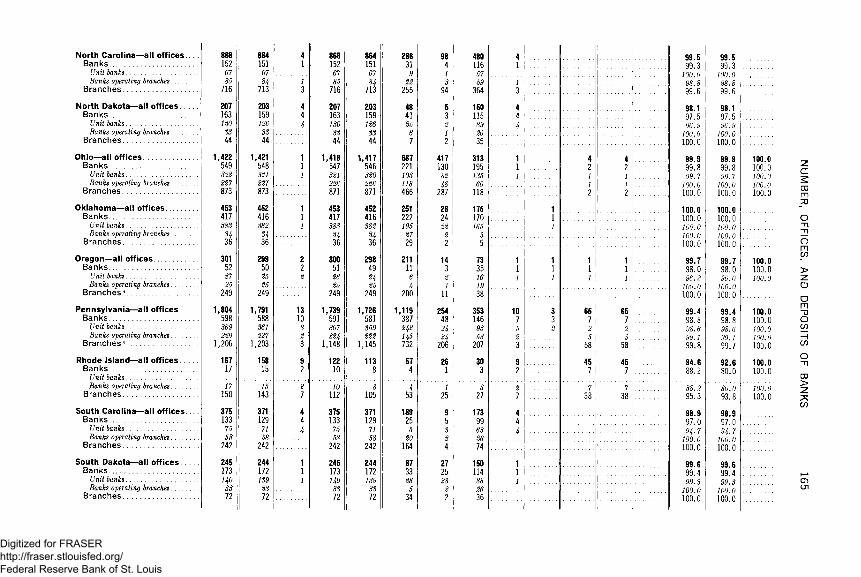
North Carolina—ail o ffices.... 868 864 4 868 864 286 98B a n k s ............................................ 152 151 1 152 151 31 4
67 67 67 67 9 jBanks operating branches........... 85 84 1 85 84 22
B ra n c h e s ..................................... 116 713 3 716 713 255 94
North Dakota—all offices........ 207 203 4 207 203 48 5B a n k s ............................................ 163 159 4 163 159 41 3
Unit banks.............................. 130 126 4 130 126 35 2Banks operating branches........... 33 33 33 33 6 \
B ra n c h e s ..................................... 44 44 44 44 7 2
Ohio—all offices......................... 1,422 1,421 1 1,418 1,417 687 417B a n k s ............................................ 549 548 1 547 546 221 130
Unit banks.............................. 322 321 1 321 3 20 103 82Banks operatinq branches........... 227 227 226 226 118 48
B ra n c h e s ...................................... 873 873 871 871 466 287
Oklahoma—all offices.............. 453 452 1 453 452 251 26B a n k s ............................................ 417 416 1 417 416 111 24
Unit banks............................... 383 382 1 383 382 195 22Banks operating branches........... 34 34 34 34 27 2
B ra n c h e s ..................................... 36 36 36 36 29 2
Oregon—all offices.................... 301 299 2 300 298 211 14B a n k s ............................................ 52 50 2 51 49 11 3
Unit banks............................... 27 25 2 26 24 6 2Banks operating branches........... 25 25 25 25 5 1
B ra n c h e s 4................................... 249 249 249 249 200 11
Pennsylvania—all offices........ 1,804 1,791 13 1,739 1,726 1,119 254B a n k s ............................................ 598 588 10 591 581 387 48
Unit banks............................... 369 361 8 367 3 59 242 24Banks operating branches........... 229 227 2 224 222 145 24
B ra n c h e s 4.................................... 1,206 1,203 3 1,148 1,145 732 206
Rhode Island—all offices........ 167 158 9 122 113 57 26B a n k s ............................................ 17 15 2 10 8 4 1
Unit banks...............................Banks operating branches........... 17 15 2 10 8 4 1
B ra n c h e s ..................................... 150 143 7 112 105 53 25
South Carolina—all offices__ 375 371 4 375 371 189 9B a n k s ............................................ 133 129 4 133 129 25 5
Unit banks............................... 75 71 4 75 71 5 3Banks operating branches........... 58 58 58 58 20 2
B ra n c h e s ...................................... 242 242 242 242 164 4
South Dakota—all offices 245 244 1 245 244 67 27B a n k s ............................................ 173 172 1 173 172 33 25
Unit banks............................... 140 139 1 140 139 28 23Banks operating branches........... 33 33 33 3 3 5 2
B ra n c h e s ...................................... 72 72 72 72 34 1
480 4116 1
5759 1
364 3
150 4115 4
89 42635
313 1 4 4195 1 2 2
1135 1 160 1 1
118 2 2
175 1170 1
116555
73 1 1 1 135 1 1 1
11116 1 1
1938
353 10 3 65 65146 7 3 7 7
93 5 3 2 253 2 5 5
207 3 58 58
30 9 45 453 2 7 7
3 2 7 727 7 38 38
173 499 463 43674
150 1114 1
88 12636
99.599.3
1 0 0 . 09 8 .899.6
98.197.59 6 .9
100.0 100.0
99.999.89 9 .7
100.0 100.0
100.0100.0100.0100.0100.0
99.798.09 6 .2
100.0 100.0
9 8 .69 9 .1 99.8
94.688 .2
99.599.3
100.09 8 .899.6
98.197.59 6 .9
100.0 100.0
99.999.89 9 .7
100.0 100.0
100.0100.0100.0100.0100.0
99.798.09 6 .0
100.0 100.0
99.498.89 8 .69 9 .199.7
92.680.0
100.0100.0100.0100.0100.0
100.0100 .0100.0
100.0100.0100.0100.0100.0
100.0100.0
95.3
98.997.09 4 .7
100.0100.0
99.4
100.0100.0
8 0 .093.8
98.997.09 4 .7
100.0100.0
99.49 9 .3
100.0100.0
100.0100.0
NU
MB
ER
, O
FFICES,
AND DEPO
SITS OF
BANKS 165
Digitized for FRASER http://fraser.stlouisfed.org/ Federal Reserve Bank of St. Louis
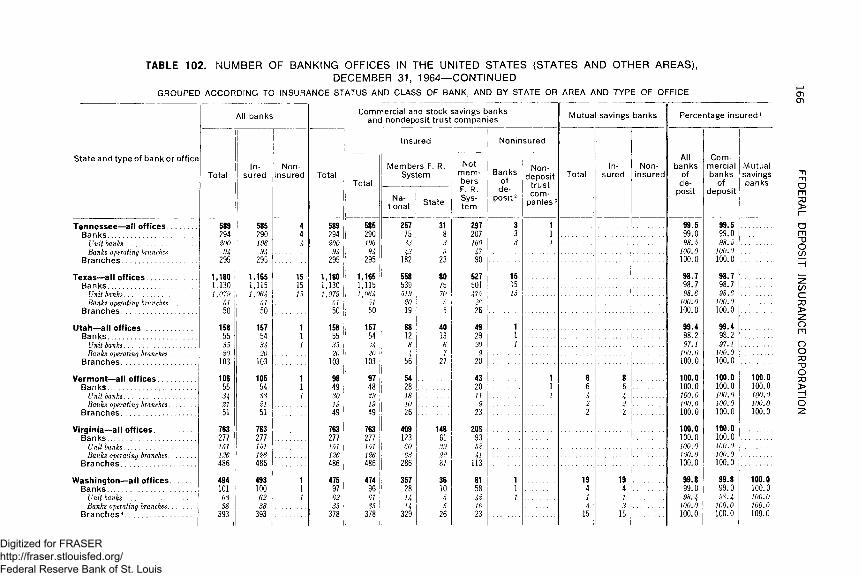
TABLE 102. NUMBER OF BANKING OFFICES IN THE UNITED STATES (STATES AND OTHER AREAS),DECEMBER 31, 1964— CONTINUED
GROUPED ACCORDING TO INSURANCE STATUS AND CLASS OF BANK, AND BY STATE OR AREA AND TYPE OF OFFICE
All banksCom m ercia l and stock savings banks
and non depos it t ru s t com pan ie sM utu a l savings banks Percentage in s u re d 1
Insured N on insured
In su red
N oninsured Total
Total
M em bers F. R. System
Notm e m bers
Banksof
N ond e p o s it
tru s tco m
p a n ie s 3
TotalIn
suredN on
insured
Allbanks
ofd e
Com m ercia lbanks
o f
M utualsavingsbanks
Nationa l S ta te
F. R.System
de p o s it2
posit d ep os it
585 4 589 585 257 31 297 3 1 99.5 99.5290 4 294 290 75 8 207 3 1 99.0 99.0196 4 200 196 33 3 160 3 1 9 8 .5 9 8 .5
94295
94 94295
42 4790
1 0 0 .0 1 0 0 .0
295 182 23 100.0 100.0
1,1651,1151 ,0 6 4
51
15 1,1801,1301 ,0 7 9
51
1,1651,1151 ,0 6 4
51
558 80 527 15 98.7 98.715 539 75 501 15 98.7 98.715 519 70 475 15 9 8 .6 9 8 .6
20 26 100.0 1 0 0 .0
50 50 50 19 5 26 100.0 100.0
157 11
15855S3
157 68 40 49 1 99.4 99.454 54 12 13 29 1
198.2 98.2
3420
I 8 6 20 9 7 .1 9 7 .1
20 20 4 7 9 1 0 0 .0 1 0 0 .0
103 103 103 56 27 20 100.0 100.0
105 11
98 97 54 43 1 8 8 100.0 100.0 100.054 49 48 28 20 1 6 6 100.0 100.0 100.033 i 30 29 18 U 1 4 4
21 0 0 .0 1 0 0 .0 1 0 0 .0
21 19 19 10 9 2 1 0 0 .0 1 0 0 .0 1 0 0 .0
51 49 49 26 23 2 2 100.0 100.0 100.0
763 763 763 409 148 2QS 100.0 100.0277 277 111 123 61 93 100.0 100.0151 151 151 60 39 52 1 0 0 .0 1 0 0 .0
126 126 126 63 22 41113
1 0 0 .0 1 0 0 .0
486 486 486 286 87 100.0 100.0
493 1 475 474 357 36 81 1 19 19 99.8 99.8 100.0100 1 97 96 28 10 58 1 4 4 99.0 99.0 100.0
62 1 62 61 1414
329
42 1 1 1 9 8 .41 0 0 .0
9 8 .41 0 0 .0
1 0 0 .0
38 35 35 5 16 3 3 1 0 0 .0
393 378 378 26 23 15 15 100.0 100.0 100.0
S ta te and typ e o f bank o r o ffice
Tennessee—all offices.B a n k s ...............................
Unit banks.................Banks operating branches.
B ra n c h e s . .....................
Texas—-all offices.......B a n k s ................................
Unit banks...................Banks operating branches.
B ra n c h e s .........................
Utah—all offices.............B a n k s ................................
Unit banks...................Banks operating branches.
B ra n c h e s .........................
Vermont—all offices.. . .B a n k s ................................
Unit banks...................Banks operating branches.
B ra n c h e s .........................
Virginia—all offices.......B a n k s ................................
Unit banks...................Banks operating branches.
B ra n c h e s .........................
Washington—all offices.B a n k s ................................
Unit banks.....................Banks operating branches. .
B ra n c h e s 4.......................
Total
589294200H
295
1,1801.1301,07.9
5150
158553520
103
10655342151
763277151126
494101
63
393
166 FEDERAL
DEPOSIT
INSU
RAN
CE
CO
RPO
RA
TION
Digitized for FRASER http://fraser.stlouisfed.org/ Federal Reserve Bank of St. Louis
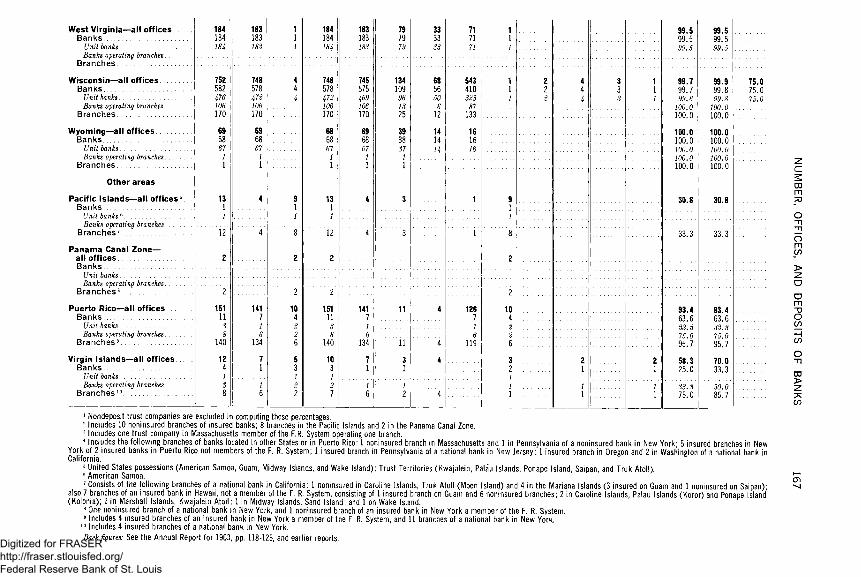
West Virginia—all offices.B a n k s ....................................
Unit banks........................Banks operating branches
B ra n c h e s .............................
18418418 4
183183183
184184184
183183183
99.599.59 9 .5
99.599.59 9 .5
Wisconsin—all offices...B a n k s ................................
Unit banks...................Banks operating branches.
B ra n c h e s .........................
Wyoming—all offices__B a n k s ................................
Unit banks...................Banks operating branches.
B ra n c h e s .........................
Other areas
Pacific Islands—all offices5.B a n k s ........................................
Unit banks6..........................Banks operating branches........
B ra n c h e s 7...............................
Panama Canal Zone— all offices......................B a n k s ................................
Unit banks.....................Banks operating branches.
B ra n c h e s 8.......................
752582476106170
748578
106170
748578472106170
745575469106170
134109
961325
543410323
87133
161616
99.799.7 9 9 .6
100.0100.0
100.0100.0100.0100.0100.0
30.8
33.3
99.999.89 9 .8
100.0 100.0
100.0100.0100.0100.0100.0
30.8
33.3
75.075.07 5 .0
Puerto Rico—all offices.B a n k s ................................
Unit banks.....................Banks operating branches..
B ra n c h e s 9.......................
Virgin Islands—all offices.B a n k s ....................................
Unit banks........................Banks operating branches....
B ra n c h e s 10..........................
15111
3 8
140
124 /3
141716
134
15111
38
140
1031
141716
134
71
126716
119
93.463.63 3 .37 5 .095.7
58.325.0
93.463.63 3 .37 5 .095.7
70.033.3
3 3 .375.0
5 0 .085.7
1 Nondeposit trust companies are excluded in computing these percentages.2 Includes 10 noninsured branches of insured banks; 8 branches in the Pacific Islands and 2 in the Panama Canal Zone.3 Includes one trust company in Massachusetts member of the F.R. System operating one branch.4 Includes the following branches of banks located in other States or in Puerto Rico: 1 noninsured branch in Massachusetts and 1 in Pennsylvania of a noninsured bank in New York; 5 insured branches in New
York of 2 insured banks in Puerto Rico not members of the F. R. System; 1 insured branch in Pennsylvania of a national bank in New Jersey; 1 insured branch in Oregon and 2 in Washington of a national bank in California.
5 United States possessions (American Samoa, Guam, Midway Islands, and Wake Island); Trust Territories (Kwajalein, Palau Islands, Ponape Island, Saipan, and Truk Atoll).6 American Samoa.7 Consists of the following branches of a national bank in California: 1 noninsured in Caroline Islands, Truk Atoll (Moen Island) and 4 in the Mariana Islands (3 insured on Guam and 1 noninsured on Saipan);
also 7 branches of an insured bank in Hawaii, not a member of the F. R. System, consisting of 1 insured branch on Guam and 6 noninsured branches; 2 in Caroline Islands, Palau Islands (Koror) and Ponape Island (Kolonia); 2 in Marshall Islands, Kwajalein Atoll: 1 in Midway Islands, Sand Island; and 1 on Wake Island.
8 One noninsured branch of a national bank in New York, and 1 noninsured branch of an insured bank in New York a member of the F. R. System.9 Includes 4 insured branches of an insured bank in New York a member of the F. R. System, and 11 branches of a national bank in New York.
10 Includes 4 insured branches of a national bank in New York.Back figures: See the Annual Report for 1963, pp. 118-125, and earlier reports.
NU
MB
ER
, O
FFICES,
AND DEPO
SITS OF
BANKS 167
Digitized for FRASER http://fraser.stlouisfed.org/ Federal Reserve Bank of St. Louis
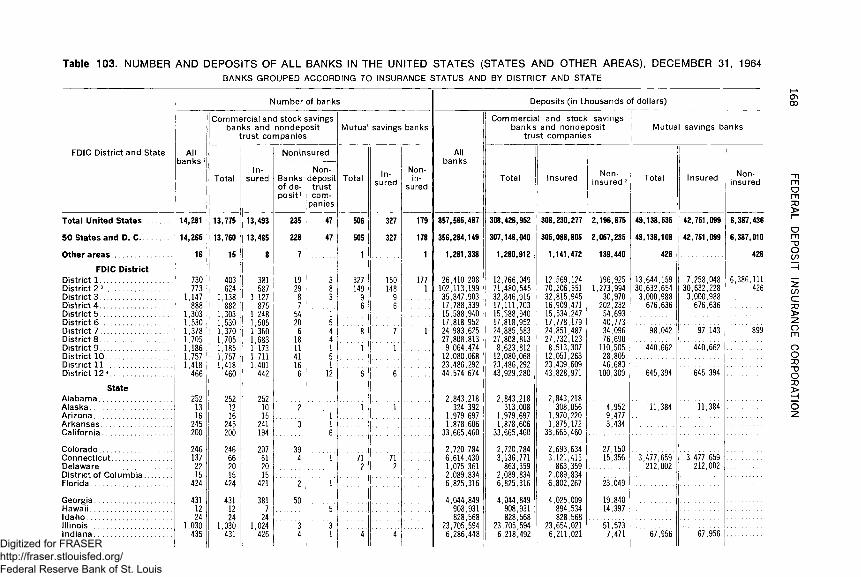
Table 103. NUMBER AND DEPOSITS OF ALL BANKS IN THE UNITED STATES (STATES AND OTHER AREAS), DECEMBER 31, 1964BANKS GROUPED ACCORDING TO INSURANCE STATUS AND BY DISTRICT AND STATE
FDIC D is tr ic t and S tate
Total United S ta tes.............
50 States and D. C..............
Other a reas...........................
FDIC D istrictD istrict 1 ................................D istrict 2 3...............................D istrict 3 ................................D istrict 4 ................................D istrict 5 ................................D istrict 6 ................................D istrict 7 ................................D istrict 8 ................................D istrict 9 ................................D istrict 1 0 ..............................D istrict 1 1 ..............................D istrict 1 2 4............................
StateAlabama.................................A laska.....................................Arizona...................................Arkansas................................California...............................
Colorado.................................Connecticut...........................Delaware................................D istrict of C olum bia............Florida.....................................
Georgia...................................Hawaii.....................................Idaho ......................................Illino is .....................................Ind iana ...................................
N u m b e r o f banks
C o m m ercia l and s tock savings ban ks and n o n d e p o s it
t ru s t com pan ie sM utua l savings banks
All ban ks 1
N o n insured
T otalIn
su red Banks o f d e p o s it1
N ondep os it
tru s tco m
panies
Tota l In sured
Nonin
sured
14,281 13,775 13,493 235 47 506 327 179
14,265 13,760 13,485 228 47 505 327 178
16 15 8 7 1 1
730773
1,147888
403624
1,138882
381587
1,127875
19298
383
327149
9
150148
9
1771
7 6 61,3031,530
1,3031,5301,3701,7051,1851,7571,418
460
1,2481,5051,3601,6831,1731,7111,401
442
54 120 5
1,3781,7051,1861,7571,418
618
44
8 7 1
11 1 1 141 516 1
466 6 12 6 6
252 252 25213 12 10 2 1 116 16 15 1
1245 245 241 3200 200 194 6
246 246 207 39137 66 61 4 1 71 7122 20 20 2 215 15 15
424 424 421 2 1
431 431 381 5012 12 7 524 24 24
1,030435
1,030431
1,024426
3 34 1 4 4
Allbanks
Deposits (in th o u s a n d s o f do lla rs)
C om m erc ia l and s tock savings b a n k s and no n d e p o s it
t ru s t com pan ie s
T ota l Insured N onin su re d ;
M utua l savings banks
Tota l In sured N oninsured
357,565,487
356,284,149
1,281,338
26,410,208102,113,19935,847,90317,788,33915,588,94017,818,95224,983,62527,808,8139,064,474
12,080,06823,486,29244,574,674
2,843,218324,392
1,979,6971,878,606
33,665,460
2,720,7846,614,4301,075,3612,089,8346,825,316
4,044,849908,931828,568
23,705,5946,286,448
308,426,952
307,146,040
1,280,912
12,766,04971,480,54532,846,91517,111,70315,588,94017,818,95224,885,58327,808,8138,623,812
12,080,06823,486,29243,929,280
2,843,218313,008
1,979,6971,878,606
33,665,460
2,720,7843,136,771
863,3592,089,8346,825,316
4,044,849908,931828,568
23,705,5946,218,492
306,230,277
305,088,805
1,141,472
12,569,12470,206,55132,815,94516,909,47115,534,24717,778,17924,851,48727,732,1238,513,307
12,051,26323,439,60943,828,971
2,843,218308,056
1,970,2201,875,172
33,665,460
2,693,6343,121,415
863,3592,089,8346,802,267
4,025,009894,534828,568
23,654,0216 ,211,021
2,196,675
2,057,235
139,440
196,9251,273,994
30,970202,232
54,69340,77334,09676,690
110,50528,80546,683
100,309
49,138,535
49,138,109
426
13,644,15930,632,6543,000,988
676,636
42.751.099
42.751.099
7,258,04830,632,2283,000,988
676,636
6,387,436
6,387,010
426
6,386,111426
98,042 97,143 899
440,662
645'394
440,662
645'394
4,9529,4773,434
11,384 11,384
27,15015,356 3,477,659
212,0023,477,659
212,002
23,049
19,84014,397
51,5737,471 67,956 67,956
168 FEDERAL
DEPOSIT
INSU
RAN
CE
CO
RPO
RA
TION
Digitized for FRASER http://fraser.stlouisfed.org/ Federal Reserve Bank of St. Louis
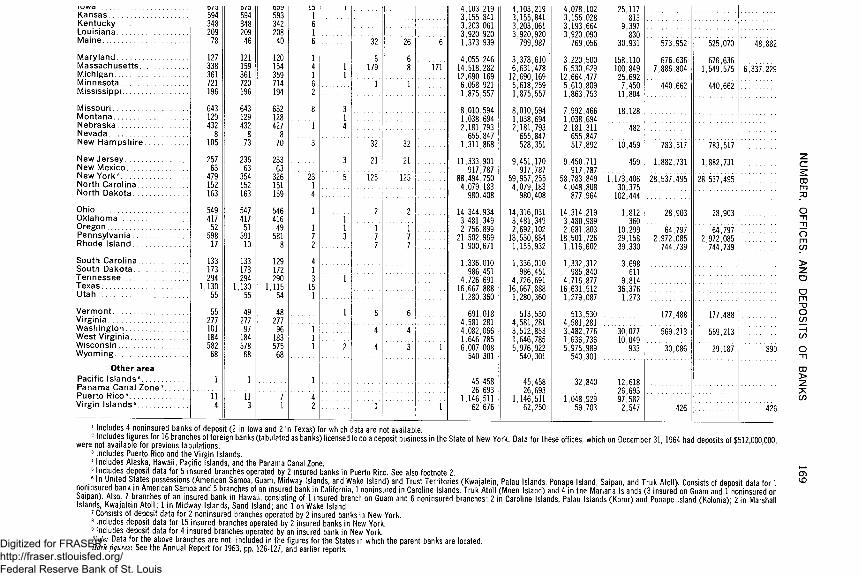
lUWd.............................................K a n s a s .......................................
D/3594
D/3594
ooy593
I D1
i 4,103,2193,155,8413,203,0613,920,9201,373,939
4,103,2193,155,8413,203,0613,920,920
799,987
4,078,1023,155,0283,193,6643,920,090
769,056
25,117813
9,397830
30,931
K e n tu c k y ................................... 348 348 342 6L o u is ia n a ................................... 209 209 208 1M a in e .......................................... 78 46 40 6 32 26 6 573,952 525,070 48,882
M a ry la n d ................................... 127 121 120 1 6 6 4,055,24614,518,28212,690,1696,058,9211,875,557
8,010,5941,038,6942,181,793
655,8471,311,868
11,333,901917,787
88,494,750
3,378,6106,631,478
12,690,1695,618,2591,875,557
8,010,5941,038,6942,181,793
655,847528,351
9,451,170917,787
59,957,2554,079,183
980,408
14,316,0313,481,3492,692,102
3,220,5006,530,629
12,664,4775,610,8091,863,753
7,992,4661,038,6942.181.311
655,847 517,892
9,450,711917,787
58,783,8494,048,808
877,964
14,314,2193.480.989 2,681,803
18,501,7261,116,602
1.332.312 985,840
4,716,87716,631,5121,279,087
513,5304,581,2813,482,7761,636,7365.975.989
540,301
32,840
158,110100,84925,6927,450
11,804
18,128
676,6367,886,804
676,6361,549,575M a s s a c h u s e tts ........................
M ic h ig a n ....................................338361
159361
154359
41
11
179 8 171 6,337,229
M in n e s o ta ................................. 721 720 714 6 1 1 440,662 440,662M is s is s ip p i................................ 196 196 194 2
M is s o u ri..................................... 643 643 632 8 3M o n ta n a ..................................... 129 129 128 1N e b ra s k a ................................... 432 432 427 1 4 482N e va d a ....................................... 8 8 8New H a m p s h ire ..................... 105 73 70 3 32 32 10,459
459
783,517
1,882,731
783,517
1,882,731New J e rs e y ............................... 257 236 233 3 21 21New M e x ic o .............................. 63 63 63New Y o rk 5............................. 479 354 326 23 5 125 125 1,173,406
30.375 102,444
1,812360
10,29929,15839,330
3,698611
9,81436.376
1,273
28,537,495 28,537,495N orth C a ro lin a ........................ 152 152 151 1 4,079,183
980,408
14,344,9343,481,3492,756,899
N o rth D a k o ta ........................... 163 163 159 4
O h io ............................................. 549 547 546 1 2 2 28,903 28,903O k la h o m a .................................. 417 417 416 1O re g o n ........................................ 52 51 49 1 1 1 1 64,797
2,972,085744,739
64,7972,972,085
744,739
P e n n sy lva n ia ........................... 598 591 581 7 3 7 7 21,502,969 18,530,8841,155,932
1,336,010 986,451
4 726 691
Rhode Is la n d ........................... 17 10 8 2 7 7 1,900,671
1,336,010986,451
4,726,69116,667,8881,280,360
691,0184,581,2814,082,0661,646,7856,007,008
540,301
45,458 26 693
S outh C a ro lin a ........................ 133 133 129 4South D a k o ta .......................... 173 173 172 1T e n n e s s e e ................................ 294 294 290 3 1T e x a s ........................................... 1,130 1,130 1,115 15 16!667!888
1,280,360
513,5304,581,2813,512,8531,646,7855,976,922
540,301
45,45826,693
1,146,51162,250
U ta h ............................................. 55 55 54 1
V e rm o n t..................................... 55 49 48 1 6 6 177,488 177,488V irg in ia ....................................... 277 277 277W a s h in g to n .............................. 101 97 96 1 4 4 30,077
10,049933
569,213 569,213W est V irg in ia ............................ 184 184 183 1W isco n s in ........................ 582 578
6857568
1 2 4 3 1 30,086 29,187 899W yo m in g .................................... 68
Other areaP acific Is la n d s 6...................... 1 1 1 12,618
26,69397,5822,547
Panam a Canal Z o n e 7...........Puerto R ic o 8............................. 11 11 7 4 1,146,511
62,6761,048,929
59,703V irg in Is la n d s 9......................... 4 3 1 2 1 1 426 426
1 Includes 4 noninsured banks of deposit (2 in Iowa and 2 in Texas) for which data are not available.2 Includes figures for 16 branches of foreign banks (tabulated as banks) licensed to do a deposit business in the State of New York. Data for these offices, which on December 31,1964 had deposits of $512,000 000
were not available for previous tabulations. ' ,3 Includes Puerto Rico and the Virgin Islands.4 Includes Alaska, Hawaii, Pacific Islands, and the Panama Canal Zone.5 Includes deposit data for 5 insured branches operated by 2 insured banks in Puerto Rico. See also footnote 2.6 In United States possessions (American Samoa, Guam, Midway Islands, and Wake Island) and Trust Territories (Kwajalein, Palau Islands, Ponape Island, Saipan, and Truk Atoll). Consists of deposit data for 1
noninsured bank in American Samoa and 5 branches of an insured bank in California, 1 noninsured in Caroline Islands, Truk Atoll (Moen Island) and 4 in the Mariana Islands (3 insured on Guam and 1 noninsured on paipan)-Also, 7 branches of an insured bank in Hawaii, consisting of 1 insured branch on Guam and 6 noninsured branches: 2 in Caroline Islands, Palau Islands (Koror) and Ponape Island (Kolonia); 2 in Marshall Islands, Kwajalein Atoll; 1 in Midway Islands, Sand Island; and 1 on Wake Island.
7 Consists of deposit data for 2 noninsured branches operated by 2 insured banks in New York.8 Includes deposit data for 15 insured branches operated by 2 insured banks in New York.9 Includes deposit data for 4 insured branches operated by an insured bank in New York.Note: Data for the above branches are not included in the figures for the States in which the parent banks are located.Back figures: See the Annual Report for 1963, pp. 126-127, and earlier reports.
NU
MB
ER
, O
FFICES,
AND DEPO
SITS OF
BANKS 169
Digitized for FRASER http://fraser.stlouisfed.org/ Federal Reserve Bank of St. Louis
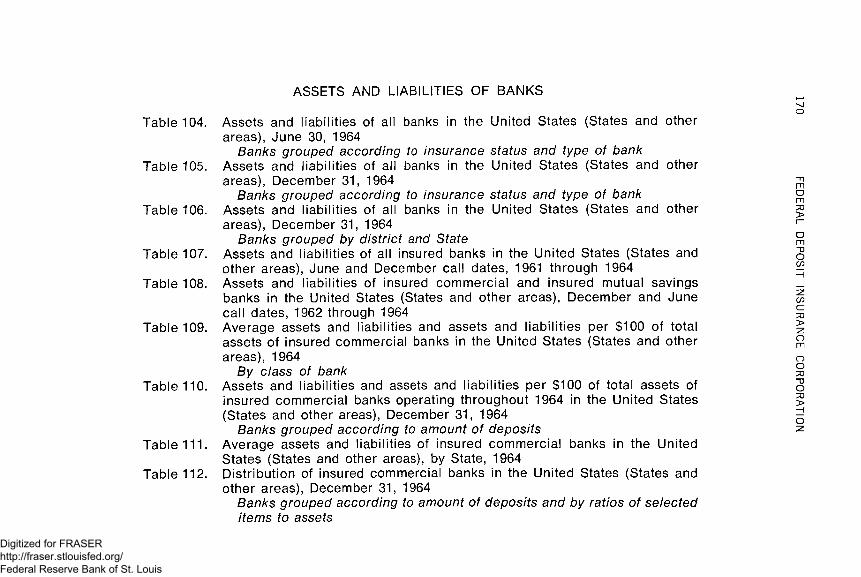
ASSETS AND LIABILITIES OF BANKS
Table 104.
Table 105.
Table 106.
Table 107.
Table 108.
Table 109.
Table 110.
Table 111.
Table 112.
Assets and liabilities of all banks in the United States (States and other areas), June 30, 1964
Banks grouped according to insurance status and type of bank Assets and liabilities of all banks in the United States (States and other areas), December 31, 1964
Banks grouped according to insurance status and type of bank Assets and liabilities of all banks in the United States (States and other areas), December 31, 1964
Banks grouped by district and State Assets and liabilities of all insured banks in the United States (States and other areas), June and December call dates, 1961 through 1964 Assets and liabilities of insured commercial and insured mutual savings banks in the United States (States and other areas), December and June call dates, 1962 through 1964Average assets and liabilities and assets and liabilities per $100 of total assets of insured commercial banks in the United States (States and other areas), 1964
By class of bankAssets and liabilities and assets and liabilities per $100 of total assets of insured commercial banks operating throughout 1964 in the United States (States and other areas), December 31, 1964
Banks grouped according to amount of deposits Average assets and liabilities of insured commercial banks in the United States (States and other areas), by State, 1964Distribution of insured commercial banks in the United States (States and other areas), December 31, 1964
Banks grouped according to amount of deposits and by ratios of selected items to assets
170 FED
ERAL
DEPO
SIT IN
SUR
ANC
E C
OR
PO
RA
TION
Digitized for FRASER http://fraser.stlouisfed.org/ Federal Reserve Bank of St. Louis
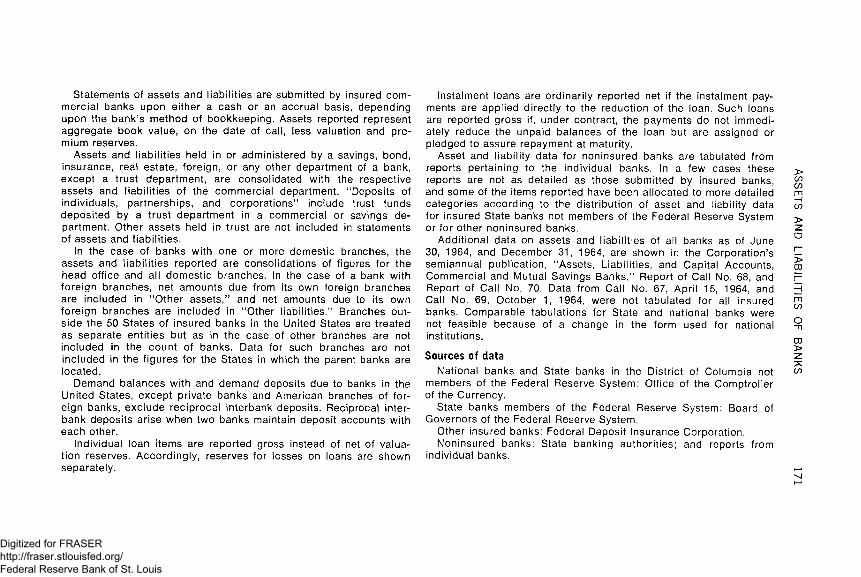
Statements of assets and liabilities are submitted by insured commercial banks upon either a cash or an accrual basis, depending upon the bank’s method of bookkeeping. Assets reported represent aggregate book value, on the date of call, less valuation and premium reserves.
Assets and liabilities held in or administered by a savings, bond, insurance, real estate, foreign, or any other department of a bank, except a trust department, are consolidated with the respective assets and liabilities of the commercial department. “ Deposits of individuals, partnerships, and corporations” include trust funds deposited by a trust department in a commercial or savings department. Other assets held in trust are not included in statements of assets and liabilities.
In the case of banks with one or more domestic branches, the assets and liabilities reported are consolidations of figures for the head office and all domestic branches. In the case of a bank with foreign branches, net amounts due from its own foreign branches are included in “ Other assets,” and net amounts due to its own foreign branches are included in “ Other liabilities.” Branches outside the 50 States of insured banks in the United States are treated as separate entities but as in the case of other branches are not included in the count of banks. Data for such branches are not included in the figures for the States in which the parent banks are located.
Demand balances with and demand deposits due to banks in the United States, except private banks and American branches of foreign banks, exclude reciprocal interbank deposits. Reciprocal interbank deposits arise when two banks maintain deposit accounts with each other.
Individual loan items are reported gross instead of net of valuation reserves. Accordingly, reserves for losses on loans are shown separately.
Instalment loans are ordinarily reported net if the instalment payments are applied directly to the reduction of the loan. Such loans are reported gross if, under contract, the payments do not immediately reduce the unpaid balances of the loan but are assigned or pledged to assure repayment at maturity.
Asset and liability data for noninsured banks are tabulated from reports pertaining to the individual banks. In a few cases these reports are not as detailed as those submitted by insured banks, and some of the items reported have been allocated to more detailed categories according to the distribution of asset and liability data for insured State banks not members of the Federal Reserve System or for other noninsured banks.
Additional data on assets and liabilities of all banks as of June 30, 1964, and December 31, 1964, are shown in the Corporation’s semiannual publication, “ Assets, Liabilities, and Capital Accounts, Commercial and Mutual Savings Banks,” Report of Call No. 6 8 , and Report of Call No. 70. Data from Call No. 67, April 15, 1964, and Call No. 69, October 1, 1964, were not tabulated for all insured banks. Comparable tabulations for State and national banks were not feasible because of a change in the form used for national institutions.
Sources of dataNational banks and State banks in the District of Columbia not
members of the Federal Reserve System: Office of the Comptroller of the Currency.
State banks members of the Federal Reserve System: Board of Governors of the Federal Reserve System.
Other insured banks: Federal Deposit Insurance Corporation.Noninsured banks: State banking authorities; and reports from
individual banks.
ASSETS AND
LIAB
ILITIES
OF
BA
NK
S
Digitized for FRASER http://fraser.stlouisfed.org/ Federal Reserve Bank of St. Louis
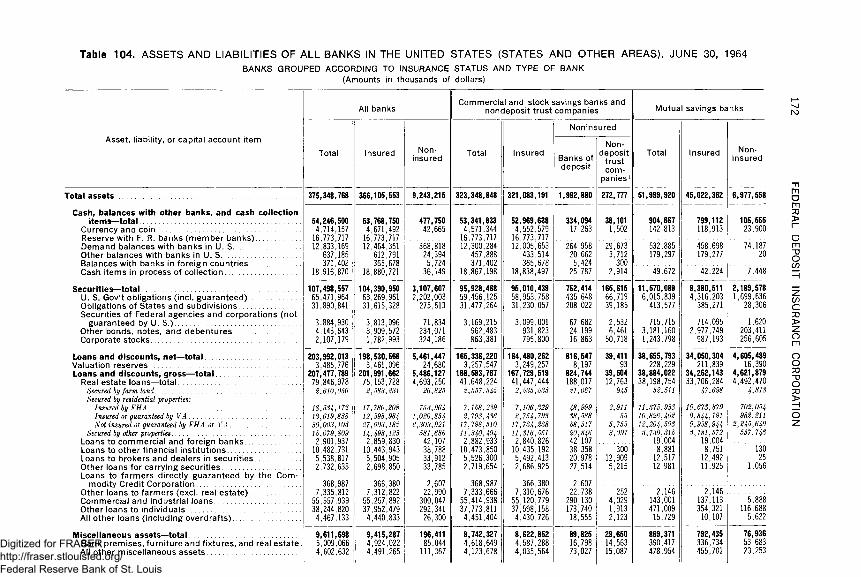
Table 104. ASSETS AND LIABILITIES OF ALL BANKS IN THE UNITED STATES (STATES AND OTHER AREAS), JUNE 30, 1964BANKS GROUPED ACCORDING TO INSURANCE STATUS AND TYPE OF BANK
(Am ounts in thousands of do lla rs)
All banksC om m erc ia l and s tock savings banks and
n o n d e p o s it t ru s t com pan ie s M utua l savings banks
N on insured
Asse t, lia b ility , o r ca p ita l a cco u n t item
Total Insured N oninsured
Total InsuredBanks of d e p o s it
N ond e p o s it
t ru s tco m
p a n ie s 1
Total Insured N oninsured
Total assets.................................................................................... 375,348,768 366,105,553 9,243,215 323,348,848 321,083,191 1,992,880 272,777 51,999,920 45,022,362 6,977,558
Cash, balances with other banks, and cash collectionitems—tota l......................................................................... 54,246,500 53,768,750 477,750 53,341,833 52,969,638 334,094 38,101 904,667 799,112 105,555
C u rrency and c o in ....................................................................... 4,714,15716,773,71712,833,169
4,671,49216,773,71712,464,351
42,665 4,571,34416,773,71712,300,284
4,552,57916,773,71712,005,653
17,263 1,502 142,813 118,913 23,900
D em and balances w ith banks in U. S................................. 368,818 264,958 29,673 532,885 458,698 74,187O ther ba lances w ith ban ks in U. S....................................... 637,185
371,40218,916,870
612,791365,678
18,880,721
24,3945,724
457,888371,402
18,867,198
433,514365,678
18,838,497
20,6625,424
25,787
3,712300
179,297 179,277 20
Cash ite m s in process o f c o lle c tio n ..................................... 36,149 2,914 49,672 42,224 7,448
Securities—tota l........................................................................ 107,498,557 104,390,950 3,107,607 95,928,468 95,010,439 752,414 165,615 11,570,089 9,380,511 2,189,578U. S. G ov’t o b lig a tio n s (inc l. g u a ra n te e d ) ......................... 65,471,964 63,269,961 2,202,003 59,456,125 58,953,758 435,648 66,719 6,015,839 4,316,203 1,699,636O b liga tions o f S ta tes and s u b d iv is io n s ..............................S e cu ritie s o f Federal agencies and co rp o ra tio n s (n o t
31,890,841 31,615,328 275,513 31,477,264 31,230,057 208,022 39,185 413,577 385,271 28,306
g u a ra n te e d by U. S .) ............................................................... 3,884,930 3,813,096 71,834 3,169,215 3,099,001 67,682 2,532 715,715 714,095 1,620O ther bonds, notes, and d e b e n tu re s ................................. 4,143,643 3,909,572 234,071 962,483 931,823 24,199 6,461 3,181,160 2,977,749 203,411C orpora te s to c k s .......................................................................... 2,107,179 1,782,993 324,186 863,381 795,800 16,863 50,718 1,243,798 987,193 256,605
Loans and discounts, net—total........................................... 203,992,013 198,530,566 5,461,447 165,336,220 164,480,262 816,547 39,411 38,655,793 34,050,304 4,605,489Valuation re s e rv e s ........................................................................... 3,485,776 3,461,096 24,680 3,257,547 3,249,257 8,197 93 228,229 211,839 16,390Loans and discounts, gross— total 207,477,789 201,991,662 5,486,127 168,593,767 167,729,519 824,744 39,504 38,884,022 34,262,143 4,621,879
Real esta te loans— to ta l............................................................. 79,846,978 75,153,728 4,693,250 41,648,224 41,447,444 188,017 12,763 38,198,754 33,706,284 4,492,470Secured by farm, land..............................................................Secured by residential properties:
2 ,6 1 0 ,0 5 6 2 ,5 8 3 ,2 3 1 2 6 ,8 2 5 2 ,5 5 7 ,5 4 5 2 ,5 3 5 ,5 3 3 2 1 ,0 6 7 945 52 ,51 1 4 7 ,6 9 8 4 ,8 1 3
Insured by F H A ................................................................. 1 8 ,5 3 4 ,1 7 2 1 7 ,7 8 0 ,2 0 8 7 5 3 ,9 6 4 7 ,1 5 8 ,2 3 9 7 ,1 0 6 ,3 2 9 4 8 ,9 9 9 2 ,9 1 1 1 1 ,3 7 5 ,9 3 3 1 0 ,6 7 3 ,8 7 9 7 02 ,0 5 4Insured or guaranteed by V A ................................................ 1 3 ,6 1 9 ,8 3 8 1 2 ,5 9 8 ,9 8 4 1 ,0 2 0 ,8 5 4 2 ,7 9 3 ,4 3 6 2 ,7 5 4 ,7 9 3 3 8 ,5 8 8 55 1 0 ,8 2 6 ,4 0 2 9 ,8 4 4 ,1 9 1 982 ,2 1 1
Not insured or guaranteed by FHA or VA.............................. 3 0 ,0 0 3 ,1 0 3 2 7 ,6 9 3 ,1 8 2 2 ,3 0 9 ,9 2 1 1 7 ,7 9 8 ,5 1 0 1 7 ,7 3 4 ,2 3 8 5 8 ,5 1 7 5 ,7 5 5 1 2 ,2 0 4 ,5 9 3 9 ,9 5 8 ,9 4 4 2 ,2 4 5 ,6 4 9
Secured by other properties.......................................................Loans to co m m e rc ia l and fo re ig n banks
1 5 ,0 7 9 ,8 0 92,901,937
10,482,731
1 4 ,4 9 8 ,1 2 32,859,830
10,443,943
5 8 1 ,6 8 642,10738,788
1 1 ,3 4 0 ,4 9 42,882,933
10,473,850
1 1 ,3 1 6 ,5 5 12,840,826
10,435,192
2 0 ,8 4 642,10738,358
3 ,0 9 7 3 ,7 3 9 ,3 1 519,004
3 ,1 8 1 ,5 7 219,004
5 5 7 ,7 4 3
Loans to o th e r fin a n c ia l in s t itu t io n s .................................... 300 8,881 8,751 130Loans to b ro ke rs and dea lers in s e c u r it ie s ...................... 5,538,817 5,504,905 33,912 5,526,300 5,492,413 20,978 12,909 12,517 12,492 25O th e r loans fo r c a rry in g s e c u r it ie s .......................................Loans to fa rm e rs d ire c tly g u a ra n te e d by th e C om
m o d ity C re d it C o rpo ra tion
2,732,635
368,9877,335,812
55,557,939
2,698,850
366,3807,312,822
55,257,892
33,785
2,60722,990
300,047
2,719,654
368,9877,333,666
55,414,938
2,686,925
366,3807,310,676
55,120,779
27,514
2,60722,738
5,215 12,981 11,925 1,056
O ther loans to fa rm e rs (excl real es ta te ) 252 2,146 2,146Com m erc ia l and in d u s tr ia l lo a n s ........................................... 290,130 4,029 143,001 137,113 5,888O ther loans to in d iv id u a ls ......................................................... 38,244,820 37,952,479 292,341 37,773,811 37,598,158 173,740 1,913 471,009 354,321 116,688All o th e r loans ( in c lu d in g o v e rd ra f ts ) .................................. 4,467,133 4,440,833 26,300 4,451,404 4,430,726 18,555 2,123 15,729 10,107 5,622
Miscellaneous assets—tota l.................................................. 9,611,698 9,415,287 196,411 8,742,327 8,622,852 89,825 29,650 869,371 792,435 76,936B ank p rem ises, fu rn itu re and f ix tu re s , and real e s ta te . 5,009,066 4,924,022 85,044 4,618,649 4,587,288 16,798 14,563 390,417 336,734 53,683All o th e r m isce llane ous a s s e ts ............................................... 4,602,632 4,491,265 111,367 4,123,678 4,035,564 73,027 15,087 478,954 455,701 23,253
172 FEDERAL
DEPOSIT
INSU
RAN
CE
CO
RPO
RA
TION
Digitized for FRASER http://fraser.stlouisfed.org/ Federal Reserve Bank of St. Louis

Business and personal deposits— to ta l............................Individuals, partnerships, and coporations— demand Individuals, partnerships, and corporations— t im e . ..
Savings deposits...................................................................Deposits accumulated for payment of personal loans...................Other deposits of individuals, partnerships, and coporations........
Certified and o fficers ’ checks, le tters of credit, and travelers' checks, e tc......................................................
Government deposits— to ta l . * ......................................United States Government— dem and............................United States Government— tim e ...................................States and subdivisions— dem and.................................States and subdivisions— tim e ........................................
Domestic in te rbank and postal savings deposits— to ta lCommercial banks in the U. S.— d em and....................Commercial banks in the U. S.— tim e ............................Mutual savings banks in the U. S.— dem and ...............Mutual savings banks in the U. S.— tim e ......................Postal savings......................................................................
Foreign government and bank deposits— to ta l..............Foreign governm ents, central banks, etc.— demand.Foreign governm ents, central banks, etc.— tim e ........Banks in foreign countries— dem and ............................Banks in foreign countries— tim e ...................................
Total dep o s its ...................................................................Demand...........................................................................Time...............................................................................
M iscellaneous liab ilitie s— to ta l..........................................Rediscounts and other borrowed m oney.....................All other miscellaneous liab ilities....................................
Total lia b ilit ie s (exclud ing capita l accounts)..........
Capital accounts— to ta l.........................................................Preferred cap ita l..................................................................Common stock .......................................................... ..........Surplus...................................................................................Undivided profits and reserves.......................................
Number of banks2......................................................................
Total lia b ilities and cap ita l acco u n ts ........................................ 375,348,768
280,780,258121,726,667154,187,2851 2 6 ,1 9 5 ,6 0 8
8 97 ,4 2 02 7 ,0 9 4 ,2 5 7
4,866,306
31,978,72110,289,804
260,73812,676,1728,752,007
14,489,07613,091,229
364,576861,855152,19919,217
5,824,717681,498
3,598,2741,364,041
180,904
333,072,7721 6 5 ,5 5 7 ,5 7 21 6 7 ,5 1 5 ,2 0 0
11,145,9792,123,6749,022,305
344,218,751
31,130,017603,305
7,870,11315,661,7516,994,848
14,189
366,105,553
273,587,716121,036,112147,739,2551 1 9 ,8 5 8 ,8 2 2
8 9 5 ,3 8 72 6 ,9 8 5 ,0 4 6
4,812,349
31,764,28810,257,861
257,57412,562,5828,686,271
14,261,22313,051,155
359,132749,16882,56119,207
5,733,893675,616
3,574,2541,316,494
167,529
325,347,1201 6 4 ,4 6 1 ,3 3 71 6 0 ,8 8 5 ,7 8 3
10,726,6862,059,4418,667,245
336,073,806
30,031,747559,875
7,744,93115,133,5236,593,418
13,728
9,243,215
7,192,542690,555
6,448,0306 ,3 3 6 ,7 8 6
2 ,0 3 3109 ,211
53,957
214,43331,9433,164
113,59065,736
227,85340,0745,444
112,68769,638
10
90,8245,882
24,02047,54713,375
7,725,6521 ,0 9 6 ,2 3 56 ,6 2 9 ,4 1 7
419,29364,233
355,060
8,144,945
1,098,27043,430
125,182528,228401,430
461
323,348,848 321,083,191 1,992,880 272,777
233,872,277121,391,091107,624,877
7 9 ,6 6 6 ,9 3 58 9 6 ,6 3 1
2 7 ,0 6 1 ,3 1 1
4,856,309
31,948,13710,283,140
260,72012,674,6728,729,605
14,487,60813,091,168
363,169861,855152,19919,217
5,824,675681,457
3,598,2741,364,040
180,904
286,132,6971 6 5 ,2 0 3 ,7 3 21 2 0 ,9 2 8 ,9 6 5
10,354,8782,102,9648,251,914
296,487,575
26,861,273602,627
7,870,11312,719,5525,668,981
13,682
232,821,964120,715,072107,304,540
7 9 ,4 4 7 ,9 5 58 9 4 ,7 0 0
2 6 ,9 6 1 ,8 8 5
4,802,352
31,735,03310,251,709
257,55612,561,0828,664,686
14,259,75513,051,094
357,725749,16882,56119,207
5,733,851675,575
3,574,2541,316,493
167,529
284,550,6031 6 4 ,1 2 2 ,5 4 51 2 0 ,4 2 8 ,0 5 8
10,118,8452,039,4068,079,439
294,669,448
26,413,743559,197
7,744,93112,551,7815,557,834
13,401
945,420596,829294,7002 0 7 ,5 5 8
1,9 3185 ,21 1
53,891
212,23530,5623,164
113,59064,919
227.68639,9075,444
112.687 69,638
10
90,2795,838
24,02047,54612,875
1,475,6201 ,0 0 0 ,8 5 0
4 7 4 ,7 7 0
214,80461,840
152,964
1,690,424
302,45643,23082,84499,63376,749
233
104,89379,19025,63711,422
1 4 ,2 1 5
66
869
167167
54544
1500
106,4748 0 ,3 3 72 6 ,1 3 7
21,2291,718
19,511
127,703
145,074200
42,33868,13834,398
48
51,999,920
46,907,981335,576
46,562,4084 6 ,5 2 8 ,6 7 3
7893 2 ,9 4 6
9,997
30,5846,664
181,500
22,402
1,46861
1,407
46,940,0753 5 3 ,8 4 0
4 6 ,5 8 6 ,2 3 5
791,10120,710
770,391
47,731,176
4,268,744678
2,942,1991,325,867
507
45,022,362 6,977,558
40,765,752321,040
40,434,7154 0 ,4 1 0 ,8 6 7
68723,161
9,997
29,2556,152
181,500
21,585
1,46861
1,407
40,796,5173 3 8 ,7 9 2
4 0 ,4 5 7 ,7 2 5
607,84120,035
587,806
41,404,358
1,618,004678
2,581,7421,035,584
327
6,142,22914,536
6,127,6936 ,1 1 7 ,8 0 6
1029 ,7 8 5
1,329512
817
6,143,55815,04 8
6 ,1 2 8 ,5 1 0
183,260675
182,585
6,326,818
650,740
360,457290,283
180
1 ^ m.ou.n*s shown as deposits are special accounts and univested trust funds with the latter classified as demand deposits of individuals, partnerships, and corporations.2 Includes 18 noninsured banks of deposit for which asset and liability data are not available.Back figures: See the Annual Report for 1963, pp. 130-131, and earlier reports.
ASSETS AND
LIABILITIES OF
BANKS 173
Digitized for FRASER http://fraser.stlouisfed.org/ Federal Reserve Bank of St. Louis

Table 105. ASSETS AND LIABILITIES OF ALL BANKS IN THE UNITED STATES (STATES AND OTHER AREAS), DECEMBER 31, 1964BANKS GROUPED ACCORDING TO INSURANCE STATUS AND TYPE OF BANK
(Am ounts in thousands o f dollars)
All banksC om m ercia l and stock savings banks and
n o n d e p o s it t ru s t com pan ie s M utu a l savings banks
Asset, lia b ility , o r cap ita l a cco u n t item Total InsuredN oninsured
Total Insured N o ninsured Banks of
d e p o s it1
N ond e p o s it
tru s tco m
p a n ie s 2
Total in su re d N oninsured
Total assets.................................................................................... 402,673,308 392,174,389 10,498,919 348,433,496 345,130,205 3,016,367 286,924 54,239,812 47,044,184 7,195,628
Cash, balances with other banks, and cash collectionitems—total 61,643,984 60,926,055 717,929 60,640,246 60,032,916 569,822 37,508 1,003,738 893,139 110,599
C u rrency and c o in .......................................................................Reserve w ith F. R. banks (m e m b e r b a n k s ) ......................
4,736,44417,580,74315,129,133
4,690,73217,580,74314,567,230
45,712 4,572,84117,580,74314,577,048
4,551,88917,580,74314,090,586
19,486 1,466 163,603 138,843 24,760
D em and ba lances w ith ban ks in U. S.................................. 561,903 458,000 28,462 552,085 476,644 75,441O ther ba lances w ith ban ks in U. S........................................Balances w ith banks in fo re ig n co u n tr ie s ................
811,764341,237
23,044,663
782,609300,841
23,003,900
29,15540,39640,763
587,352341,237
22,981,025
558,335300,841
24,61840,160
4,399236
224,412 224,274 138
Cash ite m s in process o f c o lle c tio n ......... .............. 22,950,522, 27,558 2,945 63,638 53,378 10,260
Securities—tota l........................................................................ 113,283,341 110,084,808 3,198,5332,222,880
102,004,922 100,959,700 861,826 183,396 11,278,419 9,125,108 2,153,311U. S. G ov’t, o b lig a tio n s (inc l. g u a ra n te e d )........................ 68,921,384 66,698,504 63,133,110 62,588,052 475,673 69,385 5,788,274 4,110,452 1,677,822O bliga tions o f S tates and s u b d iv is io n s ..............................S e curities o f Federal agencies a n d c o rp o ra tio n s (n o t
33,985,319 33,711,653 273,666 33,594,205 33,343,807 204,583 45,815 391,114 367,846 23,268
g u a ra n te e d by U. S .) ............................................................... 4,239,188 4,195,363 43,825 3,488,868 3,446,144 38,463 4,261 750,320 749,219 1,101O ther bonds, notes, and d e b e n tu re s ................................... 3,990,325 3,667,522 322,803 899,968 762,790 125,786 11,392 3,090,357 2,904,732 185,625C o rpo ra te s to c k s ........................................................................... 2,147,125 1,811,766 335,359 888,771 818,907 17,321 52,543 1,258,354 992,859 265,495
Loans and discounts, net—tota l........................................... 217,657,808 211,329,246 6,328,562 176,572,772 175,096,194 1,440,899 35,679 41,085,036 36,233,052 4,851,984Va lua tion re s e rv e s ........................................................................... 3,787,959 3,762,450 25,509 3,564,019 3,552,676 11,144 199 223,940 209,774 14,166Loans and discounts, gross—total 221,445,767 215,091,696 6,354,071 180,136,791 178,648,870 1,452,043 35,878 41,308,976 36,442,826 4,866,1£0
Real e s ta te loans— to ta l............................................................. 84,532,443 79,556,374 4,976,069 43,976,082 43,733,086 230,297 12,699 40,556,361 35,823,288 4,733,073Secured by farm land..............................................................Secured by residential properties:
2 ,6 9 1 ,2 1 8 2 ,6 6 5 ,2 3 3 2 5 ,9 8 5 2 ,6 3 8 ,0 3 1 2 ,6 1 6 ,6 0 4 2 0 ,5 2 3 904 5 3 ,1 8 7 4 8 ,6 2 9 4 ,5 5 8
Insured by F H A ................................................................. 1 9 ,6 0 1 ,4 5 6 1 8 ,7 7 1 ,3 2 4 8 3 0 ,1 3 2 7 ,3 1 4 ,5 9 0 7 ,2 4 3 ,4 9 7 6 8 ,2 0 8 2 ,8 8 5 1 2 ,2 8 6 ,8 6 6 1 1 ,5 2 7 ,8 2 7 7 59 ,0 3 9Insured or guaranteed by V A ................................................ 1 3 ,8 6 2 ,9 5 1 1 2 ,8 1 3 ,7 4 2 1 ,0 4 9 ,2 0 9 2 ,7 4 1 ,8 5 2 2 ,6 8 4 ,4 6 8 5 7 ,3 2 9 55 1 1 ,1 2 1 ,0 9 9 1 0 ,1 2 9 ,2 7 4 9 91 ,8 2 5Not insured or guaranteed by FHA or V A .............................. 3 1 ,9 5 5 ,2 0 5 2 9 ,5 5 0 ,6 9 1 2 ,4 0 4 ,5 1 4 1 8 ,8 7 5 ,7 1 6 1 8 ,8 1 0 ,7 9 8 5 9 ,1 7 0 5 ,7 4 8 1 3 ,0 7 9 ,4 8 9 1 0 ,7 3 9 ,8 9 3 2 ,3 3 9 ,5 9 6
Secured by other properties.......................................................Loans to co m m e rc ia l and fo re ig n ban ks. ..............
1 6 ,4 2 1 ,6 1 33,509,569
10,959,478
1 5 ,7 5 5 ,3 8 43,437,217
10,858,968
6 6 6 ,2 2 9 72,352
1 2 ,4 0 5 ,8 9 33,493,341
10,950,005
1 2 ,3 7 7 ,7 1 93,420,989
10,849,646
2 5 ,0 6 7 72 352
3 ,1 0 7 4 ,0 1 5 ,7 2 016,2289,473
3 ,3 7 7 ,6 6 516,2289,322
6 38 ,0 5 5
Loans to o th e i ■ m c ia l in s t itu t io n s .................................... 100,510 100,237 122 151Loans to broko ; ‘d dea le rs in s e c u r it ie s ....................... 5,567,471 5,381,309 186,162 5,541,687 5,355,550 175,648 10,489 25,784 25,759 25O ther loans fo i 1 'ty in g s e c u r it ie s .......................................Loans to fa rm e rs d ire c tly g u a ra n te e d by th e C o m
m o d ity C re d it C o rp o ra tio n ............... ............
2,850,998
516,8387,005,642
60,776,296
2,799,024
513,5806,984,795
60,197,360
51,974
3,25820,847
578,936
2,845,094
516,8387,003,490
60,612,317
2,794,217
513,5806,982,643
60,040,383
46,193
3,22720,374
569,370
4,684
31
5,904 4,807 1,097
O ther loans to fa rm e rs (excl. real e s t a t e ) ....................... 473 2,152163,979
2,152156,977C o m m erc ia l and in d u s tr ia l lo a n s.......................................... 2,564 7,002
O ther loans to in d iv id u a ls ......................................................... 40,521,291 40,205,923 315,368 40,011,207 39,814,778 194,034 2,395 510,084 391,145 118,939All o th e r loan s (in c lu d in g o v e rd ra f ts ) .................................. 5,205,741 5,157,146 48,595 5,186,730 5,143,998 40,311 2,421 19,011 13,148 5,863
Miscellaneous assets—to ta l.................................................. 10,088,175 9,834,280 253,895 9,215,556 9,041,395 143,820 30,341 872,619 792,885 79,734Bank p rem ises , fu rn itu re and f ix tu re s , and real e s ta te . 5,191,748 5,096,486 95,262 4,793,519 4,753,588 23,479 16,452 398,229 342,898 55,331All o th e r m isce llane ous a s s e ts ............................................... 4,896,427 4,737,794 158,633 4,422,037 4,287,807 120,341 13,889 474,390 449,987 24,403
174 FEDERAL
DEPOSIT
INSU
RAN
CE
CO
RPO
RA
TION
Digitized for FRASER http://fraser.stlouisfed.org/ Federal Reserve Bank of St. Louis
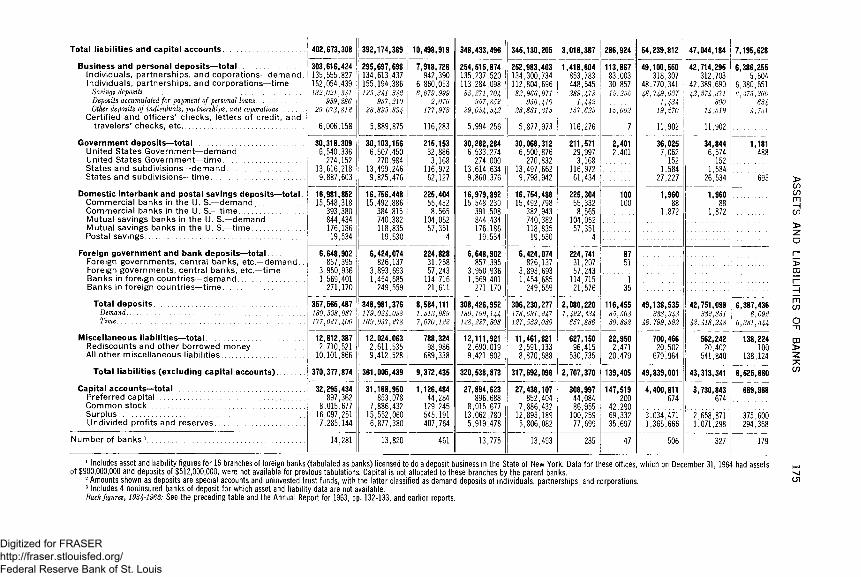
B u s iness and p e rso n a l d e p o s its — t o ta l ..............................In d iv id u a ls , p a rtn e rs h ip s , and c o p o ra tio n s— d em and In d iv id u a ls , p a rtn e rs h ip s , and co rp o ra tio n s — tim e . ..
Savings deposits...................................................................Deposits accumulated for payment of personal loans...................Other deposits of individuals, partnerships, and coporations........
C e rtifie d a nd o ff ic e rs ’ checks , le tte rs o f c re d it, and tra v e le rs ’ checks, e tc ...........................................................
G o ve rn m e n t d e p o s its — t o ta l ....................................................U n ited S ta tes G o ve rn m e n t— d e m a n d ..............................U n ited S ta tes G o ve rn m e n t— t im e ......................................S tates and su b d iv is io n s— d e m a n d ....................................S tates and su b d iv is io n s — t im e ............................................
D o m estic in te rb a n k and p o s ta l sa v in g s d e p o s its— to ta lC o m m erc ia l banks in th e U. S.— dem and . ....................C o m m erc ia l ban ks in th e U. S.— t im e ..............................M utua l savings banks in th e U. S.— d e m a n d ................M u tu a l savings ban ks in th e U. S.— t im e ........................Postal s a v in g s .............................................................................
F ore ign g o v e rn m e n t and b a n k d e p o s its — to ta lForeign g o ve rn m e n ts , ce n tra l ban ks, etc.— d em and .Foreign g o ve rn m e n ts , c e n tra l banks, e tc .— t im e ........Banks in fo re ig n co u n tr ie s — d e m a n d ...............................Banks in fo re ig n c o u n tr ie s — t im e ......................................
T o ta l d e p o s its .........................................................................Demand..........................................................................Time..............................................................................
M isce llane ous lia b ilit ie s — t o ta l ..............................................R e d iscoun ts and o th e r borrow ed m o n e y ........................All o th e r m isce lla n e o u s l ia b ilit ie s .......................................
T o ta l l ia b il i t ie s (e x c lu d in g c a p ita l a c c o u n ts )...........
C a p ita l a cco u n ts— t o ta l ...............................................................P re fe rred c a p ita l........................................................................C om m on s to c k ............................................................................S u rp lu s ...........................................................................................U n d iv ided p ro fits and re s e rv e s ..........................................
N u m b e r of b a n k s 3............................................................................
Total liabilities and capital accounts.................................. 402,673,308
303,616,424135,555,827162,054,439182 ,0 2 1 ,34 1
9 59 ,2 8 62 9 ,0 7 3 ,8 1 2
6,006,158
30,318,3096,540,336
274,15213,616,2189,887,603
16,981,85215,548,318
393,380844,434176,18619,534
6,648,902857,395
3,950,9361,569,401
271,170
357,565,4871 8 0 ,5 3 8 ,0 8 71 7 7 ,0 2 7 ,4 0 0
12,812,3872,710,521
10 ,101,866
370,377,874
32,295,434897,362
8,015,67716,097,2517,285,144
392,174,389
295,697,698134,613,437155,194,3861 2 5 ,3 4 1 ,3 4 2
9 5 7 ,2 1 02 8 ,8 9 5 ,8 3 4
5,889,875
30,103,1566,507,450
270,98413,499,2469,825,476
16,756,44815,492,886
384,815740,382118,83519,530
6,424,074826,137
3,893,6931,454,685
249,559
348,981,3761 7 9 ,0 2 4 ,0 9 81 6 9 ,9 5 7 ,2 7 8
12,024,0632,611,5359,412,528
361,005,439
31,168,950853,078
7,886,43215,552,0606,877,380
10,498,919
7,918,726942,390
6,860,0536 ,6 7 9 ,9 9 9
2 ,0 7 61 7 7 ,9 7 8
116,283
215,15332,8863,168
116,97262,127
225,40455,4328,565
104,05257,351
4
224,82831,25857,243
114,71621,611
8,584,1111 ,5 1 3 ,9 8 97 ,0 7 0 ,1 2 2
788,32498,986
689,338
9,372,435
1,126,48444,284
129,245545,191407,764
348,433,496
254,515,874135,237,520113,284,098
8 3 ,2 7 1 ,7 0 49 5 7 ,8 5 2
2 9 ,0 5 4 ,5 4 2
5,994,256
30,282,2846,533,274
274,00013,614,6349,860,376
16,979,89215,548,230
391,508844,434176,18619,534
6,648,902857,395
3,950,9361,569,401
271,170
308,426,9521 8 0 ,1 9 9 ,1 4 41 2 8 ,2 2 7 ,8 0 8
12,111,9212,690,0199,421,902
320,538,873
27,894,623896,688
8,015,67713,062,7805,919,478
345,130,205
252,983,403134,300,734112,804,696
8 2 ,9 6 6 ,9 7 19 5 6 ,4 1 0
2 8 ,8 8 1 ,3 1 5
5,877,973
30,068,3126,500,876
270,83213,497,6629,798,942
16,754,48815,492,798
382,943740,382118,83519,530
6,424,074826,137
3,893,6931,454,685
249,559
306,230,2771 7 8 ,6 9 1 ,2 4 71 2 7 ,5 3 9 ,0 3 0
11,461,8212,591,1338,870,688
317,692,098
27,438,107852,404
7,886,43212,893,1895,806,082
3,016,367 286,924 54,239,812
1,418,604853,783448,5452 8 9 ,4 7 8
1 ,4 4 21 5 7 ,6 2 5
116,276
211,57129,9973,168
116,97261,434
225,30455,3328,565
104,05257,351
4
224,74131,20757,243
114,71521,576
2,080,2201 ,4 2 2 ,3 3 4
6 5 7 ,8 8 6
627,15096,415
530,735
2,707,370
308,99744,08486,955
100,25977,699
113,86783,00330,85715 ,2 5 5
1 5 ,6 0 2
12.4012.401
100100
116,4558 5 ,5 6 33 0 ,8 9 2
22,9502,471
20,479
139,405
147,519200
42,29069,33235,697
49,100,550318,307
48,770,3414 8 ,7 4 9 ,6 3 7
1 ,4 3 41 9 ,2 7 0
11,902
36,0257,062
1521,584
27,227
1,96088
1,872
49,138,5353 3 8 ,9 4 3
4 8 ,7 9 9 ,5 9 2
700,46620,502
679,964
49,839,001
4,400,811674
3,034,4711,365,666
47,044,184 7,195,
42,714,295312,703
42,389,6904 2 ,3 7 4 ,3 7 1
8001 4 ,5 1 9
11,902
34,8446,574
1521,584
26,534
1,96088
1,872
42,751,099332,851
4 2 ,4 1 8 ,2 4 8
562,24220,402
541,840
43,313,341
3,730,843674
2,658,8711,071,298
6,386,2555,604
6,380,6516 ,3 7 5 ,2 6 6
6344 ,751
1,181
693
6,387,4366 ,0 9 2
6 ,3 8 1 ,3 4 4
138,224100
138,124
6,525,660
375,600294,368
14,281 13,820 461 13,775 13,493 235 47 506 327 179
1 Includes asset and liability figures for 16 branches of foreign banks (tabulated as banks) licensed to do a deposit business in the State of New York. Data for these offices, which on December 31,1964 had assets of $900,000,000 and deposits of $512,000,000, were not available for previous tabulations. Capital is not allocated to these branches by the parent banks.
2 Amounts shown as deposits are special accounts and uninvested trust funds, with the latter classified as demand deposits of individuals, partnerships, and corporations.3 Includes 4 noninsured banks of deposit for which asset and liability data are not available.Back figures, 1934-1963: See the preceding table and the Annual Report for 1963, pp. 132-133, and earlier reports.
ASSETS AND
LIABILITIES OF
BANKS 175
Digitized for FRASER http://fraser.stlouisfed.org/ Federal Reserve Bank of St. Louis
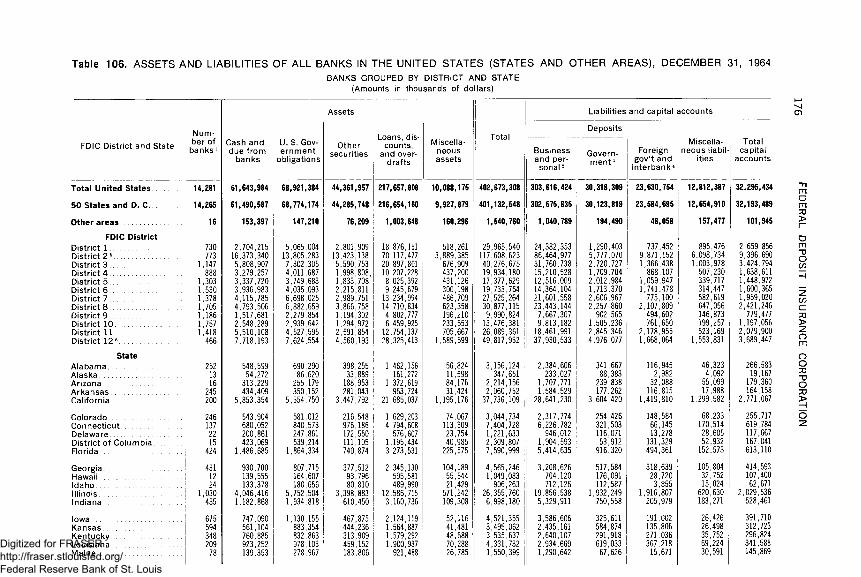
Table 106. ASSETS AND LIABILITIES OF ALL BANKS IN THE UNITED STATES (STATES AND OTHER AREAS), DECEMBER 31, 1964BANKS GROUPED BY DISTRICT AND STATE
(Am ounts in thousands of do lla rs)
FDIC D is tr ic t and State
N u m ber o f
b a n k s 1
Assets
Total
L iab ilities and cap ita l accou n ts
Cash and due fro m
banks
U. S. Gove rn m e n t
ob liga tions
O thersecurities
Loans, d iscounts,
and overd ra fts
M isce lla neousassets
Business and p e r
sonal 2
Deposits
G overnm e n t5
Foreign g o v ’t and
in te rb a n k 4
M iscellaneous lia b il
ities
Totalcap ita l
accounts
Total United States............. 14,281 61,643,984 68,921,384 44,361,957 217,657,808 10,088,175 402,673,308 303,616,424 30,318,309 23,630,754 12,812,387 32,295,434
50 States and D. C .............. 14,265 61,490,587 68,774,174 44,285,748 216,654,160 9,927,879 401,132,548 302,575,635 30,123,819 23,584,695 12,654,910 32,193,489
Other areas........................... 16 153,397 147,210 76,209 1,003,648 160,296 1,540,760 1,040,789 194,490 46,059 157,477 101,945
FDIC DistrictD is tr ic t 1 .................................... 730 2,704,215 5,065,004 2,801,909 18,876,151 518,261 29,965,540 24,382,353 1,290,403 737,452 895,476 2,659,856D is tr ic t 2 5................................. 773 16,373,340 13,805,283 13,423,138 70,117,477 3,889,385 117,608,623 86,464,977 5,777,070 9,871,152 6,098,734 9,396,690D is tr ic t 3 .................................... 1,147 5,808,907 7,302,305 5,590,753 20,897,801 676,909 40,276,675 31,760,738 2,720,727 1,366,438 1,003,978 3,424,794D is tr ic t 4 .................................... 888 3,279,257 4,011,687 1,998,808, 10,207,228 437,200 19,934,180 15,210,528 1,709,704 868,107 507,230 1,638,611D is tr ic t 5 ................................... 1,303 3,337,720 3,749,683 1,833,708 8,025,392 431,126 17,377,629 12,516,009 2,012,984 1,059,947 339,717 1,448,972D is tr ic t 6 .................................... 1,530 3,936,983 4,035,093 2,215,811 9,245,679 300,198 19,733,764 14,364,104 1,713,370 1,741,478 314,447 1,600,365D is tr ic t 7 .................................... 1,378 4,115,785 6,698,025 2,989,751 13,234,994 486,709 27,525,264 21,601,558 2,606,967 775,100 582,619 1,959,020D is tr ic t 8 .................................... 1,705 4,793,506 6,882,659 3,866,758 14,710,834 623,358 30,877,115 23,443,144 2,257,860 2,107,809 647,056 2,421,246D is tr ic t 9 .................................... 1,186 1,517,681 2,279,854 1,194,302 4,802,777 196,210 9,990,824 7,667,307 902,565 494,602 146,873 779,477D is tr ic t 1 0 ................................. 1,757 2,548,289 2,939,642 1,294,972 6,459,925 233,553 13,476,381 9,813,182 1,505,236 761,650 199,257 1,197,056D is tr ic t 1 1 ................................. 1,418 5,510,108 4,527,595 2,591,854 12,754,137 705,667 26,089,361 18,461,991 2,845,346 2,178,955 523,169 2,079,900D is tr ic t 1 2 6............................... 466 7,718,193 7,624,554 4,560,193 28,325,413 1,589,599 49,817,952 37,930,533 4,976,077 1,668,064 1,553,831 3,689,447
StateA la b a m a .................................... 252 548,599 690,290 398,255 1,462,156 56,824 3,156,124 2,384,606 341,667 116,945 46,323 266,583A la s k a ......................................... 13 54,272 86,620 33,889 161,272 11,598 347,651 233,027 88,383 2,982 4,092 19,167A riz o n a ....................................... 16 313,229 255,179 188,953 1,372,619 84,176 2,214,156 1,707,771 239,838 32,088 55,099 179,360A rk a n s a s ................................... 245 434,409 350,152 281,043 963,724 31,424 2,060,752 1,584,529 177,262 116,815 17,988 164,158C a lifo rn ia ................................... 200 5,853,354 5,554,750 3,447,792 21,685,037 1,195,176 37,736,109 28,641,230 3,604,420 1,419,810 1,299,582 2,771,067
C o lo ra d o .................................... 246 543,904 581,012 216,548 1,629,203 74,067 3,044,734 2,317,774 254,426 148,584 68,233 255,717C o n n e c tic u t.............................. 137 680,052 840,573 976,186 4,794,608 113,309 7,404,728 6,226,782 321,503 66,145 170,514 619,784D e law are ................................... 22 200,861 247,861 172,550 576,607 23,754 1,221,633 946,012 116,071 13,278 28,605 117,667D is tr ic t o f C o lu m b ia ............. 15 423,069 539,214 111,105 1,195,434 40,985 2,309,807 1,904,593 53,912 131,329 52,932 167,041F lo rid a ........................................ 424 1,486,685 1,864,334 740,874 3,273,531 225,575 7,590,999 5,414,635 916,320 494,361 152,573 613,110
G e o rg ia ...................................... 431 930,700 807,715 377,512 2,345,130 104,189 4,565,246 3,208,626 517,584 318,639 105,804 414,593H a w a ii......................................... 12 139,555 164,607 93,796 595,581 55,544 1,049,083 704,120 176,091 28,720 32,752 107,400Id a h o .......................................... 24 133,378 180,656 80,810 489,990 21,429 906,263 712,126 112,587 3,855 15,024 62,671I ll in o is ......................................... 1,030 4,046,416 5,752,504 3,398,883 12,586,715 571,242 26,355,760 19,856,538 1,932,249 1,916,807 620,630 2,029,536In d ia n a ....................................... 435 1,182,868 1,934,818 610,450 3,160,736 109,308 6,998,180 5,329,911 750,558 205,979 183,271 528,461
Io w a ............................................. 675 747,090 1,130,155 467,875 2,124,119 52,116 4,521,355 3,586,606 325,611 191,002 26,426 391,710K a n s a s ....................................... 594 561,104 883,354 444,236 1,564,887 41,481 3,495,062 2,435,161 584,874 135,806 26,498 312,723K e n tu c k y ...................................L o u is ia n a ..................................
348 760,885 832,863 313,909 1,579,292 48,688 3,535,637 2,640,107 291,918 271,036 35,752 296,824209 923,252 978,103 459,152 1,900,937 70,288 4,331,732 2,934,669 619,033 367,218 69,224 341,588
M a in e .......................................... 78 139,353 278,967 183,806 921,488 26,785 1,550,399 1,290,642 67,626 15,671 30,591 145,869
FEDERAL DEPO
SIT IN
SUR
ANC
E C
OR
PO
RA
TION
Digitized for FRASER http://fraser.stlouisfed.org/ Federal Reserve Bank of St. Louis
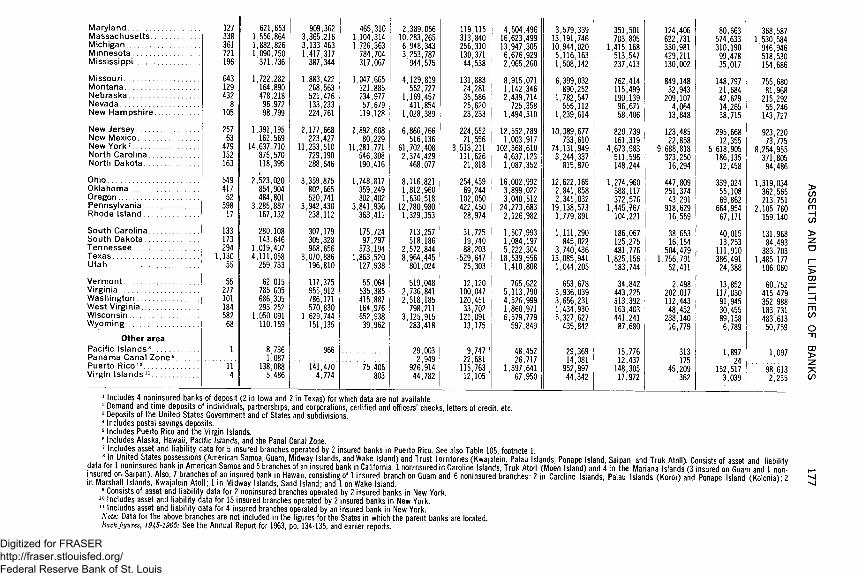
M a ry la n d ................................... 127 621,653 909,362 465,310 2,389,056M a s s a c h u s e tts ........................ 338 1,556,864 3,365,216 1,104,314 10,283,265M ic h ig a n .................................... 361 1,882,826 3,133,463 1,726,363 6,948,343M in n e s o ta ................................. 721 1,090,750 1,417,317 784,704 3,253,787M is s is s ip p i................................ 196 371,736 387,344 317,067 944,575
M is s o u r i..................................... 643 1,722,282 1,883,422 1,047,665 4,129,819M o n ta n a ..................................... 129 164,890 268,563 121,885 562,727N e b ra s k a ................................... 432 478,218 521,476 234,977 1,169,457N e va d a ....................................... 8 96,972 133,233 57,679 411,854New H a m p s h ire ...................... 105 98,799 224,761 119,128 1,028,389
New J e rs e y ............................... 257 1,391,195 2,177,668 1,892,608 6,866,766New M e x ico .............................. 63 162,569 223,427 80,229 516,136New Y o rk 7................................. 479 14,637,710 11,233,510 11,281,771 61,702,408N orth C a ro lin a ......................... 152 875,570 729,190 546,308 2,374,429N orth D a k o ta ........................... 163 118,395 288,646 190,416 468,077
O h io ............................................. 549 2,523,020 3,359,875 1,748,817 8,116,821O k la h o m a .................................. 417 854,904 802,665 359,249 1,812,960O re g o n ........................................ 52 484,801 520,741 302,402 1,630,518P e n n s y lv a n ia ........................... 598 3,285,887 3,942,430 3,841,936 12,780,980Rhode Is la n d ........................... 17 167,132 238,112 363,411 1,329,353
South C a ro lin a ........................ 133 280,108 307,179 175,724 713,257S outh D a k o ta ........................... 173 143,646 305,328 97,297 518,186T e n n e s s e e ................................ 294 1,019,407 968,656 573,194 2,572,844T e x a s ........................................... 1,130 4,111,058 3,070,886 1,863,520 8,964,445U ta h ............................................. 55 259,733 196,810 127,938 801,024
V e rm o n t..................................... 55 62,015 117,375 55,064 519,048V irg in ia ....................................... 277 785,605 955,912 535,385 2,736,841W a sh in g to n .............................. 101 686,305 786,171 415,887 2,518,185W est V irg in ia ............................ 184 293,252 570,830 164,976 798,211W isco n s in .................................. 582 1,050,091 1,629,744 652,938 3,125,915W y o m in g .................................... 68 110,159 151,135 39,962 283,418
O ther areaPacific Is la n d s 8....................... 1 8,736 966 29,003Panam a Canal Z o n e 9........... 1,087 2 949Puerto R ic o 10...........................V irg in Is la n d s 11.......................
114
138,0885,486
141,4704,774
75,406803
926*91444,782
1 Includes 4 noninsured banks of deposit (2 in Iowa and 2 in Texas) for which data are not available.2 Demand and time deposits of individuals, partnerships, and corporations, certified and officers’ check3 Deposits of the United States Government and of States and subdivisions.4 Includes postal savings deposits.5 Includes Puerto Rico and the Virgin Islands.6 Includes Alaska, Hawaii, Pacific Islands, and the Panal Canal Zone.7 Includes asset and liability data for 5 insured branches operated by 2 insured banks in Puerto Rico. S8 In United States possessions (American Samoa, Guam, Midway Islands, and Wake Island) and Trust T
data for 1 noninsured bank in American Samoa and 5 branches of an insured bank in California, 1 noninsured insured on Saipan). Also, 7 branches of an insured bank in Hawaii, consisting of 1 insured branch on Guam in Marshall Islands, Kwajalein Atoll; 1 in Midway Islands, Sand Island; and 1 on Wake Island.
9 Consists of asset and liability data for 2 noninsured branches operated by 2 insured banks in New Yo10 Includes asset and liability data for 15 insured branches operated by 2 insured banks in New York.11 Includes asset and liability data for 4 insured branches operated by an insured bank in New York. Note: Data for the above branches are not included in the figures for the States in which the parent bar Back figures, 1945-1963: See the Annual Report for 1963, pp. 134-135, and earlier reports.
119,115313,840256,310130,37144,538
4,504,49616,623,49913,947,3056,676,9292,065,260
3,579,33913,191,74610,944,0205,116,1631,508,142
351,501703,805
1,415,168513,547237,413
124,406622,731330,981429,211130,002
80,663574,633310,19099,47835,017
368,5871,530,584
946,946518,530154,686
131,88324,28135,58625,62023,233
8,915,0711,142,3462,439,714
725,3581,494,310
6,399,032890,252
1,782,547555,112
1,239,614
762,414115,499190,13996,67158,406
849,14832,943
209,1074,064
13,848
148,79721,68442,62914,26538,715
755,68081,968
215,29255,246
143,727
224,55221,556
3,513,211111,62621,818
12,552,7891,003,917
102,368,6104,637,1231,087,352
10,389,677733,610
74,131,9493,244,337
815,870
820,739161,319
4,673,983511,596148,244
123,48522,858
9,688,818323,250
16,294
295,66812,355
5,618,905186,13512,458
923,22073,775
8,254,955371,80594,486
254,45969,244
102,050422,45028,974
16,002,9923,899,0223,040,512
24,273,6832,126,982
12,622,1652,841,8582,341,032
19,138,5731,779,891
1,274,960388,117372,576
1,445,767104,221
447,809251,37443,291
918,62916,559
339,02455,10869,862
664,95467,171
1,319,034362,565213,751
2,105,760159,140
31,72519,74088,203
529,64725,303
1,507,9931,084,1975,222,304
18,539,5561,410,808
1,111,290845,022
3,740,43613,085,9411,044,205
186,067125,275481,776
1,825,156183,744
38,65316,154
504,4791,756,791
52,411
40,01513,253
111,910386,49124,388
131,96884,493
383,7031,485,177
106,060
12,120100,047120,45133,702
121,09113,175
765,6225,113,7904,526,9991,860,9716,579,779
597,849
653,6783,936,0393,656,2311,434,9305,327,627
435,842
34,842443,225313,392163,403441,24187,680
2,498202,017112,44348,452
238,14016,779
13,852117,03091,94530,45589,1586,789
60,752415,479352,988183,731483,61350,759
9,74722,681
48,45226,717
29,36914,081
15,77612,437
313175
1,89724
1,097
115,76312,105
1,397,64167,950
952,99744,342
148,30517,972
45,209362
152,5173,039
98,6132,235
;, letters of credit, etc.
3 also Table 105, footnote 1.ritories (Kwajalein, Palau Islands, Ponape Island, Saipan, and Truk Atoll). Consists of asset and liability Caroline Islands, Truk Atoll ’(Moen Island) and 4 in the Mariana Islands (3 insured on Guam and 1 non-
id 6 noninsured branches: 2 in Caroline Islands, Palau Islands (Koror)and Ponape Island (Kolonia); 2
are located.
ASSETS AND
LIABILITIES OF
BANKS 177
Digitized for FRASER http://fraser.stlouisfed.org/ Federal Reserve Bank of St. Louis
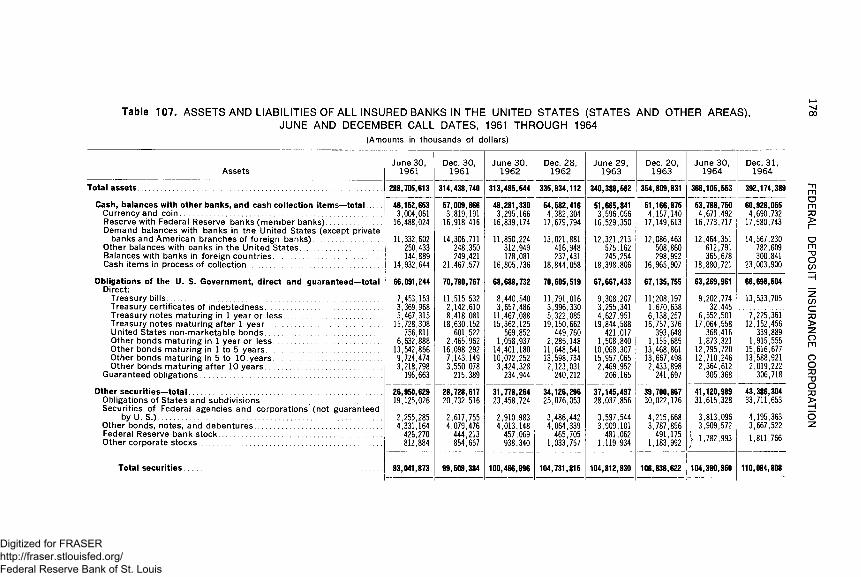
Table 107. ASSETS AND LIABILITIES OF ALL INSURED BANKS IN THE UNITED STATES (STATES AND OTHER AREAS),JUNE AND DECEMBER CALL DATES, 1961 THROUGH 1964
(Amounts in thousands of dollars)
June 30, 1961
Dec. 30, 1961
June 30, 1962
Dec. 28 , 1962
June 29, 1963
Dec. 20, 1963
June 30 , 1 964
Dec. 31, 1964
288,705,613 314,438,740 313,495,544 335,934,112 340,388,582 354,809,831 366,105,553 392,174,389
46,152,6533,004,061
16,488,024
11,332,602250,433144,889
14,932,644
57,009,6663,819,191
16,918,416
14,306,711248,350249,421
21,467,577
49,281,3303,295,166
16,839,174
11,850,224312,949178,081
16,805,736
54,582,4164,382,304
17,679,794
13,021,881416,948237,431
18,844,058
51,665,8413,596,056
16,529,350
12,321,213575,162245,254
18,398,806
51,166,9754,157,140
17,149,613
12,086,463508,860298,992
16,965,907
53,768,7504,671,492
16,773,717
12,464,351612,791365,678
18,880,721
60,926,0554,690,732
17,580,743
14,567,230782,609300,841
23,003,900
66,091,244
7,453,1533,369,9685,467,315
15,728,308756,811
6,632,88813,542,8669,724,4743,218,798
196,663
70,780,767
11,515,5322,142,6108,418,081
18,630,152601,522
2,465,96216,098,2927,143,1493,550,078
215,389
68,688,732
8,440,5403,657,486
11,467,08815,362,125
569,8521,058,937
14,401,18010,072,2523,424,328
234,944
70,605,519
11,791,0163,996,3305,322,085
19,150,662449,760
2,285,14811,648,54113,598,7342,123,031
240,212
67,667,433
9,308,2073,255,3414.627.951
19,844,588421,017
1,508,84010,068,30715,957,0652.469.952
206,165
67,135,755
11;208,197 1,670,638 6,138,257
16,757,376 393,648
1,155,685 13,468,861 13,667,498 2,433,898
241,697
63,269,961
9,202,77432,445
6,552,50117,064,558
368,4161,873,321
12,795,72012,710,2462,364,612
305,368
66,698,504
13,533,705
7,225,36112,152,456
339,8891,915,555
15,616,67713,588,9212,019,222
306,718
26,950,62919,125,026
2,255,2854,331,164
426,270812,884
28,728,61720,732,516
2,617,7554,079,476
444,213854,657
31,778,26423,458,724
2,910,9834,013,148
457,069938,340
34,126,29625,076,053
3,486,4424,064,339
465,7051,033,757
37,145,49728,037,856
3,597,5443,909,101
481,0621,119,934
39,700,86730,022,176
4,215,6683,787,856
491,1751,183,992
41,120,98931,615,328
3,813,0963,909,572
| 1,782,993
43,386,30433,711,653
4,195,3633,667,522
1,811,766
93,041,873 99,509,384 100,466,996 104,731,815 104,812,930 106,836,622 104,390,950 110,084,808
Asse ts
Total assets.
Cash, balances with other banks, and cash collection items—total......C u rrency and c o in .....................................................................................................Reserve w ith Federa l Reserve ban ks (m e m b e r b a n k s )...........................D em and ba lances w ith banks in th e U n ite d S ta tes (excep t priva te
banks and A m e rica n b ranche s o f fo re ig n b a n k s ).................................O th e r balances w ith ban ks in th e U n ite d S ta te s ........................................Ba lances w ith ban ks in fo re ig n c o u n tr ie s ......................................................Cash ite m s in process o f c o lle c tio n .................................................................
Obligations of the U. S. Government, direct and guaranteed—totalD irect:
T re a su ry b il ls ...........................................................................................................T re a su ry c e rtif ic a te s o f in d e b te d n e s s ..........................................................T reasury no tes m a tu rin g in 1 ye a r o r le s s ................................................T re a su ry n o te s m a tu rin g a fte r 1 y e a r .........................................................U n ited S ta tes n o n -m a rk e ta b le b o n d s ..........................................................O th e r b on ds m a tu rin g in 1 ye a r o r le s s ......................................................O th e r b on ds m a tu rin g in 1 to 5 y e a rs .........................................................O ther bon ds m a tu rin g in 5 to 1 0 .y e a rs ......................................................O th e r bon ds m a tu rin g a fte r 10 y e a rs ..........................................................
G uaran te ed o b lig a tio n s ...........................................................................................
Other securities—tota l......................................................................................O bliga tions o f S ta tes a nd s u b d iv is io n s ...................... ...................................S e curities o f Federa l agencies and c o rp o ra tio n s (n o t gua ran teed
by U. S .) ..............................................................................................................O th e r bonds, no tes, and d e b e n tu re s .............................................................Federa l Reserve ban k s to c k ...............................................................................O th e r co rp o ra te s to c k s .........................................................................................
Total securities
178 FEDERAL
DEPOSIT
INSU
RAN
CE
CO
RP
OR
ATIO
N
Digitized for FRASER http://fraser.stlouisfed.org/ Federal Reserve Bank of St. Louis
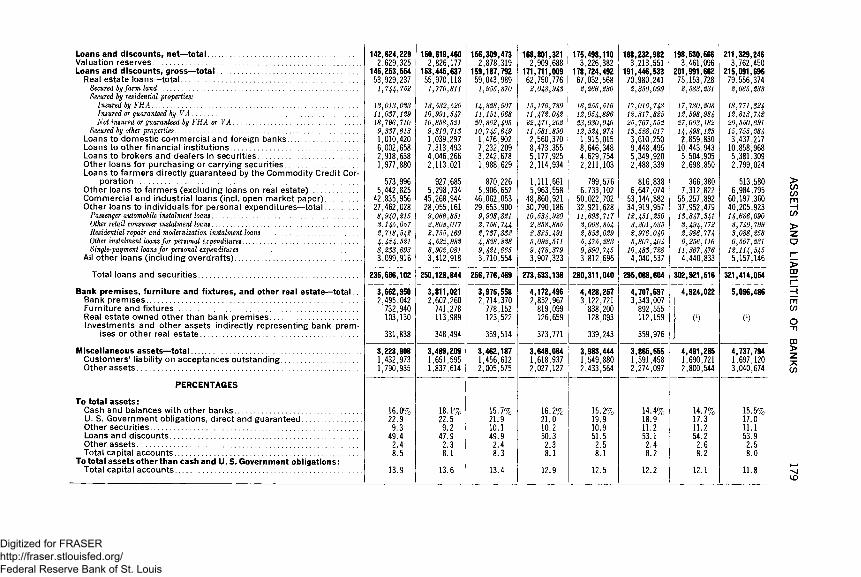
Loans and discounts, net—tota l..................................................................... 142,624,229 150,619,460 156,309,473 168,801,321 175,498,110 188,232,982 198,530,566 211,329,246V aluation re s e rv e s ........................................................................................................ 2,629,325 2,826,177 2,878,319 2,909,688 3,226,382 3,213,551 3,461,096 3,762,450Loans and discounts, gross—tota l................................................................. 145,253,554 153,445,637 159,187,792 171,711,009 178,724,492 191,446,533 201,991,662 215,091,696
Real es ta te loans— to ta l.......................................................................................... 53,929,237 55,970,118 59,043,989 62,750,776 67,032,568 70,980,241 75,153,728 79,556,374Secured by farm land....................................................................................... 1 ,7 4 4 ,7 5 2 1 ,7 7 6 ,8 1 1 1 ,9 5 5 ,8 7 0 2 ,0 4 8 ,9 4 3 2 ,2 6 6 ,2 3 6 2 ,3 5 0 ,0 9 9 2 ,5 8 3 ,2 3 1 2 ,6 6 5 ,2 3 3Secured by residential properties:
Insured by F H A ......................................................................................... 1 3 ,0 1 3 ,0 3 3 1 3 ,5 3 2 ,5 2 6 1 4 ,3 2 8 ,9 0 7 1 5 ,1 7 6 ,7 3 9 1 6 ,2 5 5 ,5 1 6 1 7 ,0 1 6 ,7 4 8 1 7 ,7 8 0 ,2 0 8 1 8 ,7 7 1 ,3 2 4Insured or guaranteed by V A ........................................................................ 1 1 ,0 3 7 ,1 2 9 1 0 ,9 9 1 ,5 4 7 1 1 ,1 5 1 ,0 6 8 1 1 ,4 7 2 ,0 4 2 1 2 ,0 5 4 ,8 9 6 1 2 ,3 1 7 ,8 2 5 1 2 ,5 9 8 ,9 8 4 1 2 ,8 1 3 ,7 4 2Not insured or guaranteed by FHA or V A ....................................................... 1 8 ,7 9 6 ,7 1 0 1 9 ,8 5 8 ,5 2 1 2 0 ,8 6 2 ,4 9 5 2 2 ,4 7 1 ,2 0 2 2 3 ,9 3 0 ,9 4 6 2 5 ,7 6 7 ,5 5 2 2 7 ,6 9 3 ,1 8 2 2 9 ,5 5 0 ,6 9 1
Secured by other properties................................................................................ 9 ,3 3 7 ,6 1 3 9 ,8 1 0 ,7 1 3 1 0 ,7 4 5 ,6 4 9 1 1 ,5 8 1 ,8 5 0 1 2 ,5 2 4 ,9 7 4 1 3 ,5 2 8 ,0 1 7 1 4 ,4 9 8 ,1 2 3 1 5 ,7 5 5 ,3 8 4Loans to d o m e s tic co m m e rc ia l and fo re ign b a n k s .................................... 1,010,420 1,039,297 1,476,902 2,560,370 1,915,015 3,610,250 2,859,830 3,437,217Loans to o th e r f in a n c ia l in s t itu t io n s ................................................................. 6,002,658 7,313,493 7,232,209 8,473,355 8,646,348 9,448,495 10,443,943 10,858,968Loans to b ro ke rs and dea le rs in s e c u r it ie s ................................................... 2,918,638 4,046,266 3,242,678 5,177,925 4,629,754 5,349,920 5,504,905 5,381,309O ther loans fo r p u rch a s in g o r c a rry in g s e c u r it ie s ...................................... 1,977,880 2,113,021 1,988,629 2,114,934 2,211,103 2,488,339 2,698,850 2,799,024Loans to fa rm e rs d ire c tly gua ra n te e d by the C o m m odity C re d it Cor
po ra tion ................................................................................................................. 573,996 927,685 870,226 1,111,661 799,576 816,838 366,380 513,580O th e r loans to fa rm e rs (e xc lu d in g loans on real e s ta te ).......................... 5,442,825 5,298,734 5,906,652 5,963,558 6,733,102 6,647,074 7,312,822 6,984,795C o m m erc ia l and in d u s tr ia l loans (inc l. open m a rke t p a p e r).................. 42,835,956 45,268,944 46,062,053 48,860,921 50,022,702 53,144,882 55,257,892 60,197,360O ther loans to in d iv id u a ls fo r persona l e xpe nd itu re s— to ta l.................. 27,462,028 28,055,161 29,653,900 30,790,186 32,921,628 34,919,957 37,952,479 40,205,923
Passenger automobile instalment loans................................................................ 8 ,9 4 0 ,2 1 5 9 ,0 6 6 ,8 5 1 9 ,9 0 8 ,8 2 1 1 0 ,5 3 4 ,9 2 0 1 1 ,6 9 3 ,7 1 7 1 2 ,4 5 1 ,2 5 0 1 3 ,8 4 7 ,3 4 1 1 4 ,6 8 6 ,0 9 0Other retail consumer instalment loans................................................................ 3 ,1 4 5 ,0 5 7 2 ,8 0 8 ,0 7 7 2 ,7 5 6 ,7 4 4 2 ,8 5 8 ,8 8 5 3 ,0 0 8 ,8 5 4 3 ,2 0 1 ,5 3 5 3 ,4 9 4 ,7 7 2 3 ,7 4 9 ,7 9 9Residential repair and modernization instalment loans.......................................... 2 ,7 1 8 ,5 4 2 2 ,7 5 5 ,1 6 9 2 ,7 3 7 ,8 3 2 2 ,8 2 5 ,4 9 1 2 ,8 5 3 ,0 2 9 2 ,9 7 6 ,0 4 0 2 ,9 8 6 ,7 7 4 3 ,0 8 8 ,2 5 8Other instalment loans for personal expenditures....................................... ........... 4 ,4 2 4 ,5 2 1 4 ,5 2 2 ,9 8 3 4 ,8 2 8 ,8 3 8 5 ,0 9 2 ,5 1 1 5 ,4 7 5 ,2 8 3 5 ,8 0 7 ,4 0 4 6 ,2 5 6 ,1 1 6 6 ,5 6 7 ,2 3 1Single-payment loans for personal expenditures.................................................... 8 ,2 3 3 ,6 9 3 8 ,9 0 2 ,0 8 1 9 ,4 2 1 ,6 6 5 9 ,4 7 8 ,3 7 9 9 ,8 9 0 ,7 4 5 1 0 ,4 8 3 ,7 2 8 1 1 ,3 6 7 ,4 7 6 1 2 ,1 1 4 ,5 4 5
All o th e r loan s ( in c lu d in g o v e rd ra f ts ) ............................................................... 3,099,916 3,412,918 3,710,554 3,907,323 3,812,696 4,040,537 4,440,833 5,157,146
T ota l loan s and s e c u r it ie s ................................................................................. 235,666,102 250,128,844 256,776,469 273,533,136 280,311,040 295,069,604 302,921,516 321,414,054
Bank premises, furniture and fixtures, and other real estate—total .. 3,662,950 3,811,021 3,975,558 4,172,496 4,428,257 4,707,697 4,924,022 5,096,486Bank p re m is e s ........................................................................................................... 2,495,042 2,607,260 2,714,370 2,852,967 3,122,721 3,343,007 ]F u rn itu re and f ix tu re s ............................................................................................. 732,940 741,278 778,152 819,099 838,200 892,555 IReal e s ta te ow ned o th e r th a n ban k p re m is e s ............................................. 103,130 113,989 123,522 126,659 128,093 112,159 \ 0) (:)In ve s tm e n ts and o th e r asse ts in d ire c tly re p re se n tin g bank p re m I
ises o r o th e r real e s ta te ................................................................................ 331,838 348,494 359,514 373,771 339,243 359,976 )
Miscellaneous assets—total............................................................................. 3,223,908 3,489,209 3,462,187 3,646,064 3,983,444 3,865,555 4,491,265 4,737,794C u s to m e rs ' lia b ility on a ccep tance s o u ts ta n d in g ........................................ 1,432,973 1,651,595 1,456,612 1,618,937 1,549,880 1,591,458 1,690,721 1,697,120O th e r a s s e ts ................................................................................................................ 1,790,935 1,837,614 2,005,575 2,027,127 2,433,564 2,274,097 2,800,544 3,040,674
PERCENTAGES
To total assets:Cash and ba lances w ith o th e r b a n k s ............................................................... 16.0% 18.1% 15.7% 16.2% 15.2% 14.4% 14.7% 15.5%U. S. G o ve rn m e n t ob lig a tio n s , d ire c t and g u a ra n te e d ............................. 22.9 22.5 21.9 21.0 19.9 18.9 17.3 17.0O th e r s e c u r it ie s ......................................................................................................... 9.3 9.2 10.1 10.2 10.9 11.2 11.2 11.1Loans a nd d is c o u n ts ............................................................................................... 49.4 47.9 49.9 50.3 51.5 53.1 54.2 53.9O th e r a s s e ts ................................................................................................................ 2.4 2.3 2.4 2.3 2.5 2.4 2.6 2.5To ta l ca p ita l a c c o u n ts ............................................................................................. 8.5 8.1 8.3 8.1 8.1 8.2 8.2 8.0
To total assets other than cash and U. S. Government obligations:T ota l ca p ita l a c c o u n ts ............................................................................................. 13.9 13.6 13.4 12.9 12.5 12.2 12.1 11.8
ASSETS AND
LIABILITIES OF
BANKS 179
Digitized for FRASER http://fraser.stlouisfed.org/ Federal Reserve Bank of St. Louis

Table 107. ASSETS AND LIABILITIES OF ALL INSURED BANKS IN THE UNITED STATES (STATES AND OTHER AREAS),JUNE AND DECEMBER CALL DATES, 1961 THROUGH 1964— CONTINUED
(Amounts in thousands of dollars)
L iab ilities and cap ita l
T o ta l lia b il i t ie s and c a p ita l a c c o u n ts .......................................................................
B u s in e ss and p ersona l d e p o s its — t o ta l ...............................................................In d iv id u a ls , p a rtn e rsh ip s , and co rp o ra tio n s — d e m a n d ............................In d iv id u a ls , p a rtn e rsh ip s , and c o rp o ra tio n s — t im e .....................................
Savings deposits..............................................................................................Deposits accumulated for payment of personal loans..............................................Other deposits of individuals, partnerships, and corporations...................................
C ertified and o ffic e rs ’ checks, le tte rs o f c re d it, and tra ve le rs ’ checks etc,
G overnm e nt d e p o s its— t o ta l .....................................................................................U n ited S tates G overnm e nt— d e m a n d ...............................................................U n ited S tates G overnm e nt— t im e .......................................................................S tates and subd iv is ions— d e m a n d .....................................................................S tates and subd iv is ions— t im e ..............................................................................
D o m estic in te rb a n k and po s ta l sav ings d e p o s its — t o ta l .............................C om m ercia l banks in th e U. S.— d e m a n d .......................................................C om m ercia l banks in th e U. S.— t im e ...............................................................M utua l savings banks in th e U. S.— d e m a n d ................................................M utua l savings banks in th e U. S .— t im e ........................................................Postal sa v in g s ..............................................................................................................
Foreign g o ve rn m e n t and ba n k d e p o s its— t o ta l ................................................Foreign gove rnm ents , ce n tra l banks, e tc .— d e m a n d .................................Foreign gove rnm ents , ce n tra l banks, e tc .— t im e .........................................Banks in fo re ign co u n tr ie s— d e m a n d ................................................................B anks in fo re ign co u n tr ie s— t im e .......................................................................
T o ta l d e p o s its ..........................................................................................................Demand......................................................................................................Time..........................................................................................................
June 30, 1961
Dec. 30, 1961
June 30, 1962
Dec. 28, 1962
June 29, 1963
Dec. 20, 1963
June 30, 1964
Dec. 31, 1964
288,705,613 314,438,740 313,495,544 335,934,112 340,388,582 354,809,831 366,105,553 392,174,389
216,779,674108,738,879104,296,059
9 3 ,3 7 9 ,5 8 2773 ,8 5 2
1 0 ,1 4 2 ,6 2 53,744,736
236,462,979123,736,675107,682,172
9 6 ,9 9 6 ,5 2 97 72 ,1 5 0
9 ,9 1 3 ,4 9 35,044,132
233,748,980111,730,739117,596,0621 0 1 ,6 4 8 ,5 5 7
7 6 5 ,9 3 31 5 ,1 8 1 ,5 7 24,422,179
252,498,086123,554,500124,486,8601 0 6 ,8 4 1 ,3 7 7
784 ,5311 6 ,8 6 0 ,9 5 24,456,726
253,187,093116,024,030132,715,2991 1 1 ,6 2 1 ,5 0 6
790 ,3 8 02 0 ,3 0 3 ,4 1 34,447,764
266,669,373123,842,677138,370,4251 1 4 ,7 3 8 ,5 5 0
8 37 ,0 8 12 2 ,7 9 4 ,7 9 44,456,271
273,587,716121,036,112147,739,2551 1 9 ,8 5 8 ,8 2 2
8 9 5 ,3 8 72 6 ,9 8 5 ,0 4 64,812,349
295,697,698134,613,437155,194,3861 2 5 ,3 4 1 ,3 4 2
9 57 ,2 1 0
2 8 ,8 9 5 ,8 3 45,889,875
23,742,7966,367,691
283,41111,838,5235,253,171
23,904,9255,949,325
280,09612,217,6825,457,822
27,970,2189,544,587
295,84011,794,8776,334,914
25,611,0346,833,754
266,19912,066,0836,444,998
31,127,76311,026,837
250,83412,388,6737,461,419
27,171,2776,734,239
268,30012,263,4357,905,303
31,764,28810,257,861
257,57412,562,5828,686,271
30,103,1566,507,450
270,98413,499,2469,825,476
12,668,98711,849,410
173,437605,54423,00417,592
16,681,39815,751,964
197,186700,35515,11316,780
13,341,49712,392,738
218,066669,33742,90118,455
14,889,92113,907,406
241,908684,28538,15318,169
13,980,53212,924,632
281,667710,09146,88817,254
14,270,00013,323,112
269,914610,29449,25217,428
14,261,22313,051,155
359,132749,16882,56119,207
16,756,44815,492,886
384,815740,382118,83519,530
3,604,283652,063
1,811,0701,031,500
109,650
4,255,164656,922
2,178,0551,297,787
122,400
4,138,626660,437
2,162,5391,182,770
132,880
4,548,654724,335
2,431,6881,265,391
127,240
4,854,482626,447
2,856,9241,264,201
106,910
5,193,098841,612
3,045,4481,177,311
128,727
5,733,893675,616
3,574,2541,316,494
167,529
6,424,074826,137
3,893,6931,454,685
249,559
256,795,7401 4 4 ,8 2 8 ,3 4 61 1 1 ,9 6 7 ,3 9 4
281,304,4661 6 5 ,3 5 4 ,8 4 21 1 5 ,9 4 9 ,6 2 4
279,199,3211 5 2 ,3 9 7 ,6 6 41 2 6 ,8 0 1 ,6 5 7
297,547,6951 6 3 ,4 9 2 ,4 8 01 3 4 ,0 5 5 ,2 1 5
303,149,8701 5 9 ,4 1 2 ,6 7 51 4 3 ,7 3 7 ,1 9 5
313,303,7481 6 3 ,2 4 8 ,9 5 11 5 0 ,0 5 4 ,7 9 7
325,347,1201 6 4 ,4 6 1 ,3 3 71 6 0 ,8 8 5 ,7 8 3
348,981,3761 7 9 ,0 2 4 ,0 9 81 6 9 ,9 5 7 ,2 7 8
180 FEDERAL
DEPOSIT
INSU
RAN
CE
CO
RPO
RA
TION
Digitized for FRASER http://fraser.stlouisfed.org/ Federal Reserve Bank of St. Louis
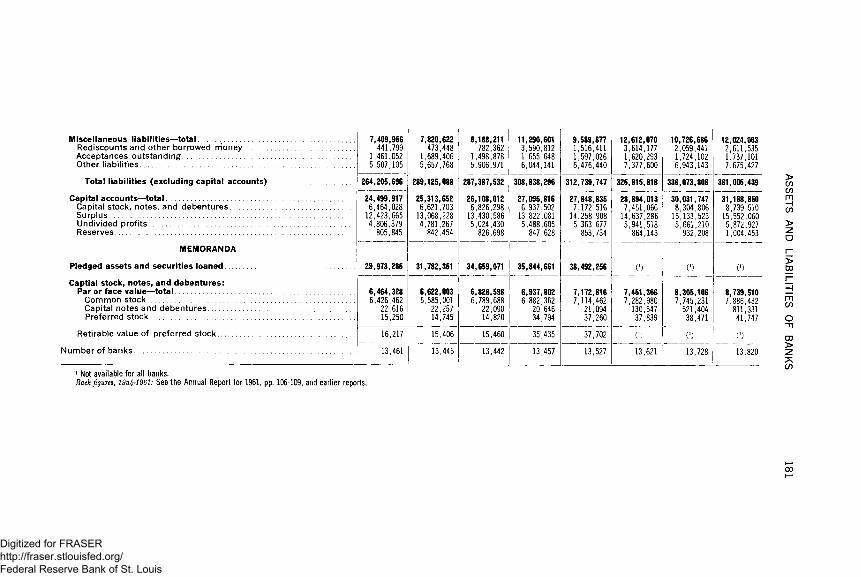
Miscellaneous liabilities—tota l.......................................................................R e d iscoun ts and o th e r bo rrow ed m o n e y ....................................... ...............A cce p tan ces o u ts ta n d in g ......................................................................................O ther lia b il i t ie s ...........................................................................................................
Total liabilities (excluding capital accounts).......................................
Capital accounts—tota l.....................................................................................C apita l stock, notes, and d e b e n tu re s ..............................................................S u rp lu s .............................................................................................................
7,409,956441,799
1,461,0525,507,105
7,820,622473,448
1,689,4065,657,768
8,188,211782,362
1,498,8785,906,971
11,290,6013,590,8121,655,6486,044,141
9,589,8771,516,4111,597,0266,476,440
12,612,0703,614,1771,620,2937,377,600
10,726,6862,059,4411,724,1026,943,143
12,024,0632,611,5351,737,1017,675,427
264,205,696 289,125,088 287,387,532 308,838,296 312,739,747 325,915,818 336,073,806 361,005,439
24,499,9176,464,028
12,423,6654,806,379
805,845
25,313,6526,621,703
13,068,2284,781,267
842,454
26,108,0126,826,298
13,430,5865,024,430
826,698
27,095,8166,937,502
13,822,0815,488,605
847,628
27,648,8357,172,516
14,258,9085,363,677
853,734
28,894,0137,451,066
14,637,2865,941,518
864,143
30,031,7478,304,806
15,133,5235,661,210
932,208
31,168,9508,739,510
15,552,0605,872,9271,004,453
U n d iv ided p ro f its ......................................................................................................R e se rve s ........................................................................................................
MEMORANDA
Pledged assets and securities loaned.............. ..............
Captial stock, notes, and debentures:Par or face value—total.................................................................................
C om m on s to c k .......................................................................................................Cap ita l no tes and d e b e n tu re s .........................................................................P re fe rre d s to c k ......................................................................................................
R e tirab le va lue o f p re fe rre d s to c k ....................................................................
N u m b e r o f b a n k s ..............................................................................................................
29,973,285 31,782,351 34,659,071 35,844,661 38,492,256 e) 0) 0)
6,464,3286,426,462
22,61615,250
6,622,0036,585,001
22,25714,745
6,826,5986,789,688
22,09014,820
6,937,8026,882,362
20,64634,794
7,172,8167,114,462
21,09437,260
7,451,3667,282,980
130,54737,839
8,305,1067,745,231
521,40438,471
8,739,5107,886,432
811,33141,747
16,217 15,406 15,460 35,435 37,702 0) 0) 0)
13,461 13,445 13,442 13,457 13,527 13,621 13,728 13,820
1 Not available for all banks.Back figures, 1984-1961: See the Annual Report for 1961, pp. 106-109, and earlier reports.
ASSETS AND
LIABILITIES OF
BANKS 181
Digitized for FRASER http://fraser.stlouisfed.org/ Federal Reserve Bank of St. Louis
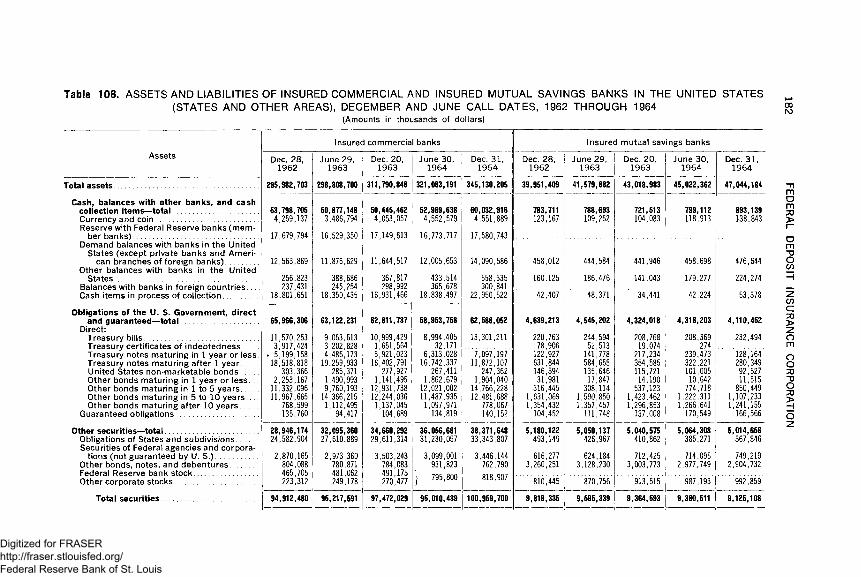
Table 108. ASSETS AND LIABILITIES OF INSURED COMMERCIAL AND INSURED MUTUAL SAVINGS BANKS IN THE UNITED STATES(STATES AND OTHER AREAS), DECEMBER AND JUNE CALL DATES, 1962 THROUGH 1964
(Amounts in thousands of dollars)
Insured com m erc ia l banks Insured m u tu a l savings banks
Dec. 28, 1962
June 29, 1963
Dec. 20, 1963
June 30, 196 4
Dec. 31, 1964
Dec. 28, 1962
June 29, 1963
Dec. 20, 1963
June 30, 1 96 4
Dec. 31, 1964
295,982,703 298,808,700 311,790,848 321,083,191 345,130,205 39,951,409 41,579,882 43,018,983 45,022,362 47,044,184
53,798,7054,259,137
50,877,1483,486,794
50,445,4624,053,057
52,969,6384,552,579
60,032,9164,551,889
783,711123,167
788,693109,262
721,513104,083
799,112118,913
893,139138,843
17,679,794
12,563,869
16,529,350
11,876,629
17,149,613
11,644,517
16,773,717
12,005,653
17,580,743
14,090,586 458,012 444,584 441,946 458,698 476,644
256,823237,431
388,686245,254
18,350,435
367,817298,992
16,931,466
433,514365,678
18,838,497
558,335300,841
22,950,522
160,125 186,476 141,043 179,277 224,274
18,801,651 42,407 48,371 34,441 42,224 53,378
65,966,306 63,122,231 62,811,737 58,953,758 62,588,052 4,639,213 4,545,202 4,324,018 4,316,203 4,110,452
11,570,253 3,917,424
. 5,199,158 18,518,818
303,366 2,253,167
11,332,096 11,967,665
768,599 135,760
9,063,6133,202,8284,486,173
19,259,933285,371
1,490,9939,760,193
14,366,2151,112,495
94,417
10,999,4291,651,5645,921,023
16,402,791277,927
1,141,49512,931,73812,244,0361,137,045
104,689
8,994,40532,171
6,313,02816,742,337
267,4111,862,679
12,021,00211,487,9351,097,971
134,819
13,301,211 220,76378,906
122,927631,844146,39431,981
316,4451,631,0691,354,432
104,452
244,59452,513
141,778584,655135,64617,847
308,1141,590,8501,357,457
111,748
208,76819,074
217,234354,585115,72114,190
537,1231,423,4621,296,853
137,008
208,369274
232,494
7,097,19711,872,107
247,3621,904,040
14,766,22812,481,688
778,067140,152
239,473322,221101,00510,642
774,7181,222,3111,266,641
170,549
128,164280,34992,52711,515
850,4491,107,2331,241,155
166,566
28,946,17424,582,904
32,095,36027,610,889
34,660,29229,611,314
36,056,68131,230,057
38,371,64833,343,807
5,180,122493,149
5,050,137426,967
5,040,575410,862
5,064,308385,271
5,014,656367,846
2,870,165804,088465,705223,312
2,973,360780,871481,062249,178
3,503,243784,083491,175270,477
3,099,001931,823
| 795,800
3,446,144762,790
818,907
616,2773,260,251
624,1843,128,230
712,4253,003,773
714,0952,977,749
749,2192,904,732
810,445 870,756 913,515 987,193 992,859
94,912,480 95,217,591 97,472,029 95,010,439 100,959,700 9,819,335 9,595,339 9,364,593 9,380,511 9,125,108
Assets
Total assets................................................................
Cash, balances w ith other banks, and cash collection item s— to ta l.....................................Currency and co in .............................................Reserve with Federal Reserve banks (m em
ber banks).......................................................Demand balances with banks in the United
States (except private banks and A m erican branches of foreign banks).............
Other balances with banks in the UnitedS tates................................................................
Balances with banks in foreign co u n tr ie s ... Cash items in process of co llection ...............
Obligations of the U. S. Government, d irec t and guaranteed— to ta l.................................
Direct:Treasury b ills ..................................................Treasury certificates of indebtedness . . . . Treasury notes m aturing in 1 year or lessTreasury notes m aturing a fte r 1 ye ar.......United States non-marketable bonds . . . Other bonds m aturing in 1 year or less. .Other bonds maturing in 1 to 5 years.......Other bonds m aturing in 5 to 10 ye a rs ...Other bonds m aturing after 10 years ........
Guaranteed obligations....................................
Other securities— to ta l..........................................Obligations of States and subdivisions.........Securities of Federal agencies and corpora
tions (not guaranteed by U. S .)...................Other bonds, notes, and debentures............Federal Reserve bank s tock .............................Other corporate stocks......................................
Total se curities..........................................
182 FEDERAL
DEPOSIT
INSU
RAN
CE
CO
RP
OR
ATIO
N
Digitized for FRASER http://fraser.stlouisfed.org/ Federal Reserve Bank of St. Louis
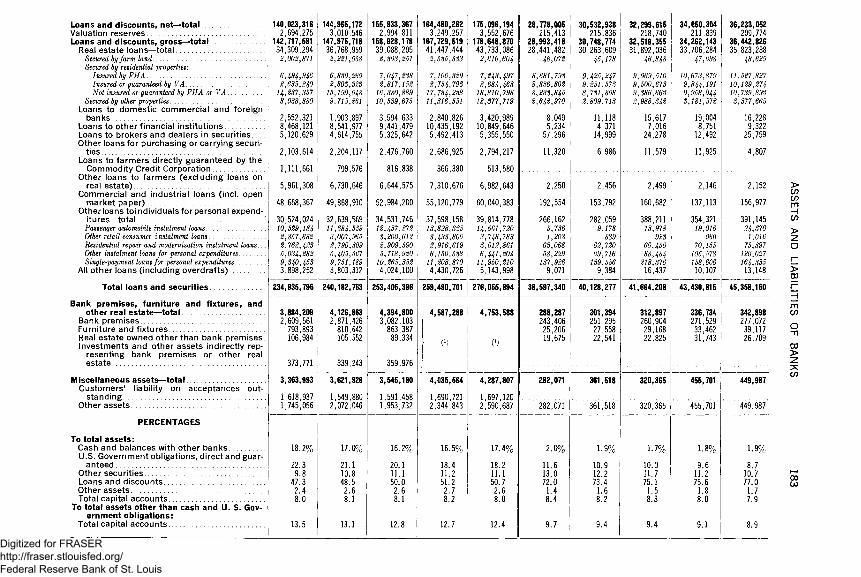
Loans and discounts, net—total............................ 140,023,316 144,965,172 155,933,367 164,480,262 175,096,194 28,778,005 30,532,938 32,299,615 34,050,304 36,233,052V aluation re s e rv e s ........................................................... 2,694,275 3,010,546 2,994,811 3,249,257 3,552,676 215,413 215,836 218,740 211,839 209,774Loans and discounts, gross—tota l........................ 142,717,591 147,975,718 158,928,178 167,729,519 178,648,870 28,993,418 30,748,774 32,518,355 34,262,143 36,442,826
Real e s ta te loan s— to ta l ............................................ 34,309,294 36,768,959 39,088,205 41,447,444 43,733,086 28,441,482 30,263,609 31,892,036 33,706,284 35,823,288Secured by farm land ................................................ 2 ,0 0 2 ,8 7 1 2 ,2 2 1 ,0 5 8 2 ,3 0 3 ,2 5 1 2 ,5 3 5 ,5 3 3 2 ,6 1 6 ,6 0 4 4 6 ,0 7 2 4 5 ,1 7 8 4 6 ,8 4 8 4 7 ,6 9 8 4 8 ,6 2 9Secured by residential properties:
Insured by F H A .................................................. 6 ,4 9 4 ,9 4 6 6 ,8 3 0 ,2 6 9 7 ,0 4 7 ,2 3 8 7 ,1 0 6 ,3 2 9 7 ,2 4 3 ,4 9 7 8 ,6 8 1 ,7 9 3 9 ,4 2 5 ,2 4 7 9 ,9 6 9 ,5 1 0 1 0 ,6 7 3 ,8 7 9 1 1 ,5 2 7 ,8 2 7Insured or guaranteed by VA.................................. 2 ,6 3 5 ,2 4 0 2 ,8 0 3 ,3 2 3 2 ,8 1 7 ,1 5 2 2 ,7 5 4 ,7 9 3 2 ,6 8 4 ,4 6 8 8 ,8 3 6 ,8 0 2 9 ,2 5 1 ,5 7 3 9 ,5 0 0 ,6 7 3 9 ,8 4 4 ,1 9 1 1 0 ,1 2 9 ,2 7 4Not insured or guaranteed by FHA or VA ................ 1 4 ,2 3 7 ,3 5 7 1 5 ,1 9 9 ,0 4 8 1 6 ,3 8 0 ,8 8 9 1 7 ,7 3 4 ,2 3 8 1 8 ,8 1 0 ,7 9 8 8 ,2 3 3 ,8 4 5 8 ,7 3 1 ,8 9 8 9 ,3 8 6 ,6 6 3 9 ,9 5 8 ,9 4 4 1 0 ,7 3 9 ,8 9 3
Secured by other properties........................................ 8 ,9 3 8 ,8 8 0 9 ,7 1 5 ,2 6 1 1 0 ,5 3 9 ,6 7 5 1 1 ,3 1 6 ,5 5 1 1 2 ,3 7 7 ,7 1 9 2 ,6 4 2 ,9 7 0 2 ,8 0 9 ,7 1 3 2 ,9 8 8 ,3 4 2 3 ,1 8 1 ,5 7 2 3 ,3 7 7 ,6 6 5Loans to d o m e s tic co m m e rc ia l and fo re ign
b a n k s ............................................................................ 2,552,321 1,903,897 3,594,633 2,840,826 3,420,989 8,049 11,118 15,617 19,004 16,228Loans to o th e r fin a n c ia l in s t itu t io n s .................... 8,468,121 8,641,977 9,441,479 10,435,192 10,849,646 5,234 4,371 7,016 8,751 9,322Loans to b rokers and dea lers in s e c u r it ie s ___ 5,120,629 4,614,755 5,325,642 5,492,413 5,355,550 57,296 14,999 24,278 12,492 25,759O th e r loans fo r p u rch a s in g o r ca rry in g se cu ri
t ie s ................................................................................. 2,103,614 2,204,117 2,476,760 2,686,925 2,794,217 11,320 6,986 11,579 11,925 4,807Loans to fa rm e rs d ire c tly g u a ra n te e d by th e
C o m m o d ity C re d it C o rp o ra tio n .......................... 1,111,661 799,576 816,838 366,380 513,580O ther loans to fa rm e rs (e x c lu d in g loans on
real e s ta te ) ................................................................. 5,961,308 6,730,646 6,644,575 7,310,676 6,982,643 2,250 2,456 2,499 2,146 2,152C om m erc ia l and in d u s tr ia l loans (inc l. open
m a rk e t p a p e r) ........................................................... 48,668,367 49,868,910 52,984,200 55,120,779 60,040,383 192,554 153,792 160,682 137,113 156,977O ther loans to in d iv id u a ls fo r persona l expend
itu re s— to ta l..............................................................! 30,524,024 32,639,569 34,531,746 37,598,158 39,814,778 266,162 282,059 388,211 354,321 391,145Passenger automobile instalment loans......................... 1 0 ,5 2 9 ,1 8 4 1 1 ,6 8 4 ,5 3 9 1 2 ,4 3 7 ,2 7 2 1 3 ,8 2 8 ,3 2 5 1 4 ,6 6 1 ,7 2 0 5 ,7 3 6 9 ,1 7 8 1 3 ,9 7 8 19 ,01 6 2 4 ,3 7 0Other retail consumer instalment loans........................ 2 ,8 5 7 ,6 8 2 3 ,0 0 7 ,9 6 5 3 ,2 0 0 ,6 1 2 3 ,4 9 3 ,8 0 6 3 ,7 4 8 ,7 8 3 1 ,2 0 3 889 923 966 1 ,0 1 6Residential repair and modernization instalment loans. . . 2 ,7 6 2 ,4 2 3 2 ,7 9 0 ,3 0 9 2 ,9 0 9 ,5 9 0 2 ,9 1 6 ,6 1 9 3 ,0 1 2 ,8 6 1 6 3 ,0 6 8 6 2 ,7 2 0 6 6 ,4 5 0 7 0,15 5 7 5 ,39 7Other instalment loans for personal expenditures........... 5 ,0 3 4 ,2 8 2 5 ,4 0 5 ,5 6 7 5 ,7 1 8 ,9 2 0 6 ,1 5 0 ,5 3 8 6,441J04 5 8 ,2 2 9 6 9 ,7 1 6 8 8 ,4 8 4 1 05 ,578 1 26 ,0 2 7Single-payment loans for personal expenditures............ 9 ,3 4 0 ,4 5 3 9 ,7 5 1 ,1 8 9 1 0 ,2 6 5 ,3 5 2 1 1 ,2 0 8 ,8 7 0 1 1 ,9 5 0 ,2 1 0 1 37 ,9 2 6 1 39 ,5 5 6 2 1 8 ,3 7 6 1 58 ,6 0 6 164 ,3 3 5
All o th e r loans ( in c lu d in g o v e rd ra f ts ) ................. 3,898,252 3,803,312 4,024,100 4,430,726 5,143,998 9,071 9,384 16,437 10,107 13,148
Total loans and securities......................... 234,935,796 240,182,763 253,405,396 259,490,701 276,055,894 38,597,340 40,128,277 41,664,208 43,430,815 45,358,160
Bank premises, furniture and fixtures, andother real estate—total..................................... 3,884,209 4,126,863 4,394,800 4,587,288 4,753,588 288,287 301,394 312,897 336,734 342,898
B ank p re m is e s .............................................................. 2,609,561 2,871,426 3,082,103 I 243,406 251,295 260,904 271,529 277,072F u rn itu re and f ix tu re s ............................................... 793,893 810,642 863,387 ! 25,206 27,558 29,168 33,462 39,117Real e s ta te ow ned o th e r th a n ban k p re m ise s . 106,984 105,552 89,334 m 19,675 22,541 22,825 31,743 26,709In ve s tm e n ts and o th e r assets in d ire c tly rep r v )I O
re se n tin g b a n k p re m ise s o r o th e r real Ie s ta te ............................................................................ 373,771 339,243 359,976 j
Miscellaneous assets—tota l.................................... 3,363,993 3,621,926 3,545,190 4,035,564 4,287,807 282,071 361,518 320,365 455,701 449,987C u s to m e rs ’ lia b ility on acce p ta n ce s o u t
s ta n d in g ....................................................................... 1,618,937 1,549,880 1,591,458 1,690,721 1,697,120O ther a s s e ts ................................................................... 1,745,056 2,072,046 1,953,732 2,344,843 2,590,687 282,071 361,518 320,365 455,701 449,987
PERCENTAGES
To total assets:Cash and ba lances w ith o th e r b a n k s .................. 18.2% 17.0% 16.2% 16.5% 17.4% 2.0% 1.9% 1.7% 1.8% 1.9%U.S. G o ve rn m e n t o b lig a tio n s , d ire c t and g u a r
a n te e d .......................................................................... 22.3 21.1 20.1 18.4 18.2 11.6 10.9 10.0 9.6 8.7O ther s e c u r it ie s ............................................................ 9.8 10.8 11.1 11.2 11.1 13.0 12.2 11.7 11.2 10.7Loans and d is c o u n ts .................................................. 47.3 48.5 50.0 51.2 50.7 72.0 73.4 75.1 75.6 77.0O ther a s s e ts ................................................................... 2.4 2.6 2.6 2.7 2.6 1.4 1.6 1.5 1.8 1.7Total cap ita l a c c o u n ts ............................................... 8.0 8.1 8.1 8.2 8.0 8.4 8.2 8.3 8.0 7.9
To total assets other than cash and U. S. Government obligations:
Tota l cap ita l a c c o u n ts ................................................ 13.5 13.1 12.8 12.7 12.4 9.7 9.4 9.4 9.1 8.9
ASSETS AND
LIABILITIES OF
BANKS 183
Digitized for FRASER http://fraser.stlouisfed.org/ Federal Reserve Bank of St. Louis
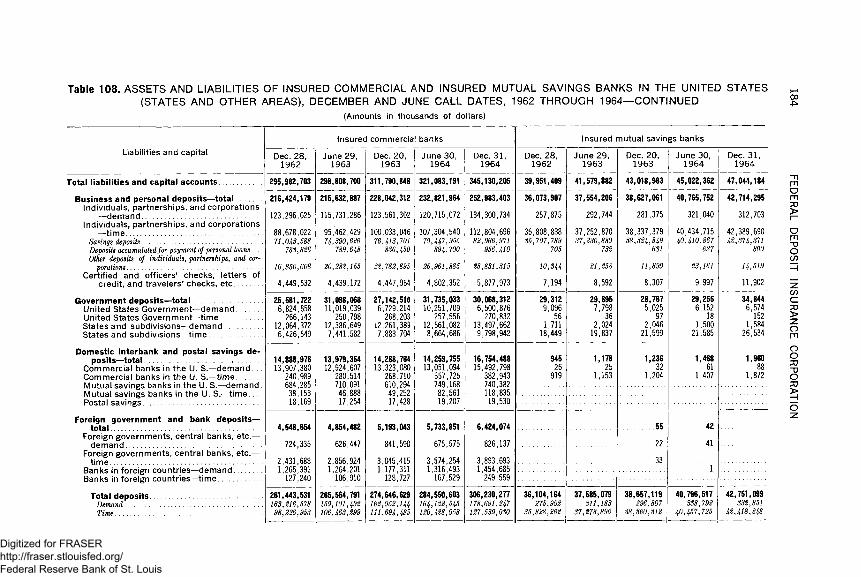
Table 108. ASSETS AND LIABILITIES OF INSURED COMMERCIAL AND INSURED MUTUAL SAVINGS BANKS IN THE UNITED STATES(STATES AND OTHER AREAS), DECEMBER AND JUNE CALL DATES, 1962 THROUGH 1964— CONTINUED
(Amounts in thousands of dollars)
Insured com m ercia l banks In sured m u tu a l savings banks
L iab ilities and cap ita l Dec. 28, June 29, Dec. 20, June 30, Dec. 31, Dec. 28, June 29, Dec. 20, June 30, Dec. 31,1962 1963 1963 1964 1964 1962 1963 1963 1964 1 96 4
Total liabilities and capital accounts................... 295,982,703 298,808,700 311,790,848 321,083,191 345,130,205 39,951,409 41,579,882 43,018,983 45,022,362 47,044,184
Business and personal deposits—tota l............ 216,424,179 215,632,887 228,042,312 232,821,964 252,983,403 36,073,907 37,554,206 38,627,061 40,765,752 42,714,295In d iv id u a ls , p a rtn e rs h ip s , and co rp o ra tio n s
— d e m a n d ............................................................ 123,296,625 115,731,286 123,561,302 120,715,072 134,300,734 257,875 292,744 281,375 321,040 312,703In d iv id u a ls , p a rtn e rs h ip s , and co rp o ra tio n s
— t im e .................................................................... 88,678,022 95,462,429 100,033,046 107,304,540 112,804,696 35,808,838 37,252,870 38,337,379 40,434,715 42,389,690Savings deposits.................................................... 7 1 ,0 ^ 3 ,5 8 8 7 4 ,3 9 0 ,6 2 6 7 6 ,41 3 ,7 0 1 7 9 ,4 4 7 ,9 5 5 8 2 ,9 6 6 ,9 7 1 3 5 ,7 9 7 ,7 8 9 3 7 ,2 3 0 ,8 8 0 3 8 ,3 2 4 ,8 4 9 4 0 ,4 1 0 ,8 6 7 4 2 ,3 7 4 ,3 7 1
Deposits accumulated for payment of personal loans... 7 83 ,8 2 6 7 89 ,6 4 8 8 36 ,4 5 0 8 94 ,7 0 0 9 5 6 ,4 1 0 705 732 631 687 800
Other deposits of individuals, partnerships, and corporations .......................................................... 1 6 ,8 5 0 ,6 0 8 2 0 ,2 8 2 ,1 5 5 2 2 ,7 8 2 ,8 9 5 2 6 ,9 6 1 ,8 8 5 2 8 ,8 8 1 ,3 1 5 1 0 ,3 4 4 2 1 ,2 5 8 1 1 ,8 9 9 2 3 ,1 6 1 1 4 ,51 9
C e rtifie d and o ffic e rs ’ checks, le tte rs o fc re d it, a nd tra v e le rs ' checks, e tc .............. 4,449,532 4,439,172 4,447,964 4,802,352 5,877,973 7,194 8,592 8,307 9,997 11,902
Government deposits—tota l................................ 25,581,722 31,098,068 27,142,510 31,735,033 30,068,312 29,312 29,695 28,767 29,255 34,844U n ite d S ta tes G o ve rn m e n t— d e m a n d ............. 6,824,658 11,019,039 6,729,214 10,251,709 6,500,876 9,096 7,798 5,025 6,152 6,574U n ite d S ta tes G o ve rn m e n t— t im e ..................... 266,143 250,798 268,203 257,556 270,832 56 36 97 18 152States and su bd iv is ions— d e m a n d ................... 12,064,372 12,386,649 12,261,389 12,561,082 13,497,662 1,711 2,024 2,046 1,500 1,584S ta tes and su b d iv is io n s— t im e .......................... 6,426,549 7,441,582 7,883,704 8,664,686 9,798,942 18,449 19,837 21,599 21,585 26,534
Domestic interbank and postal savings deposits—tota l..................................................... 14,888,976 13,979,354 14,268,764 14,259,755 16,754,488 945 1,178 1,236 1,468 1,960
C o m m erc ia l ban ks in th e U. S.— d e m a n d . . . 13,907,380 12,924,607 13,323,080 13,051,094 15,492,798 26 25 32 61 88C o m m e rc ia l ban ks in th e U. S.— t im e ............. 240,989 280,514 268,710 357,725 382,943 919 1,153 1,204 1,407 1,872M u t u a l c a v i n c r c hs» n k Q i n t h p 1 1 ^ — H p r n a n d 684,285 710,091 610,294 749,168 740 382I V IU l ll C II o d v l l I g o U a l lr\o III L I I C U . O . U C I I I u l l U .M utu a l savings banks in th e U . S.— t im e 38 153 46’888 49^252 82 561 118 835Postal savings 18^169 17,254 17'428 19,207 19,530
Foreign government and bank deposits—total . . . ............... 4,548,654 4,854,482 5,193,043 5,733,851 6,424,074 ............... 55 42
Foreign g o v e rn m e n ts , c e n tra l banks, e tc .—d e m a n d . . . . 724,335 626,447 841,590 675,575 826,137 22 41
Foreign g o ve rn m e n ts , c e n tra l banks, e tc .—t im e 2,431,688 2,856,924 3,045,415 3,574,254 3,893,693 33
B anks in fo re ig n c o u n tr ie s — d em and 1 265 391 1,264,201 1,177,311 1,316,493 1,454,685 1Banks in fo re ig n co u n tr ie s— tim e 127[240 106,910 128,727 167,529 249,559
Total deposits................................................... 261,443,531 265,564,791 274,646,629 284,550,603 306,230,277 36,104,164 37,585,079 38,657,119 40,796,517 42,751,099Demand........................................................... 1 6 3 ,2 1 6 ,5 7 8 1 5 9 ,1 0 1 ,4 9 2 1 6 2 ,9 5 2 ,1 4 4 1 6 4 ,1 2 2 ,5 4 5 1 7 8 ,6 9 1 ,2 4 7 2 7 5 ,9 0 2 3 1 1 ,1 8 3 2 9 6 ,8 0 7 3 3 8 ,7 9 2 3 32 ,8 5 1
Tim e............................................................... 9 8 ,2 2 6 ,9 5 3 1 0 6 ,4 6 3 ,2 9 9 1 1 1 ,6 9 4 ,4 8 5 1 2 0 ,4 2 8 ,0 5 8 1 2 7 ,5 3 9 ,0 3 0 3 5 ,8 2 8 ,2 6 2 3 7 ,2 7 3 ,8 9 6 3 8 ,3 6 0 ,3 1 2 4 0 ,4 5 7 ,7 2 5 4 2 ,4 1 8 ,2 4 8
184 FEDERAL
DEPOSIT
INSU
RAN
CE
CO
RP
OR
ATIO
N
Digitized for FRASER http://fraser.stlouisfed.org/ Federal Reserve Bank of St. Louis
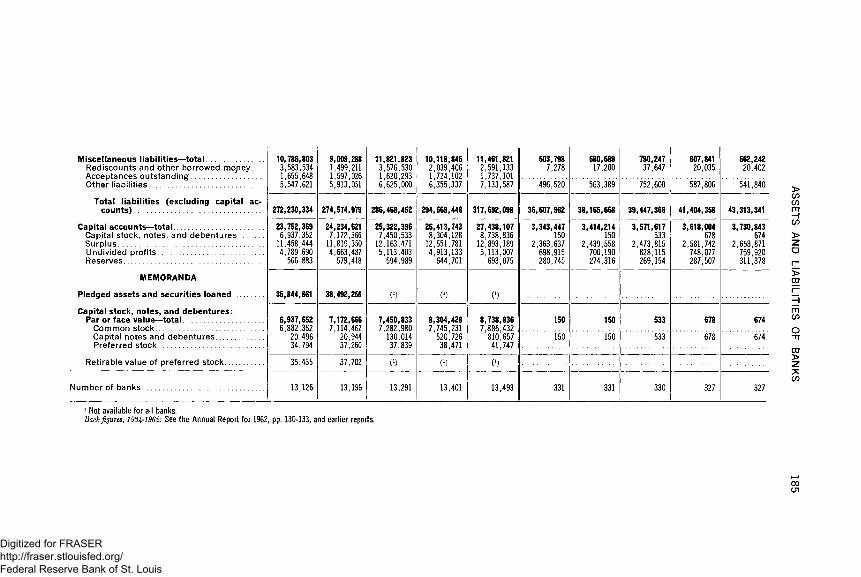
Miscellaneous liabilities—tota l..........................R e d iscoun ts and o th e r bo rrow ed m o p e y ___A cce p tan ces o u ts ta n d in g .....................................
10,786,8033,583,5341,655,6485,547,621
9,009,2881,499,2111,597,0265,913,051
11,821,8233,576,5301,620,2936,625,000
10,118,8452,039,4061,724,1026,355,337
11,461,8212,591,1331,737,1017,133,587
503,7987,278
580,58917,200
790,24737,647
607,84120,035
562,24220,402
O ther lia b ilit ie s .........................................................
Total liabilities (excluding capital accounts) ...........................................................
Capital accounts—total.........................................C apita l s tock, notes, and d e b e n tu re s ............S u rp lu s .........................................................................U n d iv ided p ro f its .....................................................R e serve s ......................................................................
MEMORANDA
Pledged assets and securities loaned..............
496,520 563,389 752,600 587,806 541,840
272,230,334 274,574,079 286,468,452 294,669,448 317,692,098 36,607,962 38,165,668 39,447,366 41,404,358 43,313,341
23,752,3696,937,352
11,458,4444,789,690
566,883
24,234,6217,172,366
11,819,3504,663,487
579,418
25,322,3967,450,533
12,163,4715,113,403
594,989
26,413,7438,304,128
12,551,7814,913,133
644,701
27,438,1078,738,836
12,893,1895,113,007
693,075
3,343,447150
2,363,637698,915280,745
3,414,214150
2,439,558700,190274,316
3,571,617533
2,473,815828,115269,154
3,618,004678
2,581,742748,077287,507
3,730,843674
2,658,871759,920311,378
35,844,661 38,492,256 (J) C1) 0)
Capital stock, notes, and debentures:Par or face value—total....................................
C o m m on s to c k ......................................................6,937,6526,882,362
20,49634,794
7,172,6667,114,462
20,94437,260
7,450,8337,282,980
130,01437,839
8,304,4287,745,231
520,72638,471
8,738,8367,886,432
810,65741,747
150 150 533 678 674
C apita l n o tes and d e b e n tu re s ........................P re fe rre d s to c k ....................................................
150 150 533 678 674
R e tirab le va lue o f p re fe rre d s to c k ................... 35,435 37,702 C1) 0) C1)
N u m b e r o f b a n k s ............................................................. 13,126 13,196 13,291 13,401 13,493 331 331 330 327 327
1 Not available for all banks.Back figures, 1934-1962: See the Annual Report for 1962, pp. 130-133, and earlier reports.
ASSETS AND
LIABILITIES OF
BANKS 185
Digitized for FRASER http://fraser.stlouisfed.org/ Federal Reserve Bank of St. Louis
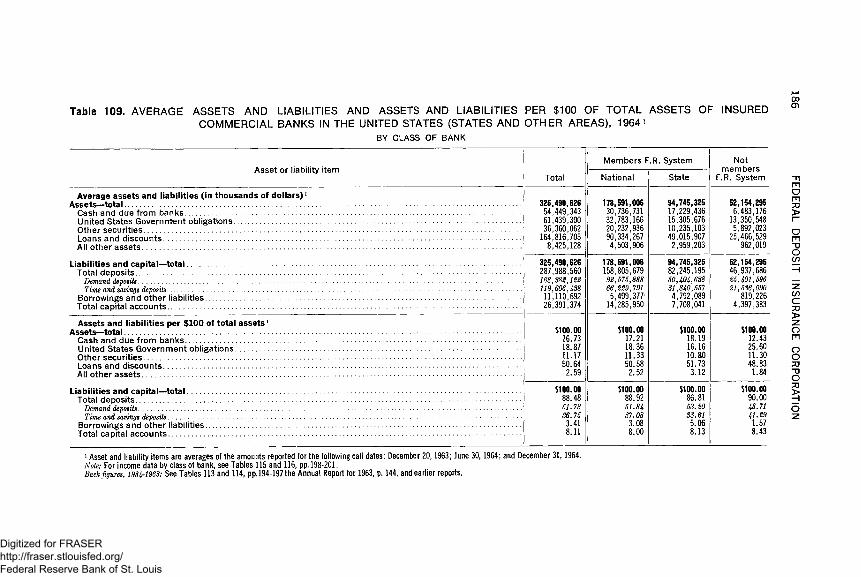
Table 109. AVERAGE ASSETS AND LIABILITIES AND ASSETS AND LIABILITIES PER $100 OF TOTAL ASSETS OF INSUREDCOMMERCIAL BANKS IN THE UNITED STATES (STATES AND OTHER AREAS), 19641
BY CLASS OF BANK
A sse t o r lia b ility itemTotal
M em b ers F.R. System N ot m em b ers
F.R. SystemN ational S tate
Average assets and liabilities (in thousands of dollars)1325,490,626
54,449,34361,439,39036,360,062
164,816,7038,425,128
178,591,00630,736,73132,783,16620,232,93690,334,2674.503,906
94,745,32517,229,43615,305,67610,235,10349,015,9072,959,203
52,154,2956,483,176
13,350,5485,892,023
25,466,529962,019
U n ite d S ta tes G overnrrrent o b lig a tio n s ......................................................................................................................O th e r se cu ritie s .................................................................................................................................................................................Loans and d isco u n ts ...................................................................................................................................................A ll o th e r assets ...........................................................................................................................................................
Liabilities and capital'—total ..................................................................................................................................... 325,490,626287,988,5601 6 8 ,3 8 2 ,1 2 21 1 9 ,6 0 6 ,4 3 8
11,110,69226,391,374
178,591,006158,805,679
9 2 ,5 7 5 ,8 8 86 6 ,2 2 9 ,7 9 1
5,499,377-14,285,950
94,745,32582,245,1955 0 ,4 0 4 ,6 3 83 1 ,8 4 0 ,5 5 74,792,0897,708,041
52,154,29546,937,6862 5 ,4 0 1 ,5 9 62 1 ,5 3 6 ,0 9 0
819,2264,397,383
Tota l d e p o s its ...........................................................................................................................................................
Time and savings deposits ........................................................................................Bo rrow ings and o th e r lia b ilitie s ..................................................................................................................T o ta l c a p ita l a cco u n ts ..............................................................................................................................
Assets and liabilities per $100 of total assets1 Assets—total ............................................................................................................................................. $100.00
16.7318.8711.1750.642.59
$100.0017.2118.3611.3350.582.52
$100.0018.1916.1610.8051.733.12
$100.0012.4325.6011.3048.83
1.84
Cash and due f ro m ban ks ..........................................................................................................................U n ite d S ta tes G o ve rn m e n t o b lig a tio n s ..................................................................................................................O th e r se cu ritie s ......................................................................................................................Loans a nd d is c o u n ts ..........................................................................................................................A ll o th e r assets .......................................................................................................................................
Liabilities and capital—total .......................................................................................................................... $100.0088.485 1 .7 33 6 .7 53.418.11
$100.0088.925 1 .8 43 7 .0 83.088.00
$100.0086.815 3 .2 03 3 .6 15.068.13
$100.0090.004 8.714 1 .2 9
1.578.43
To ta l d e p o s its ......................................................................................................................
Time and savings deposits ..........................................................................................B o rrow ings and o th e r lia b ilitie s ..............................................................................................................................To ta l c a p ita l acco u n ts ...........................................................................................................................................................
1 Asset and liability items are averages of the amounts reported for the following call dates: December 20,1963; June 30,1964; and December 31,1964. Note: For income data by class of bank, see Tables 115 and 116, pp. 198-201.Back figures, 1934-1963: See Tables 113 and 114, pp.194-197 the Annual Report for 1963, p. 144, and earlier reports.
186 FEDERAL
DEPOSIT
INSU
RAN
CE
CO
RPO
RA
TION
Digitized for FRASER http://fraser.stlouisfed.org/ Federal Reserve Bank of St. Louis
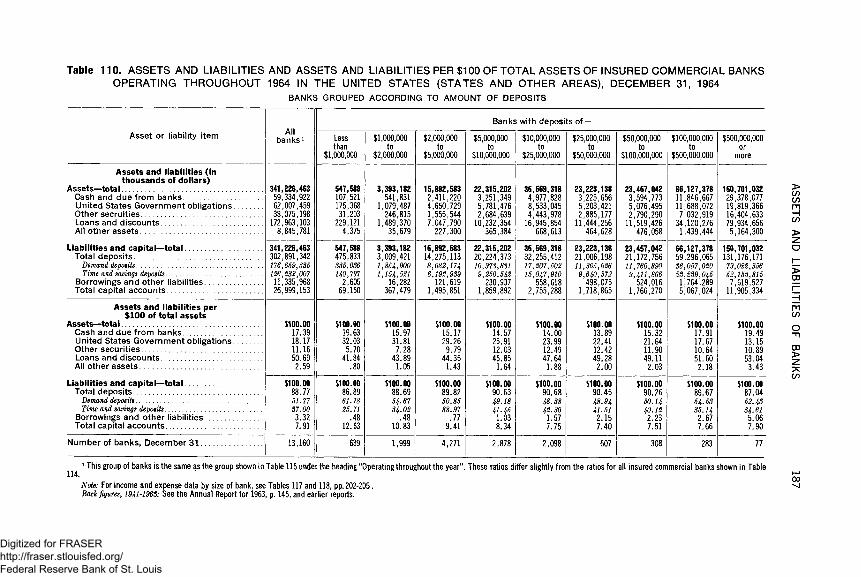
Table 110. ASSETS AND LIABILITIES AND ASSETS AND LIABILITIES PER $100 OF TOTAL ASSETS OF INSURED COMMERCIAL BANKS OPERATING THROUGHOUT 1964 IN THE UNITED STATES (STATES AND OTHER AREAS), DECEMBER 31, 1964
BANKS GROUPED ACCO RDING TO AM O UNT OF DEPOSITS
A sse t o r lia b ility item Allb a n k s 1
Banks w ith deposits o f—
Lessthan
$1,000,000
$1,000,000to
$2,000,000
$2,000,000to
$5,000,000
$5,000,000to
$10,000,000
$10,000,000to
$25,000,000
$25,000,000to
$50,000,000
$50,000,000to
$100,000,000
$100,000,000to
$500,000,000
$500,000,000or
more
Assets and liabilities (in thousands of dollars)
Assets—total................................................................Cash and d u e fro m b a n k s .......................................U n ite d S ta tes G o ve rn m e n t o b lig a tio n s ..............O th e r s e c ru it ie s ............................................................Loans and d is c o u n ts ..................................................A ll o th e r a s s e ts .............................................................
Liabilities and capital—total...................................Tota l d e p o s its ................................................................
Demand deposits......................................................Time and savings deposits.........................................
B o rrow ings and o th e r lia b ilit ie s .............................Total ca p ita l a c c o u n ts ................................................
341,226,46359,334,92262,007,45938,075,198
172,963,1038,845,781
547,588107,521175,36831,203
229,1214,375
3,393,182541,831
1,079,487246,815
1,489,37035,679
15,892,5832,411,2204,650,7291,555,5447,047,790
227,300
22,315,2023,251,3495,781,4762,684,639
10,232,354365,384
35,569,3184,977,8288,533,0454,443,978
16,945,854668,613
23,223,1383,225,6565,203,4212,885,177
11,444,256464,628
23,457,0423,594,7735,076,4952,790,290
11,519,426476,058
66,127,37811,846,66711,688,0727,032,919
34,120,2761,439,444
150,701,03229,378,07719,819,36616,404,63379,934,6565,164,300
341,226,463302,891,3421 7 6 ,6 5 9 ,3 3 51 26 ,2 3 2 ,0 0 711,335,96826,999,153
547,588475,833335 ,0 3 6140 ,797
2,60569,150
3,393,1823,009,4211 ,8 5 4 ,9 0 01 ,1 5 4 ,5 2 1
16,282367,479
15,892,58314,275,1138 ,0 8 2 ,1 7 46 ,1 9 2 ,9 3 9
121,6191,495,851
22,315,20220,224,3731 0 ,9 7 3 ,8 3 1
9 ,2 5 0 ,5 4 2230,937
1,859,892
35,569,31832,255,4121 7 ,2 0 7 ,5 0 21 5 ,0 4 7 ,9 1 0
558,6182,755,288
23,223,13821,006,1981 1 ,3 6 5 ,6 2 6
9 ,6 4 0 ,5 7 2498,075
1,718,865
23,457,04221,172,7561 1 ,7 6 0 ,8 9 0
9 ,4 1 1 ,8 6 6524,016
1,760,270
66,127,37859,296,0653 6 ,0 5 7 ,0 2 02 3 ,2 3 9 ,0 4 5
1,764,2895,067,024
150,701,032131,176,171
7 9 ,0 2 2 ,3 5 65 2 ,1 5 3 ,8 1 57,619,527
11,905,334
Assets and liabilities per $100 of total assets
Assets—total................................................................Cash and d u e fro m b a n k s .......................................U n ited S tates G o ve rn m e n t o b lig a tio n s ..............O th e r s e c u r it ie s ............................................................Loans and d is c o u n ts ..................................................A ll o th e r a s s e ts .............................................................
Liabilities and capital—total...................................Total d e p o s its ................................................................
Demand deposits......................................................Time and savings deposits.........................................
B orrow ings and o th e r lia b ilit ie s .............................Tota l cap ita l a c c o u n ts ................................................
$100.0017.3918.1711.1650.692.59
$100.0019.6332.035.70
41.84.80
$100.0015.9731.817.28
43.891.05
$100.0015.1729.269.79
44.351.43
$100.0014.5725.9112.0345.85
1.64
$100.0014.0023.9912.4947.641.88
$100.0013.8922.4112.42 49.282.00
$100.0015.3221.6411.9049.112.03
$100.0017.9117.6710.6451.602.18
$100.0019.4913.1510.8953.043.43
$100.0088.775 1 .7 7 3 7 .0 03.327.91
$100.0086.896 1 .1 825.71
.4812.63
$100.0088.695 4 -6 73 4 .0 2
.4810.83
$100.0089.825 0 .8 53 8 .9 7
.779.41
$100.0090.634 9 .1 8
4 1 .4 51.038.34
$100.0090.684 8 .3 84 2 .3 01.577.75
$100.0090.454 8 .9 44 1 .5 12.157.40
$100.0090.2650.1440.122.237.51
$100.0089.675 4 .5 33 5 .1 42.677.66
$100.0087.045 2 .4 3 3 4 .6 1
5.06 7.90
N u m b e r o f banks, D ecem ber 3 1 ........................... 13,160 639 1,999 4,271 2,878 2,098 607 308 283 77
1 This group of banks is the same as the group shown in Table 115 under the heading "Operating throughout the year” . These ratios differ slightly from the ratios for all insured commercial banks shown in Table
Note: For income and expense data by size of bank, see Tables 117 and 118, pp. 202-205.Back figures, 1941-1963: See the Annual Report for 1963, p. 145, and earlier reports.
114.
ASSETS AND
LIABILITIES OF
BANKS 187
Digitized for FRASER http://fraser.stlouisfed.org/ Federal Reserve Bank of St. Louis
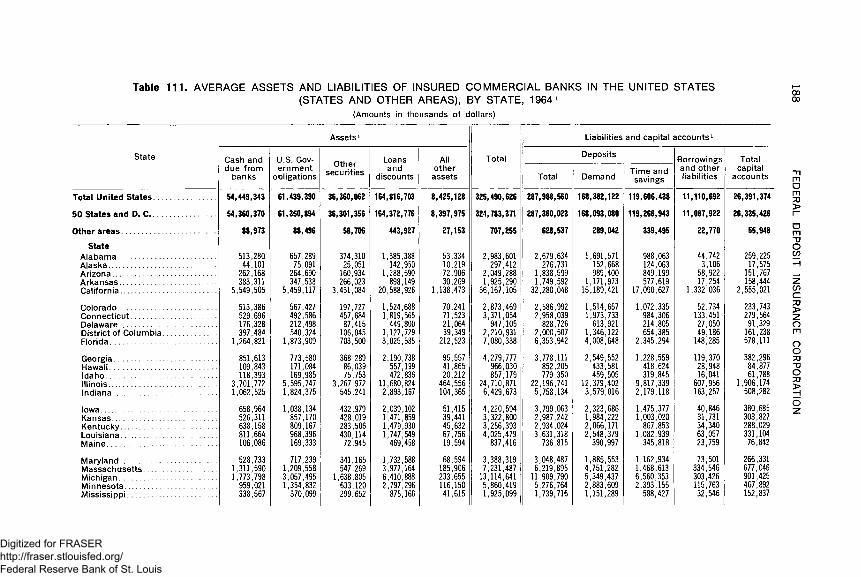
Table 111. AVERAGE ASSETS AND LIABILITIES OF INSURED COMMERCIAL BANKS IN THE UNITED STATES(STATES AND OTHER AREAS), BY STATE, 1964 1
(Amounts in thousands of dollars)
State
A s s e ts 1
T ota l
L iab ilities and cap ita l a c c o u n ts 1
Cash and due fro m
banks
U.S. Gove rn m e n t
ob lig a tio n s
O thersecurities
Loansand
discounts
Allo th e r
assets Total
Deposits
Dem andT im e and
savings
B orrow ings and o th e r lia b ilitie s
Totalcap ita l
accou nts
Total United States............................ 54,449,343 61,439,390 36,360,062 164,816,703 8,425,128 325,490,626 287,988,560 168,382,122 119,606,438 11,110,692 26,391,374
50 States and D. C.............................. 54,360,370 61,350,894 36,301,356 164,372,776 8,397,975 324,783,371 287,360,023 168,093,080 119,266,943 11,087,922 26,335,426
Other areas.......................................... 88,973 88,496 58,706 443,927 27,153 707,255 628,537 289,042 339,495 22,770 55,948
StateA la b a m a ................................................. 513,280 657,289 374,310 1,385,388 53,334 2,983,601 2,679,634 1,691,571 988,063 44,742 259,225A la s k a ..................................................... 44,101 75,091 25,051 142,950 10,219 297,412 276,731 152,668 124,063 3,106 17,575A riz o n a ................................................... 262,168 264,690 160,934 1,288,590 72,906 2,049,288 1,838,599 989,400 849,199 58,922 151,767A rk a n s a s ................................................ 383,311 347,538 266,023 898,149 30,269 1,925,290 1,749,592 1,171,973 577,619 17,254 158,444C a lifo rn ia ................................................ 5,549,505 5,459,117 3,431,084 20,588,926 1,138,473 36,167,105 32,280,048 15,189,421 17,090,627 1,332,036 2,555,021
C o lo ra d o ................................................. 513,386 567,427 197,727 1,524,688 70,241 2,873,469 2,586,992 1,514,657 1,072,335 52,734 233,743C o n n e c tic u t.......................................... 529,696 492,586 457,684 1,819,565 71,523 3,371,054 2,958,039 1,973,733 984,306 133,451 279,564D e la w a re ................................................ 176,328 212,498 87,415 449,800 21,064 947,105 828,726 613,921 214,805 27,050 91,329D is tr ic t o f C o lu m b ia .......................... 397,484 540,324 106,045 1,127,729 39,349 2,210,931 2,000,507 1,346,122 654,385 49,186 161,238F lo r id a ..................................................... 1,264,821 1,873,909 703,500 3,025,585 212,523 7,080,338 6,353,942 4,008,648 2,345,294 148,285 578,111
G e o rg ia ...................................................H a w a ii.....................................................
851,613 773,580 368,289 2,190,738 95,557 4,279,777 3,778,111 2,549,552 1,228,559 119,370 382,296109,843 171,084 86,039 557,199 41,865 966,030 852,205 433,581 418,624 28,948 84,877
Id a h o ....................................................... 118,393 169,985 75,753 472,836 20,212 857,179 779,350 459,505 319,845 16,041 61,788Illin o is ...................................................... 3,701,772 5,595,747 3,267,972 11,680,824 464,556 24,710,871 22,196,741 12,379,402 9,817,339 607,956 1,906,174In d ia n a ................................................... 1,062,525 1,824,375 545,241 2,893,167 104,365 6,429,673 5,758,134 3,579,016 2,179,118 163,257 508,282
Io w a ......................................................... 658,964 1,038,134 432,979 2,039,102 51,415 4,220,594 3,799,063 2,323,686 1,475,377 40,846 380,685K a n sa s .................................................... 526,311 857,170 428,019 1,471,859 39,441 3,322,800 2,987,242 1,984,222 1,003,020 31,731 303,827K e n tu c k y ...............................................L o u is ia n a ...............................................
638,158 809,167 283,506 1,479,930 45,632 3,256,393 2,934,024 2,066,171 867,853 34,340 288,029811,664 968,396 430,114 1,747,549 67,756 4,025,479 3,631,318 2,548,379 1,082,939 63,057 331,104
M a in e ...................................................... 106,086 169,333 72,945 469,458 19,594 837,416 736,815 390,997 345,818 23,759 76,842
M a ry la n d ................................................ 528,733 717,239 341,165 1,732,588 68,594 3,388,319 3,048,487 1,885,553 1,162,934 73,501 266,331M a s s a c h u s e tts .................................... 1,311,590 1,209,558 547,269 3,977,164 185,906 7,231,487 6,219,895 4,751,282 1,468,613 334,546 677,046M ic h ig a n ................................................ 1,773,798 3,057,495 1,638,805 6,410,888 233,655 13,114,641 11,909,790 5,349,437 6,560,353 303,426 901,425M in n e s o ta ............................................. 959,021 1,354,832 633,120 2,797,296 116,150 5,860,419 5,276,764 2,883,609 2,393,155 115,763 467,892M is s is s ip p i............................................ 338,567 370,099 299,652 875,166 41,615 1,925,099 1,739,716 1,151,289 588,427 32,546 152,837
188 FEDERAL
DEPOSIT
INSU
RAN
CE
CO
RPO
RA
TION
Digitized for FRASER http://fraser.stlouisfed.org/ Federal Reserve Bank of St. Louis
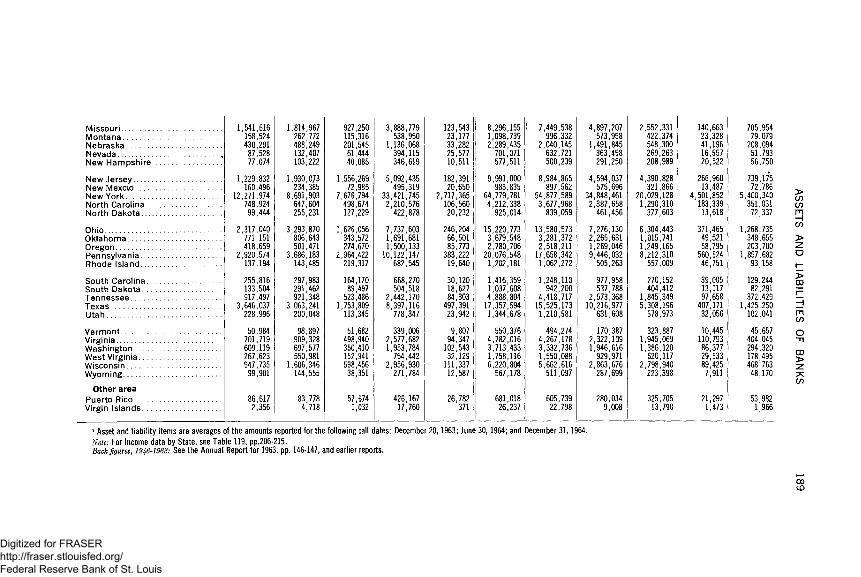
M is s o u r i.................................................. 1,541,616 1,814,967 927,250 3,888,779 123,543 8,296,155 7,449,538 4,897,207 2,552,331 140,663 705,954M o n ta n a ................................................. 158,524 262,772 115,316 538,950 23,177 1,098,739 996,332 573,958 422,374 23,328 79,079N e b ra s k a ............................................... 430,291 488,249 201,545 1,136,068 33,282 2,289,435 2,040,145 1,491,845 548,300 41,196 208,094N e va d a ........................................... ..... v 87,528 132,407 61,444 394,115 25,577 701,071 632,721 363,458 269,263 16,557 51,793New H a m p sh ire ................................ 77,074 103,222 40,085 346,619 10,511 577,511 500,239 291,250 208,989 20,522 56,750
N ew J e rs e y ........................................... 1,229,832 1,930,0/3 1,556,269 5,092,435 182,391 9,991,000 8,984,865 4,594,037 4,390,828 266,960 739,175New M e xc io ........................................... 160,496 234,385 72,985 495,319 20,650 983,835 897,562 575,696 321,866 13,487 72,786New Y o rk ................................................ 12,271,974 8,691,903 7,676,794 33,421,745 2,717,365 64,779,781 54,877,589 34,848,461 20,029,128 4,501,852 5,400,340N o rth C a ro lin a ..................................... 748,924 647,604 498,674 2,210,576 106,560 4,212,338 3,677,968 2,387,658 1,290,310 183,339 351,031N o rth D a k o ta ........................................ 99,444 255,231 127,229 422,878 20,232 925,014 839,059 461,456 377,603 13,618 72,337
O h io .......................................................... 2,317,040 3,293,870 1,626,056 7,737,603 246,204 15,220,773 13,580,573 7,276,130 6,304,443 371,465 1,268,735O k la h o m a .............................................. 771,151 806,643 343,572 1,691,681 66,501 3,679,548 3,281,372 2,265,631 1,015,741 49,521 348,655O re g o n .................................................... 418,659 501,471 274,670 1,500,133 85,773 2,780,706 2,518,211 1,269,046 1,249,165 58,795 203,700P e n n sy lva n ia ........................................ 2,920,574 3,686,183 2,964,422 10,122,147 383,222 20,076,548 17,658,342 9,446,032 8,212,310 560,524 1,857,682Rhode Is la n d ........................................ 137,194 143,485 219,317 682,545 19,640 1,202,181 1,062,272 505,263 557,009 46,751 93,158
South C a ro lin a ..................................... 255,816 297,983 164,170 668,270 30,120 1,416,359 1,248,110 977,958 270,152 39,005 129,244South D a k o ta ....................................... 133,504 291,462 89,497 504,518 18,627 1,037,608 942,200 537,788 404,412 13,117 82,291T e n n e sse e ............................................. 917,497 921,348 523,486 2,442,170 84,303 4,888,804 4,418,717 2,573,368 1,845,349 97,658 372,429T e x a s ....................................................... 3,646,037 3,063,241 1,753,809 8,397,116 497,391 17,357,594 15,525,173 10,216,977 5,308,196 407,171 1,425,250U ta h ......................................................... 228,996 200,048 113,345 778,347 23,942 1,344,678 1,210,581 631,608 578,973 32,056 102,041
V e rm o n t.................................................. 50,984 98,897 51,682 339,006 9,807 550,376 494,274 170,387 323,887 10,445 45,657V irg in ia .................................................... 701,719 909,328 498,940 2,577,682 94,347 4,782,016 4,267,178 2,322,109 1,945,069 110,793 404,045W a sh in g to n ........................................... 609,119 697,577 350,410 1,953,784 102,543 3,713,433 3,332,736 1,946,616 1,386,120 86,377 294,320W est V irg in ia ......................................... 267,623 550,981 152,941 754,442 32,129 1,758,116 1,550,088 929,971 620,117 29,533 178,495W isco n s in ............................................... 947,735 1,606,346 598,456 2,956,930 111,337 6,220,804 5,662,616 2,863,676 2,798,940 89,425 468,763W yo m in g ................................................. 99,901 144,555 38,351 271,784 12,587 567,178 511,097 287,699 223,398 7,911 48,170
O ther areaPuerto R ico ........................................... 86,617 83,778 57,674 426,167 26,782 681,018 605,739 280,034 325,705 21,297 53,982V irg in Is la n d s ....................................... 2,356 4,718 1,032 17,760 371 26,237 22,798 9,008 13,790 1,473 1,966
1 Asset and liability items are averages of the amounts reported for the following cal! dates: December 20,1963; June 30,1964; and December 31,1964. Note: For income data by State, see Table 119, pp.206-215.Back figures, 1946-1963: See the Annual Report for 1963, pp. 146-147, and earlier reports.
ASSETS AND
LIABILITIES OF
BANKS 189
Digitized for FRASER http://fraser.stlouisfed.org/ Federal Reserve Bank of St. Louis
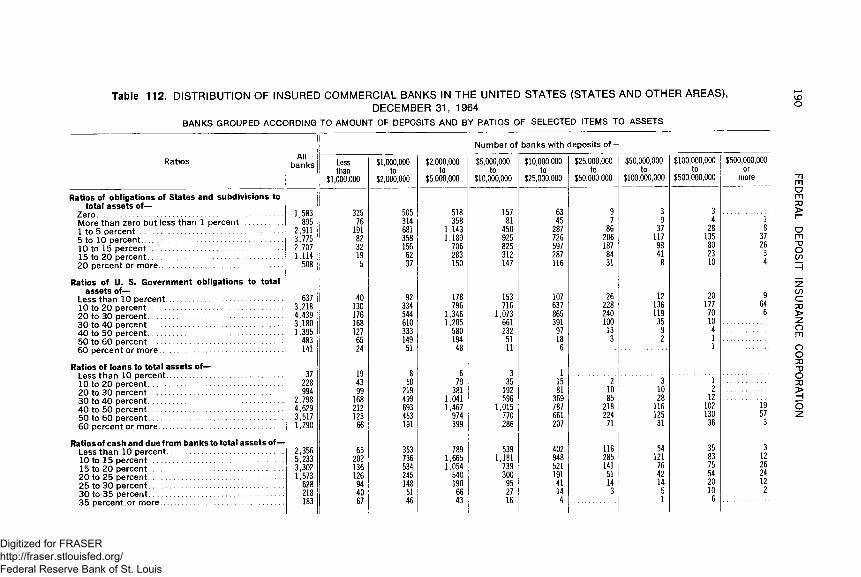
BANKS GROUPED ACCORDING TO AMOUNT OF DEPOSITS AND BY RATIOS OF SELECTED ITEMS TO ASSETS
Table 112. DISTRIBUTION OF INSURED COMMERCIAL BANKS IN THE UNITED STATES (STATES AND OTHER AREAS),DECEMBER 31, 1964
N u m b e r o f banks w ith dep os its o f—
RatiosAll
banks Lessthan
$1,000,000
$1,000,000to
$2,000,000
$2,000,000to
$5,000,000
$5,000,000to
$10,000,000
$10,000,000to
$25,000,000
$25,000,000to
$50,000,000
$50,000,000to
$100,000,000
$100,000,000to
$500,000,000
$500,000,000or
more
Ratios of obligations of States and subdivisions to total assets of—
1,583895
2,911
325 505 518 157 63 9 3 3
M ore th a n ze ro b u t less th a n 1 p e rc e n t..................... 76191
314681
3581,143
81450
45287
786
937
428
18
3,775 82 358 1,189 925 726 206 117 135 37
2,707 32 156 706 825 597 187 98 80 26
15 to 2 0 p e rc e n t ......................................................... 1,114508
19 62 283 312 287 84 41 23 3
2 0 p e rc e n t o r m ore ....................................................... 5 37 150 147 116 31 8 10 4
Ratios of U. S. Government obligations to total assets of—
Less th a n 10 p e rc e n t.......................................................... 637 40 92 178 153 107 26 12 20 9
10 to 2 0 p e rce n t ................................................. 3,2184,4393,180
130 334 796 716 637 228 136 177 64
20 to 3 0 p e rc e n t ........................................................... 176 544 1,346 1,073 865 240 119 70 6
q n to A fl n p r rp n t . . 168 610 1,205 661 391 100 35 10A fi tn Rf) n p r rp n t 1 395 127 333 580 232 97 13 9 4
RH to f i f i n p r rp n t . . 483 65 149 194 51 18 3 2 1141
37228
24
1943
51 48 11 6 1
Ratios of loans to total assets of—8 6 3 1Less th a n 10 p e rc e n t..........................................................
10 to 2 0 p e rce n t 50 79 35 15 2 3 1Of) tr» qn n p rrp n t 994
2,79899 219 381 192 81 10 10 2
3 0 to 4-0 p e rce n t 168 499 1,041 596 369 85 28 12
4 0 to 5 0 p e rce n t ............................................. 4,629 212 693 1,467 1,015 787 218 116 102 19
5 0 to 6 0 p e rce n t ............................................................. 3,517 123 453 974 770 661 224 125 130 57
6 0 p e rc e n t o r m ore ................................ 1,290
2,356
66 191 399 286 207 71 31 36 3
Ratios of cash and due from banks to total assets of—Less th a n 10 p e rce n t. ................................................. 65 353 789 539 402 116 54 35 3
10 to 15 p e rc e n t ............................................................... 5,233 202 736 1,665 1,181 948 285 121 83 1226
15 to 2 0 p e rce n t ................................................... 3,302 136 534 1,054 739 521 141 76 75
2 0 to 25 p e rc e n t ............................................................... 1,573 126 245 540 300 191 51 42 54 2412
2 5 to 3 0 p e rce n t ............................................... 628 94 148 190 95 41 14 14 20
3 0 to 3 5 p e rc e n t ............................................................... 218 40 51 66 27 14 3 5 10 2OR n o rro n t n y mATA 183 67 46 43 16 4 1 6
1
190 FEDERAL
DEPOSIT
INSU
RAN
CE
CO
RPO
RA
TION
Digitized for FRASER http://fraser.stlouisfed.org/ Federal Reserve Bank of St. Louis

Ratios of total capital accounts to total assets other than cash and due from banks and U. S. Government obligations of—
Less than 10 percent....................................................10 to 15 percent............................................................15 to 20 percent............................................................20 to 25 percent............................................................25 to 30 percent............................................................30 to 35 percent............................................................35 to 40 percent............................................ ...............40 percent or more.......................................................
Ratios of total capital accounts to total assets other than cash and due from banks, U. S. Government obligations, C.C.C. loans, and F.H.A. and V.A. real estate loans of—
Less than 10 percent....................................................10 to 15 percent............................................................15 to 20 percent............................................................20 to 25 percent............................................................25 to 30 percent............................................................30 to 35 percent............................................................35 to 40 percent............................................................40 percent or more.......................................................
Ratios of total capital accounts to total assets of— ..Less than 4 percent.......................................................4 to 6 percent.................................................................6 to 8 percent.................................................................8 to 10 percent...............................................................10 to 12 percent............................................................12 to 15 percent............................................................15 percent or more.......................................................
Number of banks...............................................................
1,301 2 305,389 60 3943,358 126 5751,568 126 421
748 94 261415 81 143244 65 103470 176 186
1,007 2 235,184 47 3363,478 118 5361,684 118 431
887 105 306447 80 161261 53 109545 207 211
32 2877 2 20
4,341 50 3314,187 122 6002,086 156 4931,201 182 394
769 216 275
13,493 730 2,113
Back figures, 1958-1968: See the Annual Report for 1963, pp. 148-149, and earlier reports.
175 307 417 191 88 75 161,434 1,535 1,238 327 177 173 511,414 743 348 81 31 28 12
728 200 72 8 9 4292 63 27 3 5 3147 29 13 266 7 2 191 13 4
140 237 333 150 67 48 71,294 1,479 1,253 339 189 189 581,425 807 396 107 37 38 14
784 237 87 11 12 4355 81 29 2 5 4154 33 16 1 286 10 2 1
109 13 5
3 4 12 5 4 2143 220 285 122 46 35 4
1,160 1,168 993 292 161 151 351,532 1,001 598 146 79 77 32
852 353 159 37 14 14 8449 103 53 8 9 3208 48 21 1
4,347 2,897 2,121 610 313 283 79
ASSETS AND
LIABILITIES OF
BANKS 191
Digitized for FRASER http://fraser.stlouisfed.org/ Federal Reserve Bank of St. Louis
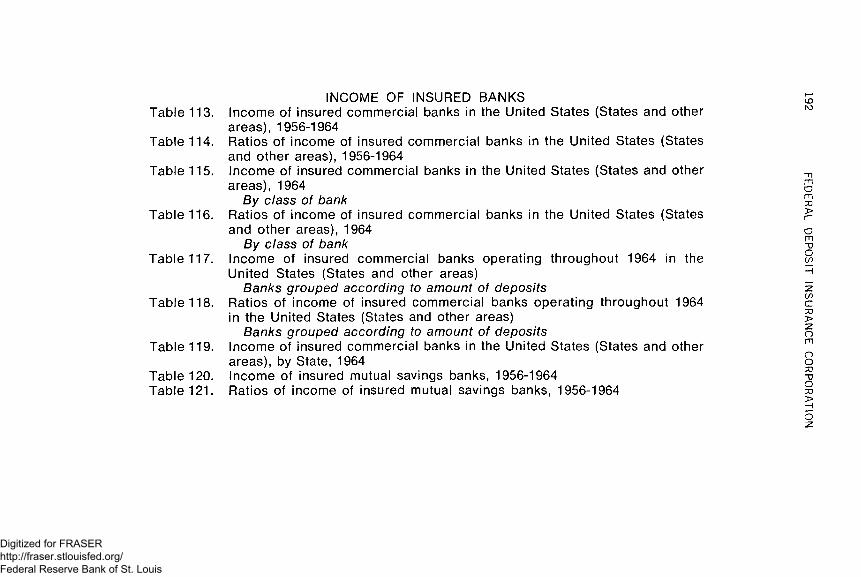
Table 113.
Table 114.
Table 115.
Table 116.
Table 117.
Table 118.
Table 119.
Table 120. Table 121.
INCOME OF INSURED BANKS Income of insured commercial banks in the United States (States and other areas), 1956-1964Ratios of income of insured commercial banks in the United States (States and other areas), 1956-1964Income of insured commercial banks in the United States (States and other areas), 1964
By class of bankRatios of income of insured commercial banks in the United States (States and other areas), 1964
By class of bankIncome of insured commercial banks operating throughout 1964 in the United States (States and other areas)
Banks grouped according to amount of deposits Ratios of income of insured commercial banks operating throughout 1964 in the United States (States and other areas)
Banks grouped according to amount of deposits Income of insured commercial banks in the United States (States and other areas), by State, 1964Income of insured mutual savings banks, 1956-1964 Ratios of income of insured mutual savings banks, 1956-1964
192 FED
ERAL
DEPO
SIT IN
SUR
ANC
E C
OR
PO
RA
TION
Digitized for FRASER http://fraser.stlouisfed.org/ Federal Reserve Bank of St. Louis
The income data received and published by the Corporation relate to commercial and mutual savings banks insured by the Corporation.
Commercial banksReports of income and dividends are submitted to the Federal
supervisory agencies on either a cash or an accrual basis.Income data are included for all insured banks operating at the
end of the respective years, unless indicated otherwise. In addition, appropriate adjustments have been made for banks in operation during part of the year but not at the end of the year. Data for 4 insured branches in Guam of 2 insured banks in California and Hawaii, for 5 insured branches in New York of 2 insured banks in Puerto Rico, for 15 insured branches in Puerto Rico and for 4 insured branches in the Virgin Islands of insured banks in New York are not available.
The uniform Report of Income and Dividends (formerly called Report of Earnings and Dividends) was revised extensively in 1961. New items were added, combining components previously included in other items; and some items were subsumed into new categories. Thus certain items, even carrying the same designation (e.g. other current operating expenses), are not comparable with data reported for prior years.
The revised form breaks out the following items not previously available separately: (1) benefits to officers and other employees; (2) net occupancy expense of bank premises, with a supporting schedule; (3) furniture and equipment expense (including costs related to the purchase or rental of automated data processing systems); and (4) losses on securities sold.
Two expense items previously reported separately have been combined with other items: (1) taxes other than on net income; and
(2) recurring depreciation on banking house, furniture and fixtures. Taxes on bank premises, social security taxes paid in behalf of building employees, and recurring depreciation on banking house are now included under occupancy expense of bank premises. Other social security taxes are included with officer and employee benefits. Recurring depreciation on furniture and fixtures is now included with furniture and equipment expense.
Revenue and expenses incident to “ Federal funds” transactions have been classified as “ Interest and discount on loans” and “ Interest and discount on borrowed money,” respectively.
In addition to other minor changes in classification, new designations have been given to certain items. For example, the term “ net income” is the new equivalent of the former term “ net profits.” A further change entailed the division of officers and other employees into two groups: those engaged in banking operations, and those concerned with building operations.
Mutual savings banksThe present report of income and dividends for mutual savings
banks was first used by the Corporation for the calendar year 1951. For a discussion of the history and principles of this report see pp. 50-52 in Part Two of the 1951 Annual Report.
Sources of dataNational banks and State banks in the District of Columbia not
members of the Federal Reserve System: Office of the Comptroller of the Currency.
State banks members of the Federal Reserve System: Board of Governors of the Federal Reserve System.
Other insured banks: Federal Deposit Insurance Corporation.
INCOM
E OF
INSU
RED
BANKS
193
Digitized for FRASER http://fraser.stlouisfed.org/ Federal Reserve Bank of St. Louis
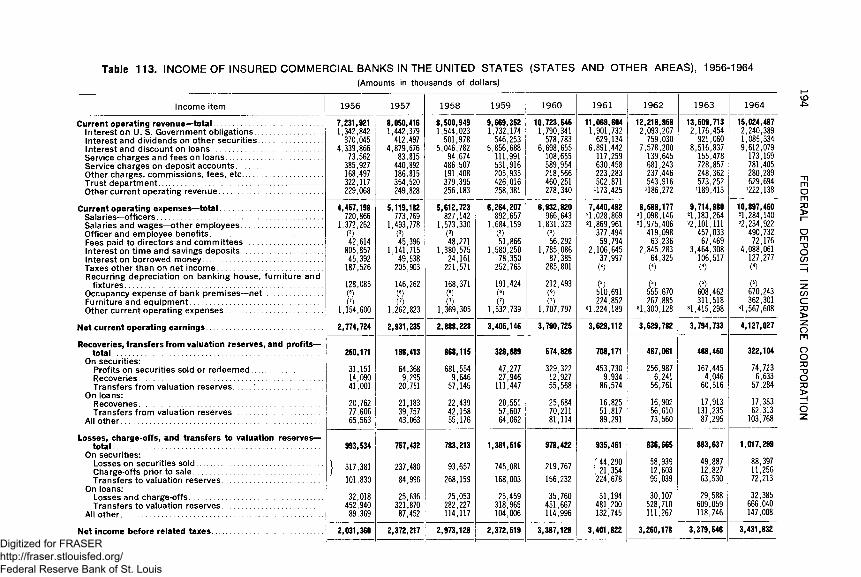
Table 113. INCOME OF INSURED COMMERCIAL BANKS IN THE UNITED STATES (STATES AND OTHER AREAS), 1956-1964(Am ounts in thousands o f do lla rs)
Incom e ite m 1956 1957 195 8 1959 196 0 1961 1962 1963 1964
Current operating revenue—tota l................................................. 7,231,9211,342,842
370,0454,339,866
8,050,416 8,500,949 9,669,352 10,723,545 11,069,604 12,218,959 13,509,713 15,024,487In te re s t on U. S. G o ve rn m e n t o b lig a tio n s ................................. 1,442,379 1,544,023 1,732,174 1,790,341 1,901,732 2,093,207 2,176,454 2,240,389In te re s t and d iv id e n d s on o th e r s e c u r it ie s ................................ 412,497 501,978 546,253 578,783 629,134 759,030 921,060 1,085,334In te re s t and d is c o u n t on lo a n s ....................................................... 4,879,676 5,046,782 5,856,688 6,698,655 6,891,442 7,578,200 8,516,837 9,612,079Service charges and fees on lo a n s ................................................Service charges on d e p o s it a c c o u n ts ...........................................
73,562385,927
83,815440,892
94,674486,507
111,991531,916
108,655589,954
117,259630,458
139,645681,243
155,478728,857
173,159781,405
O ther charges, com m iss ions , fees, e tc ........................................T ru s t d e p a rtm e n t ....................................................................
168,497322,117
186,815354,520
191,408379,395
205,935426,016
218,566460,251
223,283502,871
237,446543,916
248,362573,252
280,289629,694
O ther c u rre n t o p e ra tin g re v e n u e .................................................... 229,068 249,828 256,183 258,381 278,340 473,425 >186,272 ‘189,413 >222,138
Current operating expenses—total.............................................. 4,457,198 5,119,182 5,612,723 6,264,207 6,932,820 7,440,492 8,589,177 9,714,980 10,897,460Salaries— o ff ic e rs ................................................................................... 720,866 773,769 827,142 892,657 966,643 21,028,869 21,098,146 21,183,264 21,284,140Salaries and wages— o th e r e m p lo y e e s ........................................O ffice r and em p loyee b e n e fits ........................................................
1,372,262(3)
1,493,778(3)
1,573,330(3)
1,684,159(3)
1,831,323(3)
21,869,961 377,494
21,975,406 419,098
22 ,101,111 457,033
22,234,922 490,732
Fees paid to d ire c to rs and c o m m itte e s ....................................... 42,614 45,396 48,271 51,866 56,292 59,794 63,236 67,469 72,176In te re s t on t im e and savings d e p o s its ........................................ 805,857 1,141,715
49,5381,380,575 1,580,250 1,785,086 2,106,645 2,845,283 3,464,308 4,088,061
In te re s t on borrow ed m o n e y ............................................................ 45,392 24,161 78,350 87,385 37,997(4)
64,325(4)
106,517(4)
127,277Taxes o th e r th a n on ne t in c o m e ..................................................... 187,526 205,903 221,571 252,763 285,801 (4)R e curring de p re c ia tio n on b a n k in g house, fu rn itu re and
f ix tu re s ................................................................................................... 128,085 146,262 168,371 191,424 212,493 (5) (5) (6) (5)O ccupancy expense o f ban k p re m ise s— n e t .............................F u rn itu re a nd e q u ip m e n t..................................................................
(6)(7)
(6)(7)
(6)(7)
(6)(7)
(6)(7)
510,691224,852
555,670267,885
608,462311,518
670,243362,301
O ther c u rre n t o p e ra tin g e xp e n se s .......................... .................. 1,154,600 1,262,823 1,369,305 1,532,739 1,707,797 81,224,189 *1,300,128 81,415,298 81,567,608
Net current operating earnings..................................................... 2,774,724 2,931,235 2,888,223 3,405,145 3,790,725 3,629,112 3,629,782 3,794,733 4,127,027
Recoveries, transfers from valuation reserves, and profits— t o t a l ................. .................................................................. 250,171 198,413 868,115 328,889 574,826 708,171 467,061 468,450 322,104
On securities :P ro fits on se c u ritie s sold o r re d e e m e d ................................... 31,151
14,09064,368 681,554 47,277 329,322 453,730 256,987 167,445 74,723
Recoveries .......................................................................................... 9,295 9,646 27,946 12,927 9,934 6,241 4,046 6,633T ra n s fe rs f ro m va lu a tio n reserves 41,001
20,762
20,751
21,183
57,145 111,447 55,568 86,574 56,761 60,516 57,284On loans:
R e coveries ............................................................................................ 22,439 20,551 25,684 16,825 16,902 17,913 17,383T ra n s fe rs fro m va lu a tio n re s e rv e s ............................................. 77,606 39,757 42,158 57,607 70,211 51,817 56,610 131,235 62,313
All o th e r ..................................................................................................... 65,563 43,063 55,176 64,062 81,114 89,291 73,560 87,295 103,768
Losses, charge-offs, and transfers to valuation reserves— total............................................................................................... 993,534
1 317,381
757,432
237,480
783,213
93,657
1,361,515
745,081
978,422
219,767
935,461 836,665 883,637 1,017,299On securities :
Losses on se cu ritie s s o ld ............................................................... / 44,290 58,939 49,887 88,397C harge-o ffs p rio r to s a le ................................................................. \21,354 12,603 12,827 11,256T ra n s fe rs to va lua tion re s e rv e s .................................................. 101,830 84,996 268,159 168,003 156,232 224,678 95,039 63,530 72,213
On loans:Losses and ch a rg e -o ffs ................................................................... 32,018 25,636 25,053 25,459 35,760 31,194 30,107 29,588 32,385T ra n s fe rs to va lua tion re s e rv e s .................................................. 452,940 321,870 282,227 318,965 451,667 481,200 528,710 609,059 666,040
All o th e r ......................................................................................... 89,369 87,452 114,117 104,006 114,996 132,745 111,267 118,746 147,008
Net income before related taxes.................................................. 2,031,360 2,372,217 2,973,128 2,372,519 3,387,129 3,401,822 3,260,178 3,379,546 3,431,832
194 FEDERAL
DEPOSIT
INSU
RAN
CE
CO
RP
OR
ATIO
N
Digitized for FRASER http://fraser.stlouisfed.org/ Federal Reserve Bank of St. Louis
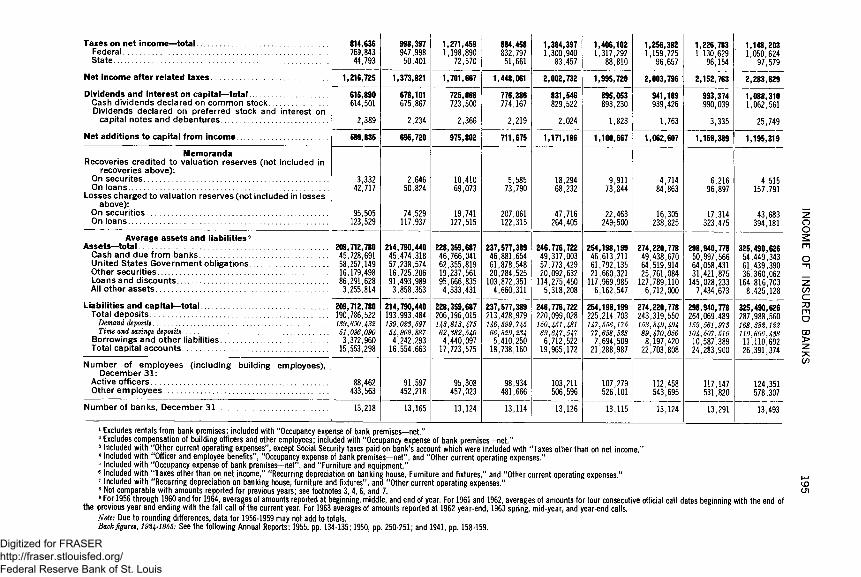
Taxes on net income—tota l...........................................................F ed era l......................................................................................................S ta te ...........................................................................................................
Net income after related taxes.....................................................
Dividends and interest on capital—total...................................Cash d iv id e n d s de c la re d on co m m o n s to c k .............................D iv idends d e c la re d on p re fe rre d s to ck and in te re s t on
ca p ita l no te s a nd d e b e n tu re s .....................................................
Net additions to capital from income.........................................
814,636769,84344,793
998,397947,99850,401
1,271,4591,198,890
72,570
884,458832,79751,661
1,384,3971,300,940
83,457
1,406,1021,317,292
88,810
1,256,3821,159,725
96,657
1,226,7831,130,629
96,154
1,148,2031,050,624
97,579
1,216,725 1,373,821 1,701,667 1,448,061 2,002,732 1,995,720 2,003,796 2,152,763 2,283,629
616,890614,501
2,389
678,101675,867
2,234
725,866723,500
2,366
776,386774,167
2,219
831,546829,522
2,024
895,053893,230
1,823
941,189939,426
1,763
993,374990,039
3,335
1,088,3101,062,561
25,749
599,835 695,720 975,802 711,675 1,171,186 1,100,667 1,062,607 1,159,389 1,195,319
MemorandaRecoveries c re d ite d to va lua tion reserves (n o t inc luded in
recoveries above):On s e c u r ite s ............................................................................................On lo a n s ....................................................................................................
Losses cha rg e d to va lua tion reserves (rvot inc luded in losses above):
On s e c u r it ie s ...........................................................................................On lo a n s ....................................................................................................
3,33242,717
95,505123,529
2,64650,824
74,529117,937
10,41069,073
19,741127,515
5,58573,790
207,061122,315
18,29468,232
47,716264,405
9,91173,844
22,463249-500
4,71484,863
16,305238,825
6,21696,897
17,314323,475
4,515157,791
43,683394,181
Average assets and liabilities9 Assets—total......................................................................................
Cash and due fro m b a n k s ................................................................U n ite d S ta te s G o ve rn m e n t o b lig a tio n s .......................................O th e r s e c u r it ie s .....................................................................................Loans and d is c o u n ts ...........................................................................All o th e r a s s e ts ......................................................................................
Liabilities and capital—total.........................................................Tota l d e p o s its ...............................................................................
Demand deposits..................................................Time and savings deposits...................................................
B orrow ings an d o th e r lia b ilit ie s .....................................................To ta l cap ita l a c c o u n ts .................................................
209,712,78045,728,69158,257,14916,179,49886,291,6283,255,814
214,790,44045,474,31857,238,57416,725,20691,493,9893,858,353
228,359,68746,766,04162,355,81919,237,56195,666,8354,333,431
237,577,38946,881,65461,878,54820,284,525
103,872,3514,660,311
246,776,72249,317,00357,773,42920,092,632
114,275,4505,318,208
254,198,19946,613,21161,792,13521,660,321
117,969,9856,162,547
274,220,77849,438,67064,519,91425,761,084
127,789,1106,712,000
298,940,77850,997,56664,058,43131,421,875
145,028,2337,434,673
325,490,62654,449,34361,439,39036,360,062
164,816,7038,425,128
209,712,780190,786,5221 39 ,6 9 0 ,4 3 2
5 1 ,0 9 6 ,0 9 03,372,960
15,553,298
214,790,440193,993,4841 3 9 ,0 2 3 ,5 9 7
5 4 ,9 6 9 ,8 8 74,242,293
16,554,663
228,359,687206,196,0151 4 3 ,8 1 3 ,4 7 5
6 2 ,3 8 2 ,5 4 04,440,097
17,723,575
237,577,389213,428,9791 4 6 ,5 9 9 ,7 4 5
6 6 ,8 2 9 ,2 3 45,410,250
18,738,160
246,776,722220,099,0281 5 0 ,4 5 1 ,4 8 1
6 9 ,6 4 7 ,5 4 76,712,522
19,965,172
254,198,199225,214,7031 4 7 ,5 5 6 ,1 7 5
7 7 ,6 5 8 ,5 2 87,694,509
21,288,987
274,220,778243,319,5501 5 3 ,8 4 9 ,4 9 4
8 9 ,4 7 0 ,0 5 68,197,420
22,703,808
298,940,778264,069,4891 5 9 ,5 6 1 ,9 7 31 0 4 ,5 0 7 ,5 1 610,587,38924,283,900
325,490,626287,988,5601 6 8 ,3 8 2 ,1 2 21 1 9 ,6 0 6 ,4 3 8
11,110,69226,391,374
N u m b e r o f em ployees ( in c lu d in g b u ild ing em ployees), D ecem ber 31 :
A ctive o f f ic e rs ........................................................................................O ther e m p lo y e e s ..................................................................................
88,462433,563
91,597452,218
95,308457,023
98,934481,666
103,211506,596
107,279526,101
112,458543,695
117,147531,820
124,351578,307
N u m b e r o f banks, D ecem ber 3 1 ....................................................... 13,218 13,165 13,124 13,114 13,126 13,115 13,124 13,291 13,493
1 Excludes rentals from bank premises; included with “ Occupancy expense of bank premises— net.”2 Excludes compensation of building officers and other employees; included with "Occupancy expense of bank premises— net.”3 Included with “ Other current operating expenses” , except Social Security taxes paid on bank's account which were included with “ Taxes other than on net income.”4 Included with “ Officer and employee benefits” , “ Occupancy expense of bank premises— net", and "Other current operating expenses.”5 Included with "Occupancy expense of bank premises— net” , and “ Furniture and equipment.”6 Included with "Taxes other than on net income," “ Recurring depreciation on banking house, Furniture and fixtures,” and “ Other current operating expenses.”7 Included with "Recurring depreciation on banking house, furniture and fixtures” , and “ Other current operating expenses.”8 Not comparable with amounts reported for previous years; see footnotes 3,4,6, and 7.9 For 1956 through 1960 and for 1964, averages of amounts reported at beginning, middle, and end of year. For 1961 and 1962, averages of amounts for four consecutive official call dates beginning with the end of
the previous year and ending with the fall call of the current year. For 1963 averages of amounts reported at 1962 year-end, 1963 spring, mid-year, and year-end calls.Note: Due to rounding differences, data for 1956-1959 may not add to totals.Back figures, 1934-1955: See the following Annual Reports: 1955, pp. 134-135; 1950, pp. 250-251; and 1941, pp. 158-159.
INCOM
E OF
INSURED BANKS
195
Digitized for FRASER http://fraser.stlouisfed.org/ Federal Reserve Bank of St. Louis

Table 114. RATIOS OF INCOME OF INSURED COMMERCIAL BANKS IN THE UNITED STATES (STATES AND OTHER AREAS), 1956-1964
Incom e ite m 1956 1957 195 8 1959 196 0 1961 1962 1963 1964
Amounts per $100 of current operating revenue Current operating revenue—tota l............................................................................................................. $100.00 $100.00 $100.00 $100.00 $100.00 $100.00
17.185.68
63.31
$100.0017.136.21
63.16
$100.0016.116.82
64.19
$100.0014.917.22
65.13
In te re s t on U. S. G o ve rn m e n t o b lig a tio n s ....................................................................................................In te re s t and d iv id e n d s on o th e r s e c u r it ie s ..................................................................................................Incom e on lo a n s ......................................................................................................................................................
18.575.12
61.03
17.925.12
61.65
18.165.91
60.48
17.915.65
61.73
16.695.40
63.48Service charges on d e p o s it a c c o u n ts ............................................................................................................. 5.33 5.48 5.72 5.50 5.50 5.70 5.58 5.39 5.20O th e r charges, com m iss ions , fees, e tc ..........................................................................................................O ther c u r re n t o p e ra tin g re v e n u e .....................................................................................................................
2.337.62
2.327.51
2.257.48
2.137.08
2.046.89
2.02 *6.11
1.94>5.98
1.84*5.65
1.87'5.67
Current operating expenses—tota l.......................................................................................................... 61.63 63.59 66.02 64.78 64.65 67.22 70.29 71.91 72.53Salaries, wages, and fe e s ....................................................................................................................................O ffice r and em ployee b e n e fits ..........................................................................................................................
29.53(3)
28.73(3)
28.80(3)16.242.61
27.19(3)
26.62(3)
226.73 3.41
225 . 67 3.43
224.81 3.38
223.903.27
In te re s t on t im e and savings d e p o s its ..........................................................................................................Taxes o th e r th a n on n e t in c o m e .......................................................................................................................
11.142.60
14.182.56
16.342.61
16.652.66
19.03(4)
23.28(4)
25.64(4)
27.21(4)
R e curring d e p re c ia tio n on b a n k in g house, fu rn itu re and f ix tu re s ....................................................O ccupancy expense o f ban k p re m ise s— n e t ...............................................................................................
1.77(«)
1.82(6)
1.98(6)
1.98(6)
1.98(6)(7)16.74
(5)4.61
(5)4.55
(6)4.50
(6)4.46
F u rn itu re and e q u ip m e n t................................................................................................................ ................O th e r c u r re n t o p e ra tin g e x p e n s e s ..................................................................................................................
(7)16.59
(7)16.30
(7)16.39
(7)16.66
2.03*11.41
2.19*11.17
2.31*11.27
2.41*11.28
Net current operating earnings................................................................................................................. 38.37 36.41 33.98 35.22 35.35 32.78 29.71 28.09 27.47
Amounts per $100 of total assets9C u rre n t o p e ra tin g revenue— to ta l..................................................................................................................... 3.45 3.74 3.72 4.07 4.35 4.35 4.45 4.52 4.62C u rre n t o p e ra tin g expenses— to ta l .................................................................................................................. 2.13 2.38 2.46 2.64 2.81 2.92 3.13 3.25 3.35N et c u r re n t o p e ra tin g e a rn in g s ......................................................................................................................... 1.32 1.36 1.26 1.43 1.54 1.43 1.32 1.27 1.27Recoveries, tra n s fe rs fro m v a lu a tio n reserves, and p ro fits— to ta l..................................................... .12 .09 .38 .14 .23 .28 .17 .16 .10Losses, ch a rg e -o ffs , and tra n s fe rs to va lu a tio n reserves— to ta l......................................................... .47 .35 .34 .57 .40 .37 .30 .30 .32N e t incom e be fo re re la ted ta x e s ...................................................................................................................... .97 1.10 1.30 1.00 1.37 1.34 1.19 1.13 1.05N et incom e a fte r re la ted ta x e s .......................................................................................................................... .58 .64 .75 .63 .81 .79 .73 .72 .70
Amounts per $100 of total capital accounts9N e t c u r re n t o p e ra tin g e a rn in g s ......................................................................................................................... 17.84 17.71 16.30 18.17 18.99 17.05 15.99 15.63 15.64Recoveries, tra n s fe rs fro m va lu a tio n reserves, and p ro fits— to ta l.....................................................Losses, ch arge-o ffs , and tra n s fe rs to v a lu a tio n reserves— to ta l.........................................................N e t incom e be fo re re la ted ta x e s ................................................. . . .
1.616.39
13.06
1.204.58
14.33
4.894.42
16.77
1.767.27
12.66
2.884.90
16.97
3.324.39
15.98
2.063.69
14.36
1.933.64
13.92
1.223.86
13.00Taxes on n e t in c o m e .............................................................................................................................................. 5.24 6.03 7.17 4.72 6.94 6.61 5.53 5.06 4.35N et incom e a fte r re la ted ta x e s ..................................................... 7.82 8.30 9.60 7.94 10.03 9.37 8.83 8.86 8.65Cash d iv id e n d s d e c la re d ........................................................................... .......... ........................ 3.96 4.10 4.09 4.14 4.16 4.20 4.15 4.09 4.12N e t a d d itio n s to cap ita l fro m in c o m e ............................................................................................................. 3.86 4.20 5.51 3.80 5.87 5.17 4.68 4.77 4.53
Special ratios9Incom e on loans per $ 1 0 0 o f lo a n s ..................................................... ........................ 5.11 5.42 5.37 5.75 5.96 5.94 6.04 5.98 5.94Incom e on U. S. G overnm e nt ob liga tions pe r $ 1 0 0 o f U. S. G overnm ent o b lig a tio n s ...............Incom e on o th e r securities pe r $ 1 0 0 o f o th e r s e c u r it ie s ......................................................................Service charges per $ 1 0 0 o f dem and d e p o s its .........................................................................................
2.312.29
.28
2.522.47
.32
2.482.61
.34
2.802.69
.36
3.102.88
.39
3.082.90
.43
3.242.95
.44
3.402.93
.46
3.652.98
.46In te re s t paid per $ 1 0 0 o f t im e and savings d e p o s its ............................................................................. 1.58 2.08 2.21 2.36 2.56 2.71 3.18 3.31 3.42
196 FEDERAL
DEPOSIT
INSU
RAN
CE
CO
RPO
RA
TION
Digitized for FRASER http://fraser.stlouisfed.org/ Federal Reserve Bank of St. Louis
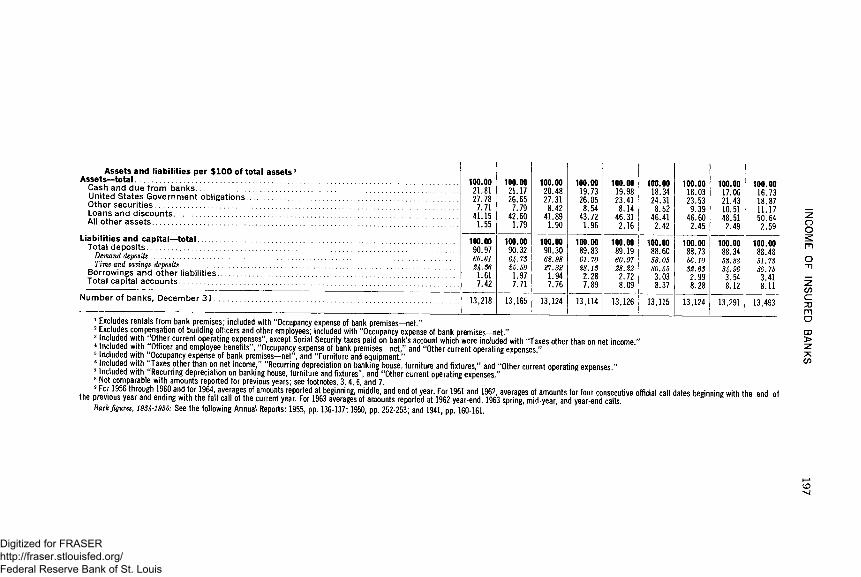
Assets and liabilities per $100 of total assets Assets—tota l.......................................................................
Cash and due fro m b a n k s ................................................U n ited S tates G o ve rn m e n t o b lig a tio n s .......................O the r s e c u r it ie s .....................................................................Loans and d is c o u n ts ...........................................................All o th e r a s s e ts ......................................................................
Liabilities and capital—total...........................................Tota l d e p o s its .........................................................................
Demand deposits.............................................................Time and savings deposits................................................
B o rrow ings and o th e r l ia b ilit ie s .....................................T o ta l cap ita l a c c o u n ts ........................................................
N u m b e r o f banks, D e cem b er 3 1 .......................................
100.00 100.00 100.00 100.00 100.00 100.00 100.00 100.00 100.0021.81 21.17 20.48 19.73 19.98 18.34 18.03 17.06 16.7327.78 26.65 27.31 26.05 23.41 24.31 23.53 21.43 18.87
7.71 7.79 8.42 8.54 8.14 8.52 9.39 10.51 11.1741.15 42.60 41.89 43.72 46.31 46.41 46.60 48.51 50.64
1.55 1.79 1.90 1.96 2.16 2.42 2.45 2.49 2.59
100.00 100.00 100.00 100.00 100.00 100.00 100.00 100.00 100.0090.97 90.32 90.30 89.83 89.19 88.60 88.73 88.34 88.486 6 .6 1 6 4 .7 3 6 2 .9 8 6 1 .7 0 6 0 .9 7 5 8 .0 5 5 6 .1 0 5 3 .3 8 5 1 .7 32 4 .3 6 2 5 .5 9 2 7 .3 2 2 8 .1 3 2 8 .2 2 3 0 .5 5 3 2 .6 3 3 4 .9 6 3 6 .7 5
1.61 1.97 1.94 2.28 2.72 3.03 2.99 3.54 3.417.42 7.71 7.76 7.89 8.09 8.37 8.28 8.12 8.11
13,218 13,165 13,124 13,114 13,126 13,115 13,124 13,291 13,493
1 Excludes rentals from bank premises; included with “ Occupancy expense of bank premises— net.”2 Fxc,lu,de! comPensation of building officers and other employees; included with “ Occupancy expense of bank premises— net.”3 nc uded with “ Other current operating expenses” , except Social Security taxes paid on bank’s account which were included with "Taxes other than on net income ”
included with Officer and employee benefits , ‘ Occupancy expense of bank premises— net,” and “ Other current operating expenses ”5 Included with ^Occupancy expense of bank premises— net", and “ Furniture and equipment.”6 Included with “ Taxes other than on net income," “ Recurring depreciation on banking house, furniture and fixtures,” and “ Other current operating expenses.”
Included with Recurring depreciation on banking house, furniture and fixtures” , and “ Other current operating expenses.”8 Not comparable with amounts reported for previous years; see footnotes, 3,4,6, and 7.
th» r.K !^ i ,ave,Ia? . l 0f amT ts reported at beginning, middle, and end of year. For 1961 and 1962, averages of amounts for four consecutive official call dates beginning with the end ofthe previous year and ending with the fall call of the current year. For 1963 averages of amounts reported at 1962 year-end, 1963 spring, mid-year, and year-end calls.
Back figures, 1934-1955: See the following Annual Reports; 1955, pp. 136-137; 1950, pp. 252-253; and 1941, pp. 160-161.
INCOM
E OF
INSURED BANKS
197
Digitized for FRASER http://fraser.stlouisfed.org/ Federal Reserve Bank of St. Louis

Table 115. INCOME OF INSURED COMMERCIAL BANKS IN THE UNITED STATES (STATES AND OTHER AREAS), 1964BY CLASS OF BANK
(Am ounts in thousand s o f do lla rs)
Incom e ite m TotalM em b e rs F.R. System N ot
m e m b e rs F.R. System
O pera tin g th ro u g h o u t
th e year
O perating less than fu ll yearN ational State
Current operating revenue—tota l...................................................................................... 15,024,487 8,147,698 4,227,943 2,648,846 14,880,868 143,619In te re s t on U. S. G o ve rn m e n t o b lig a tio n s ........................................................................... 2,240,389 1,189,736 551,394 499,259 2,219,652 20,737In te re s t and d iv id e n d s on o th e r s e c u r it ie s ......................................................................... 1,085,334 601,677 309,504 174,153 1,075,504 9,830In te re s t and d is c o u n t on lo a n s ................................................................................................ 9,612,079 5,276,368 2,694,442 1,641,269 9,520,740 91,339Service charges and fe e s on lo a n s ......................................................................................... 173,159 93,734 46,696 32,729 171,112 2,047Service charges on d e p o s it a c c o u n ts .................................................................................... 781,405 441,409 165,784 174,212 775,515 5,890O th e r charges, co m m iss io n s , fees, e tc ................................................................................. 280,289 133,259 73,925 73,105 277,599 2,690T ru s t d e p a rtm e n t........................................................................................................................... 629,694 290,331 311,024 28,339 620,722 8,972O th e r c u r re n t o p e ra tin g re v e n u e ............................................................................................ 222,138 121,184 75,174 25,780 220,024 2,114
Current operating expenses—to ta l.................................................................................... 10,897,460 5,904,713 2,983,328 2,009,419 10,783,527 113,933Salaries— o f f ic e rs ............................................................................................................................ 1,284,140 664,841 302,311 316,988 1,269,126 15,014Salaries and wages— o th e r e m p lo y e e s ................................................................................. 2,234,922 1,210,766 659,052 365,104 2,211,747 23,175O ffice r and em ployee b e n e fits ................................................................................................. 490,732 266,022 153,407 71,303 486,775 3,957Fees paid to d ire c to rs and c o m m itte e s ................................................................................ 72,176 33,447 12,393 26,336 71,427 749In te re s t on tim e and savings d e p o s its ................................................................................. 4,088,061 2,262,724 1,120,800 704,537 4,055,304 32,757In te re s t on borrow ed m o n e y ..................................................................................................... 127,277 63,477 58,577 5,223 126,073 1,204O ccupancy expense o f ban k prem ises— n e t ...................................................................... 670,243 350,823 198,642 120,778 662,300 7,943F u rn itu re and e q u ip m e n t........................................................................................................... 362,301 206,210 90,307 65,784 358,010 4,291O th e r c u rre n t o p e ra tin g e xp e n se s .......................................................................................... 1,567,608 846,403 387,839 333,366 1,542,765 24,843
Net current operating earnings.......................................................................................... 4,127,027 2,242,985 1,244,615 639,427 4,097,341 29,686
Recoveries, transfers from valuation reserves, and profits—total...........................On securities :
322,104 168,623 106,143 47,338 315,365 6,739
P ro fits on se cu ritie s sold o r re d e e m e d ............................................................................ 74,723 43,318 14,975 16,430 73,549 1,174R ecoveries..................................................................................................................................... 6,633 1,564 3,909 1,160 6,592 41T ra n s fe rs fro m va lua tion re s e rv e s ......................................................................................
On loans:57,284 39,214 14,764 3,306 56,400 884
R ecoveries..................................................................................................................................... 17,383 7,640 2,729 7,014 17,296 87T ra n s fe rs fro m va lua tion re s e rv e s ..................................................................................... 62,313 19,288 37,097 5,928 60,883 1,430
All o th e r .............................................................................................................................................. 103,768 57,599 32,669 13,500 100,645 3,123
Losses, charge-offs, and transfers to valuation reserves—total................................On securities :
1,017,299 556,940 288,273 172,086 1,004,288 13,011
Losses on securities s o ld ........................................................................................................ 88,397 49,738 29,947 8,712 87,711 686C harge-o ffs p rio r to s a le .......................................................................................................... 11,256 4,442 3,936 2,878 10,170 1,086T ra n s fe rs to va lua tion reserves. ........................................................................................
On loans:72,213 41,340 23,920 6,953 71,337 876
Losses and ch a rg e -o ffs ............................................................................................................ 32,385 13,465 3,380 15,540 32,171 214T ra n s fe rs to va lua tion re s e rv e s ........................................................................................... 666,040 365,585 186,211 114,244 658,841 7,199
All o th e r .............................................................................................................................................. 147,008 82,370 40,879 23,759 144,058 2,950
Net income before related taxes........................................................................................ 3,431,832 1,854,668 1,062,485 514,679 3,408,418 23,414
198 FEDERAL
DEPOSIT
INSU
RAN
CE
CO
RP
OR
ATIO
N
Digitized for FRASER http://fraser.stlouisfed.org/ Federal Reserve Bank of St. Louis
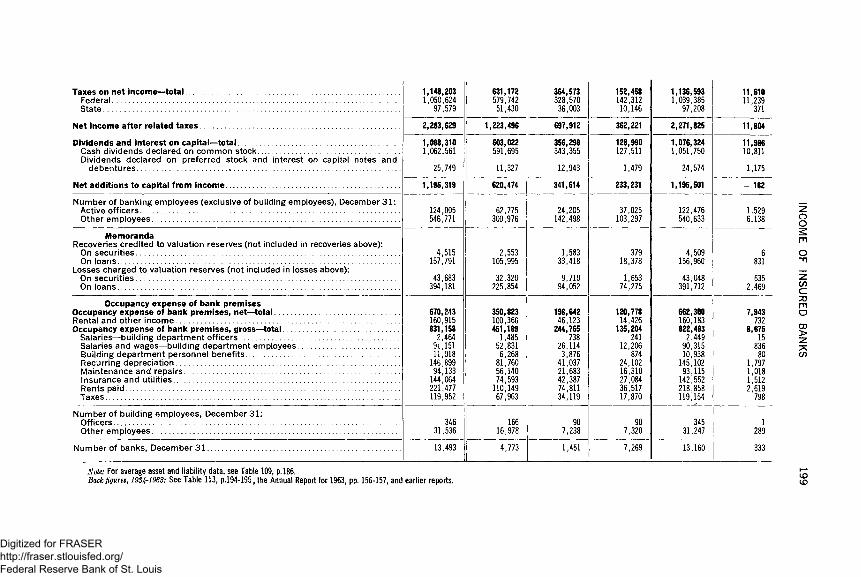
Taxes on net income—tota l.................................................................................................F e d e ra l................................................................................................................................................
1,148,2031,050,624
97,579
631,172579,74251,430
364,573328,57036,003
152,458142,31210,146
1,136,5931,039,385
97,208
11,61011,239
371Sta te ....................................................................................................................................................
Net income after related taxes...........................................................................................
Dividends and interest on capital—tota l.........................................................................Cash d iv id e n d s d ec la red on co m m o n s to c k ......................................................................D iv idends dec la red on p re fe rre d s tock and in te re s t on capita l notes and
d e b e n tu re s ...........................................................................................................................
2,283,629 1,223,496 697,912 362,221 2,271,825 11,804
1,088,3101,062,561
25,749
603,022591,695
11,327
356,298343,355
12,943
128,990127,511
1,479
1,076,3241,051,750
24,574
11,98610,811
1,175
Net additions to capital from income............................................................................... 1,195,319 620,474 341,614 233,231 1,195,501 - 182
N u m b e r o f b a n k in g em ployees (exclusive o f b u ild ing em ployees), Decem ber 3 1 : A ctive o f f ic e rs ...................................................................................................... ........................... 124,005
546,77162,775
300,97624,205
142,49837,025
103,297122,476540,633
1,5296,138O th e r e m p lo y e e s ............................................................................................................................
MemorandaR ecoveries c re d ite d to v a lu a tio n reserves (n o t inc lu ded in recoveries above):
On s e c u r it ie s .................................................................................................................................... 4,515157,791
43,683394,181
2,553105,995
32,320225,854
1,58333,418
9,71094,052
37918,378
1,65374,275
4,509156,960
43,048391,712
6831
6352,469
On lo a n s .............................................................................................................................................Losses ch a rg e d to va lu a tio n reserves (n o t inc luded in losses above):
On s e c u r it ie s ....................................................................................................................................On lo a n s .............................................................................................................................................
Occupancy expense of bank premises Occupancy expense of bank premises, net—total.........................................................Renta l and o th e r in c o m e ........................... .................................................................................Occupancy expense of bank premises, gross—total....................................................
S alaries— b u ild in g d e p a rtm e n t o f f ic e rs ................................................................................Salaries and wages— b u ild in g d e p a rtm e n t em p loyee s ..................................................B u ild ing d e p a rtm e n t personn e l b e n e fits .............................................................................R e curring d e p re c ia tio n ................................................................................................................M a in tenance and re p a irs ............................................................................................................Insu rance and u t il it ie s .................................................................................................................R ents p a id .........................................................................................................................................
670,243160,915831,158
2,46491,15111,018
146.89994,133
144,064221,477119,952
350,823100,366451,189
1,48552,8316,268
81,76056,14074,593
110,14967,963
198,64246,123
244,765738
26,1143,876
41,03721,68342,38774,81134,119
120,77814,426
135,204241
12,206874
24,10216,31027,08436,51717,870
662,300160,183822,483
2,44990,31510,938
145,10293,115
142,552218,858119,154
7,943732
8,67515
83680
1,7971,0181,5122,619
798Taxes .................................................................................................................................................
N u m b e r o f b u ild in g em ployees, D ecem ber 31:O ffic e rs .......................................................... ................................................................................. 346
31,536166
16,97890
7,23890
7,320345
31,2471
289O ther e m p lo y e e s ............................................................................................................................
N u m b e r o f banks, D ecem b er 3 1 ................................................................................................ 13,493 4,773 1,451 7,269 13,160 333
Note: For average asset and liability data, see Table 109, p. 186.Back figures, 1934-1963: See Table 113, p.194-195, the Annual Report for 1963, pp. 156-157, and earlier reports.
INCOM
E OF
INSURED BANKS
199
Digitized for FRASER http://fraser.stlouisfed.org/ Federal Reserve Bank of St. Louis
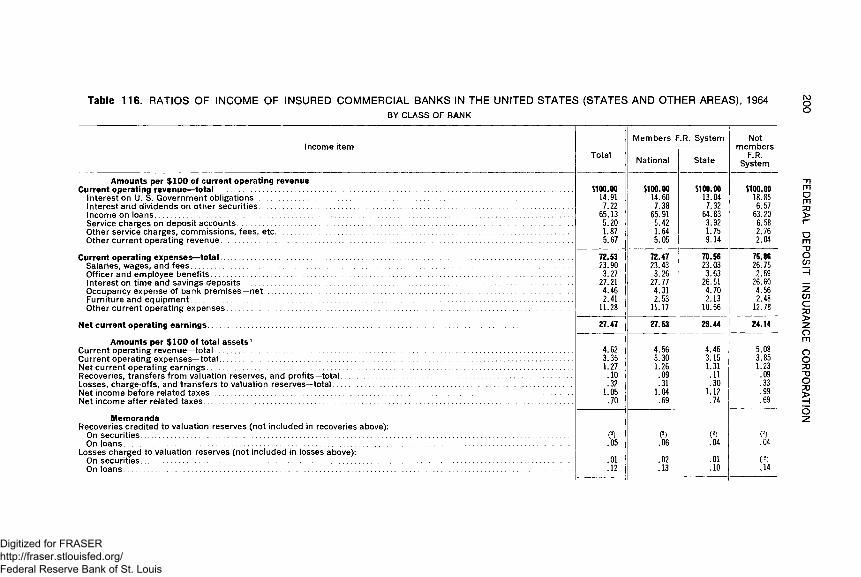
Table 116. RATIOS OF INCOME OF INSURED COMMERCIAL BANKS IN THE UNITED STATES (STATES AND OTHER AREAS), 1964BY CLASS OF BANK
Incom e itemM em b e rs F.R. System Not
m em b ersF.R.
SystemTotal
N a tiona l S tate
Amounts per $100 of current operating revenueCurrent operating revenue—tota l.................................................................................................................................................................. $100.00 $100.00 $100.00 $100.00
In te re s t on U. S. G o ve rn m e n t o b lig a tio n s .............................................................................................................................................................. 14.91 14.60 13.04 18.85In te re s t and d iv id e n d s on o th e r s e c u r it ie s ............................................................................................................................................................. 7.22 7.38 7.32 6.57Incom e on lo a n s ................................................................................................................................................................................................................. 65.13 65.91 64.83 63.20Service charges on d e p o s it a c c o u n ts ........................................................................................................................................................................ 5.20 5.42 3.92 6.58O th e r serv ice charges, co m m iss io n s , fees, e tc ..................................................................................................................................................... 1.87 1.64 1.75 2.76O th e r c u rre n t o p e ra tin g re v e n u e ................................................................................................................................................................................ 5.67 5.05 9.14 2.04
Current operating expenses—tota l................................................................................................................................................................ 72.53 72.47 70.56 75.86Salaries, wages, and fe e s ............................................................................................................................................................................................... 23.90 23.43 23.03 26.75O ffice r and em ployee b e n e fits ..................................................................................................................................................................................... 3.27 3.26 3.63 2.69In te re s t on t im e and savings d e p o s its ..................................................................................................................................................................... 27.21 27.77 26.51 26.60O ccupancy expense o f ban k p rem ises— n e t .......................................................................................................................................................... 4.46 4.31 4.70 4.56F u rn itu re and e q u ip m e n t ............................ ........................................................................................................... 2.41 2.53 2.13 2.48O th e r c u rre n t o p e ra tin g e x p e n s e s ............................................................................................................................................................................. 11.28 11.17 10.56 12.78
Net current operating earnings...................................................................................................................................................................... 27.47 27.53 29.44 24.14
Amounts per $100 of total assets14.46 5.08C u rre n t o p e ra tin g revenue— to ta l ..................................................................................................... 4.62 4.56
C u rre n t o p e ra tin g expenses— to ta l ........................................................................................................................................................................... 3.35 3.30 3.15 3.85N e t c u r re n t o p e ra tin g e a rn in g s ............................................................................................... 1.27 1.26 1.31 1.23Recoveries, tra n s fe rs fro m va lua tion reserves, and p ro fits — to ta l................................................................................................................... .10 .09 .11 .09Losses, ch a rg e -o ffs , and tra n s fe rs to v a lu a tio n reserves— to ta l....................................................................................................................... .32 .31 .30 .33N et incom e be fore re la ted ta x e s .................................................. ..................................................................................................... 1.05 1.04 1.12 .99N et incom e a fte r re la ted ta x e s ................................................................. ........................................................................................................... .70 .69 .74 .69
MemorandaRecoveries cre d ite d to va lua tion reserves (n o t inc lu ded in recoveries above):
On se curities .................................................................................................... ..................................................................................................... (2) (2) (2) (2)On lo a n s ................................................................................................................................................................................................................................. .05 .06 .04 .04
Losses charged to va lua tion reserves (n o t inc lu ded in losses above):.01 .02 .01 ( 2)On s e c u r it ie s ........................................................................................................................................................................................................................
On loans .................................................................................... ........................................................................................................... .12 .13 .10 .14
200 FEDERAL
DEPOSIT
INSU
RAN
CE
CO
RP
OR
ATIO
N
Digitized for FRASER http://fraser.stlouisfed.org/ Federal Reserve Bank of St. Louis
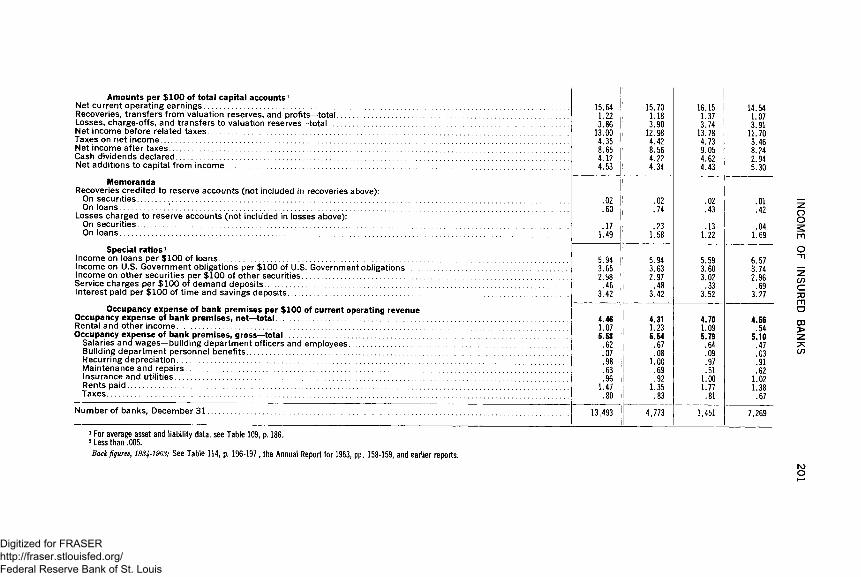
A m o u n ts p e r $ 1 0 0 o f to ta l c a p ita l a c c o u n ts 1N et c u r re n t o p e ra tin g e a rn in g s .............................................................................................................R ecoveries, t ra n s fe rs fro m v a lu a tio n reserves, and p ro fits— to ta l.........................................Losses, ch a rg e -o ffs , and tra n s fe rs to va lua tion reserves— to ta l.............................................N e t incom e be fo re re la ted ta x e s ..........................................................................................................Taxes on n e t in c o m e ..................................................................................................................................N e t incom e a fte r ta x e s ..............................................................................................................................Cash d iv id e n d s d e c la re d ..........................................................................................................................N e t a d d itio n s to ca p ita l fro m in c o m e .................................................................................................
M em o ran daRecoveries c re d ite d to reserve a cco u n ts (n o t inc luded in recoveries above):
On s e c u r it ie s .............................................................................................................................................On lo a n s ...................... ................................................................................................................................
Losses charged to reserve a cco u n ts (n o t inc luded in losses above):On s e c u r it ie s ..............................................................................................................................................On lo a n s .......................................................................................................................................................
S pecia l ra t io s 1In co m e on loans per $100 o f lo a n s ....................................................................................................In co m e on U.S. G o ve rn m e n t o b lig a tio n s per $100 of U.S. G overnm ent o b lig a tio n s ___Incom e on o th e r se cu ritie s pe r $100 o f o th e r se c u ritie s ...........................................................Service charges p e r $100 o f demand d e p o s its ..............................................................................In te re s t paid pe r $100 o f t im e and savings d e p o s its ..................................................................
O ccupancy expe nse o f b a n k p re m ise s per $ 1 0 0 o f c u rre n t o p e ra ting revenue O ccupancy expense o f b a n k p re m ise s , n e t— to ta l ........................................................................Renta l and o th e r in c o m e ..........................................................................................................................O ccupancy expe nse o f b a n k p re m ise s , gross— to ta l ...................................................................
Sa laries and wages— b u ild in g d e p a rtm e n t o ffice rs and em p lo ye e s...................................B u ild ing d e p a rtm e n t personne l b e n e fits ......................................................................................R e curring d e p re c ia tio n .........................................................................................................................M a in tenance and re p a irs .....................................................................................................................Insu rance and u t il it ie s ...................................................................................................................R ents p a id ...................................................................................................................................................T axe s .............................................................................................................................................................
N u m b e r o f banks, D ecem ber 31
1 For average asset and liability data, see Table 109, p. 186.2 Less than .005.
Back figures, 1934-1963: See Table 114, p. 196-197, the Annual Report for 1963, pp. 158-159, and earlier reports.
15.64 15.70 16.15 14.541.22 1.18 1.37 1.073.86 3.90 3.74 3.91
13.00 12.98 13.78 11.704.35 4.42 4.73 3.468.65 8.56 9.05 8.244.12 4.22 4.62 2.944.53 4.34 4.43 5.30
.02 .02 .02 .01
.60 .74 .43 .42
.17 .23 .13 .041.49 1.58 1.22 1.69
5.94 5.94 5.59 6.573.65 3.63 3.60 3.742.98 2.97 3.02 2.96
.46 .48 .33 .693.42 3.42 3.52 3.27
4.46 4.31 4.70 4.561.07 1.23 1.09 .545.53 5.54 5.79 5.10
.62 .67 .64 .47
.07 .08 .09 .03
.98 1.00 .97 .91
.63 .69 .51 .62
.96 .92 1.00 1.021.47 1.35 1.77 1.38.80 .83 .81 .67
13,493 4,773 1,451 7,269
INCOM
E OF
INSURED BANKS
201
Digitized for FRASER http://fraser.stlouisfed.org/ Federal Reserve Bank of St. Louis
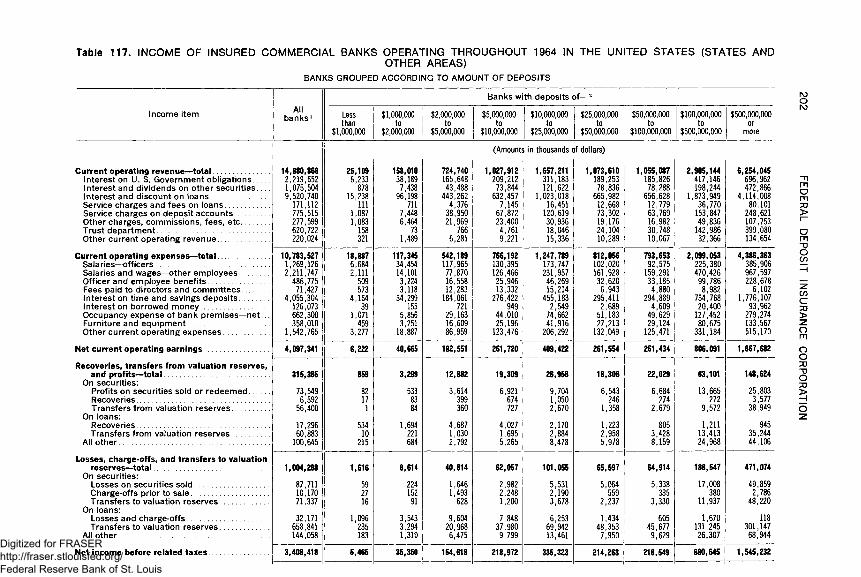
BANKS GROUPED ACCORDING TO AM O UNT OF DEPOSITS
Table 117. INCOME OF INSURED COMMERCIAL BANKS OPERATING THROUGHOUT 1964 IN THE UNITED STATES (STATES ANDOTHER AREAS)
Incom e itemAll
b a n k s 1
Banks w ith de p o s its o f— 2
Lessthan
$1,000,000
$1,000,000to
$2,000,000
$2,000,000to
$5,000,000
$5,000,000to
$10,000,000
$10,000,000to
$25,000,000
$25,000,000to
$50,000,000
$50,000,000to
$100,000,000
$100,000,000to
$500,000,000
$500,000,000or
more
(Amounts in thousands of dollars)
Current operating revenue—total.......................... 14,880,868 25,109 158,010 724,740 1,027,912 1,657,211 1,073,610 1,055,087 2,905,144 6,254,045In te re s t on U. S. G o ve rn m e n t o b lig a tio n s ........ 2,219,652 6,233 38,189 165,648 209,212 311,183 189,253 185,826 417,146 696,962In te re s t and d iv id e n d s on o th e r s e c u r it ie s ___ 1,075,504 878 7,438 43,488 73,844 121,622 78,836 78,288 198,244 472,866In te re s t and d is c o u n t on lo a n s ............................. 9,520,740 15,238 96,198 443,262 632,457 1,023,018 665,982 656,628 1,873,949 4,114,008Service charges and fe e s on lo a n s ...................... 171,112 111 711 4,376 7,145 16,451 12,668 12,779 36,770 80,101Service charges on d e p o s it a c c o u n ts ................. 775,515 1,087 7,448 38,950 67,872 120,619 73,302 63,769 153,847 248,621O ther charges, co m m iss io n s , fees, e tc .............. 277,599 1,083 6,464 21,969 23,400 30,936 19,176 16,982 49,836 107,753T ru s t d e p a rtm e n t........................................................ 620,722 158 73 766 4,761 18,046 24,104 30,748 142,986 399,080O ther c u rre n t o p e ra tin g re v e n u e .......................... 220,024 321 1,489 6,281 9,221 15,336 10,289 10,067 32,366 134,654
Current operating expenses—total....................... 10,783,527 18,887 117,345 542,189 766,192 1,247,789 812,056 793,653 2,099,053 4,386,363S a laries— o f f ic e rs ......................................................... 1,269,126 6,684 34,454 117,965 130,395 173,747 102,020 92,575 225,380 385,906Salaries and wages— o th e r e m p lo y e e s .............. 2,211,747 2,111 14,101 77,870 126,466 231,957 161,928 159,291 470,426 967,597O ffice r and em p loyee b e n e fits .............................. 486,775 509 3,224 16,558 25,946 46,269 32,620 33,185 99,786 228,678Fees paid to d ire c to rs and c o m m itte e s ............. 71,427 573 3,118 12,283 13,332 15,214 6,943 4,880 8,982 6,102In te re s t on t im e and savings d e p o s its ............... 4,055,304 4,164 34,299 184,061 276,422 455,183 295,411 294,889 734,768 1,776,107In te re s t on borrow ed m o n e y .................................. 126,073 39 155 721 949 2,549 2,689 4,609 20,400 93,962O ccupancy expense o f ban k p re m ise s— n e t . .. 662,300 1,071 5,856 29,163 44,010 74,662 51,183 49,629 127,452 279,274F u rn itu re and e q u ip m e n t......................................... 358,010 459 3,251 16,609 25,196 41,916 27,213 29,124 80,675 133,567O ther c u rre n t o p e ra tin g e x p e n s e s ....................... 1,542,765 3,277 18,887 86,959 123,476 206,292 132,049 125,471 331,184 515,170
Net current operating earnings............................. 4,097,341 6,222 40,665 182,551 261,720 409,422 261,554 261,434 806,091 1,867,682
Recoveries, transfers from valuation reserves,and profits—tota l................................................ 315,365 859 3,299 12,882 19,309 26,956 18,306 22,029 63,101 148,624
On se cu ritie s :P ro fits on se cu ritie s sold o r re d e e m e d .......... 73,549 82 533 3,614 6,921 9,704 6,543 6,684 13,665 25,803R e co ve rie s.................................................................. 6,592 17 83 399 674 1,050 246 274 272 3,577T ra n s fe rs fro m va lua tion re s e rv e s .................. 56,400 1 84 360 727 2,670 1,358 2,679 9,572 38,949
On loans:R e co ve rie s.................................................................. 17,296 534 1,694 4,687 4,027 2,170 1,223 805 1,211 945T ra n s fe rs fro m va lua tion re s e rv e s ................... 60,883 10 221 1,030 1,695 2,884 2,958 3,428 13,413 35,244
All o th e r ........................................................................... 100,645 215 684 2,792 5,265 8,478 5,978 8,159 24,968 44,106
Losses, charge-offs, and transfers to valuation reserves—total....................................................
On securities :Losses on se cu ritie s s o ld .....................................C harge-o ffs p rio r to s a le .......................................T ra n s fe rs to va lua tion re s e rv e s ........................
On loans:Losses and c h a rg e -o ffs .........................................T ra n s fe rs to va lua tion re s e rv e s ........................
A ll o th e r ...........................................................................
Net income before related taxes...........................
1,004,288
87,71110.170 71,337
32.171 658,841 144,058
1,616
592716
1,096235183
8,614
22415291
3,5433,2941,310
40,814
1,6461,493
628
9,60420,9686,475
62,057
2,9822,2481,200
7,84837,9809,799
101,055
5,5312,1903,678
6,25369,94213,461
65,597
5,064559
2,237
1,43448,353
7,950
64,914
5,338335
3,330
60545,6779,629
188,547
17,008380
11,937
1,670131,24526,307
471,074
49,8592,786
48,220
118301,14768,944
3,408,418 5,465 35,350 154,619 218,972 335,323 214,263 218,549 680,645 1,545,232
202 FEDERAL
DEPOSIT
INSU
RAN
CE
CO
RP
OR
ATIO
N
Digitized for FRASER http://fraser.stlouisfed.org/ Federal Reserve Bank of St. Louis
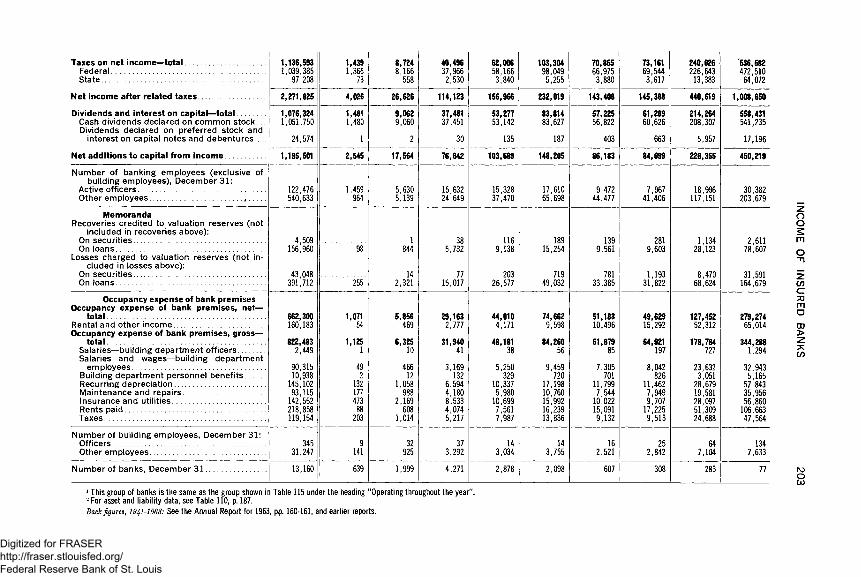
Taxes on net income—total.....................................F e d e ra l.............................................................................S ta te ..................................................................................
1,136,5931,039,385
97,208
1,4391,366
73
8,7248,166
558
40,49637,966
2,530
62,00658,1663,840
103,30498,049
5,255
70,85566,9753,880
73,16169,5443,617
240,026226,643
13,383
536,582472,51064,072
Net income after related taxes.............................. 2,271,825 4,026 26,626 114,123 156,966 232,019 143,408 145,388 440,619 1,008,650
Dividends and interest on capital—tota l............. 1,076,324 1,481 9,062 37,481 53,277 83,814 57,225 61,289 214,264 558,431Cash d iv id e n d s dec la re d on co m m o n s to c k . .. 1,051,750 1,480
1
9,060 37,451 53,142 83,627 56,822 60,626 208,307 541,235D iv idends d ec la red on p re fe rre d s to ck and
in te re s t on ca p ita l no tes and d e b e n tu re s .. .. 24,574 2 30 135 187 403 663 5,957 17,196
Net additions to capital from income.................. 1,195,501 2,545 17,564 76,642 103,689 148,205 86,183 84,099 226,355 450,219
N u m b e r o f b a n k in g em p loyee s (exc lus ive o f b u ild in g em p loyee s), D e cem b er 3 1 :
A ctive o f f ic e rs ................................................................ 122,476 1,459 5,630 15,632 15,328 17,610 9,472 7,967 18,996 30,382O th e r e m p lo y e e s .............................................., ......... 540,633 964 5,139 24,649 37,470 65,698 44,477 41,406 117,151 203,679
MemorandaRecoveries c re d ite d to v a lu a tio n reserves (n o t
inc lu d e d in recoveries above):On s e c u r it ie s .................................................................. 4,509
156,9601 38 116 189 139 281 1,134
28,1232,611
78,607On lo a n s .......................................................................... 98 844 5,732 9,138 15,254 9,561 9,603Losses charged to va lua tion reserves (n o t in
c luded in losses above):On s e c u r it ie s .................................................................. 43,048
391,71214 77 203 719 781 1,193
31,8228,470
68,62431,591
164,679On lo a n s .......................................................................... 255 2,321 15,017 26,577 49,032 33,385
Occupancy expense of bank premises Occupancy expense of bank premises, n e t -
total ........................................................................ 662,300 1,071 5,856 29,163 44,010 74,662 51,183 49,629 127,452 279,274Renta l and o th e r in c o m e ............................................. 160,183 54 469 2,777 4,171 9,598 10,496 15,292 52,312 65,014Occupancy expense of bank premises, g ross-
total ........................................................................ 822,483 1,125 6,325 31,940 48,181 84,260 61,679 64,921 179,764 344,288Salaries— b u ild in g d e p a rtm e n t o f f ic e rs ............. 2,449 1 10 41 38 56 85 197 727 1,294Salaries and wages— b u ild in g d e p a rtm e n t
e m p lo y e e s .................................................................. 90,315 49 466 3,169 5,250 9,459 7,305 8,042 23,632 32,943B u ild ing d e p a rtm e n t personne l b e n e fits .......... 10,938 2 12 132 329 720 701 826 3,051 5,165R e curring d e p re c ia tio n ............................................. 145,102 132 1,058 6,594 10,337 17,198 11,799 11,462 28,679 57,843M ain tenance and re p a irs ......................................... 93,115 177 988 4,180 5,980 10,760 7,544 7,949 19,581 35,956Insurance and u t il it ie s .............................................. 142,552 473 2,169 8,533 10,699 15,992 10,022 9,707 28,097 56,860R ents p a id ...................................................................... 218,858 88 608 4,074 7,561 16,239 15,091 17,225 51,309 106,663T a xe s ................................................................................ 119,154 203 1,014 5,217 7,987 13,836 9,132 9,513 24,688 47,564
N u m b e r o f b u ild in g em ployees, D ecem ber 31: O ff ic e rs ............................................................................. 345 9 32 37 14 14 16 25 64 134O ther e m p lo ye e s .......................................................... 31,247 141 925 3,292 3,034 3,755 2,521 2,842 7,104 7,633
N u m b e r o f banks, D ecem ber 3 1 .............................. 13,160 639 1,999 4,271 2,878 2,098 607 308 283 77
1 This group of banks is the same as the group shown in Table 115 under the heading "Operating throughout the year” .2 For asset and liability data, see Table 110, p. 187.Back figures, 1941-1963: See the Annual Report for 1963, pp. 160-161, and earlier reports.
INCOM
E OF
INSURED BANKS
203
Digitized for FRASER http://fraser.stlouisfed.org/ Federal Reserve Bank of St. Louis

BANKS GROUPED ACCORDING TO AM O UNT OF DEPOSITS
Table 118. RATIOS OF INCOME OF INSURED COMMERCIAL BANKS OPERATING THROUGHOUT 1964 IN THE UNITED STATES (STATESAND OTHER AREAS)
Ailb a n k s 1
Banks w ith d ep os its o f— 2
Incom e item Lessthan
$1,000,000
$1,000,000to
$2,000,000
$2,000,000to
$5,000,000
$5,000,000to
$10,000,000
$10,000,000to
$25,000,000
$25,000,000to
$50,000,000
$50,000,000to
$100,000,000
$100,000,000to
$500,000,000
$500,000,000or
more
Amounts per $100 of current operating revenue
Current operating revenue—total.......................... $100.00 $100.00 $100.00 $100.00 $100.00 $100.00 $100.00 $100.00 $100.00 $100.00In te re s t on U. S. G o ve rn m e n t o b lig a tio n s ........ 14.92 24.82 24.17 22.86 20.35 18.78 17.63 17.61 14.36 11.14In te re s t and d iv id e n d s on o th e r s e c u r it ie s ___ 7.23 3.50 4.71 6.00 7.19 7.34 7.34 7.42 6.82 7.56Incom e on lo a n s ........................................................... 65.13 61.13 61.33 61.77 62.22 62.72 63.21 63.45 65.77 67.06Service charges on d e p o s it a c c o u n ts ................. 5.21 4.33 4.71 5.37 6.60 7.28 6.83 6.04 5.30 3.98O th e r serv ice charges, co m m iss io n s , fees, e tc. 1.86 4.31 4.09 3.03 2.28 1.87 1.79 1.61 1.71 1.72O th e r c u r re n t o p e ra tin g re v e n u e ......................... 5.65 1.91 .99 .97 1.36 2.01 3.20 3.87 6.04 8.54
Current operating expenses—tota l....................... 72.47 75.22 74.26 74.81 74.54 75.29 75.64 75.22 72.25 70.14Salaries, wages, and fe e s ......................................... 23.87 37.31 32.70 28.72 26.29 25.40 25.23 24.33 24.26 21.74O ffice r a nd em p loyee b e n e fits .............................. 3.27 2.03 2.04 2.28 2.52 2.79 3.04 3.15 3.43 3.66In te re s t on t im e and saving s d e p o s its ............... 27.25 16.58 21.71 25.40 26.89 27.47 27.52 27.95 25.29 28.40O ccupancy expense o f ban k p re m ise s— n e t . .. 4.45 4.26 3.70 4.02 4.28 4.50 4.77 4.70 4.39 4.47F u rn itu re and e q u ip m e n t......................................... 2.41 1.83 2.06 2.29 2.45 2.53 2.53 2.76 2.78 2.13O th e r c u r re n t o p e ra tin g e x p e n s e s ....................... 11.22 13.21 12.05 12.10 12.11 12.60 12.55 12.33 12.10 9.74
Net current operating earnings............................. 27.53 24.78 25.74 25.19 25.46 24.71 24.36 24.78 27.75 29.86
Amounts per $100 of total assets24.15C u rre n t o p e ra tin g revenue— to ta l ............................. 4.36 4.59 4.66 4.56 4.61 4.66 4.62 4.49 4.39
C u rre n t o p e ra tin g expenses— to ta l.......................... 3.16 3.45 3.46 3.41 3.44 3.51 3.49 3.38 3.17 2.91N et c u r re n t o p e ra tin g e a rn in g s ................................. 1.20 1.14 1.20 1.15 1.17 1.15 1.13 1.11 1.22 1.24Recoveries, t ra n s fe rs fro m v a lu a tio n reserves ,
.10and p ro fits — to ta l ..................................................... .09 .16 .09 .08 .09 .07 .07 .09 .10Losses, ch a rg e -o ffs , and t ra n s fe rs to v a lu a tio n
.31reserves— to ta l.......................................................... .29 .30 .25 .26 .28 .28 .28 .27 .29N et incom e b e fo re re la ted ta x e s .............................. 1.00 1.00 1.04 .97 .98 .94 .92 .93 1.03 1.03N e t incom e a fte r re la ted ta x e s .................................. .67 .74 .78 .72 .70 .65 .62 .62 .67 .67
MemorandaRecoveries c re d ite d to va lu a tio n reserves (n o t
in c lu d e d in recoveries above):On s e c u r it ie s .................................................................. (3)
.05( 3).02
( 3).04
( 3).04
( 3) ( 3) ( 3) ( 3) ( 3)On lo a n s ........................................................................... .02 .04 .04 .04 .04 .05
Losses charged to v a lu a tio n reserves (n o t in c lu d e d in losses above):
.01 .01 .02On s e c u r it ie s .................................................................. .01 ( 3).07
( 3).09
( 3) ( 3) ( 3).14On lo a n s ........................................................................... .11 .05 .12 .14 .14 .10 .11
204 FEDERAL
DEPOSIT
INSU
RAN
CE
CO
RP
OR
ATIO
N
Digitized for FRASER http://fraser.stlouisfed.org/ Federal Reserve Bank of St. Louis
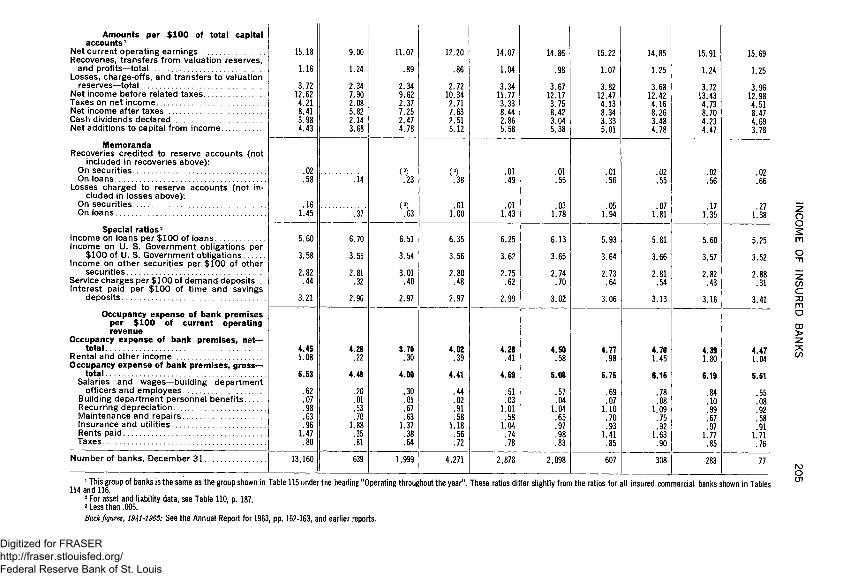
Amounts per $100 of total capitalaccounts2
N e t c u r re n t o p e ra tin g e a rn in g s ................................ 15.18 9.00 11.07 12.20 14.07 14.86 15.22 14.85 15.91 15.69Recoveries, t ra n s fe rs fro m v a lu a tio n reserves,
an d p ro fits — to ta l ......................................................... 1.16 1.24 .89 .86 1.04 .98 1.07 1.25 1.24 1.25Losses, ch a rg e -o ffs , and tra n s fe rs to v a lu a tio n
reserves— to ta l .............................................................. 3.72 2.34 2.34 2.72 3.34 3.67 3.82 3.68 3.72 3.96N e t incom e b e fo re re la te d ta x e s .............................. 12.62 7.90 9.62 10.34 11.77 12.17 12.47 12.42 13.43 12.98Taxes on n e t in c o m e ...................................................... 4.21 2.08 2.37 2.71 3.33 3.75 4.13 4.16 4.73 4.51N e t incom e a fte r ta x e s .................................................. 8.41 5.82 7.25 7.63 8.44 8.42 8.34 8.26 8.70 8.47Cash d iv id e n d s d e c la re d .............................................. 3.98 2.14 2.47 2.51 2.86 3.04 3.33 3.48 4.23 4.69N e t a d d itio n s to ca p ita l fro m in c o m e ..................... 4.43 3.68 4.78 5.12 5.58 5.38 5.01 4.78 4.47 3.78
MemorandaRecoveries c re d ite d to reserve a c c o u n ts (n o t
in c lu d e d in re co ve rie s above):On s e c u r it ie s .................................................................. .02 ( 3)
.23( 3)
.38.01.49
.01
.55.01.56
.02
.55.02.56
.02
.66On lo a n s ........................................................................... .58 .14Losses ch a rg e d to reserve a cco u n ts (n o t in
c lu d e d in losses above):On s e c u r it ie s .................................................................. .16 ( 3)
.63.01
1.00.01
1.43.03
1.78.05
1.94.07
1.81.17
1.35.27
1.38On lo a n s ........................................................................... 1.45 .37
Special ratios2Incom e on loan s per $ 1 0 0 o f lo a n s ........................ 5.60 6.70 6.51 6.35 6.25 6.13 5.93 5.81 5.60 5.25Incom e on U. S. G o ve rn m e n t o b lig a tio n s per
$ 1 0 0 o f U. S. G o ve rn m e n t o b lig a tio n s .......... 3.58 3.55 3.54 3.56 3.62 3.65 3.64 3.66 3.57 3.52Incom e on o th e r se cu ritie s per $ 1 0 0 o f o th e r
s e c u r it ie s ..................................................................... 2.82 2.81 3.01 2.80 2.75 2.74 2.73 2.81 2.82 2.88Service ch a rg e s p e r $ 1 0 0 o f d e m a n d d e p o s its . .. .44 .32 .40 .48 .62 .70 .64 .54 .43 .31In te re s t paid per $ 1 0 0 o f t im e and savings
d e p o s its ....................................................................... 3.21 2.96 2.97 2.97 2.99 3.02 3.06 3.13 3.16 3.41
Occupancy expense of bank premisesper $100 of current operatingrevenue
Occupancy expense of bank premises, n e t -total ........................................................................ 4.45 4.26 3.70 4.02 4.28 4.50 4.77 4.70 4.39 4.47
R enta l and o th e r in c o m e .............................................. 1.08 .22 .30 .39 .41 .58 .98 1.45 1.80 1.04Occupancy expense of bank premises, gross-
total........................................................................ 5.53 4.48 4.00 4.41 4.69 5.08 5.75 6.15 6.19 5.51Salaries and w ages— b u ild in g d e p a rtm e n t
o ffice rs and e m p lo y e e s ......................................... .62 .20 .30 .44 .51 .57 .69 .78 .84 .55B u ild in g d e p a rtm e n t pe rsonn e l b e n e fits .......... .07 .01 .01 .02 .03 .04 .07 .08 .10 .08R e cu rrin g d e p re c ia tio n ............................................. .98 .53 .67 .91 1.01 1.04 1.10 1.09 .99 .92M a in te n a n ce and re p a irs ......................................... .63 .70 .63 .58 .58 .65 .70 .75 .67 .58Insurance and u t i l i t ie s .............................................. .96 1.88 1.37 1.18 1.04 .97 .93 .92 .97 .91Rents p a id ....................................................................... 1.47 .35 .38 .56 .74 .98 1.41 1.63 1.77 1.71T a xe s ................................................................................. .80 .81 .64 .72 .78 .83 .85 .90 .85 .76
N u m b e r o f banks, D e cem b er 3 1 .............................. 13,160 639 1,999 4,271 2,878 2,098 607 308 283 77
1 This group of banks is the same as the group shown in Table 115 under the heading "Operating throughout the year” . These ratios differ slightly from the ratios for all insured commercial banks shown in Tables 114 and 116.
2 For asset and liability data, see Table 110, p. 187.3 Less than .005.
Back figures, 1941-1963: See the Annual Report for 1963, pp. 162-163, and earlier reports.
INCOM
E OF
INSURED BANKS
205
Digitized for FRASER http://fraser.stlouisfed.org/ Federal Reserve Bank of St. Louis
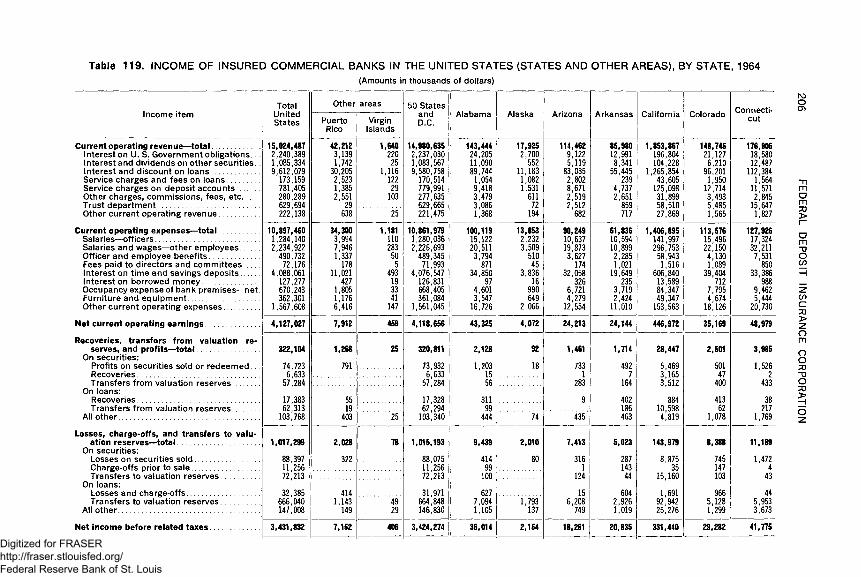
Table 119. INCOME OF INSURED COMMERCIAL BANKS IN THE UNITED STATES (STATES AND OTHER AREAS), BY STATE, 1964(Am ounts in thousands o f do lla rs)
Incom e ite mTota l
U n ite dS ta tes
O ther areas 50 S ta tes and D.C.
A labam a Alaska A rizona A rkansa s C a lifo rn ia Colorado C o nnectic u tPuerto
RicoVirgin
Is lands
Current operating revenue—tota l...................... 15,024,487 42,212 1,640 14,980,635 143,444 17,925 114,462 85,980 1,853,867 148,745 176,905In te re s t on U. S. G o ve rn m e n t o b l ig a t io n s . .. 2,240,389 3,139 220 2,237,030 24,205 2,700 9,122 12,991 196,804 21,127 18,580In te re s t and d iv id e n d s on o th e r s e c u r it ie s . . 1,085,334 1,742 25 1,083,567 11,090 552 5,119 8,341 104,228 6,210 12,487In te re s t and d is c o u n t on lo a n s ........................ 9,612,079 30,205 1,116 9,580,758 89,744 11,183 83,035 55,445 1,265,854 96,201 112,384S ervice charges and fe e s on lo a n s ................ 173,159 2,523 122 170,514 1,054 1,082 2,802 239 43,605 1,950 1,564S ervice charges on d e p o s it a c c o u n ts ........... 781,405 1,385 29 779,991 9,418 1,531 8,671 4,737 125,098 12,714 11,571O th e r charges, co m m iss io n s , fees, e tc ........ 280,289 2,551 103 277,635 3,479 611 2,519 2,651 31,899 3,493 2,845T ru s t d e p a r tm e n t................................................... 629,694 29 629,665 3,086 72 2,512 859 58,510 5,485 15,647O th e r c u r re n t o p e ra tin g re v e n u e .................... 222,138 638 25 221,475 1,368 194 682 717 27,869 1,565 1,827
Current operating expenses—tota l.................. 10,897,460 34,300 1,181 10,861,979 100,119 13,853 90,249 61,836 1,406,895 113,576 127,926S a laries— o f f ic e rs .................................................... 1,284,140 3,994 110 1,280,036 15,122 2,232 10,637 10,594 141,997 15,496 17,324Salaries and wages— o th e r e m p lo y e e s ......... 2,234,922 7,946 283 2,226,693 20,511 3,509 19,873 10,899 296,753 22,150 32,211O ffice r a n d e m p loyee b e n e fits ......................... 490,732 1,337 50 489,345 3,794 510 3,627 2,285 58,943 4,130 7,531Fees paid to d ire c to rs and c o m m itte e s 72,176 178 5 71,993 871 45 174 1,021 1,516 1,089 850In te re s t on t im e and sav ing s d e p o s its ......... 4,088,061 11,021 493 4,076,547 34,850 3,836 32,058 19,649 606,840 39,404 33,386In te re s t on borro w e d m o n e y ............................. 127,277 427 19 126,831 97 16 326 235 13,589 712 988O ccupancy expe nse o f ban k p re m is e s — n e t. 670,243 1,805 33 668,405 4,601 990 6,721 3,719 84,347 7,795 9,462F u rn itu re and e q u ip m e n t.................................... 362,301 1,176 41 361,084 3,547 649 4,279 2,424 49,347 4,674 5,444O th e r c u r re n t o p e ra tin g e x p e n s e s .................. 1,567,608 6,416 147 1,561,045 16,726 2,066 12,554 11,010 153,563 18,126 20,730
Net current operating earnings........................ 4,127,027 7,912 459 4,118,656 43,325 4,072 24,213 24,144 446,972 35,169 48,979
Recoveries, transfers from valuation reserves, and profits—to ta l............................ 322,104 1,268 25 320,811 2,128 92 1,461 1,714 28,447 2,501 3,985
On s e cu ritie s :P ro fits on se cu ritie s sold o r re d e e m e d . . . 74,723 791 73,932 1,203 18 733 492 5,469 501 1,526R e co ve rie s ............................................................. 6,633 6,633 15 1 7 3,165 47 2T ra n s fe rs fro m va lu a tio n reserves 57,284 57,284 56 283 164 3,512 400 433
On loans:R e co ve rie s ....................... . . . 17,383 55 17,328 311 9 402 884 413 38T ra n s fe rs fro m va lu a tio n reserves ......... 62,313 19 62,294 99 186 10,598 62 217
All o th e r ...................................................................... 103,768 403 25 103,340 444 74 435 463 4,819 1,078 1,769
Losses, charge-offs, and transfers to valuation reserves—total..................................... 1,017,299 2,028 78 1,015,193 9,439 2,010 7,413 5,023 143,979 8,388 11,189
On securities :Losses on se cu ritie s s o ld ................................ 88,397 322 88,075 414 80 316 287 8,875 745 1,472C h arge-o ffs p rio r to s a le .................................. 11,256 11,256 99 1 143 35 147 4T ra n s fe rs to va lua tion re s e rv e s ................... 72,213 72,213 100 124 44 15,160 103 43
On loans:Losses and c h a rg e -o ffs .................................... 32,385 414 31,971 627 15 604 1,691 966 44T ra n s fe rs to va lua tion re s e rv e s ................... 666,040 1,143 49 664,848 7,094 1,793 6,208 2,926 92,942 5,128 5,953
All o th e r ...................................................................... 147,008 149 29 146,830 1,105 137 749 1,019 25,276 1,299 3,673
Net income before related taxes...................... 3,431,832 7,152 406 3,424,274 36,014 2,154 18,261 20,835 331,440 29,282 41,775
206 FEDERAL
DEPOSIT
INSU
RAN
CE
CO
RP
OR
ATIO
N
Digitized for FRASER http://fraser.stlouisfed.org/ Federal Reserve Bank of St. Louis
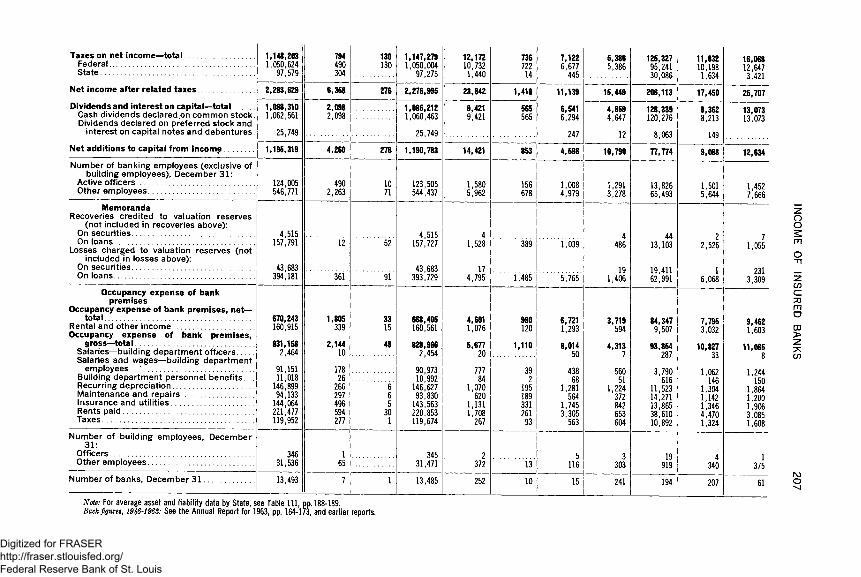
Taxes on net income—tota l................................F e d e ra l........................................................................S ta te .............................................................................
1,148,2031,050,624
97,579
794490304
130130
1,147,2791,050,004
97,275
12,17210,7321,440
73672214
7,1226,677
445
5.3865.386
125,32795,24130,086
11,83210,1981,634
16,06812,6473,421
Net income after related taxes.........................
Dividends and interest on capital—to ta l.........Cash d iv id e n d s d ec la red .on co m m o n s to ck . D iv idends dec la re d on p re fe rre d s to c k and
in te re s t on ca p ita l no tes and d e b e n tu re s .
Net additions to capital from income.............
2,283,629 6,358 276 2,276,995 23,842 1,418 11,139 15,449 206,113 17,450 25,7071,088,3101,062,561
25,749
2.0982.098
1,086,2121,060,463
25,749
9.4219.421
565565
6,5416,294
247
4,6594,647
12
128,339120,276
8,063
8,3628,213
149
13.07313.073
1,195,319 4,260 276 1,190,783 14,421 853 4,598 10,790 77,774 9,088 12,634N u m b e r o f b a n k in g em p lo ye e s (e xc lu s ive o f
b u ild in g e m p loyee s), D e cem b er 3 1 :A ctive o f f ic e rs ...........................................................O th e r e m p lo y e e s .....................................................
124,005546,771
4902,263
1071
123,505544,437
1,5805,962
156678
1,0084,979
1,2913,278
13,82665,493
1,5015,644
1,4527,666
MemorandaRecoveries c re d ite d to va lu a tio n reserves
(n o t in c lu d e d in recoveries above):On s e c u r it ie s ............................................................. 4,515
157,791
43,683394,181
4,515157,727
43,683393,729
41,528
174,795
4486
191,406
4413,103
19,41162,991
22,526
16,068
71,055
2313,309
On lo a n s ......................................................................Losses ch a rg e d to va lu a tio n reserves (n o t
in c lu d e d in losses above):On s e c u r it ie s .............................................................
12 52 389 1,039
On lo a n s ...................................................................... 361 91 1,485 5,765
Occupancy expense of bank premises
Occupancy expense of bank premises, n e t - total ....................................................................
R enta l and o th e r in c o m e ........................................Occupancy expense of bank premises,
gross—tota l......................................................S a laries— b u ild in g d e p a rtm e n t o ffic e rs Sa laries and w ages— b u ild in g d e p a rtm e n t
e m p lo y e e s .. .......................................................B u ild in g d e p a rtm e n t p e rso n n e l b e n e f i t s . ..R e cu rrin g d e p re c ia tio n ........................................M a in te n a n ce a nd re p a irs ....................................In su rance and u t i l i t ie s .........................................R ents p a id .................................................................T a x e s ..........................................................................
670,243160,915
831,1582,464
91,15111,018
146,89994,133
144,064221,477119,952
1,805339
2,14410
17826
266297496594277
3315
48
665
301
668,405160,561
828,9662,454
90,97310,992
146,62793,830
143,563220,853119,674
4,6011,076
5,67720
77784
1,070620
1,1311,708
267
990120
1,110
392
19518933126193
6,7211,293
8,01450
43868
1,281564
1,7453,305
563
3,719594
4,3137
56051
1,224372842653604
84,3479,507
93,854287
3,790616
11,52314,27113,86538,61010,892
7,7953,032
10,82733
1,062146
1,3041,1421,3464,4701,324
9,4621,603
11,0658
1,244150
1,8641,2001,9063,0851,608
N u m b e r o f b u ild in g em ployees, D e cem b er 31 :
O ff ic e rs ........................................................................O th e r e m p lo ye e s .....................................................
34631,536
165
34531,471
2372 13
5116
3303
19919
4340
1375
N u m b e r o f banks, D e cem b er 3 1 ......................... 13,493 7 1 13,485 252 10 15 241 194 207 61
Note: For average asset and liability data by State, see Table 111, pp. 188-189.Back figures, 1946-1963: See the Annual Report for 1963, pp. 164-173, and earlier reports.
INCOM
E OF
INSURED BANKS
207
Digitized for FRASER http://fraser.stlouisfed.org/ Federal Reserve Bank of St. Louis
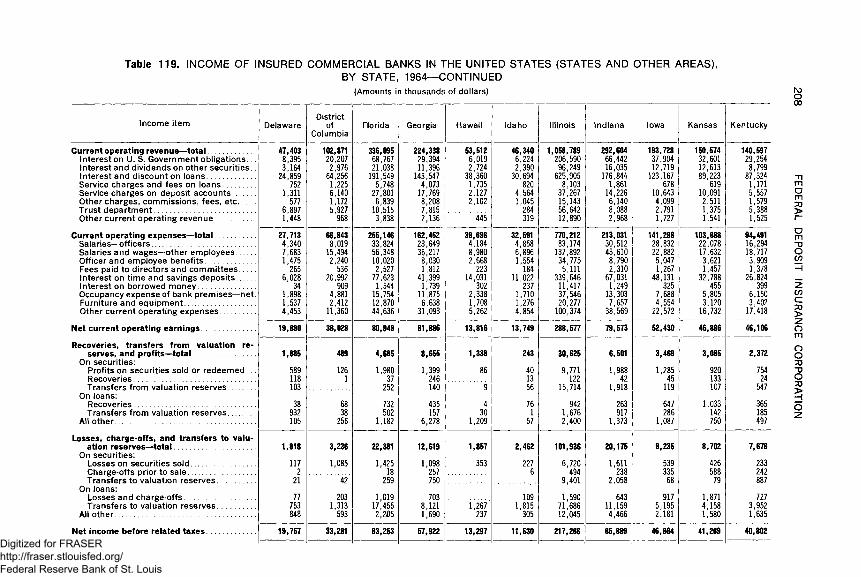
Table 119. INCOME OF INSURED COMMERCIAL BANKS IN THE UNITED STATES (STATES AND OTHER AREAS),BY STATE, 1964— CONTINUED
(Amounts in thousands of dollars)
Incom e item DelawareD is tric t
ofColum bia
Florida Georgia Hawaii Idaho Illino is Ind iana Iowa Kansas K e ntucky
Current operating revenue—to ta l..................... 47,403 102,871 336,095 224,338 53,512 46,340 1,058,789 292,604 193,728 150,574 140,597In te re s t on U. S. G o ve rn m e n t o b lig a t io n s . .. 8,395 20,207 68,767 29,394 6,019 6,224 206,590 66,442 37,904 32,601 29,254In te re s t and d iv id e n d s on o th e r s e c u r it ie s .. 3,164 2,976 21,038 11,396 2,724 2,390 96,249 16,035 12,719 12,613 8,799In te re s t a nd d is c o u n t on lo a n s ........................ 24,859 64,256 191,549 143,547 38,360 30,694 625,905 176,844 123,167 89,223 87,324Service charges and fees on lo a n s ................ 752 1,225 5,748 4,073 1,735 820 8,103 1,861 678 619 1,171Service ch a rg e s on d e p o s it a c c o u n ts ........... 1,311 6,140 27,801 17,769 2,127 4,564 37,267 14,226 10,643 10,091 5,557O th e r ch a rg e s, co m m iss io n s , fees , e tc ........ 577 1,172 6,839 8,208 2,102 1,045 15,143 6,140 4,099 2,511 1,579T ru s t d e p a r tm e n t................................................... 6,897 5,927 10,515 7,815 284 56,642 8,088 2,791 1,375 5,388O th e r c u r re n t o p e ra tin g re v e n u e .................... 1,448 968 3,838 2,136 445 319 12,890 2,968 1,727 1,541 1,525
Current operating expenses—total.................. 27,713 66,843 255,146 162,452 39,696 32,591 770,212 213,031 141,298 103,688 94,491S a laries— o f f ic e rs .................................................... 4,340 8,019 33,824 23,649 4,184 4,858 83,174 30,512 28,832 22,078 16,294Salaries a nd wages— o th e r e m p lo y e e s ......... 7,683 15,494 56,348 36,217 8,980 6,896 137,892 43,610 22,882 17,632 18,717O ffice r and e m ployee b e n e fits ......................... 1,475 2,240 10,020 8,030 2,668 1,554 34,775 8,790 5,047 3,621 3,909Fees paid to d ire c to rs and c o m m itte e s 265 536 2,527 1,812 223 184 5,111 2,310 1,267 1,457 1,378In te re s t on t im e and savings d e p o s its ......... 6,028 20,992 77,623 41,399 14,031 11,022 339,646 67,031 48,131 32,788 26,824In te re s t on borrow ed m o n e y ............................. 34 909 1,544 1,739 302 237 11,417 1,249 325 455 399O ccupancy expe nse o f ba n k p re m ise s— n e t. 1,898 4,881 15,754 11,875 2,338 1,710 37,546 13,303 7,688 5,805 6,150F u rn itu re and e q u ip m e n t................................... 1,537 2,412 12,870 6,638 1,708 1,276 20,277 7,657 4,554 3,120 3,402O ther c u r re n t o p e ra tin g e x p e n s e s .................. 4,453 11,360 44,636 31,093 5,262 4,854 100,374 38,569 22,572 16,732 17,418
Net current operating earnings........................ 19,690 36,028 80,949 61,886 13,816 13,749 288,577 79,573 52,430 46,886 46,106
Recoveries, transfers from valuation reserves, and profits—tota l............................ 1,885 489 4,685 8,655 1,338 243 30,625 6,501 3,469 3,085 2,372
On se cu ritie s :P ro fits on se cu ritie s sold o r re d e e m e d . . . 589 126 1,980 1,399 86 40 9,771 1,988 1,285 920 754R e co ve rie s ............................................................. 118 1 37 246 13 122 42 45 133 24T ra n s fe rs fro m v a lu a tio n re s e rv e s ............. 103 252 140 9 56 15,714 1,918 119 107 547
On loans:R e co ve rie s ............................................................. 38 68 732 435 4 76 942 263 647 1,033 365T ra n s fe rs fro m va lu a tio n re s e rv e s ............. 932 38 502 157 30 1 1,676 917 286 142 185
All o th e r ...................................................................... 105 256 1,182 6,278 1,209 57 2,400 1,373 1,087 750 497
Losses, charge-offs, and transfers to valuation reserves—tota l..................................... 1,818 3,236 22,381 12,619 1,857 2,462 101,936 20,175 9,235 8,702 7,676
On se cu ritie s :Losses on se cu ritie s s o ld ................................ 117 1,085 1,425 1,098 353 227 6,720 1,611 539 426 233C harge-o ffs p rio r to s a le .................................. 2 18 257 6 494 238 335 588 242T ra n s fe rs to va lua tion re s e rv e s ................... 21 42 259 750 9,401 2,058 68 79 887
On loans:Losses a n d c h a rg e -o ffs ................................... 77 203 1,019 703 109 1,590 643 917 1,871 727T ra n s fe rs to va lu a tio n re s e rv e s ................... 753 1,313 17,455 8,121 1,267 1,815 71,686 11,159 5,195 4,158 3,952
All o th e r ...................................................................... 848 593 2,205 1,690 237 305 12,045 4,466 2,181 1,580 1,635
Net income before related taxes...................... 19,757 33,281 63,253 57,922 13,297 11,530 217,266 65,899 46,664 41,269 40,802
208 FEDERAL
DEPOSIT
INSU
RAN
CE
CO
RPO
RA
TION
Digitized for FRASER http://fraser.stlouisfed.org/ Federal Reserve Bank of St. Louis
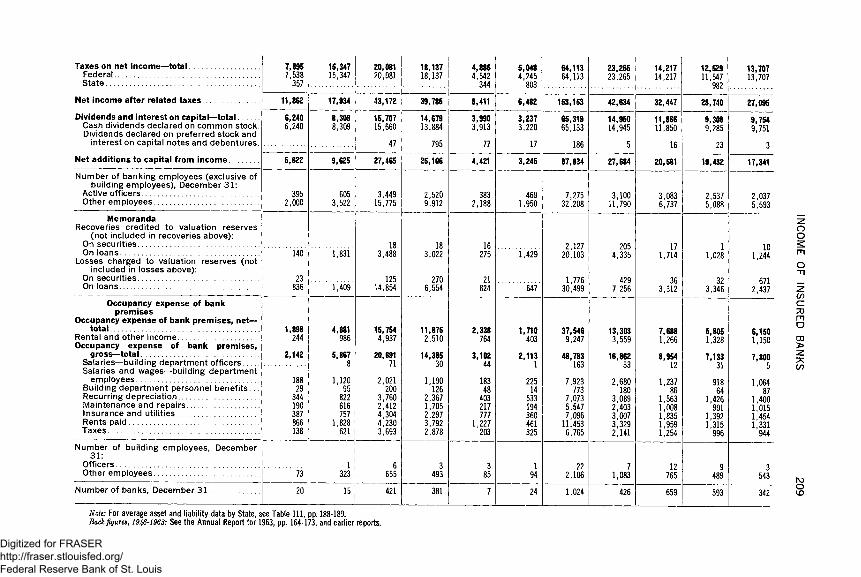
Taxes on net income—tota l................................F e d e ra l........................................................................S ta te .............................................................................
7,8957,538
357
15.34715.347
20,08120,081
18.13718.137
4,8864,542
344
5,0484,245
803
64.11364.113
23.26523.265
14.21714.217
12,52911,547
982
13.70713.707
Net income after related taxes.........................
Dividends and interest on capital—tota l.........Cash d iv id e n d s dec la re d on co m m o n s to ck . D iv idends dec la re d on p re fe rre d s to ck and
in te re s t on c a p ita l no te s and d e b e n tu re s
Net additions to capital from income.............
11,862 17,934 43,172 39,785 8,411 6,482 153,153 42,634 32,447 28,740 27,095
6.2406.240
8.3098.309
15,70715,660
47
14,67913,884
795
3,9903,913
77
3,2373,220
17
65,31965,133
186
14,95014,945
5
11,86611,850
16
9,3089,285
23
9,7549,751
3
5,622 9,625 27,465 25,106 4,421 3,245 87,834 27,684 20,581 19,432 17,341
N u m b e r o f b a n k in g em p loyee s (exc lus ive o f b u ild in g e m p loyee s), D e ce m b e r 31 :
A ctive o f f ic e rs ..........................................................O the r e m p lo ye e s ........................ ............................
3952,000
6053,522
3,44915,775
2,5209,912
3832,188
4691,950
7,27532,208
3,10011,790
3,0836,737
2,5375,088
2,0375,593
MemorandaR ecoveries c re d ite d to va lua tion reserves
(n o t inc lu ded in recoveries above):On s e c u r it ie s ............................................................ 18
3,488
12514,854
183,022
2706,554
16275
21824
2,12720,103
1,77630,499
2054,335
4297,256
171,714
363,312
11,028
323,346
2OO
10 S1,244 m
OT |
671 _ 2,437 2
r /i
On lo a n s .....................................................................Losses charged to va lua tion reserves (n o t
inc lu ded in losses above):On s e c u r it ie s ............................................................On lo a n s .....................................................................
140
23836
1,831
1,409
1,429
647
Occupancy expense of bank premises
Occupancy expense of bank premises, n e t - total ...................................................................
Renta l and o th e r in c o m e ........................................Occupancy expense of bank premises,
gross—tota l.....................................................Salaries— b u ild in g d e p a rtm e n t o f f ic e rs ........S a laries a nd wages— b u ild in g d e p a rtm e n t
e m p lo y e e s .............................................................B u ild in g d e p a rtm e n t personne l b e n e f its . . .R e curring d e p re c ia tio n ........................................M a in tenance and re p a irs ....................................In su ra n ce and u t i l i t ie s .........................................Rents p a id .................................................................T a x e s ...........................................................................
1,898244
2,142
18829
344190387866138
4,881986
5,8678
1,12095
822616757
1,828621
15,7544,937
20,69171
2,021200
3,7602,4124,3044,2303,693
11,8752,510
14,38530
1,190126
2,3671,7052,2973,7922,878
2,338764
3,10244
18348
403217777
1,227203
1,710403
2,1131
22514
533194360461325
37,5469,247
46,793163
7,923773
7,0735,5477,096
11,4536,765
13,3033,559
16,86233
2,680180
3,0892,4033,0073,3292,141
7,6881,266
8,95412
1,23786
1,5631,0081,8351,9591,254
5,8051,328
7,13331
91864
1,426991
1,3921,315
996
C73mD
6.1501.150 CD
J>
7,300 |5 C/)
1,06487
1,4001,0151,4541,331
944
N u m b e r o f b u ild in g em ployee s, Decem ber 31 :
O ff ic e rs .......................................................................O ther e m p lo ye e s ..................................................... 73
1323
6655
3493
385
194
222,106
71,083
12765
9489
3
543 roN u m b e r o f banks, D ecem ber 3 1 ......................... 20 15 421 381 7 24 1,024 426 659 593
o342 VO
Note: For average asset and liab ility data by State, see Table 111, pp. 188-189.Back figures, 1946-1963: See the Annual Report for 1963, pp. 164-173, and earlier reports.
Digitized for FRASER http://fraser.stlouisfed.org/ Federal Reserve Bank of St. Louis
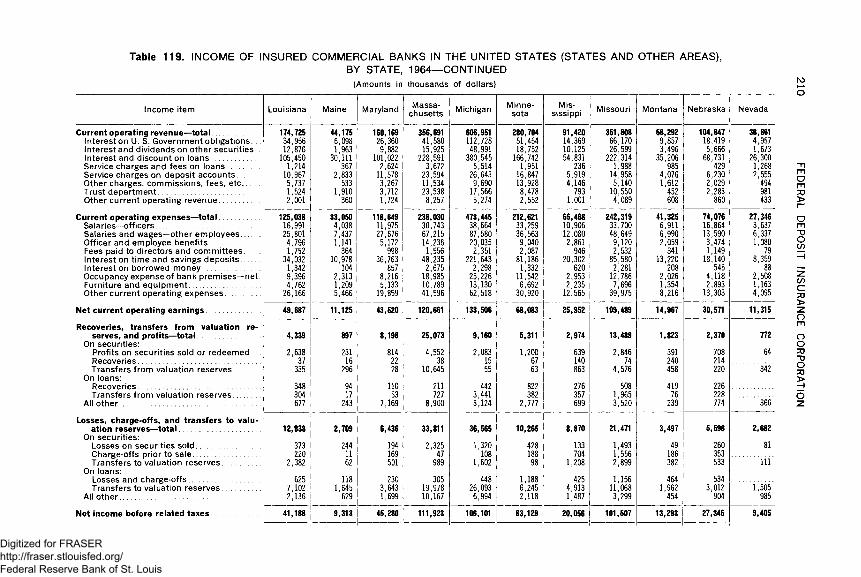
Table 119. INCOME OF INSURED COMMERCIAL BANKS IN THE UNITED STATES (STATES AND OTHER AREAS),BY STATE, 1964— CONTINUED
(Am ounts in thousands o f do lla rs )
Incom e ite m Louisiana M aine M aryland M assachuse tts M ichigan M in n e
sotaM is
siss ipp i M issouri M ontana N ebraska Nevada
Current operating revenue—tota l..................... 174,725 44,175 160,169 356,691 606,951 280,704 91,420 351,808 56,292 104,647 38,661In te re s t on U. S. G o ve rn m e n t o b lig a t io n s . .. 34,956 6,098 26,360 41,580 112,728 51,454 14,369 66,170 9,857 18,419 4,957In te re s t and d iv id e n d s on o th e r s e c u r it ie s .. 12,876 1,963 9,882 15,925 48,991 18,752 10,125 26,599 3,496 5,666 1,673In te re s t and d isco u n t on lo a n s ........................ 105,450 30,111 101,022 228,591 380,545 166,742 54,831 222,314 35,206 68,731 26,300Service charges and fees on lo a n s ................ 1,214 367 2,624 3,672 5,514 1,951 236 1,988 985 429 1,268Service charges on d e p o s it a c c o u n ts ........... 10,967 2,833 11,578 23,594 26,643 16,847 5,919 14,958 4,076 6,230 2,555O th e r charges, co m m iss io n s , fees, e tc ........ 5,737 533 3,267 11,534 9,690 13,928 4,146 5,140 1,612 2,029 494T ru s t d e p a r tm e n t................................................... 1,524 1,910 3,712 23,538 17,566 8,478 793 10,550 452 2,283 981O th e r c u r re n t o p e ra tin g re v e n u e .................... 2,001 360 1,724 8,257 5,274 2,552 1,001 4,089 608 860 433
Current operating expenses—tota l.................. 125,038 33,050 116,649 236,030 473,445 212,621 65,468 242,319 41,325 74,076 27,346S a laries— o ff ic e rs .................................................... 16,991 4,038 11,975 30,743 38,664 33,259 10,906 33,700 6,911 16,864 3,637Sa laries and wages— o th e r e m p lo y e e s ......... 25,801 7,437 27,676 67,215 87,580 36,563 12,080 48,649 6,990 13,590 6,337O ffice r and em ployee b e n e fits ......................... 4,796 1,141 5,172 14,236 20,035 9,040 2,861 9,120 2,059 3,474 1,080Fees paid to d ire c to rs and c o m m itte e s ........ 1,752 364 998 1,556 2,351 2,087 946 2,532 341 1,149 79In te re s t on t im e and saving s d e p o s its ......... 34,032 10,978 36,763 48,235 221,643 81,186 20,302 85,580 13,220 18,140 8,359In te re s t on borrow ed m o n e y ............................ 1,342 104 857 2,675 2,298 1,332 620 2,281 208 545 88O ccupancy expense o f b a n k p re m ise s— ne t. 9,396 2,313 8,216 18,985 25,226 11,542 2,953 12,786 2,026 4,118 2,508F u rn itu re and e q u ip m e n t................................... 4,762 1,209 5,133 10,789 13,130 6,692 2,235 7,696 1,354 2,893 1,163O th e r c u r re n t o p e ra tin g e x p e n s e s ................. 26,166 5,466 19,859 41,596 62,518 30,920 12,565 39,975 8,216 13,303 4,095
Net current operating earnings........................ 49,687 11,125 43,520 120,661 133,506 68,083 25,952 109,489 14,967 30,571 11,315
Recoveries, transfers from valuation reserves, and profits—to ta l............................ 4,339 897 8,196 25,073 9,160 5,311 2,974 13,489 1,823 2,370 772
On secu ritie s :P ro fits on s e c u ritie s sold o r re d e e m e d . . . 2,638 231 814 4,552 2,083 1,200 639 2,846 391 708 64R e co ve rie s ............................................................. 37 16 22 38 15 67 140 74 240 214T ra n s fe rs f ro m va lu a tio n re s e rv e s ............. 335 296 28 10,645 55 63 863 4,576 458 220 342
On loans:Recoveries . . 348 94 110 211 442 822 276 508 419 226T ra n s fe rs f ro m va lu a tio n reserves 304 17 53 727 3,441
3,124382 357 1,965
3,52076 228
All o th e r ...................................................................... 677 243 7,169 8,900 2,777 699 239 774 366
Losses, charge-offs, and transfers to valuation reserves—to ta l..................................... 12,838 2,709 6,436 33,811 36,565 10,265 8,870 21,471 3,497 5,596 2,682
On secu ritie s :Losses on se c u ritie s s o ld ................................ 373 244 194 2,325 1,320 428 133 1,493 49 260 81C h arg e-o ffs p r io r to sa le . 220 11 169 47 108 188 704 1,556
2,899186 353
T ra n s fe rs to va lu a tio n re s e rv e s ................... 2,382 62 501 989 1,602 98 1,208 382 533 111On loans:
Losses and c h a rg e -o ffs .................................. 625 118 230 305 448 1,1886,245
425 1,15611,068
464 534T ra n s fe rs to v a lu a tio n re s e rv e s ................... 7,102 1,645 3,643 19,978 26,093 4,913 1,962 3,012 1,505
All o th e r ...................................................................... 2,136 629 1,699 10,167 6,994 2,118 1,487 3,299 454 904 985
Net income before related taxes...................... 41,188 9,313 45,280 111,923 106,101 63,129 20,056 101,507 13,293 27,345 9,405
210 FEDERAL
DEPOSIT
INSU
RAN
CE
CO
RPO
RA
TION
Digitized for FRASER http://fraser.stlouisfed.org/ Federal Reserve Bank of St. Louis
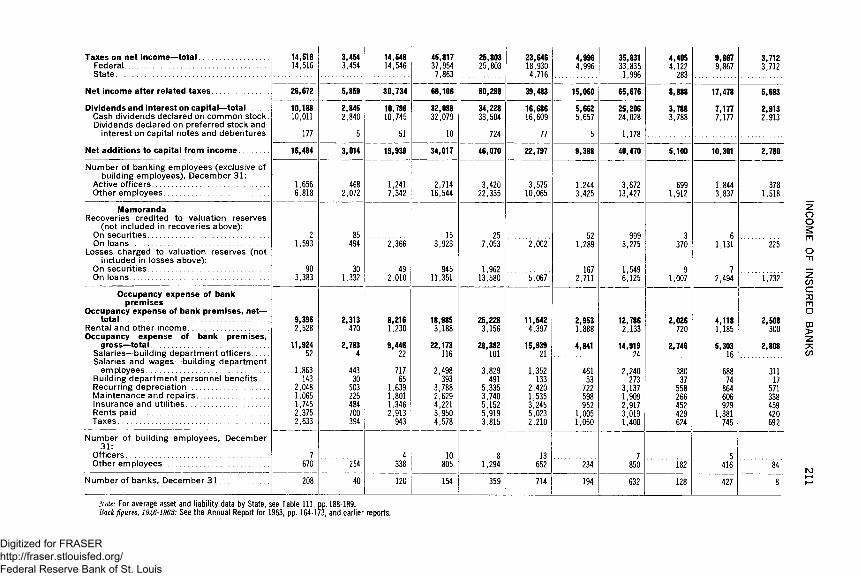
Taxes on net income—tota l...............................F e d e ra l........................................................................S tate ............................................................................
14.51614.516
3.4543.454
14.54614.546
45,81737,9547,863
25.80325.803
23,64618,9304,716
4.9964.996
35,83133,835
1,996
4,4054,122
283
9.8679.867
3.7123.712
Net income after related taxes......................... 26,672 5,859 30,734 66,106 80,298 39,483 15,060 65,676 8,888 17,478 5,693
Dividends and interest on capital—tota l.........Cash d iv id e n d s dec la red on co m m o n s tock. D iv idends dec la red on p re fe rre d s tock and
in te re s t on cap ita l no tes and d e b e n tu re s .
10,18810,011
177
2,8452,840
5
10,79610,745
51
32,08932,079
10
34,22833,504
724
16,68616,609
77
5,6625,657
5
25,20624,028
1,178
3.7883.788
7.1777.177
2.9132.913
Net additions to capital from income............. 16,484 3,014 19,938 34,017 46,070 22,797 9,398 40,470 5,100 10,301 2,780
N u m b e r o f b a n k in g em p loyee s (exc lus ive of b u ild in g em ployee s), D e cem b er 31:
A ctive o f f ic e rs ..........................................................O ther e m p lo y e e s ..............................................
1,6566,818
4682,072
1,2417,342
2,71416,544
3,42022,335
3,57510,065
1,2443,425
3,67213,427
6991,912
1,8443,837
3781,518
MemorandaRecoveries c re d ite d to v a lu a tio n reserves
(n o t in c lu d e d in recoveries above):On s e c u r it ie s ............................................................ 2 85 15 25 52 999 3 6On lo a n s .....................................................................
Losses charged to va lu a tio n reserves (no t inc lu ded in losses above):
On s e c u r it ie s ............................................................
1,593
90
494
30
2,366
49
3,923
945
7,053
1,96213,580
2,002 1,289
167
3,275
1,5496,125
370
9
1,131
7
225
On lo a n s ..................................................................... 3,383 1,332 2,010 11,351 5,067 2,711 1,007 2,494 1,732
Occupancy expense of bank premises
Occupancy expense of bank premises, n e t - to ta l...................................................................
Renta l and o th e r in c o m e ........................................Occupancy expense of bank premises,
gross—tota l.....................................................Salaries— b u ild in g d e p a rtm e n t o ffice rs
9,3962,528
11,92452
2,313470
2,7834
8,2161,230
9,44622
18,9853,188
22,173116
25,2263,156
28,382101
11,5424,397
15,93921
2,9531,888
4,841
12,7862,133
14,91924
2,026720
2,746
4,1181,185
5,30316
2,508300
2,808
S alaries and wages— b u ild in g d e p a rtm e n te m p lo y e e s .............................................................
B u ild in g d e p a rtm e n t personn e l b e n e fits . . .R e curring d e p re c ia tio n ........................................M a in tenance and re p a irs ....................................Insu rance and u t i l i t ie s .........................................Rents p a id .................................................................T a x e s ...........................................................................
1,863143
2,0481,0651,7452,3752,633
44330
503225484700394
71765
1,6391,8011,3462,913
943
2,498393
3,7882,6294,2213,9504,578
3,829491
5,3353,7405,1525,9193,815
1,352133
2,4201,5353,2455,0232,210
46153
722598952
1,0051,050
2,240273
3,1371,9092,9173,0191,400
38037
558266452429624
68874
864606929
1,381745
31117
571338459420692
N u m b e r o f b u ild in g em ployees, Decem ber 31:
O ff ic e rs ....................................................................... 7 4 10 8 13 7 5O ther e m p lo ye e s .................................................... 670 254 338 805 1,294 652 234 850 182 416 84
N u m b e r o f banks, D ecem ber 3 1 ........................ 208 40 120 154 359 714 194 632 128 427 8
Note: For average asset and liability data by State, see Table 111, pp. 188-189.Back figures, 1946-1963: See the Annual Report for 1963, pp. 164-173, and earlier reports.
INCOM
E OF
INSURED BANKS
211
Digitized for FRASER http://fraser.stlouisfed.org/ Federal Reserve Bank of St. Louis
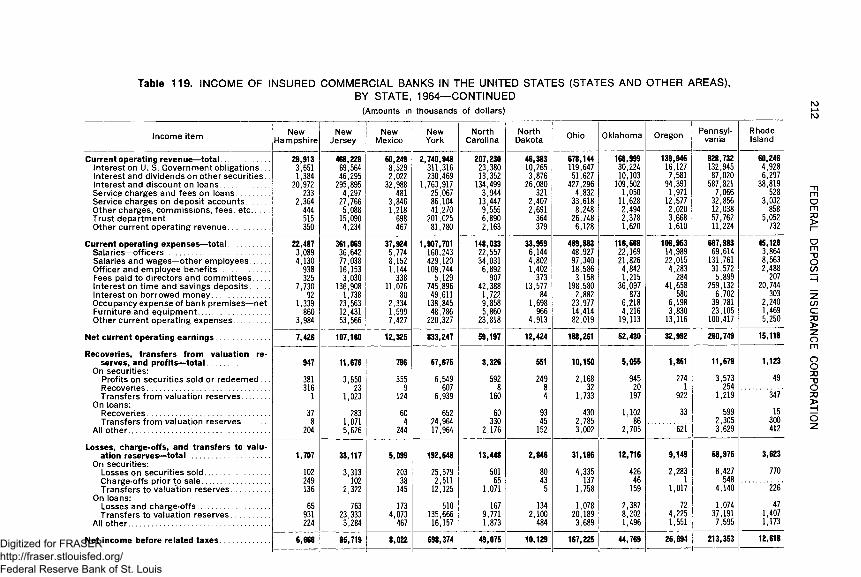
Table 119. INCOME OF INSURED COMMERCIAL BANKS IN THE UNITED STATES (STATES AND OTHER AREAS),BY STATE, 1964— CONTINUED
(Am ounts in thousands o f do lla rs )
Incom e item NewH a m psh ire
NewJersey
NewMexico
NewY ork
N o rthCarolina
N orthDakota Ohio O klahom a Oregon P ennsyl
vaniaRhodeIsland
Current operating revenue—tota l..................... 29,913 468,229 50,249 2,740,948 207,230 46,383 678,144 168,999 139,945 928,732 60,246In te re s t on U. S. G o ve rn m e n t o b lig a tio n s . .. 3,651 69,564 8,529 311,316 23,380 10,265 119,647 30,224 16,127 132,945 4,928In te re s t and d iv id e n d s on o th e r s e c u r it ie s . . 1,384 46,295 2,022 230,469 13,352 3,876 51,627 10,103 7,581 87,020 6,297In te re s t and d is c o u n t on lo a n s ........................ 20,972 295,895 32,988 1,763,917 134,499 26,080 427,296 109,502 94,391 587,821 38,819Service charges and fees on lo a n s ................ 233 4,297 481 25,067 3,944 321 4,832 1,050 1,971 7,066 528Service charges on d e p o s it a c c o u n ts ........... 2,364 27,766 3,846 86,104 13,447 2,407 33,618 11,628 12,577 32,856 3,032O th e r charges, co m m iss io n s , fees, e tc ........ 444 5,088 1,218 41,270 9,555 2,691 8,248 2,494 2,020 12,038 858T ru s t d e p a r tm e n t................................................... 515 15,090 698 201,025 6,890 364 26,748 2,378 3,668 57,762 5,052O th e r c u r re n t o p e ra tin g re v e n u e .................... 350 4,234 467 81,780 2,163 379 6,128 1,620 1,610 11,224 732
Current operating expenses—tota l.................. 22,487 361,069 37,924 1,907,701 148,033 33,959 489,88348,927
116,569 106,953 667,983 45,128S a laries— o f f ic e rs .................................................... 3,089 36,642 5,774 160,243 22,557 6,144 22,169 14,989 69,614 3,864S a laries and wages— o th e r e m p lo y e e s ......... 4,130 77,038 8,152 429,120 34,031 4,802 97,340 21,826 22,015 131,761 8,563O ffice r and e m p loyee b e n e fits ......................... 938 16,153 1,144 109,744 6,892 1,402 18,586 4,842 4,283 31,572 2,488Fees paid to d ire c to rs a nd c o m m itte e s 325 3,030 338 5,129 907 373 3,158 1,215 284 5,899 207In te re s t on t im e and saving s d e p o s its ......... 7,730 136,908 11,076 745,896 42,388 13,577 198,580 36,097 41,658 259,132 20,744In te re s t on b o rro w e d m o n e y ............................ 92 1,738 80 49,611 1,722 84 2,882 873 580 6,702 303O ccupancy expe nse o f ban k p re m ise s— n e t. 1,339 23,563 2,334 138,845 9,858 1,698 23,977 6,218 6,198 39,781 2,240F u rn itu re and e q u ip m e n t................................... 860 12,431 1,599 48,786 5,860 966 14,414 4,216 3,830 23,105 1,469O th e r c u r re n t o p e ra tin g e x p e n s e s ................. 3,984 53,566 7,427 220,327 23,818 4,913 82,019 19,113 13,116 100,417 5,250
Net current operating earnings........................ 7,426 107,160 12,325 833,247 59,197 12,424 188,261 52,430 32,992 260,749 15,118
Recoveries, transfers from valuation reserves, and profits—to ta l............................ 947 11,676 796 57,675 3,326 551 10,150 5,055 1,851 11,579 1,123
On s e cu ritie s :P ro fits on se c u ritie s so ld o r re d e e m e d ... 381 3,650 355 6,549 592 249 2,168 945 274 3,573 49Recoveries 316 23 9 607 8 8 32 20 1 254T ra n s fe rs fro m va lu a tio n re s e rv e s ............. 1 1,023 124 6,939 160 4 1,733 197 922 1,219 347
On loans:R e co ve rie s ............................................................. 37 283 60 652 60 93 430 1,102 33 599 15T ra n s fe rs fro m va lu a tio n reserves 8 1,071
5,6264 24.964
17.964330 45 2,785
3,00286 2,305 300
All o th e r ...................................................................... 204 244 2,176 152 2,705 621 3,629 412
Losses, charge-offs, and transfers to valuation reserves—tota l..................................... 1,707 33,117 5,099 192,548 13,448 2,846 31,186 12,716 9,149 58,975 3,623
On securities :Losses o n se cu ritie s s o ld ................................ 102 3,313 203 25,579 501 80 4,335 426 2,283 8,427 770C h arg e-o ffs p r io r to sale 249 102 38 2,511
12,12565 43 137 46 1 548
T ra n s fe rs to va lu a tio n re s e rv e s ................... 136 2,322 145 1,071 5 1,758 159 1,017 4,140 226On loans:
Losses and c h a rg e -o ffs .................................... 65 763 173 510 167 134 1,078 2,387 72 1,074 47T ra n s fe rs to va lu a tio n re s e rv e s ................... 931 23,333 4,073 135,666 9,771 2,100 20,189 8,202 4,225 37,191 1,407
All o th e r ...................................................................... 224 3,284 467 16,157 1,873 484 3,689 1,496 1,551 7,595 1,173
Net income before related taxes...................... 6,666 85,719 8,022 698,374 49,075 10,129 167,225 44,769 25,694 213,353 12,618
212 FEDERAL
DEPOSIT
INSU
RAN
CE
CO
RPO
RA
TION
Digitized for FRASER http://fraser.stlouisfed.org/ Federal Reserve Bank of St. Louis
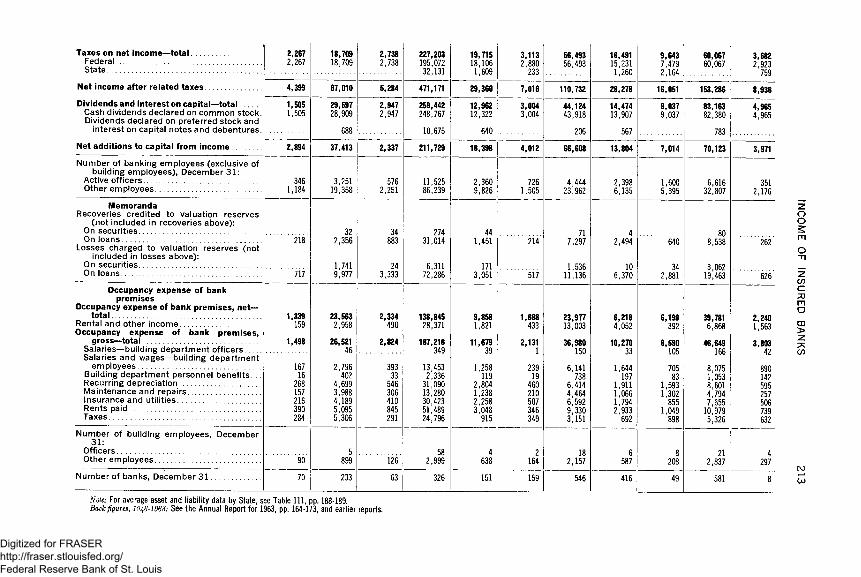
Taxes on net income—tota l................................F e d e ra l............................................................S ta te .........................................................................
2.2672.267
18.70918.709
2.7382.738
227,203195,07232,131
19,71518,1061,609
3,1132,880
233
56.49356.493
16,49115,2311,260
9,6437,4792,164
60.06760.067
3,6822,923
759
Net income after related taxes.........................
Dividends and interest on capital—tota l.........Cash d iv id e n d s d e c la re d on co m m o n s to ck . D iv idends d e c la re d on p re fe rre d s to ck and
in te re s t on ca p ita l n o te s and d e b e n tu re s
Net additions to capital from income.............
4,399 67,010 5,284 471,171 29,360 7,016 110,732 28,278 16,051 153,286 8,936
1.5051.505
29,59728,909
688
2.9472.947
259,442248,767
10,675
12,96212,322
640
3.0043.004
44,12443,918
206
14,47413,907
567
9.0379.037
83,16382,380
783
4.9654.965
2,894 37,413 2,337 211,729 16,398 4,012 66,608 13,804 7,014 70,123 3,971
N u m b e r o f b a n k in g em p lo ye e s (exc lus ive o f b u ild in g e m p lo ye e s), D e cem b er 3 1 :
A ctive o f f ic e rs ..........................................................O th e r e m p lo y e e s .....................................................
3461,184
3,25119,358
5762,251
11,52586,239
2,3609,826
7261,505
4,44423,962
2,3986,135
1,6005,395
6,61632,807
3512,176
MemorandaR ecoveries c re d ite d to va lu a tio n reserves
(n o t in c lu d e d in reco ve rie s above):On s e c u r it ie s ............................................................. 32
2,356
1,7419,977
34883
243,333
27431,014
6,31172,286
441,451
1713,051
717,297
1,53611,136
42,494
106,370
808,538
3,06219,463
2OO
On lo a n s ......................................................................Losses cha rg e d to va lu a tio n reserves (n o t
in c lu d e d in losses abo ve):On s e c u r it ie s .............................................................
218 214 640
342,881
262 m O ~n
On lo a n s ...................................................................... 717 517 626 2 CO
Occupancy expense of bank premises
Occupancy expense of bank premises, n e t - total ................................................
Renta l and o th e r in c o m e ........................................Occupancy expense of bank premises,
gross—tota l......................................................S a laries— b u ild in g d e p a rtm e n t o f f ic e rs ........Sa laries and w ages— b u ild in g d e p a rtm e n t
e m p lo y e e s ....................................................B u ild in g d e p a rtm e n t p e rso n n e l b e n e f i t s . ..R e cu rr in g d e p re c ia tio n ........................................M a in te n a n ce and re p a irs ..................................In su ra n ce a nd u t i l i t ie s .........................................Rents p a id ............................................................T a x e s ............................................................................
1,339159
1,498
16716
268157216390284
23,5632,958
26,52146
2,796402
4,6993,9884,1895,0955,306
2,334490
2,824
39333
546306410845291
138,84528,371
167,216349
13,4532,336
31,09013,28030,42351,48924,796
9,8581,821
11,67939
1.258 119
2,8041,2382.258 3,048
915
1,698433
2,1311
23919
460210507346349
23,97713,003
36,980150
6,141738
6,4144,4646,5929,3303,151
6,2184,052
10,27033
1,644197
1,9111,0661,7942,933
692
6,198392
6,590105
70583
1,5931,302
8551,049
898
39,7816,868
46,649166
8,0751,0538,6014,7947,655
10,9795,326
c=
mo
2,240 m1,563
3,803 142 GO
890142595257506739632
N u m b e r o f b u ild in g em p loyee s, D e cem b er 31 :
O ff ic e rs ......................................................O th e r e m p lo y e e s ..................................................... 90
5899 126
582,999
4638
2164
182,157
6587
8208
212,837
4297
ro
N u m b e r o f ban ks, D e ce m b e r 3 1 ....................... 70 233 63 326 151 159 546 416 49 581 8 oo
Note: For average asset and liability data by State, see Table 111, pp. 188-189.Back figures, 1946-1963: See the Annual Report for 1963, pp. 164-173, and earlier reports.
Digitized for FRASER http://fraser.stlouisfed.org/ Federal Reserve Bank of St. Louis
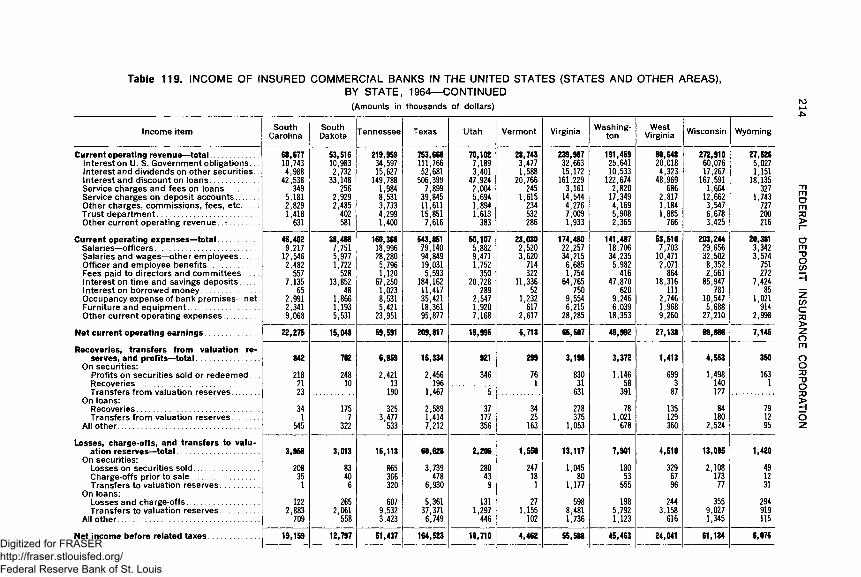
Table 119. INCOME OF INSURED COMMERCIAL BANKS IN THE UNITED STATES (STATES AND OTHER AREAS),BY STATE, 1964— CONTINUED
(Am ounts in thousands o f do lla rs )
Incom e ite m S o uthC arolina
SouthDakota T ennessee Texas U tah V e rm o n t V irg in ia W ash ing
tonW est
V irg in ia W isconsin W yom ing
Current operating revenue—tota l...................... 68,677 53,51610,983
219,959 753,668 70,102 28,743 239,987 191,459 80,648 272,910 27,526In te re s t on U. S. G o ve rn m e n t o b lig a tio n s . .. 10,743 34,597 111,766 7,189 3,477 32,663 25,641 20,018 60,076 5,027In te re s t a nd d iv id e n d s on o th e r s e c u r it ie s . . 4,988 2,732 15,627 52,681 3,401 1,588 15,172 10,533 4,323 17,267 1,151In te re s t a nd d is c o u n t on lo a n s ........................ 42,538 33,148 149,788 506,399 47,924 20,766 161,229 122,674 48,969 167,591 18,135S ervice charges and fees on lo a n s ................ 349 256 1,984 7,899 2,004 245 3,161 2,820 686 1,664 327Serv ice charges on d e p o s it a c c o u n ts ........... 5,181 2,929 8,531 39,845 5,694 1,615 14,544 17,349 2,817 12,662 1,743O th e r charges, co m m iss io n s , fees, e tc ........ 2,829 2,485 3,733 11,611 1,894 234 4,276 4,169 1,184 3,547 727T ru s t d e p a r tm e n t................................................... 1,418 402 4,299 15,851 1,613 532 7,009 5,908 1,885 6,678 200O th e r c u r re n t o p e ra tin g re ve n u e . . 1 .............. 631 581 1,400 7,616 383 286 1,933 2,365 766 3,425 216
Current operating expenses—tota l.................. 46,402 38,468 160,368 543,851 50,107 23,030 174,48022,257
141,467 53,510 203,244 20,381Sa laries— o f f ic e rs .................................................... 9,217 7,751 18,996 79,140 5,882 2,520 18,706 7,703 29,656 3,342Sa laries a n d w ages— o th e r e m p lo y e e s ......... 12,546 5,977 28,280 94,849 9,471 3,620 34,215 34,235 10,471 32,502 3,574O ffice r and em p loyee b e n e fits ......................... 2,482 1,722 5,796 19,031 1,752 714 6,685 5,982 2,071 8,352 751Fees paid to d ire c to rs and c o m m itte e s 557 528 1,120 5,593 350 322 1,754 416 864 2,561 272In te re s t on t im e and saving s d e p o s its ......... 7,135 13,852 67,250 184,162 20,728 11,336 64,765 47,870 18,316 85,947 7,424In te re s t on borrow ed m o n e y ............................. 65 48 1,023 11,417 289 52 750 620 111 781 85O ccupancy expe nse o f ban k p re m ise s— ne t. 2,991 1,866 8,531 35,421 2,547 1,232 9,554 9,246 2,746 10,547 1,021F u rn itu re and e q u ip m e n t ................................... 2,341 1,193 5,421 18,361 1,920 617 6,215 6,039 1,968 5,688 914O th e r c u r re n t o p e ra tin g e x p e n s e s ................. 9,068 5,531 23,951 95,877 7,168 2,617 28,285 18,353 9,260 27,210 2,998
Net current operating earnings........................ 22,275 15,048 59,591 209,817 19,995 5,713 65,507 49,992 27,138 69,666 7,145
Recoveries, transfers from valuation reserves, and profits—tota l............................
On se cu ritie s :842 762 6,959 15,334 921 299 3,198 3,372 1,413 4,553 350
P ro fits on s e c u ritie s sold o r re d e e m e d . . . 218 248 2,421 2,456 346 76 830 1,146 699 1,498 163R e co ve rie s .............................................................T ra n s fe rs f ro m va lu a tio n re s e rv e s .............
On loans:
2123
10 13190
1961,467 5
1 31631
58391
387
140127
1
R e co ve rie s ............................................................. 34 175 325 2,589 37 34 278 78 135 84 79T ra n s fe rs f ro m va lu a tio n re s e rv e s ............. 1 7 3,477 1,414 177 25 375 1,021 129 180 12
All o th e r ...................................................................... 545 322 533 7,212 356 163 1,053 678 360 2,524 95
Losses, charge-offs, and transfers to valuation reserves—tota l.....................................
On securities :3,958 3,013 15,113 60,628 2,206 1,550 13,117 7,901 4,510 13,085 1,420
Losses on se cu ritie s s o ld ................................ 208 83 865 3,739 280 247 1,045 180 329 2,108 49C harge-o ffs p r io r to s a le .................................. 35 40 366 478 43 18 80 53 67 173 12T ra n s fe rs to va lua tion re s e rv e s ...................
On loans:1 6 320 6,930 9 1 1,177 555 96 77 31
Losses a nd c h a rg e -o ffs .................................... 122 265 607 5,361 131 27 598 198 244 355 294T ra n s fe rs to va lua tion re s e rv e s ................... 2,883 2,061 9,532 37,371 1,297 1,155 8,481 5,792 3,158 9,027 919
All o th e r ...................................................................... 709 558 3,423 6,749 446 102 1,736 1,123 616 1,345 115
Net income before related taxes....................... 19,159 12,797 51,437 164,523 18,710 4,462 55,588 45,463 24,041 61,134 6,075
214 FEDERAL
DEPOSIT
INSU
RAN
CE
CO
RPO
RA
TION
Digitized for FRASER http://fraser.stlouisfed.org/ Federal Reserve Bank of St. Louis

Taxes on net income—tota l................................F e d e ra l........................................................................S ta te .............................................................................
7,1296,671
458
4,6994,261
438
17,30816,962
346
54.94854.948
7,5537,227
326
1,3681,219
149
20.22520.225
17.32917.329
9.3979.397
20,44217,4243,018
2.2992.299
Net income after related taxes......................... 12,030 8,098 34,129 109,575 11,157 3,094 35,363 28,134 14,644 40,692 3,776
Dividends and interest on capital—tota l.........Cash d iv id e n d s d e c la re d on co m m o n s to ck . D iv idends d e c la re d on p re fe rre d s to ck and
in te re s t on ca p ita l n o te s and d e b e n tu re s .
5,3195,318
1
3,1293,121
8
12,44412,410
34
54,92654,916
10
5.7655.765
1,5281,463
65
17,09517,002
93
11.79311.793
5.0095.009
16,64016,532
108
1,4471,443
4
Net additions to capital from income............. 6,711 4,969 21,685 54,649 5,392 1,566 18,268 16,341 9,635 24,052 2,329
N u m b e r o f b a n k in g em p loyee s (e xc lu s ive o f b u ild in g em p lo ye e s), D e cem b er 3 1 :
A ctive o f f ic e rs ...........................................................O th e r e m p lo y e e s .....................................................
1,0143,779
8851,781
2,2048,004
8,08525,575
6362,684
3031,051
2,4649,756
1,8378,051
8692,973
3,0999,257
338930
MemorandaR ecoveries c re d ite d to v a lu a tio n reserves
(n o t in c lu d e d in re co ve rie s above):On s e c u r it ie s ............................................................. 10 14 199 89 2 2On lo a n s ......................................................................
Losses ch a rg e d to v a lu a tio n reserves (n o t inc lu d e d in losses abo ve):
On s e c u r it ie s .............................................................
250 579
7
1,799
3
10,994
2,07732,388
409 158
2
1,414
732
913 420
85
2,586
18
382
On lo a n s ...................................................................... 1,281 1,339 4,766 889 790 5,191 2,237 1,321 3,941 644
Occupancy expense of bank premises
Occupancy expense of bank premises, n e t - total ...................................................................
Renta l and o th e r in c o m e .........................................Occupancy expense of bank premises,
gross—total......................................................S alaries— b u ild in g d e p a rtm e n t o ffice rs
2,991266
3,2571
1,866308
2,1741
8,5312,642
11,17339
35,42125,031
60,452133
2,547807
3,354
1,232141
1,373
9,5541,605
11,15920
9,246924
10,17074
2,746862
3,60819
10,5472,722
13,26974
1,021329
1,3503
S alaries and wages— b u ild in g d e p a rtm e n te m p lo ye e s .............................................................
B u ild in g d e p a rtm e n t pe rsonn e l b e n e fits . . .R e curring d e p re c ia tio n ........................................M a in tenance and re p a irs ....................................In su rance and u t i l i t ie s .........................................R ents p a id .................................................................T a xe s ............................................................................
30641
790432788721178
27130
348255525389355
1,435116
2,5761,2712,0071,4952,234
6,182564
11,2346,067
10,13911,67314,460
38426
807248603931355
19619
255113235384171
1,665166
2,2201,1612,1352,892
900
892130
3,0351,7301,7361,5451,028
60848
719473688"581472
1,682173
2,5351,4522,3132,8492,191
15013
301198255133297
N u m b e r o f b u ild in g em ployee s, D e cem b er 31 :
O ff ic e rs ........................................................................ 1 3 7 20 1 17 3 10 2O ther e m p lo ye e s ..................................................... 192 202 615 2,086 126 101 827 239 295 789 71
N u m b e r o f banks, D e cem b er 3 1 ......................... 129 172 290 1,115 54 48 277 96 183 575 68
Note: For average asset and liab ility data by State, see Table 111, pp. 188-189.Back figures, 1946-1963: See the Annual Report for 1963, pp. 164-173, and earlier reports.
INCOM
E OF
INSURED BANKS
215
Digitized for FRASER http://fraser.stlouisfed.org/ Federal Reserve Bank of St. Louis
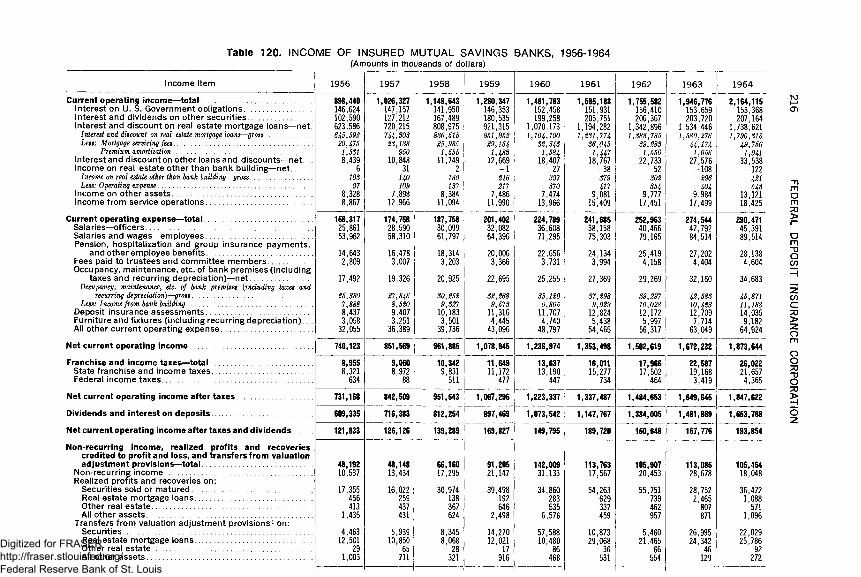
Table 120. INCOME OF INSURED MUTUAL SAVINGS BANKS, 1956-1964(Amounts in thousands of dollars)
Incom e Item 1956 1957 1958 1959 1960 1961 1962 1963 1964
Current operating income—total.................................................. 898,440 1,026,327 1,149,643 1,280,347 1,461,763 1,595,183 1,755,582 1,946,776 2,164,115In te re s t on U. S. G o ve rn m e n t o b lig a tio n s .................................. 146,624 147,157 141,950 146,353 152,458 151,931 156,410 153,659 153,368In te re s t and d iv id e n d s on o th e r s e c u r it ie s ................................ 102,590 127,212 167,489 180,535 199,258 205,751 206,367 203,720 207,164In te re s t and d is c o u n t on real e s ta te m o rtg a g e loan s— n e t. 623,586 720,215 808,975 921,315 1,070,173 1,194,282 1,342,896 1,534,446 1,738,621
Interest and discount on real estate mortgage loans—gross.................... 6 ^ 5 ,5 9 2 7 4 4 ,SOS 8 3 6 ,5 1 5 9 5 1 ,9 5 2 1, 104,100 1 ,2 3 1 ,7 7 4 1 ,3 8 3 ,7 3 5 1 ,5 8 0 ,2 7 6 1 ,7 9 0 ,3 1 8Less: Mortgage servicing fees........................................................... 2 0 ,4 7 5 2 3 ,1 3 8 2 5 ,9 8 5 2 9 ,1 5 4 3 2 ,3 4 3 3 6 ,0 4 5 3 9 ,2 8 3 4 4 ,1 7 4 4 9 ,7 5 6
Premium amortization............................................................ 1 ,531 950 1 ,5 5 5 1 ,4 8 3 1 ,5 8 4 1 ,4 4 7 1 ,5 5 6 1 ,6 5 6 1 ,941In te re s t and d is c o u n t on o th e r loans and d is c o u n ts — n e t . .. 8,439 10,848 11,749 12,669 18,407 18,767 22,733 27,576 33,538Incom e on real e s ta te o th e r th a n ba n k b u ild in g — n e t .......... 6 31 2 - 1 27 -3 8 -52 -108 -122
Income on real estate other than bank building—gross.......................... 103 140 139 216 397 379 302 296 421Less: Operating expense.................................................................. 97 109 137 217 370 417 354 404 543
Incom e on o th e r a s s e ts ...................................................................... 8,328 7,898 8,384 7,486 7,474 9,081 9,777 9,984 13,121Incom e fro m serv ice o p e ra t io n s ..................................................... 8,867 12,966 11,094 11,990 13,966 15,409 17,451 17,499 18,425
Current operating expense—tota l................................................. 158,317 174,758 187,758 201,402 224,789 241,685 252,963 274,544 290,471S alaries— o f f ic e rs ................................................................................... 25,861 28,590 30,099 32,082 36,608 38,158 40,466 42,792 45,391Salaries a nd wages— e m p lo y e e s ..................................................... 53,962 58,310 61,797 64,396 71,295 75,303 79,165 84,514 89,514Pension, h o sp ita liza tio n and g ro u p insu rance p a ym e n ts ,
and o th e r em ployee b e n e fits ..................................................... 14,643 16,478 18,314 20,006 22,656 24,134 25,419 27,202 28,138Fees paid to tru s te e s and c o m m itte e m e m b e rs ...................... 2,809 3,007 3,203 3,366 3,731 3,994 4,158 4,404 4,604O ccupancy, m a in tenance , etc. o f ban k p rem ises ( in c lu d in g
taxes and re c u rrin g d e p re c ia tio n )— n e t ............................... 17,492 19,326 20,925 22,695 25,255 27,369 29,269 32,160 34,683Occupancy, maintenance, etc. of bank premises (including taxes and
recurring depreciation) —gross................................................... 2 5 ,3 8 0 2 7 ,8 4 6 3 0 ,2 5 2 3 2 ,2 6 8 3 5 ,1 2 0 3 7 ,2 9 8 3 9 ,2 9 7 4 2 ,5 8 3 4 5 ,87 1Less: Income from bank building...................................................... 7 ,8 8 8 8 ,5 2 0
9,4079 ,3 2 7 9 ,5 7 3 9 ,8 6 5 9 ,9 2 9 1 0 ,0 2 8 1 0 ,4 2 3 1 1 ,1 8 8
D eposit in su rance a ss e s s m e n ts ..................................................... 8,437 10,183 11,316 11,707 12,824 12,172 12,709 14,035Fu rn itu re and fix tu re s ( in c lu d in g re c u rrin g d e p re c ia t io n ) . .. 3,058 3,251 3,501 4,445 4,740 5,438 5,997 7,714 9,182All o th e r c u rre n t o p e ra tin g e x p e n s e ............................................. 32,055 36,389 39,736 43,096 48,797 54,465 56,317 63,049 64,924
Net current operating income........................................................ 740,123 851,569 961,885 1,078,945 1,236,974 1,353,498 1,502,619 1,672,232 1,873,644
Franchise and income taxes—tota l.............................................. 8,955 9,060 10,342 11,649 13,637 16,011 17,966 22,587 26,022S tate fra n ch ise and incom e ta x e s .................................................. 8,321 8,972 9,831 11,172 13,190 15,277 17,502 19,168 21,657Federal incom e ta x e s ........................................................................... 634 88 511 M l 447 734 464 3,419 4,365
Net current operating income after taxes.................................. 731,168 842,509 951,543 1,067,296 1,223,337 1,337,487 1,484,653 1,649,645 1,847,622
Dividends and interest on deposits............................................. 609,335 716,383 812,254 897,469 1,073,542 1,147,767 1,334,005 1,481,869 1,653,768
Net current operating income after taxes and dividends........ 121,833 126,126 139,289 169,827 149,795 189,720 150,648 167,776 193,854
Non-recurring income, realized profits and recoveries credited to profit and loss, and transfers from valuation adjustment provisions—tota l.................................................. 48,192 48,148 66,160 91,205 142,009 113,763 105,907 113,085 105,454
N o n -re cu rr in g in c o m e .......................................................................... 10,537 13,434 17,295 21,147 31,133 17,567 20,453 28,678 18,048Realized p ro fits and recoveries on:
S e cu ritie s sold o r m a tu re d ............................................................ 17,355 16,022 30,974 39,498 34,860 54,263 55,751 28,752 36,472Real e s ta te m ortgag e lo a n s .......................................................... 456 259 138 192 283 629 739 2,465 1,088O ther real e s ta te ................................................................................ 413 437 367 646 535 337 462 807 571All o th e r a s s e ts ................................................................................... 1,435 431 624 2,498 6,576 459 957 871 1,096
T ra n s fe rs f ro m va lua tion a d ju s tm e n t p ro v is io n s 1 on: S e c u rit ie s .............................................................................................. 4,463 5,939 8,345 14,270 57,588 10,873 5,460 26,995 22,029Real esta te m ortgag e lo a n s .......................................................... 12,501 10,850 8,068 12,021 10,480 29,068 21,465 24,342 25,786O ther real e s ta te ................................................................................ 29 65 28 17 86 36 66 46 92All o th e r a s s e ts ................................................................................... 1,003 711 321 916 468 531 554 129 272
216 FEDERAL
DEPOSIT
INSU
RAN
CE
CO
RPO
RA
TION
Digitized for FRASER http://fraser.stlouisfed.org/ Federal Reserve Bank of St. Louis
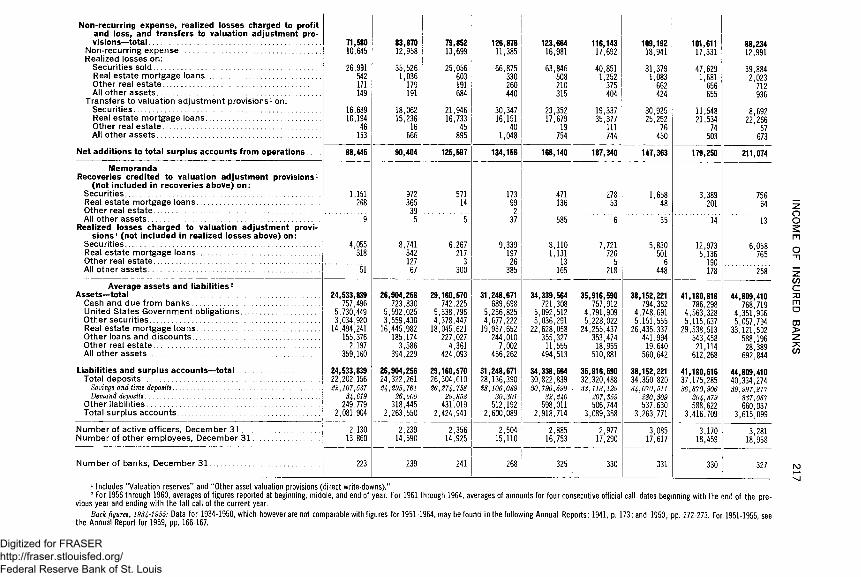
Non-recurring expense, realized losses charged to profit11
and loss, and transfers to valuation adjustment provisions—tota l............................................................................. 71,580 83,870 79,852 126,876 123,664 116,143 109,192 101,611 88,234
N o n -re cu rrin g e x p e n s e ...................................................................... 10,645 12,958 13,699 11,385 16,981 17,692 18,941 17,331 12,991Realized losses on:
S e curities s o ld ................................................................................... 26,991 35,526 25,056 66,875 63,846 40,851 31,379 47,629 39,884Real e s ta te m o rtg a g e lo a n s ......................................................... 542 1,036 603 330 508 1,252 1,083 1,681 2,023O ther real e s ta te .............................................................................. 171 179 191 260 210 375 662 656 712All o th e r a s s e ts .................................................................................. 149 191 684 440 315 404 424 655 936
T ra n s fe rs to va lua tion a d ju s tm e n t p ro v is io n s1 on:S e c u rit ie s ............................................................................................. 16,689 18,062 21,946 30,347 23,352 19,337 30,925 11,548 8,692Real es ta te m ortgag e lo a n s ......................................................... 16,194 15,236 16,733 16,151 17,679 35,377 25,252 21,534 22,266O ther real e s ta te .............................................................................. 46 16 45 40 19 111 76 74 57All o th e r a s s e ts .................................................................................. 153 666 895 1,048 754 744 450 503 673
Net additions to total surplus accounts from operations. . . . 98,445 90,404 125,597 134,156 168,140 187,340 147,363 179,250 211,074
MemorandaRecoveries credited to valuation adjustment provisions1
(not included in recoveries above) on:S e c u rit ie s ................................................................................................. 1,151 972 571 173 471 278 1,658 3,389 756Real estate m ortgag e lo a n s ............................................................. 268 365 14 99 136 53 48 201 64O ther real e s ta te ................................................................................... 39 2All o th e r a s s e ts ...................................................................................... 9 5 5 37 585 6 35 14 13
Realized losses charged to valuation adjustment provisions1 (not included in realized losses above) on:
S e c u rit ie s ................................................................................................. 4,055 8,741 6,267 9,339 8,110 7,721 5,830 12,973 6,058Real estate m ortgag e lo a n s ............................................................. 318 342 217 197 1,131 720 501 5,136 765O ther real e s ta te ................................................................................... 127 3 26 13 5 6 190All o th e r a s s e ts ...................................................... ............................... 51 67 300 385 165 218 448 178 258
Average assets and liabilities2Assets—total...................................................................................... 24,533,839 26,904,256 29,160,570 31,248,671 34,339,564 35,916,590 38,152,221 41,180,616 44,609,410
Cash and due fro m b a n k s ................................................................ 757,496 723,830 742,225 689,698 721,308 757,912 794,362 786,298 768,719U nited S tates G overnm e nt o b lig a tio n s ....................................... 5,730,449 5,592,025 5,338,796 5,236,825 5,092,512 4,791,909 4,748,691 4,563,328 4,351,936O ther s e c u r it ie s ..................................................................................... 3,034,920 3,559,430 4,378,447 4,677,222 5,036,291 5,228,022 5,151,555 5,115,637 5,057,794Real esta te m ortgage lo a n s ............................................................. 14,494,241 16,445,982 18,045,621 19,937,652 22,628,058 24,255,437 26,435,337 29,538,513 33,121,502O ther loans and d is c o u n ts ............................................................... 155,376 185,174 227,027 244,010 355,327 353,474 441,994 543,458 588,196O ther real e s ta te ................................................................................. 2,197 3,586 4,361 7,002 11,555 18,955 19,640 21,114 28,389All o th e r a s s e ts ...................................................................................... 359,160 394,229 424,093 456,262 494,513 510,881 560,642 612,268 692,844
Liabilities and surplus accounts—tota l...................................... 24,533,839 26,904,256 29,160,570 31,248,671 34,339,564 35,916,590 38,152,221 41,180,616 44,609,410Total d e p o s its ......................................................................................... 22,202,156 24,322,261 26,304,610 28,136,390 30,822,839 32,320,488 34,350,820 37,175,285 40,334,274
Savings and time deposits............................................................... 2 2 ,1 6 7 ,5 3 7 2 4 ,2 9 5 ,7 6 1 2 6 ,2 7 4 ,7 5 8 2 8 ,1 0 6 ,0 8 9 3 0 ,7 9 0 ,5 9 9 3 2 ,1 1 3 ,1 2 9 3 4 ,0 7 0 ,5 1 1 3 6 ,8 7 0 ,9 0 6 3 9 ,9 9 7 ,2 1 7Demand deposits........................................................................... 3 4,61 9 2 6 ,5 0 0 2 9 ,8 5 2 3 0 ,301 3 2 ,2 4 0 2 0 7 ,3 5 9 2 8 0 ,3 0 9 3 0 4 ,3 7 9 3 37 ,0 5 7
O ther l ia b ilit ie s ...................................................................................... 249,779 318,445 431,019 512,192 598,011 506,744 537,630 588,622 660,037Total su rp lu s a c c o u n ts ...................................................................... 2,081,904 2,263,550 2,424,941 2,600,089 2,918,714 3,089,358 3,263,771 3,416,709 3,615,099
N u m b e r o f active o ffice rs , D ecem ber 3 1 ....................................... 2,130 2,239 2,356 2,504 2,885 2,977 3,085 3,170 3,281N u m b e r o f o th e r em ployees, D ecem ber 3 1 ................................. 13,860 14,590 14,925 15,110 16,753 17,290 17,617 18,459 18,958
N u m b e r o f banks, D e cem b er 3 1 ....................................................... 223 239 241 268 325 330 331 330 327
1 Includes "Valuation reserves” and “ Other asset valuation provisions (direct write-downs).''2 For 1956 through 1960, averages of figures reported at beginning, middle, and end of year. For 1961 through 1964, averages of amounts for four consecutive official call dates beginning with the end of the pre
vious year and ending with the fall call of the current year.
Back figures, 1934-1955: Data for 1934-1950, which however are not comparable with figures for 1951-1964, may be found in the following Annual Reports: 1941, p. 173; and 1950, pp. 272-273. For 1951-1955 see the Annual Report for 1959, pp. 166-167.
INCOM
E OF
INSURED BANKS
217
Digitized for FRASER http://fraser.stlouisfed.org/ Federal Reserve Bank of St. Louis
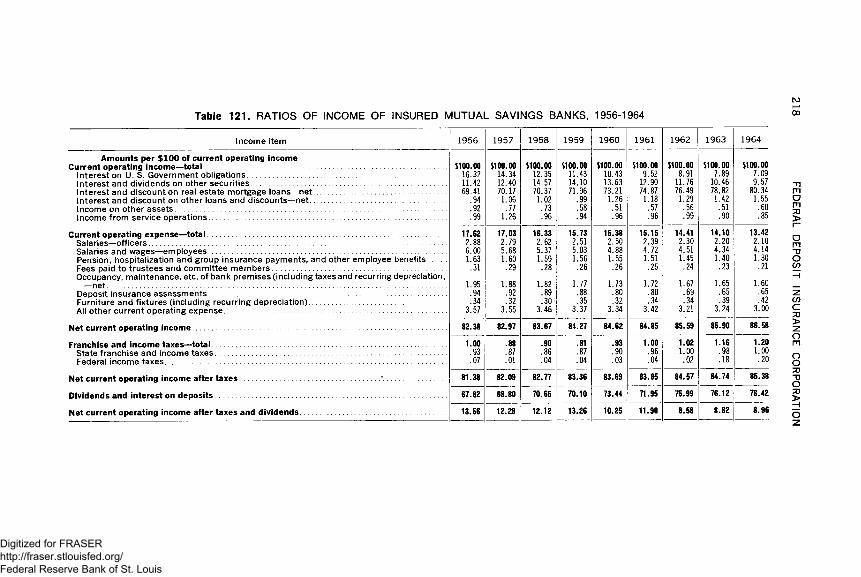
Table 121. RATIOS OF INCOME OF INSURED MUTUAL SAVINGS BANKS, 1956-1964
Incom e ite m 1956 1957 1958 1959 1960 1961 1962 1963 1964
A m o u n ts p e r $ 1 0 0 o f c u r re n t o p e ra tin g in co m e C u rre n t o p e ra tin g in co m e — t o ta l .......................................................................................................................
In te re s t on U. S. G o ve rn m e n t o b lig a tio n s ..................................................................................................In te re s t and d iv id e n d s on o th e r s e c u r it ie s ................................................................................................In te re s t and d is c o u n t on real e s ta te m ortg a g e loan s— n e t ................................................................In te re s t and d is c o u n t on o th e r loans and d is c o u n ts — n e t ..................................................................Incom e on o th e r a s s e ts ......................................................................................................................................Incom e fro m serv ice o p e ra t io n s .....................................................................................................................
C u rre n t o p e ra tin g expe nse— t o ta l ......................................................................................................................S a laries— o f f ic e rs ...................................................................................................................................................Sa laries and wages— e m p lo y e e s .....................................................................................................................Pension, h o sp ita liza tio n and g ro u p in su ra n ce pa ym e n ts , and o th e r em ployee ben efits . . .Fees paid to tru s te e s and c o m m itte e m e m b e rs .....................................................................................O ccupancy, m a in tenance , etc. o f ban k p rem ises ( in c lu d in g taxes and re cu rrin g deprecia tion
— n e t ........................................................................................................................................................................D eposit in su ra n ce a sse ssm e n ts .....................................................................................................................F u rn itu re and fix tu re s ( in c lu d in g re c u rrin g d e p re c ia tio n )...................................................................All o th e r c u rre n t o p e ra tin g e xp e n se .............................................................................................................
N e t c u rre n t o p e ra tin g in c o m e .............................................................................................................................
Franch ise and in co m e taxes— t o ta l ...................................................................................................................S tate fra n ch ise and incom e ta x e s ..................................................................................................................Federal incom e ta x e s ...........................................................................................................................................
N e t c u rre n t o p e ra tin g incom e a fte r ta x e s ......................................................................
D iv id e n d s and in te re s t on d e p o s its ..................................................................................................................
N e t c u rre n t o p e ra tin g incom e a fte r ta xe s and d iv id e n d s .......................................................................
$100.0016.3211.4269.41
.94
.92
.99
17.622.886.001.63.31
1.95.94.34
3.57
82.38
1.00.93.07
81.38
67.82
13.56
$100.0014.3412.4070.171.06
.771.26
$100.0012.3514.5770.371.02
.73
.96
$100.0011.4314.1071.96
.99
.58
.94
$100.0010.4313.6373.21
1.26.51.96
$100.009.52
12.9074.871.18
.57
.96
$100.008.91
11.7676.49
1.29.56.99
17.032.795.681.60
.29
1.88.92.32
3.55
16.332.625.371.59.28
1.82.89.30
3.46
15.732.515.031.56.26
1.77.88.35
3.37
15.382.504.881.55
.26
1.73.80.32
3.34
15.152.394.72 1.51.25
1.72 .80 .34
3.42
14.412.304.511.45.24
1.67.69.34
3.21
82.97 83.67 84.27 84.62 84.85 85.59
.88
.87
.01
.90
.86
.04
.91
.87
.04
.93
.90
.03
1.00.96.04
1.021.00
.02
82.09 82.77 83.36 83.69 83.85 84.57
69.80 70.65 70.10 73.44 71.95 75.99
12.29 12.12 13.26 10.25 11.90 8.58
$100.007.89
10.4678.821.42.51.90
14.102.204.341.40
.23
1.65.65.39
3.24
85.90
1.16.98.18
84.74
76.12
8.62
$100.007.099.57
80.341.55
.60
.85
13.422.104.141.30
.21
1.60.65.42
3.00
86.58
1.201.00.20
85.38
76.42
8.96
218 FEDERAL
DEPOSIT
INSU
RAN
CE
CO
RPO
RA
TION
Digitized for FRASER http://fraser.stlouisfed.org/ Federal Reserve Bank of St. Louis
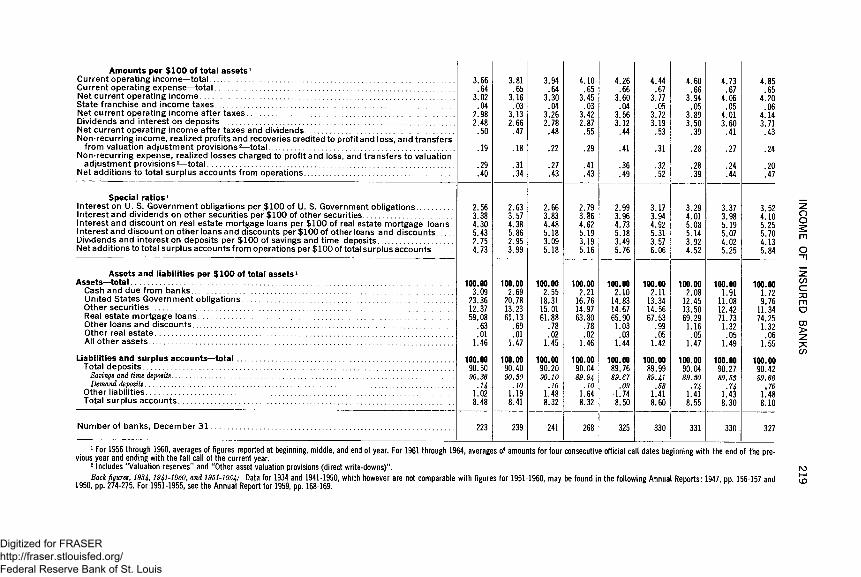
Amounts per $100 off total assets1C u rre n t o p e ra tin g incom e— to ta l...................................................................... 3.66 3.81 3.94 4.10 4.26 4.44 4.60 4.73 4.85C u rre n t o p e ra tin g expense— to ta l .............................................................................. .64 .65 .64 .65 .66 .67 .66 .67 .65N e t c u rre n t o p e ra tin g in c o m e ............................................................... 3.02 3.16 3.30 3.45 3.60 3.77 3.94 4.06 4.20S ta te fra n ch ise and incom e ta x e s ..................................................................... .04 .03 .04 .03 .04 .05 .05 .05 .06N et c u rre n t o p e ra tin g incom e a fte r ta x e s ........................................ 2.98 3.13 3.26 3.42 3.56 3.72 3.89 4.01 4.14D ividends and in te re s t on d e p o s its ........................................................... 2.48 2.66 2.78 2.87 3.12 3.19 3.50 3.60 3.71N e t c u rre n t o p e ra tin g incom e a fte r taxes and d iv id e n d s .................................. .50 .47 .48 .55 .44 .53 .39 .41 .43N o n -re cu rrin g incom e, rea lized p ro fits and recoveries cred ited to p ro fita n d loss, and tra n s fe rs
fro m va lua tion a d ju s tm e n t p ro v is io n s 2— to ta l............................................ .19 .18 .22 .29 .41 .31 .28 .27 .24N o n -re cu rrin g expense, rea lized losses charged to p ro f ita n d loss, and tra n s fe rs to va lua tion
a d ju s tm e n t p ro v is io n s 2— to ta l ......................................................................... .29 .31 .27 .41 .36 .32 .28 .24 .20N e t a d d itio n s to to ta l su rp lu s accou n ts fro m o p e ra tio n s ............................................. .40 .34 .43 .43 .49 .52 .39 .44 .47
Special ratios1In te re s t on U. S. G overnm e nt ob lig a tio n s per $ 10 0 o f U. S. G overnm ent ob liga tions 2.56 2.63 2.66 2.79 2.99 3.17 3.29 3.37 3.52In te re s t and d iv id ends on o th e r se cu ritie s per $10 0 o f o th e r se cu ritie s .......... 3.38 3.57 3.83 3.86 3.96 3.94 4.01 3.98 4.10In te re s t and d is c o u n t on real e s ta te m ortgag e loans per $ 1 0 0 o f real estate m ortgag e loans . 4.30 4.38 4.48 4.62 4.73 4.92 5.08 5.19 5.25In te re s t and d is c o u n t on o th e r loans a nd d iscou n ts per $ 10 0 o f o th e r loans and d isco u n ts 5.43 5.86 5.18 5.19 5.18 5.31 5.14 5.07 5.70D iv idends and in te re s t on d e p o s its per $ 1 0 0 o f savings and tim e d e p o s its ........... 2.75 2.95 3.09 3.19 3.49 3.57 3.92 4.02 4.13N e t a d d itio n s to to ta l s u rp lu s a cco u n ts fro m ope ra tions per $ 1 0 0 o f total s u rp lu s a c c o u n ts ... . 4.73 3.99 5.18 5.16 5.76 6.06 4.52 5.25 5.84
Assets and liabilities per $100 off total assets1Assets—total............................................................................................................ 100.00 100.00 100.00 100.00 100.00 100.00 100.00 100.00 100.00
Cash and due fro m b a n k s ............................................................................. 3.09 2.69 2.55 2.21 2.10 2.11 2.08 1.91 1.72U n ited S tates G overnm e nt o b lig a tio n s ........................................................... 23.36 20.78 18.31 16.76 14.83 13.34 12.45 11.08 9.76O ther s e c u r it ie s .............................................................................................. 12.37 13.23 15.01 14.97 14.67 14.56 13.50 12.42 11.34Real estate m o rtg a g e lo a n s .............................................................................. 59.08 61.13 61.88 63.80 65.90 67.53 69.29 71.73 74.25O ther loans and d is c o u n ts .................................................................... .63 .69 .78 .78 1.03 .99 1.16 1.32 1.32O ther real e s ta te ....................................................................................................... .01 .01 .02 .02 .03 .05 .05 .05 .06All o th e r a s s e ts .................................................................................................. 1.46 1.47 1.45 1.46 1.44 1.42 1.47 1.49 1.55
Liabilities and surplus accounts—to ta l.................................................. 100.00 100.00 100.00 100.00 100.00 100.00 100.00 100.00 100.00Tota l d e p o s its ........................................................................................ 90.50 90.40 90.20 90.04 89.76 89.99 90.04 90.27 90.42
Savings and time deposits............................................................ 9 0 .3 6 9 0 .3 0 9 0 .1 0 8 9 .9 4 8 9 .6 7 8 9 .4 1 8 9 .3 0 8 9 .5 3 8 9 .6 6Demand deposits................................................................................... .1 4 .10 .10 .10 .0 9 .5 8 .7 4 .74 .7 6
O ther lia b ilit ie s ................................................................................ 1.02 1.19 1.48 1.64 1.74 1.41 1.41 1.43 1.48Tota l s u rp lu s a c c o u n ts ........................................................................................ 8.48 8.41 8.32 8.32 8.50 8.60 8.55 8.30 8.10
N u m b e r o f banks, D ecem ber 3 1 .......................................................................... 223 239 241 268 325 330 331 330 327
1 For 1956 through 1960, averages of figures reported at beginning, middle, and end of year. For 1961 through 1964, averages of amounts for four consecutive official call dates beginning with the end of the previous year and ending with the fall call of the current year.
2 Includes “ Valuation reserves” and “ Other asset valuation provisions (direct write-downs)” .
Back figures, 1 93 4 ,1 94 1 -1 95 0 , and 1951-1954: Data for 1934 and 1941-1950, which however are not comparable with figures for 1951-1960, may be found in the following Annual Reports: 1947, pp. 156-157 and 1950, pp. 274-275. For 1951-1955, see the Annual Report for 1959, pp. 168-169.
INCOM
E OF
INSURED BANKS
219
Digitized for FRASER http://fraser.stlouisfed.org/ Federal Reserve Bank of St. Louis
BANKS CLOSED BECAUSE OF FINANCIAL DIFFICULTIES,AND DEPOSIT INSURANCE DISBURSEMENTS
Table 122.
Table 123.
Table 124.
Table 125.
Number and deposits of banks closed because of financial difficulties, 1934-1964, by yearsInsured banks requiring disbursements by the Federal Deposit Insurance Corporation during 1964Depositors, deposits, and disbursements in insured banks requiring disbursements by the Federal Deposit Insurance Corporation, 1934-1964
Banks grouped by class of bank, year of deposit payoff or deposit assumption, amount of deposits, and State
Recoveries and losses by the Federal Deposit Insurance Corporation on principal disbursements for protection of depositors, 1934-1964
Digitized for FRASER http://fraser.stlouisfed.org/ Federal Reserve Bank of St. Louis
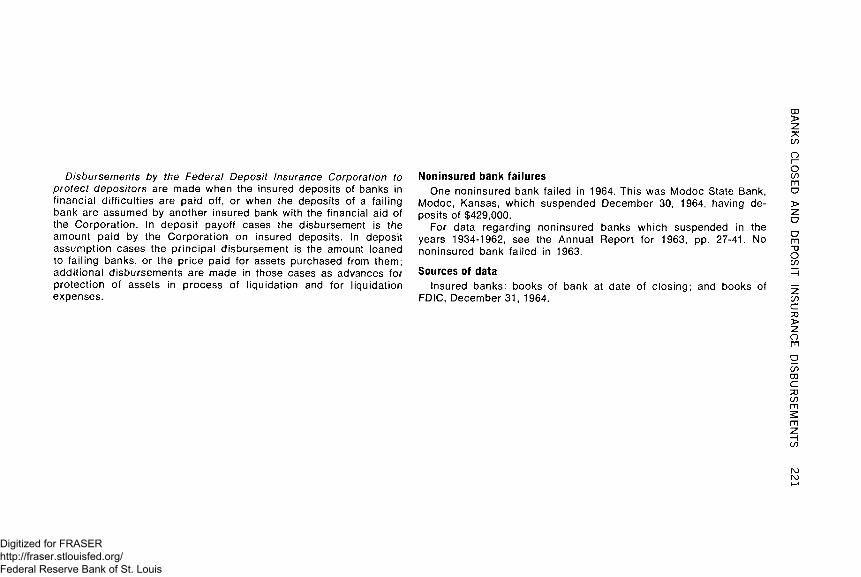
Disbursements by the Federal Deposit Insurance Corporation to protect depositors are made when the insured deposits of banks in financial difficulties are paid off, or when the deposits of a failing bank are assumed by another insured bank with the financial aid of the Corporation. In deposit payoff cases the disbursement is the amount paid by the Corporation on insured deposits. In deposit assumption cases the principal disbursement is the amount loaned to failing banks, or the price paid for assets purchased from them; additional disbursements are made in those cases as advances for protection of assets in process of liquidation and for liquidation expenses.
Noninsured bank failuresOne noninsured bank failed in 1964. This was Modoc State Bank,
Modoc, Kansas, which suspended December 30, 1964, having deposits of $429,000.
For data regarding noninsured banks which suspended in the years 1934-1962, see the Annual Report for 1963, pp. 27-41. No noninsured bank failed in 1963.
Sources of dataInsured banks: books of bank at date of closing; and books of
FDIC, December 31, 1964.
BANKS CLO
SED AND
DEPO
SIT IN
SUR
ANC
E D
ISB
UR
SE
ME
NTS
221
Digitized for FRASER http://fraser.stlouisfed.org/ Federal Reserve Bank of St. Louis
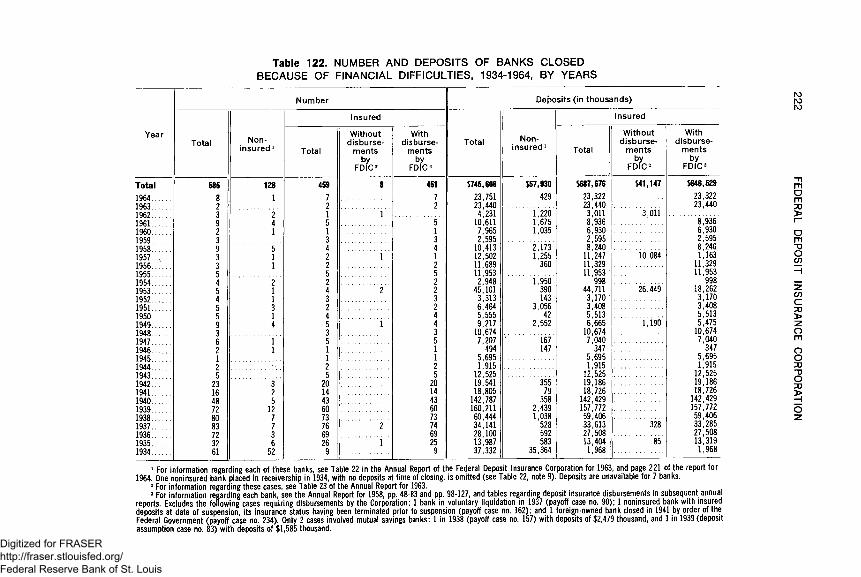
1964.1963.1962.1961.1960.1959.1958.1957.1956.1955.1954.1953.1952.1951.1950.19491948.1947.1946.1945.1944.1943.1942.1941.1940.1939.1938.1937.1936.1935.1934.
i
1964.
Table 122. NUMBER AND DEPOSITS OF BANKS CLOSEDBECAUSE OF FINANCIAL DIFFICULTIES, 1934-1964, BY YEARS
N u m be r D eposits (in th o u sa n d s)
T ota l N o nin su re d 1
Insured
Total
W ith ou td isb u rse
m entsby
FD IC 2
W ithd isb u rse
m entsby
FDIC3
Tota l N onin su re d 1
In sured
Total
W ith o u td is b u rs e
m e n tsby
F D IC 2
W ithd is b u rs e
m e n tsby
F D IC 3
585823923933 545455 9 36 2 1 2 5
231648728083723261
1261
4597215134 2 25 2 43 245 3 5 1 1 2 5
20144360737669269
451725134 1 25 2 23 244 35 1 1 2 5
201443607374 69 259
$745,60623,75123,4404,231
10,6117,9652,595
10,41312,50211,68911,9532,948
45,1013,3136,4645,5559,217
10,6747,207
4945,6951,915
12,52519,54118,805
142,787160,21160,44434,14128,10013,98737,332
$57,930429
1,2201,6751,035
2,1731,255
360
1,950390143
3,05642
2,552
167147
35579
3582,4391,038
528592583
35,364
$687,67623,32223,4403,0118,9366,9302,5958,240
11,24711,32911,953
99844,7113,1703,4085,5136,665
10,6747,040
3475,6951,915
12,52519,18618,726
142,429157,77259,40633,61327,50813,4041,968
$41,147
3,011
$646,52923,32223,440
10,(
26,449
U 9 0 '
328
85
8,9366,9302,5958,2401,163
11,32911,953
99818,2623,1703,4085,5135,475
10,6747,040
3475,6951,915
12,52519,18618,726
142,429157,77259,40633,28527,50813,319
1,968
iformation regarding each of these banks, see Table 22 in the Annual Report of the Federal Deposit Insurance Corporation for 1963, and page 221 jof the report for oninsured bank placed in receivership in 1934, with no deposits at time of closing, is omitted (see Table 22, note 9). Deposits are unavailable for 7 banks, formation regarding these cases, see Table 23 of the Annual Report for 1963. formation r “ ‘ *■ - * •«ludest date cernment ( r __________case no. 83) with deposits of $1,585 thousand.
222 FEDERAL
DEPOSIT
INSU
RAN
CE
CO
RPO
RA
TION
Digitized for FRASER http://fraser.stlouisfed.org/ Federal Reserve Bank of St. Louis
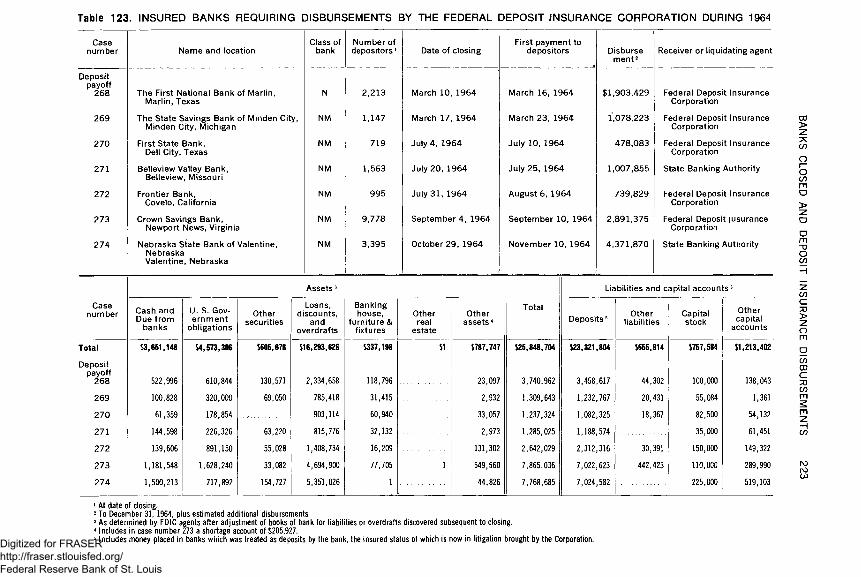
Table 123. INSURED BANKS REQUIRING DISBURSEMENTS BY THE FEDERAL DEPOSIT JNSURANCE CORPORATION DURING 1964
Casen u m b e r N am e and location
Class of bank
N u m be r o f d e p o s ito rs 1 Date o f c los in g
F irs t p a ym e n t to d ep o s ito rs D isburse
m e n t2Receiver o r liq u id a tin g agent
D epositpayo ff
2 6 8 The F irs t N a tion a l B ank o f M arlin , M arlin , Texas
N 2 ,2 1 3 M arch 10, 196 4 M arch 16, 196 4 $ 1 ,9 0 3 ,4 2 9 Federal Deposit Insurance C orpo ra tion
2 6 9 The S tate Savings B ank o f M inden C ity, M inden C ity, M ich igan
NM 1,147 M arch 17, 196 4 M arch 23 , 196 4 1 ,0 7 8 ,223 Federal Deposit Insurance C o rpora tion
2 7 0 F irs t S ta te Bank, Dell C ity, Texas
NM 719 Ju ly 4, 1 96 4 J u ly 10, 1964 4 7 8 ,0 8 3 Federal Deposit Insurance C o rpo ra tion
271 Belleview Va lley Bank, Be lleview , M issouri
NM 1,563 Ju ly 20 , 196 4 Ju ly 25 , 196 4 1 ,0 0 7 ,8 5 5 S ta te B anking A u th o rity
272 F ro n tie r Bank, Covelo, C a lifo rn ia
NM 9 95 Ju ly 31 , 1964 A u g u s t 6, 1964 7 3 9 ,8 2 9 Federal D eposit Insurance C orpora tion
2 73 Crown Savings Bank, N e w p o rt News, V irg in ia
NM 9 ,7 7 8 S e ptem ber 4 , 1964 S e ptem ber 10, 1964 2 ,8 9 1 ,3 7 5 Federal Deposit |usurance C orpora tion
2 7 4 N ebraska S tate B ank o f Va lentine , N ebraskaV a le n tin e , N e bra ska
NM 3 ,3 9 5 O ctober 2 9 , 196 4 N o ve m b e r 10, 1 96 4 4 ,3 7 1 ,8 7 0 S ta te B a nking A u th o rity
A s s e ts 3 L iab ilities and cap ita l a c c o u n ts 3
Casen u m b e r Cash and
Due fro m b anks
U. S. Gove rn m e n t
o b lig a tio n s
O thersecurities
Loans,d iscounts,
ando ve rd ra fts
Banking house,
fu rn itu re & fix tu re s
O therreal
esta te
O ther a s s e ts 4
Total
D e p o s its5O ther
lia b ilitie sCapita lstock
O thercapita l
accounts
Total $3,651,148 $4,573,306 $505,678 $16,293,626 $337,198 $1 $787,747 $25,848,704 $23,321,804 $555,914 $757,584 $1,213,402
D epositpayo ff
2 6 8 522,996
100,828
610,844
320,000
130,571
69,050
2,334,658
785,418
118,796
31,415
23,097
2,932
3,740,962
1,309,643
3,458,617
1,232,767
44,302
20,431
100,000
55,084
138,043
1,3612 69
27 0 61,359
144,598
139,606
1,181,548
178,854
226,326
891,150
1,628,240
903,114
815,776
1,408,734
4,694,900
60,940
32,132
16,209
77,705
33,057
2,973
131,302
549,560
1,237,324
1,285,025
2,642,029
7,865,036
1,082,325
1,188,574
2,312,316
7,022,623
18,367 82,500
35,000
150.000
110.000
54,132
61,451
149,322
289,990
271 63,220
55,028
33,082
272 30,391
442,423273 1
2 7 4 1,500,213 717,892 154,727 5,351,026 1 44,826 7,768,685 7,024,582 225,000 519,103
1 At date of closing.2 To December 31,1964, plus estimated additional disbursements.3 As determined by FDIC agents after adjustment of books of bank for liabilities or overdrafts discovered subsequent to closing.4 Includes in case number 273 a shortage account of $205,927.5 Includes money placed in banks which was treated as deposits by the bank, the insured status of which is now in litigation brought by the Corporation.
BANKS CLOSED
AND DEPO
SIT IN
SUR
ANC
E D
ISBUR
SEMEN
TS 223
Digitized for FRASER http://fraser.stlouisfed.org/ Federal Reserve Bank of St. Louis
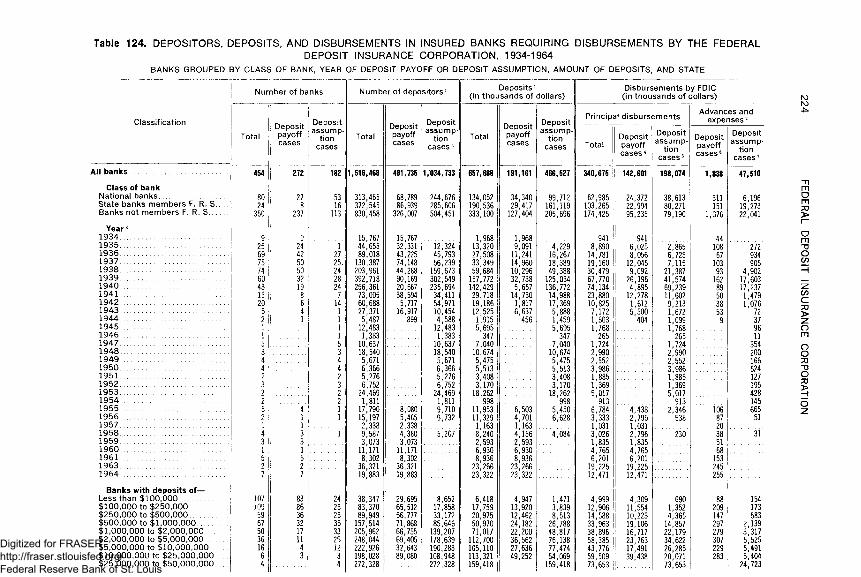
Table 124. DEPOSITORS, DEPOSITS, AND DISBURSEMENTS IN INSURED BANKS REQUIRING DISBURSEMENTS BY THE FEDERALDEPOSIT INSURANCE CORPORATION, 1934-1964
BANKS GROUPED BY CLASS OF BANK, YEAR OF DEPOSIT PAYOFF OR DEPOSIT ASSUMPTION, AMOUNT OF DEPOSITS, AND STATE
Classifica tion
All banks
Class of bankNational b a n k s ............................State banks m em b ers F. R. S. Banks not m em bers F. R. S.. .
Year81 9 3 4 ...1 9 3 5 ...1 9 3 6 ...1 9 3 7 ...1 9 3 8 ...1 9 3 9 ...1 9 4 0 ...1 9 4 1 ...1 9 4 2 ...1 9 4 3 ...1 9 4 4 ...1 9 4 5 ...1 9 4 6 ...1 9 4 7 ...1 9 4 8 ...1 9 4 9 ...1 9 5 0 ...1 9 5 1 ...1 9 5 2 ...1 9 5 3 ...1 9 5 4 ...1 9 5 5 ...1 9 5 6 ...1 9 5 7 ...1 9 5 8 ...1 9 5 9 ...1 9 6 0 ...1 9 6 1 ...1 9 6 3 ...1 9 6 4 ...
Banks with deposits of—Less than $ 1 0 0 ,0 0 0 ..................$1 0 0 ,0 0 0 to $ 2 5 0 ,0 0 0 .............$ 2 5 0 ,00 0 to $ 5 0 0 ,0 0 0 .............$ 5 0 0 ,0 0 0 to $ 1 ,0 0 0 ,0 0 0 .........$ 1 ,0 0 0 ,0 0 0 to $ 2 ,0 0 0 ,0 0 0 . $ 2 ,0 0 0 ,0 0 0 to $5 ,0 0 0 ,0 0 0 . $5 ,0 0 0 ,0 0 0 to $1 0 ,0 0 0 ,0 0 0 $1 0 ,0 0 0 ,0 0 0 to $2 5 ,0 0 0 ,0 0 0 . $2 5 ,0 0 0 ,0 0 0 to $ 5 0 ,0 0 0 ,0 0 0 .
N um ber o f banks
24350
107109596750361664
Depositpayoffcases
272
278
237
Depositassum p
tioncases
182
5316
113
4 111
1
3 131527
83 2486 2336 2332 3517 3311 254 123 3
4
Num ber o f dep o s ito rs1
Total
1,516,468
313,465372,545830,458
15,76744,65589,018
130,387203,961392,718256,36173,00560,68827,3715,487
12,4831,383
10,63718,5405,6716,3665,2766,752
24,4691,811
17,79015,1972,3389,5873,073
11,1718,302
36,32119,883
38,34783,37089,949
157,514205,962248,044222,926198,028272,328
Depositpayoffcases
481,735
68,78986,939
326,007
15,76732,33143,22574,14844,28890,16920,66738,5945,717
16,917
5,4652,3384,3803,073
11,1718,302
36,32119,883
29,69565,51256,77771,86866,75569,40532,643
Depositassum p
tioncases3
1,034,733
244,676285,606504,451
12,32445,79356,239
159,673302,549235,69434,41154,97110,4544,588
12,4831,383
10,63718,5405,6716,3665,2766,752
24,4691,8119,7109,732
5,207
8,65217,85833,17285,646
139,207178,639190,283108,948272,328
D e posits1 (in thousands o f dollars)
Total
657,688
134,052190,536333,100
1,96813,32027,50833,34959,684
157,772142,42929,71819,18612,5251,9155,695
3477,040
10,6745,4755,5133,4083,170
18,262998
11,95311,3291,1638,2402,5936,9308,936
23,26623,322
6,41817,75920,97550,97071,017
112,700105,110113,321159,418
Depositpayoffcases
191,161
34,34029,417
127,404
1,9689,091
11,24114,96010,29632,7385,657
14,7301,8176,637
456
6,5034,7011,1634,1562,5936,9308,936
23,26623,322
4,94713,92012,46224,18222,20036,56227,63649,252
Depositassum p
tioncases
466,527
99,712161,119205,696
4,22916,26718,38949,388
125,034136,77214,98817,3695,8881,4595,695
3477,040
10,6745,4755,5133,4083,170
18,262998
5,4506,628
4,084
1,4713,8398,513
26,78848,81776,13877,47464,069
159,418
Disbursem ents by FDIC (in thousands o f dollars)
Principal d isbursem ents
Total
340,675
62,985103,265174,425
9418,890
14,78119,16030,47967,77074,13423,88010,8257,1721,5031,768
2651,7242,9902,5523,9861,8851,3695,017
9136,7843,3331,0313,0261,8354,7656,201
19,22512,471
4,99912,90614,58833,96338,89658,38543,77659,50973,653
Depositpayoffcases4
142,601
24,37222,99495,235
9416,0258,056
12,0459,092
26,1964,895
12,2781,6125,500
404
4,4382.795 1,0312.796 1,835 4,765 6,201
19,22512,471
4,30911,55410,22319,10616,71723,76317,49139,438
Depositassum p
tioncases5
198,074
38,61380,27179,190
2,8656,7257,115
21,38741,57469,23911,6029,2131,6721,0991,768
2651,7242,9902,5523,9861,8851,3695,017
9132,346
538
230
6901,3524,365
14,85722,17934,62226,28520,07173,653
Advances and expenses2
Depositpayoffcases6
1,838
311151
1,376
4410867
10393
162895038539
1068720385168
153245255
209147297279307229283
Depositassum p
tionc ases7
47,510
6,19619,27322,041
272934905
4,90217,60317,2371,4791,076
72379611
35420016652412719542814566551
31
154173583
2,1393,3175,5255,4915,404
24,723
224 FEDERAL
DEPOSIT INSURANCE
CO
RPO
RATIO
N
Digitized for FRASER http://fraser.stlouisfed.org/ Federal Reserve Bank of St. Louis
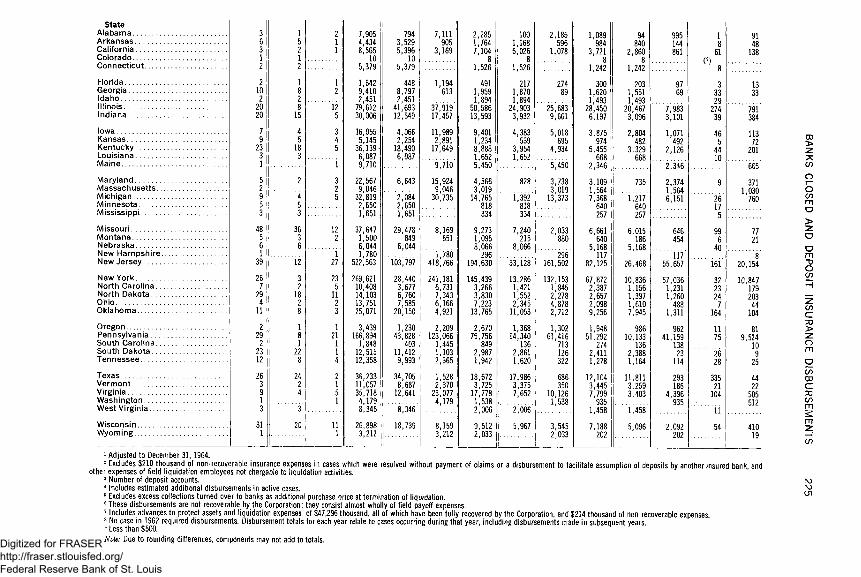
StateA la b a m a..............A rka n sa s............C a lifo rn ia ............C o lorado..............C o n n e cticu t.......
F lorida ..................G eorgia................Id a h o ....................I llin o is ..................In d ia n a ................
Iow a......................Kansas................K e n tu cky ............Lou is iana............M a ine ...................
M a ry la n d ............M a ssa ch u se tts ..M ich igan.............M in n e so ta ..........M iss iss ipp i.........
M isso u ri..............M o n tana ..............N e b ra ska ............New H am psh ire New Je rse y ........
New Y o rk ............North C a ro lin a .. N orth D a ko ta .. .O h io ......................O k lahom a...........
O regon.................P e nnsylvan ia . . . South C a ro lin a .. South D a ko ta . . . T ennessee..........
Texas....................V e rm o n t..............V irg in ia ................W ash ing ton ........W est V irg in ia ....
W isconsin ...........W yom ing .............
3 1 2 7,905 794 7,111 2,285 100 2,185 1,089 94 995 1 91b 5 1 4,434 3,529 905 1,764 1,168 596 984 840 144 8 486 2 1 8,565 5,396 3,169 7,104 6,026 1,078 3,721 2,860 861 61 1381 1 10 10 8 8 8 8 (9)2 2 5,379 5,379 1,526 1,526 1,242 1,242 8
2 1 1 1,642 448 1,194 491 217 274 300 203 97 3 1310 8 2 9,410 8,797 613 1,959 1,870 89 1,620 1,551 69 33 332 2 2,451 2,451 1,894 1,894 1,493 1,493 29
20 8 12 79,612 41,693 37,919 50,586 24,903 25,683 28,450 20,467 7,983 274 79120 15 5 30,006 12,549 17,457 13,593 3,932 9,661 6,197 3,096 3,101 39 384
7 4 3 16,055 4,066 11,989 9,401 4,383 5,018 3,875 2,804 1,071 46 1139 5 4 5,145 2,254 2,891 1,234 539 695 974 482 492 5 72
23 18 5 36,139 - 18,490 17,649 8,888 3,954 4,934 5,455 3,329 2,126 44 2013 3 6,087 6,087 1,652 1,652 668 668 101 1 9,710 9,710 5,450 5,450 2,346 2,346 665
5 2 3 22,567 6,643 15,924 4,566 828 3,738 3,109 735 2,374 9 3712 2 9,046 9,046 3,019 3,019 1 564 1 564 1 0309 4 5 32,819 2,084 30,735 14,765 1,392 13,373 7,368 1,217 6* 151 26 ’ 7605 5 2,650 2,650 818 818 640 640 173 3 1,651 1,651 334 334 257 257 5
48 36 12 37,647 29,478 8,169 9,273 7,240 2,033 6,661 6,015 646 99 775 3 2 1,500 849 651 1,095 215 880 640 186 454 6 216 6 6,044 6,044 8,066 8,066 5,168 5,168 401 1 1,780 1,780 296 296 117 117 8
39 12 27 522,563 103,797 418,766 194,630 33,128 161,502 82,125 26,468 55,657 161 20,154
26 3 23 269,621 28,440 241,181 145,439 13,286 132,153 67,872 10,836 57,036 32 10,8477 2 5 10,408 3,677 6,731 3,266 1,421 1,845 2,387 1,156 1,231 23 179
29 18 11 14,103 6,760 7,343 3,830 1,552 2,278 2,657 1,397 1,260 24 2034 2 2 13,751 7,585 6,166 7,223 2,345 4,878 2,098 1,610 488 7 44
11 8 3 25,071 20,150 4,921 13,765 11,053 2,712 9,256 7,945 1,311 164 104
2 1 1 3,439 1,230 2,209 2,670 1,368 1,302 1,948 986 962 11 8129 8 21 166,894 43,828 123,066 75,756 14,340 61,416 51,292 10,133 41,159 75 9,5242 1 1 1,848 403 1,445 849 136 713 274 136 138 10
23 22 1 12,515 11,412 1,103 2,987 2,861 126 2,411 2,388 23 26 912 8 4 12,358 9,993 2,365 1,942 1,620 322 1,278 1,164 114 28 25
26 24 2 36,233 34,705 1,528 18,672 17,986 686 12,104 11,811 293 335 443 2 1 11,057 8,687 2,370 3,725 3,375 350 3,445 3,259 186 21 229 4 5 35,718 12,641 23,077 17,778 7,652 10,126 7,799 3,403 4,396 104 5051 1 4,179 4,179 1,538 1,538 935 935 5123 3 8,346 8,346 2,006 2,006 1,458 1,458 11
31 20 11 26,898 18,739 8,159 9,512 5,967 3,545 7,188 5,096 2,092 54 4101 1 3,212 3,212 2,033 2,033 202 202 19
1 Adjusted to December 31,1964.2 Excludes $210 thousand of non-recoverable insurance expenses in cases which were resolved without payment of claims or a disbursement to facilitate assumption of deposits by another insured bank and
other expenses of field liquidation employees not chargable to liquidation activities.3 Number of deposit accounts.4 Includes estimated additional disbursements in active cases.5 Excludes excess collections turned over to banks as additional purchase price at termination of liquidation.6 These disbursements are not recoverable by the Corporation; they consist almost wholly of field payoff expenses.7 Includes advances to protect assets and liquidation expenses of $47,296 thousand, all of which have been fully recovered by the Corporation, and $214 thousand of non-recoverable expenses.8 No case in 1962 required disbursements. Disbursement totals for each year relate to cases occurring during that year, including disbursements made in subsequent years.9 Less than $500.Note: Due to rounding differences, components may not add to totals.
BANKS CLOSED
AND DEPOSIT
INSURANCE D
ISBUR
SEMEN
TS 225
Digitized for FRASER http://fraser.stlouisfed.org/ Federal Reserve Bank of St. Louis
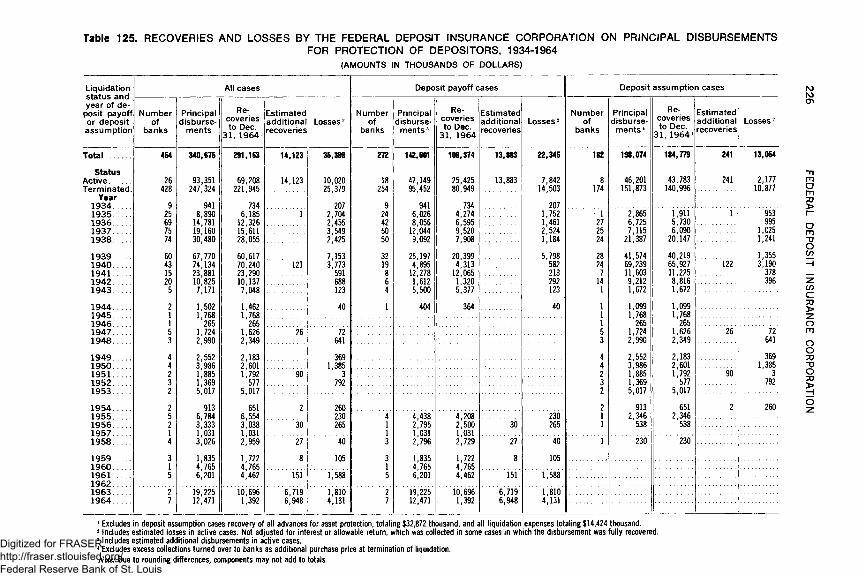
Table 125. RECOVERIES AND LOSSES BY THE FEDERAL DEPOSIT INSURANCE CORPORATION ON PRINCIPAL DISBURSEMENTSFOR PROTECTION OF DEPOSITORS, 1934-1964
(AMOUNTS IN THOUSANDS OF DOLLARS)
Liquidation status and year of de
posit payoff or deposit assumption
All cases Deposit payoff cases Deposit assumption cases
Numberof
banks
Principald isburse
ments
Recoveries to Dec.
3 1 ,1 9 6 4 '
Estimatedadditionalrecoveries
Losses2Number
ofbanks
Principal disburse
ments 3
Recoveries to Dec.
31, 1964
Estimatedadditionalrecoveries
Losses2Number
ofbanks
Principaldisburse
m ents4
Recoveries to Dec.
3 1 ,1 9 6 4 1
Estimatedadditionalrecoveries
Losses2
Total........... 454 340,675
93,351247,324
941
291,153 14.123
14.123
35,399
10,02025,379
207
272 142,601 106,374 13,883 22,345 182 198,074 184,779 241 13,054
StatusActive .......... 26 69,208
221,945
734
18 47,14995,452
941
25,42580,949
734
13,883 7,84214,503
207
8 46,201 43,783 241 2,177428 254 174 151,873 140,996 10,877
Year1934 9 91935 25 8,890
14,78119,16030,480
67,77074,13423,88110,8257,171
1,5021,768
265
6,18512,32615,61128,055
60,61770,24023,29010,1377,048
1,4621,768
265
1 2,7042,4553,5492,425
7,1533,773
591
24 6,0268,056
12,0449,092
26,1974,895
12,2781,6125,500
404
4,2746,5959,5207,908
1,7521,4612,5241,184
5,798582
• 1 2,8656,7257,115
21,387
41,57469,23911,6039,2121,672
1,0991,768
1,9115,730
1 9531936. .. 69 42 27 9951937 75 50 25 6,090
20,1471,025
1 93 8 .. .. 74 50 24 1,241
1939 60 32 20,3994,313
12,0651,3205,377
364
28 40,21965,927
1,3551940 43 121 19 24 122 3,1901941 15 8 213 7 11,225
8,816378
1942 20 688 6 292 141
3961943 5 123 4 123 1,672
1,0991,768
1944 2 40 1 40 111945 1
1946 1 1 265 2651947 5 1,724
2,990
2,5523,9861,8851,3695,017
1,6262,349
2,1832,6011,792
577
26 72 5 1,724 1,626 26 721948 3 641 3 2,990
2,5523,9861,885
2,349 641
1949 4 369 4 2,1832,601
3691950 4 1,385
34 1,385
1951 2 90 2 1,792 90 31952 3 792 3 1,369 577 7921953 2 5,017
651
2 5,017
913
5,017
6511954 2 913 2 260 2 2 2601955 5 6,784
3,3331,0313,026
1,8354,7656,201
6,5543,0381,0312,959
1,7224,7654,462
230 4 4,4382.795 1,0312.796
1,8354,7656,201
4,2082,5001,0312,729
1,7224,7654,462
230 1 2,346538
2,3465381956 2 30 265 1 30 265 1
1957 1 11958 4 27
8
40
105
3 27
8
40 1 230 230
1959 3 3 1051960 1 11961 5 151 1,588 5 151 1,58819621963 2 19,225
12,47110,6961,392
6,7196,948
1,8104,131
2 19,22512,471
10,6961,392
6,7196,948
1,8104,1311964 7 7
1 Excludes in deposit assumption cases recovery of all advances for asset protection, totaling $32,872 thousand, and all liquidation expenses totaling $14,424 thousand.2 Includes estimated losses in active cases. Not adjusted for interest or allowable return, which was collected in some cases in which the disbursement was fully recovered.3 Includes estimated additional disbursements in active cases.4 Excludes excess collections turned over to banks as additional purchase price at termination of liquidation.Note: Due to rounding differences, components may not add to totals.
226 FEDERAL
DEPOSIT
INSU
RAN
CE
CO
RPO
RA
TION
Digitized for FRASER http://fraser.stlouisfed.org/ Federal Reserve Bank of St. Louis

INDEX
Digitized for FRASER http://fraser.stlouisfed.org/ Federal Reserve Bank of St. Louis

Digitized for FRASER http://fraser.stlouisfed.org/ Federal Reserve Bank of St. Louis

PageAbsorptions:
Of insured banks requiring disbursements by the Corporation. See Banks in financial difficulties.
Of operating banks, 1964______________________________________136-139Of operating banks approved by the Corporation, 1964_____________ 31-60Regulation of _________________________________________________ 11-12
Accounts in insured banks:
Average size, special call dates, 1936-1964_________________________78-79Fully and partially protected by insurance. See Deposit Insurance
coverage.Number, in all insured banks, November 18, 1964:
By FDIC district and State________________________________ 94-95By size of bank, by population of center, and by class of bank___ 96-97By type of account_______________ ________________________96-97In banks grouped by percentage of deposits insured____________ 97In SMSA’s with population over 500,000_______________________ 98-99
Number and percent distribution, insured commercial banks,November 18, 1964:
By class of bank and size of account__________________________ 103By population of center and size of account________________ 102-103By size of account in each State and FDIC district____________ 100-101By size of bank and size of account__________________________ 102By type and size of account_________________________________ 103In banks grouped by percentage of deposits insured, by size of
account _________________________________________________ 103Number and percent distribution, insured mutual savings banks,
November 18, 1964:By population of center and size of account___________________ 121By size of account in each State and FDIC district______________ 121By size of bank and size of account________________________120-121By type and size of account__________________________________ 121In banks grouped by percentage of deposits insured, by size of
account _________________________________________________ 121Number and percent distribution, individual, partnership, and corporation
accounts, insured commercial banks, November 18, 1964:Demand, by size of account in each State and FDIC district___ 104-105Demand, by size of bank and size of account___________________ 108
Savings and time, by size of account in each State and FDICdistrict _______________________________________________106-107
Savings and time, by size of bank and size of account__________ 109
Admission of banks to insurance:
Applicants for, 1964____________________________________________13-14
Different methods followed______________________________________ 13Number of banks admitted, by class of bank, 1964_______________ __ 158
Application from banks____________________ _______________ ___ _____13-14
INDEX
229
Digitized for FRASER http://fraser.stlouisfed.org/ Federal Reserve Bank of St. Louis

230 FEDERAL DEPOSIT INSURANCE CORPORATION
Areas outside continental United States, banks and branches located in:Assets and liabilities, December 31, 1964_________________________ 176-177Average assets and liabilities, insured commercial banks, 1964____188-189Deposits, December 31, 1964____________________________________ 168-169Earnings, expenses, profits, and dividends, 1964_________________206-207Number, December 31, 1964_______________________ 160, 167-169, 176-177
Assessments for deposit insurance______________________________________ 24-28
Assets, liabilities, and capital of banks (see also Deposits):All banks:
Amounts by type and supervisory status, December 31, 1964______ 134By FDIC district and State, December 31, 1964_________________176-177Capital ratios by type and supervisory status, December 31,
1964 _______________________________________________________ 135In banks grouped according to insurance status and type of• bank, June 30, and December 31, 1964____________________172-175Commercial banks, June 30, and December 31, 1964__________ 172-175Insured banks, June and December call dates, 1961 through
1964 ____________________________________________________ 178-181Insured commercial banks:
Amount, call dates, December 28, 1962 through December31, 1964 ____________________________________________ 182-185
Average for 1964, by class of bank_______________________ 186Average for 1964, by State___________ ___________________ 188-189Percentage distributions, average for 1964, by class of bank___ 186Percentage distributions, December and June call dates,
1962 through 1964___________________________________ 182-185Percentage distributions of totals among size groups of banks,
December 31, 1964________ _________________________151, 187Ratio of selected items to total assets, by size of bank, De
cember 31, 1964________ ____________________________ 190-191Insured mutual savings banks:
Amount, and percentage distributions, December and Junecall dates, 1962 through 1964_______________________ __182-185
Major categories, average, 1956-1964_______________________ 217Mutual savings banks:
Amount and percentage distribution, December 31, 1964______ 148Banks grouped by insurance status, June 30, and December
31, 1964 ............. ......... ...................................................................172-175Sources of data_______________________________________ 171, 193, 221
Assets and liabilities of the Federal Deposit Insurance Corporation____23-24
Assets pledged to secure bank obligations_______________________ 181, 185
Assets purchased by the Federal Deposit Insurance Corporation from banks in financial difficulties__________________________________12, 221
Assumption of deposits of insured banks with financial aid of the Corporation (see also Banks in financial difficulties)____________ 14-15, 221
Digitized for FRASER http://fraser.stlouisfed.org/ Federal Reserve Bank of St. Louis

PageAttorney General of the United States, summary reports on absorp
tions _________________________________________________________ 31-60Audit of the Federal Deposit Insurance Corporation_________________ 29
Bad-debt reserves. See Valuation reserves.Bank supervision. See Supervision of banks; Examination of insured
banks.Banking offices, number of. See Number of banks and branches.Bank practices. See Unsafe and unsound banking practices.Banks, applications from, acted on by the Federal Deposit Insurance
Corporation ____________________________________________________ 13-14Banks, concentration and location of banking facilities____________ 139-147Banks in financial difficulties:
Insured banks requiring disbursements by the Corporation:Deposit size of___________________________________________ 224Deposits protected, 1934-1964..................................3-12, 222, 224-225Disbursements by the Corporation, 1934-1964__________ 7, 221-226Loans made and assets purchased by the Corporation________ 12Location by State, 1934-1964______________________________ 225Losses incurred by the Corporation___________________ 7, 12, 226Losses incurred by depositors_____________ ____ _____ ______ 5-12Name and location of, 1964.___________________________10, 223Number of, 1934-1964............... ........... .......... ......................... 11-12, 222Number of deposit accounts, 1934-1964..................................224-225Recoveries by the Corporation on assets acquired, 1934-
1964 ____ __ ______ ____ ________ _____ ___ ____________12, 226Noninsured banks:
Deposits of commercial banks closed, by year, 1934-1964........ 222Sources of data___________________________________________ 221Suspensions, 1964 ______________________________ _____ ___ 158Suspensions of noninsured banks, 1964_______________ _____ 221
Banks, number of. See Number of banks and branches.Banks operating branches, December 31, 1964_____________________160-167Banks, size of largest banks according to branch banking status, banks
grouped by large metropolitan areas, June 30, 1964__________ __ .142-143Banks, size of largest banks according to branch banking status, banks
grouped by State, December 31, 1964____________________________ 141Board of Directors of the Federal Deposit Insurance Corporation. See
Federal Deposit Insurance Corporation.Board of Governors of the Federal Reserve System. See Federal Reserve
Authorities.Branches (See also Number of banks and branches):
Establishment approved by Federal Deposit Insurance Corporation,1964 ____ ___ _____ _______ ______ _________ _________________13-14
INDEX 231
Examination of, 1963 and 1964_______Increase, branches of all banks, 1964.
...... 16136, 159
Digitized for FRASER http://fraser.stlouisfed.org/ Federal Reserve Bank of St. Louis
232 FEDERAL DEPOSIT INSURANCE CORPORATION
Page
Business and personal deposits. See Deposits (items referring to type of account).
Call reports. See Assets, liabilities, and capital of banks; Reports from banks.
Capital of banks. See Assets, liabilities, and capital of banks; Banks in financial difficulties; Income of insured commercial banks; Examination of insured banks.
Charge-offs by banks. See Income of insured commercial banks; income of insured mutual savings banks; Valuation reserves.
Class of bank, banking data presented by:
Admissions to and terminations of insurance__________________ 158
Assets and liabilities of all banks______________________________133Deposits, December 31, 1964_________________________________ 135Income of insured commercial banks, 1964_________________ 198-199Insured banks requiring disbursements by the Corporation, 1934-
1964 _____________________________________________________ 224Number of banks and banking offices, 1964_____________ 133, 158-169Ratios of income of insured commercial banks, 1964________ 200-201
Classification of banks_______________________________ 133-135, 156-157
Closed banks. See Banks in financial difficulties.Commercial banks. See Assets, liabilities, and capital of banks; De
posit insurance coverage; Deposits; Income of insured commercialbanks; Number of banks and branches.
Comptroller General of the United States__________________________ 29Comptroller of the Currency______________________IV, V, 8, 13, 22, 134-135
Consolidations. See Absorptions.Credit, bank. See Assets, liabilities, and capital of banks.
Demand deposits. See Assets, liabilities, and capital of banks; Deposits (items referring to type of account).
Deposit insurance coverage:
Accounts fully and partially protected, November 18, 1964:Number and proportion of, all insured banks, banks grouped by size,
by percentage of deposits insured, by population of center, andby class, and accounts grouped by type____________________ 96-97
Number and proportion of, all insured banks, by FDIC district andState __________________________________________________94-95
Number and proportion of, SMSA’s with population over 500,000 _ 98-99
Accounts fully protected:Definition of _____________________________________________ 89-90
Difference from depositors fully protected____________________ 90Number of, all insured banks, banks grouped by size, by per
centage of deposits insured, by population of center, and byclass; and accounts grouped by type, November 18, 1964_____ 96-97
Special call dates, 1936, 1945, 1955, and 1964_________________ 77-78
Special call, November 18, 1964_______________________________ 77
Digitized for FRASER http://fraser.stlouisfed.org/ Federal Reserve Bank of St. Louis
INDEX 233
Deposit insurance coverage— Continued PageAccounts fully protected, number and proportion, comparison with
assumed coverages of $25,000 and $100,000 November 18, 1964:By type of account, insured commercial banks_________________ 127By type of account, insured mutual savings banks___________ 129Discussion of______________________________________________87-88Insured commercial banks, by FDIC district and State_________ 124-125Insured commercial banks, by size of bank, by population of center,
and by class of bank__________________________________ 126-127Insured commercial banks grouped by percentage of deposits
insured _________________________________________________ 127Insured mutual savings banks, banks grouped by FDIC district, by
State, by size of bank, by population of center, and by percent ofdeposits insured, November 18, 1964______________________128-129
Banks grouped by percent of deposits insured, comparison withassumed coverages of $25,000 and $100,000 November 18, 1964___ 130
Deposits insured:
Amount of, all insured banks, grouped by size, by percentage of deposits insured, by population of center, by class, and accounts grouped by type, November 18, 1964_______________ 96-97
Definition o f________________________________________________ 90
Special call dates, 1936, 1945, 1955, and 1964_________________ 77-81Special call, November 18, 1964_______________________________ 77Types o f___________________________________________________ 78
Deposits insured, amount and proportion, comparison with assumed coverages of $25,000 and $100,000, November 18, 1964:
By type of account, insured commercial banks_________________ 127
By type of account, insured mutual savings banks______________ 129Insured commercial banks, by FDIC district and State___ _____124-125Insured commercial banks, by size of bank, by population of
center, and by class of bank_____________________________126-127Insured commercial banks grouped by percentage of deposits
insured ________________________________________________ 127Insured mutual savings banks, banks grouped by FDIC district,
by State, by size of bank, by population of center, and by percent of deposits insured, November 18, 1964____________________128-129
Deposits insured and uninsured, November 18, 1964:Amount and proportion of, all insured banks, banks grouped by size,
by percentage of deposits insured, by population of center, and by class, and accounts grouped by type____________________ 96-97
Amount and proportion of, all insured banks, by FDIC district and State __________________________________________________94-95
Amount and proportion of, cities with population over 500,000, bycity ____________________________________________________ 99
Instructions and form, special call for deposit information, November18, 1964 ___________________________________________________ 91-92
Depositors (See also Accounts in insured banks):Claims against closed insured banks. See Banks in financial difficulties.
Digitized for FRASER http://fraser.stlouisfed.org/ Federal Reserve Bank of St. Louis
234 FEDERAL DEPOSIT INSURANCE CORPORATION
Depositors (See also Accounts in insured banks)— Continued PageLosses. See Banks in financial difficulties.Number of, difference from number of accounts_____________________ 90Protected in insolvent or hazardous banks suspended or absorbed. See
Banks in financial difficulties.
Deposit insurance national banks______________________________________ 10
Deposits:All banks:
By insurance status of bank and type of account, December 31,1964 _____________________________________________________ 175
By insurance status of bank and type of account, June 30, 1964___ 173By supervisory status and insurance status, December 31, 1964___ 135By type of account in each State and FDIC district, December 31,
1964 ___________________________________________________176-177By type of bank and insurance status, December 31, 1964_________ 135By type of bank in each State and FDIC district, December 31,
1964 ___________________________________________________168-169
All insured banks:By FDIC district and State, November 18, 1964________________ 94-95By percent of deposits insured and type of account, November 18,
1964 ___________________________________________________96-97
By size of bank, population center, and by class and type of bank,November 18, 1964_______________________________________96-97
By Standard Metropolitan Statistical Area and City, November 18,1964 ___________________________________________________98-99
By type of account, December 31, 1964________________________ 175By type of account, call dates, June 30, 1961, through December
31, 1964 _______________________________________________ 180Ratios of deposit insurance fund to, 1934-1964_____________ 24n, 28
Commercial banks:By FDIC district and State, December 31, 1964______________ 168-169By proportion of total deposits held by the largest banks, December
31, 1964 ________________________________________________ 140
By type of account, December 31, 1964________________________ 175
By type of account, June 30, 1964_____________________________ 173
Insured banks requiring disbursements by the Corporation. See Banks in financial difficulties.
Insured commercial banks:By type of account, call dates, December 31, 1962, through Decem
ber 31, 1964_____________________________________________ 182Percentage distributions of selected totals among size groups of
banks, December 31, 1964_________________________________ 187
Insured mutual savings banks:By FDIC district and State, December 31, 1964______________ 168-169
By type of account, call dates, December 28, 1962, through December 31, 1964_____________________________________________ 182
Interest and dividends on, 1956-1964__________________________ 216
Digitized for FRASER http://fraser.stlouisfed.org/ Federal Reserve Bank of St. Louis
INDEX 235
Deposits— Continued PageLargest commercial banks:
By selected metropolitan area and character of branch system___ 142
By State and character of branch system_____________________ 141United States______________________________________________ 140
Mutual savings banks:By FDIC district and State, December 31, 1964______________ 168-169By type of account, June 30, and December 31, 1964_________ 173, 175
Noninsured banks:By FDIC district and State, December 31, 1964_______________ 168-169By type of account and type of bank, June 30, and December 31,
1964 _______________________________________________173, 175
Percent distribution of, insured commercial banks:By size of account in each State and FDIC district, November 18,
1964 _________________________________________________110-111By size of account and with banks grouped by FDIC district, by
State, by size of bank, by population of center, and by percentof deposits insured, November 18, 1964____________________110-113
By type and size of account, November 18, 1964_______________ 113
Percent distribution of, insured mutual savings banks:By size of account, and with banks grouped by FDIC district, by
State, by size of bank, by population of center, and by percentof deposits insured, November 18, 1964__________________ 122-123
By type and size of account, November 18, 1964_______________ 123
Percent distribution of, in individual, partnership, and corporation accounts, insured commercial banks:
Demand, by size of account in each State and FDIC district,November 18, 1964_____________________________________114-115
Demand, by size of bank and size of account, November 18, 1964 ... 118
Savings and time, by size of account in each State and FDIC district, November 18, 1964________________________________116-117
Savings and time, by size of bank and size of account, November 18, 1964_________________________________________________ 119
Sources of data________________________________________________ 171
State legislation_____ __________________________________________67-73
Deposits, insured by FDIC, 1934-1964.......... ................ ........................................ 28
Directors of the Federal Deposit Insurance Corporation. See Federal Deposit Insurance Corporation.
Disbursements. See Banks in financial difficulties.
Disclosure of information by banks (see also Legislation relating to deposit insurance and banking; Federal Deposit Insurance Corporation rules and regulations) ____________________________________________________18, 20
Dividends:To depositors in insured mutual savings banks______ 153-154, 216, 218-219To stockholders of insured commercial banks. See Income of insured
commercial banks.
Digitized for FRASER http://fraser.stlouisfed.org/ Federal Reserve Bank of St. Louis
236 FEDERAL DEPOSIT INSURANCE CORPORATION
Page
Earnings of banks. See Income of insured commercial banks; Income ofinsured mutual savings banks.
Educational program for bank examiners_______________________________ 23Employees:
Federal Deposit Insurance Corporation____________________________22-23
Insured commercial banks:Distribution by deposit size of bank, 1964______________________ 151Number and compensation, 1955-1964_______________________194-197Number and compensation, by class of bank, by size of bank, and
by State, 1964_________________________198-199, 202-203, 206-215Insured mutual savings banks, number and compensation_________ 216-217State legislation ______________________________________________ 67-73
Examination of insured banks:Banks examined by the Federal Deposit Insurance Corporation,
1964 ________________________________________________ 16, 133-134
Examination school_____________________________________________ 23Examination staff_______________________________________________ VI, 22
Powers granted to supervisory authorities________________________133-134Expenses of banks. See Income of insured commercial banks; Income of in
sured mutual savings banks.Expenses of the Corporation_________________________________________ 25-27
Failures. See Banks in financial difficulties.Federal bank supervisory authorities___________________________ 13-14, 133-135Federal Deposit Insurance Act. (see also Legislation relating to deposit in
surance and banking) _______________________________________________ 24nFederal Deposit Insurance Corporation:
Assessments on insured banks_____________________________________ 23-27Assets __________________________________________________________ 23-24Audit _____________________________________________________________ 29Banks examined by, and submitting reports to________________ 16, 133-135Board of Directors, actions on applications and banking practices_____13-18Borrowing power _________________________________________________ 24nCapital stock _____________________________________________________ 24nCoverage of deposit insurance, banks participating____8, 77, 78, 133, 158-167Deposit insurance fund (surplus)________________________________24n, 23-29Directors (members of the Board)________________________________V, 21-22Disbursements for protection of depositors______________ 5-7, 9-12, 221-226Districts __________________________________________________________ VIDivisions ________________________________________________________ IV, 22Educational program for bank examiners___________________________ 23Employees ______________________________________________________ 21-22Examination of banks____________________________________ VI, 16, 133-134Financial statements______________________________________________ 24-25Income and expenses, 1933-1964___________________________________ 27
Digitized for FRASER http://fraser.stlouisfed.org/ Federal Reserve Bank of St. Louis
INDEX 237
Federal Deposit Insurance Corporation— Continued Page
Income and expenses, 1964______ _____________________________ 25-27Insured banks requiring disbursements by. See Banks in financial diffi
culties.Liabilities _____________________________________________________23-24Loans to and purchase of assets from insured banks________ 221, 224-225Losses incurred, 1934-1964__________________________________7, 12, 226
Methods of protecting depositors______________________________9-12, 221Organization and staff_____________________________________IV-VI, 21-23Payments to insured depositors__________________________________ 9-12Protection of depositors___________________________________ 6, 224-225
Recoveries __________________________________________________12, 226Reports from banks__________________________________________17-18, 92Reserve for losses on assets acquired_____________________________ 25Retirement of capital stock of the Corporation__________________8, 24nRules and regulations______________________________________ 20, 66-67
Sources and uses of funds_______________________________________ 26Supervisory activities___________________________________13-18, 133-136
Federal Deposit Insurance Corporation districts, banking data classified by:All banks:
Assets and liabilities, December 31, 1964______________________ 176Number and deposits, by type of bank, December 31, 1964______ 168
Federal Reserve authorities_____________________________________13, 133-135Federal Reserve member banks. See Class of bank, banking data pre
sented by.
General Accounting Office__________________________________________ 29Government deposits. See Deposits (items referring to type of account).
Income of the Federal Deposit Insurance Corporation___________________ 25-28Income of insured commercial banks:
Amounts of principal components:Annually, 1956-1964______________________________________194-195By class of bank, 1964____________________________________198-199By size of bank, 1964_____________________________________202-203By State, 1964__________________________________________ 206-215
Charge-offs and recoveries, 1955-1964___________________________194-195
Income, sources and disposition of total, 1964___________________ 150-152Profits, 1956-1964 ___________________________________________194-195
Profits, 1964____________________________________193, 198-199, 202-203Rates of income on assets, 1956-1964__________________________ 196-197
Rate of net profit on total capital accounts, 1964___________ 193, 200, 205
Ratios of income items:Annually, 1956-1964______________________________________196-197
By class of bank, 1964___________________________________ 200-201By size of bank, 1964____________________________________ 204-205
Sources and disposition of total, 1962-1964____________________ 151
Digitized for FRASER http://fraser.stlouisfed.org/ Federal Reserve Bank of St. Louis
238 FEDERAL DEPOSIT INSURANCE CORPORATION
Income of insured commercial banks— Continued PageRatios of expense items_____________________ 153, 196, 200-201, 204-205Revision of report of income and dividends_________________________ 193Selected operating ratios, 1950-1964______________________________ 153Sources of data_________________ ______________________________ 193
Income of insured mutual savings banks:Amounts of principal components, 1962-1964___________________ 216-217
Income, sources and disposition of total, 1963-1964________________ 154
Rates of income on assets, 1956-1964_____________________________ 218Ratios of expense items_______________________________________218-219Ratios of income items________________________________________218-219Sources of data_____________________________________________ __ 193
Insolvent banks. See Banks in financial difficulties.
Insurance of bank obligations______________________________________3-12, 28
Insurance status, banks classified by:Assets and liabilities, June 30 and December 31, 1964____ 134, 172-175Capital ratios______________________________________________ 135Changes in number, 1964_________________________________158-159Deposits, June 30 and December 31, 1964________ __________ 173-175Number, December 31, 1964__________________________133, 158-169Percentage of banks insured, by State, December 31, 1964_____ 160-167
Insured banks. See Assets, liabilities, and capital of banks; Banks in financial difficulties; Deposits; Deposit insurance coverage; Income of insured commercial banks; Income of insured mutual savings banks; Number of banks and branches.
Insured commercial banks not members of the Federal Reserve System. See Class of bank, banking data presented by.
Insured deposits. See Banks in financial difficulties; Deposit insurance coverage.
Insured State banks members of the Federal Reserve System. See Class of bank, banking data presented by.
Interbank deposits. See Deposits (items referring to type of account).Interest. See Income of insured commercial banks; Income of insured mutual
savings banks.
Investments. See Assets, liabilities, and capital of banks; Assets and liabilities of the Federal Deposit Insurance Corporation; Banks in financial difficulties.
Law, violations of by insured banks__________________________________16-17
Legislation relating to deposit insurance and banking:
Federal, enacted in 1964__________________________________18-19, 63-66Relating to bank supervision_____________________________________ 133
State, enacted in 1964_________________________________________ 67-73
Loans. See Assets, liabilities, and capital of banks; Banks in financial difficulties.
Digitized for FRASER http://fraser.stlouisfed.org/ Federal Reserve Bank of St. Louis

INDEX 239
Losses:Of banks, charged off. See Income of insured commercial banks; In
come of insured mutual savings banks.Of the Federal Deposit Insurance Corporation_______________4, 7, 12, 226Provision for, in insured banks, 1956-1964_______________194-195, 216-217
Mergers. See Absorptions.Methods of tabulating banking data:
Assets and liabilities of banks____________________________________ 171Deposit insurance disbursements_________________________________ 221Income of insured banks________________________________________ 193Number, offices, and deposits of banks__________________________156-157Metropolitan areas, banking concentration in_________ 141, 142-143, 144
Mutual savings banks. See Assets, liabilities, and capital of banks; Deposit insurance coverage; Deposits; Income of insured mutual savings banks; Number of banks and branches.
National banks. See Class of bank, banking data presented by.New banks, 1964____________________________________________ 136, 158-159Noninsured banks. See Absorptions; Admission of banks to insurance;
Assets, liabilities, and capital of banks; Banks in financial difficulties; Classification of banks; Class of bank, banking data presented by; Deposits; Number of banks and branches; Reports from banks.
Number of banks and branches:Banking offices (banks and branches):
By insurance status, type of bank, and State, December 31,1964 ___________________________________________________ 160-167Changes during 1964_____________________________________ 136, 159
Banks:By insurance status and type of bank, December 31, 1964-133, 159, 175By insurance status and type of bank, June 30, 1964___________ 173By insurance status, type of bank, and State, December 31,
1964 _________________________________________________ 160-167By insurance status, type of bank, FDIC district and State, December
31, 1964_______________________________________________ 168-169
By number of offices in center in which located and population ofcenter, December 31, 1964___________ ____________________ 145
By status of branch banking and metropolitan area counties andother counties, December 31, 1964__________ ______________ 146
Changes during 1964, by type of bank______________________136, 159
Operating branches, by insurance status and State, December 31,1964 ________________________________________________ 160-167
Branches:By insurance status, type of bank, and State, December 31,
1964 _________________________________________________ 160-167
Changes in, during 1964____ _____________________________136, 159
Number of, 1964_________________________________________ 136, 159
Digitized for FRASER http://fraser.stlouisfed.org/ Federal Reserve Bank of St. Louis
240 FEDERAL DEPOSIT INSURANCE CORPORATION
Number of banks and branches— Continued PageInsured commercial banks:
December 31, 1956-1964__________________________________195, 197December 31, 1964, by class, deposit size of bank, or
State ____________________________________151, 199, 203, 213, 215Distributed by capital ratios and distribution assets, December
31, 1964 ______________________________________________190-191Insured mutual savings banks, 1956-1964______________________217-219Mutual savings banks, December 31, 1964_________________ 133, 159-169
Noninsured banks:Noninsured banks, December 31, 1964________________ 133, 159-169
Trust companies, December 31, 1964______________________ 159-169Unit banks, by insurance status and State, December 31, 1964__„160-167
Obligations of banks. See Assets, liabilities, and capital of banks; Deposits.
Officers of insured banks. See Employees.Officers of the Federal Deposit Insurance Corporation_______________ V, 21-22Operating banks. See Number of banks and branches.
Payments to depositors in closed insured banks. See Banks in financial difficulties.
Personnel. See Employees.Population of center, number of commercial banking offices by__________ 145Possessions, banks and branches located in. See Areas outside continental
United States, banks and branches located in.
Protection of depositors. See Banks in financial difficulties.
Public funds. See Deposits (items referring to type of account).
Receivership, insured banks placed in. See Banks in financial difficulties.
Recoveries:
By banks on assets charged off. See Income of insured commercial banks; Income of insured mutual savings banks.
By the Corporation on disbursements. See Banks in financial difficulties.
Report from banks_________________________________________17-18, 77, 133
Reserves:
Of Federal Deposit Insurance Corporation, for losses on assets acquired 25
Of insured banks for losses on assets. See Valuation reserves.
With Federal Reserve banks. See Assets, liabilities, and capital of banks.
Salaries and wages:
Federal Deposit Insurance Corporation____________________________ 25
Insured banks. See Income of insured commercial banks; Income of insured mutual savings banks.
Savings and time deposits. See Deposits (items referring to type of account).
Digitized for FRASER http://fraser.stlouisfed.org/ Federal Reserve Bank of St. Louis
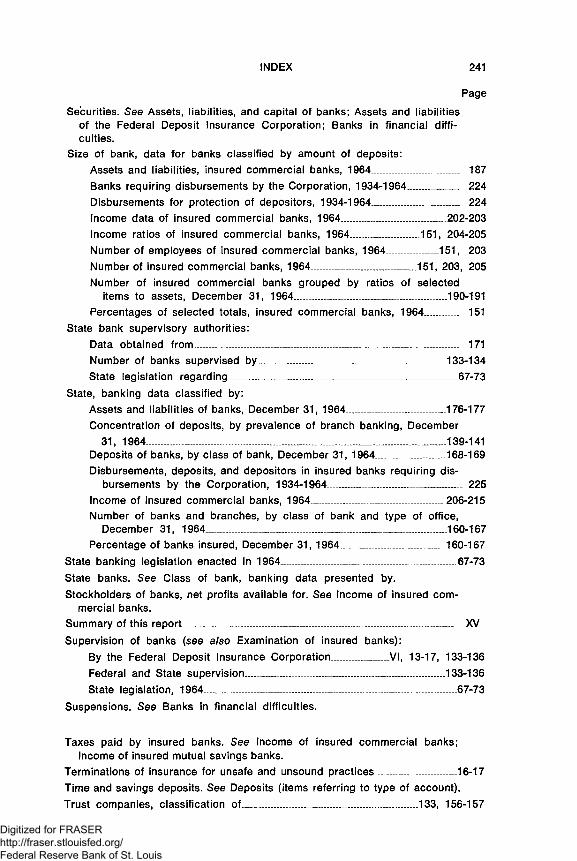
INDEX 241
Page
Securities. See Assets, liabilities, and capital of banks; Assets and liabilities of the Federal Deposit Insurance Corporation; Banks in financial difficulties.
Size of bank, data for banks classified by amount of deposits:Assets and liabilities, insured commercial banks, 1964_______________ 187
Banks requiring disbursements by the Corporation, 1934-1964________ 224Disbursements for protection of depositors, 1934-1964_______________ 224Income data of insured commercial banks, 1964_________________ 202-203Income ratios of insured commercial banks, 1964___________ 151, 204-205
Number of employees of insured commercial banks, 1964________ 151, 203
Number of insured commercial banks, 1964__________________151, 203, 205Number of insured commercial banks grouped by ratios of selected
items to assets, December 31, 1964__________________________190-191Percentages of selected totals, insured commercial banks, 1964_____ 151
State bank supervisory authorities:
Data obtained from_____________________________________________ 171Number of banks supervised by________________________________133-134State legislation regarding_______________________________________67-73
State, banking data classified by:Assets and liabilities of banks, December 31, 1964_________________176-177Concentration of deposits, by prevalence of branch banking, December
31, 1964___________________________________________________ 139-141Deposits of banks, by class of bank, December 31, 1964____________168-169Disbursements, deposits, and depositors in insured banks requiring dis
bursements by the Corporation, 1934-1964_______________________ 225Income of insured commercial banks, 1964______________________ 206-215Number of banks and branches, by class of bank and type of office,
December 31, 1964_________________________________________ 160-167Percentage of banks insured, December 31, 1964__________________160-167
State banking legislation enacted in 1964______________________________67-73
State banks. See Class of bank, banking data presented by.
Stockholders of banks, net profits available for. See Income of insured commercial banks.
Summary of this report______________________________________________ XV
Supervision of banks (see also Examination of insured banks):
By the Federal Deposit Insurance Corporation_________ VI, 13-17, 133-136
Federal and State supervision__________________________________133-136
State legislation, 1964___________________________________________ 67-73
Suspensions. See Banks in financial difficulties.
Taxes paid by insured banks. See Income of insured commercial banks; Income of insured mutual savings banks.
Terminations of insurance for unsafe and unsound practices______________16-17Time and savings deposits. See Deposits (items referring to type of account).
Trust companies, classification of__________________________ ___ 133, 156-157
Digitized for FRASER http://fraser.stlouisfed.org/ Federal Reserve Bank of St. Louis

242 FEDERAL DEPOSIT INSURANCE CORPORATION
Page
Trust powers:Applications fo r____ ___________________________________________ 14State legislation__ _____________________________________________ 68-73
Unit banks, by insurance status and State, December 31, 1964_________ 160-167Unsafe and unsound banking practices________________________________16-17
Valuation reserves (see also Assets, liabilities, and capital of banks):Amounts held, June and December call dates, 1961 through 1964_____ 179Amounts held, June 29 and December 31, 1964______________172, 174, 183Changes, 1956-1964__________________________________194-195, 216-217
Violations of law or regulations, banks charged with_____________________16-17
Digitized for FRASER http://fraser.stlouisfed.org/ Federal Reserve Bank of St. Louis


