Embed Size (px)
Citation preview

1

2
D I S C L A I M E R
This report is not an advice/offer/solicitation for an offer to buy and/or sell any securities in any jurisdiction. We are not soliciting any action based on this material. Recipients of this report should conduct their own investigation and analysis, including that of the information provided. This report is intended to provide general information on a particular subject or subjects and is not an exhaustive treatment of such subject(s). This report has been prepared on the basis of information obtained from publicly available, accessible resources. Company has not independently verified all the information given in this report. Accordingly, no representation or warranty, express, implied or statutory, is made as to accuracy, completeness or fairness of the information and opinion contained in this report. The information given in this report is as of the date of this report and there can be no assurance that future results or events will be consistent with this information. Any decision or action taken by the recipient based on this report shall be solely and entirely at the risk of the recipient. The distribution of this report in some jurisdictions may be restricted and/or prohibited by law, and persons into whose possession this report comes should inform themselves about such restriction and/or prohibition, and observe any such restrictions and/or prohibition. Company will not treat recipient/user as customer by virtue of their receiving/using this report. Neither Company nor its affiliates, directors, employees, agents or representatives, shall be responsible or liable in any manner, directly or indirectly, for the contents or any errors or discrepancies herein or for any decisions or actions taken in reliance on the report.

3

4
M E S S A G E F R O M T H E A U T H O R
In this report we have attempted to provide an overview of the global restaurant industry with an emphasis on the US restaurant industry and Indian restaurant industry. We start with brief overview of the global restaurant industry structure/segmentation and size with an emphasis on the US restaurant industry, which is the largest, and also the most organised. Next, we cover the valuation of listed food services companies and the deals in the segment including a commentary on the emerging trends in the merger and acquisition / private equity in the industry. We also also cover the Indian industry structure, key players and deals in the industry and include brief commentary on the challenges faced by the industry.
While the restaurant industry size and deals in the sector is well covered and researched to some extent, we felt a need to share some of the operational best practices followed by large restaurant chains which the Indian restaurant companies may take inspiration from, while scaling their brands. In this report we have also attempted to touch on some of the factors that determine the success of a restaurant such as the food and beverage menu, the importance of customer experience, marketing and promotion, operational aspects, and how technology is changing the industry.
The report is an attempt to collate as much secondary data we could gather from disparate sources. We welcome feedback from each of you and apologize if anything we’ve written (or missed out) offends anyone’s sensitivities.
We trust you’ll find this report useful as you formulate your own thoughts, and look forward to a continued, meaningful dialogue with you as the industry evolves.
Amit KadooVice [email protected]


6
I N D U S T R YGlobal Restaurant IndustryThe global restaurant industry is estimated to be USD 2.7 trillion in annual sales (2014), with more than 15 million locations, and is poised to grow to USD 3.6 trillion by 2019. The industry is fragmented with independent restaurants accounting for nearly three-fourth of the industry.
Given the size and population, the Asia-Pacific region accounts for around 40% of the value. US-Canada is the second biggest region by value, accounting for over 20%, but has the highest per capital spend in the world.
US-Canada is also the most organised region with restaurant chains accounting for over half of the market compared to other regions where restaurant chains account for less than one-fifth of the market. The top US restaurant chains such as McDonald’s, Starbucks, Subway, Burger King, Pizza Hut, KFC and Domino’s are also the largest global chains.
Outside of the US, the large food and services players fall typically into the following categories
Л Contract food services players such as Compass Group and Sodexo Л Companies that specialise in managing restaurant outlets at airports and railway
stations such as Autogrill SPA Л Convenience stores such as 7-Eleven and Lawson or in-store retailers like Ikea Л Franchisees of US restaurant brands like Alsea SAB (Mexican franchisee of Domino’s,
Starbucks, Burger King, among others) Л Pub companies in the UK like Greene King and JD Wetherspoon Л Other brands such as Costa Coffee (UK) and Nando’s (South Africa) are creating a space
for themselves in the global restaurant market, while brands like Dicos (China), Sukiya (Japan) and Quick (Belgium) are going strong in their home markets.
The high penetration of restaurant chains in the US-Canada region can be partially attributed to high per capita income. It is estimated that as other countries catch up, the penetration of restaurant chains in the US will continue to increase. There are, however, other factors that have helped increase the penetration of restaurant chains in the US:
Л In the US, the restaurant industry’s share of the food dollar is almost half. Л Fast food or quick-service-restaurant chains are a unique American invention; quick-service
restaurants account for three-fourth of the combined sales of the top-100 brands in the US.
While the restaurant industry in Western Europe is almost as large as the US and has comparable per capita income, the market is not homogenous. Compared to that, the quick-service burger concept alone accounts for over 30% of the combined sales of the top-100 brands in the US.

7
Exhibit 1 – Global restaurant industry by region
Source: www.nrn.comNote: tn - trillion
Exhibit 2 – Global food services sales; chains versus independent restaurants
Source: www.nrn.com (CY2014)Note: bn - billion; MEA - Middle East - Africa
Interesting Facts
Л Global system-wide sales (combined revenue of owned stores and franchised stores) of McDonald’s are around USD 90 billion or over 3.3% of the global industry.
Л McDonald’s, ranked number 6 and valued at USD 39.5 billion, is the only restaurant brand in the top 50 most valuable global brands as compiled by Forbes in 2015.
Л Subway has the largest number of locations worldwide with over 44,500 outlets in 111 countries.
Л The combined valuation of McDonald’s and Starbucks is around USD 190 billion, which is more than the combined valuation of the next 50 global restaurant companies.
Л The sales of the largest Indian restaurant company, Jubilant FoodWorks Limited, are around 1% of McDonald’s US system-wide sales.
USD 2.7 tn USD 3.6 tn
USD 2,700 bn USD 554 bn USD 543 bn USD 57 bn USD 1,104 bn USD 297 bn USD 92 bn
40.9% 42%
20.5% 18.8%
20.1% 16.6%
11.0% 14.7%
74%
26 %
47%
53%
80%
20%
75%
25%
81%
19%
86%
14%
81%
19%

8
US Restaurant IndustryThe National Restaurant Association (USA) defines the industry as all meals /snacks prepared away from home, including all takeout meals. The industry has grown from USD 43 billion in 1970 to USD 709 billion in 2015 as the industry’s share of the food dollar increased from 25% in 1955 to 47% in 2015. The compound annual growth rate (CAGR) in sales for the period was 6.4%, with the 1970s being the fastest-growing decade when the industry tripled between 1970 and 1980.
Exhibit 3 – Growth of the US restaurant industry since 1970
The industry is categorised into two broad categories – commercial establishments (accounted for around 91%) and non-commercial establishments (comprised the rest).
Commercial Establishments Л Eating and drinking places (restaurants and bars/taverns) - At USD 491 billion, these establishments have the biggest share in the industry. The industry is dominated by the top-100 brands that account for nearly half the market in value terms.
Л Managed Services - Food and beverages served at cafeterias of schools, offices, hospitals and other commercial places that are managed by companies such as Compass Group and Sodexo account for USD 50 billion.
Л Lodging Places - Food and beverages served at hotels, motels and serviced apartment account for USD 37 billion.
Л Retail/ Vending/ Recreational - Food and beverages sold at retail stores, vending machines and recreational centres (movie halls, amusement parks) account for USD 70 billion.
Non-Commercial Establishments Л Non-Commercial Food Services - Includes food provided by employers, schools, colleges and universities, hospitals and community centres on a non-commercial basis accounts for USD 59 billion.
Л Military Restaurants - Food served at military canteens accounted for USD 3 billion.
USD
Bili
on
Source: National Restaurant Association (USA)

9
Exhibit 4 – Break-up of the US food and beverages services industry
Source: National Restaurant Association (USA), www.nrn.com, Avendus analysis (CY 2015)
The restaurant industry can be further classified into following categories –
Full-service restaurants (casual dining)These are restaurants where the staff waits on tables and the order is taken while the customer is seated. The menu has a wide range of choices and customers pay after they eat. This segment accounts for around USD 229 billion or 47% of the restaurant and bar market. Within this segment, the buffet/grill sub-segment accounts for around USD 9 billion. Full-service restaurants are also categorised as family dining (alcohol is not served), casual dining (alcohol is served) and fine dining (upscale restaurants with an extensive wine menu, food paring and average check size of USD 75).
Industry Size (USD 709 bn) US Restaurant Size (USD 491 bn)
Impact of US restaurant industry
Л The industry’s share of the food dollar is 47%. Л Employs 14 million at 1 million locations.
Л Employs 10% of working Americans; 50% of the adults have worked in the industry at some point during their lives.
Л One in three Americans got their first job in a restaurant.
Л Entrepreneurial opportunities – 80% of restaurant owners and 90% of the managers started at entry-level positions.
Л Labour-intensive industry – Average sales per full-time equivalent non-supervisory employee - USD 85,000 (1/4th of grocery stores).
Л More than 7 in 10 restaurants are single-unit operations.
Л Annual average unit sales were USD 966,000 at full-service restaurants and USD 834,000 at quick-service restaurants.

10
Non-Alcoholic Beverages and Snacks The segment is similar to QSR with respect to service with the focus primarily on non-alcoholic beverages like coffee, tea and juices and snacks like sandwiches. The market size is about USD 32 billion and, like the QSR segment, is marked by large chains accounting for substantial market share. Starbucks and Dunkin’ Donuts account for over USD 20 billion of aggregate sales or 62% market share.
Pubs, Bars and TavernsThe segment is similar to the casual-dining segment with the focus primarily on serving alcohol. The market size is about USD 21 billion.
The role of QSR in organising the restaurant market
Л QSR chains like McDonald’s and Subway were amongst the first to expand nationally and then internationally on account of standardisation of processes and franchising.
Л As the menu was limited to a type of cuisine and the menu and processes could be standardised easily, QSR chains proliferated along with their closest segment–the snacks and beverage segment.
Л Out of the top-10 US brands, 7 belong to the QSR segment and 2 belong to snack and beverage companies–Starbucks and Dunkin’ Donuts.
Л The top-100 US brands have 52 QSR companies. These companies account for over 130,000 units and USD 152 billion in sales, representing 68% of aggregate units and 65% of aggregate sales of the top-100 brands.
Л The top-52 QSR brands account for 72% of the entire QSR segment’s sales.
Л Within the top-52 brands, 16 burger chains account for USD 74 billion of aggregate sales.
Limited-service restaurants (quick-service restaurants [QSR])In these restaurants, customers generally order at the cash counter and pay before they eat. Servers either serve food or customers have to collect it themselves. The menu is typically limited to a particular theme/cuisine such as burgers, sandwiches, pizzas and Mexican. This segment accounts for around USD 211 billion or 43% of the restaurant and bar market. Traditionally, the segment is categorised based on the cuisine; the burger segment is the largest. Fast casual, which is currently a part of the QSR segment, is fast emerging as an independent segment. The key differentiating factors in fast casual are (a) the food is made-to-order boasting complex flavours, (b) typically fresh ingredients are used and (c) the décor is upscale resulting in a higher ticket size compared to traditional QSRs. The fast-casual segment is the fastest-growing segment due to increase in the demand for customisation and fresh ingredients. Panera Bread and Chipotle Mexican Grill (Chipotle) are the largest fast-casual chains.

11
Exhibit 5 – Break up of US restaurant industry
Source: www.nrn.com (CY 2015)
US Restaurant Size (USD 491 bn)
Top-100 US restaurant brandsThe industry is characterised by a top few chains, primarily QSR and snack and beverage chains, accounting for substantial market share. In 2015 the aggregate sales of the top-100 brands was estimated to be around USD 232 billion. Within that, the top-10 brands account for USD 109 billion. With system-wide sales of USD 35 billion, McDonald’s is the largest brand in terms of sales and the 100th brand, Frisch’s Big Boy, at USD 389million of sales is 1.1% of McDonald’s. There are 50 brands with sales of around USD 1 billion and above. With around 26,500 units, Subway has 85% more units than McDonald’s, which has around 14,350 units. The smallest chain in terms of units is Maggiano’s Little Italy with 49 units. The average unit value (AUV) at USD 2.7 million is the highest for casual-dining restaurants. The AUV for QSRs is around USD 1.1 million. The Cheesecake Factory has the highest AUV of USD 10.3 million while the highest AUV for a QSR is Chick-fill-A’s USD 3.1 million. There are few convenience stores (C-store) such as 7-Eleven and food stores within a retail establishment (In-store) like Costco that are a part of the top-100 brands.

12
Exhibit 7 – Segment-wise average unit value in USD million of the top-100 US chains
Source: www.nrn.com (CY 2015)
For a detailed list of chains with sales of over USD 1 billion refer to Annexure 1 and for chains with AUV of over USD 5 million refer to Annexure 2.
The evolution of the fast-casual segment
Historically, the restaurant industry in the US has been dominated by two segments: quick-service restaurants (QSR) and full-service restaurants (casual dining). In the late 1990s/early 2000s, a different kind of restaurant began to appear that did not fall into either the QSR or the casual-dining segment. Like a casual-dining restaurant, the new segment offered higher quality ingredients, menu options and, additionally, customization, while offering speed and lower prices like a QSR. Panera Bread and Chipotle Mexican Grill were the pioneers in this space that was eventually termed fast casual. Though still classified as a part of the limited-service-restaurant segment, the fast-casual segment accounted for around USD 50 billion (of the USD 211 billion limited service restaurant segment) and is the fastest growing segment in the US restaurant industry.
Exhibit 6 – Segment-wise units and sales of the top-100 US chains
Source: www.nrn.com (CY 2015)
Total Units (192,600) Total Sales (232 bn)

13
Key differentiators of QSR, fast-casual and casual-dining chains
QSR Fast Casual Casual Dining
Order At counter At counter At table
Table Service No Maybe Yes
Menu Limited Focused Wide
Customisation Low High Medium to High
Food Quality Low High High
Alcohol Service No Limited Bar Wide Bar
Service Fast Fast Slow
Average check size USD 7-9 USD 9-10 USD 18-20
QSRs have always focused on speedy service and low price points while casual dining has focused on service and quality fresh food served in a comfortable, appealing atmosphere. Busy schedules and fast-paced lifestyles did not allow the luxury of a leisurely meal. Customers, however, still wanted the quality of casual-dining restaurants. Fast casual created an alternative. The most important differentiator for fast casuals over QSRs has been quality ingredients and customization. Fast-casual players have also been quick to adapt to changing customer preferences such as gluten-free, healthy food. The key differentiators with respect to casual-dining restaurants are the speed of service and check size.
Average customer expectations for food delivery times per segment
QSR
Casual Dining
Fast Casual
Fine Dining
Source: www.fastcasual.com

14
The other factors attracting customers that at least some fast-casual chains offer are non-genetically modified food products, no artificial ingredients or preservatives and locally sourced ingredients. Fast-casual chains are also at the forefront of using technology to manage their operations and the ordering process to compete with QSRs on the speed of service without compromising on the food quality and the freshness of ingredients.
Fast-casual chains have also been offering a limited alcohol menu to boost sales. They tend to offer craft beer, wine on tap and quirky cocktails. This has resulted in fast-casual chains taking a share from casual-dining chains.
To compete with fast-casual chains, casual-dining chains are now either adopting features such as pay ahead or developing fast-casual versions of their brands or are acquiring fast-casual concepts to drive sales. Fast casuals have better unit economics, rapid growth and high return on investment. Since the size is smaller, the capital expenditure and rent are lower while the absence of servers leads to lower labour costs (27% of sales compared to 32% in case of casual-dining chains). The main hindrance to casual-dining chains acquiring fast-casual chains has been valuation as the forward multiples for fast casuals are 25-30% higher than for casual-dining chains.
QSRs are also taking note and are incorporating features that made fast casuals a success into their operations. Burger chain Wendy’s, for instance, spent over USD 150 million in the past three years on remodeling stores in an effort to appeal to more mature customers. Even the chain that epitomized standardization, McDonald’s, has launched ’Create Your Taste’ offering customized burgers.
According to Bloomberg, fast-casual brands increased their collective annual sales by 12% in 2014, compared to 3.6% and 4.2% for casual dining and QSRs, respectively. Four of the five fastest growing brands in 2015 were fast-casual chains (Growth rate for Piology was 230%, for PDQ was 119%, BurgerFi was 111% and The Habit Burger Grill was 46&). Even a mature brand such as Chipotle Mexican Grill grew by 28% over the same period.
As more brands enter the segment, the stars of the fast-causal segment will have to modify their model to continue their impressive growth by incorporating new technologies, expanding their menu and stepping up their customer service. Pieology Pizzeria, for example, offers unlimited topping on its pizzas for a set price while PDQ (chicken finger chain) touts the absence of freezers and microwaves at it stores. Others are focusing on technology, such as mobile ordering and pay-ahead options with fully customizable orders, and are offering delivery. Some players are even delivering food to the table instead of pick-up at the counter. Table service improves guest experience by enabling customers to wait at their table for their food as well as provide the restaurant staff an additional touch point with the customer to serve needs better.
Please refer Annexure 3 for a note on six innovative fast-casual brands that are trying to distinguish themselves from the pack.

15
Major Non-Us BrandsThe global restaurant industry is estimated to be USD 2.7 trillion (2014) with over 15 million locations and is poised to grow to USD 3.6 trillion by 2019.In all the markets outside of US-Canada, independent restaurants account for around 80% of the market.
Asia PacificThe restaurant industry in the Asia-Pacific region is estimated to be USD 1.1 trillion in annual sales (2014) or 40% of global restaurant industry. The industry is expected to be USD 1.5 trillion by 2019 growing at a compounded annual growth rate (CAGR) of 6.8%. The industry is fragmented with standalone restaurants accounting for 81% of the market share. The franchisees of US restaurant chains have significant presence in the region. In the region, 98 companies are listed with an aggregate market capitalisation of USD 56 billion. Of these 8 companies with an aggregate market capitalisation of USD 10 billion are franchisees of US restaurant chains. Restaurant chains in Japan offering sushi, donburi and other Japanese dishes account for significant share of the organised market in the region followed by the restaurant chains in China – 55 Japanese restaurant chains have an aggregate market capitalisation of USD 27 billion and 20 Chinese restaurant chains have an aggregate market capitalisation of USD 7 billion.
With annual sales of over USD 1.8 billion, South Korean quick service restaurant chain Paris Baguette is the largest restaurant brand in the region followed by Chinese quick restaurant chain Dicos (USD 1.5 billion) and Japanese quick restaurant chain Sukiya (USD 1.5 billion). Philippines based chain Jollibee, which has presence in US, Middle East and South East Asia is the largest restaurant company in the region by market capitalisation. Japanese convenience store chains (C-stores) 7-Eleven, Lawson and FamilyMart that offer ready to eat food and beverage are the largest food services brands (other than restaurant) in the world.
Indikitch – Indian fast-casual restaurant
Л Décor and set-up is like any fast-casual restaurant
Л Menu is visible everywhere–flags, posters and on paper
Л There are four main choices for the meal: (a) Feast, which is essentially a platter with meat, rice, and a side, (b) Biryani Rice Bowl, (c) Dosa or (d) Salad.
Л The food is prepared as you watch, with the meat and sauce of your choice (nearly half the menu is vegetarian-friendly) sautéed on a flaming grill.
Л A myriad freshly made sauces and chutneys are available as you move down the order line.
Л The entire ordering experience lasts around 5 minutes from start to meal.

16
Exhibit 8 – Top 5 largest companies in the Asia Pacific region by market capitalisation
Global Rank Company Key Brands Mkt
Cap Sales EBITDA NetIncome
8 Jollibee Foods (Phillipines) Jollibee 5,154 2,215 213 106
11 Domino’s PizzaEnterprises (Australia) Domino’s (Franchisee) 4,163 588 106 54
14 McDonald’s Holding Co (Japan) McDonald’s (Franchisee) 3,346 1,566 (146) (287)
21 Skylark (Japan) Gusto, Bamiyan, Jonathan’s 2,481 2,902 342 125
26 Zensho Holdings (Japan) Sukiya, Nakau, Hamazushi 1.941 1,941 248 (43)
Western Europe
The restaurant industry in the Western Europe region is estimated to be USD 540 billion in annual sales (2014) or 20% of global restaurant industry. The industry is expected to be USD 610 billion by 2019 growing at a compounded annual growth rate (CAGR) of 2.3%. The industry is fragmented with standalone restaurants accounting for 80% of the market share. Apart from the franchisees of US restaurant chains brewing companies and pub companies in UK are the largest restaurant companies in the region; however, given the nature of the pub industry in the UK, these companies operate through multiple brands and only two brands have sales of over USD 1 billion.
Source: Bloomberg (May 06, 2016); financials for latest fiscal; global ranking by market capitalization

17
The other dominant formats are QSRs, the snack and beverage segment, convenience stores and in-stores. With annual food sales of over USD 1.5 billion, the Ikea (in-store) is the third largest brand by sales after the pub brand J D Wetherspoon (USD 2.1 billion) and café brand Costa Coffee (USD 1.7 billion).
The UK Pub Industry
Tenanted pubs mark the UK pub industry with ’beer tie-ups’ as opposed to the franchise model.
Ownership types – Л BrewCo (19%) – Owned by breweries, the key players are Greene King (2,200 pubs),
Marston’s 2,200 pubs) and Heineken UK–Star Pubs & Bar (1,250 pubs) Л PubCo (40%) – Are owned by pub companies that do not have their own breweries and
have to procure beer from others. The key players are Enterprise Inn (5,500 pubs), Punch Taverns (4,000 pubs), Mitchells & Butlers (1,500 pubs) and JD Wetherspoon (900 pubs)
Л Free houses (41%) – Are owned by independent licensees.
Operating Structure – Л Managed houses (16%) – Pubs owned by BrewCo or PubCo and managed by them.
They are usually larger in size than the tenanted houses and free houses and have greater emphasis on food. Marston’s, Mitchells & Butlers and JD Wetherspoon have predominantly managed houses.
Л Tenanted houses (43%) – Pubs owned by BrewCo or PubCo and leased to a licensee who pays the rent and runs the premises as their own businesses. Under the beer tie-up arrangement, tenants pay ‘dry rent’ to the pub companies and are contractually obliged to buy drinks from the pub companies at a rate above the wholesale price (‘wet rent’). Tenancies are short-term (1-3 years), rolling and un-assignable agreements, whereas leased pubs are longer term agreements (10 years or more) that can be sold to another party. Enterprise Inn and Punch Taverns have predominantly tenanted houses.
Л Free houses (41%) – Pubs owned and managed by independent licensees. Л Franchisees – Not very common, have started only recently.

18
Exhibit 9 – Top 5 largest companies in the Western Europe region by market capitalisation
Global Rank Company Key Brands Mkt
Cap Sales EBITDA NetIncome
12 Greene King(UK)
Belhaven Pubs, Eating Inn, Flame Grill, Farmhouse Inn 3,714 2,494 528 146
23 Domino’s Pizza Group(UK) Domino’s (Franchisee) 2,301 481 105 76
29 Mitchells & Butlers(UK)
Sizzling Pubs, Vintage Inns, Ember Inns, Harvester 1,630 3,248 589 159
34 J D Wetherspoon(UK) J D Wetherspoon (pub) 1,220 2,377 267 73
36 Marston’s (UK) Pubs in UK 1,205 1,357 234 36
Latin America
The restaurant industry in the Latin America region is estimated to be USD 300 billion in annual sales (2014) or 11% of global restaurant industry. The industry is expected to be USD 540 billion by 2019 growing at a compounded annual growth rate (CAGR) of 12.4%. The industry is fragmented with standalone restaurants accounting for 86% of the market share. The franchisees of the US restaurant chains are the largest companies in the region.
Exhibit 10 – Top 2 largest companies in the Latin America region by market capitalisation
Global Rank Company Key Brands Mkt
Cap Sales EBITDA NetIncome
15 Alsea SAB de CV(Mexico)
Franchisee for Domino’s, Starbucks, Burger King,
Chili’s3,714 2,039 272 62
44 Arcos Dorados Holdings (Argentina)
McDonald’s(franchisee) 983 2,936 218 27
Middle East and Africa
The restaurant industry in the Middle East and Africa region is estimated to be USD 90 billion in annual sales (2014) or 3.4% of global restaurant industry. The industry is expected to be USD 150 billion by 2019 growing at a compounded annual growth rate (CAGR) of 10%. The industry is fragmented with standalone restaurants accounting for 81% of the market share. Nando’s with annual sales of over USD 1.3 billion is the largest brand from the region.
Source: Bloomberg (May 06, 2016); financials for latest fiscal; global ranking by market capitalization
Source: Bloomberg (May 06, 2016); financials for latest fiscal; global ranking by market capitalization

19
Exhibit 11 – Segment-wise units and the top non-US chains with sales of over USD 1 billion
Sales (USD 60 bn)Total Units (122,297)
For a detailed list of non-US chains with sales of over USD 1 billion refer to Annexure 4.
Source: www.nrn.com (CY 2015)

21
Listed LandscapeAccording to Bloomberg data, there are around 200 food services companies (both restaurants and non-restaurant food services companies) listed globally with an aggregate market capitalisation of USD 480 billion. In terms of the number of companies, the Asia Pacific region accounts for half the listed companies but the companies in the US-Canada region account for over 70% of the market capitalisation (MCap). Many of the companies in the other regions are the franchises of the US restaurants.
Exhibit 12 – Region-wise break-up of listed food services companies
Region No of companies Aggregate MCap(USD Bn)
Average MCap(USD Bn)
US-Canada 65 341 5.3
Western Europe 22 75 3.4
Asia Pacific 100 57 0.6
Middle East - Africa 7 5 0.8
Latin America 4 4 0.9
Eastern Europe 1 1 1.2
Total 199 483 2.4Source: Bloomberg (May 06, 2016), Avendus analysis
There are 55 companies with market capitalisation of USD 1 billion or more. Of these, 43 are restaurant companies while the other 12 are non-restaurant food services companies such as contract food services, convenience stores and travel food companies. US-Canada companies and their franchisees outside the region account for about 70% in terms of number and 90% in terms of aggregate market capitalisation of the 43 restaurant companies. While the non-restaurant food services category is dominated by Western Europe, which accounts for 7 of the 12 companies in the space and 70% in terms of aggregate market capitalisation.

22
Exhibit 13 – Region-wise break-up of listed restaurant companies with market capitalization (MCap) of over USD 1 billion
RegionLocal Brands Franchisee of US Brands Total
Companies(#)
MCap(USD Bn)
Companies(#)
MCap(USD Bn)
Companies(#)
MCap(USD Bn)
US-Canada 24 316.1 - - 24 316.1
Asia Pacific 8 16.0 3 8.7 11 24.7
Western Europe 5 8.6 1 2.3 6 10.9
Latin America - - 1 3.2 1 3.2
Eastern Europe - - 1 1.2 1 1.2
Total 37 340.8 6 15.4 43 356.1
Source: Bloomberg (May 06, 2016), Avendus analysis
Exhibit 14 – Region-wise break-up of listed non-restaurant food services companies with MCap of over USD 1 billion
Region Companies (#) MCap(USD Bn)
Western Europe 7 62
Asia Pacific 2 13
US-Canada 2 10
Middle East-Africa 1 3
Total 12 88
Source: Bloomberg (May 06, 2016), Avendus analysis

23
McDonald’s, 24x, 15x
Domino's Australia, 71x, 37x
Atom Corp , 77x, 25x
Jollibee Foods, 49x, 26x
Domino's UK, 30x, 19x
Domino's US, 31x, 18x
Starbucks, 32x, 17xPopeyes Louisiana, 27x, 16xDunkin' Brands, 36x, 17x
Chipotle, 39x, 18x
Domino's India, 54x, 22x
Restaurant Brands, 46x, 19x
5x
10x
15x
20x
25x
30x
35x
40x
10x 20x 30x 40x 50x 60x 70x 80x
Valuation
The valuation of majority of the restaurant companies with market capitalisation of over USD 1 billion ranges from 9-14 times enterprise value/earnings before interest, taxes, depreciation and amortisation (EV/EBITDA) on a trailing twelve-month basis with the median being 13.2 times. On the price to earnings matrix, it ranges from 17-27 times on a trailing twelve-month basis with the median being 26 times. The global companies such as Domino’s, Starbucks, Chipotle, Restaurant Brands (Burger King) and Dunkin’ Brands that have demonstrated high growth and better returns trade at 17-19 times EV/EBITDA while the Asian counterparts such as Jollibee Foods and Jubilant FoodWorks (Domino’s India) that have demonstrated high growth trade at 26-27 times EV/EBITDA.
Exhibit 15 – Global restaurant companies’ valuation map
Note: McDonald’s Holding (Japan), Zenso Holding (Japan) and Shake Shack (US) are not considered as they have negative PESource: Bloomberg (May 06, 2016), Avendus analysis
Refer to Annexure 5 for the detailed list of food services companies (both restaurant and non-restaurant) having market capitalisation of more than USD 1 billion.
EV /
EBIT
DA
Med
ian
PE -
26x
Median EV / EBITDA - 12x
Legend - Company PE, EV / EBITDA
PE

24
S&P Super Composite Restaurants Index
The S&P Super Composite Restaurants index is a capitalisation-weighted index consisting of the top-25 restaurant companies listed in the US. In 2015 (calendar year [CY]), the index climbed by 18% outpacing S&P 500’s 1% decline. This is despite Chipotle’s share price crashing by almost 40% in November due to an E. coli scare. The strongest performers included heavy weights Starbucks (up 46%) and McDonald’s (up 26%). The EV/trailing 12 months EBITDA of 15 times for the index is above the 10-year average of 11 times. At 22 times, the 2016 earnings per share (EPS) estimates are also above the 10-year average of 17 times earnings per share.
Exhibit 16 – Normalized chart of the S&P Supercomposite Restaurants index with respect to the S&P 500 index
Source: Bloomberg (Period Jan 01, 2015 to May 06, 2016), Avendus analysis
Typically, chains with a higher percentage of franchised stores in the portfolio command higher valuation multiples versus chains with a higher percentage of company-operated stores as the cash flow and EPS are predictable. Franchising also reduces operating costs and the company can focus more on branding, menu and growth rather than manage day-to-day activities. There are other criteria like same-store sales growth, unit growth, operating margin and return on capital that are important valuation parameters.

25
Deals in the food and beverage services companiesMergers and acquisitions/private equity deals
The number of deals has increased to more than 220 in the last two years compared to the preceding three years when the number was around 150 according to Bloomberg data. The deals have been in the range of USD 50-60 billion. US-Canada is the most active region followed by Western Europe.
Exhibit 17 – Global deals in the last five years
Two most important metrics to evaluate a restaurant
Investors and analysts to determine the performance of restaurant companies intensively monitor same-store sales growth. While same-store growth is important, it is necessary to keep in mind that it increases revenue in short term. For longer-term growth, increase in net stores is more critical, which is beneficial in case of excess return on capital over the cost of capital.
Л Return on capital – Good management teams allocate capital effectively and increase shareholder value over time with smart investments. This is accomplishment of a higher rate of return on investment than its cost of capital (Chipotle’s cost of capital is 8.45% while its return on capital is 25.6%)
Л Restaurant-level operating margin – Underlying the return on capital is the restaurant level operating margin (27.5% for Chipotle).
Starbucks, which also has high operating margin and return on capital, allows its stores to cannibalise its stores in a cluster to increase its market share in the cluster. For example, of its 283 stores in New York City, around 200 stores are in Manhattan alone with some stores across the road.
Note: The value was not disclosed for around 40% of the deals across the years. In CY14, the Burger King - Tim Horton merger deal was for over USD 12 billion.Source: Bloomberg, Avendus analysis

26
Public Market deals
Public market deals, which dipped in CY12, have picked in the past two years. In the past five years, there were 30-35 public market deals (both initial public offers and additional offerings) every year with average deal size of upward of USD 100 million. The deals are dominated by US companies, which accounted for around 60% by deal size.
Exhibit 19 – Public market deals in the past five years
Exhibit 20 – Geographical break-up of CY15 public market deals
Deals (45) Value (USD 4.8 bn)
Deals (244) Value (USD 8.8 bn)
Exhibit 18 – Geographical break-up of CY15 deals
Source: Bloomberg, Avendus analysisNote: The value is not disclosed for around 40% of the deals
Source: Bloomberg, Avendus analysis
Source: Bloomberg, Avendus analysis

27
Emerging trends in mergers and acquisitions/private equity in the USThe recent deals indicate two emerging trends (a) investment in start-up restaurant chains and (b) investment in franchisee operations
Cash flows into the disruptive restaurant concept
Millennials are driving major changes in the industry in part by their changing eating habits and their tendency to dine out more. They are not only spending a higher percentage on restaurants but also looking for the best of a product (best hamburger, best taco and best cupcake for instance). They also want to experience a variety of different concepts or flavours.
This has resulted in a young generation of start-up restaurant chains disrupting the restaurant industry and taking the share from larger chains fuelled by an unprecedented flow of investment cash into small concepts. This group of start-ups is better funded than they have ever been in the past.
A negative effect is being felt by larger restaurant chains, which are experiencing weak traffic. This eventually creates a big opportunity for others–a 1% sales decline for McDonald’s creates a USD 350 million opportunity for other restaurants or in other words a 1% decline in McDonald’s can create more than three Shake Shacks.
Private equity (PE) firms are putting their money towards those disruptive concepts grabbing market share and luring millennials. Last year, Kohlberg Kravis Roberts (KKR), which traditionally does large buyouts, made a minority investment in a 14-unit Los Angeles (LA) chain Lemonade, Roark Capital invested in Middle Eastern concept NafNaf Grill. Catterton Partners in recent years have invested in a handful of start-ups. Even venture capitalists (VC) are pumping money into these new concepts. One of the investors in Cava Mezze is Revolution Growth, which has been putting money into other restaurants such as fast-casual concept Sweetgreen.
In the past three years, PEs and other investors have put money into 33 different concepts with 20 or fewer units. In many cases, multiple rounds have come fast, which is relatively rare in the restaurant industry. Recent deals indicate that investors are now looking at restaurant companies earlier. Most of the concepts receiving money are fast-casual chains, which is where restaurant industry growth is currently concentrated. Also, in many cases, they have unique menus such as a waffle sandwich concept called Bruxie, an Italian concept that serves burrito like wraps (Piada Italian Street Food), Middle Eastern concept (NafNaf Grill) and Indian (Tava Indian Kitchen). Investors have also pumped money into other fast-casual concepts–MOD Pizza, Project Pie, Your Pie, Patxi’s Pizza and PizzaRev. The biggest beneficiaries have been health-oriented or Mediterranean style or similar concepts like Sweetgreen, Native Foods Café, Chop’t, Lemonade, Fitlife Foods, Cava Mezze Grill, Tender Green and Honeygrow.

28
Exhibit 21 – Deals in smaller restaurant concepts in 2015
Year Chain Early-stage investor Units
2016 CCW LLC (Hut Mongolian Grill’s largest franchisee) Sun Capital 21
2016 Sincerely Yogurt Ablak Holdings 20
2015 Barcelona Wine Bar and Bartaco General Atlantic LLC 11
2015 Tender Greens Alliance Consumer Growth 18
2015 Taylor Gourmet KarpReilly 9
2015 Tava Indian Kitchen CircleUp Growth/KensingtonCapital 3
2015 NafNaf Grill Roark Capital 13
2015 Honeygrow Miller Investment Management 5
2015 Fitlife Foods KarpReilly 14
2015 Eureka! Restaurant Group KarpReilly 14
2015 Cava Mezze Grill Swan & Legend Partners/Invus/Rev Growth 11
2015 Asian Box Horowitz Group 5
2015 &Pizza Private investors 9
Source: www.nrn.com
For the list of deals in smaller concepts in previous years, please refer Annexure 6
This is also due to the strong IPO market that PEs are motivated to invest in these emerging companies. Companies can go public at an earlier stage in their life cycles than they have been able to before. Previously, companies could not go public until they had reached annual cash flow of USD 40-50 million. Now, they can with less than USD 15 million. In 2012, Leonard Green and Partners invested in Shake Shack, a burger chain in New York with a few units but a big reputation. In less than three years, Shake Shack went public, got a huge valuation and set the stage for a valuable exit. This trend has forced investors to focus on smaller companies.

29
Investment in franchisee operations
PEs are also investing in large franchisee groups as it is still a path for making good returns. In addition, retirements and an aging franchisee base is driving a lot of consolidation as are refranchising efforts on the part of companies like McDonald’s and TGI Friday’s.
Franchisees do not control the brand, are not as profitable as they have high capital costs and pay a certain percentage of revenue to the franchisor. For all these reasons, PE avoided franchisees but that has changed in recent years as investors have discovered the benefits of buying these companies. What franchisees lack in absolute value, they make up for in cash generation as they operate plenty of restaurants. This cash can be distributed in the form of dividend or management fee.
In recent years, they have also demonstrated an ability to grow at rates that rival many brands. Large-scale franchisees have been able to aggressively acquire locations funded with readily available low-cost debt. PEs look for these kind of growth rates.
PEs are expanding their search for franchisee acquisitions targeting franchisees of smaller, lesser-known brands as long as those operators fit their criteria. Recently, Sun Capital invested in CCW LLC, a franchisee of Hut Hut Mangolian Grill (has a 55-unit chain, 21 of those with CCW LLC). Sun Capital was interested in CCW’s management team and the business that it created, while seeing huge expansion potential. Sun Capital wants to explore franchising options with the management team in other fast-casual concepts.
Exhibit 22 – Some PE-owned franchisee operations
Fund Companies /Brands Group Revenue(USD Mn)
Olympus Partners Centerplate Inc., NPC International (Pizza Hut, Wendy’s), Pepper Dining (Chili’s Grill & Bar) 2,236
Argonne Capital Group LLC
On the Border Mexican Grill, Krystal, ACG Texas, Sunshine Restaurant Partners, Peak Restaurant Group (IHOP), Neighbourhood Restaurant Partners (Applebee’s), Stevi B’s Pizza
1,255
Ontario Teachers’ Pension Plan Apple American Group LLC (Applebee’s); Bell American Group LLC (Taco Bell, KFC, Pizza Hut) 826
Cerberus Capital Management L.P.
Strategic Restaurants Acquisition Corp (Burger King, TGI Friday’s), Champps Kitchen + Bar, Fox & Hound Sports Tavern, Bailey’s Sports Grille
656
Altamont Capital Partners LLC Tacala Cos. (Taco Bell), Boom Holdings Inc. (Sonic Drive-In), Cotton Patch Café 410
Source: www.nrn.com

30
PE-owned restaurant companies
As a result of robust mergers and acquisitions, PEs have continued to cement their place among the largest domestic food services companies.
Bain Capital, with their investment in Bloomin’ Brands, and Roark Capital, with their investment in Arby’s, Carl’s Jr and other brands, are ahead of Yum Brands in US revenue. Roark Capital moved from rank 20 in 2014 to rank 9 in terms of accounting revenue owing to the acquisition of CKE Inc. (Carl’s Jr and Hardee’s) and Miller’s Ale House Inc. (Miller’s Ale House). Sentinel Capital post its acquisition of TGI Friday’s and Checkers Drive-In restaurant moved to rank 48 in 2015 from rank around 200 in 2014.
Exhibit 23 –Ranking of PEs as per US food and beverage service revenue (firms with revenue of more than USD 1 billion)
Rank Fund Companies / Brands Revenue (USD Bn)
8 Bain Capital LLC
Bloomin’ Brands Inc. (Outback Steakhouse, Carrabba’s Italian Grill, Fleming’s Prime Steakhouse & Wine Bar, Bonefish Grill) 3.9
9 Roark Capital Group
Arby's, Carl's Jr, Corner Bakery Cafe, Hardee's, McAlister's Deli, Moe's Southwest Grill, Schlotzsky's, Wingstop, Miller's Ale House, Auntie Anne's, Cinnabon, Il Fornaio, Carvel Ice Cream, Seattle's Best Coffee
3.3
12 Golden Gate Capital California Pizza Kitchen, CPK ASAP, Red Lobster 2.9
14 Olympus Partners
Centerplate Inc., NPC International (Pizza Hut, Wendy's), Pepper Dining (Chili's Grill & Bar) 2.2
21 Sun Capital Partners Inc.
Boston Market, Friendly’s Ice Cream, Souplantation, Sweet Tomatoes, Fazoli’s, Johnny Rockets, Restaurants Unlimited, Smokey Bones, Bar Louie
1.8
22 Centerbridge Partners LP
P.F. Chang's China Bistro Inc. (PF Chang's China Bistro, Pei Wei Asian Diner, True Food Kitchen), Craftworks Restaurants & Breweries Inc. (Gordon Biersch Brewery Restaurant, Big River Grille, A1A Aleworks, Bluewater Grille, Seven Bridges)
1.7
31Argonne
Capital Group LLC
On the Border Mexican Grill, Krystal, ACG Texas, Sunshine Restaurant Partners, Peak Restaurant Group (IHOP), Neighbour-hood Restaurant Partners (Applebee’s), Stevi B’s Pizza
1.3
Note – The ranking is as per revenue, which includes only the franchise fee and not the entire franchisee revenue.Source: www.nrn.com
Refer to Annexure 7 for the ranking of food and beverage services companies by revenue.


32
The classification of food services space in India The restaurant segment is estimated to be USD 48 billion in 2014. The unorganised sector, which lacks standardisation in terms of menu, operations and formats, accounts for around 70% of the market. The organised segment comprises stand-alone as well as chain outlets with the former accounting for around 80% of the organised market.
Exhibit 24 – Indian restaurant market structure
Source: NRAI
Casual dining:These are sit-down restaurants offering single or multiple cuisines with pricing ranging from affordable to premium. This is the largest portion of the organised segment, accounting for USD 7 billion. Independent restaurants account for nearly 89% of the sub-segment. Some of the chain brands are Barbeque Nation, Mainland China, Pizza Hut, and Moti Mahal.
QSRs:This segment accounts for USD 2.3 billion. Restaurant chains constitute around 50% of the organised QSR segment, the highest amongst all the organised segments due to standardisation and scalability on account of the pricing. International chains such as Domino’s, Subway, McDonalds, Pizza Hut and KFC operating in this segment are the largest food services brands in India.
Cafés:These are tea/coffee-centric casual places with a limited menu and affordable to premium pricing with beverage sale comprising 60-65% of sales. The segment size is around USD 1.1 billion with around 26% share of restaurant chains. Café Coffee Day is the largest among the chains and is also the largest Indian food services brand. The other chain operators are Barista, Starbucks, Costa Coffee and Dunkin’s Donuts.
Indian market – (~ USD 48 Bn)
Chain & Standalone restaurants (~ USD 13 Bn)

33
Pub bar café lounge (PBCL):This is a service format with strong focus on alcohol and the experience offered to customers. The USD 1.7 billion segment is dominated by city-specific standalone concepts that account for around 94% of the market. The key players are Social, TGI Friday, Monkey Bar, Irish House, Hoppipola and Beer Café.
Fine dining:Comprises speciality restaurants (other than 5-star hotels) with strong focus on quality ingredients, presentation and immaculate service. The pricing is premium to luxury. The size of this segment is around USD 407 million. The key players include Indigo, Olive and Masala Library.
Frozen desserts:Outlets with a limited menu with focus on ice-cream and frozen yogurt. Some places also have snack and beverage options. The segment accounts for USD 401 million. Players such as Baskin Robbins, Gelato, Ice Cream Works and Cocoberry operate in this segment. Some players are going beyond the frozen desserts with donuts (Mad Over Donuts) and waffles/pancakes (Waffle House).
PBCL in India is experimenting with formats
Many players in this segment are going a step ahead of the ’happy hour’/’themed outlets’ to attract the crowd beyond the weekend/evening footfall–
Л All-day dining: Casual dining during the day and pub/lounge in the evening. Some of these offer fixed-menu lunch to attract the office crowd in the afternoon. Players include Social, Irish House and Hoppipola.
Л Pubs with micro-brewery: Pubs with a micro-brewery serving their own craft beer–Barking Deer, White Owl, Toit Brewpub and 7 Barrel Brewpub. Some of these also provide their craft beer to other pubs.
Л Café model: Predominantly, beer-serving pubs themed like a café with bright light, light music and limited food. Some of these places also keep books and board games for customers. The largest in this space in terms of number of outlets is Beer Café, others include Pint Room and Doolally Taproom.
Л Dynamic pricing: Players use software to change the pricing dynamically depending on the supply-demand with prices low during the early hours and picking up as the crowd picks-up. Outlets include The Bar Stock Exchange and Café Dalal Street.
Apart from these, there are three other food and beverage services concepts –
Travel food serviceThese companies manage either the food served in transit, primarily in flights and to some extent trains or the restaurant outlets at the airport. Taj Stats and Skygourmet are the leading players that provide in-flight food to the airlines while IRCTC provides food in trains. Due to security reasons,

34
only a limited number of companies are allowed to operate restaurant outlets at airports. These companies usually take franchises of restaurant brands and operate them at the airports. One of the key players is Travel Food Services, which manages franchised as well as its own brand of restaurants at airports. IRCTC, meanwhile, manages canteens and cafeterias at many railway stations in India.
Snack/sweat shop and restaurantsThese are traditional snack and sweet shops that evolved their businesses to provide restaurant service. The menu offered ranges from limited snack options, which were traditionally available as take away, to a complete meal menu. The dine-in option is usually available at a limited number of locations and the major share of revenue is still from the traditional snack/sweet business. The major players are Haldiram Bhujiawala and Bikanervala Foods.
Managed ServicesThese companies manage food and beverage served at cafeterias of offices, hospitals, and other commercial places. Global players Compass Group and Sodexo are active in this space in India. Refer to Annexure 8 for the key brands in each segment and Annexure 9 for the key restaurant and other food and beverage companies operating in India.
Exhibit 25 – Break-up of the chain and standalone restaurant market in India (USD Mn)
89%
94%
77%
53%
74%
63%
7,074
1,705
407
2,247
1,126401
Source: NRAI

35
New concepts emerging in India
Internet-first restaurants
These restaurants are delivery only and use technology to serve customers.
The pricing is typically around INR 200-250 for a meal. The menu primarily consists of a full meal but may have soup, dessert and beverage options.
The primary target segment is office goers and bachelors with operators targeting to replace home food/tiffin or canteen food.
Primarily, the companies operate under two models –
Л Central Kitchen - Under this model, there is a central kitchen and the menu (which typically varies daily) is curated in-house. Since the menu is curated in-house, mixed cuisines as well as menu items like soup, salad, mains and desserts can be managed. Moreover, since the food is cooked in a central kitchen by professional chefs, the quality of food can be controlled. Players include FreshMenu, Yumist and Inner Chef.
Л Home chef - The food is prepared by home chefs or trained chefs at their respective homes. The operator aggregates the menu and provides pick-up and delivery service. The operator also provides some training in case of home chefs. The chef and the operator curate the menu jointly. Since the food is prepared at a chef’s home, maintaining quality can be a challenge. Players include TinyOwl and Bite Club.
Some of the Indian QSR operators are adapting to this model with the use of technology and focus on delivery. These operators have central kitchens that prepare the food and distribute it to the outlets. The outlets act as spokes for local delivery. The key differentiation from the typical QSR operator is the use of technology. The physical presence gives the brand better visibility. The key Indian brand with omnichannel presence is Fasoos.
AggregatorsThese are technology platforms that aggregate restaurants and provide delivery to customers. The platforms aggregate a variety of restaurants and, hence, provide multiple options for customers to choose a restaurant from. For restaurants, it is additional customer acquisition, especially for those that do not have their own delivery option. The aggregators can also work with restaurant operators to curate combos that provide complete meals to customers at a reasonable price. The delivery is done by the aggregator, the restaurant or by hyper local delivery firms. Players include Swiggy, FoodPanda and Zomato.
Despite being in the news due to lay-offs and scaling back of operations, the food-tech companies (Internet-first restaurants, aggregators) have attracted investor interest. This space will grow as these companies are complementing (eating in) to the largely eating-out model of traditional restaurants and thereby expanding the market itself. They are expanding the market for organised players by providing alternatives to tiffin/canteen services (which are largely unorganised) as well as to home-cooked food.

36
Recently, food-tech companies like Yumist, Bite Club and InnerChef have started serving institutional customers like Google, Citibank, Snapdeal, Yatra and Oyo Rooms in an effort to build scale and improve cash flows. Operating margin, excluding the cost of acquisition, is higher in case of institutional sales but the cost of acquisition per customer is low to negligible. Demand is also more predictable in case of institutional customers and the logistics cost per meal also works out to be lower. While some of the food-tech companies are venturing into institutional sales, TinyOwl is planning to provide a technology platform to internet-first restaurants.
Apart from internet-first restaurants and aggregators, there are other associated models in the food-tech space.
Л Table booking/reservation: These websites and apps help people book a table at their favourite restaurant. Some of these players offer discount while some offer a curated fixed-priced set menu. Players include DineOut, GroupTable and TableGrabber.
Л Restaurant Review: These websites provide restaurant listings and facilitate user-generated reviews. Zomato is the largest player followed by Burrp.
Л Hyper-local delivery: These companies provide last-mile delivery options for aggregators and/or restaurants. Players include Groffers, Roadrunnr and PepperTap.
IRCTC – Changing the way food is consumed on trains
Traditionally the Indian Railways Catering and Tourism Corporation (IRCTC) has been operating canteens and food plazas on railway stations and providing meal service on select trains like Rajdhani and Shatabdi. Recently it has launched a ‘station-based e-catering’ service allowing passengers to order meals as per their choice, which will be delivered in the train from popular private caterers. The passenger needs to provide the ticket PNR and make payment upfront. In case of waitlisted ticket which doesn’t get confirmed, the order is cancelled automatically and money is refunded. Currently the passenger can order the food using website, by calling or sending SMS.
Besides food from IRCTC-managed food plazas and fast food units, reputed food chains like McDonald’s, KFC, Dominos, Haldiram, Bikanerwala, Nirualas, SagarRatna, Pizza Hut, which have a wide variety in menu have entered into a tie-up with IRCTC to serve the passengers passing through these stations.
Recently it has also started 10% cash back program when using payment gateway of HDFC or Paytm.

37
New dining concepts emerging in India
Recipe box:A menu is posted on the website every few days and the customers can choose the dish that they want and place an online order. The company sends the ingredients, weighed out according to the recipe along with the step-by-step instructions. The pricing is competitive and cheaper than ordering in. If the customer were to go and purchase ingredients, he or she may need to buy larger minimum quantities and waste the unused portion if it is perishable. Players include iChef and Cookfresh
Invite-only home dining:This is an experimental dining concept wherein experienced and exceptional home cooks invite a small group of people home for a meal. The guests can taste authentic cuisines. Players include The Bohri Kitchen and The Avadhi Dastarkhwan.
Chef-Hosted Dining:A chef visits the house of the customer or host with all the ingredients, utensils as well as serving cutlery, prepares the food in the host kitchen and serves the hosts and their guests. The charge is usually on a per-person basis. The food may also be accompanied with wine pairing. HoppingChef is one of the players that provide an aggregation platform for chefs.
Farm lunches:Diners are interested in seeing where their food actually comes from. This has given rise to farm lunches where one can take a tour of the farm and understand the nuances of farming (organic or otherwise). This is followed by a meal cooked using these ingredients and served in a rustic environment. The Sahakari Spice Farm, Goa; Saswad Farm Lunch, Pune.
Food walks:A two-to three-hour guided walk through a quintessential part of town where one gets to sample a variety of dishes popular in that particular area. Tushky, Magic Tours (Bangalore); Finely Chopped (Mumbai).
Pop-up restaurants:The concept of pop-up restaurants is still evolving in the country. The concept is popular in the west, especially in London and New York. The idea is to have a make-shift fine dining experience servicing gourmet food for a specific period of time in a city. A pop-up restaurant is typically more casual than its parent restaurant and is priced more competitively.

38
Deals in the food and beverage services space in IndiaAs there are not many players that have reached scale in the Indian market, the deals in this space have been limited both in terms of number and size. On average, there have been 10-12 deals in this space annually. In CY15, however, the deal count increased to 23 along with large deals like the PE funds raised by Faasos, acquisition of Indigo by India Value Fund and acquisition of the franchisee business of Pizza Hut.
On the public market front, Speciality Restaurants (Mainland China, Hopipolla), Jubilant FoodWorks (Domino’s, Dunkin’ Donuts) and Coffee Day Enterprise (Café Coffee Day) have gone public. While Hardcastle Restaurants (McDonald’s) merged with its listed group company Westlife Development to go public.
The number as well as the size of deals should increase as the Indian industry moves to organised from unorganised and as the Indian players scale up beyond one or two locations. Recently, PEs have shown interest in buy-out deals apart from fund-raising deals.The concept of pop-up restaurants is still evolving in the country. The concept is popular in the west, especially in London and New York. The idea is to have a make-shift fine dining experience servicing gourmet food for a specific period of time in a city. A pop-up restaurant is typically more casual than its parent restaurant and is priced more competitively.
Exhibit 26 – Deals in the last 5 years in the Indian restaurant industry
Note: The value was not disclosed for all deals.Source: VCCEdge, Avendus analysis

39
Exhibit 27 – Key deals in CY15 in the Indian restaurant industry
Target Format Brands Investors(s) Deal Value(USD Mn)
Faasos Food Services QSR Faasos Sequoia Capital, Lightbox
India, ru-Net 30.0
Degustibus Hospitality Casual Dining Indigo, Indigo Deli Indium Fund V 30.0
Massive Restaurants Casual Dining Masala Library, PaPaYa,
Farzi Café, Made in PunjabEverstone Capital Management 13.5
Sapphire Foods* Casual Dining/ QSR Pizza Hut, KFC
Samara Capital, Goldman Sachs, IDI Emerging Markets Partners, CX Capital
31.5
Barbeque-Nation Hospitality Casual Dining Barbeque Nation CX Capital 16.7
Faasos Food Services QSR Faasos Lightbox India, Sequoia
Capital India III LP 20.0
*Franchisee operations of Pizza Hut and KFC outlets from Dodsal Enterprise, Yum Restaurants India and othersSource: VCCEdge
Exhibit 28 – Key deals in CY15 in the emerging concepts
Target Format Brands Investors(s) Deal Value(USD Mn)
Zomato Media Rating Zomato Temasek, VyCapital 58.1
Bundl Tech Food Delivery Swiggy DST Global, Harmony Partners, Norwest Venutre, SAIF, Accel 38.9
Food Vista India Internet first restaurant FreshMenu Lightspeed Venture 17.0
TinyOwl Tech Food Delivery TinyOwl Matrix Partners, Nexus Partner, Sequoia 7.7
HolaChef Hospitality
Internet-first restaurant/ Home
ChefHolaChef Kalaari Capital & HNIs 3.1
EazyDiner Table Booking EazyDiner DSG Consumer Partners, Saama Capital 3.0
YuMistFoodtech Internet first restaurant Yumist Unilazer 2.0
Source: VCCEdge

40
Exhibit 29 – Valuation of listed Indian restaurant companies
Company Mkt Cap(INR Mn)
EV/Revenue EV/EBITDA PEReturn on
CapitalTTM(#) FY16E TTM(#) FY16E TTM(#) FY16E
Jubilant FoodWorks 63,512 3.0x 2.5x 24.3x 20.8x 57.2x 51.0x 18.6%
Westlife Development 33,629 4.3x 4.0x 169.2x 75.1x NM NM -3.8%
Speciality Restaurants 3,921 1.0x NA 10.4x NA 41.5x NA 3.1%
Coffee Day Enterprise1 46,412 3.3x 17.6x 21.4x 14 NM NM 2.4%
Note: (1) Coffee Day Enterprise is the holding company for Café Coffee Day, which is the largest business while the other busi-nesses are not related to the food business; NM - Not Meaningful; NA - Not Available.Source: Bloomberg (May 06, 2016), Avendus analysis
Challenges faced by the organised restaurant industry in IndiaUnorganised sectorThe unorganised sector accounts for about 70% of the restaurant market. The focus is on providing food at a reasonable price. The customers frequenting these places are indifferent to the experiential value like speciality cuisine and décor provided by the organised sector. Therefore, barring a few QSR players, like Domino’s and KFC, most players are restricted to the top seven to eight cities. The addressable market reduces considerably due to this reason. Also, the unorganised players do not actively pay taxes, which account for 15-20% of the final bill for the customers of organised players, which also makes organised restaurants unattractive for value seekers. The organised sector will grow as the aspirations of people increase with increase in income levels; however, the organised players will have to alter their model in order to take share from the unorganised players.
India is not a homogenous marketIt is said that in India if you travel 100 kilometres, the dialect changes and if you travel 500 kilometres, then the language changes. The same can be extended to food–the taste preference changes in 100 kilometres and the cuisine changes in 500 kilometres. India has rich culinary diversity, which poses a challenge for the organised players to expand. Indian brands need to adapt their business model to accommodate the preference changes while maintaining the integrity of their brands. They can take a cue from the experiences of US brands in India–McDonald’s does not serve beef and pork in India, KFC and McDonald’s have vegetarian-only restaurants in India and pizza chains Domino’s and Pizza Hut have served chicken tikka and kheema as toppings.
Retail spaceOne of the key success factors for a restaurant is location. Rentals have been increasing over the past few years, impacting profitability. Also, as there is a dearth of prime locations, the rentals at such locations are higher than average and can negate the benefits of high sales.

41
Supply chainThe supply chain is fragmented and marked by the presence of multiple intermediaries. The lack of infrastructure and cold-storage facilities and non-integration of the food-value chain result in about 30% of food being wasted across the chain. All these factors increase the cost of ingredients, which, in turn, reduces the profitability of operations.
LicensingA restaurant operator needs to take 14-15 licenses from various government agencies to start operations. Moreover, as there is no single window for application, the restaurant operator needs to approach various departments individually, which is a time-consuming and an unpredictable process. Getting the liquor license is an even bigger challenge and the age limit in some places is as high as 25 years.
ManpowerThe restaurant industry is labour intensive but the availability of trained chefs, managerial staff and other staff is low. Given the paucity of skilled manpower and the industry’s high attrition, the cost of labour is high. Also, due to the labour laws, hiring temporary manpower to address the peak requirements (say on weekends) is difficult and the restaurants need to hire staff taking into account peak traffic, which results in overstaffing for non-peak days.


43
Trends BreakfastBreakfast is fast becoming an important offering. Restaurant chains across the format spectrum are not only focusing on breakfast but also, in many cases, making it available throughout the day.
Healthful food/food with integrityCustomers are becoming more conscious about what is being served and are increasingly opting for restaurants providing cleaner ingredients. The preference for, and consumption of, whole grains and vegetables is increasing.
Fast CasualsThe preference for fast casuals such as Chipotle, Panera Bread and a host of other fast-casual chains offering burgers to pizzas and Mexican to Chinese is increasing. This is because they provide faster service, fresher ingredients, new flavours and customization
Local sourcingCustomers, specifically millennials, are increasingly demanding locally sourced ingredients. Restaurants are using their gardens, house-made or farm-branded ingredients and artisan items to satisfy the local-sourcing demands. From ice-cream to cheese, pickle to bacon, lemonade to beer, restaurants are producing their own signature menu items from scratch.
Sustainable/ethical sourceCustomers want to know if the restaurants are procuring the ingredients from a sustainable/ethical source. Chipotle and Panera Bread are leading the movement by promising customers of responsibly sourced meat, non-genetically modified products and removing artificial ingredients from their menu or recipes. Even big chains like McDonald’s and AppleBee’s have made commitments to use only cage-free eggs.
Going globalEthnic cuisine continues to make inroads into mainstream menus. Micro trending in this category is fusion cuisine, as well as authentic and regional, underscoring the breadth and depth of flavours being explored. Also, ethnic ingredients, including cheeses, flour and condiments, are increasingly finding their way into non-ethnic dishes. Specific dishes such as ramen, ethnic street food and kids’ entrées are also gaining momentum. After Mexican and Chinese, the Middle-Eastern concepts are picking up as they are also perceived to be healthy.
Mini- gourmetChildren’s menus are drawing more attention from chefs and restaurant operators. Gourmet kids’ dishes adopted from adult menu items with more adventurous flavour profiles than traditional children’s options are being offered. Growing in parallel are healthy versions featuring whole grains, vegetables, oven-baked items and entrée salads.

44
Small portionsLimited service chains have started offering small portions like mini burgers/hot dogs, little sandwiches and shakes that are smaller than small. They are intended to entice people who are searching for a small treat between meals, a cheap bite or a little something extra at mealtime. Reduced portion sizes can also be a way to attract deal-seekers because smaller sizes usually mean lesser prices. That’s an area some fast-food chains are struggling with as the rising cost of ingredients, such as beef and dairy, have made it tough to keep offering traditional dollar menus.
Limited Time Offers (LTO)LTOs are critical as they present loyal customers with fresh dishes and beverages and give restaurants an opportunity to test new items. Among the top-performing LTOs in terms of purchase intent and draw are LTO items that did not stray too far from the comfort zone of a chain’s customers. LTOs can also be a seasonal menu.
Waste NotEnvironmental sustainability remains a key trend–composting, recycling and donating are all tactics of food-waste management strategies tying into both sustainability and social responsibility. With rising food costs, food waste reduction and management is at the forefront of restaurant operations. Restaurant operators are taking a closer look at minimising waste and surplus as a cost-management tool.
Calories/salt listingIn a bid to differentiate healthy food concepts, Sweetgreen and Eatsa are listing calorie and sometimes nutrition content on their menu. Some city councils like New York City are mandating restaurant to list calorie and/or salt content above a certain limit.
The Herbivorous Butcher
Wrapping each slab with butcher paper, the bacon is ready to sell at the local farmer’s market to eco-conscious consumers. But unlike the other butchers, The Herbivorous Butcher takes humane and sustainable butchering to extreme: rather than killing animals, it uses juices, vinegars, spices and herbs to make dough that is steamed, baked or pan-fried to taste like meat.

45
Consumer Behaviour Food is becoming a vehicle for self-expression, a point of pride, a political statement, a declaration of identity and much more. Health seems to be on the consumer’s mind, too, although the definition of health and the perception of what is good varies and often in contradictory ways. Restaurants are responding by finding new ways to engage with their customers, not just with new menu items, but also with conversation about how their food is sourced, prepared and served.
Food as self-expressionNowadays, people post a picture of food or a drink from a restaurant via social media. This is not just for getting likes but also help them identify who they are based on their eating habits. The new ingredient that they become aware of (through food shows, restaurants) becomes a point of social conversation. Restaurants are introducing offbeat items to get people talking. Since food is fashionable, some diners want to be trend leaders by being the first to try new foods.
Looking for adventureMajority of consumers these days are looking for a food adventure. Restaurants have responded to these customers by introducing new ingredients. To give those ingredients broader appeal, restaurants generally introduce them in a context that makes them less alienating.
On another level, many consumers have restricted what they will eat, sometimes based simply on preference, but often based on real or imagined allergies or moral concerns. Restaurants are responding with an array of items to suit their customers’ dietary whims, from gluten-free foods to protein-focused bowls and snacks. For instance, at Panera Bread, customers are able to choose from the vegan, gluten conscious, protein rich and calorie conscious categories. Restaurants, however, need to understand that the preferences may not be permanent. Rather than catering to a specific dietary choice, they should have the flexibility in place within their systems to adjust to whatever the customers are looking for.
Power of perceptionConsumers often confuse terms that seem healthful like fresh and natural with actually healthful food (for example salads that have 1,200 calories). This reality is clear to restaurant operators and they are responding to consumers’ interest in real, fresh and cleaner food by removing artificial ingredients from their food with some chains going a step further by committing to provide antibiotic/GMO-free meat. These may not necessarily mean healthy but perception is what matters.
Giving control to the consumerCustomisation is often cited as a reason for the current success of the fast-casual segment. The open kitchen feel and the overt involvement of customers in the construction of their meals have given customers a sense of empowerment that makes them feel good about eating a 1,000-calorie Chipotle Mexican Grill burrito, when they would have felt bad about eating a 540-calorie McDonald’s Big Mac. Giving customers something to do, an activity that gives them the illusion of control, can work wonders for restaurants.

46
What customers say and what they doIt is a tall order to have reasonably priced, delicious, nutritious, humanely raised, sustainable, local food on hand for every meal. As a result, people often pick and choose their values or engage in psychological bargaining such a drinking diet soda and rewarding themselves with a slice of cheesecake. People also eat meals they feel are good for them early in the week and blow their diets on Fridays. NRA found that on Mondays the three US burger chains witness slow sales, which spike as the week progresses. Similarly, at a wing chain, Friday sales are 75% higher than Monday sales. Conversely, a salad bar saw sales on Friday that are 43% lower than they were on Monday. Sometimes, it comes down to cost and speed while opting for a meal. As much as people might be concerned about social justice and a clean planet and their own health, sometimes they are hungry and just want to eat lunch.
“ “
The build-your-own segment, within the fast-casual segment, has been the fastest-growing segment in the industry

47
Five ways restaurants can attract today’s customers
Being transparentMany consumers are increasingly interested in knowing where ingredients come from and howtheir food is made. The restaurant should be ready to answer their questions honestly and to explain the decisions. If many customers object to some of the practices, then the restaurants should explore ways to adjust them so that they better align with their customers’ values. To gauge the potential returns, restaurants can look at the success story of Chipotle’s “Food with Integrity” mantra.
Being funRestaurants should try offering unusual items as specials to help express their brand. Mooyah Burgers, Fries and Shakes did just that with its Jelly Donut Milkshake. The item drew attention to the chain’s other shakes, and also boosted sales. Special items will help restaurants get noticed and, possibly, garner positive attention on social media. With more and more customers, especially millennials, posting pictures of food and drinks from restaurants on social media, that kind of attention can be valuable.
Being engagedRestaurants should use social media, loyalty programmes or other methods to receive and respond to customer feedback. Restaurants can ask customers for menu suggestions to help give them a sense of ownership in the brand. If the customers are asking for gluten-free, vegan or other niche products, restaurants should consider responding to them: if one person in a party of eight wants a gluten-free item and the restaurant can’t provide it, then all eight of those people will take their business elsewhere.
Offering healthful choicesNot offering healthful choices, even if the focus is fried chicken, is not an option anymore. To many people, a small act of self-sacrifice can justify a fairly high level of gluttony. Ordering a chicken sandwich instead of a hamburger can justify a larger order of fries, according to psychologist William Hallman of Rutgers University. Those items can also offer cover for gluttony, he says. “Before salads were on the menu at McDonald’s, when you went there, everyone knew what you were ordering,” Hallman says. “Now there’s a little bit of wiggle room. You can say, ‘I went to McDonald’s but I had a salad.’”
Offering customisationMany consumers today feel better about their food if they can customise it. The fast-casual model of assembling food in front of customers seems ideal, but regardless of the service style, it is important that customers know that the restaurant will happily add, take away from or otherwise modify their order in any way they like. Restaurants might even consider making customisation part of the ordering process.

48
Breakfast: Evolving as an all-day affairBreakfast is becoming an important offering as customers are craving breakfast food morning, noon and night. Sales of breakfast items like coffee, pancakes and doughnuts are outpacing lunch and dinner items. This has prompted chains like McDonald’s, Taco Bell, Dunkin’ Donuts and buffet chain Golden Corral to offer all-day breakfast joining Denny’s, IHOP, Jack in the Box and Sonic Drive-In. Chains like IHOP are coining and using term like ‘Breakfastarians’ in their ads.
National chains like McDonald’s, Starbucks and Panera Bread are highlighting the strength of breakfast sales in their quarterly reports as breakfast is more profitable for some chains. The focus on breakfast helped McDonald’s to achieve positive same-store sales growth after eight quarters of decline and same-store sales growth for the quarter increased by more than 5% after 14 quarters.
Listed below are some of the trends in breakfast
Need for indulgenceWhen consumers eat breakfast on the run, they accept comfort food in whatever form their schedules allow. When given the luxury of time to enjoy breakfast, they want indulgence–upscale eggs benedict, a goat cheese and artichoke scramble, lobster crepes, fresh juice and flavoured coffee–like at the brunch chain outlets of Golden Corral and Macaroni Grill.
In pursuit of indulgent profitsCountering the popular notion that serving breakfast food at the same time as high-priced lunch and dinner items will reduce profits, some restaurant operators see breakfast as an opportunity for showcasing creativity with breakfast foods, including more upscale ingredients later in the day when people have more time to enjoy. Indulgent food reignites consumer interest and helps restaurant reap profits.
Convenient breakfastConvenience store operators are capitalising on breakfast’s popularity to transform people stopping for fuel on the way to work into breakfast patrons. According to Mintel’s 2015 report, Convenience Store Foodservice, 32% of those surveyed had purchased a made-to-order breakfast sandwich at a convenience store.
CustomisationOmelettes, the original customisable food, have landed their own place on build-your-menus with IHOP, Perkins and Friendly’s all offering build-your-own omelette options. Independent operators, however, are going the extra mile, offering the lengthiest list of ingredients. Customisation also leads to better profitability for restaurants as the feeling of control comes with certain satisfaction and makes consumers less price sensitive.
The cultural evolution of healthBreakfast is a great platform to offer many options for virtually any definition of the word healthy. Restaurants are taking advantage of this based on their adoption and creativity. Eggs can take healthy breakfast in many directions in the form of breakfast burritos, omelettes, benedicts, frittatas and sandwiches. Adding any mix of vegetables, cheeses, herbs, salsas, poultry products or tofu can produce low-calorie, gluten-free or energy-rich, high-protein dishes.

49
Daypart-blurring proteins–As millennials become the most important consumer group, the daypart boundaries are getting eroded due to their habit of eating whatever/whenever. Roasted turkey and chicken have migrated to the morning menu and egg-topped burgers, salads and vegetable dishes have proliferated. Consumers are also showing more interest in high-protein items like eggs, meats and yogurts during their breakfast meal.
Food with integrityConsumers’ definition of health food has broadened. It is less about removing negatives or adding positives and more about simply eating real food. The health movement is definitely not a trend but it is evolving. Healthful is the main characteristic that customers across all segments and nearly all demographics want to see more of on restaurant menus and are seeking food that is real.
What people consider healthy has changed with time–the definition has moved from low calorie or low fat to fresh, whole grain, antibiotic-free, made from scratch and organic. For restaurants, the use of these elevated ingredients and techniques underscores the credibility and value of their menu.
Restaurants are increasingly offering their menu in wholegrain, which has high fibre content, and gluten free. They are also introducing ancient food from forgotten plants like quinoa, chia seeds and peer cactus. Plants like kale are being used not only in salads but also in dishes and smoothies. Fast-casual pioneers like Chipotle and Panera Bread have been promoting the use of non-genetically modified products in their menu. Now, they are planning to move towards grass-fed beef and cage-free eggs. Large QSR chains like McDonald’s are also committing towards options like cage-free eggs.
Customers say they want restaurant food that is healthful and that they plan to eat at restaurants they consider healthful. It is, however, difficult to actually sell healthful food as restaurants are considered an indulgence and many customers do not want to compromise when they dine out. Customers still want to measure their food on taste and experience and do not want to sacrifice on these parameters.
Many concepts are responding to the trend by adding more real food options to their menus while others are launching campaigns to shed light on existing real food practices. Better-for-you options have long been available at Darden’s Olive Garden and LongHorn Steakhouse; recently, Darden revamped those offerings to meet consumers’ changing health demand. It is not just about better-for-you but also better-for-you that is desirable. To solve the problem, Darden has reinvented its better-for-you options at both brands, offering a selection of items that are delicious and carve-able but with fresh cues.
Some healthful food concepts that are busting the traditional service model

50
Farmers’ FridgeThe kiosk is an oversized vending machine loaded mostly with salads made fresh that morning and stored in mason jars. It has 30 locations in the Chicago area with plans for up to 100 and designs on taking the concept national.
Whole-food conceptsSweetgreen, Chop’t, Tender Greens, Lyfe Kitchen and Greek food fast-casual concept Cava Mezze Grill. All these chains aim to develop a nationwide chain of guilt-free limited service restaurants serving low-calorie items made with all natural ingredients.
EatsaIt has a bowl-based menu with a quinoa base. The customer can give a customised order on the store’s iPads or smartphone app. When the made-to-order bowl is ready, the customer can retrieve the meal from small glass compartments.

51
E. Coli scares Chipotle consumers and investors
For years, Chipotle had been promoting ‘food with integrity’–fresh, genetically modified organism (GMO)-free ingredients–and was considered the gold standard for quality. Its reputation was tarnished as the E. Coli outbreak was linked to some of its restaurants. This resulted in negative same store sales growth for the first time since going public in January 2006. In December 2015, same store sales declined by 30%. Investors dumped the stock, which tumbled by around 40% post outbreak.
Same store sales growth (%)
(15)
(10)
(5)
0
5
10
15
20
2013 Q1 2013 Q2 2013 Q3 2013 Q4 2014 Q1 2014 Q2 2014 Q3 2014 Q4 2015 Q1 2015 Q2 2015 Q3 2015 Q4
CMG US Equity
Stock price movement vis-à-vis SPX Index since January 2013
050100150200250300
CMG US SPXSource: Bloomberg
1.0
5.5 6.2
9.3
13.4
17.3
19.8
16.1
10.4
4.32.6
14.6

52
Soup sales: Key upselling opportunityAccording to consumer surveys, more than two-fifth of consumers visit specific restaurants because they enjoy soup. It is, however, vital for restaurant operators to emphasize uniqueness in order to keep soup lovers coming to their outlets as soup as an offering competes with the retail sector due to the availability of instant soup. While soup is a traditional favourite, customers expect variety when it comes to consumption at restaurants. The following are a few strategies that successful restaurants follow for promoting and presenting soup.
Л Trending keywords – Use trending keywords in the soup menu description, call out special ingredients and also be sure to complement descriptions with appealing food photography.
Л Menu callouts – Highlight soup on the menu or the menu board and feature it prominently as a selection combo meal.
Л Seasonal Rotation – Rotate soup according to season and try to menu three-four soups, including at least one lighter broth-based soup, a cream-based soup, a vegetable option and one more adventurous ethnic flavour profile.
Л Staff training – Have the staff try each soup and encourage them to make their own personal recommendations to customers, including pairing suggestions for featured entrées. Also equip the staff with appealing easy-to-remember soup descriptions.
Л Sampling – Sample new soup varieties on a regular basis to encourage trial. Have a hostess offer soup samples to customers who are waiting for a table.
Л Garnishing – Speciality crackers or fresh breads can elevate soup’s perceived value, allowing restaurants to command a higher price point.
Menu: Narrow, focused, customizableMcDonald’s spent the last decade adding products to its menu in a successful strategy that earned it among the highest average unit volumes (AUV; USD 2.5 million) in the QSR business. Burger King tried in 2010 unsuccessfully and, by 2013, the chain’s sales were decreasing, forcing the company to alter the strategy and shift towards fewer products. These products were easier to create, so they could be made faster with fewer new ingredients, which resulted in sales increase in 2014.
As consumers, especially millennials, are gravitating towards speciality concepts, the shift towards a narrower menu is happening across the industry. Fast casuals and new QSRs have very focused menus in which they are specialising. Chick-fil-A has a menu that is half the size of McDonald’s and AUV of USD 3.1 million despite being shut on Sundays.
A smaller, focused menu also helps in streamlining operations and increasing efficiency, thereby improving profitability. Steak ‘n’ Shake reduced its menu to half focusing on core products in 2008, resulting in simplicity of operations. The chain has experienced same store sales growth every quarter since the change.

53
Chipotle has a simple menu but is so customisable that it provides customers with enough variety to generate AUV of USD 2.4 million without breakfast. Its operational simplicity has helped the chain get such volumes inside small stores. The chain is careful about additions to the menu to retain the simplicity. They will add ingredients only if they feel that the additional item will bring new customers or increase frequency among existing customers and not if it just splits the existing customers between the existing and new items.
Chains often increase the menu to attract new customers or to eliminate the ‘veto vote’ a phenomenon in which a member of a party vetoes a concept based on its menu. For instance, burger chains may add chicken sandwiches to attract people who do not eat beef or salads for health conscious customers. Chains are, however, better off cutting from menu and specialising in a few things so that they attract enough customers looking for quality to offset the loss due to veto votes.
Larger menus can also increase complexities that result in slow service, which is critical in the QSR and fast-casual concepts. McDonald’s, after years of adding to the menu, is currently researching how to shrink its menu. Decreasing sales have forced McDonald’s to reduce the complexity of its operations and have a simpler menu.
Points to remember while adding menu items
Л For every successful idea that works, there are hundred that fail to hit the mark.
Л Restaurants can take inspiration from what they see emerging in the broader food market place like food trucks or an ingredient that is suddenly becoming popular. Corporate chefs have to adapt their find so that it resonates with the brand.
Л Sales matter but if an item proves popular but ends up cannibalising other items, it may not add much to the bottom line.
Л Operations are a factor as well–an item could be a hit with customers but if it poses problems for the kitchen crew, its popularity may be irrelevant.
Л The testing phase can also become the tweaking phase for slight adjustment in the recipe or product formulation that will make all the difference.
Л An item may work at some place but not at another.
“ “
Chipotle claims a customer can order 65,000 menu combinations due to customisation.

54
Menu pricing strategyEventually, all restaurants have to increase their menu prices due to increase in ingredient costs or salaries and other costs. The moot point to be considered at the time of increasing the price is timing. Restaurant operators can consider the following points while changing menu prices.
Л Pairing price change with scheduled menu reprints – Restaurants need to reprint their menu at regular intervals as the old menu gets worn out or while adding or removing menu items or introducing seasonal items. This can be the ideal time to change prices as the change is accompanied by other changes in the menu.
Л Raising prices around signature item(s) – Menu prices can also be changed around the signature pricey item(s), which can act as a benchmark, in small incremental amounts. Or while maintaining the prices of a couple of entry-level items. This strategy can help the restaurant to create a perception that the prices have not changed.
Л Discussing with suppliers – Restaurants can try working with their suppliers to bring some of the everyday costs down to the extent possible. Sometimes, the surge in prices of certain items may be temporary; for example, chicken prices may increase due to unavailability on account of bird flu. Restaurants can also discuss if there are cheaper alternate products that could be swapped into the menu, and alter recipes accordingly, without changing the price.
Л Lowering prices – Usually, restaurants will not lower prices but raising and lowering prices at the same time can be a successful strategy as customers will appreciate lower prices. While the restaurant is increasing the menu prices in general, prices of menu items that define the concept or have strong margins can be lowered to maintain the goodwill among the customers.
Л Raising the perceived value of an item – If the value of an item is perceived to be high by the customers, then the incremental price rise will not have a negative effect. The creativity of the restaurant is the key factor that can build the perception around the menu.
Before increasing prices, it is critical for a restaurant to know which menu items have high perceived value, which are bestselling and which are not working. Shifting menu trends in the industry mean restaurants must continually evaluate and update the menu. Restaurant operators may believe that they know which items the customers enjoy the best and the most cost effective way to produce these selections. Using analytical tools on the appropriate data can sometimes reveal surprises for operators.
To understand how effective a menu item is, Swipely (a restaurant analytics and credit card processing company) has created a formula for evaluating restaurant menu items and their benefit to the business in terms of creating loyal repeat customers.
% Formula weight Single menu item/average for all menu items
40 Orders
40 Retention rate
20 Menu item price

55
The results of the formula will give each menu item an index score usually between 30 and 200
Л A score of 100 is for an average menu item
Л A menu item that scores 123 is 23% more valuable to the business than an average menu item
Л A menu item that scores 87 is 13% less valuable to the business than an average menu item
Once the restaurant has the understanding of how the menu items perform, it can start making better business decisions that lead to more profitable menus.
Л Training the staff–Restaurants should train the staff on items that have the highest index scores.
Л Provide profitable recommendations–Between two similar items (say, two fish choices), the server can steer the guest towards the more valuable item.
Л Determine pricing–Instead of raising all the prices, restaurants can raise the prices for highest-performing items slightly–customers will barely notice and still continue to order them.
Attracting millennials to restaurants
Л A creative menu – Restaurants need not put unconventional combinations of ingredients on the menu but need to use interesting descriptions for items.
Л High-quality ingredients – Millennials have shown they are willing to pay for quality ingredients. Putting organic veggies and antibiotic-free meat on the menu or stressing the origin can attract millennials.
Л Customisation – Millennials love creativity and nothing is more creative than being able to craft your own food. Customisation helps in keeping millennials fully involved in the culinary process.
Л Drinking up – Millennials have turned drinking into an art form and, therefore, have forced restaurants to offer craft beer and handcrafted cocktails. They also love variety and shareable drinks.
Л Social media hashtags – The quickest way to ensure millennials promote restaurants on social media is by putting social media handles on the menu along with creative hashtags.
Л Camera ready food – Millennials love to share pictures of whatever they are doing, including the food they are eating. Hence, it is essential that the presentation of food is ’click-worthy’.


57
Trends Л Limited service restaurants (QSRs and fast casuals) are experimenting with serving alcohol, especially beer and wine, and to some extent cocktails.
Л Beverage on tap is an evolving trend with restaurant operators, apart from serving beer on tap, also serving wine, cocktails and even tea and coffee on tap.
Л Limited service restaurants are employing self-service drinking stations.
Л Increasingly, brew masters are aging beer in barrels to give an exotic flavour to the beer.
Л The demand for craft beer and microbreweries is on the rise at the cost of commercial beer.
Л Restaurants are adopting beer-food pairing programmes along the lines of wine-food pairing.
Л Fine-dining restaurants are creating multi-course vegetarian meals around their wine list.
Л Restaurants are creating savoury cocktails as well as cocktails with a bitter taste.
Serving alcohol: Key growth strategy for fast-casual chainsServing alcohol is one of the ways for fast casuals to garner more market share from casual dining. While Chipotle went upscale with hand-shaken Patron margaritas, Smashburger took a regional approach to craft beer and Shake Shack incorporated proprietary wine and beer. For 800 Degree Neapolitian Pizzeria, alcohol service puts the fast-casual chain in the date-spot category and helps capture more dinner traffic. At Tokyo Joe’s, Asian beer is such a staple that they use recycled beer bottles to serve soy sauce at the table.
Historically, alcohol has been all about the sales volume, prompting many limited-service operators to question its significance in the absence of large volume. Serving alcohol has a unique ability to enhance customer experience, however. Fast-casual chains have pushed the quality of food so high it seems fitting to pair beverages with it. Drinks are usually approachable and affordable.
In the US, according to research by Technomic, 42% of drinking-age adults order an alcoholic beverage at casual dining while 24% do so at a fast casual. The numbers are slightly higher among millennial diners and Hispanics.
Apart from fast-causal chains, QSR chains like Taco Bell (Taco Bell Cantina) and Burger King (Burger King’s Whopper Bar) are also experimenting with serving alcohol.

58
Fast-casual chains: Rewriting the wine listOffering alcohol is one of the key differentiators between fast-casual and QSR chains. When restaurants want to emphasise that they are offering high-quality food within their casual environment, they turn to wine to help separate their restaurants from QSR chains.
While wine competes with beer for customer attention at fast casuals, there are generally few liquor options, if any at all. Partly, this is about speed of service: wine does not require the mixing time of a craft cocktail; it is simply poured and served. Fast-casual chains prefer short menus that keep customers focused on a limited set of options and the line moving. Wine by the glass suits the high volumes at fast casuals well. In order to further increase the speed of service, fast casuals are opting for boxed wines and kegs to pour quickly.
Fast casuals also do not have a sommelier and so the wine list has to work by itself. Overall accessibility, with options that can suit a wide range of tastes, is an important factor in the success of wine offering at fast casuals. Pricing is another factor. While traditional restaurants mark-up three-four times the cost, fast casuals are sacrificing margin in favour of volume. Given the high volumes at fast casuals, maximising revenue on each sale is less necessary, further improving the volume of wine sales.
As fast casuals continue to expand their reach, and as diners make it more of a part of their dining habit, there will be more innovation in the menu. The extent to which wine has already played a successful role at these establishments without embracing the old rules is noteworthy.

59
‘Evenings’ at Starbucks
Starbucks is accelerating its efforts to sell wine and craft beer at its US stores. The companyalso offers small plates such as bacon wrapped dates and truffle mac ‘n’ cheese. Currently, the offerings are available at 70 stores. The company has submitted liquor licence applications for several hundred more locations and has plans to introduce the concept in more than 2000 stores. The company aims to achieve USD 1 billion revenue from alcohol sale by 2019.
Starbucks offers a very relaxed, casual atmosphere with drinks that very few places offer. The programme is very popular among women (who account for 60% of traffic) as Starbucks is perceived to be a safer and a more inviting option to meet friends during evening hours than a bar. These stores are also attracting book clubs, knitting circles and even the occasional Bible study. The menu is also drawing online daters meeting for the first time.
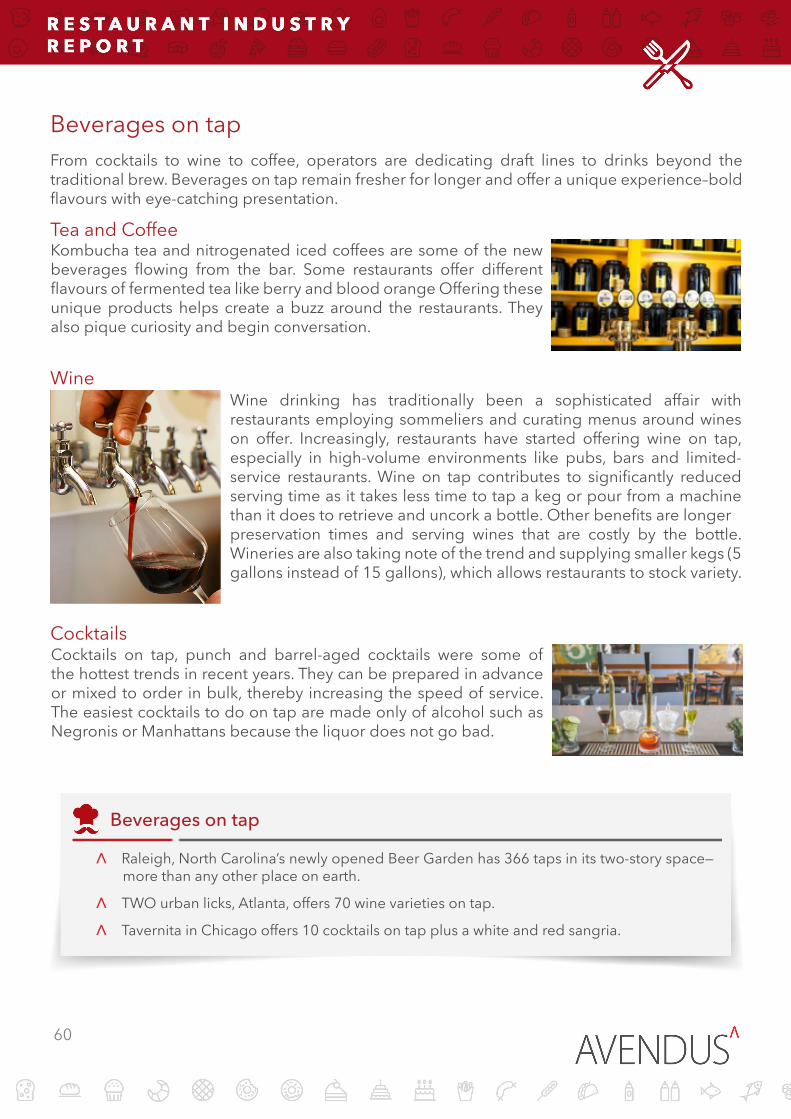
60
Beverages on tapFrom cocktails to wine to coffee, operators are dedicating draft lines to drinks beyond the traditional brew. Beverages on tap remain fresher for longer and offer a unique experience–bold flavours with eye-catching presentation.
Tea and Coffee
Wine
Cocktails
Beverages on tap
Л Raleigh, North Carolina’s newly opened Beer Garden has 366 taps in its two-story space—more than any other place on earth.
Л TWO urban licks, Atlanta, offers 70 wine varieties on tap.
Л Tavernita in Chicago offers 10 cocktails on tap plus a white and red sangria.
Kombucha tea and nitrogenated iced coffees are some of the new beverages flowing from the bar. Some restaurants offer different flavours of fermented tea like berry and blood orange Offering these unique products helps create a buzz around the restaurants. They also pique curiosity and begin conversation.
Wine drinking has traditionally been a sophisticated affair with restaurants employing sommeliers and curating menus around wines on offer. Increasingly, restaurants have started offering wine on tap, especially in high-volume environments like pubs, bars and limited-service restaurants. Wine on tap contributes to significantly reduced serving time as it takes less time to tap a keg or pour from a machine than it does to retrieve and uncork a bottle. Other benefits are longerpreservation times and serving wines that are costly by the bottle. Wineries are also taking note of the trend and supplying smaller kegs (5 gallons instead of 15 gallons), which allows restaurants to stock variety.
Cocktails on tap, punch and barrel-aged cocktails were some of the hottest trends in recent years. They can be prepared in advance or mixed to order in bulk, thereby increasing the speed of service. The easiest cocktails to do on tap are made only of alcohol such as Negronis or Manhattans because the liquor does not go bad.

61
Beer RenaissanceCraft beer, food pairing and aging of beer are some of the key trends emerging in the beer world. Edging up in consumers’ perception of luxury items, beer has entered the worlds of white tablecloth and staff certifications, food pairings and tastings, education events and intimate experiences. Stepping out from wine’s shadow, ales, lagers, stouts and other brews are embracing artistry, refinement and a quality over quantity mind-set to capture consumers’ imaginations. Craft breweries and micro-breweries are hosting brewery tours to give consumers the first-hand experience of the brewing process. Another wine tradition that is being adopted is staff certification.
Craft beerIn the US, craft beer accounts for 11% in volume terms and around 20% in value terms. There are a total of around 3,500 craft breweries. At many breweries, innovation and artistry combine to push beer’s longstanding norms, experimenting with everything from ingredients to storage methods. Consumers are embracing distinctive, esoteric styles and a willingness to pay more for well-built beers, barrel-aged brews or limited/seasonal production offerings. As craft breweries are taking away the share from the major brewers, acquisition increased in this space with at least 24 craft breweries being acquired in 2015 by major brewers, such as AB InBev and Heineken, and PEs like LNK Partners and Fireman Capital Partners.
Beer-food pairingFood pairing, which was till recently associated primarily with wine, is being curated around beers by many restaurants. Apart from artistry and innovation, accessibility is an important factor in beer’s surge–while the globe’s best wines enter the six-figure territory, the finest beers run a fraction of that cost. Like wine, restaurants are beginning to identify the beers by producer, region and vintage (if applicable). Consumers are also flocking to restaurant events that celebrate beer, ranging from beer dinners to brewer’s weekends. Even Michelin-star restaurants are taking note of beer. Eleven Madison Park, a Michelin three-star restaurant, weaves beer seamlessly into a fine dining space by offering carefully curated 180 selections from around the globe, including some rare, unfamiliar brews, alongside cutting-edge cuisine.
Deals in craft beer in India
Л Sequoia Capital recently invested around USD 6 million in Cerana Beverage, which manufactures Bira 91 craft beer.
Л Angel investors have invested in microbreweries White Owl Brewery and Giest.

62
Aging of beerCocktails on tap, punch and barrel-aged cocktails were some of the hottest trends in recent years. They can be prepared in advance or mixed to order in bulk, thereby increasing the speed of service. The easiest cocktails to do on tap are made only of alcohol such as Negronis or Manhattans because the liquor does not go bad.
Self-serving drink station
measures the flow of beverage. The amount is deducted from the customer’s account.
The system is also integrated with point of sales (POS) and enterprise resource planning (ERP) systems, giving restaurants the control of the flow rate. The system also alerts the management when the barrels need to be replenished and even the orders to the vendors can be sent. Some of the systems can also be integrated with loyalty programmes with customers giving feedback and ratings on the beverages they had.
Apart from reducing employee cost, these systems offer following advantages – Л Once the pre-paid card /wristband is loaded, the customers do not have to wait for the bartender.
Л Since the taps are metered, customers are not restricted to buy in multiples of specified quantity (say pint); they can buy in smaller quantities, which may result in increase in beverage sales.
Л As the system is integrated with POS, the popularity of a beverage can be better analysed. Л Typically, per keg, there is 20% loss, which can reduced or even completely eliminated by using metered taps.
Beyond the Vine
Restaurants specialising in serving beer are providing tips for switching over from wine to customers:
Л Instead of a Chardonnay, try a spicy white ale.
Л Go for a brown ale in place of a Malbec.
Л Instead of a Pinot Noir, taste an India Pale Ale.
Л Forgo the Riesling for a delicious wheat beer.
Limited-service restaurants are employing self-serving drink stations to increase revenue without increasing the associated employee costs. The customer loads a pre-paid card/wristband at the cash counter where age verification is also done before issuing the pre-paid card/wristband. The display system provides pricing and other information on the beverage. The customer swipes the card or touches the tap while wearing the wristband, the system then opens the valve and meter

63
Since the system can be integrated with the ordering process and provides alerts, the just-in-time ordering process can be implemented.
Sustainable Tap BeerBeer drinkers will always choose their beer based upon quality, taste and local origin. Some breweries are trying to add environmental sustainability to these parameters. This craft eco-beer is similar to the booming farm-to-fork movement and could help boost their beer sales by telling an engrossing eco-story about how the product was made. Why sustainable beer is importantDepending upon the agricultural practices, location and technology, the brewer can take up to 75 litres of water to brew a pint of beer. Growth of craft beer is affecting water supplies in the US. In California, where there is water shortage and 68% of water is utilised for agriculture, at least 500 breweries operate that compete for water in the state. Due to water constraints, some breweries are reducing production.
What are breweries doing– Л Sierra Nevada, which diverts 99.8% of its solid waste from landfills, recycles carbon dioxide from its fermentation tanks and owns one of the largest private solar power panels in the US.
Л Hellbender Brewing purchased an expensive but highly efficient mash filter that requires 15% less grain and 35% less water per batch of beer than standard filters. The company also donates its spent grain to local farmers for animal feed.
Л Miller Coors works with farmers to minimise the footprint of its beer raw ingredients barley, hops and wheat. The company saved 440 million gallons of water over three years, the equivalent of water used in one brewery for around five months.
Bar Menu EconomicsAlcohol can be a great profit centre at restaurantsBeer, wine and spirits are all generally more profitable than food and their sales are generally incremental to whatever food customers are ordering. To get the most out of alcohol sales, restaurants can benefit by having systems in place to measure sales and control inventory.
Managing costsIt is important to strike the right balance between the pour cost (how much it costs to make a drink) and the price. Pour cost is easy to calculate but there are other considerations when it comes to managing the cost of the beverage such as labour and time taken to prepare the drink. For its popular drinks, restaurants can make a compound syrup instead of bartender picking up multiple bottles during service. Having unique cocktails are important as they generally have better margins than beer and wine. Therefore, it is important to make sure the restaurant has a robust bar programme.
Restaurants also need to review their bar programme regularly and keep up with trend.


65
Restaurant delivery disruption Uber-ification of everything
With people’s growing desire for on-demand, personalised service, meals and food are no exception. Meals and independent restaurant delivery services have caught the imagination of customers and investors. Meals at home used to be conventional. Today, recipes are becoming more adventurous with experimentation and customisation are driving the demand. Meal delivery services do this by offering an ever-changing assortment of imaginative chef-inspired dishes; independent restaurant delivery services do it by delivering from menus of many different eateries.
Development in technology is driving the growth of food delivery. The analytics behind Uber matching supply and demand are being copied and applied by restaurant delivery services. Apps provide a friction-free environment in which customers customise, track, communicate about and pay for orders.
Great brands are aware of trends and use that knowledge to better understand customer needs. They succeed by pursuing their own, disruptive ideas. A brand may decide that high-touch, low-tech service is a hallmark of its brand and delivery would detract from the customer experience it wants to offer. If a brand decides to do delivery, it should develop and use a system that aligns well with its values.
On demand delivery has created a new generation of companies—internet-first restaurants—that operate out of central kitchens and provide delivery to customers. These companies have a limited menu offering, which is rotated through the week. Also, aggregators/delivery companies are aggregating restaurants and providing delivery services on their behalf. These are providing a revenue boost to restaurants and are a boon especially to small chains and independent restaurants that do not have the resources to build their online presence
The following are some of the events that are defining delivery service –
Brands pick their partnersPostmates signed on as official delivery partner for Chipotle and agreed to test delivery for McDonald’s and Starbucks. DoorDash signed on with Taco Bell, KFC, 7-Eleven and Dunkin’ Donuts.
Starbucks tests delivery in New York City, Amazon launches restaurant delivery for Prime members Starbucks debuted Green Apron delivery by baristas at Empire State Building in New York City for a flat fee of USD 2 with no minimum order. Amazon is making restaurant delivery service available to its prime members (USD 99 per year subscription service) in various markets using its shipping company’s fleet of drivers.

66
Domino’s soup up vehiclesDomino’s launched a delivery car with a built-in warming oven. The company also made it easier to order pizza for delivery on its app, Twitter, and online by using emojis.
Chipotle goes to collegeChipotle expanded its delivery service to college campuses in partnership with Tapingo, a company that specialises in the closed-campus ecosystem. Tapingo has clearance to deliver on more than 100 campuses and uses students as delivery drivers.
In-N-Out Burger fights backIn-N-Out Burger sued DoorDash for delivery without permission citing trademark infringement and concerns over food safety. The move raised concerns that other restaurants will follow suit. While restaurant chains have experienced incremental sales, some restaurant chains have asked delivery firms to stop delivering their products, saying they want to have more control over consumer exposure to their brand.
Food delivery by casual-dining restaurantsMany full-service restaurants look down upon the idea of offering their food for delivery citing food is only one of the aspects of their service. Given the hectic daily schedules of many customers, however, convenience outranks in-person dining. Also, delivery can boost weekday sales when customers do not want to travel or at times when it is difficult to get out like when it is raining or snowing.
Restaurants should think of offering delivery as the equivalent of foot traffic and, hence, strong online presence is important. Even if the customers do not order, online presence will get the menu, brand proposition and food in front of a far larger audience than if the restaurant is limiting itself to only the dining-in experience. Full-service restaurants should, however, understand the difference between delivering, say, a pizza and their meals and develop a top-class delivery experience by keeping in mind some of the best practices.
Л Using insulated, temperature-specific delivery bags – It is important that the delivery food taste is as fresh it was served in the restaurant. Using wrong bags can result in the delivered food becoming soggy, cold or unappetizing. This can be avoided by using insulated, temperature-specific delivery bags.
Л Using top-notch delivery containers and packaging – Restaurants should not use cheap containers that may impart unwanted flavours to the food. The use of good quality delivery containers and packaging will also help the restaurant to build a strong brand.
Л Avoid mixing cold items with hot items – Restaurant should never mix cold items such as desserts and salads with hot items like entrée and soups; customers will not appreciate a warm salad or melted ice-cream. Combining hot and cold items will also indicate laziness on the part of the restaurant thereby damaging the brand.
Л Drivers should not call customers for directions – Calling the customer for instructions is an avoidable nuisance that detracts the delivery experience. Restaurants should provide the technology to the drivers so that they can deliver without calling the customer for directions.

67
Domino’s: The delivery innovatorDomino’s airplane pizza delivery
Domino’s delivery car with warming oven
Domino’s text ordering
Domino’s ‘push for pizza button’
Domino’s has teamed up with airline Winair to deliver pizzas to Saba and St. Eustatius islands from Princess Juliana International Airport. An employee hops on a regularly scheduled 20-minuteflight with pizzas. Customers come to the airport to pick up their orders. Domino’s charges USD 2.75 for the service.
The biggest feature is a Domino’s-branded warming oven located behind the driver’s door and storage areas for easy loading and unloading of pizzas. The oven can hold two Heatwave bags and drivers can access it with the touch of a key fob. It can hold up to 80 pizzas.
The new system lets customers who have a pizza profile at Dominos.com to place an order by texting the phrase ‘Easy Order’ or simply the pizza emoji. Customers can also place the order via Twitter, Samsung Smart TV, Android Wear smartwatch apps, the Ford SYNC Applink and by voice ordering through its smartphone app.
The biggest feature is a Domino’s-branded warming oven located behind the driver’s door and storage areas for easy loading and unloading of pizzas. The oven can hold two Heatwave bags and drivers can access it with the touch of a key fob. It can hold up to 80 pizzas.


69
Customer Experience: Aggregation of all of their interactionsCustomer experience is the sum of all the interactions the customer has with the company. People are used to getting what they want, where they want it, how they want it and when they want it, and now expect on-demand personalised service from all companies. Customer service problems no longer remain isolated individual issues but are broadcast to all of their friends and followers. Therefore, customer experience has become increasingly important and restaurants can take lessons from other consumer-servicing industries.
Being entertainingPeople are drawn to brands that make them feel excited. Trader Joe’s makes grocery shopping a fun experience. The fun shirts that employees wear, the bell used to indicate the need to open new checkout stands, hand-painted signs and cute displays contribute to the experience at Trader Joe’s.
Being empatheticGreat customer experience is built upon a deep understanding of what customers want and need. For instance, Virgin Atlantic’s boarding pass is designed to be folded and fit in the pocket; the pass has all information visible and the type size is large enough to be read at a glance.
Engaging the sensesIf the customer experience engages the five senses, then it can increase the brand’s emotional appeal. The management of Starwood Hotels and Resorts has created distinctive patented smells for each of the company’s hotel brands–a white tea fragrance for Westin and a signature lemon zest scent for W Hotels.
Executing with excellenceGreat brands set high standards for themselves and hold themselves to them. Chick-fil-A aims to provide service comparable to finer establishments. When a customer thanks an employee, the response is “my pleasure” (not “no problem” or even “you’re welcome”). Employees roam the dining room offering to refill drinks and help guests to their cars. The employees even fold down the corners of the toilet paper in the restrooms.
Embodying the brandUsing the brand to design customer experiences ensures that the focus is on the right things. One of the key things about customer experience design and management is being intentional and focusing the resources on the details that have the most impact. Shake Shack’s brand platform, for example, is grounded in hospitality. So, everything it does is designed to deliver enlightened hospitality, including providing induction loops at its cash registers so that people who are hard of hearing can switch their hearing devices to a mode that enables them to hear the order taker better. The technology required significant investment that only benefits a small portion of its guests, but it made sense for the Shake Shack brand.
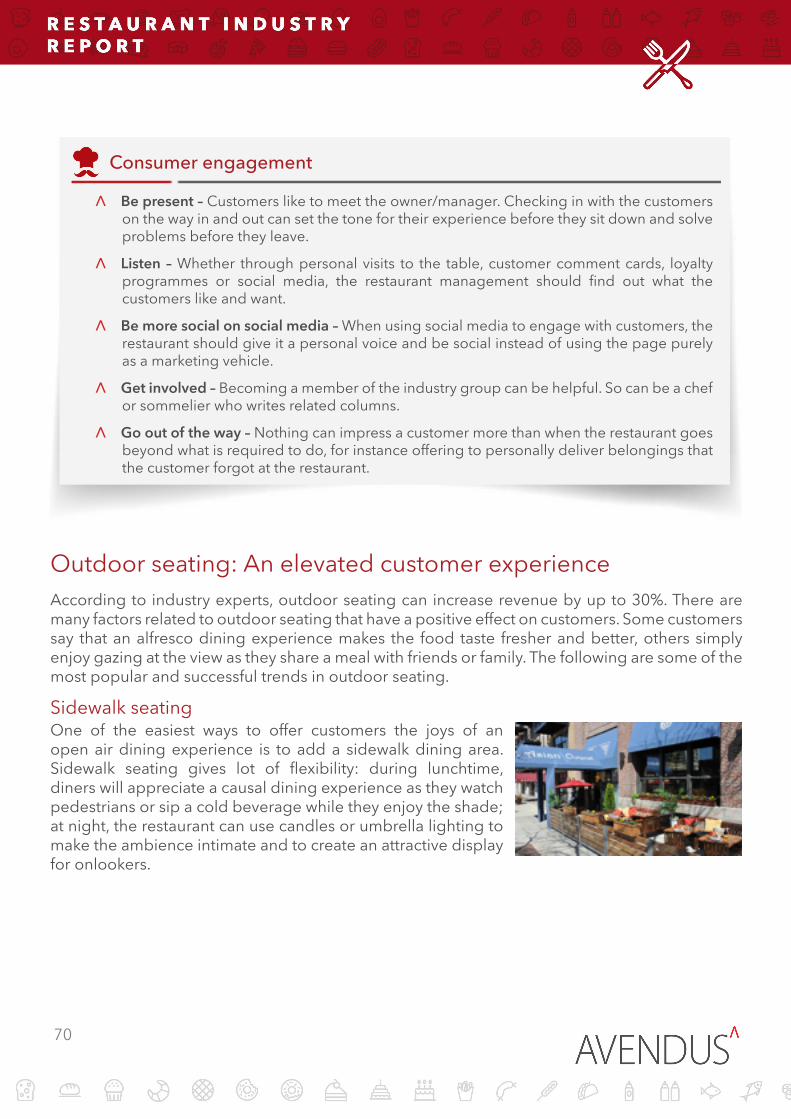
70
Outdoor seating: An elevated customer experienceAccording to industry experts, outdoor seating can increase revenue by up to 30%. There are many factors related to outdoor seating that have a positive effect on customers. Some customers say that an alfresco dining experience makes the food taste fresher and better, others simply enjoy gazing at the view as they share a meal with friends or family. The following are some of the most popular and successful trends in outdoor seating.
Sidewalk seating
Consumer engagement
Л Be present – Customers like to meet the owner/manager. Checking in with the customers on the way in and out can set the tone for their experience before they sit down and solve problems before they leave.
Л Listen – Whether through personal visits to the table, customer comment cards, loyalty programmes or social media, the restaurant management should find out what the customers like and want.
Л Be more social on social media – When using social media to engage with customers, the restaurant should give it a personal voice and be social instead of using the page purely as a marketing vehicle.
Л Get involved – Becoming a member of the industry group can be helpful. So can be a chef or sommelier who writes related columns.
Л Go out of the way – Nothing can impress a customer more than when the restaurant goes beyond what is required to do, for instance offering to personally deliver belongings that the customer forgot at the restaurant.
One of the easiest ways to offer customers the joys of an open air dining experience is to add a sidewalk dining area. Sidewalk seating gives lot of flexibility: during lunchtime, diners will appreciate a causal dining experience as they watch pedestrians or sip a cold beverage while they enjoy the shade; at night, the restaurant can use candles or umbrella lighting to make the ambience intimate and to create an attractive display for onlookers.

71
Rooftop dining
Dining in the garden
Fire and water
The view allows diners to take in the beautiful city skylines or wide-open landscapes as they dine. The restaurant can go the extra mile with manicured gardens and light displays that enliven the atmosphere at night. Pergolas and awnings are also popular features as they offer shade during the day and protect diners from rain.
One of the industry’s hottest trends is farm-to-table food, which can be easily combined with outdoor dining. To take advantage of this trend, it is less about the space and more about what the restaurant grows–some restaurants landscape their outdoor dining areas with the fruits and vegetables that they serve.
Diners love the contrast that fire and water create. One of the reasons that this theme works well is that these two elements convey everything that the restaurant wants their customers to feel: water adds a sense of cleanliness and freshness that enhances the environment and the food that is served; fire conveys a warm, comfortable feeling that encourages customers to linger over drinks and desserts.

72
Communal table: A welcome sign for singles and large groupsMore-and-more restaurant concepts are pushing aside two-tops and setting a communal table into their dining room floor plans. Communal tables help send two clear messages—large groups are welcome (which helps to build loyalty and drive sales) and that it is a welcoming place where neighbours can catch up or strangers can become friends.
Before setting up communal tables, restaurants should consider –
Л Will it fit into the restaurant’s demographic patterns? – A communal table needs to fit into the casualness of the overall concept. Generally, café-bars are more suited to larger tables. Also, the traffic and profile of customers should be taken into consideration while fitting in communal tables.
Л Does it work with the seating configuration? – If it is not designed as a part of the ground-up construction and the restaurant is trying to retrofit on into a space, the traffic flow around the table should be considered; its dimensions can easily disrupt the dining room.
Л Will it affect other diners? – Larger tables create greater noise that could be disruptive to people in the vicinity. The restaurant needs to be thoughtful about how the space is set up and positioned.
Л What’s the proper height of the table? – This depends on and varies according to the concept. A restaurant with higher bar sales and showcasing sport events may prefer higher topped tables at stool height while a concept where family traffic is high may prefer regular tables.
Л How is the lighting? – Specific lighting for the communal table is necessary as experts warn against accidently leaving the big table unsuitably lit.

73
Naming the Restaurant While a name alone will not guarantee restaurant success, it does remain the restaurant’s unquestionable public identity: an element broadcast in conversations, internet searches and exterior signage. In just a few easily relayed syllables, the name must capture, at least to some extent, the menu, hospitality, design, vibe and sensibilities of the restaurant–a remarkably complex, dynamic and challenging task. Great names are distinctive, yet easily recalled and simple to spell.Any name requires intense research regarding the restaurant’s points of differentiation, its marketplace positioning and, most importantly, its target customers. It is important to sit down, reflect and have careful, diligent conversations about the restaurant’s unique traits, concepts and tone. Once the owners understand the restaurant’s feel, position and target consumer, prospective names that are enlightening and imaginative often materialise.
Tying the restaurant to a place can bring unique ideas to the table and it is important to look in the backyard since that’s where the primary customer base is. Shorter names tend to resonate best in today’s text messaging-social media environment. Shorter names also work well on business cards, windows, print menus and exterior signage.
Once a name is shortlisted, restaurant owners should visit Google to see if other restaurants carry the name. The availability of the domain and the potential moniker’s availability on social media should be investigated as well. Post this, the management can do the market testing.
Casual-dining restaurants at non-traditional spacesIn the restaurant industry, it is vital to remain active and growing. As the restaurant expands, however, the management may be forced to address the problem of limited A-list real estate options. This means operators will continue to enter non-restaurant ready or non-traditional spaces as a way to increase brand awareness. When entering into non-traditional restaurant formats like food courts, universities and airports, redeveloping a concept to fit these new operational structures is not an easy task and operators need to keep the following things in mind to succeed at these locations.
Making necessary operational and service model changesIn the traditional format, the restaurant typically has a complete and discreet operation dedicated just to the concept. In the non-traditional format, the restaurant may have a separate cook-line, while other operational processes may have to be allocated to a shared space. Other operational changes may also be required like no wait staff. Restaurants should have a separate operational manual for operational control and consistency. The non-traditional formats may also create unique franchise relationships because they are often run through contract service providers, which can lead to added complexities and opportunities.

74
Maximising opportunities for clear brand expressionFrom a design standpoint, the brand communication will be based on the size and format of the available non-traditional space and may well be subject to the overall facility’s design requirements. What the restaurant chooses to communicate will affect the overall brand equity. As the customers are exposed to a snippet of the intended customer experience, it is critical to select the most important messaging points tied to the brand. At a non-traditional format, there is always a conflict between the overall space and individual food vendor. An individual brand may want a clear brand expression for the entity as a whole while the real estate owners may avoid this approach as it is much easier for them to follow set standards and prescribed guidelines. This is something that the restaurant needs to pay close attention to while choosing a non-traditional format.
Alter the production model In non-traditional formats, the restaurant may be required to prepare the food at a quicker rate but it is very important to maintain the high standards even with the increased throughput. Customers do not tolerate sub-par food simply because it was bought at an airport or a food court. Hence, restaurants need to adhere to the same level of expectation or they run the risk of quickly losing their brand equity due to high exposure garnered in non-traditional venues. Peak times and volumes can also be different, so restaurants need to increase their efficiency and productivity in order to produce and deliver more meals. This can be done through effectively researching and testing alternative cooking or production methods that can handle higher volumes.

75
Gift cards: A margin-boosting strategyAcross all industries, businesses sold USD 124 billion of gift cards in the US in 2014. Despite their growth, the restaurant industry is not tapping into the potential of gift cards as it does not perceive the benefits. There are three ways gift cards can boost margins for restaurants –
a. Gift card breakage – Around 30% of gift cards are never redeemed. Although no specific study has been undertaken for gift cards issued by restaurants, it is estimated that the breakages should be at least 30% if not higher. This adds to the margin of the restaurant moreover, for the remaining 70%, the income is recognised at the time of use and, therefore, be considered an interest-free loan. The cost associated with issuing gift cards is also low.
b. Gift cards drive larger and higher-margin purchases – In more than 70% of the cases, gift-card holders spent more than the card’s value. Around 25% purchased an item that was not originally planned or a more expensive version of an item.
c. Better alternative for disgruntled customers – Every restaurant has disgruntled customers from time to time. Restaurants seek to placate them by writing down a portion of their bill, providing complimentary desserts or, in some instances, a refund. All these have immediate costs associated with them. If the customer is given a gift card, however, the benefits are (a) cost is incurred at the time of redemption (b) Add 30% breakage possibility that reduces the cost (c) possibility of increased spend (d) it can bring back a customer who otherwise might not have revisited.
Companies usually give gift cards to their employees during the holiday season. Restaurants can tie-up with corporate clients and offer gift cards to their employees along with some discounts. This can help in building loyalty with corporate employees who are major spenders at restaurant


77
Digital MarketingMulti-location restaurant companies need to keep their large scale operations local when it comes to customer perception. The first step towards this should be to ensure that the data quality is accurate, consistent and complete across all different channels. If the Google result shows that the restaurant is closed (not updated), then the customer will not visit the restaurant. A chain competes with not only other chains with similar cuisines but also standalone restaurants with different cuisines. The correspondence across the platforms should align; for example, if a customer posts a complaint through social media but receives an unrelated loyalty email thanking them for dining at the location.
Benefits of digital marketing
Л It can be personalised based on location, preferences and history of the consumer.
Л Location-based technology can be used to connect to the customer when he or she is in the vicinity of the outlet by offering discount, special promotions, and free desserts.
Л The return on investments on digital marketing is higher than mass media marketing.
Kids, ideal target for digital marketing
Acceptance by kids strongly influences parental choice of dining and party locations for kids aged 12 years and younger. Operators need to leverage digital entertainment to increase brand engagement with kids. Digital gaming provides the opportunity for restaurant operators to bridge the gap in marketing to the whole family. Restaurant apps for kids provide a perfect vehicle to build brand loyalty.
Л Texas Roadhouse has a QR code on the children’s menu. When scanned, the code downloads the app for the smartphone. Kids can then colour scenes from a story that can be saved, emailed, printed or uploaded to Facebook.
Л Chili’s offers tabletop tablets with unlimited games for a small fee, which is additional revenue to the restaurant.
Л Dr. Panda’s Restaurant allows kids to cook food for the animal guests.
Restaurants can replicate some of the best practices followed by successful brands while designing their digital marketing campaign.
Offering mobile-optimised deals Restaurants should ensure that there are restaurant coupons and deals on mobile-optimised internet landing pages. When the coupons are loaded on mobile, the customers are more likely to visit the restaurant.

78
Tracking more than just the clicksMulti-media or high-impact ads are great opportunities for customer engagement in a variety of ways such as games and quizzes.
Using mobile advertising to geo-fenceGPS technologies enable advertisers to automatically send a message to smartphone users once they have entered specific areas. This can be used to attract customers by offering deals or discounts.
Gaming
Leveraging partner networks to optimise ads Relying on media partners like online publishers, websites, blogs and social media sites to optimise ads will help increase site engagement beyond the initial click. Restaurants should take advantage of the digital network to drive the customer engagement through loyalty programmes and nutritional information.
Remembering the basics
Branded blogs: A key marketing toolHigh-quality, original content on branded blogs for social channels can boost engagement and purchasing decisions. A number of chains, including Chipotle, Pizza Hut and Chick-fil-A, have launched branded blogs and digital newsrooms to complement social media. The following are some of the reasons why branded blogs are important –
Л Consumers like reading brand content in a news format – Chick-fil-A, which does not serve beef, posted a news article-type piece on the brand’s blog for National Cow Appreciation Day along with videos, which would have been obscure on Facebook.
Л Customised blogs give the brand a voice – Having a separate site for a brand blog is better than adding content to the corporate website as it gives the brand a distinct voice.
Л Consumers prefer branded articles over ads – Consumers generally prefer branded articles over ads; hence, many companies are recruiting journalists for their content hub.
Л Branded blogs increase consumer engagement online – Chick-fil-A experienced that articles on its site get 10 mins or more viewing time.
Л Blogs along with social media campaigns are powerful communication tools – Blogs provide a platform to know the company and its values in a meaningful way but social media engages fans 24/7.
Marketing campaigns that include rich-media games are a great way to generate brand lift and increase customer engagement. Chipotle, for example, launched a ‘Friend or Faux’ game to create awareness about ingredients that they use compared to what their competitors use and provided coupons on successfully completing the game.
Eventually, the content is paramount and creating engaging creative ads with a strong call to action will help drive product sales.

79
Five ways restaurants can attract today’s customers
Burger King Peace Day
Arby’s vegetarian support helpline
McDonald’s ‘obscene’ Minions
Starbucks’ Christmas Cup
Carl’s Jr. raises eyebrows
Burger King proposed to McDonald’s that they come together for one day to create a Peace Day Burger. While McDonald’s refused the offer, smaller burger chains Denny’s, Wayback Burgers, Krystal’s and Giraffas Brazilian Grill joined Burger King to create a Peace-Day offering creating positive social media buzz for themselves.
Arby’s introduced its Brown Sugar Bacon sandwich by trolling vegetarians by setting up a vegetarian support helpline. In an open letter, Arby’s urged vegetarians to call 1-855-Meat-HLP when they were likely to give in to their meat cravings and offered them the sweetmeat. The electronic responses offered alternatives like lettuce.
McDonald’s introduced a Happy Meal with talking toys inspired by the movie Minions. Some parents, however, interpreted the sound made by the toys as profane and obscene. A video uploaded on YouTube was viewed over 6.3 million times and McDonald’s had to issue a statement that the toy was not cursing. The outrage added intrigue to the Happy Meal sales as customers sought to see if the language was indeed salty.
Starbucks found itself in a controversy when it revealed its annual red holiday cup without a snowflake or snowman in sight. The plain cup drew the ‘war on Christmas’ outrage and even comments on social media to boycott Starbucks. Starbucks had to issue a statement that they wanted to usher the holidays with the purity of design and followed it up by asking customers to draw designs on the red cups and upload them on Instagram or Twitter using a designated hashtag for a chance to have their artwork featured.
Carl’s Jr. raised eyebrows when it released its ‘All Natural ‘ad showing a model walking seemingly nude or ‘au naturel’ through a farmer’s market with various fruits and vegetables obscuring her lady bits while touting the Carl’s Jr. all-natural beef burger. In less than two weeks, the commercial generated nearly 2.5 billion media impressions and 9.5 million YouTube views with sales taking off.

80
A guide to restaurant marketingPublic relations To generate strong word of mouth, a restaurant can have a soft opening wherein friends, family, and suppliers are invited for dinner. Grand opening parties usually follows this: inviting friends, colleagues, public officials and people in the industry who are going to spread the word. Fundraisers, community relations and charity events also fall under the category of public relations and publicity. Radio can be used to precisely target the demographics of its customers.
Social NetworksSocial networks are critical and so is the brand website as the first contact with the customer now usually happens online. Other publicity ideas include catering, cooking demos and going on TV/radio shows. Fairs are another effective venue as restaurants can promote their food and chefs directly to the public.
DiscountingDone well, discounting is another smart way to market the restaurant. In slow times, prix fixe menus prove popular for many restaurants and even early bird specials remain a good way to boost a slow time of the day. Restaurants that are in the business districts can tie-up with companies to provide discounts to their employees.
Specials/Limited Time Offers (LTO)Specials are effective at building loyalty and return visits; if the restaurant has a rotating list of specials, it keeps customers coming back. LTOs and seasonal menus also help in attracting regulars and building loyalty.
Internet marketingInternal marketing, which is often overlooked, is an incredible opportunity for restaurants to market to customers effectively by educating and treating their staff well. When restaurants treat their staff well, it makes them happy and effective, resulting in happy and loyal customers.
A few aspects that restaurants should remember while designing their marketing campaigns Л Defining how to measure success - While designing a restaurant campaign, it is critical to identify its goal, such as driving traffic even if the restaurant does not make money; attract regular customers and encourage them to spend more; or simply create a buzz with an unusual item.
Л Picking a quantifiable way to measure success - The simplest metric would be a bump in customer traffic. But a restaurant can a pick a metric related to the size of its average check or if creating buzz is the goal, it can be web traffic or social media activity.
Л Determining a marketing budget and stick to it – Sticking to a predetermined budget and tracking that into the analysis of profitability will help make an informed decision if the promotion can be undertaken again.

81
Л Understanding that when a promotion increases sales of one item it also affects other items – If the sale of a certain item increases, the decreased sale of other menu items will either help or hurt overall profitability. This requires the need for having a deep understanding of what the customers buy and also know how different menu items vary in profitability and how sales vary by day and time of day. One approach to scheduling promotions might be to rely on low-margin traffic driver campaigns in slower months, then shift efforts to improving check sizes in stronger months.
Л Know that every geographic market is not the same – If the chain has restaurants at multiple locations, it is imperative to start by testing a promotion in a few markets to see how it impacts the business.
Л It takes time to create a well-run promotion – Having the information at hand to help you determine if you want to repeat a promotion will lead to a well-reasoned approach that pays off.
Zone merchandising: Optimising the store spaceZone merchandising–setting measurable business goals for different areas of the restaurant while considering customers’ needs and behaviour in each can help limited service restaurants make every second of their interaction with customers count. Industry experts think that while looking to improve their store throughput, restaurants are overlooking the business potential of zone merchandising to speed up throughput and boost the ticket size. To configure the store to maximise productivity and optimise customer experience, limited service restaurants must look at customer behaviour at each zone.
Zones Л Good window signage - Critical for customers to find the restaurants, especially for new ones. A good window signage conveys what the brand stands for.
Л Customer enters the restaurant - The brand message should be reinforced. The entryway is critical as most of customers are undecided what to order and, hence, decisions can be influenced through creative and strategic display of products.
Л Order counter - Customers should be able to view what’s on offer.
Photo stations as a marketing ally
TAO Asian Fusion, New York, has introduced a photo booth by BuzzyBooth in the restaurant. The photo booth is situated beside the hostess and is free for the customer. Customers can share thepictures on social media. The photo booth helps the restaurant on two levels –
Л A customised frame surrounds the photo, which sends the restaurant’s brand in the social media universe without any in-house promotion.
Л It also captures customers’ email and creates a database for future marketing use, such as loyalty programmes and announcing food specials.

82
Loyalty programme: A must for restaurant chainsNot only does it cost a business 5-7 times more to acquire a new customer than it does to sell to an existing one, but also an average loyal customer spends 10 times more over a lifetime. By taking customer loyalty seriously and offering customers the ability to earn rewards, restaurants can retain the most profitable customers and allocate resources to more value-add activities. Restaurants can follow some of the best practices across industries while designing their loyalty programmes.
Л Signup should be frictionless - Signup should be easy and through multiple channels (in-store, online or on the go).
Л Reward customers for what they buy, not just how many times they visit - Points per dollar spent is better than points per visit as that encourages customers to spend more and visit more rather than just visit more.
Menu boards
Л The importance of menu boards for QSRs, fast casuals - Menu boards are critical for QSR and fast-casual restaurants as engagement varies by type of consumer as well as by how often they visit. Millennials are more likely to look at menu boards for a new favourite or experiences.
Л Digital menu boards are scarce – Digital menu boards offer greater design flexibility, regular updating and the flexibility to change according to the time of day. Yet, only 16% of restaurants have them.
Л Missing out on sales opportunities – Restaurants lose out on sales as promotional information on check-boosting items such as desserts, side dishes and alcoholic beverages is not included on menu boards.
Л Photos are critical – Photos are important, especially to promote signature items and LTOs.
Л Restaurant Concerns – The major concerns cited by restaurants are space constraints for detailed menu description and that it is difficult to organise a board so that customers can easily think through the entire order.
Sequential messaging is critical as it can help customers decide what to order before they get to the order point. This can not only increase throughput but also increase the ticket size through suggestive sells. For example, Panera Bread’s ‘You Pick Two’ offer begins with a signage at the entryway encouraging customers to select two from among its sandwiches, salads, flatbreads or soups to create perfect pairing. It is reinforced with another message on similarly designed signage after customers step inside the vestibule. The message is emphasised once more with a different coloured message on the menu board’s centre panel.
Menu boards are another oft-missed opportunity to speed throughput. Each menu board contains a hotspot–the spot where customers typically glance first. Another important aspect for making the zone merchandising successful is staff training as the responsibility of carrying out zone merchandising ultimately falls on them

83
Л Send reward information according to customer preferences - Some customers like receiving text messages, others prefer emails or push notifications. Restaurants should send reward information to customers the way they want to receive it as this ensures the highest response rates, the lowest opt-out rates and an effective loyalty programme.
Л Do not overcomplicate the platform - Creating a programme with a lot of rules and limited rewards with an expiration date can drive away users from consistently engaging with the programme.
Л Do not be passive - Restaurants should make the engagement interesting and fun filled for customers. Some of the ways to do this are in-app games, random surprises, delight campaigns and leaderboards. The Greene Turtle, a sports bar and grill chain, has built a feature in their loyalty programme app wherein customers can predict the winners of upcoming professional games in the four major sports as well as college football and basketball and earn points on correct predictions. The company has observed that the most frequent game players spend 177% more than the average check and also visit 565% more often.
Л Remember the staff - Restaurants should ensure their staff is engaged and understands the value of loyalty as the major part of customer engagement is via staff interaction.
Л Not just a digital platform - Mobile-only loyalty programmes have the lowest adoption rates in general and, hence, they should also be supported by in-store customer experience.
Л Include a social cause - Restaurants can associate their loyalty programme with a social cause to create impact. At Fuzzy’s Taco Shop, customers can donate their reward points to the ‘No Kid Hungry’ campaign. The chain donates USD1 for every 25 reward points.
Л Rewards that keep diners coming back - Some restaurants are experimenting with loyalty programmes that offer discounts or allow users to earn points outside of their stores. Olive Garden has teamed with Fuel Rewards, a national merchant programme that rewards customers with savings at petrol pumps. Therefore, customers who spend USD100 at Olive Garden get discounts on fuel. Starbucks has tied up with Spotify, Lyft and the New York Times, whereby members earn Starbucks ‘Stars’ when they use services offered by these organisations.
The Loyalty programme can be complemented with the opportunity to order by tablet or pay by mobile as these methods allow easier data collection and can be aggregated within the loyalty program.
Service industry membership programme
IndiCard has launched an exclusive service-industry membership programme that provides industry professionals special offers at bars, restaurants and other establishments. Those who use it can avail of exclusive offers or special discounts at a variety of local partners such as restaurants, gyms and salons.

84
Staff training: More important than marketingMoney spent on customer acquisition (advertising and promotion) can fill a restaurant, but money spent on customer retention (through staff training and better service) makes that restaurant profitable by transforming a single visitor into a lifetime guest. Food service marketing budgets are over-focused on customer acquisition, but not so much on customer retention. This makes sense for the first year of operations but is counter-intuitive from year two and beyond. A well-trained staff delivers on the brand promise and creates brand affinity with customers—two critical drivers of repeat business. In 2014, McDonald’s and Subway spent USD 963 million and 516 million on advertising, while Chipotle Mexican Grill and Starbucks spent a fraction of those amounts and yet have a stronger reputation for taking care of their employees and customers. Chipotle Mexican Grill deliberately spends less on marketing to afford higher quality ingredients. The four stages of marketing and the role that training plays in its success is as follows –
Л Awareness - In this initial stage of engagement, potential diners may not have even heard of the restaurant, hence advertising, promotion and social media marketing budgets tend to be heavily weighted towards new customer engagement.
Л Consideration - This stage is characterized by contemplation and then decision making by potential customers. They are now aware of the restaurant and are contemplating if they should spend their money. If they decide against it, the marketing spend has been unsuccessful; if they decide to visit, then marketing has been successful and operation/training takes over.
Л Visitation - It is at this stage that the brand meets the customer and the customer retention strategy (service and training) comes into play.
Л Preference (Affinity) - This is the ultimate goal for every food-service company as preference drives repeat business and lifelong patronage. Only when restaurants continuously excel at the Visitation Stage do they convert customers into loyalists.
Marketing initiative through CSR
Л Applebee’s gave close to 1 million free meals to veterans and active duty military personnel. The initiative generated 664,596 likes on Facebook, 123,977,592 timeline deliveries on Twitter and 1,944,123 page views on Applebee’s website over 2 days.
Л On Halloween, Chipotle offers a discounted USD 3 burrito to customers who visit Chipotle restaurants after 5 pm in costume. Proceeds from the day, up to USD 1 million, go towards the Chipotle Cultivate Foundation, which is dedicated to providing resources and promoting good stewardship for farmers; promoting better livestock husbandry and encouraging regenerative agricultural practice.
Л Every time a customer buys a Happy Meal or Mighty Kids Meal, McDonald’s donates a penny to support Ronald McDonald’s Charity House programs and services.

86
Research and development (R&D) Money spent on customer acquisition (advertising and promotion) can fill a restaurant, but money spent on customer retention (through staff training and better service) makes that restaurant profitable by transforming a single visitor into a lifetime guest. Food service marketing budgets are over-focused on customer acquisition, but not so much on customer retention. This makes sense for the first year of operations but is counter-intuitive from year two and beyond. A well-trained staff delivers on the brand promise and creates brand affinity with customers—two critical drivers of repeat business. In 2014, McDonald’s and Subway spent USD 963 million and 516 million on advertising, while Chipotle Mexican Grill and Starbucks spent a fraction of those amounts and yet have a stronger reputation for taking care of their employees and customers. Chipotle Mexican Grill deliberately spends less on marketing to afford higher quality ingredients. The four stages of marketing and the role that training plays in its success is as follows
Once restaurant brands undergo a rebranding, whether it’s a subtle store redesign or wholesale menu shift, costs are typically tangible and easy to identify. Before the refresh begins, however, activities behind the scenes must also be funded and unlike hard costs, activities in the R&D phase are more difficult to classify. Each aspect of the project requires R&D time and cost to identify what types of changes should be considered.
The scope of a rebrand often ends up being larger than that initially assumed. Research is needed to truly understand the bigger picture. Changing the menu, for example, entails more than just sourcing new ingredients. It also includes updating menu items on the brand’s websites and revised communication on the brand’s social media channels.
The company should set budget for R&D efforts. When developing the budget for any rebranding project, the internal costs must also be estimated. Labour costs and utilization of rented space or equipment do not appear on any invoice but will still consume organisational resources. Focus and discipline is critical for staying in line with the budget.
R&D labs by restaurant operators Wendy’s has opened a R&D lab called 90o Lab aimed at testing and evolving new technologies related to mobile ordering, mobile payment and special mobile offers via a new loyalty programme. Within the lab, there’s a faux Wendy’s restaurant with an ordering counter that looks identical to those at the chain’s newest locations. There’s even a simulated drive-thru pedestal and window that emulates the customer experience.
Dairy Queen has opened a lab, ‘DQ Bakes’, which is a menu platform that’s aimed at creating and selling fast-casual-quality food at fast food prices. Nine products have already been rolled out, with more than 100concepts in the pipeline. The company feels that eventually they will be able to market about 15% of them.

87
Loss-prevention programme: Top areas to cover Restaurants operate on tight margins, making a loss-prevention programme critical to success. The following are the top-5 areas a restaurant’s loss-prevention programme should cover.
Transaction integrity: Restaurants should keep an eye on voids, no sales, refunds, low transaction amounts and excessive employee or manager discounts that make it easier for employees to hoard unaccounted-for cash in the POS, to be taken undetected at a later time. Sweet hearting is another type of theft that does not result in loss of cash but does contribute to inventory loss.
Cash handling: Control the quantity of cash left in the till by enforcing a maximum amount and requiring regular drops of the surplus amount. Restaurants should enforce single-drawer accountability so that they know which employee handles which POS terminal—useful if there is a cash balancing discrepancy at the end of shift.
Safety and security: Safety and security are not only important for employee and customer welfare, but also reduce liability costs in the event of a critical incident like a slip and fall or a robbery at the store. Slips and falls are a huge source of general liability claims in the restaurant industry so it is necessary that staff is trained to put up ‘wet floor’ signs when mopping and cleaning.
Employee productivity: Time theft is often-overlooked component of loss prevention. It is necessary to have a plan in place during slow periods so that staff don’t sit idly – they can use that time to clean, take inventory, conduct cash counts and drops, organize POS stations, stack cups or anything else that comes to mind. Do not allow employees to eat, drink or smoke during a shift; also, limit mobile use.
Customer service: If employees are unpleasant or rude to customers, those patrons won’t be returning to the restaurant. Restaurants should have a script in place to give employees direction and aid to help with suggestive selling efforts. Speed of service is also important –customers who feel they have been kept waiting for too long are likely to take their business elsewhere.
Human resource: Hiring and retaining the right talentHiring the Right TalentLabour constitutes a significant portion of operational costs. Two factors that affect costs are (a) lack of skilled labour and (b) a high attrition rate, resulting in increased training costs. Thus, it is important to hire the right talent.

88
Following are some strategies that restaurants use to attract talent:
Rethinking the approach to recruitment: Restaurants need to approach candidates as they would customers–by providing a positive experience such that they build both employment and the brand. This approach should be used for all positions—from the servers to the executive chef.
Have an employment-friendly brand and a great career portal on the brand’s website, both informed by the sales approach: Posting pictures of employees at work, team-building events, employee picnics or participating in community service are activities that portray the brand’s culture and can help prospective employees make an informed choice. The emphasis should be on what the restaurant offers rather than what it needs.
Attract people to the career portal: Restaurants should be active on social media, send email blasts and leverage table-top marketing.Hit the market with searching, sourcing and networking: Restaurants should use multiple tactics to target the right talent. Some of these are employee references, social networking on sites like LinkedIn, accessing career sites as well as cold calling competitors. Also, restaurants should ask key staff members to post on blogs that are frequented by the kinds of candidate the restaurant needs instead of writing how great the business is to work, restaurant chains can ask their chefs or bartenders to post recipes or tips on online forums. The goal should be to establish that the employees are subject-matter experts, which raises the company’s profile among prospects.
Retaining staffRetaining staff and preventing constant turnover are the most significant challenges in the restaurant business. To address this, Applebee’s implemented a gamification system that aims to help servers and staff sell new and supplemental menu items as well as learn about workplace rules and safety, earn points and win prizes for making progress. Employees access the cloud-based system via a web browser on smartphones, tablets or computers. Large flat screens located in the back of each restaurant display the leader board.
Servers and staff see a variety of tasks to complete when they log infer example, servers might be challenged to sell certain menu items on a daily, weekly or monthly basis. When they sell special menu items, they earn points or badges. Servers might also be asked to take quizzes or watch video on menu items.
Managers can integrate POS data into the gamification system to see the most and least popular items, thereby helping them make decisions on which meals to promote to boost the sales of certain items. Some tasks

89
carry more reward points than others and when employees rack up a certain number of points and badges, they become eligible for prizes.
With increase in minimum-wage requirements, scheduling software is becoming critical to manage labour. HotSchedules and Monkeypod Kitchen are such systems that provide overtime alerts and track real-time labour costs, also allowing employees to access their schedules. These systems may also define a small time range, say 5 minutes, to clock-in and disallow employees to clock-in before or beyond their scheduled shift time without prior manager approval.
CVR4ME – App to hire restaurant labour on the spot
Chefs De Leoz and James Lalonde developed CVR4ME to connect restaurants with potential hires that can range from a day of need to a long-term position. The fee is USD 25 but restaurants only pay if they actually hire a capable replacement. On the service side, there are categories to fill in, such as job position, skill set, résumé and availability that quicken the decision-making process for both parties. A rating system is also available to foster a network of capable professionals.
Controlling food cost In the world of restaurant food distribution, price changes constantly and it is common for an invoice to show a price that is above or below the contracted price. In many cases, restaurant costs can be driven down materially simply by comparing what the company should be paying for products vis-à-vis what it actually is paying.
Restaurant chains can use one of the following strategies– Л Having accounting team compare actual invoice prices to contracted prices - This requires manpower but the savings can make it worthwhile.
Л Having restaurant managers double-check invoice prices against a vendor price sheet - This puts a knowledgeable manager to work doing a purely mechanical task and his/her time may be better spent improving food production operations, reducing waste and training people.
Л Using a back office solution to automate the comparison, generate alerts and remediate discrepancies - This option is highly effective though it requires an expert implementation of a restaurant back-office software system. While return on investment can be outstanding, typically adding 2-3% of food sales to profits, this strategy requires a commitment to operational discipline from the entire restaurant chain, top-to-bottom.

90
Food cost management
Restaurants should complement the ordering process with strong internal controls to manage food costs.
Theoretical food cost: Restaurants should compare actual food costs to what costs should have been, the difference is money wasted. This is critical to know rather than trying to monitor food cost as a percentage of revenue.
Loss prevention: Restaurants should identify fraudulent activities through alerts and trend tracking, monitor high-cost ingredients, isolate critical areas, and track user-specific activities to reduce any dishonest behaviour.
Menu engineering: Restaurants should engineer more profitable menus by analysing customer demand, item percentage sales contributions and cost and profit margins.
Demand-based production: By forecasting the food production schedule based on sales forecasts and historical consumption patterns, restaurants can reduce the costs associated with overproduction.
Inventory management: Maintaining optimal inventory is important to manage food costs. 100% web-based solutions allow real-time tracking of all items from ordering to depletion and is one of the most important benefits of using a restaurant inventory software.
Managing food wasteAccording to reports, 40% of all the food produced in the US is wasted. Restaurants deal with two waste streams (a) pre-consumer food waste includes overproduced, spoiled or expired items, trimmings and materials dropped, burned or contaminated; (b) post-consumer waste is the food that is left on guests’ plates after the meal. Five myths about food waste that restaurants have –
Л Our restaurant doesn’t waste food - The truth is every kitchen wastes food; the need is to figure out what is causing it.
Л Talking about food waste will make restaurants look bad - Many chefs carry around stress and guilt and worry that they will be perceived negatively for throwing food; however, everyone has waste and it is not an indicator of poor performance. Even the best operations have food waste but they recognise and talk about it.
Л Tracking food waste is hard - Measuring food waste is quicker and easier than people think. It takes 15-20 minutes for the chef or manager to review food waste. But the restaurant should not stop at collecting data and should figure out why the food is being wasted and then adjust production.

91
Л The team is too busy dealing with other things - The restaurant can provide bonus incentives or give recognition and positive reinforcement to those who reduce waste.
Л We compost, so we’re already doing our part - Food waste needs to be prevented and not just disposed effectively.
Measuring food waste
According to LeanPath, which provides automated food waste-tracking system, 4-10% of food purchased by a restaurant or a food service operation is discarded even before reaching the customer. By keeping tabs on reducing waste, an operator can increase profit by cutting food cost. The first step to reduce food cost is measuring and tracking what has been thrown away. Pre-consumer food waste is due to four major factors –
Л Overproduction - Striving to prepare for variable crowds, restaurants end up prepping and cooking more than needed. Restaurants should try to forecast by noting which menu item sales better under various conditions (day of the week, weather and holidays). Restaurants can also select packaging that makes more sense to the output–bigger packages are cheaper but the savings will be wasted in case the restaurant has to discard a large portion of the product.
Л Expiration - As food has a short shelf life, it should be prepared in smaller batches. While keeping food safety in mind, restaurants can explore re-use of leftovers in future dishes.
Л Spoilage - Restaurants should train the staff on following the first-in first-out of storing and using to ensure older products are used first.
Л Trimming - Restaurants should consider if pre-cut items are more affordable after taking into account the actual yield and labour cost
If there are still wastages, restaurants should donate food as this will give the brand a boost.
Melbourne-based food rescue app –YuMe
In Australia, annually about 1.4 million tonnes of edible food waste is thrown by the restaurant industry. The app facilitates direct hyper local connection between those who have surplus food and those who need it. YuMe complements the work done by food rescue organisations by providing a tool that redistributes food that they are unable to collect. Businesses can choose to either sell their excess food to YuMe’s growing list of Yumembers (currently 1700) or donate it to one of YuMe’s partner food charities.

92
Tech to combat food wasteAccording to estimates, in the US, around USD 165 billion worth of food is wasted every year. Large portion sizes are a big reason but another contributor is that restaurants often keep more food than they need to ensure that everything on the menu is available. Lastly, many chains have inflexible rules that require them to throw out foods instead of giving it to food banks. The following are three tech tools that can help operators combat some of the food waste –
Food Cowboy
It uses mobile technology to safely route surplus food from wholesalers and restaurants to food banks and soup kitchens instead of landfills. Apart from the CSR credit, restaurants can also benefit from enhanced tax deductions when they donate. Donors may be able to deduct half the profits they lose on unsold food. For example, if the food donated cost USD 10 in ingredients and labour and would have been sold for a profit of USD 6, the tax deduction would be USD 13.
The platform uses tech to allow donors and charities to communicate efficiently, track donations, match donations to charities ex hours of operations, loading dock size, cooler capacity and ensure that food-safety requirements are met. Anytime restaurant operators have food to donate, they can open the app and a create donation alert that tells the charity what is available and when it can be picked up. The charity will confirm the interest in the donation, schedule a pickup and confirm when the food was accepted. Food Cowboy also requires charities to have food-safety procedures in place for transporting, storing and serving food.

93
The Eco-Safe Digester
LeanPath-Zap
LeanPath offers an automated food-waste-monitoring system that restaurant operators can use on their tablets. Powered by LeanPath Online, the dashboard allows users to review a variety of info, including wasted foods and the top loss reasons. They can also set up text-message alerts tied to specific waste parameters and receive a weekly summary of top waste instances.
BioHitech recently introduced The Eco-Safe Digester, which reduces the amount of food waste in landfills and uses data to track and improve an organisation’s sustainability. The system works as a mechanical stomach, combining heat, moisture and oxygen to enable microorganisms to break down waste into water. Attached to a sewer line, it eliminates the need for smelly compactors and transportation of waste to landfills or compost facilities. It also provides the real-time data an organisation needs to strategically cut back on food spending. Through its cloud intelligence, the system identifies trends and inefficiencies that lead to waste for a clearer view of waste management.XA


95
Disrupting Food The fast-casual segment has already started to disrupt fast food. At the same time, consumer demand for healthier, real food and increased convenience are further driving a need for disruption in the restaurant industry. Technology is reshaping how every aspect of food–production, distribution and consumption– will evolve. Food start-ups are using technology and tech start-ups will increasingly be targeting the food industry.
Limited-service restaurants are at the forefront of using technology because of the short amount of time that they have to get everything out. Even the casual-dining chains are adapting technology to improve customer experience and efficiencies in their operations. Listed below are some of the technology adoptions by restaurant companies (both limited service and casual dining).
Mobile ordering:
Mobile ordering and payment is picking up, which also helps the restaurant as it increases throughput. Restaurants having mobile-ordering apps experience over 20% increase in the average ticket size on mobile transactions compared to non-mobile. Limited-service restaurants as well as some casual-dining restaurants are allowing mobile ordering and pay ahead facilities for pick-up orders as well. In case of fast-casual chains, which offer customisation, mobile ordering improves the accuracy of the order vis-à-vis over the counter orders.
Mobile POS (mPOS) systems: mPOS systems are no longer just about the ‘cool’ factor. There are real returns on mPOS investments due to benefits such as faster checkout, shorter lines, upstream ordering, ordering and paying ahead. Chains are increasingly using mPOS solutions at their restaurants.
Omni-channel payments get real: More and more restaurant chains, especially limited-service ones, are allowing customers to pay in multiple ways, via multiple channels and also by enabling customers to start a sale in one channel (such as via a mobile device) and finish it in the restaurant or a kiosk. The objective is to stay connected throughout the buyer’s journey–whether in-store, online or on mobile devices. Restaurants are also increasingly accepting PayPal, Apple Pay, Android Pay and even wallets as mode of payment even in the physical stores.
Tabletop tablets: Casual-dining chains are increasing adopting tabletop tablets at their restaurants as they serve multiple purposes: they act as mPOS in the hands of customers thereby increasing the order intake accuracy, they act as an entertainment hub and an additional revenue stream and they can speed up the payment process, which results in better table turns. Restaurant chains that have installed tabletop tablets claim that they also boost the average ticket size and increase same-stores sales.

96
Loyalty programme:Chains are integrating their loyalty programmes into customer-facing technologies like mobile apps and tabletop tablets to help drive repeat business. Moreover, the adoption rate for loyalty programmes is higher if customers use mobile apps and tabletop tablets. Companies are also partnering other consumer services companies to provide loyalty points to customers for use of those services.
Cloud-based POS systems: With the concerns regarding data security and availability of data in case of network outage decreasing, companies are increasingly adopting cloud-based POS systems. Cloud-based systems integrate better with mobile-ordering systems and also help chains to implement unified POS systems across own and franchisee stores.
Multi-layered security solutions are becoming the norm: Major card data breaches are causing restaurants to re-think their security approaches, including EMV, point-to-point encryption and tokenization.
Guest-management platform; Casual-dining and fining-dining restaurants are implementing guest-management platforms to manage reservations, wait lists, tables, servers and seated guests more effectively.
Order-tracking systems: Fast-casual chains offer highly customisable menus at the speed of service close to QSR chains, with some chains also providing food at the table (though the ordering is at the counter). In order to manage the speed of service and table service, these chains are adopting order-tracking and table-tracking systems to manage their operations.
Integrating of ERP with POS system: Restaurants are increasingly integrating their ERP systems with POS systems for better inventory management, utilisation and ordering.
Automation: As the cost of labour is going up, restaurants are exploring ways to reduce labour in their operations by using technology. The use of tablet tabletops can help in reducing labour cost for casual-dining chains as a server can handle more tables. Sushi restaurants in and outside Japan have been using conveyor belts to serve sushi can explore using sushi bots to prepare sushi. While burger chains can use burger-flipping robots.
Technology is affecting every aspect of restaurant operation, not just consumer facing but also the non-consumer facing operations like kitchen operations, inventory ordering and management process and POS systems. Though food still is, and will remain the most important differentiating factor, restaurants will increasingly use technology to improve their quality of service and operations. Restaurant chains are increasingly looking like tech companies. In order to manage the technology and to keep pace with the changing technology landscape, restaurant chains such as Starbucks and Chipotle have started hiring chief information officers (CIO) and / or chief technology officers (CTO).

97
Food-tech companies
As with other sectors, tech start-ups are redefining the way food is produced, delivered and consumed, in the process creating new categories. VC and PE investors are showing interest in these ‘food-tech’ companies and have invested over USD 1 billion in various concepts. The following are some of the concepts/companies in the food-tech category
Aggregator/delivery companies:These are companies that are aggregating the menus of various restaurants and providing delivery services. These are the most common food-tech companies along with internet-first restaurants. Some of the players also provide grocery delivery services along with restaurant food. Some of the players in the space are GrubHub, Postmates, DoorDash, Caviar, OrderUp and UberEats.
Internet-first restaurants: These restaurants prepare in their central kitchen and deliver to the customer on demand. The menu is limited and rotates through the week. Some of the companies specialise in vegetarian meals, while some in healthful food concepts. Some of the players in the space are Sprig, Spoonrocket, Revolution Foods, and Freshology.
Л Galley - Hires fine dining trained chefs and delivers freshly cooked food. They have built kitchen automation software to predict consumer demand and inform ingredient volume. Instead of the hub-and-spoke system, the company sends all their drivers out with chilled bags at the beginning of the night, but with an optimised route so that they hit everyone’s delivery window.
Meal kits: These are targeted at people who would like to prepare their own food and want to try different cuisines or dishes. The companies operating in this space send all the ingredients along with the recipe for a particular dish to the customer who then prepares the food. Some of the players are Blue Apron, Plated, Purple Carrot and Gobble.
Л On-demand personal chef - Customers can hire a personal chef for preparing food (usually for 2-10people). The chef sent by the aggregator is based on the meal the customer chooses and brings with him/her all the necessary ingredients and equipment required to prepare the food at the host’s house. Some of the players are Kitchensurfing and Kitchit.
Л Restaurant rating - These companies list the restaurants and crowdsource the ratings. They compute a rating based on consumer feedback and also list trends. Yelp is the largest player in this space. Indian player Zomato is also present outside of India, including the US.
ο Savoir app –The app makes it easier to locate restaurants serving higher-quality, better-sourced ingredients in no great revelation. It also has a feature that suggests healthy dining options, enables credentialed health and fitness professionals to share their own advice including review of the listed restaurants.
Л Restaurant reservation - Apps like OpenTable and Reserve help customers reserve table at their favourite restaurants. They also tie-up with restaurants to provide a curated menu as an offering to customers.

98
ο OpenTable is starting to test how desperately consumers want a desired seat at a hot dining spot at the last minute with a premium pricing option, ala Uber. 100% of the proceeds from this pricing will go to the restaurants. It is similar to other booking options from Reserve, which charges a base USD 5 ‘concierge fee’ for tables; if one is not readily available, Reserve provides users a separate bid option for access to a high-demand table at a particular date and time.
The following are some players that are bringing in tech to the restaurants – Л ERP/supply chain - Dine Market is a cloud-based platform with a goal to create a seamless digital marketplace for all parties. The chef, the owner or the manager can open the website or app and get a real-time picture of what is going on in the business. Restaurants can place and manage their supply orders with a 2% cost being charged to the vendor on each transaction.
Л Food delivery and order-tracking system Table Tracker - In addition to simplifying the process of locating and delivering food to waiting customers, the restaurant can also use the system to monitor the volume of orders going into the kitchen and manage potential backups. When a customer places an order, the cashier gives him or her a Table Tracker and a timer is started for that order. Tables in the dining room are fitted with RFID tags that identify the location of the table, which the Table Tracker reads and sends. Table Tracker also has a colour-coded system that changes colours as orders near the time limit, alerting staff of a backup and allowing them to take steps to manage order flow and avoid prolonged delivery times. At day’s end, the management can pull reports from Table Tracker to analyse delivery times and see how many delayed orders occurred, allowing them to take steps to solve the issues that may be creating the problem.
Л App to hire labour - CVR4ME helps restaurants hire trained labour for short term or long term or according to their need. The app also has a system to rate the labour, thereby weeding out the least desirable labourers.
Л Food + Tech Connect - Started as a blog, Food + Tech Connect has now grown into a company that organises in-person meet-ups and events and offers online resources for aspiring food entrepreneurs.
Л Mobile loyalty app provider - FiveStars provides loyalty programme-related services to small chains and independent restaurants that cannot afford to build on their own owing to the scale of operations.
Food Subscription Services
Subscription services are becoming a big part of the food and beverage industry. Subscription services appeal to consumers because of their convenience, quality, ease and affordability. If companies like these can consistently deliver quality food and groceries at affordable rates, they can take a portion of revenue away from brick-and-mortar grocers and restaurants.
Traditional restaurants have an advantage over subscription services if they choose to seize the opportunity as they already have physical space and customer base to establish their own subscription-based service. Restaurants also have industry knowledge, finances and other

99
elements that will allow them to perfect the service.
Companies are providing differentiated subscription services in order to get customers. Some of the services are: Meal kits (Blue Apron, Plated), vegan meal kits (Purple Carrot), diet/health programme wise meals (Freshology), handcrafted cured meat (Carnivore Club), grocery box (Amazon Prime), weekly grocery using intelligent algorithm (Just Baguette) and farm-to-table fresh ingredients, including fruits and vegetables (Fresh City Farms).
Guest-management platform
In addition, restaurants immediately gain the ability to accept mobile parties and online reservations from the mobile app or add online reservations and waiting lists to the brand’s existing website.
Technology to watch out for in futureAutomation
Darden has rolled of guest-management platform DineTime at Olive Garden and LongHorn Steakhouse, two-largest brands. With DineTime, restaurants can effectively organise and manage wait lists, tables, servers, seated guests and reservations to improve speed and service while collecting real-time statistics and valuable guest information.
Rising wage cost may drive automation in the restaurant industry – burger-flipping robots, superfast ovens and making sushi roll. Restaurant operators are aggressively looking for technology that can allow them to produce more food faster with higher quality and lower waste. Currently, the most common labour-saving technology being used is kiosk- and tablet-based ordering and payment. Being a service industry, however, means that human interactions will always remain.

100
Eatsa
3D - Printing
Mobile Experience
An increasing number of restaurant chains are leveraging mobile technology to forge stronger engagements with customers. The following are the top-5 ways this is happening –
Mobile usage responsible for delayed service in casual-dining restaurants
A New York City restaurant claims that customers constantly using mobiles are to blame for a dramatic increase in the amount of time it takes to be served in restaurants these days. The restaurateur claims to have reviewed surveillance videos from 2004 and 2014 and found that the average time a customer spent in restaurants from start to finish in 2014 was 1 hour and 55 minutes as against 1 hour and 5 minutes in 2004.
After comparing the videos, the restaurant found that mobiles have become a big distraction for customers, preventing it from serving as efficiently as they did earlier. The customers are preoccupied with taking photos upon entering and then of food once it is served. The ordering process itself it taking 21 minutes as against 8 minutes earlier.
Eatsa, a San Francisco-based eatery, is an automated café with no servers, no line and no meat. It has a bowl-based menu with a quinoa base. The customer can give customise orders on the store’s iPads or app on the smartphone. When the made-to-order bowl is ready, the customer can retrieve the meal from small glass compartments. The store has also reduced the complexity in the kitchen, with each employee
responsible for a singular task, paired with the system that tells them exactly what goes into each bowl and in what order, increasing the speed of service.
Currently being experimented for desserts and chocolates, experts feel 3-D printing will play a big role in the restaurant industry, including the fine dining establishments. 3-D printing will change the way food is prepared–homemade
pasta of almost any shape and size, perfectly packed veggie burgers, carefully portioned, identically shaped servings of mashed potatoes. These things will be an easy task for the 3-D printer. It will increase the creativity in food preparation and presentation, including customisation. Some pastry chefs already use 3-D printing to make intricate, edible cake decorations.

101
Mobile wallets/payments:Restaurants are giving customers the ability to pay using mobile payment solutions such as Apple Pay, Android Pay, PayPal or similar custom solutions to speed transaction times and boost their business. The mobile payment options are also provided for in-store consumption.
Mobile order ahead capabilities:The decision to dine at a particular restaurant, especially at limited-service restaurants, is often last minute. Restaurants that offer order-ahead capabilities from a mobile can lock-in their customers on the fly at the point of inspiration.
Enhanced engagement:Restaurant apps have the ability to use geolocation and loyalty data to send users offers based on location, time of day and personal preferences. The mobile app can also enhance customer experience when they walk in the restaurant by presenting custom data such as nutrition information, menu specials and gaming and custom media content matching customers’ interests.
Linebusting:Linebusting is the practice of sending employees equipped with mPOS devices to take customer orders and payments before they reach the counter. This helps in shortening the queue and speeding up service.
Out-of-store service and payments:mPOS devices also enable a number of out-of-store capabilities, including catering, out-of-restaurant special events and delivery. This not only expands and streamlines general-service capabilities but also offers the opportunity to upsell products and services at the point of remote service without sacrificing security or transaction rates.
Restaurant Mobile App
Listed below are some of the features incorporated by industry leaders in their mobile app.
Order and Pay aheadIn 2015, Starbucks completed the rollout of the mobile order ahead and payment feature in its app across all company-owned locations in the US. Within a year of launch, the mobile ordering and payment accounts for a quarter of the transactions. The move sets the stage for Starbucks delivery, which is expected to roll out in 2016 (recently started delivery in Empire State building in NYC). The company feels mobile pay and order can be major same-store sales driver in 2016 and also provide a long-term structural advantage for Starbucks (enhanced customer experience; integration into My Starbucks Rewards programme) that can produce multi-year sales lift (including through higher average ticket once the company turns on suggestive selling capabilities) and rapid mobile adoption (enabling one-to-one marketing).pasta of almost any shape and size, perfectly packed veggie burgers, carefully portioned, identically shaped servings of mashed potatoes. These things will be an easy task for

102
the 3-D printer. It will increase the creativity in food preparation and presentation, including customisation. Some pastry chefs already use 3-D printing to make intricate, edible cake decorations.
Delivery
Panera Bread 2.0 remodel also takes an integrated digital approach, including a mobile app that allows guests to order and pay ahead as well as use in-store touch screen kiosks. For Panera Bread, the mobile, web and in-store order by kiosks account for 10% of sales. Other chains that have launched apps with order and pay ahead capabilities are Taco Bell, Jamba Juice, Firehouse Subs and Papa Murphy’s Pizza. BJ’s Restaurants was one of the first casual-dining chains to launch a mobile app that allows diners to order ahead,
even though they might be dining in the restaurant. The idea is to speed service, payment through app allows the customers to leave when they are ready rather than waiting for the check. The adoption rate is, however, lower due to lack of awareness while the same is higher in case of take-outs.
In case of restaurants that offer customisation, a higher level of customisation is feasible with app ordering compared to in-store ordering. Also, app ordering eliminates wrong ordering on the part of restaurants.
The proliferation of tech-based third party providers such as Postmates or DoorDash has made restaurant delivery more accessible to consumers in an increasing on-demand economy. These providers train consumers to turn to their apps to decide what they want to eat. Many restaurant chains are concerned that they will lose the opportunity to draw consumers to their apps, which means they may also lose the data-collection potential
of that direct relationship. Olo, a New York-based digital ordering provider, announced a new delivery service called Dispatch that addresses that concern. Dispatch allows guests to use the participating restaurant chain’s app, placing their order, which goes directly to the respective chain’s POS system,
and paying ahead. At checkout, a delivery option is available where the customers can see a selection of delivery price quote options and times from local delivery providers who serve as last-mile couriers.
Postmates is working with Starbucks to integrate with their ordering system with Starbucks’ app, allowing the customers to order delivery through Starbucks’ app.
For restaurant chains like Starbucks, Chipotle and Panera Bread, which have integrated the ordering system with their app, the next logical step is to offer delivery themselves or tie up with last-mile logistics companies to deliver on behalf of them. Starbucks, for example, debuted ‘green apron delivery’ in New York City while signing with Postmates for delivery in Seattle and other areas.

103
Not all food enjoys such delivery demand. Fast-casual chains, however, saw a different opportunity. In an effort to compete with QSRs on the speed of service and convenience while still providing high quality, made-to-order products, fast-casual brands saw that digital ordering could make them faster than QSR. Customers could order online and schedule a pick-up time. The online ordering platform could fire the order into the kitchen just on time so that it is ready when the customer comes for pick-up. Many thought digital ordering would not be successful for coffee but with mobile apps it has become feasible as is evident from the success of ‘Mobile Order and Pay’ at Starbucks.
With smartphone apps, the digital ordering process has become simpler as these are web-enabled, location-aware devices and can store previous / favourite order details, thereby making digital ordering a simple process. It is estimated that due to smartphones, digital ordering at non-pizza chains will reach 50% of transactions in half the time that it took pizza chains.
Upstream ordering at Chick-Fil-A The upstream ordering system consists of servers armed with tablets taking customer orders while they are in line. Once the order is taken, it is transmitted to the kitchen along with the customer’s name. The customer then receives a colour-coded tag and is sent to the cash register of the same colour to pay. The customer then receives a pager that lights up and vibrates when the order is ready to be picked up. All orders are picked up at same location regardless of the cash register. The system intends to simulate the drive-thru experience at restaurants in urban areas and shopping malls. This has reduced the time for the customer from 10-15 minutes to 4-6 minutes.
Loyalty
Nutrition DataThis can be an added feature for chains that have healthy options and want to showcase the same to the targeted audience.
Digital ordering: A key channel for restaurants
Starbucks predicts that the addition of mobile ordering will boost participation in the chain’s loyalty programme. It will also help the brand to reach more consumers with target marketing, and more upselling components to the mobile app. Taco Bell is expected to integrate the loyalty programme with the app.
The rate of adoption for the traditional loyalty programme is 5-12% while for mobile payment combined with the loyalty programme it increases to 18-28%.
Digital ordering in the restaurant business started with pizza. The top-three players (Pizza Hut, Domino’s and Papa John’s) found a new way to capitalise on the rise of internet penetration at homes. Online ordering was a natural extension to calling the stores for orders as the delivery market was substantial for pizza chains. At present, at least 50% of the transactions at these 3 chains are through digital ordering in the US.

104
Digital ordering at casual-dining restaurantsNRA reports that 75% of the restaurant industry transactions are consumed off-premise: The rise of fast-causal chains is putting competitive pressure on casual-dining restaurants as the former better serves a guest looking to consume the food off-premise. Fast casuals are designed to prepare the food efficiently, made-to-order and at minimal cost. Nearly 50% of fast-casual operators have embraced digital ordering as it provides benefits like larger average order size (customers no longer feel rushed and are given suggestive selling recommendations); higher visit frequency (loyal customers return more frequently when given the convenience of getting to skip the line at pick-up); reduce food waste; and improved order accuracy.
Casual-dining operators should not be constrained by the thought that ‘it is all about the lively environment and why would I want my customer to consume off-premise?’ Operators must capitalise on the opportunity to level the playing field with fast-casual and quick-service restaurants. This has a potential to transcend the limitations of a fixed-dining room and long table turn times by breaking into the limitless dining room of off-premise and the only constraint is how many customers the kitchen can serve.
CustomisationStacked has incorporated an iPad ordering system wherein the customers are able to select their desired ingredients to visually build their meal on the iPad (which is at each table) before sending the order to the kitchen. With hundreds of toppings and variations, each order can be a completely unique formulation of the menu. The iPad ordering system also intimates the approximate time for the order.
Streamlining restaurant operations using technologyOver time, everyone develops different processes for formalising every aspect of their many locations so that customers know what they are getting. The way managers and others ensure they reach that consistency does not have to stay the same. Technology, specifically mobility, provides the opportunity to automate task completion and share information quickly and easily. The following are the three ways mobile technology can help restaurants to streamline their operations –
Prioritising activities and managing day-to-day operations with mobile solutionsEvery employee at a restaurant has a series of jobs secondary to customer service to finish each day. Mobile solutions that bring new assignments directly to smartphones or tablets that workers already carry can make it perfectly clear what they are responsible for; automating activities based on exceptions can make operations even smoother. As new tasks approach, mobility ensures everyone who needs to be updated of new jobs receives notifications as well as a clear list of priorities and the goal of the day.
Simplifying store management with mobilityKeeping track of sales figures and other information on a store-by-store basis is a time-consuming process. The management needs these numbers quickly to make correct decisions and purchases across locations. People sometimes just forget to do things or they may misplace or misremember

105
important information and, hence, the integration of task automation in any form is likely to have benefits for the company. Using electronic forms streamlines activity around offices and also allows employees to do their jobs on the run. Mobile solutions also provide a flexible method of delivering information to the right parties.
Automating customer-facing processThere are solutions available that can be applied to the customer-facing aspects of business in ways that will not too heavily detract from the uniform experience that restaurants strive for. Primarily, these have to deal with the integration of optional services for ordering products. For example, integration of the mobile app and the in-store touchscreen for ordering.
All of these possibilities for deploying and leveraging mobile technology come with myriad benefits. The biggest contributions are the increased focus on accountability and greater efficiency they provide. Freeing up employees to focus on the customer experience in the restaurant and on food means the restaurant can deliver the familiar brand experience that keeps customers coming back.
POS SystemCloud-based POSWith myriad of disparate hardware and software systems that restaurants need to keep running their businesses, the role of chief information officer (CIO) in the restaurant industry is becoming an industry. Cloud-based POS systems offer many benefits; they remove the burden of having to update and maintain traditional on-premise systems, seamlessly take care of many back-end processes – from payment to inventory – and reduce costs in the long run. The systems can help remove the role of CIO and help restaurants focus on food and service. The following are the common misconceptions regarding cloud-based POS –
Л Data will be less secure - Restaurant operators feel more secure knowing exactly where their physical server is located. No matter where the server is located, the vulnerability to attacks and breaches will always exist. With the cloud, instead of the operators bearing the burden of keeping their systems up-to-date, they have advantage of highly trained IT professionals who are maintain the data round the clock. Also, in the event of disaster, the possibility of recovery from an on-premise server is less compared to cloud where there are multiple back-ups.
Л All of this new technology will be too expensive - Restaurant operators pay large upfront costs for traditional on-premises systems, which get out-dated in a few years. Cloud-based POS and management systems usually have minimal or no upfront cost as they are based on the subscription model. The subscription fee takes care of software, support, backups and, most importantly, future upgrades.
Л If one loses internet connection, one loses the business - Most of today’s systems build intelligence directly into the hardware to keep the business running even in the event of a network outage.

106
Л Cloud does not offer any benefit that the current system cannot provide - The biggest benefit cloud-based systems provide is integrated data. With these systems, operators can automatically sync sales, payments (including mobile/online payments), inventory, customer relationship management (CRM) and payroll data to the accounting software. This gives an ability to always have an accurate, consolidated understanding of the money flowing in and out of businesses, ultimately making it possible to run operations as leanly and effectively as possible.
Which mobile POS system to orderMobility continues to be a growing trend in restaurants and one that delivers real results. Handheld-ordering and payment devices can reduce labour needs while boosting table turns. One key benefit is that mobile devices can increase staff productivity so the customer’s overall experience is enhanced.
Before making a final decision about which handheld POS device to use, restaurants need to consider their brand, service model and concept before they take the plunge. A goal for a limited service restaurant may be line-busting while that for a full-service restaurant would be allowing servers to handle more tables.
Purpose built vis-à-vis consumer based The first decision is the source of the mobile device–units developed specifically for foodservice settings vis-à-vis off-the-shelf tablets or phone-sized devices using special software and apps. On the consumer-based side, electronic tablets and smart phones are familiar to servers and customers but getting the big picture is important.
Л Purpose-built devices have been designed to withstand restaurant inflicted abuse and accidental spills. By contrast, consumer tablets need to be protected with cases which tend to reduce out the cool factor.
Л The shrinkage level will be lower in purpose-built units due to limited usefulness.
Л Network security is of utmost importance. Consumer-based devices will operate over Wi-Fi while purpose-built units use radio frequencies, the troubleshooting of which can be taken care of only by service providers. Also, the device range is critical.
Л A tablet-sized device tends to be better for quick service where you need more screen space for each order. At the same time, the larger the device, the harder it is to carry around. In high-volume restaurant formats like QSRs, one would never put the device away because of constant traffic. In case of full-service restaurants, the servers would do better with devices that are smaller, easy to carry and discreet.
Л The device should ideally be able to last two shifts before recharging. Considering the amount of usage mobile devices will undergo per shift is important. QSR mobile units are in play for a longer duration compared to full-service restaurants.
The iPad is fast evolving as an option for POS technology for both server-based systems as well as cloud based systems.

107
Tech: What to prioritise
Technology has been lauded as the saving grace of the restaurant industry, which relies heavily on efficiency. Restaurant operators report seeing that technology has a direct impact on increased revenue, increased efficiency and increased customer brand connectivity. Many operators, however, feel the cost of maintaining or upgrading technology is a major obstacle and state that they lack the staff to manage IT upgrades. Hence, these operators are finding solutions that are straightforward and offer support to increase productivity with minimal requirements for training and upkeep.
Focusing on social media is an easy way to leverage tech as it requires minimal know-how and economic investment it just requires vigilance and plan. The key to success is to be responsive and get up-to-speed on the social media market. Restaurant operators could implement software to notify when certain keywords are posted on social media sites, allowing them to respond quickly to customer concerns and manage their brand’s online image effectively.
One of the most important considerations is 24-hour, simple, and relevant technology support so that operators can integrate efforts in a way that increases efficiency, not confusion.
The key is that restaurant operators should not start chasing the latest app, technology or fad while forgetting what’s core to the brand.
5 things to avoid during technology implementations
Л Keeping tech implementation a secret - A technology solution often affects the entire enterprise in one way or another and, hence, it is important to be proactive and inform people early and follow up with regular updates.
Л Diluting focus by taking too many initiatives at once - Rolling out multiple initiatives can be a recipe for disaster and it is necessary to be practical and implement one initiative at a time.
Л Missing the opportunity to examine old processes while updating the systems - This can be a great chance to fix bad company-wide habits. Evaluating food-storage locations may make sense while creating new inventory sheets.
Л Underestimating the resources needed - Implementing ERP is a big job and it touches almost everyone and, hence, choosing a smart and responsible team lead is critical to drive the process. The lead should have a dedicated team, budget and a go-to executive sponsor who can be tapped for additional help if required.
Л Aiming at a moving target - The legacy system contains much of the data required for the day-to-day running of the restaurant. Changing certain things at the start of implementation can slowdown the project dramatically and, hence, it is critical to sequence the changes so that day-to-day operations are not affected.


109
McDonaldsBrand - McDonalds
Format – Quick Service Restaurant
Cuisine – Burger
BriefMcDonald’s is the largest restaurant company in the world. The company currently has around 36,500 stores in 119 countries. Ranked at 6, McDonald’s is the only restaurant brand in the top 50 most valuable global brands as compiled by Forbes. McDonald’s sells around 6.5 million burgers a day across the globe.
Key Events Л 1940 – Dick and Mac McDonald open McDonald’s Bar-B- Q restaurant in San Bernardino, California
Л 1948 –Store converted into a self-service, drive-in restaurant with only 9 items, including staple hamburger
Л 1955 – Ray Kroc incorporates McDonald’s Corp and opens his first restaurant as a franchisee in Des Plaines, Illinois
Л 1961 – Kroc buys out McDonald brothers for USD 2.7 million
Л 1965 – McDonald’s goes public, offering shares at USD 22.5 per share
Л 1967 – McDonald’s first international restaurants open in Canada and Puerto Rico
Л 1968 – 1,000 th store opens in Des Plaines, Illinois
Л 1978 – 5,000 th store opens in Kanagawa, Japan
Л 1983 – McDonald’s is present in 32 countries.
Л 1988 – 10,000 th store opens in Washington DC
Л 1993 – McCafé launched in Australia
Л 1996 – 20,000 th store opens; McDonald’s debuts in India
Л 1999 – 25,000 th store opens in Chicago
Л 2002 – McCafé debuts in US
Л 2013 – 35,000 th store opens
Л 2015 – All-day breakfast menu rolled out

110
Store Break-up (38,500 stores)
Revenue Break-up (USD 25.4 bn)
Market View Л McDonald’s growth is driven by all-day breakfast and tactical campaigns such as quality focus in Europe and value meals in Asia. The company achieved positive same-store sales growth after 8 quarters of decline and an increase of more than 5% after 14 consecutive quarters.
Store Break-up (38,500 stores)
Revenue Break-up (USD 25.4 bn)
Geo
grap
hica
l Seg
men
tBu
sines
s Seg
men
t
Break-up for fiscal year 2015
Key Financials
FY13 FY14 FY15 FY16E FY17E
Revenue (USD Mn) 28,106 27,441 25,413 24,115 22,658
EBITDA% 36.8% 35.0% 34.2% 38.1% 42.2%
EBIT% 31.2% 29.0% 28.1% 31.9% 36.2%
PAT% 19.9% 17.3% 17.8% 19.3% 21.7%
Source: Bloomberg, Avendus analysis
Source: Bloomberg, Avendus analysis

111
Л Refranchising efforts may aid cash-flow predictability: McDonald’s has higher operating margin than peers due to higher-margin franchise revenue–over 80% of its restaurants are franchised.
Л Structural reorganization based on geographies: The US (US and Canada),international lead markets (Australia, Canada, France, Germany and the UK), high-growth markets (China, Korea, Russia, Poland, Italy, Spain, Netherlands and Switzerland) and foundational markets and focus on operational efficiencies should provide a foundation for efforts around core menu innovation, improved customer service and an updated value platform. The company is also leveraging its new structure to share best practices between the geographical segments.
Л McDonald’s turnaround efforts, particularly in the US, to improve food quality perception, offering friendlier service and providing customization options should result in the company regaining its lost market share.
ValuationThe EV/EBITDA, which was trading in the 9-10 times range historically, has increased to 13-14 times recently on account of positive same-store sales growth and refranchising efforts.
Ratio FY13 FY14 FY15 FY16E FY17E FY18E
P/E 17.5x 19.4x 23.8x 22.9x 20.5x 19.3x
EV/EBIT 12.3x 13.0x 17.3x 16.6x 15.6x 14.5x
EV/EBITDA 10.4x 10.7x 14.2x 13.9x 13.4x 13.3x
Note: The EV/EBITDA for FY1 is calculated as EV as on date and current year EBITDA estimate. Similarly, the EV/EBITDA for FY2 is calculated as EV as on date and next EBITDA estimate.Source: Bloomberg (May 06, 2016), Avendus analysis

112
PROFILES – Starbucks Corp.Brand - Starbucks
Format – Quick Service Restaurant
Cuisine – Coffee and Snacks
BriefStarbucks is the largest beverage-based restaurant company in the world. The company currently has 23,570 stores in 67 countries. The company also owns brands like Teavana and Fresh Evolution. Starbucks recently launched ‘Evenings’, serving alcohol at some of its stores and aims to have USD 1 billion in revenue from alcohol by 2019.
Key Events Л 1971 – Starbucks opens first coffee retailing store in Seattle’s Pike Place Market
Л 1982 – Howards Schultz joins Starbucks; company begins providing coffee to restaurants and espresso bars.
Л 1984 – Schultz convinces founders to test coffee house concept; first Latte is served.
Л 1985 – Schultz founds Il Giornale, offering brewed coffee and espressos made from Starbucks’ coffee beans
Л 1987 – II Giornale acquires Starbucks and renames it Starbucks Corp
Л 1992 – Starbucks goes public; store count reaches 165
Л 1996 – Store count crosses 1,000; opens store in Japan–first store outside of North America
Л 2002 – Store count crosses 5,000
Л 2005 – Store count crosses 10,000
Л 2014 – Store count crosses 20,000
FY13 FY14 FY15 FY16E FY17E
Revenue (USD Mn) 14,867 16,448 19,163 21,526 23,447
EBITDA 2.2% 23.3% 23.7% 24.5% 25.3%
EBIT -2.2% 18.7% 18.8% 20.0% 21.0%
PAT 0.1% 12.6% 14.4% 13.1% 13.9%
Source: Bloomberg, Avendus analysis
Key Financials

113
Market View Л Starbucks’ sales gain aided by unit growth: Starbucks’ revenue has increased at a CAGR of 11.7% since 2010. Traffic and sales have been driven by a combination of strong non-US unit growth, product innovation, increase in food orders and high adoption of mobile payment in the US.
Л Cost savings may help operating margin: Starbucks’ operating margin is lower than Dunkin’ Donuts’ due to a higher percentage of owned stores. Starbucks is focusing on innovation, operations and finance and has identified about USD 1 billion in potential leverage across the company’s cost of goods sold.
Л Mobile strategy streams up Starbucks’ operational opportunities: Mobile ordering and payment has increased transactions; currently, over 21% of transactions at the company-operated stores in the US are through mobile devices.
Л Starbucks has tied up with partners such as Spotify, the New York Times and Lyft to provide ’Stars’ to their customers; these can only be redeemed at Starbucks..
Store Break-up (23,570 stores)
Busin
ess S
egm
ent
Revenue Break-up (USD 19.1 bn)
Store Break-up (23,570 stores)
Geo
grap
hica
l Seg
men
t
Break-up for fiscal year 2015
Revenue Break-up (USD 19.1 bn)
Source: Bloomberg, Avendus analysis

114
ValuationThe EV/EBITDA is trading at 15-16 times the 1-year forward EBITDA.
Ratio FY13 FY14 FY15 FY16E FY17E FY18E
P/E 35.2x 28.9x 35.2x 31.5x 27.3x 23.9x
EV/EBIT NM 18.4x 24.1x 20.4x 18.0x 16.6x
EV/EBITDA 170.5x 14.8x 19.2x 16.7x 14.8x 13.2x
Note: The EV/EBITDA for FY1 is calculated as EV as on date and the current year EBITDA estimate. Similarly, the EV/EBITDA for FY2 is calculated as EV as on date and the next EBITDA estimate; NM - Not Meaningfu
Source: Bloomberg (May 06, 2016), Avendus analysis

115
Yum! Brands Inc.
Brand - Pizza Hut KFC Taco Bells
Format - Quick-Service Restaurant/Casual
Dining
Quick-Service Restaurant
Quick-Service Restaurant
Cuisine - Pizza Chicken Mexican
BriefYum! Brands was formed after PepsiCo’s restaurant business was spun off in 1997. The company operates nearly 41,000 restaurants in over 130 countries under three brands–Pizza Hut, KFC and Taco Bell. Pizza Hut operates under casual dining as well as QSR while KFC and Taco Bell operate under QSR. There are over 15,500 Pizza Hut outlets in 90 countries, around 19,500 KFC outlets in 115 countries and around 6,200 outlets of Taco Bell, of which 6,000 are in the US.
Key Events : Pizza Hut Л 1958 – Dan and Frank Carney open first Pizza Hut outlet in Wichita, Kansas
Л 1970 – 500thoutlet opens in Nashville, Tennessee
Л 1971 – Pizza Hut becomes the largest pizza restaurant chain in US and globally in terms of both sales and number of restaurants (1,000+)
Л 1972 – Pizza Hut goes public
Л 1973 – 2,000thoutlet opens in Independence, Missouri; goes international with restaurants in Japan, Canada and England
Л 1977 – Pizza Hut merges with Pepsi Co
Л 1986 – 5,000thoutlet opens in Dallas, Texas
Л 1994 – Pizza Hut becomes the first restaurant chain to offer facility to order pizza via internet. Outlet count crosses 10,000
Л 1997 – PepsiCo spins off restaurant division as Tricon Global Restaurants
Л 2002 – Tricon Global Restaurants becomes Yum! Brands
Key Events : KFC Л 1934 – Harland Sanders starts serving customers fried chicken at service station he operates
Л 1937 – Sanders expands restaurant and names it Sanders Court & Café

116
Л 1940 – Sanders finalises ’Original Recipe’
Л 1952 – Sanders starts franchising recipe to other restaurants; name Kentucky Fried Chicken adopted based on suggestion of first franchisee Pete Harman
Л 1960 – Outlet count crosses 200 Л 1963 – Outlet count crosses 600
Л 1964 – Group led by John Brown, in association with financer Jack Messey and first franchisee Pete Harman, acquires company from Sanders. Franchisees asked to sell only KFC products and stop selling own products
Л 1965 – KFC opens first international outlet in Canada
Л 1966 – KFC goes public
Л 1970 – Outlet count crosses 3,000; presence in 48 countries
Л 1971 – KFC sold to packaged food and drinks corporation Heublein Inc.
Л 1986 – PepsiCo acquires KFC; outlet count crosses 6,500
Л 1987 – KFC becomes first chain to enter China
Л 1991 – Outlet count crosses 8,500; chain adopts KFC name
Key Events : Taco Bell Л 1954 – Glen Bell opens Bell’s Drive-In and Taco Tia in San Bernardino area
Л 1962 – Bell opens first Taco Bell restaurant in Downey, California
Л 1964 – Bell starts franchising Taco Bell
Л 1967 – 100th outlet opens in Anaheim, California
Л 1970 – Taco Bell goes public with 325 outlets
Л 1978 – Bell sells 868 Taco Bell restaurants to Pepsi Co
Л 1981 – Taco Bell opens first international outlets in Canada and Australia
Primary SegmentCurrently, Yum! Brands’ primary segment is the China division that covers both KFC and Pizza Hut in the country and accounts for around 70% of the total owned stores for these two brands. The India division covers all three brands in India, Sri Lanka, Bangladesh and Nepal. The stores in other countries, including in the US, are organised according to the brand.

117
Key Financials
FY13 FY14 FY15 FY16E FY17E
Revenue (USD Mn) 13,084 13,279 13,105 13,462 13,727
EBITDA 19.3% 17.3% 20.4% 22.1% 23.3%
EBIT 13.7% 11.7% 14.7% 16.4% 17.6%
PAT 8.3% 7.9% 9.9% 10.6% 11.1%
Source: Bloomberg, Avendus analysis
Market View Л Yum! Brands aims to unlock value with a spin-off of the China division. Post spin-off, Yum! Brands’ mostly company-owned and-operated China business will become a separate entity and a franchisee of Yum! Brands. The move is expected to enable both companies to focus on accelerating growth and improving margin and shareholders’ value. The spin-off will also result in an increase in operating margin, as margins are higher in the franchised
Break-up for fiscal year 2015
Store Break-up (41,200 stores)
Revenue Break-up (USD 13.1 bn)
Geo
grap
hica
l Seg
men
tBu
sines
s Seg
men
t
Store Break-up (41,200 stores)
Revenue Break-up (USD 13.1 bn)
Source: Bloomberg, Avendus analysis

118
segment. The spin-off is expected to be completed by the end of 2016.
Л Yum! Brands’ split may spur growth for Taco Bell, KFC and Pizza Hut. Franchised chains have higher operating margin due to lower overhead costs. Stronger restaurant-level economics can translate into faster unit growth because franchisees have a strong motivation to open stores.
Л Taco Bell is mostly US-based with international expansion in the early stages. Given the 22% restaurant-level margins, Taco Bell is very attractive to franchisees for expansion. Taco Bell also recently entered the fast-growing breakfast segment, providing a likely boost to same-store sales.
Л All three brands are market leaders in their respective categories with Pizza Hut owning over 25% share in the US. The spin-off of the China division will help the company focus on individual brands, thus driving same-store sales and unit growth.
Yum! Brands’ is targeting value meal options to gain a larger slice of the sales pie in the respective segments of each brand. This will, however, slow margin expansion
ValuationThe EV/EBITDA is trading at 11-12 times the 1-year forward EBITDA.
Ratio FY13 FY14 FY15 FY16E FY17E FY18E
P/E 24.6x 21.9x 22.4x 22.3x 19.5x 16.5x
EV/EBIT 19.6x 22.2x 17.9x 15.9x 14.5x 12.5x
EV/EBITDA 14.0x 15.1x 12.9x 11.9x 11.1x 10.1x
Note: The EV/EBITDA for FY1 is calculated as EV as on date and the current year EBITDA estimate. Similarly, the EV/EBITDA for FY2 is calculated as EV as on date and the next EBITDA estimate.Source: Bloomberg (May 06, 2016), Avendus analysis

119
PROFILES – Chipotle Mexican GrillBrand - Chipotle Mexican Grill
Format – Fast Casual Restaurant
Cuisine – Mexican
BriefChipotle operates fast-casual restaurants serving burritos and other Mexican food. The restaurant chain is one of the first global fast-casual chains and offers higher quality ingredients than quick-service restaurants along with customisation, lower prices and faster service. The company currently operates over 2,000 outlets, mostly in the US, all company operated. Chipotle has had unprecedented positive same-store sales growth since listing in 2006 till the last quarter of 2015 when sales declined by 15% after numerous stores were shut down due to an E. Coli outbreak at its stores.
Key Events Л 1993 – Steve Ellis opens first Chipotle Mexican Grill in Denver, Colorado
Л 1998 – McDonald’s makes a minority investment in company; store count is 16
Л 2001 – McDonald’s becomes largest investor in company
Л 2005 – Store count crosses 500
Л 2006 – Goes public while McDonald’s divests entire stake
Л 2015 – Store count crosses 2,000
Key Financials
FY13 FY14 FY15 FY16E FY17E
Revenue (USD Mn) 3,215 4,108 4,501 4,378 5,150
EBITDA 19.8% 19.6% 20.0% 19.9% 10.5%
EBIT 16.7% 16.6% 17.3% 17.0% 7.0%
PAT 10.2% 10.2% 10.8% 10.6% 4.4%
Source: Bloomberg, Avendus analysis

120
Market View Л US unit growth and time may reignite sales post illness: Chipotle’s revenue increased at a CAGR of 19.6% since 2010, fueled by 13% unit growth and consistent same-store sales growth. The company expects to continue its US-focused unit growth.
Л Margins drop as safety, labour add to ongoing costs: The Company expects new food safety procedures to add about 200bps to recurring costs. Its ability to raise prices, however, will be limited for some time, creating a drag on margins.
Л Free burritos fail to meaningfully raise sales: The Company’s advertising blitz, which included free burritos, failed to translate into meaningful improvement in same-store sales.
Л E. Coli-related sales recovery may take 12-18 months, meaning investors might not see sales rebound until 2017.
Л Legal action due to the E. Coli outbreak linked to its stores may impact future earnings.
ValuationPost the E. Coli outbreak; investors dumped the stock, which tumbled by around 40% subsequently. In the process, Chipotle’s global ranking based on valuation dropped to the fourth position from the third position. While the company has recovered recently, the valuation is still subdued.
Ratio FY13 FY14 FY15 FY16E FY17E FY18E
P/E 50.2x 48.0x 31.2x 76.0x 36.4x 23.8x
EV/EBIT 30.0x 28.8x 18.4x 38.1x 21.5x 16.2x
EV/EBITDA 25.4x 24.9x 15.7x 31.4x 17.4x 13.1x
Note: The EV/EBITDA for FY1 is calculated as EV as on date and the current year EBITDA estimate. Similarly, the EV/EBITDA for FY2 is calculated as EV as on date and the next EBITDA estimate.Source: Bloomberg (May 06, 2016), Avendus analysis

121
Restaurant Brands Inc.
Brand - Burger King Tim Hortons
Format - Quick-Service Restaurant
Quick-Service Restaurant
Cuisine - Burger Coffee and Snacks
BriefYum! Brands was formed after PepsiCo’s restaurant business was spun off in 1997. The company operates nearly 41,000 restaurants in over 130 countries under three brands–Pizza Hut, KFC and Taco Bell. Pizza Hut operates under casual dining as well as QSR while KFC and Taco Bell operate under QSR. There are over 15,500 Pizza Hut outlets in 90 countries, around 19,500 KFC outlets in 115 countries and around 6,200 outlets of Taco Bell, of which 6,000 are in the US.
Key Events : Burger King Л 1953 – Success of McDonalds brothers’ original store inspires Keith Kramer and Matthew Burns to start Insta-Burger King in Jacksonville, Florida
Л 1954 – James McLamore and David Edgerton acquire licenses to open and operate an Insta-Burger King franchise
Л 1959 – McLamore and Edgerton acquire the brand from founders and rechristen the company Burger King
Л 1967 – Pillsbury Company acquires Burger King
Л 1989 –British alcoholic beverage company Grand Metropolitan acquires Pillsbury and revives Burger King, which had faltered
Л 1997 – Grand Metropolitan merges with Guinness to form Diageo
Л 2002 – Private-equity consortium led by TPG Capital with Bain Capital and Goldman Sachs Capital Partners acquires Burger King from Diageo
Л 2006 – Burger King goes public with record stock sale of USD 425 million
Л 2009 – 12,000th store opens in Beijing
Л 2010 – 3G Capital acquires Burger King and takes company private
Л 2012 – Burger King again goes public

122
Л 2014 – Burger King merges with Tim Horton to form Restaurant Brands
Key Events : Tim Horton Л 1964 – Tim Horton opens first store in Hamilton, Canada
Л 1984 – First US location opens in Tonawanda, New York
Л 1991 – 500th store opens in Aylmer, Quebec
Л 1995 – 1,000th store opens in Ontario. Tim Horton merges with Wendy’s to expand concept in the US
Л 2000 – 2,000th store opens in Toronto, Canada
Л 2006 – The company goes public, with Wendy’s divesting stake. 3,000th store opens in New York
Л 2011 – Store count crosses 4,000
Key Financials
FY14 FY15 FY16E FY17E
Revenue (USD Mn) 4,052 4,110 4,388 4,052
EBITDA% 20.8% 33.9% 41.7% 42.5%
EBIT% 15.1% 29.4% 36.8% 37.7%
PAT% - 22.5% 12.6% 14.9% 15.6%
Source: Bloomberg, Avendus analysis
Brea
k-up
by
Bran
ds
Revenue Break-up (USD 4 bn)
Revenue Break-up (USD 4 bn)
Brea
k-up
by
Geo
grap
hy
Source: Bloomberg, Avendus analysis

123
Market View Л Same-store sales have improved significantly at Burger King and Tim Hortons: Burger King received a boost from fewer, impactful limited-time offers and value promotions. While Tim Horton’s growth was fueled by a strong pipeline of new products.
Л Margins are high due to the almost 100% franchised system for Burger King and strong company-owned store sales at Tim Hortons’, doubling the EBITDA.
Л Burger King’s remodel boosts same-store sales: About 50% of Burger King stores in the US were remodeled at the end of 2015. Burger King also offered its US franchisees reduced franchisee fees to encourage faster adaption; however, this is likely to curb the effective franchisee fee rate till 2021.
Л Burger King boosted international units by 39% over 2011-2014 with an innovative structure that connects local restaurant operators with financing partners (typically private equity partners) to create a master franchise joint venture. The operators include Tab Gida in China and Alsea Sab in Mexico, while the private equity partners include Cartesian Capital in China and Vinci Partners in Brazil.
Л Tim Hortons’ US and overseas development could boost growth: Tim Hortons is ramping up franchise development in the US and other markets outside Canada. International branding may, however, require heavy investment as the brand has limited awareness even in the US.
ValuationThe EV/EBITDA is trading at 17-18 times the 1-year forward EBITDA.
Ratio FY14 FY15 FY16E FY17E FY18E
P/E NM 48.1x 30.3x 25.4x 20.5x
EV/EBIT 108.3x 16.5x 19.0x 17.6x 16.0x
EV/EBITDA 78.5x 14.3x 17.0x 15.6x 14.2x

124
Note: The EV/EBITDA for FY1 is calculated as EV as on date and the current year EBITDA estimate. Similarly, the EV/EBITDA for FY2 is calculated as EV as on date and the next EBITDA estimate; NM - Not MeningfulSource: Bloomberg (May 06, 2016), Avendus analysis

125
Jubliant FoodWorks Ltd.
Brand - Domino’s Pizza Dunkin’ Donuts
Format - Quick-Service Restaurant
Quick-Service Restaurant
Cuisine - Pizza Coffee and Snacks
BriefJubilant FoodWorks is the largest restaurant company in India. It is the master franchisee for Domino’s Pizza in India, Sri Lanka, Bangladesh and Nepal. The company operates more than 1,000 Domino’s Pizza outlets across 230 cities and has over 70% market share in the organised pizza market in India.
It is also a master franchisee for Dunkin’ Donuts in India and operates 70 Dunkin’ Donuts outlets in 24 cities.
Key Events Л 1995 – Enters into master franchise agreement with Domino’s International for North and West regions of India
Л 1996 – First Domino’s Pizza outlet opens in New Delhi
Л 1998 – Master franchise agreement for Domino’s Pizza extended to whole of India and Nepal
Л 2005 – Becomes master franchisee for Domino’s Pizza for Sri Lanka and Bangladesh
Л 2006 – Domino’s Pizza outlet count crosses 100
Л 2009 – Domino’s Pizza outlet count crosses 200
Л 2010 – Company goes public with outlet count of around 300.
Л 2012 – Domino’s Pizza outlet count crosses 500; becomes master franchisee for Dunkin’ Donuts in India, opens first Dunkin’ Donuts outlet
Л 2015 – Dunkin’ Donuts outlet count reaches 70
Л 2016 – Domino’s Pizza outlet count crosses 1,000

126
Key Financials
FY13 FY14 FY15 FY16 FY17E FY18E
Revenue (INR Million) 14,141 17,360 20,924 24,372 29,517 35,822
EBITDA 17.2% 14.4% 12.3% 11.4% 12.2% 13.4%
EBIT 13.3% 9.9% 7.4% 6.1% 8.7% 10.9%
PAT 9.3% 6.8% 5.3% 4.3% 5.1% 6.0%
Source: Bloomberg, Avendus analysis
Market View Л With over 1,000 Domino’s Pizza outlets, the company is expected to reduce the pace of store openings (from March 2013 till date, the outlet count has increased from 586 to 1004). Moreover, the economy has been subdued and the time taken for new stores to reach maturity has stretched, thereby dragging margins.
Л Existing cities, especially Tier-II and Tier-III cities, are not fully penetrated, providing an avenue for unit growth: Margins in these cities are not lower than those in large cities as the lower sales volume is offset by lower operating costs such as rent and labour.
Л Largest food-tech Company in India – The online/digital-ordering platform is growing and is likely to provide a boost to same-store sales. The contribution of online ordering increased from 21% in Q3FY15 to 38% in Q4FY16 and is expected to increase further (online ordering contributes to about 75% of Domino’s US sales).
Л Non-traditional distribution channels such as airports, railways and office complexes are likely to augment growth: The Company has tied up with Indian Railway Catering and Tourism Corporation (IRCTC) to provide pizzas to railway passengers at certain stations. As IRCTC expands this service to more stations, Domino’s is poised to benefit, given its wide network.
ValuationThe company has been trading at an EV/EBITDA of 22-23 times the 1-year forward EBITDA.
Ratio FY13 FY14 FY15 FY16 FY17E FY18E
P/E 62.0x 58.8x 87.2x 61.8x 42.3x 29.7x
EV/EBIT 42.7x 40.0x 61.7x 44.6x 31.4x 21.8x
EV/EBITDA 33.0x 27.4x 37.4x 25.5x 18.7x 13.9x

127
Note: The EV/EBITDA for FY1 is calculated as EV as on date and the current year EBITDA estimate. Similarly, the EV/EBITDA for FY2 is calculated as EV as on date and the next EBITDA estimate.Source: Bloomberg (May 06, 2016), Avendus analysis

128
Westlife Development LimitedBrand - McDonalds
Format – Quick Service Restaurant
Cuisine – Burger
BriefWestlife Development, through its subsidiary Hardcastle Restaurants, is the master franchisee for McDonald’s and McCafé restaurants in West and South India. The company operates 223 outlets across 29 cities in 8 states in West and South India.
Key Events Л 1996 – Company opens first outlet in Mumbai
Л 2000 – Opens outlet in Pune, first outlet outside of Mumbai
Л 2002 – Opens first outlet in Ahmedabad, Gujarat.
Л 2006 – Opens first outlet in South India (Bengaluru)
Л 2007 – Outlet count reaches 50
Л 2010 – Outlet count reaches 100; breakfast introduced
Л 2012 – Outlet count reaches 150
Л 2013 – Hardcastle Restaurants merges with Westlife Development. First McCafé opens in Mumbai
Л 2014 – Outlet count reaches 200
Key Financials
FY13 FY14 FY15 FY16 FY17E FY18E
Revenue (INR Mn) 3,800 7,403 7,643 8,236 9,744 11,760
EBITDA 17.2% 6.5% 2.5% 5.2% 7.4% 9.3%
EBIT 8.9% 0.6% -4.1% -1.8% 1.2% 3.5%
PAT 5.6% 0.1% -3.8% 0.3% 0.3% 2.5%
Source: Bloomberg, Avendus analysis

129
Market View Л Same-store sales growth turns positive after nine quarters: This growth can be primarily attributed to product introduction, contribution from McDelivery and McCafé. Currently, McDelivery is offered in 120 outlets while McCafé is present in 62 outlets. As the proportion of stores with McDelivery and McCafé increase, same-store sales growth is expected to grow along with operating margin.
Л Restaurant operating margin has increased from 6.2% in Q2 FY15 to 13.1% in Q3 FY16 on account of better product mix, menu pricing and effective cost management.
Л Currently, McDonald’s (Hardcastle Restaurants) is present in 24 cities, while Domino’s is present in 25 cities in Maharashtra alone. The under-penetrated market presents a high scope for unit expansion. Hardcastle Restaurants also plans to double the number of McCafés in the next 12-18 months; this is likely to boost both revenue as well as margins.
Valuation
Ratio FY14 FY15 FY16 FY17E FY18E
P/E 5,113.6x NM NM 262.9x 73.0x
EV/EBIT 1,178.8x NM NM 162.3x 54.1x
EV/EBITDA 113.7x 228.2x 66.6x 39.2x 24.9x
Store Break-up (223 stores)
Revenue Break-up (INR 7,643 mn)
Break-up for fiscal year 2015
Source: Bloomberg, Avendus analysis

130
Note:The EV/EBITDA for FY1 is calculated as EV as on date and the current year EBITDA estimate. Similarly, the EV/EBITDA for FY2 is calculated as EV as on date and the next EBITDA estimate; NM - Not MeaningfulSource: Bloomberg (May 06,2016), Avendus analysis


132
Annexure 1 – Top brands with more than $1 Bn of system wide sales in the US
Rank Chain Segment Sub-Segment Sales # Units AUV (USD Mn)
1 McDonald's QSR LSR/Burger 35,447 14,350 2.5
2 Starbucks Coffee QSR Beverage-Snack 13,019 11,939 1.1
3 Subway QSR LSR/Sandwich 12,265 26,530 0.5
4 Burger King QSR LSR/Burger 8,632 7,129 1.2
5 Wendy's QSR LSR/Burger 8,568 5,750 1.5
6 Taco Bell QSR LSR/Mexican 8,200 5,921 1.4
7 Dunkin' Donuts QSR Beverage-Snack 7,176 8,082 0.9
8 Chick-Fil-A QSR Chicken 5,711 1,871 3.1
9 Pizza Hut QSR Pizza 5,500 7,863 0.7
10 Applebee's Casual Dining Casual Dining 4,577 1,870 2.5
11 Panera Bread QSR Bakery-Cafe 4,260 1,759 2.5
12 KFC QSR Chicken 4,200 4,370 0.9
13 Domino's QSR Pizza 4,116 5,067 0.8
14 Chipotle Mexican Grill QSR LSR/Mexican 4,061 1,755 2.4
15 Sonic America'sDrive-In QSR LSR/Burger 4,033 3,518 1.1
16 Olive Garden Casual Dining Casual Dining 3,763 840 4.5
17 Chili's Grill & Bar Casual Dining Casual Dining 3,634 1,263 2.9

133
Rank Chain Segment Sub-Segment Sales # Units AUV (USD Mn)
18 Little Caesars Pizza QSR Pizza 3,405 4,087 0.9
19 Buffalo Wild Wings Casual Dining Casual Dining 3,238 1,052 3.2
20 Dairy Queen QSR LSR/Burger 3,192 4,446 0.7
21 Jack in the Box QSR LSR/Burger 3,180 2,249 1.4
22 Arby's QSR LSR/Sandwich 3,177 3,226 1.0
23 IHOP Casual Dining Family Dining 2,933 1,579 1.9
24 Papa John's Pizza QSR Pizza 2,685 3,250 0.8
25 Denny's Casual Dining Family Dining 2,539 1,596 1.6
26 Outback Steakhouse Casual Dining Casual Dining 2,487 752 3.3
27 Popeye’s Louisiana Kitchen QSR Chicken 2,419 1,870 1.3
28 Red Lobster Casual Dining Casual Dining 2,373 678 3.5
29 Panda Express QSR LSR/Chinese 2,246 1,708 1.4
30 Cracker Barrel Old Country Casual Dining Family Dining 2,137 633 3.4
31 7-Eleven C-Store C-Store 2,117 7,309 0.3
32 Hardee's QSR LSR/Burger 2,050 1,771 1.2
33 Texas Roadhouse Casual Dining Casual Dining 1,877 438 4.4
34 Whataburger QSR LSR/Burger 1,801 774 2.4
35 The Cheesecake Factory Casual Dining Casual Dining 1,782 176 10.4
36 TGI Fridays Casual Dining Casual Dining 1,775 507 3.4

134
Rank Chain Segment Sub-Segment Sales # Units AUV (USD Mn)
37 Jimmy John's QSR LSR/Sandwich 1,757 2,109 0.9
38 Golden Corral Casual Dining Family Dining/Buf-fet 1,735 500 3.5
39 LongHorn Steakhouse Casual Dining Casual Dining 1,548 479 3.3
40 Carl's Jr. QSR LSR/Burger 1,520 1,142 1.3
41 Red Robin Casual Dining Casual Dining 1,438 496 3.0
42 Zaxby's QSR Chicken 1,258 658 2.0
43 Wawa QSR C-Store 1,223 678 1.9
44 Five Guys Burgers and Fries QSR LSR/Burger 1,208 1,163 1.1
45 Ruby Tuesday Casual Dining Casual Dining 1,182 694 1.7
46 Waffle House Casual Dining Family Dining 1,119 1,840 0.6
47 Culver's QSR LSR/Burger 1,036 528 2.0
48 Bojangles' QSR Chicken 1,033 622 1.7
Note:System wide sales include sales of owned as well as franchised stores.Source: www.nrn.com

135
Annexure 2 - Top brands based on Average Unit Value of over USD 5 Mn in the US
Rank Chain Segment AUV(USD Mn)
Sales(USD Mn) # Units
1 Del Frisco's Double Eagle Steak House Casual Dining 14.4 151 11
2 Mastro's Steakhouse Casual Dining 13.7 151 12
3 The Cheesecake Factory Casual Dining 10.4 1,782 176
4 Houston's Casual Dining 9.4 178 19
5 Rainforest café Casual Dining 9.0 206 23
6 Yard House Casual Dining 8.6 478 59
7 Maggiano's Little Italy Casual Dining 8.6 408 49
8 Fogo de Chao Casual Dining 8.5 199 25
9 Portillo's QSR 8.4 318 38
10 The Capital Grille Casual Dining 7.4 405 55
11 Legal Sea Foods Casual Dining 7.2 234 34
12 Bubba Gump Shrimp Co. Casual Dining 6.9 201 29
13 Seasons 52 Casual Dining 5.9 240 43
14 Bahama Breeze Casual Dining 5.7 211 37
15 BJ's Restaurant & Brewhouse Casual Dining 5.6 846 156
16 J. Alexander's Casual Dining 5.5 168 31
17 Dave & Buster's Casual Dining 5.2 354 72
Source: www.nrn.com

136
Annexure 3 - Six innovative fast-casual brands that are trying to stand out from the crowd
Streamlining supply chain (Dig Inn) Using locally produced food has so far proved relatively elusive, which has prevented limited-service chains from joining the movement in big way. Farm-to-counter brand Dig Inn is tackling its supply chain with a fresh perspective, taking a more hands-on approach with its sourcing practices in order to make fresh, local foods more accessible.
Instead of connecting with farmers and vendors through third parties, Dig Inn goes directly to the sources, working with suppliers to get exactly what it needs. The company has a distribution centre that serves as a supply hub for its 11 restaurants. Fresh vegetables are cost prohibitive to many consumers and having more control of the supply chain allows Dig Inn to not only support local farmers’ businesses but also to make its vegetable-heavy menu more accessible to customers. The brand has plans to open at 500 locations.
&pizza (Giving restaurants some character) Each of the 13 locations of &pizza features its own design, every one incorporating culture and characteristics of it surrounding neighbourhood and communities. The reason for that that the company wanted each store to feel not like a mass-produced product maker but rather like the local pizza shop.
To get a sense of each neighbourhood’s personality, the company officials canvas the area, interviewing locals and snapping photos to get a sense of what defines each neighbourhood. The team then looks for ways to incorporate the existing bones of real estate and trying to preserve as much of the location’s inherent personalities as possible, especially within the more urban restaurants.
Wayne Humphrey (Put on a smile) Wayne Humphrey, a 13-unit burger chain, is trying to create customer loyalty through it hospitality, which is developed through what the company calls Local Relationship Marketing (LRM). Through its LRM programme, the company trains each store manager to creatively engage with his or her local community, a training process that includes professional development and a library of engagement tactics that can be used to boost brand exposure. LRM manifests itself through charitable giving and employee hospitality that is friendly, inviting and personable. As a bonus, the increased investment in employees not only supports customer loyalty, but also encourages employees to stick around.
Cava Mezze Grill (Run some numbers) Cava Mezze Grill has hired a chief data scientist to tackle the potential that big data provides–help it create the infrastructure for data so that it can better prepare for future growth. The company plans to use data both for consumer-facing purposes–nutritional information for example and for operational efficiency.
When Cava Mezze Grill recently opened a location near an existing unit, the data was able to help the company drill down exactly how the proximity might affect traffic patterns in each store.

137
Dog Haus (Don’t take yourself too seriously) Dog Haus partnered Buzzfeed to produce a video showcasing creative sausage recipes. The video starring the company’s culinary director and head sausage maker has racked up 2 million YouTube views since its March premier. The video was a part of a broader strategy from the ‘craft casual’ chain, one in which Dog Haus forgoes traditional radio and TV spots in favour of social media marketing and online videos that communicate the brand’s fun, irreverent personality.
The company hired a team of young people to direct Dog Haus’ social media efforts, which include engaging with nearly every person who mentions the brands and developing creative content. The company feels that team should be of similar age group as that of the customers that come in there.
Roam Artisan Burgers (Share up the drink menu) Roam Artisan Burgers was opened with an intent to create an upscale fast-casual burger joint that used high quality, high integrity ingredients. That objective was extended to the beverage menu as well. Today, the company boosts of a diverse drink menu that goes beyond most limited service restaurants. It includes wine and kombucha (fermented tea) on tap, bottled local beers, house-made artisan sodas and a line of milkshakes produced in-house and made with local ice cream and milk.
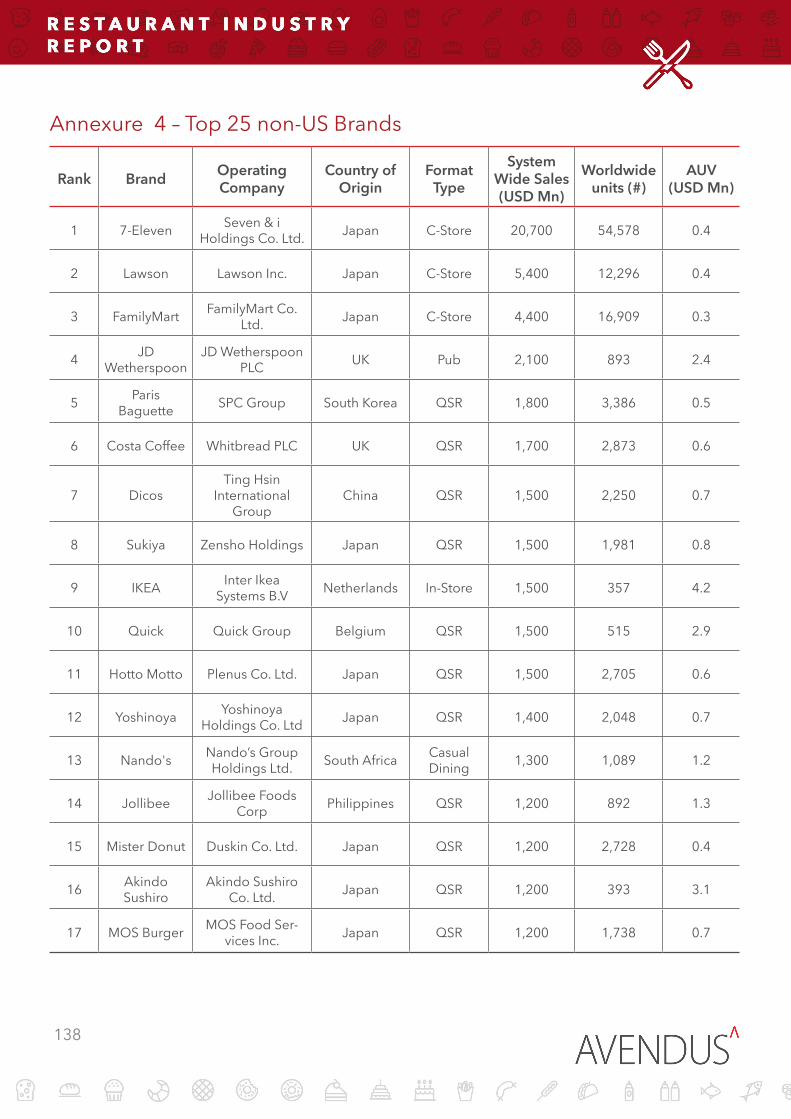
138
Annexure 4 – Top 25 non-US Brands
Rank Brand Operating Company
Country of Origin
Format Type
System Wide Sales(USD Mn)
Worldwide units (#)
AUV(USD Mn)
1 7-Eleven Seven & i Holdings Co. Ltd. Japan C-Store 20,700 54,578 0.4
2 Lawson Lawson Inc. Japan C-Store 5,400 12,296 0.4
3 FamilyMart FamilyMart Co. Ltd. Japan C-Store 4,400 16,909 0.3
4 JD Wetherspoon
JD Wetherspoon PLC UK Pub 2,100 893 2.4
5 Paris Baguette SPC Group South Korea QSR 1,800 3,386 0.5
6 Costa Coffee Whitbread PLC UK QSR 1,700 2,873 0.6
7 DicosTing Hsin
International Group
China QSR 1,500 2,250 0.7
8 Sukiya Zensho Holdings Japan QSR 1,500 1,981 0.8
9 IKEA Inter Ikea Systems B.V Netherlands In-Store 1,500 357 4.2
10 Quick Quick Group Belgium QSR 1,500 515 2.9
11 Hotto Motto Plenus Co. Ltd. Japan QSR 1,500 2,705 0.6
12 Yoshinoya Yoshinoya Holdings Co. Ltd Japan QSR 1,400 2,048 0.7
13 Nando's Nando’s Group Holdings Ltd. South Africa Casual
Dining 1,300 1,089 1.2
14 Jollibee Jollibee Foods Corp Philippines QSR 1,200 892 1.3
15 Mister Donut Duskin Co. Ltd. Japan QSR 1,200 2,728 0.4
16 Akindo Sushiro
Akindo Sushiro Co. Ltd. Japan QSR 1,200 393 3.1
17 MOS Burger MOS Food Ser-vices Inc. Japan QSR 1,200 1,738 0.7

139
Rank Brand Operating Company
Country of Origin
Format Type
System Wide Sales(USD Mn)
Worldwide units (#)
AUV(USD Mn)
18 Lotteria Lotte Group Japan QSR 1,200 1,784 0.7
19 Saizeriya Saizeriya Co. Ltd. Japan Casual Dining 1,200 1,221 1.0
20 Greggs Greggs PLC UK QSR 1,200 1,650 0.7
21 Gusto Skylark Group Japan Casual Dining 1,100 1,369 0.8
22 Enterprise Inns
Enterprise Inns PLC UK Pub 1,000 5,300 0.2
23 Tank & RastAutobahn Tank & Rast GmbH &
Co KGGermany C-Store 1,000 432 2.3
24 Marston's Marston’s PLC UK Pub 1,000 2,210 0.5
25 Gyoza no Ohsho
Ohsho Food Service Corp Japan Casual
Dining 902 695 1.3
Note:System wide sales include sales of owned as well as franchised stores.Source: www.nrn.com

Annexure 5 - Valuation of global restaurant companies with market capitalisation of more than USD 1 Bn
Rank Company Brands Country Mkt Cap Sales EBITDA Net Income
TTM EV / EBITDA TTM PE Return on
Cap
1 McDonald's McDonald's US 113,466 25,413 8,590 4,529 14.9x 23.6x 18
2 Starbucks Starbucks US 82,401 19,733 4,708 2,462 17.2x 32.4x 36
3 Yum Brands Pizza Hut, KFC, Taco Bell US 32,938 13,105 2,668 1,293 13.3x 24.9x 22
4 Restaurant Brands Burger King, Tim Horton Canada 19,712 4,032 1,628 356 18.9x 45.7x NA
5 Chipotle Mexican Grill Chipotle Mexican Grill US 12,703 4,501 894 476 18.4x 38.9x 23
6 Darden RestaurantsOlive Garden, Longhorn
Steakhouse, Yard House & others
US 7,980 6,905 854 369 10.1x 23.4x 19
7 Domino's US Domino's US 6,015 2,118 408 178 18.3x 31.3x 79
8 Jollibee Foods Jollibee Philippines 5,154 2,215 213 106 25.7x 48.8x 18
9 Panera Bread Panera Bread US 5,100 2,682 377 149 13.7x 33.4x 23
10 Dunkin' Brands Dunkin's Donuts, Baskin Robbins US 4,195 811 365 105 17.5x 35.9x 7
11 Domino's Australia Domino's (Franchisee) Australia 4,163 588 106 54 37.1x 70.7x 17
140

Rank Company Brands Country Mkt Cap Sales EBITDA Net Income
TTM EV / EBITDA TTM PE Return on
Cap
12 Greene KingBelhaven Pubs, Eating Inn, Flame Grill, Farmhouse Inn
& othersUK 3,714 2,494 528 146 10.9x 25.4x 6
13 Cracker Barrel Cracker Barrel US 3,550 2,861 339 171 10.9x 20.7x 19
14 McDonald's Japan McDonald's (Franchisee) Japan 3,346 1,566 (146) (287) NM NM -24
15 Alsea SAB
Franchisee of Domino's Starbucks, Burger King, Chili's & other American
brands)
Mexico 3,175 2,039 272 62 14.2x 73.4x 7
16 Texas Roadhouse Texas Roadhouse US 3,067 1,757 204 93 13.7x 30.6x NA
17 Wendy's Wendy's US 2,983 1,885 441 161 11.5x 18.5x 5
18 Brinker International Chili's, Maggiano's Little Italy US 2,577 3,100 475 204 7.6x 13.2x 24
19 Cheesecake Factory Cheesecake Factory US 2,516 2,073 246 114 9.6x 20.6x 18
20 Buffalo Wild Wings Buffalo Wild Wings US 2,485 1,813 266 95 9.1x 25.2x NA
21 Skylark Gusto, Bamiyan, Jonathan's & others Japan 2,481 2,902 342 125 10.5x 19.9x 7
22 Jack in the Box Jack in the Box US 2,406 1,540 287 109 10.8x 22.7x 16
141

Rank Company Brands Country Mkt Cap Sales EBITDA Net Income
TTM EV / EBITDA TTM PE Return on
Cap
23 Domino's UK Domino's (Franchisee) UK 2,301 481 105 76 18.8x 30.3x 43
24 Papa John's Papa John's US 2,236 1,646 171 72 13.6x 28.1x 24
25 Bloomin' BrandsOutback Steakhouse,
Carrabba's Bonefish Grill, Fleming's
US 2,214 4,437 428 132 8.3x 21.9x NA
26 Zensho Holdings Sukiya, Nakau, Hamazushi and others Japan 1,941 4,339 248 (43) 12.2x NM -4
27 Café De Coral Hold-ings
Café De Coral, Oliver's Su-per Sandwiches, The Spa-ghetti House and others
China 1,730 952 116 71 13.2x 24.3x 16
28 Sonic Corp Sonic Drive-In US 1,672 612 165 67 12.4x 23.9x 16
29 Mitchells & ButlersSizzling Pubs, Vintage Inns,
Ember Inns, Harvester & others
UK 1,630 3,248 589 159 7.6x 10.2x 6
30 DineEquity Applebee's, IHOP US 1,532 674 252 57 10.8x 15.0x 6
31 MK Restaurants Group
MK Suki, MK Gold, Yayoi, Na Siam Ta and others Thailand 1,345 440 89 60 13.4x 24.8x 16
32 Colowide Tetuskuri Izakaya, Amataro, Suteiki Miya and others Japan 1,298 2,001 143 15 12.1x 471.7x 3
142
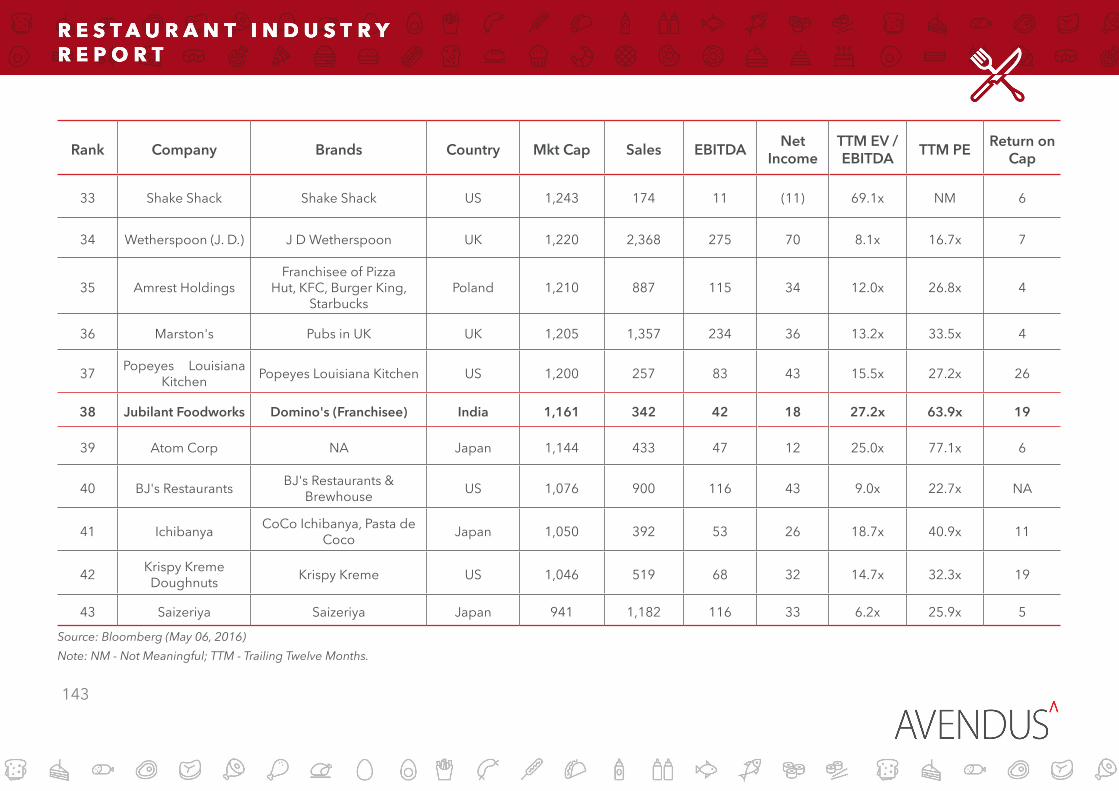
Rank Company Brands Country Mkt Cap Sales EBITDA Net Income
TTM EV / EBITDA TTM PE Return on
Cap
33 Shake Shack Shake Shack US 1,243 174 11 (11) 69.1x NM 6
34 Wetherspoon (J. D.) J D Wetherspoon UK 1,220 2,368 275 70 8.1x 16.7x 7
35 Amrest HoldingsFranchisee of Pizza
Hut, KFC, Burger King, Starbucks
Poland 1,210 887 115 34 12.0x 26.8x 4
36 Marston's Pubs in UK UK 1,205 1,357 234 36 13.2x 33.5x 4
37 Popeyes Louisiana Kitchen Popeyes Louisiana Kitchen US 1,200 257 83 43 15.5x 27.2x 26
38 Jubilant Foodworks Domino's (Franchisee) India 1,161 342 42 18 27.2x 63.9x 19
39 Atom Corp NA Japan 1,144 433 47 12 25.0x 77.1x 6
40 BJ's Restaurants BJ's Restaurants & Brewhouse US 1,076 900 116 43 9.0x 22.7x NA
41 Ichibanya CoCo Ichibanya, Pasta de Coco Japan 1,050 392 53 26 18.7x 40.9x 11
42 Krispy Kreme Doughnuts Krispy Kreme US 1,046 519 68 32 14.7x 32.3x 19
43 Saizeriya Saizeriya Japan 941 1,182 116 33 6.2x 25.9x 5
Source: Bloomberg (May 06, 2016)Note: NM - Not Meaningful; TTM - Trailing Twelve Months.
143

Valuation of global food and beverage companies other than restaurant companies with market capitalisation of more than USD 1 Bn
Company Country Type Mkt Cap Sales EBITDA Net Income
TTM EV / EBITDA TTM PE Return on
Cap
Compass Group UK Contract Food Services 29,319 27,177 2,454 1,343 13.6x 21.8x 20
Sodexo France Contract Food Services 15,875 23,043 1,608 789 10.6x 20.1x 12
Whitbread Plc UK Hotel & Restaurant 10,009 4,420 1,091 592 10.4x 16.9x 14
Aramark US Contract Food Services 8,135 14,329 1,146 244 11.6x 33.4x 6
Lawson Japan Convinience Store 7,932 1,887 1,010 260 8.8x 30.5x 8
FamilyMart Japan Convinience Store 5,278 1,135 691 175 7.3x 30.2x 6
Kuwait Food Kuwait Restaurant & packaged food 3,206 3,217 396 146 7.0x 22.0x 12
Autogrill SPA Italy Travel Food 2,169 5,371 428 71 6.8x 30.5x 7
SSP Group UK Travel Food 1,973 2,832 263 83 9.3x 23.9x 10
Dave & Buster's Entertainment US Entertainment Center 1,657 867 189 60 10.4x 27.8x 10
Greggs UK Bakery 1,600 1,277 173 88 8.9x 18.2x 22
DO & CO AG Austria Contract Food Services 1,086 1,009 97 33 12.4x 32.4x 14
Source: Bloomberg (May 06, 2016)Note: TTM - Trailing Twelve Months.
144

145
Annexure 6 – Deals in Smaller Concepts
Year Chain Early-stage investor Units
2016 CCW LLC (Hut Mongolian Grill franchisee) Sun Capital 21
2016 Sincerely Yogurt Ablak Holdings 20
2015 Barcelona Wine Bar and Bartaco General Atlantic LLC 11
2015 Tender Greens Alliance Consumer Growth 18
2015 Taylor Gourmet KarpReilly 9
2015 Tava Indian Kitchen CircleUp Growth/Kensington Capital 3
2015 NafNaf Grill Roark Capital 13
2015 Honeygrow Miller Investment Management 5
2015 Fitlife Foods KarpReilly 14
2015 Eureka! Restaurant Group KarpReilly 14
2015 Cava Mezze Grill Swan & Legend Partners/Invus/Rev Growth 11
2015 Asian Box Horowitz Group 5
2015 &Pizza Private investors 9
2014 Rusty Taco Buffalo Wild Wings 9
2014 Punch Bowl Social Coulton Creek Capital 4
2014 Patxi's Pizza KarpReilly 12
2014 MOD Pizza Private investors/PWP Growth Equity 14
2014 Hopdoddy Catterton Partners 7
2013 Your Pie Georgia Oak Partners 18

146
Year Chain Early-stage investor Units
2013 Umami Burger Fortress Investment Group 15
2013 Sweetgreen Revolution Growth 22
2013 Sprinkles Cupcakes KarpReilly 11
2013 Project Pie Lee Equity Partners 6
2013 Primanti Bros. Catterton Partners 20
2013 PizzaRev Buffalo Wild Wings 3
2013 Piada Catterton Partners 14
2013 Philz Coffee Summit Partners 13
2013 Native Foods Café Laurel Crown Partners/Huntington Cap 16
2013 Lion's Choice Millstone Capital Advisors 23
2013 Lazy Dog Brentwood Associates 12
2013 Chop't Morehead Capital 20
2013 Bruxie Catterton Partners 6
2013 Bad Daddy's Good Times Burgers 5
2012 Not Your Average Joe's BRS 17
2012 Mendocino Farms Catterton Partners 5
2012 Garbanzo Fresh Mediterranean Gemini Investors 14
2012 Blue Bottle Coffee True Ventures, Index Ventures 11
2012 Barteca Holdings Rosser Capital Partners 7
Source: www.nrn.com

147
Annexure 7 – Ranking of companies by revenue from food and bever-age services in US (above USD 1 Bn)
Rank Company Brand Revenue(USD Bn)
1 Compass Group PLC Contract food service 10.8
2 Starbucks Corp. Starbucks 9.0
3 Aramark Contract food service 7.7
4 Darden Restaurants Inc. Olive Garden, Longhorn Steakhouse, Yard House & others 7.1
5 Sodexo Contract food service 7.0
6 McDonald's Corp. McDonald's 5.6
7 Chipotle Mexican Grill Inc. Chipotle Mexican Grill 4.1
8 Bain Capital LLCBloomin' Brands Inc. (Outback Steakhouse,
Carrabba's Italian Grill, Fleming's Prime Steakhouse & Wine Bar, Bonefish Grill)
3.9
9 Roark Capital Group
Arby's, Carl's Jr., Corner Bakery Cafe, Hardee's, McAlister's Deli, Moe's Southwest
Grill, Schlotzsky's, Wingstop, Miller's Ale House, Auntie Anne's, Cinnabon, Il Fornaio,
Carvel Ice Cream, Seattle's Best Coffee
3.3
10 Yum! Brands Inc. Pizza Hut, KFC, Taco Bell 3.0
11 Brinker International Inc. Chili's, Maggiano's Little Italy 2.9
12 Golden Gate Capital California Pizza Kitchen, CPK ASAP, Red Lobster 2.9
13 Panera Bread Co. Panera Bread 2.3
14 Olympus PartnersCenterplate Inc., NPC International (Pizza
Hut, Wendy's), Pepper Dining (Chili's Grill & Bar)
2.2
15 Panda Restaurant Group Inc. Panda Express, Panda Inn, Hibachi-San 2.2
16 Cracker Barrel Old Country Store Inc. Cracker Barrel Old Country Store 2.1
17 Fertitta Entertainment Inc. Dining, hospitality and entertainment 2.1

148
Rank Company Brand Revenue(USD Bn)
18 Autogrill SpA Travel food 2.0
19 The Cheesecake Factory Inc. The Cheesecake Factory 1.9
20 Walt Disney Co. Amusement park 1.8
21 Sun Capital Partners Inc.
Boston Market, Friendly's Ice Cream, Sou-plantation, Sweet Tomatoes, Fazoli's, Johnny
Rockets, Restaurants Unlimited, Smokey Bones, Bar Louie
1.8
22 Centerbridge Partners L.P.
P.F. Chang's China Bistro Inc. (P.F. Chang's China Bistro, Pei Wei Asian Diner, True Food Kitchen), Craftworks Restaurants & Brewer-
ies Inc. (Gordon Biersch Brewery Restaurant, Big River Grille, A1A Aleworks, Bluewater
Grille, Seven Bridges)
1.7
23 The Wendy's Co. Wendy's 1.7
24 Whataburger Inc. Whataburger 1.6
25 Texas Roadhouse Inc. Texas Roadhouse 1.6
26 Buffalo Wild Wings Inc. Buffalo Wild Wings 1.5
27 Host Hotels & Resorts Inc. Lodging and boarding 1.5
28 Fidelity National Financial Inc.
American Blue Ribbon Holdings LLC (O'Charley's, Ninety Nine Restaurants, Max
& Erma's, Village Inn, Bakers Square), Stoney River Legendary Steaks, J. Alexander's
1.4
29 Delaware North Contract food service 1.3
30 Jack in the Box Inc. Jack in the Box 1.3
31 Argonne Capital Group LLC
On the Border Mexican Grill, Krystal, ACG Texas, Sunshine Restaurant Partners, Peak Restaurant Group (IHOP), Neighborhood
Restaurant Partners (Applebee's), Stevi B's Pizza
1.3
32 Wawa Inc. Convenience store 1.2
33 Chick-fil-A Inc. Chick-fil-A 1.2

149
Rank Company Brand Revenue(USD Bn)
34 MGM Resorts International Hotel and resort 1.2
35 Ruby Tuesday Inc. Ruby Tuesday 1.1
36 Red Robin Gourmet Burgers Inc. Red Robin Gourmet Burgers 1.1
Note – The ranking is as per the revenue to the company which includes only the franchise fee and not the entire franchisee rev-enue. For example, McDonald’s brand system wise sales (combined sale of all the stores in US) were around USD 35 billion while McDonald’s Inc. company revenue was USD 5.6 billion due to over 85% franchised units.
Source: www.nrn.com (Latest Financial Year)

150
Annexure 8 – Key brands in the Indian restaurant space
Brand Operating companies Ownership Cuisine No of Outlets
No of Cities
QUICK SERVICE RESTAURANTS
Domino's Jubilant FoodWorks Franchise Pizza 1004 240
Subway Multiple Franchise Sandwich 549 NA
McDonald's Connaught Plaza & Hardcastle Franchise Burger 386 70
KFC Devyani International, Sapphire Foods, Yum Franchise Chicken 334 115
Pizza Hut Delivery Devyani International, Sapphire Foods, Yum Franchise Pizza 306 68
CAFE
CCD Coffee Day Enterprises Owned Snacks 1,556 74
Barista Barista Coffee Company Owned Snacks 200 30
Costa Coffee Devyani International Franchise Snacks 90 NA
Starbucks Tata Starbucks Franchise Snacks 77 6
Dunkin’ Donuts Jubilant FoodWorks Franchise Snacks 70 24
CASUAL DINING
Pizza Hut Devyani International, Yum, Sapphire Foods Franchise Pizza 88 34
Moti Mahal Moti Mahal Delux & its franchisees Owned Indian 86 42
SagarRatna SagarRatna Restaurants Owned Indian 81 NA
Barbeque Nation Barbeque Nation Owned Multi 63 28
Mainland China Speciality Restaurants Owned Chinese 53 20

151
Brand Operating companies Ownership Cuisine No of Outlets
No of Cities
PUB, BAR, CAFÉ LOUNGE (PBCL)
Beer Cafe BTB Marketing Owned Multi 29 8
TGIF Bistro Hospitality Owned American 15 7
Chili's Texmex Cuisine Franchise Mexican 15 7
Hoppipola Speciality Owned Multi 10 5
Social Impresario Hospitality Owned Multi 9 3
Irish House Global Kitchen Owned Mexican 8 3
Hard Rock Café JSM Franchise American 8 7
FROZEN DESSERTS
Baskin Robbins Graviss Food Franchise Frozen Des-sert 600 150
Naturals Ice Cream Kamaths Ourtimes Ice Cream Owned Frozen Des-sert 119 14
Gelato Pan India Owned Frozen Des-sert 60 10
Mad Over Donuts Pragati Ventures Owned Donuts 44 4
Baskin Robbins Graviss Food Franchise Frozen Des-sert 600 150
Source: Brand websites (May 2016)

Annexure 9 – Restaurant Companies in India
Company BrandsFY15 FY14 FY13
Sales EBITDA PAT Sales EBITDA PAT Sales EBITDA PAT
Jubilant Foodworks Domino's, Dunkin' Donuts 20,745 2,628 1,233 17,235 2,551 1,258 14,073 2,444 1,331
Coffee Day Enterprise1 Café Coffee Day 9,511 1,909 NA 8,472 1,831 NA 7,325 1,582 NA
Yum Restaurants2 Pizza Hut, KFC, Taco Bell 8,646 (1,122) NA 8,219 (732) (1,309) 6,331 (131) (474)
Devyani International
Pizza Hut, KFC, Costa Coffee, Vaango 7,940 321 (1,020) 6,978 423 (605) 5,965 246 (495)
Westlife Development McDonald's 7,643 354 (291) 7,403 538 488 6,843 653 213
Barbeque Nation Hospitality Barbeque Nation 3,041 496 137 2,680 461 242 1,842 272 103
Speciality Restaurants
Mainland China, Oh! Calcutta, Hoppipola and others 2,994 291 95 2,638 340 189 2,269 459 234
JSM Corp Hard Rock Café, California Pizza Kitchen, Shiro, Asilo 1,879 (90) (335) 1,701 46 (132) 1,085 165 65
Tata Starbucks Starbucks 1,712 (651) (470) 969 (622) (519) 146 (125) (142)
Pan India Food Solutions
Spaghetti Kitchen, Copper Chimney, Bombay Blues,
Noodle Bar, Gelato1,630 (186) (389) 1,681 (257) (348) 1,720 (231) (215)
152

Company BrandsFY15 FY14 FY13
Sales EBITDA PAT Sales EBITDA PAT Sales EBITDA PAT
Lite Bite Foods Punjab Grill, Asia Seven, Zambar 1444 34 (515) 853 (257) (289) 792 (238) (204)
Impresario Entertainment and
HospitalitySocial, Smoke House Deli 1,242 50 (64) 624 (97) (128) NA NA (123)
deGustibus Indigo, Indigo Deli 802 35 (61) 764 96 357 687 80 34
Bistro Hospitality TGIF 741 27 (4) 684 29 5 NA NA 13
Mirah Hospitality Rajdhani, Café Mangii, The United NA NA NA 841 (163) (175) 751 (174) (82)
Olive Bar & Kitchen Olive, Monkey Bar, Fatty Bao, SodaBottleOpenerWala NA NA NA 552 45 17 379 27 15
Azure Hospitality Mamagoto, Rollmaal, Speedychow 422 (60) (109) 425 (60) (109) 296 (2) (25)
Source: VcC Edge, MCA filingsNA - Not AvailableNote: (1) The financials represent the revenue from coffee business excluding the exports. (2) The financials for FY15 are based on financials provided Yum Brands Inc. in its US filings convert to INR.
153

Indian food & beverage service companies other than restaurants
Company TypeFY15 FY14 FY13
Sales EBITDA PAT Sales EBITDA PAT Sales EBITDA PAT
Haldiram Snacks Snacks & restaurants 17,658 2,867 1,281 16,813 1,877 951 12,292 1,371 678
Haldiram Foods International Snacks & restaurants 14,357 1,582 914 12,373 1,347 822 10,119 1,300 824
Bikanervala Foods Snacks & restaurants 4,926 468 205 4,177 314 157 3,503 299 150
Haldiram Bhujiawala Snacks & restaurants 2,685 219 103 2,117 164 82 1,554 112 49
Sodexo Technical Service Managed service 1,700 124 90 1,457 65 37 1,268 8 9
Compass India Support Service Managed service 2,058 (106) (33) 1,559 (75) (141) 1,264 (66) (47)
Skygourmet Catering Travel food 1,382 (206) (728) 1,171 (155) (297) 1,099 (859) (1,015)
Travel Food Services Travel food 1,048 255 141 1,255 202 100 966 102 39
Source: VCC Edge, MCA filings
154

155
Annexure 10 – Food tech brands in India
Company BrandBusiness
Description / Model
Present in Cities
Fund Raised
(USD Mn)Investor
INTERNET FIRST RESTAURANTS
Food Vista India Pvt. Ltd. Fresh Menu Central kitchen Bangalore,
Mumbai, NCR 22.00
Lightspeed Venture
Partners, Zodius Technology
Fund
Holachef Hospitality Pvt.
Ltd.HolaChef Central kitchen and
chefs Mumbai, Pune 3.39 Kalari Capital
YuMist Foodtech Pvt.
Ltd.Yumist Central kitchen NCR,
Bangalore 2.97Orios Venture,
Unilazer Venutres
Fingertip Foods Pvt. Ltd. Frsh Central kitchen NCR 1.52 India Quotient,
Kae Capital
Tapcibo Online Solutions Pvt.
Ltd.Dazo
Central kitchen and also aggregation
of small food entrepreneurs
Bangalore 0.23 Angel investments
Hello Curry Pvt Ltd Hello Curry Central kitchen Hyderabad,
Bangalore 2.00 Angel investments
Eatlo Tech Solutions Pvt.
Ltd.Eatlo Aggregation of
professional chefs Bangalore 1.09 Angel investments
Masalabox Food Network
Pvt. Ltd.MasalaBox Aggregation of
home chefs Kochi,
Bangalore - -
Ecstasy E-Ordering Pvt.
Ltd.Bite Club Aggregation of
professional chefs NCR NA Angel investments
AGGREGATORSPisces
eServices Pvt. Ltd.
FoodPanda
Restaurant aggregation,
delivery done by restaurants
100+ cities in India NA Rocket Internet
Bundl Technologies
Pvt. Ltd.Swiggy
Restaurant aggregation,
delivery done by Swiggy.
8 cities 52.59
DST Global, Harmony Part-
ners, Accel, SAIF Norwest Ven-ture Partners

156
Company BrandBusiness
Description / Model
Present in Cities
Fund Raised
(USD Mn)Investor
Tinyowl Technology Pvt.
Ltd.TinyOwl
2 models(a) Restaurant ag-
gregation(b) Aggregation of
home chefs
10 cities 20.00
Sequoia,Nexus ventures,Matrix
Sequoia Sequoia,Nexus
ventures
Carthero Technologies
Pvt. Ltd.Roadrunnr
B2B platform for restaurants to get food delivered to the customers in
their locality
10 cities 10.00Sequoia Capital, Nexus Venture
Partners
Meal / recipe boxArya Food and Packaging Pvt.
Ltd.iChef Veg recipes Mumbai NA Brand Capital
Cookfresh Food Works
Pvt. Ltd.CookFresh Veg and non-veg
recipes NCR - -
Inner Chef Pvt. Ltd. InnerChef
Veg and non-veg recipes as well as read to eat food
7 cities NA Angel invest-ments
Other food-tech companies
Zomato Media Pvt. Ltd. Zomato
Restaurant search. Have also started
delivery service for restaurants
10,000+ cities in 23 countries 221.00
InfoEdge, Vy Capital Sequoia
Capital, Te-masek
Navs Services Pvt. Ltd. DineOut Online Restaurant
Table Reservations 8 cities 10.00 Times Internet
Source: VCC Edge, MCA filingsNA - Not Available