Embed Size (px)
Citation preview

Disclaimer
This is a PDF version of the Unilever Annual Report and Accounts 2021 and is an exact copy of the printed document provided to Unilever’s shareholders.
The Annual Report and Accounts 2021 was filed with the National Storage Mechanism and the Dutch Authority for the Financial Markets in European Single Electronic Format, including a human readable XHMTL version of the Annual Report and Accounts 2021 (the ESEF Format). The Annual Report and Accounts 2021 in ESEF Format is also available on Unilever’s website at www.unilever.com. Only the Annual Report and Accounts 2021 in ESEF Format is the official version for purposes of the ESEF Regulation.
Certain sections of the Unilever Annual Report and Accounts 2021 have been audited. These are on pages 114 to 166, and those parts noted as audited within the Directors’ Remuneration Report on pages 84 to 104.
The maintenance and integrity of the Unilever website is the responsibility of the Directors; the work carried out by the auditors does not involve consideration of these matters. Accordingly, the auditors accept no responsibility for any changes that may have occurred to the financial statements since they were initially placed on the website.
Legislation in the United Kingdom and the Netherlands governing the preparation and dissemination of financial statements may differ from legislation in other jurisdictions. Except where you are a shareholder, this material is provided for information purposes only and is not, in particular, intended to confer any legal rights on you.
This Annual Report and Accounts does not constitute an invitation to invest in Unilever shares. Any decisions you make in reliance on this information are solely your responsibility.
The information is given as of the dates specified, is not updated, and any forward-looking statements are made subject to the reservations specified in the cautionary statement on the inside back cover of this PDF.
Unilever accepts no responsibility for any information on other websites that may be accessed from this site by hyperlinks.
Unilever Annual Report and Accounts 2021
Purpose-led, future-fit
Making sustainable living commonplace
We make household brands used by 3.4 billion consumers every day.
We are 148,000 people working in factories, labs, offices and homes around the world.
We are determined to prove that our purpose-led, future-fit business model delivers superior performance.
We are Unilever.

STRA
TEGIC
REP
OR
T – INTR
OD
UC
ING
UN
ILEVER
1Unilever Annual Report and Accounts 2021
In this report
Strategic ReportPages 2-13 Pages 14-66
Introducing Unilever Review of the year2 At a glance 15 Shareholders4 Chair's introduction 18 Our people6 Chief Executive Officer's review 20 Consumers8 Our strategy 25 Customers12 Our business model 27 Suppliers & business partners
29 Planet & society32 Our performance36 Financial review44 Our risks51 Additional non-financial information
- Climate change disclosures- Other non-financial disclosures
Governance Report Financial StatementsPages 67-104 Pages 105-198
Running a responsible and effective business
Our full financial results and notes for the year
68 Corporate governance 106 Statement of Directors' responsibilities78 Report of the Audit Committee 107 Independent Auditor's Report80 Report of the Corporate Responsibility Committee 114 Consolidated financial statements82 Report of the Nominating and Corporate
Governance Committee118 Notes to the consolidated financial statements167 Unilever PLC Company Accounts and notes
84 Directors' Remuneration Report 176 Group Companies187 Shareholder information188 Additional Information for US Listing Purposes
Online About this Annual Report
You can find more information about Unilever online atUnilever Annual Report and Accounts 2021
www.unilever.com This document is made up of the Strategic Report, the Governance Report, the Financial Statements and Notes, and Additional Information for US Listing Purposes.
The Unilever Group consists of Unilever PLC (PLC) together with the companies it controls. The terms 'Unilever', the 'Group', 'we', 'our' and 'us' refer to the Unilever Group.
Our Strategic Report on pages 2 to 66, contains information about us, how we create value and how we run our business. It includes our strategy, business model, market outlook and key performance indicators, as well as our approach to sustainability and risk. The Strategic Report is only part of the Annual Report and Accounts 2021. The Strategic Report has been approved by the Board and signed on its behalf by Ritva Sotamaa – Group Secretary.
Our Governance Report on pages 67 to 104 contains detailed corporate governance information, our Committee reports and how we remunerate our Directors.
Our Financial Statements and Notes are on pages 105 to 175.
Pages 1 to 187 constitute the Unilever Annual Report and Accounts 2021, which we may also refer to as ‘this Annual Report and Accounts' throughout this document.
The Directors' Report of PLC on pages 67 to 83, 106 (Statement of Directors' responsibilities), 136 (Dividends on ordinary capital), 149 to 155 (Treasury Risk Management), 175 (Post balance sheet events) and 186 (Branch disclosure) has been approved by the PLC Board and signed on its behalf by Ritva Sotamaa – Group Secretary.
Pages 188 to 198 are included as Additional Information for US Listing Purposes.
The Unilever Annual Report and Accounts 2021 (and the Additional Information for US Listing Purposes) along with other relevant documents can be downloaded at www.unilever.com/ara2021/downloads
For more on our sustainability commitmentswww.unilever.com/planet-and-society

2 Unilever Annual Report and Accounts 2021
A truly global businessOur brands are available in around 190 countries
3.4bn people use our products every day(a)
58% of turnover in emerging markets
Strong brands with purposeOur 400+ brands are on a mission to offer superior products while doing good for people and planet
13 brands with turnover of over €1bn in 2021
13 of the top 50 consumer goods brands(b)
Read more about our brands and consumers on pages 20 to 24
Powered by our peopleOur purposeful and inclusive culture attracts the best talent in our markets
52/48 gender balance management (female/male)(c)
148,000 employees
92% of our leaders in markets are local(d)
Read more about our people on pages 18 to 19
At a glance
Using our scale for goodOur leading sustainability agenda is delivering significant impact
64% reduction in Scope 1 and 2 GHG emissions since 2015
53% of our plastic packaging is reusable, recyclable or compostable
€445m spend with diverse businesses owned by under-represented groups
Read more about planet & society on pages 29 to 31
(a) Based on a Europanel 2021 project (in partnership with Kantar & GfK). Includes consumers who use at least one Unilever product every day.
(b) Based on market penetration and consumer interactions (Kantar Brand Footprint report 2021).(c) Based on a total management population of 16,787 Unilever employees.(d) Leaders defined as all managers up to senior management reporting to ULE.
STRA
TEGIC
REP
OR
T – INTR
OD
UC
ING
UN
ILEVER
3Unilever Annual Report and Accounts 2021
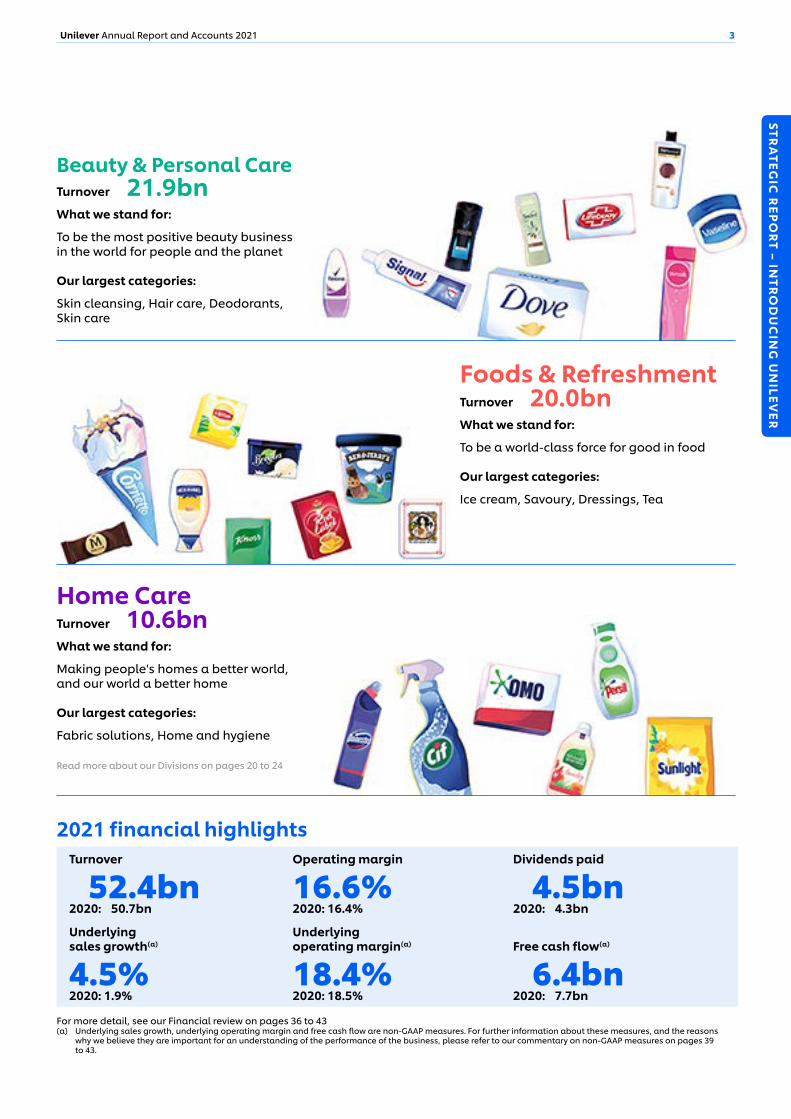
2021 financial highlightsTurnover Operating margin Dividends paid
€52.4bn2020: €50.7bn
16.6%2020: 16.4%
€4.5bn2020: €4.3bn
Underlying sales growth(a)
Underlying operating margin(a)
Free cash flow(a)
4.5%2020: 1.9%
18.4%2020: 18.5%
€6.4bn2020: €7.7bn
For more detail, see our Financial review on pages 36 to 43(a) Underlying sales growth, underlying operating margin and free cash flow are non-GAAP measures. For further information about these measures, and the reasons
why we believe they are important for an understanding of the performance of the business, please refer to our commentary on non-GAAP measures on pages 39 to 43.
Beauty & Personal CareTurnover €21.9bnWhat we stand for:
To be the most positive beauty business in the world for people and the planet
Our largest categories:
Skin cleansing, Hair care, Deodorants, Skin care
Foods & RefreshmentTurnover €20.0bnWhat we stand for:
To be a world-class force for good in food
Our largest categories:
Ice cream, Savoury, Dressings, Tea
Home CareTurnover €10.6bnWhat we stand for:
Making people's homes a better world, and our world a better home
Our largest categories:
Fabric solutions, Home and hygiene
Read more about our Divisions on pages 20 to 24
4 Unilever Annual Report and Accounts 2021
Chair's introduction
PerformanceUnilever’s operating performance improved in 2021, with the company recording its fastest year-on-year underlying sales growth for nine years, at 4.5%. Underlying operating profit also increased, by 2.9%. This represented a good outcome in what were unusually difficult trading conditions. Spiralling cost inflation presented the biggest challenge and impacted underlying operating margin, which was down 10bps, although the company’s determined response in landing customer price increases certainly helped to limit the impact. This ability to raise prices in a tough, inflationary environment is testament to the strength and quality of Unilever’s brands.
Unilever’s business is benefiting from the focus and investment being put behind its five Compass strategic choices – see pages 8 to 9. The Board was particularly encouraged to see Unilever’s top 13 brands – each with a turnover in excess of €1 billion – grow in aggregate last year by 6.4%, well above the company average. These brands account for 50% of Unilever’s total turnover. The focus behind key long-term growth markets is also driving improved results, with strong performances last year in the US, India and China. Together, these markets now represent 36% of Unilever’s turnover.
The good operating performance in 2021 was the main driver of earnings growth, with earnings per share (EPS) up by 5.5%.
Following the completion of the programme to buy back shares with an aggregate market value equivalent to €3 billion, the company announced a further €3 billion programme of share buybacks, which we expect to see completed over 2022 and 2023.
PortfolioThe Board is convinced that the continued evolution of Unilever’s portfolio into higher growth spaces is key to accelerating the company’s long-term growth profile and in delivering enhanced value to shareholders. To that end, unifying the Group’s legal structure in 2020 was an important milestone in allowing the Board to consider a wider range of strategic options, including scope for larger and more transformative acquisitions.
It was in this context that the Board viewed a possible acquisition of GSK Consumer Health as one route to accelerate Unilever’s presence in a very attractive part of the market. However, while there was some recognition among shareholders of the strategic merits of pursuing such a move, many voiced their strong opposition to the size and timing of such a deal. Consequently, and having listened closely to shareholder concerns, the Board and management of the company have made clear that we do not intend to pursue similar large-scale acquisitions in the foreseeable future.
Instead, the focus will be on improving Unilever’s value creation through accelerated organic growth – driven by the five Compass strategic choices. We will also continue to strengthen the portfolio through the kind of bolt-on acquisitions that have enabled Unilever to build fast-growing businesses in Prestige beauty and Functional nutrition. As part of strengthening the portfolio, last year we announced the sale
of Unilever’s Tea business, for €4.5 billion, which is expected to complete in the second half of 2022. Selective disposals of brands and assets will continue to play a role going forwards.
The Board also expects the new organisation to support growth over the coming years. Having reviewed the changes, the Board is confident they will help make Unilever a simpler, faster and more accountable business, and at lower cost.
Board composition and successionDuring the year, the Board appointed Adrian Hennah and Ruby Lu as independent Non-Executive Directors, both appointments took effect from 1 November 2021. Adrian joined the Board after a long and successful executive career, most recently in the consumer goods sector. Adrian’s extensive financial experience, gained from CFO positions with leading UK-based businesses, together with his deep industry knowledge, is a major asset to the Board. The Board will also benefit enormously from Ruby Lu’s appointment. Ruby is a venture capitalist with a long and successful track record of investing in start-up businesses in China and the US, markets she knows very well.
Following the 2021 AGM, Youngme Moon stood down from her role as Senior Independent Director (SID). I want to thank Youngme for the valuable contribution she made in that role. Equally, I am delighted that Andrea Jung was appointed to succeed Youngme as SID. Andrea also took over as Chair of the Compensation Committee, in February 2021, when Vittorio Colao stepped down from the Board to join the Italian government as Minister for Technological Innovation and Digital Transition.
STRA
TEGIC
REP
OR
T – INTR
OD
UC
ING
UN
ILEVER
5Unilever Annual Report and Accounts 2021
The 2022 AGM will mark the retirement of both Laura Cha and John Rishton as Non-Executive Directors having both served for nine years. On behalf of the Board, I would like to thank them for their much-valued contribution to Unilever.
Corporate GovernanceTackling climate change is a key priority for the Group and we were pleased to put our Climate Transition Action Plan (CTAP) to shareholders for an advisory vote at the 2021 AGM. The plan sets out our climate strategy, defines our net zero and emission reduction goals, and sets out the actions we intend to take to meet them. The plan also describes how the company is integrating climate change considerations into its products and brands, as well as the role that advocacy and partnership can play in meeting goals. This was the first time a global company of our size voluntarily put its climate transition plans before a shareholder vote, and we were delighted to see it receive overwhelming backing, with over 99% of shareholders voting in favour. Work remains to be done but we do believe that the CTAP can help Unilever make an important contribution to tackling climate change while growing our brands. Read more about our progress in the CTAP Progress Report on pages 51 to 56.
Regular Board evaluation is an important element in maintaining high standards of corporate governance and Board effectiveness. In 2021, the Board conducted a thorough internal evaluation exercise. The results, which were reviewed at the November 2021 Board meeting, confirmed that the Board continues to perform effectively and with a high degree of Director engagement.
In addition to our six planned Board meetings, three additional meetings were held in 2021 to consider the Group’s portfolio and the growth opportunities within it. Non-Executive Directors also attended 14 virtual employee engagement events during the year across a wide range of the workforce. In addition, Andrea Jung attended a global town hall webcast in July 2021, providing an opportunity for all employees to engage with one of our Board members.
The evaluation and Board engagements also re-affirmed the Board’s focus on growth and portfolio strategy evolution as keys to unlocking value in Unilever.
Further detail on the evaluation process this year, together with the Board’s remit, operations and the topics regularly discussed by the Board can be found in the Governance section on pages 67 to 83.
RemunerationDuring 2021, we continued to consult with shareholders on our Remuneration Policy and were pleased at the 2021 AGM to receive your strong support for the implementation of a reward framework based on a new Performance Share Plan, delinked from the annual bonus. The new Policy seeks to improve the overall effectiveness of Unilever’s incentives by helping drive sustainable long-term growth and enabling the Compensation Committee to set stretching but achievable performance targets over realistic timeframes. Further information on the Policy can be found on page 84.
Looking aheadTrading conditions will undoubtedly be challenging throughout 2022 as the world continues to come through the effects of the Covid pandemic and all the consequent economic aftershocks – and in particular, extraordinarily high levels of cost inflation. Unilever is well prepared to meet these challenges through a combination of customer prices and the delivery of cost savings, which will help to mitigate inflationary impacts on the business. Moreover, the company enters 2022 with good momentum, and with a clear set of strategic choices that the Board is confident will help deliver another positive year of top-line growth for Unilever.
Against a particularly challenging backdrop, Unilever delivered a good set of results for 2021. This could not have been achieved without the efforts of the 148,000 people who make up this great company, some of whom it was a privilege to spend time with over the last year, albeit in most cases virtually. Their hard work, ingenuity and integrity have once again shone through and on behalf of the Board, I want to thank them for everything they have done, and continue to do, for Unilever. I also want to thank and acknowledge our shareholders and other stakeholders for their continued support.
"Unilever’s business is undoubtedly benefiting from the focus and investment being put behind its five Compass strategic choices."Nils AndersenChair
Section 172 statement
Under Section 172 of the UK Companies Act 2006 (‘Section 172’) directors must act in the way that they consider, in good faith, would be most likely to promote the success of their company. In doing so, our Directors must have regard to stakeholders and the other matters set out in Section 172. Pages 63 and 69 to 71 comprise our Section 172 statement. Page 63 of our Strategic Report identifies our key stakeholders and provides examples of how the business engaged them during 2021, with cross references to the stakeholder review section for more detail. Pages 69 to 71 of our Governance Report details how our Directors have taken steps to understand the needs and priorities of these stakeholders when setting Unilever’s strategy and taking decisions concerning the business, including by direct engagement or via their delegated committees and forums. The relevance of each stakeholder group may vary depending on the matter at hand.
6 Unilever Annual Report and Accounts 2021
Chief Executive Officer's review
Context2021 was another turbulent year for the world economy and for global markets. Output rebounded strongly, if unevenly, after the sharp Covid-related declines of 2020. However, surging demand, triggered by significant fiscal and monetary stimulus, gave rise to widespread labour shortages, supply bottlenecks and soaring energy costs, stoking significant inflationary pressures.
For Unilever, this steep rise in input cost inflation was one of the defining features of the year, impacting each of our product categories.
Performance 2021Against this challenging backdrop, we delivered a strong set of results in 2021. Underlying sales growth of 4.5% represented Unilever’s fastest year-on-year growth in nine years, well into the upper end of our 3-5% multi-year framework. We responded to rising input costs with pricing actions, delivering underlying price growth of 2.9% for the year. While never easy, raising customer prices in response to inflationary pressures is vital and necessary if we are to preserve our ability to invest in Unilever’s brands. Underlying volume growth for the full year was 1.6%.
Growth was broad-based, with each of our three global Divisions – Beauty & Personal Care, Foods & Refreshment and Home Care – performing well. Growth was also competitive. We ended the year with 53% of the business winning market share by value, a second consecutive year of competitive growth and a marked improvement in our competitive performance from just a few years ago.
While top-line growth remains the number one priority, margin progression is also an important component of value creation. Underlying operating margin for the year was 18.4%, down 10bps on the previous year. Although pricing stepped up, it wasn’t enough to fully offset the impact of inflation across our raw materials, packaging and distribution costs.
Free Cash Flow remained strong at €6.4 billion, albeit down year-on-year versus a record delivery in 2020, when the business was focused on delivering cash in a period of huge uncertainty. For 2021, we declared a 3% increase to the full-year dividend, taking the dividend for the year to €4.5 billion.
Overall, we made good progress in 2021. Unilever’s growth momentum is building. We stepped up pricing significantly in a heavily inflationary environment while delivering strong earnings and maintaining our restored competitiveness.
Our five strategic choicesOne of the most encouraging aspects of our growth in 2021 was the extent to which it followed the five Compass strategic choices we called out a year ago. These choices sit at the heart of our strategy for value creation – see pages 8 to 9.
The first of these is winning with brands and innovation, ensuring that our top brands deliver superior performance. Today, we have 13 brands with sales in excess of €1 billion. Together they make up over half of our total turnover. Last year, they grew in aggregate by 6.4%. This included some particularly strong individual performances. Dove, for example, grew by 8%, its best performance in eight years; Hellmann’s grew 11%; and our Ice Cream brands Magnum and Ben & Jerry’s each grew 7%.
Behind the success of these brands is product superiority and great innovation and we continue to step up our performance in both areas. Product superiority in tests versus Unilever’s competition is now over 70% of tested turnover, up from less than 50% in 2019, and our focus on driving bigger, better and more impactful innovation delivered over €1 billion of incremental turnover in 2021, double the delivery in 2020.
It is no surprise or coincidence that our top-performing brands also happen to be those with the most clearly defined – and powerfully articulated – commitment to purpose as a driver of brand growth.
As well as focusing on winning with our biggest and strongest brands, we have also chosen to prioritise investment in the key growth markets for the future, including most notably the US, India and China.
All three countries delivered strong and competitive growth in 2021. The US, for example, grew almost 4% on top of a record growth year in 2020, while India and China grew well into double-digits, albeit against weaker comparators.
Other markets also performed well, but not all. Indonesia, for example, a key geography for Unilever, struggled last year and was down by 7.4%. We are fully focused on restoring growth in this, our sixth-largest market.
Our next strategic choice is to invest in the capabilities needed to lead in channels of the future. Today, that means winning in eCommerce, and in 2021 we delivered another strong year, on the back of record growth in 2020. In total, the eCommerce business was up 44% with growth coming from all the main sub-channels – pure-play, omnichannel, and business-to-business (eB2B). In just five years, this channel has gone from 2% of our turnover to 13% in 2021.
Developing Unilever’s portfolio into the higher growth spaces of Hygiene, Skin care, Prestige beauty, Functional nutrition and Plant-based foods is another strategic choice. It is also one that made a meaningful contribution to performance in 2021. While organic growth is our first priority, acquisitions also play an important role. Indeed, since 2017, 93% of M&A capital has gone into either Prestige beauty, Functional nutrition or Skin care and other areas of Beauty & Personal Care. By contrast, 98% of disposals by turnover were in slower growth food segments such as Spreads and more recently Tea.
The benefits of this portfolio rotation were very apparent last year – which including eketerra will be equivalent to 17% of our
"We made good progress in 2021 and our growth momentum is building."Alan Jope Chief Executive Officer
STRA
TEGIC
REP
OR
T – INTR
OD
UC
ING
UN
ILEVER
7Unilever Annual Report and Accounts 2021
of delivering an improvement in underlying operating margin, having chosen – in the face of spiralling inflation – to continue investing in advertising, R&D and other long-term drivers of growth.
We will continue to take this approach in 2022, when we expect input cost inflation to ratchet up still further. This means that we expect our underlying operating margin will be down in 2022, although we anticipate that the effect of pricing action and well-established savings programmes to help reverse this decline over the course of 2023 and 2024.
Importantly, we have entered 2022 with good growth momentum and with our biggest brands, our most important markets, and our priority channel all performing strongly. The five strategic choices that we have put in place will guide us in the years ahead, and are having a positive and demonstrable impact on performance. The introduction of a new operating model during the year will help accelerate our progress still further.
StakeholdersTogether with our world-leading brands, our biggest strength remains the dedication and professionalism of our employees around the world, plus the millions more who make up Unilever’s extended family across the value chain. To all of them, I offer my sincere appreciation for their hard work and commitment over a year characterised by many challenges but also a lot of progress.
We remain fully wedded to Unilever’s multi-stakeholder model and I want to thank all of those with whom we have partnered over the last year, and all those whose needs and interests we are committed to serving. We deliberately cite the planet as one of our stakeholders and in the year of COP26, it was a source of particular pride to see Unilever – in its words and actions – living up to its ambitious climate commitments.
Finally, I want to thank and acknowledge our shareholders for their continued support of our business. We are working hard to repay that support and are fully focused on delivering long-term value for shareholders in line with our 4G growth model.
2021 turnover since 2017. Prestige beauty, for example, now a €1 billion business, grew over 20%. Functional nutrition, which includes Horlicks in South Asia as well as our largely US-based Vitamins, Supplements & Minerals (VMS) business, grew 22% in 2021 and now enjoys leadership positions across its portfolio.
Together, Functional nutrition and Prestige beauty contributed 60bps to our underlying sales growth last year.
We will go on building Unilever’s portfolio in this way, while recognising that not all acquisitions have performed equally well. Dollar Shave Club, for example, has not delivered in the way that we had hoped or expected, mainly due to changes in the economics of the direct-to-consumer model.
In considering the evolution of our portfolio, Consumer Health and Wellbeing undoubtedly represents an attractive space. It is also one in which we are increasingly well positioned. Last year, after a long period of careful review, the Board concluded that moving Unilever’s portfolio even more decisively into this area would position the company for faster growth in the coming decades. This is what lay behind confidential discussions with GSK and Pfizer about the possible acquisition of GSK Consumer Health. We listened carefully to shareholders in the wake of those discussions becoming public and heard the message that many did not support a deal on this scale at this time. We remain resolved in the direction of our portfolio evolution, but we have made clear that we do not intend to pursue similar large-scale acquisitions in the foreseeable future.
Instead, we will continue to accelerate Unilever’s growth through a rigorous focus on organic growth and by continuing to strengthen the portfolio through bolt-on acquisitions and selective disposals. Guided by our five Compass strategic choices, we are fully committed to stepping up the growth of our existing business.
We will be aided significantly in this process by our fifth strategic choice – building a purpose-led, future-fit organisation and growth culture.
Having operated for some time under a relatively heavy matrix structure, with three global Divisions and 15 regional performance management units, we are now modernising Unilever’s organisation with the introduction – from 1 July 2022 – of five Business Groups with full, end-to-end responsibility for setting strategy and for delivering results.
The five Business Groups – Beauty and Wellbeing; Personal Care; Home Care; Nutrition; and Ice Cream – will have the power to drive performance by responding more quickly and directly to the consumer and channel dynamics that are unique to their Business Group. This is a big change for Unilever, one that we are confident will result in a simpler, faster and more agile way of operating, with more focused and expert categories and with greater empowerment and accountability flowing through the business.
We are alive to the risks of a change management programme on this scale and have put in place a number of mitigating measures, including the creation of a well-resourced Transformation Office to oversee the detailed delivery of the programme in line with ambitious but achievable timescales.
Outlook – 4G GrowthOur overarching goal remains the delivery of 4G growth – that is, growth which is consistent, competitive, profitable and responsible. All four are key to our long-term value creation model. On profitable growth, in 2021 we fell short
8 Unilever Annual Report and Accounts 2021
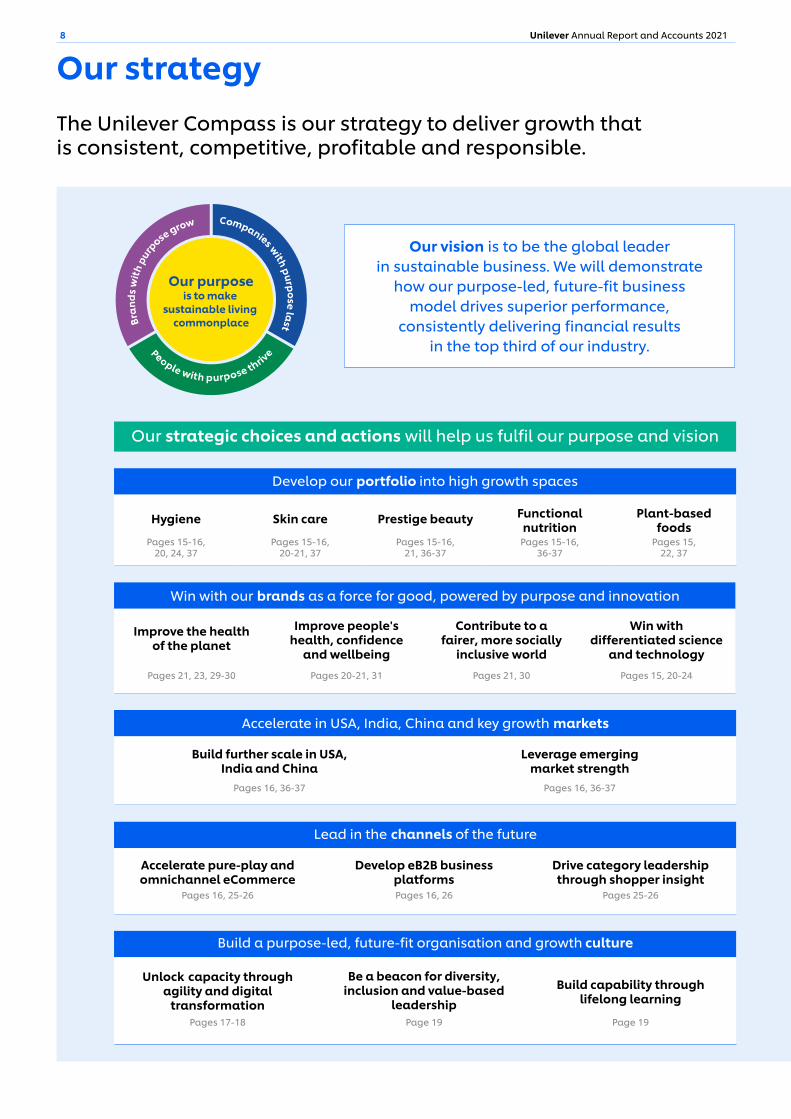
Our strategyThe Unilever Compass is our strategy to deliver growth that is consistent, competitive, profitable and responsible.
Our vision is to be the global leader in sustainable business. We will demonstrate
how our purpose-led, future-fit business model drives superior performance,
consistently delivering financial results in the top third of our industry.
Our strategic choices and actions will help us fulfil our purpose and vision
Develop our portfolio into high growth spaces
Hygiene
Pages 15-16, 20, 24, 37
Skin care
Pages 15-16, 20-21, 37
Prestige beauty
Pages 15-16, 21, 36-37
Functional nutrition
Pages 15-16, 36-37
Plant-based foods
Pages 15, 22, 37
Win with our brands as a force for good, powered by purpose and innovation
Improve the health of the planet
Pages 21, 23, 29-30
Improve people's health, confidence
and wellbeingPages 20-21, 31
Contribute to a fairer, more socially
inclusive worldPages 21, 30
Win with differentiated science
and technology Pages 15, 20-24
Accelerate in USA, India, China and key growth markets
Build further scale in USA, India and China
Pages 16, 36-37
Leverage emerging market strength
Pages 16, 36-37
Lead in the channels of the future
Accelerate pure-play and omnichannel eCommerce
Pages 16, 25-26
Develop eB2B business platformsPages 16, 26
Drive category leadership through shopper insight
Pages 25-26
Build a purpose-led, future-fit organisation and growth culture
Unlock capacity through agility and digital
transformationPages 17-18
Be a beacon for diversity, inclusion and value-based
leadershipPage 19
Build capability through lifelong learning
Page 19

STRA
TEGIC
REP
OR
T – INTR
OD
UC
ING
UN
ILEVER
9Unilever Annual Report and Accounts 2021
Operational excellence through the 5 Growth Fundamentals
1Purposeful
brands
2Improved
penetration
3Impactful
innovation
4Design for
channel
5Fuel for growth
Our growth creates value through a multi-stakeholder model
Our Multi-year Financial Framework
Shareholders See pages 15-17
Our peopleSee pages 18-19
ConsumersSee pages 20-24
Customers See pages 25-26
Suppliers & business partnersSee pages 27-28
Planet & societySee pages 29-31
Competitive growth
Cash generation
Profit growth
Savings Restructuring investment
Return on invested capital
Net debt
10 Unilever Annual Report and Accounts 2021
Our strategy continued
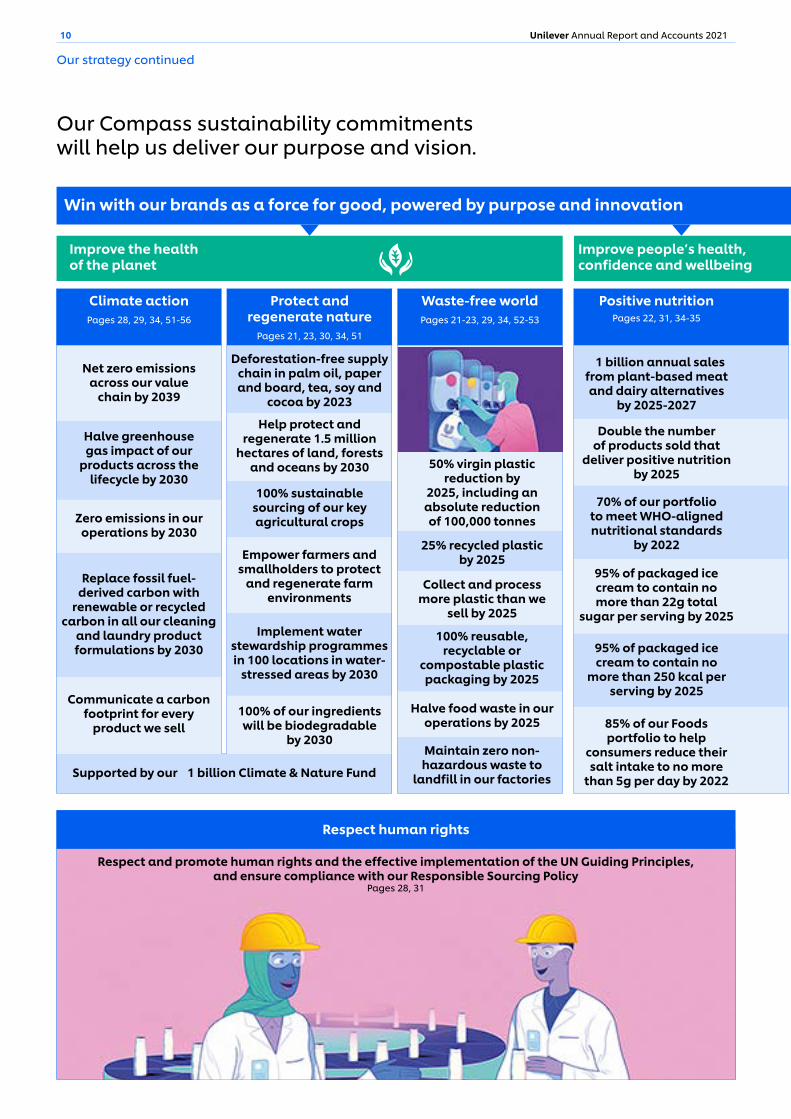
Our Compass sustainability commitments will help us deliver our purpose and vision.
Win with our brands as a force for good, powered by purpose and innovation
Improve the health of the planet
Improve people’s health, confidence and wellbeing
Respect human rights
Respect and promote human rights and the effective implementation of the UN Guiding Principles, and ensure compliance with our Responsible Sourcing Policy
Pages 28, 31
Climate actionPages 28, 29, 34, 51-56
Protect and regenerate nature
Pages 21, 23, 30, 34, 51
Waste-free worldPages 21-23, 29, 34, 52-53
Positive nutritionPages 22, 31, 34-35
Net zero emissions across our value
chain by 2039
Deforestation-free supply chain in palm oil, paper and board, tea, soy and
cocoa by 2023
Halve greenhouse gas impact of our
products across the lifecycle by 2030
Help protect and regenerate 1.5 million
hectares of land, forests and oceans by 2030
Zero emissions in our operations by 2030
100% sustainable sourcing of our key agricultural crops
Replace fossil fuel-derived carbon with
renewable or recycled carbon in all our cleaning
and laundry product formulations by 2030
Empower farmers and smallholders to protect
and regenerate farm environments
Communicate a carbon footprint for every
product we sell
Implement water stewardship programmes in 100 locations in water-
stressed areas by 2030
Supported by our €1 billion Climate & Nature Fund
100% of our ingredients will be biodegradable
by 2030
€1 billion annual sales from plant-based meat and dairy alternatives
by 2025-2027
Double the number of products sold that
deliver positive nutrition by 2025
70% of our portfolio to meet WHO-aligned nutritional standards
by 2022
95% of packaged ice cream to contain no more than 22g total
sugar per serving by 2025
85% of our Foods portfolio to help
consumers reduce their salt intake to no more
than 5g per day by 2022
95% of packaged ice cream to contain no
more than 250 kcal per serving by 2025
50% virgin plastic reduction by
2025, including an absolute reduction of 100,000 tonnes
25% recycled plastic by 2025
Collect and process more plastic than we
sell by 2025
100% reusable, recyclable or
compostable plastic packaging by 2025
Maintain zero non-hazardous waste to
landfill in our factories
Halve food waste in our operations by 2025
STRA
TEGIC
REP
OR
T – INTR
OD
UC
ING
UN
ILEVER
11Unilever Annual Report and Accounts 2021
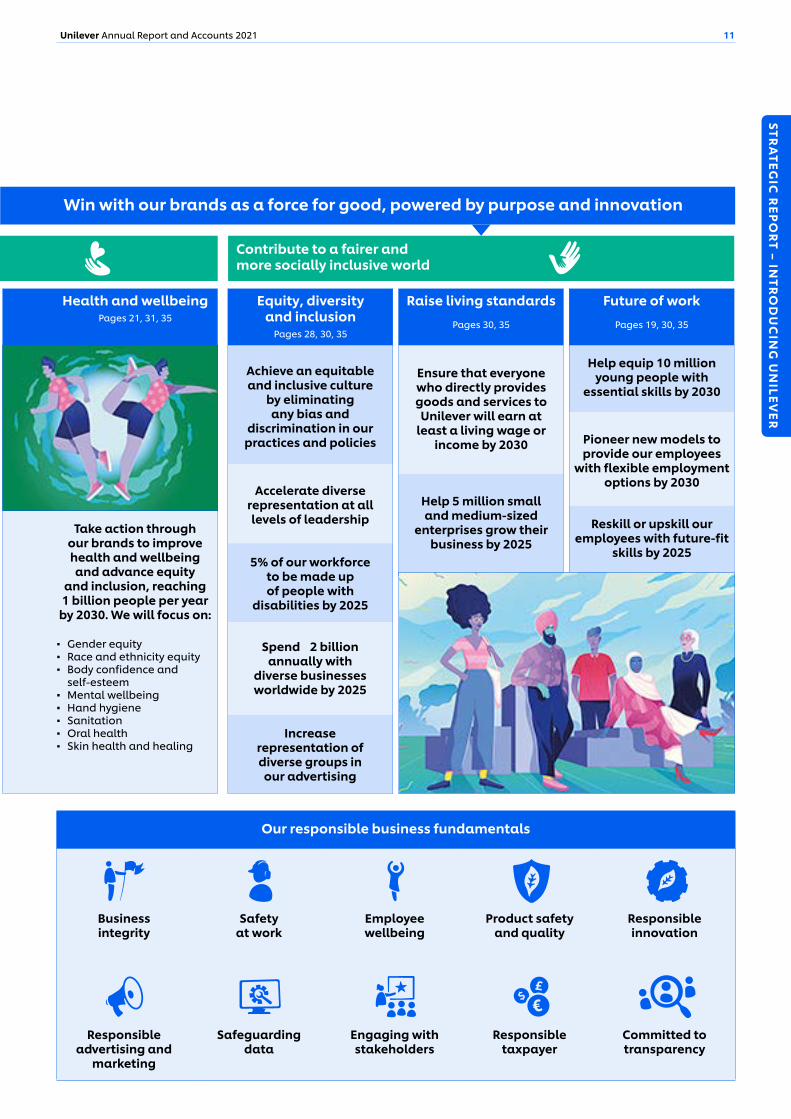
Win with our brands as a force for good, powered by purpose and innovation
Improve people’s health, confidence and wellbeing
Contribute to a fairer and more socially inclusive world
Our responsible business fundamentals
Business integrity
Safety at work
Employee wellbeing
Product safety and quality
Responsible innovation
Responsible advertising and
marketing
Safeguarding data
Engaging with stakeholders
Responsible taxpayer
Committed to transparency
Health and wellbeingPages 21, 31, 35
Equity, diversity and inclusion
Pages 28, 30, 35
Raise living standardsPages 30, 35
Future of workPages 19, 30, 35
Take action through our brands to improve health and wellbeing and advance equity
and inclusion, reaching 1 billion people per year
by 2030. We will focus on:
▪ Gender equity ▪ Race and ethnicity equity ▪ Body confidence and
self-esteem ▪ Mental wellbeing ▪ Hand hygiene ▪ Sanitation ▪ Oral health ▪ Skin health and healing
Achieve an equitable and inclusive culture
by eliminating any bias and
discrimination in our practices and policies
Accelerate diverse representation at all levels of leadership
5% of our workforce to be made up of people with
disabilities by 2025
Spend €2 billion annually with
diverse businesses worldwide by 2025
Increase representation of diverse groups in
our advertising
Help equip 10 million young people with
essential skills by 2030
Pioneer new models to provide our employees
with flexible employment options by 2030
Reskill or upskill our employees with future-fit
skills by 2025
Ensure that everyone who directly provides goods and services to
Unilever will earn at least a living wage or
income by 2030
Help 5 million small and medium-sized
enterprises grow their business by 2025
12 Unilever Annual Report and Accounts 2021
21
7
8
6
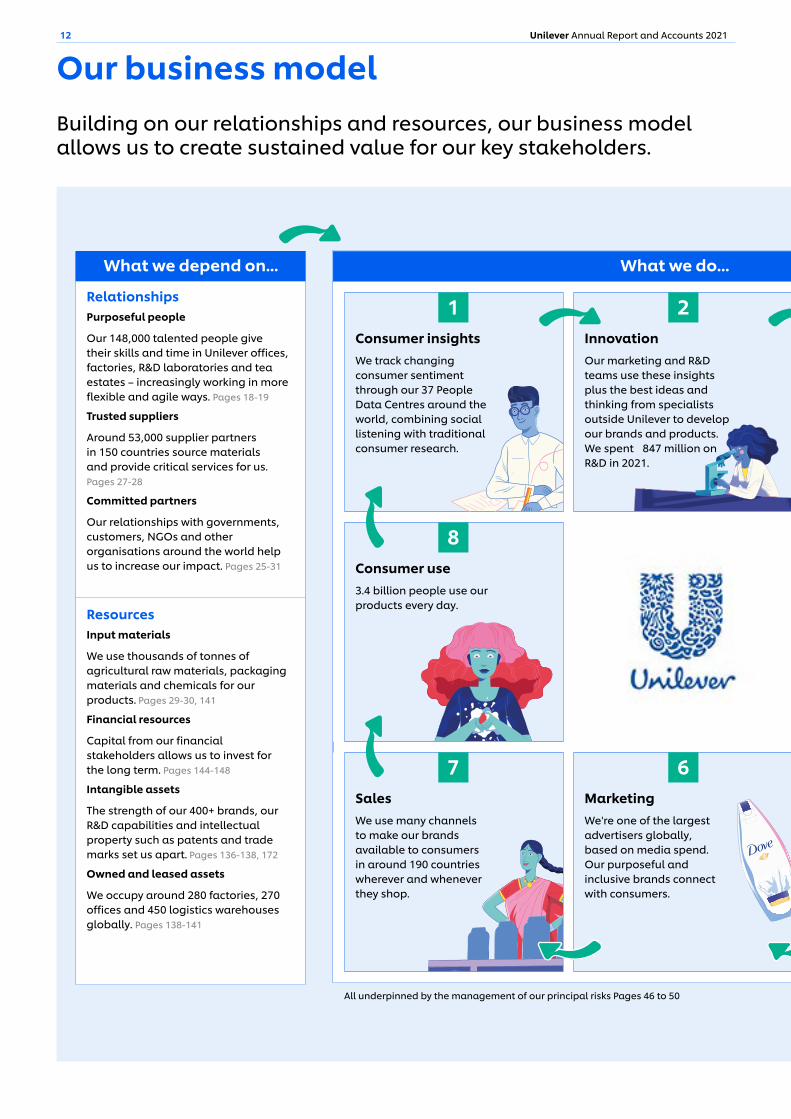
Our business modelBuilding on our relationships and resources, our business model allows us to create sustained value for our key stakeholders.
What we depend on...
Consumer insightsWe track changing consumer sentiment through our 37 People Data Centres around the world, combining social listening with traditional consumer research.
What we do...
InnovationOur marketing and R&D teams use these insights plus the best ideas and thinking from specialists outside Unilever to develop our brands and products. We spent €847 million on R&D in 2021.
Consumer use3.4 billion people use our products every day.
SalesWe use many channels to make our brands available to consumers in around 190 countries wherever and whenever they shop.
MarketingWe're one of the largest advertisers globally, based on media spend. Our purposeful and inclusive brands connect with consumers.
All underpinned by the management of our principal risks Pages 46 to 50
RelationshipsPurposeful people
Our 148,000 talented people give their skills and time in Unilever offices, factories, R&D laboratories and tea estates – increasingly working in more flexible and agile ways. Pages 18-19
Trusted suppliers
Around 53,000 supplier partners in 150 countries source materials and provide critical services for us. Pages 27-28
Committed partners
Our relationships with governments, customers, NGOs and other organisations around the world help us to increase our impact. Pages 25-31
ResourcesInput materials
We use thousands of tonnes of agricultural raw materials, packaging materials and chemicals for our products. Pages 29-30, 141
Financial resources
Capital from our financial stakeholders allows us to invest for the long term. Pages 144-148
Intangible assets
The strength of our 400+ brands, our R&D capabilities and intellectual property such as patents and trade marks set us apart. Pages 136-138, 172
Owned and leased assets
We occupy around 280 factories, 270 offices and 450 logistics warehouses globally. Pages 138-141
STRA
TEGIC
REP
OR
T – INTR
OD
UC
ING
UN
ILEVER
13Unilever Annual Report and Accounts 2021
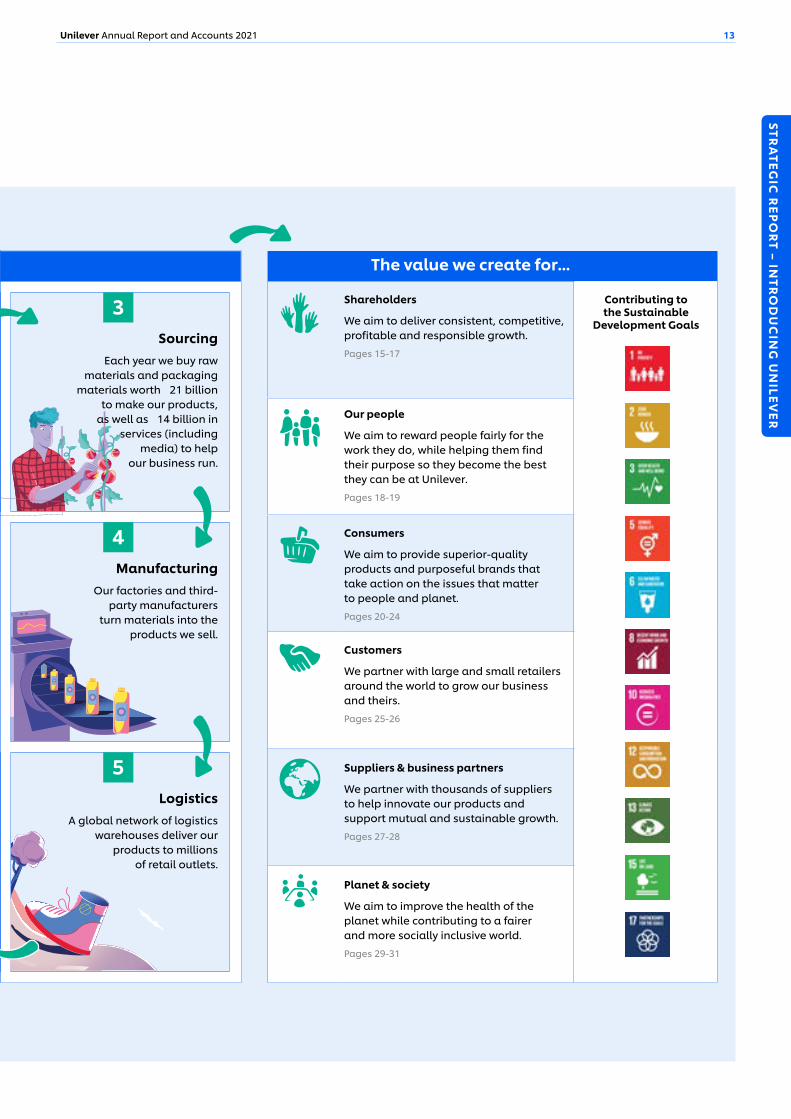
3
5
4
What we do...
SourcingEach year we buy raw
materials and packaging materials worth €21 billion
to make our products, as well as €14 billion in
services (including media) to help
our business run.
ManufacturingOur factories and third-
party manufacturers turn materials into the
products we sell.
LogisticsA global network of logistics
warehouses deliver our products to millions
of retail outlets.
The value we create for...
Shareholders
We aim to deliver consistent, competitive, profitable and responsible growth.
Pages 15-17
Our people
We aim to reward people fairly for the work they do, while helping them find their purpose so they become the best they can be at Unilever.
Pages 18-19
Consumers
We aim to provide superior-quality products and purposeful brands that take action on the issues that matter to people and planet.
Pages 20-24
Customers
We partner with large and small retailers around the world to grow our business and theirs.
Pages 25-26
Suppliers & business partners
We partner with thousands of suppliers to help innovate our products and support mutual and sustainable growth.
Pages 27-28
Planet & society
We aim to improve the health of the planet while contributing to a fairer and more socially inclusive world.
Pages 29-31
Contributing to the Sustainable
Development Goals
Review of the yearHere we describe the value we created for our stakeholders in 2021, our performance and how we’re managing the key risks to our business.
Review of the year
15 Shareholders
18 Our people
20 Consumers
25 Customers
27 Suppliers & business partners
29 Planet & society
32 Our performance
36 Financial review
44 Our risks
51 Additional non-financial information
- Climate change disclosures
- Other non-financial disclosures
Shareholders
We're delivering competitive growth by focusing on our strategic choices.
2021 was an unpredictable and challenging year, with cost inflation and continued disruption from Covid-19. As Covid rates spiked and restrictions were imposed and then eased in different countries at different times, we worked to manage disruption to our supply chains, building on our experience from 2020.
Our performance in 2021We delivered underlying sales growth of 4.5% in 2021. Our growth was broad-based, with all three Divisions growing. We achieved this while maintaining our competitiveness with 53% of our business winning share. While our pricing and savings programmes helped to offset some of the impact of mounting input costs, our underlying operating margin was down 10bps at 18.4%. Free cash flow remained healthy at €6.4 billion, albeit down from record levels last year. For more details on our performance see the Financial review on pages 36 to 43.
Five strategic choices for growthIn early 2021, we set out in detail the Unilever Compass strategy to deliver our vision. The five clear, sharpened choices we have made in our Compass strategy – portfolio, brands, markets, channels and culture – along with the continued delivery of our 5 Growth Fundamentals, have been playing an important role in building momentum across the business.
Developing our portfolio into high growth spaces
Our investments in high growth spaces continued in 2021. As well as our established businesses in hygiene and skin care where we continue to drive science-based innovation (see pages 20 to 24), we’re building sizeable new businesses in areas such as Prestige beauty, Functional nutrition and Plant-based foods, which are contributing to our growth. Our Prestige beauty business, now including the digitally-led cruelty-free Paula’s Choice brand which we acquired in 2021, delivered strong double-digit growth in 2021 and reached €1 billion turnover if we include a full year of Paula’s Choice.(a)
Functional nutrition is another area of focus for our portfolio transformation into high growth spaces. It includes Horlicks and our Vitamins, Minerals & Supplements (VMS) brands such as Olly, Liquid I.V., and Onnit, a leading brand in the fast-growing area of nootropics, acquired in 2021. Functional nutrition grew double-digit in 2021 and reached €1.5 billion turnover if we include a full year of Onnit.(a) We're also expanding our plant-based portfolio to meet growing consumer demand – see page 22.
In November 2021, we announced that we had entered into an agreement to sell our global Tea business, now known as ekaterra, to CVC Capital Partners Fund VIII for €4.5 billion on a cash-free, debt-free basis. The transaction excludes Unilever’s tea business in India, Nepal and Indonesia as well as the Pepsi Lipton ready-to-drink tea joint ventures and associated distribution businesses. We expect to complete this transaction in the second half of 2022, subject to receiving regulatory approvals and completing works council consultation processes. Once we dispose of eketerra, our portfolio rotation will be equivalent to 17% of our 2021 turnover since 2017.(b)
Winning with our brands as a force for good, powered by purpose and innovation
We hold clear global leadership positions in seven categories; and in a further two, we lead in terms of volume sold but not yet value. We’ve stepped up our investments in science and technology to strengthen the quality and efficacy of our products – 95% of the turnover we've tested was equal or better than the main competitor product, with 71% winning outright. (c) Insights from testing help us improve product performance through innovation. Focusing our R&D activities on fewer and bigger projects is also bringing innovations to market faster. In total, our innovation programme helped to deliver €1 billion in incremental turnover in 2021 – double that of 2020. See pages 20 to 24 for more on our brands and innovation.
"We're focused on driving faster growth from our strong portfolio of brands and markets."Alan JopeChief Executive Officer
STRA
TEGIC
REP
OR
T – REV
IEW O
F THE Y
EAR
15Unilever Annual Report and Accounts 2021
Our focus on winning with brands and innovation saw our 13 €1 billion brands – also among our most purposeful – grow in aggregate by over 6% in 2021. These brands now make up half of our total turnover. See pages 20 to 24 for more on brands with purpose and how we're building our marketing capability.
Accelerating in USA, India, China and key growth markets
Around 36% of our turnover is from three markets: the US, India and China. Having a strong brand and category presence here is key to our future growth, as these countries are predicted to account for well over half of global economic growth by 2030. To strengthen and expand our business in these priority markets, we’re growing our core brands, transforming our portfolio to capitalise on high growth opportunities and growing our digital and eCommerce channel presence.
USThe US is our largest market and we grew 3.7% in 2021 against a very strong prior year comparator. Delivering breakthrough technology innovations through our purposeful brands such as Dove, and scaling our recently acquired brands such as Olly and SheaMoisture, has helped to drive the growth of our US business. Data-driven customer partnerships are also unlocking further opportunities, such as exclusive bath range launches with two US retailers.
Our US business continues to benefit from our portfolio transformation into higher growth areas such as Functional nutrition and Prestige beauty – building on the strength of brands such as Liquid I.V. and Living Proof. The growth of eCommerce in the US continued in 2021 – enabled by an increased focus on innovations designed for channel and strengthened digital capabilities.
India Our Hindustan Unilever (HUL) business is India’s largest FMCG company. We delivered a strong all-round performance, growing at 13.4%.
We’re growing our core brands by focusing on superior products and purpose. Surf excel, for instance, continued to build relevance through our iconic ‘Dirt is Good’ campaign and delivered strong performance. And Lifebuoy strengthened our market leadership as the number one soap brand in India, building on its hygiene credentials (see page 31). HUL has a strong track record of building scale in new categories through market development, by moving consumers to new products with added benefits – such as liquid detergents, functional tea with wellness benefits and body wash.
Brands such as Surf excel, Dove and TRESemmé are responding to the needs of consumers and leading premiumisation. The newly formed Premium Beauty Business unit within HUL will strengthen our presence in the fast-growing masstige beauty segment. The premium portfolio performed well in 2021.
We made significant progress on the integration of the Horlicks portfolio. Our focus now is on building category relevance and growing penetration – through innovations in the high science range, such as Diabetes Plus, as well as a step up in marketing and communications, home visits to promote products and the introduction of affordable packs.
Our eCommerce sales in India saw double-digit growth in 2021. We're also reaching more small retail stores through digital channels – our eB2B app Shikhar is now used by over 700,000 retailers. Through direct-to-consumer platforms, we’re expanding our digital footprint further. The iconic beauty brand Lakme, for instance, is the most followed Indian beauty brand on Instagram with around 30% of its sales in 2021 through digital channels.
ChinaChina has grown into our third-largest market by fulfilling diverse and constantly changing consumer needs – doubling in size over the last decade. We grew by 14.3% in 2021.
Our success in China is built on our core brands – including Knorr, OMO, Dove and CLEAR – which are combining product superiority and brand purpose to expand penetration and sales. Transforming the portfolio is also key to unlocking future growth opportunities, such as in personal and home hygiene and masstige, and by premiumising brands such as Vaseline which has evolved from a basic body care range to cover whole body expert skin healing. We’re also expanding our Prestige beauty and VMS offerings with a selective roll-out of brands such as SmartyPants.
Sales through eCommerce in China grew double-digit in 2021. Further eCommerce growth is expected as penetration increases in lower-tier cities. Partnerships with eCommerce platforms such as JD.com and Alibaba (see page 25) and expanding reach to newer channels such as live streaming and social commerce, will continue this upward trend.
Leading in the channels of the future
We’re increasingly designing products and organising our business for eCommerce by working with partners such as Amazon and Alibaba as well as large retailers who are expanding their footprint across a range of digital commerce channels. Our eCommerce sales grew by 44% in 2021 and accounted for 13% of our total turnover – we see no sign of this shift reversing (see page 37 for a definition of eCommerce sales). We sell around 50% of our Prestige beauty products, for example, through eCommerce channels, including direct to consumer. See page 25 for more.
With our innovation and merchandising strategies firmly rooted in shopper insights, we'll continue to adapt at speed to trends, such as consumers wanting quick and delicious food delivered to their door. Our Ice Cream Now platform for instant ice cream delivery, for example, grew by 60% in 2021. We’re also increasingly using digital sales platforms with our customers, both large and small. See page 26 for more on our eB2B growth.
Shareholders continued
16 Unilever Annual Report and Accounts 2021
Building a purpose-led, future-fit organisation and growth culture
We believe that when employees are clear on their purpose in life and how this connects to the work they do, they’re more engaged and willing to go the extra mile. Working with purpose is at the heart of our culture – see page 19. This also helps us attract the very best people, as evidenced by our status as number one FMCG employer of choice for graduates and early career talent in over 50 markets.
More agile application of technology alongside simpler ways of working will help us stay one step ahead of consumer trends. We’re continuing to speed up our ways of working, building our eCommerce capabilities and automating back-office processes – see pages 19 and 25 for examples. We’re also reskilling and upskilling our people, and embracing hybrid ways of work to prepare for the future of work – see pages 18 to 19.
In January 2022 we announced changes to our organisational model to make us a simpler, more category-focused business – see pages 6 to 7 for more.
(a) Prestige beauty and Functional nutrition turnover for 2021 calculated as if Paula's Choice and Onnit respectively, had been acquired on 1 January 2021.
(b) Portfolio rotation is the 2021 turnover from any acquisitions completed since 2017 (including a full year of turnover for 2021 acquisitions) plus the last twelve months' of turnover from our disposals since 2017 (including eketerra) as a percentage of our 2021 turnover.
(c) Based on tests of our top products in 60 countries over the past three years to benchmark product superiority (turnover weighted).
STRA
TEGIC
REP
OR
T – REV
IEW O
F THE Y
EAR
17Unilever Annual Report and Accounts 2021
Our people
Our people are the heartbeat of Unilever – when they thrive, our business thrives.
This year reinforced the importance of being a safe, inclusive and supportive place to work for our 148,000 employees. Around 90,000 people took part in our UniVoice employee survey this year. We sustained very high engagement levels – 82% in offices and 83% in factories – which places us in the top quartile for employee engagement compared to industry benchmarks.
Protecting health, safety and wellbeingAlongside safety at work, supporting our people’s physical, mental and emotional wellbeing has never been more important.
Supporting our people through the pandemic
We’ve continued to help our people protect themselves from the virus by working to remove barriers to testing and encouraging vaccinations to keep our workplaces as safe and productive as possible. We ensured that thousands of our employees received medical care through our own facilities and healthcare resources, telehealth options or connections to community resources, and supported the colleagues and families of those we sadly lost to Covid.
We continued promoting healthy living and working for all our employees. To help people get the medical support they need, for example we now offer triage services in India and the UK. We launched a new digital tool in four countries that helps people identify their risk of type 2 diabetes, followed by a 12-month programme to reduce those risks. Participants in our Brazil and Mexico pilots have reported improvements to their quality of life and sleep, as well as less stress and time off work due to ill health.
We also intensified our focus on mental health, introducing online training in ten languages to help our people understand the impact of Covid on their mental health. More people used our Employee Assistance Programme this year, and our global network of mental health champions more than doubled to around 4,000 people. Our teams are using a new tool to assess their energy levels and better support each other. Due to these and other initiatives, the percentage of our people who feel Unilever cares about their wellbeing is rising: 85% in offices (81% in 2020) and 83% in factories (70% in 2019).
Safety at work
We continue to prioritise the safety of our people and contractors in everyday work situations – from using mechanical equipment to staying safe on the roads. Our 2021 UniVoice survey showed that over 90% of employees feel that Unilever is committed to their safety. We rolled out a new incident management tool which connects our sites around
the world on a single digital platform. We also increased resources to ensure appropriate oversight for safety.
Our Total Recordable Frequency Rate (TRFR) improved from 0.63 to 0.55 accidents per million hours worked (1 October 2020 to 30 September 2021), partly related to fewer accidents at Unilever offices due to continued working from home. Sadly however, fatalities continued to rise. In the reporting period, three contractors and four employees lost their lives. Two contractors were fatally electrocuted at one of our sites in Pakistan in one event; and a contractor in Hungary lost their life in a construction incident. Two employees were struck by lightning in separate incidents in Kenya and Tanzania. And two employees were involved in a fatal car accident in India.
When fatalities occur, our first priority is to support the emotional and physical needs of the families and team members of the individuals involved. We work with local law enforcement, communities and regulators to fully investigate the root cause and determine further preventative measures.
See our website for more on safety at work
New ways of workingThe world of work is changing. Our 2021 employee survey showed that around three-quarters of our people believe we have become simpler, faster and more agile in the last 12 months. Covid-19 has been a catalyst to expand flexible and more inclusive ways of working.
We’re rethinking how we work as an employer. The fact that the satisfaction and connection levels of new employees have risen since our last pre-Covid survey is testament to the effectiveness of our evolved ways of working. So we’ve moved to a hybrid model for our office-based employees. This means thinking about work as what people do, not where they do it – with our offices as collaboration spaces and people able to work where they’ll be most effective. Our global guiding principles for hybrid working state that we expect our employees to spend at least 40% of their time in the office.
We’re also pioneering new ways of working which both unlock capacity and help individuals find a meaningful and balanced way of working. Our AI-powered internal talent marketplace, Flex, allows us to match the skills needed for projects to people, regardless of where they sit in the organisation. It helped us reprioritise more than 110,000 hours to around 1,350 critical projects in 2021. In addition we have flexible working options like job-sharing or paid learning sabbaticals. Our people now have the option to work as a contractor on a project-by-project basis through the 'U-Work' programme in seven countries. This gives them the flexibility associated with contract roles and they are paid a monthly retainer fee with a core set of benefits.
18 Unilever Annual Report and Accounts 2021
No1 FMCG employer of choice for graduates and early career talent in over 50 markets
Skills for the futureWe’re creating a culture of learning across Unilever, upskilling and reskilling our people for jobs of the future. Our employees accessed the Degreed learning platform over 4.2 million times during 2021. In our latest employee survey, 83% of our people in offices and 77% of our people in factories said they believe Unilever gives them a chance to upgrade their skills for a successful future.
In 2021, we focused on building critical digital commerce skills throughout our business, including an eCommerce accelerator hub and bootcamp for our customer development teams and enhancing digital access in our factories to ensure our people have future-fit capabilities. Our Future of Work in Manufacturing programme gave frontline workers access to technology that enables shared learning on the job and better processes and communications. This is an important step towards our factories becoming the efficient digital workplaces we’ll need for our future growth.
Our ultimate goal is for no one to be left behind as the world of work continues to change. In December 2021, we held our first Future of Work conference to share our progress and learnings and build alliances with forward-thinking companies. We’re also aiming to help equip 10 million young people with essential skills for jobs by 2030 – see page 30 for more.
See our website for more on the future of work
Nurturing our growth culture
We see a human, purposeful and accountable culture that is rooted in our values as essential to our purpose-led and future-fit organisation. Using our future-fit plans, our people are shaping development and career plans based on their purpose – we've made a good start by upskilling or reskilling 7% of our people in 2021. We now have statistical evidence from ongoing research led by the London School of Economics of the link between purpose and intrinsic motivation, based on data from 3,500 employees across 14 countries.
Equity, diversity and inclusionWe also want to be a workplace in which everyone feels they belong and are able to thrive. This means creating an inclusive culture free from the barriers that limit people in reaching their true potential. We've identified four equity, diversity and inclusion priorities – gender, race and ethnicity, people with disabilities and LGBTQI+ communities. This is where we will put our global focus to address under-representation and overcome possible challenges in career progression and to foster a greater sense of inclusion. We’re building the capabilities of our business leaders and HR practitioners to support equity advocacy, diversity awareness and psychological safety in their teams.
We’re working to build a better understanding of the diversity of our workforce in order to identify specific community needs. For example, we've conducted a cultural assessment and focus groups with over 2,000 employees in Brazil, India and the UK to explore attitudes and barriers around disability inclusion in Unilever. Our LGBTQI+ employee network has increased to over 1,000 members, and we're continuing to expand it
to increase advocacy for human rights and safe havens for this community.
Our race and ethnicity strategy is focused on four markets (Brazil, South Africa, the UK and US). These are leading our work to make our recruitment practices more equitable by increasing the representation of black and brown people, building more inclusive and equitable cultures, and expanding local partnerships and advocacy.
Our gender balance at management level changed slightly in 2021, with women now accounting for 52% of all management employees. Our work continues to increase the representation of women, particularly at senior levels. This year, we reintroduced a tool that uses a mix of behavioural science and data to raise awareness of senior leaders’ hiring patterns and unconscious bias in decision-making. See page 64 for our gender balance statistics.
See our website for more on equity, diversity and inclusion
Working with integrityOur focus is on growth in line with our values, not on growth at any cost. We review our Code of Business Principles and Code Policies every year to ensure they reflect the current operating context and the latest legal requirements. In 2021, we further strengthened our Code Policies on data security and fraud. Our zero-tolerance approach to bribery continues to be supported through mandatory training and initiatives delivered to all employees.
We train our people every year to prevent compliance breaches, and they’re able to report in confidence any concerns around business integrity through our 24/7 Speak Up platform. In 2021, we continued to simplify and improve the whistleblowing process for users through expansion of local hotlines and interpreting services.
On our website, we report the number of Code cases and subsequent actions for each of our five Code themes including countering corruption – covering amongst other things anti-bribery and avoiding conflicts of interest. This year, across all areas of our Code of Business Principles, we received 1,275 Code reports, closed 1,246 reports (including some from prior years) and confirmed 694 reports as breaches, which led to 369 people leaving the business. Our data on Code breaches provides insights into issues and where they happen so that we can prevent behaviours that lead to them.
See our website for more on business integrity
STRA
TEGIC
REP
OR
T – REV
IEW O
F THE Y
EAR
19Unilever Annual Report and Accounts 2021
Consumers
Our brands are evolving to meet the changing needs of consumers all over the world.
Value and values With some countries emerging from lockdown and others living with Covid-related restrictions in 2021, many of the consumer trends we saw last year continued.
Consumers are thinking more carefully about everything from what they put in, and on, their bodies to what they use to clean their homes with. Shoppers also continue to be increasingly discerning – looking for highly effective products, with ingredients that are good for them and good for the environment. There is now compelling evidence that brands with purpose grow. Our own research shows a strong correlation between brand purpose and brand attractiveness – referred to as brand power – which in turn drives market share and growth. Other independent research from Kantar shows that the category of most sustainable shoppers who are highly concerned about the environment, is now around 1 in 5 of the global adult population – with the potential to reach 1 in 3 by 2024.
Even as some countries relaxed restrictions and people started to spend more time out of the home, online shopping and the demand for convenience stayed strong – e-everything is here to stay. Many people chose to stay home even when they had other options – continuing to cook at home instead of eating out, for example. The varying impact of the pandemic has also led to some shoppers treating themselves to more premium products while others are increasingly cost-conscious, looking for the best-performing products they can afford. Despite the price increases brought about by commodity inflation, we continued to offer value for everyone.
To capitalise on these consumer trends, we’re building our marketing capability to support the growth of our brands. We're particularly focused on digital marketing which now makes up to 40% of our media spend. And we’re harnessing new AI-powered innovation tools to spot trends early and test new product concepts. Against this dynamic backdrop, our three Divisions worked to anticipate and meet consumers’ needs with their products and purpose-led brands.
Beauty & Personal CareWe want to be the most positive beauty business in the world for people and the planet.
We believe in beauty that not only does less harm, but also does more good – beauty that’s both inclusive and sustainable. To achieve our new Positive Beauty vision, we’re using our scale to create positive change and drive growth through our big brands, impactful innovation and portfolio transformation.
Growing our core brands
Dove grew strongly this year reaching €5 billion turnover, supported by renovation of its core products, such as Dove Care & Protect which is now available in 50 countries with clinically proven, superior moisturisation. Dove also launched the premium Hair Therapy range, combining expert hair care solutions with skin care-inspired ingredients.
The pandemic has highlighted the importance of hygiene, and our brands continued to meet this need, despite the slowdown in the sale of hand sanitisers which affected the growth of Lifebuoy and Suave. Lifebuoy’s handwashing campaigns continued to raise awareness and contributed to a large increase in brand power – a measure of brand attractiveness – and its ranking as the third most chosen FMCG brand in the world by Kantar. Lux relaunched its core soap bars and body washes with superior benefits, such as long-lasting fragrance.
Rexona relaunched its core deodorant range with 72-hour non-stop protection against sweat and body odour. And our male grooming brand Axe refreshed its identity to celebrate and represent all types of attraction, in addition to a major reformulation that fights odour instead of masking it.
Impactful innovation
We’re anticipating future consumer needs by focusing our innovations on fewer projects with bigger impact. This year, we’ve scaled our industry-leading pro-lipid technology which helps to nourish skin from within. Developed by our dermatology scientists, it's now available across our biggest skin care brands such as Dove, Vaseline, and Pond’s.
In focusSaying no to normal
As part of our commitment to challenging narrow beauty ideals, we’re eliminating the use of the word ‘normal’ across all our Beauty & Personal Care products and communications, globally. We'll end any digital alteration to change a person’s body shape, size, proportion or skin colour across all advertising material, and increase the number of advertisements portraying people from diverse groups. Our brands are already putting this commitment into action. Dove’s Reverse Selfie campaign launched in 2021 to highlight the effect retouching apps have on girls’ self-esteem. And Sunsilk released a music video in Turkey featuring inspiring women who are breaking the mould.
20 Unilever Annual Report and Accounts 2021

With over 100 patents on the human microbiome, a number of our product innovations in 2021 focused on enhancing the body’s own repair and defences by using natural ingredients. For example, our reformulated Dove Body Wash uses a gentle formulation to support a healthy skin microbiome.
We’re also dialling up our innovation partnerships to anticipate future consumer needs. The digital Uni-Excubator we launched in 2020 in China has been giving start-ups unique access to our insights and expertise in areas such as technology, sustainability and distribution networks. In return we've harnessed their skills and agility to help our brands grow. We're partnering with Alibaba’s Tmall platform which is hosting the Uni-Excubator’s flagship store, Uni-Topia Planet, showcasing exclusive new beauty and personal care products and driving sales through its channel.
Portfolio transformation
We're building a sizeable Prestige beauty business, a key part of our strategy to evolve our portfolio into high growth spaces. Prestige is growing fast, with turnover of €1 billion in 2021 if we include a full year of Paula’s Choice, a digitally led, cruelty-free skin care brand. The growth of Prestige was supported by new innovations from Dermalogica, REN – and Hourglass with a breakthrough red lipstick that offers consumers a vegan alternative to the red pigment traditionally made from crushed beetles.
Skin care grew single-digit in 2021. Potential in the category is high, but there is more we need to do to fully capitalise on the opportunity. By targeting our top markets with breakthrough innovations such as pro-lipids, as well as locally relevant brand purpose activities, we’re already seeing strong growth of brands such as Vaseline which performed strongly in 2021, supported by a number of premium innovations across skin brightening, therapeutics and hydration. Good growth also came from brands such as Pond's which continues to offer more premium ranges.
We continued to expand our presence across eCommerce channels – eCommerce sales accounted for 16% of our Beauty & Personal Care turnover in 2021. We're also looking at digital commerce and capitalising on this growth in a number of
ways. For example, through our new Positive Beauty Growth Platform which aims to partner with start-ups and scale-ups from around the world on cutting-edge projects. Our initial invitation for pitches focused on the emerging channel of social commerce – from livestream shopping to gaming. We’re now working with the shortlisted applicants to partner with our brands.
People positive
We know that consumers want health and beauty products which they feel represent them. So we’re focused on growing our global portfolio of brands that are inclusive and care for all skin, hair and body types, championing the diversity of beauty.
As well as saying ‘no to normal’, our Beauty & Personal Care brands are using their power to serve more diverse communities and break down stereotypes and prejudice. As hair can be a source of discrimination for people from different races and ethnicities, we’re working to help people make the most of all hair types. By pinpointing the proteins that differ in curly and straight hair, we were able to launch one of the first product ranges – Nexxus Curl Define in the US – which caters to each hair type's specific needs.
In line with its purpose to give people the confidence to move more, Degree piloted the world’s first prototype deodorant designed to be easier for people with disabilities to use. Alongside this, to get audiences thinking differently about sportspeople, the brand also released short films featuring diverse athletes defying stereotypes.
See page 30 for more on how Beauty & Personal Care brands worked to improve health and wellbeing and advance equity and inclusion in 2021.
Planet positive
We’re committed to doing less harm and more good for the natural world by protecting and regenerating 1.5 million hectares of land, forests and oceans by 2030. Consumers are increasingly concerned about the effect of the products they buy on the environment – and especially plastic pollution. Towards our goal to use less, better and no plastic, our oral care ranges, starting with France in 2021, began rolling out recyclable toothpaste tubes. And Dove launched 'buy once, refill for life' aluminium deodorant sticks. For more on plastic, see page 29.
"Positive Beauty isn’t just about doing the right thing for the planet, it’s also helping to grow our business too."Sunny Jain President, Beauty & Personal Care
€5bnDove grew high single-digit in 2021 and reached another turnover milestone
STRA
TEGIC
REP
OR
T – REV
IEW O
F THE Y
EAR
21Unilever Annual Report and Accounts 2021

in all 55 markets, both in foodservice and retail. The latest addition to its meat alternatives is the Patty on the Back burger, a breakthrough plant-based burger. Not only is the burger lower in calories and fat than meat, it’s higher in fibre and iron and has similar salt levels.
Our plant-based ice cream range continued to grow with brands like Ben & Jerry’s, Magnum, Breyers, Cornetto, Carte D’Or and Swedish Glace offering non-dairy options. With Magnum’s Vegan Sea Salt Caramel winning a PETA Vegan Food Award in 2021, all the brand’s vegan flavours are now award-winning. Certified vegan non-dairy now makes up over 25% of Ben & Jerry’s pint flavours in the US.
We’re also using cutting-edge food science to find alternative proteins and new ways to cook without meat. In Argentina, Colombia and Mexico, we launched Rinde Más, a blend of herbs, spices, vegetables and protein that gives cooks an affordable way to reduce the meat in their dishes. We’ve also begun working with food-tech company ENOUGH to develop new plant-based products based on mycoprotein – from a process that uses 93% less water, 97% less feed and 97% less carbon than meat.
We were again named by investor network FAIRR as a pioneer in sustainable protein research and innovation and ranked number one in its protein transition index for 2021.
See our website for more on plant-based foods
Growing our channel footprint
We’re finding new ways to make our brands available to consumers, wherever they are. Sales through eCommerce continue to grow, and accounted for 9% of our Foods & Refreshment turnover in 2021. Our Ice Cream Now business caters to the rise of 'in-home' eating, by quickly delivering our brands to consumers in 35 countries, growing 60% in 2021. And our out-of-home professional foodservices business, Unilever Food Solutions (UFS), grew double-digit in 2021 despite the ongoing impact of restrictions. UFS is now working with cloud kitchens – commercial kitchens that prepare and cook food purely for delivery – such as Casper, a cloud kitchen pioneer in Belgium, where we provide a range of products from our Vegetarian Butcher portfolio, as well as specific ingredients and flavours.
"We’re improving the health of the planet by changing what’s on our plates."Hanneke FaberPresident, Foods & Refreshment
As part of our support for a global ban on animal testing for cosmetics, we’ve continued to work alongside regulatory authorities, NGOs and like-minded companies to share science and advocate the use of non-animal approaches for safety testing. Requests for new animal tests in Europe threaten the European Union’s ban on animal testing for cosmetics. Dove and our other 27 PETA-approved brands united with The Body Shop and animal protection organisations to campaign to save cruelty-free cosmetics. Regulatory changes in China have allowed for the import of more cosmetic products without the requirement for animal testing, meaning more consumers will be able to enjoy our beauty products.
Foods & RefreshmentWe're on a mission to be a world-class force for good in food.
Our brands continue to provide great-tasting, nutritious and sustainable foods for consumers all over the world – using our world-class innovation and brand purpose to inspire change.
Irresistible innovation
During 2021 we continued to grow our core brands. Knorr, our biggest Foods & Refreshment brand grew high single-digit, supported by bigger innovations and a clear purpose. It launched its first zero salt bouillon in Europe – now available in ten markets, offering cooks unique blends of vegetables, herbs and spices, while supporting our goal to reduce salt intake. Its purpose to ‘reinvent food for humanity’, inspired the inaugural Eat for Good day, which aims to empower 'Eativists' who want to make a difference to the world through their food choices, as well as building brand awareness. And the ‘future- proof your recipe’ platform on Recipedia, where consumers can share Future 50 Foods recipe ideas, is expanding to other countries after a successful launch in Mexico.
Hellmann’s, the world’s number one mayonnaise, grew double-digit for the second year in succession. Continuing its mission to inspire 100 million people to waste less food, its 2021 Superbowl campaign led to increased brand awareness and a boost in sales. And Hellmann’s vegan mayonnaise, now available in 33 markets, launched three new flavours – Baconnaise, Chipotle and Garlic.
While varying levels of restrictions around the world affected our sales of out-of-home ice cream in 2021, our ice cream brands grew mid-single digit – as Ben & Jerry’s (now a €1 billion brand), Wall's and Magnum continued to offer much-loved favourites and new flavours, such as Magnum's Double Gold Caramel Billionaire – available in 35 markets. Not only an indulgent ice cream, it comes in 100% recycled plastic tubs developed with advanced recycling technology which is now being rolled out to other brands.
Expanding our plant-based portfolio
We continued to step up our plant-based offerings through a number of our brands. Our plant-based meat and dairy replacement business saw strong double-digit growth in 2021 in pursuit of €1 billion annual sales by 2025-2027. This was primarily driven by The Vegetarian Butcher, which is growing
Consumers continued
22 Unilever Annual Report and Accounts 2021

Home CareWe're making people’s homes a better world, and our world a better home.
As we work to make the lives of the people who buy our products easier, cleaner and safer, we’re also leading our industry towards a cleaner future through the power of science and innovation. Our relentless focus on meeting consumer needs with superior products has fuelled the steady and competitive growth of many of our brands.
Powering growth through Clean Future
We know people want to clean their homes and clothes without damaging the planet. We’re making good progress in transforming some of the world's most well-known household brands to disinfect, clean, freshen up and remove stains better than ever while lowering their carbon emissions and waste, in line with our ‘Clean Future’ strategy.
Our biggest Home Care brand, Dirt is Good (also known as OMO, Surf Excel, Persil or Skip) is key to our Clean Future ambitions – and leads the transformation of our entire Home Care business. It launched a successful new liquid range that uses plant-based stain removers without compromising on performance. It’s suitable for low-temperature washing, with a lower GHG impact than laundry powders, and is packaged in mostly recycled plastic bottles.
To help reduce its use of plastic packaging, Dirt is Good also rolled out a six times concentrated OMO dilute-at-home laundry liquid in our biggest laundry market, Latin America. It quickly became a top-seller in Argentina and Brazil. Not only does this make the brand affordable to more consumers, it also uses around 70% less plastic than a conventional 3-litre bottle, and is now more biodegradable. Dirt is Good grew mid single-digit in 2021 and increased its global brand power score, also winning WARC and Effie awards for the effective communication of its brand purpose to consumers. For more on our Clean Future innovations, see pages 31 and 52.
Sunlight, one of our €1 billion brands, started to roll out a new plant-based formulation for its hand dishwash products across the world. With biodegradable active ingredients, it’s also proven to deliver a superior cleaning experience.
In 2021, we entered a multi-year partnership with Arzeda to design new enzymes for our laundry and cleaning products, including OMO, Surf and Sunlight. Applying the latest advances in digital biology, the new enzymes have the potential to significantly reduce the number of ingredients we use, while delivering superior products, new cleaning benefits and a lower environmental footprint.
See our website for more on our Clean Future strategy
In focusKnorr: building a greener food future
Our largest food brand continues to take bold and innovative steps towards healthier eating and a healthier planet. Through its new zero salt bouillon, its promotion of Future 50 Foods – a collection of nutritious and sustainable plant-based foods – and its new World Eat for Good day, the brand is encouraging people to swap out traditional ingredients for healthier ones. And now, through its new Grown for Good initiative, Knorr will create 50 regenerative agriculture projects to transform how its key ingredients are grown. The first three projects are looking at water preservation and soil health with key suppliers of tomatoes, rice and vegetables. Knorr grew high single-digit in 2021.
A world-class force for good in food
As one of the biggest consumer goods companies in the world, with a large Foods & Refreshment portfolio, we want to use our scale and reach to transform the food system – from the fields and farms where ingredients are grown, to the packaging that keeps food fresh.
Our brands are working to protect and preserve natural habitats in the places their ingredients are produced. Knorr continues its work with farmers and growers through a new series of 50 projects. Part of our Climate & Nature Fund, it aims to establish regenerative agriculture sourcing for 80% of its key raw materials over five years. One project, for example, is using satellite data and digital sensors to help tomato farmers in the south of Spain optimise their water use and improve soil health through cover cropping. In Côte d’Ivoire, where the cocoa used by Magnum is grown by Rainforest Alliance farmers, the brand has planted 465,000 native trees and is working with farmers to tackle deforestation. For more on nature see pages 30 and 52.
We’re meeting consumer demand for more sustainable packaging by using less, better or no plastic. Many of our foods brands already use 100% recycled plastic, such as Hellmann’s and Bango. And we’re now making progress in finding better ways to overcome technical challenges with sachets that are hard to recycle, for example by bringing out groundbreaking paper-based recyclable pouches for our Colman’s range in the UK. For more on plastic see page 29.
STRA
TEGIC
REP
OR
T – REV
IEW O
F THE Y
EAR
23Unilever Annual Report and Accounts 2021
Responding to fast-changing hygiene habits
People’s hygiene habits continued to evolve during the year, and with this came unpredictable and challenging market conditions for our cleaning and disinfecting brands. In this context, we decided to evolve and expand our portfolio to continue to meet consumers’ existing and future needs.
Our leading toilet-cleaning brand Domestos now offers around-the-house disinfection with a range of sprays, foams, cleaning liquids and wipes – making these available to consumers in our top 30 markets. Lifebuoy home disinfectants, delivering 24 hours of disinfection with 100% natural cleaning ingredients, are now available in the UK, Germany, Vietnam, Malaysia and Singapore. And in Indonesia we rolled out a new antibacterial Sunlight washing-up liquid that can be used without water and rinsing.
Our air purification brand Blueair enjoyed a particularly strong year in 2021. Its latest innovation, HealthProtect, which provides protection against viruses and bacteria, supported a record year of growth for Blueair. The brand also made great strides in its Freedom to Breathe campaign which supports children’s right to clean air, after the Committee of the UN Convention on the Rights of the Child acknowledged children’s right to clean air.
Value through more convenient formats and channels
Our Home Care brands have a long track record of helping consumers access more convenient formats which offer superior benefits and create more value in the market. Our market development activities have accelerated liquid detergent growth to double-digit in most of our key developing and emerging markets. And we’re moving consumers from laundry liquids to laundry capsules, so that they get the right dose of detergent every time. Our capsules business enjoyed strong growth, gaining share in most markets. And our OMO capsules became the second most popular laundry capsules in China, ranking first in offline channels.
As more people turned to online shopping to conveniently buy their cleaning and laundry products during the pandemic, we’ve renewed our focus on growing our home care digital commerce business. We’ve also invested in a digital capability team, including a dedicated unit in the UK to create and launch ‘design for eCommerce’ innovations. Sales through eCommerce accounted for 16% of our Home Care turnover in 2021.
We continue to focus on taking unproductive costs out of our business. Our 5S programme delivered €190 million of savings, helping us to invest in future shopping channels, product formats, media, consumer needs and sustainable innovation.
"We’re radically transforming some of the most popular cleaning and laundry brands in the world to deliver great cleaning experiences with lower environmental impact."Peter ter Kulve President, Home Care
Consumers continued
24 Unilever Annual Report and Accounts 2021
We work with our many retail partners to help them grow sustainably alongside Unilever.
Customers
Our products reach the hands of consumers through millions of retail outlets in around 190 countries. Our customer partners range from large traditional stores to online-only retailers, and from small family-owned shops to value retailers. As our gateway to the people who buy and use our products, these customer partners are critical to our success.
A shifting retail landscapeOur customers had to adapt throughout the year to changes in people’s buying habits as Covid-related restrictions came and went and shopping patterns shifted in different ways at different times around the world. One consistency was the ongoing growth of online retail – with consumers shopping more and more online and new groups of shoppers, such as older age groups, joining them. During the year, global supply chain and logistics challenges made it harder for retailers to predict product availability. So we focused on offering more proactive planning and strategic support and establishing new ways to help our partners of all sizes grow.
Partnering for growthWe survey our customers using the Advantage Group Survey to understand our strengths and where we need to improve. This year across the 34 markets we surveyed, we continued to improve customer satisfaction. We were told that customers value the quality of our consumer insights and that we’re improving in our service and supply. We were also rated leaders in sustainability. Based on these findings, we continue to improve our capabilities for closer collaboration, smoother processes, more powerful insights and solid business planning and execution. For instance, we're transforming our core business processes across functions by using technology and data to create a superior customer experience.
Digital acceleration
Despite the recent surge in digital commerce, only around a third of the world’s population shop online – which represents a huge opportunity for growth. We’re seeing the rise of new models like social commerce, where people shop through social media platforms, and quick commerce, where people expect to receive their orders in less than an hour. And we’re seeing continued growth through some of our biggest eCommerce partners, Amazon and Alibaba.
Our eCommerce sales grew by 44% in 2021 and now represent 13% of our turnover. We’re investing significantly in our ability to fulfil online customer orders and our own technology, skills and capabilities in digital commerce. Our aim is to be the digital commerce partner of choice, helping our customers grow in the channels of the future. The power of our brands and marketing, our inclusive content and design, the strength of our supply chain and our focus on sustainability allows us to form unique partnerships.
We’re a launch partner for Amazon as they expand into new markets – most recently Egypt and Poland where our products were available on the day of launch. As one of a select group of manufacturers in Amazon’s Tier 1 Global Vendor Program, we work closely together on retail, supply chain, media and sustainability initiatives around the world. Our offering under their Climate Pledge Friendly programme continues to expand, with over 700 items in the programme in 2021. More than half of these are certified as compact by design – lighter products that use less water and packaging, so need less energy to deliver and use. Our Amazon US Climate Pledge Friendly selection online accounted for 7% of our US eCommerce turnover in 2021 – and this will continue to be a key focus for the future.
We partner with Alibaba across 13 markets. In China, our collaboration goes beyond core commerce into digital transformation across the value chain: from suppliers to marketing to consumer recycling. In March 2021, we launched a joint innovation centre in Hangzhou, China to quickly test, refine and scale product innovations. Our strategic partnership with Alibaba’s Lazada platform has helped our products reach consumers across South East Asia since 2017. We also see huge potential in Europe through AliExpress, Alibaba’s new local marketplace.
STRA
TEGIC
REP
OR
T – REV
IEW O
F THE Y
EAR
25Unilever Annual Report and Accounts 2021
"In this rapidly changing environment, we are partnering with our customers big and small, digital and physical, to drive shopper loyalty and conversion."Keith Higgins Chief Customer Development Officer
Strategic growth for large retail partners
Most of our large retail partners are evolving from traditional ‘bricks and mortar’ stores to selling across a blend of channels (omnichannel), with digital commerce playing a significant role. This change in business model requires new ways of thinking about and reaching consumers.
The shift has led to challenges around product distribution, availability, visibility and promotion for many of our large retail customers. In 2021, we ran pilots of location-based analytics in the US, UK and Netherlands allowing us to track how our products were performing store by store to help customers meet these challenges.
We also launched a strategic growth initiative for our large retail customers. Through the Partners4Growth programme, we’re harnessing insights and foresights from our advanced shopper data analytics to help our customers create growth plans and make sure they have the right products in the right places at the right time. After piloting this approach to mutual growth with Walmart, Carrefour, Target and Ahold-Delhaize Benelux, we plan to expand to other key customers and ultimately bring all of the elements of our collaboration together in an integrated digital platform.
Closer collaboration and insight-driven initiatives like these with our most valuable customers, alongside a focus on our biggest purpose-led brands, are helping us to further accelerate mutual growth.
Helping small retailers become future-fit
We believe that by helping smaller retailers engage with the digital economy, we can help them build more resilient and profitable businesses that also grow our sales. In 2021, we expanded our e-business-to-business (eB2B) platforms co-created and owned by Unilever, such as Shikhar in India, Compra Agora in Brazil and GoToko in Indonesia, to help small retailers meet the changing needs of today’s shoppers. We've added thousands of new customers each month to reach half of the 4.7 million small stores in the Asia, Latin America and Africa markets we directly serve. They also offer many of our smaller customers access to things like extended payment terms and cashless payments that help them keep their shelves stocked and increase their profits.
We’re working with external researchers to independently assess the impact of three of our initiatives providing small- scale retailers in our value chain with access to finance, technology and training. These include Jaza Duka in Kenya, Siparis Direkt in Turkey and Kabisig Summits in the Philippines. The studies found that 68% of participants reported that their business grew as a result of being in the programmes. As the retail world moves more and more online, we’ll continue to invest in digital and financial inclusion for our small retailers everywhere. See page 30 for more on how we’re creating economic opportunities throughout our retail value chain.
Selling with purposeWith sustainability an important consideration in many consumers’ buying decisions, we’re working with our customers to deliver on our strategic priorities – such as climate action and health and wellbeing – while engaging consumers on these important issues. One example is our continued partnership with Alibaba to create China’s first large-scale closed-loop system of recycling machines. These use artificial intelligence to sort plastic packaging so that it can be fast-tracked for reuse – and consumers get ‘green points’ for their deposits, which they can use to plant trees or protect land.
Another is the Hygiene 101 sale in the Philippines with Lazada, Shopee and Grab, where popular brands such as Lifebuoy handwash and Domex cleaner were sold with hygiene tips and vouchers to help spread good habits. This was part of a bigger campaign in partnership with the Philippine Public Health Association to create better hygiene behaviours.
We’re also bringing our brands’ purposes to life in retail outlets. Through in-store campaigns and materials, we've now reached over 8 million points of sale display units.
In focusEmpowering small retailers through apps
We’re expanding our e-business-to-business (eB2B) platforms to give our small retail customers a safe, non-contact way of interacting with us at convenient times to place orders, track stock and shipments, and see prices and promotions. Not only does this create a better experience for our customers, it helps them increase sales – our digitally enrolled customers grew by 4% more than offline-only stores in 2021. And we can use the data from these apps to predict sales, manage inventory, offer insight-based advice to retailers and improve our customer experience.
Customers continued
26 Unilever Annual Report and Accounts 2021

Suppliers & business partners
We’re working more closely with our many suppliers and partners around the world to deliver our strategy.
Our supplier ecosystem includes millions of people around the world – from large multinationals to start-ups and small local producers who provide us with goods and services such as raw materials, logistics, advertising, professional services and much more. We also work with a range of business partners, including industry peers, innovation agencies, universities and joint ventures, to help unlock growth and find solutions that benefit our stakeholders.
Stronger togetherCovid-related restrictions continued to challenge supply chains in 2021, with lockdowns affecting our suppliers’ businesses in many parts of the world. Commodities, packaging and transport all experienced high levels of inflation. There were shortages of agricultural raw materials, such as tomatoes, soybean oil and rapeseed oil, caused by extreme weather conditions. And globally, supply chains and services were put under pressure due to labour shortages. Meanwhile, consumer demand rebounded in many areas, calling for deeper collaboration, agility and innovation with our network of partners to secure supplies and stay resilient.
To overcome these challenges, we spread production of products across our manufacturing network and held inventory closer to the consumer to ensure availability. We also enhanced our procurement approach: partnering with scoutbee, for example, to bring AI into our supplier discovery process to quicken, streamline and strengthen our search for partners – giving us a more resilient network.
Partnerships fit for the futureOur ongoing success rests on working with many innovative and purposeful businesses and offering them a great experience. We know that while our suppliers value our sustainability ambitions and the relationships they have with us, they want Unilever to be quicker, simpler and easier to work with. In 2021, we improved our partner experience through a new integrated supplier helpdesk with a single point of contact and faster query resolution times. We’ll be rolling out the helpdesk globally in 2022.
We continue to invest in technology to enhance our supply chain, with digital transformation allowing us to re-engineer production lines and apply automation and AI to be more responsive and resilient. We developed an award-winning Covid-19 dashboard which uses real-time data and machine learning to monitor and predict trends down to site level. This helped us identify and manage risks in our operations. We’ve also created a version of the dashboard to share with our supply chain partners.
Our Virtual Ocean Control Tower also proved indispensable in mitigating the effects of the Suez Canal blockage in 2021, giving us real-time visibility of sea cargo location, container details and estimated time of arrival. This helps our logistics, planning and procurement teams minimise delays and makes our cross-border supply chain more efficient and resilient.
Increases in speed and agility must not, of course, come at the expense of product quality. So we also introduced a new digital process for addressing quality defects with our raw ingredient and packaging supply partners. This is allowing us to better track, analyse and manage quality issues, and we’ll be rolling this out to all factories and supply partners in 2022. We know we need to bring more collaborative technology to our relationships with our suppliers, and are working to increase the speed and scale of platforms and processes like this one."Through purpose-led
partnerships, we’re innovating and finding new opportunities to accelerate growth and scale industry transformation."Reginaldo EcclissatoChief Business Operations Officer
STRA
TEGIC
REP
OR
T – REV
IEW O
F THE Y
EAR
27Unilever Annual Report and Accounts 2021

From strategy to actionOur direct suppliers are the gateway to the millions of people in our wider supply chain. So they’re critical to building a more inclusive world, slowing climate change, and protecting natural resources. We simply can’t do these things without them.
We’ve started to turn our strategy into action by working with our partners on pilots, roadmaps, capability building and information sharing. At the very end of 2020, we launched our Partner with Purpose programme to help us find innovative and impactful ways to deliver on our ambitious commitments with our supply partners and generate mutual growth.
Throughout 2021, we held a series of global and market-specific virtual events to share our strategy and commitments and recognise supplier contributions. In August, we launched our Partner Promise Programme to encourage suppliers to begin their own sustainability journeys, initially in three critical areas: climate, supplier diversity and living wage.
Reducing emissions through our supply chain
In 2020, we set out our ambition to achieve net zero emissions across our value chain by 2039.(a) This is a collective challenge, and an urgent one. Our suppliers bring critical climate action innovations to us. Through our partnership with Neste, for example, we’re exploring new sources of renewable and recycled carbon for our cleaning product formulations. In June, we joined forces with Coca-Cola and Colgate-Palmolive in AB InBev’s 100+ accelerator to push sustainable innovation in climate, water, packaging and sustainable agriculture in supply chains. We began five pilots to test innovations in sustainable packaging, water and energy – for example, converting food waste into animal feed in East Africa and repurposing brewery grains for packaging materials in China. We also take part in groups with similar ambitions, such as Transform to Net Zero and the Exponential Roadmap Initiative, to learn from others and share our own experience to help accelerate climate action in supply chains. For more on how we're working with our suppliers see page 53.
See our website for more on partnering with suppliers to deliver net zero
Dialling up diversity
Having a more diverse supply chain not only helps shape a fairer and more socially inclusive world – it allows us to unlock innovation and agility and better address the needs of our diverse consumers. Despite the volatility of the year, we made progress on our commitment to help our suppliers improve their own diversity and increase our spend with diverse suppliers. Our first step was to understand where we’re starting from and begin tracking our spend. We ran our first global survey to map our spending with diverse businesses and are now working on validating our data and assessing which procurement categories should be prioritised. Our technology partner for finding new suppliers, scoutbee, has also added
diversity to its search criteria – reinforcing this as a critical element we look for in all potential suppliers.
We expanded our supplier diversity programmes in North America and South Africa and began new ones in seven other countries – the UK, Ireland, India, Thailand, Australia, Brazil and Kenya – where we’d identified conditions for good progress. For example, in the UK we’re working with Google, Dow and WPP on an accelerator programme to empower diverse businesses. And in Kenya, we began partnering with International Finance Corporation (IFC) on Sourcing2Equal, a three-year project helping women-owned small and medium businesses access corporate procurement opportunities.
We spent €445 million with diverse suppliers in 2021, the first year of our ambitious goal to spend €2 billion annually by 2025. As a global commitment, this covers all markets – many with little or no infrastructure for supporting diverse businesses. So in 2021, we also invited 450 of our closest supply partners to commit to growing their own workforce and supplier diversity in order to start growing the demand for more diverse businesses.
Responsible sourcingPartnerships based on clear standards of responsible sourcing strengthen our supply chain and the businesses within it. Our Responsible Sourcing Policy (RSP) sets out our commitment to conduct business with integrity, and with respect for universal human and labour rights as well as environmental sustainability. It’s a crucial part of the due diligence we undertake to identify and encourage remediation by suppliers of issues within our extended supply chain.
In 2021, the proportion of our suppliers meeting the requirements of our RSP reached 81%. Our 2021 performance is not comparable to previous years as we now include new acquisitions that are not yet fully integrated into our systems. We risk-assess our suppliers against the RSP and require those we identify as high-risk to undergo an independent audit verifying they can meet our requirements. We require suppliers to put in place corrective actions to remedy any identified non-conformances so that they can remain compliant. This year, we improved the compliance process for new suppliers by ensuring that they only work with us once they confirm they can meet the requirements of our RSP. We’re strengthening our process for existing suppliers to ensure we only raise new purchase orders for those who remain RSP compliant.
We’re launching a refreshed RSP in 2022 with an expanded focus on climate and nature – and a new requirement for suppliers to pay a living wage, which will be introduced progressively across different portfolios until it is mandatory for all by 2030 – see page 30 for more on living wage.
See our website for more on responsible sourcing
(a) The definition of ‘net zero’ is outlined in our Climate Transition Action Plan. See page 53 for further details on the scope of this goal.
Suppliers & business partners continued
28 Unilever Annual Report and Accounts 2021
STRA
TEGIC
REP
OR
T – REV
IEW O
F THE Y
EAR
29Unilever Annual Report and Accounts 2021
Planet & society
Our business simply will not prosper without a healthy planet and society.
Our approach to sustainability continues to recognise the interconnection of the planet and society – and that sustainable business can be a driver of business performance.
Improving the health of our planet As the UN announced ‘code red for humanity’ in 2021, the urgency of our work to tackle climate change, reduce plastic waste and protect nature has never been greater.
Climate action
We put our Climate Transition Action Plan (CTAP) to a shareholder vote at our AGM in May 2021. The plan received overwhelming support, with 99.59% of votes in favour. For more detail on progress against our CTAP during 2021 and our Task Force on Climate-related Financial Disclosures (TCFD) statement, see pages 51 to 62.
See our website for more on climate action
A waste-free world
We’re making progress towards our ambitious goals around virgin plastic reduction, recycled plastic use, making our packaging recyclable, and collection and processing of plastic. However, we know there is still a lot more to do. In just three years, we've increased our use of recycled plastic to approximately 17% of our total packaging portfolio (July 2020 to June 2021 – the reporting period for all our plastic metrics). Our end of 2021 forecast was around 20%, putting us well on track to meet our commitment of at least 25% recycled plastic by 2025.
Many of our brands are now using high levels of recycled plastic in their packaging. In 2021, Hellmann’s launched 100% recycled packaging in almost two-thirds of its markets. In Europe, Knorr has introduced bouillon tubs and lids made from 100% recycled material, Swedish Glace now offers its plant-based ice cream in food-grade and freezable recycled plastic tubs, and Persil comes in lighter bottles made with 70% recycled plastic. Dove uses 100% recycled plastic in its bottles in Europe and North America (where technically feasible) and 98% of its new refillable deodorant packaging in the US is made from recycled plastic.
Due to our step up on recycled plastic, we've reduced our total virgin plastic packaging footprint since 2018 by around 16% to 599,000 tonnes. We have more projects than ever exploring
less or no plastic. We’re working with Pulpex to create the first- ever paper-based laundry detergent bottle, piloting this with OMO in Brazil. And we’re expanding our in-store refill programmes, now in 11 countries, including refill stations in Asda and Co-op stores in the UK, and vending machines in India for Surf Excel, Comfort and Vim refills.
Currently, 53% of our packaging is recyclable, reusable or compostable. This is our actual recyclability rate (which is based on the EMF Global Commitment definition of 'recyclable'), which is significantly less than the 70% of our packaging portfolio that is technically recyclable with existing technology. This gap is an industry-wide challenge and is primarily driven by a lack of collection and recycling infrastructure. We’re working with local governments and partners to close this gap, while we continue to deploy new materials and technologies. For instance, Signal, Pepsodent and Closeup are shifting to fully recyclable toothpaste tubes. In 2021 we rolled out recyclable flexibles in North America for Dove and Love Beauty and Planet. And in Vietnam, we launched a trial of recyclable sachets for CLEAR shampoo, with the aim of collecting and recycling the sachets for other uses.
We’re also ramping up our collection and processing of post- consumer plastic waste. Our business in India was one of the first to help collect and process more plastic than it sold, and we have roadmaps for achieving this in other markets. We have more work to do to scale up our collection efforts. Industry partnerships will be key, such as our work with Mars, Mondelēz, Nestlé, PepsiCo and UK retailers to incentivise the recycling of flexible packaging. In the US, we've made a $15 million investment in the Closed Loop Partners’ Leadership Fund to help improve recycling. Advocacy is an important part of our plastics strategy. In January 2022, alongside more than 70 other businesses, we called for an ambitious and legally binding UN treaty to tackle plastic pollution on a global scale, similar in intent to the Paris Agreement.
See our website for more on plastic
We’re also focused on reducing food waste. We’re using predictive analytics and automation to better manage stock as well as apps to help chefs and caterers become more aware of food waste. Hellmann’s continues its efforts to cut waste in homes and hospitality. Its #MakeTasteNotWaste campaign encourages quick and easy ways to use up leftovers, reaching more than 150 million people around the world. Hellmann’s grew double-digit in 2021. See page 52 for more on food waste.
See our website for more on food waste
30 Unilever Annual Report and Accounts 2021
Planet & society continued
Protect and regenerate nature
We continue to work towards a deforestation-free supply chain for palm oil, paper and board, tea, soy, and cocoa. We’ve made progress in moving our sourcing footprint to areas of lower risk of deforestation. We’re working towards reporting of low-risk deforestation volumes from 2022 and independently verified deforestation-free volumes from 2023. Our efforts in tackling deforestation and sustainable sourcing have been recognised by CDP, through our inclusion on the A List for Forests in 2021.
During the year, we strengthened our contractual framework with key suppliers in palm and soy so we are working on aligned commitments. We created independent verification protocols and piloted these in our sourcing of palm oil, cocoa, and soy. We also expanded the coverage of our palm oil monitoring platform, which uses satellite imagery and geolocation data to measure deforestation in our supply chain. And along with NASA, Google, and others, we developed the Forest Data Partnership to collect data on forests and ecosystems.
Our People & Nature Policy enhances our supplier requirements around no deforestation and human rights for our key commodities. We also published our Regenerative Agriculture Principles, guiding our suppliers and farmers, including smallholders, on how to nourish soil and water, capture carbon and restore land. By the end of 2021, we had 53,000 hectares under protection and regeneration in partnership with others. Brands like Knorr are playing a leading role in driving our regenerative agriculture programmes (see page 52).
Water is essential for our business – the crops we grow, how we make our products, and how consumers use our brands. We’re expanding our focus on water beyond our factory gates, starting with 12 factories in a number of water-stressed countries. We’re also working with the 2030 Water Resources Group to address water security for consumers in Bangladesh, India, Brazil, South Africa and Vietnam. Ensuring our Home Care and Beauty & Personal Care products are biodegradable is another key part of our approach to water stewardship. We’re working with suppliers and innovation partners to find alternative biodegradable ingredients that don’t compromise on product performance. See page 23 for more.
See our website for more on nature and water
A fairer, more inclusive world We’re helping to build more resilient and equitable communities by raising living standards, advancing equity, diversity and inclusion and preparing people for the future of work.
Raising living standards
Since 2020, we’ve continued to pay all our employees a living wage, and in 2021 were awarded our first global independent accreditation as a living wage employer from the Fair Wage Network.
In 2021, we made a groundbreaking commitment that everyone who directly provides goods and services to us will earn at least a living wage or living income by 2030. We’re starting with our manufacturing and agriculture supply chain, where workers tend to be the most vulnerable. We’re engaging our teams in the four markets with the biggest gap between the legal minimum wage and living wage in our supply chain. And we’ve begun engaging with our suppliers to understand their living wage position and how best to support and engage them.
In addition, we know there are many barriers to small businesses thriving, such as lack of access to skills, finance and technology. We’ve launched new programmes to move towards our goal to help 5 million small and medium-sized businesses in our retail value chain grow by 2025, reaching 1.2 million in 2021.
See our website for more on raising living standards
Equity, diversity and inclusion
Our research shows that more progressive advertising has the potential to deliver 74% better brand power – a key measure of consumer attraction for brands. Through our Act 2 Unstereotype programme, we're integrating more diverse and inclusive thinking at every point of our marketing – to ensure it reflects the diversity of society. For examples of how our brands are working to shape a fairer and more inclusive world, see pages 21 and 31, and for diversity and inclusion in our workforce and supply chain, see pages 19 and 28.
The future of work
We’re working to help young people find their purpose and match it with skills that will prepare them for the future of work – giving us access to talented young workers. Our LevelUp programme in South Africa for example, aims to break barriers to employment through purpose workshops, digital learning, mentoring and work experience. For more on how we’re preparing our own people for the future of work, see pages 18 to 19.
See our website for more on the future of work
Improving health, confidence and wellbeingOur brands continued their work to promote health and wellbeing, inclusive beauty and positive nutrition – finding ways to power growth through purpose.
STRA
TEGIC
REP
OR
T – REV
IEW O
F THE Y
EAR
31Unilever Annual Report and Accounts 2021
Health and wellbeing
Covid has brought the importance of hygiene into sharp relief. Lifebuoy's purpose is preventing illness and saving lives through handwashing with soap. Its H for Handwashing education campaign has been teaching children about the importance of handwashing since its launch in 2020. And the Hygiene & Behaviour Change Coalition created by Lifebuoy, Domestos, the UK government and others has equipped many more to practise better hygiene. Lifebuoy also began offering free doctor teleconsultations on pack and through its communications across India, Indonesia, Bangladesh, Pakistan and Vietnam. Our Pepsodent/Signal toothpaste brand also expanded its oral health services in Indonesia by providing free dental consultations via WhatsApp during Covid-19 restrictions, with other markets to follow in 2022. We see access to healthcare services as an important way to grow household penetration of our brands by providing vital services to communities.
Our brands also expanded their efforts to improve confidence and wellbeing. Rexona deodorant extended its Breaking Limits programme to help young people in Brazil, the US and the UK overcome barriers to being active – funding community sports projects and access to coaches. Sunsilk continued its work to empower girls and young women through its Explore More programme with Girl Rising, which has reached more than 56,000 young people from underserved communities in six countries. Our brand-led initiatives helped to improve health and wellbeing and advance equity and inclusion for almost 700 million people in 2021.
See our website for more on improving health and wellbeing
Positive nutrition
We’re continuing to increase the nutritional value and reduce salt, sugar and calories in our foods and refreshments. 63% of our portfolio met our WHO-aligned nutrition standards. Fortifying foods with micronutrients is another long-standing priority, now linked to our goal to double the number of products sold that deliver Unilever's standards for positive
In focusOMO: Purple carbon cleaning power
We’ve teamed up with biotech partners LanzaTech and India Glycols to capture carbon dioxide waste from steel factories and turn it into a climate-friendly cleaning ingredient. This ‘purple carbon’ technology – carbon captured from industrial emissions – has so far been used in OMO laundry liquid capsules in China and in Sunlight dishwashing liquid in South Africa. This is just one example of how we’re reinventing the chemistry of our Home Care products to create growth opportunities for our brands while cutting the use of fossil fuels.
nutrition by 2025 – including impactful amounts of vegetables, fruits, protein and fibre as well as micronutrients. At the end of 2021, 41% of our products delivered positive nutrition (per serving), keeping us on track towards our goal – see page 35 for more including our progress in reducing salt, sugar and calories.
We’re using our voice to push for a sustainable food system, for example at the UN Food Systems Summit in 2021 where we called for a move to more plant-based proteins and more action on food loss and waste. We know there is more to do, but we’re proud that our efforts are being recognised. We ranked first in the World Benchmarking Alliance’s Food and Agriculture Benchmark and number two in the global Access to Nutrition Initiative (ATNI) Index, which ranks the nutrition programmes of the top 25 global food and beverage manufacturers.
See our website for more on positive nutrition
Respecting and promoting human rightsRespect for human rights is at the heart of our business and the responsibility of every person in Unilever. We work with suppliers, peers, industry bodies, trade unions and civil society to address human rights impacts so that everyone connected to our value chain is treated with respect, dignity and fairness.
In support of our commitment to respect and promote human rights and the effective implementation of the UN Guiding Principles, in 2021 we created a framework to enable us to address human rights issues consistently and effectively. We're using it to define a theory of change, and action plans which include capability building and impact assessment metrics to measure progress. We used the framework to implement capability building on responsible recruitment for our suppliers – which includes an e-learning platform and toolkit – and our procurement teams.
Our Human Rights Reports explain our progress and the due diligence we've undertaken in tackling the many human rights challenges such as forced labour, gender-based violence and living wages.
We continued to work on women’s inclusion and safety in agriculture, manufacturing and last-mile distribution. We'll be introducing safety frameworks in priority regions and making sure our direct suppliers have policies and processes in place to support inclusion and address sexual and gender-based violence.
See our website for more on human rights
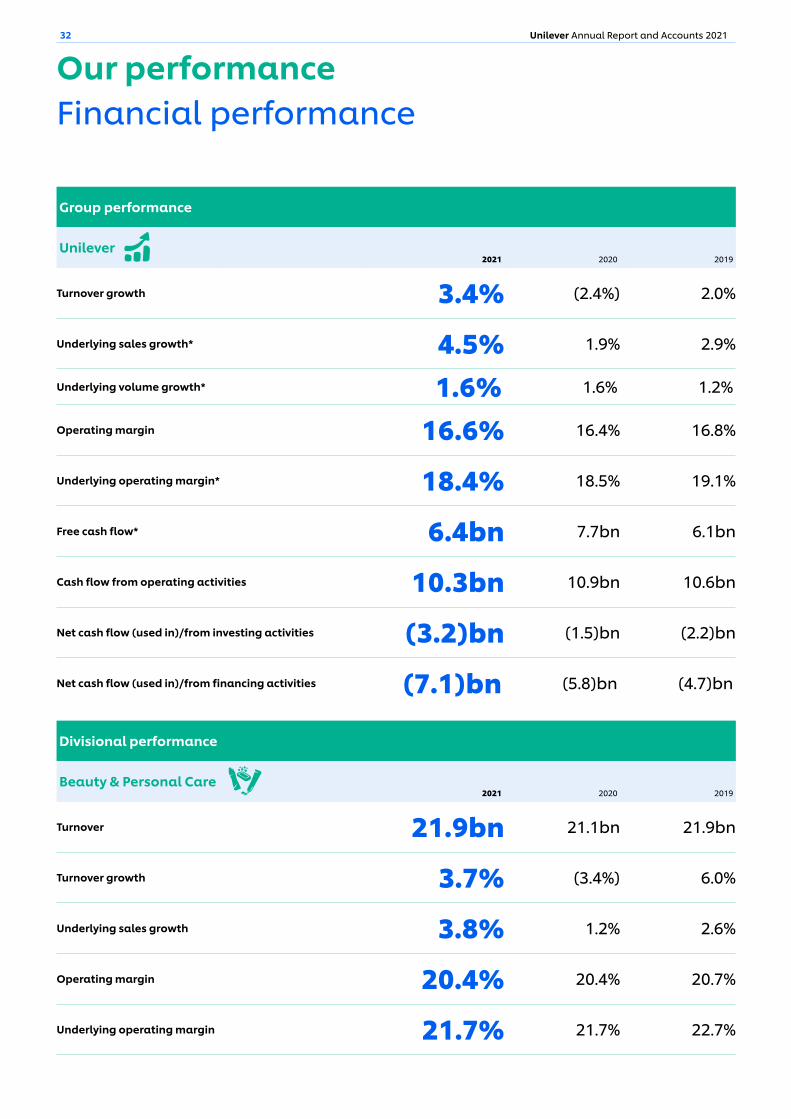
32 Unilever Annual Report and Accounts 2021
Group performance
Unilever2021 2020 2019
Turnover growth 3.4% (2.4%) 2.0%
Underlying sales growth* 4.5% 1.9% 2.9%
Underlying volume growth* 1.6% 1.6% 1.2%
Operating margin 16.6% 16.4% 16.8%
Underlying operating margin* 18.4% 18.5% 19.1%
Free cash flow* €6.4bn €7.7bn €6.1bn
Cash flow from operating activities €10.3bn €10.9bn €10.6bn
Net cash flow (used in)/from investing activities €(3.2)bn €(1.5)bn €(2.2)bn
Net cash flow (used in)/from financing activities €(7.1)bn €(5.8)bn €(4.7)bn
Our performanceFinancial performance
Divisional performance
Beauty & Personal Care2021 2020 2019
Turnover €21.9bn €21.1bn €21.9bn
Turnover growth 3.7% (3.4%) 6.0%
Underlying sales growth 3.8% 1.2% 2.6%
Operating margin 20.4% 20.4% 20.7%
Underlying operating margin 21.7% 21.7% 22.7%
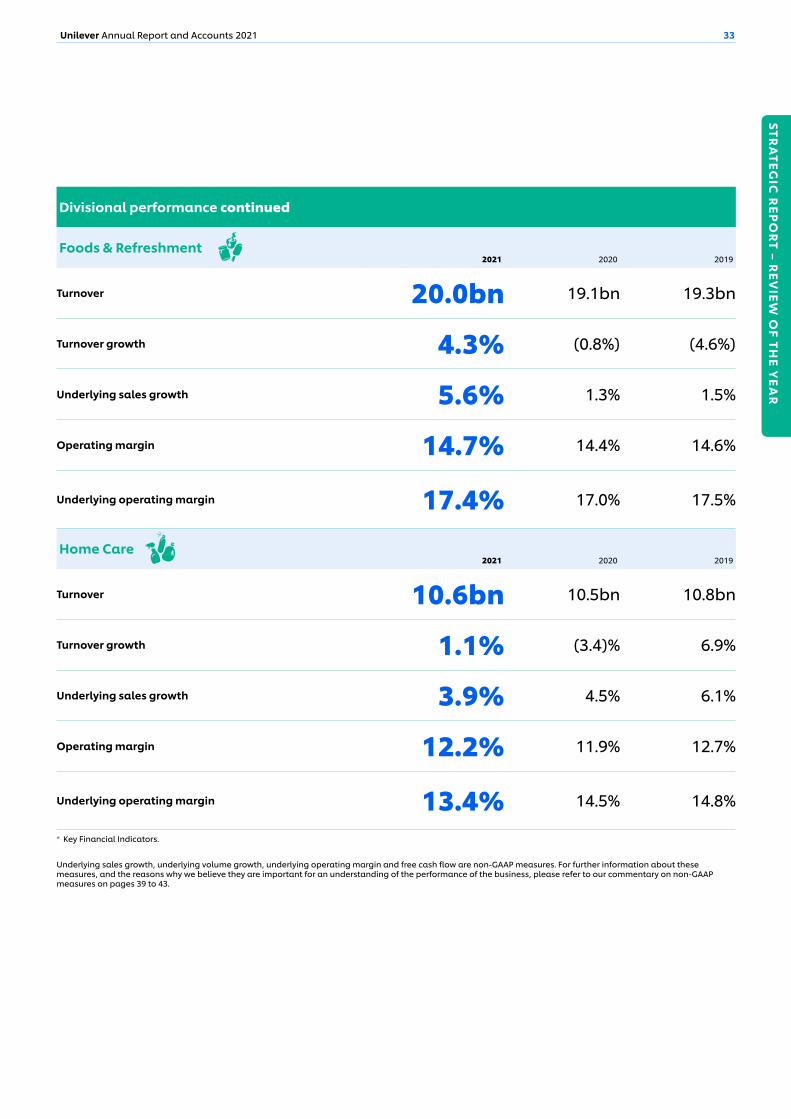
STRA
TEGIC
REP
OR
T – REV
IEW O
F THE Y
EAR
33Unilever Annual Report and Accounts 2021
Divisional performance continued
Foods & Refreshment 2021 2020 2019
Turnover €20.0bn €19.1bn €19.3bn
Turnover growth 4.3% (0.8%) (4.6%)
Underlying sales growth 5.6% 1.3% 1.5%
Operating margin 14.7% 14.4% 14.6%
Underlying operating margin 17.4% 17.0% 17.5%
Home Care 2021 2020 2019
Turnover €10.6bn €10.5bn €10.8bn
Turnover growth 1.1% (3.4)% 6.9%
Underlying sales growth 3.9% 4.5% 6.1%
Operating margin 12.2% 11.9% 12.7%
Underlying operating margin 13.4% 14.5% 14.8%
* Key Financial Indicators.
Underlying sales growth, underlying volume growth, underlying operating margin and free cash flow are non-GAAP measures. For further information about these measures, and the reasons why we believe they are important for an understanding of the performance of the business, please refer to our commentary on non-GAAP measures on pages 39 to 43.
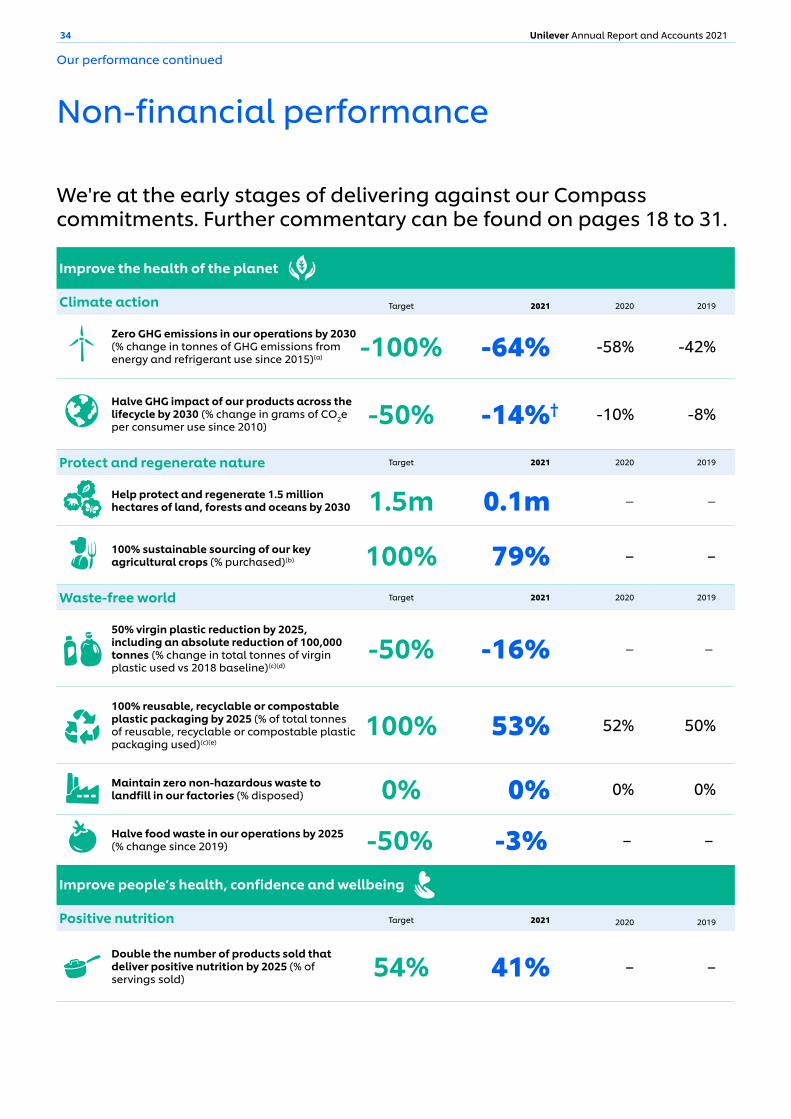
34 Unilever Annual Report and Accounts 2021
Non-financial performance
We're at the early stages of delivering against our Compass commitments. Further commentary can be found on pages 18 to 31.
Our performance continued
Improve people’s health, confidence and wellbeing
Positive nutrition Target 2021 2020 2019
Double the number of products sold that deliver positive nutrition by 2025 (% of servings sold) 54% 41% – –
Improve the health of the planet
Climate action Target 2021 2020 2019
Zero GHG emissions in our operations by 2030 (% change in tonnes of GHG emissions from energy and refrigerant use since 2015)(a) -100% -64% -58% -42%
Halve GHG impact of our products across the lifecycle by 2030 (% change in grams of CO2e per consumer use since 2010) -50% -14%† -10% -8%
Protect and regenerate nature Target 2021 2020 2019
Help protect and regenerate 1.5 million hectares of land, forests and oceans by 2030 1.5m 0.1m – –
100% sustainable sourcing of our key agricultural crops (% purchased)(b) 100% 79% – –
Waste-free world Target 2021 2020 2019
50% virgin plastic reduction by 2025, including an absolute reduction of 100,000 tonnes (% change in total tonnes of virgin plastic used vs 2018 baseline)(c)(d)
-50% -16% – –
100% reusable, recyclable or compostable plastic packaging by 2025 (% of total tonnes of reusable, recyclable or compostable plastic packaging used)(c)(e)
100% 53% 52% 50%
Maintain zero non-hazardous waste to landfill in our factories (% disposed) 0% 0% 0% 0%
Halve food waste in our operations by 2025 (% change since 2019) -50% -3% – –
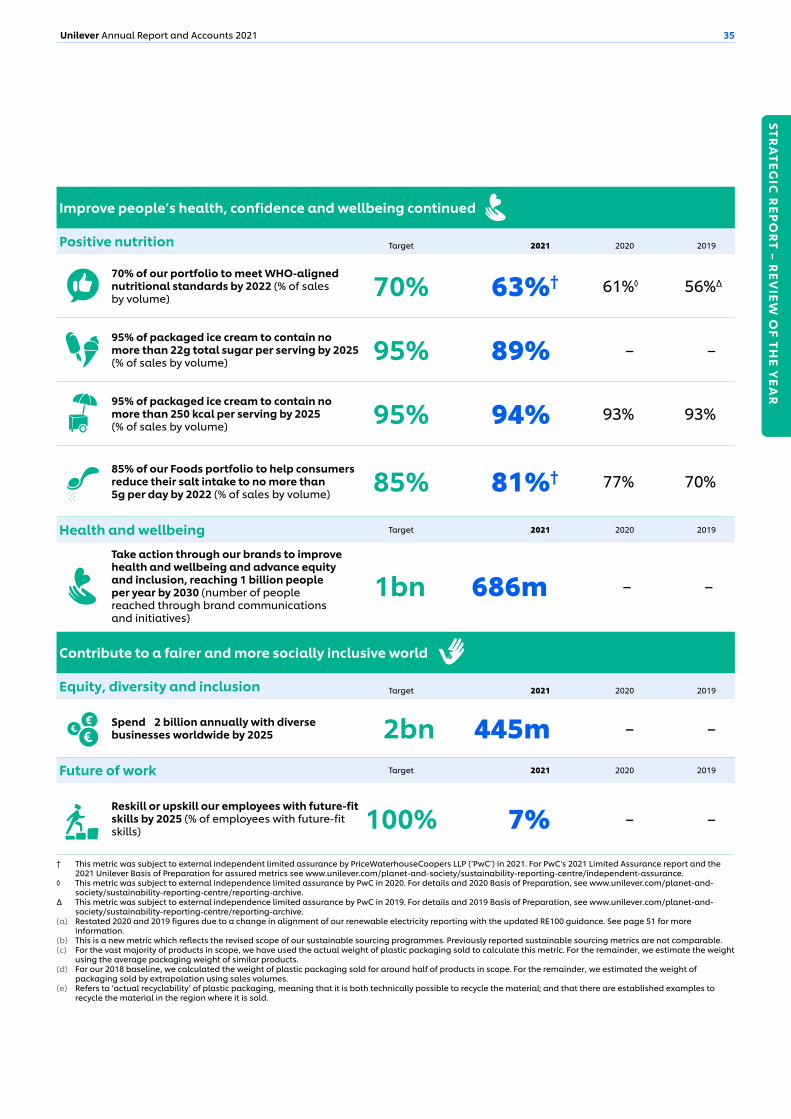
STRA
TEGIC
REP
OR
T – REV
IEW O
F THE Y
EAR
35Unilever Annual Report and Accounts 2021
Improve people’s health, confidence and wellbeing continued
Positive nutrition Target 2021 2020 2019
70% of our portfolio to meet WHO-aligned nutritional standards by 2022 (% of sales by volume) 70% 63%† 61%◊ 56%Δ
95% of packaged ice cream to contain no more than 22g total sugar per serving by 2025 (% of sales by volume) 95% 89% – –
95% of packaged ice cream to contain no more than 250 kcal per serving by 2025 (% of sales by volume) 95% 94% 93% 93%
85% of our Foods portfolio to help consumers reduce their salt intake to no more than 5g per day by 2022 (% of sales by volume) 85% 81%† 77% 70%
Health and wellbeing Target 2021 2020 2019
Take action through our brands to improve health and wellbeing and advance equity and inclusion, reaching 1 billion people per year by 2030 (number of people reached through brand communications and initiatives)
1bn 686m – –
Contribute to a fairer and more socially inclusive world
Equity, diversity and inclusion Target 2021 2020 2019
Spend €2 billion annually with diverse businesses worldwide by 2025 €2bn €445m – –
Future of work Target 2021 2020 2019
Reskill or upskill our employees with future-fit skills by 2025 (% of employees with future-fit skills) 100% 7% – –
† This metric was subject to external independent limited assurance by PriceWaterhouseCoopers LLP (‘PwC’) in 2021. For PwC's 2021 Limited Assurance report and the 2021 Unilever Basis of Preparation for assured metrics see www.unilever.com/planet-and-society/sustainability-reporting-centre/independent-assurance.
◊ This metric was subject to external independence limited assurance by PwC in 2020. For details and 2020 Basis of Preparation, see www.unilever.com/planet-and-society/sustainability-reporting-centre/reporting-archive.
Δ This metric was subject to external independence limited assurance by PwC in 2019. For details and 2019 Basis of Preparation, see www.unilever.com/planet-and-society/sustainability-reporting-centre/reporting-archive.
(a) Restated 2020 and 2019 figures due to a change in alignment of our renewable electricity reporting with the updated RE100 guidance. See page 51 for more information.
(b) This is a new metric which reflects the revised scope of our sustainable sourcing programmes. Previously reported sustainable sourcing metrics are not comparable.(c) For the vast majority of products in scope, we have used the actual weight of plastic packaging sold to calculate this metric. For the remainder, we estimate the weight
using the average packaging weight of similar products.(d) For our 2018 baseline, we calculated the weight of plastic packaging sold for around half of products in scope. For the remainder, we estimated the weight of
packaging sold by extrapolation using sales volumes.(e) Refers to ‘actual recyclability’ of plastic packaging, meaning that it is both technically possible to recycle the material; and that there are established examples to
recycle the material in the region where it is sold.
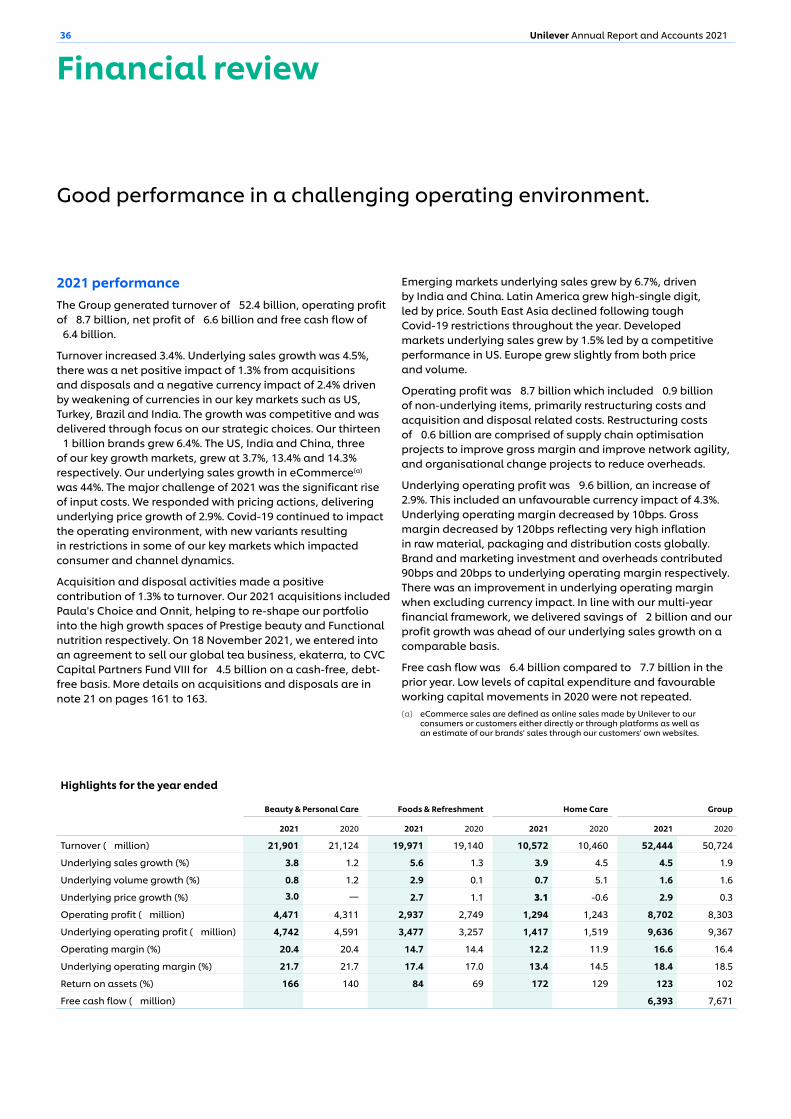
36 Unilever Annual Report and Accounts 2021
Financial review
2021 performanceThe Group generated turnover of €52.4 billion, operating profit of €8.7 billion, net profit of €6.6 billion and free cash flow of €6.4 billion.
Turnover increased 3.4%. Underlying sales growth was 4.5%, there was a net positive impact of 1.3% from acquisitions and disposals and a negative currency impact of 2.4% driven by weakening of currencies in our key markets such as US, Turkey, Brazil and India. The growth was competitive and was delivered through focus on our strategic choices. Our thirteen €1 billion brands grew 6.4%. The US, India and China, three of our key growth markets, grew at 3.7%, 13.4% and 14.3% respectively. Our underlying sales growth in eCommerce(a) was 44%. The major challenge of 2021 was the significant rise of input costs. We responded with pricing actions, delivering underlying price growth of 2.9%. Covid-19 continued to impact the operating environment, with new variants resulting in restrictions in some of our key markets which impacted consumer and channel dynamics.
Acquisition and disposal activities made a positive contribution of 1.3% to turnover. Our 2021 acquisitions included Paula's Choice and Onnit, helping to re-shape our portfolio into the high growth spaces of Prestige beauty and Functional nutrition respectively. On 18 November 2021, we entered into an agreement to sell our global tea business, ekaterra, to CVC Capital Partners Fund VIII for €4.5 billion on a cash-free, debt-free basis. More details on acquisitions and disposals are in note 21 on pages 161 to 163.
Emerging markets underlying sales grew by 6.7%, driven by India and China. Latin America grew high-single digit, led by price. South East Asia declined following tough Covid-19 restrictions throughout the year. Developed markets underlying sales grew by 1.5% led by a competitive performance in US. Europe grew slightly from both price and volume.
Operating profit was €8.7 billion which included €0.9 billion of non-underlying items, primarily restructuring costs and acquisition and disposal related costs. Restructuring costs of €0.6 billion are comprised of supply chain optimisation projects to improve gross margin and improve network agility, and organisational change projects to reduce overheads.
Underlying operating profit was €9.6 billion, an increase of 2.9%. This included an unfavourable currency impact of 4.3%. Underlying operating margin decreased by 10bps. Gross margin decreased by 120bps reflecting very high inflation in raw material, packaging and distribution costs globally. Brand and marketing investment and overheads contributed 90bps and 20bps to underlying operating margin respectively. There was an improvement in underlying operating margin when excluding currency impact. In line with our multi-year financial framework, we delivered savings of €2 billion and our profit growth was ahead of our underlying sales growth on a comparable basis.
Free cash flow was €6.4 billion compared to €7.7 billion in the prior year. Low levels of capital expenditure and favourable working capital movements in 2020 were not repeated.(a) eCommerce sales are defined as online sales made by Unilever to our
consumers or customers either directly or through platforms as well as an estimate of our brands' sales through our customers' own websites.
Highlights for the year ended
Beauty & Personal Care Foods & Refreshment Home Care Group
2021 2020 2021 2020 2021 2020 2021 2020
Turnover (€ million) 21,901 21,124 19,971 19,140 10,572 10,460 52,444 50,724
Underlying sales growth (%) 3.8 1.2 5.6 1.3 3.9 4.5 4.5 1.9
Underlying volume growth (%) 0.8 1.2 2.9 0.1 0.7 5.1 1.6 1.6
Underlying price growth (%) 3.0 — 2.7 1.1 3.1 -0.6 2.9 0.3
Operating profit (€ million) 4,471 4,311 2,937 2,749 1,294 1,243 8,702 8,303
Underlying operating profit (€ million) 4,742 4,591 3,477 3,257 1,417 1,519 9,636 9,367
Operating margin (%) 20.4 20.4 14.7 14.4 12.2 11.9 16.6 16.4
Underlying operating margin (%) 21.7 21.7 17.4 17.0 13.4 14.5 18.4 18.5
Return on assets (%) 166 140 84 69 172 129 123 102
Free cash flow (€ million) 6,393 7,671
Good performance in a challenging operating environment.
STRA
TEGIC
REP
OR
T – REV
IEW O
F THE Y
EAR
37Unilever Annual Report and Accounts 2021
Divisional review
Beauty & Personal Care
Turnover increased 3.7%. Underlying sales growth was 3.8%, there was a net positive impact of 2.7% from acquisitions and disposals and a negative currency impact of 2.8%.
All categories delivered good growth apart from skin cleansing which declined following the elevated demand in the prior year. Skin care grew high-single digit with channels reopening in 2021. Vaseline performed strongly throughout the year, supported by several premium innovations across brightening, therapeutics and hydration. Deodorants grew as the market continued to recover, with good growth and restored competitiveness in North America. Rexona relaunched its core deodorant range with 72-hour non-stop protection against sweat and body odour. Hair care grew mid-single digit, with Sunsilk, Dove and CLEAR contributing and styling in North America restored to competitive growth. Dove grew high-single digit and is now a €5 billion brand. Oral care grew with good performance in South Asia and Africa. Prestige beauty delivered strong double-digit growth in 2021 benefiting from eCommerce and a recovery in beauty channels compared to the prior year. New innovations in Prestige beauty include Dermalogica's biolumin-c and sound sleep cocoon and REN’s zero waste packaging. Prestige beauty reached €1.0 billion turnover in 2021 if we include a full year of Paula’s Choice. Functional nutrition(a) grew double-digit with good growth in Liquid I.V. and Olly, and reached €1.5 billion turnover if we include a full year of Onnit.(a) Includes vitamins, minerals & supplements which is reported in Beauty
& Personal Care and Health Foods Drinks which is reported in Foods & Refreshment.
Underlying operating profit increased by €151 million. This was due to a €169 million impact from the growth in turnover and €18 million due to negative gross margin particularly impacted by high material inflation in palm oil. This was partially offset by reduction in brand and marketing investment although we benefited from efficiencies in advertising production costs. Non-underlying items were €271 million, €9 million lower than the prior year due to lower restructuring costs. Operating profit increased by €160 million.
Foods & Refreshment
Turnover increased 4.3%. Underlying sales growth was 5.6%, there was a net positive impact of 0.6% from acquisitions and disposals and a negative currency impact of 1.8%.
Ice cream grew mid-single digit. Growth was driven by out-of-home products, with in-home ice cream flat as we lapped double-digit prior year growth. Magnum and Ben & Jerry’s each grew high-single digit. Ben & Jerry's is now a €1 billion brand. Our Ice Cream Now business which catered to the rise of 'in-home' eating by quickly delivering our brands to consumers in 35 countries, grew 60% in 2021. Food solutions recovered well, with double-digit growth, although Covid-19 variants continued to drive uncertainty in the out-of-home channel. In-home savoury saw a slight decline in growth, following elevated demand in the prior year. Our largest food brand Knorr grew high-single digit across in-home and out-of-home channels through innovations such as zero salt stock cubes and Rinde Más in Latin America, a plant-based product that extends the yield of meat dishes while adding flavour. Dressings brand Hellmann's grew double-digit for the second consecutive year. Our retained tea business grew double-digit.
Underlying operating profit increased by €220 million. This was due to a €141 million impact from the growth in turnover and €79 million driven by lower overheads and brand and marketing investment as a percentage of turnover, despite a reduction in gross margin as a result of high input cost inflation. Non-underlying items were €540 million, €32 million higher than prior year due to step up in acquisition and disposal related costs partially offset by lower restructuring costs. Operating profit increased by €188 million.
Home Care
Turnover increased 1.1%. Underlying sales growth was 3.9% with a negative currency impact of 2.6%.
In fabric care, mid single-digit growth in fabric cleaning and low-single digit growth in fabric enhancers was led by South Asia and Latin America. We continued to see good innovation performance from dilutable laundry liquids across Latin America, under the OMO brand. Capsule and liquid formats continued to grow well, and in China OMO became the leading capsules brand in traditional retail and second-largest in eCommerce. Underlying sales in home and hygiene declined mid-single digit as we lapped strong performance for hygiene products in 2020, but home and hygiene continued to trade ahead of pre-pandemic levels.
Underlying operating profit decreased by €102 million. This was due to a €16 million positive impact from the growth in turnover which was more than offset by €118 million impact from reduction in gross margin as a result of high cost inflation. This was partially offset by lower brand and marketing investment, following a step up in 2020 as we invested behind high demand hygiene categories. Non-underlying items were €123 million, €153 million lower than prior year due to lower restructuring costs. Operating profit increased by €51 million.
In focusOur multi-year financial framework
We will deliver long-term value creation by continuing to evolve our portfolio and driving earnings growth, a strong cash flow and a growing dividend. We expect to do this through:
▪ Underlying sales growth ahead of our markets, delivering USG in the range of 3% to 5%
▪ Profit growth ahead of sales growth, on a comparable basis
▪ Sustained strong cash flow over the long term
▪ Savings of €2 billion per year from our well-established Fuel for Growth savings programmes
▪ Restructuring investment of around €1 billion for 2021 and 2022; lower thereafter
▪ Return on invested capital (ROIC) in the mid-to-high teens
▪ Net debt to underlying EBITDA at around 2x
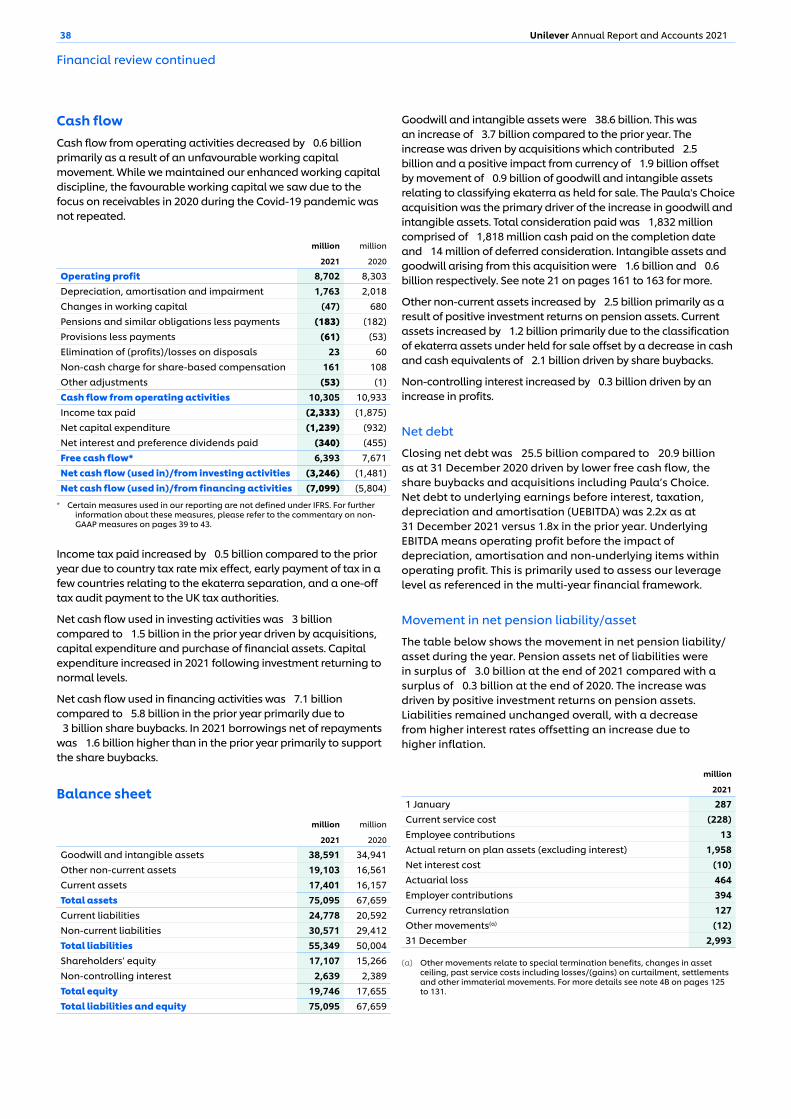
38 Unilever Annual Report and Accounts 2021
Cash flowCash flow from operating activities decreased by €0.6 billion primarily as a result of an unfavourable working capital movement. While we maintained our enhanced working capital discipline, the favourable working capital we saw due to the focus on receivables in 2020 during the Covid-19 pandemic was not repeated.
€ million € million
2021 2020
Operating profit 8,702 8,303Depreciation, amortisation and impairment 1,763 2,018Changes in working capital (47) 680Pensions and similar obligations less payments (183) (182)Provisions less payments (61) (53)Elimination of (profits)/losses on disposals 23 60Non-cash charge for share-based compensation 161 108Other adjustments (53) (1)Cash flow from operating activities 10,305 10,933Income tax paid (2,333) (1,875)Net capital expenditure (1,239) (932)Net interest and preference dividends paid (340) (455)Free cash flow* 6,393 7,671Net cash flow (used in)/from investing activities (3,246) (1,481)Net cash flow (used in)/from financing activities (7,099) (5,804)
* Certain measures used in our reporting are not defined under IFRS. For further information about these measures, please refer to the commentary on non-GAAP measures on pages 39 to 43.
Income tax paid increased by €0.5 billion compared to the prior year due to country tax rate mix effect, early payment of tax in a few countries relating to the ekaterra separation, and a one-off tax audit payment to the UK tax authorities.
Net cash flow used in investing activities was €3 billion compared to €1.5 billion in the prior year driven by acquisitions, capital expenditure and purchase of financial assets. Capital expenditure increased in 2021 following investment returning to normal levels.
Net cash flow used in financing activities was €7.1 billion compared to €5.8 billion in the prior year primarily due to €3 billion share buybacks. In 2021 borrowings net of repayments was €1.6 billion higher than in the prior year primarily to support the share buybacks.
Balance sheet
€ million € million
2021 2020
Goodwill and intangible assets 38,591 34,941Other non-current assets 19,103 16,561Current assets 17,401 16,157Total assets 75,095 67,659Current liabilities 24,778 20,592Non-current liabilities 30,571 29,412Total liabilities 55,349 50,004Shareholders’ equity 17,107 15,266Non-controlling interest 2,639 2,389Total equity 19,746 17,655Total liabilities and equity 75,095 67,659
Goodwill and intangible assets were €38.6 billion. This was an increase of €3.7 billion compared to the prior year. The increase was driven by acquisitions which contributed €2.5 billion and a positive impact from currency of €1.9 billion offset by movement of €0.9 billion of goodwill and intangible assets relating to classifying ekaterra as held for sale. The Paula's Choice acquisition was the primary driver of the increase in goodwill and intangible assets. Total consideration paid was €1,832 million comprised of €1,818 million cash paid on the completion date and €14 million of deferred consideration. Intangible assets and goodwill arising from this acquisition were €1.6 billion and €0.6 billion respectively. See note 21 on pages 161 to 163 for more.
Other non-current assets increased by €2.5 billion primarily as a result of positive investment returns on pension assets. Current assets increased by €1.2 billion primarily due to the classification of ekaterra assets under held for sale offset by a decrease in cash and cash equivalents of €2.1 billion driven by share buybacks.
Non-controlling interest increased by €0.3 billion driven by an increase in profits.
Net debt
Closing net debt was €25.5 billion compared to €20.9 billion as at 31 December 2020 driven by lower free cash flow, the share buybacks and acquisitions including Paula’s Choice. Net debt to underlying earnings before interest, taxation, depreciation and amortisation (UEBITDA) was 2.2x as at 31 December 2021 versus 1.8x in the prior year. Underlying EBITDA means operating profit before the impact of depreciation, amortisation and non-underlying items within operating profit. This is primarily used to assess our leverage level as referenced in the multi-year financial framework.
Movement in net pension liability/asset
The table below shows the movement in net pension liability/asset during the year. Pension assets net of liabilities were in surplus of €3.0 billion at the end of 2021 compared with a surplus of €0.3 billion at the end of 2020. The increase was driven by positive investment returns on pension assets. Liabilities remained unchanged overall, with a decrease from higher interest rates offsetting an increase due to higher inflation.
€ million
2021
1 January 287Current service cost (228)Employee contributions 13Actual return on plan assets (excluding interest) 1,958Net interest cost (10)Actuarial loss 464Employer contributions 394Currency retranslation 127Other movements(a) (12)31 December 2,993
(a) Other movements relate to special termination benefits, changes in asset ceiling, past service costs including losses/(gains) on curtailment, settlements and other immaterial movements. For more details see note 4B on pages 125 to 131.
Financial review continued
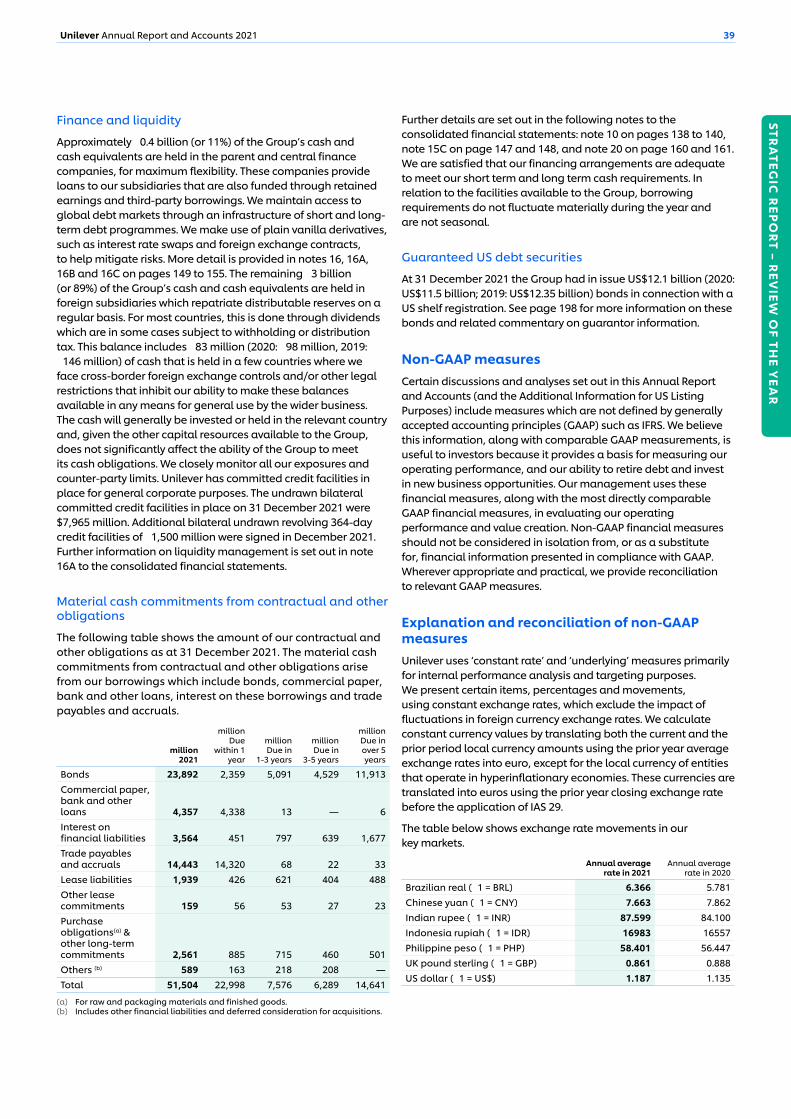
STRA
TEGIC
REP
OR
T – REV
IEW O
F THE Y
EAR
39Unilever Annual Report and Accounts 2021
Finance and liquidity
Approximately €0.4 billion (or 11%) of the Group’s cash and cash equivalents are held in the parent and central finance companies, for maximum flexibility. These companies provide loans to our subsidiaries that are also funded through retained earnings and third-party borrowings. We maintain access to global debt markets through an infrastructure of short and long-term debt programmes. We make use of plain vanilla derivatives, such as interest rate swaps and foreign exchange contracts, to help mitigate risks. More detail is provided in notes 16, 16A, 16B and 16C on pages 149 to 155. The remaining €3 billion (or 89%) of the Group’s cash and cash equivalents are held in foreign subsidiaries which repatriate distributable reserves on a regular basis. For most countries, this is done through dividends which are in some cases subject to withholding or distribution tax. This balance includes €83 million (2020: €98 million, 2019: €146 million) of cash that is held in a few countries where we face cross-border foreign exchange controls and/or other legal restrictions that inhibit our ability to make these balances available in any means for general use by the wider business. The cash will generally be invested or held in the relevant country and, given the other capital resources available to the Group, does not significantly affect the ability of the Group to meet its cash obligations. We closely monitor all our exposures and counter-party limits. Unilever has committed credit facilities in place for general corporate purposes. The undrawn bilateral committed credit facilities in place on 31 December 2021 were $7,965 million. Additional bilateral undrawn revolving 364-day credit facilities of €1,500 million were signed in December 2021. Further information on liquidity management is set out in note 16A to the consolidated financial statements.
Material cash commitments from contractual and other obligations
The following table shows the amount of our contractual and other obligations as at 31 December 2021. The material cash commitments from contractual and other obligations arise from our borrowings which include bonds, commercial paper, bank and other loans, interest on these borrowings and trade payables and accruals.
€ million2021
€ millionDue
within 1 year
€ millionDue in
1-3 years
€ millionDue in
3-5 years
€ millionDue in over 5 years
Bonds 23,892 2,359 5,091 4,529 11,913Commercial paper, bank and other loans 4,357 4,338 13 — 6Interest on financial liabilities 3,564 451 797 639 1,677Trade payables and accruals 14,443 14,320 68 22 33Lease liabilities 1,939 426 621 404 488Other lease commitments 159 56 53 27 23Purchase obligations(a) & other long-term commitments 2,561 885 715 460 501Others (b) 589 163 218 208 —Total 51,504 22,998 7,576 6,289 14,641
(a) For raw and packaging materials and finished goods.(b) Includes other financial liabilities and deferred consideration for acquisitions.
Further details are set out in the following notes to the consolidated financial statements: note 10 on pages 138 to 140, note 15C on page 147 and 148, and note 20 on page 160 and 161. We are satisfied that our financing arrangements are adequate to meet our short term and long term cash requirements. In relation to the facilities available to the Group, borrowing requirements do not fluctuate materially during the year and are not seasonal.
Guaranteed US debt securities
At 31 December 2021 the Group had in issue US$12.1 billion (2020: US$11.5 billion; 2019: US$12.35 billion) bonds in connection with a US shelf registration. See page 198 for more information on these bonds and related commentary on guarantor information.
Non-GAAP measuresCertain discussions and analyses set out in this Annual Report and Accounts (and the Additional Information for US Listing Purposes) include measures which are not defined by generally accepted accounting principles (GAAP) such as IFRS. We believe this information, along with comparable GAAP measurements, is useful to investors because it provides a basis for measuring our operating performance, and our ability to retire debt and invest in new business opportunities. Our management uses these financial measures, along with the most directly comparable GAAP financial measures, in evaluating our operating performance and value creation. Non-GAAP financial measures should not be considered in isolation from, or as a substitute for, financial information presented in compliance with GAAP. Wherever appropriate and practical, we provide reconciliation to relevant GAAP measures.
Explanation and reconciliation of non-GAAP measuresUnilever uses ‘constant rate’ and ‘underlying’ measures primarily for internal performance analysis and targeting purposes. We present certain items, percentages and movements, using constant exchange rates, which exclude the impact of fluctuations in foreign currency exchange rates. We calculate constant currency values by translating both the current and the prior period local currency amounts using the prior year average exchange rates into euro, except for the local currency of entities that operate in hyperinflationary economies. These currencies are translated into euros using the prior year closing exchange rate before the application of IAS 29.
The table below shows exchange rate movements in our key markets.
Annual average rate in 2021
Annual average rate in 2020
Brazilian real (€1 = BRL) 6.366 5.781Chinese yuan (€1 = CNY) 7.663 7.862Indian rupee (€1 = INR) 87.599 84.100Indonesia rupiah (€1 = IDR) 16983 16557Philippine peso (€1 = PHP) 58.401 56.447UK pound sterling (€1 = GBP) 0.861 0.888US dollar (€1 = US$) 1.187 1.135
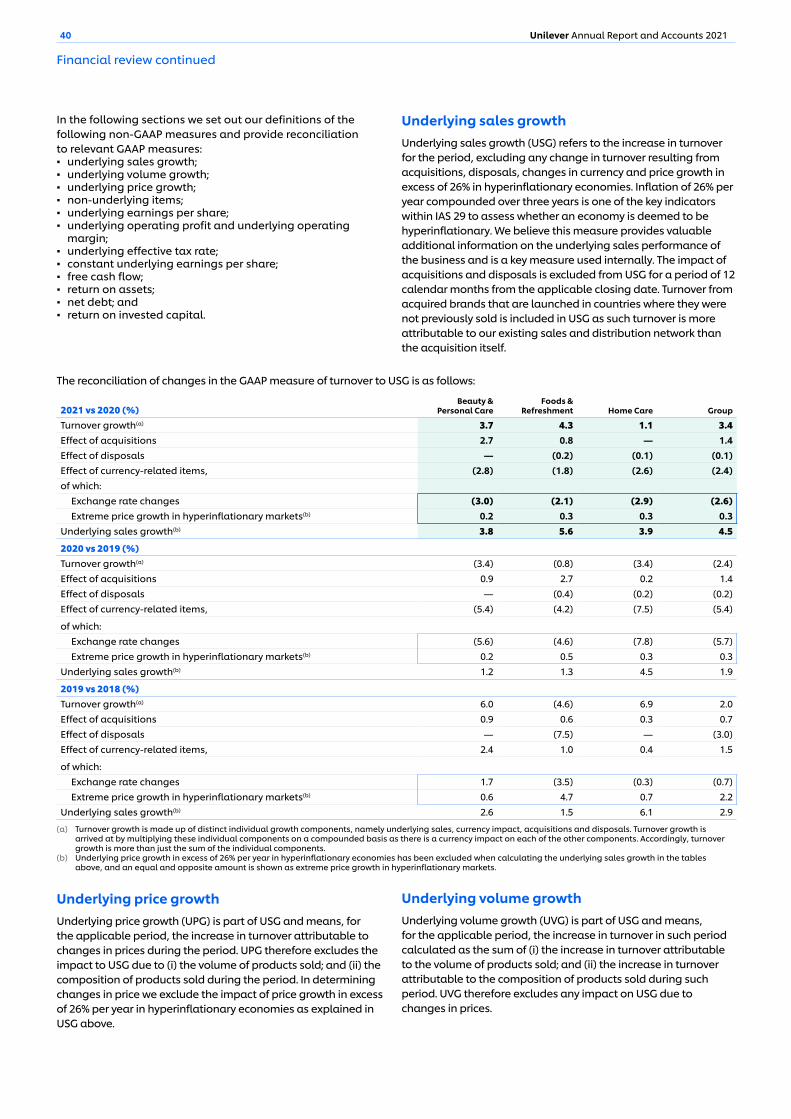
40 Unilever Annual Report and Accounts 2021
Underlying price growthUnderlying price growth (UPG) is part of USG and means, for the applicable period, the increase in turnover attributable to changes in prices during the period. UPG therefore excludes the impact to USG due to (i) the volume of products sold; and (ii) the composition of products sold during the period. In determining changes in price we exclude the impact of price growth in excess of 26% per year in hyperinflationary economies as explained in USG above.
Underlying volume growthUnderlying volume growth (UVG) is part of USG and means, for the applicable period, the increase in turnover in such period calculated as the sum of (i) the increase in turnover attributable to the volume of products sold; and (ii) the increase in turnover attributable to the composition of products sold during such period. UVG therefore excludes any impact on USG due to changes in prices.
In the following sections we set out our definitions of the following non-GAAP measures and provide reconciliation to relevant GAAP measures: ▪ underlying sales growth; ▪ underlying volume growth; ▪ underlying price growth; ▪ non-underlying items; ▪ underlying earnings per share; ▪ underlying operating profit and underlying operating
margin; ▪ underlying effective tax rate; ▪ constant underlying earnings per share; ▪ free cash flow; ▪ return on assets; ▪ net debt; and ▪ return on invested capital.
Financial review continued
Underlying sales growthUnderlying sales growth (USG) refers to the increase in turnover for the period, excluding any change in turnover resulting from acquisitions, disposals, changes in currency and price growth in excess of 26% in hyperinflationary economies. Inflation of 26% per year compounded over three years is one of the key indicators within IAS 29 to assess whether an economy is deemed to be hyperinflationary. We believe this measure provides valuable additional information on the underlying sales performance of the business and is a key measure used internally. The impact of acquisitions and disposals is excluded from USG for a period of 12 calendar months from the applicable closing date. Turnover from acquired brands that are launched in countries where they were not previously sold is included in USG as such turnover is more attributable to our existing sales and distribution network than the acquisition itself.
The reconciliation of changes in the GAAP measure of turnover to USG is as follows:
2021 vs 2020 (%)Beauty &
Personal CareFoods &
Refreshment Home Care Group
Turnover growth(a) 3.7 4.3 1.1 3.4Effect of acquisitions 2.7 0.8 — 1.4Effect of disposals — (0.2) (0.1) (0.1)Effect of currency-related items, (2.8) (1.8) (2.6) (2.4)of which:
Exchange rate changes (3.0) (2.1) (2.9) (2.6)Extreme price growth in hyperinflationary markets(b) 0.2 0.3 0.3 0.3
Underlying sales growth(b) 3.8 5.6 3.9 4.5
2020 vs 2019 (%)Turnover growth(a) (3.4) (0.8) (3.4) (2.4)Effect of acquisitions 0.9 2.7 0.2 1.4Effect of disposals — (0.4) (0.2) (0.2)Effect of currency-related items, (5.4) (4.2) (7.5) (5.4)
of which:Exchange rate changes (5.6) (4.6) (7.8) (5.7)Extreme price growth in hyperinflationary markets(b) 0.2 0.5 0.3 0.3
Underlying sales growth(b) 1.2 1.3 4.5 1.9
2019 vs 2018 (%)Turnover growth(a) 6.0 (4.6) 6.9 2.0Effect of acquisitions 0.9 0.6 0.3 0.7Effect of disposals — (7.5) — (3.0)Effect of currency-related items, 2.4 1.0 0.4 1.5
of which:Exchange rate changes 1.7 (3.5) (0.3) (0.7)Extreme price growth in hyperinflationary markets(b) 0.6 4.7 0.7 2.2
Underlying sales growth(b) 2.6 1.5 6.1 2.9
(a) Turnover growth is made up of distinct individual growth components, namely underlying sales, currency impact, acquisitions and disposals. Turnover growth is arrived at by multiplying these individual components on a compounded basis as there is a currency impact on each of the other components. Accordingly, turnover growth is more than just the sum of the individual components.
(b) Underlying price growth in excess of 26% per year in hyperinflationary economies has been excluded when calculating the underlying sales growth in the tables above, and an equal and opposite amount is shown as extreme price growth in hyperinflationary markets.
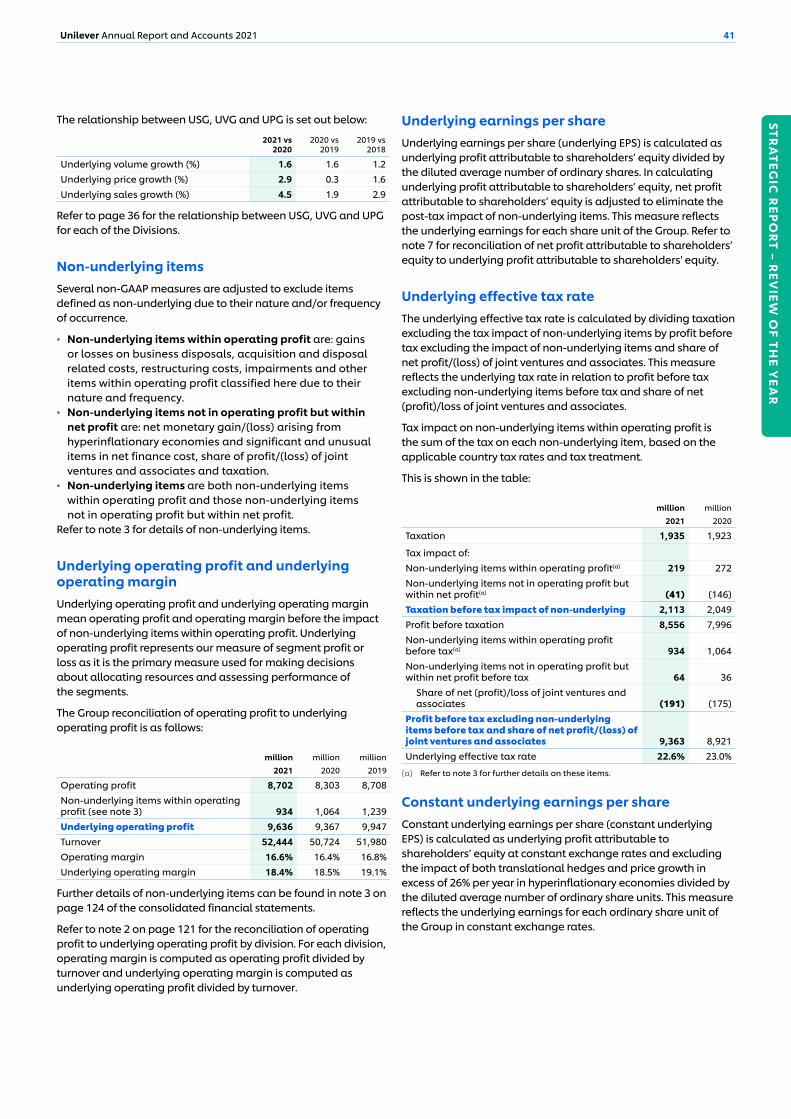
STRA
TEGIC
REP
OR
T – REV
IEW O
F THE Y
EAR
41Unilever Annual Report and Accounts 2021
The relationship between USG, UVG and UPG is set out below:
2021 vs 2020
2020 vs 2019
2019 vs 2018
Underlying volume growth (%) 1.6 1.6 1.2Underlying price growth (%) 2.9 0.3 1.6Underlying sales growth (%) 4.5 1.9 2.9
Refer to page 36 for the relationship between USG, UVG and UPG for each of the Divisions.
Non-underlying itemsSeveral non-GAAP measures are adjusted to exclude items defined as non-underlying due to their nature and/or frequency of occurrence.
▪ Non-underlying items within operating profit are: gains or losses on business disposals, acquisition and disposal related costs, restructuring costs, impairments and other items within operating profit classified here due to their nature and frequency.
▪ Non-underlying items not in operating profit but within net profit are: net monetary gain/(loss) arising from hyperinflationary economies and significant and unusual items in net finance cost, share of profit/(loss) of joint ventures and associates and taxation.
▪ Non-underlying items are both non-underlying items within operating profit and those non-underlying items not in operating profit but within net profit.
Refer to note 3 for details of non-underlying items.
Underlying operating profit and underlying operating marginUnderlying operating profit and underlying operating margin mean operating profit and operating margin before the impact of non-underlying items within operating profit. Underlying operating profit represents our measure of segment profit or loss as it is the primary measure used for making decisions about allocating resources and assessing performance of the segments.
The Group reconciliation of operating profit to underlying operating profit is as follows:
€ million € million € million2021 2020 2019
Operating profit 8,702 8,303 8,708Non-underlying items within operating profit (see note 3) 934 1,064 1,239Underlying operating profit 9,636 9,367 9,947Turnover 52,444 50,724 51,980Operating margin 16.6% 16.4% 16.8%Underlying operating margin 18.4% 18.5% 19.1%
Further details of non-underlying items can be found in note 3 on page 124 of the consolidated financial statements.
Refer to note 2 on page 121 for the reconciliation of operating profit to underlying operating profit by division. For each division, operating margin is computed as operating profit divided by turnover and underlying operating margin is computed as underlying operating profit divided by turnover.
Underlying earnings per shareUnderlying earnings per share (underlying EPS) is calculated as underlying profit attributable to shareholders’ equity divided by the diluted average number of ordinary shares. In calculating underlying profit attributable to shareholders’ equity, net profit attributable to shareholders’ equity is adjusted to eliminate the post-tax impact of non-underlying items. This measure reflects the underlying earnings for each share unit of the Group. Refer to note 7 for reconciliation of net profit attributable to shareholders’ equity to underlying profit attributable to shareholders' equity.
Underlying effective tax rateThe underlying effective tax rate is calculated by dividing taxation excluding the tax impact of non-underlying items by profit before tax excluding the impact of non-underlying items and share of net profit/(loss) of joint ventures and associates. This measure reflects the underlying tax rate in relation to profit before tax excluding non-underlying items before tax and share of net (profit)/loss of joint ventures and associates.
Tax impact on non-underlying items within operating profit is the sum of the tax on each non-underlying item, based on the applicable country tax rates and tax treatment.
This is shown in the table:
€ million € million2021 2020
Taxation 1,935 1,923
Tax impact of:Non-underlying items within operating profit(a) 219 272Non-underlying items not in operating profit but within net profit(a) (41) (146)Taxation before tax impact of non-underlying 2,113 2,049Profit before taxation 8,556 7,996Non-underlying items within operating profit before tax(a) 934 1,064Non-underlying items not in operating profit but within net profit before tax 64 36
Share of net (profit)/loss of joint ventures and associates (191) (175)
Profit before tax excluding non-underlying items before tax and share of net profit/(loss) of joint ventures and associates 9,363 8,921Underlying effective tax rate 22.6% 23.0%
(a) Refer to note 3 for further details on these items.
Constant underlying earnings per shareConstant underlying earnings per share (constant underlying EPS) is calculated as underlying profit attributable to shareholders’ equity at constant exchange rates and excluding the impact of both translational hedges and price growth in excess of 26% per year in hyperinflationary economies divided by the diluted average number of ordinary share units. This measure reflects the underlying earnings for each ordinary share unit of the Group in constant exchange rates.
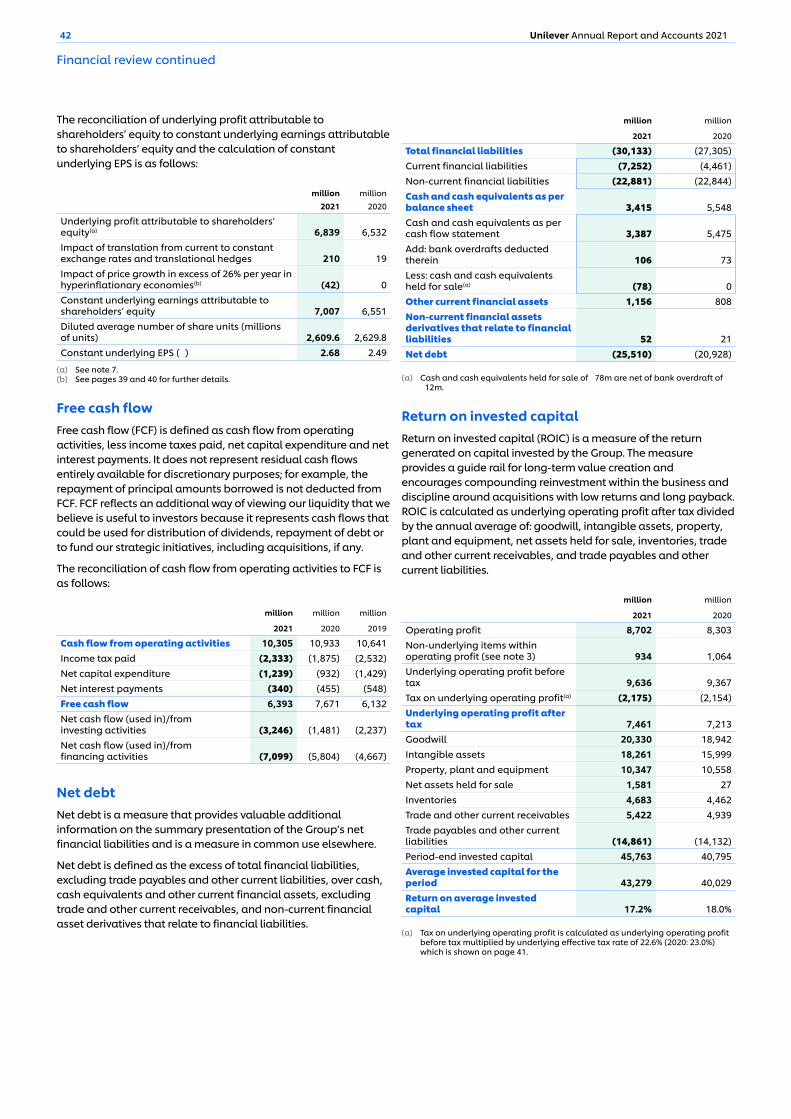
42 Unilever Annual Report and Accounts 2021
The reconciliation of underlying profit attributable to shareholders’ equity to constant underlying earnings attributable to shareholders’ equity and the calculation of constant underlying EPS is as follows:
€ million € million2021 2020
Underlying profit attributable to shareholders’ equity(a) 6,839 6,532Impact of translation from current to constant exchange rates and translational hedges 210 19Impact of price growth in excess of 26% per year in hyperinflationary economies(b) (42) 0Constant underlying earnings attributable to shareholders’ equity 7,007 6,551Diluted average number of share units (millions of units) 2,609.6 2,629.8Constant underlying EPS (€) 2.68 2.49
(a) See note 7.(b) See pages 39 and 40 for further details.
Free cash flowFree cash flow (FCF) is defined as cash flow from operating activities, less income taxes paid, net capital expenditure and net interest payments. It does not represent residual cash flows entirely available for discretionary purposes; for example, the repayment of principal amounts borrowed is not deducted from FCF. FCF reflects an additional way of viewing our liquidity that we believe is useful to investors because it represents cash flows that could be used for distribution of dividends, repayment of debt or to fund our strategic initiatives, including acquisitions, if any.
The reconciliation of cash flow from operating activities to FCF is as follows:
€ million € million € million
2021 2020 2019
Cash flow from operating activities 10,305 10,933 10,641Income tax paid (2,333) (1,875) (2,532)Net capital expenditure (1,239) (932) (1,429)Net interest payments (340) (455) (548)Free cash flow 6,393 7,671 6,132Net cash flow (used in)/from investing activities (3,246) (1,481) (2,237)Net cash flow (used in)/from financing activities (7,099) (5,804) (4,667)
Net debtNet debt is a measure that provides valuable additional information on the summary presentation of the Group’s net financial liabilities and is a measure in common use elsewhere.
Net debt is defined as the excess of total financial liabilities, excluding trade payables and other current liabilities, over cash, cash equivalents and other current financial assets, excluding trade and other current receivables, and non-current financial asset derivatives that relate to financial liabilities.
€ million € million
2021 2020
Total financial liabilities (30,133) (27,305)Current financial liabilities (7,252) (4,461)Non-current financial liabilities (22,881) (22,844)Cash and cash equivalents as per balance sheet 3,415 5,548Cash and cash equivalents as per cash flow statement 3,387 5,475Add: bank overdrafts deducted therein 106 73Less: cash and cash equivalents held for sale(a) (78) 0Other current financial assets 1,156 808Non-current financial assets derivatives that relate to financial liabilities 52 21Net debt (25,510) (20,928)
(a) Cash and cash equivalents held for sale of €78m are net of bank overdraft of €12m.
Return on invested capitalReturn on invested capital (ROIC) is a measure of the return generated on capital invested by the Group. The measure provides a guide rail for long-term value creation and encourages compounding reinvestment within the business and discipline around acquisitions with low returns and long payback. ROIC is calculated as underlying operating profit after tax divided by the annual average of: goodwill, intangible assets, property, plant and equipment, net assets held for sale, inventories, trade and other current receivables, and trade payables and other current liabilities.
€ million € million
2021 2020
Operating profit 8,702 8,303Non-underlying items within operating profit (see note 3) 934 1,064Underlying operating profit before tax 9,636 9,367Tax on underlying operating profit(a) (2,175) (2,154)Underlying operating profit after tax 7,461 7,213Goodwill 20,330 18,942Intangible assets 18,261 15,999Property, plant and equipment 10,347 10,558Net assets held for sale 1,581 27Inventories 4,683 4,462Trade and other current receivables 5,422 4,939Trade payables and other current liabilities (14,861) (14,132)Period-end invested capital 45,763 40,795Average invested capital for the period 43,279 40,029Return on average invested capital 17.2% 18.0%
(a) Tax on underlying operating profit is calculated as underlying operating profit before tax multiplied by underlying effective tax rate of 22.6% (2020: 23.0%) which is shown on page 41.
Financial review continued
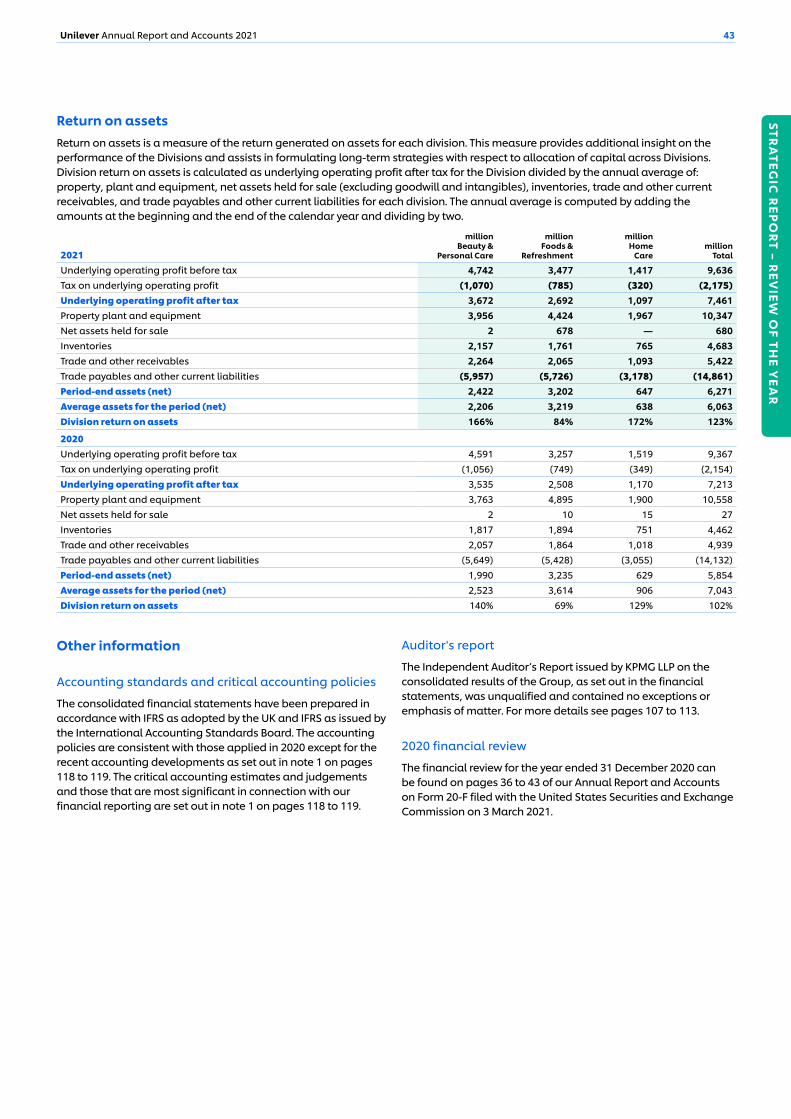
STRA
TEGIC
REP
OR
T – REV
IEW O
F THE Y
EAR
43Unilever Annual Report and Accounts 2021
Return on assetsReturn on assets is a measure of the return generated on assets for each division. This measure provides additional insight on the performance of the Divisions and assists in formulating long-term strategies with respect to allocation of capital across Divisions. Division return on assets is calculated as underlying operating profit after tax for the Division divided by the annual average of: property, plant and equipment, net assets held for sale (excluding goodwill and intangibles), inventories, trade and other current receivables, and trade payables and other current liabilities for each division. The annual average is computed by adding the amounts at the beginning and the end of the calendar year and dividing by two.
2021
€ million Beauty &
Personal Care
€ million Foods &
Refreshment
€ million Home
Care€ million
Total
Underlying operating profit before tax 4,742 3,477 1,417 9,636Tax on underlying operating profit (1,070) (785) (320) (2,175)Underlying operating profit after tax 3,672 2,692 1,097 7,461Property plant and equipment 3,956 4,424 1,967 10,347Net assets held for sale 2 678 — 680Inventories 2,157 1,761 765 4,683Trade and other receivables 2,264 2,065 1,093 5,422Trade payables and other current liabilities (5,957) (5,726) (3,178) (14,861)Period-end assets (net) 2,422 3,202 647 6,271Average assets for the period (net) 2,206 3,219 638 6,063Division return on assets 166% 84% 172% 123%
2020Underlying operating profit before tax 4,591 3,257 1,519 9,367Tax on underlying operating profit (1,056) (749) (349) (2,154)Underlying operating profit after tax 3,535 2,508 1,170 7,213Property plant and equipment 3,763 4,895 1,900 10,558Net assets held for sale 2 10 15 27Inventories 1,817 1,894 751 4,462Trade and other receivables 2,057 1,864 1,018 4,939Trade payables and other current liabilities (5,649) (5,428) (3,055) (14,132)Period-end assets (net) 1,990 3,235 629 5,854Average assets for the period (net) 2,523 3,614 906 7,043Division return on assets 140% 69% 129% 102%
Other information
Accounting standards and critical accounting policies
The consolidated financial statements have been prepared in accordance with IFRS as adopted by the UK and IFRS as issued by the International Accounting Standards Board. The accounting policies are consistent with those applied in 2020 except for the recent accounting developments as set out in note 1 on pages 118 to 119. The critical accounting estimates and judgements and those that are most significant in connection with our financial reporting are set out in note 1 on pages 118 to 119.
Auditor's report
The Independent Auditor’s Report issued by KPMG LLP on the consolidated results of the Group, as set out in the financial statements, was unqualified and contained no exceptions or emphasis of matter. For more details see pages 107 to 113.
2020 financial review
The financial review for the year ended 31 December 2020 can be found on pages 36 to 43 of our Annual Report and Accounts on Form 20-F filed with the United States Securities and Exchange Commission on 3 March 2021.
44 Unilever Annual Report and Accounts 2021
Our risksOur risk appetite and approach to risk managementRisk management is integral to Unilever’s strategy and to the achievement of Unilever’s long-term goals. Our success as an organisation depends on our ability to identify and exploit the opportunities generated by our business and in our markets. In doing this, we take an embedded approach to risk management which puts risk and opportunity assessment at the core of the Board agenda, which is where we believe it should be.
Unilever’s appetite for risk is driven by the following: ▪ Our growth should be consistent, competitive, profitable
and responsible. ▪ Our actions on issues such as plastic and climate change
must reflect their urgency, and not be constrained by the uncertainty of potential impacts.
▪ Our behaviours must be in line with our Code of Business Principles and Code Policies.
▪ Our ambition to continuously improve our operational efficiency and effectiveness.
▪ Our aim to maintain a minimum A/A2 credit rating on a long-term basis.
Our approach to risk management is designed to provide reasonable, but not absolute, assurance that our assets are safeguarded, the risks facing the business are being assessed and mitigated, and all information that may be required to be disclosed is reported to Unilever’s senior management including, where appropriate, the CEO and CFO.
OrganisationThe Board has overall accountability for the management of risk and for reviewing the effectiveness of Unilever’s risk management and internal control systems. The Board has established a clear organisational structure with well-defined accountabilities for the principal risks that Unilever faces in the short, medium and long term. This organisational structure and distribution of accountabilities and responsibilities ensure that every country in which we operate has specific resources and processes for risk reviews and risk mitigation. This is supported by the ULE, which takes active responsibility for focusing on the principal areas of risk to Unilever. The Board regularly review these risk areas, including consideration of environmental, social and governance matters, and retain responsibility for determining the nature and extent of the significant risks that Unilever is prepared to take to achieve its strategic objectives.
Foundation and principlesUnilever’s approach to doing business is framed by our purpose and values (see pages 8 to 9). Our Code of Business Principles sets out the standards of behaviour that we expect all employees to adhere to. Day-to-day responsibility for ensuring these principles are applied rests with senior management across Divisions, geographies and functions.
A network of Business Integrity Officers and Committees supports the activities necessary to communicate the Code, deliver training, maintain processes and procedures (including support lines) to report and respond to alleged breaches, and to capture and communicate learnings.
We have a framework of Code Policies that underpins the Code of Business Principles and sets out the non-negotiable standards of behaviour expected from all our employees.
For each of our principal risks we have a risk management framework detailing the controls we have in place and who is responsible for managing both the overall risk and the individual controls mitigating that risk. Unilever’s functional standards define mandatory requirements across a range of specialist areas, which are key controls in mitigating these risks. Examples include health and safety, accounting and reporting, and financial risk management.
Our assessment of risk considers both short- and long-term risks, including how these risks are changing, together with emerging risk areas. These are reviewed on an ongoing basis, and formally by senior management and the Board at least once a year.
ProcessesUnilever operates a wide range of processes and activities across all its operations covering strategy, planning, execution and performance management. Risk management is integrated into every stage.
Assurance and re-assuranceAssurance on compliance with the Code of Business Principles and all of our Code Policies is obtained annually from Unilever management via a formal Code declaration. In addition, there are specialist awareness and training programmes which are run throughout the year and vary depending on the business priorities. These specialist compliance programmes supplement the Code declaration. Our Corporate Audit function plays a vital role in providing to both management and the Board an objective and independent review of the effectiveness of risk management and internal control systems throughout Unilever.
Board assessment of compliance with the risk management frameworksThe Board, advised by the Committees where appropriate, regularly review the significant risks and decisions that could have a material impact on Unilever. These reviews consider the level of risk that Unilever is prepared to take in pursuit of the business strategy and the effectiveness of the management controls in place to mitigate the risk exposure.
The Board, through the Audit Committee, has reviewed the assessment of risks, internal controls and disclosure controls and procedures in operation within Unilever. They have also considered the effectiveness of any remedial actions taken for the year covered by this Annual Report and Accounts and up to the date of its approval by the Board.
Details of the activities of the Audit Committee in relation to this can be found in the Report of the Audit Committee on pages 78 to 79.
Further statements on compliance with the specific risk management and control requirements in the UK Corporate Governance Code and the US Securities Exchange Act (1934) and the US Sarbanes-Oxley Act (2002) can be found on page 77.
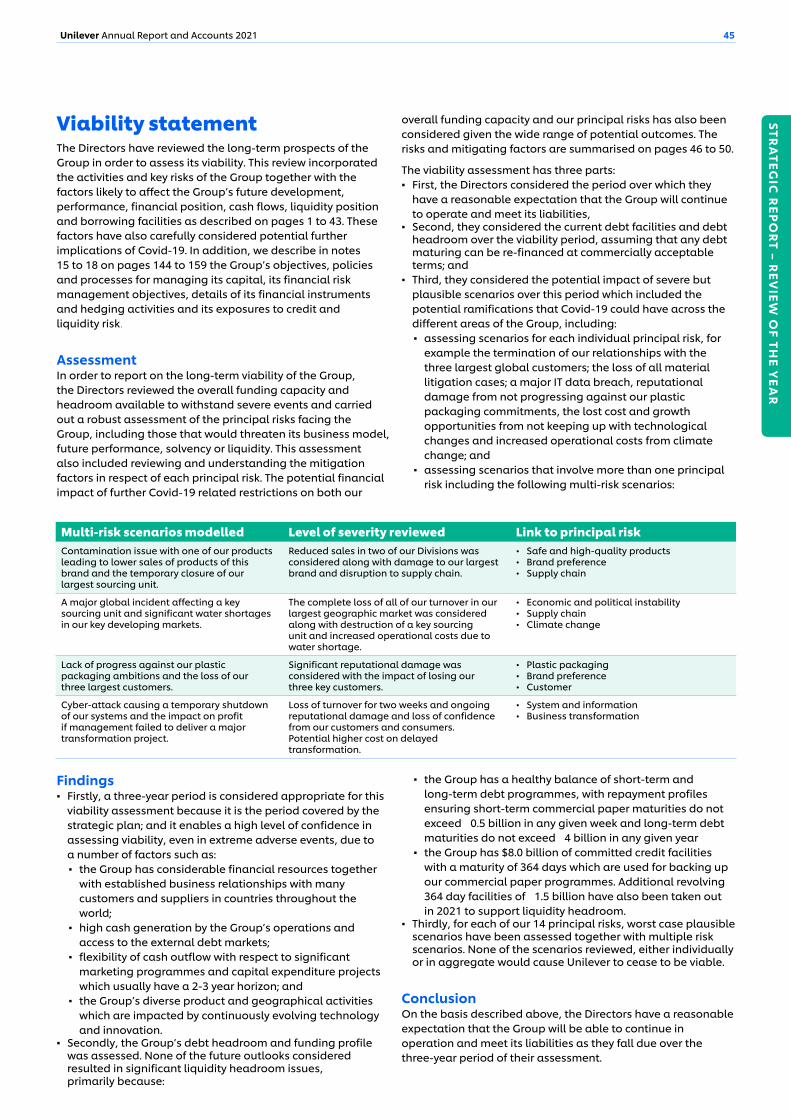
STRA
TEGIC
REP
OR
T – REV
IEW O
F THE Y
EAR
45Unilever Annual Report and Accounts 2021
Viability statementThe Directors have reviewed the long-term prospects of the Group in order to assess its viability. This review incorporated the activities and key risks of the Group together with the factors likely to affect the Group’s future development, performance, financial position, cash flows, liquidity position and borrowing facilities as described on pages 1 to 43. These factors have also carefully considered potential further implications of Covid-19. In addition, we describe in notes 15 to 18 on pages 144 to 159 the Group’s objectives, policies and processes for managing its capital, its financial risk management objectives, details of its financial instruments and hedging activities and its exposures to credit and liquidity risk.
AssessmentIn order to report on the long-term viability of the Group, the Directors reviewed the overall funding capacity and headroom available to withstand severe events and carried out a robust assessment of the principal risks facing the Group, including those that would threaten its business model, future performance, solvency or liquidity. This assessment also included reviewing and understanding the mitigation factors in respect of each principal risk. The potential financial impact of further Covid-19 related restrictions on both our
overall funding capacity and our principal risks has also been considered given the wide range of potential outcomes. The risks and mitigating factors are summarised on pages 46 to 50.
The viability assessment has three parts: ▪ First, the Directors considered the period over which they
have a reasonable expectation that the Group will continue to operate and meet its liabilities,
▪ Second, they considered the current debt facilities and debt headroom over the viability period, assuming that any debt maturing can be re-financed at commercially acceptable terms; and
▪ Third, they considered the potential impact of severe but plausible scenarios over this period which included the potential ramifications that Covid-19 could have across the different areas of the Group, including: ▪ assessing scenarios for each individual principal risk, for
example the termination of our relationships with the three largest global customers; the loss of all material litigation cases; a major IT data breach, reputational damage from not progressing against our plastic packaging commitments, the lost cost and growth opportunities from not keeping up with technological changes and increased operational costs from climate change; and
▪ assessing scenarios that involve more than one principal risk including the following multi-risk scenarios:
Multi-risk scenarios modelled Level of severity reviewed Link to principal riskContamination issue with one of our products leading to lower sales of products of this brand and the temporary closure of our largest sourcing unit.
Reduced sales in two of our Divisions was considered along with damage to our largest brand and disruption to supply chain.
• Safe and high-quality products• Brand preference• Supply chain
A major global incident affecting a key sourcing unit and significant water shortages in our key developing markets.
The complete loss of all of our turnover in our largest geographic market was considered along with destruction of a key sourcing unit and increased operational costs due to water shortage.
• Economic and political instability• Supply chain• Climate change
Lack of progress against our plastic packaging ambitions and the loss of our three largest customers.
Significant reputational damage was considered with the impact of losing our three key customers.
• Plastic packaging• Brand preference• Customer
Cyber-attack causing a temporary shutdown of our systems and the impact on profit if management failed to deliver a major transformation project.
Loss of turnover for two weeks and ongoing reputational damage and loss of confidence from our customers and consumers.Potential higher cost on delayed transformation.
• System and information • Business transformation
Findings ▪ Firstly, a three-year period is considered appropriate for this
viability assessment because it is the period covered by the strategic plan; and it enables a high level of confidence in assessing viability, even in extreme adverse events, due to a number of factors such as: ▪ the Group has considerable financial resources together
with established business relationships with many customers and suppliers in countries throughout the world;
▪ high cash generation by the Group’s operations and access to the external debt markets;
▪ flexibility of cash outflow with respect to significant marketing programmes and capital expenditure projects which usually have a 2-3 year horizon; and
▪ the Group’s diverse product and geographical activities which are impacted by continuously evolving technology and innovation.
▪ Secondly, the Group’s debt headroom and funding profile was assessed. None of the future outlooks considered resulted in significant liquidity headroom issues, primarily because:
▪ the Group has a healthy balance of short-term and long-term debt programmes, with repayment profiles ensuring short-term commercial paper maturities do not exceed €0.5 billion in any given week and long-term debt maturities do not exceed €4 billion in any given year
▪ the Group has $8.0 billion of committed credit facilities with a maturity of 364 days which are used for backing up our commercial paper programmes. Additional revolving 364 day facilities of €1.5 billion have also been taken out in 2021 to support liquidity headroom.
▪ Thirdly, for each of our 14 principal risks, worst case plausible scenarios have been assessed together with multiple risk scenarios. None of the scenarios reviewed, either individually or in aggregate would cause Unilever to cease to be viable.
ConclusionOn the basis described above, the Directors have a reasonable expectation that the Group will be able to continue in operation and meet its liabilities as they fall due over the three-year period of their assessment.
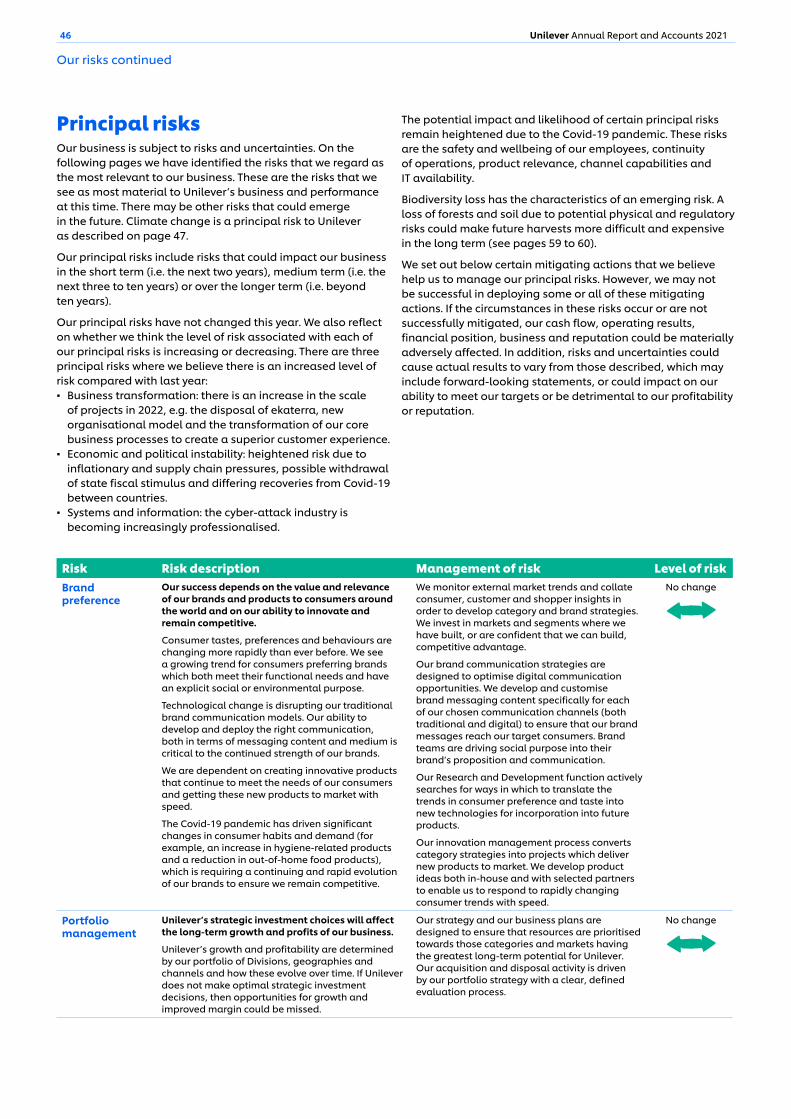
46 Unilever Annual Report and Accounts 2021
Principal risksOur business is subject to risks and uncertainties. On the following pages we have identified the risks that we regard as the most relevant to our business. These are the risks that we see as most material to Unilever’s business and performance at this time. There may be other risks that could emerge in the future. Climate change is a principal risk to Unilever as described on page 47.
Our principal risks include risks that could impact our business in the short term (i.e. the next two years), medium term (i.e. the next three to ten years) or over the longer term (i.e. beyond ten years).
Our principal risks have not changed this year. We also reflect on whether we think the level of risk associated with each of our principal risks is increasing or decreasing. There are three principal risks where we believe there is an increased level of risk compared with last year: ▪ Business transformation: there is an increase in the scale
of projects in 2022, e.g. the disposal of ekaterra, new organisational model and the transformation of our core business processes to create a superior customer experience.
▪ Economic and political instability: heightened risk due to inflationary and supply chain pressures, possible withdrawal of state fiscal stimulus and differing recoveries from Covid-19 between countries.
▪ Systems and information: the cyber-attack industry is becoming increasingly professionalised.
The potential impact and likelihood of certain principal risks remain heightened due to the Covid-19 pandemic. These risks are the safety and wellbeing of our employees, continuity of operations, product relevance, channel capabilities and IT availability.
Biodiversity loss has the characteristics of an emerging risk. A loss of forests and soil due to potential physical and regulatory risks could make future harvests more difficult and expensive in the long term (see pages 59 to 60).
We set out below certain mitigating actions that we believe help us to manage our principal risks. However, we may not be successful in deploying some or all of these mitigating actions. If the circumstances in these risks occur or are not successfully mitigated, our cash flow, operating results, financial position, business and reputation could be materially adversely affected. In addition, risks and uncertainties could cause actual results to vary from those described, which may include forward-looking statements, or could impact on our ability to meet our targets or be detrimental to our profitability or reputation.
Risk Risk description Management of risk Level of riskBrand preference
Our success depends on the value and relevance of our brands and products to consumers around the world and on our ability to innovate and remain competitive.
Consumer tastes, preferences and behaviours are changing more rapidly than ever before. We see a growing trend for consumers preferring brands which both meet their functional needs and have an explicit social or environmental purpose.
Technological change is disrupting our traditional brand communication models. Our ability to develop and deploy the right communication, both in terms of messaging content and medium is critical to the continued strength of our brands.
We are dependent on creating innovative products that continue to meet the needs of our consumers and getting these new products to market with speed.
The Covid-19 pandemic has driven significant changes in consumer habits and demand (for example, an increase in hygiene-related products and a reduction in out-of-home food products), which is requiring a continuing and rapid evolution of our brands to ensure we remain competitive.
We monitor external market trends and collate consumer, customer and shopper insights in order to develop category and brand strategies. We invest in markets and segments where we have built, or are confident that we can build, competitive advantage.
Our brand communication strategies are designed to optimise digital communication opportunities. We develop and customise brand messaging content specifically for each of our chosen communication channels (both traditional and digital) to ensure that our brand messages reach our target consumers. Brand teams are driving social purpose into their brand’s proposition and communication.
Our Research and Development function actively searches for ways in which to translate the trends in consumer preference and taste into new technologies for incorporation into future products.
Our innovation management process converts category strategies into projects which deliver new products to market. We develop product ideas both in-house and with selected partners to enable us to respond to rapidly changing consumer trends with speed.
No change
Portfolio management
Unilever’s strategic investment choices will affect the long-term growth and profits of our business.
Unilever’s growth and profitability are determined by our portfolio of Divisions, geographies and channels and how these evolve over time. If Unilever does not make optimal strategic investment decisions, then opportunities for growth and improved margin could be missed.
Our strategy and our business plans are designed to ensure that resources are prioritised towards those categories and markets having the greatest long-term potential for Unilever. Our acquisition and disposal activity is driven by our portfolio strategy with a clear, defined evaluation process.
No change
Our risks continued

STRA
TEGIC
REP
OR
T – REV
IEW O
F THE Y
EAR
47Unilever Annual Report and Accounts 2021
Risk Risk description Management of risk Level of riskClimate change Climate change and governmental actions to
reduce such change may disrupt our operations and/or reduce consumer demand for our products.
Climate change could impact our business in various ways. Government action to reduce climate change such as the introduction of a carbon tax, land use regulations or product composition regulations which restrict or ban certain GHG intensive ingredients, could impact our business through higher costs or reduced flexibility of operations. Market risks associated with the energy transition and rising energy prices could disrupt our operations and increase costs.
Physical environment risks such as water scarcity could impact our operations or reduce demand for our products that require water during consumer use. Increased frequency of extreme weather events such as high temperatures, hurricanes or floods could cause increased incidence of disruption to our supply chain, manufacturing and distribution network. If we do not take action, climate change could result in increased costs, reduced profit and reduced growth.
We monitor climate change and in 2021 we published our Climate Transition Action Plan which provides details on how we are reducing the carbon intensity of our operations, developing products with a lower carbon footprint or that require less water during consumer use including details of how we will achieve our GHG reduction targets which include net zero emissions across our value chain and zero emissions in our operations.
We are decarbonising our operations through eco-efficiency measures, powering our factories with renewable electricity, transitioning to renewable energy for heating and cooling and replacing climate harmful refrigerants. We invest in new products and formulations so that our products work with less water, poor quality water or no water.
We monitor trends in raw material availability and pricing due to short-term weather impacts to ensure continued availability of input materials and integrate weather system modelling into our forecasting process.
We also monitor government policy and actions to combat climate change and take proactive action to minimise the impact on our business and advocate for changes to public policy frameworks consistent with the 1.5°C ambition of the Paris Agreement.
No change
Plastic packaging
We use a significant amount of plastic to package our products. A reduction in the amount of virgin plastic we use, the use of recycled plastic and an increase in the recyclability of our packaging are critical to our future success.
Both consumer and customer responses to the environmental impact of plastic waste and emerging regulations by governments to tax or ban the use of certain plastics requires us to find solutions to reduce the amount of plastic we use, increase recycling post-consumer use and source recycled plastic for use in our packaging. We are also dependent on the work of our industry partners to create and improve recycling infrastructure throughout the world.
Not only is there a risk around finding appropriate replacement materials, but also due to high demand, the cost of recycled plastic or other alternative packaging materials could significantly increase in the foreseeable future and this could impact our business performance. We could also be exposed to higher costs as a result of taxes or fines if we are unable to comply with plastic regulations, which would again impact our profitability and reputation.
We are committed to reducing the amount of post-consumer plastic packaging waste going to landfill. We have committed to ensuring 100% of our plastic packaging is reusable, recyclable or compostable by 2025.
We aim to halve our use of virgin plastic by both reducing usage and accelerating use of recycled plastic. This requires us to redesign products by considering multiple-use packs, wider use of refills, recycling and using post-consumer recycled materials in innovative ways.
We are working on innovative solutions through new business models. We aim to collect and process more plastic packaging than we sell, enabled through driving systematic change in circular thinking at an industry level working with partners such as the Ellen MacArthur Foundation. We are also working with governments, industry partners, suppliers and consumers to raise awareness and find solutions to improve the recycling infrastructure for plastics. We are helping consumers to understand disposal methods and supporting collection schemes and facilities.
No change
Customer Successful customer relationships are vital to our business and continued growth.
Maintaining strong relationships with our existing customers and building relationships with new customers who have built new technology-enabled business models to serve changing shopper habits are necessary to ensure our brands are well presented to our consumers and available for purchase at all times.
The strength of our customer relationships also affects our ability to obtain pricing and competitive trade terms. Failure to maintain strong relationships with customers could negatively impact our terms of business with affected customers and reduce the availability of our products to consumers.
The Covid-19 pandemic has driven a rapid increase in online shopping, which means we need to accelerate development of eCommerce capabilities to remain competitive.
We build and maintain trading relationships across a broad spectrum of channels ranging from centrally managed multinational customers through to small traders accessed via distributors in many emerging markets. We identify changing shopper habits and build relationships with new customers, such as those serving the eCommerce channel.
We develop joint business plans with our key customers that include detailed investment plans and customer service objectives and we regularly monitor progress.
We have developed capabilities for customer sales and outlet design which enable us to find new ways to improve customer performance and enhance our customer relationships. We invest in technology to optimise order and stock management processes for our distributive trade customers.
No change
48 Unilever Annual Report and Accounts 2021
Risk Risk description Management of risk Level of riskTalent A skilled workforce and agile ways of working are
essential for the continued success of our business.
With the rapidly changing nature of work and skills, there is a risk that our workforce is not equipped with the skills required for the new environment.
Our ability to attract, develop and retain a diverse range of skilled people is critical if we are to compete and grow effectively. This is especially true in our key emerging markets where there can be a high level of competition for a limited talent pool.
The loss of management or other key personnel or the inability to identify, attract and retain qualified personnel could make it difficult to manage the business and could adversely affect operations and financial results.
The wellbeing of our employees is vital to the success of our business. Covid-19 continues to have a significant impact on their wellbeing, therefore helping our employees manage the impact of Covid-19 on their lives and their ability to work effectively requires continued focus.
We have an integrated management development process which includes regular performance reviews underpinned by a common set of leadership behaviours, skills and competencies. We have development plans to upskill and reskill employees for future roles and will bring in flexible talent to access new skills.
We have targeted programmes to attract and retain top talent and we actively monitor our performance in retaining a diverse talent pool within Unilever.
We regularly review our ways of working to drive speed and simplicity through our business in order to remain agile and responsive to marketplace trends.
We are moving to agile ways of working to unlock internal capacity and prioritise work based on growth and impact.
No change
Supply chain Our business depends on purchasing materials, efficient manufacturing and the timely distribution of products to our customers.
Our supply chain network is exposed to potentially adverse events such as physical disruptions, environmental and industrial accidents, trade restrictions or disruptions at a key supplier, which could impact our ability to deliver orders to our customers.
The Covid-19 pandemic is an adverse event that has challenged and continues to challenge the continuity of our supply chain. Maintaining manufacturing operations whilst adhering to changing local regulations and meeting enhanced health and safety standards has proven possible but has required significant management. In addition, ensuring the operation of a global logistics network for both input materials and finished goods has presented challenges and requires continued focus and flexibility.
The cost of our products can be significantly affected by the cost of the underlying commodities and materials from which they are made. Fluctuations in these costs cannot always be passed on to the consumer through pricing.
We have contingency plans designed to enable us to secure alternative key material supplies at short notice, to transfer or share production between manufacturing sites and to use substitute materials in our product formulations and recipes.
We have policies and procedures designed to ensure the health and safety of our employees and the products in our facilities, and to deal with major incidents including business continuity and disaster recovery.
Commodity price risk is managed through forward buying of traded commodities, other appropriate hedging mechanisms and product pricing. Trends are monitored and modelled regularly and integrated into our forecasting process.
No change
Safe and high-quality products
The quality and safety of our products are of paramount importance for our brands and our reputation.
The risk that raw materials are accidentally or maliciously contaminated throughout the supply chain or that other product defects occur due to human error, equipment failure or other factors cannot be excluded.
Labelling errors can have potentially serious consequences for both consumer safety and brand reputation. Therefore, on-pack labelling needs to provide clear and accurate ingredient information in order that consumers can make informed decisions regarding the products they buy.
Our product quality processes and controls are comprehensive, from product design to customer shelf. They are verified annually and regularly monitored through performance indicators that drive improvement activities. Our key suppliers are externally certified and the quality of material received is regularly monitored to ensure that it meets the rigorous quality standards that our products require.
In the event of an incident relating to the safety of our consumers or the quality of our products, incident management teams are activated in the affected markets under the direction of our product quality, science and communications experts, to ensure timely and effective marketplace action.
We have processes in place to ensure that the data used to generate on-pack labelling is compliant with applicable regulations and with relevant Unilever labelling policies in order to provide the clarity and transparency needed for consumers.
No change
Our risks continued
STRA
TEGIC
REP
OR
T – REV
IEW O
F THE Y
EAR
49Unilever Annual Report and Accounts 2021
Risk Risk description Management of risk Level of riskSystems and information
Unilever’s operations are increasingly dependent on IT systems and the management of information.
The cyber-attack threat of unauthorised access and misuse of sensitive information or disruption to operations continues to increase. Such an attack could inhibit our business operations in a number of ways, including disruption to sales, production and cash flows, ultimately impacting our results.
In addition, increasing digital interactions with customers, suppliers and consumers place ever greater emphasis on the need for secure and reliable IT systems and infrastructure and careful management of the information that is in our possession to ensure data privacy.
Given the changes in the ways of working of all our employees as well as our customers and suppliers as a result of Covid-19, there has been an increased reliance on certain elements of our IT infrastructure. We are particularly reliant on third-party experts in this space and thus the impact of Covid-19 on their operations also poses a risk for us.
To reduce the impact of external cyber-attacks impacting our business we have firewalls and threat monitoring systems in place, complete with immediate response capabilities to mitigate identified threats. We also maintain a global system for the control and reporting of access to our critical IT systems. This is supported by an annual programme of testing of access controls.
We have policies covering the protection of both business and personal information, as well as the use of IT systems and applications by our employees. Our employees are trained to understand these requirements.
We also have a set of IT security standards and closely monitor their operation to protect our systems and information. Hardware that runs and manages core operating data is fully backed up with separate contingency systems to provide real-time backup operations should they ever be required.
We have standardised ways of hosting information on our public websites and have systems in place to monitor compliance with appropriate privacy laws and regulations, and with our own policies.
Increase
Business transformation
Successful execution of business transformation projects is key to delivering their intended business benefits and avoiding disruption to other business activities.
Unilever is continually engaged in major change projects, including acquisitions, disposals and organisational transformation, to drive continuous improvement in our business and to strengthen our portfolio and capabilities. Continued digitalisation of our business models and processes, together with enhancing data management capabilities, is a critical part of our transformation.
We have an extensive programme of transformation projects. Failure to execute such initiatives successfully could result in under-delivery of the expected benefits and there could be a significant impact on the value of the business.
All acquisitions, disposals and global organisational transformation projects are sponsored by a member of the ULE. All such projects have steering groups in place led by a senior executive and regular progress updates are provided to the ULE. Sound project disciplines are used in all transformation projects and these projects are resourced by dedicated and appropriately qualified personnel.
The digitalisation of our business is led by a dedicated specialist team together with representatives from all parts of the business to ensure an integrated and holistic approach. A significant part of the organisational transformation involves the transfer of activities to third parties on and offshore. New ways of working are being developed to manage this new business model.
Unilever also monitors the volume of change programmes under way in an effort to stagger the impact on current operations and to ensure minimal disruption.
Increase
Economic and political instability
Adverse economic conditions may affect one or more countries, regions or may extend globally. Unilever operates around the world and is exposed to economic and political instability that may reduce consumer demand for our products, disrupt sales operations and/or impact the profitability of our operations.
Government actions such as foreign exchange or price controls can impact on the growth and profitability of our local operations.
Unilever has more than half of its turnover in emerging markets which can offer greater growth opportunities but also expose Unilever to related economic and political volatility.
The breadth of Unilever’s portfolio and our geographic reach help to mitigate our exposure to any particular localised risk. Our flexible business model allows us to adapt our portfolio and respond quickly to develop new offerings that suit consumers’ and customers’ changing needs during economic downturns.
We regularly update our forecast of business results and cash flows and, where necessary, rebalance investment priorities.
We believe that many years of exposure to emerging markets have given us experience of operating and developing our business successfully during periods of economic and political volatility.
Increase
50 Unilever Annual Report and Accounts 2021
Risk Risk description Management of risk Level of riskTreasury and Tax
Unilever is exposed to a variety of external financial risks in relation to Treasury and Tax.
The relative value of currencies can fluctuate widely and could have a significant impact on business results. Further, because Unilever consolidates its financial statements in euros it is subject to exchange risks associated with the translation of the underlying net assets and earnings of its foreign subsidiaries.
We are also subject to the imposition of exchange controls by individual countries which could limit our ability to import materials paid in foreign currency or to remit dividends to the parent company.
A material shortfall in our cash flow could undermine Unilever’s credit rating, impair investor confidence and restrict Unilever’s ability to raise funds. In times of financial crisis, there is a further risk that we may not be able to raise funds due to market illiquidity.
We are exposed to counter-party risks with banks, suppliers and customers, which could result in financial losses.
Tax is a complex and evolving area where laws and their interpretation are changing regularly, leading to the risk of unexpected tax exposures. International tax reform remains a key focus of attention with the OECD’s Base Erosion and Profit Shifting project, and the Digitalising Economy Project, and further potential tax reform in the European Union and the US.
Currency exposures are managed within prescribed limits and by the use of financial hedging instruments. Further, operating companies borrow in local currency except where inhibited by local regulations, lack of local liquidity or local market conditions.
We seek to maintain access to global debt markets through short-term and long-term debt programmes. In addition, we maintain significant undrawn committed credit facilities for general corporate purposes as disclosed in note 16A.
Group treasury regularly monitors exposure to our banks, tightening counter-party limits where appropriate. Unilever actively manages its banking exposures on a daily basis. We regularly assess and monitor counter-party risk in our suppliers and customers and take appropriate action to manage our exposures.
Our Global Tax Principles provide overarching governance and we have a process in place to monitor compliance with the Tax Principles. We have a Tax Risk Framework in place which sets out the controls established to assess and monitor tax risk for direct and indirect taxes. We monitor proposed changes in taxation legislation and ensure these are taken into account when we consider our future business plans.
No change
Ethical Unilever’s brands and reputation are valuable assets and the way in which we operate, contribute to society and engage with the world around us is always under scrutiny both internally and externally.
Acting in an ethical manner, consistent with the expectations of customers, consumers and other stakeholders, is essential for the protection of the reputation of Unilever and its brands.
A key element of our ethical approach to business is to reduce inequality and promote fairness. Our activities touch the lives of millions of people and it is our responsibility to protect their rights and help them live well.
The safety of our employees and the people and communities we work with is critical. Failure to meet these high standards could result in damage to Unilever’s corporate reputation and business results.
Our Code of Business Principles and our Code Policies govern the behaviour of our employees, suppliers, distributors and other third parties who work with us. Our processes for identifying and resolving breaches of our Code of Business Principles and our Code Policies are clearly defined and regularly communicated throughout Unilever. Data relating to such breaches is reviewed by the ULE and by relevant Board Committees and helps to determine the allocation of resources for future policy development, process improvement, training and awareness initiatives.
Our Responsible Sourcing Policy and Responsible Business Partners Policy help us improve the lives of the people in our supply chains by ensuring human rights are protected and makes a healthy and safe workplace a mandatory requirement for our suppliers. We have detailed safety standards and monitor safety incidents at the highest level.
Through our Brands with Purpose agenda, a number of our brands are taking action on societal issues such as fairness and equality.
No change
Legal and regulatory
Compliance with laws and regulations is an essential part of Unilever’s business operations.
Unilever is subject to national and regional laws and regulations in such diverse areas as product safety, product claims, trademarks, copyright, patents, competition, employee health and safety, data privacy, the environment, corporate governance, listing and disclosure, employment and taxes.
Failure to comply with laws and regulations could expose Unilever to civil and/or criminal actions leading to damages, fines and criminal sanctions against us and/or our employees with possible consequences for our corporate reputation. Changes to laws and regulations could have a material impact on the cost of doing business.
Unilever is committed to complying with the laws and regulations of the countries in which we operate. In specialist areas the relevant teams at global, regional or local levels are responsible for setting detailed standards and ensuring that all employees are aware of and comply with regulations and laws specific and relevant to their roles.
Our legal and regulatory specialists are heavily involved in monitoring and reviewing our practices to provide reasonable assurance that we remain aware of and in line with all relevant laws and legal obligations.
No change
Our risks continued
STRA
TEGIC
REP
OR
T – REV
IEW O
F THE Y
EAR
51Unilever Annual Report and Accounts 2021
Our Climate Transition Action Plan: Annual Progress ReportOur Climate Transition Action Plan (CTAP) sets out our climate strategy, defines our net zero and emission reduction goals, and the actions we intend to take to meet them. Our goals are to: ▪ Reduce in absolute terms our operational (Scope 1 and 2)
emissions by 100% by 2030 against a 2015 baseline;(a) with an interim goal to achieve a 70% reduction by 2025 against a 2015 baseline.
▪ Halve the full value chain emissions of our products on a per consumer use basis by 2030 against a 2010 baseline.(b)
▪ Achieve net zero emissions covering Scope 1, 2 and 3 emissions by 2039.(c)
In the 2020s and 2030s, our primary focus will be to eliminate emissions in our operations and reduce emissions across our value chain(d) rather than purchasing carbon credits. It is too early to estimate the amount of any residual value chain emissions but our plan is to balance these with carbon removals to achieve and maintain our net zero emissions goal.
We fully expect our approach to delivering our commitments to evolve as science progresses and the societal debate on net zero matures. For example, we’re currently considering the recently issued guidance from the Science Based Targets initiative on net zero targets.
See our website for our Climate Transition Action Plan
Our progressTo deliver the ambitious goals set out in our CTAP, we're focusing our actions in four key areas, which form the basis of this Annual Progress Report: our operations, our brands and products, our value chain and our wider influence on society.
Our operations
Our first ambition is to eliminate operational Scope 1 and 2 emissions from our factories, offices and research labs which make up approximately 2% of our GHG footprint. We've reduced our operational emissions by 64% since 2015. This puts us on track to achieve our interim milestone of a 70% reduction by 2025 – see page 34 for our three-year performance. We're taking action in a number of areas to decarbonise our operations.
Eco-efficiencyFor years we’ve invested in eco-efficiency projects across our factories, reducing CO2 from energy per tonne of production by 77% compared to 2008 and by 14% versus 2020. Recent investments include improving energy efficiency of lighting and manufacturing equipment, and installing heat recovery systems. We've committed to align our future capital expenditure with the Paris Agreement. As a first step, in 2021 we developed a bespoke digital tool to capture the GHG, water and waste impact data of all capital expenditure projects.
Renewable electricityTransitioning to renewable electricity is a significant driver of emissions reduction in our operations. Our preference is to support local renewable energy markets through purchasing renewable electricity contracts called Power Purchase Agreements (PPAs), or green tariffs/bundled Renewable Energy Certificates (RECs) to match our grid power demand, where these are available and can be sourced in a cost competitive way. Where this is not possible, and as the next best option, we seek to purchase unbundled RECs sold separately from electricity in the same market.
Only as a last resort, and when unbundled RECs are not available in a market where we buy electricity, do we buy unbundled RECs in an adjacent market.
In January 2020, we reached our target of purchasing 100% renewable grid electricity for our operations through a combination of PPAs and RECs (bundled and unbundled). Since we set this target, we've worked with the RE100 campaign to evolve industry best practice in renewable electricity reporting. From 2021, we're aligning our reporting with the updated RE100 guidance which requires us to make two changes.
First, for renewable electricity certified with RECs, we will only report as 'renewable' the electricity where the accompanying RECs originate in the same market. While we intend to maintain our commitment to ensure our purchase of renewable grid electricity is matched by an equivalent volume of renewable electricity generation, we’ll no longer count the purchase of unbundled RECs from an adjacent market in our renewable electricity reporting. While this will lower our reported renewable electricity percentage, we support the aims of RE100 to increase transparency in the global renewable power landscape, which we hope will help to accelerate the provision of renewable power in all markets.
The second change is to include non-grid sourced electricity. Currently, we use biomass in combined heat and power (CHP) boilers at a limited number of sites. As well as providing thermal energy (see below), they also supply our sites with electricity. From 2021 we'll include this within our renewable electricity reporting. We'll also include the renewable electricity generated at our factory sites, for example, the on-site solar installations in 24 countries. In 2021 we generated almost 3% of our total electricity from on-site renewable sources. Taking into account the updated definition and widened scope of our renewable electricity reporting, in 2021, 86% of our total electricity was from renewable sources. Against the new scope and definitions, the prior year would have been 80%. See page 56 for a more detailed breakdown of our electricity by source.
Renewable thermal energy In addition to renewable electricity, we aim to transition heating sources (typically fossil-fuel-burning CHP boilers for hot air, water and steam) to renewable energy alternatives. By early 2020, we had stopped using direct coal on-site for thermal energy, except for three factories acquired in 2020
Additional non-financial informationClimate change disclosures

52 Unilever Annual Report and Accounts 2021
as part of our acquisition of the Horlicks portfolio in India and other predominantly Asian markets. In 2021, we eliminated direct coal from these three factories through the use of biomass and biodiesel. We're exploring options to eliminate indirect coal from steam supplied by third parties by 2030.
We're phasing out gas-fired boilers and exploring new renewable heating technologies such as heat pumps, concentrated solar power and lower carbon biogenic-derived sources. These technologies could provide up to half of our thermal energy needs by 2025. We have strict criteria to ensure we deliver genuine lifecycle carbon reductions. In 2022, we will publish details on how we’ll ensure any biofuels we use do not lead to deforestation, compete with food supplies, and are sourced from local waste materials where possible.
Many of the low-carbon heating options we’re exploring are not yet commercially viable or widely available, so we're supporting innovation and looking for ways to trial them. We see hydrogen produced using renewable energy as a potential industrial scale low-carbon alternative to natural gas. Our Port Sunlight factory in the UK is supporting a trial of hydrogen technology.
Refrigerants We're phasing out high-impact refrigerants from our operations, starting with the most harmful hydrochlorofluorocarbons (HCFCs). When replacing these, we aim to use the greenest version available for the purpose needed. By the end of 2021 we had replaced HCFCs at 29 sites.
Food wasteOur first priority is to reduce the amount of food waste we generate in the first place – we're aiming to halve food waste in our operations by 2025. This will also help to reduce our GHG emissions. By the end of 2021, we’d reduced food waste per tonne of food handled in our operations by 3% versus 2019. Our progress in reducing manufacturing food waste has been hampered by Covid-related disruptions. We're exploring solutions with our engineering teams such as anaerobic digestion, using the biogas generated on-site, composting and using the waste as fertiliser.
Our brands and products
Designing our products to be lower carbon will help us to reduce our indirect Scope 3 footprint and strengthens the appeal of our brands to consumers. In some cases, it can also help consumers reduce their own footprint (see page 53). We’re focusing on concentration and compaction, transitioning away from fossil fuels in our cleaning products, growing our portfolio of plant-based products and investing in climate and nature projects through our Climate & Nature Fund.
Concentration and compactionIn the last decade we’ve made significant emissions reductions by removing or reducing carbon-intensive materials such as inorganics and surfactants, and by concentrating and compacting our products. In 2021 we continued to develop concentrated formulas for our laundry liquids, including OMO in-home refills available in six markets and Seventh Generation’s ultraconcentrated laundry formulation in the US. Lifebuoy also rolled out ten times concentrated ecorefill home cleaning spray in Europe.
Recycled and renewable carbon in formulationsThrough our Clean Future programme, our Home Care laundry and cleaning brands are identifying new opportunities to shift to renewable and recycled ingredients, moving away from fossil-fuel-based ingredients. This year we launched an OMO liquid laundry capsule made from captured industrial carbon. Lifebuoy launched a cleaning range with plant-based ingredients in five countries. And OMO/Persil launched a new laundry liquid in 16 countries with plant-based stain removers. Read more about Clean Future on page 23.
Plant-based foodsAlternative proteins, plant-based eating and meat and dairy alternatives are strategic pillars for our Foods & Refreshment division and all contribute to lowering carbon emissions. We’re aiming to achieve €1 billion in sales from plant-based meat and dairy alternatives by 2025-2027 – through brands such as The Vegetarian Butcher, Wall’s, Ben & Jerry’s, Magnum, Knorr and Hellmann’s. We’re also encouraging people to use more plant-based ingredients in their cooking, through Knorr’s ‘Future 50’ inspired plant-based recipes. Read more about plant-based foods on page 22.
Helping consumers make lower carbon choicesAs well as ingredient transparency on product packs, we want our consumers to have clear information about the carbon footprint of the products they buy and we're exploring ways to provide this. After more than a decade of work assessing the carbon footprint of our products, we're now working with others across the value chain to standardise data collection protocols and communication frameworks. For example, we’re part of the World Business Council for Sustainable Development Value Chain Carbon Transparency Pathfinder initiative. And we’re working with the Cosmetics Consortium to develop an industry-standard environmental impact assessment and scoring system.
Climate & Nature FundOur €1 billion Climate & Nature Fund will help brands invest in projects that positively address climate change and protect nature – for example, through forest protection and regeneration. In 2021, we recruited a specialised team to lead this work, formulate the strategy and get started on project implementation. In this first year, we've committed
Additional non-financial information continued
STRA
TEGIC
REP
OR
T – REV
IEW O
F THE Y
EAR
53Unilever Annual Report and Accounts 2021
€40 million and are now building a pipeline of further projects. For example, Knorr will use the fund to support 50 regenerative agriculture projects. These are predicted to reduce GHG emissions and water use by an estimated 30% while improving biodiversity, soil health and livelihoods. As part of our Beauty & Personal Care’s Positive Beauty strategy (see page 21), the Fund is working on innovative financing and collaboration partnerships to support the delivery of our commitment to protect and regenerate 1.5 million hectares of land, forests and oceans by 2030. This is more land than we use to grow renewable ingredients for the Division’s products.
Our value chain
Our value chain encompasses upstream and downstream Scope 3 emissions, excluding indirect consumer use-phase emissions (see page 53 for more on consumer use). Our focus is on tackling emissions from raw materials (including aerosol propellants), packaging materials, logistics and distribution networks, ice cream cabinets, and the disposal of waste products and packaging.
Raw materialsWe've developed GHG reduction roadmaps for key materials and ingredients which contribute to our upstream Scope 3 GHG emissions, including dairy. Our roadmaps identify how we can reduce emissions through product reformulations, different raw materials and supplier innovation partnerships. It is particularly critical that we work in partnership with our suppliers as 1.5°C-aligned emission reduction pathways for the majority of these materials are still unclear and it is only through collaboration that we will find solutions.
In 2021, we invited our suppliers to commit to setting a public target to halve absolute GHG emissions by 2030, report their progress and share their data with us. We’re exploring new ways to support suppliers through guidance, tools and resources, particularly for the 300 suppliers who have the most significant GHG emissions. In 2021, we began working with a small group to help us shape the programme, and we‘ll launch a pilot in 2022, before further roll-out in 2023. We’re also encouraging other companies to work with their suppliers, for example through the 1.5°C Supplier Engagement Guide, launched by the 1.5°C Supply Chain Leaders initiative at COP26.
We cannot achieve our climate goals if our operations or supply chain contribute to deforestation. Our suppliers and other partners will play a critical role in helping us achieve a deforestation-free supply chain for five key commodities by 2023. Read more on tackling deforestation on page 30.
Packaging materialsWe’ve set ambitious plastic commitments including to halve our virgin plastic footprint by 2025. Key to achieving this will be by increasing our use of recycled plastic. Our goal is to use at least 25% recycled plastic by 2025, and this year we achieved approximately 17%. We’re also reducing our use of virgin
plastic by shifting to refillable, reusable or naked (unwrapped) products which use less or no plastic. In 2021, we saw strong sales of concentrated home refill laundry and we continue to expand our in-store and at-home refill pilots, with about 15 in progress around the world. We're also exploring materials like paper and board, using life cycle analysis to ensure any switch away from plastic doesn’t end up increasing our GHG footprint. Read more about plastic on page 29.
Logistics and distributionMore than 90% of our logistics emissions come from our logistics suppliers. We've begun using lower carbon alternative fuels such as liquified natural gas (LNG) or compressed natural gas (CNG) in 12 countries and piloted zero emission electric trucks with partners in three countries with plans to scale to more. We also signed up to a new shipping coalition, Cargo Owners for Zero Emission Vessels (coZEV) to help accelerate the decarbonisation of the shipping industry.
In our own car fleet, we developed country roadmaps to achieve 100% electric vehicles (EVs) or hybrids by 2030, taking into account the availability of EVs, charging infrastructure and financial support or subsidies. In 2021, across six of the most EV-ready countries, EVs and hybrids made up 6% of the fleet.
Retail emissionsIn 2021, all the new freezers we purchased to cool our ice creams in-store used lower carbon natural hydrocarbon refrigerants. We estimate that over 90% of the 3 million freezers in our fleet now use these refrigerants. We’re investing in energy-efficient freezers, with the average energy use per cabinet falling by 3% compared to 2020. We're also looking at ‘warming up’ the cold chain so that less energy is needed to refrigerate products across their life.
Aerosol propellantsWe typically use hydrocarbon propellant gases in hairsprays, body sprays and deodorants. In the US, our largest deodorant and hair market, Volatile Organic Compound (VOC) regulations restrict the use of formulations used elsewhere. Our primary focus has been to find regulatory solutions in the US to enable the use of alternative propellant systems which have a lower GHG footprint compared to hydrocarbon and hydrofluorocarbon propellants and help improve air quality. Provisions have been added to the US VOC regulations to allow the use of compressed gas propellants. We’re now exploring alternative formulations and formats in key markets.
Disposal of waste products Our products have a GHG impact at the end of their life, as fossil-fuel-based ingredients break down and release emissions. We're switching to plant-based 100% biodegradable formulations across our Home Care portfolio. For example, Lifebuoy’s BotaniTech range made from naturally derived and 100% biodegradable cleaning ingredients launched in five markets in 2021. And Comfort launched its Ultimate Care range, which contains new biodegradable technology to extend the life of clothes.

54 Unilever Annual Report and Accounts 2021
Our wider influence on society
We’re advocating for changes that will ultimately reduce the impact of our products when used by consumers as well as accelerating progress in other areas of our value chain.
Consumer useAround two-thirds of our products' GHG impact comes from their use by consumers (indirect downstream Scope 3 emissions), for instance from energy used by washing machines or hot water used for showering. There’s a limit to how much we can influence emissions from product use as consumers make their own choices on how long they shower, which energy provider they use, and how efficient their home appliances are. We’re therefore reliant, as many companies are, on the decarbonisation of the energy grid to reduce our downstream Scope 3 footprint. We’re using our influence to advocate for system-wide change, such as acceleration of renewable energy globally, which will help reduce emissions in consumers’ homes – see below for more on our advocacy.
In addition, we're committed to using technology and innovation to provide consumers with superior and lower carbon products while growing our business. This is already visible in Home Care’s Clean Future strategy (with a focus on renewable and recycled carbon ingredients – see page 23), in Foods & Refreshment’s Future Foods strategy (with a focus on plant-based foods – see page 22), and Beauty & Personal Care’s Positive Beauty strategy (with a focus on sustainable sourcing, deforestation-free palm oil and nature-based solutions – see page 21).
Our product lifecycle GHG emissions per consumer use have reduced by 14% since 2010 and by 4% since 2020, while our absolute Scope 3 emissions (from consumer use, ingredients and packaging and distribution and retail) increased by 1% versus 2020, as our sales increased over the same period. The reduction in GHG emissions per consumer use is driven by our Foods & Refreshment and Home Care Divisions, where emissions have fallen by 32% and 43% respectively since 2010. This is mainly due to grid decarbonisation, portfolio changes and product reformulation, such as the removal of phosphates in our laundry products. Over the same period, GHG emissions per consumer use from our Beauty & Personal Care Division have increased by 6% despite ongoing grid decarbonisation – driven primarily by the acquisition of brands with hair, bath and shower products which have high GHG emissions associated with consumer hot water use.
Advocacy We were an early signatory to the We Mean Business open letter to G20 leaders calling for higher ambition ahead of the COP26 conference in 2021. Subsequently we partnered with the UK government as a Principal Partner of COP26 in Glasgow. Alan Jope served as a member of the COP26 Business Leaders Group to rally UK and international businesses. During the conference, we participated in numerous events including the World Leaders Summit, the Forest, Agriculture, Commodities and Trade (FACT) dialogue to reduce emissions in commodity value chains and events on creating high integrity standards for voluntary carbon markets. We also developed a climate advocacy toolkit to support our market teams to push for higher climate ambition.
Trade association policy alignmentWe've committed to ensuring that all direct lobbying relevant to climate policy is consistent with the Paris Agreement. At the end of 2021 we published our climate policy position on our website for indirect climate lobbying. In 2021 we rejoined the European Chemical Industry Council (CEFIC) to help accelerate the European chemical industry’s transition towards circular chemistry. We will clearly indicate when CEFIC submissions on climate change-related policies do not align with our own climate positions.
See our website for our climate policy position
Industry partnerships We continued our engagement with a selected group of international climate leadership strategic partners – the United Nations Global Compact, the World Economic Forum, the World Business Council for Sustainable Development, and the Consumer Goods Forum (CGF). We initiated and co-chaired with Walmart a Race to Zero Task Force within the CGF to encourage other consumer goods and retail companies to join the UN’s Race to Zero. This succeeded in doubling the number of CGF Board members making such commitments. We also helped to create a Transform to Net Zero guide for businesses.
Additional non-financial information continued
(a) Our medium-term emissions reduction target has been recognised as science-based and consistent with the 1.5°C ambition of the Paris Agreement by the Science Based Targets initiative.
(b) Our medium-term full value chain emissions reduction target has been recognised as science-based and consistent with a 2°C temperature increase by the Science Based Targets initiative. It was set in 2010 and was validated by the Science Based Targets initiative before the 1.5°C validation was introduced. We plan to review this goal in the near future.
(c) Our long-term net zero value chain target covers upstream Scope 3 emissions, Scope 1 and 2 emissions, and mandatory downstream Scope 3 emissions. Mandatory downstream emissions include direct emissions from aerosol propellants and the biodegradation of chemicals in the disposal phase, but excludes indirect consumer use-phase emissions, such as emissions associated with hot water used with our products. This approach is consistent with the Science Based Targets initiative’s approach to net zero targets. Our medium-term value chain emissions reduction target covers indirect consumer use-phase emissions. The definition of ‘net zero’ is outlined in our CTAP.
(d) In this CTAP Progress Report, as in the CTAP, references to ‘our value chain’ encompasses upstream and downstream Scope 3 emissions, but excludes indirect consumer use-phase emissions and operational Scope 1 and 2 emissions, unless stated otherwise. References to ‘full value chain’ in the context of our goal to halve our full value chain GHG emissions by 2030, additionally includes operational Scope 1 and 2 emissions and indirect consumer-use phase emissions.

STRA
TEGIC
REP
OR
T – REV
IEW O
F THE Y
EAR
55Unilever Annual Report and Accounts 2021
Governance, data and disclosure
Our CTAP was put before shareholders for a non-binding advisory vote in May 2021 at our Annual General Meeting. Shareholders overwhelmingly supported the plan, with 99.59% of votes in favour. We'll continue to seek an advisory vote at our AGM every three years and will report on progress against the plan every year.
The Board take overall accountability for the management of all risks and opportunities, including climate change. Our CEO Alan Jope is ultimately responsible for overseeing our climate change agenda.
External assurance ensures that our data is robust and reliable. For details of assurance in 2021, see the PwC Independent Limited Assurance Report 2021 on our website.
This Annual Report and Accounts contains additional climate change disclosures, including in our TCFD statement: ▪ Governance: pages 4, 57, 80 to 81, 88 and 91 to 93 ▪ Strategy: pages 8 to 11 and 57 to 62 ▪ Risk management: pages 44 to 47 and 57 to 62 ▪ Metrics and targets: pages 10, 34 and 62
See our website for more on climate action Our CDP submissions contain further disclosures on climate, water and forests
GHG emissions The table below provides a detailed breakdown of our Scope 1, 2 and 3 GHG emissions by activity.
2021 2020 2019
Unilever operations (Scope 1 and 2)(a) Total Scope 1 and 2 (tonnes CO2e) 710,740 823,511 1,128,091Scope 1 (tonnes CO2e) 565,988 606,771 659,028 Renewable energy 0 0 0 Non-renewable energy 542,620 592,342 632,560 Refrigerants 23,368 14,429 26,468Scope 2 (tonnes CO2e) 144,752 216,740 469,063 Purchased renewable electricity 0 0 0 Purchased non-renewable electricity 57,033 128,442 382,057 Purchased renewable thermal energy 0 0 0 Purchased non-renewable thermal energy 87,719 88,298 87,006 Reduction in Scope 1 and 2 GHG emissions from energy and refrigerant use in our operations since 2015 (%) -64% -58% -42%
Upstream and downstream of Unilever operations (Scope 3)(b)
Total Scope 3 (tonnes CO2e) 61,007,131 60,388,592 61,020,357 Consumer use (tonnes CO2e) 43,187,538 42,093,341 41,743,454 Ingredients and packaging (tonnes CO2e) 14,860,832 14,239,918 14,897,174 Distribution and retail (tonnes CO2e) 2,958,761 4,055,333 4,379,729Full value chain (Scope 1, 2, 3)(c)
GHG impact per consumer use (grams CO2e) 43.6† 45.6 46.7
(a) Scope 1 encompasses direct GHG emissions from energy generated from fossil fuels such as gas and oil, as well as emissions from refrigerants at a small number of sites where we have reliable data; Scope 2 encompasses indirect GHG emissions from the on-site generation and purchase of electricity according to the ‘market-based method’ and purchased thermal energy. 2020 and 2019 Scope 2 figures have been restated to align our renewable electricity reporting with updated RE100 guidance. See page 51 for more information.
(b) Scope 3 encompasses indirect GHG emissions in Unilever’s value chain (upstream and downstream). Our Scope 3 emissions were recalculated in 2020 to include biodegradability of organic materials. We also recalculated consumer use to include disposal, and ingredients and packaging to include inbound transport of raw materials. However, the direction of change of our GHG impact per consumer use over the past three years remains the same. See the Basis of Preparation on our website for more details on how we measure our GHG footprint www.unilever.com/planet-and-society/sustainability-reporting-centre/independent-assurance.
(c) We measure the Scope 1, 2 and 3 GHG footprint of our product portfolio using an LCA method. Our environmental targets are expressed against a baseline of 2010 and on a 'per consumer use' basis. This means a single use, portion or serving of a product. We continuously review our GHG footprint estimations to ensure we are using the best available data. These changes can affect both the 2010 baseline and the annual emissions that we report.
† This metric was subject to external independent limited assurance by PriceWaterhouseCoopers LLP (‘PwC’) in 2021. For PwC's 2021 Limited Assurance report and the 2021 Unilever Basis of Preparation for assured metrics see www.unilever.com/planet-and-society/sustainability-reporting-centre/independent-assurance.

56 Unilever Annual Report and Accounts 2021
Additional non-financial information continued
Renewable and non-renewable electricity The table below provides a breakdown of our renewable and non-renewable electricity by source.
2021 2020 2019
Renewable (% of kWh)(a)
On-site renewable self-generation 2.5% 1.0% 0.4%Purchased renewable electricity: 83.8% 78.7% 66.1% On-site Purchase Power Agreements 0.3% 0.5% 0.5% Off-site Purchase Power Agreements 9.8% 15.3% 18.8% Green electricity products from an energy supplier (green tariffs/bundled RECs) 24.5% 18.8% 21.9% Green electricity purchased in markets with greater than 95% renewable grid 0.2% 0.1% 0.1% Unbundled RECs bought in market 65.2% 65.4% 58.7%Total renewable electricity 86.3% 79.7% 66.5%Non-renewable (% of kWh) On-site non-renewable electricity generation (e.g. gas-fired on-site CHP) 7.5% 7.7% 8.0%Purchased non-renewable electricity (e.g. non-grid transfer of CHP) 0.1% 5.8% 22.6%Unbundled RECs bought in an adjacent market(b) 6.1% 6.7% 2.9%Total non-renewable electricity 13.7% 20.2% 33.5%
(a) The renewable sources listed align with the RE100 Reporting Guidance 2021. See page 51 for more information. (b) Previously counted as 'renewable grid electricity'. See page 51 for more information.
STRA
TEGIC
REP
OR
T – REV
IEW O
F THE Y
EAR
57Unilever Annual Report and Accounts 2021
Task Force on Climate-related Financial Disclosures statementThe following statement, which Unilever believes is consistent with the Task Force on Climate-related Financial Disclosures (TCFD) Recommendations and Recommended Disclosures, details the risks and opportunities arising from climate change, the potential impact on our business and the actions we’re taking to respond. We also integrate climate-related disclosures throughout this Annual Report and Accounts, including in our Climate Transition Action Plan (CTAP) Progress Report on pages 51 to 56.
See our website for our Climate Transition Action Plan
GovernanceThe Board takes overall accountability for the management of all risks and opportunities, including climate change (see page 44). Our CEO and Executive Board member, Alan Jope, is ultimately responsible for oversight of our climate change agenda. The Corporate Responsibility Committee and Audit Committee review our climate reporting and receive presentations from sustainability experts, including the Sustainability Advisory Council. The Board is supported by the ULE. The ULE meet quarterly to discuss key strategic matters. During 2021, three agenda items relating to climate change were discussed, including progress against our Compass climate goals.
Additional specialist governance groups are in place to support our climate agenda and ULE decision- making, including: ▪ Climate Action Committee: Drives delivery of our carbon
ambition at corporate and country level and leads strategic partnerships and policy on renewables. Chaired by our Chief Business Operations Officer, Reginaldo Ecclissato.
▪ Sustainable Sourcing Steering Group: Supports our strategy focusing on long-term, sustainable access to our key crops. Chaired by our Chief Procurement Officer, David Ingram.
This year we engaged with shareholders on our climate strategy by seeking an advisory vote on our CTAP. We will continue to seek an advisory vote on our CTAP at our AGM every three years.
Executive remuneration for management employees – up to and including the ULE – continues to be linked to performance against climate change goals. Their reward packages include fixed pay, a bonus as a percentage of fixed pay and eligibility to participate in a long-term Performance Share Plan (PSP). The PSP is linked to financial and sustainability performance, guided by our Sustainability Progress Index (SPI), which accounts for 25% of the total PSP award. The SPI in 2021 is tied to a number of sustainability targets, including our progress on reducing Scope 1 and 2 emissions in manufacturing, sustainable sourcing and recycled plastic – see page 92 for details. From 2022, the SPI will be linked to a new set of targets, including replacing fossil-fuel-derived ingredients in our
laundry and cleaning products with renewable or recycled carbon and our deforestation-free supply chain and recycled plastic commitments. See pages 87 to 88 for more on PSP including the role of the Board’s Compensation Committee and Corporate Responsibility Committee in determining how the PSP operates, and the SPI outcome each year.
Strategy and risk managementClimate change is a principal risk to Unilever which has the potential – to varying degrees – to impact our business in the short, medium and long term. We face potential physical environment risks from the effects of climate change on our business, including extreme weather and water scarcity. Potential regulatory and transition market risks associated with the shift to a low-carbon economy include changing consumer preferences and future government policy and regulation. These also present opportunities. The potential impacts of climate change are taken into account in developing the overall strategy and financial plans.
More detail on these risks, opportunities and the mitigating actions we’re taking can be found on pages 59 to 60.
The process for assessing and identifying climate-related risks is the same for the principal risks and is described on page 44. The risks are reviewed and assessed on an ongoing basis and formally at least once per year. For each of our principal risks we have a risk management framework detailing the controls we have in place, who is responsible for managing both the overall risk and the individual controls mitigating it. We monitor risks throughout the year to identify changes in the risk profile.
We regularly carry out climate-related risk assessments at site level, supplier level, as well as innovation-project level. Climate-related risks are managed by the team relevant to where the risk resides. For example, climate risks in relation to commodities in the supply chain are managed by our procurement team.
Understanding financial impact: scenario analysis
We have conducted several high-level scenario analyses on the potential impacts of climate change to help us consider and adapt our strategies and financial planning. In prior years, we have reported the potential financial impacts of climate change on our business in 2030 if average global temperatures were to rise by 2°C and 4°C above pre-industrial levels by 2100. This analysis led us to understand that limiting warming to 2°C would primarily expose us to economic and regulatory transition risks, whereas a 4°C warming level would expose us to unprecedented physical risks. In 2021, as new scientific evidence was released by the UN’s Intergovernmental Panel on Climate Change (IPCC) and the global consensus around the need of governments to commit to a 1.5°C world strengthened, we extended our scenario analyses to assess the impacts of a 1.5°C temperature increase above pre-industrial levels by 2100 on our business in 2030, 2039 and 2050.
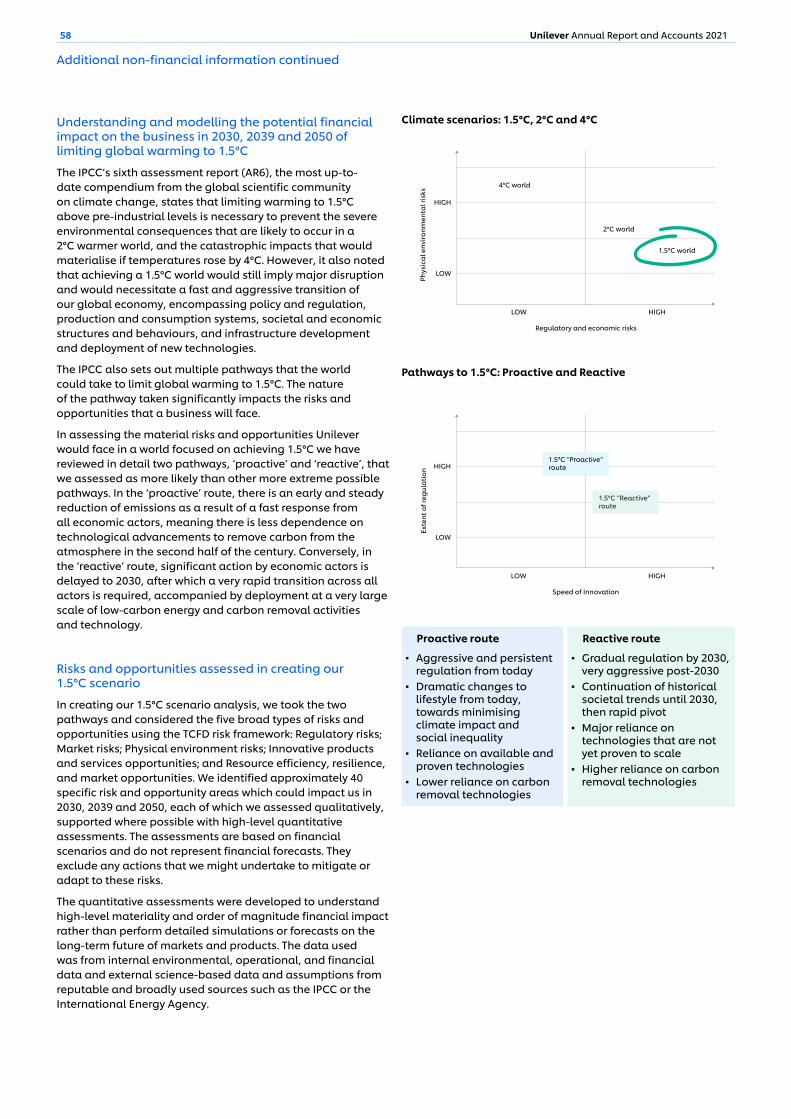
58 Unilever Annual Report and Accounts 2021
Understanding and modelling the potential financial impact on the business in 2030, 2039 and 2050 of limiting global warming to 1.5°C
The IPCC’s sixth assessment report (AR6), the most up-to-date compendium from the global scientific community on climate change, states that limiting warming to 1.5°C above pre-industrial levels is necessary to prevent the severe environmental consequences that are likely to occur in a 2°C warmer world, and the catastrophic impacts that would materialise if temperatures rose by 4°C. However, it also noted that achieving a 1.5°C world would still imply major disruption and would necessitate a fast and aggressive transition of our global economy, encompassing policy and regulation, production and consumption systems, societal and economic structures and behaviours, and infrastructure development and deployment of new technologies.
The IPCC also sets out multiple pathways that the world could take to limit global warming to 1.5°C. The nature of the pathway taken significantly impacts the risks and opportunities that a business will face.
In assessing the material risks and opportunities Unilever would face in a world focused on achieving 1.5°C we have reviewed in detail two pathways, ‘proactive’ and ‘reactive’, that we assessed as more likely than other more extreme possible pathways. In the ‘proactive’ route, there is an early and steady reduction of emissions as a result of a fast response from all economic actors, meaning there is less dependence on technological advancements to remove carbon from the atmosphere in the second half of the century. Conversely, in the ‘reactive’ route, significant action by economic actors is delayed to 2030, after which a very rapid transition across all actors is required, accompanied by deployment at a very large scale of low-carbon energy and carbon removal activities and technology.
Climate scenarios: 1.5°C, 2°C and 4°C
Additional non-financial information continued
Proactive route
▪ Aggressive and persistent regulation from today
▪ Dramatic changes to lifestyle from today, towards minimising climate impact and social inequality
▪ Reliance on available and proven technologies
▪ Lower reliance on carbon removal technologies
Risks and opportunities assessed in creating our 1.5°C scenario
In creating our 1.5°C scenario analysis, we took the two pathways and considered the five broad types of risks and opportunities using the TCFD risk framework: Regulatory risks; Market risks; Physical environment risks; Innovative products and services opportunities; and Resource efficiency, resilience, and market opportunities. We identified approximately 40 specific risk and opportunity areas which could impact us in 2030, 2039 and 2050, each of which we assessed qualitatively, supported where possible with high-level quantitative assessments. The assessments are based on financial scenarios and do not represent financial forecasts. They exclude any actions that we might undertake to mitigate or adapt to these risks.
The quantitative assessments were developed to understand high-level materiality and order of magnitude financial impact rather than perform detailed simulations or forecasts on the long-term future of markets and products. The data used was from internal environmental, operational, and financial data and external science-based data and assumptions from reputable and broadly used sources such as the IPCC or the International Energy Agency.
Pathways to 1.5°C: Proactive and Reactive
Reactive route
▪ Gradual regulation by 2030, very aggressive post-2030
▪ Continuation of historical societal trends until 2030, then rapid pivot
▪ Major reliance on technologies that are not yet proven to scale
▪ Higher reliance on carbon removal technologies
Regulatory and economic risks
4°C world
1.5°C world
2°C world
Phys
ica
l env
ironm
enta
l ris
ks
LOW
HIGH
LOW HIGH
Speed of Innovation
1.5°C “Proactive”route
Exte
nt o
f reg
ula
tion
LOW
HIGH
LOW HIGH
1.5°C “Reactive”route
STRA
TEGIC
REP
OR
T – REV
IEW O
F THE Y
EAR
59Unilever Annual Report and Accounts 2021
Actions taken: We're mitigating regulatory risks through ongoing progress against the goals in our Compass and CTAP, notably our commitments on climate, deforestation and plastic packaging – see pages 10, 29 to 30 and 51 to 56. We support the use of carbon pricing as an important tool to help us achieve our zero emissions goal. Our carbon pricing approach is a mechanism which creates a sustainable capital investment fund which is then used to fund capital investments to decarbonise our operations. We support EPR policies and schemes and we’re investing directly in waste collection, processing and capacity-building projects to recycle more plastic.
Market risks: ▪ Energy transition and rising energy prices could be driven
by increased electrification, the deployment of renewable energy solutions, associated transmission, distribution and storage infrastructure, as well as the adoption of emerging low-carbon technologies such as biogas, green hydrogen and ammonia. This could impact our operations, suppliers, and end-consumers’ utility costs.
▪ Energy and commodity market volatility could potentially lead to increased uncertainty in financial planning and forecasting for key commodities, as well as a higher cost associated with risk management. Other considerations include potential manufacturing or supply disruptions linked to availability or higher cost of energy and sourced commodities.
Actions taken: We're mitigating market risks by decarbonising our operations through eco-efficiency measures in our factories, powering our operations with renewables and transitioning heating and cooling for our factories to lower emission and renewable sources (see page 51). We manage commodity price risks through forward-buying of traded commodities and other hedging mechanisms.
Physical environment risks: ▪ Water scarcity would lead to increased droughts while
limited resources to irrigate soils could reduce crop outputs. Water shortages could also impact our manufacturing sites and our ability to supply water-based products. Our consumers could also face water shortages in their everyday activities in certain regions, creating a need for water-smart or waterless products or services.
▪ Extreme weather events could significantly disrupt our entire value chain. Sustained high temperatures could lead to reduced crop outputs due to reduction in soil productivity which could translate into higher raw material prices. Weather events such as hurricanes or floods, which would become increasingly common and intense, could cause plant outages or disrupt our distribution infrastructure. Additionally, macroeconomic negative shocks among affected communities could reduce or destroy consumer demand and purchasing power.
Actions taken: We're mitigating physical environment risks by investing in new products and formulations that work with less water, poor quality water or no water. Many of our hair care products now have fast-rinse technology as standard, using less water. We're expanding our water stewardship programme to 100 locations in water-stressed areas by 2030 (see page 30). We monitor changing weather patterns on a short-term basis and integrate weather system
Key risks and opportunities
Out of all the risks and opportunities we assessed, there are 11 which we believe are significant and we summarise these below. We have combined the outputs from the ‘proactive’ and ‘reactive’ analyses since the risks and opportunities are similar, with differences in the size and timing of impact. Where we have been able to quantify the risk, the ranges represent potential impacts of the different pathways.
Actions to mitigate the risks and capitalise on the opportunities have been consolidated into our Compass strategy (pages 8 to 11) and our CTAP (pages 51 to 56). Below we summarise the actions we're taking for each of the areas considered in our 1.5°C scenario assessments.
Regulatory risks: ▪ Carbon pricing includes carbon taxes and voluntary removal
or offset costs. Tightening regional or national regulations as well as climate commitments across individual businesses could drive widespread implementation of these taxes or market schemes. This could translate into rising direct and indirect costs linked to carbon emissions, where the strongest impact would likely be on costs of sales linked to raw materials, production, and distribution emissions. Carbon taxes on household emissions or costs passed through to our consumers linked to household emissions may impact their disposable income and ultimately their purchasing power.
▪ Land use regulation could drive reforms to radically restructure current global land use patterns to conserve and expand forest land, serving as the main natural carbon removal solution. This could reduce land available for food crops, pasture, and timber and hence access to our primary commodities which could drive reduced crop output and increase raw material prices.
▪ Product composition regulations could restrict or ban the use of certain GHG intensive components and ingredients in everyday products. This would require the redesign of products and packaging to comply, which could increase costs.
▪ Sourcing transparency and product labelling regulations could increase significantly through pressure from regulators, consumers, and investors. This could lead to disclosure compliance risks and rising commodity costs linked to radical transition to transparent supply chains, as well as a potential loss of market share to more transparent competitors.
▪ Extended producer responsibility (EPR) would mean that producers are held accountable for their environmental and social impacts across the product value chain. This could lead to improvements of lifecycle traceability from sourcing to managing end-of-life treatment of products and packaging. Circular product design and manufacturing practices could become a requirement in many regions to incentivise efficient and responsible resource extraction, and pass waste management costs through higher disposal and recycling fees to producers.
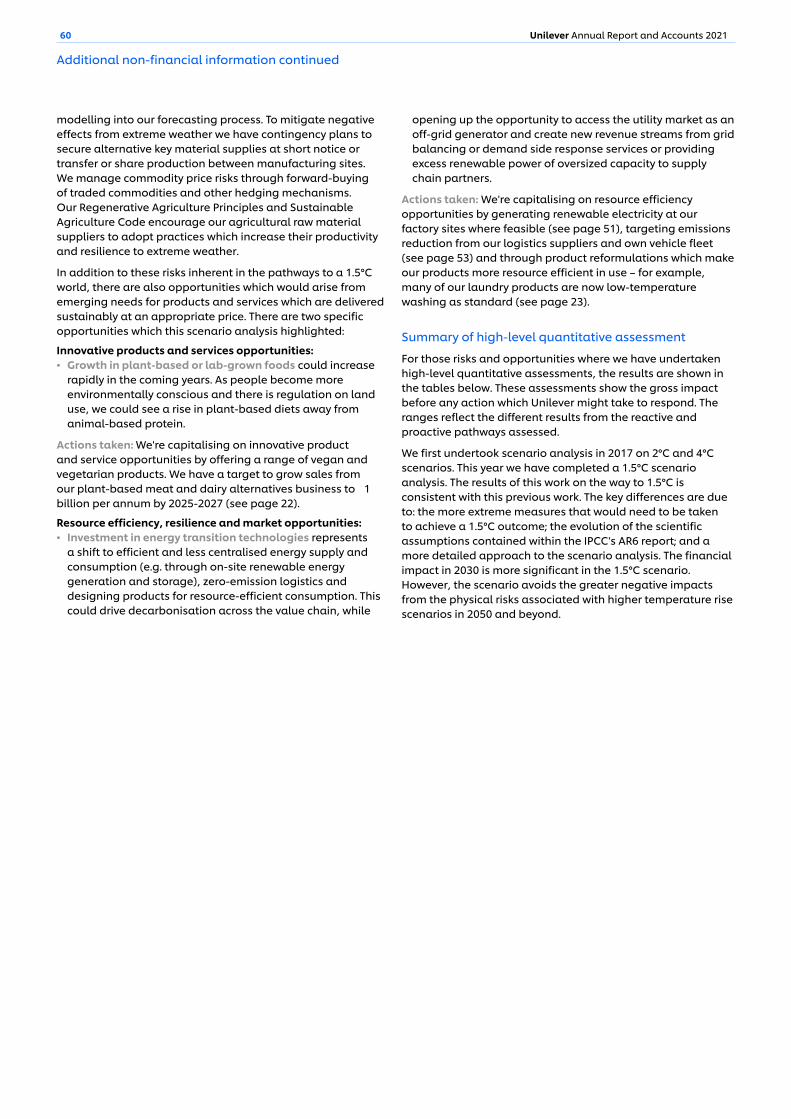
60 Unilever Annual Report and Accounts 2021
modelling into our forecasting process. To mitigate negative effects from extreme weather we have contingency plans to secure alternative key material supplies at short notice or transfer or share production between manufacturing sites. We manage commodity price risks through forward-buying of traded commodities and other hedging mechanisms. Our Regenerative Agriculture Principles and Sustainable Agriculture Code encourage our agricultural raw material suppliers to adopt practices which increase their productivity and resilience to extreme weather.
In addition to these risks inherent in the pathways to a 1.5°C world, there are also opportunities which would arise from emerging needs for products and services which are delivered sustainably at an appropriate price. There are two specific opportunities which this scenario analysis highlighted:
Innovative products and services opportunities: ▪ Growth in plant-based or lab-grown foods could increase
rapidly in the coming years. As people become more environmentally conscious and there is regulation on land use, we could see a rise in plant-based diets away from animal-based protein.
Actions taken: We're capitalising on innovative product and service opportunities by offering a range of vegan and vegetarian products. We have a target to grow sales from our plant-based meat and dairy alternatives business to €1 billion per annum by 2025-2027 (see page 22).
Resource efficiency, resilience and market opportunities: ▪ Investment in energy transition technologies represents
a shift to efficient and less centralised energy supply and consumption (e.g. through on-site renewable energy generation and storage), zero-emission logistics and designing products for resource-efficient consumption. This could drive decarbonisation across the value chain, while
opening up the opportunity to access the utility market as an off-grid generator and create new revenue streams from grid balancing or demand side response services or providing excess renewable power of oversized capacity to supply chain partners.
Actions taken: We're capitalising on resource efficiency opportunities by generating renewable electricity at our factory sites where feasible (see page 51), targeting emissions reduction from our logistics suppliers and own vehicle fleet (see page 53) and through product reformulations which make our products more resource efficient in use – for example, many of our laundry products are now low-temperature washing as standard (see page 23).
Summary of high-level quantitative assessment
For those risks and opportunities where we have undertaken high-level quantitative assessments, the results are shown in the tables below. These assessments show the gross impact before any action which Unilever might take to respond. The ranges reflect the different results from the reactive and proactive pathways assessed.
We first undertook scenario analysis in 2017 on 2°C and 4°C scenarios. This year we have completed a 1.5°C scenario analysis. The results of this work on the way to 1.5°C is consistent with this previous work. The key differences are due to: the more extreme measures that would need to be taken to achieve a 1.5°C outcome; the evolution of the scientific assumptions contained within the IPCC's AR6 report; and a more detailed approach to the scenario analysis. The financial impact in 2030 is more significant in the 1.5°C scenario. However, the scenario avoids the greater negative impacts from the physical risks associated with higher temperature rise scenarios in 2050 and beyond.
Additional non-financial information continued
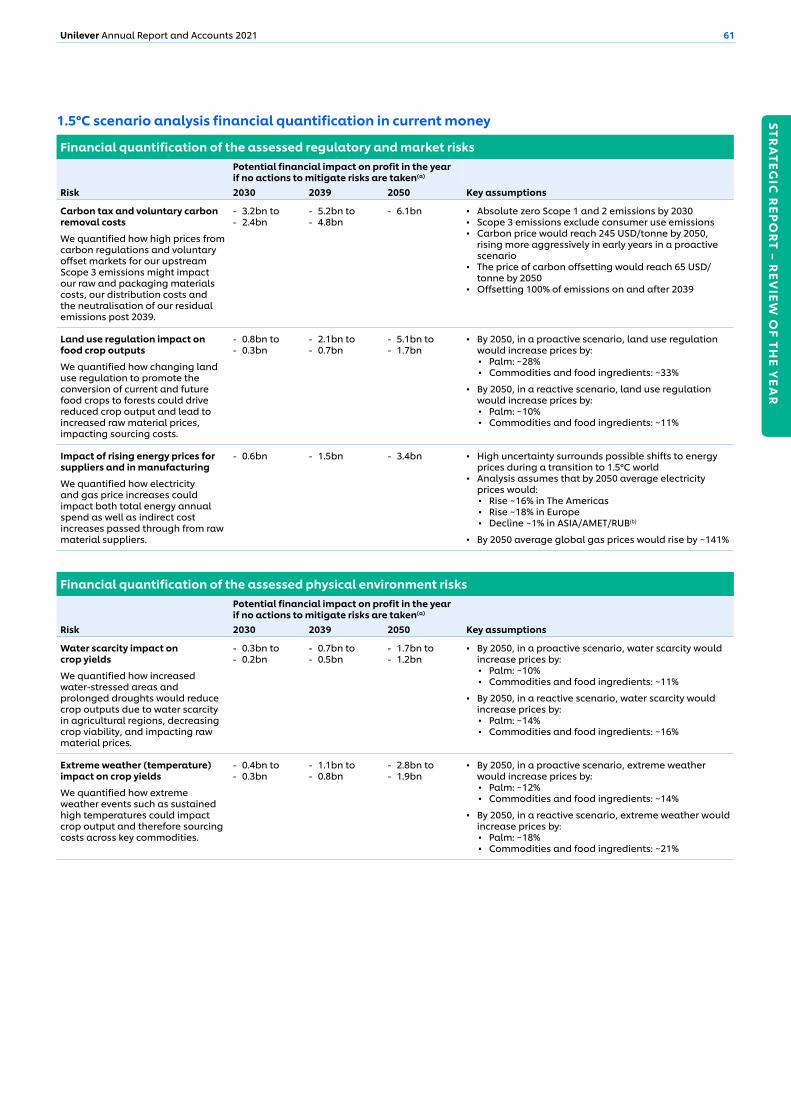
STRA
TEGIC
REP
OR
T – REV
IEW O
F THE Y
EAR
61Unilever Annual Report and Accounts 2021
1.5°C scenario analysis financial quantification in current money
Financial quantification of the assessed regulatory and market risks Potential financial impact on profit in the year if no actions to mitigate risks are taken(a)
Risk 2030 2039 2050 Key assumptions
Carbon tax and voluntary carbon removal costs
We quantified how high prices from carbon regulations and voluntary offset markets for our upstream Scope 3 emissions might impact our raw and packaging materials costs, our distribution costs and the neutralisation of our residual emissions post 2039.
-€3.2bn to -€2.4bn
-€5.2bn to -€4.8bn
-€6.1bn ▪ Absolute zero Scope 1 and 2 emissions by 2030 ▪ Scope 3 emissions exclude consumer use emissions ▪ Carbon price would reach 245 USD/tonne by 2050,
rising more aggressively in early years in a proactive scenario
▪ The price of carbon offsetting would reach 65 USD/tonne by 2050
▪ Offsetting 100% of emissions on and after 2039
Land use regulation impact on food crop outputs
We quantified how changing land use regulation to promote the conversion of current and future food crops to forests could drive reduced crop output and lead to increased raw material prices, impacting sourcing costs.
-€0.8bn to -€0.3bn
-€2.1bn to -€0.7bn
-€5.1bn to -€1.7bn
▪ By 2050, in a proactive scenario, land use regulation would increase prices by:
▪ Palm: ~28% ▪ Commodities and food ingredients: ~33%
▪ By 2050, in a reactive scenario, land use regulation would increase prices by:
▪ Palm: ~10% ▪ Commodities and food ingredients: ~11%
Impact of rising energy prices for suppliers and in manufacturing
We quantified how electricity and gas price increases could impact both total energy annual spend as well as indirect cost increases passed through from raw material suppliers.
-€0.6bn -€1.5bn -€3.4bn ▪ High uncertainty surrounds possible shifts to energy prices during a transition to 1.5°C world
▪ Analysis assumes that by 2050 average electricity prices would:
▪ Rise ~16% in The Americas ▪ Rise ~18% in Europe ▪ Decline ~1% in ASIA/AMET/RUB(b)
▪ By 2050 average global gas prices would rise by ~141%
Financial quantification of the assessed physical environment risksPotential financial impact on profit in the year if no actions to mitigate risks are taken(a)
Risk 2030 2039 2050 Key assumptions
Water scarcity impact on crop yields
We quantified how increased water-stressed areas and prolonged droughts would reduce crop outputs due to water scarcity in agricultural regions, decreasing crop viability, and impacting raw material prices.
-€0.3bn to -€0.2bn
-€0.7bn to -€0.5bn
-€1.7bn to -€1.2bn
▪ By 2050, in a proactive scenario, water scarcity would increase prices by:
▪ Palm: ~10% ▪ Commodities and food ingredients: ~11%
▪ By 2050, in a reactive scenario, water scarcity would increase prices by:
▪ Palm: ~14% ▪ Commodities and food ingredients: ~16%
Extreme weather (temperature) impact on crop yields
We quantified how extreme weather events such as sustained high temperatures could impact crop output and therefore sourcing costs across key commodities.
-€0.4bn to -€0.3bn
-€1.1bn to -€0.8bn
-€2.8bn to -€1.9bn
▪ By 2050, in a proactive scenario, extreme weather would increase prices by:
▪ Palm: ~12% ▪ Commodities and food ingredients: ~14%
▪ By 2050, in a reactive scenario, extreme weather would increase prices by:
▪ Palm: ~18% ▪ Commodities and food ingredients: ~21%
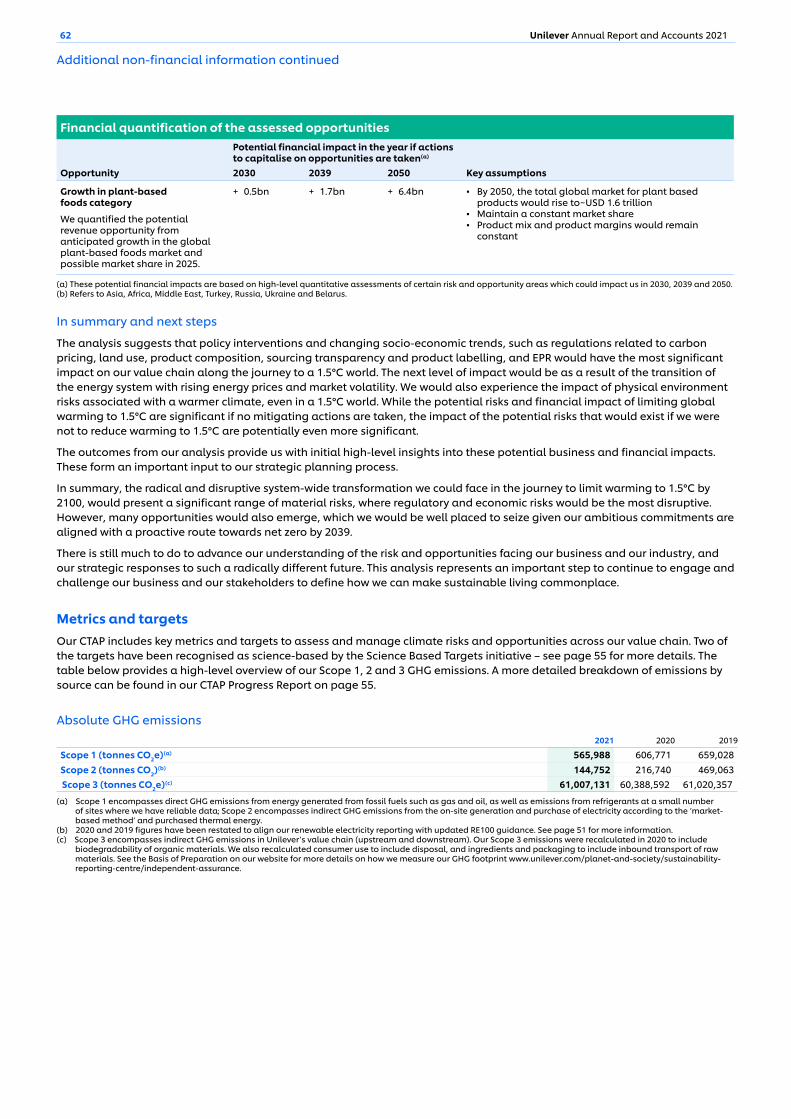
62 Unilever Annual Report and Accounts 2021
Financial quantification of the assessed opportunitiesPotential financial impact in the year if actions to capitalise on opportunities are taken(a)
Opportunity 2030 2039 2050 Key assumptions
Growth in plant-based foods category
We quantified the potential revenue opportunity from anticipated growth in the global plant-based foods market and possible market share in 2025.
+€0.5bn +€1.7bn +€6.4bn ▪ By 2050, the total global market for plant based products would rise to~USD 1.6 trillion
▪ Maintain a constant market share ▪ Product mix and product margins would remain
constant
(a) These potential financial impacts are based on high-level quantitative assessments of certain risk and opportunity areas which could impact us in 2030, 2039 and 2050.(b) Refers to Asia, Africa, Middle East, Turkey, Russia, Ukraine and Belarus.
In summary and next steps
The analysis suggests that policy interventions and changing socio-economic trends, such as regulations related to carbon pricing, land use, product composition, sourcing transparency and product labelling, and EPR would have the most significant impact on our value chain along the journey to a 1.5°C world. The next level of impact would be as a result of the transition of the energy system with rising energy prices and market volatility. We would also experience the impact of physical environment risks associated with a warmer climate, even in a 1.5°C world. While the potential risks and financial impact of limiting global warming to 1.5°C are significant if no mitigating actions are taken, the impact of the potential risks that would exist if we were not to reduce warming to 1.5°C are potentially even more significant. The outcomes from our analysis provide us with initial high-level insights into these potential business and financial impacts. These form an important input to our strategic planning process.
In summary, the radical and disruptive system-wide transformation we could face in the journey to limit warming to 1.5°C by 2100, would present a significant range of material risks, where regulatory and economic risks would be the most disruptive. However, many opportunities would also emerge, which we would be well placed to seize given our ambitious commitments are aligned with a proactive route towards net zero by 2039.
There is still much to do to advance our understanding of the risk and opportunities facing our business and our industry, and our strategic responses to such a radically different future. This analysis represents an important step to continue to engage and challenge our business and our stakeholders to define how we can make sustainable living commonplace.
Metrics and targetsOur CTAP includes key metrics and targets to assess and manage climate risks and opportunities across our value chain. Two of the targets have been recognised as science-based by the Science Based Targets initiative – see page 55 for more details. The table below provides a high-level overview of our Scope 1, 2 and 3 GHG emissions. A more detailed breakdown of emissions by source can be found in our CTAP Progress Report on page 55.
Absolute GHG emissions 2021 2020 2019
Scope 1 (tonnes CO2e)(a) 565,988 606,771 659,028Scope 2 (tonnes CO2)(b) 144,752 216,740 469,063Scope 3 (tonnes CO2e)(c) 61,007,131 60,388,592 61,020,357
(a) Scope 1 encompasses direct GHG emissions from energy generated from fossil fuels such as gas and oil, as well as emissions from refrigerants at a small number of sites where we have reliable data; Scope 2 encompasses indirect GHG emissions from the on-site generation and purchase of electricity according to the ‘market- based method’ and purchased thermal energy.
(b) 2020 and 2019 figures have been restated to align our renewable electricity reporting with updated RE100 guidance. See page 51 for more information. (c) Scope 3 encompasses indirect GHG emissions in Unilever’s value chain (upstream and downstream). Our Scope 3 emissions were recalculated in 2020 to include
biodegradability of organic materials. We also recalculated consumer use to include disposal, and ingredients and packaging to include inbound transport of raw materials. See the Basis of Preparation on our website for more details on how we measure our GHG footprint www.unilever.com/planet-and-society/sustainability-reporting-centre/independent-assurance.
Additional non-financial information continued
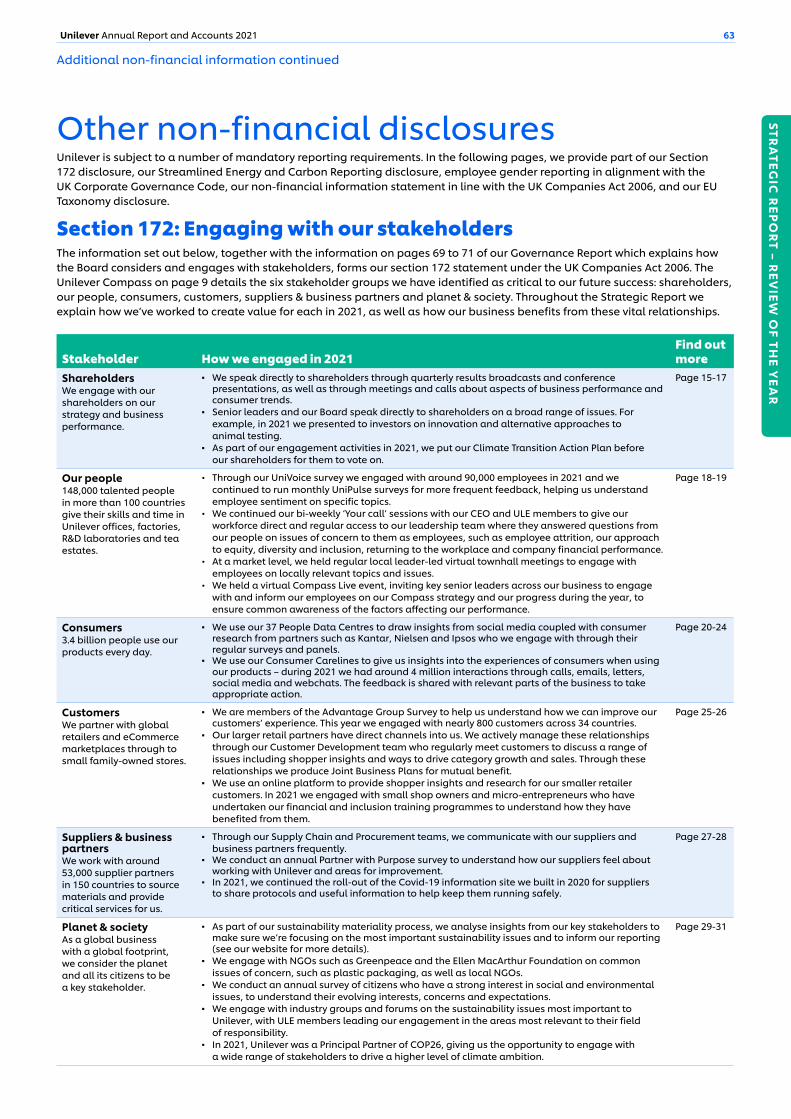
STRA
TEGIC
REP
OR
T – REV
IEW O
F THE Y
EAR
63Unilever Annual Report and Accounts 2021
Other non-financial disclosuresUnilever is subject to a number of mandatory reporting requirements. In the following pages, we provide part of our Section 172 disclosure, our Streamlined Energy and Carbon Reporting disclosure, employee gender reporting in alignment with the UK Corporate Governance Code, our non-financial information statement in line with the UK Companies Act 2006, and our EU Taxonomy disclosure.
Section 172: Engaging with our stakeholdersThe information set out below, together with the information on pages 69 to 71 of our Governance Report which explains how the Board considers and engages with stakeholders, forms our section 172 statement under the UK Companies Act 2006. The Unilever Compass on page 9 details the six stakeholder groups we have identified as critical to our future success: shareholders, our people, consumers, customers, suppliers & business partners and planet & society. Throughout the Strategic Report we explain how we’ve worked to create value for each in 2021, as well as how our business benefits from these vital relationships.
Stakeholder How we engaged in 2021Find out more
Shareholders We engage with our shareholders on our strategy and business performance.
▪ We speak directly to shareholders through quarterly results broadcasts and conference presentations, as well as through meetings and calls about aspects of business performance and consumer trends.
▪ Senior leaders and our Board speak directly to shareholders on a broad range of issues. For example, in 2021 we presented to investors on innovation and alternative approaches to animal testing.
▪ As part of our engagement activities in 2021, we put our Climate Transition Action Plan before our shareholders for them to vote on.
Page 15-17
Our people 148,000 talented people in more than 100 countries give their skills and time in Unilever offices, factories, R&D laboratories and tea estates.
• Through our UniVoice survey we engaged with around 90,000 employees in 2021 and we continued to run monthly UniPulse surveys for more frequent feedback, helping us understand employee sentiment on specific topics.
• We continued our bi-weekly ‘Your call’ sessions with our CEO and ULE members to give our workforce direct and regular access to our leadership team where they answered questions from our people on issues of concern to them as employees, such as employee attrition, our approach to equity, diversity and inclusion, returning to the workplace and company financial performance.
• At a market level, we held regular local leader-led virtual townhall meetings to engage with employees on locally relevant topics and issues.
• We held a virtual Compass Live event, inviting key senior leaders across our business to engage with and inform our employees on our Compass strategy and our progress during the year, to ensure common awareness of the factors affecting our performance.
Page 18-19
Consumers3.4 billion people use our products every day.
▪ We use our 37 People Data Centres to draw insights from social media coupled with consumer research from partners such as Kantar, Nielsen and Ipsos who we engage with through their regular surveys and panels.
▪ We use our Consumer Carelines to give us insights into the experiences of consumers when using our products – during 2021 we had around 4 million interactions through calls, emails, letters, social media and webchats. The feedback is shared with relevant parts of the business to take appropriate action.
Page 20-24
CustomersWe partner with global retailers and eCommerce marketplaces through to small family-owned stores.
▪ We are members of the Advantage Group Survey to help us understand how we can improve our customers’ experience. This year we engaged with nearly 800 customers across 34 countries.
▪ Our larger retail partners have direct channels into us. We actively manage these relationships through our Customer Development team who regularly meet customers to discuss a range of issues including shopper insights and ways to drive category growth and sales. Through these relationships we produce Joint Business Plans for mutual benefit.
▪ We use an online platform to provide shopper insights and research for our smaller retailer customers. In 2021 we engaged with small shop owners and micro-entrepreneurs who have undertaken our financial and inclusion training programmes to understand how they have benefited from them.
Page 25-26
Suppliers & business partnersWe work with around 53,000 supplier partners in 150 countries to source materials and provide critical services for us.
▪ Through our Supply Chain and Procurement teams, we communicate with our suppliers and business partners frequently.
▪ We conduct an annual Partner with Purpose survey to understand how our suppliers feel about working with Unilever and areas for improvement.
▪ In 2021, we continued the roll-out of the Covid-19 information site we built in 2020 for suppliers to share protocols and useful information to help keep them running safely.
Page 27-28
Planet & societyAs a global business with a global footprint, we consider the planet and all its citizens to be a key stakeholder.
▪ As part of our sustainability materiality process, we analyse insights from our key stakeholders to make sure we’re focusing on the most important sustainability issues and to inform our reporting (see our website for more details).
▪ We engage with NGOs such as Greenpeace and the Ellen MacArthur Foundation on common issues of concern, such as plastic packaging, as well as local NGOs.
▪ We conduct an annual survey of citizens who have a strong interest in social and environmental issues, to understand their evolving interests, concerns and expectations.
▪ We engage with industry groups and forums on the sustainability issues most important to Unilever, with ULE members leading our engagement in the areas most relevant to their field of responsibility.
▪ In 2021, Unilever was a Principal Partner of COP26, giving us the opportunity to engage with a wide range of stakeholders to drive a higher level of climate ambition.
Page 29-31
Additional non-financial information continued
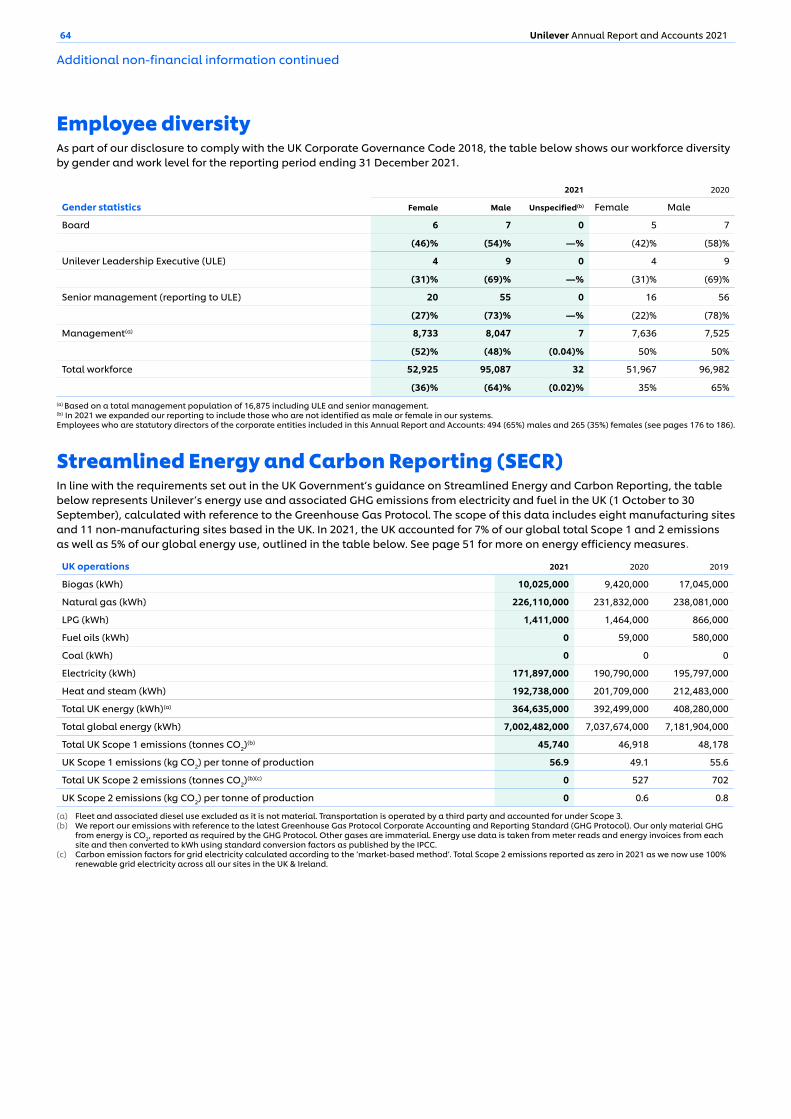
64 Unilever Annual Report and Accounts 2021
Employee diversityAs part of our disclosure to comply with the UK Corporate Governance Code 2018, the table below shows our workforce diversity by gender and work level for the reporting period ending 31 December 2021.
2021 2020
Gender statistics Female Male Unspecified(b) Female Male
Board 6 7 0 5 7
(46)% (54)% —% (42)% (58)%
Unilever Leadership Executive (ULE) 4 9 0 4 9
(31)% (69)% —% (31)% (69)%
Senior management (reporting to ULE) 20 55 0 16 56
(27)% (73)% —% (22)% (78)%
Management(a) 8,733 8,047 7 7,636 7,525
(52)% (48)% (0.04)% 50% 50%
Total workforce 52,925 95,087 32 51,967 96,982
(36)% (64)% (0.02)% 35% 65%(a) Based on a total management population of 16,875 including ULE and senior management.(b) In 2021 we expanded our reporting to include those who are not identified as male or female in our systems. Employees who are statutory directors of the corporate entities included in this Annual Report and Accounts: 494 (65%) males and 265 (35%) females (see pages 176 to 186).
Streamlined Energy and Carbon Reporting (SECR)In line with the requirements set out in the UK Government’s guidance on Streamlined Energy and Carbon Reporting, the table below represents Unilever’s energy use and associated GHG emissions from electricity and fuel in the UK (1 October to 30 September), calculated with reference to the Greenhouse Gas Protocol. The scope of this data includes eight manufacturing sites and 11 non-manufacturing sites based in the UK. In 2021, the UK accounted for 7% of our global total Scope 1 and 2 emissions as well as 5% of our global energy use, outlined in the table below. See page 51 for more on energy efficiency measures.
UK operations 2021 2020 2019
Biogas (kWh) 10,025,000 9,420,000 17,045,000
Natural gas (kWh) 226,110,000 231,832,000 238,081,000
LPG (kWh) 1,411,000 1,464,000 866,000
Fuel oils (kWh) 0 59,000 580,000
Coal (kWh) 0 0 0
Electricity (kWh) 171,897,000 190,790,000 195,797,000
Heat and steam (kWh) 192,738,000 201,709,000 212,483,000
Total UK energy (kWh)(a) 364,635,000 392,499,000 408,280,000
Total global energy (kWh) 7,002,482,000 7,037,674,000 7,181,904,000
Total UK Scope 1 emissions (tonnes CO2)(b) 45,740 46,918 48,178
UK Scope 1 emissions (kg CO2) per tonne of production 56.9 49.1 55.6
Total UK Scope 2 emissions (tonnes CO2)(b)(c) 0 527 702
UK Scope 2 emissions (kg CO2) per tonne of production 0 0.6 0.8
(a) Fleet and associated diesel use excluded as it is not material. Transportation is operated by a third party and accounted for under Scope 3.(b) We report our emissions with reference to the latest Greenhouse Gas Protocol Corporate Accounting and Reporting Standard (GHG Protocol). Our only material GHG
from energy is CO2, reported as required by the GHG Protocol. Other gases are immaterial. Energy use data is taken from meter reads and energy invoices from each site and then converted to kWh using standard conversion factors as published by the IPCC.
(c) Carbon emission factors for grid electricity calculated according to the ‘market-based method’. Total Scope 2 emissions reported as zero in 2021 as we now use 100% renewable grid electricity across all our sites in the UK & Ireland.
Additional non-financial information continued
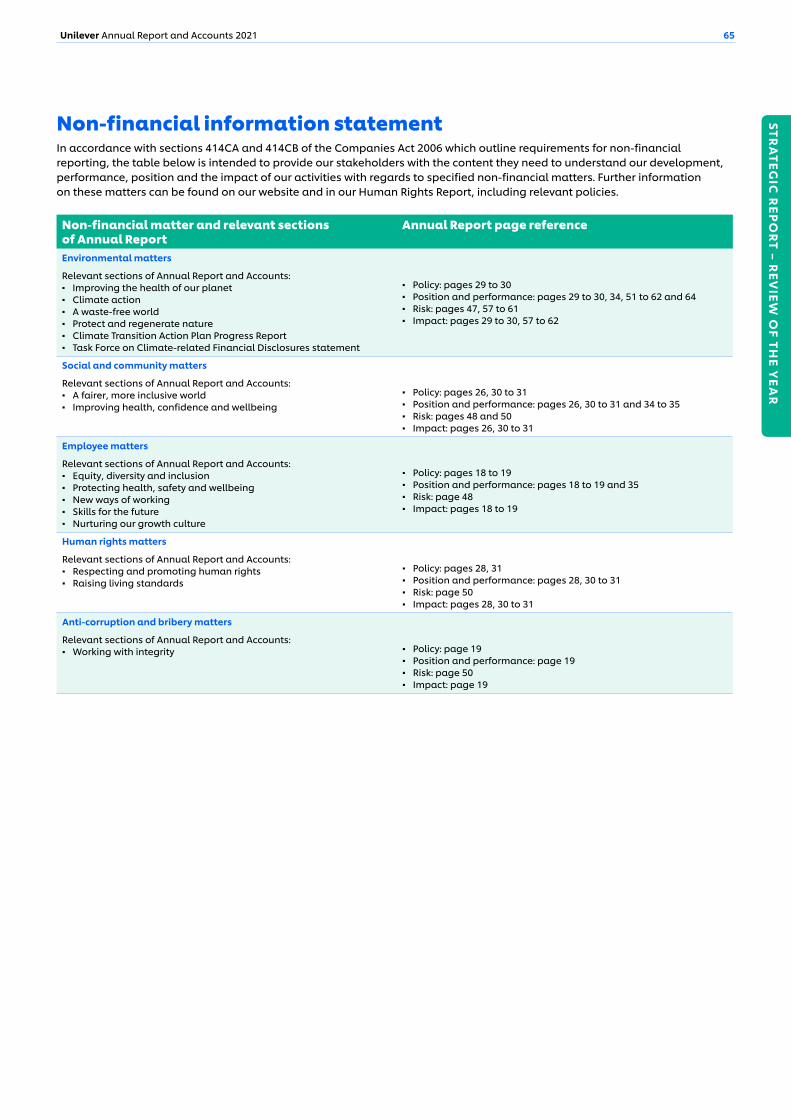
STRA
TEGIC
REP
OR
T – REV
IEW O
F THE Y
EAR
65Unilever Annual Report and Accounts 2021
Non-financial information statementIn accordance with sections 414CA and 414CB of the Companies Act 2006 which outline requirements for non-financial reporting, the table below is intended to provide our stakeholders with the content they need to understand our development, performance, position and the impact of our activities with regards to specified non-financial matters. Further information on these matters can be found on our website and in our Human Rights Report, including relevant policies.
Non-financial matter and relevant sections of Annual Report
Annual Report page reference
Environmental matters
Relevant sections of Annual Report and Accounts: ▪ Improving the health of our planet ▪ Climate action ▪ A waste-free world ▪ Protect and regenerate nature ▪ Climate Transition Action Plan Progress Report ▪ Task Force on Climate-related Financial Disclosures statement
▪ Policy: pages 29 to 30 ▪ Position and performance: pages 29 to 30, 34, 51 to 62 and 64 ▪ Risk: pages 47, 57 to 61 ▪ Impact: pages 29 to 30, 57 to 62
Social and community matters
Relevant sections of Annual Report and Accounts: ▪ A fairer, more inclusive world ▪ Improving health, confidence and wellbeing
▪ Policy: pages 26, 30 to 31 ▪ Position and performance: pages 26, 30 to 31 and 34 to 35 ▪ Risk: pages 48 and 50 ▪ Impact: pages 26, 30 to 31
Employee matters
Relevant sections of Annual Report and Accounts: ▪ Equity, diversity and inclusion ▪ Protecting health, safety and wellbeing ▪ New ways of working ▪ Skills for the future ▪ Nurturing our growth culture
▪ Policy: pages 18 to 19 ▪ Position and performance: pages 18 to 19 and 35 ▪ Risk: page 48 ▪ Impact: pages 18 to 19
Human rights matters
Relevant sections of Annual Report and Accounts: ▪ Respecting and promoting human rights ▪ Raising living standards
▪ Policy: pages 28, 31 ▪ Position and performance: pages 28, 30 to 31 ▪ Risk: page 50 ▪ Impact: pages 28, 30 to 31
Anti-corruption and bribery matters
Relevant sections of Annual Report and Accounts: ▪ Working with integrity ▪ Policy: page 19
▪ Position and performance: page 19 ▪ Risk: page 50 ▪ Impact: page 19
66 Unilever Annual Report and Accounts 2021
EU Taxonomy disclosuresNew legislation has been introduced this year to support the transition to a more sustainable economy and will continue to be augmented and amended. This includes the European Union’s Sustainable Finance Disclosure Regulation which incorporates new reporting obligations including the EU Taxonomy. The Taxonomy sets out certain economic activities which are deemed to be environmentally sustainable – referred to as ‘eligible activities’. It requires European businesses to disclose certain information about these eligible activities.
The EU Taxonomy is work in progress and in creating the current list of eligible activities the European Commission have not yet considered our industry, focusing instead on those industries where they believe there is most potential for climate change mitigation or adaptation. However, certain European companies are required to report against the current list of eligible activities for this year end. On the basis of the current eligible activity list and in accordance with the legislation, we have undertaken a review of the Group’s turnover, capital expenditure and operating expenditure (as defined by the EU Taxonomy) to identify the extent of any eligible activities within our business.
Turnover
▪ None of our turnover as detailed in our consolidated income statement (page 114) for the year ended 31 December 2021 is derived from eligible activities.
Capital expenditure (intangible assets and property, plant and equipment)
▪ 1% of our capital expenditure as detailed in our consolidated financial statements (pages 114 to 117) for the year ended 31 December 2021 is in respect of eligible activities. The activities identified are related to: (i) Construction and real estate; (ii) Water supply, sewerage, waste management and remediation; and (iii) Energy.
Operating expenditure
▪ Operating expenditure as per the EU Taxonomy is defined as directly incurred, non-capitalised costs relating to research and development, building renovations, short-term leases and the repair and maintenance of property, plant and equipment. 0% of our operating expenditure for the year ended 31 December 2021 is in respect of eligible activities.
WEF/IBC metrics The World Economic Forum (WEF) and the International Business Council (IBC) have defined a number of metrics and disclosures to help standardise environmental, social and governance reporting. Our Annual Report and Accounts includes a number of the 'core' WEF/IBC metrics and disclosures, including: Governing purpose (pages 8 to 9 and 72 to 73), Ethical behaviour (page 19), Risk and opportunity oversight (pages 44 to 46), Climate change (pages 51 to 62), and Employment and wealth generation (pages 112, 121 to 130, 163). Further information on core metrics will be available on our website in May.
See our website for more information on reporting standards
Additional non-financial information continued
GovernanceUnilever is subject to corporate governance requirements in the UK and as a foreign private issuer in the US. Here we describe how Unilever is governed, the role of our Board and its committees, and how our Directors are remunerated.
Governance review
67 Corporate governance78 Report of the Audit Committee80 Report of the Corporate Responsibility Committee82 Report of the Nominating and Corporate Governance Committee84 Directors' Remuneration Report
68 Unilever Annual Report and Accounts 2021
Corporate GovernanceUnilever's structureUnilever PLC (PLC) is the parent company of the Unilever Group, which was incorporated under the laws of England and Wales in 1894. PLC’s shares are traded through its listings on the London Stock Exchange and Euronext in Amsterdam, with its securities also traded on the New York Stock Exchange under its American Depositary Share programme.
The Board of PLC has implemented standards of corporate governance and disclosure policies applicable to a UK incorporated company, with listings in London, Amsterdam and New York.
Articles of associationThe current Articles of Association (Articles) were approved by shareholders at the 2021 AGM and adopted with effect from 5 May 2021. The amendments made to the Articles at the 2021 AGM brought the Articles up to date in a number of areas, including providing the ability to hold AGMs and general meetings in a hybrid format, meaning a combined physical and electronic general meeting enabling shareholders to choose whether they attend and vote in person or remotely through an electronic platform. PLC also retains the ability to hold AGMs and general meetings in the traditional way as a physical meeting without attendance via an electronic platform. No decision has been taken on how best to hold AGMs or general meetings in the future, but the Directors of PLC believe that it is important to have flexibility to hold AGMs or general meetings in a different format, which is what the changes to the Articles achieved. There were also a number of other changes to the Articles to reflect changes to company law and market practice.
Lapse of distributionsAny PLC dividend unclaimed after 12 years from the date of the declaration of the dividend by PLC reverts to PLC. Any unclaimed dividends may be invested or otherwise applied for the benefit of PLC while they are unclaimed. PLC may also cease to send any cheque for any dividend on any shares normally paid in that manner if the cheques in respect of at least two consecutive dividends have been returned to PLC or remain uncashed.
Unilever N.V., the former parent company of the Unilever Group alongside PLC, was merged in to PLC and dissolved in November 2020 (Unification). The time periods for the right to claim cash dividends or the proceeds of share distributions declared by Unilever N.V. before Unification will remain at 5 and 20 years, respectively, after the first day the dividend or share distribution was obtainable from Unilever N.V. Any such unclaimed amounts will revert to Unilever PLC after the expiry of these time periods.
Redemption provisions and capital callOutstanding PLC ordinary shares cannot be redeemed. PLC may make capital calls on money unpaid on shares and not payable on a fixed date. PLC has only fully paid shares in issue.
Modification of rightsModifications to PLC's Articles of Association must be approved by a general meeting of shareholders.
Modifications that prejudicially affect the rights and privileges of a class of PLC shareholders require the written consent of three-quarters of the affected holders (excluding treasury shares) or a special resolution passed at a general meeting of the class at which at least two persons holding or representing at least one-third of the paid-up capital (excluding treasury shares) must be present. Every shareholder is entitled to one vote per share held on a poll and may demand a poll vote. At any adjourned general meeting, present affected class holders may establish a quorum.
IndemnificationThe power to indemnify PLC Directors, together with former Directors, the Company Secretary and the directors of subsidiary companies, is provided for in PLC’s Articles of Association and deeds of indemnity have been agreed with all PLC Directors. Third-party directors’ and officers’ liability insurance was in place for such individuals throughout 2021 and is currently in force.
In addition, PLC provides indemnities (including, where applicable, a qualifying pension scheme indemnity provision) to the Directors of three subsidiaries, each of which acts or acted as trustee of a Unilever UK pension fund. Appropriate trustee liability insurance is also in place.
The Governance of UnileverA comprehensive description of Unilever's corporate governance arrangements, including further details on the structure of the Unilever Group, is set out in ‘The Governance of Unilever'. It further details the roles and responsibilities of the Chair, Senior Independent Director (SID), CEO, CFO and other corporate officers and how our Board effectively operates, governs itself and delegates its authorities.
The Governance of Unilever also describes Directors' appointment, tenure, induction and training, Directors' ability to seek independent advice at Unilever's expense and details about Board and Management Committees (including the Disclosure Committee). Unilever’s strong governance makes it well-placed to meet its strategic targets by ensuring it has effective risk management and internal controls, a diverse board, and high levels of engagement with stakeholders.
www.unilever.com/board-and-management-committees
BoardThe Board of PLC has ultimate responsibility for the management, general affairs, direction, culture, performance and long-term success of our business as a whole. The Directors lead by example, promoting Unilever's culture and acting with integrity. The majority of the Directors are independent Non-Executive Directors who essentially have a supervisory role, providing constructive challenges, strategic guidance and specialist advice. In the normal course, Unilever has two Executive Directors, the CEO and the CFO. A list of our current Directors can be found on pages 72 to 73.
Board CommitteesThe Board has established four Board Committees: the Audit Committee, the Compensation Committee, the Corporate Responsibility Committee, and the Nominating and Corporate Governance Committee. The terms of reference of these Committees can be found on our website and the reports of each Committee, including attendance at meetings in 2021, can be found on pages 73 and 78 to 104.
www.unilever.com/boardsofunilever
Board meetingsIn the ordinary course, six Board meetings are planned throughout the calendar year to consider important corporate events and actions, for example, the half-year and full-year results announcements; the development and approval of our strategy; oversight of the performance of the business; review of the risk framework; authorisation of major transactions; declaration of dividends; review of the financial plan; succession planning; review of the functioning of the Board and its Committees; culture; workforce engagement; and review of corporate responsibility. Other ad hoc Board meetings are convened to discuss strategic, transactional and governance matters that arise. A majority of Board meetings are held in the UK.
In 2021, due to the Covid-19 pandemic, the Board met physically in October and November only and these Board meetings took place in the UK. The Board held all other meetings in 2021 virtually, these being in February, March, May, June, July and September.
The Chair leads the Board and is responsible for its overall effectiveness in directing the Unilever Group. The Chair sets the Board’s agenda, ensures the Directors receive accurate, timely and clear information, promotes and facilitates constructive relationships and effective contribution of all the Executive and Non-Executive Directors, and promotes a culture of openness and debate. The Group Secretary supports the Board to ensure that it has the policies, processes, information, time and resources it needs to function effectively and efficiently.
When there is a Board meeting, the Non-Executive Directors usually meet also as a group, without the Executive Directors present. In 2021 they met six times. The Chair, or in his absence the SID, chairs such meetings.
The table showing the attendance of current Directors at Board meetings in 2021 can be found on page 73. If Directors are unable to attend a Board meeting, they have the opportunity beforehand to discuss any agenda items with the Chair.
69Unilever Annual Report and Accounts 2021
GO
VER
NA
NC
E REP
OR
T
Board evaluationEach year the Board formally assesses its own performance, including with respect to its composition, diversity and how effectively its members work together, with the aim of helping to improve the effectiveness of both the Board and the Committees. At least once every three years, an independent third party facilitates the evaluation. The last external evaluation was performed at the end of 2019 by No.4, an independent third party consultant, and consisted of individual interviews with the Directors followed by a Board discussion in January 2020, covering both the outcome of the evaluation and the proposed actions to enhance the effectiveness of the Board.
At the end of 2021, the Board performed an internal evaluation which consisted of the Directors completing a questionnaire that focused on a number of key areas including strategy, risk/financial controls, Board effectiveness, virtual ways of working, and information/knowledge. The Chair’s statement on pages 4 to 5 describes the key actions agreed by the Board following the internal evaluation.
The evaluation of the performance of the Chair and CEO is led by the SID and Chair respectively, and bespoke questionnaires are used to support these evaluations.
Committees of the Board evaluate themselves annually under supervision of their respective Chairs taking into account the views of respective Committee members and the Board. The key actions agreed by each Committee in the 2021 evaluations can be found in each Committee Report.
Board appointmentThe report of the Nominating and Corporate Governance Committee (NCGC) on pages 82 to 83 describes the work of the NCGC in Board appointments and recommendations for re-election. The procedure for the nomination and appointment of Directors is contained within the document entitled ‘Appointment procedure for PLC Directors' which is available on our website. Directors may be appointed by a simple majority vote of shareholders at a general meeting, or on an interim basis by the Board (in which case they will offer themselves for reappointment at the next AGM).
www.unilever.com/boardsofunilever
Board induction and trainingAll new Directors participate in a comprehensive induction programme when they join the Board. The Chair ensures that ongoing training is provided for Directors by way of site visits, presentations and circulated updates at (and between) Board and Board Committee meetings. The training covers, among other things, Unilever’s business, environmental, social, corporate governance, regulatory developments and investor relations matters. For example, in 2021 the Directors received presentations on our sustainability strategy, our people strategy, progress on our 5 Growth Fundamentals, and eCommerce.
Independence and conflictsIt is important that the Non-Executive Directors can be considered to be independent. Each year the Board conducts a thorough review of the Non-Executive Directors’, and their related or connected persons’, relevant relationships referencing the criteria set out in The Governance of Unilever which is derived from the relevant best practice guidelines in the UK and US. The Board currently considers all our Non-Executive Directors to be independent of Unilever for the purposes of the UK Corporate Governance Code.
We attach special importance to avoiding conflicts of interest between PLC and its Directors. The Board ensures that there are effective procedures in place to avoid conflicts of interest by Board members. A Director must without delay report any conflict of interest or potential conflict of interest to the Chair and to the other Directors, or, in case any conflict of interest or potential conflict of interest of the Chair, to the SID and to the other Directors. The Director in question must provide all relevant information to the Board, so that the Board can decide whether a reported (potential) conflict of interest of a Director qualifies as a conflict of interest within the meaning of the relevant laws. A Director may not take part in the decision-taking process of the Board in respect of any situation in which he or she has a conflict of interest. We consider the procedures that Unilever has put in place to deal with conflicts of interest operate effectively.
Unilever recognises the benefit to the individual and the Unilever Group of senior executives acting as directors of other companies but, to ensure outside directorships of our Executive Directors do not involve an excessive commitment or conflict of interest, the number of outside directorships of listed companies is generally limited to one per Executive Director and approval is required from the Chair.
Unilever, through the NCGC, assesses and monitors the structure of the Board including the other directorships held or proposed to be held by Non-Executive Directors. Unilever aims to have a Board with a diverse range of skills and capabilities and works to the principle that each Director shall have sufficient time available for the performance of his or her duties. Unilever considers that the other board responsibilities of its Non-Executive Directors, including those taken on during 2021, are fully consistent with these aims.
How the Board engages with employeesAs in previous years, given Unilever’s global footprint and scope of operations, the Board decided that the most effective way of organising its engagement with employees was to share the responsibility among all Non-Executive Directors as a collective point of contact. In 2021, Unilever published a Workforce Engagement Policy (further details can be found on our website) setting out our approach to workforce engagement, which is endorsed by the Board. A number of workforce engagement activities are provided for in the policy including face-to-face engagement sessions with Non-Executive Directors, engaging with employee representatives, townhall meetings, site visits, employee engagement surveys and Code of Business Principles reports. We believe that taking into account feedback from our workforce widens the diversity of our Board’s views when making business decisions.
At the start of the year, the Board discussed the progress on workforce engagement in 2020 and endorsed the programme for 2021. The Board considered workforce engagement valuable, offering the ability to tap into and understand different aspects of Unilever globally and to hear from people at all organisational levels, including junior employees. The engagements gave the Non-Executive Directors the ability to be systematically closer to markets and other parts of the business.
In 2021, the continuing Covid-19 pandemic meant we were required to hold workforce engagement activities virtually. Non-Executive Directors attended 14 virtual workforce engagement events across a diverse range of the workforce. This method of engagement provided Non-Executive Directors with the opportunity to meet and hear directly from cohorts of employees at all levels, geographies and Divisions across the business and allowed for discussions covering a wide range of topics.
Non-Executive Directors engaged with topics that are personal to the workforce including health and wellbeing, equity, diversity and inclusion, and compensation and incentives. Non-Executive Directors heard from employees on strategic initiatives during sessions dedicated to the Unilever Compass and sustainability, innovation, eCommerce, and a specific geography visit with employees in North Asia. Sessions were dedicated to ways of working with two sessions focused on the future of work initiatives hearing from employees on Unilever’s alternative employment models and those upskilling their teams and colleagues in future-fit skills. New hybrid ways of working were discussed with employees who had returned to offices. Non-Executive Directors connected with factory workers across three sessions hearing from employees in factories in Indonesia, Nigeria and Hungary as well as employee representatives from Italy. Lastly, Non-Executive Directors engaged with employees in the cyber security team to hear about their activities in managing this topic.
We collaborated with the European Works Council (EWC) in a number of areas. An engagement session was held with the EWC to share Unilever’s social commitments. We co-developed and hosted a future of work conference with the EWC, which was attended by a member of the ULE. The conference highlighted best practices, outlined future plans and committed to drive the future of work agenda across Europe through site visits and engagements. Throughout the year, we worked in a small group with the EWC focused on equity, diversity and inclusion, exploring opportunities to achieve a better gender balance in supply chain, for example, in relation to shift patterns and flexible working. In 2022, we intend to hold a joint conference with the EWC to promote the equity, diversity and inclusion agenda across Europe.
Perspectives from the workforce were taken into consideration in decision-making. For example: • Employee engagement survey (UniVoice) results from 2020 showed
a need to focus more on career development, so this was added to the HR priorities for 2021.

70 Unilever Annual Report and Accounts 2021
Unilever Compass strategic choices Board discussions Stakeholders consideredDevelop our portfolio into high growth spaces Our disposals and acquisitions: ekaterra and
Paula’s Choice Shareholders, our people, consumers, customers, planet & society
Win with our brands as a force for good, powered by purpose and innovation
Our approach to innovation and the Climate Transition Action Plan (CTAP)
Shareholders, our people, consumers, customers, suppliers & business partners, planet & society
Accelerate in USA, India, China and key growth markets
Growth strategies in USA, India and China Shareholders, our people, consumers, customers, suppliers & business partners, planet & society
Lead in the channels of the future Accelerating eCommerce and becoming the digital commerce partner of choice for customers
Shareholders, our people, consumers, customers
Build a purpose-led, future-fit organisation and growth culture
Our strategy for equity, diversity and inclusion (EDI)
Shareholders, our people, consumers, customers, suppliers & business partners, planet & society
• In the health and wellbeing engagement session, attendees suggested providing more training in this area. Line managers have access to training sessions, webinars, supporting material, bereavement guidance, Covid mental health guidebook, policies, online training plans, and a team energy tool.
• Our Senior Independent Director attended a town hall meeting in July 2021, which was an opportunity for all employees globally to engage with one of our Non-Executive Directors. Employees were able to ask questions and receive feedback on topics, such as gender diversity pipeline for the Board, hearing employee perspectives, growth opportunities, CEO pay ratio, living wage and gender pay equity.
• In an engagement session on the Unilever Compass, employees were able to ask Non-Executive Directors to leverage their networks to help expand Unilever's ability to influence stakeholders on sustainability.
• An engagement session on the U-work employment model (employees engaged on assignments) identified a need to further consider IT access and aspects of compensation based on stage of career. The Non-Executive Directors remain committed to ensuring employment rights continue for workers under the U-work model.
• In a session focused on North Asia, employees asked for feedback from the Non-Executive Directors on the business in China. The Non-Executive Directors confirmed that demand and production in China are both powerful and important to Unilever. They also confirmed business focus on sustainability and local product solutions in China.
• The Board believes that ensuring a culture that embraces differences without bias is key to stepping up diverse talent representation. This has been facilitated, for example, by inclusion workshops and catalyst conversations, starting with the ULE. The engagement activities in 2021 continue to be a success with positive feedback from employees and Non-Executive Directors alike. A survey of employees who attended found that 59% felt their session topic was extremely relevant to them, all felt they were given the opportunity to raise matters of interest to them and felt listened to, and all felt the sessions are an effective way for Unilever to engage with employees.
Non-Executive Directors found the virtual sessions allowed for effective dialogue with a broad range of employees. Therefore, we intend to continue with virtual connects in 2022 to access hard-to-reach sites and diverse Unilever communities.
Based on feedback from Non-Executive Directors, we will also look to carry out some in-person engagement sessions in 2022, subject to any travel restrictions caused by Covid-19.
Board discussions and decision-makingWithin our business model we have identified six stakeholder groups that are crucial to our ongoing success, see page 9. As part of our Section 172 of the UK Companies Act 2006 disclosure, below we detail how our Directors engaged with stakeholders and had regard to their interests when setting Unilever’s strategy and taking decisions concerning the business. This, along with the information on page 63 which explains how we engaged with our stakeholders in 2021 and the information on pages 69 to 70 which explains how we engaged with our employees in 2021, form our Section 172 statement.
With clear roles and responsibilities defined by the Governance of Unilever, the Board and the ULE work in tandem to ensure the success of the business, informed by the individual knowledge and experience Board members bring. Board meetings, knowledge sessions covering Unilever Compass topics, visits and an agreed programme of engagement with employees ensure the Board and ULE can come to a rounded view of the interests of stakeholders when making strategic decisions. In 2021, the ten Board visits were held virtually due to Covid-19 and included sessions with a number of key markets as well as detailed discussions on Unilever’s largest brands, Dove and Knorr.
The following section illustrates the key discussions and decisions of the Board in 2021, including highlighting how the Board considered the interests of stakeholders in the context of the strategic choices set out in the Unilever Compass.
Develop our portfolio into high growth spacesThe evolution of our portfolio into high growth spaces is an important part of our growth strategy. As one of the steps to deliver this strategy, the Board endorsed proposals to separate Unilever’s global tea brands into a new entity, to place them into a new company called ekaterra and then to sell ekaterra via an agreement reached in 2021 (see page 15). The Board concluded that ekaterra’s strong portfolio and positive momentum would enable it to prosper under new ownership, while the interests of Unilever would be served through a portfolio more focused on high-growth spaces.
We have also acquired new brands in pursuit of our strategy. Our most recent is Paula’s Choice, a digitally-led cruelty-free brand (see page 15). The acquisition represents a strong addition to Beauty & Personal Care’s Prestige beauty portfolio and supports Unilever’s expansion into this fast-growing market.
In June, the Board approved the acquisition of Paula’s Choice, noting its potential for growth and the strength it would bring to the business in terms of its appeal to consumers, particularly those seeking cruelty-free options and transparency on ingredients. The company’s long experience in digital commerce will also be invaluable as we pursue another of our strategic ambitions to become a leader in channels of the future.
Win with our brands as a force for good, powered by purpose and innovation We rely on our world class R&D capability to evolve our portfolio and capitalise on high growth opportunities. We’ve developed a number of focused science and technology initiatives to position the business for the future – based on clear priorities and disciplined execution of bigger projects. A number of these focus on opportunities from the low carbon transition. Home Care’s Clean Future strategy is already demonstrating the potential of our ambitious approach with high-performance renewable and recycled ingredients (see page 23). And through our Future Foods strategy we're developing lower carbon, plant-based foods alternatives (see page 22).
Our comprehensive Climate Transition Action Plan (CTAP) sets out how through our business, our purpose-led brands and our value chain partners we will transition to net zero emissions by 2039 and zero emissions in our operations by 2030. Innovation will play a key role in achieving these goals. The Board approved the CTAP’s creation in 2020 and supported our proactive stance in setting out this ambitious agenda, agreeing that it was a critical move for the long-term benefit of the business and society.
Corporate governance continued
71Unilever Annual Report and Accounts 2021
GO
VER
NA
NC
E REP
OR
T
We published the CTAP in 2021, with reference to a number of climate-related investor initiatives to ensure that it met investor expectations. The views of investors were canvassed by the Chair, CEO and CFO. Investors supported the publication of the CTAP, agreeing that it represented a well-considered approach to managing risk and opportunity.
The Board studied the cost assumptions underlying the CTAP and considered the long-term commercial gain from emissions reductions, noting that leveraging the power of Unilever’s value chain will be essential to drive the scale and pace of the change required. They also emphasised that citizens and consumers have increasing expectations of company action on climate change. The Board concluded that the CTAP will prove valuable in the future, particularly plans to communicate the carbon footprint of products. These footprints – which will require in-depth GHG lifecycle analysis by our R&D teams – will ultimately help consumers make lower carbon choices.
In March 2021, the Board agreed that the CTAP should be put to a non-binding advisory vote at the AGM in May, where it received overwhelming support with over 99% of votes in favour.
Accelerate in USA, India, China and key growth marketsDuring the year the Board scrutinised progress against the Unilever Compass strategy. Underpinning the success of the Unilever Compass are the 5 Growth Fundamentals (see page 9) – which are being driven with discipline throughout Unilever to improve the operation of the business. In addition, they held in-depth discussions with our three biggest businesses – the USA, India and China – to analyse progress on growth in these important markets.
In discussions with the US leadership team, the Board noted that the USA represents a very competitive and volatile market. The US business is building its competitiveness, and growing the proportion of the business sold through eCommerce remains a priority. It is working closely with customers, for example by creating customised product ranges for them, while boosting its premium product portfolio. Ensuring its brands serve the varying needs of consumers, for example the Hispanic population, has also been identified as a priority.
The Board’s discussion with our Indian business focused on the continued resilience of Hindustan Unilever during 2021 and the opportunities over the next decade as internet access increases and the Indian economy expands. Hindustan Unilever is pursuing growth in line with the Unilever Compass – with a particular focus on making good nutrition accessible and building our beauty brands. Recognising that these plans respond to consumer needs, the Board endorsed Hindustan Unilever’s strategic growth ambitions.
In China, consumers’ passion for digital commerce continues to rise. The Board spoke to the Unilever China leadership team and studied an example of how the Chinese business had benefited from improving its digital capabilities. By connecting real-time social media advertising to eCommerce sites, it was able to track the effectiveness of its advertising in converting to sales, and ultimately to derive a bigger return on its marketing investment. Integrating digital processes is a company-wide imperative to support growth, and Unilever has placed a high priority on training for employees, particularly for those in marketing (see page 19).
From its workforce engagement discussions with employees (see page 69), the Board recognised the importance of localised products and solutions for Chinese consumers, and urged Unilever China to continue developing its portfolio of in-home foods, hygiene, and health and wellbeing brands.
Lead in the channels of the futureOnline commerce continues to grow, a trend that accelerated as people switched to digital channels during the pandemic. The Board keeps close track of Unilever’s strategic choice to lead in the channels of the future, which goes hand in hand with the strategic choice to accelerate growth in key markets.
The Board focused on eCommerce during its July meeting and Unilever’s aim to become the digital commerce partner of choice for customers. To achieve this, we are developing our capabilities across business-to-business (B2B) and business-to-consumer (B2C) channels. At the same time, we are exploring new business models and new routes to market in our aim to help customers – both large and small – grow their businesses.
Digital commerce also featured prominently in the Board’s virtual visit programme during the year as business leaders, from markets as disparate as Brazil to Benelux, explained its importance in winning in the marketplace. For example, the Board discussed how the Chinese business is investing in people to deliver on this fast-moving agenda: recruiting from a highly competitive market and equipping existing employees with specialist skillsets such as data science. This visit reinforced a discussion in the workforce engagement programme, where earlier in the year the Board had emphasised the vital role of the Chinese business in delivering Unilever’s growth strategy.
The Board was pleased to see that Unilever’s initiatives are paying off, with eCommerce growing by 44% to reach 13% of turnover in 2021. Board members considered that accelerating this momentum remains crucial to the future success of the business.
Build a purpose-led, future-fit organisation and growth culture The Board reviewed Unilever’s plans for a new organisational model during its annual strategy discussions in 2021. It noted that the objectives of the simplified model were to create a leaner and faster organisation that is better able to respond to a fast-changing and intensely competitive environment. Employee feedback had also echoed the need for greater speed and agility. Five new category-focused Business Groups will equip Unilever to be more responsive to consumer and channel trends as each Group will be accountable for its strategy, growth, and profit delivery.
Through its Compass goals, Unilever is driving equity, diversity and inclusion in its culture and workforce, through its brands, in its advertising and among its suppliers.
The Board considers that a bias-free culture is crucial if we are to benefit from the talent of a diverse workforce, a view that was reinforced through our workforce engagement where gender diversity and gender pay equity were raised by employees.
The CEO chairs Unilever’s Global Diversity Board and the Board’s Corporate Responsibility Committee (CRC) also regularly reviews the topic. The Committee welcomed Unilever’s comprehensive strategy and supported Unilever’s drive to maximise the use of tools and data-driven insights to inform decision-making, for example to ensure fairness in recruitment and appointments. To support this improved decision-making, we are using a mix of behavioural science and data to shed light on our senior leaders’ hiring patterns.
Unilever’s equity, diversity and inclusion strategy focuses on four areas: gender; race and ethnicity; people with disabilities; and LGBTQI+ communities. The CRC probed the detail of this strategy, enabling it to see, for example, how we are determining a baseline on people with disabilities to inform our future steps and how we are equipping eight countries to support advocacy on human rights and freedom from discrimination. And through a Board knowledge session, our objective to increase the representation of women across the business was also discussed.
Further illustrations of this strategy in action were shared in many of the Board virtual visits, for instance Unilever’s team in Brazil explained their targets to ensure equality of opportunity for Black and mixed-race people (who make up half of the Brazilian population) in leadership roles – so that leaders reflect the societies they live in and the consumers they serve. And at a brand level, the Board engaged with Dove’s team who shared their work to challenge systemic race-based hair discrimination through The CROWN Act.

72 Unilever Annual Report and Accounts 2021
Committee membership key
ChairAC Audit CommitteeCC Compensation Committee
CR Corporate Responsibility CommitteeNC Nominating and Corporate Governance Committee
Our Board of Directors
Nils AndersenChair
Nationality DanishAge 63, MaleAppointed April 2015 CC NC
Andrea JungVice Chair/Senior Independent Director
NationalityAmerican/CanadianAge 62, FemaleAppointed May 2018 CC
Alan JopeCEO
Nationality BritishAge 57, MaleAppointed CEO January 2019Appointed DirectorMay 2019
Current external appointments: AKZO Nobel N.V. (Chair); Worldwide Flight Services (Chair); Salling Foundation (NED); European Round Table of Industrialists (Member).
Previous experience: Faerch Plast (Chair); Salling Group (Chair); BP plc (NED); A.P. Moller – Maersk A/S (Group CEO); Carlsberg A/S and Carlsberg Breweries A/S (CEO); European Round Table of Industrialists (Vice-Chairman); Unifeeder S/A (Chairman).
Current external appointments: Grameen America Inc. (President and CEO); Apple Inc. (NED); Wayfair Inc. (NED).
Previous experience: Avon Products Inc. (CEO); General Electric (Board member); Daimler AG (Board member).
Current external appointments: Generation Unlimited (Chair).
Previous experience: Beauty & Personal Care Division (President); Unilever Russia, Africa and Middle East (President); Unilever North Asia (President); SCC and Dressings (Global Category Leader); Home and Personal Care North America (President).
Graeme PitkethlyCFO
Nationality BritishAge 55, MaleAppointed CFO October 2015Appointed DirectorApril 2016
Laura ChaNon-Executive Director
Nationality ChineseAge 72, Female Appointed May 2013 NC CC
Judith HartmannNon-Executive Director
Nationality AustrianAge 52, Female Appointed April 2015 AC
Current external appointments: Pearson Plc (NED); Financial Stability Board Task Force on Climate-related Financial Disclosures (Vice Chair); The 100 Group Main Committee (Vice Chair); UN Global Compact CFO Task Force.
Previous experience: Unilever UK and Ireland (EVP and General Manager); Finance Global Markets (EVP); Group Treasurer; Head of M&A; FLAG Telecom (VP Corporate Development); PwC
Current external appointments: Hong Kong Exchanges and Clearing Ltd (Chair); Foundation Asset Management Sweden AB (Senior International Adviser); Executive Council of the Hong Kong Special Administrative Region (Non-official member); CSRC International Advisory Council (Vice Chair).
Previous experience: HSBC Holdings plc (NED); Securities and Futures Commission, Hong Kong (Deputy Chair); China Securities Regulatory Commission (Vice Chair); China Telecom Corporation Limited (NED); 12th National People’s Congress of China (Hong Kong Delegate).
Current external appointments: None
Previous experience: ENGIE Group (Deputy CEO); Suez (NED); General Electric (various roles); Bertelsmann SE & Co. KGaA (CFO); RTL Group SA (NED); Penguin Random House LLC (NED).
Adrian HennahNon-Executive Director
Nationality BritishAge 64, MaleAppointed November 2021 AC
Susan KilsbyNon-Executive Director
Nationality American/British
Age 63, FemaleAppointed August 2019 AC
Ruby LuNon-Executive Director
Nationality ChineseAge 51, FemaleAppointed November 2021 NC CC
Current external appointments: J Sainsbury plc (NED); Oxford Nanopore Technologies plc (NED).
Previous experience: Reckitt Benckiser Group plc (Executive Director); RELX plc (NED).
Current external appointments: Fortune Brands Home & Security Inc. (Chair); Diageo plc (Senior Independent Director); NHS England (Board Member).
Previous experience: BHP plc (NED); L’Occitane International (NED); Keurig Green Mountain (NED); Coca-Cola HBC AG (NED); Goldman Sachs International (NED); Shire plc (Chair); Mergers and Acquisitions, EMEA – Credit Suisse (Chair).
Current external appointments: Uxin Limited (NED); Yum China Holdings Inc. (NED).
Previous experience: iKang Healthcare Group, (NED); Blue City Holdings Limited (NED).
Our Non-Executive Directors bring diverse experience to the Board’s strategic discussions and decision-making
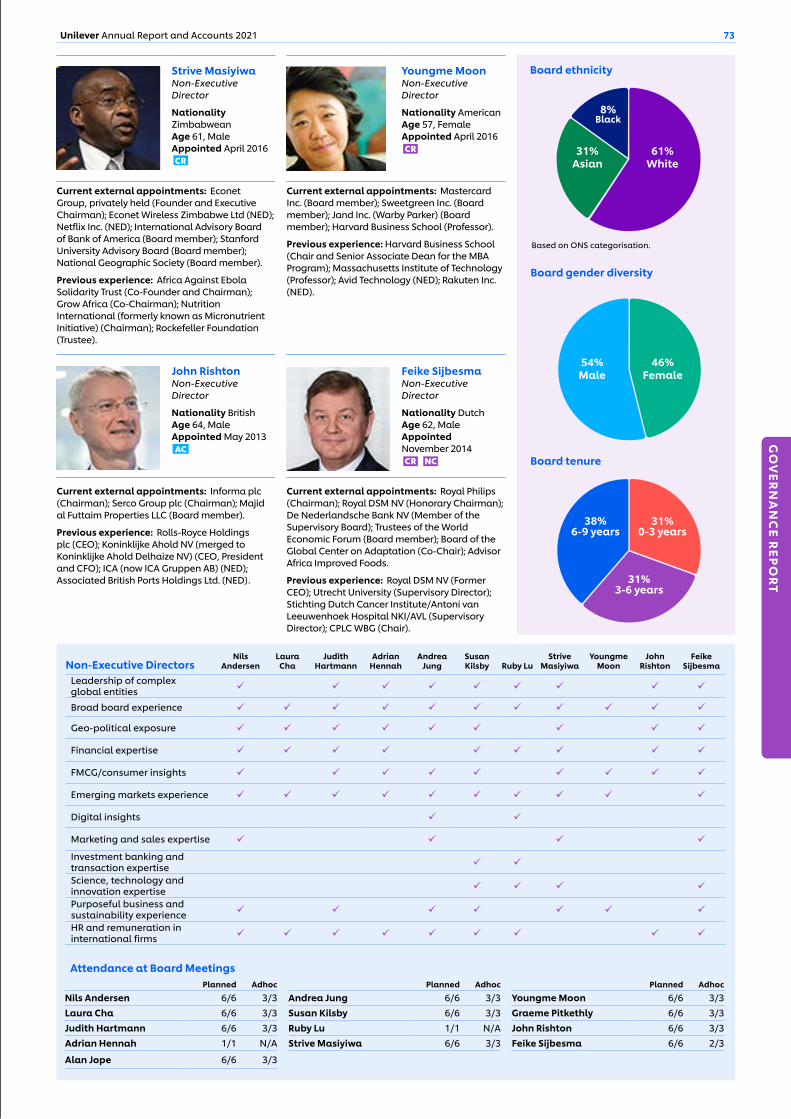
Board tenure
38%6-9 years
31%0-3 years
31%3-6 years
Board ethnicity
61%White
31%Asian
8%Black
Board gender diversity
54%Male
46%Female
73Unilever Annual Report and Accounts 2021
GO
VER
NA
NC
E REP
OR
T
Non-Executive DirectorsNils
AndersenLaura
ChaJudith
HartmannAdrian
HennahAndrea
JungSusan Kilsby Ruby Lu
Strive Masiyiwa
Youngme Moon
John Rishton
Feike Sijbesma
Leadership of complex global entities ü ü ü ü ü ü ü ü ü
Broad board experience ü ü ü ü ü ü ü ü ü ü ü
Geo-political exposure ü ü ü ü ü ü ü ü ü
Financial expertise ü ü ü ü ü ü ü ü ü
FMCG/consumer insights ü ü ü ü ü ü ü ü ü
Emerging markets experience ü ü ü ü ü ü ü ü ü ü
Digital insights ü ü
Marketing and sales expertise ü ü ü ü
Investment banking and transaction expertise ü ü
Science, technology and innovation expertise ü ü ü ü
Purposeful business and sustainability experience ü ü ü ü ü ü ü
HR and remuneration in international firms ü ü ü ü ü ü ü ü ü
Strive MasiyiwaNon-Executive Director
Nationality ZimbabweanAge 61, MaleAppointed April 2016 CR
Youngme MoonNon-Executive Director
Nationality American Age 57, FemaleAppointed April 2016 CR
Current external appointments: Econet Group, privately held (Founder and Executive Chairman); Econet Wireless Zimbabwe Ltd (NED); Netflix Inc. (NED); International Advisory Board of Bank of America (Board member); Stanford University Advisory Board (Board member); National Geographic Society (Board member).
Previous experience: Africa Against Ebola Solidarity Trust (Co-Founder and Chairman); Grow Africa (Co-Chairman); Nutrition International (formerly known as Micronutrient Initiative) (Chairman); Rockefeller Foundation (Trustee).
Current external appointments: Mastercard Inc. (Board member); Sweetgreen Inc. (Board member); Jand Inc. (Warby Parker) (Board member); Harvard Business School (Professor).
Previous experience: Harvard Business School (Chair and Senior Associate Dean for the MBA Program); Massachusetts Institute of Technology (Professor); Avid Technology (NED); Rakuten Inc. (NED).
John RishtonNon-Executive Director
Nationality BritishAge 64, MaleAppointed May 2013 AC
Feike SijbesmaNon-Executive Director
Nationality Dutch Age 62, MaleAppointed November 2014 CR NC
Current external appointments: Informa plc (Chairman); Serco Group plc (Chairman); Majid al Futtaim Properties LLC (Board member).
Previous experience: Rolls-Royce Holdings plc (CEO); Koninklijke Ahold NV (merged to Koninklijke Ahold Delhaize NV) (CEO, President and CFO); ICA (now ICA Gruppen AB) (NED); Associated British Ports Holdings Ltd. (NED).
Current external appointments: Royal Philips (Chairman); Royal DSM NV (Honorary Chairman); De Nederlandsche Bank NV (Member of the Supervisory Board); Trustees of the World Economic Forum (Board member); Board of the Global Center on Adaptation (Co-Chair); Advisor Africa Improved Foods.
Previous experience: Royal DSM NV (Former CEO); Utrecht University (Supervisory Director); Stichting Dutch Cancer Institute/Antoni van Leeuwenhoek Hospital NKI/AVL (Supervisory Director); CPLC WBG (Chair).
Attendance at Board Meetings Planned Adhoc Planned Adhoc Planned Adhoc
Nils Andersen 6/6 3/3 Andrea Jung 6/6 3/3 Youngme Moon 6/6 3/3Laura Cha 6/6 3/3 Susan Kilsby 6/6 3/3 Graeme Pitkethly 6/6 3/3Judith Hartmann 6/6 3/3 Ruby Lu 1/1 N/A John Rishton 6/6 3/3Adrian Hennah 1/1 N/A Strive Masiyiwa 6/6 3/3 Feike Sijbesma 6/6 2/3
Alan Jope 6/6 3/3
Based on ONS categorisation.

74 Unilever Annual Report and Accounts 2021
Unilever Leadership Executive (ULE)Our executive management team is responsible for the day-to-day running of the business and the execution of our strategy.
The Board has delegated the operational running of the Unilever Group to the CEO with the exception of the following matters which are reserved for the Board, as more fully set out in the Governance of Unilever:: structural and constitutional matters, corporate governance, approval of dividends, approval and monitoring of overall strategy for the Unilever Group, approval of significant transactions or arrangements in relation to mergers, acquisitions, joint ventures and pensions. The CEO is responsible to the Board in relation to the operational running of the Group and other powers delegated to him by the Board. The CEO can delegate any of his powers and discretions, and he does so delegate to members of the ULE (with power to sub-delegate).
The ULE is composed of the CEO, CFO and other senior executives who assist the CEO in the discharge of the powers delegated to the CEO by the Board. Members of the ULE report to the CEO, and the CEO supervises and determines the roles, activities and responsibilities of the ULE. While ULE members (other than the CEO and the CFO) are not part of the Board decision-making process, to provide the Board with deeper insights, ULE members often attend those parts of the Board meetings which relate to the operational running of the Group. The ULE currently consists of the CEO, CFO and those listed below. As announced on 25 January 2022, there will be some changes to the leadership team with effect from 1 April 2022. These are indicated below.
For Alan Jope and Graeme Pitkethly, see page 72ULE as at December 31 2021*For ULE changes and new appointments, see page 75
Conny BraamsChief Digital & Marketing Officer
Nationality Dutch Age 56, FemaleAppointed to ULE January 2020Joined Unilever 1990
Reginaldo Ecclissato*Chief Business Operations Officer
Nationality BrazilianAge 53, MaleAppointed to ULE January 2022 (replacing Marc Engel)Joined Unilever 1991
Hanneke Faber*President, Foods & Refreshment
Nationality Dutch Age 52, FemaleAppointed to ULE January 2018Joined Unilever 2018
Current external appointments: Kröller-Müller Museum (Advisory Board member); Rotterdam School of Management, Erasmus University (Advisory Board member).
Previous Unilever posts include: Unilever Middle Europe (EVP); Unilever Benelux (Chair and EVP); Home Care Europe (EVP); Unilever Food Solutions Asia, Africa and Middle East (EVP); various Unilever marketing and general management roles.
Previous Unilever posts include: EVP for Mexico, Caribbean, and Central America; EVP Supply Chain for North America and Latin America; VP Supply Chain, Home Care for the Americas.
Current external appointments: Tapestry Inc. (NED); FoodDrinkEurope (Board member); Leading Executives Advancing Diversity (LEAD) (Advisory Board member); Pepsi/Lipton JV (Board member).
Previous posts include: Bayer AG (Supervisory Board member); Royal Ahold Delhaize (CEIO & EC member); Royal Ahold (CCO & EC member); P&G (VP & GM).
Previous Unilever posts include: Europe (President).
Fabian Garcia*President, North America
Nationality American Age 62, MaleAppointed to ULE January 2020Joined Unilever 2019
Sunny Jain*President, Beauty & Personal Care
Nationality CanadianAge 46, MaleAppointed to ULE June 2019Joined Unilever 2019
Sanjiv MehtaPresident, Unilever, South Asia and Chair and Managing Director, Hindustan Unilever
Nationality Indian Age 61, MaleAppointed to ULE May 2019Joined Unilever 1992
Current external appointments: Council of Foreign Relations in the US (member); Arrow Electronics (Board member).
Previous posts include: Revlon (President and CEO); Colgate Palmolive (COO; President of the Asia/Pacific Division, EVP Latin America); P&G (President of Asia Pacific, General Manager of Venezuela).
Previous posts include: Amazon.com Inc. (Head of Core Consumables/FMCG Retail; VP Consumables/FMCG Innovation); P&G US and P&G Canada (various roles in New Business Creation, Marketing, Sales and Information Technology).
Current external appointments: Board of Indian School of Business (Director); Federation of Indian Chambers of Commerce and Industry (Senior Vice President); Breach Candy Hospital Trust (member); South Asia Advisory Board of Harvard Business School (member); Xynteo’s ‘India 2022’ (Chair); Advisory Network to the High Level Panel for a Sustainable Ocean Economy (Co-Chair).
Previous Unilever posts include: Advisory Network to the High Level Panel for a Sustainable Ocean Economy (Co-Chair); Unilever North Africa and Middle East (Chair and CEO); Unilever Philippines Inc. (Chair and CEO); Unilever Bangladesh Limited (Chair and Managing Director).
ULE gender diversity
31%Female
69%Male
ULE ethnicity
Hisp/Latino
54%White
31%Asian
15% Otherethnic group
75Unilever Annual Report and Accounts 2021
GO
VER
NA
NC
E REP
OR
T
Leena Nair*Chief HR Officer
Nationality British Age 52, FemaleAppointed to ULE March 2016Joined Unilever 1992 (left on 31 January 2022)
Nitin Paranjpe*Chief Operating Officer
Nationality Indian Age 58, MaleAppointed to ULE October 2013Joined Unilever 1987
Richard SlaterChief R&D Officer
Nationality British Age 44, MaleAppointed to ULE April 2019Joined Unilever 2019
Current external appointments: BT Plc (NED).
Previous Unilever posts include: HR Leadership and Organisational Development and Global Head of Diversity (SVP); Hindustan Unilever Limited (Executive Director HR); Hindustan Lever (various roles).
Current external appointments: Heineken N.V. (Member of the Supervisory Board).
Previous Unilever posts include: Foods & Refreshment (President); Home Care (President); Unilever South Asia (EVP) and Hindustan Unilever Limited (CEO); Home and Personal Care India (EVP); Home Care India (VP); senior positions in Laundry and Household Care.
Previous posts include: GSK (Head of R&D, Consumer Healthcare); Reckitt Benckiser (Head of R&D, Consumer Healthcare); Reckitt Benckiser (Global Group Director/VP R&D Personal Care; Global Director R&D Aircare, Analgesics and New Brands); Boots Healthcare (various roles).
Ritva Sotamaa*Chief Legal Officer & Group Secretary
Nationality Finnish Age 58, FemaleAppointed to ULE February 2013Joined Unilever 2013
Peter ter Kulve*President, Home Care
Nationality Dutch Age 57, MaleAppointed to ULE May 2019Joined Unilever 1988
ULE changes and new appointments with the new Compass organisationMatt Close Appointed as Business Group President Ice Cream
(newly created role)
Reginaldo Ecclissato Appointed as Chief Business Operations Officer (newly created role)
Marc Engel Left role as Chief Supply Chain Officer (on 31 December 2021)
Hanneke Faber Appointed as Business Group President Nutrition (newly created role)
Fernando Fernandez Appointed as Business Group President Beauty and Wellbeing (newly created role)
Fabian Garcia Appointed as Business Group President Personal Care (newly created role)
Sunny Jain Leaving role as President, Beauty & Personal Care (will leave Unilever on 1 April 2022)
Leena Nair Left role as Chief HR Officer (on 31 January 2022)
Nitin Paranjpe Appointed as Chief Transformation Officer & Chief People Officer (newly created role)
Ritva Sotamaa Leaving role as Chief Legal Officer and Group Secretary (will leave Unilever on 1 April 2022)
Peter ter Kulve Appointed as Business Group President Home Care (newly created role)
Maria Varsellona Appointed as Chief Legal Officer & Group Secretary (replacing Ritva Sotamaa from 1 April 2022)
Current external appointments: Fiskars Corporation (NED).
Previous posts include: Siemens AG – Siemens Healthcare (GC); General Electric Company – GE Healthcare (various positions including GE Healthcare Systems (GC)); Instrumentarium Corporation (GC).
Previous Unilever posts include: Unilever South East Asia & Australasia (President) and Chief Digital Transformation & Growth Officer; EVP Corporate Transformation; Unilever Benelux (Chair and EVP); Unilever Ice Cream (Global Head & EVP); various Brand and Channel Management roles.
Based on ONS categorisation. Other Ethnic Group include:1 ULE member identified as Hispanic1 ULE identified as White/Latin

76 Unilever Annual Report and Accounts 2021
Our sharesShare capitalPLC’s issued share capital on 31 December 2021 was made up of £81,798,695 split into 2,629,243,772 ordinary shares of 31/9p each and each carrying one vote. A total of 62,976,145 PLC ordinary shares were held in treasury as at 31 December 2021.
ListingsPLC has ordinary shares listed on the London Stock Exchange (ULVR), on Euronext Amsterdam (UNA) and, as American Depositary Receipts* (UL), on the New York Stock Exchange.* One American Depositary Receipt represents one
PLC ordinary share with a nominal value of 31/9p.
Share issues and purchase of sharesAt the 2021 PLC AGM held on 5 May 2021, the PLC Directors were authorised to:• issue new shares, up to a maximum of £27,212,500 nominal value
(which at the time represented approximately 33% of PLC’s issued ordinary share capital);
• disapply pre-emption rights up to a maximum of £4,086,711 nominal value (which at the time represented approximately 5% of PLC’s issued ordinary share capital) for general corporate purposes and an additional 5% authority in connection with an acquisition or specified capital investment; and
• make market purchases of its ordinary shares, up to a maximum of 262,811,000 ordinary shares (which at the time represented just under 10% of PLC’s issued ordinary share capital) and within the price limits prescribed in the resolution.
PLC conducted a share buyback programme during 2021 with an aggregate market value of approximately €3 billion, pursuant to which PLC bought back 62,976,145 PLC ordinary shares of 31/9 p each in two tranches. The purpose of the share buyback programme was to reduce the capital of PLC and the total consideration paid for the repurchased shares (excluding transaction costs) was €2,999,999,879. The 62,976,145 PLC ordinary shares that have been repurchased were held in treasury as at 31 December 2021, representing 2.4% of PLC’s issued share capital. Outside of this share buyback programme, no other company within the Unilever Group purchased any PLC ordinary shares or American Depositary Shares during 2021.
At the 2021 AGM, the Directors were also authorised to reduce the share premium account of the Company by £18,400,000,000. Immediately prior to Unification becoming effective, Unilever N.V. had distributable reserves of some €20.6bn (£18.4bn at the prevailing exchange rate). Upon Unification becoming effective, these distributable reserves of Unilever N.V. could not be legally recognised as realised profits (or distributable reserves) of PLC. Accordingly, the purpose of the reduction in PLC’s share premium account was effectively to reinstate the distributable reserves of Unilever N.V. prior to Unification in PLC’s accounts, so that PLC’s distributable reserves were equivalent to those available prior to Unification. The share premium account reduction was approved by the court and became effective on 15 June 2021.
Trust OfficeThe Trust Office of Unilever N.V. operated a depositary receipts system whereby shareholders in Unilever N.V. could alternatively have their shares held and managed by the Trust Office. Following Unification, the Trust Office was dissolved on 19 January 2022. The ordinary shares in PLC held by the Trust Office have been sold and the proceeds transferred into consignment (in consignatie) in the deposit fund (consignatiekas) at the Dutch Ministry of Finance.
Our shareholdersSignificant shareholders of PLCAs far as Unilever is aware, the only holder of more than 3% of, or 3% of voting rights attributable to, PLC’s ordinary share capital (‘Disclosable Interests’) on 31 December 2021, was BlackRock, Inc. with a shareholding of 8.3% and voting interest of 8.5%.
As far as Unilever is aware, no new Disclosable Interests have been notified to PLC between 1 January 2022 and 24 February 2022 (the latest practicable date for inclusion in this report). Between 1 January 2019 and 24 February 2022, (i) BlackRock, Inc., and (ii) the aggregated holdings of the trustees of the Leverhulme Trust and the Leverhulme Trade Charities Trust, have held more than 3% of, or 3% of voting rights attributable to, PLC’s ordinary shares.
Shareholder engagementWe value open and effective communication with our shareholders.
The CFO has lead responsibility for shareholder engagement, with the active involvement of the CEO and supported by the Investor Relations department.
In 2021, meetings were held with institutional shareholders based across the world. Members of the ULE and Investor Relations team also met a large number of investors at industry conferences. In October 2021, the Chair and the Chairs of the Board committees met with investors in order to further establish the relationship between the Directors and our largest investors and to cement the understanding on how the Board and its Committees operate. During this event, the Chair and Committee Chairs each presented before concluding with a Q&A session.
The Chair of the Compensation Committee also extensively engaged with and sought feedback from investors in relation to our new Directors’ Remuneration Policy, which was renewed at the 2021 PLC AGM. Further details can be found on page 84 of the Directors’ Remuneration Report. This new Policy was approved at the 2021 AGM with over 93% of votes in favour of the Policy.
On an ongoing basis, the Board is briefed on investor reactions to the Unilever Group’s quarterly results announcements and on any issues raised by shareholders that are relevant to their responsibilities.
We maintain a frequent dialogue with our principal institutional shareholders and regularly collect feedback. Private shareholders are encouraged to give feedback via [email protected]. Our shareholders are also welcome to raise any issues directly with the Chair or the SID, and the Chair, Executive Directors and Chairs of the Committees are also generally available to answer questions from the shareholders at the AGM each year. More information on shareholder engagement can be found on page 76.
www.unilever.com/investor-relations
General meetingsAt the AGM, the Chair gives his thoughts on governance aspects of the preceding year and the CEO gives a detailed review of the performance of the Unilever Group over the last year. In the ordinary course, shareholders are encouraged to attend the meeting and to ask questions at or in advance of the meeting. Indeed, the question and answer session forms an important part of each meeting. The external auditors are welcomed to the AGM and are entitled to address the meeting on any part of the business of the meeting which concerns them as auditors.
As a result of the Covid-19 pandemic and the UK government’s restrictions on gatherings, the 2021 PLC AGM was held as a closed meeting and shareholders were unable to attend the meeting in person. However, recognising that the AGM also serves as a forum for shareholders to engage with Directors, following the conclusion of the PLC AGM, a live shareholder webcast was held on Unilever’s corporate website with statements by the Chair and CEO. The Senior Independent Director and all Committee Chairs were also present and following the statements from the Chair and CEO, the questions submitted by shareholders prior to the webcast and received during the webcast were responded to.
Corporate Governance continued
77Unilever Annual Report and Accounts 2021
GO
VER
NA
NC
E REP
OR
T
Shareholders of PLC may propose resolutions if they individually or together hold shares representing at least 5% of the total voting rights of PLC, or 100 shareholders who hold on average £100 each in nominal value of PLC share capital can require PLC to propose a resolution at a General Meeting. PLC shareholders holding in aggregate 5% of the issued PLC ordinary shares are able to convene a General Meeting of PLC.
Information on the 2022 PLC AGM can be found within the PLC AGM Notice which will be published in March 2022.
Required majoritiesResolutions are usually adopted at PLC General Meetings by an absolute majority of votes cast, unless there are other requirements under the applicable laws or PLC’s Articles. For example, there are special requirements for resolutions relating to the alteration of the Articles of Association and the liquidation of PLC.
A proposal to alter the Articles of PLC can be made either by the PLC Board or by requisition of shareholders in accordance with the UK Companies Act 2006. Unless expressly specified to the contrary in PLC’s Articles, PLC’s Articles may be amended by a special resolution. The Articles of PLC can be found on our website.
www.unilever.com/investor-relations/agm-and-corporate-governance/our-corporate-governance
Right to hold and transfer sharesUnilever’s constitutional documents place no limitations on the right to hold or transfer PLC ordinary shares. There are no limitations on the right to hold or exercise voting rights on the ordinary shares of PLC imposed by English law.
Corporate governance complianceWe conduct our operations in accordance with internationally accepted principles of good governance and best practice, while ensuring compliance with the corporate governance requirements applicable in the countries in which we operate. Unilever is subject to corporate governance requirements (legislation, codes and/or standards) in the UK and the US and in this section, we report on our compliance against these.
The United KingdomIn 2021, PLC has applied the Principles and complied with the Provisions of the UK Corporate Governance Code. Further information on how Unilever has applied the five overarching categories of Principles can be found on the following pages – (i) Board Leadership and Company Purpose: pages 8 and 68 to 71; (ii) Division of Responsibilities: pages 68 to 69 and 78 to 83; (iii) Composition, Succession and Evaluation: pages 82 and 83; (iv) Audit, Risk and Internal Control: pages 78 to 79; and (v) Remuneration: pages 84 to 104. The UK Code is available on the Financial Reporting Council’s (FRC) website.
Risk Management and Control: Our approach to risk management and systems of internal control is in line with the recommendations in the FRC’s revised guidance ‘Risk management, internal control and related financial and business reporting’ (the Risk Guidance). It is Unilever’s practice to review acquired companies’ governance procedures and to align them to the Unilever Group’s governance procedures as soon as is practicable.
Under the UK Companies Act 2006 and rules of the US Securities and Exchange Commission, Unilever is required to provide information on contracts and other arrangements essential or material to the business of the Unilever Group. We believe we do not have any such contracts or arrangements.
Greenhouse Gas (GHG) Emissions: Information on GHG emissions can be found on pages 55 and 64.
Employee Involvement and Communication: Unilever’s UK companies maintain formal processes to inform, consult and involve employees and their representatives. A National Consultative Forum comprising employees and management representatives from key locations meets regularly to discuss issues relating to Unilever sites in the UK. We recognise collective bargaining on a number of sites and engage with employees via the Sourcing Unit Forum, which includes national officer representation from the three recognised trade unions. A European Works Council, embracing employee and management representatives from countries within Europe, has been in existence for several years and provides a forum for discussing issues that extend across national boundaries. Further details on how the Board has engaged with the workforce can be found on pages 69 and 70.
Equal Opportunities and Diversity: Consistent with our Code of Business Principles, Unilever aims to ensure that applications for employment from everyone are given full and fair consideration and that everyone is given access to training, development and career opportunities. Every effort is made to reskill and support employees who become disabled while working within the Group.
The United StatesPLC is listed on the New York Stock Exchange (NYSE). As such, PLC must comply with the requirements of US legislation, regulations enacted under US securities laws and the Listing Standards of the NYSE, that are applicable to foreign private issuers, copies of which are available on their websites.
We are substantially compliant with the Listing Standards of the NYSE applicable to foreign private issuers except as set out below.
We are required to disclose any significant ways in which our corporate governance practices differ from those typically followed by US companies listed on the NYSE. Our corporate governance practices are primarily based on the requirements of the UK Listing Rules and the UK Corporate Governance Code but substantially conform to those required of US companies listed on the NYSE. The only significant way in which our corporate governance practices differ from those followed by domestic companies under Section 303A Corporate Governance Standards of the NYSE is that the NYSE rules require that shareholders must be given the opportunity to vote on all equity-compensation plans and material revisions thereto, with certain limited exemptions. The UK Listing Rules require shareholder approval of equity compensation plans only if new or treasury shares are issued for the purpose of satisfying obligations under the plan or if the plan is a long-term incentive plan in which a director may participate. Amendments to plans approved by shareholders generally only require approval if they are to the advantage of the plan participants.
Attention is drawn to the Report of the Audit Committee on pages 78 to 79. In addition, further details about our corporate governance are provided in the document entitled ‘The Governance of Unilever’ which can be found on our website.
All senior executives and senior financial officers have declared their understanding of and compliance with Unilever’s Code of Business Principles and the related Code Policies. No waiver from any provision of the Code of Business Principles or Code Policies was granted in 2021 to any of the persons falling within the scope of the SEC requirements. The Code of Business Principles and related Code Policies are published on our website.
Risk Management and Control: Following a review by the Disclosure Committee, Audit Committee and Board, the CEO and the CFO concluded that the design and operation of the Unilever Group’s disclosure controls and procedures, including those defined in the US Securities Exchange Act of 1934 – Rule 13a – 15(e), as at 31 December 2021were effective.
Unilever is required by Section 404 of the US Sarbanes-Oxley Act of 2002 to report on the effectiveness of its internal control over financial reporting. This requirement is reported on within the section entitled ‘Management’s Report on Internal Control over Financial Reporting’ on page 197.
www.unilever.com/corporategovernance
78 Unilever Annual Report and Accounts 2021
Report of the Audit Committee
Committee members and attendanceAttendance
John Rishton Chair 7/7
Judith Hartmann 7/7
Adrian Hennah (member since 1 November 2021)
1/1
Susan Kilsby 7/7
This table shows the membership of the Committee together with their attendance at meetings during 2021. Attendance is expressed as the number of meetings attended out of the number eligible to be attended.
The Audit Committee is comprised only of independent Non-Executive Directors with a minimum requirement of three such members. It is chaired by John Rishton and the other current members are Judith Hartmann, Susan Kilsby and Adrian Hennah. Adrian joined the Board and the Audit Committee on 1 November 2021. For the purposes of the US Sarbanes-Oxley Act of 2002, John Rishton is the Audit Committee’s financial expert.
The Board is satisfied that the members of the Audit Committee are competent in financial matters and have recent and relevant experience. Other attendees at Committee meetings were the Chief Financial Officer, Chief Auditor, EVP Financial Control and Risk Management, Chief Legal Officer, Group Secretary, EVP Sustainable Business Performance and Reporting and the external auditors. Throughout the year, the Committee members periodically met without others present and also held separate private sessions with the Chief Financial Officer, Chief Auditor and the external auditors, allowing the Committee to discuss issues in more detail.
The majority of the meetings have been held virtually, while the last meeting in the year was held as a hybrid meeting adopting similar ways of working as the rest of the business.
Role of the CommitteeThe role and responsibilities of the Audit Committee are set out in written terms of reference which are reviewed annually by the Committee, taking into account relevant legislation and recommended good practice. The terms of reference are contained within ‘The Governance of Unilever’ which is available on our website at
www.unilever.com/investors/corporate-governance
The Committee’s responsibilities include, but are not limited to, the following matters: ▪ oversight of the integrity of Unilever’s financial statements; ▪ review of Unilever’s half-yearly and annual financial statements
(including clarity and completeness of disclosure) and approval of the quarterly trading statements for quarter 1 and quarter 3;
▪ oversight of risk management and internal control arrangements; ▪ oversight of compliance with legal and regulatory requirements; ▪ oversight of the external auditors’ performance, objectivity,
qualifications and independence; the approval process of non-audit services; recommendation to the Board of the nomination of the external auditors for shareholder approval; and approval of their fees, refer to note 25 on page 165; and
▪ performance of the internal audit function.
All relevant matters arising are brought to the attention of the Board.
In order to help the Committee meet its oversight responsibilities, each year management organise knowledge sessions for the Committee on subject areas within its remit. In 2021, sessions were held with management on cyber security, data privacy, major transformation projects and the management of third parties, particularly service providers and the increased dependency on those. The Committee also had presentations from management and discussions on the business's risk management activities, the preparation of the financial statements, the overall control environment, and the operation of the financial reporting controls.
How the Committee has discharged its responsibilitiesDuring the year, the Committee’s principal activities were as follows:
Financial StatementsThe Committee reviewed prior to publication the quarterly financial press releases together with the associated internal quarterly reports from the Chief Financial Officer and the Disclosure Committee and, with respect to the full-year results, the external auditor’s report. It also reviewed the Annual Report and Accounts and the Annual Report on Form 20-F 2021. These reviews incorporated the accounting policies and significant judgements and estimates underpinning the financial statements as disclosed within note 1 on pages 118 to 119. Particular attention was paid to the following significant matters in relation to the financial statements: ▪ indirect tax provisions and contingent liabilities, refer to notes 19 and
20 on pages 159 to 161; ▪ revenue recognition – including discounts and incentives; ▪ accounting treatment of assets held for sale (e.g. ekaterra).
These matters were also highlighted by our external auditors as being important in their audit.
For each of the above areas, the Committee considered the key facts and judgements outlined by management. Members of management attended the section of the meeting of the Committee where their item was discussed to answer any questions or challenges posed by the Committee. The matters were also discussed with the external auditors and further information can be found on pages 107 to 113. The Committee specifically discussed with the external auditor how management’s judgement and assertions were challenged and how professional scepticism was demonstrated during their audit of these areas; this included the disclosures for each matter noted above. The Committee is satisfied that there are relevant accounting policies in place in relation to these significant matters and management have correctly applied these policies.
In addition to the matters noted above, our external auditors, as required by auditing standards, also consider the risk of management override of controls. Nothing has come to our attention or their attention to suggest any material misstatement with respect to suspected or actual fraud relating to management override of controls.
At the request of the Board, the Committee undertook to: ▪ review the appropriateness of adopting the going concern
basis of accounting in preparing the annual and half-yearly financial statements;
▪ assess whether the business was viable in accordance with the requirement of the UK Corporate Governance Code. The assessment included a review of the principal and emerging risks facing Unilever, their potential impact, how they were being managed, together with a discussion as to the appropriate period for the assessment. The Committee recommended to the Board that there is a reasonable expectation that the Group will be able to continue in operation and meet its liabilities as they fall due over the three-year period (consistent with the period of the strategic plan) of the assessment; and
▪ consider whether the Unilever Annual Report and Accounts 2021 was fair, balanced and understandable, and whether it provided the necessary information for shareholders to assess the Group’s year-end position and performance, business model and strategy. To make this assessment, the committee received copies of the annual report and financial statements to review during the drafting process to ensure that the key messages being followed in the annual report were aligned with the company’s position, performance and strategy. The Committee also reviewed the processes and controls that are the basis for its preparation. The Committee was satisfied that, taken as a whole, the Unilever Annual Report and Accounts 2021 is fair, balanced and understandable.
Risk management and internal control arrangementsThe Committee reviewed Unilever’s overall approach to risk management and control, and its processes, outcomes and disclosure. The assessment was undertaken through a review of: ▪ the yearly report detailing the risk identification and assessment
process, together with any emerging risks identified by management; ▪ reports from senior management on those 2021 corporate risks for

79Unilever Annual Report and Accounts 2021
GO
VER
NA
NC
E REP
OR
T
which the Audit Committee had oversight responsibility: treasury, tax and pensions, information security, legal and regulatory compliance, and business transformation;
▪ the proposed 2022 corporate risks identified by the ULE; ▪ the Quarterly Risk and Control Status Reports, including Code of
Business Principles cases relating to frauds and financial crimes; ▪ a summary of control deficiencies identified through controls testing
activities together with action plans to address underlying causes; ▪ management’s improvements to reporting through further
automation and centralisation; and ▪ the annual financial plan and Unilever’s dividend policy and dividend
proposals.
The Committee reviewed the application of the requirements under Section 404 of the US Sarbanes-Oxley Act of 2002 with respect to internal controls over financial reporting.
In fulfilling its oversight responsibilities in relation to risk management and internal control, the Committee met regularly with senior members of management and is satisfied with the key judgements taken.
The Committee has completed its review for 2021 on both risk management and internal control and was satisfied that the process had worked effectively and where specific areas for improvement were identified, there was adequate mitigation or alternative controls and that processes were under way to ensure sustainable improvements. The key area of focus has been to ensure that the controls impacted by the transformation programmes are appropriately designed and are being implemented effectively. Through its review, it also ensured that appropriate procedures are in place for the detection and prevention of fraud.
During 2021, the Committee continued to review the sustainability assurance provided by PwC and plan for the assurance on non-financial Compass metrics going forward.
The Committee is monitoring and taking a proactive approach in anticipating and preparing for legislative or regulatory changes which may be required following the outcome of the Department for Business, Energy & Industrial Strategy (BEIS) consultation paper. As part of this, the Committee reviewed the formal response of the company into the BEIS consultation process mid-year 2021.
Internal audit functionThe Committee reviewed internal audit’s plan for the year which is focused on Unilever’s corporate risks, and ensured the necessary resources are in place to perform effectively. The pandemic has impacted the way the audits have been completed since April 2020. The audits were mainly conducted remotely and there has been more focus on data analysis and the use of remote video technology. Data and analytics has made the internal audits more efficient and effective, increasing the coverage. The Committee reviewed interim and year-end summary reports and management’s response together with the completion status of agreed actions.
Every five years, the Committee engages an independent third party to perform an effectiveness review of the function. This was last completed in 2018 and is planned for 2022. In 2021, the Committee evaluated the performance of the internal audit function through a questionnaire. The feedback was reviewed, and the Committee was satisfied with the effectiveness of the internal audit function. During the year, the Committee also met independently with the Chief Auditor and discussed the results of the audits performed and any additional insights obtained from the Chief Auditor.
Audit of the annual accountsKPMG, Unilever’s external auditors and independent registered public accounting firm, reported in depth to the Committee on the scope and outcome of the annual audit, including their audit of internal controls over financial reporting as required by Section 404 of the US Sarbanes-Oxley Act of 2002. Their reports included audit and accounting matters, governance and control, and accounting developments.
The Committee held independent meetings with the external auditors during the year and reviewed, agreed, discussed, and challenged their audit plan, including the materiality applied, scope and assessment of the financial reporting risk profile of the Group.
The Committee discussed the views and conclusions of KPMG regarding management’s treatment of significant transactions and areas of judgement during the year. The Committee considered these and is satisfied with the treatment in the financial statements.
External auditorsKPMG have been the Group’s auditors since 2014 and shareholders approved their reappointment as the Group’s external auditors at the
2021 AGM. On the recommendation of the Committee, the Directors will be proposing the reappointment of KPMG at the AGM in May 2022.
The Committee confirms that the Group is in compliance with The Statutory Audit Services for Large Companies Market Investigation (Mandatory Use of Competitive Tender Processes and Audit Committee Responsibilities) Order 2014, which requires Unilever to tender the audit every ten years. The last tender for the audit of the Annual Report and Accounts was performed in 2013 with respect to the audit for the financial year 2014. The Committee has commenced planning for a tender process during 2022 with respect to the audit for the financial year 2024. This would allow time for the transition of non-audit services ahead of any change in auditor that may be made. At present, we are satisfied with the effectiveness of our current auditors and hence have no plans to retender the external auditor appointment for an earlier period. This position is re-evaluated each year.
Both Unilever and KPMG have safeguards in place to avoid the possibility that the external auditors’ objectivity and independence could be compromised, such as audit partner rotation and the restriction on non-audit services that the external auditors can perform as described below. KPMG has issued a formal letter to the Committee outlining the general procedures to safeguard independence and objectivity, disclosing the relationship with the Company and confirming their audit independence. During 2021, as part of routine partner rotation, Jonathan Mills of KPMG replaced Nicholas Frost as lead audit partner.
Each year, the Committee assesses the effectiveness of the external audit process which includes discussing feedback from the members of the Committee and stakeholders at all levels across Unilever. Interviews are also held with key senior management within both Unilever and KPMG. During the year, KPMG presented to the Committee the key findings from the review of their 2019 audit files by the FRC’s Audit Quality Review (AQR) team. KPMG confirmed that they had acknowledged the AQR comments and had addressed all of them in the 2020 audit through a combination of additional procedures and improved documentation.
The Committee also reviewed the statutory audit, other audit and non-audit services provided by KPMG and compliance with Unilever’s documented approach, which prescribes in detail the types of engagements, listed below, for which the external auditors can be used: ▪ statutory audit services, including audit of subsidiaries; ▪ other audit services - audits that are not required by law or
regulation; and ▪ non-audit services - work that our external auditors are best placed
to undertake, which may include: ▪ services required by law or regulation to be performed by the audit
firm; and ▪ services where knowledge obtained during the audit is relevant to
the service such as bond issue comfort letters.
Unilever has for many years maintained a policy which prescribes in detail the types of engagements for which the external auditors can be used with all other engagements being prohibited. The policy is aligned with both UK and SEC regulations and is updated in line with these regulations.
All engagements over €250,000 require specific advance approval by the Audit Committee Chair. The Committee further approve all engagements which have been authorised by the EVP Financial Control and Risk Management. These authorities are reviewed regularly and, where necessary, updated in the light of internal and external developments. Since the appointment of KPMG in 2014, the level of non-audit fees has been below 7% of the annual statutory audit fee. The level of other audit fees has been below 6% of the annual statutory audit fee except for 2017 (41%), 2018 (24%), 2020 (32%) and 2021 (21%) due to assurance work relating to the disposal of our Spreads business (2017 and 2018) and assurance work relating to the separation of our Tea business (2020 and 2021).
Evaluation of the Audit CommitteeAs part of the internal Board evaluation carried out in 2021, the Board evaluated the performance of the Committee. The Committee also carried out a self assessment. While overall the members concluded that the Committee is performing effectively, they agreed to ensure continued engagement with the Group’s operations by organising (virtual) site visits and to allocate time to transformation projects.
John RishtonChair of the Audit Committee
Judith Hartmann
Adrian Hennah
Susan Kilsby
80 Unilever Annual Report and Accounts 2021
Report of the Corporate Responsibility Committee
Committee members and attendance
Attendance
Strive Masiyiwa Chair 3/4
Youngme Moon 4/4
Feike Sijbesma 4/4
This table shows the membership of the Committee together with their attendance at meetings during 2021. Attendance is expressed as the number of meetings attended out of the number eligible to be attended.
The Corporate Responsibility Committee comprises three Non-Executive Directors: Strive Masiyiwa (Chair), Youngme Moon and Feike Sijbesma.
The Chief Supply Chain Officer, the Chief Sustainability Officer and the Chief Business Integrity Officer attend the Committee’s meetings. The Chief Legal Officer and Group Secretary may also join the Committee’s discussions.
Role of the CommitteeThe Corporate Responsibility Committee oversees Unilever’s conduct as a responsible global business. Core to this remit is its governance of progress on Unilever’s sustainability agenda, as set out in the company’s integrated business strategy, the Unilever Compass (see pages 8 to 11). Core to this remit is reviewing sustainability-related risks, developments and opportunities.
The Committee is also charged with ensuring that Unilever’s reputation is protected and enhanced, so it must consider the company’s influence and impact on stakeholders. Central to this is the need to identify any external developments that are likely to have an influence on Unilever’s standing in society, and to ensure that appropriate and effective communication policies are in place to support the company’s reputation. This remit also extends to overseeing Unilever’s Code of Business Principles and third-party compliance, ensuring that both Unilever’s direct employees and those working within the company’s value chain comply with the expected standards of conduct.
The Committee’s discussions are informed by the experience of the Unilever Leadership Executive – as those accountable for driving responsible and sustainable growth through Unilever’s operations, value chain and brands. Other senior leaders are invited to the Committee to share their perspectives and insights on key issues and external developments. These in-depth discussions ensure the Committee stays alert to current and emerging trends and any potential risks arising from sustainability issues. The Committee captures these insights for the Board through formal feedback and the ongoing sharing of knowledge.
Complementing the Committee’s role, the Audit Committee is responsible for reviewing significant breaches of the Code of Business Principles as part of its remit to review risk management and for overseeing the independent assurance programme of Unilever’s sustainability commitments within the Unilever Compass.
The Committee’s terms of reference are set out at:
www.unilever.com/corporategovernance
Meetings are held quarterly and ad hoc as required – four were held in 2021. The Committee Chair is responsible for reporting the findings from the meetings to the Board, thus ensuring that the Board can fulfil its oversight responsibilities.
Following the Committee’s terms of reference and Unilever’s principal risks, in 2021 the Committee’s agenda covered the new sustainability commitments of the Unilever Compass strategy and in addition the Code and third-party compliance, safety, plastic packaging, setting the new Sustainability Progress Index (SPI) KPIs aligned with the Unilever Compass, corporate reputation and litigation.
During the year, the Committee also addressed a range of other strategic and current issues, including occupational health and human rights. How Unilever handled the Covid-19 pandemic remained topical.
How the Committee has discharged its responsibilitiesIn 2021, the Committee's principal activities were as follows:
Code of Business PrinciplesThe Code and associated Code Policies set out the standards of conduct expected of all Unilever employees in their business endeavours. Compliance with these is an essential element in ensuring Unilever’s continued business success and is identified as an ethical, legal and regulatory risk to Unilever (see page 50).
The Corporate Responsibility Committee is responsible for oversight of the Code and Code Policies, ensuring that they remain fit for purpose and are appropriately applied. It maintains close scrutiny of the mechanisms for implementing the Code and Code Policies. This is vital as compliance is essential to promote and protect Unilever’s values and standards, and hence the good reputation of the Group.
At each meeting, the Committee reviews an analysis of investigations into non-compliance with the Code and Code Policies and discusses any trends arising from these investigations.
The Committee also considers litigation and regulatory matters which may have a reputational impact and reviews a summary of any significant developments at each meeting. These matters include environmental issues, anti-bribery and corruption and competition law compliance.
In 2021, human rights was a focus for the Committee's Code oversight. The Committee was updated on and discussed a summary of the legislation enacted and/or proposed in the UK, EU and US in relation to supply chain transparency and mandatory due diligence. This deep dive included the deforestation related proposals in all three jurisdictions, and the German and broader EU proposals on Corporate Sustainability Reporting, mandatory human rights and environmental due diligence and governance risks. Although it was acknowledged that much of the proposed legislation was still to be passed and uncertainties existed in the final requirements and related implications, it was concluded that Unilever is well placed to meet any new requirements through its commitment and work previously under Unilever's Sustainable Living Plan and currently, the Compass. A number of actions are underway to put Unilever in a position to comply with any new requirements including the establishment of a cross-functional workshop to define the implementation roadmap. The Committee also reviewed Unilever's Modern Slavery Statement and Human Rights Report, before the Statement was put to the Board and published.
It also reviewed the EU’s Whistleblower Protection Directive, concluding that the impact on the company would be minimal given Unilever’s already comprehensive standards in this area.
Principles and standards for third partiesExtending Unilever’s values to third parties is essential if Unilever is to generate responsible growth and a positive social impact on the industry.
A lack of third-party compliance can pose a significant risk to the business, (see principal risks, page 50), so the Committee examines Unilever’s compliance programmes in detail to ensure risks are minimised.
At each meeting, the Committee tracks compliance with Unilever’s Responsible Sourcing Policy (RSP) for suppliers and its Responsible Business Partner Policy (RBPP) for customers and distributors. Together they set out Unilever’s requirements that third parties conduct business with integrity and respect for human rights and core labour principles. In 2021, the Committee scrutinised Unilever’s roll-out of the RSP First programme that ensures that no new supplier can be onboarded to Unilever’s systems without first formally agreeing to the requirements of the RSP.
Safety and securityThe need to keep people safe remained a priority in the face of Covid-19. Due to the pandemic, in 2021 mental health continued as a focus for the Committee’s oversight of employee wellbeing.
81Unilever Annual Report and Accounts 2021
GO
VER
NA
NC
E REP
OR
T
Unilever’s approach centred on ensuring business continuity and ensuring people were physically equipped and felt psychologically secure in the workplace or when working from home. Unilever has long-standing employee assistance programmes, which are accessible to all employees.
In 2021, programmes were expanded to include tools to help line managers to support team wellbeing, dedicated support for families of bereaved employees and the continuation of the Mental Health Champions Network. The Committee commended the newly created dashboard tracking Unilever’s occupational health ambitions and the level of the company’s attention on employee health and wellbeing.
The Committee has continued to receive an ongoing update of Unilever’s Covid preparations and actions across its business and supply chain.
The Committee continued to review Unilever's safety standards and Unilever continues to protect people from accidents. Sadly three contractors and four employees lost their lives (see page 18), but the Total Recordable Frequency Rate (TRFR) improved.
The Committee also examined Unilever’s approach to security. As a global business, Unilever operates in many countries, some of which suffer from a weak rule of law or from growing social and political unrest. Similarly, cyber threats continue to expand. The business continues to upgrade its resilience programmes to protect its people and assets.
Improving the health of the planetThe effects of climate change and nature loss are becoming ever more apparent and increasingly urgent. Following the launch of Unilever’s new commitments on climate and nature in 2020 (see page 10), in May 2021 Unilever put its Climate Transition Action Plan (CTAP, see pages 51 to 56) before shareholders and sought a non-binding advisory vote on our ambitious emissions reduction targets and our plans to reach them. The Corporate Responsibility Committee studied the plan ahead of its publication and presentation to the Board. The Committee reviewed and supported the company’s CTAP which the Committee considered reflects Unilever's leadership on sustainability matters.
Packaging waste and single-use plastic continued as high priorities for the business and society in 2021. Unilever’s goals cover using more recycled and less virgin plastic, improving the recyclability of plastic and an industry-leading commitment to an absolute reduction in plastic (see page 29).
Members noted the progress made on Unilever’s plastic goals with more recycled material, a step-up in plastic collection and processing, an increase in the proportion of the portfolio that is now technically recyclable and a framework for absolute plastic reduction projects and innovation. However, it was noted that the reduction of virgin plastics remains Unilever’s biggest challenge, the CRC urged Unilever to continue its efforts.
Contributing to a fairer and more socially inclusive worldIn January 2021, Unilever launched new social goals to complement its environmental goals, recognising the interdependence of people and planet. The new goals set out to contribute to a fairer and more socially inclusive world which leaves no one behind.
Alongside its new social goals, Unilever has strengthened its focus on equity, diversity and inclusion in gender, race, people with disabilities and LGBTQI+ across the company’s value chain (see pages 19 and 28). In 2021, the Committee in particular reviewed and welcomed the progress made with regards to improving equity, diversity and inclusion strategies in Unilever’s own operations, such as workforce representation, inclusive recruitment and career progression policies. The Committee counselled Unilever to maintain its data-driven monitoring on the progress made.
Protecting and enhancing Unilever’s reputationEnsuring its good reputation is vital to Unilever’s ongoing success. As activism rises, commentary on issues such as deforestation for palm oil or animal testing can travel faster and wider than ever before, while social media continues to amplify and accelerate issues. In 2021, the Committee considered the impact of Unilever’s brands engaging with activist citizens and consumers on these topics.
As the Committee charged with overseeing Unilever’s reputation, members scrutinised Unilever’s processes for managing issues. These processes are defined within a clear governance framework and have been enhanced with more sophisticated forecasting techniques, and tracking and measurement tools, to gauge likely future issues and extended training.
The Committee also reviewed the impact on Unilever of the decision made by the independent Board of Ben & Jerry’s about sales in the West Bank, which attracted media and political attention. The Committee noted that Unilever has a strong and long-standing commitment to its business in Israel, and has been clear that it does not support the Boycott, Divestment, Sanctions (BDS) movement.
Performance Share PlanUnilever’s Reward Framework includes the Performance Share Plan (PSP), a long-term incentive plan that is linked to financial performance, as well as performance against sustainability targets, defined in the Sustainability Progress Index (SPI).
SPI was based on a selection of key performance indicators (KPIs) from our Unilever Sustainable Living Plan (USLP) which ran until 2020, reflected in the PSP up to and including the 2021 award.
In 2021, Unilever introduced the Compass, which includes a series of sustainability commitments for the business, and as such, we have updated the SPI incentive performance measure to reflect the Compass from the 2022 PSP award onwards.
The role of the Committee in 2021 with regards to SPI was therefore two-fold: 1) assessment of Unilever’s 2020 SPI performance for 2021 reward, and 2) agreement of the new SPI targets based on the Unilever Compass.
To come to a view on Unilever’s 2020 performance on its sustainability commitments, the Corporate Responsibility Committee and the Compensation Committee jointly evaluate performance against the SPI targets.
The SPI is a two-fold assessment that captures quantitative and qualitative elements. Firstly, the Committee considered the 2020 targets reported in the 2020 Annual Report and Accounts alongside performance evidenced in a number of sustainability ratings and indices. The second part of the assessment takes into account the overall sustainability performance across the strategic actions of the Unilever Compass strategy.
Following an in-depth discussion of the SPI, the Corporate Responsibility Committee agreed a performance rating which was endorsed by the Compensation Committee. This joint assessment forms part of the Compensation Committee’s overall recommendation on the SPI outcome (see pages 91 to 93 for the SPI outcome for the 2021 PSP award).
In addition to the performance assessment, the Committee, also jointly with the Compensation Committee, agreed a new set of KPI, which reflect the three overarching strategic actions under the Unilever Compass: to improve the health of the planet; improve people’s health, confidence and wellbeing; and to contribute to a fairer, more socially inclusive world.
These three strategic actions are underpinned by eight key pillars, all of which are represented in new SPI KPIs. Each of the eight equally weighted SPI KPIs has specific annual KPIs that are fixed for the next three years. These enable the meaningful evaluation of progress against the overarching mid- to long-term Unilever Compass target.
See page 88 for the SPI KPIs for the 2022 PSP award as agreed between the Corporate Responsibility Committee and the Compensation Committee.
Evaluation of the Corporate Responsibility CommitteeAs part of the internal Board evaluation carried out in 2021, the Board evaluated the performance of the Committee. The Committee also carried out an assessment of its own performance in 2021 and concluded that it was working effectively.
Strive MasiyiwaChair of the Corporate Responsibility Committee
Youngme Moon
Feike Sijbesma
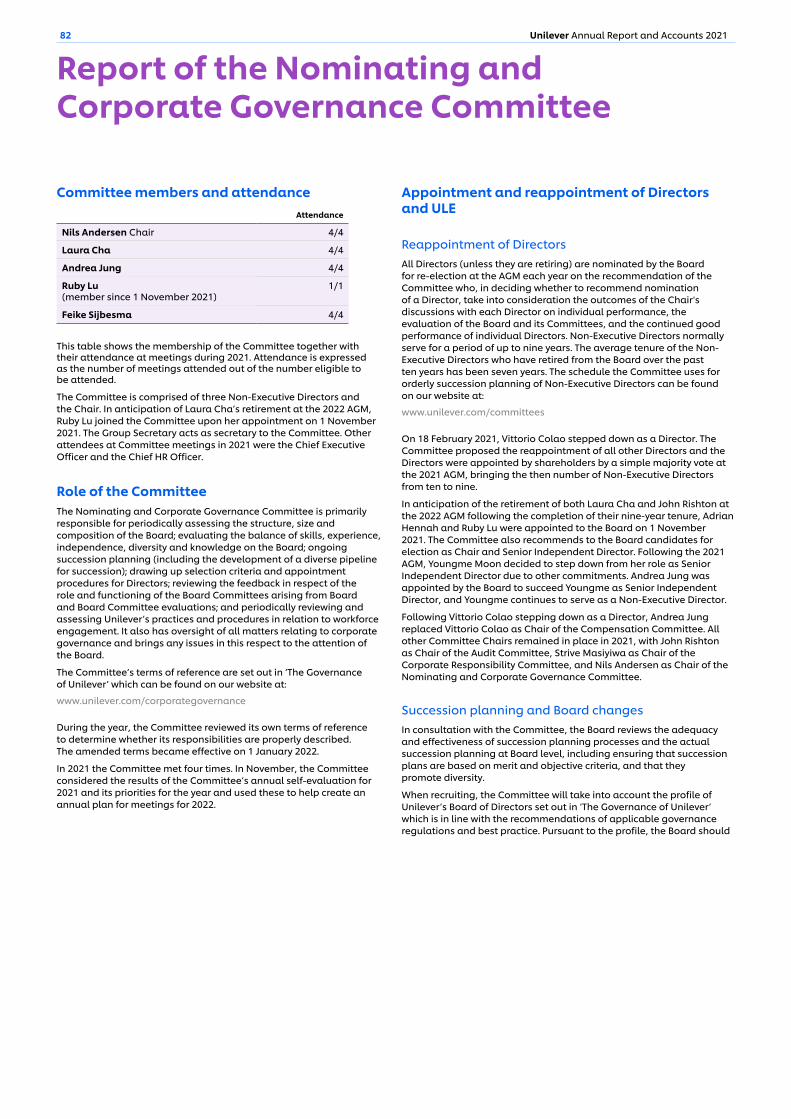
82 Unilever Annual Report and Accounts 2021
Report of the Nominating and Corporate Governance Committee
Committee members and attendanceAttendance
Nils Andersen Chair 4/4
Laura Cha 4/4
Andrea Jung 4/4
Ruby Lu (member since 1 November 2021)
1/1
Feike Sijbesma 4/4
This table shows the membership of the Committee together with their attendance at meetings during 2021. Attendance is expressed as the number of meetings attended out of the number eligible to be attended.
The Committee is comprised of three Non-Executive Directors and the Chair. In anticipation of Laura Cha’s retirement at the 2022 AGM, Ruby Lu joined the Committee upon her appointment on 1 November 2021. The Group Secretary acts as secretary to the Committee. Other attendees at Committee meetings in 2021 were the Chief Executive Officer and the Chief HR Officer.
Role of the CommitteeThe Nominating and Corporate Governance Committee is primarily responsible for periodically assessing the structure, size and composition of the Board; evaluating the balance of skills, experience, independence, diversity and knowledge on the Board; ongoing succession planning (including the development of a diverse pipeline for succession); drawing up selection criteria and appointment procedures for Directors; reviewing the feedback in respect of the role and functioning of the Board Committees arising from Board and Board Committee evaluations; and periodically reviewing and assessing Unilever’s practices and procedures in relation to workforce engagement. It also has oversight of all matters relating to corporate governance and brings any issues in this respect to the attention of the Board.
The Committee’s terms of reference are set out in ‘The Governance of Unilever’ which can be found on our website at:
www.unilever.com/corporategovernance
During the year, the Committee reviewed its own terms of reference to determine whether its responsibilities are properly described. The amended terms became effective on 1 January 2022.
In 2021 the Committee met four times. In November, the Committee considered the results of the Committee’s annual self-evaluation for 2021 and its priorities for the year and used these to help create an annual plan for meetings for 2022.
Appointment and reappointment of Directors and ULE
Reappointment of DirectorsAll Directors (unless they are retiring) are nominated by the Board for re-election at the AGM each year on the recommendation of the Committee who, in deciding whether to recommend nomination of a Director, take into consideration the outcomes of the Chair's discussions with each Director on individual performance, the evaluation of the Board and its Committees, and the continued good performance of individual Directors. Non-Executive Directors normally serve for a period of up to nine years. The average tenure of the Non-Executive Directors who have retired from the Board over the past ten years has been seven years. The schedule the Committee uses for orderly succession planning of Non-Executive Directors can be found on our website at:
www.unilever.com/committees
On 18 February 2021, Vittorio Colao stepped down as a Director. The Committee proposed the reappointment of all other Directors and the Directors were appointed by shareholders by a simple majority vote at the 2021 AGM, bringing the then number of Non-Executive Directors from ten to nine.
In anticipation of the retirement of both Laura Cha and John Rishton at the 2022 AGM following the completion of their nine-year tenure, Adrian Hennah and Ruby Lu were appointed to the Board on 1 November 2021. The Committee also recommends to the Board candidates for election as Chair and Senior Independent Director. Following the 2021 AGM, Youngme Moon decided to step down from her role as Senior Independent Director due to other commitments. Andrea Jung was appointed by the Board to succeed Youngme as Senior Independent Director, and Youngme continues to serve as a Non-Executive Director.
Following Vittorio Colao stepping down as a Director, Andrea Jung replaced Vittorio Colao as Chair of the Compensation Committee. All other Committee Chairs remained in place in 2021, with John Rishton as Chair of the Audit Committee, Strive Masiyiwa as Chair of the Corporate Responsibility Committee, and Nils Andersen as Chair of the Nominating and Corporate Governance Committee.
Succession planning and Board changesIn consultation with the Committee, the Board reviews the adequacy and effectiveness of succession planning processes and the actual succession planning at Board level, including ensuring that succession plans are based on merit and objective criteria, and that they promote diversity.
When recruiting, the Committee will take into account the profile of Unilever’s Board of Directors set out in ‘The Governance of Unilever’ which is in line with the recommendations of applicable governance regulations and best practice. Pursuant to the profile, the Board should

83Unilever Annual Report and Accounts 2021
GO
VER
NA
NC
E REP
OR
T
comprise a majority of Non-Executive Directors who are independent of Unilever, free from any conflicts of interest and able to allocate sufficient time to carry out their responsibilities effectively. With respect to composition and capabilities, the Board should be in keeping with the size of Unilever, its strategy, portfolio, consumer base, culture, geographical spread and its status as a listed company and have sufficient understanding of the markets and business where Unilever is active in order to understand the key trends and developments relevant for Unilever. The objective pursued by the Board is to have a variety of nationality, race, gender, ethnicity, social background and relevant skills and expertise. It is important that the Board has sufficient global experience and outlook, and financial literacy. As discussed later in this report, Unilever currently has a diverse Board in terms of gender and nationality and, as can be seen from the subset of the mapping that this Committee has done of the current Non-Executive Directors’ skills and capabilities on page 73, composition and capabilities are in line with our Board profile described above.
At each Committee meeting there is a standing agenda item to review the succession plan for the Board and discuss short and long-term action plans on succession. Through these discussions the Committee reflects on whether the plans need to be updated or whether new requirements for potential candidates need to be implemented, ensuring we continue to adapt our succession planning to the skills and experience required on the Board. Reflecting its role in respect of board succession planning, early in 2021, the Committee’s priority was to identify new non-executive directors to succeed two of the longer-serving members of the board – Laura Cha and John Rishton. Candidates were sought in line with the skills, experience and diversity requirements of the Board, with particular focus on the technical and professional skills required to take on certain committee responsibilities and who would also enhance the strategic discussion in the boardroom. Due to the successful previous experience with Egon Zehnder and Russell Reynolds, both agencies were engaged to support the process and identify candidates, with the search process leading to the appointments of Adrian Hennah and Ruby Lu during 2021.
ULE succession planning and appointmentIn consultation with the Committee, the Board reviews the adequacy and effectiveness of succession planning processes and the actual succession planning at ULE level, including ensuring that succession plans are based on merit and objective criteria, and that they promote diversity.
Board Diversity PolicyUnilever has long understood the importance of diversity and inclusion within our workforce because of the wide range of consumers and other stakeholders we connect with globally. This goes right through our organisation, starting with the Board.
Unilever’s Board Diversity Policy, which is reviewed by the Committee each year, is reflected on our website at:
www.unilever.com/boardsofunilever
The Board believes that the composition and quality of the Board should be in keeping with the size and geographical spread of Unilever, its portfolio, culture and status as a listed company. A diverse Board with a range of views enhances decision-making which is beneficial to the company’s long-term success and in the interests of Unilever’s stakeholders. Thus, the Board believes that Unilever Directors must be selected using objective and merit-based criteria, including on the basis of wide-ranging experience, backgrounds, skills, knowledge and insight with a continuing emphasis on diversity of its members.
In 2021, the Committee also reviewed and considered relevant recommendations on diversity and remains pleased that 55% of our Non-Executive Directors and 46% of all Directors were women and that eight nationalities were represented on the Board. As regards ethnicity, in 2021 eight directors identified themselves as White, four Directors identified themselves as Asian and one Director identified himself as Black. Further details on our approach to diversity and inclusion as well as gender balance of our workforce can be found on pages 19 and 64.
Corporate governance developmentsThe Committee reviews relevant proposed legislation and changes to relevant corporate governance codes at least twice a year. It carefully considers whether and how the proposed laws/rules would impact upon Unilever and whether Unilever should participate in consultations on the proposed changes. For example, during 2021, new EU proposals for a Corporate Sustainability Reporting Directive and a UK White paper on audit and corporate governance reform, alongside stakeholder interests, corporate reporting and overboarding were discussed by the Committee.
Evaluation of the Nominating and Corporate Governance CommitteeAs part of the Board evaluation carried out in 2021, the Board evaluated the performance of the Committee. The Committee also carried out an assessment of its own composition and performance in 2021. The Committee members concluded that the Committee is performing effectively.
Nils AndersenChair of the Nominating and Corporate Governance Committee
Laura Cha
Andrea Jung
Ruby Lu
Feike Sijbesma
84 Unilever Annual Report and Accounts 2021
Directors' Remuneration Report
Committee members and attendanceAttendance
Andrea Jung Chair (Chair from 18 February 2021) 5/5
Vittorio Colao (Member and Chair until 18 February 2021) 1/1
Nils Andersen 5/5Laura Cha 5/5Ruby Lu (Member from 1 November 2021) 1/1
This table shows the membership of the Compensation Committee (Committee) together with their attendance at meetings during 2021. Attendance is expressed as the number of meetings attended out of the number each member was eligible to attend.
Letter from the Chair
Dear shareholders,As the Committee Chair, I am pleased to present Unilever’s Directors’ Remuneration Report (DRR) 2021. In the sections below, I set out the Committee’s activities in 2021, including Unilever’s business performance in 2021 and how it links to key remuneration outcomes for the year. I also reflect on the feedback we received on our new Directors’ Remuneration Policy, which was approved at the May 2021 AGM (referred to as the Remuneration Policy).
Business performance and remuneration 2021 was a year of volatility with continued impact from the Covid-19 pandemic and unprecedented global commodity inflation driven by supply constraints and demand spikes.
In this context, we delivered Underlying Sales Growth (USG) of +4.5%, above our par target of 3.5%, driven by strong pricing of +2.9% and volume growth of 1.6%. Our growth was competitive with 53% of our business gaining market share on a Moving Annual Total basis.
The severe mismatch between supply and demand resulted in a once in a two-decade spike in commodity and logistics cost inflation. Prices of core ingredients have risen significantly versus early 2020 levels; Brent Crude Oil +60%, Soyabean Oil +90% and Palm Oil +130%. We accelerated pricing action and stepped up savings, which helped to offset much of the inflation challenge. We delivered Underlying Operating Margin (UOM) of 18.4%; -10bps versus prior year, below the threshold range of -5bps. Overall, Underlying Operating Profit grew 2.9%.
Free Cash Flow (FCF) (excluding taxes paid on disposals) delivery remained strong at €6.5 billion ahead of our par target of €6.3 billion.
Underlying Earnings per Share (EPS) grew by +5.5% at current rates and included +0.9% from the €3 billion share buy-back programme announced in April 2021.
Return on Invested Capital (ROIC) was 17.2%, being sustained in the mid to high teens, and Unilever's sustainability performance measure for the long-term incentive plan, the Sustainability Progress Index (SPI), achieved a 125% outcome, as detailed on page 92.
Incentive outcomes and wider stakeholder considerations 2021 Annual Bonus After careful consideration, the Committee decided neither to change the targets in response to volatile business conditions nor to exercise discretion on the formulaic outcome, which will set the global bonus pool for all eligible Unilever employees.
Accordingly, the Committee confirmed a bonus of 81% of target opportunity for both the CEO Alan Jope (resulting in a bonus of 122% of fixed pay against a target of 150%), and the CFO Graeme Pitkethly (resulting in a bonus of 97% of fixed pay against a target of 120%), as detailed in the chart on page 90.
Under the Remuneration Policy, 50% of the net bonus award will be deferred in shares for three years.
2018-2021 Management Co-Investment Plan (MCIP)Similarly, no discretion was applied to the MCIP vesting based on performance in 2021.
Accordingly, the Committee confirmed the formulaic outcome for the 2018-2021 MCIP was 87% of target, which will be applied to all eligible Unilever employees. This outcome is detailed in the chart on page 91, and corresponds to a vesting of 44% of the maximum of 200% for our two Executive Directors.
Wider stakeholder considerations When considering the annual bonus and MCIP outcomes, the Committee carefully took into account the experiences of our wider stakeholders in order to ensure that outcomes were aligned.
In particular, our decision not to amend targets mid-year in light of significant inflationary conditions was taken to ensure that employees and Executive Directors are treated commensurately with the interests of our shareholders. The final outcomes of 81% of target for annual bonus and 87% of target for MCIP are below our expectations. However, the Committee believes these outcomes represent the performance delivered to shareholders in challenging trading circumstances.
Our Remuneration Policy for 2021We are delighted the Remuneration Policy was approved at the May 2021 AGM with 93.51% votes in favour, which is available on our website.
As detailed in full in last year’s DRR, the key changes to the Remuneration Policy for the Executive Directors were to: ▪ replace the former long-term incentive plan, MCIP, with a new
Performance Share Plan (PSP) that is entirely separate from the annual bonus plan;
▪ replace the voluntary investment of bonus through MCIP with a mandatory deferral of 50% of the net annual bonus in shares for three years;
▪ set performance measures for the PSP that are strategically aligned with the business; and
▪ reduce the long-term performance period for the PSP from four to three years while maintaining a five-year period from award to release by increasing the retention period from one year to two years.
The Remuneration Policy is operating as intended and, following the high level of support, no material changes are proposed in relation to how we implement the Remuneration Policy in 2022.
Remuneration arrangements are determined throughout Unilever based on the same principles as for the Board, as set out in the Remuneration Policy.

85Unilever Annual Report and Accounts 2021
GO
VER
NA
NC
E REP
OR
T
Executive Director fixed pay increases 2021 increases As set out in last year’s DRR, we did not conduct a fixed pay review for the Executive Directors in the first half of 2021, and we planned to undertake such a review in the second half of 2021. This review was conducted taking into account business performance, external circumstances and salary increases awarded to the wider workforce.
The Committee conducted a review of the CEO and CFO packages against external market data* in the second half of 2021, as planned, which shows the CEO is between lower quartile and median on a fixed pay and target total compensation basis and the CFO is between median and upper quartile on fixed pay and just below median on a target total compensation basis.
The Committee approved a 2021 fixed pay increase of 3.5% for both the CEO and the CFO, effective from 1 July 2021. This is in line with the average increase awarded to the wider Unilever workforce in 2020.
Given the fixed pay increases were delayed and took place mid-year, they also reduced the incentives for 2021 compared to if the increases were awarded at the start of the year: PSP grants in 2021 were based on previous salary levels; and annual bonus opportunities for 2021 were based on the actual salary received during the year.
2022 increasesThere will be no fixed pay review for the Executive Directors in the first half of 2022. Such a review will take place in the second half of 2022, with any potential changes based on performance, external circumstances and with any increase below the level applied for the wider workforce.
In line with the Remuneration Policy and subject to the performance and workforce alignment, the Committee will, over time, continue to review the CEO’s fixed pay positioning and progress towards the market median benchmark.*Our benchmarking peer group consists of other global companies of a similar financial size and complexity to Unilever and is set out in full in the Remuneration Policy.
Engaging with shareholdersIn 2020, the Committee engaged extensively with shareholders and major advisory bodies (including the Investment Association, ISS, Glass Lewis, Hermes and Eumedion) on the Remuneration Policy. In the run-up to the 2021 AGM, we had further consultation with some of these shareholders and advisory bodies on the Remuneration Policy.
On behalf of the Committee, I spoke with investors and advisory bodies in the autumn of 2021 on how the Remuneration Policy landed in the organisation and wider investor community. Through this engagement, shareholders and major advisory bodies requested to better understand the performance measure on competitiveness, which was introduced for 2021, and how SPI targets are calculated. We have shared additional information and explanation with shareholders, advisory bodies and on our website, including:
Competitiveness: % Business Winning Market Share (% Business Winning) ▪ Competitiveness, measured as % Business Winning, was introduced
as a new measure for the PSP. Growing competitively ahead of our markets is a key strategic driver of long-term growth.
▪ % Business Winning incentivises all country/category cells (e.g. UK deodorant) to win share, not just the big cells, thus supporting broad-based competitive growth.
▪ There is an end-to-end governance framework in place consisting of a cross-function steering committee and regular updates to, and evaluation by, the Committee.
See the remuneration topics section of our website under investors, corporate governance and other governance information for more on Business Winning Market Share.
Sustainability Progress Index ▪ SPI has been an established feature of our long-term incentive (LTI)
scheme since it was introduced in 2017, in recognition of our vision to be the global leader in sustainable business and the importance of sustainability KPIs in driving business performance. SPI was based on a selection of KPIs from our Unilever Sustainable Living Plan (USLP) which ran until 2020, reflected in the PSP up to and including the 2021 award.
▪ In 2021, Unilever introduced the Compass, which includes a series of new sustainability commitments for the business, and as such, we have updated the SPI incentive performance measure to reflect the Compass from the 2022 PSP award onwards.
▪ Within the Unilever Compass strategy, we have three overarching strategic actions: to improve the health of the planet; to improve people’s health and wellbeing; and to contribute to a fairer, more socially inclusive world.
▪ These three strategic actions are underpinned by eight key pillars, all of which are represented in new SPI KPIs. Each of the eight KPIs are equally weighted and have specific annual KPIs that are fixed for the next three years. These enable the meaningful evaluation of progress against the overarching mid- to long-term Unilever Compass KPI.
▪ The eight KPIs are agreed between the Unilever Board’s Corporate Responsibility Committee (CRC) and the Committee. The CRC and the Committee work together to review a detailed quantitative and qualitative update on performance against each KPI. The CRC and the Committee also look at the overall sustainability performance across the strategic actions of the Unilever Compass strategy. This information together is used to make a recommendation on the performance outcome for each year in the range of 0–200% for the Committee to consider.
▪ Because performance against the SPI incentive performance measure is calculated after the performance year has ended, the previous year’s SPI applies to the performance year for LTI. For example, the 2020 SPI KPIs (based on USLP) were used for the 2021 performance year for LTI whereas the 2021 SPI KPIs (based on the Unilever Compass strategy) will be used for the 2022 performance year for LTI.
▪ The SPI KPIs for the 2021 PSP award are set out on page 92 and the SPI KPIs for the 2022 PSP award are set out on page 88.
See the remuneration topics section of our website for a video explanation on SPI.
Non-Executive Director feesThere was no increase to Non-Executive Director fees in 2021. Following a review in 2021, the Committee decided to keep Non-Executive Director fees the same for 2022. The Committee will review the fees again in 2022.
86 Unilever Annual Report and Accounts 2021
Directors’ Remuneration Report continued
Engaging with employeesAs previously announced, the Board decided to share the responsibility for workforce engagement among all Non-Executive Directors to ensure that all Directors have a collective responsibility for bringing employee views into relevant Board discussion. We continued these engagements in 2021, see page 69 for a summary of the discussions that took place.
In July 2021, I attended a virtual town hall meeting open to all employees globally. This was an opportunity for employees to ask me questions, including in relation to Unilever’s approach to remuneration. I was able to share that the Board considers topics on pay, such as living wage and pay equity, because the Board understands the issue of income equality, how it is expressed in society and what corporations can do to address it.
We sought feedback from employees globally who were eligible for the new PSP and 71% of respondents answered positively that PSP offers a more valuable reward for them personally. In addition, 85% understood how their role can impact the long-term business performance measures that determine final PSP pay-out. Overall, the Committee is pleased to receive such positive feedback.
One of the Non-Executive Directors attended an engagement session with employees on the subject of compensation and benefits. Employees shared feedback on progression within pay bands, differentiation of annual bonus, benefits of PSP over MCIP and competitiveness of Unilever’s pension schemes.
See the Board and management committees section of our website under investors and corporate governance for a copy of Unilever's workforce engagement policy introduced in 2021.
Implementation reportThe annual report on remuneration in this report describes 2021 remuneration in detail as well as the planned implementation of the Remuneration Policy in 2022.
On behalf of the Committee and the entire Board, I thank all shareholders and their representatives for their constructive engagement in 2021. Shareholders will have an advisory vote on the DRR at the 2022 AGM.
Andrea JungChair of the Compensation Committee
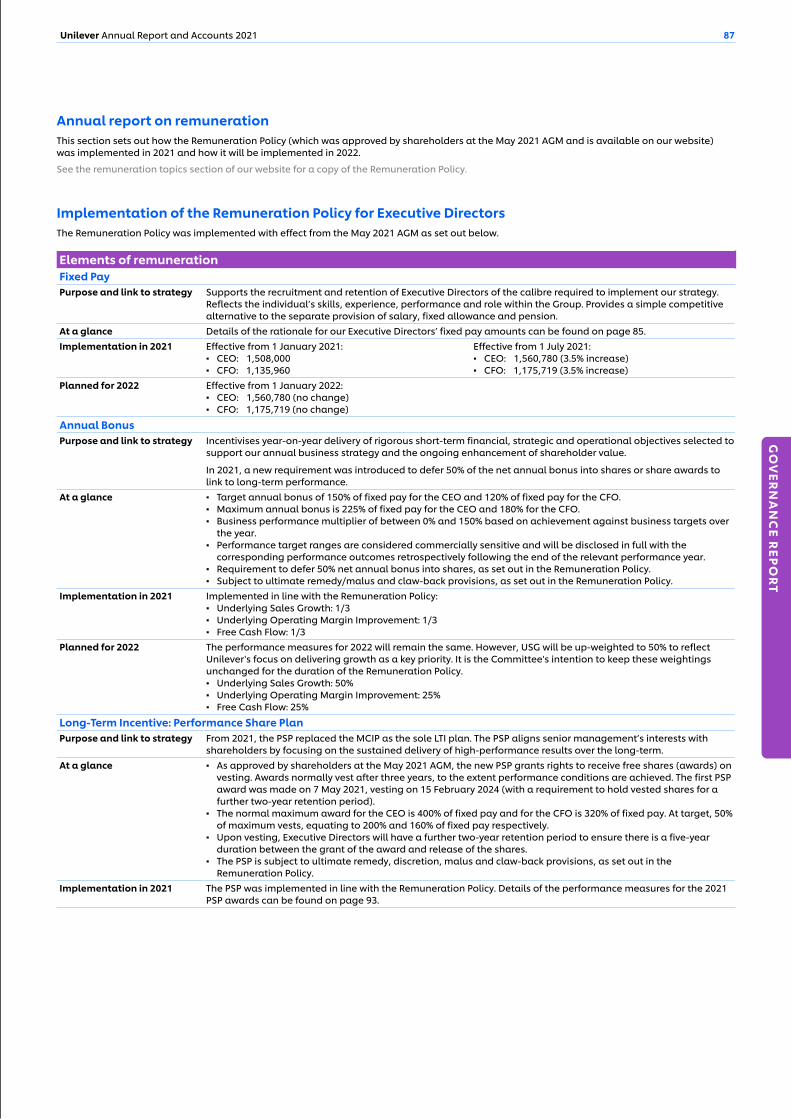
87Unilever Annual Report and Accounts 2021
GO
VER
NA
NC
E REP
OR
T
Annual report on remunerationThis section sets out how the Remuneration Policy (which was approved by shareholders at the May 2021 AGM and is available on our website) was implemented in 2021 and how it will be implemented in 2022.
See the remuneration topics section of our website for a copy of the Remuneration Policy.
Implementation of the Remuneration Policy for Executive Directors The Remuneration Policy was implemented with effect from the May 2021 AGM as set out below.
Elements of remunerationFixed PayPurpose and link to strategy Supports the recruitment and retention of Executive Directors of the calibre required to implement our strategy.
Reflects the individual’s skills, experience, performance and role within the Group. Provides a simple competitive alternative to the separate provision of salary, fixed allowance and pension.
At a glance Details of the rationale for our Executive Directors’ fixed pay amounts can be found on page 85.Implementation in 2021 Effective from 1 January 2021:
▪ CEO: €1,508,000 ▪ CFO: €1,135,960
Effective from 1 July 2021: ▪ CEO: €1,560,780 (3.5% increase) ▪ CFO: €1,175,719 (3.5% increase)
Planned for 2022 Effective from 1 January 2022: ▪ CEO: €1,560,780 (no change) ▪ CFO: €1,175,719 (no change)
Annual BonusPurpose and link to strategy Incentivises year-on-year delivery of rigorous short-term financial, strategic and operational objectives selected to
support our annual business strategy and the ongoing enhancement of shareholder value.
In 2021, a new requirement was introduced to defer 50% of the net annual bonus into shares or share awards to link to long-term performance.
At a glance ▪ Target annual bonus of 150% of fixed pay for the CEO and 120% of fixed pay for the CFO. ▪ Maximum annual bonus is 225% of fixed pay for the CEO and 180% for the CFO. ▪ Business performance multiplier of between 0% and 150% based on achievement against business targets over
the year. ▪ Performance target ranges are considered commercially sensitive and will be disclosed in full with the
corresponding performance outcomes retrospectively following the end of the relevant performance year. ▪ Requirement to defer 50% net annual bonus into shares, as set out in the Remuneration Policy. ▪ Subject to ultimate remedy/malus and claw-back provisions, as set out in the Remuneration Policy.
Implementation in 2021 Implemented in line with the Remuneration Policy: ▪ Underlying Sales Growth: 1/3 ▪ Underlying Operating Margin Improvement: 1/3 ▪ Free Cash Flow: 1/3
Planned for 2022 The performance measures for 2022 will remain the same. However, USG will be up-weighted to 50% to reflect Unilever's focus on delivering growth as a key priority. It is the Committee's intention to keep these weightings unchanged for the duration of the Remuneration Policy. ▪ Underlying Sales Growth: 50% ▪ Underlying Operating Margin Improvement: 25% ▪ Free Cash Flow: 25%
Long-Term Incentive: Performance Share PlanPurpose and link to strategy From 2021, the PSP replaced the MCIP as the sole LTI plan. The PSP aligns senior management’s interests with
shareholders by focusing on the sustained delivery of high-performance results over the long-term.At a glance ▪ As approved by shareholders at the May 2021 AGM, the new PSP grants rights to receive free shares (awards) on
vesting. Awards normally vest after three years, to the extent performance conditions are achieved. The first PSP award was made on 7 May 2021, vesting on 15 February 2024 (with a requirement to hold vested shares for a further two-year retention period).
▪ The normal maximum award for the CEO is 400% of fixed pay and for the CFO is 320% of fixed pay. At target, 50% of maximum vests, equating to 200% and 160% of fixed pay respectively.
▪ Upon vesting, Executive Directors will have a further two-year retention period to ensure there is a five-year duration between the grant of the award and release of the shares.
▪ The PSP is subject to ultimate remedy, discretion, malus and claw-back provisions, as set out in the Remuneration Policy.
Implementation in 2021 The PSP was implemented in line with the Remuneration Policy. Details of the performance measures for the 2021 PSP awards can be found on page 93.
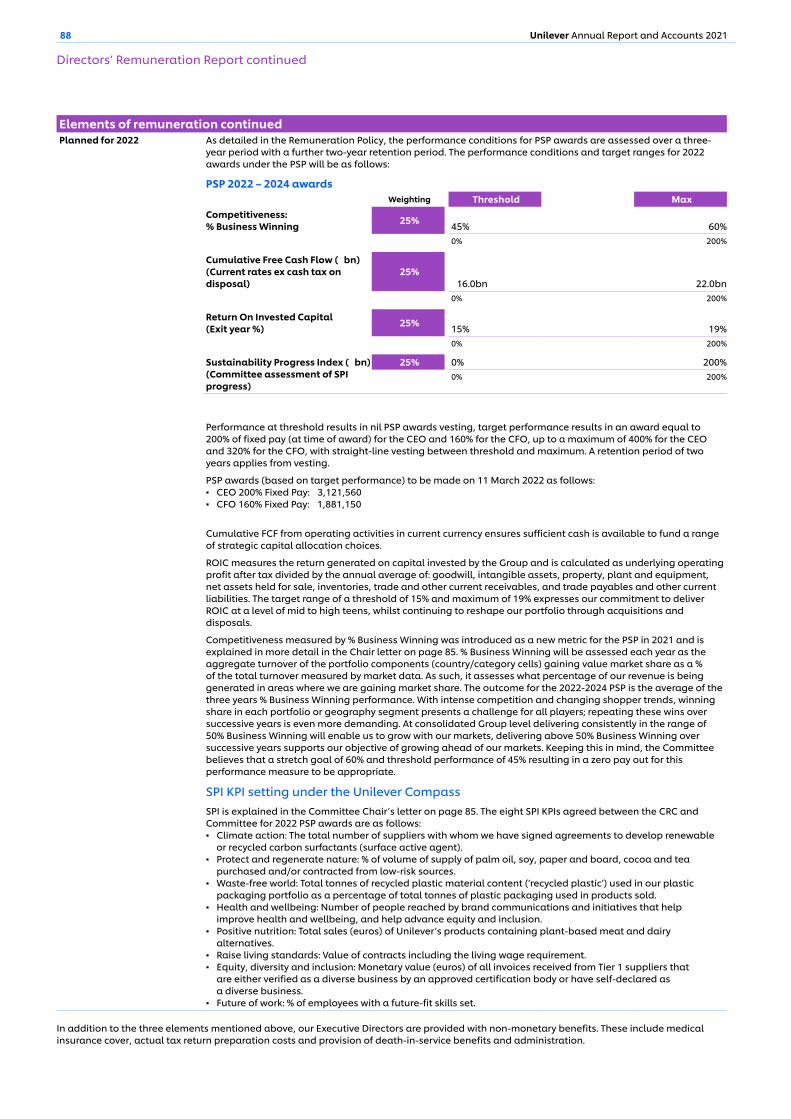
88 Unilever Annual Report and Accounts 2021
Elements of remuneration continuedPlanned for 2022 As detailed in the Remuneration Policy, the performance conditions for PSP awards are assessed over a three-
year period with a further two-year retention period. The performance conditions and target ranges for 2022 awards under the PSP will be as follows:
PSP 2022 – 2024 awardsWeighting Threshold Max
Competitiveness: % Business Winning 25% 45% 60%
0% 200%
Cumulative Free Cash Flow (€bn) (Current rates ex cash tax on disposal)
25%€16.0bn €22.0bn0% 200%
Return On Invested Capital (Exit year %) 25% 15% 19%
0% 200%
Sustainability Progress Index (€bn) (Committee assessment of SPI progress)
25% 0% 200%0% 200%
Performance at threshold results in nil PSP awards vesting, target performance results in an award equal to 200% of fixed pay (at time of award) for the CEO and 160% for the CFO, up to a maximum of 400% for the CEO and 320% for the CFO, with straight-line vesting between threshold and maximum. A retention period of two years applies from vesting.
PSP awards (based on target performance) to be made on 11 March 2022 as follows: ▪ CEO 200% Fixed Pay: €3,121,560 ▪ CFO 160% Fixed Pay: €1,881,150
Cumulative FCF from operating activities in current currency ensures sufficient cash is available to fund a range of strategic capital allocation choices.
ROIC measures the return generated on capital invested by the Group and is calculated as underlying operating profit after tax divided by the annual average of: goodwill, intangible assets, property, plant and equipment, net assets held for sale, inventories, trade and other current receivables, and trade payables and other current liabilities. The target range of a threshold of 15% and maximum of 19% expresses our commitment to deliver ROIC at a level of mid to high teens, whilst continuing to reshape our portfolio through acquisitions and disposals.
Competitiveness measured by % Business Winning was introduced as a new metric for the PSP in 2021 and is explained in more detail in the Chair letter on page 85. % Business Winning will be assessed each year as the aggregate turnover of the portfolio components (country/category cells) gaining value market share as a % of the total turnover measured by market data. As such, it assesses what percentage of our revenue is being generated in areas where we are gaining market share. The outcome for the 2022-2024 PSP is the average of the three years % Business Winning performance. With intense competition and changing shopper trends, winning share in each portfolio or geography segment presents a challenge for all players; repeating these wins over successive years is even more demanding. At consolidated Group level delivering consistently in the range of 50% Business Winning will enable us to grow with our markets, delivering above 50% Business Winning over successive years supports our objective of growing ahead of our markets. Keeping this in mind, the Committee believes that a stretch goal of 60% and threshold performance of 45% resulting in a zero pay out for this performance measure to be appropriate.
SPI KPI setting under the Unilever CompassSPI is explained in the Committee Chair’s letter on page 85. The eight SPI KPIs agreed between the CRC and Committee for 2022 PSP awards are as follows: ▪ Climate action: The total number of suppliers with whom we have signed agreements to develop renewable
or recycled carbon surfactants (surface active agent). ▪ Protect and regenerate nature: % of volume of supply of palm oil, soy, paper and board, cocoa and tea
purchased and/or contracted from low-risk sources. ▪ Waste-free world: Total tonnes of recycled plastic material content ('recycled plastic') used in our plastic
packaging portfolio as a percentage of total tonnes of plastic packaging used in products sold. ▪ Health and wellbeing: Number of people reached by brand communications and initiatives that help
improve health and wellbeing, and help advance equity and inclusion. ▪ Positive nutrition: Total sales (euros) of Unilever’s products containing plant-based meat and dairy
alternatives. ▪ Raise living standards: Value of contracts including the living wage requirement. ▪ Equity, diversity and inclusion: Monetary value (euros) of all invoices received from Tier 1 suppliers that
are either verified as a diverse business by an approved certification body or have self-declared as a diverse business.
▪ Future of work: % of employees with a future-fit skills set.
In addition to the three elements mentioned above, our Executive Directors are provided with non-monetary benefits. These include medical insurance cover, actual tax return preparation costs and provision of death-in-service benefits and administration.
Directors’ Remuneration Report continued
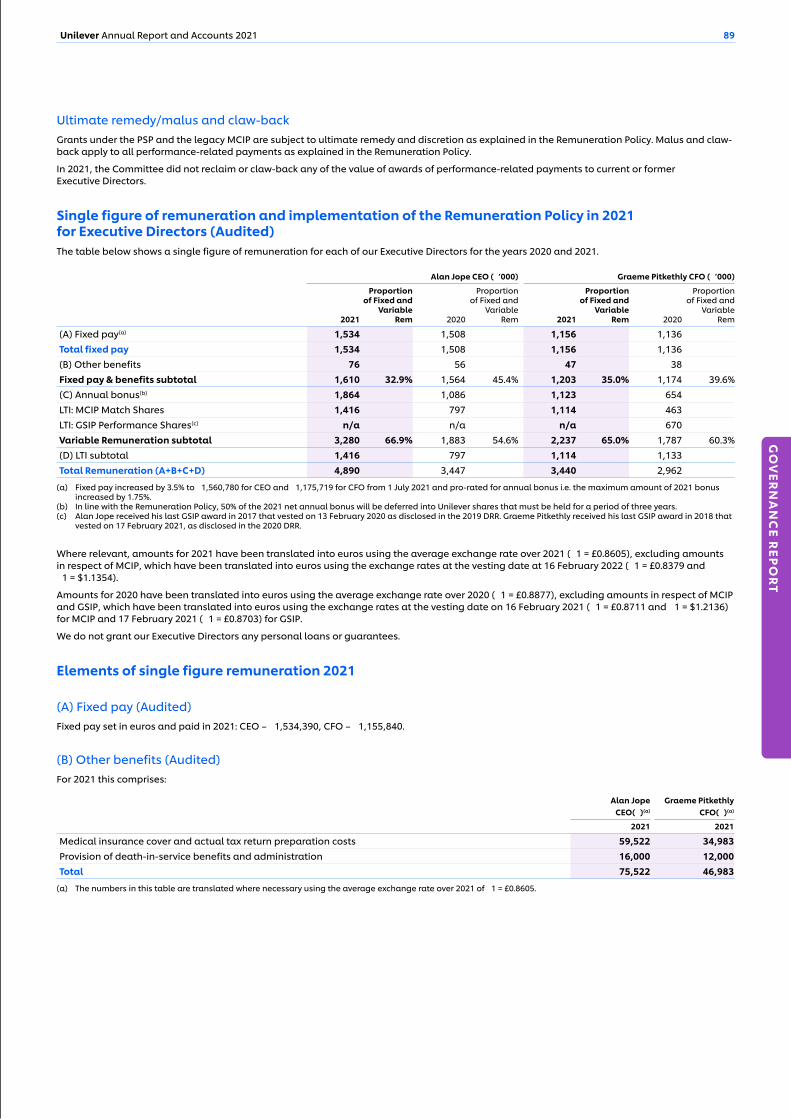
89Unilever Annual Report and Accounts 2021
GO
VER
NA
NC
E REP
OR
T
Ultimate remedy/malus and claw-backGrants under the PSP and the legacy MCIP are subject to ultimate remedy and discretion as explained in the Remuneration Policy. Malus and claw-back apply to all performance-related payments as explained in the Remuneration Policy.
In 2021, the Committee did not reclaim or claw-back any of the value of awards of performance-related payments to current or former Executive Directors.
Single figure of remuneration and implementation of the Remuneration Policy in 2021 for Executive Directors (Audited) The table below shows a single figure of remuneration for each of our Executive Directors for the years 2020 and 2021.
Alan Jope CEO (€’000) Graeme Pitkethly CFO (€’000)
2021
Proportion of Fixed and
Variable Rem 2020
Proportion of Fixed and
Variable Rem 2021
Proportion of Fixed and
Variable Rem 2020
Proportion of Fixed and
Variable Rem
(A) Fixed pay(a) 1,534 1,508 1,156 1,136Total fixed pay 1,534 1,508 1,156 1,136(B) Other benefits 76 56 47 38Fixed pay & benefits subtotal 1,610 32.9% 1,564 45.4% 1,203 35.0% 1,174 39.6%(C) Annual bonus(b) 1,864 1,086 1,123 654LTI: MCIP Match Shares 1,416 797 1,114 463LTI: GSIP Performance Shares(c) n/a n/a n/a 670Variable Remuneration subtotal 3,280 66.9% 1,883 54.6% 2,237 65.0% 1,787 60.3%(D) LTI subtotal 1,416 797 1,114 1,133Total Remuneration (A+B+C+D) 4,890 3,447 3,440 2,962
(a) Fixed pay increased by 3.5% to €1,560,780 for CEO and €1,175,719 for CFO from 1 July 2021 and pro-rated for annual bonus i.e. the maximum amount of 2021 bonus increased by 1.75%.
(b) In line with the Remuneration Policy, 50% of the 2021 net annual bonus will be deferred into Unilever shares that must be held for a period of three years.(c) Alan Jope received his last GSIP award in 2017 that vested on 13 February 2020 as disclosed in the 2019 DRR. Graeme Pitkethly received his last GSIP award in 2018 that
vested on 17 February 2021, as disclosed in the 2020 DRR.
Where relevant, amounts for 2021 have been translated into euros using the average exchange rate over 2021 (€1 = £0.8605), excluding amounts in respect of MCIP, which have been translated into euros using the exchange rates at the vesting date at 16 February 2022 (€1 = £0.8379 and €1 = $1.1354).
Amounts for 2020 have been translated into euros using the average exchange rate over 2020 (€1 = £0.8877), excluding amounts in respect of MCIP and GSIP, which have been translated into euros using the exchange rates at the vesting date on 16 February 2021 (€1 = £0.8711 and €1 = $1.2136) for MCIP and 17 February 2021 (€1 = £0.8703) for GSIP.
We do not grant our Executive Directors any personal loans or guarantees.
Elements of single figure remuneration 2021
(A) Fixed pay (Audited)Fixed pay set in euros and paid in 2021: CEO – €1,534,390, CFO – €1,155,840.
(B) Other benefits (Audited)For 2021 this comprises:
Alan JopeCEO(€)(a)
Graeme PitkethlyCFO(€)(a)
2021 2021
Medical insurance cover and actual tax return preparation costs 59,522 34,983Provision of death-in-service benefits and administration 16,000 12,000Total 75,522 46,983
(a) The numbers in this table are translated where necessary using the average exchange rate over 2021 of €1 = £0.8605.
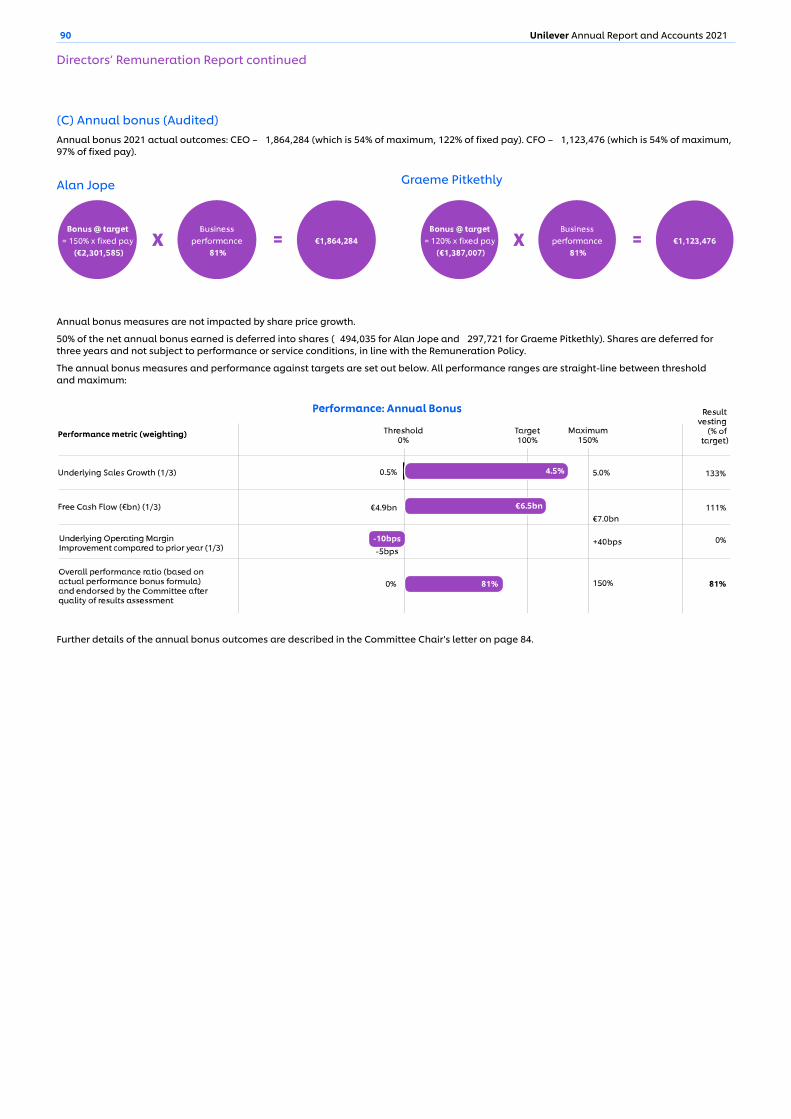
90 Unilever Annual Report and Accounts 2021
(C) Annual bonus (Audited) Annual bonus 2021 actual outcomes: CEO – €1,864,284 (which is 54% of maximum, 122% of fixed pay). CFO – €1,123,476 (which is 54% of maximum, 97% of fixed pay).
Alan Jope Graeme Pitkethly
Annual bonus measures are not impacted by share price growth.
50% of the net annual bonus earned is deferred into shares (€494,035 for Alan Jope and €297,721 for Graeme Pitkethly). Shares are deferred for three years and not subject to performance or service conditions, in line with the Remuneration Policy.
The annual bonus measures and performance against targets are set out below. All performance ranges are straight-line between threshold and maximum:
Further details of the annual bonus outcomes are described in the Committee Chair's letter on page 84.
Directors’ Remuneration Report continued
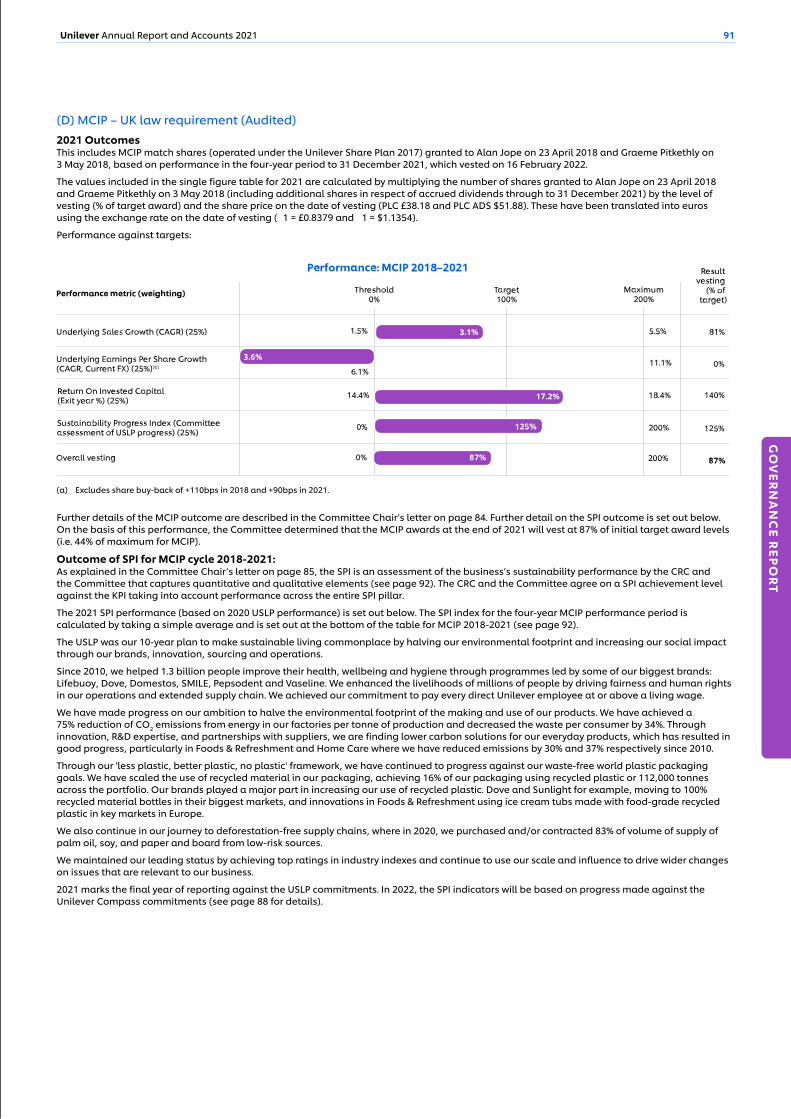
91Unilever Annual Report and Accounts 2021
GO
VER
NA
NC
E REP
OR
T
(D) MCIP – UK law requirement (Audited) 2021 OutcomesThis includes MCIP match shares (operated under the Unilever Share Plan 2017) granted to Alan Jope on 23 April 2018 and Graeme Pitkethly on 3 May 2018, based on performance in the four-year period to 31 December 2021, which vested on 16 February 2022.
The values included in the single figure table for 2021 are calculated by multiplying the number of shares granted to Alan Jope on 23 April 2018 and Graeme Pitkethly on 3 May 2018 (including additional shares in respect of accrued dividends through to 31 December 2021) by the level of vesting (% of target award) and the share price on the date of vesting (PLC £38.18 and PLC ADS $51.88). These have been translated into euros using the exchange rate on the date of vesting (€1 = £0.8379 and €1 = $1.1354).
Performance against targets:
(a) Excludes share buy-back of +110bps in 2018 and +90bps in 2021.
Further details of the MCIP outcome are described in the Committee Chair's letter on page 84. Further detail on the SPI outcome is set out below. On the basis of this performance, the Committee determined that the MCIP awards at the end of 2021 will vest at 87% of initial target award levels (i.e. 44% of maximum for MCIP).
Outcome of SPI for MCIP cycle 2018-2021: As explained in the Committee Chair’s letter on page 85, the SPI is an assessment of the business’s sustainability performance by the CRC and the Committee that captures quantitative and qualitative elements (see page 92). The CRC and the Committee agree on a SPI achievement level against the KPI taking into account performance across the entire SPI pillar.
The 2021 SPI performance (based on 2020 USLP performance) is set out below. The SPI index for the four-year MCIP performance period is calculated by taking a simple average and is set out at the bottom of the table for MCIP 2018-2021 (see page 92).
The USLP was our 10-year plan to make sustainable living commonplace by halving our environmental footprint and increasing our social impact through our brands, innovation, sourcing and operations.
Since 2010, we helped 1.3 billion people improve their health, wellbeing and hygiene through programmes led by some of our biggest brands: Lifebuoy, Dove, Domestos, SMILE, Pepsodent and Vaseline. We enhanced the livelihoods of millions of people by driving fairness and human rights in our operations and extended supply chain. We achieved our commitment to pay every direct Unilever employee at or above a living wage.
We have made progress on our ambition to halve the environmental footprint of the making and use of our products. We have achieved a 75% reduction of CO2 emissions from energy in our factories per tonne of production and decreased the waste per consumer by 34%. Through innovation, R&D expertise, and partnerships with suppliers, we are finding lower carbon solutions for our everyday products, which has resulted in good progress, particularly in Foods & Refreshment and Home Care where we have reduced emissions by 30% and 37% respectively since 2010.
Through our 'less plastic, better plastic, no plastic' framework, we have continued to progress against our waste-free world plastic packaging goals. We have scaled the use of recycled material in our packaging, achieving 16% of our packaging using recycled plastic or 112,000 tonnes across the portfolio. Our brands played a major part in increasing our use of recycled plastic. Dove and Sunlight for example, moving to 100% recycled material bottles in their biggest markets, and innovations in Foods & Refreshment using ice cream tubs made with food-grade recycled plastic in key markets in Europe.
We also continue in our journey to deforestation-free supply chains, where in 2020, we purchased and/or contracted 83% of volume of supply of palm oil, soy, and paper and board from low-risk sources.
We maintained our leading status by achieving top ratings in industry indexes and continue to use our scale and influence to drive wider changes on issues that are relevant to our business.
2021 marks the final year of reporting against the USLP commitments. In 2022, the SPI indicators will be based on progress made against the Unilever Compass commitments (see page 88 for details).
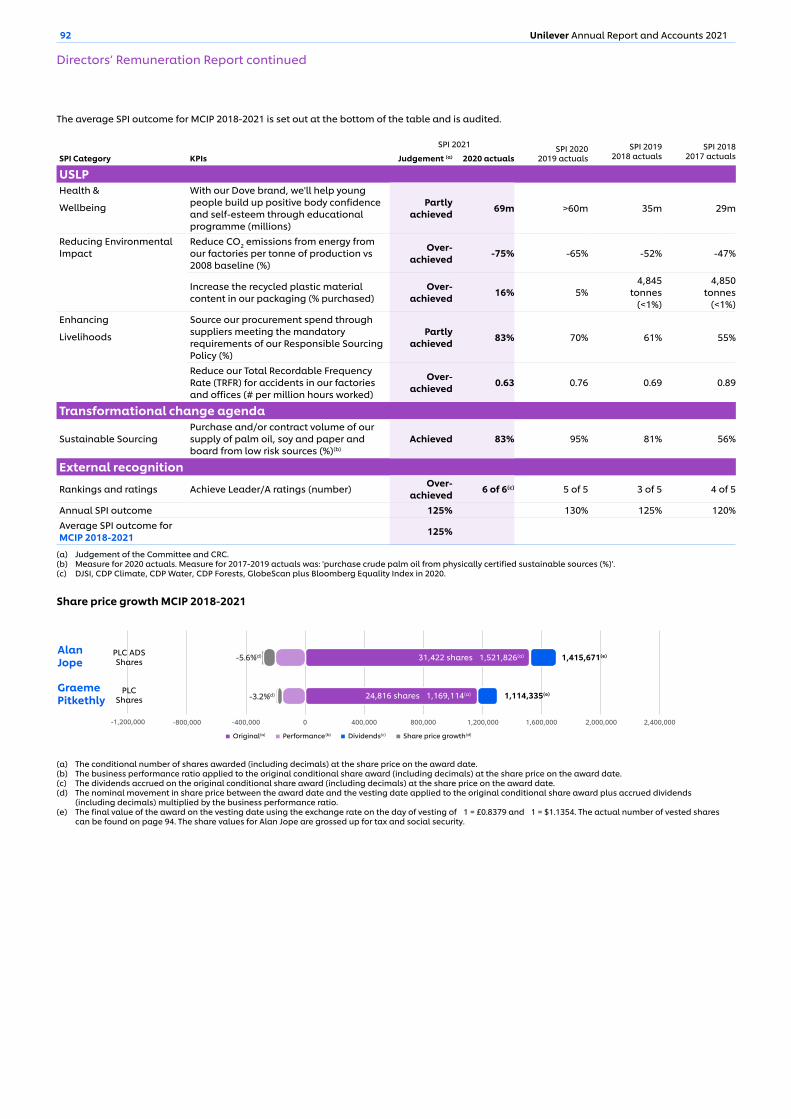
92 Unilever Annual Report and Accounts 2021
Graeme Pitkethly
2,000,0001,600,0001,200,000800,000400,0000
PLC Shares
Original(a) Performance(b) Dividends(c) Share price growth(d)
2,400,000-400,000-800,000-1,200,000
Alan Jope
PLC ADS Shares
24,816 shares €1,169,114(a) €1,114,335(e)-3.2%(d)
31,422 shares €1,521,826(a) €1,415,671(e)-5.6%(d)
The average SPI outcome for MCIP 2018-2021 is set out at the bottom of the table and is audited.
SPI 2021 SPI 2020 2019 actuals
SPI 2019 2018 actuals
SPI 2018 2017 actualsSPI Category KPIs Judgement (a) 2020 actuals
USLPHealth &
Wellbeing
With our Dove brand, we'll help young people build up positive body confidence and self-esteem through educational programme (millions)
Partly achieved 69m >60m 35m 29m
Reducing Environmental Impact
Reduce CO2 emissions from energy from our factories per tonne of production vs 2008 baseline (%)
Over-achieved -75% -65% -52% -47%
Increase the recycled plastic material content in our packaging (% purchased)
Over-achieved 16% 5%
4,845 tonnes
(<1%)
4,850 tonnes
(<1%)Enhancing
Livelihoods
Source our procurement spend through suppliers meeting the mandatory requirements of our Responsible Sourcing Policy (%)
Partly achieved 83% 70% 61% 55%
Reduce our Total Recordable Frequency Rate (TRFR) for accidents in our factories and offices (# per million hours worked)
Over-achieved 0.63 0.76 0.69 0.89
Transformational change agenda
Sustainable SourcingPurchase and/or contract volume of our supply of palm oil, soy and paper and board from low risk sources (%)(b)
Achieved 83% 95% 81% 56%
External recognition
Rankings and ratings Achieve Leader/A ratings (number) Over-achieved 6 of 6(c) 5 of 5 3 of 5 4 of 5
Annual SPI outcome 125% 130% 125% 120%Average SPI outcome for MCIP 2018-2021 125%
(a) Judgement of the Committee and CRC.(b) Measure for 2020 actuals. Measure for 2017-2019 actuals was: 'purchase crude palm oil from physically certified sustainable sources (%)'. (c) DJSI, CDP Climate, CDP Water, CDP Forests, GlobeScan plus Bloomberg Equality Index in 2020.
Share price growth MCIP 2018-2021
(a) The conditional number of shares awarded (including decimals) at the share price on the award date. (b) The business performance ratio applied to the original conditional share award (including decimals) at the share price on the award date.(c) The dividends accrued on the original conditional share award (including decimals) at the share price on the award date.(d) The nominal movement in share price between the award date and the vesting date applied to the original conditional share award plus accrued dividends
(including decimals) multiplied by the business performance ratio.(e) The final value of the award on the vesting date using the exchange rate on the day of vesting of €1 = £0.8379 and €1 = $1.1354. The actual number of vested shares
can be found on page 94. The share values for Alan Jope are grossed up for tax and social security.
Directors’ Remuneration Report continued
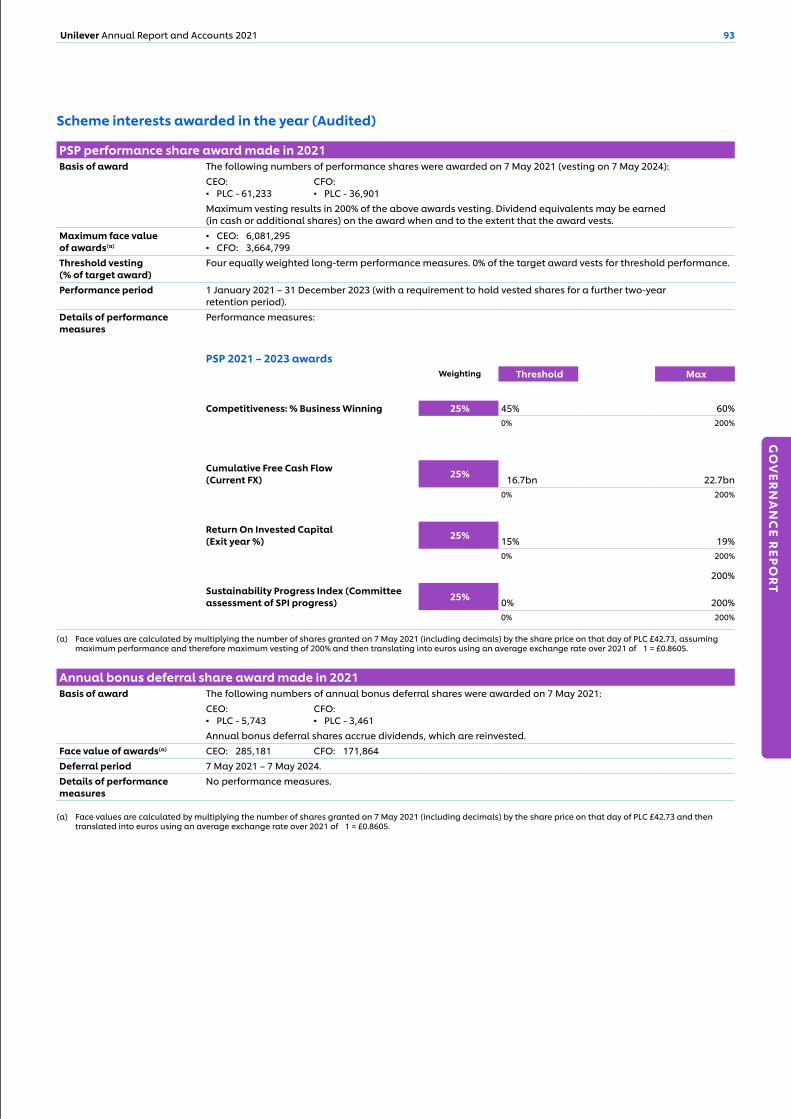
93Unilever Annual Report and Accounts 2021
GO
VER
NA
NC
E REP
OR
T
Scheme interests awarded in the year (Audited)
PSP performance share award made in 2021 Basis of award The following numbers of performance shares were awarded on 7 May 2021 (vesting on 7 May 2024):
CEO: ▪ PLC - 61,233
CFO: ▪ PLC - 36,901
Maximum vesting results in 200% of the above awards vesting. Dividend equivalents may be earned (in cash or additional shares) on the award when and to the extent that the award vests.
Maximum face value of awards(a)
▪ CEO: €6,081,295 ▪ CFO: €3,664,799
Threshold vesting (% of target award)
Four equally weighted long-term performance measures. 0% of the target award vests for threshold performance.
Performance period 1 January 2021 – 31 December 2023 (with a requirement to hold vested shares for a further two-year retention period).
Details of performance measures
Performance measures:
PSP 2021 – 2023 awardsWeighting Threshold Max
Competitiveness: % Business Winning 25% 45% 60%0% 200%
Cumulative Free Cash Flow (Current FX) 25% €16.7bn 22.7bn
0% 200%
Return On Invested Capital (Exit year %) 25% 15% 19%
0% 200%
200%Sustainability Progress Index (Committee assessment of SPI progress) 25% 0% 200%
0% 200%
(a) Face values are calculated by multiplying the number of shares granted on 7 May 2021 (including decimals) by the share price on that day of PLC £42.73, assuming maximum performance and therefore maximum vesting of 200% and then translating into euros using an average exchange rate over 2021 of €1 = £0.8605.
Annual bonus deferral share award made in 2021 Basis of award The following numbers of annual bonus deferral shares were awarded on 7 May 2021:
CEO: ▪ PLC - 5,743
CFO: ▪ PLC - 3,461
Annual bonus deferral shares accrue dividends, which are reinvested. Face value of awards(a) CEO: €285,181 CFO: €171,864Deferral period 7 May 2021 – 7 May 2024. Details of performance measures
No performance measures.
(a) Face values are calculated by multiplying the number of shares granted on 7 May 2021 (including decimals) by the share price on that day of PLC £42.73 and then translated into euros using an average exchange rate over 2021 of €1 = £0.8605.
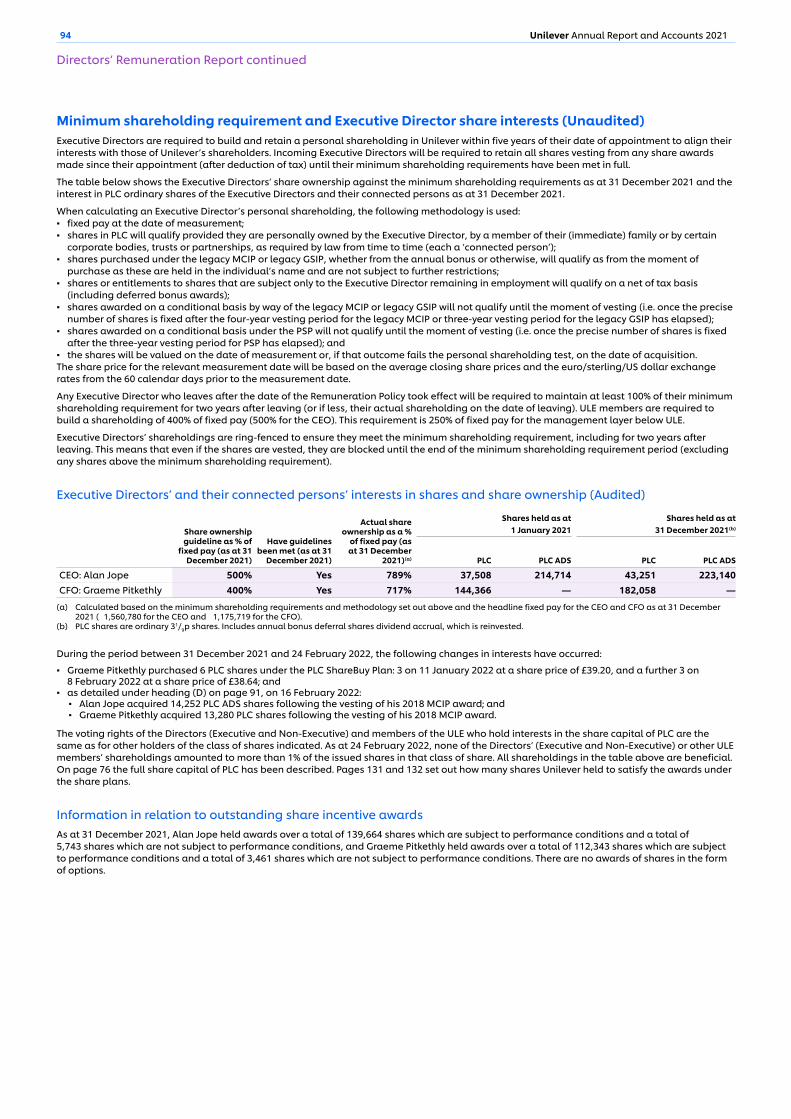
94 Unilever Annual Report and Accounts 2021
Minimum shareholding requirement and Executive Director share interests (Unaudited)Executive Directors are required to build and retain a personal shareholding in Unilever within five years of their date of appointment to align their interests with those of Unilever’s shareholders. Incoming Executive Directors will be required to retain all shares vesting from any share awards made since their appointment (after deduction of tax) until their minimum shareholding requirements have been met in full.
The table below shows the Executive Directors’ share ownership against the minimum shareholding requirements as at 31 December 2021 and the interest in PLC ordinary shares of the Executive Directors and their connected persons as at 31 December 2021.
When calculating an Executive Director’s personal shareholding, the following methodology is used: ▪ fixed pay at the date of measurement; ▪ shares in PLC will qualify provided they are personally owned by the Executive Director, by a member of their (immediate) family or by certain
corporate bodies, trusts or partnerships, as required by law from time to time (each a ‘connected person’); ▪ shares purchased under the legacy MCIP or legacy GSIP, whether from the annual bonus or otherwise, will qualify as from the moment of
purchase as these are held in the individual’s name and are not subject to further restrictions; ▪ shares or entitlements to shares that are subject only to the Executive Director remaining in employment will qualify on a net of tax basis
(including deferred bonus awards); ▪ shares awarded on a conditional basis by way of the legacy MCIP or legacy GSIP will not qualify until the moment of vesting (i.e. once the precise
number of shares is fixed after the four-year vesting period for the legacy MCIP or three-year vesting period for the legacy GSIP has elapsed); ▪ shares awarded on a conditional basis under the PSP will not qualify until the moment of vesting (i.e. once the precise number of shares is fixed
after the three-year vesting period for PSP has elapsed); and ▪ the shares will be valued on the date of measurement or, if that outcome fails the personal shareholding test, on the date of acquisition.
The share price for the relevant measurement date will be based on the average closing share prices and the euro/sterling/US dollar exchange rates from the 60 calendar days prior to the measurement date.
Any Executive Director who leaves after the date of the Remuneration Policy took effect will be required to maintain at least 100% of their minimum shareholding requirement for two years after leaving (or if less, their actual shareholding on the date of leaving). ULE members are required to build a shareholding of 400% of fixed pay (500% for the CEO). This requirement is 250% of fixed pay for the management layer below ULE.
Executive Directors’ shareholdings are ring-fenced to ensure they meet the minimum shareholding requirement, including for two years after leaving. This means that even if the shares are vested, they are blocked until the end of the minimum shareholding requirement period (excluding any shares above the minimum shareholding requirement).
Executive Directors’ and their connected persons’ interests in shares and share ownership (Audited)
Share ownership guideline as % of
fixed pay (as at 31 December 2021)
Have guidelines been met (as at 31
December 2021)
Actual share ownership as a %
of fixed pay (as at 31 December
2021)(a)
Shares held as at1 January 2021
Shares held as at31 December 2021(b)
PLC PLC ADS PLC PLC ADS
CEO: Alan Jope 500% Yes 789% 37,508 214,714 43,251 223,140CFO: Graeme Pitkethly 400% Yes 717% 144,366 — 182,058 —
(a) Calculated based on the minimum shareholding requirements and methodology set out above and the headline fixed pay for the CEO and CFO as at 31 December 2021 (€1,560,780 for the CEO and €1,175,719 for the CFO).
(b) PLC shares are ordinary 31/9p shares. Includes annual bonus deferral shares dividend accrual, which is reinvested.
During the period between 31 December 2021 and 24 February 2022, the following changes in interests have occurred:
▪ Graeme Pitkethly purchased 6 PLC shares under the PLC ShareBuy Plan: 3 on 11 January 2022 at a share price of £39.20, and a further 3 on 8 February 2022 at a share price of £38.64; and
▪ as detailed under heading (D) on page 91, on 16 February 2022: ▪ Alan Jope acquired 14,252 PLC ADS shares following the vesting of his 2018 MCIP award; and ▪ Graeme Pitkethly acquired 13,280 PLC shares following the vesting of his 2018 MCIP award.
The voting rights of the Directors (Executive and Non-Executive) and members of the ULE who hold interests in the share capital of PLC are the same as for other holders of the class of shares indicated. As at 24 February 2022, none of the Directors’ (Executive and Non-Executive) or other ULE members’ shareholdings amounted to more than 1% of the issued shares in that class of share. All shareholdings in the table above are beneficial. On page 76 the full share capital of PLC has been described. Pages 131 and 132 set out how many shares Unilever held to satisfy the awards under the share plans.
Information in relation to outstanding share incentive awardsAs at 31 December 2021, Alan Jope held awards over a total of 139,664 shares which are subject to performance conditions and a total of 5,743 shares which are not subject to performance conditions, and Graeme Pitkethly held awards over a total of 112,343 shares which are subject to performance conditions and a total of 3,461 shares which are not subject to performance conditions. There are no awards of shares in the form of options.
Directors’ Remuneration Report continued
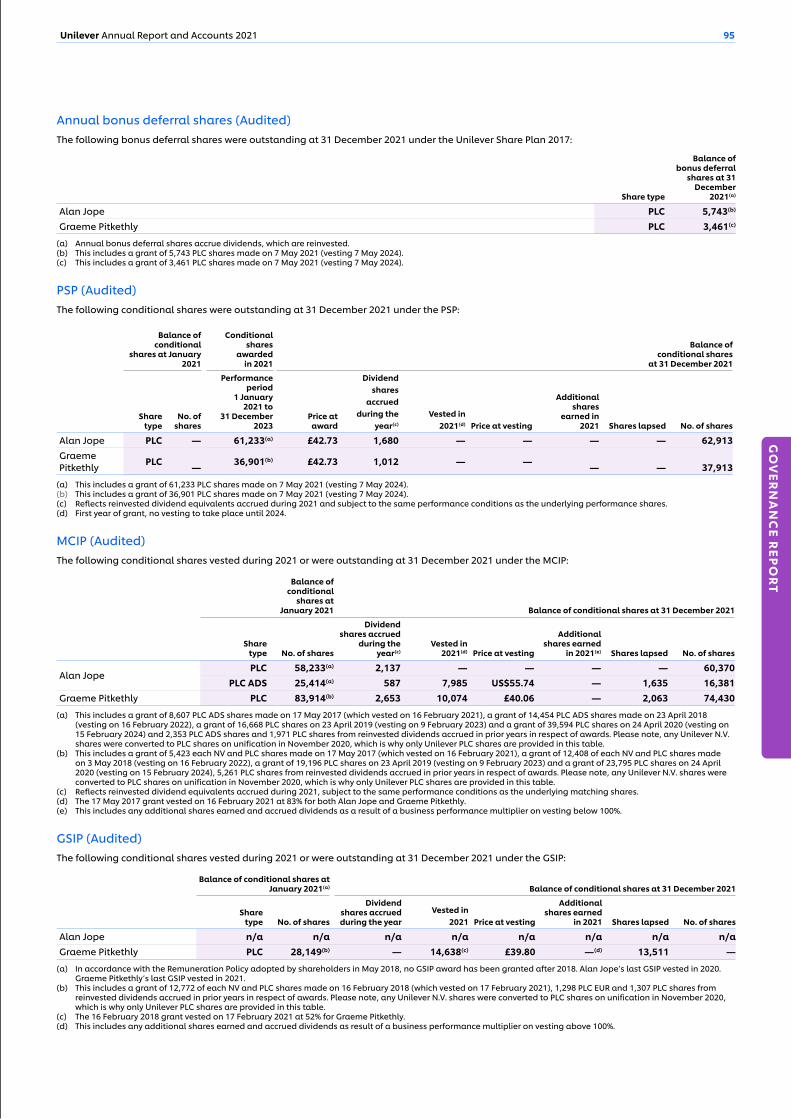
95Unilever Annual Report and Accounts 2021
GO
VER
NA
NC
E REP
OR
T
Annual bonus deferral shares (Audited)The following bonus deferral shares were outstanding at 31 December 2021 under the Unilever Share Plan 2017:
Share type
Balance of bonus deferral
shares at 31 December
2021(a)
Alan Jope PLC 5,743(b)
Graeme Pitkethly PLC 3,461(c)
(a) Annual bonus deferral shares accrue dividends, which are reinvested.(b) This includes a grant of 5,743 PLC shares made on 7 May 2021 (vesting 7 May 2024).(c) This includes a grant of 3,461 PLC shares made on 7 May 2021 (vesting 7 May 2024).
PSP (Audited)The following conditional shares were outstanding at 31 December 2021 under the PSP:
Balance of conditional
shares at January 2021
Conditional shares
awarded in 2021
Balance of conditional shares
at 31 December 2021
Share type
No. of shares
Performance period
1 January 2021 to
31 December 2023
Price at award
Dividendshares
accruedduring the
year(c)
Vested in2021(d) Price at vesting
Additional shares
earned in 2021 Shares lapsed No. of shares
Alan Jope PLC — 61,233(a) £42.73 1,680 — — — — 62,913Graeme Pitkethly PLC — 36,901(b) £42.73 1,012 — — — — 37,913
(a) This includes a grant of 61,233 PLC shares made on 7 May 2021 (vesting 7 May 2024).(b) This includes a grant of 36,901 PLC shares made on 7 May 2021 (vesting 7 May 2024).(c) Reflects reinvested dividend equivalents accrued during 2021 and subject to the same performance conditions as the underlying performance shares.(d) First year of grant, no vesting to take place until 2024.
MCIP (Audited)The following conditional shares vested during 2021 or were outstanding at 31 December 2021 under the MCIP:
Balance of conditional
shares at January 2021 Balance of conditional shares at 31 December 2021
Share type No. of shares
Dividend shares accrued
during the year(c)
Vested in 2021(d) Price at vesting
Additional shares earned
in 2021(e) Shares lapsed No. of shares
Alan JopePLC 58,233(a) 2,137 — — — — 60,370
PLC ADS 25,414(a) 587 7,985 US$55.74 — 1,635 16,381Graeme Pitkethly PLC 83,914(b) 2,653 10,074 £40.06 — 2,063 74,430
(a) This includes a grant of 8,607 PLC ADS shares made on 17 May 2017 (which vested on 16 February 2021), a grant of 14,454 PLC ADS shares made on 23 April 2018 (vesting on 16 February 2022), a grant of 16,668 PLC shares on 23 April 2019 (vesting on 9 February 2023) and a grant of 39,594 PLC shares on 24 April 2020 (vesting on 15 February 2024) and 2,353 PLC ADS shares and 1,971 PLC shares from reinvested dividends accrued in prior years in respect of awards. Please note, any Unilever N.V. shares were converted to PLC shares on unification in November 2020, which is why only Unilever PLC shares are provided in this table.
(b) This includes a grant of 5,423 each NV and PLC shares made on 17 May 2017 (which vested on 16 February 2021), a grant of 12,408 of each NV and PLC shares made on 3 May 2018 (vesting on 16 February 2022), a grant of 19,196 PLC shares on 23 April 2019 (vesting on 9 February 2023) and a grant of 23,795 PLC shares on 24 April 2020 (vesting on 15 February 2024), 5,261 PLC shares from reinvested dividends accrued in prior years in respect of awards. Please note, any Unilever N.V. shares were converted to PLC shares on unification in November 2020, which is why only Unilever PLC shares are provided in this table.
(c) Reflects reinvested dividend equivalents accrued during 2021, subject to the same performance conditions as the underlying matching shares.(d) The 17 May 2017 grant vested on 16 February 2021 at 83% for both Alan Jope and Graeme Pitkethly.(e) This includes any additional shares earned and accrued dividends as a result of a business performance multiplier on vesting below 100%.
GSIP (Audited)The following conditional shares vested during 2021 or were outstanding at 31 December 2021 under the GSIP:
Balance of conditional shares at January 2021(a) Balance of conditional shares at 31 December 2021
Share type No. of shares
Dividend shares accrued during the year
Vested in2021 Price at vesting
Additional shares earned
in 2021 Shares lapsed No. of shares
Alan Jope n/a n/a n/a n/a n/a n/a n/a n/aGraeme Pitkethly PLC 28,149(b) — 14,638(c) £39.80 —(d) 13,511 —
(a) In accordance with the Remuneration Policy adopted by shareholders in May 2018, no GSIP award has been granted after 2018. Alan Jope’s last GSIP vested in 2020. Graeme Pitkethly’s last GSIP vested in 2021.
(b) This includes a grant of 12,772 of each NV and PLC shares made on 16 February 2018 (which vested on 17 February 2021), 1,298 PLC EUR and 1,307 PLC shares from reinvested dividends accrued in prior years in respect of awards. Please note, any Unilever N.V. shares were converted to PLC shares on unification in November 2020, which is why only Unilever PLC shares are provided in this table.
(c) The 16 February 2018 grant vested on 17 February 2021 at 52% for Graeme Pitkethly.(d) This includes any additional shares earned and accrued dividends as result of a business performance multiplier on vesting above 100%.
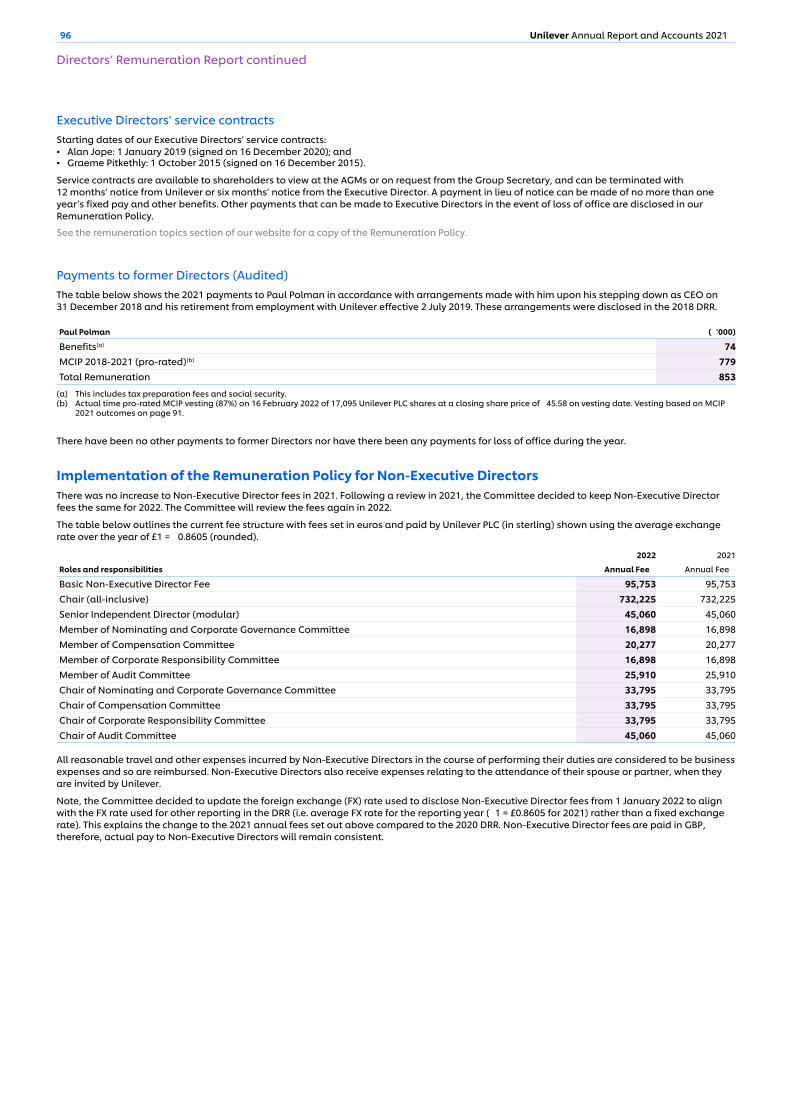
96 Unilever Annual Report and Accounts 2021
Executive Directors' service contractsStarting dates of our Executive Directors’ service contracts: ▪ Alan Jope: 1 January 2019 (signed on 16 December 2020); and ▪ Graeme Pitkethly: 1 October 2015 (signed on 16 December 2015).
Service contracts are available to shareholders to view at the AGMs or on request from the Group Secretary, and can be terminated with 12 months’ notice from Unilever or six months’ notice from the Executive Director. A payment in lieu of notice can be made of no more than one year’s fixed pay and other benefits. Other payments that can be made to Executive Directors in the event of loss of office are disclosed in our Remuneration Policy.
See the remuneration topics section of our website for a copy of the Remuneration Policy.
Payments to former Directors (Audited) The table below shows the 2021 payments to Paul Polman in accordance with arrangements made with him upon his stepping down as CEO on 31 December 2018 and his retirement from employment with Unilever effective 2 July 2019. These arrangements were disclosed in the 2018 DRR.
Paul Polman (€'000)
Benefits(a) 74MCIP 2018-2021 (pro-rated)(b) 779Total Remuneration 853
(a) This includes tax preparation fees and social security.(b) Actual time pro-rated MCIP vesting (87%) on 16 February 2022 of 17,095 Unilever PLC shares at a closing share price of €45.58 on vesting date. Vesting based on MCIP
2021 outcomes on page 91.
There have been no other payments to former Directors nor have there been any payments for loss of office during the year.
Implementation of the Remuneration Policy for Non-Executive DirectorsThere was no increase to Non-Executive Director fees in 2021. Following a review in 2021, the Committee decided to keep Non-Executive Director fees the same for 2022. The Committee will review the fees again in 2022.
The table below outlines the current fee structure with fees set in euros and paid by Unilever PLC (in sterling) shown using the average exchange rate over the year of £1 = €0.8605 (rounded).
2022 2021
Roles and responsibilities Annual Fee € Annual Fee €
Basic Non-Executive Director Fee 95,753 95,753Chair (all-inclusive) 732,225 732,225Senior Independent Director (modular) 45,060 45,060Member of Nominating and Corporate Governance Committee 16,898 16,898Member of Compensation Committee 20,277 20,277Member of Corporate Responsibility Committee 16,898 16,898Member of Audit Committee 25,910 25,910Chair of Nominating and Corporate Governance Committee 33,795 33,795Chair of Compensation Committee 33,795 33,795Chair of Corporate Responsibility Committee 33,795 33,795Chair of Audit Committee 45,060 45,060
All reasonable travel and other expenses incurred by Non-Executive Directors in the course of performing their duties are considered to be business expenses and so are reimbursed. Non-Executive Directors also receive expenses relating to the attendance of their spouse or partner, when they are invited by Unilever.
Note, the Committee decided to update the foreign exchange (FX) rate used to disclose Non-Executive Director fees from 1 January 2022 to align with the FX rate used for other reporting in the DRR (i.e. average FX rate for the reporting year (€1 = £0.8605 for 2021) rather than a fixed exchange rate). This explains the change to the 2021 annual fees set out above compared to the 2020 DRR. Non-Executive Director fees are paid in GBP, therefore, actual pay to Non-Executive Directors will remain consistent.
Directors’ Remuneration Report continued
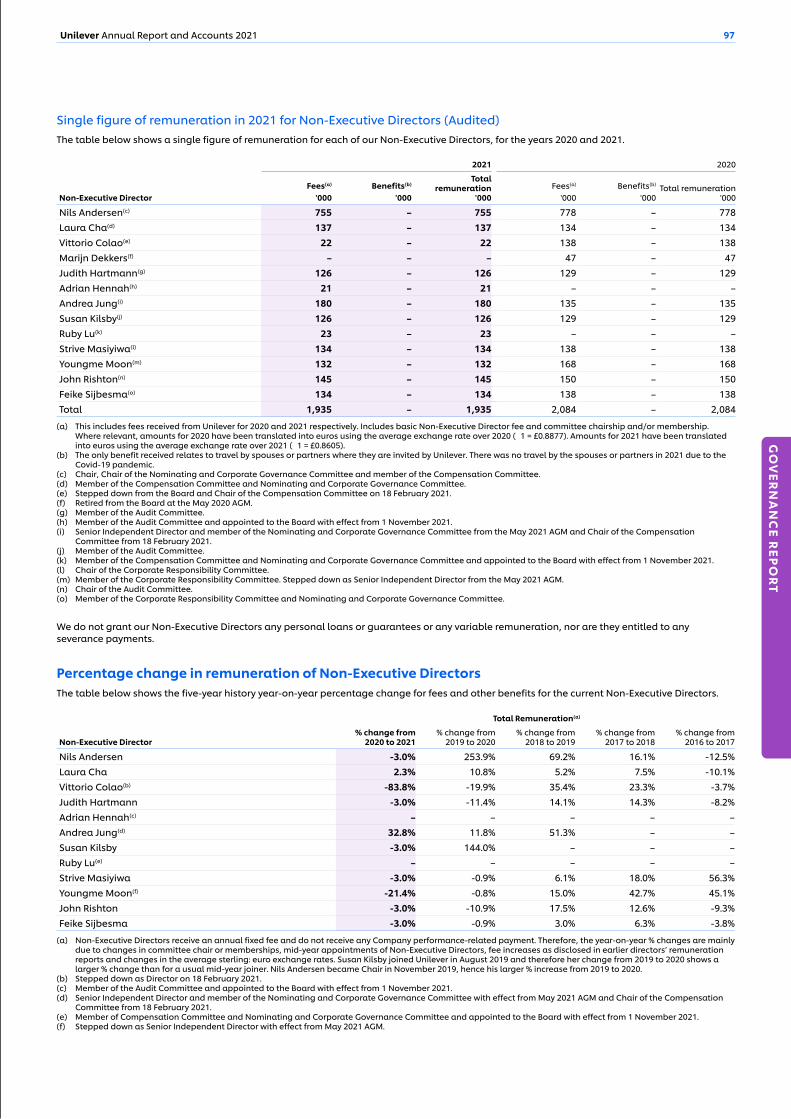
97Unilever Annual Report and Accounts 2021
GO
VER
NA
NC
E REP
OR
T
Single figure of remuneration in 2021 for Non-Executive Directors (Audited)The table below shows a single figure of remuneration for each of our Non-Executive Directors, for the years 2020 and 2021.
Non-Executive Director
2021 2020
Fees(a)
€'000Benefits(b)
€'000
Total remuneration
€'000Fees(a)
€'000Benefits(b)
€'000Total remuneration
€'000
Nils Andersen(c) 755 – 755 778 – 778Laura Cha(d) 137 – 137 134 – 134Vittorio Colao(e) 22 – 22 138 – 138Marijn Dekkers(f) – – – 47 – 47Judith Hartmann(g) 126 – 126 129 – 129Adrian Hennah(h) 21 – 21 – – –Andrea Jung(i) 180 – 180 135 – 135Susan Kilsby(j) 126 – 126 129 – 129Ruby Lu(k) 23 – 23 – – –Strive Masiyiwa(l) 134 – 134 138 – 138Youngme Moon(m) 132 – 132 168 – 168John Rishton(n) 145 – 145 150 – 150Feike Sijbesma(o) 134 – 134 138 – 138Total 1,935 – 1,935 2,084 – 2,084
(a) This includes fees received from Unilever for 2020 and 2021 respectively. Includes basic Non-Executive Director fee and committee chairship and/or membership. Where relevant, amounts for 2020 have been translated into euros using the average exchange rate over 2020 (€1 = £0.8877). Amounts for 2021 have been translated into euros using the average exchange rate over 2021 (€1 = £0.8605).
(b) The only benefit received relates to travel by spouses or partners where they are invited by Unilever. There was no travel by the spouses or partners in 2021 due to the Covid-19 pandemic.
(c) Chair, Chair of the Nominating and Corporate Governance Committee and member of the Compensation Committee.(d) Member of the Compensation Committee and Nominating and Corporate Governance Committee. (e) Stepped down from the Board and Chair of the Compensation Committee on 18 February 2021.(f) Retired from the Board at the May 2020 AGM.(g) Member of the Audit Committee. (h) Member of the Audit Committee and appointed to the Board with effect from 1 November 2021. (i) Senior Independent Director and member of the Nominating and Corporate Governance Committee from the May 2021 AGM and Chair of the Compensation
Committee from 18 February 2021.(j) Member of the Audit Committee. (k) Member of the Compensation Committee and Nominating and Corporate Governance Committee and appointed to the Board with effect from 1 November 2021. (l) Chair of the Corporate Responsibility Committee.(m) Member of the Corporate Responsibility Committee. Stepped down as Senior Independent Director from the May 2021 AGM. (n) Chair of the Audit Committee.(o) Member of the Corporate Responsibility Committee and Nominating and Corporate Governance Committee.
We do not grant our Non-Executive Directors any personal loans or guarantees or any variable remuneration, nor are they entitled to any severance payments.
Percentage change in remuneration of Non-Executive DirectorsThe table below shows the five-year history year-on-year percentage change for fees and other benefits for the current Non-Executive Directors.
Total Remuneration(a)
Non-Executive Director% change from
2020 to 2021% change from
2019 to 2020% change from
2018 to 2019% change from
2017 to 2018% change from
2016 to 2017
Nils Andersen -3.0% 253.9% 69.2% 16.1% -12.5%Laura Cha 2.3% 10.8% 5.2% 7.5% -10.1%Vittorio Colao(b) -83.8% -19.9% 35.4% 23.3% -3.7%Judith Hartmann -3.0% -11.4% 14.1% 14.3% -8.2%Adrian Hennah(c) – – – – –Andrea Jung(d) 32.8% 11.8% 51.3% – –Susan Kilsby -3.0% 144.0% – – –Ruby Lu(e) – – – – –Strive Masiyiwa -3.0% -0.9% 6.1% 18.0% 56.3%Youngme Moon(f) -21.4% -0.8% 15.0% 42.7% 45.1%John Rishton -3.0% -10.9% 17.5% 12.6% -9.3%Feike Sijbesma -3.0% -0.9% 3.0% 6.3% -3.8%
(a) Non-Executive Directors receive an annual fixed fee and do not receive any Company performance-related payment. Therefore, the year-on-year % changes are mainly due to changes in committee chair or memberships, mid-year appointments of Non-Executive Directors, fee increases as disclosed in earlier directors’ remuneration reports and changes in the average sterling: euro exchange rates. Susan Kilsby joined Unilever in August 2019 and therefore her change from 2019 to 2020 shows a larger % change than for a usual mid-year joiner. Nils Andersen became Chair in November 2019, hence his larger % increase from 2019 to 2020.
(b) Stepped down as Director on 18 February 2021.(c) Member of the Audit Committee and appointed to the Board with effect from 1 November 2021. (d) Senior Independent Director and member of the Nominating and Corporate Governance Committee with effect from May 2021 AGM and Chair of the Compensation
Committee from 18 February 2021. (e) Member of Compensation Committee and Nominating and Corporate Governance Committee and appointed to the Board with effect from 1 November 2021. (f) Stepped down as Senior Independent Director with effect from May 2021 AGM.
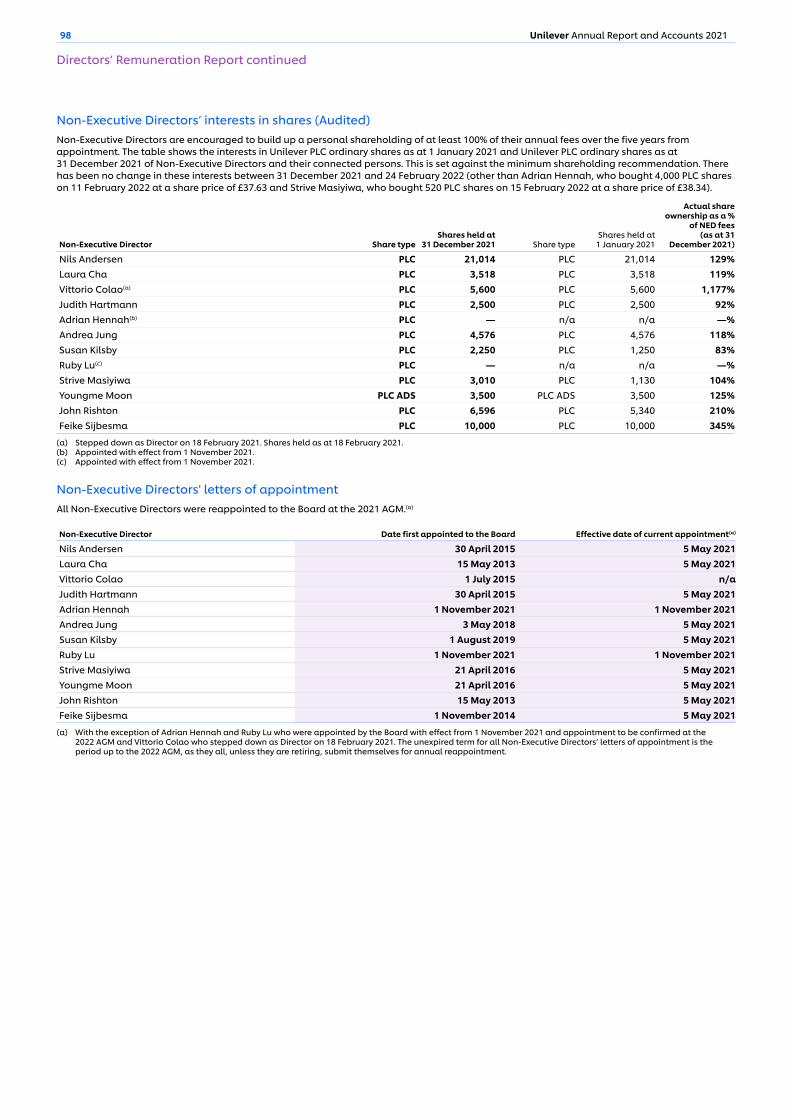
98 Unilever Annual Report and Accounts 2021
Non-Executive Directors’ interests in shares (Audited)Non-Executive Directors are encouraged to build up a personal shareholding of at least 100% of their annual fees over the five years from appointment. The table shows the interests in Unilever PLC ordinary shares as at 1 January 2021 and Unilever PLC ordinary shares as at 31 December 2021 of Non-Executive Directors and their connected persons. This is set against the minimum shareholding recommendation. There has been no change in these interests between 31 December 2021 and 24 February 2022 (other than Adrian Hennah, who bought 4,000 PLC shares on 11 February 2022 at a share price of £37.63 and Strive Masiyiwa, who bought 520 PLC shares on 15 February 2022 at a share price of £38.34).
Non-Executive Director Share typeShares held at
31 December 2021 Share typeShares held at
1 January 2021
Actual share ownership as a %
of NED fees (as at 31
December 2021)
Nils Andersen PLC 21,014 PLC 21,014 129%Laura Cha PLC 3,518 PLC 3,518 119%Vittorio Colao(a) PLC 5,600 PLC 5,600 1,177%Judith Hartmann PLC 2,500 PLC 2,500 92%Adrian Hennah(b) PLC — n/a n/a —%Andrea Jung PLC 4,576 PLC 4,576 118%Susan Kilsby PLC 2,250 PLC 1,250 83%Ruby Lu(c) PLC — n/a n/a —%Strive Masiyiwa PLC 3,010 PLC 1,130 104%Youngme Moon PLC ADS 3,500 PLC ADS 3,500 125%John Rishton PLC 6,596 PLC 5,340 210%Feike Sijbesma PLC 10,000 PLC 10,000 345%
(a) Stepped down as Director on 18 February 2021. Shares held as at 18 February 2021. (b) Appointed with effect from 1 November 2021.(c) Appointed with effect from 1 November 2021.
Non-Executive Directors' letters of appointmentAll Non-Executive Directors were reappointed to the Board at the 2021 AGM.(a)
Non-Executive Director Date first appointed to the Board Effective date of current appointment(a)
Nils Andersen 30 April 2015 5 May 2021Laura Cha 15 May 2013 5 May 2021Vittorio Colao 1 July 2015 n/aJudith Hartmann 30 April 2015 5 May 2021Adrian Hennah 1 November 2021 1 November 2021Andrea Jung 3 May 2018 5 May 2021Susan Kilsby 1 August 2019 5 May 2021Ruby Lu 1 November 2021 1 November 2021Strive Masiyiwa 21 April 2016 5 May 2021Youngme Moon 21 April 2016 5 May 2021John Rishton 15 May 2013 5 May 2021Feike Sijbesma 1 November 2014 5 May 2021
(a) With the exception of Adrian Hennah and Ruby Lu who were appointed by the Board with effect from 1 November 2021 and appointment to be confirmed at the 2022 AGM and Vittorio Colao who stepped down as Director on 18 February 2021. The unexpired term for all Non-Executive Directors’ letters of appointment is the period up to the 2022 AGM, as they all, unless they are retiring, submit themselves for annual reappointment.
Directors’ Remuneration Report continued
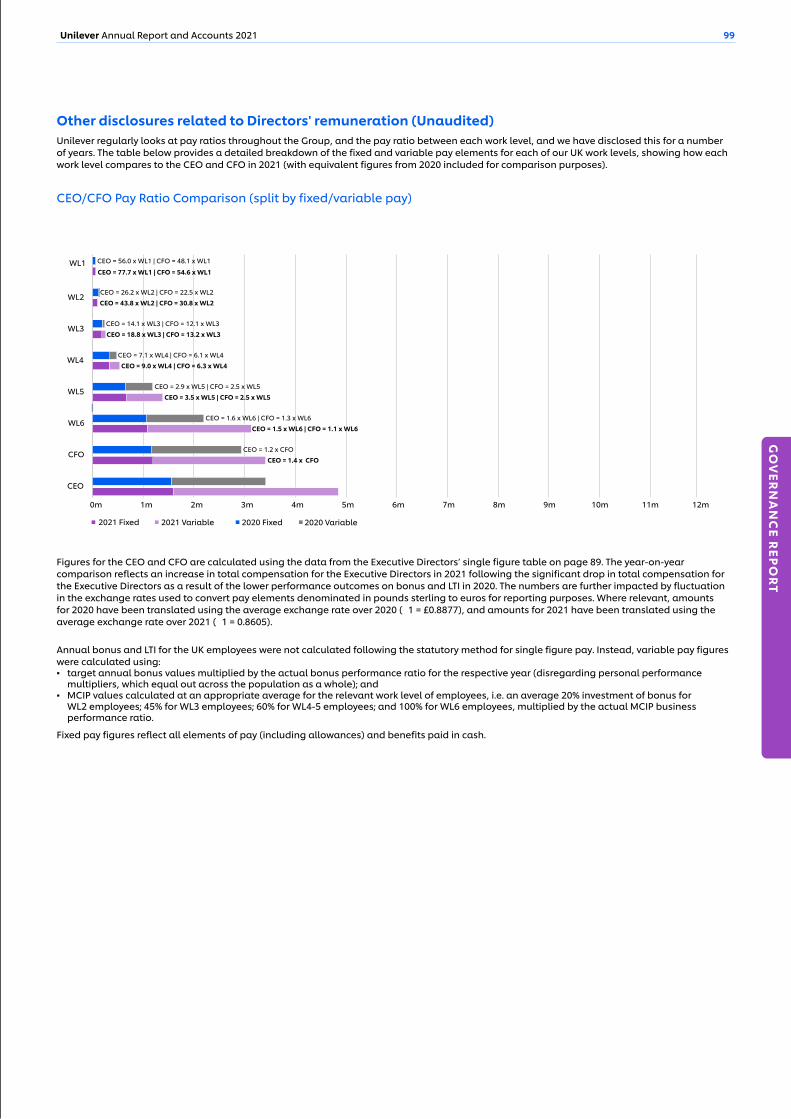
99Unilever Annual Report and Accounts 2021
GO
VER
NA
NC
E REP
OR
T
WL1
WL2
WL3
WL4
WL5
WL6
CFO
CEO
€0m €1m €2m €3m €4m €5m €6m €7m €8m €9m €10m €11m €12m
2021 Fixed 2021 Variable 2020 Fixed 2020 Variable
CEO = 77.7 x WL1 | CFO = 54.6 x WL1
CEO = 26.2 x WL2 | CFO = 22.5 x WL2 CEO = 43.8 x WL2 | CFO = 30.8 x WL2
CEO = 14.1 x WL3 | CFO = 12.1 x WL3 CEO = 18.8 x WL3 | CFO = 13.2 x WL3
CEO = 7.1 x WL4 | CFO = 6.1 x WL4 CEO = 9.0 x WL4 | CFO = 6.3 x WL4
CEO = 2.9 x WL5 | CFO = 2.5 x WL5 CEO = 3.5 x WL5 | CFO = 2.5 x WL5
CEO = 1.6 x WL6 | CFO = 1.3 x WL6 CEO = 1.5 x WL6 | CFO = 1.1 x WL6
CEO = 1.2 x CFO CEO = 1.4 x CFO
CEO = 56.0 x WL1 | CFO = 48.1 x WL1
Other disclosures related to Directors' remuneration (Unaudited)Unilever regularly looks at pay ratios throughout the Group, and the pay ratio between each work level, and we have disclosed this for a number of years. The table below provides a detailed breakdown of the fixed and variable pay elements for each of our UK work levels, showing how each work level compares to the CEO and CFO in 2021 (with equivalent figures from 2020 included for comparison purposes).
CEO/CFO Pay Ratio Comparison (split by fixed/variable pay)
Figures for the CEO and CFO are calculated using the data from the Executive Directors’ single figure table on page 89. The year-on-year comparison reflects an increase in total compensation for the Executive Directors in 2021 following the significant drop in total compensation for the Executive Directors as a result of the lower performance outcomes on bonus and LTI in 2020. The numbers are further impacted by fluctuation in the exchange rates used to convert pay elements denominated in pounds sterling to euros for reporting purposes. Where relevant, amounts for 2020 have been translated using the average exchange rate over 2020 (€1 = £0.8877), and amounts for 2021 have been translated using the average exchange rate over 2021 (€1 = 0.8605).
Annual bonus and LTI for the UK employees were not calculated following the statutory method for single figure pay. Instead, variable pay figures were calculated using: ▪ target annual bonus values multiplied by the actual bonus performance ratio for the respective year (disregarding personal performance
multipliers, which equal out across the population as a whole); and ▪ MCIP values calculated at an appropriate average for the relevant work level of employees, i.e. an average 20% investment of bonus for
WL2 employees; 45% for WL3 employees; 60% for WL4-5 employees; and 100% for WL6 employees, multiplied by the actual MCIP business performance ratio.
Fixed pay figures reflect all elements of pay (including allowances) and benefits paid in cash.
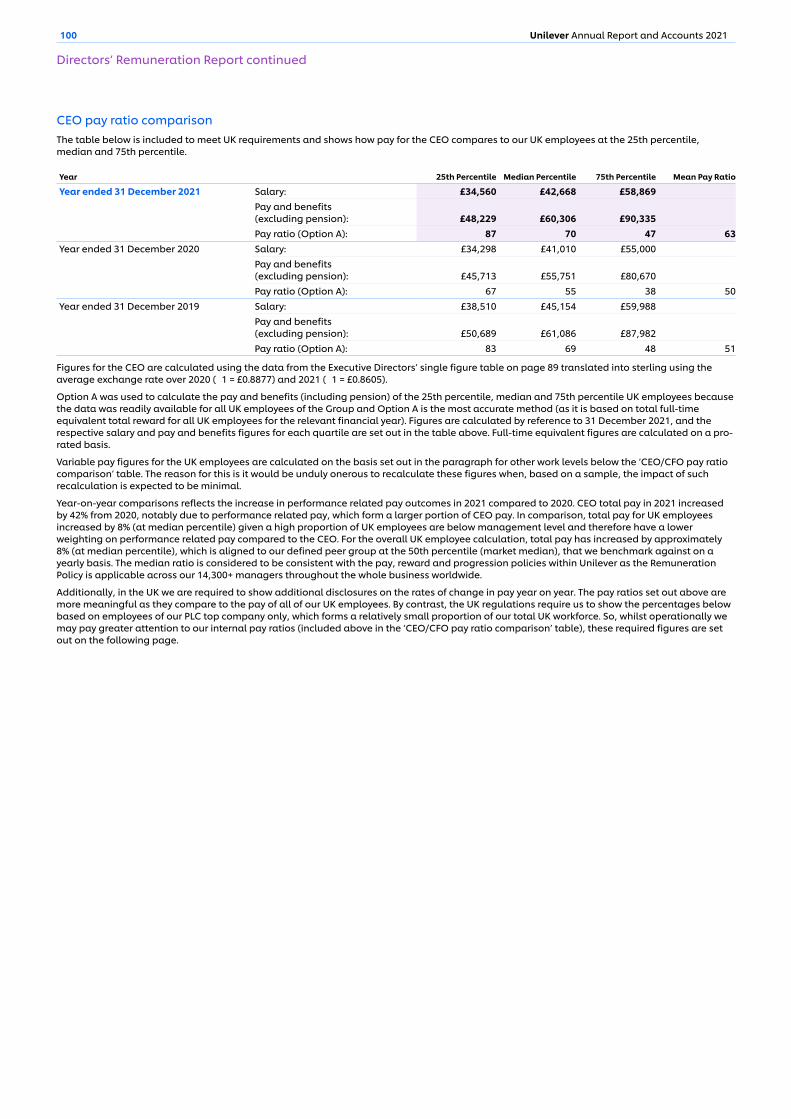
100 Unilever Annual Report and Accounts 2021
CEO pay ratio comparisonThe table below is included to meet UK requirements and shows how pay for the CEO compares to our UK employees at the 25th percentile, median and 75th percentile.
Year 25th Percentile Median Percentile 75th Percentile Mean Pay Ratio
Year ended 31 December 2021 Salary: £34,560 £42,668 £58,869Pay and benefits (excluding pension): £48,229 £60,306 £90,335Pay ratio (Option A): 87 70 47 63
Year ended 31 December 2020 Salary: £34,298 £41,010 £55,000Pay and benefits (excluding pension): £45,713 £55,751 £80,670Pay ratio (Option A): 67 55 38 50
Year ended 31 December 2019 Salary: £38,510 £45,154 £59,988Pay and benefits (excluding pension): £50,689 £61,086 £87,982Pay ratio (Option A): 83 69 48 51
Figures for the CEO are calculated using the data from the Executive Directors’ single figure table on page 89 translated into sterling using the average exchange rate over 2020 (€1 = £0.8877) and 2021 (€1 = £0.8605).
Option A was used to calculate the pay and benefits (including pension) of the 25th percentile, median and 75th percentile UK employees because the data was readily available for all UK employees of the Group and Option A is the most accurate method (as it is based on total full-time equivalent total reward for all UK employees for the relevant financial year). Figures are calculated by reference to 31 December 2021, and the respective salary and pay and benefits figures for each quartile are set out in the table above. Full-time equivalent figures are calculated on a pro-rated basis.
Variable pay figures for the UK employees are calculated on the basis set out in the paragraph for other work levels below the ‘CEO/CFO pay ratio comparison’ table. The reason for this is it would be unduly onerous to recalculate these figures when, based on a sample, the impact of such recalculation is expected to be minimal.
Year-on-year comparisons reflects the increase in performance related pay outcomes in 2021 compared to 2020. CEO total pay in 2021 increased by 42% from 2020, notably due to performance related pay, which form a larger portion of CEO pay. In comparison, total pay for UK employees increased by 8% (at median percentile) given a high proportion of UK employees are below management level and therefore have a lower weighting on performance related pay compared to the CEO. For the overall UK employee calculation, total pay has increased by approximately 8% (at median percentile), which is aligned to our defined peer group at the 50th percentile (market median), that we benchmark against on a yearly basis. The median ratio is considered to be consistent with the pay, reward and progression policies within Unilever as the Remuneration Policy is applicable across our 14,300+ managers throughout the whole business worldwide.
Additionally, in the UK we are required to show additional disclosures on the rates of change in pay year on year. The pay ratios set out above are more meaningful as they compare to the pay of all of our UK employees. By contrast, the UK regulations require us to show the percentages below based on employees of our PLC top company only, which forms a relatively small proportion of our total UK workforce. So, whilst operationally we may pay greater attention to our internal pay ratios (included above in the ‘CEO/CFO pay ratio comparison’ table), these required figures are set out on the following page.
Directors’ Remuneration Report continued

101Unilever Annual Report and Accounts 2021
GO
VER
NA
NC
E REP
OR
T
Percentage change in remuneration of Executive Directors (CEO/CFO)The table below shows the five-year history of year-on-year percentage change for fixed pay, other benefits (excluding pension) and bonus for the CEO, CFO and PLC’s employees (based on total full-time equivalent total reward for the relevant financial year) pursuant to UK requirements. The respective changes in percentages in fees for our Non-Executive Directors are included in the table ‘Percentage change in remuneration of Non-Executive Directors’ on page 97.
Fixed pay
Other benefits (not including
pension) Bonus
% change from 2020 to 2021 CEO(a)(b) 1.7% 35.7% 71.6%CFO(a)(c) 1.8% 23.7% 71.7%PLC employees(d) -19.3% -2.2% -10.6%
% change from 2019 to 2020 CEO(a)(b) 4.0% 36.6% -39.1%CFO(a) 3.0% 40.7% -39.7%PLC employees(d) 1.7% 30.2% -3.0%
% change from 2018 to 2019 CEO(a) -9.5% -92.3% -7.4%CFO(a) 4.2% 4.8% 7.9%PLC employees(d) 15.0% -5.2% 9.7%
% change from 2017 to 2018 CEO(a) 11.3% -19.2% -16.5%CFO(a) 8.2% 8.3% -10.5%PLC employees(d) 8.4% -5.0% -3.9%
% change from 2016 to 2017 CEO(a) -6.9% 5.0% 0.8%CFO(a)(c) -2.2% -5.5% 21.1%PLC employees(d) -6.8% -7.0% 14.5%
% change from 2015 to 2016 CEO(a) -11.0% -5.1% -11.0%CFO(a)(c) -30.8% -32.2% 14.3%PLC employees(d) 10.1% 19.1% 16.6%
(a) Calculated using the data from the Executive Directors’ single figure table on page 89 (for information on exchange rates, please see the footnotes in that table).(b) The increase in fixed pay for the CEO and CFO in 2021 reflects the pay increase awarded from 1 July 2021, as explained in the Committee Chair's letter on page 85.
As a result of a higher formulaic outcome for the 2021 bonus, the bonus increased compared to the previous year (2020). Conversely, a lower formulaic outcome for the 2020 bonus resulted in the bonus from 2019 to 2020 decreasing. As at 1 January 2020, the tax gross-up has been added in the cost instead of in base salary and therefore the other benefits increased from 2019 to 2020 compared to prior years. As at 1 January 2019, Alan Jope succeeded Paul Polman as CEO and therefore the CEO remuneration from 2018 to 2019 decreased compared to prior years as Alan Jope’s fixed pay was set at a level lower than Paul Polman’s.
(c) The increase in fixed pay for the CEO and CFO in 2021 reflects the pay increase awarded from 1 July 2021, as explained in the Committee Chair's letter on page 85. As a result of a higher formulaic outcome for the 2021 bonus, the bonus increased compared to the previous year (2020). Conversely, a lower formulaic outcome for the 2020 bonus resulted in the bonus from 2019 to 2020 decreasing. As at 1 January 2020, the tax gross-up has been added in the cost instead of in base salary and therefore the other benefits increased from 2019 to 2020 compared to prior years. Graeme Pitkethly succeeded Jean-Marc Huet as an Executive Director as per 21 April 2016, although he assumed the role of CFO as from October 2015. As a result, the figure for 2016 includes payments from May 2016 onwards.
(d) For the PLC employees, fixed pay numbers have been restated to include cash-related benefits employees receive as part of their total compensation, to ensure we can accurately compare fixed pay for them against that of the CEO and CFO. Such cash-related benefits include car allowance, acting-up allowance, transport allowance, training instructor allowance and fixed pay protection allowance. Figures are also affected by changes in the average sterling: euro exchange rates, as well as changes in the number of employees, including more junior employees than in 2020.
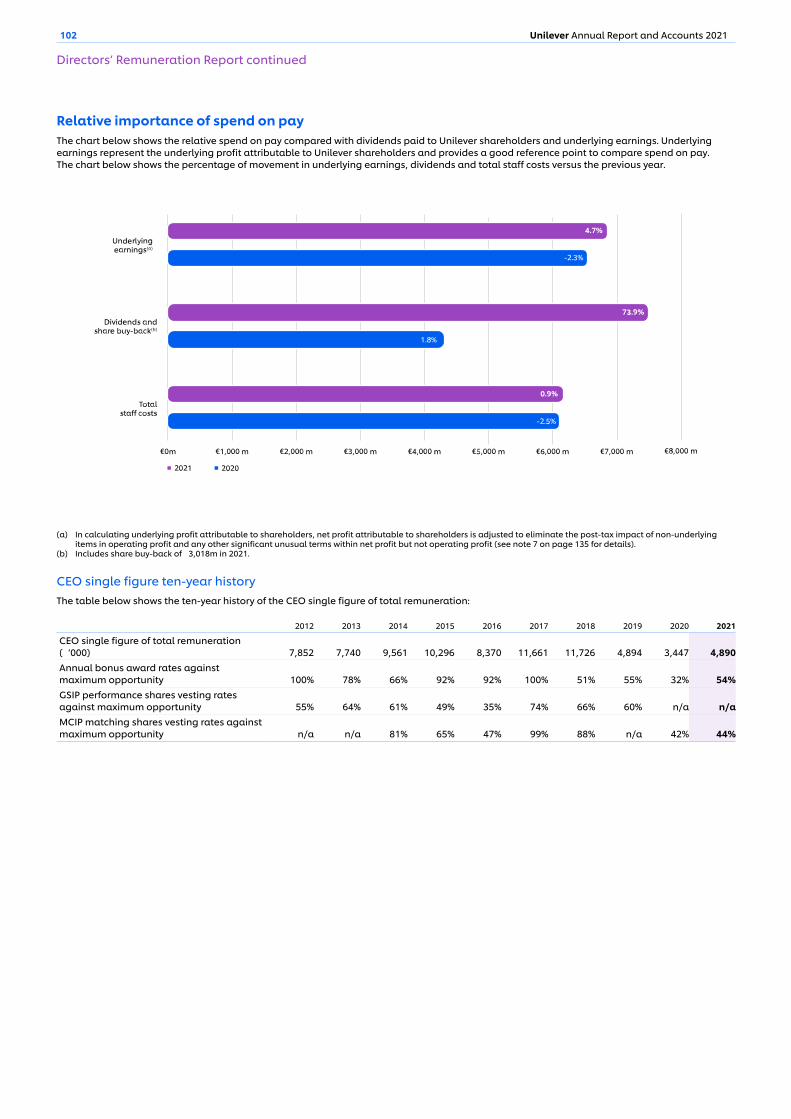
102 Unilever Annual Report and Accounts 2021
Directors’ Remuneration Report continued
Relative importance of spend on payThe chart below shows the relative spend on pay compared with dividends paid to Unilever shareholders and underlying earnings. Underlying earnings represent the underlying profit attributable to Unilever shareholders and provides a good reference point to compare spend on pay. The chart below shows the percentage of movement in underlying earnings, dividends and total staff costs versus the previous year.
(a) In calculating underlying profit attributable to shareholders, net profit attributable to shareholders is adjusted to eliminate the post-tax impact of non-underlying items in operating profit and any other significant unusual terms within net profit but not operating profit (see note 7 on page 135 for details).
(b) Includes share buy-back of €3,018m in 2021.
CEO single figure ten-year historyThe table below shows the ten-year history of the CEO single figure of total remuneration:
2012 2013 2014 2015 2016 2017 2018 2019 2020 2021
CEO single figure of total remuneration (€‘000) 7,852 7,740 9,561 10,296 8,370 11,661 11,726 4,894 3,447 4,890Annual bonus award rates against maximum opportunity 100% 78% 66% 92% 92% 100% 51% 55% 32% 54%GSIP performance shares vesting rates against maximum opportunity 55% 64% 61% 49% 35% 74% 66% 60% n/a n/aMCIP matching shares vesting rates against maximum opportunity n/a n/a 81% 65% 47% 99% 88% n/a 42% 44%

103Unilever Annual Report and Accounts 2021
GO
VER
NA
NC
E REP
OR
T
Valu
e of
hyp
othe
tica
l £ h
old
ing
Dec 21Dec 20Dec 19Dec 18Dec 17Dec 16Dec 15Dec 14Dec 13Dec 12
50
150
100
200
250
300
350
400
Unilever PLC FTSE 100
Dec 11
Ten-year historical Total Shareholder Return (TSR) performanceThe graph below includes growth in the value of a hypothetical £100 investment over ten years’ FTSE 100 comparison based on 30-trading-day average values.
The table below shows Unilever’s performance against the FTSE 100 Index, which is the most relevant index in the UK where we have our principal listing. Unilever is a constituent of this index.
Ten-year historical TSR performance
Serving as a Non-Executive Director on the board of another companyUnilever recognises the benefit to the individual and the Group of senior executives acting as directors of other companies in terms of broadening Directors’ knowledge and experience, but the number of outside directorships of listed companies is generally limited to one per Executive Director. The remuneration and fees earned from that particular outside listed directorship may be retained (see ‘Independence and Conflicts’ on page 69 for further details).
For the reason above, Graeme Pitkethly is permitted to be a Non-Executive Director of Pearson PLC since 1 May 2019. In 2021, he received an annual fee of €108,077 (£93,000) (2020: €104,014 (£92,333)) (of which 25% of his basic fee was, in accordance with Pearson’s remuneration policy, delivered in Pearson shares) based on an average exchange rate over 2021 of €1 = £0.8605. Figures for 2020 have been translated in euros based on an average exchange rate over 2020 of €1 = £0.8877.
104 Unilever Annual Report and Accounts 2021104 Unilever Annual Report and Accounts 2021
The Compensation CommitteeDuring 2021, the Committee met five times and its activities included: ▪ finalising the Remuneration Policy; ▪ determining the 2020 annual bonus outcome; ▪ determining vesting of the MCIP awards for the CEO, CFO and the ULE; ▪ determining vesting of the GSIP award for the CFO; ▪ setting the 2021 annual bonus and PSP 2021-2023 performance measures and targets; ▪ reviewing fixed pay for the CEO and CFO and fees for the Non-Executive Directors; ▪ tracking external developments and assessing their impact on Unilever’s Remuneration Policy and its implementation, in particular in the
context of Covid-19; ▪ retrospectively reviewing how the Remuneration Policy landed with stakeholders; ▪ reviewing underlying reward principles, workforce pay, including pay philosophy and pay positioning; ▪ reviewing gender pay gap data; ▪ considering progress on the living wage commitment that is now extended to the wider supply chain; and ▪ assessing performance against 2021 SPI targets and setting 2022 SPI targets along with the CRC.
The Committee operates within its terms of reference which were last updated on 29 November 2020. The Committee’s terms of reference are contained within ‘The Governance of Unilever’.
See the Board and Management Committees section of our website for a copy of the Committee's terms of reference.
As part of the Board evaluation carried out in 2021, the Board evaluated the performance of the Committee. The Committee also carried out an assessment of its own performance in 2021. Overall, the Committee members concluded that the Committee is performing effectively. The Committee has agreed to further enhance its effectiveness by continuing to monitor the effectiveness of performance measures for incentives and their link to Company strategy and the assessment of the Company's talent bank and suitability for growth initiatives.
AdvisersWhile it is the Committee’s responsibility to exercise independent judgement, the Committee does request advice from management and professional advisers, as appropriate, to ensure that its decisions are fully informed given the internal and external environment.
Fiona Camenzuli of PricewaterhouseCoopers (PwC) provided the Committee with independent advice on various matters it considered. During 2021, the wider PwC firm has also provided tax and consultancy services to Unilever including tax compliance, transfer pricing, other tax-related services, managed legal services, internal audit advice and secondees, third-party risk and compliance advice, cyber security advice, sustainability assurance and consulting, merger and acquisition support, and media assurance support. PwC is a member of the Remuneration Consultants Group and, as such, voluntarily operates under the code of conduct in relation to executive remuneration consulting in the UK, which is available online.
www.remunerationconsultantsgroup.com (Code of Conduct: Executive Remuneration Consulting)
The Committee is satisfied that the PwC engagement partner and team, which provide remuneration advice to the Committee, do not have connections with PLC that might impair their independence. The Committee reviewed the potential for conflicts of interest and judged that there were appropriate safeguards against such conflicts. The fees paid to PwC in relation to advice provided to the Committee in the year to 31 December 2021 were £137,100. This figure is calculated based on time spent and expenses incurred for the majority of advice provided, but on occasion, for specific projects, a fixed fee may be agreed.
During the year, the Committee also sought input from the CEO (Alan Jope), the Chief Human Resources Officer (Leena Nair) and the VP Global Head of Reward (Constantina Tribou) on various subjects including the remuneration of senior management. No individual Executive Director was present when their own remuneration was being determined to ensure a conflict of interest did not arise, although the Committee has separately sought and obtained Executive Directors’ own views when determining the amount and structure of their remuneration before recommending individual packages to the Board for approval. The Committee also received legal and governance advice from the Chief Legal Officer and Group Secretary (Ritva Sotamaa) and the Chief Counsel Executive Compensation & Employment (Margot Fransen).
Shareholder votingUnilever remains committed to ongoing shareholder dialogue and takes an active interest in voting outcomes. In the event of a substantial vote against a resolution in relation to Directors’ remuneration, Unilever would seek to understand the reasons for any such vote and would set out in the following Annual Report and Accounts any actions in response to it. The following table sets out actual voting in respect of this and previous report:
Voting outcome (% of votes) For Against Withheld
2020 Directors' Remuneration Report (2021 AGM) (excluding the Directors' Remuneration Policy) 96.88% 3.12% 7,962,2822021 Directors' Remuneration Policy (2021 AGM) 93.51% 6.49% 8,161,369
The Directors’ Remuneration Report has been approved by the Board, and signed on their behalf by Ritva Sotamaa, Chief Legal Officer and Group Secretary.
Directors’ Remuneration Report continued
Financial statements
Financial statements
106 Statement of Directors’ responsibilities107 Independent Auditor’s report114 Consolidated financial statements118 Notes to the consolidated financial statements167 Unilever PLC company accounts and notes176 Group Companies187 Shareholder information188 Additional Information for US Listing Purposes

Statement of Directors’ responsibilitiesAnnual accountsThe Directors are responsible for preparing the Annual Report and Accounts in accordance with applicable law and regulations. The Directors are also required by the UK Companies Act 2006 to prepare accounts for each financial year which give a true and fair view of the state of affairs of the Unilever Group and PLC as at the end of the financial year and of the profit or loss and cash flows for that year.
The Directors consider that, in preparing the accounts, the Group and PLC have used the most appropriate accounting policies, consistently applied and supported by reasonable and prudent judgements and estimates, and that all international financial reporting standards (IFRS) as issued by the International Accounting Standards Board (IASB), and UK-adopted international accounting standards, which they consider to be applicable have been followed. The Directors are responsible for preparing the Annual Report and Accounts including the consolidated financial statements in the European single electronic format in accordance with the requirements as set out in Commission Delegated Regulation (EU) 2019/815 with regard to regulatory technical standards on the specification of a single electronic reporting format.
The Directors have responsibility for ensuring that PLC keep accounting records which disclose with reasonable accuracy their financial position and which enable the Directors to ensure that the accounts comply with all relevant legislation. They also have a general responsibility for taking such steps as are reasonably open to them to safeguard the assets of the Group, and to prevent and detect fraud and other irregularities.
This statement, which should be read in conjunction with the Independent Auditor's Report, is made with a view to distinguishing for shareholders the respective responsibilities of the Directors and of the auditors in relation to the accounts.
A copy of the financial statements of the Unilever Group is placed on our website at www.unilever.com/investorrelations. The maintenance and integrity of the website are the responsibility of the Directors, and the work carried out by the auditors does not involve consideration of these matters. Accordingly, the auditors accept no responsibility for any changes that may have occurred to the financial statements since they were initially placed on the website. Legislation in the UK and the Netherlands governing the preparation and dissemination of financial statements may differ from legislation in other jurisdictions.
Independent auditors and disclosure of information to auditorsUK law sets out additional responsibilities for the Directors of PLC regarding disclosure of information to auditors. To the best of each of the Directors’ knowledge and belief, and having made appropriate enquiries, all information relevant to enabling the auditors to provide their opinions on PLC’s consolidated and parent company accounts has been provided. Each of the Directors has taken all reasonable steps to ensure their awareness of any relevant audit information and to establish that Unilever PLC’s auditors are aware of any such information.
Directors’ responsibility statementEach of the Directors confirms that, to the best of his or her knowledge:▪ The Unilever Annual Report and Accounts 2021, taken as a whole, is
fair, balanced and understandable, and provides the information necessary for shareholders to assess the Company’s position and performance, business model and strategy;
▪ The financial statements which have been prepared in accordance with international financial reporting standards (IFRS) as issued by the International Accounting Standards Board (IASB), and UK-adopted international accounting standards give a true and fair view of the assets, liabilities, financial position and profit or loss of the Company and the undertakings included in the consolidation taken as a whole; and
▪ The Strategic Report includes a fair review of the development and performance of the business and the position of PLC and the undertakings included in the consolidation taken as a whole, together with a description of the principal risks and uncertainties that they face.
The Directors and their roles are listed on pages 72 to 73.
Going concernThe activities of the Group, together with the factors likely to affect its future development, performance, the financial position of the Group, its cash flows, liquidity position and borrowing facilities are described on pages 1 to 43. In addition, we describe in notes 15 to 18 on pages 144 to 159 the Group’s objectives, policies and processes for managing its capital; its financial risk management objectives; details of its financial instruments and hedging activities and its exposures to credit and liquidity risk. Although not assessed over the same period as going concern, the viability of the Group has been assessed on page 45.
The Group has considerable financial resources together with established business relationships with many customers and suppliers in countries throughout the world. As a consequence, the Directors believe that the Group is well placed to manage its business risks successfully for at least twelve months from the date of approval of the financial statements.
After making enquiries, the Directors consider it appropriate to adopt the going concern basis of accounting in preparing this Annual Report and Accounts.
Internal and disclosure controls and proceduresPlease refer to pages 46 to 50 for a discussion of Unilever’s principal risk factors and to pages 44 to 50 for commentary on the Group’s approach to risk management and control.
106 Unilever Annual Report and Accounts 2021
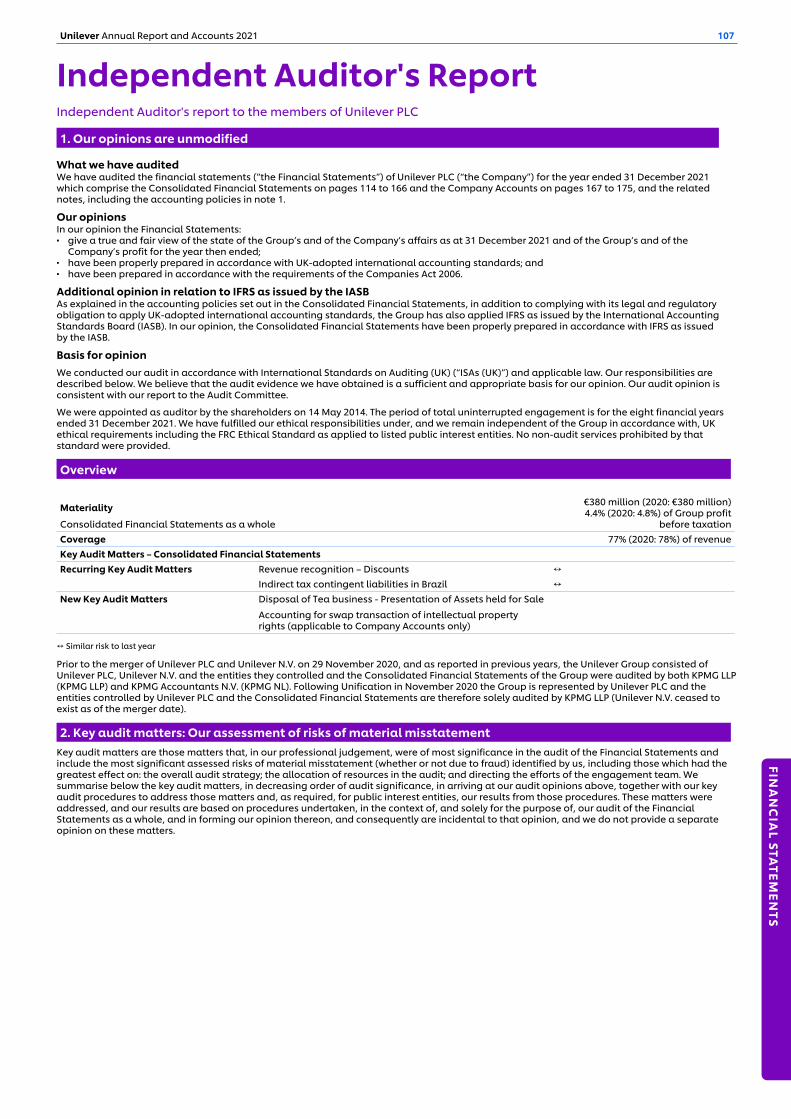
Independent Auditor's ReportIndependent Auditor's report to the members of Unilever PLC
1. Our opinions are unmodified
What we have auditedWe have audited the financial statements (“the Financial Statements”) of Unilever PLC (“the Company”) for the year ended 31 December 2021 which comprise the Consolidated Financial Statements on pages 114 to 166 and the Company Accounts on pages 167 to 175, and the related notes, including the accounting policies in note 1.
Our opinions In our opinion the Financial Statements: ▪ give a true and fair view of the state of the Group’s and of the Company’s affairs as at 31 December 2021 and of the Group’s and of the
Company’s profit for the year then ended; ▪ have been properly prepared in accordance with UK-adopted international accounting standards; and▪ have been prepared in accordance with the requirements of the Companies Act 2006.
Additional opinion in relation to IFRS as issued by the IASB As explained in the accounting policies set out in the Consolidated Financial Statements, in addition to complying with its legal and regulatory obligation to apply UK-adopted international accounting standards, the Group has also applied IFRS as issued by the International Accounting Standards Board (IASB). In our opinion, the Consolidated Financial Statements have been properly prepared in accordance with IFRS as issued by the IASB.
Basis for opinion
We conducted our audit in accordance with International Standards on Auditing (UK) (“ISAs (UK)”) and applicable law. Our responsibilities are described below. We believe that the audit evidence we have obtained is a sufficient and appropriate basis for our opinion. Our audit opinion is consistent with our report to the Audit Committee.
We were appointed as auditor by the shareholders on 14 May 2014. The period of total uninterrupted engagement is for the eight financial years ended 31 December 2021. We have fulfilled our ethical responsibilities under, and we remain independent of the Group in accordance with, UK ethical requirements including the FRC Ethical Standard as applied to listed public interest entities. No non-audit services prohibited by that standard were provided.
Overview
Materiality
Consolidated Financial Statements as a whole
€380 million (2020: €380 million)4.4% (2020: 4.8%) of Group profit
before taxationCoverage 77% (2020: 78%) of revenueKey Audit Matters – Consolidated Financial StatementsRecurring Key Audit Matters Revenue recognition – Discounts ↔
Indirect tax contingent liabilities in Brazil ↔New Key Audit Matters Disposal of Tea business - Presentation of Assets held for Sale
Accounting for swap transaction of intellectual property rights (applicable to Company Accounts only)
↔ Similar risk to last year Prior to the merger of Unilever PLC and Unilever N.V. on 29 November 2020, and as reported in previous years, the Unilever Group consisted of Unilever PLC, Unilever N.V. and the entities they controlled and the Consolidated Financial Statements of the Group were audited by both KPMG LLP (KPMG LLP) and KPMG Accountants N.V. (KPMG NL). Following Unification in November 2020 the Group is represented by Unilever PLC and the entities controlled by Unilever PLC and the Consolidated Financial Statements are therefore solely audited by KPMG LLP (Unilever N.V. ceased to exist as of the merger date).
2. Key audit matters: Our assessment of risks of material misstatementKey audit matters are those matters that, in our professional judgement, were of most significance in the audit of the Financial Statements and include the most significant assessed risks of material misstatement (whether or not due to fraud) identified by us, including those which had the greatest effect on: the overall audit strategy; the allocation of resources in the audit; and directing the efforts of the engagement team. We summarise below the key audit matters, in decreasing order of audit significance, in arriving at our audit opinions above, together with our key audit procedures to address those matters and, as required, for public interest entities, our results from those procedures. These matters were addressed, and our results are based on procedures undertaken, in the context of, and solely for the purpose of, our audit of the Financial Statements as a whole, and in forming our opinion thereon, and consequently are incidental to that opinion, and we do not provide a separate opinion on these matters.
Unilever Annual Report and Accounts 2021 107
FINA
NC
IAL STA
TEMEN
TS
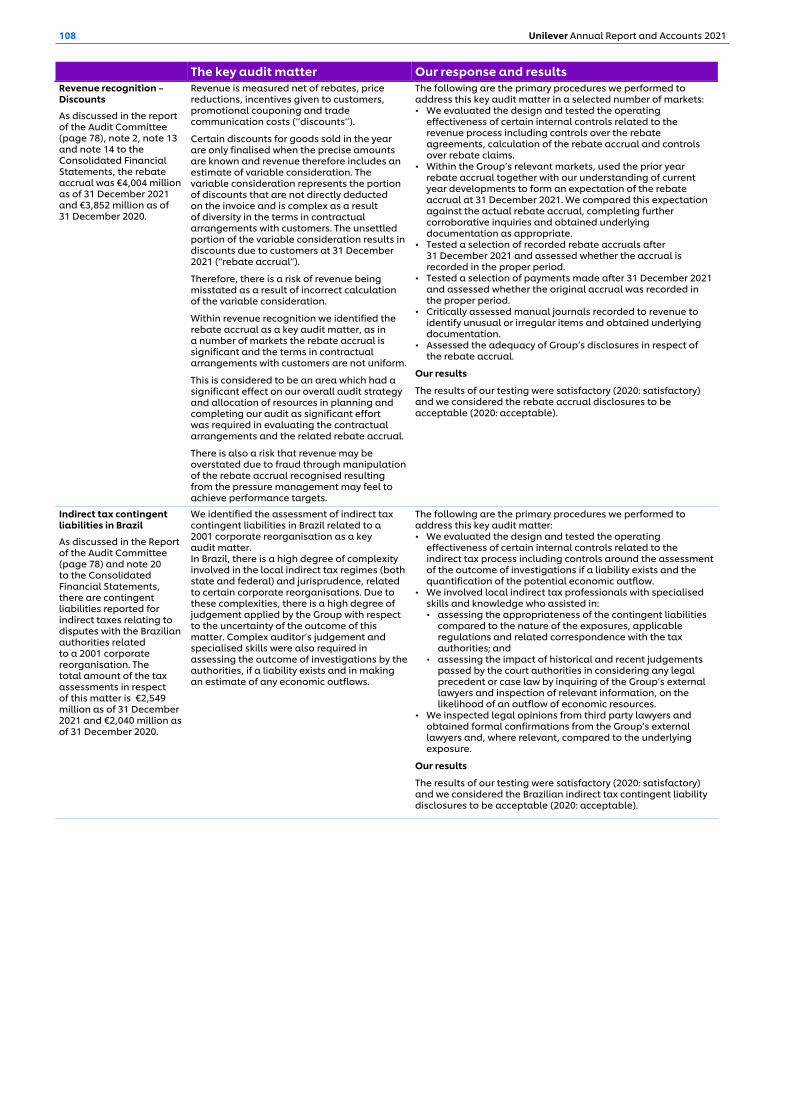
Revenue recognition – Discounts
As discussed in the report of the Audit Committee (page 78), note 2, note 13 and note 14 to the Consolidated Financial Statements, the rebate accrual was €4,004 million as of 31 December 2021 and €3,852 million as of 31 December 2020.
Revenue is measured net of rebates, price reductions, incentives given to customers, promotional couponing and trade communication costs (‘’discounts’’).
Certain discounts for goods sold in the year are only finalised when the precise amounts are known and revenue therefore includes an estimate of variable consideration. The variable consideration represents the portion of discounts that are not directly deducted on the invoice and is complex as a result of diversity in the terms in contractual arrangements with customers. The unsettled portion of the variable consideration results in discounts due to customers at 31 December 2021 (“rebate accrual”).
Therefore, there is a risk of revenue being misstated as a result of incorrect calculation of the variable consideration.
Within revenue recognition we identified the rebate accrual as a key audit matter, as in a number of markets the rebate accrual is significant and the terms in contractual arrangements with customers are not uniform.
This is considered to be an area which had a significant effect on our overall audit strategy and allocation of resources in planning and completing our audit as significant effort was required in evaluating the contractual arrangements and the related rebate accrual.
There is also a risk that revenue may be overstated due to fraud through manipulation of the rebate accrual recognised resulting from the pressure management may feel to achieve performance targets.
The following are the primary procedures we performed to address this key audit matter in a selected number of markets: • We evaluated the design and tested the operating
effectiveness of certain internal controls related to the revenue process including controls over the rebate agreements, calculation of the rebate accrual and controls over rebate claims.
• Within the Group’s relevant markets, used the prior year rebate accrual together with our understanding of current year developments to form an expectation of the rebate accrual at 31 December 2021. We compared this expectation against the actual rebate accrual, completing further corroborative inquiries and obtained underlying documentation as appropriate.
• Tested a selection of recorded rebate accruals after 31 December 2021 and assessed whether the accrual is recorded in the proper period.
• Tested a selection of payments made after 31 December 2021 and assessed whether the original accrual was recorded in the proper period.
• Critically assessed manual journals recorded to revenue to identify unusual or irregular items and obtained underlying documentation.
• Assessed the adequacy of Group’s disclosures in respect of the rebate accrual.
Our results
The results of our testing were satisfactory (2020: satisfactory) and we considered the rebate accrual disclosures to be acceptable (2020: acceptable).
Indirect tax contingent liabilities in Brazil
As discussed in the Report of the Audit Committee (page 78) and note 20 to the Consolidated Financial Statements, there are contingent liabilities reported for indirect taxes relating to disputes with the Brazilian authorities related to a 2001 corporate reorganisation. The total amount of the tax assessments in respect of this matter is €2,549 million as of 31 December 2021 and €2,040 million as of 31 December 2020.
We identified the assessment of indirect tax contingent liabilities in Brazil related to a 2001 corporate reorganisation as a key audit matter.In Brazil, there is a high degree of complexity involved in the local indirect tax regimes (both state and federal) and jurisprudence, related to certain corporate reorganisations. Due to these complexities, there is a high degree of judgement applied by the Group with respect to the uncertainty of the outcome of this matter. Complex auditor’s judgement and specialised skills were also required in assessing the outcome of investigations by the authorities, if a liability exists and in making an estimate of any economic outflows.
The following are the primary procedures we performed to address this key audit matter: • We evaluated the design and tested the operating
effectiveness of certain internal controls related to the indirect tax process including controls around the assessment of the outcome of investigations if a liability exists and the quantification of the potential economic outflow.
• We involved local indirect tax professionals with specialised skills and knowledge who assisted in: • assessing the appropriateness of the contingent liabilities
compared to the nature of the exposures, applicable regulations and related correspondence with the tax authorities; and
• assessing the impact of historical and recent judgements passed by the court authorities in considering any legal precedent or case law by inquiring of the Group’s external lawyers and inspection of relevant information, on the likelihood of an outflow of economic resources.
• We inspected legal opinions from third party lawyers and obtained formal confirmations from the Group’s external lawyers and, where relevant, compared to the underlying exposure.
Our results
The results of our testing were satisfactory (2020: satisfactory) and we considered the Brazilian indirect tax contingent liability disclosures to be acceptable (2020: acceptable).
The key audit matter Our response and results
108 Unilever Annual Report and Accounts 2021
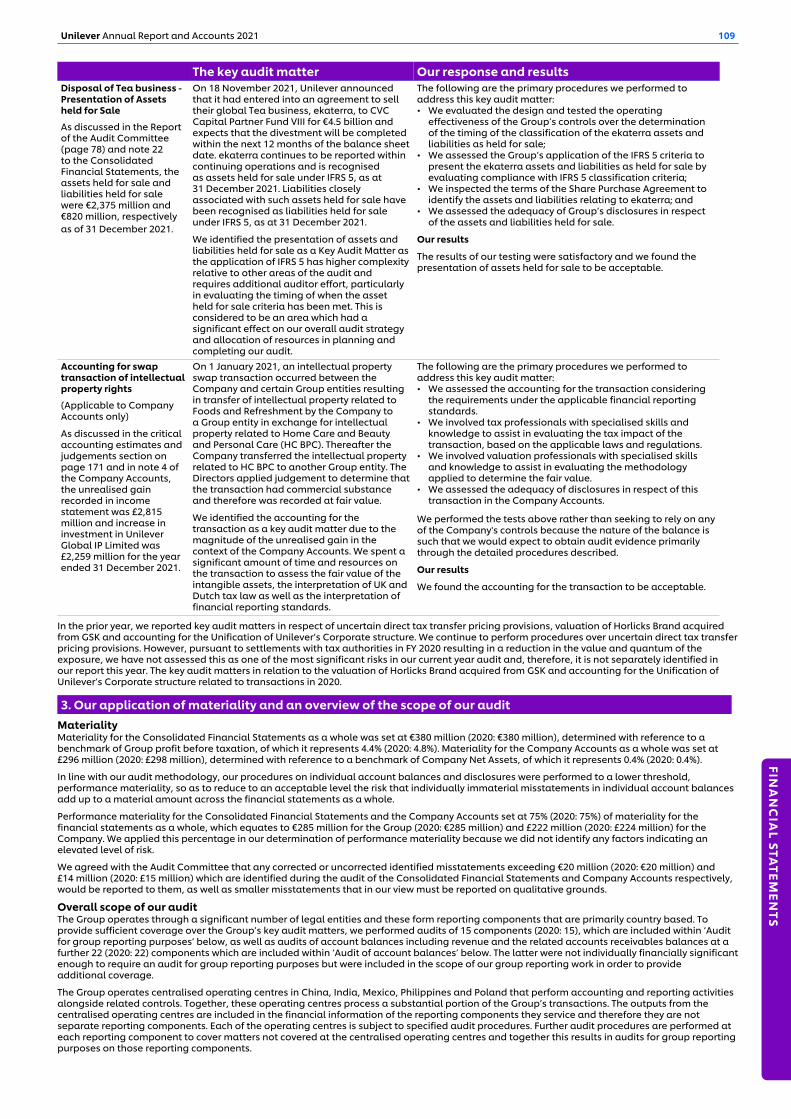
Disposal of Tea business - Presentation of Assets held for Sale
As discussed in the Report of the Audit Committee (page 78) and note 22 to the Consolidated Financial Statements, the assets held for sale and liabilities held for sale were €2,375 million and €820 million, respectively as of 31 December 2021.
On 18 November 2021, Unilever announced that it had entered into an agreement to sell their global Tea business, ekaterra, to CVC Capital Partner Fund VIII for €4.5 billion and expects that the divestment will be completed within the next 12 months of the balance sheet date. ekaterra continues to be reported within continuing operations and is recognised as assets held for sale under IFRS 5, as at 31 December 2021. Liabilities closely associated with such assets held for sale have been recognised as liabilities held for sale under IFRS 5, as at 31 December 2021.
We identified the presentation of assets and liabilities held for sale as a Key Audit Matter as the application of IFRS 5 has higher complexity relative to other areas of the audit and requires additional auditor effort, particularly in evaluating the timing of when the asset held for sale criteria has been met. This is considered to be an area which had a significant effect on our overall audit strategy and allocation of resources in planning and completing our audit.
The following are the primary procedures we performed to address this key audit matter: • We evaluated the design and tested the operating
effectiveness of the Group’s controls over the determination of the timing of the classification of the ekaterra assets and liabilities as held for sale;
• We assessed the Group’s application of the IFRS 5 criteria to present the ekaterra assets and liabilities as held for sale by evaluating compliance with IFRS 5 classification criteria;
• We inspected the terms of the Share Purchase Agreement to identify the assets and liabilities relating to ekaterra; and
• We assessed the adequacy of Group’s disclosures in respect of the assets and liabilities held for sale.
Our results
The results of our testing were satisfactory and we found the presentation of assets held for sale to be acceptable.
Accounting for swap transaction of intellectual property rights
(Applicable to Company Accounts only)
As discussed in the critical accounting estimates and judgements section on page 171 and in note 4 of the Company Accounts, the unrealised gain recorded in income statement was £2,815 million and increase in investment in Unilever Global IP Limited was £2,259 million for the year ended 31 December 2021.
On 1 January 2021, an intellectual property swap transaction occurred between the Company and certain Group entities resulting in transfer of intellectual property related to Foods and Refreshment by the Company to a Group entity in exchange for intellectual property related to Home Care and Beauty and Personal Care (HC BPC). Thereafter the Company transferred the intellectual property related to HC BPC to another Group entity. The Directors applied judgement to determine that the transaction had commercial substance and therefore was recorded at fair value.
We identified the accounting for the transaction as a key audit matter due to the magnitude of the unrealised gain in the context of the Company Accounts. We spent a significant amount of time and resources on the transaction to assess the fair value of the intangible assets, the interpretation of UK and Dutch tax law as well as the interpretation of financial reporting standards.
The following are the primary procedures we performed to address this key audit matter: • We assessed the accounting for the transaction considering
the requirements under the applicable financial reporting standards.
• We involved tax professionals with specialised skills and knowledge to assist in evaluating the tax impact of the transaction, based on the applicable laws and regulations.
• We involved valuation professionals with specialised skills and knowledge to assist in evaluating the methodology applied to determine the fair value.
• We assessed the adequacy of disclosures in respect of this transaction in the Company Accounts.
We performed the tests above rather than seeking to rely on any of the Company's controls because the nature of the balance is such that we would expect to obtain audit evidence primarily through the detailed procedures described.
Our results
We found the accounting for the transaction to be acceptable.
The key audit matter Our response and results
In the prior year, we reported key audit matters in respect of uncertain direct tax transfer pricing provisions, valuation of Horlicks Brand acquired from GSK and accounting for the Unification of Unilever’s Corporate structure. We continue to perform procedures over uncertain direct tax transfer pricing provisions. However, pursuant to settlements with tax authorities in FY 2020 resulting in a reduction in the value and quantum of the exposure, we have not assessed this as one of the most significant risks in our current year audit and, therefore, it is not separately identified in our report this year. The key audit matters in relation to the valuation of Horlicks Brand acquired from GSK and accounting for the Unification of Unilever’s Corporate structure related to transactions in 2020.
3. Our application of materiality and an overview of the scope of our auditMateriality Materiality for the Consolidated Financial Statements as a whole was set at €380 million (2020: €380 million), determined with reference to a benchmark of Group profit before taxation, of which it represents 4.4% (2020: 4.8%). Materiality for the Company Accounts as a whole was set at £296 million (2020: £298 million), determined with reference to a benchmark of Company Net Assets, of which it represents 0.4% (2020: 0.4%).
In line with our audit methodology, our procedures on individual account balances and disclosures were performed to a lower threshold, performance materiality, so as to reduce to an acceptable level the risk that individually immaterial misstatements in individual account balances add up to a material amount across the financial statements as a whole.
Performance materiality for the Consolidated Financial Statements and the Company Accounts set at 75% (2020: 75%) of materiality for the financial statements as a whole, which equates to €285 million for the Group (2020: €285 million) and £222 million (2020: £224 million) for the Company. We applied this percentage in our determination of performance materiality because we did not identify any factors indicating an elevated level of risk.
We agreed with the Audit Committee that any corrected or uncorrected identified misstatements exceeding €20 million (2020: €20 million) and £14 million (2020: £15 million) which are identified during the audit of the Consolidated Financial Statements and Company Accounts respectively, would be reported to them, as well as smaller misstatements that in our view must be reported on qualitative grounds.
Overall scope of our auditThe Group operates through a significant number of legal entities and these form reporting components that are primarily country based. To provide sufficient coverage over the Group’s key audit matters, we performed audits of 15 components (2020: 15), which are included within ‘Audit for group reporting purposes’ below, as well as audits of account balances including revenue and the related accounts receivables balances at a further 22 (2020: 22) components which are included within ‘Audit of account balances’ below. The latter were not individually financially significant enough to require an audit for group reporting purposes but were included in the scope of our group reporting work in order to provide additional coverage.
The Group operates centralised operating centres in China, India, Mexico, Philippines and Poland that perform accounting and reporting activities alongside related controls. Together, these operating centres process a substantial portion of the Group’s transactions. The outputs from the centralised operating centres are included in the financial information of the reporting components they service and therefore they are not separate reporting components. Each of the operating centres is subject to specified audit procedures. Further audit procedures are performed at each reporting component to cover matters not covered at the centralised operating centres and together this results in audits for group reporting purposes on those reporting components.
Unilever Annual Report and Accounts 2021 109
FINA
NC
IAL STA
TEMEN
TS
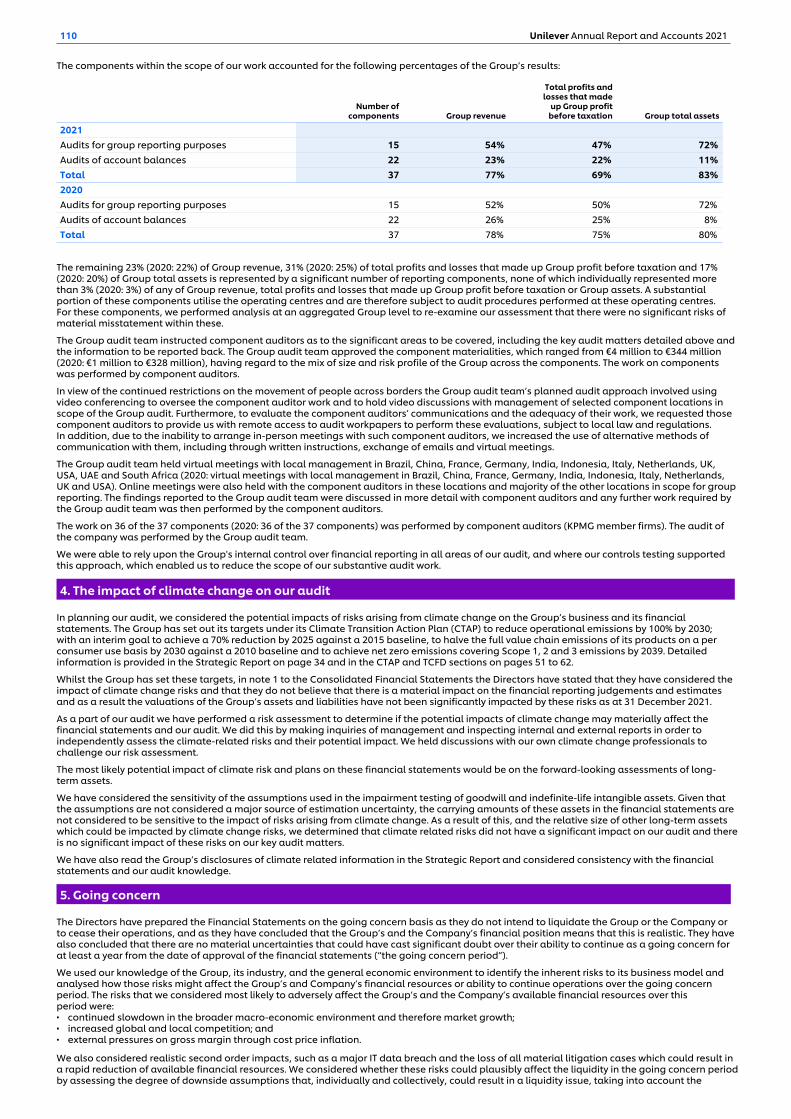
The components within the scope of our work accounted for the following percentages of the Group’s results:
Number ofcomponents Group revenue
Total profits andlosses that made
up Group profitbefore taxation Group total assets
2021Audits for group reporting purposes 15 54% 47% 72% Audits of account balances 22 23% 22% 11% Total 37 77% 69% 83% 2020Audits for group reporting purposes 15 52% 50% 72% Audits of account balances 22 26% 25% 8% Total 37 78% 75% 80%
The remaining 23% (2020: 22%) of Group revenue, 31% (2020: 25%) of total profits and losses that made up Group profit before taxation and 17% (2020: 20%) of Group total assets is represented by a significant number of reporting components, none of which individually represented more than 3% (2020: 3%) of any of Group revenue, total profits and losses that made up Group profit before taxation or Group assets. A substantial portion of these components utilise the operating centres and are therefore subject to audit procedures performed at these operating centres. For these components, we performed analysis at an aggregated Group level to re-examine our assessment that there were no significant risks of material misstatement within these.
The Group audit team instructed component auditors as to the significant areas to be covered, including the key audit matters detailed above and the information to be reported back. The Group audit team approved the component materialities, which ranged from €4 million to €344 million (2020: €1 million to €328 million), having regard to the mix of size and risk profile of the Group across the components. The work on components was performed by component auditors.
In view of the continued restrictions on the movement of people across borders the Group audit team’s planned audit approach involved using video conferencing to oversee the component auditor work and to hold video discussions with management of selected component locations in scope of the Group audit. Furthermore, to evaluate the component auditors’ communications and the adequacy of their work, we requested those component auditors to provide us with remote access to audit workpapers to perform these evaluations, subject to local law and regulations. In addition, due to the inability to arrange in-person meetings with such component auditors, we increased the use of alternative methods of communication with them, including through written instructions, exchange of emails and virtual meetings.
The Group audit team held virtual meetings with local management in Brazil, China, France, Germany, India, Indonesia, Italy, Netherlands, UK, USA, UAE and South Africa (2020: virtual meetings with local management in Brazil, China, France, Germany, India, Indonesia, Italy, Netherlands, UK and USA). Online meetings were also held with the component auditors in these locations and majority of the other locations in scope for group reporting. The findings reported to the Group audit team were discussed in more detail with component auditors and any further work required by the Group audit team was then performed by the component auditors.
The work on 36 of the 37 components (2020: 36 of the 37 components) was performed by component auditors (KPMG member firms). The audit of the company was performed by the Group audit team.
We were able to rely upon the Group's internal control over financial reporting in all areas of our audit, and where our controls testing supported this approach, which enabled us to reduce the scope of our substantive audit work.
4. The impact of climate change on our audit
In planning our audit, we considered the potential impacts of risks arising from climate change on the Group’s business and its financial statements. The Group has set out its targets under its Climate Transition Action Plan (CTAP) to reduce operational emissions by 100% by 2030; with an interim goal to achieve a 70% reduction by 2025 against a 2015 baseline, to halve the full value chain emissions of its products on a per consumer use basis by 2030 against a 2010 baseline and to achieve net zero emissions covering Scope 1, 2 and 3 emissions by 2039. Detailed information is provided in the Strategic Report on page 34 and in the CTAP and TCFD sections on pages 51 to 62.
Whilst the Group has set these targets, in note 1 to the Consolidated Financial Statements the Directors have stated that they have considered the impact of climate change risks and that they do not believe that there is a material impact on the financial reporting judgements and estimates and as a result the valuations of the Group’s assets and liabilities have not been significantly impacted by these risks as at 31 December 2021.
As a part of our audit we have performed a risk assessment to determine if the potential impacts of climate change may materially affect the financial statements and our audit. We did this by making inquiries of management and inspecting internal and external reports in order to independently assess the climate-related risks and their potential impact. We held discussions with our own climate change professionals to challenge our risk assessment.
The most likely potential impact of climate risk and plans on these financial statements would be on the forward-looking assessments of long-term assets.
We have considered the sensitivity of the assumptions used in the impairment testing of goodwill and indefinite-life intangible assets. Given that the assumptions are not considered a major source of estimation uncertainty, the carrying amounts of these assets in the financial statements are not considered to be sensitive to the impact of risks arising from climate change. As a result of this, and the relative size of other long-term assets which could be impacted by climate change risks, we determined that climate related risks did not have a significant impact on our audit and there is no significant impact of these risks on our key audit matters.
We have also read the Group’s disclosures of climate related information in the Strategic Report and considered consistency with the financial statements and our audit knowledge.
5. Going concern
The Directors have prepared the Financial Statements on the going concern basis as they do not intend to liquidate the Group or the Company or to cease their operations, and as they have concluded that the Group’s and the Company’s financial position means that this is realistic. They have also concluded that there are no material uncertainties that could have cast significant doubt over their ability to continue as a going concern for at least a year from the date of approval of the financial statements (“the going concern period”).
We used our knowledge of the Group, its industry, and the general economic environment to identify the inherent risks to its business model and analysed how those risks might affect the Group’s and Company’s financial resources or ability to continue operations over the going concern period. The risks that we considered most likely to adversely affect the Group’s and the Company’s available financial resources over this period were:▪ continued slowdown in the broader macro-economic environment and therefore market growth;▪ increased global and local competition; and▪ external pressures on gross margin through cost price inflation.
We also considered realistic second order impacts, such as a major IT data breach and the loss of all material litigation cases which could result in a rapid reduction of available financial resources. We considered whether these risks could plausibly affect the liquidity in the going concern period by assessing the degree of downside assumptions that, individually and collectively, could result in a liquidity issue, taking into account the
110 Unilever Annual Report and Accounts 2021
Group’s current and projected cash and facilities and the outcome of their reverse stress testing. We considered whether the going concern disclosure in note 1 to the financial statements gives a full and accurate description of the Directors’ assessment of going concern.
Our conclusions based on this work:▪ we consider that the Directors’ use of the going concern basis of accounting in the preparation of the Financial Statements is appropriate;▪ we have not identified, and concur with the Directors’ assessment that there is not, a material uncertainty related to events or conditions
that, individually or collectively, may cast significant doubt on the Group’s or Company’s ability to continue as a going concern for the going concern period;
▪ we have nothing material to add or draw attention to in relation to the Directors’ statement on page 106 to the Financial Statements on the use of the going concern basis of accounting with no material uncertainties that may cast significant doubt over the Group and Company’s use of that basis for the going concern period, and we found the going concern disclosure on page 106 to be acceptable; and
▪ the related statement under the Listing Rules set out on page 106 is materially consistent with the financial statements and our audit knowledge.
However, as we cannot predict all future events or conditions and as subsequent events may result in outcomes that are inconsistent with judgements that were reasonable at the time they were made, the above conclusions are not a guarantee that the Group or the Company will continue in operation.
6. Fraud and breaches of laws and regulations – ability to detect
Identifying and responding to risks of material misstatement due to fraudTo identify risks of material misstatement due to fraud (“fraud risks”) we assessed events or conditions that could indicate an incentive or pressure to commit fraud or provide an opportunity to commit fraud. Our risk assessment procedures included:▪ Enquiring of directors, the audit committee, internal audit and inspection of policy documentation as to the Group’s high-level policies and
procedures to prevent and detect fraud, including the internal audit function, and the Group’s channel for “whistleblowing”, as well as whether they have knowledge of any actual, suspected or alleged fraud.
▪ Reading Board and audit committee minutes.▪ Considering remuneration incentive schemes and performance targets for directors.▪ Using analytical procedures to identify any unusual or unexpected relationships.▪ Using our own forensic professionals with specialised skills and knowledge to assist us in identifying the fraud risks based on discussions of the
circumstances of the Group.
We communicated identified fraud risks throughout the audit team and remained alert to any indications of fraud throughout the audit. This included communication from the group to in-scope component audit teams of relevant fraud risks identified at the Group level and request to in-scope component audit teams to report to the Group audit team any instances of fraud that could give rise to a material misstatement at group.
As required by auditing standards, and taking into account possible pressures to meet profit targets, we performed procedures to address the risk of management override of controls and the risk of fraudulent revenue recognition. Further detail in respect of Revenue recognition – Discounts is set out in the key audit matter disclosures in section 2 of this report. We did not identify any additional fraud risks.
In determining the audit procedures we took into account the results of our evaluation and testing of the operating effectiveness of the Group-wide fraud risk management controls. For further details in respect to the Group-wide risk management controls refer to the report of the Audit Committee on page 78.
We also performed procedures including:▪ Identifying manual journal entries to test for all in-scope components based on risk criteria and comparing the identified entries to supporting
documentation.▪ Evaluating the business purpose of significant unusual transactions.▪ Assessing significant accounting estimates for bias.
Identifying and responding to risks of material misstatement due to non-compliance with laws and regulations We identified areas of laws and regulations that could reasonably be expected to have a material effect on the financial statements from our general commercial and sector experience, through discussion with the Directors and other management (as required by auditing standards) and from inspection of the Group’s regulatory and legal correspondence. We discussed with the Directors and other management the policies and procedures regarding compliance with laws and regulations and we made use of our own forensic professionals with specialised skills and knowledge to assist us in evaluating the facts and circumstances.
We communicated identified laws and regulations throughout our team and remained alert to any indications of non-compliance throughout the audit. This included communication from the group to in-scope component audit teams of relevant laws and regulations identified at the Group level, and a request for in-scope component auditors to report to the group team any instances of non-compliance with laws and regulations that could give rise to a material misstatement at the Group level.
The potential effect of these laws and regulations on the financial statements varies considerably.
Firstly, the Group is subject to laws and regulations that directly affect the financial statements including financial reporting legislation (including related companies legislation), distributable profits legislation and taxation legislation and we assessed the extent of compliance with these laws and regulations as part of our procedures on the related financial statement items.
Secondly, the Group is subject to many other laws and regulations where the consequences of non-compliance could have a material effect on amounts or disclosures in the financial statements, for instance through the imposition of fines or litigation. We identified the following areas as those most likely to have such an effect:▪ Competition legislation (reflecting the Group’s involvement in a number of ongoing investigations by national competition authorities),▪ Employment legislation (reflecting the Group’s significant and geographically diverse work force).▪ Health and safety regulation (reflecting the nature of the Group’s production and distribution processes).▪ Consumer product law such as product safety and product claims (reflecting the nature of the Group’s diverse product base).▪ Contract legislation (reflecting the Group’s extensive use of trademarks, copyright and patents).▪ Data privacy (requirements from existing data privacy laws).▪ Environmental regulation (reflecting nature of the Group’s production and distribution processes).
Auditing standards limit the required audit procedures to identify non-compliance with these laws and regulations to enquiry of the directors and other management and inspection of regulatory and legal correspondence, if any. Therefore, if a breach of operational regulations is not disclosed to us or evident from relevant correspondence, an audit will not detect that breach.
Context of the ability of the audit to detect fraud or breaches of law or regulationOwing to the inherent limitations of an audit, there is an unavoidable risk that we may not have detected some material misstatements in the financial statements, even though we have properly planned and performed our audit in accordance with auditing standards. For example, the further removed non-compliance with laws and regulations is from the events and transactions reflected in the financial statements, the less likely the inherently limited procedures required by auditing standards would identify it.
In addition, as with any audit, there remained a higher risk of non-detection of fraud, as these may involve collusion, forgery, intentional omissions, misrepresentations, or the override of internal controls. Our audit procedures are designed to detect material misstatement. We are not responsible for preventing non-compliance or fraud and cannot be expected to detect non-compliance with all laws and regulations.
Unilever Annual Report and Accounts 2021 111
FINA
NC
IAL STA
TEMEN
TS
7. We have nothing to report on the other information
The Directors are responsible for the other information presented in the Unilever Annual Report and Accounts 2021 together with the Financial Statements. Our opinion on the Financial Statements does not cover the other information and, accordingly, we do not express an audit opinion or, except as explicitly stated below, any form of assurance conclusion thereon.
Our responsibility is to read the other information and, in doing so, consider whether, based on our financial statements audit work, the information therein is materially misstated or inconsistent with the Financial Statements or our audit knowledge. Based solely on that work we have not identified material misstatements in the other information.
Strategic report and Directors’ report Based solely on our work on the other information:▪ we have not identified material misstatements in the Strategic report and the Directors’ report;▪ in our opinion the information given in those reports for the financial year is consistent with the Financial Statements; and▪ in our opinion those reports have been prepared in accordance with the Companies Act 2006.
Directors’ remuneration reportIn our opinion the part of the Directors’ Remuneration Report to be audited has been properly prepared in accordance with the Companies Act 2006.
Disclosures of emerging and principal risks and longer-term viability We are required to perform procedures to identify whether there is a material inconsistency between the Directors’ disclosures in respect of emerging and principal risks and the viability statement, and the financial statements and our audit knowledge.
Based on the knowledge we acquired during our audit, we have nothing material to add or draw attention to in relation to:▪ the Directors’ confirmation within the Viability Statement on page 45 that they have carried out a robust assessment of the emerging and
principal risks facing the Group, including those that would threaten its business model, future performance, solvency and liquidity;▪ the Principal Risk Factors disclosures describing these risks and how emerging risks are identified, and explaining how they are being managed
and mitigated; and▪ the Directors’ explanation in the Viability Statement of how they have assessed the prospects of the Group, over what period they have done so
and why they considered that period to be appropriate, and their statement as to whether they have a reasonable expectation that the Group will be able to continue in operation and meet its liabilities as they fall due over the period of their assessment, including any related disclosures drawing attention to any necessary qualifications or assumptions.
We are also required to review the Viability Statement, set out on page 45 under the Listing Rules. Based on the above procedures, we have concluded that the above disclosures are materially consistent with the financial statements and our audit knowledge.
Our work is limited to assessing these matters in the context of only the knowledge acquired during our financial statements audit. As we cannot predict all future events or conditions and as subsequent events may result in outcomes that are inconsistent with judgements that were reasonable at the time they were made, the absence of anything to report on these statements is not a guarantee as to the Group’s and Company’s longer-term viability.
Corporate governance disclosures We are required to perform procedures to identify whether there is a material inconsistency between the Directors’ corporate governance disclosures and the financial statements and our audit knowledge.
Based on those procedures, we have concluded that each of the following is materially consistent with the financial statements and our audit knowledge: ▪ the directors’ statement that they consider that the annual report and financial statements taken as a whole is fair, balanced and
understandable, and provides the information necessary for shareholders to assess the Group’s position and performance, business model and strategy;
▪ the section of the annual report describing the work of the Audit Committee, including the significant issues that the audit committee considered in relation to the financial statements, and how these issues were addressed; and
▪ the section of the annual report that describes the review of the effectiveness of the Group’s risk management and internal control systems.
We are required to review the part of Corporate Governance Statement relating to the Group’s compliance with the provisions of the UK Corporate Governance Code specified by the Listing Rules for our review. We have nothing to report in this respect.
8. We have nothing to report on the other matters on which we are required to report by exception
Under the Companies Act 2006, we are required to report to you if, in our opinion: ▪ adequate accounting records have not been kept by the Company, or returns adequate for our audit have not been received from branches
not visited by us; or ▪ the Company Accounts and the part of the Directors’ Remuneration Report to be audited are not in agreement with the accounting records
and returns; or ▪ certain disclosures of Directors’ remuneration specified by law are not made; or ▪ we have not received all the information and explanations we require for our audit.
We have nothing to report in these respects.
9. Respective ResponsibilitiesDirectors’ responsibilities As explained more fully in their statement set out on page 106, the Directors are responsible for the preparation of the Financial Statements including being satisfied that they give a true and fair view. They are also responsible for: such internal control as they determine is necessary to enable the preparation of Financial Statements that are free from material misstatement, whether due to fraud or error; assessing the Group and Company’s ability to continue as a going concern, disclosing, as applicable, matters related to going concern; and using the going concern basis of accounting unless they either intend to liquidate the Group or the Company or to cease operations, or have no realistic alternative but to do so.
Auditor’s responsibilities Our objectives are to obtain reasonable assurance about whether the financial statements as a whole are free from material misstatement, whether due to fraud, or error, and to issue our opinion in an auditor’s report. Reasonable assurance is a high level of assurance, but does not guarantee that an audit conducted in accordance with ISAs (UK) will always detect a material misstatement when it exists.
Misstatements can arise from fraud or error and are considered material if, individually or in aggregate, they could reasonably be expected to influence the economic decisions of users taken on the basis of the financial statements.
A fuller description of our responsibilities is provided on the FRC’s website at
www.frc.org.uk/auditorsresponsibilities
112 Unilever Annual Report and Accounts 2021
10. The purpose of our audit work and to whom we owe our responsibilities
This report is made solely to the Company’s members, as a body, in accordance with Chapter 3 of Part 16 of the Companies Act 2006. Our audit work has been undertaken so that we might state to the Company’s members those matters we are required to state to them in an auditor’s report and for no other purpose. To the fullest extent permitted by law, we do not accept or assume responsibility to anyone other than the Company and the Company’s members, as a body, for our audit work, for this report, or for the opinions we have formed.
Jonathan Mills
(Senior Statutory Auditor)for and on behalf of KPMG LLP, Statutory Auditor
Chartered Accountants 15 Canada Square London, E14 5GL 2 March 2022
Unilever Annual Report and Accounts 2021 113
FINA
NC
IAL STA
TEMEN
TS

Consolidated Financial Statements Unilever GroupConsolidated income statementfor the year ended 31 December
€ million € million € million
Notes 2021 2020 2019
Turnover 2 52,444 50,724 51,980
Operating profit 2 8,702 8,303 8,708
Which includes non-underlying item credits/(charges) of 3 (934) (1,064) (1,239)
Net finance costs 5 (354) (505) (627)
Pensions and similar obligations (10) (9) (30)
Finance income 147 232 224
Finance costs (491) (728) (821)
Which includes non-underlying costs of 3 10 (56) —
Non-underlying item net monetary gain/(loss) arising from hyperinflationary economies 1,3 (74) 20 32
Share of net profit/(loss) of joint ventures and associates 11 191 175 176
Which includes non-underlying item credits/(charges) of 3 — — 3
Other income/(loss) from non-current investments and associates 91 3 —
Profit before taxation 8,556 7,996 8,289
Taxation 6A (1,935) (1,923) (2,263)
Which includes tax impact of non-underlying items of 3 178 126 113
Net profit 6,621 6,073 6,026
Attributable to:
Non-controlling interests 572 492 401
Shareholders’ equity 6,049 5,581 5,625
Combined earnings per share 7
Basic earnings per share (€) 2.33 2.13 2.15
Diluted earnings per share (€) 2.32 2.12 2.14
Consolidated statement of comprehensive incomefor the year ended 31 December
€ million € million € million
Notes 2021 2020 2019
Net profit 6,621 6,073 6,026
Other comprehensive income 6C
Items that will not be reclassified to profit or loss, net of tax:Gains/(losses) on equity instruments measured at fair value through other comprehensive income 166 78 29
Remeasurement of defined benefit pension plans 15B 1,734 215 353
Items that may be reclassified subsequently to profit or loss, net of tax:
Gains/(losses) on cash flow hedges 279 60 176 Currency retranslation gains/(losses) 15B 1,177 (2,590) (15)
Total comprehensive income 9,977 3,836 6,569
Attributable to:
Non-controlling interests 749 286 407
Shareholders’ equity 9,228 3,550 6,162
Note references in the consolidated income statement, consolidated statement of comprehensive income, consolidated statement of changes in equity, consolidated balance sheet and consolidated cash flow statement relate to notes on pages 118 to 166, which form an integral part of the consolidated financial statements.
114 Unilever Annual Report and Accounts 2021
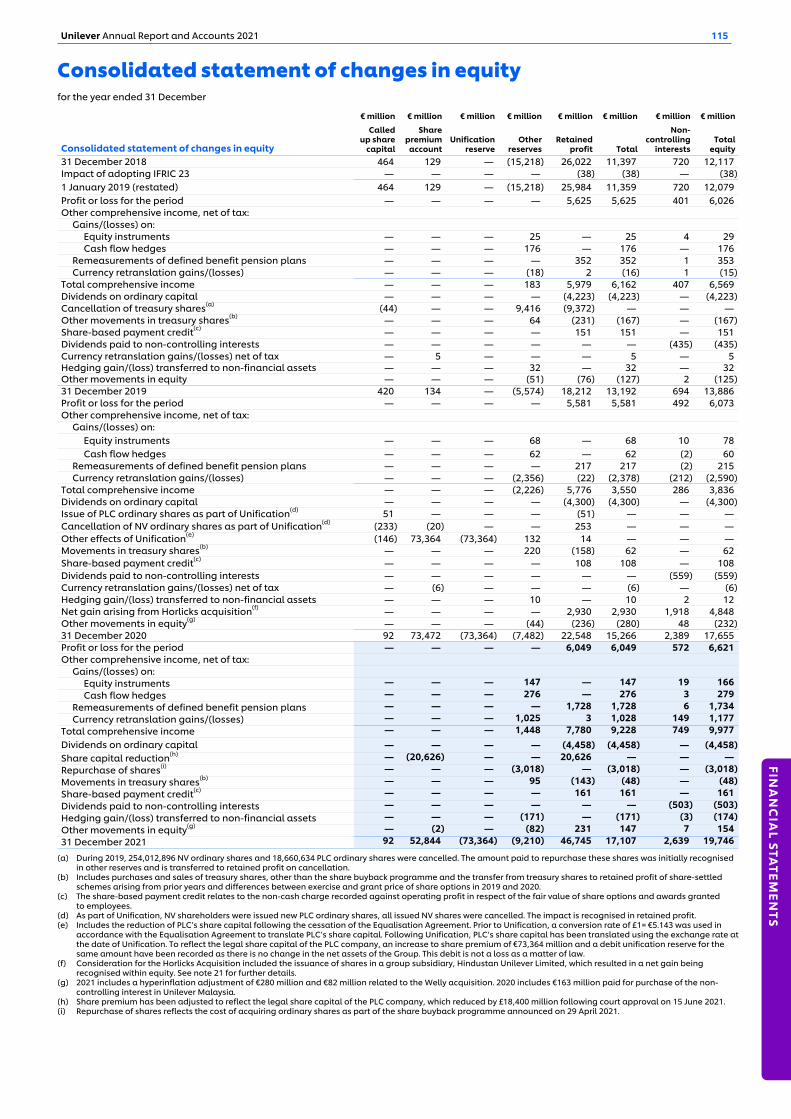
Consolidated statement of changes in equityfor the year ended 31 December
€ million € million € million € million € million € million € million € million
Consolidated statement of changes in equity
Calledup share
capital
Sharepremium
accountUnification
reserveOther
reservesRetained
profit Total
Non-controlling
interestsTotal
equity31 December 2018 464 129 — (15,218) 26,022 11,397 720 12,117 Impact of adopting IFRIC 23 — — — — (38) (38) — (38) 1 January 2019 (restated) 464 129 — (15,218) 25,984 11,359 720 12,079 Profit or loss for the period — — — — 5,625 5,625 401 6,026 Other comprehensive income, net of tax:
Gains/(losses) on:Equity instruments — — — 25 — 25 4 29 Cash flow hedges — — — 176 — 176 — 176
Remeasurements of defined benefit pension plans — — — — 352 352 1 353 Currency retranslation gains/(losses) — — — (18) 2 (16) 1 (15)
Total comprehensive income — — — 183 5,979 6,162 407 6,569 Dividends on ordinary capital — — — — (4,223) (4,223) — (4,223) Cancellation of treasury shares(a) (44) — — 9,416 (9,372) — — — Other movements in treasury shares(b) — — — 64 (231) (167) — (167) Share-based payment credit(c) — — — — 151 151 — 151 Dividends paid to non-controlling interests — — — — — — (435) (435) Currency retranslation gains/(losses) net of tax — 5 — — — 5 — 5 Hedging gain/(loss) transferred to non-financial assets — — — 32 — 32 — 32 Other movements in equity — — — (51) (76) (127) 2 (125) 31 December 2019 420 134 — (5,574) 18,212 13,192 694 13,886 Profit or loss for the period — — — — 5,581 5,581 492 6,073 Other comprehensive income, net of tax:
Gains/(losses) on:Equity instruments — — — 68 — 68 10 78 Cash flow hedges — — — 62 — 62 (2) 60
Remeasurements of defined benefit pension plans — — — — 217 217 (2) 215 Currency retranslation gains/(losses) — — — (2,356) (22) (2,378) (212) (2,590)
Total comprehensive income — — — (2,226) 5,776 3,550 286 3,836 Dividends on ordinary capital — — — — (4,300) (4,300) — (4,300) Issue of PLC ordinary shares as part of Unification(d) 51 — — — (51) — — — Cancellation of NV ordinary shares as part of Unification(d) (233) (20) — — 253 — — — Other effects of Unification(e) (146) 73,364 (73,364) 132 14 — — — Movements in treasury shares(b) — — — 220 (158) 62 — 62 Share-based payment credit(c) — — — — 108 108 — 108 Dividends paid to non-controlling interests — — — — — — (559) (559) Currency retranslation gains/(losses) net of tax — (6) — — — (6) — (6) Hedging gain/(loss) transferred to non-financial assets — — — 10 — 10 2 12 Net gain arising from Horlicks acquisition(f) — — — — 2,930 2,930 1,918 4,848 Other movements in equity(g) — — — (44) (236) (280) 48 (232) 31 December 2020 92 73,472 (73,364) (7,482) 22,548 15,266 2,389 17,655 Profit or loss for the period — — — — 6,049 6,049 572 6,621 Other comprehensive income, net of tax:
Gains/(losses) on:Equity instruments — — — 147 — 147 19 166 Cash flow hedges — — — 276 — 276 3 279
Remeasurements of defined benefit pension plans — — — — 1,728 1,728 6 1,734 Currency retranslation gains/(losses) — — — 1,025 3 1,028 149 1,177
Total comprehensive income — — — 1,448 7,780 9,228 749 9,977 Dividends on ordinary capital — — — — (4,458) (4,458) — (4,458) Share capital reduction(h) — (20,626) — — 20,626 — — — Repurchase of shares(i) — — — (3,018) — (3,018) — (3,018) Movements in treasury shares(b) — — — 95 (143) (48) — (48) Share-based payment credit(c) — — — — 161 161 — 161 Dividends paid to non-controlling interests — — — — — — (503) (503) Hedging gain/(loss) transferred to non-financial assets — — — (171) — (171) (3) (174) Other movements in equity(g) — (2) — (82) 231 147 7 154 31 December 2021 92 52,844 (73,364) (9,210) 46,745 17,107 2,639 19,746
(a) During 2019, 254,012,896 NV ordinary shares and 18,660,634 PLC ordinary shares were cancelled. The amount paid to repurchase these shares was initially recognised in other reserves and is transferred to retained profit on cancellation.
(b) Includes purchases and sales of treasury shares, other than the share buyback programme and the transfer from treasury shares to retained profit of share-settled schemes arising from prior years and differences between exercise and grant price of share options in 2019 and 2020.
(c) The share-based payment credit relates to the non-cash charge recorded against operating profit in respect of the fair value of share options and awards granted to employees.
(d) As part of Unification, NV shareholders were issued new PLC ordinary shares, all issued NV shares were cancelled. The impact is recognised in retained profit.(e) Includes the reduction of PLC’s share capital following the cessation of the Equalisation Agreement. Prior to Unification, a conversion rate of £1= €5.143 was used in
accordance with the Equalisation Agreement to translate PLC’s share capital. Following Unification, PLC’s share capital has been translated using the exchange rate at the date of Unification. To reflect the legal share capital of the PLC company, an increase to share premium of €73,364 million and a debit unification reserve for the same amount have been recorded as there is no change in the net assets of the Group. This debit is not a loss as a matter of law.
(f) Consideration for the Horlicks Acquisition included the issuance of shares in a group subsidiary, Hindustan Unilever Limited, which resulted in a net gain being recognised within equity. See note 21 for further details.
(g) 2021 includes a hyperinflation adjustment of €280 million and €82 million related to the Welly acquisition. 2020 includes €163 million paid for purchase of the non-controlling interest in Unilever Malaysia.
(h) Share premium has been adjusted to reflect the legal share capital of the PLC company, which reduced by £18,400 million following court approval on 15 June 2021.(i) Repurchase of shares reflects the cost of acquiring ordinary shares as part of the share buyback programme announced on 29 April 2021.
Unilever Annual Report and Accounts 2021 115
FINA
NC
IAL STA
TEMEN
TS
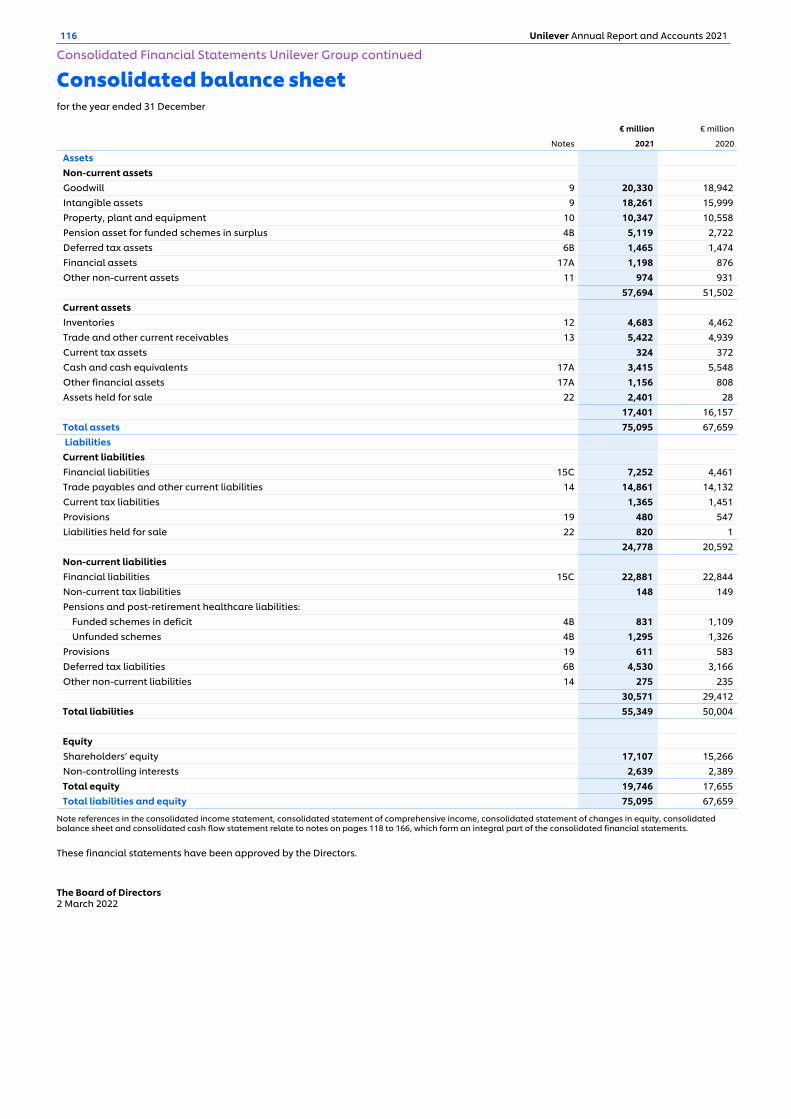
Consolidated balance sheetfor the year ended 31 December
€ million € million
Notes 2021 2020
Assets Non-current assets Goodwill 9 20,330 18,942 Intangible assets 9 18,261 15,999 Property, plant and equipment 10 10,347 10,558 Pension asset for funded schemes in surplus 4B 5,119 2,722 Deferred tax assets 6B 1,465 1,474 Financial assets 17A 1,198 876 Other non-current assets 11 974 931
57,694 51,502 Current assets Inventories 12 4,683 4,462 Trade and other current receivables 13 5,422 4,939 Current tax assets 324 372 Cash and cash equivalents 17A 3,415 5,548 Other financial assets 17A 1,156 808 Assets held for sale 22 2,401 28
17,401 16,157 Total assets 75,095 67,659 Liabilities Current liabilities Financial liabilities 15C 7,252 4,461 Trade payables and other current liabilities 14 14,861 14,132 Current tax liabilities 1,365 1,451 Provisions 19 480 547 Liabilities held for sale 22 820 1
24,778 20,592 Non-current liabilities Financial liabilities 15C 22,881 22,844 Non-current tax liabilities 148 149 Pensions and post-retirement healthcare liabilities:
Funded schemes in deficit 4B 831 1,109 Unfunded schemes 4B 1,295 1,326
Provisions 19 611 583 Deferred tax liabilities 6B 4,530 3,166 Other non-current liabilities 14 275 235
30,571 29,412 Total liabilities 55,349 50,004
Equity Shareholders’ equity 17,107 15,266 Non-controlling interests 2,639 2,389 Total equity 19,746 17,655 Total liabilities and equity 75,095 67,659
Note references in the consolidated income statement, consolidated statement of comprehensive income, consolidated statement of changes in equity, consolidated balance sheet and consolidated cash flow statement relate to notes on pages 118 to 166, which form an integral part of the consolidated financial statements.
These financial statements have been approved by the Directors.
The Board of Directors2 March 2022
116 Unilever Annual Report and Accounts 2021
Consolidated Financial Statements Unilever Group continued
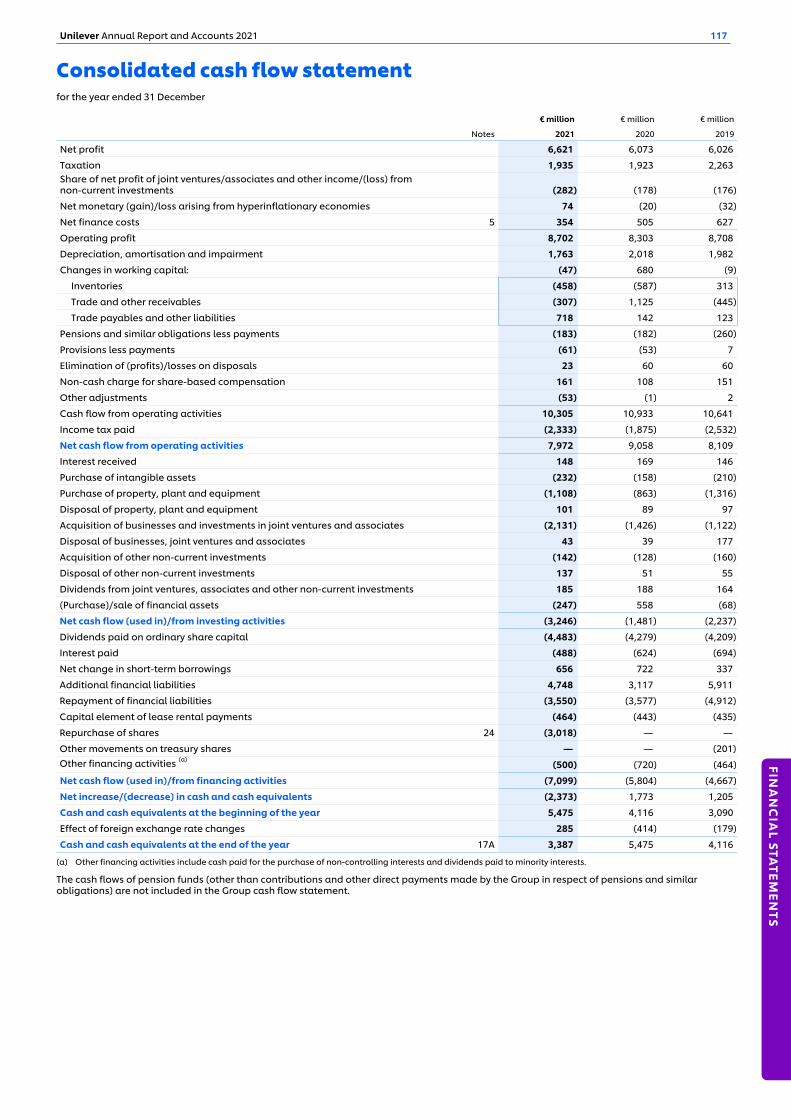
Consolidated cash flow statementfor the year ended 31 December
€ million € million € million
Notes 2021 2020 2019
Net profit 6,621 6,073 6,026
Taxation 1,935 1,923 2,263 Share of net profit of joint ventures/associates and other income/(loss) from non-current investments (282) (178) (176)
Net monetary (gain)/loss arising from hyperinflationary economies 74 (20) (32)
Net finance costs 5 354 505 627
Operating profit 8,702 8,303 8,708
Depreciation, amortisation and impairment 1,763 2,018 1,982
Changes in working capital: (47) 680 (9)
Inventories (458) (587) 313
Trade and other receivables (307) 1,125 (445)
Trade payables and other liabilities 718 142 123
Pensions and similar obligations less payments (183) (182) (260)
Provisions less payments (61) (53) 7
Elimination of (profits)/losses on disposals 23 60 60
Non-cash charge for share-based compensation 161 108 151
Other adjustments (53) (1) 2
Cash flow from operating activities 10,305 10,933 10,641
Income tax paid (2,333) (1,875) (2,532)
Net cash flow from operating activities 7,972 9,058 8,109
Interest received 148 169 146
Purchase of intangible assets (232) (158) (210)
Purchase of property, plant and equipment (1,108) (863) (1,316)
Disposal of property, plant and equipment 101 89 97
Acquisition of businesses and investments in joint ventures and associates (2,131) (1,426) (1,122)
Disposal of businesses, joint ventures and associates 43 39 177
Acquisition of other non-current investments (142) (128) (160)
Disposal of other non-current investments 137 51 55
Dividends from joint ventures, associates and other non-current investments 185 188 164
(Purchase)/sale of financial assets (247) 558 (68)
Net cash flow (used in)/from investing activities (3,246) (1,481) (2,237)
Dividends paid on ordinary share capital (4,483) (4,279) (4,209)
Interest paid (488) (624) (694)
Net change in short-term borrowings 656 722 337
Additional financial liabilities 4,748 3,117 5,911
Repayment of financial liabilities (3,550) (3,577) (4,912)
Capital element of lease rental payments (464) (443) (435)
Repurchase of shares 24 (3,018) — —
Other movements on treasury shares — — (201) Other financing activities (a)
(500) (720) (464)
Net cash flow (used in)/from financing activities (7,099) (5,804) (4,667)
Net increase/(decrease) in cash and cash equivalents (2,373) 1,773 1,205
Cash and cash equivalents at the beginning of the year 5,475 4,116 3,090
Effect of foreign exchange rate changes 285 (414) (179)
Cash and cash equivalents at the end of the year 17A 3,387 5,475 4,116
(a) Other financing activities include cash paid for the purchase of non-controlling interests and dividends paid to minority interests.
The cash flows of pension funds (other than contributions and other direct payments made by the Group in respect of pensions and similar obligations) are not included in the Group cash flow statement.
Unilever Annual Report and Accounts 2021 117
FINA
NC
IAL STA
TEMEN
TS
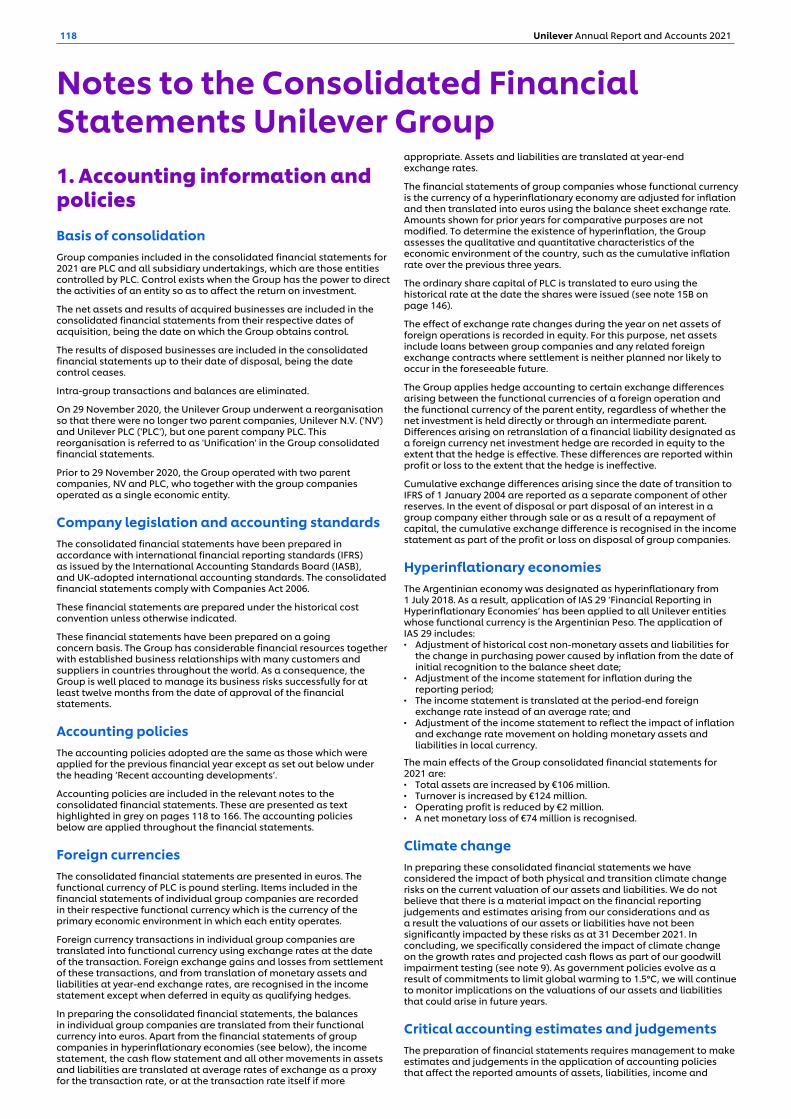
Notes to the Consolidated Financial Statements Unilever Group1. Accounting information and policiesBasis of consolidationGroup companies included in the consolidated financial statements for 2021 are PLC and all subsidiary undertakings, which are those entities controlled by PLC. Control exists when the Group has the power to direct the activities of an entity so as to affect the return on investment.
The net assets and results of acquired businesses are included in the consolidated financial statements from their respective dates of acquisition, being the date on which the Group obtains control.
The results of disposed businesses are included in the consolidated financial statements up to their date of disposal, being the date control ceases.
Intra-group transactions and balances are eliminated.
On 29 November 2020, the Unilever Group underwent a reorganisation so that there were no longer two parent companies, Unilever N.V. ('NV') and Unilever PLC ('PLC'), but one parent company PLC. This reorganisation is referred to as 'Unification' in the Group consolidated financial statements.
Prior to 29 November 2020, the Group operated with two parent companies, NV and PLC, who together with the group companies operated as a single economic entity.
Company legislation and accounting standardsThe consolidated financial statements have been prepared in accordance with international financial reporting standards (IFRS) as issued by the International Accounting Standards Board (IASB), and UK-adopted international accounting standards. The consolidated financial statements comply with Companies Act 2006.
These financial statements are prepared under the historical cost convention unless otherwise indicated.
These financial statements have been prepared on a going concern basis. The Group has considerable financial resources together with established business relationships with many customers and suppliers in countries throughout the world. As a consequence, the Group is well placed to manage its business risks successfully for at least twelve months from the date of approval of the financial statements.
Accounting policiesThe accounting policies adopted are the same as those which were applied for the previous financial year except as set out below under the heading ‘Recent accounting developments’.
Accounting policies are included in the relevant notes to the consolidated financial statements. These are presented as text highlighted in grey on pages 118 to 166. The accounting policies below are applied throughout the financial statements.
Foreign currenciesThe consolidated financial statements are presented in euros. The functional currency of PLC is pound sterling. Items included in the financial statements of individual group companies are recorded in their respective functional currency which is the currency of the primary economic environment in which each entity operates.
Foreign currency transactions in individual group companies are translated into functional currency using exchange rates at the date of the transaction. Foreign exchange gains and losses from settlement of these transactions, and from translation of monetary assets and liabilities at year-end exchange rates, are recognised in the income statement except when deferred in equity as qualifying hedges.
In preparing the consolidated financial statements, the balances in individual group companies are translated from their functional currency into euros. Apart from the financial statements of group companies in hyperinflationary economies (see below), the income statement, the cash flow statement and all other movements in assets and liabilities are translated at average rates of exchange as a proxy for the transaction rate, or at the transaction rate itself if more
appropriate. Assets and liabilities are translated at year-end exchange rates.
The financial statements of group companies whose functional currency is the currency of a hyperinflationary economy are adjusted for inflation and then translated into euros using the balance sheet exchange rate. Amounts shown for prior years for comparative purposes are not modified. To determine the existence of hyperinflation, the Group assesses the qualitative and quantitative characteristics of the economic environment of the country, such as the cumulative inflation rate over the previous three years.
The ordinary share capital of PLC is translated to euro using the historical rate at the date the shares were issued (see note 15B on page 146).
The effect of exchange rate changes during the year on net assets of foreign operations is recorded in equity. For this purpose, net assets include loans between group companies and any related foreign exchange contracts where settlement is neither planned nor likely to occur in the foreseeable future.
The Group applies hedge accounting to certain exchange differences arising between the functional currencies of a foreign operation and the functional currency of the parent entity, regardless of whether the net investment is held directly or through an intermediate parent. Differences arising on retranslation of a financial liability designated as a foreign currency net investment hedge are recorded in equity to the extent that the hedge is effective. These differences are reported within profit or loss to the extent that the hedge is ineffective.
Cumulative exchange differences arising since the date of transition to IFRS of 1 January 2004 are reported as a separate component of other reserves. In the event of disposal or part disposal of an interest in a group company either through sale or as a result of a repayment of capital, the cumulative exchange difference is recognised in the income statement as part of the profit or loss on disposal of group companies.
Hyperinflationary economiesThe Argentinian economy was designated as hyperinflationary from 1 July 2018. As a result, application of IAS 29 ‘Financial Reporting in Hyperinflationary Economies’ has been applied to all Unilever entities whose functional currency is the Argentinian Peso. The application of IAS 29 includes: ▪ Adjustment of historical cost non-monetary assets and liabilities for
the change in purchasing power caused by inflation from the date of initial recognition to the balance sheet date;
▪ Adjustment of the income statement for inflation during the reporting period;
▪ The income statement is translated at the period-end foreign exchange rate instead of an average rate; and
▪ Adjustment of the income statement to reflect the impact of inflation and exchange rate movement on holding monetary assets and liabilities in local currency.
The main effects of the Group consolidated financial statements for 2021 are:▪ Total assets are increased by €106 million.▪ Turnover is increased by €124 million.▪ Operating profit is reduced by €2 million. ▪ A net monetary loss of €74 million is recognised.
Climate changeIn preparing these consolidated financial statements we have considered the impact of both physical and transition climate change risks on the current valuation of our assets and liabilities. We do not believe that there is a material impact on the financial reporting judgements and estimates arising from our considerations and as a result the valuations of our assets or liabilities have not been significantly impacted by these risks as at 31 December 2021. In concluding, we specifically considered the impact of climate change on the growth rates and projected cash flows as part of our goodwill impairment testing (see note 9). As government policies evolve as a result of commitments to limit global warming to 1.5°C, we will continue to monitor implications on the valuations of our assets and liabilities that could arise in future years.
Critical accounting estimates and judgementsThe preparation of financial statements requires management to make estimates and judgements in the application of accounting policies that affect the reported amounts of assets, liabilities, income and
118 Unilever Annual Report and Accounts 2021
expenses. Actual results may differ from these estimates. Estimates and judgements are continuously evaluated and are based on historical experience and other factors, including expectations of future events that are believed to be reasonable. Revisions to accounting estimates are recognised in the period in which the estimate is revised and in any future period affected.
The following estimates are those that management believe have the most significant risk of causing a material adjustment to the carrying amounts of assets and liabilities within the next financial year are:▪ Measurement of defined benefit obligations – the valuations of the
Group’s defined benefit pension plan obligations are dependent on a number of assumptions. These include discount rates, inflation and life expectancy of scheme members. Details of these assumptions and sensitivities are in note 4B.
The following judgements are those that management believe have the most significant effect on the amounts recognised in the Group’s financial statements:▪ Separate presentation of items in the income statement – certain
items of income or expense are presented separately as non-underlying items. These are excluded in several of our performance measures, including underlying operating profit and underlying earnings per share due to their nature and/or frequency of occurrence. See note 3 for further details.
• Disclosure of ekaterra assets and liabilities – following the announcement to dispose of part of our Tea business ('ekaterra'), management has assessed whether this would meet the criteria for presentation as a discontinued operation. As the contribution of
ekaterra to the overall Group is approximately 4% of Group turnover and 3% of total assets, management has concluded that it does not represent a separate major line of business, nor separate component of the Group and so should not be presented as a discontinued operation. ekaterra assets and liabilities have been presented in the financial statements as held for sale – see note 22.
▪ Utilisation of tax losses and recognition of other deferred tax assets – the Group operates in many countries and is subject to taxes in numerous jurisdictions. Management uses judgement to assess the recoverability of tax assets such as whether there will be sufficient future taxable profits to utilise losses – see note 6B.
▪ Likelihood of occurrence of provisions and contingent liabilities – events can occur where there is uncertainty over future obligations. Judgement is required to determine if an outflow of economic resources is probable, or possible but not probable. Where it is probable, a liability is recognised and further judgement is used to determine the level of the provision. Where it is possible but not probable, further judgement is used to determine if the likelihood is remote, in which case no disclosures are provided; if the likelihood is not remote then judgement is used to determine the contingent liability disclosed. Unilever does not have provisions and contingent liabilities for the same matters. External advice is obtained for any material cases. See notes 6A, 19 and 20.
▪ Recognition of pension surplus – where there is an accounting surplus on a defined benefit plan, management uses judgement to determine whether the Group can realise the surplus through refunds, reductions in future combinations or a combination of both.
Recent accounting developments adopted by the GroupThe Group applied for the first-time amendments to the following standards from 1 January 2021.
Applicable standard Key requirements Impact on GroupInterest Rate Benchmark Reform (Phase 2)
Amendments to IFRS 9, IAS 39, IFRS 7, IFRS 4 and IFRS 16
The amendments are applicable when an existing interest rate benchmark is replaced by another interest rate benchmark. The amendments provide a practical expedient that modifications to asset and liability values as a direct consequence of the interest rate benchmark reform and made on an economically equivalent basis (i.e. where the basis for determining contractual cash flows is the same), can be accounted for by only updating the effective interest rate.
We do not have significant financial instruments that refer to an interest rate benchmark so these amendments have not had a material impact on Unilever.
Additionally, hedge accounting is not discontinued solely because of the replacement of another interest rate benchmark. Hedging relationships (and related documentation) must instead be amended to reflect modifications to the hedged item, hedging instrument and hedged risk.
All other standards or amendments to standards that have been issued by the IASB and were effective by 1 January 2021 were not applicable or material to Unilever.
New standards, amendments and interpretations of existing standards that are not yet effective and have not been early adopted by the GroupIFRS 17 ‘Insurance Contracts’ has been released but is not yet adopted by the Group. The standard is effective from the year ended 31 December 2023 and introduces a new model for accounting for insurance contracts. We have reviewed existing arrangements and concluded that IFRS 17 is not expected to be material for Unilever.
All other new standards or amendments that are not yet effective that have been issued by the IASB are not applicable or material to Unilever.
Unilever Annual Report and Accounts 2021 119
FINA
NC
IAL STA
TEMEN
TS
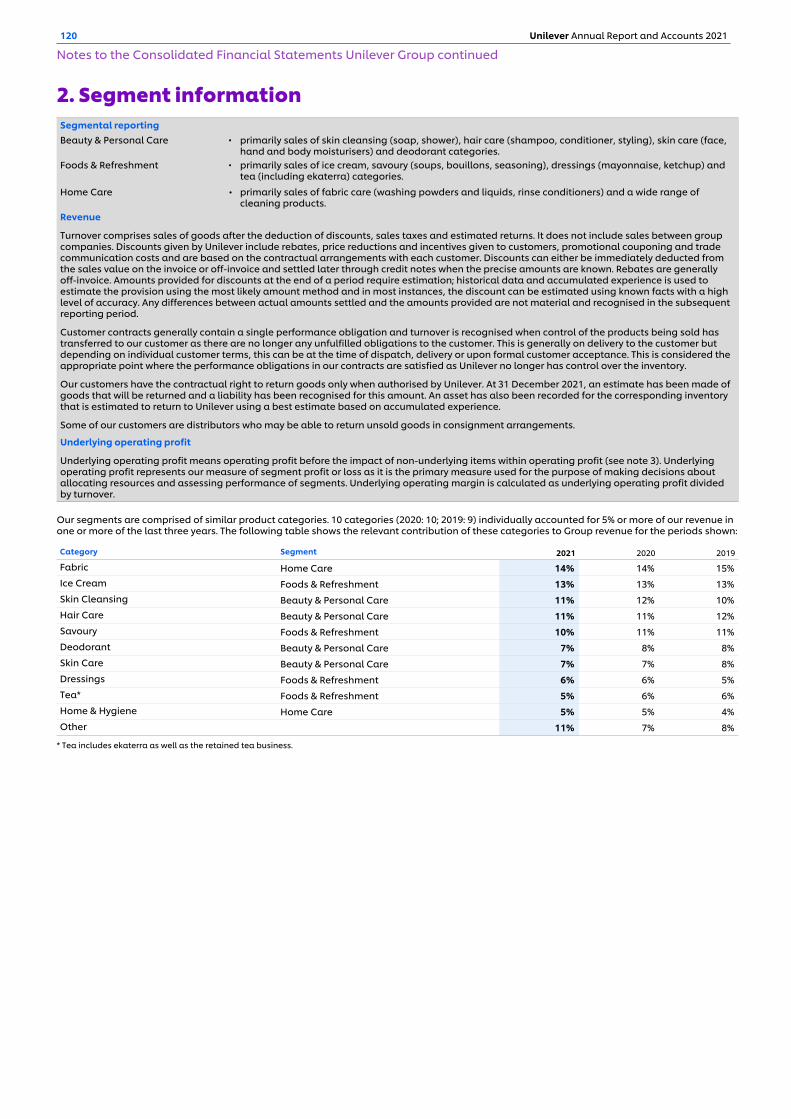
2. Segment informationSegmental reportingBeauty & Personal Care ▪ primarily sales of skin cleansing (soap, shower), hair care (shampoo, conditioner, styling), skin care (face,
hand and body moisturisers) and deodorant categories.Foods & Refreshment ▪ primarily sales of ice cream, savoury (soups, bouillons, seasoning), dressings (mayonnaise, ketchup) and
tea (including ekaterra) categories.
Home Care • primarily sales of fabric care (washing powders and liquids, rinse conditioners) and a wide range of cleaning products.
Revenue
Turnover comprises sales of goods after the deduction of discounts, sales taxes and estimated returns. It does not include sales between group companies. Discounts given by Unilever include rebates, price reductions and incentives given to customers, promotional couponing and trade communication costs and are based on the contractual arrangements with each customer. Discounts can either be immediately deducted from the sales value on the invoice or off-invoice and settled later through credit notes when the precise amounts are known. Rebates are generally off-invoice. Amounts provided for discounts at the end of a period require estimation; historical data and accumulated experience is used to estimate the provision using the most likely amount method and in most instances, the discount can be estimated using known facts with a high level of accuracy. Any differences between actual amounts settled and the amounts provided are not material and recognised in the subsequent reporting period.
Customer contracts generally contain a single performance obligation and turnover is recognised when control of the products being sold has transferred to our customer as there are no longer any unfulfilled obligations to the customer. This is generally on delivery to the customer but depending on individual customer terms, this can be at the time of dispatch, delivery or upon formal customer acceptance. This is considered the appropriate point where the performance obligations in our contracts are satisfied as Unilever no longer has control over the inventory.
Our customers have the contractual right to return goods only when authorised by Unilever. At 31 December 2021, an estimate has been made of goods that will be returned and a liability has been recognised for this amount. An asset has also been recorded for the corresponding inventory that is estimated to return to Unilever using a best estimate based on accumulated experience.
Some of our customers are distributors who may be able to return unsold goods in consignment arrangements.
Underlying operating profit
Underlying operating profit means operating profit before the impact of non-underlying items within operating profit (see note 3). Underlying operating profit represents our measure of segment profit or loss as it is the primary measure used for the purpose of making decisions about allocating resources and assessing performance of segments. Underlying operating margin is calculated as underlying operating profit divided by turnover.
Our segments are comprised of similar product categories. 10 categories (2020: 10; 2019: 9) individually accounted for 5% or more of our revenue in one or more of the last three years. The following table shows the relevant contribution of these categories to Group revenue for the periods shown:
Category Segment 2021 2020 2019
Fabric Home Care 14% 14% 15% Ice Cream Foods & Refreshment 13% 13% 13% Skin Cleansing Beauty & Personal Care 11% 12% 10% Hair Care Beauty & Personal Care 11% 11% 12% Savoury Foods & Refreshment 10% 11% 11% Deodorant Beauty & Personal Care 7% 8% 8% Skin Care Beauty & Personal Care 7% 7% 8% Dressings Foods & Refreshment 6% 6% 5% Tea* Foods & Refreshment 5% 6% 6% Home & Hygiene Home Care 5% 5% 4% Other 11% 7% 8%
* Tea includes ekaterra as well as the retained tea business.
120 Unilever Annual Report and Accounts 2021
Notes to the Consolidated Financial Statements Unilever Group continued

2. Segment information continuedThe Group operating segment information is provided based on three product areas: Beauty & Personal Care, Foods & Refreshment and Home Care.
€ million € million € million € million
NotesBeauty &
Personal CareFoods &
RefreshmentHome
Care Total
2021
Turnover 21,901 19,971 10,572 52,444
Operating profit 4,471 2,937 1,294 8,702
Non-underlying items 3 271 540 123 934
Underlying operating profit 4,742 3,477 1,417 9,636
Share of net profit/(loss) of joint ventures and associates 10 174 7 191
Significant non-cash charges:
Within underlying operating profit:
Depreciation and amortisation 621 816 309 1,746 Share-based compensation and other non-cash charges(a) 102 103 44 249
Within non-underlying items:
Impairment and other non-cash charges(b) 13 33 12 58
2020
Turnover 21,124 19,140 10,460 50,724
Operating profit 4,311 2,749 1,243 8,303
Non-underlying items 3 280 508 276 1,064
Underlying operating profit 4,591 3,257 1,519 9,367
Share of net profit/(loss) of joint ventures and associates 7 163 5 175
Significant non-cash charges:
Within underlying operating profit:
Depreciation and amortisation 710 946 362 2,018 Share-based compensation and other non-cash charges(a) 77 85 41 203
Within non-underlying items:
Impairment and other non-cash charges(b) 38 77 35 150
2019
Turnover 21,868 19,287 10,825 51,980
Operating profit 4,520 2,811 1,377 8,708
Non-underlying items 3 440 571 228 1,239
Underlying operating profit 4,960 3,382 1,605 9,947
Share of net profit/(loss) of joint ventures and associates 1 171 4 176
Significant non-cash charges:
Within underlying operating profit:
Depreciation and amortisation 693 902 369 1,964 Share-based compensation and other non-cash charges(a) 62 56 50 168
Within non-underlying items:
Impairment and other non-cash charges(b) 105 159 46 310
(a) Other non-cash charges within underlying operating profit include movements in provisions from underlying activities, excluding movements arising from non- underlying activities.
(b) Other non-cash charges within non-underlying items includes movements in restructuring provisions and movements in certain legal provisions.
Unilever Annual Report and Accounts 2021 121
FINA
NC
IAL STA
TEMEN
TS
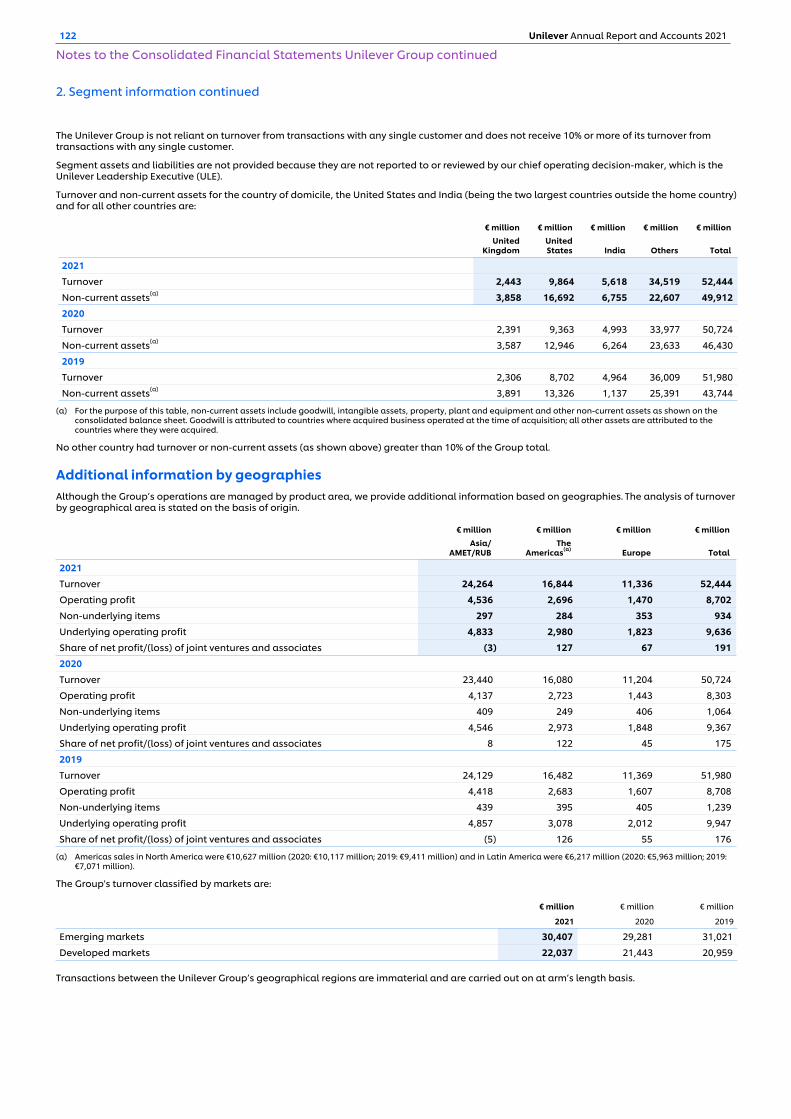
2. Segment information continued
The Unilever Group is not reliant on turnover from transactions with any single customer and does not receive 10% or more of its turnover from transactions with any single customer.
Segment assets and liabilities are not provided because they are not reported to or reviewed by our chief operating decision-maker, which is the Unilever Leadership Executive (ULE).
Turnover and non-current assets for the country of domicile, the United States and India (being the two largest countries outside the home country) and for all other countries are:
€ million € million € million € million € millionUnited
KingdomUnitedStates India Others Total
2021
Turnover 2,443 9,864 5,618 34,519 52,444
Non-current assets(a) 3,858 16,692 6,755 22,607 49,912
2020
Turnover 2,391 9,363 4,993 33,977 50,724
Non-current assets(a) 3,587 12,946 6,264 23,633 46,430
2019
Turnover 2,306 8,702 4,964 36,009 51,980
Non-current assets(a) 3,891 13,326 1,137 25,391 43,744
(a) For the purpose of this table, non-current assets include goodwill, intangible assets, property, plant and equipment and other non-current assets as shown on the consolidated balance sheet. Goodwill is attributed to countries where acquired business operated at the time of acquisition; all other assets are attributed to the countries where they were acquired.
No other country had turnover or non-current assets (as shown above) greater than 10% of the Group total.
Additional information by geographiesAlthough the Group’s operations are managed by product area, we provide additional information based on geographies. The analysis of turnover by geographical area is stated on the basis of origin.
€ million € million € million € millionAsia/
AMET/RUBThe
Americas(a) Europe Total
2021
Turnover 24,264 16,844 11,336 52,444
Operating profit 4,536 2,696 1,470 8,702
Non-underlying items 297 284 353 934
Underlying operating profit 4,833 2,980 1,823 9,636
Share of net profit/(loss) of joint ventures and associates (3) 127 67 191
2020
Turnover 23,440 16,080 11,204 50,724
Operating profit 4,137 2,723 1,443 8,303
Non-underlying items 409 249 406 1,064
Underlying operating profit 4,546 2,973 1,848 9,367
Share of net profit/(loss) of joint ventures and associates 8 122 45 175
2019
Turnover 24,129 16,482 11,369 51,980
Operating profit 4,418 2,683 1,607 8,708
Non-underlying items 439 395 405 1,239
Underlying operating profit 4,857 3,078 2,012 9,947
Share of net profit/(loss) of joint ventures and associates (5) 126 55 176
(a) Americas sales in North America were €10,627 million (2020: €10,117 million; 2019: €9,411 million) and in Latin America were €6,217 million (2020: €5,963 million; 2019: €7,071 million).
The Group's turnover classified by markets are:
€ million € million € million
2021 2020 2019
Emerging markets 30,407 29,281 31,021
Developed markets 22,037 21,443 20,959
Transactions between the Unilever Group’s geographical regions are immaterial and are carried out on at arm’s length basis.
122 Unilever Annual Report and Accounts 2021
Notes to the Consolidated Financial Statements Unilever Group continued
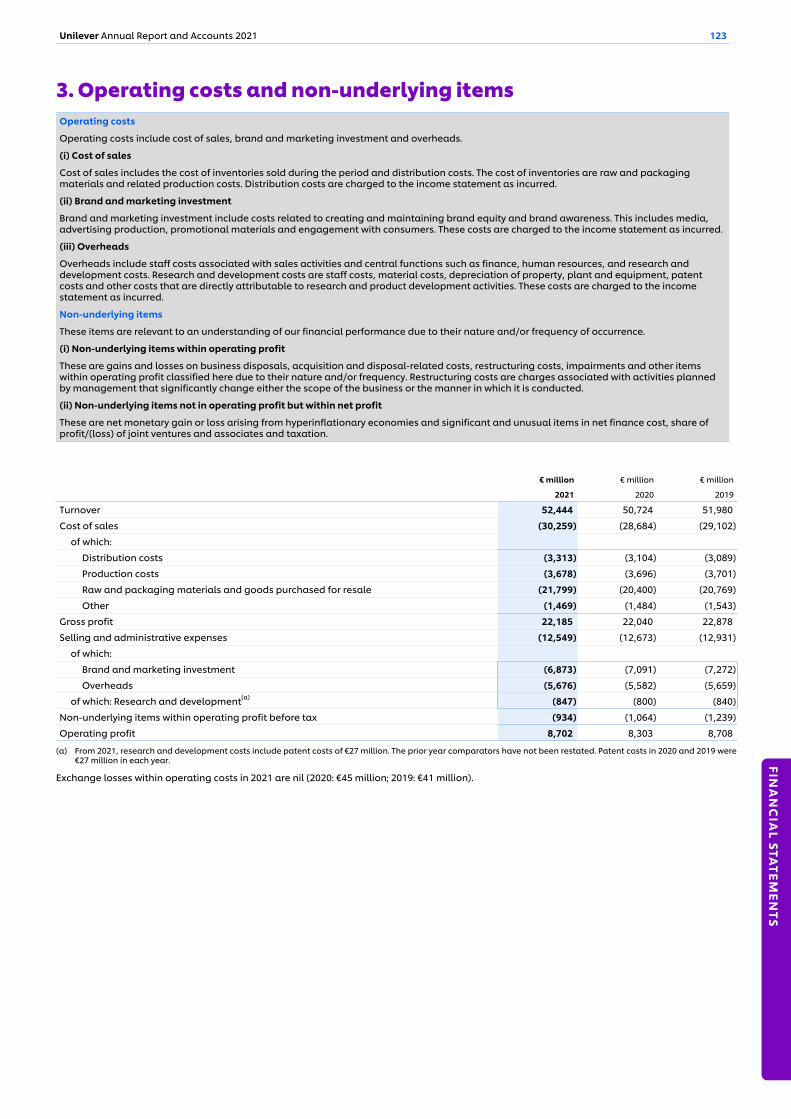
3. Operating costs and non-underlying itemsOperating costs
Operating costs include cost of sales, brand and marketing investment and overheads.
(i) Cost of sales
Cost of sales includes the cost of inventories sold during the period and distribution costs. The cost of inventories are raw and packaging materials and related production costs. Distribution costs are charged to the income statement as incurred.
(ii) Brand and marketing investment
Brand and marketing investment include costs related to creating and maintaining brand equity and brand awareness. This includes media, advertising production, promotional materials and engagement with consumers. These costs are charged to the income statement as incurred.
(iii) Overheads
Overheads include staff costs associated with sales activities and central functions such as finance, human resources, and research and development costs. Research and development costs are staff costs, material costs, depreciation of property, plant and equipment, patent costs and other costs that are directly attributable to research and product development activities. These costs are charged to the income statement as incurred.
Non-underlying items
These items are relevant to an understanding of our financial performance due to their nature and/or frequency of occurrence.
(i) Non-underlying items within operating profit
These are gains and losses on business disposals, acquisition and disposal-related costs, restructuring costs, impairments and other items within operating profit classified here due to their nature and/or frequency. Restructuring costs are charges associated with activities planned by management that significantly change either the scope of the business or the manner in which it is conducted.
(ii) Non-underlying items not in operating profit but within net profit
These are net monetary gain or loss arising from hyperinflationary economies and significant and unusual items in net finance cost, share of profit/(loss) of joint ventures and associates and taxation.
€ million € million € million
2021 2020 2019
Turnover 52,444 50,724 51,980
Cost of sales (30,259) (28,684) (29,102)
of which:
Distribution costs (3,313) (3,104) (3,089)
Production costs (3,678) (3,696) (3,701)
Raw and packaging materials and goods purchased for resale (21,799) (20,400) (20,769)
Other (1,469) (1,484) (1,543)
Gross profit 22,185 22,040 22,878
Selling and administrative expenses (12,549) (12,673) (12,931)
of which:
Brand and marketing investment (6,873) (7,091) (7,272)
Overheads (5,676) (5,582) (5,659)
of which: Research and development(a) (847) (800) (840)
Non-underlying items within operating profit before tax (934) (1,064) (1,239)
Operating profit 8,702 8,303 8,708
(a) From 2021, research and development costs include patent costs of €27 million. The prior year comparators have not been restated. Patent costs in 2020 and 2019 were €27 million in each year.
Exchange losses within operating costs in 2021 are nil (2020: €45 million; 2019: €41 million).
Unilever Annual Report and Accounts 2021 123
FINA
NC
IAL STA
TEMEN
TS
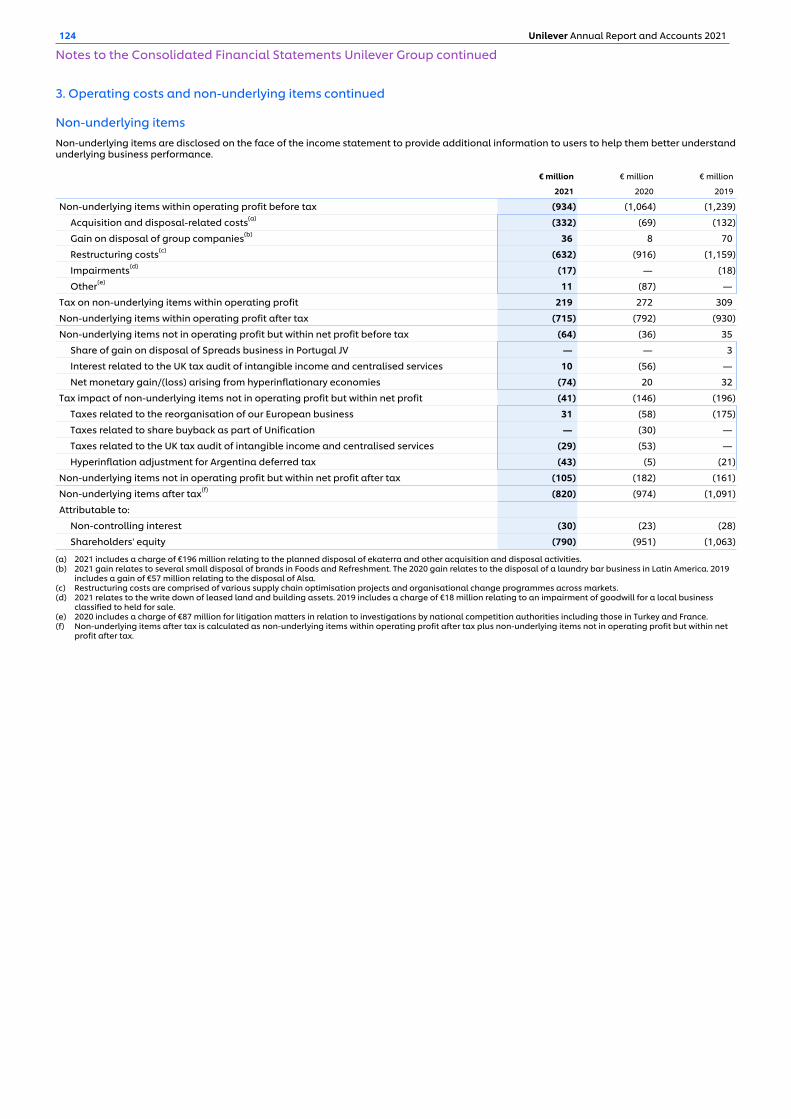
3. Operating costs and non-underlying items continued
Non-underlying items Non-underlying items are disclosed on the face of the income statement to provide additional information to users to help them better understand underlying business performance.
€ million € million € million
2021 2020 2019
Non-underlying items within operating profit before tax (934) (1,064) (1,239)
Acquisition and disposal-related costs(a) (332) (69) (132)
Gain on disposal of group companies(b) 36 8 70
Restructuring costs(c) (632) (916) (1,159)
Impairments(d) (17) — (18)
Other(e) 11 (87) —
Tax on non-underlying items within operating profit 219 272 309
Non-underlying items within operating profit after tax (715) (792) (930)
Non-underlying items not in operating profit but within net profit before tax (64) (36) 35
Share of gain on disposal of Spreads business in Portugal JV — — 3
Interest related to the UK tax audit of intangible income and centralised services 10 (56) —
Net monetary gain/(loss) arising from hyperinflationary economies (74) 20 32
Tax impact of non-underlying items not in operating profit but within net profit (41) (146) (196)
Taxes related to the reorganisation of our European business 31 (58) (175)
Taxes related to share buyback as part of Unification — (30) —
Taxes related to the UK tax audit of intangible income and centralised services (29) (53) —
Hyperinflation adjustment for Argentina deferred tax (43) (5) (21)
Non-underlying items not in operating profit but within net profit after tax (105) (182) (161)
Non-underlying items after tax(f) (820) (974) (1,091)
Attributable to:
Non-controlling interest (30) (23) (28)
Shareholders' equity (790) (951) (1,063)
(a) 2021 includes a charge of €196 million relating to the planned disposal of ekaterra and other acquisition and disposal activities. (b) 2021 gain relates to several small disposal of brands in Foods and Refreshment. The 2020 gain relates to the disposal of a laundry bar business in Latin America. 2019
includes a gain of €57 million relating to the disposal of Alsa. (c) Restructuring costs are comprised of various supply chain optimisation projects and organisational change programmes across markets. (d) 2021 relates to the write down of leased land and building assets. 2019 includes a charge of €18 million relating to an impairment of goodwill for a local business
classified to held for sale. (e) 2020 includes a charge of €87 million for litigation matters in relation to investigations by national competition authorities including those in Turkey and France.(f) Non-underlying items after tax is calculated as non-underlying items within operating profit after tax plus non-underlying items not in operating profit but within net
profit after tax.
124 Unilever Annual Report and Accounts 2021
Notes to the Consolidated Financial Statements Unilever Group continued
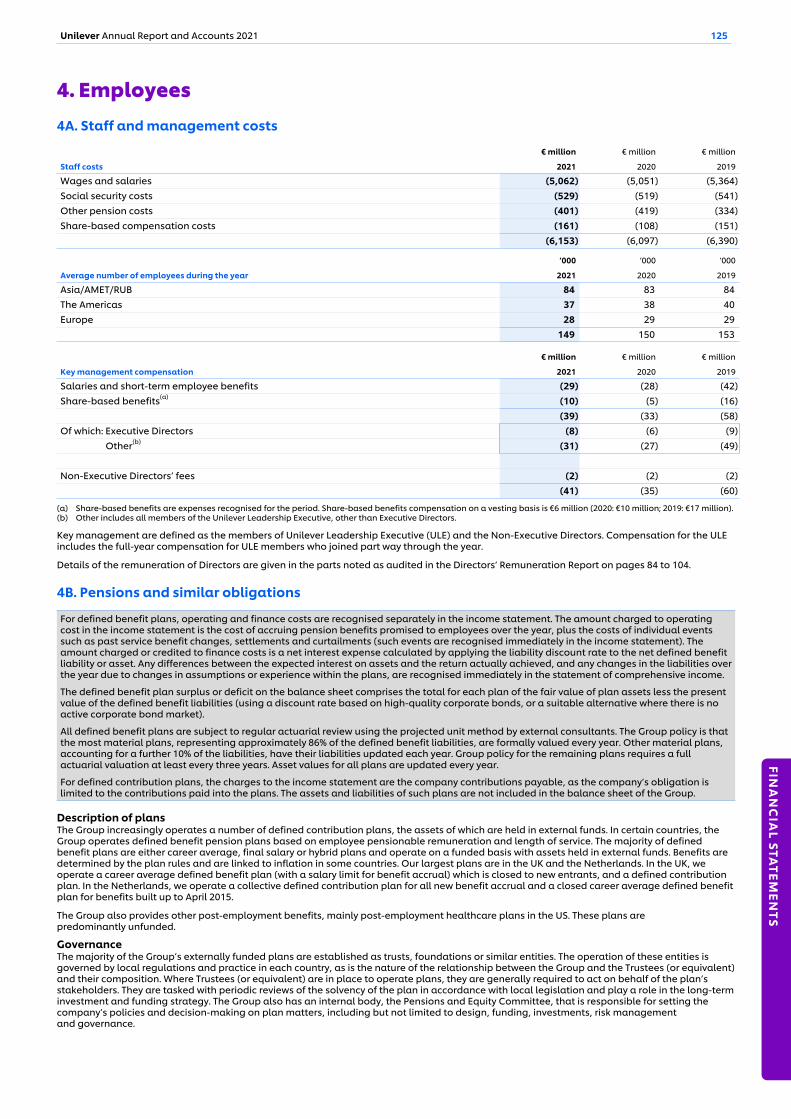
4. Employees4A. Staff and management costs
€ million € million € million
Staff costs 2021 2020 2019
Wages and salaries (5,062) (5,051) (5,364) Social security costs (529) (519) (541) Other pension costs (401) (419) (334) Share-based compensation costs (161) (108) (151)
(6,153) (6,097) (6,390)
‘000 ‘000 ‘000
Average number of employees during the year 2021 2020 2019
Asia/AMET/RUB 84 83 84 The Americas 37 38 40 Europe 28 29 29
149 150 153
€ million € million € million
Key management compensation 2021 2020 2019
Salaries and short-term employee benefits (29) (28) (42) Share-based benefits(a) (10) (5) (16)
(39) (33) (58) Of which: Executive Directors (8) (6) (9)
Other(b) (31) (27) (49)
Non-Executive Directors’ fees (2) (2) (2) (41) (35) (60)
(a) Share-based benefits are expenses recognised for the period. Share-based benefits compensation on a vesting basis is €6 million (2020: €10 million; 2019: €17 million). (b) Other includes all members of the Unilever Leadership Executive, other than Executive Directors.
Key management are defined as the members of Unilever Leadership Executive (ULE) and the Non-Executive Directors. Compensation for the ULE includes the full-year compensation for ULE members who joined part way through the year.
Details of the remuneration of Directors are given in the parts noted as audited in the Directors’ Remuneration Report on pages 84 to 104.
4B. Pensions and similar obligations
For defined benefit plans, operating and finance costs are recognised separately in the income statement. The amount charged to operating cost in the income statement is the cost of accruing pension benefits promised to employees over the year, plus the costs of individual events such as past service benefit changes, settlements and curtailments (such events are recognised immediately in the income statement). The amount charged or credited to finance costs is a net interest expense calculated by applying the liability discount rate to the net defined benefit liability or asset. Any differences between the expected interest on assets and the return actually achieved, and any changes in the liabilities over the year due to changes in assumptions or experience within the plans, are recognised immediately in the statement of comprehensive income.
The defined benefit plan surplus or deficit on the balance sheet comprises the total for each plan of the fair value of plan assets less the present value of the defined benefit liabilities (using a discount rate based on high-quality corporate bonds, or a suitable alternative where there is no active corporate bond market).
All defined benefit plans are subject to regular actuarial review using the projected unit method by external consultants. The Group policy is that the most material plans, representing approximately 86% of the defined benefit liabilities, are formally valued every year. Other material plans, accounting for a further 10% of the liabilities, have their liabilities updated each year. Group policy for the remaining plans requires a full actuarial valuation at least every three years. Asset values for all plans are updated every year.
For defined contribution plans, the charges to the income statement are the company contributions payable, as the company’s obligation is limited to the contributions paid into the plans. The assets and liabilities of such plans are not included in the balance sheet of the Group.
Description of plansThe Group increasingly operates a number of defined contribution plans, the assets of which are held in external funds. In certain countries, the Group operates defined benefit pension plans based on employee pensionable remuneration and length of service. The majority of defined benefit plans are either career average, final salary or hybrid plans and operate on a funded basis with assets held in external funds. Benefits are determined by the plan rules and are linked to inflation in some countries. Our largest plans are in the UK and the Netherlands. In the UK, we operate a career average defined benefit plan (with a salary limit for benefit accrual) which is closed to new entrants, and a defined contribution plan. In the Netherlands, we operate a collective defined contribution plan for all new benefit accrual and a closed career average defined benefit plan for benefits built up to April 2015.
The Group also provides other post-employment benefits, mainly post-employment healthcare plans in the US. These plans are predominantly unfunded.
GovernanceThe majority of the Group’s externally funded plans are established as trusts, foundations or similar entities. The operation of these entities is governed by local regulations and practice in each country, as is the nature of the relationship between the Group and the Trustees (or equivalent) and their composition. Where Trustees (or equivalent) are in place to operate plans, they are generally required to act on behalf of the plan’s stakeholders. They are tasked with periodic reviews of the solvency of the plan in accordance with local legislation and play a role in the long-term investment and funding strategy. The Group also has an internal body, the Pensions and Equity Committee, that is responsible for setting the company’s policies and decision-making on plan matters, including but not limited to design, funding, investments, risk management and governance.
Unilever Annual Report and Accounts 2021 125
FINA
NC
IAL STA
TEMEN
TS
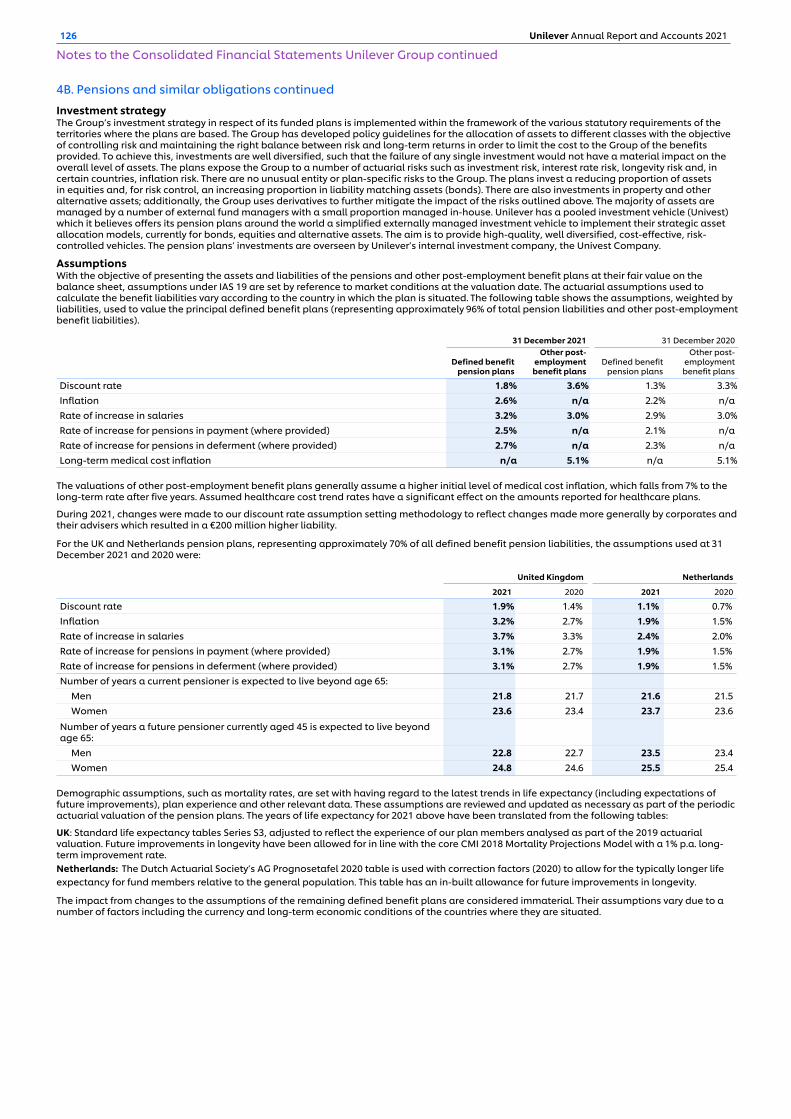
4B. Pensions and similar obligations continued
Investment strategyThe Group’s investment strategy in respect of its funded plans is implemented within the framework of the various statutory requirements of the territories where the plans are based. The Group has developed policy guidelines for the allocation of assets to different classes with the objective of controlling risk and maintaining the right balance between risk and long-term returns in order to limit the cost to the Group of the benefits provided. To achieve this, investments are well diversified, such that the failure of any single investment would not have a material impact on the overall level of assets. The plans expose the Group to a number of actuarial risks such as investment risk, interest rate risk, longevity risk and, in certain countries, inflation risk. There are no unusual entity or plan-specific risks to the Group. The plans invest a reducing proportion of assets in equities and, for risk control, an increasing proportion in liability matching assets (bonds). There are also investments in property and other alternative assets; additionally, the Group uses derivatives to further mitigate the impact of the risks outlined above. The majority of assets are managed by a number of external fund managers with a small proportion managed in-house. Unilever has a pooled investment vehicle (Univest) which it believes offers its pension plans around the world a simplified externally managed investment vehicle to implement their strategic asset allocation models, currently for bonds, equities and alternative assets. The aim is to provide high-quality, well diversified, cost-effective, risk-controlled vehicles. The pension plans’ investments are overseen by Unilever’s internal investment company, the Univest Company.
Assumptions With the objective of presenting the assets and liabilities of the pensions and other post-employment benefit plans at their fair value on the balance sheet, assumptions under IAS 19 are set by reference to market conditions at the valuation date. The actuarial assumptions used to calculate the benefit liabilities vary according to the country in which the plan is situated. The following table shows the assumptions, weighted by liabilities, used to value the principal defined benefit plans (representing approximately 96% of total pension liabilities and other post-employment benefit liabilities).
31 December 2021 31 December 2020
Defined benefitpension plans
Other post- employment
benefit plansDefined benefit
pension plans
Other post- employmentbenefit plans
Discount rate 1.8 % 3.6 % 1.3 % 3.3 %Inflation 2.6 % n/a 2.2 % n/aRate of increase in salaries 3.2 % 3.0 % 2.9 % 3.0 %Rate of increase for pensions in payment (where provided) 2.5 % n/a 2.1 % n/aRate of increase for pensions in deferment (where provided) 2.7 % n/a 2.3 % n/aLong-term medical cost inflation n/a 5.1 % n/a 5.1 %
The valuations of other post-employment benefit plans generally assume a higher initial level of medical cost inflation, which falls from 7% to the long-term rate after five years. Assumed healthcare cost trend rates have a significant effect on the amounts reported for healthcare plans.
During 2021, changes were made to our discount rate assumption setting methodology to reflect changes made more generally by corporates and their advisers which resulted in a €200 million higher liability.
For the UK and Netherlands pension plans, representing approximately 70% of all defined benefit pension liabilities, the assumptions used at 31 December 2021 and 2020 were:
United Kingdom Netherlands
2021 2020 2021 2020
Discount rate 1.9 % 1.4% 1.1% 0.7% Inflation 3.2 % 2.7% 1.9% 1.5% Rate of increase in salaries 3.7 % 3.3% 2.4% 2.0% Rate of increase for pensions in payment (where provided) 3.1 % 2.7% 1.9% 1.5% Rate of increase for pensions in deferment (where provided) 3.1 % 2.7% 1.9% 1.5% Number of years a current pensioner is expected to live beyond age 65:
Men 21.8 21.7 21.6 21.5Women 23.6 23.4 23.7 23.6
Number of years a future pensioner currently aged 45 is expected to live beyond age 65:
Men 22.8 22.7 23.5 23.4Women 24.8 24.6 25.5 25.4
Demographic assumptions, such as mortality rates, are set with having regard to the latest trends in life expectancy (including expectations of future improvements), plan experience and other relevant data. These assumptions are reviewed and updated as necessary as part of the periodic actuarial valuation of the pension plans. The years of life expectancy for 2021 above have been translated from the following tables:
UK: Standard life expectancy tables Series S3, adjusted to reflect the experience of our plan members analysed as part of the 2019 actuarial valuation. Future improvements in longevity have been allowed for in line with the core CMI 2018 Mortality Projections Model with a 1% p.a. long-term improvement rate.Netherlands: The Dutch Actuarial Society’s AG Prognosetafel 2020 table is used with correction factors (2020) to allow for the typically longer life expectancy for fund members relative to the general population. This table has an in-built allowance for future improvements in longevity.
The impact from changes to the assumptions of the remaining defined benefit plans are considered immaterial. Their assumptions vary due to a number of factors including the currency and long-term economic conditions of the countries where they are situated.
126 Unilever Annual Report and Accounts 2021
Notes to the Consolidated Financial Statements Unilever Group continued
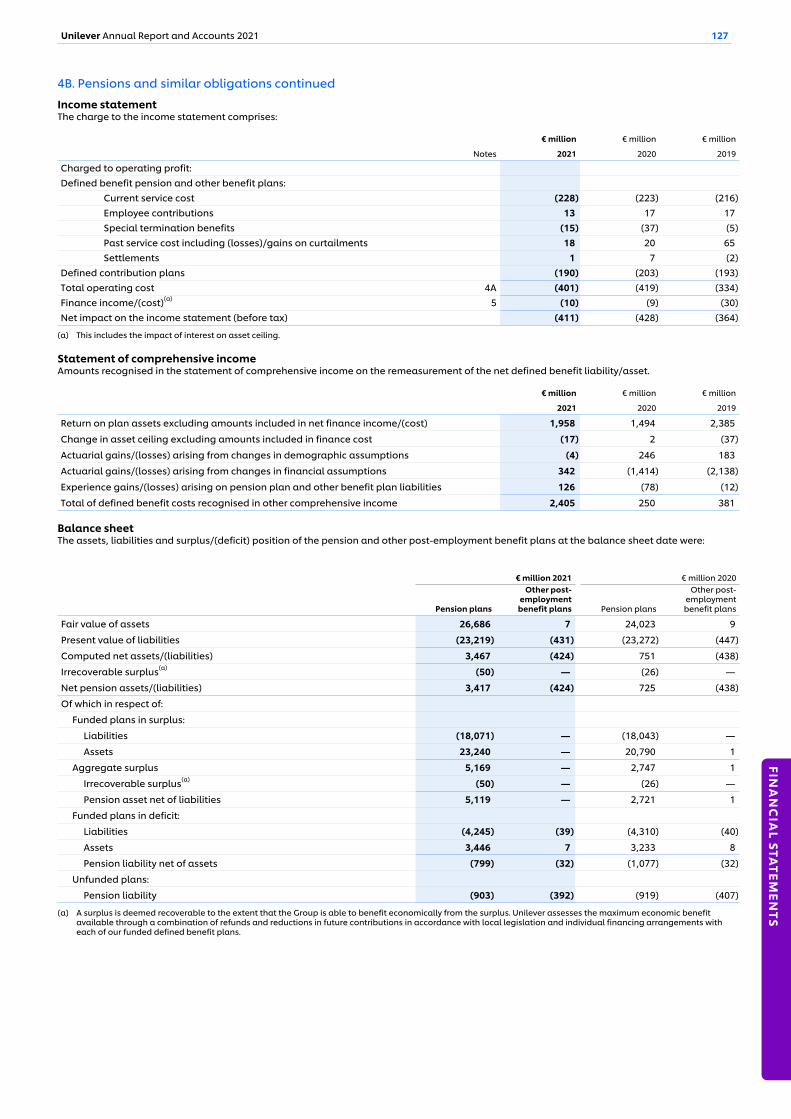
4B. Pensions and similar obligations continued
Income statementThe charge to the income statement comprises:
€ million € million € million
Notes 2021 2020 2019
Charged to operating profit:Defined benefit pension and other benefit plans:
Current service cost (228) (223) (216) Employee contributions 13 17 17 Special termination benefits (15) (37) (5) Past service cost including (losses)/gains on curtailments 18 20 65 Settlements 1 7 (2)
Defined contribution plans (190) (203) (193) Total operating cost 4A (401) (419) (334) Finance income/(cost)(a) 5 (10) (9) (30) Net impact on the income statement (before tax) (411) (428) (364)
(a) This includes the impact of interest on asset ceiling.
Statement of comprehensive incomeAmounts recognised in the statement of comprehensive income on the remeasurement of the net defined benefit liability/asset.
€ million € million € million
2021 2020 2019
Return on plan assets excluding amounts included in net finance income/(cost) 1,958 1,494 2,385
Change in asset ceiling excluding amounts included in finance cost (17) 2 (37)
Actuarial gains/(losses) arising from changes in demographic assumptions (4) 246 183
Actuarial gains/(losses) arising from changes in financial assumptions 342 (1,414) (2,138)
Experience gains/(losses) arising on pension plan and other benefit plan liabilities 126 (78) (12)
Total of defined benefit costs recognised in other comprehensive income 2,405 250 381
Balance sheetThe assets, liabilities and surplus/(deficit) position of the pension and other post-employment benefit plans at the balance sheet date were:
€ million 2021 € million 2020
Pension plans
Other post- employment
benefit plans Pension plans
Other post- employmentbenefit plans
Fair value of assets 26,686 7 24,023 9
Present value of liabilities (23,219) (431) (23,272) (447)
Computed net assets/(liabilities) 3,467 (424) 751 (438)
Irrecoverable surplus(a) (50) — (26) —
Net pension assets/(liabilities) 3,417 (424) 725 (438)
Of which in respect of:
Funded plans in surplus:
Liabilities (18,071) — (18,043) —
Assets 23,240 — 20,790 1
Aggregate surplus 5,169 — 2,747 1
Irrecoverable surplus(a) (50) — (26) —
Pension asset net of liabilities 5,119 — 2,721 1
Funded plans in deficit:
Liabilities (4,245) (39) (4,310) (40)
Assets 3,446 7 3,233 8
Pension liability net of assets (799) (32) (1,077) (32)
Unfunded plans:
Pension liability (903) (392) (919) (407)
(a) A surplus is deemed recoverable to the extent that the Group is able to benefit economically from the surplus. Unilever assesses the maximum economic benefit available through a combination of refunds and reductions in future contributions in accordance with local legislation and individual financing arrangements with each of our funded defined benefit plans.
Unilever Annual Report and Accounts 2021 127
FINA
NC
IAL STA
TEMEN
TS
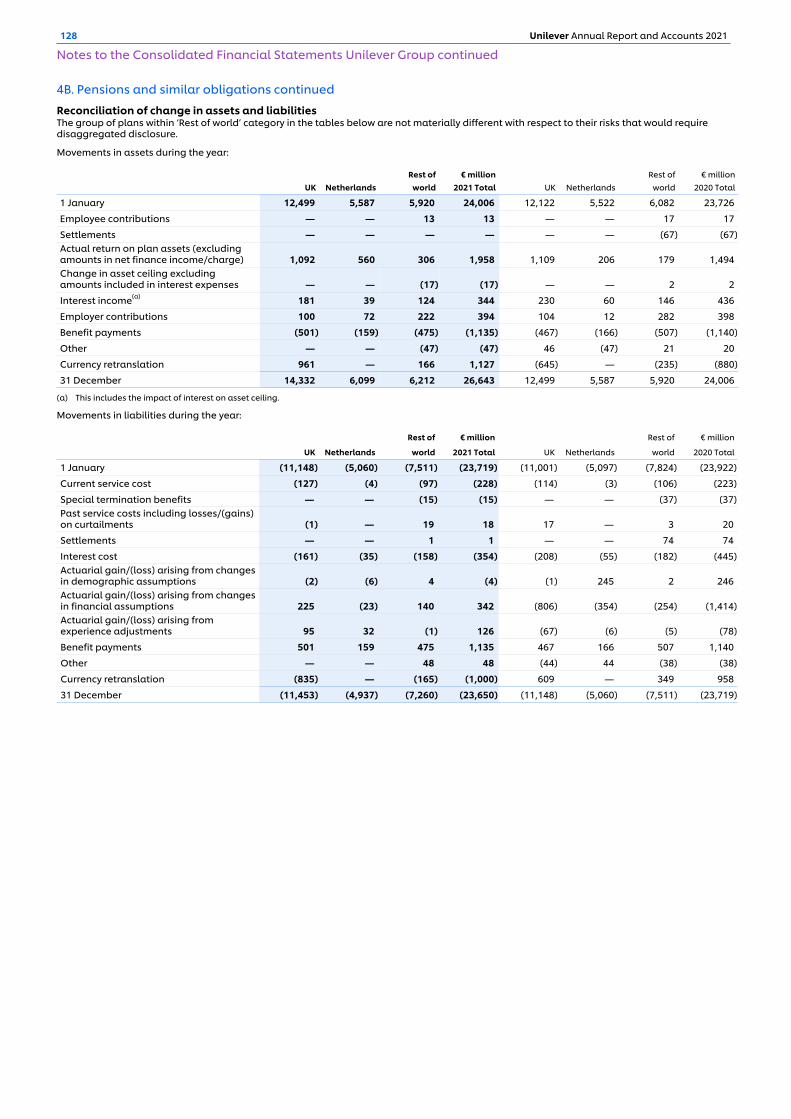
4B. Pensions and similar obligations continued
Reconciliation of change in assets and liabilities The group of plans within ‘Rest of world’ category in the tables below are not materially different with respect to their risks that would require disaggregated disclosure.
Movements in assets during the year:
Rest of € million Rest of € millionUK Netherlands world 2021 Total UK Netherlands world 2020 Total
1 January 12,499 5,587 5,920 24,006 12,122 5,522 6,082 23,726
Employee contributions — — 13 13 — — 17 17
Settlements — — — — — — (67) (67) Actual return on plan assets (excluding amounts in net finance income/charge) 1,092 560 306 1,958 1,109 206 179 1,494 Change in asset ceiling excluding amounts included in interest expenses — — (17) (17) — — 2 2
Interest income(a) 181 39 124 344 230 60 146 436
Employer contributions 100 72 222 394 104 12 282 398
Benefit payments (501) (159) (475) (1,135) (467) (166) (507) (1,140)
Other — — (47) (47) 46 (47) 21 20
Currency retranslation 961 — 166 1,127 (645) — (235) (880)
31 December 14,332 6,099 6,212 26,643 12,499 5,587 5,920 24,006
(a) This includes the impact of interest on asset ceiling.
Movements in liabilities during the year:
Rest of € million Rest of € million
UK Netherlands world 2021 Total UK Netherlands
world 2020 Total
1 January (11,148) (5,060) (7,511) (23,719) (11,001) (5,097) (7,824) (23,922)
Current service cost (127) (4) (97) (228) (114) (3) (106) (223)
Special termination benefits — — (15) (15) — — (37) (37) Past service costs including losses/(gains) on curtailments (1) — 19 18 17 — 3 20
Settlements — — 1 1 — — 74 74
Interest cost (161) (35) (158) (354) (208) (55) (182) (445) Actuarial gain/(loss) arising from changes in demographic assumptions (2) (6) 4 (4) (1) 245 2 246 Actuarial gain/(loss) arising from changes in financial assumptions 225 (23) 140 342 (806) (354) (254) (1,414) Actuarial gain/(loss) arising from experience adjustments 95 32 (1) 126 (67) (6) (5) (78)
Benefit payments 501 159 475 1,135 467 166 507 1,140
Other — — 48 48 (44) 44 (38) (38)
Currency retranslation (835) — (165) (1,000) 609 — 349 958
31 December (11,453) (4,937) (7,260) (23,650) (11,148) (5,060) (7,511) (23,719)
128 Unilever Annual Report and Accounts 2021
Notes to the Consolidated Financial Statements Unilever Group continued
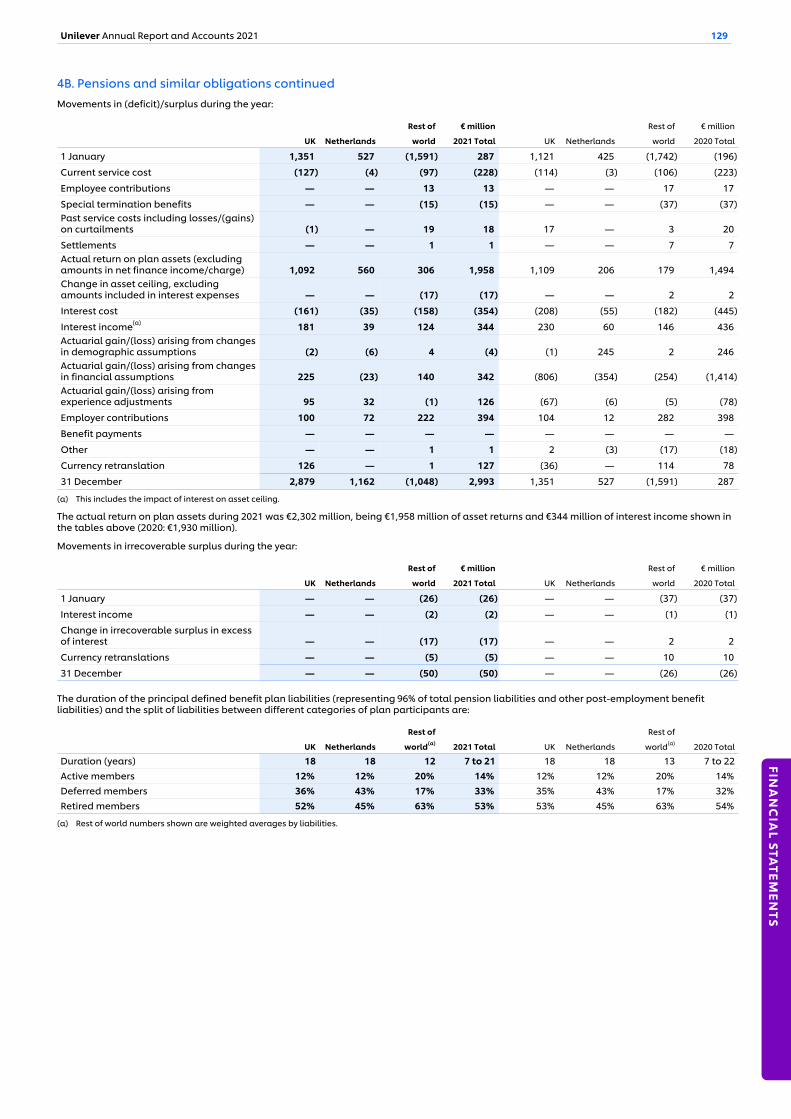
4B. Pensions and similar obligations continued Movements in (deficit)/surplus during the year:
Rest of € million Rest of € million
UK Netherlands world 2021 Total UK Netherlands world 2020 Total
1 January 1,351 527 (1,591) 287 1,121 425 (1,742) (196)
Current service cost (127) (4) (97) (228) (114) (3) (106) (223)
Employee contributions — — 13 13 — — 17 17
Special termination benefits — — (15) (15) — — (37) (37) Past service costs including losses/(gains) on curtailments (1) — 19 18 17 — 3 20
Settlements — — 1 1 — — 7 7 Actual return on plan assets (excluding amounts in net finance income/charge) 1,092 560 306 1,958 1,109 206 179 1,494 Change in asset ceiling, excluding amounts included in interest expenses — — (17) (17) — — 2 2
Interest cost (161) (35) (158) (354) (208) (55) (182) (445)
Interest income(a) 181 39 124 344 230 60 146 436 Actuarial gain/(loss) arising from changes in demographic assumptions (2) (6) 4 (4) (1) 245 2 246 Actuarial gain/(loss) arising from changes in financial assumptions 225 (23) 140 342 (806) (354) (254) (1,414) Actuarial gain/(loss) arising from experience adjustments 95 32 (1) 126 (67) (6) (5) (78)
Employer contributions 100 72 222 394 104 12 282 398
Benefit payments — — — — — — — —
Other — — 1 1 2 (3) (17) (18)
Currency retranslation 126 — 1 127 (36) — 114 78
31 December 2,879 1,162 (1,048) 2,993 1,351 527 (1,591) 287
(a) This includes the impact of interest on asset ceiling.
The actual return on plan assets during 2021 was €2,302 million, being €1,958 million of asset returns and €344 million of interest income shown in the tables above (2020: €1,930 million).
Movements in irrecoverable surplus during the year:
Rest of € million Rest of € million
UK Netherlands world 2021 Total UK Netherlands world 2020 Total
1 January — — (26) (26) — — (37) (37)
Interest income — — (2) (2) — — (1) (1)
Change in irrecoverable surplus in excess of interest — — (17) (17) — — 2 2
Currency retranslations — — (5) (5) — — 10 10
31 December — — (50) (50) — — (26) (26)
The duration of the principal defined benefit plan liabilities (representing 96% of total pension liabilities and other post-employment benefit liabilities) and the split of liabilities between different categories of plan participants are:
Rest of Rest of
UK Netherlands world(a) 2021 Total UK Netherlands world(a) 2020 Total
Duration (years) 18 18 12 7 to 21 18 18 13 7 to 22Active members 12% 12% 20% 14% 12% 12% 20% 14% Deferred members 36% 43% 17% 33% 35% 43% 17% 32% Retired members 52% 45% 63% 53% 53% 45% 63% 54%
(a) Rest of world numbers shown are weighted averages by liabilities.
Unilever Annual Report and Accounts 2021 129
FINA
NC
IAL STA
TEMEN
TS

4B. Pensions and similar obligations continued
Plan assetsThe group of plans within ‘Rest of world’ category in the tables below are not materially different with respect to their risks that would require disaggregated disclosure.
The fair value of plan assets, which are reported net of fund liabilities that are not employee benefits, at the end of the reporting period for each category are as follows:
€ million € million
31 December 2021 31 December 2020
UK NetherlandsRest of
world 2021 Total UK NetherlandsRest of
world 2020 Total
Total Assets 14,332 6,099 6,255 26,686 12,499 5,587 5,937 24,023
Assets
Equities Total 1,714 1,676 1,835 5,225 4,653 1,837 1,694 8,184
- Europe 352 271 569 1,192 921 437 506 1,864
- North America 1,030 1,001 829 2,860 2,740 894 747 4,381
- Other 332 404 437 1,173 992 506 441 1,939
Fixed Income Total 8,875 3,353 3,176 15,404 5,819 2,766 3,108 11,693
- Government bonds 6,243 1,179 1,396 8,818 3,292 798 1,367 5,457
- Investment grade corporate bonds 1,160 537 1,109 2,806 1,167 540 1,111 2,818
- Other Fixed Income 1,472 1,637 671 3,780 1,360 1,428 630 3,418
Private Equity 424 77 17 518 274 64 9 347
Property and Real Estate 1,021 517 356 1,894 835 456 332 1,623
Hedge Funds 381 — 75 456 318 — 62 380
Other 1,823 322 359 2,504 470 320 377 1,167
Other Plans — — 421 421 — — 370 370
Assets/Fund (Liabilities) that are not employee benefits
Derivatives 94 154 16 264 130 144 (15) 259
The fair values of the above equity and fixed income instruments are determined based on quoted market prices in active markets. The fair value of private equity, properties, derivatives and hedge funds are not based on quoted market prices in active markets. The Group uses derivatives and other instruments to hedge some of its exposure to inflation and interest rate risk – the degree of this hedging of liabilities was 100% for both interest rate and inflation for the UK plan and 35% for interest rate and 19% for inflation for the Netherlands plan. Foreign currency exposures, in part, are also hedged by the use of forward foreign exchange contracts. Assets included in the Other category are cash and insurance contracts which are also unquoted assets.
Equity securities include Unilever securities amounting to €1 million (0.002% of total plan assets) and €9 million (0.04% of total plan assets) at 31 December 2021 and 2020 respectively. Property includes property occupied by Unilever amounting to €74 million and €29 million at 31 December 2021 and 2020 respectively.
The pension assets above exclude the assets in a Special Benefits Trust amounting to €38 million (2020: €44 million) to fund pension and similar obligations in the US (see also note 17A on page 157).
Sensitivities The sensitivity of the overall pension liabilities to changes in the weighted key assumptions are:
Change in liabilities
Change in assumption UK Netherlands Total
Discount rate Increase by 0.5% -8 % -8 % -8 %
Inflation rate Increase by 0.5% 7 % 9 % 6 %
Life expectancy Increase by 1 year 6 % 5 % 5 %
Long-term medical cost inflation(a) Increase by 1.0% 0 % 0 % 3 %
(a) Long-term medical cost inflation only relates to post-retirement medical plans and its impact on these liabilities.
An equivalent decrease in each assumption would have an equal and opposite impact on liabilities.
The sensitivity analyses above have been determined based on reasonably possible changes of the respective assumptions occurring at the end of the reporting period and may not be representative of the actual change. It is based on a change in the key assumption while holding all other assumptions constant. When calculating the sensitivity to the assumption, the same method used to calculate the liability recognised in the balance sheet has been applied. The methods and types of assumptions used in preparing the sensitivity analysis did not change compared with the previous period.
130 Unilever Annual Report and Accounts 2021
Notes to the Consolidated Financial Statements Unilever Group continued
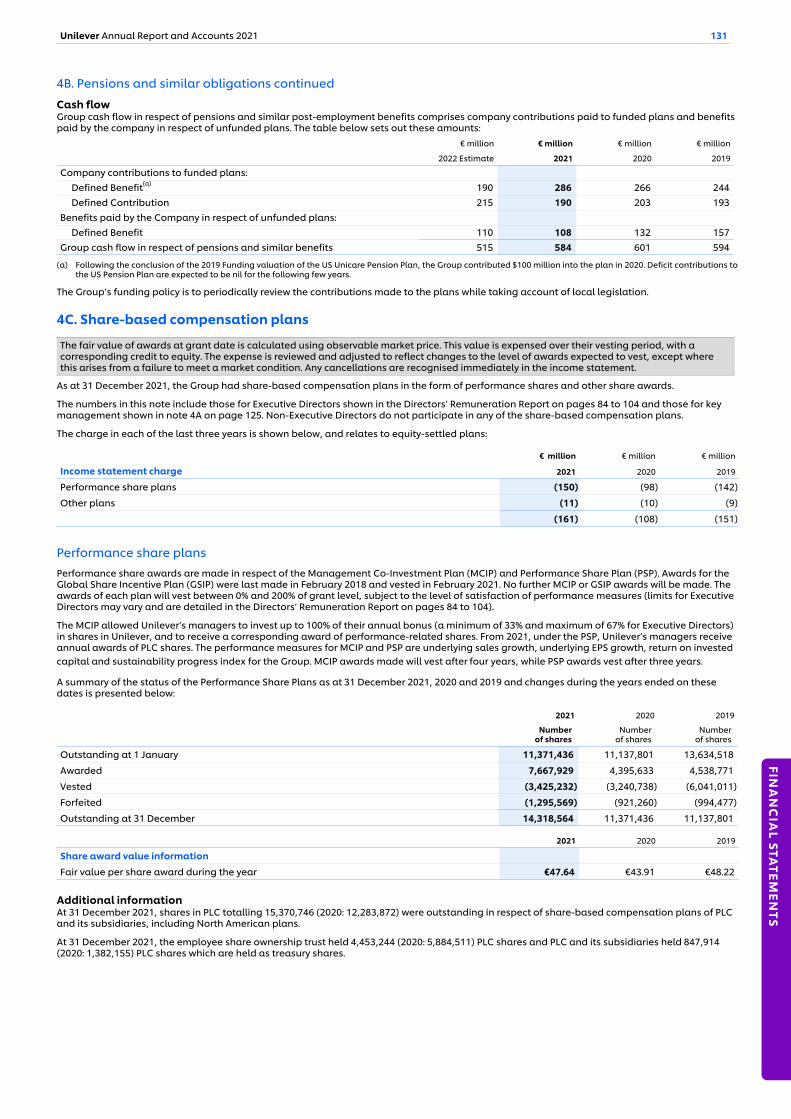
4B. Pensions and similar obligations continued
Cash flow Group cash flow in respect of pensions and similar post-employment benefits comprises company contributions paid to funded plans and benefits paid by the company in respect of unfunded plans. The table below sets out these amounts:
€ million € million € million € million
2022 Estimate 2021 2020 2019
Company contributions to funded plans: Defined Benefit(a) 190 286 266 244
Defined Contribution 215 190 203 193 Benefits paid by the Company in respect of unfunded plans:
Defined Benefit 110 108 132 157 Group cash flow in respect of pensions and similar benefits 515 584 601 594
(a) Following the conclusion of the 2019 Funding valuation of the US Unicare Pension Plan, the Group contributed $100 million into the plan in 2020. Deficit contributions to the US Pension Plan are expected to be nil for the following few years.
The Group’s funding policy is to periodically review the contributions made to the plans while taking account of local legislation.
4C. Share-based compensation plans
The fair value of awards at grant date is calculated using observable market price. This value is expensed over their vesting period, with a corresponding credit to equity. The expense is reviewed and adjusted to reflect changes to the level of awards expected to vest, except where this arises from a failure to meet a market condition. Any cancellations are recognised immediately in the income statement.
As at 31 December 2021, the Group had share-based compensation plans in the form of performance shares and other share awards.
The numbers in this note include those for Executive Directors shown in the Directors’ Remuneration Report on pages 84 to 104 and those for key management shown in note 4A on page 125. Non-Executive Directors do not participate in any of the share-based compensation plans.
The charge in each of the last three years is shown below, and relates to equity-settled plans:
€ million € million € million
Income statement charge 2021 2020 2019
Performance share plans (150) (98) (142)
Other plans (11) (10) (9)
(161) (108) (151)
Performance share plans Performance share awards are made in respect of the Management Co-Investment Plan (MCIP) and Performance Share Plan (PSP). Awards for the Global Share Incentive Plan (GSIP) were last made in February 2018 and vested in February 2021. No further MCIP or GSIP awards will be made. The awards of each plan will vest between 0% and 200% of grant level, subject to the level of satisfaction of performance measures (limits for Executive Directors may vary and are detailed in the Directors’ Remuneration Report on pages 84 to 104).
The MCIP allowed Unilever’s managers to invest up to 100% of their annual bonus (a minimum of 33% and maximum of 67% for Executive Directors) in shares in Unilever, and to receive a corresponding award of performance-related shares. From 2021, under the PSP, Unilever’s managers receive annual awards of PLC shares. The performance measures for MCIP and PSP are underlying sales growth, underlying EPS growth, return on invested capital and sustainability progress index for the Group. MCIP awards made will vest after four years, while PSP awards vest after three years. A summary of the status of the Performance Share Plans as at 31 December 2021, 2020 and 2019 and changes during the years ended on these dates is presented below:
2021 2020 2019
Numberof shares
Numberof shares
Numberof shares
Outstanding at 1 January 11,371,436 11,137,801 13,634,518
Awarded 7,667,929 4,395,633 4,538,771
Vested (3,425,232) (3,240,738) (6,041,011)
Forfeited (1,295,569) (921,260) (994,477)
Outstanding at 31 December 14,318,564 11,371,436 11,137,801
2021 2020 2019
Share award value information
Fair value per share award during the year €47.64 €43.91 €48.22
Additional informationAt 31 December 2021, shares in PLC totalling 15,370,746 (2020: 12,283,872) were outstanding in respect of share-based compensation plans of PLC and its subsidiaries, including North American plans.
At 31 December 2021, the employee share ownership trust held 4,453,244 (2020: 5,884,511) PLC shares and PLC and its subsidiaries held 847,914 (2020: 1,382,155) PLC shares which are held as treasury shares.
Unilever Annual Report and Accounts 2021 131
FINA
NC
IAL STA
TEMEN
TS

4C. Share-based compensation plans continuedThe book value of €388 million (2020: €483 million) of the shares held by the trust and by Unilever PLC and its subsidiaries in respect of share-based compensation plans is eliminated on consolidation by deduction from other reserves. Their market value at 31 December 2021 was €250 million (2020: €357 million).
Shares held to satisfy awards are accounted for in accordance with IAS 32 ‘Financial Instruments: Presentation’. All differences between the purchase price of the shares held to satisfy awards granted and the proceeds received for the shares, whether on exercise or lapse, are charged to reserves.
Between 31 December 2021 and 24 February 2022 (the latest practicable date for inclusion in this report), nil shares were granted, 2,567,252 shares vested and 211,164 shares were forfeited related to the Performance Share Plans.
5. Net finance costsNet finance costs are comprised of finance costs and finance income, including net finance costs in relation to pensions and similar obligations.
Finance income includes income on cash and cash equivalents and income on other financial assets. Finance costs include interest costs in relation to financial liabilities. This includes interest on lease liabilities which represents the unwind of the discount rate applied to lease liabilities.
Borrowing costs are recognised based on the effective interest method.
€ million € million € million
Net finance costs Notes 2021 2020 2019
Finance costs (501) (672) (821)
Bank loans and overdrafts (34) (32) (46)
Interest on bonds and other loans(a) (402) (533) (617)
Interest on lease liabilities (72) (82) (100) Net gain/(loss) on transactions for which hedge accounting is not applied(b) 7 (25) (58)
On foreign exchange derivatives (68) 275 (321)
Exchange difference on underlying items 75 (300) 263
Finance income(c) 147 232 224
Pensions and similar obligations 4B (10) (9) (30)
Net finance costs before non-underlying items(d) (364) (449) (627)
Interest related to the UK tax audit of intangible income and centralised services 3 10 (56) —
(354) (505) (627)
(a) Interest on bonds and other loans includes the impact of interest rate derivatives that are part of hedge accounting relationships and the related recycling of results from the hedge accounting reserve. Includes an amount of €(19) million (2020: €(21) million) relating to unwinding of discount on deferred consideration for acquisitions.
(b) For further details of derivatives for which hedge accounting is not applied, please refer to note 16C.(c) Includes an amount of €8 million (2020: €90 million) that relates to interest on tax settlement in Brazil and €7 million (2020: €27 million) related to interest on corporate
income tax refund in India. (d) See note 3 for explanation of non-underlying items.
132 Unilever Annual Report and Accounts 2021
Notes to the Consolidated Financial Statements Unilever Group continued

6. Taxation6A. Income taxIncome tax on the profit for the year comprises current and deferred tax. Income tax is recognised in the income statement except to the extent that it relates to items recognised directly in equity.
Current tax is the expected tax payable on the taxable income for the year, using tax rates enacted or substantively enacted at the balance sheet date, and any adjustments to tax payable in respect of previous years.
Current tax in the consolidated income statement will differ from the income tax paid in the consolidated cash flow statement primarily because of deferred tax arising on temporary differences and payment dates for income tax occurring after the balance sheet date.
Unilever is subject to taxation in the many countries in which it operates. The tax legislation of these countries differs, is often complex and is subject to interpretation by management and the government authorities. These matters of judgement give rise to the need to create provisions for tax payments that may arise in future years with respect to transactions already undertaken. Provisions are made against individual exposures and take into account the specific circumstances of each case, including the strength of technical arguments, recent case law decisions or rulings on similar issues and relevant external advice. The provision is estimated based on one of two methods, the expected value method (the sum of the probability weighted amounts in a range of possible outcomes) or the single most likely amount method, depending on which is expected to better predict the resolution of the uncertainty.
€ million € million € million
Tax charge in income statement 2021 2020 2019
Current tax
Current year (2,399) (2,128) (2,098)
Over/(under) provided in prior years 245 (154) 119
(2,154) (2,282) (1,979)
Deferred tax
Origination and reversal of temporary differences 189 344 (255)
Changes in tax rates 15 (19) (59)
Recognition of previously unrecognised losses brought forward 15 34 30
219 359 (284)
(1,935) (1,923) (2,263)
The reconciliation between the computed weighted average rate of income tax expense, which is generally applicable to Unilever companies, and the actual rate of taxation charged is as follows:
Reconciliation of effective tax rate % 2021 % 2020 % 2019
Computed rate of tax(a) 24 23 24
Differences between computed rate of tax and effective tax rate due to:
Incentive tax credits (2) (2) (2)
Withholding tax on dividends 2 2 3
Expenses not deductible for tax purposes 1 1 1
Irrecoverable withholding tax 1 1 1
Income tax reserve adjustments – current and prior year (1) (1) —
Transfer to/(from) unrecognised deferred tax assets — — (2)
Others (2) (1) 1
Underlying effective tax rate 23 23 26
Taxes related to the UK tax audit of intangible income and centralised services(b) — 1 —
Taxes related to the reorganisation of our European business(b) (1) 1 2
Hyperinflation adjustment for Argentina deferred tax(b) 1 — —
Effective tax rate 23 25 28
(a) The computed tax rate used is the average of the standard rate of tax applicable in the countries in which Unilever operates, weighted by the amount of underlying profit before taxation generated in each of those countries. For this reason, the rate may vary from year to year according to the mix of profit and related tax rates.
(b) See note 3 for explanation of non-underlying items.
Our tax rate is reduced by incentive tax credits, the benefit from preferential tax regimes that have been legislated by the countries and provinces concerned in order to promote economic development and investment. The tax rate is increased by business expenses which are not deductible for tax, such as entertainment costs and some interest expense and by irrecoverable withholding taxes on dividends paid by subsidiary companies and on other cross-border payments such as royalties and service fees, which cannot be offset against other taxes due. Uncertain tax provisions including the related interest and penalties amounted to €858 million (2020: €879 million). In 2020, a provision of €186 million was established in respect of the tax amortisation of intangible assets, including goodwill, related to Horlicks in India. In 2021, the law was changed to exclude goodwill from the definition of tax depreciable assets effective 1 April 2020. We are therefore now only providing for the amortisation of other intangibles, and our expectation is that we will continue to provide for this until the matter is resolved.
The Group's future tax charge and effective tax rate could be affected by several factors, including changes in tax laws and their interpretation, the implementation of the OECD Pillars 1 and 2, EU and US tax changes, as well as the impact of acquisitions, disposals and restructuring of our business.
Unilever Annual Report and Accounts 2021 133
FINA
NC
IAL STA
TEMEN
TS
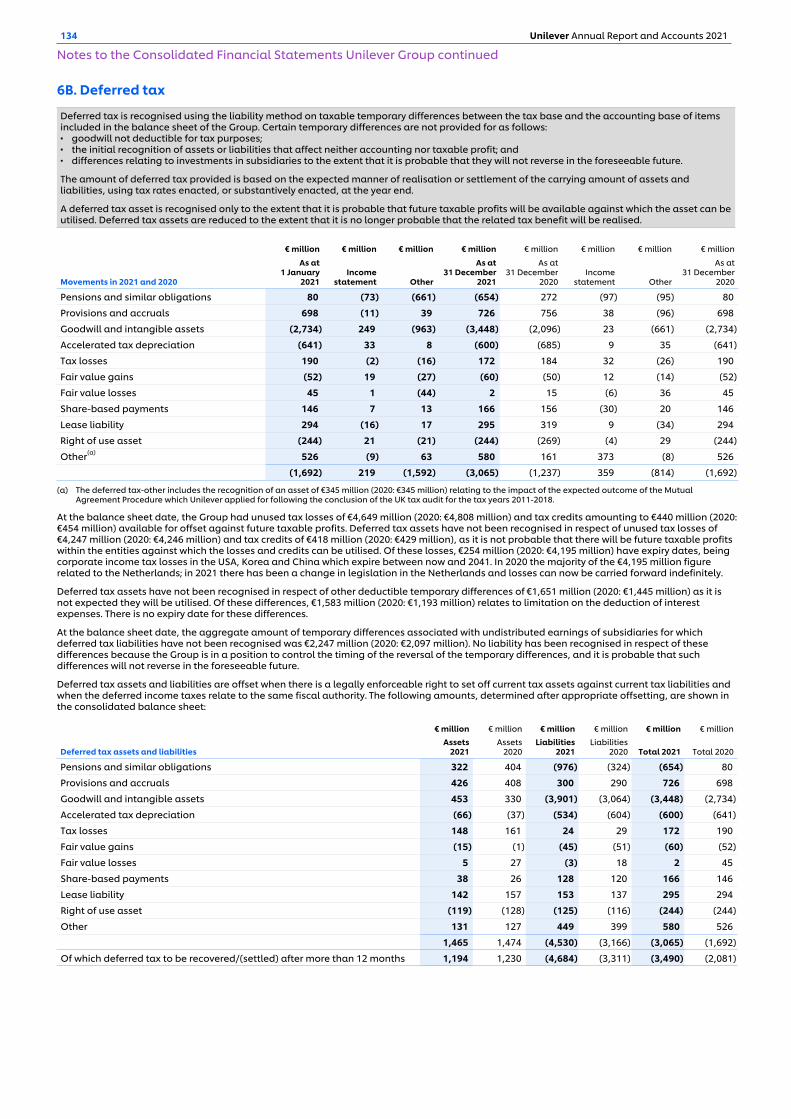
6B. Deferred tax
Deferred tax is recognised using the liability method on taxable temporary differences between the tax base and the accounting base of items included in the balance sheet of the Group. Certain temporary differences are not provided for as follows:▪ goodwill not deductible for tax purposes;▪ the initial recognition of assets or liabilities that affect neither accounting nor taxable profit; and▪ differences relating to investments in subsidiaries to the extent that it is probable that they will not reverse in the foreseeable future.
The amount of deferred tax provided is based on the expected manner of realisation or settlement of the carrying amount of assets and liabilities, using tax rates enacted, or substantively enacted, at the year end.
A deferred tax asset is recognised only to the extent that it is probable that future taxable profits will be available against which the asset can be utilised. Deferred tax assets are reduced to the extent that it is no longer probable that the related tax benefit will be realised.
€ million € million € million € million € million € million € million € million
Movements in 2021 and 2020
As at 1 January
2021Income
statement Other
As at 31 December
2021
As at 31 December
2020Income
statement Other
As at 31 December
2020
Pensions and similar obligations 80 (73) (661) (654) 272 (97) (95) 80
Provisions and accruals 698 (11) 39 726 756 38 (96) 698
Goodwill and intangible assets (2,734) 249 (963) (3,448) (2,096) 23 (661) (2,734)
Accelerated tax depreciation (641) 33 8 (600) (685) 9 35 (641)
Tax losses 190 (2) (16) 172 184 32 (26) 190
Fair value gains (52) 19 (27) (60) (50) 12 (14) (52)
Fair value losses 45 1 (44) 2 15 (6) 36 45
Share-based payments 146 7 13 166 156 (30) 20 146
Lease liability 294 (16) 17 295 319 9 (34) 294
Right of use asset (244) 21 (21) (244) (269) (4) 29 (244)
Other(a) 526 (9) 63 580 161 373 (8) 526
(1,692) 219 (1,592) (3,065) (1,237) 359 (814) (1,692)
(a) The deferred tax-other includes the recognition of an asset of €345 million (2020: €345 million) relating to the impact of the expected outcome of the Mutual Agreement Procedure which Unilever applied for following the conclusion of the UK tax audit for the tax years 2011-2018.
At the balance sheet date, the Group had unused tax losses of €4,649 million (2020: €4,808 million) and tax credits amounting to €440 million (2020: €454 million) available for offset against future taxable profits. Deferred tax assets have not been recognised in respect of unused tax losses of €4,247 million (2020: €4,246 million) and tax credits of €418 million (2020: €429 million), as it is not probable that there will be future taxable profits within the entities against which the losses and credits can be utilised. Of these losses, €254 million (2020: €4,195 million) have expiry dates, being corporate income tax losses in the USA, Korea and China which expire between now and 2041. In 2020 the majority of the €4,195 million figure related to the Netherlands; in 2021 there has been a change in legislation in the Netherlands and losses can now be carried forward indefinitely.
Deferred tax assets have not been recognised in respect of other deductible temporary differences of €1,651 million (2020: €1,445 million) as it is not expected they will be utilised. Of these differences, €1,583 million (2020: €1,193 million) relates to limitation on the deduction of interest expenses. There is no expiry date for these differences.
At the balance sheet date, the aggregate amount of temporary differences associated with undistributed earnings of subsidiaries for which deferred tax liabilities have not been recognised was €2,247 million (2020: €2,097 million). No liability has been recognised in respect of these differences because the Group is in a position to control the timing of the reversal of the temporary differences, and it is probable that such differences will not reverse in the foreseeable future.
Deferred tax assets and liabilities are offset when there is a legally enforceable right to set off current tax assets against current tax liabilities and when the deferred income taxes relate to the same fiscal authority. The following amounts, determined after appropriate offsetting, are shown in the consolidated balance sheet:
€ million € million € million € million € million € million
Deferred tax assets and liabilitiesAssets
2021Assets
2020Liabilities
2021Liabilities
2020 Total 2021 Total 2020
Pensions and similar obligations 322 404 (976) (324) (654) 80
Provisions and accruals 426 408 300 290 726 698
Goodwill and intangible assets 453 330 (3,901) (3,064) (3,448) (2,734)
Accelerated tax depreciation (66) (37) (534) (604) (600) (641)
Tax losses 148 161 24 29 172 190
Fair value gains (15) (1) (45) (51) (60) (52)
Fair value losses 5 27 (3) 18 2 45
Share-based payments 38 26 128 120 166 146
Lease liability 142 157 153 137 295 294
Right of use asset (119) (128) (125) (116) (244) (244)
Other 131 127 449 399 580 526
1,465 1,474 (4,530) (3,166) (3,065) (1,692)
Of which deferred tax to be recovered/(settled) after more than 12 months 1,194 1,230 (4,684) (3,311) (3,490) (2,081)
134 Unilever Annual Report and Accounts 2021
Notes to the Consolidated Financial Statements Unilever Group continued
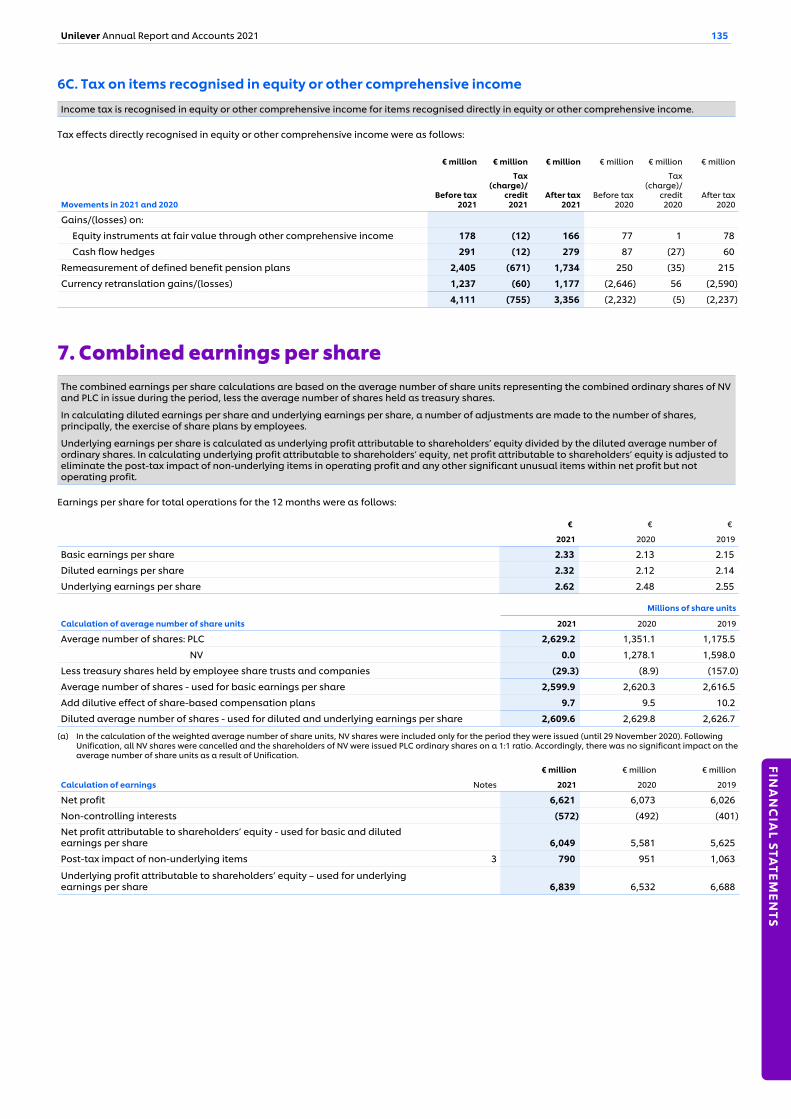
6C. Tax on items recognised in equity or other comprehensive income
Income tax is recognised in equity or other comprehensive income for items recognised directly in equity or other comprehensive income.
Tax effects directly recognised in equity or other comprehensive income were as follows:
€ million € million € million € million € million € million
Movements in 2021 and 2020Before tax
2021
Tax (charge)/
credit 2021
After tax 2021
Before tax 2020
Tax (charge)/
credit 2020
After tax 2020
Gains/(losses) on:
Equity instruments at fair value through other comprehensive income 178 (12) 166 77 1 78
Cash flow hedges 291 (12) 279 87 (27) 60
Remeasurement of defined benefit pension plans 2,405 (671) 1,734 250 (35) 215
Currency retranslation gains/(losses) 1,237 (60) 1,177 (2,646) 56 (2,590)
4,111 (755) 3,356 (2,232) (5) (2,237)
7. Combined earnings per shareThe combined earnings per share calculations are based on the average number of share units representing the combined ordinary shares of NV and PLC in issue during the period, less the average number of shares held as treasury shares.
In calculating diluted earnings per share and underlying earnings per share, a number of adjustments are made to the number of shares, principally, the exercise of share plans by employees.
Underlying earnings per share is calculated as underlying profit attributable to shareholders’ equity divided by the diluted average number of ordinary shares. In calculating underlying profit attributable to shareholders’ equity, net profit attributable to shareholders’ equity is adjusted to eliminate the post-tax impact of non-underlying items in operating profit and any other significant unusual items within net profit but not operating profit.
Earnings per share for total operations for the 12 months were as follows:
€ € €
2021 2020 2019
Basic earnings per share 2.33 2.13 2.15
Diluted earnings per share 2.32 2.12 2.14
Underlying earnings per share 2.62 2.48 2.55
Millions of share units
Calculation of average number of share units 2021 2020 2019
Average number of shares: PLC 2,629.2 1,351.1 1,175.5
NV 0.0 1,278.1 1,598.0
Less treasury shares held by employee share trusts and companies (29.3) (8.9) (157.0)
Average number of shares - used for basic earnings per share 2,599.9 2,620.3 2,616.5
Add dilutive effect of share-based compensation plans 9.7 9.5 10.2
Diluted average number of shares - used for diluted and underlying earnings per share 2,609.6 2,629.8 2,626.7
(a) In the calculation of the weighted average number of share units, NV shares were included only for the period they were issued (until 29 November 2020). Following Unification, all NV shares were cancelled and the shareholders of NV were issued PLC ordinary shares on a 1:1 ratio. Accordingly, there was no significant impact on the average number of share units as a result of Unification.
€ million € million € million
Calculation of earnings Notes 2021 2020 2019
Net profit 6,621 6,073 6,026
Non-controlling interests (572) (492) (401)
Net profit attributable to shareholders’ equity - used for basic and diluted earnings per share 6,049 5,581 5,625
Post-tax impact of non-underlying items 3 790 951 1,063
Underlying profit attributable to shareholders’ equity – used for underlying earnings per share 6,839 6,532 6,688
Unilever Annual Report and Accounts 2021 135
FINA
NC
IAL STA
TEMEN
TS
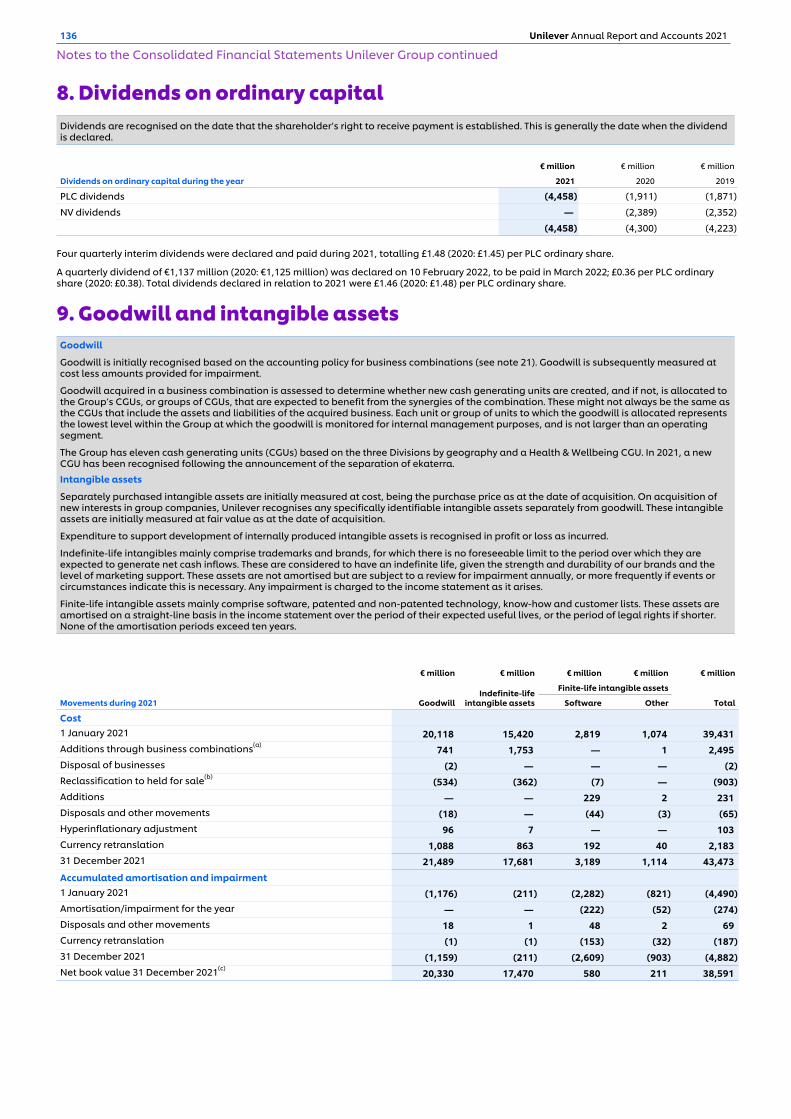
8. Dividends on ordinary capitalDividends are recognised on the date that the shareholder’s right to receive payment is established. This is generally the date when the dividend is declared.
€ million € million € million
Dividends on ordinary capital during the year 2021 2020 2019
PLC dividends (4,458) (1,911) (1,871)
NV dividends — (2,389) (2,352)
(4,458) (4,300) (4,223)
Four quarterly interim dividends were declared and paid during 2021, totalling £1.48 (2020: £1.45) per PLC ordinary share.
A quarterly dividend of €1,137 million (2020: €1,125 million) was declared on 10 February 2022, to be paid in March 2022; £0.36 per PLC ordinary share (2020: £0.38). Total dividends declared in relation to 2021 were £1.46 (2020: £1.48) per PLC ordinary share.
9. Goodwill and intangible assetsGoodwill
Goodwill is initially recognised based on the accounting policy for business combinations (see note 21). Goodwill is subsequently measured at cost less amounts provided for impairment.
Goodwill acquired in a business combination is assessed to determine whether new cash generating units are created, and if not, is allocated to the Group’s CGUs, or groups of CGUs, that are expected to benefit from the synergies of the combination. These might not always be the same as the CGUs that include the assets and liabilities of the acquired business. Each unit or group of units to which the goodwill is allocated represents the lowest level within the Group at which the goodwill is monitored for internal management purposes, and is not larger than an operating segment.
The Group has eleven cash generating units (CGUs) based on the three Divisions by geography and a Health & Wellbeing CGU. In 2021, a new CGU has been recognised following the announcement of the separation of ekaterra.
Intangible assets
Separately purchased intangible assets are initially measured at cost, being the purchase price as at the date of acquisition. On acquisition of new interests in group companies, Unilever recognises any specifically identifiable intangible assets separately from goodwill. These intangible assets are initially measured at fair value as at the date of acquisition.
Expenditure to support development of internally produced intangible assets is recognised in profit or loss as incurred.
Indefinite-life intangibles mainly comprise trademarks and brands, for which there is no foreseeable limit to the period over which they are expected to generate net cash inflows. These are considered to have an indefinite life, given the strength and durability of our brands and the level of marketing support. These assets are not amortised but are subject to a review for impairment annually, or more frequently if events or circumstances indicate this is necessary. Any impairment is charged to the income statement as it arises.
Finite-life intangible assets mainly comprise software, patented and non-patented technology, know-how and customer lists. These assets are amortised on a straight-line basis in the income statement over the period of their expected useful lives, or the period of legal rights if shorter. None of the amortisation periods exceed ten years.
€ million € million € million € million € million
GoodwillIndefinite-life
intangible assets
Finite-life intangible assets
TotalMovements during 2021 Software Other
Cost1 January 2021 20,118 15,420 2,819 1,074 39,431 Additions through business combinations(a)
741 1,753 — 1 2,495 Disposal of businesses (2) — — — (2) Reclassification to held for sale(b)
(534) (362) (7) — (903) Additions — — 229 2 231 Disposals and other movements (18) — (44) (3) (65) Hyperinflationary adjustment 96 7 — — 103 Currency retranslation 1,088 863 192 40 2,183 31 December 2021 21,489 17,681 3,189 1,114 43,473
Accumulated amortisation and impairment1 January 2021 (1,176) (211) (2,282) (821) (4,490) Amortisation/impairment for the year — — (222) (52) (274) Disposals and other movements 18 1 48 2 69 Currency retranslation (1) (1) (153) (32) (187) 31 December 2021 (1,159) (211) (2,609) (903) (4,882) Net book value 31 December 2021(c)
20,330 17,470 580 211 38,591
136 Unilever Annual Report and Accounts 2021
Notes to the Consolidated Financial Statements Unilever Group continued
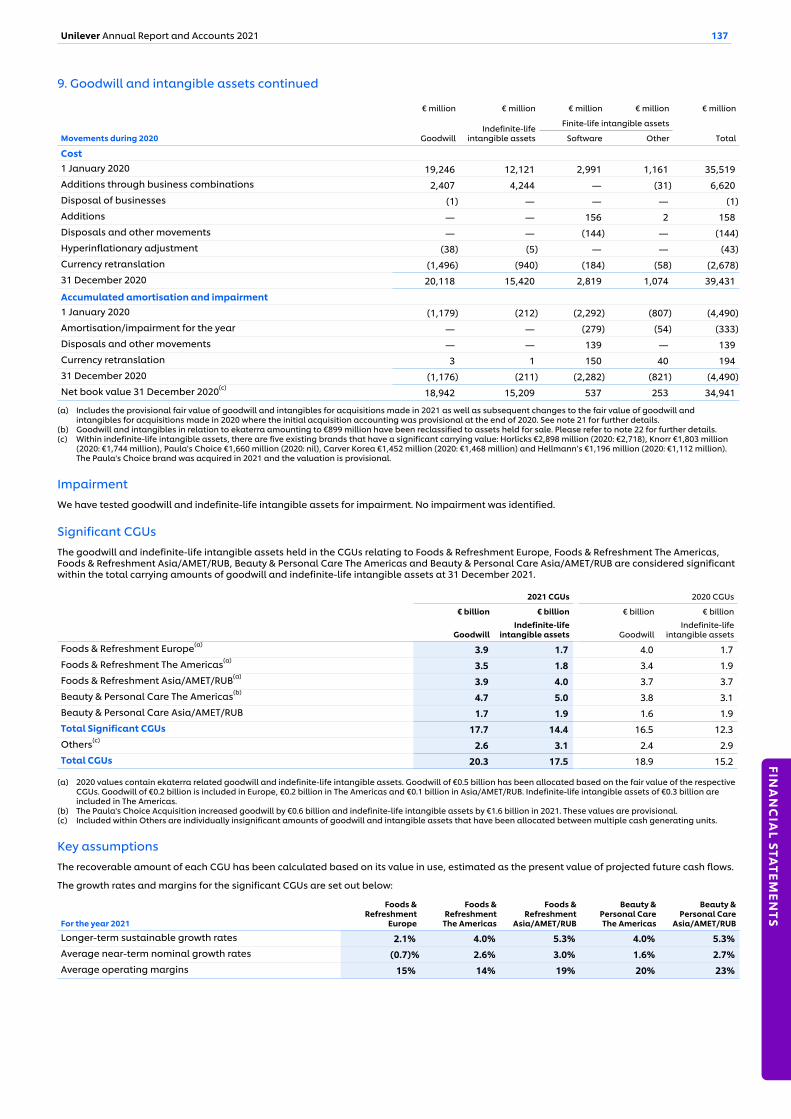
9. Goodwill and intangible assets continued
€ million € million € million € million € million
GoodwillIndefinite-life
intangible assets
Finite-life intangible assets
TotalMovements during 2020 Software Other
Cost1 January 2020 19,246 12,121 2,991 1,161 35,519 Additions through business combinations 2,407 4,244 — (31) 6,620 Disposal of businesses (1) — — — (1) Additions — — 156 2 158 Disposals and other movements — — (144) — (144) Hyperinflationary adjustment (38) (5) — — (43) Currency retranslation (1,496) (940) (184) (58) (2,678) 31 December 2020 20,118 15,420 2,819 1,074 39,431
Accumulated amortisation and impairment1 January 2020 (1,179) (212) (2,292) (807) (4,490) Amortisation/impairment for the year — — (279) (54) (333) Disposals and other movements — — 139 — 139 Currency retranslation 3 1 150 40 194 31 December 2020 (1,176) (211) (2,282) (821) (4,490) Net book value 31 December 2020(c)
18,942 15,209 537 253 34,941
(a) Includes the provisional fair value of goodwill and intangibles for acquisitions made in 2021 as well as subsequent changes to the fair value of goodwill and intangibles for acquisitions made in 2020 where the initial acquisition accounting was provisional at the end of 2020. See note 21 for further details.
(b) Goodwill and intangibles in relation to ekaterra amounting to €899 million have been reclassified to assets held for sale. Please refer to note 22 for further details.(c) Within indefinite-life intangible assets, there are five existing brands that have a significant carrying value: Horlicks €2,898 million (2020: €2,718), Knorr €1,803 million
(2020: €1,744 million), Paula's Choice €1,660 million (2020: nil), Carver Korea €1,452 million (2020: €1,468 million) and Hellmann’s €1,196 million (2020: €1,112 million). The Paula's Choice brand was acquired in 2021 and the valuation is provisional.
Impairment We have tested goodwill and indefinite-life intangible assets for impairment. No impairment was identified.
Significant CGUsThe goodwill and indefinite-life intangible assets held in the CGUs relating to Foods & Refreshment Europe, Foods & Refreshment The Americas, Foods & Refreshment Asia/AMET/RUB, Beauty & Personal Care The Americas and Beauty & Personal Care Asia/AMET/RUB are considered significant within the total carrying amounts of goodwill and indefinite-life intangible assets at 31 December 2021.
2021 CGUs 2020 CGUs
€ billion € billion € billion € billion
GoodwillIndefinite-life
intangible assets GoodwillIndefinite-life
intangible assets
Foods & Refreshment Europe(a) 3.9 1.7 4.0 1.7
Foods & Refreshment The Americas(a) 3.5 1.8 3.4 1.9
Foods & Refreshment Asia/AMET/RUB(a) 3.9 4.0 3.7 3.7
Beauty & Personal Care The Americas(b) 4.7 5.0 3.8 3.1
Beauty & Personal Care Asia/AMET/RUB 1.7 1.9 1.6 1.9 Total Significant CGUs 17.7 14.4 16.5 12.3 Others(c)
2.6 3.1 2.4 2.9 Total CGUs 20.3 17.5 18.9 15.2
(a) 2020 values contain ekaterra related goodwill and indefinite-life intangible assets. Goodwill of €0.5 billion has been allocated based on the fair value of the respective CGUs. Goodwill of €0.2 billion is included in Europe, €0.2 billion in The Americas and €0.1 billion in Asia/AMET/RUB. Indefinite-life intangible assets of €0.3 billion are included in The Americas.
(b) The Paula's Choice Acquisition increased goodwill by €0.6 billion and indefinite-life intangible assets by €1.6 billion in 2021. These values are provisional. (c) Included within Others are individually insignificant amounts of goodwill and intangible assets that have been allocated between multiple cash generating units.
Key assumptionsThe recoverable amount of each CGU has been calculated based on its value in use, estimated as the present value of projected future cash flows.
The growth rates and margins for the significant CGUs are set out below:
For the year 2021
Foods &Refreshment
Europe
Foods &Refreshment
The Americas
Foods &Refreshment
Asia/AMET/RUB
Beauty &Personal CareThe Americas
Beauty &Personal Care
Asia/AMET/RUB
Longer-term sustainable growth rates 2.1% 4.0% 5.3% 4.0% 5.3% Average near-term nominal growth rates (0.7) % 2.6% 3.0% 1.6% 2.7% Average operating margins 15% 14% 19% 20% 23%
Unilever Annual Report and Accounts 2021 137
FINA
NC
IAL STA
TEMEN
TS

9. Goodwill and intangible assets continued
For the year 2020
Foods &Refreshment
Europe
Foods &Refreshment
The Americas
Foods &Refreshment
Asia/AMET/RUB
Beauty & Personal Care The Americas
Beauty & Personal Care
Asia/AMET/RUB
Longer-term sustainable growth rates 1.1% 1.7% 3.9% 1.7% 3.9% Average near-term nominal growth rates (1.0%) 0.1% 4.9% 2.5% 3.4% Average operating margins 13% 15% 16% 22% 22%
Projected cash flows include specific estimates for a period of five years. The growth rates and operating margins used to estimate cash flows for the first five years are based on past performance and on the Group’s three-year strategic plan, which includes the impact on our business of climate change and activities we are undertaking to reduce carbon emissions, extended to years four and five.
The estimated cash flows after year five are extrapolated using a longer-term sustainable growth rate, which is determined as the lower of our own three-year average market growth projection and external forecasts for the relevant market.
In 2021, the projected cash flows are discounted using pre-tax discount rates of between 6.4% and 7.6% (2020: 6.0% and 7.4%). The discount rates are specific to each CGU and are determined based on the weighted average cost of capital, including a market risk premium.
There are no reasonably possible changes in key assumptions that would cause the carrying amount of a CGU to exceed its recoverable amount.
10. Property, plant and equipmentThe Group’s property, plant and equipment is comprised of owned assets (note 10A) and leased assets (note 10B). Property, plant and equipment is measured at cost including eligible borrowing costs less depreciation and accumulated impairment losses.
Property, plant and equipment is subject to review for impairment if triggering events or circumstances indicate that this is necessary. If an indication of impairment exists, the asset’s or cash generating unit’s recoverable amount is estimated and any impairment loss is charged to the income statement as it arises.
Owned assets
Owned assets are initially measured at historical cost. Depreciation is provided on a straight-line basis over the expected average useful lives of the assets. Residual values are reviewed at least annually. Estimated useful lives by major class of assets are as follows:▪ freehold buildings (no depreciation on freehold land) 40 years▪ leasehold land and buildings 40 years (or life of lease if less)▪ plant and equipment 2-20 years
Leased assets
The cost of a leased asset is measured as the lease liability at inception of the lease contract and other direct costs less any incentives granted by the lessor. The Group has not capitalised leases which are less than 12 months or leases of low-value assets. These mainly relate to IT equipment, office equipment, furniture and fitting and other peripheral items. When a lease liability is remeasured, the related lease asset is adjusted by the same amount.
Depreciation is provided on a straight-line basis from the commencement date of the lease to the end of the lease term.
€ million € million
Property, plant and equipment Notes 2021 2020
Owned assets 10A 8,833 8,909 Leased assets 10B 1,514 1,649 Total 10,347 10,558
138 Unilever Annual Report and Accounts 2021
Notes to the Consolidated Financial Statements Unilever Group continued

10A. Owned assets
€ million € million € million
Movements during 2021Land andbuildings
Plant andequipment Total
Cost1 January 2021 4,203 14,305 18,508 Additions through business combinations 1 2 3 Additions 100 1,008 1,108 Disposals and other movements (136) (764) (900) Hyperinflationary adjustment 46 109 155 Reclassification as held for sale (131) (731) (862) Currency retranslation 183 533 716 31 December 2021 4,266 14,462 18,728
Accumulated depreciation1 January 2021 (1,440) (8,159) (9,599) Depreciation charge for the year (137) (905) (1,042) Disposals and other movements 93 650 743 Hyperinflationary adjustment (6) (50) (56) Reclassification as held for sale 46 398 444 Currency retranslation (64) (321) (385) 31 December 2021 (1,508) (8,387) (9,895) Net book value 31 December 2021(a)
2,758 6,075 8,833 Includes capital expenditures for assets under construction 93 881 974
(a) Includes €380 million of freehold land.
The Group has commitments to purchase property, plant and equipment of €386 million (2020: €251 million).
€ million € million € million
Movements during 2020Land and buildings
Plant andequipment Total
Cost1 January 2020 4,498 15,844 20,342 Additions through business combinations 122 44 166 Additions 107 756 863 Disposals and other movements (90) (901) (991) Hyperinflationary adjustment (18) (27) (45) Reclassification as held for sale (19) (81) (100) Currency retranslation (397) (1,330) (1,727) 31 December 2020 4,203 14,305 18,508
Accumulated depreciation1 January 2020 (1,479) (8,614) (10,093) Depreciation charge for the year (135) (1,093) (1,228) Disposals and other movements 54 814 868 Hyperinflationary adjustment 6 20 26 Reclassification as held for sale 11 60 71 Currency retranslation 103 654 757 31 December 2020 (1,440) (8,159) (9,599) Net book value 31 December 2020(a)
2,763 6,146 8,909 Includes capital expenditures for assets under construction 75 660 735
(a) Includes €347 million of freehold land.
Unilever Annual Report and Accounts 2021 139
FINA
NC
IAL STA
TEMEN
TS

10B. Leased assets
€ million € million € million
Movements during 2021Land andbuildings
Plant andequipment Total
Cost1 January 2021 2,639 768 3,407 Additions through business combinations 4 0 4 Additions 263 110 373 Disposals and other movements (259) (245) (504) Hyperinflationary adjustment (18) — (18) Reclassification as held for sale (61) (3) (64) Currency retranslation 99 31 130 31 December 2021 2,667 661 3,328
Accumulated depreciation1 January 2021 (1,311) (447) (1,758) Depreciation charge for the year (307) (123) (430) Disposals and other movements 177 233 410 Reclassification as held for sale 33 2 35 Currency retranslation (53) (18) (71) 31 December 2021 (1,461) (353) (1,814)
Net book value 31 December 2021 1,206 308 1,514
€ million € million € million
Movements during 2020Land and buildings
Plant andequipment Total
Cost1 January 2020 2,874 827 3,701 Additions through business combinations 30 3 33 Additions 390 189 579 Disposals and other movements (436) (188) (624) Hyperinflationary adjustment (3) — (3) Currency retranslation (216) (63) (279) 31 December 2020 2,639 768 3,407
Accumulated depreciation1 January 2020 (1,397) (491) (1,888) Depreciation charge for the year (315) (142) (457) Disposals and other movements 300 150 450 Currency retranslation 101 36 137 31 December 2020 (1,311) (447) (1,758) Net book value 31 December 2020 1,328 321 1,649
Our leases mainly comprise of land and buildings and plant and equipment. The Group leases land and buildings for manufacturing, warehouse facilities and office space and also sublets some property. Plant and equipment includes leases for vehicles.
The Group has recognised in the income statement, a charge of €96 million (2020: €96 million) for short-term leases and €71 million (2020: €77 million) on leases for low-value assets.
During the year, the Group recognised income of €16 million (2020: €19 million) from sublet properties.
The total cash outflow relating to leases was €535 million (2020: €525 million).
Lease liabilities are shown in note 15 on pages 144 and 147.
11. Other non-current assetsJoint ventures are undertakings in which the Group has an interest and which are jointly controlled by the Group and one or more other parties. Associates are undertakings where the Group has an investment in which it does not have control or joint control but can exercise significant influence.
Interests in joint ventures and associates are accounted for using the equity method and are stated in the consolidated balance sheet at cost, adjusted for the movement in the Group’s share of their net assets and liabilities. The Group’s share of the profit or loss after tax of joint ventures and associates is included in the Group’s consolidated profit before taxation.
Where the Group’s share of losses exceeds its interest in the equity accounted investee, the carrying amount of the investment is reduced to zero and the recognition of further losses is discontinued, except to the extent that the Group has an obligation to make payments on behalf of the investee.
Biological assets are measured at fair value less costs to sell with any changes recognised in the income statement.
140 Unilever Annual Report and Accounts 2021
Notes to the Consolidated Financial Statements Unilever Group continued
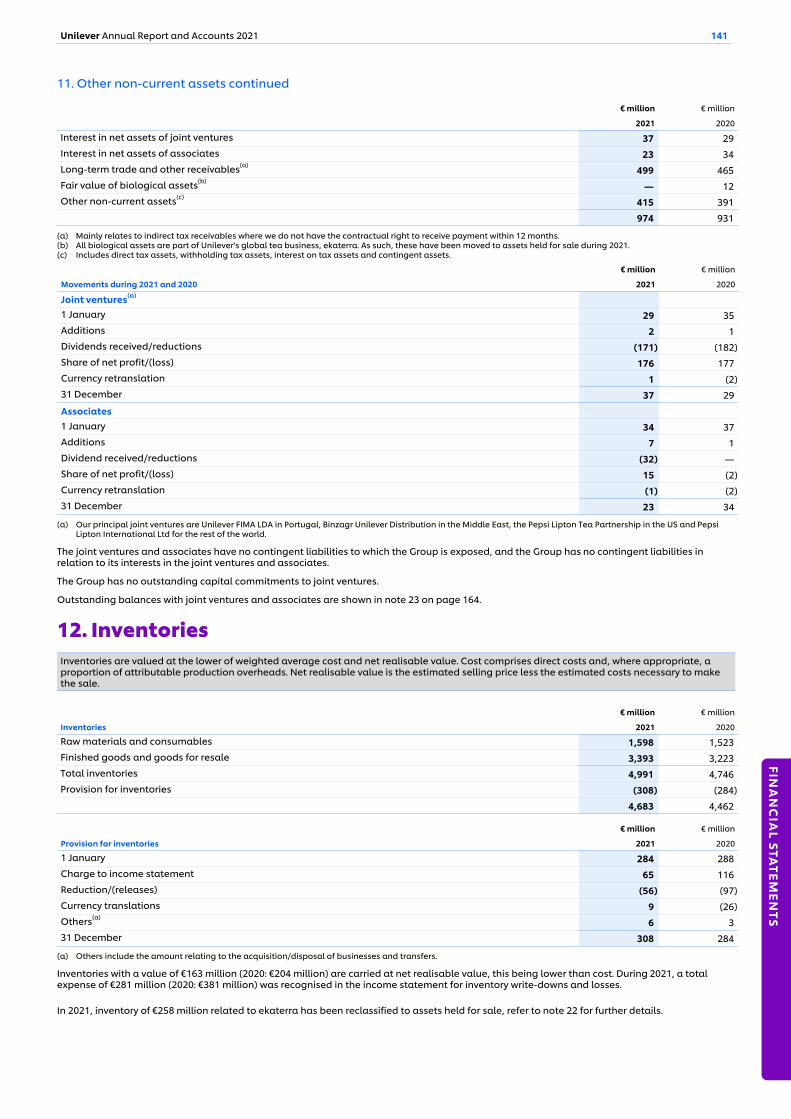
11. Other non-current assets continued
€ million € million
2021 2020
Interest in net assets of joint ventures 37 29 Interest in net assets of associates 23 34 Long-term trade and other receivables(a)
499 465 Fair value of biological assets(b)
— 12 Other non-current assets(c)
415 391
974 931
(a) Mainly relates to indirect tax receivables where we do not have the contractual right to receive payment within 12 months.(b) All biological assets are part of Unilever's global tea business, ekaterra. As such, these have been moved to assets held for sale during 2021.(c) Includes direct tax assets, withholding tax assets, interest on tax assets and contingent assets.
€ million € million
Movements during 2021 and 2020 2021 2020
Joint ventures(a)
1 January 29 35 Additions 2 1 Dividends received/reductions (171) (182) Share of net profit/(loss) 176 177 Currency retranslation 1 (2) 31 December 37 29
Associates1 January 34 37 Additions 7 1 Dividend received/reductions (32) — Share of net profit/(loss) 15 (2) Currency retranslation (1) (2) 31 December 23 34
(a) Our principal joint ventures are Unilever FIMA LDA in Portugal, Binzagr Unilever Distribution in the Middle East, the Pepsi Lipton Tea Partnership in the US and Pepsi Lipton International Ltd for the rest of the world.
The joint ventures and associates have no contingent liabilities to which the Group is exposed, and the Group has no contingent liabilities in relation to its interests in the joint ventures and associates.
The Group has no outstanding capital commitments to joint ventures.
Outstanding balances with joint ventures and associates are shown in note 23 on page 164.
12. InventoriesInventories are valued at the lower of weighted average cost and net realisable value. Cost comprises direct costs and, where appropriate, a proportion of attributable production overheads. Net realisable value is the estimated selling price less the estimated costs necessary to make the sale.
€ million € million
Inventories 2021 2020
Raw materials and consumables 1,598 1,523 Finished goods and goods for resale 3,393 3,223 Total inventories 4,991 4,746 Provision for inventories (308) (284)
4,683 4,462
€ million € million
Provision for inventories 2021 2020
1 January 284 288 Charge to income statement 65 116 Reduction/(releases) (56) (97) Currency translations 9 (26) Others(a)
6 3 31 December 308 284
(a) Others include the amount relating to the acquisition/disposal of businesses and transfers.
Inventories with a value of €163 million (2020: €204 million) are carried at net realisable value, this being lower than cost. During 2021, a total expense of €281 million (2020: €381 million) was recognised in the income statement for inventory write-downs and losses.
In 2021, inventory of €258 million related to ekaterra has been reclassified to assets held for sale, refer to note 22 for further details.
Unilever Annual Report and Accounts 2021 141
FINA
NC
IAL STA
TEMEN
TS
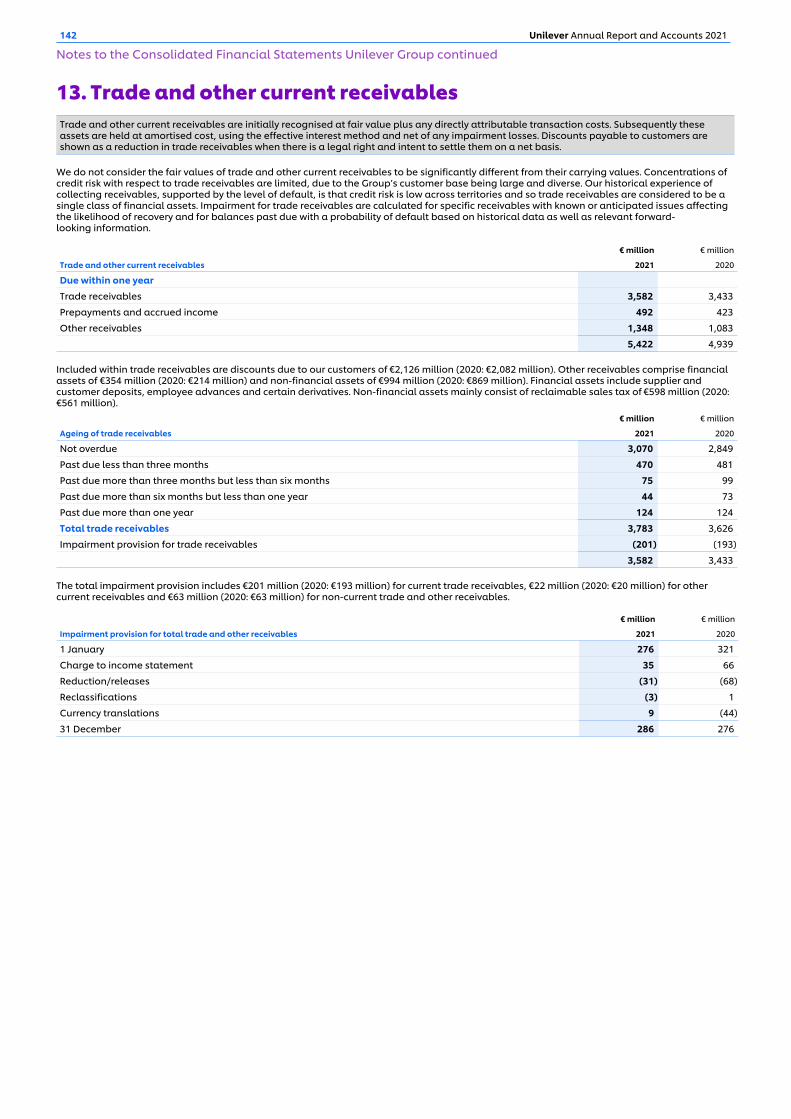
13. Trade and other current receivablesTrade and other current receivables are initially recognised at fair value plus any directly attributable transaction costs. Subsequently these assets are held at amortised cost, using the effective interest method and net of any impairment losses. Discounts payable to customers are shown as a reduction in trade receivables when there is a legal right and intent to settle them on a net basis.
We do not consider the fair values of trade and other current receivables to be significantly different from their carrying values. Concentrations of credit risk with respect to trade receivables are limited, due to the Group’s customer base being large and diverse. Our historical experience of collecting receivables, supported by the level of default, is that credit risk is low across territories and so trade receivables are considered to be a single class of financial assets. Impairment for trade receivables are calculated for specific receivables with known or anticipated issues affecting the likelihood of recovery and for balances past due with a probability of default based on historical data as well as relevant forward-looking information.
€ million € million
Trade and other current receivables 2021 2020
Due within one year
Trade receivables 3,582 3,433
Prepayments and accrued income 492 423
Other receivables 1,348 1,083
5,422 4,939
Included within trade receivables are discounts due to our customers of €2,126 million (2020: €2,082 million). Other receivables comprise financial assets of €354 million (2020: €214 million) and non-financial assets of €994 million (2020: €869 million). Financial assets include supplier and customer deposits, employee advances and certain derivatives. Non-financial assets mainly consist of reclaimable sales tax of €598 million (2020: €561 million).
€ million € million
Ageing of trade receivables 2021 2020
Not overdue 3,070 2,849
Past due less than three months 470 481
Past due more than three months but less than six months 75 99
Past due more than six months but less than one year 44 73
Past due more than one year 124 124
Total trade receivables 3,783 3,626
Impairment provision for trade receivables (201) (193)
3,582 3,433
The total impairment provision includes €201 million (2020: €193 million) for current trade receivables, €22 million (2020: €20 million) for other current receivables and €63 million (2020: €63 million) for non-current trade and other receivables.
€ million € million
Impairment provision for total trade and other receivables 2021 2020
1 January 276 321
Charge to income statement 35 66
Reduction/releases (31) (68)
Reclassifications (3) 1
Currency translations 9 (44)
31 December 286 276
142 Unilever Annual Report and Accounts 2021
Notes to the Consolidated Financial Statements Unilever Group continued
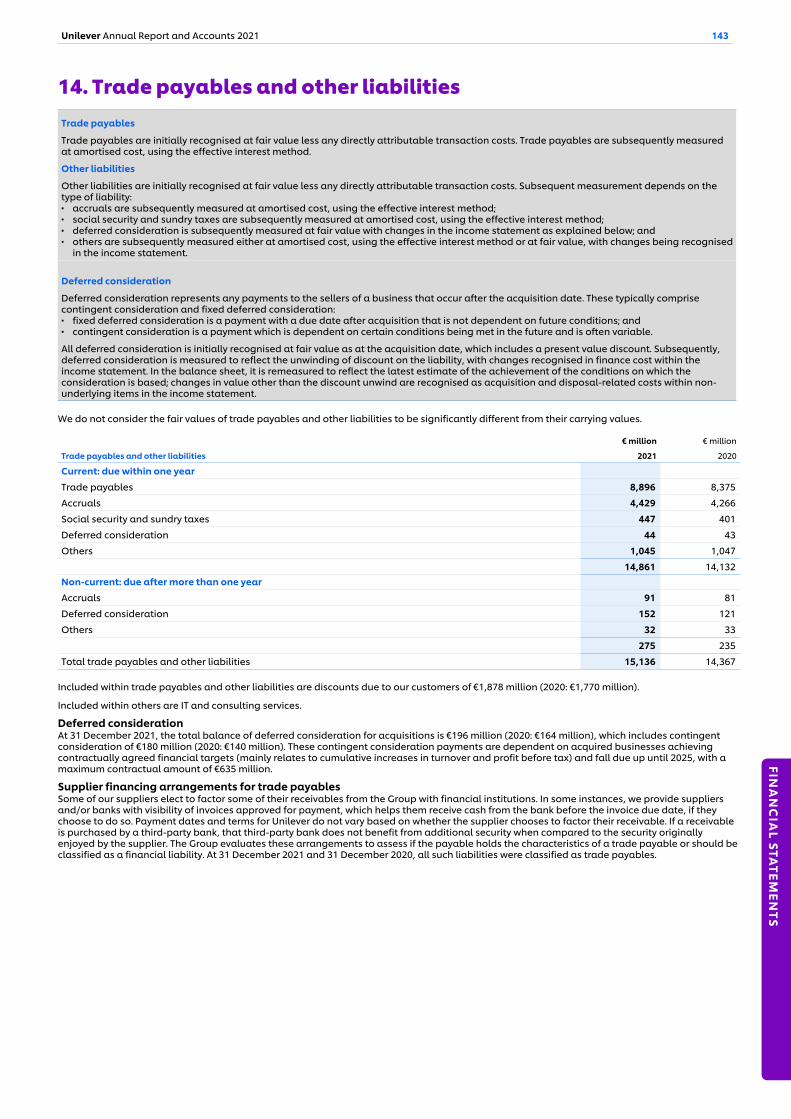
14. Trade payables and other liabilities Trade payables
Trade payables are initially recognised at fair value less any directly attributable transaction costs. Trade payables are subsequently measured at amortised cost, using the effective interest method.
Other liabilities
Other liabilities are initially recognised at fair value less any directly attributable transaction costs. Subsequent measurement depends on the type of liability:▪ accruals are subsequently measured at amortised cost, using the effective interest method;▪ social security and sundry taxes are subsequently measured at amortised cost, using the effective interest method;▪ deferred consideration is subsequently measured at fair value with changes in the income statement as explained below; and▪ others are subsequently measured either at amortised cost, using the effective interest method or at fair value, with changes being recognised
in the income statement.
Deferred consideration
Deferred consideration represents any payments to the sellers of a business that occur after the acquisition date. These typically comprise contingent consideration and fixed deferred consideration:▪ fixed deferred consideration is a payment with a due date after acquisition that is not dependent on future conditions; and▪ contingent consideration is a payment which is dependent on certain conditions being met in the future and is often variable.
All deferred consideration is initially recognised at fair value as at the acquisition date, which includes a present value discount. Subsequently, deferred consideration is measured to reflect the unwinding of discount on the liability, with changes recognised in finance cost within the income statement. In the balance sheet, it is remeasured to reflect the latest estimate of the achievement of the conditions on which the consideration is based; changes in value other than the discount unwind are recognised as acquisition and disposal-related costs within non-underlying items in the income statement.
We do not consider the fair values of trade payables and other liabilities to be significantly different from their carrying values.
€ million € million
Trade payables and other liabilities 2021 2020
Current: due within one year
Trade payables 8,896 8,375
Accruals 4,429 4,266
Social security and sundry taxes 447 401
Deferred consideration 44 43
Others 1,045 1,047
14,861 14,132 Non-current: due after more than one year
Accruals 91 81
Deferred consideration 152 121
Others 32 33
275 235
Total trade payables and other liabilities 15,136 14,367
Included within trade payables and other liabilities are discounts due to our customers of €1,878 million (2020: €1,770 million).
Included within others are IT and consulting services.
Deferred consideration At 31 December 2021, the total balance of deferred consideration for acquisitions is €196 million (2020: €164 million), which includes contingent consideration of €180 million (2020: €140 million). These contingent consideration payments are dependent on acquired businesses achieving contractually agreed financial targets (mainly relates to cumulative increases in turnover and profit before tax) and fall due up until 2025, with a maximum contractual amount of €635 million.
Supplier financing arrangements for trade payables Some of our suppliers elect to factor some of their receivables from the Group with financial institutions. In some instances, we provide suppliers and/or banks with visibility of invoices approved for payment, which helps them receive cash from the bank before the invoice due date, if they choose to do so. Payment dates and terms for Unilever do not vary based on whether the supplier chooses to factor their receivable. If a receivable is purchased by a third-party bank, that third-party bank does not benefit from additional security when compared to the security originally enjoyed by the supplier. The Group evaluates these arrangements to assess if the payable holds the characteristics of a trade payable or should be classified as a financial liability. At 31 December 2021 and 31 December 2020, all such liabilities were classified as trade payables.
Unilever Annual Report and Accounts 2021 143
FINA
NC
IAL STA
TEMEN
TS
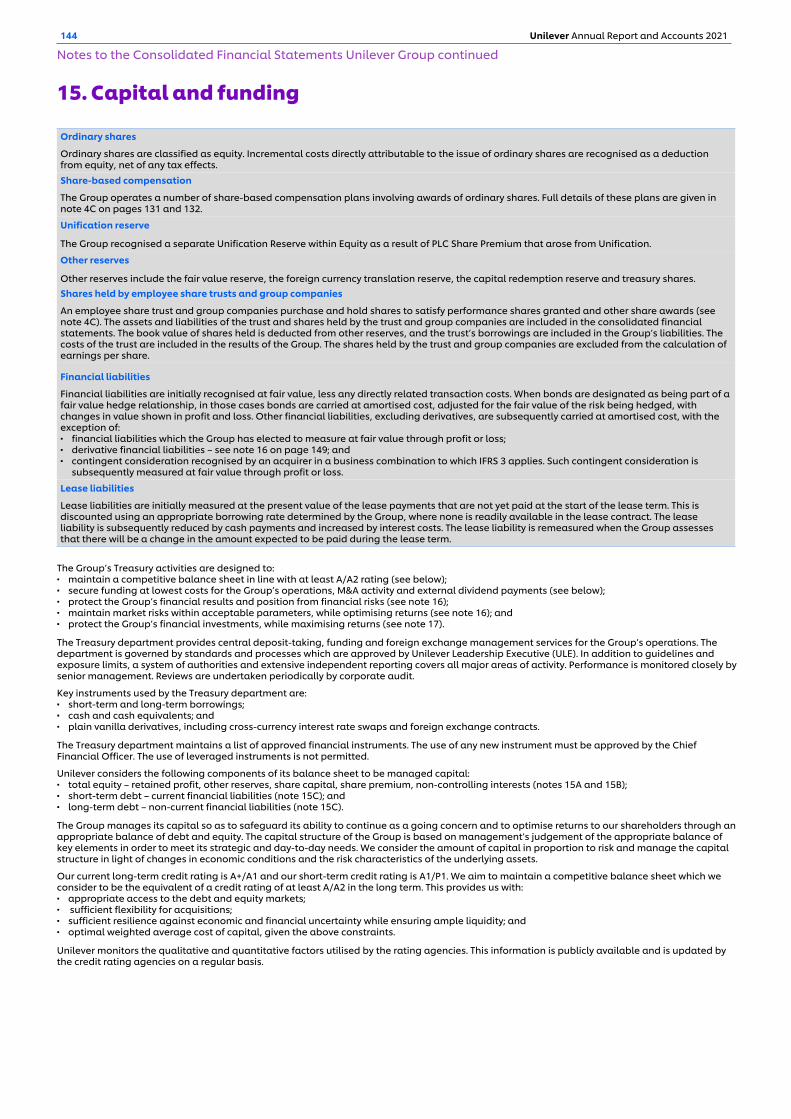
15. Capital and funding Ordinary shares
Ordinary shares are classified as equity. Incremental costs directly attributable to the issue of ordinary shares are recognised as a deduction from equity, net of any tax effects.
Share-based compensation
The Group operates a number of share-based compensation plans involving awards of ordinary shares. Full details of these plans are given in note 4C on pages 131 and 132.
Unification reserve
The Group recognised a separate Unification Reserve within Equity as a result of PLC Share Premium that arose from Unification.
Other reserves
Other reserves include the fair value reserve, the foreign currency translation reserve, the capital redemption reserve and treasury shares.Shares held by employee share trusts and group companies
An employee share trust and group companies purchase and hold shares to satisfy performance shares granted and other share awards (see note 4C). The assets and liabilities of the trust and shares held by the trust and group companies are included in the consolidated financial statements. The book value of shares held is deducted from other reserves, and the trust’s borrowings are included in the Group’s liabilities. The costs of the trust are included in the results of the Group. The shares held by the trust and group companies are excluded from the calculation of earnings per share.
Financial liabilities
Financial liabilities are initially recognised at fair value, less any directly related transaction costs. When bonds are designated as being part of a fair value hedge relationship, in those cases bonds are carried at amortised cost, adjusted for the fair value of the risk being hedged, with changes in value shown in profit and loss. Other financial liabilities, excluding derivatives, are subsequently carried at amortised cost, with the exception of:▪ financial liabilities which the Group has elected to measure at fair value through profit or loss;▪ derivative financial liabilities – see note 16 on page 149; and▪ contingent consideration recognised by an acquirer in a business combination to which IFRS 3 applies. Such contingent consideration is
subsequently measured at fair value through profit or loss.
Lease liabilities
Lease liabilities are initially measured at the present value of the lease payments that are not yet paid at the start of the lease term. This is discounted using an appropriate borrowing rate determined by the Group, where none is readily available in the lease contract. The lease liability is subsequently reduced by cash payments and increased by interest costs. The lease liability is remeasured when the Group assesses that there will be a change in the amount expected to be paid during the lease term.
The Group’s Treasury activities are designed to:▪ maintain a competitive balance sheet in line with at least A/A2 rating (see below);▪ secure funding at lowest costs for the Group’s operations, M&A activity and external dividend payments (see below);▪ protect the Group’s financial results and position from financial risks (see note 16);▪ maintain market risks within acceptable parameters, while optimising returns (see note 16); and▪ protect the Group’s financial investments, while maximising returns (see note 17).
The Treasury department provides central deposit-taking, funding and foreign exchange management services for the Group’s operations. The department is governed by standards and processes which are approved by Unilever Leadership Executive (ULE). In addition to guidelines and exposure limits, a system of authorities and extensive independent reporting covers all major areas of activity. Performance is monitored closely by senior management. Reviews are undertaken periodically by corporate audit.
Key instruments used by the Treasury department are:▪ short-term and long-term borrowings;▪ cash and cash equivalents; and▪ plain vanilla derivatives, including cross-currency interest rate swaps and foreign exchange contracts.
The Treasury department maintains a list of approved financial instruments. The use of any new instrument must be approved by the Chief Financial Officer. The use of leveraged instruments is not permitted.
Unilever considers the following components of its balance sheet to be managed capital:▪ total equity – retained profit, other reserves, share capital, share premium, non-controlling interests (notes 15A and 15B);▪ short-term debt – current financial liabilities (note 15C); and▪ long-term debt – non-current financial liabilities (note 15C).
The Group manages its capital so as to safeguard its ability to continue as a going concern and to optimise returns to our shareholders through an appropriate balance of debt and equity. The capital structure of the Group is based on management’s judgement of the appropriate balance of key elements in order to meet its strategic and day-to-day needs. We consider the amount of capital in proportion to risk and manage the capital structure in light of changes in economic conditions and the risk characteristics of the underlying assets.
Our current long-term credit rating is A+/A1 and our short-term credit rating is A1/P1. We aim to maintain a competitive balance sheet which we consider to be the equivalent of a credit rating of at least A/A2 in the long term. This provides us with:▪ appropriate access to the debt and equity markets;▪ sufficient flexibility for acquisitions;▪ sufficient resilience against economic and financial uncertainty while ensuring ample liquidity; and▪ optimal weighted average cost of capital, given the above constraints.
Unilever monitors the qualitative and quantitative factors utilised by the rating agencies. This information is publicly available and is updated by the credit rating agencies on a regular basis.
144 Unilever Annual Report and Accounts 2021
Notes to the Consolidated Financial Statements Unilever Group continued
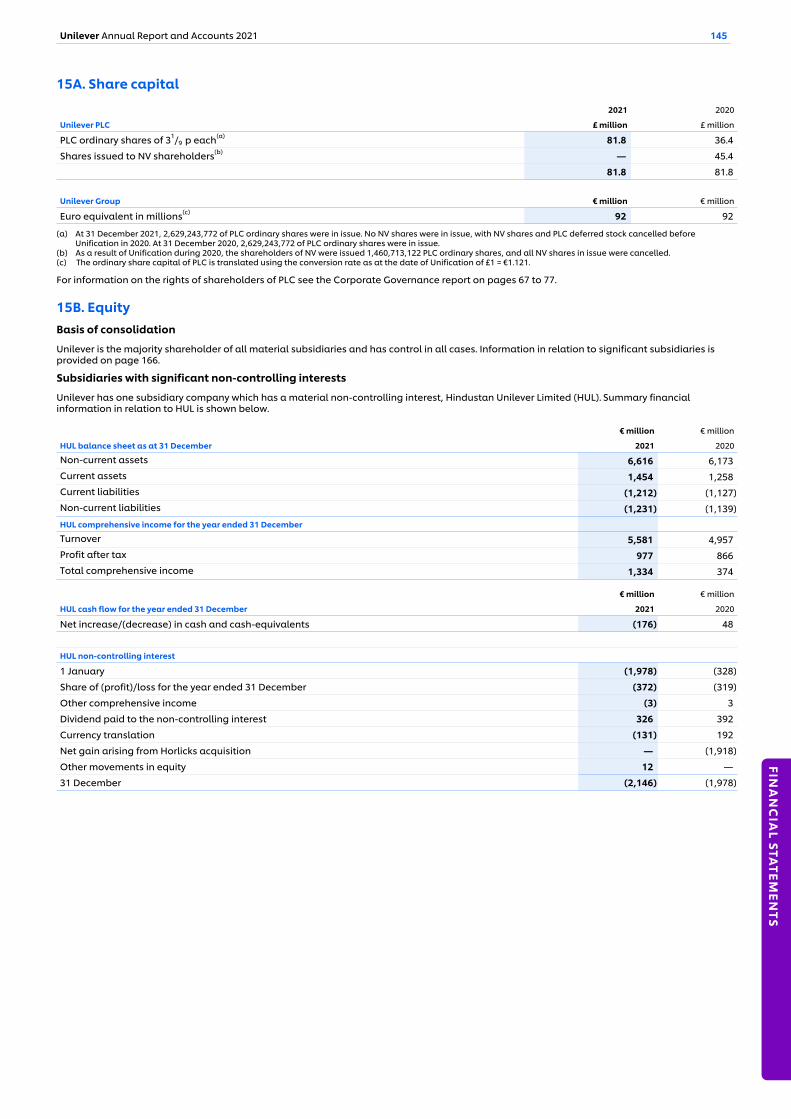
15A. Share capital
2021 2020
Unilever PLC £ million £ million
PLC ordinary shares of 31/9 p each(a) 81.8 36.4
Shares issued to NV shareholders(b) — 45.4
81.8 81.8
Unilever Group € million € million
Euro equivalent in millions(c) 92 92
(a) At 31 December 2021, 2,629,243,772 of PLC ordinary shares were in issue. No NV shares were in issue, with NV shares and PLC deferred stock cancelled before Unification in 2020. At 31 December 2020, 2,629,243,772 of PLC ordinary shares were in issue.
(b) As a result of Unification during 2020, the shareholders of NV were issued 1,460,713,122 PLC ordinary shares, and all NV shares in issue were cancelled. (c) The ordinary share capital of PLC is translated using the conversion rate as at the date of Unification of £1 = €1.121.
For information on the rights of shareholders of PLC see the Corporate Governance report on pages 67 to 77.
15B. EquityBasis of consolidation
Unilever is the majority shareholder of all material subsidiaries and has control in all cases. Information in relation to significant subsidiaries is provided on page 166.
Subsidiaries with significant non-controlling interests
Unilever has one subsidiary company which has a material non-controlling interest, Hindustan Unilever Limited (HUL). Summary financial information in relation to HUL is shown below.
€ million € million
HUL balance sheet as at 31 December 2021 2020
Non-current assets 6,616 6,173 Current assets 1,454 1,258 Current liabilities (1,212) (1,127) Non-current liabilities (1,231) (1,139) HUL comprehensive income for the year ended 31 December
Turnover 5,581 4,957 Profit after tax 977 866 Total comprehensive income 1,334 374
€ million € million
HUL cash flow for the year ended 31 December 2021 2020
Net increase/(decrease) in cash and cash-equivalents (176) 48
HUL non-controlling interest
1 January (1,978) (328)
Share of (profit)/loss for the year ended 31 December (372) (319)
Other comprehensive income (3) 3
Dividend paid to the non-controlling interest 326 392
Currency translation (131) 192
Net gain arising from Horlicks acquisition — (1,918)
Other movements in equity 12 —
31 December (2,146) (1,978)
Unilever Annual Report and Accounts 2021 145
FINA
NC
IAL STA
TEMEN
TS
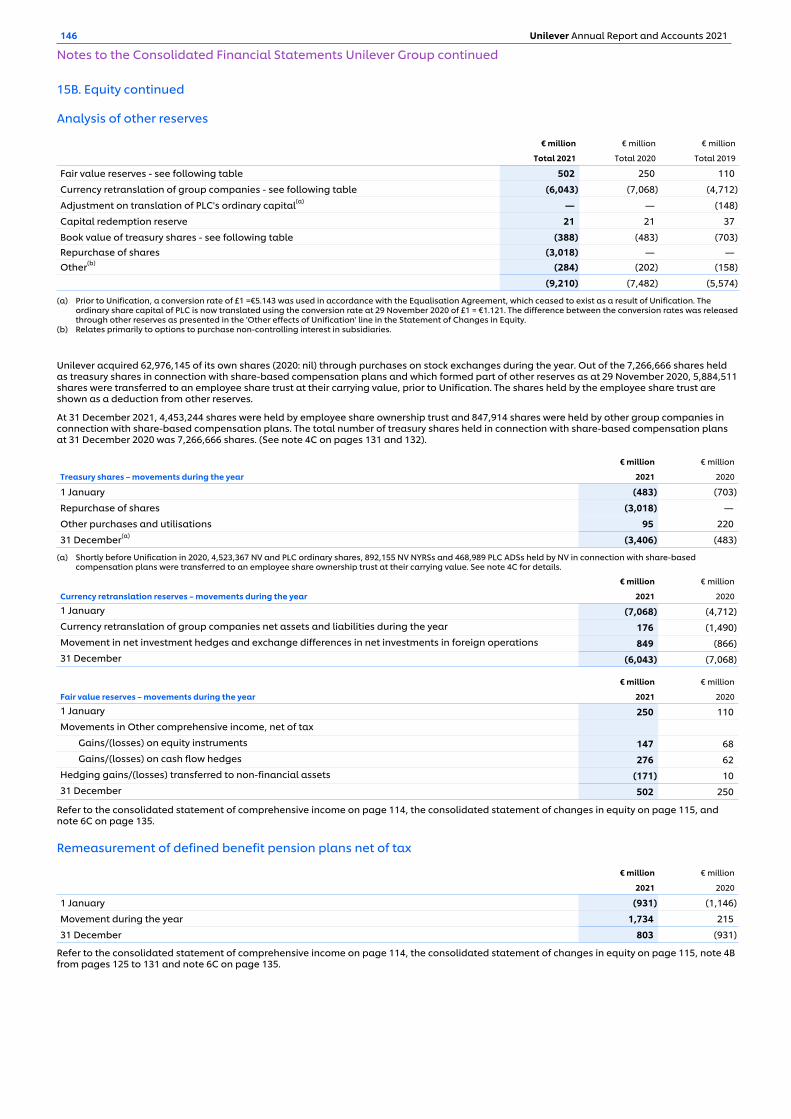
15B. Equity continued
Analysis of other reserves
€ million € million € million
Total 2021 Total 2020 Total 2019
Fair value reserves - see following table 502 250 110
Currency retranslation of group companies - see following table (6,043) (7,068) (4,712)
Adjustment on translation of PLC's ordinary capital(a) — — (148)
Capital redemption reserve 21 21 37
Book value of treasury shares - see following table (388) (483) (703) Repurchase of shares (3,018) — — Other(b) (284) (202) (158)
(9,210) (7,482) (5,574)
(a) Prior to Unification, a conversion rate of £1 =€5.143 was used in accordance with the Equalisation Agreement, which ceased to exist as a result of Unification. The ordinary share capital of PLC is now translated using the conversion rate at 29 November 2020 of £1 = €1.121. The difference between the conversion rates was released through other reserves as presented in the 'Other effects of Unification' line in the Statement of Changes in Equity.
(b) Relates primarily to options to purchase non-controlling interest in subsidiaries.
Unilever acquired 62,976,145 of its own shares (2020: nil) through purchases on stock exchanges during the year. Out of the 7,266,666 shares held as treasury shares in connection with share-based compensation plans and which formed part of other reserves as at 29 November 2020, 5,884,511 shares were transferred to an employee share trust at their carrying value, prior to Unification. The shares held by the employee share trust are shown as a deduction from other reserves.
At 31 December 2021, 4,453,244 shares were held by employee share ownership trust and 847,914 shares were held by other group companies in connection with share-based compensation plans. The total number of treasury shares held in connection with share-based compensation plans at 31 December 2020 was 7,266,666 shares. (See note 4C on pages 131 and 132).
€ million € million
Treasury shares – movements during the year 2021 2020
1 January (483) (703)
Repurchase of shares (3,018) —
Other purchases and utilisations 95 220
31 December(a) (3,406) (483)
(a) Shortly before Unification in 2020, 4,523,367 NV and PLC ordinary shares, 892,155 NV NYRSs and 468,989 PLC ADSs held by NV in connection with share-based compensation plans were transferred to an employee share ownership trust at their carrying value. See note 4C for details.
€ million € million
Currency retranslation reserves – movements during the year 2021 2020
1 January (7,068) (4,712) Currency retranslation of group companies net assets and liabilities during the year 176 (1,490) Movement in net investment hedges and exchange differences in net investments in foreign operations 849 (866) 31 December (6,043) (7,068)
€ million € million
Fair value reserves – movements during the year 2021 2020
1 January 250 110 Movements in Other comprehensive income, net of tax
Gains/(losses) on equity instruments 147 68 Gains/(losses) on cash flow hedges 276 62
Hedging gains/(losses) transferred to non-financial assets (171) 10 31 December 502 250
Refer to the consolidated statement of comprehensive income on page 114, the consolidated statement of changes in equity on page 115, and note 6C on page 135.
Remeasurement of defined benefit pension plans net of tax
€ million € million
2021 2020
1 January (931) (1,146)
Movement during the year 1,734 215
31 December 803 (931)
Refer to the consolidated statement of comprehensive income on page 114, the consolidated statement of changes in equity on page 115, note 4B from pages 125 to 131 and note 6C on page 135.
146 Unilever Annual Report and Accounts 2021
Notes to the Consolidated Financial Statements Unilever Group continued
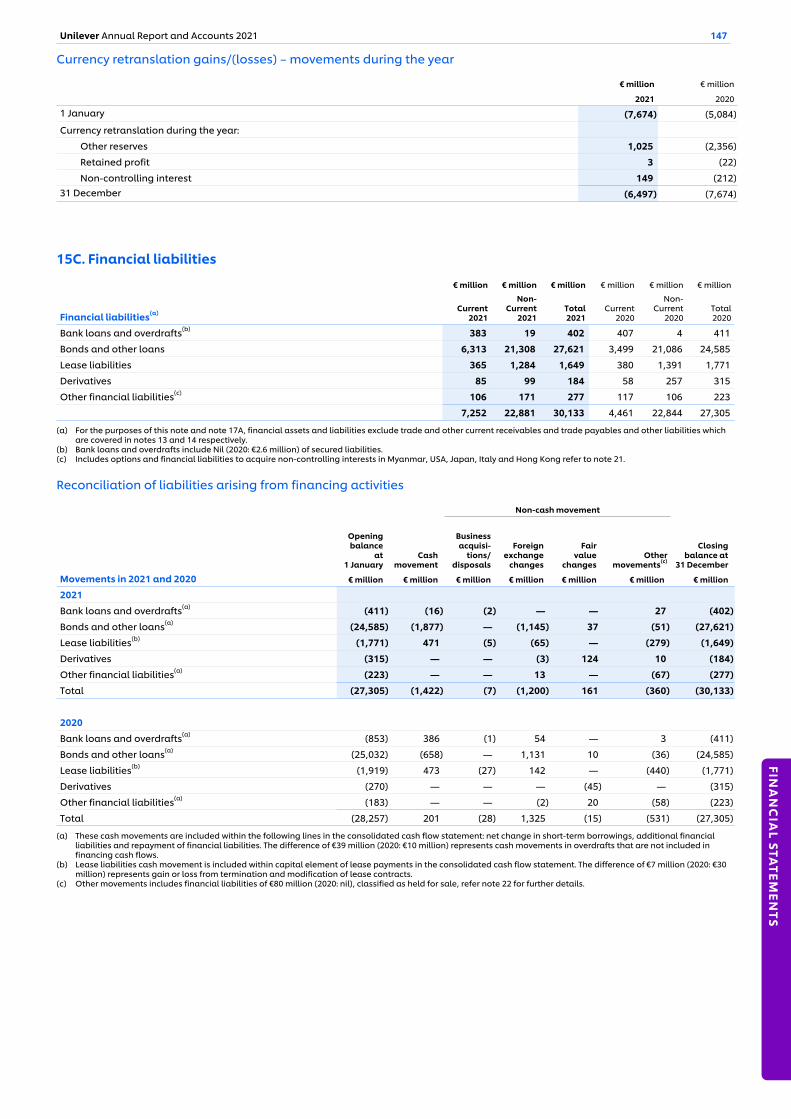
Currency retranslation gains/(losses) – movements during the year
€ million € million
2021 2020
1 January (7,674) (5,084)
Currency retranslation during the year:
Other reserves 1,025 (2,356)
Retained profit 3 (22)
Non-controlling interest 149 (212) 31 December (6,497) (7,674)
15C. Financial liabilities
€ million € million € million € million € million € million
Financial liabilities(a) Current 2021
Non-Current
2021Total 2021
Current 2020
Non-Current
2020Total 2020
Bank loans and overdrafts(b) 383 19 402 407 4 411
Bonds and other loans 6,313 21,308 27,621 3,499 21,086 24,585
Lease liabilities 365 1,284 1,649 380 1,391 1,771
Derivatives 85 99 184 58 257 315
Other financial liabilities(c) 106 171 277 117 106 223
7,252 22,881 30,133 4,461 22,844 27,305
(a) For the purposes of this note and note 17A, financial assets and liabilities exclude trade and other current receivables and trade payables and other liabilities which are covered in notes 13 and 14 respectively.
(b) Bank loans and overdrafts include Nil (2020: €2.6 million) of secured liabilities. (c) Includes options and financial liabilities to acquire non-controlling interests in Myanmar, USA, Japan, Italy and Hong Kong refer to note 21.
Reconciliation of liabilities arising from financing activities
Non-cash movement
Movements in 2021 and 2020
Openingbalance
at1 January
Cashmovement
Businessacquisi-
tions/disposals
Foreignexchange
changes
Fairvalue
changesOther
movements(c)
Closingbalance at
31 December
€ million € million € million € million € million € million € million
2021
Bank loans and overdrafts(a) (411) (16) (2) — — 27 (402)
Bonds and other loans(a) (24,585) (1,877) — (1,145) 37 (51) (27,621)
Lease liabilities(b) (1,771) 471 (5) (65) — (279) (1,649)
Derivatives (315) — — (3) 124 10 (184)
Other financial liabilities(a) (223) — — 13 — (67) (277)
Total (27,305) (1,422) (7) (1,200) 161 (360) (30,133)
2020
Bank loans and overdrafts(a) (853) 386 (1) 54 — 3 (411)
Bonds and other loans(a) (25,032) (658) — 1,131 10 (36) (24,585)
Lease liabilities(b) (1,919) 473 (27) 142 — (440) (1,771)
Derivatives (270) — — — (45) — (315)
Other financial liabilities(a) (183) — — (2) 20 (58) (223)
Total (28,257) 201 (28) 1,325 (15) (531) (27,305)
(a) These cash movements are included within the following lines in the consolidated cash flow statement: net change in short-term borrowings, additional financial liabilities and repayment of financial liabilities. The difference of €39 million (2020: €10 million) represents cash movements in overdrafts that are not included in financing cash flows.
(b) Lease liabilities cash movement is included within capital element of lease payments in the consolidated cash flow statement. The difference of €7 million (2020: €30 million) represents gain or loss from termination and modification of lease contracts.
(c) Other movements includes financial liabilities of €80 million (2020: nil), classified as held for sale, refer note 22 for further details.
Unilever Annual Report and Accounts 2021 147
FINA
NC
IAL STA
TEMEN
TS
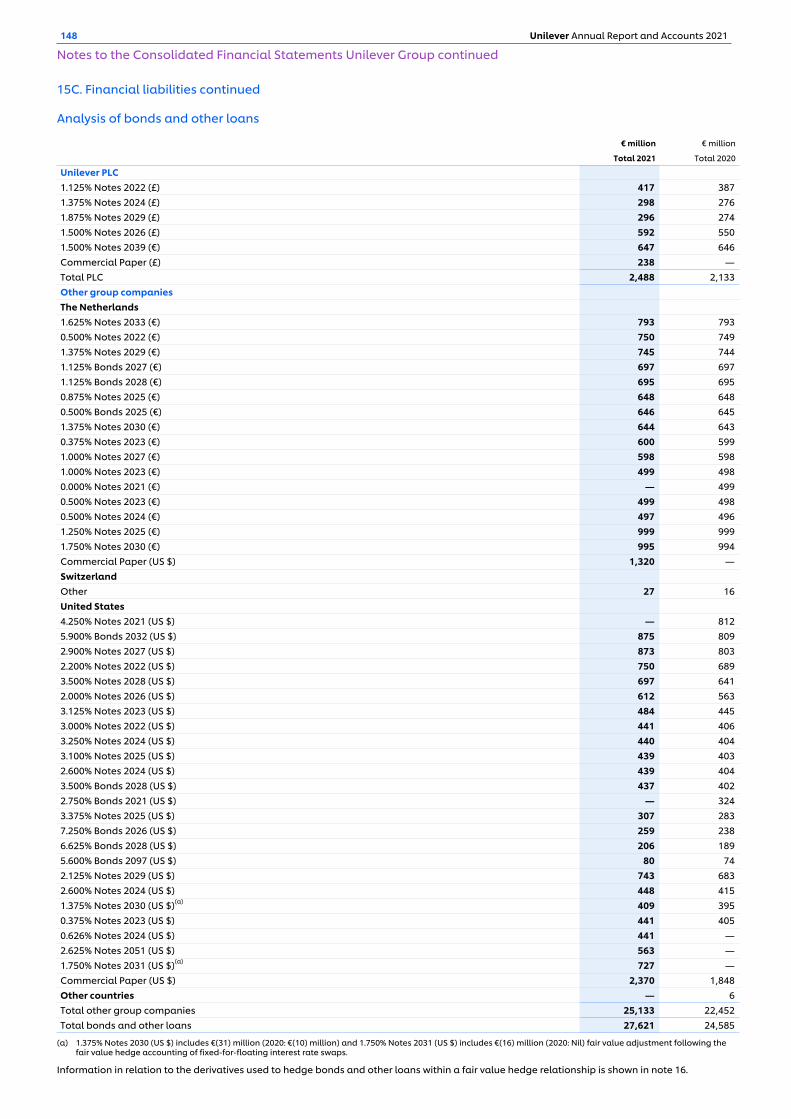
15C. Financial liabilities continued
Analysis of bonds and other loans
€ million € million
Total 2021 Total 2020
Unilever PLC1.125% Notes 2022 (£) 417 387 1.375% Notes 2024 (£) 298 276 1.875% Notes 2029 (£) 296 274 1.500% Notes 2026 (£) 592 550 1.500% Notes 2039 (€) 647 646 Commercial Paper (£) 238 — Total PLC 2,488 2,133 Other group companiesThe Netherlands1.625% Notes 2033 (€) 793 793 0.500% Notes 2022 (€) 750 749 1.375% Notes 2029 (€) 745 744 1.125% Bonds 2027 (€) 697 697 1.125% Bonds 2028 (€) 695 695 0.875% Notes 2025 (€) 648 648 0.500% Bonds 2025 (€) 646 645 1.375% Notes 2030 (€) 644 643 0.375% Notes 2023 (€) 600 599 1.000% Notes 2027 (€) 598 598 1.000% Notes 2023 (€) 499 498 0.000% Notes 2021 (€) — 499 0.500% Notes 2023 (€) 499 498 0.500% Notes 2024 (€) 497 496 1.250% Notes 2025 (€) 999 999 1.750% Notes 2030 (€) 995 994 Commercial Paper (US $) 1,320 — SwitzerlandOther 27 16 United States4.250% Notes 2021 (US $) — 812 5.900% Bonds 2032 (US $) 875 809 2.900% Notes 2027 (US $) 873 803 2.200% Notes 2022 (US $) 750 689 3.500% Notes 2028 (US $) 697 641 2.000% Notes 2026 (US $) 612 563 3.125% Notes 2023 (US $) 484 445 3.000% Notes 2022 (US $) 441 406 3.250% Notes 2024 (US $) 440 404 3.100% Notes 2025 (US $) 439 403 2.600% Notes 2024 (US $) 439 404 3.500% Bonds 2028 (US $) 437 402 2.750% Bonds 2021 (US $) — 324 3.375% Notes 2025 (US $) 307 283 7.250% Bonds 2026 (US $) 259 238 6.625% Bonds 2028 (US $) 206 189 5.600% Bonds 2097 (US $) 80 74 2.125% Notes 2029 (US $) 743 683 2.600% Notes 2024 (US $) 448 415 1.375% Notes 2030 (US $)(a) 409 395 0.375% Notes 2023 (US $) 441 405 0.626% Notes 2024 (US $) 441 — 2.625% Notes 2051 (US $) 563 — 1.750% Notes 2031 (US $)(a) 727 — Commercial Paper (US $) 2,370 1,848 Other countries — 6 Total other group companies 25,133 22,452 Total bonds and other loans 27,621 24,585
(a) 1.375% Notes 2030 (US $) includes €(31) million (2020: €(10) million) and 1.750% Notes 2031 (US $) includes €(16) million (2020: Nil) fair value adjustment following the fair value hedge accounting of fixed-for-floating interest rate swaps.
Information in relation to the derivatives used to hedge bonds and other loans within a fair value hedge relationship is shown in note 16.
148 Unilever Annual Report and Accounts 2021
Notes to the Consolidated Financial Statements Unilever Group continued
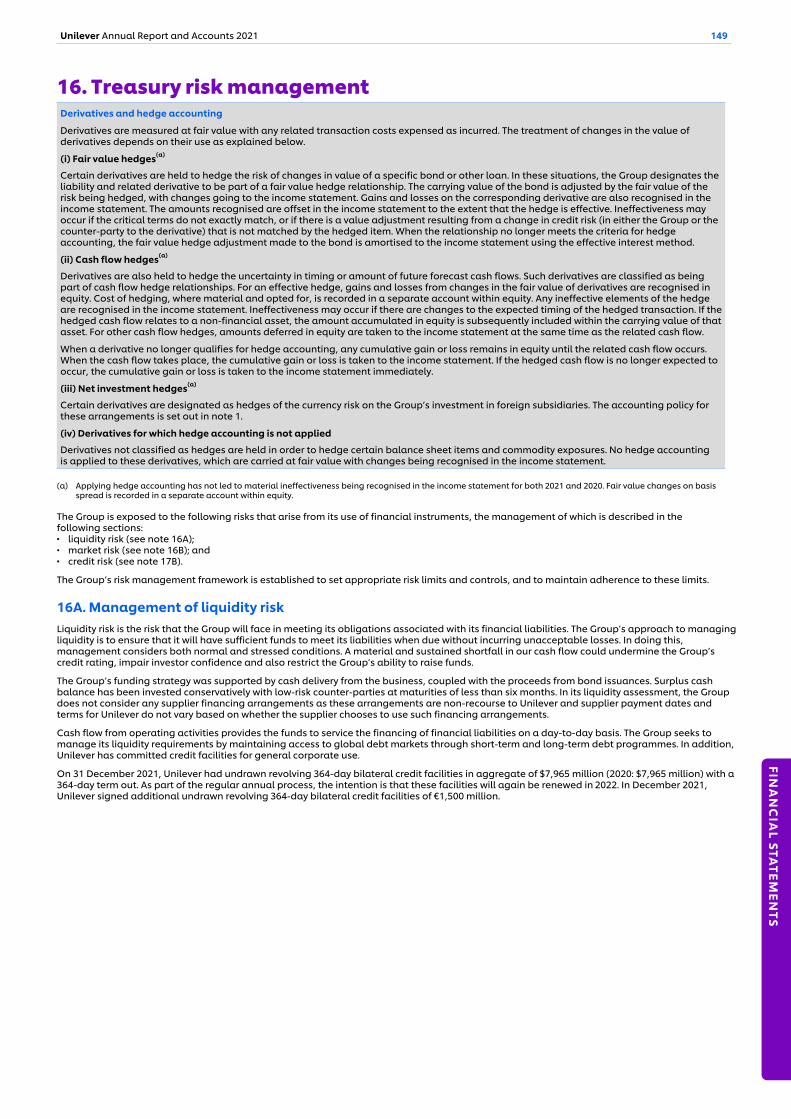
16. Treasury risk managementDerivatives and hedge accounting
Derivatives are measured at fair value with any related transaction costs expensed as incurred. The treatment of changes in the value of derivatives depends on their use as explained below.
(i) Fair value hedges(a)
Certain derivatives are held to hedge the risk of changes in value of a specific bond or other loan. In these situations, the Group designates the liability and related derivative to be part of a fair value hedge relationship. The carrying value of the bond is adjusted by the fair value of the risk being hedged, with changes going to the income statement. Gains and losses on the corresponding derivative are also recognised in the income statement. The amounts recognised are offset in the income statement to the extent that the hedge is effective. Ineffectiveness may occur if the critical terms do not exactly match, or if there is a value adjustment resulting from a change in credit risk (in either the Group or the counter-party to the derivative) that is not matched by the hedged item. When the relationship no longer meets the criteria for hedge accounting, the fair value hedge adjustment made to the bond is amortised to the income statement using the effective interest method.
(ii) Cash flow hedges(a)
Derivatives are also held to hedge the uncertainty in timing or amount of future forecast cash flows. Such derivatives are classified as being part of cash flow hedge relationships. For an effective hedge, gains and losses from changes in the fair value of derivatives are recognised in equity. Cost of hedging, where material and opted for, is recorded in a separate account within equity. Any ineffective elements of the hedge are recognised in the income statement. Ineffectiveness may occur if there are changes to the expected timing of the hedged transaction. If the hedged cash flow relates to a non-financial asset, the amount accumulated in equity is subsequently included within the carrying value of that asset. For other cash flow hedges, amounts deferred in equity are taken to the income statement at the same time as the related cash flow.
When a derivative no longer qualifies for hedge accounting, any cumulative gain or loss remains in equity until the related cash flow occurs. When the cash flow takes place, the cumulative gain or loss is taken to the income statement. If the hedged cash flow is no longer expected to occur, the cumulative gain or loss is taken to the income statement immediately.
(iii) Net investment hedges(a)
Certain derivatives are designated as hedges of the currency risk on the Group’s investment in foreign subsidiaries. The accounting policy for these arrangements is set out in note 1.
(iv) Derivatives for which hedge accounting is not applied
Derivatives not classified as hedges are held in order to hedge certain balance sheet items and commodity exposures. No hedge accounting is applied to these derivatives, which are carried at fair value with changes being recognised in the income statement.
(a) Applying hedge accounting has not led to material ineffectiveness being recognised in the income statement for both 2021 and 2020. Fair value changes on basis spread is recorded in a separate account within equity.
The Group is exposed to the following risks that arise from its use of financial instruments, the management of which is described in the following sections: ▪ liquidity risk (see note 16A); ▪ market risk (see note 16B); and ▪ credit risk (see note 17B).
The Group’s risk management framework is established to set appropriate risk limits and controls, and to maintain adherence to these limits.
16A. Management of liquidity riskLiquidity risk is the risk that the Group will face in meeting its obligations associated with its financial liabilities. The Group’s approach to managing liquidity is to ensure that it will have sufficient funds to meet its liabilities when due without incurring unacceptable losses. In doing this, management considers both normal and stressed conditions. A material and sustained shortfall in our cash flow could undermine the Group’s credit rating, impair investor confidence and also restrict the Group’s ability to raise funds.
The Group’s funding strategy was supported by cash delivery from the business, coupled with the proceeds from bond issuances. Surplus cash balance has been invested conservatively with low-risk counter-parties at maturities of less than six months. In its liquidity assessment, the Group does not consider any supplier financing arrangements as these arrangements are non-recourse to Unilever and supplier payment dates and terms for Unilever do not vary based on whether the supplier chooses to use such financing arrangements.
Cash flow from operating activities provides the funds to service the financing of financial liabilities on a day-to-day basis. The Group seeks to manage its liquidity requirements by maintaining access to global debt markets through short-term and long-term debt programmes. In addition, Unilever has committed credit facilities for general corporate use.
On 31 December 2021, Unilever had undrawn revolving 364-day bilateral credit facilities in aggregate of $7,965 million (2020: $7,965 million) with a 364-day term out. As part of the regular annual process, the intention is that these facilities will again be renewed in 2022. In December 2021, Unilever signed additional undrawn revolving 364-day bilateral credit facilities of €1,500 million.
Unilever Annual Report and Accounts 2021 149
FINA
NC
IAL STA
TEMEN
TS
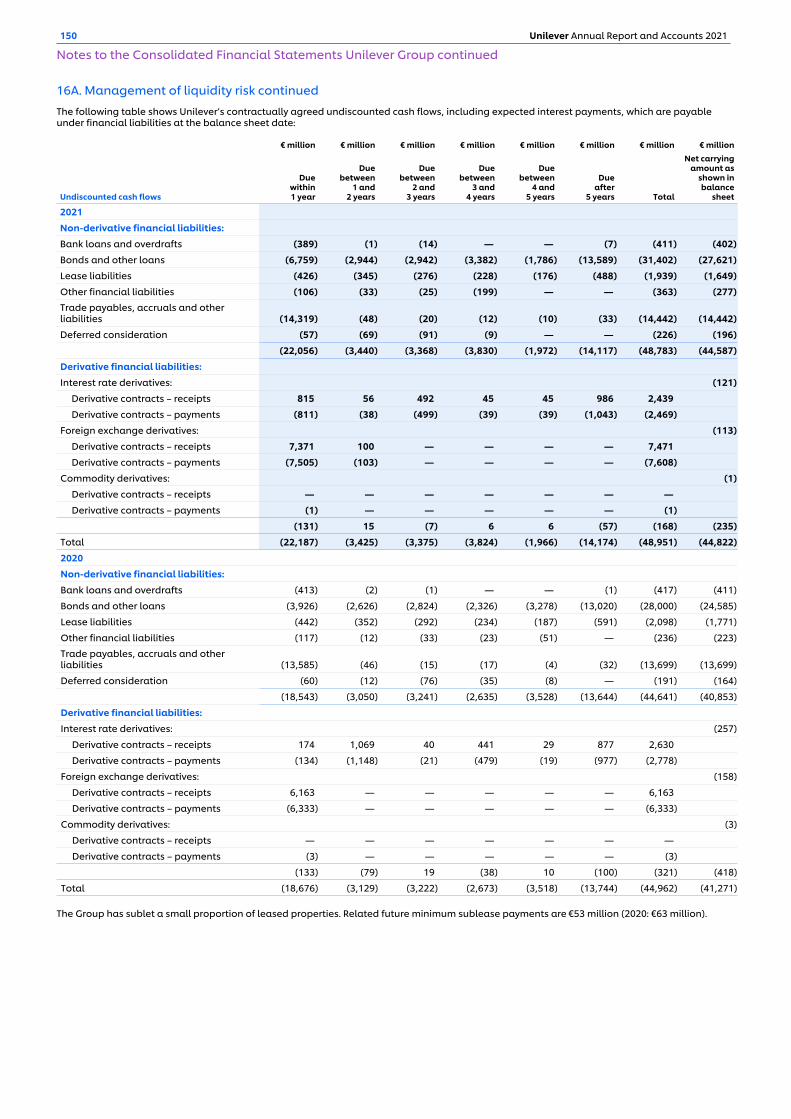
16A. Management of liquidity risk continued The following table shows Unilever’s contractually agreed undiscounted cash flows, including expected interest payments, which are payable under financial liabilities at the balance sheet date:
€ million € million € million € million € million € million € million € million
Undiscounted cash flows
Duewithin1 year
Duebetween
1 and2 years
Duebetween
2 and3 years
Duebetween
3 and4 years
Duebetween
4 and5 years
Dueafter
5 years Total
Net carryingamount as
shown inbalance
sheet
2021
Non-derivative financial liabilities:
Bank loans and overdrafts (389) (1) (14) — — (7) (411) (402)
Bonds and other loans (6,759) (2,944) (2,942) (3,382) (1,786) (13,589) (31,402) (27,621)
Lease liabilities (426) (345) (276) (228) (176) (488) (1,939) (1,649)
Other financial liabilities (106) (33) (25) (199) — — (363) (277) Trade payables, accruals and other liabilities (14,319) (48) (20) (12) (10) (33) (14,442) (14,442)
Deferred consideration (57) (69) (91) (9) — — (226) (196)
(22,056) (3,440) (3,368) (3,830) (1,972) (14,117) (48,783) (44,587)
Derivative financial liabilities:
Interest rate derivatives: (121)
Derivative contracts – receipts 815 56 492 45 45 986 2,439
Derivative contracts – payments (811) (38) (499) (39) (39) (1,043) (2,469)
Foreign exchange derivatives: (113)
Derivative contracts – receipts 7,371 100 — — — — 7,471
Derivative contracts – payments (7,505) (103) — — — — (7,608)
Commodity derivatives: (1)
Derivative contracts – receipts — — — — — — —
Derivative contracts – payments (1) — — — — — (1)
(131) 15 (7) 6 6 (57) (168) (235)
Total (22,187) (3,425) (3,375) (3,824) (1,966) (14,174) (48,951) (44,822)
2020
Non-derivative financial liabilities:
Bank loans and overdrafts (413) (2) (1) — — (1) (417) (411)
Bonds and other loans (3,926) (2,626) (2,824) (2,326) (3,278) (13,020) (28,000) (24,585)
Lease liabilities (442) (352) (292) (234) (187) (591) (2,098) (1,771)
Other financial liabilities (117) (12) (33) (23) (51) — (236) (223)
Trade payables, accruals and other liabilities (13,585) (46) (15) (17) (4) (32) (13,699) (13,699)
Deferred consideration (60) (12) (76) (35) (8) — (191) (164)
(18,543) (3,050) (3,241) (2,635) (3,528) (13,644) (44,641) (40,853)
Derivative financial liabilities:
Interest rate derivatives: (257)
Derivative contracts – receipts 174 1,069 40 441 29 877 2,630
Derivative contracts – payments (134) (1,148) (21) (479) (19) (977) (2,778)
Foreign exchange derivatives: (158)
Derivative contracts – receipts 6,163 — — — — — 6,163
Derivative contracts – payments (6,333) — — — — — (6,333)
Commodity derivatives: (3)
Derivative contracts – receipts — — — — — — —
Derivative contracts – payments (3) — — — — — (3)
(133) (79) 19 (38) 10 (100) (321) (418)
Total (18,676) (3,129) (3,222) (2,673) (3,518) (13,744) (44,962) (41,271)
The Group has sublet a small proportion of leased properties. Related future minimum sublease payments are €53 million (2020: €63 million).
150 Unilever Annual Report and Accounts 2021
Notes to the Consolidated Financial Statements Unilever Group continued
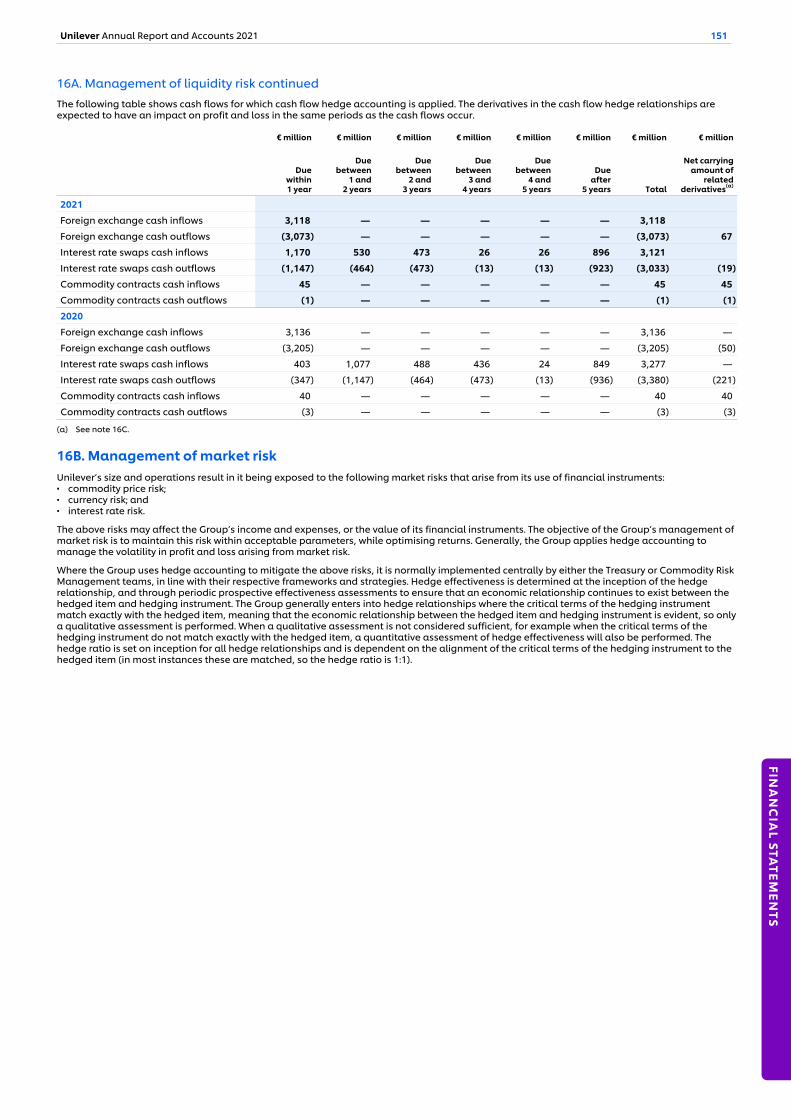
16A. Management of liquidity risk continuedThe following table shows cash flows for which cash flow hedge accounting is applied. The derivatives in the cash flow hedge relationships are expected to have an impact on profit and loss in the same periods as the cash flows occur.
€ million € million € million € million € million € million € million € million
Duewithin1 year
Duebetween
1 and2 years
Duebetween
2 and3 years
Duebetween
3 and4 years
Duebetween
4 and5 years
Dueafter
5 years Total
Net carryingamount of
relatedderivatives(a)
2021
Foreign exchange cash inflows 3,118 — — — — — 3,118
Foreign exchange cash outflows (3,073) — — — — — (3,073) 67
Interest rate swaps cash inflows 1,170 530 473 26 26 896 3,121
Interest rate swaps cash outflows (1,147) (464) (473) (13) (13) (923) (3,033) (19)
Commodity contracts cash inflows 45 — — — — — 45 45
Commodity contracts cash outflows (1) — — — — — (1) (1)
2020
Foreign exchange cash inflows 3,136 — — — — — 3,136 —
Foreign exchange cash outflows (3,205) — — — — — (3,205) (50)
Interest rate swaps cash inflows 403 1,077 488 436 24 849 3,277 —
Interest rate swaps cash outflows (347) (1,147) (464) (473) (13) (936) (3,380) (221)
Commodity contracts cash inflows 40 — — — — — 40 40
Commodity contracts cash outflows (3) — — — — — (3) (3)
(a) See note 16C.
16B. Management of market risk Unilever’s size and operations result in it being exposed to the following market risks that arise from its use of financial instruments: ▪ commodity price risk; ▪ currency risk; and ▪ interest rate risk.
The above risks may affect the Group’s income and expenses, or the value of its financial instruments. The objective of the Group’s management of market risk is to maintain this risk within acceptable parameters, while optimising returns. Generally, the Group applies hedge accounting to manage the volatility in profit and loss arising from market risk.
Where the Group uses hedge accounting to mitigate the above risks, it is normally implemented centrally by either the Treasury or Commodity Risk Management teams, in line with their respective frameworks and strategies. Hedge effectiveness is determined at the inception of the hedge relationship, and through periodic prospective effectiveness assessments to ensure that an economic relationship continues to exist between the hedged item and hedging instrument. The Group generally enters into hedge relationships where the critical terms of the hedging instrument match exactly with the hedged item, meaning that the economic relationship between the hedged item and hedging instrument is evident, so only a qualitative assessment is performed. When a qualitative assessment is not considered sufficient, for example when the critical terms of the hedging instrument do not match exactly with the hedged item, a quantitative assessment of hedge effectiveness will also be performed. The hedge ratio is set on inception for all hedge relationships and is dependent on the alignment of the critical terms of the hedging instrument to the hedged item (in most instances these are matched, so the hedge ratio is 1:1).
Unilever Annual Report and Accounts 2021 151
FINA
NC
IAL STA
TEMEN
TS
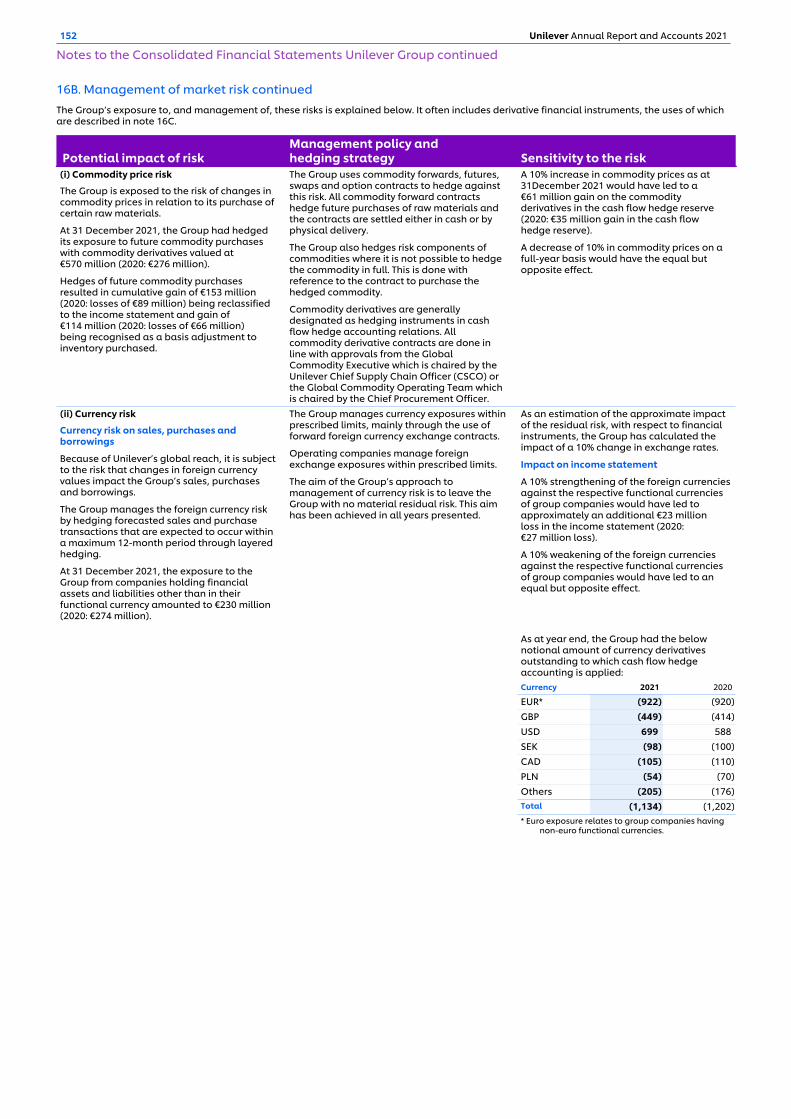
16B. Management of market risk continuedThe Group’s exposure to, and management of, these risks is explained below. It often includes derivative financial instruments, the uses of which are described in note 16C.
(i) Commodity price risk
The Group is exposed to the risk of changes in commodity prices in relation to its purchase of certain raw materials.
At 31 December 2021, the Group had hedged its exposure to future commodity purchases with commodity derivatives valued at €570 million (2020: €276 million).
Hedges of future commodity purchases resulted in cumulative gain of €153 million (2020: losses of €89 million) being reclassified to the income statement and gain of €114 million (2020: losses of €66 million) being recognised as a basis adjustment to inventory purchased.
The Group uses commodity forwards, futures, swaps and option contracts to hedge against this risk. All commodity forward contracts hedge future purchases of raw materials and the contracts are settled either in cash or by physical delivery.
The Group also hedges risk components of commodities where it is not possible to hedge the commodity in full. This is done with reference to the contract to purchase the hedged commodity.
Commodity derivatives are generally designated as hedging instruments in cash flow hedge accounting relations. All commodity derivative contracts are done in line with approvals from the Global Commodity Executive which is chaired by the Unilever Chief Supply Chain Officer (CSCO) or the Global Commodity Operating Team which is chaired by the Chief Procurement Officer.
A 10% increase in commodity prices as at 31December 2021 would have led to a €61 million gain on the commodity derivatives in the cash flow hedge reserve (2020: €35 million gain in the cash flow hedge reserve).
A decrease of 10% in commodity prices on a full-year basis would have the equal but opposite effect.
(ii) Currency risk
Currency risk on sales, purchases and borrowings
Because of Unilever’s global reach, it is subject to the risk that changes in foreign currency values impact the Group’s sales, purchases and borrowings.
The Group manages the foreign currency risk by hedging forecasted sales and purchase transactions that are expected to occur within a maximum 12-month period through layered hedging.
At 31 December 2021, the exposure to the Group from companies holding financial assets and liabilities other than in their functional currency amounted to €230 million (2020: €274 million).
The Group manages currency exposures within prescribed limits, mainly through the use of forward foreign currency exchange contracts.
Operating companies manage foreign exchange exposures within prescribed limits.
The aim of the Group’s approach to management of currency risk is to leave the Group with no material residual risk. This aim has been achieved in all years presented.
As an estimation of the approximate impact of the residual risk, with respect to financial instruments, the Group has calculated the impact of a 10% change in exchange rates.
Impact on income statement
A 10% strengthening of the foreign currencies against the respective functional currencies of group companies would have led to approximately an additional €23 million loss in the income statement (2020: €27 million loss).
A 10% weakening of the foreign currencies against the respective functional currencies of group companies would have led to an equal but opposite effect.
Potential impact of risk Management policy andhedging strategy Sensitivity to the risk
Currency 2021 2020
EUR* (922) (920) GBP (449) (414) USD 699 588 SEK (98) (100) CAD (105) (110) PLN (54) (70) Others (205) (176) Total (1,134) (1,202) * Euro exposure relates to group companies having
non-euro functional currencies.
As at year end, the Group had the below notional amount of currency derivatives outstanding to which cash flow hedge accounting is applied:
152 Unilever Annual Report and Accounts 2021
Notes to the Consolidated Financial Statements Unilever Group continued

16B. Management of market risk continued
Impact on equity – trade-related cash flow hedges
A 10% strengthening of foreign currencies against the respective functional currencies of group companies hedging future trade cash flows and applying cash flow hedge accounting, would have led to €113 million loss (2020: €120 million loss) in equity.
A 10% weakening of the same would have led to an equal but opposite effect.
Currency risk on the Group’s net investments
The Group is also subject to currency risk in relation to the translation of the net investments of its foreign operations into euros for inclusion in its consolidated financial statements.
These net investments include Group financial loans, which are monetary items that form part of our net investment in foreign operations, of €9.9 billion (2020: €9.2 billion), of which €5.9 billion (2020: €5.5 billion) is denominated in GBP. In accordance with IAS 21, the exchange differences on these financial loans are booked through reserves.
Part of the currency exposure on the Group’s investments is also managed using US$ net investment hedges with a nominal value of €3.0 billion (2020: €4.0 billion) for US$.
At 31 December 2021, the net exposure of the net investments in foreign currencies amounts to €23.6 billion (2020: €24.6 billion).
Unilever aims to minimise this currency risk on the Group’s net investment exposure by borrowing in local currency in the operating companies themselves. In some locations, however, the Group’s ability to do this is inhibited by local regulations, lack of local liquidity or by local market conditions.
Where the residual risk from these countries exceeds prescribed limits, Treasury may decide on a case-by-case basis to actively hedge the exposure. This is done either through additional borrowings in the related currency, or through the use of forward foreign exchange contracts.
Where local currency borrowings, or forward contracts, are used to hedge the currency risk in relation to the Group’s net investment in foreign subsidiaries, these relationships are designated as net investment hedges for accounting purposes.
Exchange risk related to the principal amount of the US$ denominated debt either forms part of hedging relationship itself, or is hedged through forward contracts.
Impact on equity – net investment hedges
A 10% strengthening of the euro against other currencies would have led to €303 million (2020: €404 million) loss in the equity on the net investment hedges used to manage the currency exposure on the Group’s investments.
A 10% weakening of the euro against other currencies would have led to an equal but opposite effect.
Impact on equity – net investments in group companies
A 10% strengthening of the euro against all other currencies would have led to €2,363 million negative retranslation effect (2020:€2,461 million negative retranslation effect).
A 10% weakening of the euro against all other currencies would have led to an equal but opposite effect. In line with accepted hedge accounting treatment and our accounting policy for financial loans, the retranslation differences would be recognised in equity.
(iii) Interest rate risk(a)
The Group is exposed to market interest rate fluctuations on its floating-rate debt. Increases in benchmark interest rates could increase the interest cost of our floating-rate debt and increase the cost of future borrowings. The Group’s ability to manage interest costs also has an impact on reported results.
The Group does not have any material floating interest-bearing financial assets or any significant long-term fixed interest-bearing financial assets. Consequently, the Group’s interest rate risk arises mainly from financial liabilities other than lease liabilities.
Taking into account the impact of interest rate swaps, at 31 December 2021, interest rates were fixed on approximately 75% of the expected financial liabilities (excluding lease liabilities) for 2022, and 70% for 2023 (87% for 2021 and 75% for 2022 at 31 December 2020).
As at 31 December 2021, the Group had USD 3,300 million (2020: USD 3,700 million) of outstanding cross-currency interest rate swaps (on which cash flow hedge accounting is applied).
As at 31 December 2021, the Group had USD 1,350 million (2020: USD 500 million) of outstanding fixed to float interest rate swaps (on which fair value hedge accounting is applied).
For interest management purposes, transactions with a maturity shorter than six months from inception date are not included as fixed interest transactions.
The average interest rate on short-term borrowings in 2021 was 0.7% (2020: 1.6%).
Unilever’s interest rate management approach aims for an optimal balance between fixed and floating-rate interest rate exposures on expected financial liabilities. The objective of this approach is to minimise annual interest costs.
This is achieved either by issuing fixed or floating-rate long-term debt, or by modifying interest rate exposure through the use of interest rate swaps.
The majority of the Group’s existing interest rate derivatives are designated as cash flow hedges and are expected to be effective. The fair value movement of these derivatives is recognised in the income statement, along with any changes in the relevant fair value of the underlying hedged asset or liability.
Impact on income statement
Assuming that all other variables remain constant, a 1.0 percentage point increase in floating interest rates on a full-year basis as at 31 December 2021 would have led to an additional €77 million of finance cost (2020: €40 million additional finance costs).
A 1.0 percentage point decrease in floating interest rates on a full-year basis would have an equal but opposite effect.
Impact on equity – cash flow hedges
Assuming that all other variables remain constant, a 1.0 percentage point increase in interest rates on a full-year basis as at 31 December 2021 would have led to an additional €3 million credit in equity from derivatives in cash flow hedge relationships (2020: €11 million credit).
A 1.0 percentage point decrease in interest rates on a full-year basis would have led to an additional €4 million debit in equity from derivatives in cash flow hedge relationships (2020: €12 million debit).
Potential impact of risk Management policy andhedging strategy Sensitivity to the risk
(a) See the weighted average amount of financial liabilities with fixed-rate interest shown in the following table.
Unilever Annual Report and Accounts 2021 153
FINA
NC
IAL STA
TEMEN
TS
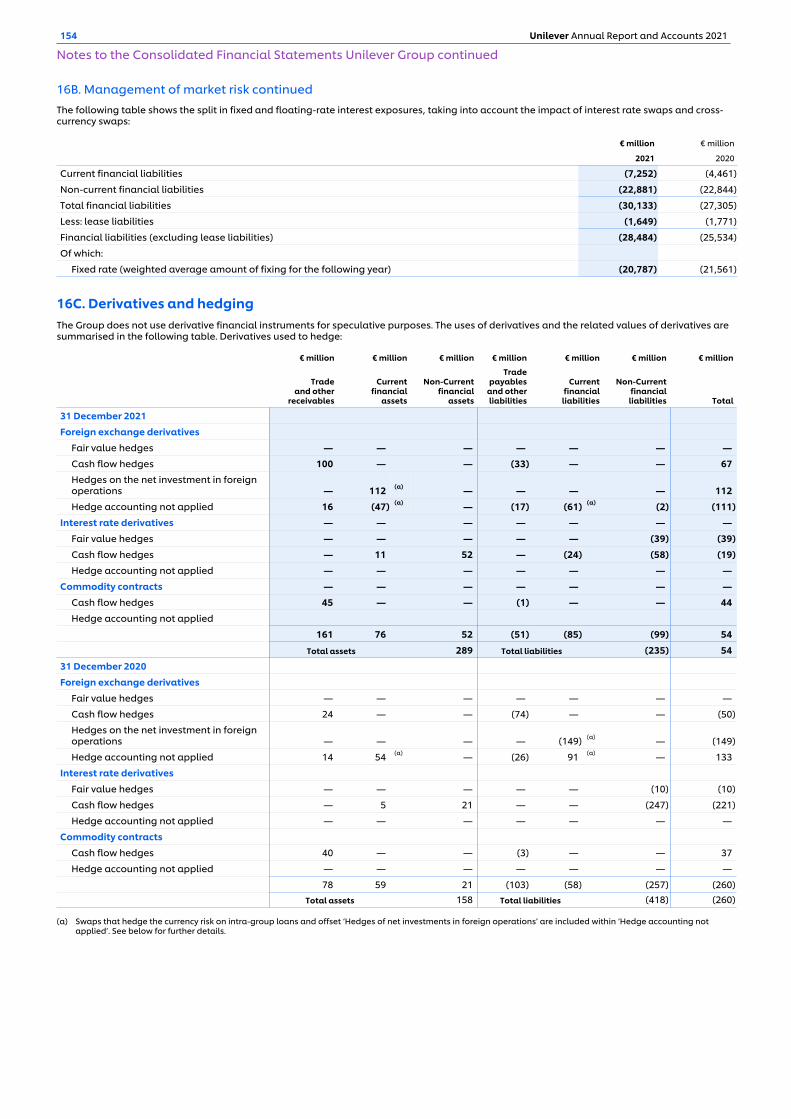
16B. Management of market risk continuedThe following table shows the split in fixed and floating-rate interest exposures, taking into account the impact of interest rate swaps and cross-currency swaps:
€ million € million
2021 2020
Current financial liabilities (7,252) (4,461)
Non-current financial liabilities (22,881) (22,844)
Total financial liabilities (30,133) (27,305)
Less: lease liabilities (1,649) (1,771)
Financial liabilities (excluding lease liabilities) (28,484) (25,534)
Of which:
Fixed rate (weighted average amount of fixing for the following year) (20,787) (21,561)
16C. Derivatives and hedgingThe Group does not use derivative financial instruments for speculative purposes. The uses of derivatives and the related values of derivatives are summarised in the following table. Derivatives used to hedge:
€ million € million € million € million € million € million € million
Tradeand other
receivables
Current financial
assets
Non-Current financial
assets
Tradepayables
and otherliabilities
Current financial
liabilities
Non-Current financial
liabilities Total
31 December 2021
Foreign exchange derivatives
Fair value hedges — — — — — — —
Cash flow hedges 100 — — (33) — — 67 Hedges on the net investment in foreign operations — 112 (a) — — — — 112
Hedge accounting not applied 16 (47) (a) — (17) (61) (a) (2) (111)
Interest rate derivatives — — — — — — —
Fair value hedges — — — — — (39) (39)
Cash flow hedges — 11 52 — (24) (58) (19)
Hedge accounting not applied — — — — — — —
Commodity contracts — — — — — — —
Cash flow hedges 45 — — (1) — — 44
Hedge accounting not applied
161 76 52 (51) (85) (99) 54
Total assets 289 Total liabilities (235) 54
31 December 2020
Foreign exchange derivatives
Fair value hedges — — — — — — —
Cash flow hedges 24 — — (74) — — (50)
Hedges on the net investment in foreign operations — — — — (149) (a) — (149)
Hedge accounting not applied 14 54 (a) — (26) 91 (a) — 133
Interest rate derivatives
Fair value hedges — — — — — (10) (10)
Cash flow hedges — 5 21 — — (247) (221)
Hedge accounting not applied — — — — — — —
Commodity contracts
Cash flow hedges 40 — — (3) — — 37
Hedge accounting not applied — — — — — — —
78 59 21 (103) (58) (257) (260) Total assets 158 Total liabilities (418) (260)
(a) Swaps that hedge the currency risk on intra-group loans and offset ‘Hedges of net investments in foreign operations’ are included within ‘Hedge accounting not applied’. See below for further details.
154 Unilever Annual Report and Accounts 2021
Notes to the Consolidated Financial Statements Unilever Group continued
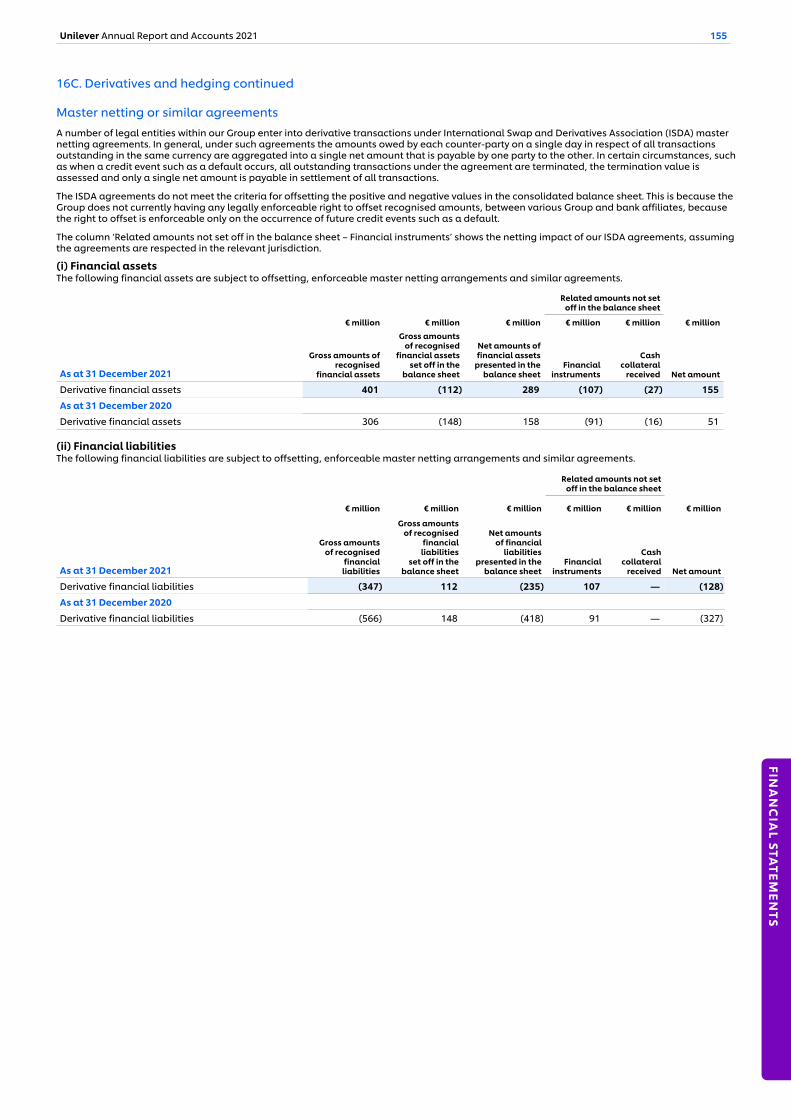
16C. Derivatives and hedging continued
Master netting or similar agreements A number of legal entities within our Group enter into derivative transactions under International Swap and Derivatives Association (ISDA) master netting agreements. In general, under such agreements the amounts owed by each counter-party on a single day in respect of all transactions outstanding in the same currency are aggregated into a single net amount that is payable by one party to the other. In certain circumstances, such as when a credit event such as a default occurs, all outstanding transactions under the agreement are terminated, the termination value is assessed and only a single net amount is payable in settlement of all transactions.
The ISDA agreements do not meet the criteria for offsetting the positive and negative values in the consolidated balance sheet. This is because the Group does not currently having any legally enforceable right to offset recognised amounts, between various Group and bank affiliates, because the right to offset is enforceable only on the occurrence of future credit events such as a default.
The column ‘Related amounts not set off in the balance sheet – Financial instruments’ shows the netting impact of our ISDA agreements, assuming the agreements are respected in the relevant jurisdiction.
(i) Financial assets The following financial assets are subject to offsetting, enforceable master netting arrangements and similar agreements.
Related amounts not setoff in the balance sheet
€ million € million € million € million € million € million
As at 31 December 2021
Gross amounts of recognised
financial assets
Gross amounts of recognised
financial assets set off in the
balance sheet
Net amounts of financial assets
presented in the balance sheet
Financial instruments
Cash collateral
received Net amount
Derivative financial assets 401 (112) 289 (107) (27) 155
As at 31 December 2020
Derivative financial assets 306 (148) 158 (91) (16) 51
(ii) Financial liabilities The following financial liabilities are subject to offsetting, enforceable master netting arrangements and similar agreements.
Related amounts not setoff in the balance sheet
€ million € million € million € million € million € million
As at 31 December 2021
Gross amounts of recognised
financial liabilities
Gross amounts of recognised
financial liabilities
set off in thebalance sheet
Net amounts of financial
liabilities presented in the
balance sheetFinancial
instruments
Cash collateral
received Net amount
Derivative financial liabilities (347) 112 (235) 107 — (128)
As at 31 December 2020
Derivative financial liabilities (566) 148 (418) 91 — (327)
Unilever Annual Report and Accounts 2021 155
FINA
NC
IAL STA
TEMEN
TS
17. Investment and returnCash and cash equivalents
Cash and cash equivalents in the balance sheet include deposits, investments in money market funds and highly liquid investments. To beclassified as cash and cash equivalents, an asset must:▪ be readily convertible into cash;▪ have an insignificant risk of changes in value; and▪ have a maturity period of typically three months or less at acquisition.Cash and cash equivalents in the cash flow statement also include bank overdrafts and are recorded at amortised cost.Other financial assets
The Group classifies its financial assets into the following measurement categories:▪ those to be measured subsequently at fair value (either through other comprehensive income, or through profit or loss), and▪ those to be measured at amortised cost.
This classification depends on our business model for managing the financial asset and the contractual terms of the cash flows.
At initial recognition, the Group measures a financial asset at its fair value plus, in the case of a financial asset not at fair value through profit orloss, transaction costs that are directly attributable to the acquisition of the financial asset. Transaction costs of financial assets carried at fairvalue through profit or loss are expensed in profit or loss.
All financial assets are either debt instruments or equity instruments. Debt instruments are those that provide the Group with a contractual rightto receive cash or another asset. Equity instruments are those where the Group has no contractual right to receive cash or another asset.
Debt instruments
The subsequent measurement of debt instruments depends on the Group’s business model for managing the asset and the cash flowcharacteristics of the asset. There are three measurement categories that debt instruments are classified as:▪ financial assets at amortised cost;▪ financial assets at fair value through other comprehensive income; or▪ financial assets at fair value through profit or loss.
(i) Amortised cost
Assets measured at amortised cost are those which are held to collect contractual cash flows on the repayment of principal or interest (SPPI). Again or loss on a debt investment recognised at amortised cost on derecognition or impairment is recognised in profit or loss. Interest income isrecognised within finance income using the effective interest rate method.
(ii) Fair value through other comprehensive income
Assets that are held at fair value through other comprehensive income are those that are held to collect contractual cash flows on therepayment of principal and interest and which are held to recognise a capital gain through the sale of the asset. Movements in the carryingamount are recognised in other comprehensive income except for the recognition of impairment, interest income and foreign exchange gains orlosses which are recognised in profit or loss. On derecognition, the cumulative gain or loss recognised in other comprehensive income isreclassified from equity to profit or loss. Interest income is included in finance income using the effective interest rate method.
(iii) Fair value through profit or loss
Assets that do not meet the criteria for either amortised cost or fair value through other comprehensive income are measured as fair valuethrough profit or loss. Related transaction costs are expensed as incurred. Unless they form part of a hedging relationship, these assets are heldat fair value, with changes being recognised in the income statement. Interest income from these assets is included within finance income.
Equity instruments
The Group subsequently measures all equity instruments at fair value. Where the Group has elected to present fair value gains and losses onequity investments in other comprehensive income, there is no subsequent reclassification of fair value gains or losses to profit or loss. Dividendsfrom these investments continue to be recognised in profit or loss.Impairment of financial assets
Financial instruments classified as amortised cost and debt instruments classified as fair value through other comprehensive income areassessed for impairment. The Group assesses the probability of default of an asset at initial recognition and then whether there has been asignificant increase in credit risk on an ongoing basis.
To assess whether there is a significant increase in credit risk, the Group compares the risk of a default occurring on the asset as at the reportingdate with the risk of default as at the date of initial recognition. It considers available reasonable and supportive forwarding-lookinginformation. Macroeconomic information (such as market interest rates or growth rates) is also considered.
Financial assets are written off when there is no reasonable expectation of recovery, such as a debtor failing to engage in a repayment plan withthe company. Impairment losses on assets classified as amortised cost are recognised in profit or loss. When a later event causes the impairmentlosses to decrease, the reduction in impairment loss is also recognised in profit or loss. Permanent impairment losses on debt instrumentsclassified as fair value through other comprehensive income are recognised in profit or loss.
156 Unilever Annual Report and Accounts 2021
Notes to the Consolidated Financial Statements Unilever Group continued
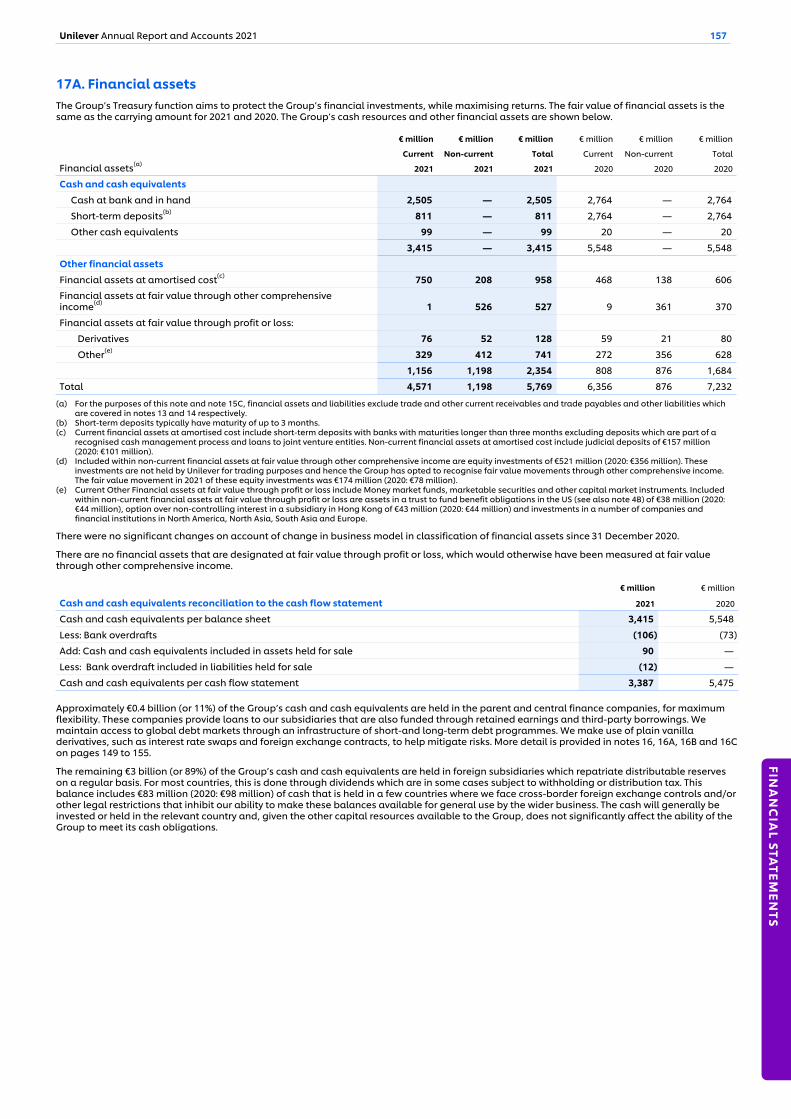
17A. Financial assets The Group’s Treasury function aims to protect the Group’s financial investments, while maximising returns. The fair value of financial assets is the same as the carrying amount for 2021 and 2020. The Group’s cash resources and other financial assets are shown below.
€ million € million € million € million € million € million
Current Non-current Total Current Non-current Total
Financial assets(a)2021 2021 2021 2020 2020 2020
Cash and cash equivalents
Cash at bank and in hand 2,505 — 2,505 2,764 — 2,764
Short-term deposits(b) 811 — 811 2,764 — 2,764
Other cash equivalents 99 — 99 20 — 20
3,415 — 3,415 5,548 — 5,548
Other financial assets
Financial assets at amortised cost(c) 750 208 958 468 138 606
Financial assets at fair value through other comprehensive income(d) 1 526 527 9 361 370
Financial assets at fair value through profit or loss:
Derivatives 76 52 128 59 21 80
Other(e) 329 412 741 272 356 628
1,156 1,198 2,354 808 876 1,684
Total 4,571 1,198 5,769 6,356 876 7,232
(a) For the purposes of this note and note 15C, financial assets and liabilities exclude trade and other current receivables and trade payables and other liabilities which are covered in notes 13 and 14 respectively.
(b) Short-term deposits typically have maturity of up to 3 months. (c) Current financial assets at amortised cost include short-term deposits with banks with maturities longer than three months excluding deposits which are part of a
recognised cash management process and loans to joint venture entities. Non-current financial assets at amortised cost include judicial deposits of €157 million (2020: €101 million).
(d) Included within non-current financial assets at fair value through other comprehensive income are equity investments of €521 million (2020: €356 million). These investments are not held by Unilever for trading purposes and hence the Group has opted to recognise fair value movements through other comprehensive income. The fair value movement in 2021 of these equity investments was €174 million (2020: €78 million).
(e) Current Other Financial assets at fair value through profit or loss include Money market funds, marketable securities and other capital market instruments. Included within non-current financial assets at fair value through profit or loss are assets in a trust to fund benefit obligations in the US (see also note 4B) of €38 million (2020: €44 million), option over non-controlling interest in a subsidiary in Hong Kong of €43 million (2020: €44 million) and investments in a number of companies and financial institutions in North America, North Asia, South Asia and Europe.
There were no significant changes on account of change in business model in classification of financial assets since 31 December 2020.
There are no financial assets that are designated at fair value through profit or loss, which would otherwise have been measured at fair value through other comprehensive income.
€ million € million
Cash and cash equivalents reconciliation to the cash flow statement 2021 2020
Cash and cash equivalents per balance sheet 3,415 5,548
Less: Bank overdrafts (106) (73)
Add: Cash and cash equivalents included in assets held for sale 90 —
Less: Bank overdraft included in liabilities held for sale (12) —
Cash and cash equivalents per cash flow statement 3,387 5,475
Approximately €0.4 billion (or 11%) of the Group’s cash and cash equivalents are held in the parent and central finance companies, for maximum flexibility. These companies provide loans to our subsidiaries that are also funded through retained earnings and third-party borrowings. We maintain access to global debt markets through an infrastructure of short-and long-term debt programmes. We make use of plain vanilla derivatives, such as interest rate swaps and foreign exchange contracts, to help mitigate risks. More detail is provided in notes 16, 16A, 16B and 16C on pages 149 to 155.
The remaining €3 billion (or 89%) of the Group’s cash and cash equivalents are held in foreign subsidiaries which repatriate distributable reserves on a regular basis. For most countries, this is done through dividends which are in some cases subject to withholding or distribution tax. This balance includes €83 million (2020: €98 million) of cash that is held in a few countries where we face cross-border foreign exchange controls and/or other legal restrictions that inhibit our ability to make these balances available for general use by the wider business. The cash will generally be invested or held in the relevant country and, given the other capital resources available to the Group, does not significantly affect the ability of the Group to meet its cash obligations.
Unilever Annual Report and Accounts 2021 157
FINA
NC
IAL STA
TEMEN
TS
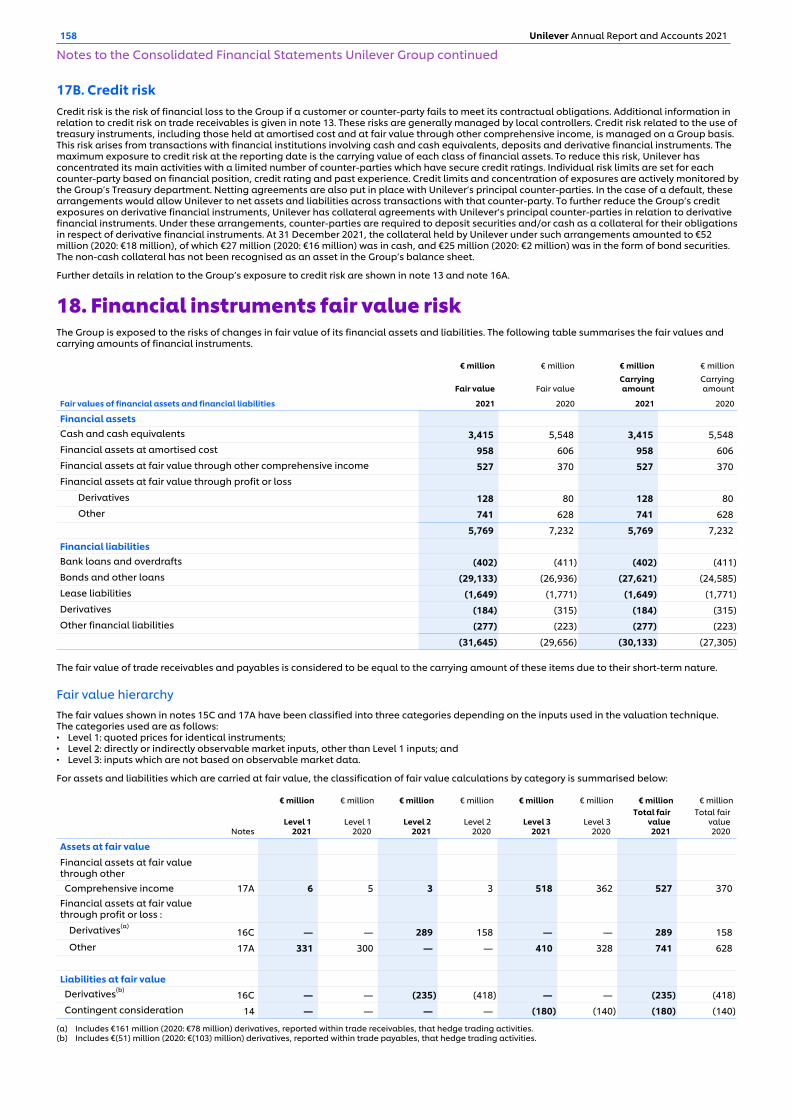
17B. Credit risk Credit risk is the risk of financial loss to the Group if a customer or counter-party fails to meet its contractual obligations. Additional information in relation to credit risk on trade receivables is given in note 13. These risks are generally managed by local controllers. Credit risk related to the use of treasury instruments, including those held at amortised cost and at fair value through other comprehensive income, is managed on a Group basis. This risk arises from transactions with financial institutions involving cash and cash equivalents, deposits and derivative financial instruments. The maximum exposure to credit risk at the reporting date is the carrying value of each class of financial assets. To reduce this risk, Unilever has concentrated its main activities with a limited number of counter-parties which have secure credit ratings. Individual risk limits are set for each counter-party based on financial position, credit rating and past experience. Credit limits and concentration of exposures are actively monitored by the Group’s Treasury department. Netting agreements are also put in place with Unilever’s principal counter-parties. In the case of a default, these arrangements would allow Unilever to net assets and liabilities across transactions with that counter-party. To further reduce the Group’s credit exposures on derivative financial instruments, Unilever has collateral agreements with Unilever’s principal counter-parties in relation to derivative financial instruments. Under these arrangements, counter-parties are required to deposit securities and/or cash as a collateral for their obligations in respect of derivative financial instruments. At 31 December 2021, the collateral held by Unilever under such arrangements amounted to €52 million (2020: €18 million), of which €27 million (2020: €16 million) was in cash, and €25 million (2020: €2 million) was in the form of bond securities. The non-cash collateral has not been recognised as an asset in the Group’s balance sheet.
Further details in relation to the Group’s exposure to credit risk are shown in note 13 and note 16A.
18. Financial instruments fair value riskThe Group is exposed to the risks of changes in fair value of its financial assets and liabilities. The following table summarises the fair values and carrying amounts of financial instruments.
€ million € million € million € million
Fair value Fair valueCarryingamount
Carryingamount
Fair values of financial assets and financial liabilities 2021 2020 2021 2020
Financial assets Cash and cash equivalents 3,415 5,548 3,415 5,548 Financial assets at amortised cost 958 606 958 606 Financial assets at fair value through other comprehensive income 527 370 527 370 Financial assets at fair value through profit or loss
Derivatives 128 80 128 80 Other 741 628 741 628
5,769 7,232 5,769 7,232
Financial liabilitiesBank loans and overdrafts (402) (411) (402) (411) Bonds and other loans (29,133) (26,936) (27,621) (24,585) Lease liabilities (1,649) (1,771) (1,649) (1,771) Derivatives (184) (315) (184) (315) Other financial liabilities (277) (223) (277) (223)
(31,645) (29,656) (30,133) (27,305)
The fair value of trade receivables and payables is considered to be equal to the carrying amount of these items due to their short-term nature.
Fair value hierarchyThe fair values shown in notes 15C and 17A have been classified into three categories depending on the inputs used in the valuation technique.The categories used are as follows:▪ Level 1: quoted prices for identical instruments;▪ Level 2: directly or indirectly observable market inputs, other than Level 1 inputs; and▪ Level 3: inputs which are not based on observable market data.
For assets and liabilities which are carried at fair value, the classification of fair value calculations by category is summarised below:
€ million € million € million € million € million € million € million € million
NotesLevel 1
2021Level 1
2020Level 2
2021Level 2
2020Level 3
2021Level 3
2020
Total fairvalue2021
Total fairvalue2020
Assets at fair valueFinancial assets at fair value through other Comprehensive income 17A 6 5 3 3 518 362 527 370 Financial assets at fair value through profit or loss :
Derivatives(a)16C — — 289 158 — — 289 158
Other 17A 331 300 — — 410 328 741 628
Liabilities at fair value Derivatives(b)
16C — — (235) (418) — — (235) (418) Contingent consideration 14 — — — — (180) (140) (180) (140)
(a) Includes €161 million (2020: €78 million) derivatives, reported within trade receivables, that hedge trading activities.(b) Includes €(51) million (2020: €(103) million) derivatives, reported within trade payables, that hedge trading activities.
158 Unilever Annual Report and Accounts 2021
Notes to the Consolidated Financial Statements Unilever Group continued
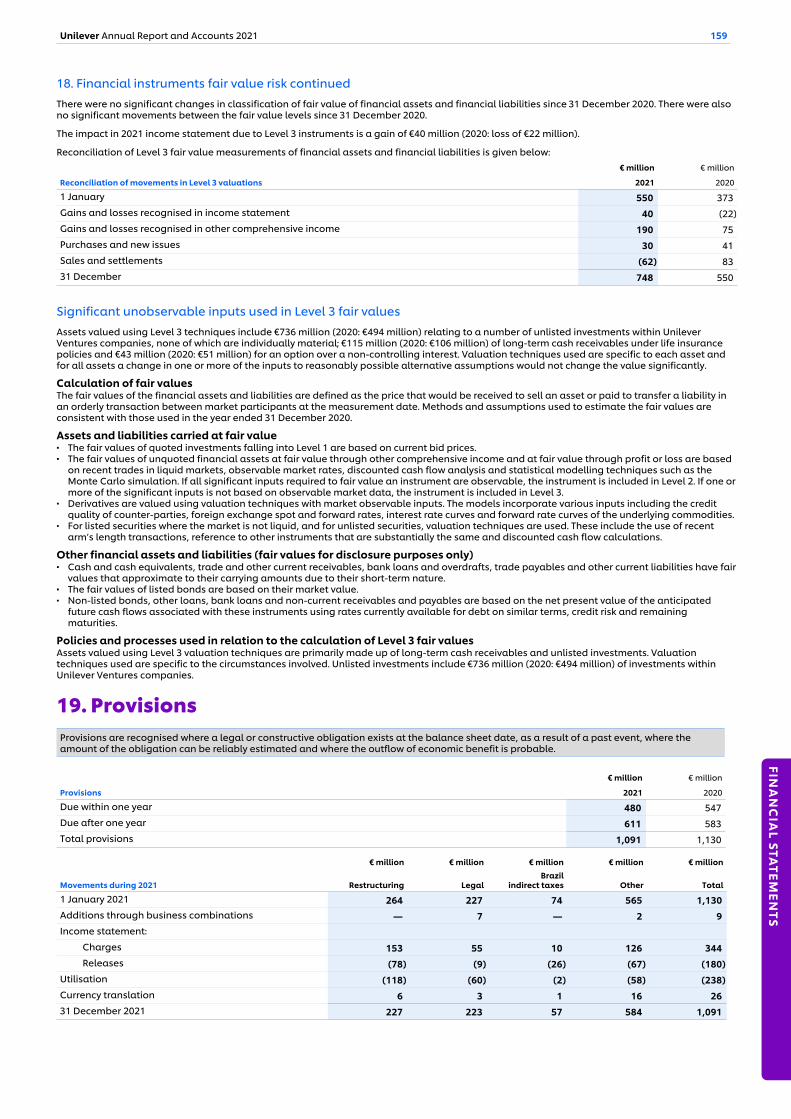
18. Financial instruments fair value risk continuedThere were no significant changes in classification of fair value of financial assets and financial liabilities since 31 December 2020. There were also no significant movements between the fair value levels since 31 December 2020.
The impact in 2021 income statement due to Level 3 instruments is a gain of €40 million (2020: loss of €22 million).
Reconciliation of Level 3 fair value measurements of financial assets and financial liabilities is given below:€ million € million
Reconciliation of movements in Level 3 valuations 2021 2020
1 January 550 373 Gains and losses recognised in income statement 40 (22) Gains and losses recognised in other comprehensive income 190 75 Purchases and new issues 30 41 Sales and settlements (62) 83 31 December 748 550
Significant unobservable inputs used in Level 3 fair valuesAssets valued using Level 3 techniques include €736 million (2020: €494 million) relating to a number of unlisted investments within Unilever Ventures companies, none of which are individually material; €115 million (2020: €106 million) of long-term cash receivables under life insurance policies and €43 million (2020: €51 million) for an option over a non-controlling interest. Valuation techniques used are specific to each asset and for all assets a change in one or more of the inputs to reasonably possible alternative assumptions would not change the value significantly.
Calculation of fair values The fair values of the financial assets and liabilities are defined as the price that would be received to sell an asset or paid to transfer a liability in an orderly transaction between market participants at the measurement date. Methods and assumptions used to estimate the fair values are consistent with those used in the year ended 31 December 2020.
Assets and liabilities carried at fair value▪ The fair values of quoted investments falling into Level 1 are based on current bid prices. ▪ The fair values of unquoted financial assets at fair value through other comprehensive income and at fair value through profit or loss are based
on recent trades in liquid markets, observable market rates, discounted cash flow analysis and statistical modelling techniques such as the Monte Carlo simulation. If all significant inputs required to fair value an instrument are observable, the instrument is included in Level 2. If one or more of the significant inputs is not based on observable market data, the instrument is included in Level 3.
▪ Derivatives are valued using valuation techniques with market observable inputs. The models incorporate various inputs including the credit quality of counter-parties, foreign exchange spot and forward rates, interest rate curves and forward rate curves of the underlying commodities.
▪ For listed securities where the market is not liquid, and for unlisted securities, valuation techniques are used. These include the use of recent arm’s length transactions, reference to other instruments that are substantially the same and discounted cash flow calculations.
Other financial assets and liabilities (fair values for disclosure purposes only)▪ Cash and cash equivalents, trade and other current receivables, bank loans and overdrafts, trade payables and other current liabilities have fair
values that approximate to their carrying amounts due to their short-term nature.▪ The fair values of listed bonds are based on their market value.▪ Non-listed bonds, other loans, bank loans and non-current receivables and payables are based on the net present value of the anticipated
future cash flows associated with these instruments using rates currently available for debt on similar terms, credit risk and remaining maturities.
Policies and processes used in relation to the calculation of Level 3 fair valuesAssets valued using Level 3 valuation techniques are primarily made up of long-term cash receivables and unlisted investments. Valuation techniques used are specific to the circumstances involved. Unlisted investments include €736 million (2020: €494 million) of investments within Unilever Ventures companies.
19. ProvisionsProvisions are recognised where a legal or constructive obligation exists at the balance sheet date, as a result of a past event, where the amount of the obligation can be reliably estimated and where the outflow of economic benefit is probable.
€ million € million
Provisions 2021 2020
Due within one year 480 547 Due after one year 611 583 Total provisions 1,091 1,130
€ million € million € million € million € million
Movements during 2021 Restructuring LegalBrazil
indirect taxes Other Total
1 January 2021 264 227 74 565 1,130 Additions through business combinations — 7 — 2 9 Income statement:
Charges 153 55 10 126 344 Releases (78) (9) (26) (67) (180)
Utilisation (118) (60) (2) (58) (238) Currency translation 6 3 1 16 26 31 December 2021 227 223 57 584 1,091
Unilever Annual Report and Accounts 2021 159
FINA
NC
IAL STA
TEMEN
TS
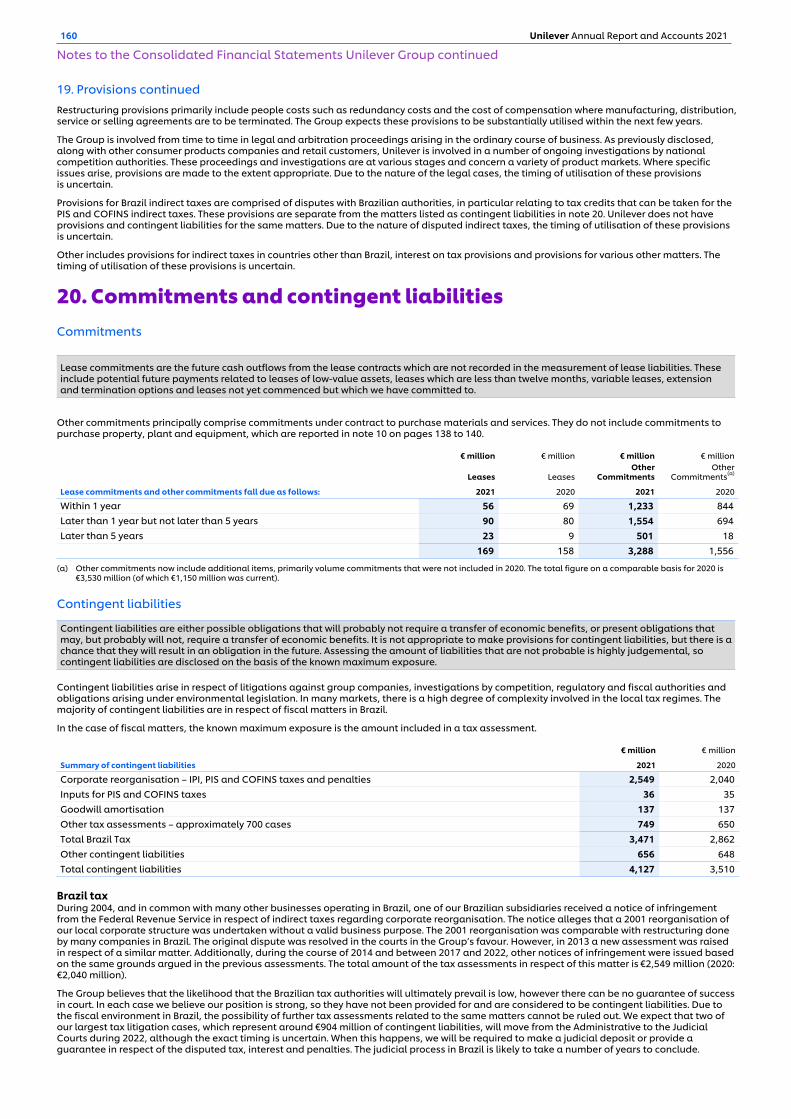
19. Provisions continuedRestructuring provisions primarily include people costs such as redundancy costs and the cost of compensation where manufacturing, distribution, service or selling agreements are to be terminated. The Group expects these provisions to be substantially utilised within the next few years.
The Group is involved from time to time in legal and arbitration proceedings arising in the ordinary course of business. As previously disclosed, along with other consumer products companies and retail customers, Unilever is involved in a number of ongoing investigations by national competition authorities. These proceedings and investigations are at various stages and concern a variety of product markets. Where specific issues arise, provisions are made to the extent appropriate. Due to the nature of the legal cases, the timing of utilisation of these provisions is uncertain.
Provisions for Brazil indirect taxes are comprised of disputes with Brazilian authorities, in particular relating to tax credits that can be taken for the PIS and COFINS indirect taxes. These provisions are separate from the matters listed as contingent liabilities in note 20. Unilever does not have provisions and contingent liabilities for the same matters. Due to the nature of disputed indirect taxes, the timing of utilisation of these provisions is uncertain.
Other includes provisions for indirect taxes in countries other than Brazil, interest on tax provisions and provisions for various other matters. The timing of utilisation of these provisions is uncertain.
20. Commitments and contingent liabilitiesCommitments
Lease commitments are the future cash outflows from the lease contracts which are not recorded in the measurement of lease liabilities. These include potential future payments related to leases of low-value assets, leases which are less than twelve months, variable leases, extension and termination options and leases not yet commenced but which we have committed to.
Other commitments principally comprise commitments under contract to purchase materials and services. They do not include commitments to purchase property, plant and equipment, which are reported in note 10 on pages 138 to 140.
€ million € million € million € million
Leases LeasesOther
CommitmentsOther
Commitments(a)
Lease commitments and other commitments fall due as follows: 2021 2020 2021 2020
Within 1 year 56 69 1,233 844 Later than 1 year but not later than 5 years 90 80 1,554 694 Later than 5 years 23 9 501 18
169 158 3,288 1,556
(a) Other commitments now include additional items, primarily volume commitments that were not included in 2020. The total figure on a comparable basis for 2020 is €3,530 million (of which €1,150 million was current).
Contingent liabilities
Contingent liabilities are either possible obligations that will probably not require a transfer of economic benefits, or present obligations that may, but probably will not, require a transfer of economic benefits. It is not appropriate to make provisions for contingent liabilities, but there is a chance that they will result in an obligation in the future. Assessing the amount of liabilities that are not probable is highly judgemental, so contingent liabilities are disclosed on the basis of the known maximum exposure.
Contingent liabilities arise in respect of litigations against group companies, investigations by competition, regulatory and fiscal authorities and obligations arising under environmental legislation. In many markets, there is a high degree of complexity involved in the local tax regimes. The majority of contingent liabilities are in respect of fiscal matters in Brazil.
In the case of fiscal matters, the known maximum exposure is the amount included in a tax assessment.
€ million € million
Summary of contingent liabilities 2021 2020
Corporate reorganisation – IPI, PIS and COFINS taxes and penalties 2,549 2,040 Inputs for PIS and COFINS taxes 36 35 Goodwill amortisation 137 137 Other tax assessments – approximately 700 cases 749 650 Total Brazil Tax 3,471 2,862 Other contingent liabilities 656 648 Total contingent liabilities 4,127 3,510
Brazil taxDuring 2004, and in common with many other businesses operating in Brazil, one of our Brazilian subsidiaries received a notice of infringement from the Federal Revenue Service in respect of indirect taxes regarding corporate reorganisation. The notice alleges that a 2001 reorganisation of our local corporate structure was undertaken without a valid business purpose. The 2001 reorganisation was comparable with restructuring done by many companies in Brazil. The original dispute was resolved in the courts in the Group’s favour. However, in 2013 a new assessment was raised in respect of a similar matter. Additionally, during the course of 2014 and between 2017 and 2022, other notices of infringement were issued based on the same grounds argued in the previous assessments. The total amount of the tax assessments in respect of this matter is €2,549 million (2020: €2,040 million).
The Group believes that the likelihood that the Brazilian tax authorities will ultimately prevail is low, however there can be no guarantee of success in court. In each case we believe our position is strong, so they have not been provided for and are considered to be contingent liabilities. Due to the fiscal environment in Brazil, the possibility of further tax assessments related to the same matters cannot be ruled out. We expect that two of our largest tax litigation cases, which represent around €904 million of contingent liabilities, will move from the Administrative to the Judicial Courts during 2022, although the exact timing is uncertain. When this happens, we will be required to make a judicial deposit or provide a guarantee in respect of the disputed tax, interest and penalties. The judicial process in Brazil is likely to take a number of years to conclude.
160 Unilever Annual Report and Accounts 2021
Notes to the Consolidated Financial Statements Unilever Group continued
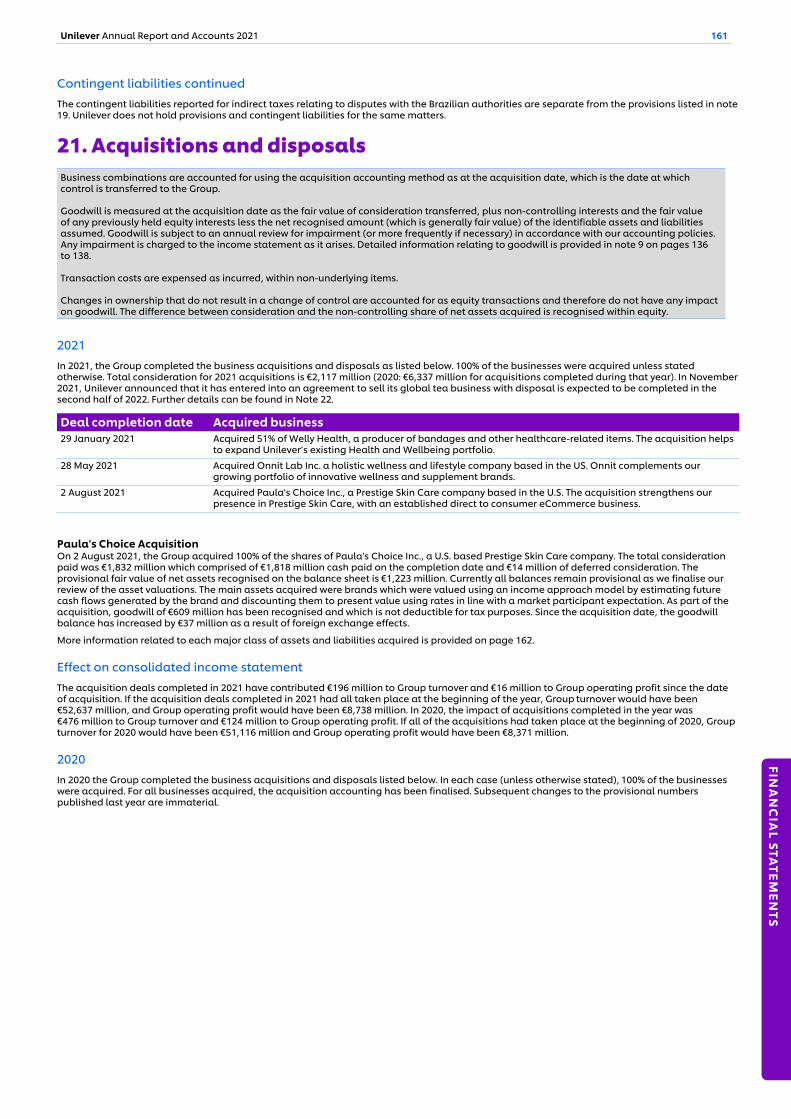
Contingent liabilities continuedThe contingent liabilities reported for indirect taxes relating to disputes with the Brazilian authorities are separate from the provisions listed in note 19. Unilever does not hold provisions and contingent liabilities for the same matters.
21. Acquisitions and disposalsBusiness combinations are accounted for using the acquisition accounting method as at the acquisition date, which is the date at which control is transferred to the Group.
Goodwill is measured at the acquisition date as the fair value of consideration transferred, plus non-controlling interests and the fair value of any previously held equity interests less the net recognised amount (which is generally fair value) of the identifiable assets and liabilities assumed. Goodwill is subject to an annual review for impairment (or more frequently if necessary) in accordance with our accounting policies. Any impairment is charged to the income statement as it arises. Detailed information relating to goodwill is provided in note 9 on pages 136 to 138.
Transaction costs are expensed as incurred, within non-underlying items.
Changes in ownership that do not result in a change of control are accounted for as equity transactions and therefore do not have any impact on goodwill. The difference between consideration and the non-controlling share of net assets acquired is recognised within equity.
2021In 2021, the Group completed the business acquisitions and disposals as listed below. 100% of the businesses were acquired unless stated otherwise. Total consideration for 2021 acquisitions is €2,117 million (2020: €6,337 million for acquisitions completed during that year). In November 2021, Unilever announced that it has entered into an agreement to sell its global tea business with disposal is expected to be completed in the second half of 2022. Further details can be found in Note 22.
Deal completion date Acquired business29 January 2021 Acquired 51% of Welly Health, a producer of bandages and other healthcare-related items. The acquisition helps
to expand Unilever’s existing Health and Wellbeing portfolio.
28 May 2021 Acquired Onnit Lab Inc. a holistic wellness and lifestyle company based in the US. Onnit complements our growing portfolio of innovative wellness and supplement brands.
2 August 2021 Acquired Paula's Choice Inc., a Prestige Skin Care company based in the U.S. The acquisition strengthens our presence in Prestige Skin Care, with an established direct to consumer eCommerce business.
Paula's Choice AcquisitionOn 2 August 2021, the Group acquired 100% of the shares of Paula's Choice Inc., a U.S. based Prestige Skin Care company. The total consideration paid was €1,832 million which comprised of €1,818 million cash paid on the completion date and €14 million of deferred consideration. The provisional fair value of net assets recognised on the balance sheet is €1,223 million. Currently all balances remain provisional as we finalise our review of the asset valuations. The main assets acquired were brands which were valued using an income approach model by estimating future cash flows generated by the brand and discounting them to present value using rates in line with a market participant expectation. As part of the acquisition, goodwill of €609 million has been recognised and which is not deductible for tax purposes. Since the acquisition date, the goodwill balance has increased by €37 million as a result of foreign exchange effects.
More information related to each major class of assets and liabilities acquired is provided on page 162.
Effect on consolidated income statementThe acquisition deals completed in 2021 have contributed €196 million to Group turnover and €16 million to Group operating profit since the date of acquisition. If the acquisition deals completed in 2021 had all taken place at the beginning of the year, Group turnover would have been €52,637 million, and Group operating profit would have been €8,738 million. In 2020, the impact of acquisitions completed in the year was €476 million to Group turnover and €124 million to Group operating profit. If all of the acquisitions had taken place at the beginning of 2020, Group turnover for 2020 would have been €51,116 million and Group operating profit would have been €8,371 million.
2020In 2020 the Group completed the business acquisitions and disposals listed below. In each case (unless otherwise stated), 100% of the businesses were acquired. For all businesses acquired, the acquisition accounting has been finalised. Subsequent changes to the provisional numbers published last year are immaterial.
Unilever Annual Report and Accounts 2021 161
FINA
NC
IAL STA
TEMEN
TS
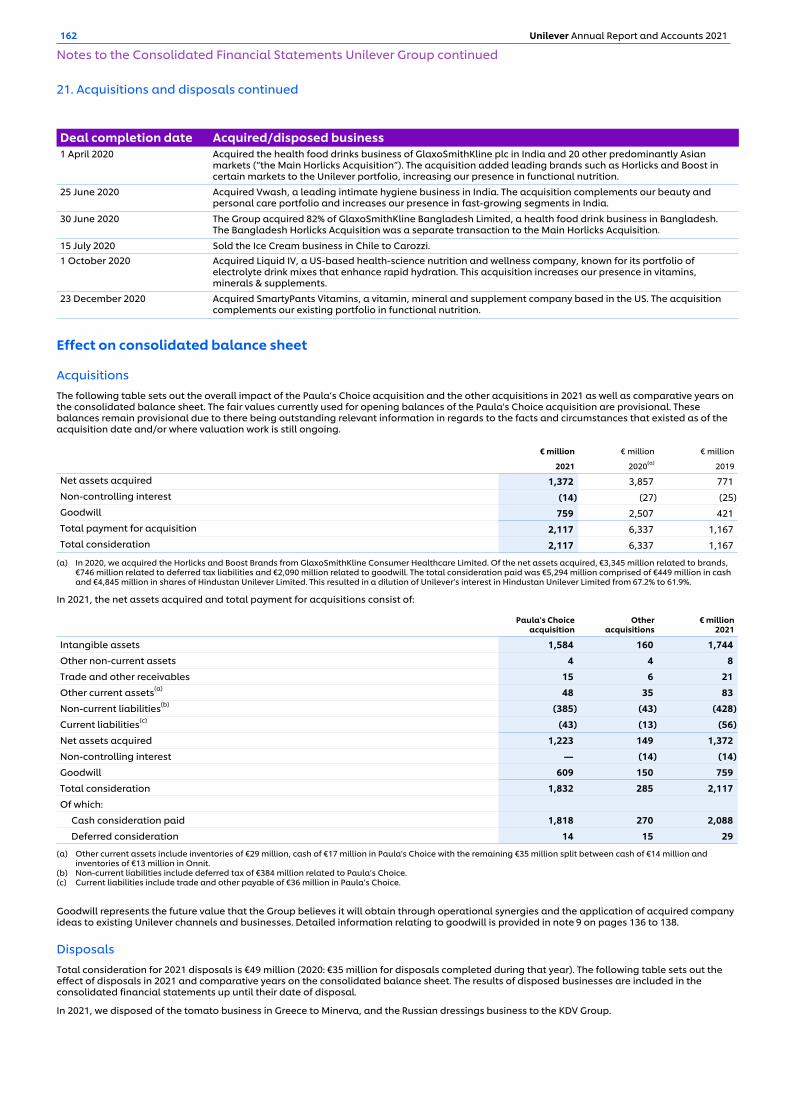
21. Acquisitions and disposals continued
Deal completion date Acquired/disposed business1 April 2020 Acquired the health food drinks business of GlaxoSmithKline plc in India and 20 other predominantly Asian
markets (“the Main Horlicks Acquisition”). The acquisition added leading brands such as Horlicks and Boost in certain markets to the Unilever portfolio, increasing our presence in functional nutrition.
25 June 2020 Acquired Vwash, a leading intimate hygiene business in India. The acquisition complements our beauty and personal care portfolio and increases our presence in fast-growing segments in India.
30 June 2020 The Group acquired 82% of GlaxoSmithKline Bangladesh Limited, a health food drink business in Bangladesh. The Bangladesh Horlicks Acquisition was a separate transaction to the Main Horlicks Acquisition.
15 July 2020 Sold the Ice Cream business in Chile to Carozzi.1 October 2020 Acquired Liquid IV, a US-based health-science nutrition and wellness company, known for its portfolio of
electrolyte drink mixes that enhance rapid hydration. This acquisition increases our presence in vitamins, minerals & supplements.
23 December 2020 Acquired SmartyPants Vitamins, a vitamin, mineral and supplement company based in the US. The acquisition complements our existing portfolio in functional nutrition.
Effect on consolidated balance sheet
AcquisitionsThe following table sets out the overall impact of the Paula’s Choice acquisition and the other acquisitions in 2021 as well as comparative years on the consolidated balance sheet. The fair values currently used for opening balances of the Paula's Choice acquisition are provisional. These balances remain provisional due to there being outstanding relevant information in regards to the facts and circumstances that existed as of the acquisition date and/or where valuation work is still ongoing.
€ million € million € million
2021 2020(a) 2019
Net assets acquired 1,372 3,857 771 Non-controlling interest (14) (27) (25) Goodwill 759 2,507 421 Total payment for acquisition 2,117 6,337 1,167 Total consideration 2,117 6,337 1,167
(a) In 2020, we acquired the Horlicks and Boost Brands from GlaxoSmithKline Consumer Healthcare Limited. Of the net assets acquired, €3,345 million related to brands, €746 million related to deferred tax liabilities and €2,090 million related to goodwill. The total consideration paid was €5,294 million comprised of €449 million in cash and €4,845 million in shares of Hindustan Unilever Limited. This resulted in a dilution of Unilever’s interest in Hindustan Unilever Limited from 67.2% to 61.9%.
In 2021, the net assets acquired and total payment for acquisitions consist of:
Paula's Choiceacquisition
Other acquisitions
€ million2021
Intangible assets 1,584 160 1,744
Other non-current assets 4 4 8
Trade and other receivables 15 6 21
Other current assets(a) 48 35 83
Non-current liabilities(b) (385) (43) (428)
Current liabilities(c) (43) (13) (56)
Net assets acquired 1,223 149 1,372
Non-controlling interest — (14) (14)
Goodwill 609 150 759
Total consideration 1,832 285 2,117
Of which:
Cash consideration paid 1,818 270 2,088
Deferred consideration 14 15 29
(a) Other current assets include inventories of €29 million, cash of €17 million in Paula's Choice with the remaining €35 million split between cash of €14 million and inventories of €13 million in Onnit.
(b) Non-current liabilities include deferred tax of €384 million related to Paula’s Choice.(c) Current liabilities include trade and other payable of €36 million in Paula’s Choice.
Goodwill represents the future value that the Group believes it will obtain through operational synergies and the application of acquired company ideas to existing Unilever channels and businesses. Detailed information relating to goodwill is provided in note 9 on pages 136 to 138.
DisposalsTotal consideration for 2021 disposals is €49 million (2020: €35 million for disposals completed during that year). The following table sets out the effect of disposals in 2021 and comparative years on the consolidated balance sheet. The results of disposed businesses are included in the consolidated financial statements up until their date of disposal.
In 2021, we disposed of the tomato business in Greece to Minerva, and the Russian dressings business to the KDV Group.
162 Unilever Annual Report and Accounts 2021
Notes to the Consolidated Financial Statements Unilever Group continued
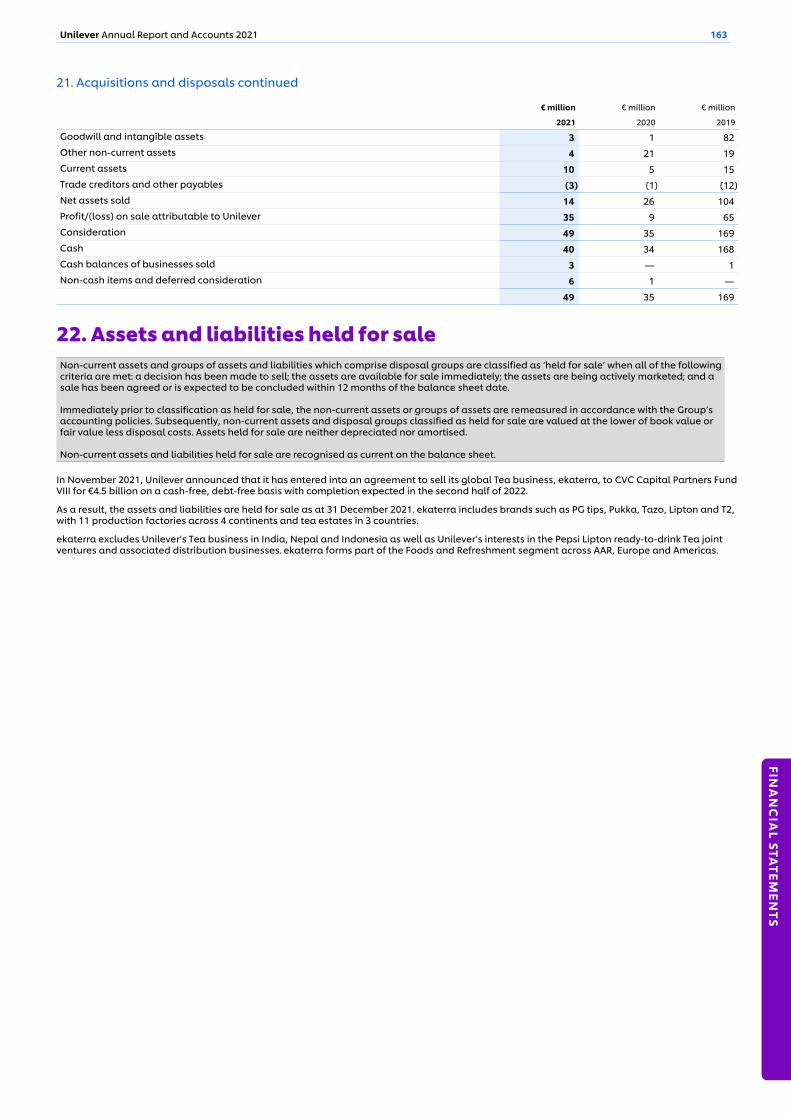
21. Acquisitions and disposals continued
€ million € million € million
2021 2020 2019
Goodwill and intangible assets 3 1 82 Other non-current assets 4 21 19 Current assets 10 5 15 Trade creditors and other payables (3) (1) (12) Net assets sold 14 26 104 Profit/(loss) on sale attributable to Unilever 35 9 65 Consideration 49 35 169 Cash 40 34 168 Cash balances of businesses sold 3 — 1 Non-cash items and deferred consideration 6 1 —
49 35 169
22. Assets and liabilities held for saleNon-current assets and groups of assets and liabilities which comprise disposal groups are classified as ‘held for sale’ when all of the following criteria are met: a decision has been made to sell; the assets are available for sale immediately; the assets are being actively marketed; and a sale has been agreed or is expected to be concluded within 12 months of the balance sheet date.
Immediately prior to classification as held for sale, the non-current assets or groups of assets are remeasured in accordance with the Group’s accounting policies. Subsequently, non-current assets and disposal groups classified as held for sale are valued at the lower of book value or fair value less disposal costs. Assets held for sale are neither depreciated nor amortised.
Non-current assets and liabilities held for sale are recognised as current on the balance sheet.
In November 2021, Unilever announced that it has entered into an agreement to sell its global Tea business, ekaterra, to CVC Capital Partners Fund VIII for €4.5 billion on a cash-free, debt-free basis with completion expected in the second half of 2022.
As a result, the assets and liabilities are held for sale as at 31 December 2021. ekaterra includes brands such as PG tips, Pukka, Tazo, Lipton and T2, with 11 production factories across 4 continents and tea estates in 3 countries.
ekaterra excludes Unilever’s Tea business in India, Nepal and Indonesia as well as Unilever’s interests in the Pepsi Lipton ready-to-drink Tea joint ventures and associated distribution businesses. ekaterra forms part of the Foods and Refreshment segment across AAR, Europe and Americas.
Unilever Annual Report and Accounts 2021 163
FINA
NC
IAL STA
TEMEN
TS
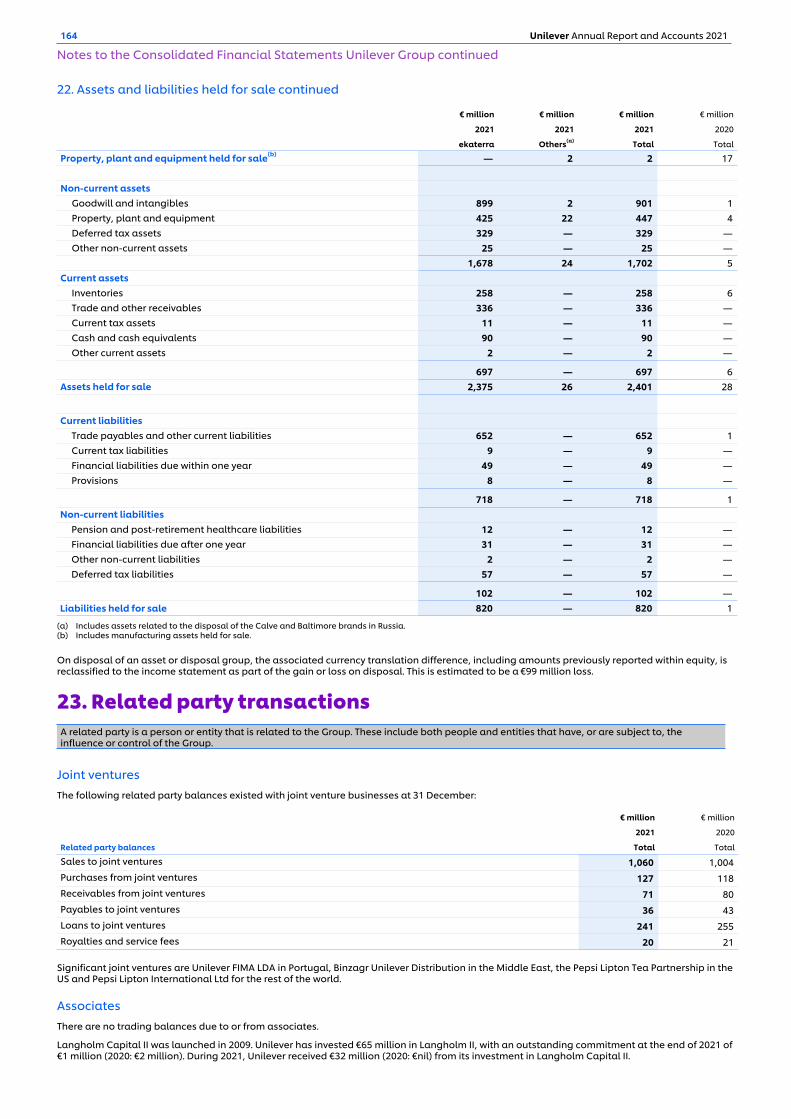
22. Assets and liabilities held for sale continued
€ million € million € million € million
2021 2021 2021 2020
ekaterra Others(a) Total Total
Property, plant and equipment held for sale(b) — 2 2 17
Non-current assetsGoodwill and intangibles 899 2 901 1 Property, plant and equipment 425 22 447 4 Deferred tax assets 329 — 329 — Other non-current assets 25 — 25 —
1,678 24 1,702 5 Current assets
Inventories 258 — 258 6 Trade and other receivables 336 — 336 — Current tax assets 11 — 11 — Cash and cash equivalents 90 — 90 — Other current assets 2 — 2 —
697 — 697 6 Assets held for sale 2,375 26 2,401 28
Current liabilitiesTrade payables and other current liabilities 652 — 652 1 Current tax liabilities 9 — 9 — Financial liabilities due within one year 49 — 49 — Provisions 8 — 8 —
718 — 718 1 Non-current liabilities
Pension and post-retirement healthcare liabilities 12 — 12 — Financial liabilities due after one year 31 — 31 — Other non-current liabilities 2 — 2 — Deferred tax liabilities 57 — 57 —
102 — 102 — Liabilities held for sale 820 — 820 1
(a) Includes assets related to the disposal of the Calve and Baltimore brands in Russia.(b) Includes manufacturing assets held for sale.
On disposal of an asset or disposal group, the associated currency translation difference, including amounts previously reported within equity, is reclassified to the income statement as part of the gain or loss on disposal. This is estimated to be a €99 million loss.
23. Related party transactionsA related party is a person or entity that is related to the Group. These include both people and entities that have, or are subject to, the influence or control of the Group.
Joint venturesThe following related party balances existed with joint venture businesses at 31 December:
€ million € million
2021 2020
Related party balances Total Total
Sales to joint ventures 1,060 1,004 Purchases from joint ventures 127 118 Receivables from joint ventures 71 80 Payables to joint ventures 36 43 Loans to joint ventures 241 255 Royalties and service fees 20 21
Significant joint ventures are Unilever FIMA LDA in Portugal, Binzagr Unilever Distribution in the Middle East, the Pepsi Lipton Tea Partnership in the US and Pepsi Lipton International Ltd for the rest of the world.
AssociatesThere are no trading balances due to or from associates.
Langholm Capital II was launched in 2009. Unilever has invested €65 million in Langholm II, with an outstanding commitment at the end of 2021 of €1 million (2020: €2 million). During 2021, Unilever received €32 million (2020: €nil) from its investment in Langholm Capital II.
164 Unilever Annual Report and Accounts 2021
Notes to the Consolidated Financial Statements Unilever Group continued
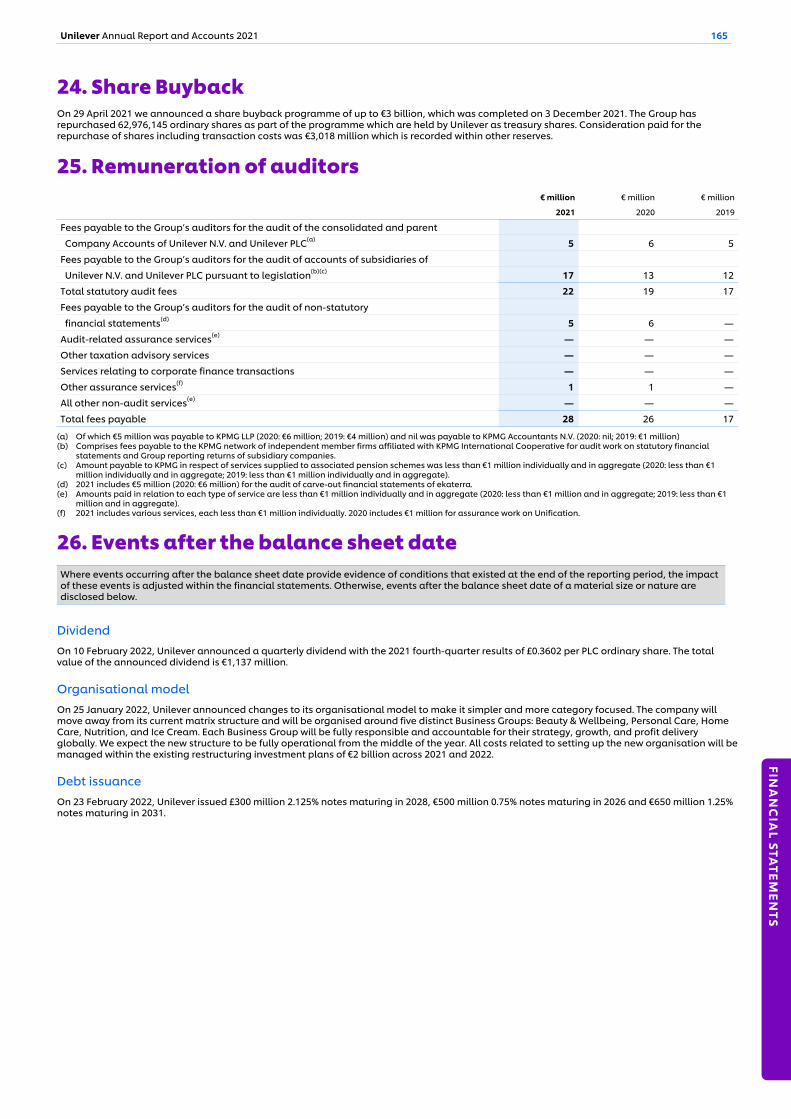
24. Share BuybackOn 29 April 2021 we announced a share buyback programme of up to €3 billion, which was completed on 3 December 2021. The Group has repurchased 62,976,145 ordinary shares as part of the programme which are held by Unilever as treasury shares. Consideration paid for the repurchase of shares including transaction costs was €3,018 million which is recorded within other reserves.
25. Remuneration of auditors€ million € million € million
2021 2020 2019
Fees payable to the Group’s auditors for the audit of the consolidated and parent
Company Accounts of Unilever N.V. and Unilever PLC(a) 5 6 5
Fees payable to the Group’s auditors for the audit of accounts of subsidiaries of
Unilever N.V. and Unilever PLC pursuant to legislation(b)(c) 17 13 12
Total statutory audit fees 22 19 17
Fees payable to the Group’s auditors for the audit of non-statutory
financial statements(d) 5 6 —
Audit-related assurance services(e) — — —
Other taxation advisory services — — —
Services relating to corporate finance transactions — — —
Other assurance services(f) 1 1 —
All other non-audit services(e) — — —
Total fees payable 28 26 17
(a) Of which €5 million was payable to KPMG LLP (2020: €6 million; 2019: €4 million) and nil was payable to KPMG Accountants N.V. (2020: nil; 2019: €1 million) (b) Comprises fees payable to the KPMG network of independent member firms affiliated with KPMG International Cooperative for audit work on statutory financial
statements and Group reporting returns of subsidiary companies.(c) Amount payable to KPMG in respect of services supplied to associated pension schemes was less than €1 million individually and in aggregate (2020: less than €1
million individually and in aggregate; 2019: less than €1 million individually and in aggregate).(d) 2021 includes €5 million (2020: €6 million) for the audit of carve-out financial statements of ekaterra. (e) Amounts paid in relation to each type of service are less than €1 million individually and in aggregate (2020: less than €1 million and in aggregate; 2019: less than €1
million and in aggregate).(f) 2021 includes various services, each less than €1 million individually. 2020 includes €1 million for assurance work on Unification.
26. Events after the balance sheet dateWhere events occurring after the balance sheet date provide evidence of conditions that existed at the end of the reporting period, the impactof these events is adjusted within the financial statements. Otherwise, events after the balance sheet date of a material size or nature aredisclosed below.
DividendOn 10 February 2022, Unilever announced a quarterly dividend with the 2021 fourth-quarter results of £0.3602 per PLC ordinary share. The total value of the announced dividend is €1,137 million.
Organisational modelOn 25 January 2022, Unilever announced changes to its organisational model to make it simpler and more category focused. The company will move away from its current matrix structure and will be organised around five distinct Business Groups: Beauty & Wellbeing, Personal Care, Home Care, Nutrition, and Ice Cream. Each Business Group will be fully responsible and accountable for their strategy, growth, and profit delivery globally. We expect the new structure to be fully operational from the middle of the year. All costs related to setting up the new organisation will be managed within the existing restructuring investment plans of €2 billion across 2021 and 2022.
Debt issuanceOn 23 February 2022, Unilever issued £300 million 2.125% notes maturing in 2028, €500 million 0.75% notes maturing in 2026 and €650 million 1.25% notes maturing in 2031.
Unilever Annual Report and Accounts 2021 165
FINA
NC
IAL STA
TEMEN
TS
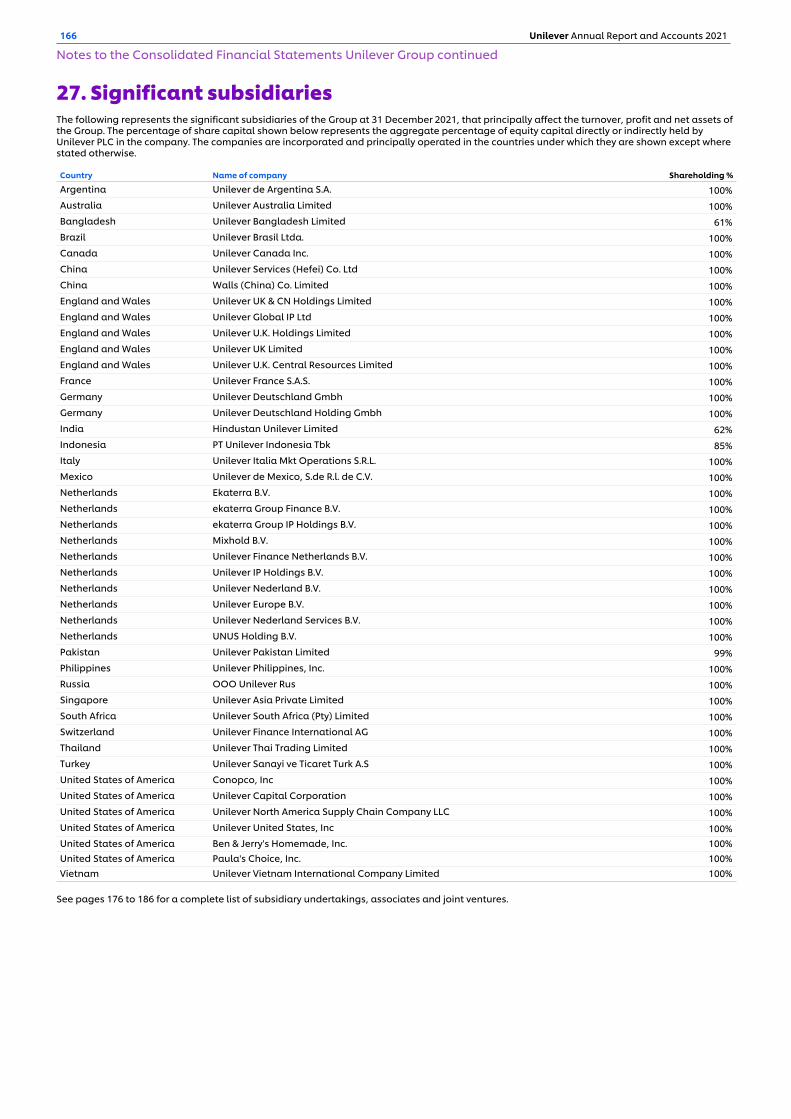
27. Significant subsidiariesThe following represents the significant subsidiaries of the Group at 31 December 2021, that principally affect the turnover, profit and net assets of the Group. The percentage of share capital shown below represents the aggregate percentage of equity capital directly or indirectly held by Unilever PLC in the company. The companies are incorporated and principally operated in the countries under which they are shown except where stated otherwise.
Country Name of company Shareholding %
Argentina Unilever de Argentina S.A. 100% Australia Unilever Australia Limited 100% Bangladesh Unilever Bangladesh Limited 61% Brazil Unilever Brasil Ltda. 100% Canada Unilever Canada Inc. 100% China Unilever Services (Hefei) Co. Ltd 100% China Walls (China) Co. Limited 100% England and Wales Unilever UK & CN Holdings Limited 100% England and Wales Unilever Global IP Ltd 100% England and Wales Unilever U.K. Holdings Limited 100% England and Wales Unilever UK Limited 100% England and Wales Unilever U.K. Central Resources Limited 100% France Unilever France S.A.S. 100% Germany Unilever Deutschland Gmbh 100% Germany Unilever Deutschland Holding Gmbh 100% India Hindustan Unilever Limited 62% Indonesia PT Unilever Indonesia Tbk 85% Italy Unilever Italia Mkt Operations S.R.L. 100% Mexico Unilever de Mexico, S.de R.l. de C.V. 100% Netherlands Ekaterra B.V. 100% Netherlands ekaterra Group Finance B.V. 100% Netherlands ekaterra Group IP Holdings B.V. 100% Netherlands Mixhold B.V. 100% Netherlands Unilever Finance Netherlands B.V. 100% Netherlands Unilever IP Holdings B.V. 100% Netherlands Unilever Nederland B.V. 100% Netherlands Unilever Europe B.V. 100% Netherlands Unilever Nederland Services B.V. 100% Netherlands UNUS Holding B.V. 100% Pakistan Unilever Pakistan Limited 99% Philippines Unilever Philippines, Inc. 100% Russia OOO Unilever Rus 100% Singapore Unilever Asia Private Limited 100% South Africa Unilever South Africa (Pty) Limited 100% Switzerland Unilever Finance International AG 100% Thailand Unilever Thai Trading Limited 100% Turkey Unilever Sanayi ve Ticaret Turk A.S 100% United States of America Conopco, Inc 100% United States of America Unilever Capital Corporation 100% United States of America Unilever North America Supply Chain Company LLC 100% United States of America Unilever United States, Inc 100% United States of America Ben & Jerry's Homemade, Inc. 100% United States of America Paula's Choice, Inc. 100% Vietnam Unilever Vietnam International Company Limited 100%
See pages 176 to 186 for a complete list of subsidiary undertakings, associates and joint ventures.
166 Unilever Annual Report and Accounts 2021
Notes to the Consolidated Financial Statements Unilever Group continued

Company Accounts Unilever PLCIncome statementfor the year ended 31 December
£ million £ million
Notes 2021 2020
Turnover 1 396 2,281
Royalties and services charged out to group companies 396 2,281
Incurred costs and royalties paid (474) (2,024)
Amortisation of finite-life intangible assets and software 4 — (11)
Other (expenses)/income 24 (5)
Operating profit (54) 241
Net finance costs (29) (58)
Finance income 29 31
Finance costs (58) (89)
Income from shares in group companies 2 2,421 456
Profit/(loss) on disposal of intangible assets 2,815 —
(Impairment)/Reversal of impairment of intangible assets 4 — (12)
Profit before taxation 5,153 627
Taxation 3 (773) (173)
Net profit 4,380 454
Statement of comprehensive income£ million £ million
2021 2020
Net profit 4,380 454
Other comprehensive income
Items that will not be reclassified to profit or loss, net of tax:
Remeasurement of defined benefit pension plans net of tax — 1
Items that may be reclassified subsequently to profit or loss, net of tax — — Total comprehensive income 4,380 455
Unilever Annual Report and Accounts 2021 167
FINA
NC
IAL STA
TEMEN
TS

Statement of changes in equity£ million £ million £ million £ million £ million £ million
Statement of changes in equityCalled up
Share capital
Share premium
account
Capital redemption
reserveOther
reservesRetained
profit Total equity
1 January 2020 36 94 15 — 7,071 7,216 Profit or loss for the period — — — — 454 454 Other comprehensive income net of tax: — — — — — —
Remeasurement of defined benefit pension plan net of tax — — — — 1 1 Total comprehensive income — — — — 455 455 Dividends on ordinary capital — — — — (1,698) (1,698) Issuance of shares(a) 46 65,431 — — — 65,477 Other movements in treasury shares(a) — — — (271) — (271) Other movements in equity — — — — — —
31 December 2020 82 65,525 15 (271) 5,828 71,179
Profit or loss for the period — — — — 4,380 4,380 Other comprehensive income net of tax:
Remeasurement of defined benefit pension plan net of tax — — — — — —
Total comprehensive income — — — — 4,380 4,380 Dividends on ordinary capital — — — — (3,841) (3,841)
Issuance of shares — — — — — —
Share capital reduction(b) — (18,400) — — 18,400 —
Repurchase of shares(c) — — — (2,581) — (2,581)
Cancellation of treasury shares — — — — — —
Other movements in treasury shares(d) — — — 58 — 58
Other movements in equity — — — — (16) (16)
31 December 2021 82 47,125 15 (2,794) 24,751 69,179
(a) As part of Unification, the shareholders of N.V. were issued PLC ordinary shares, and all NV shares in issue were cancelled and treasury stock held by Unilever N.V. was transferred to Unilever PLC.
(b) On 15 June 2021, the High Court of Justice of England and Wales approved the reduction of share premium by an amount of £18,400 million which has led to a decrease in share premium and a corresponding increase in the amount of profit retained.
(c) During 2021, Unilever PLC repurchased 62,976,145 PLC ordinary shares (2020: nil). Consideration paid for the repurchase of these shares including transaction costs was £2,581 million (2020: nil) which was initially recorded in other reserves.
(d) At 31 December 2021, 4,453,244 (2020: 5,884,511) treasury shares are held at an employee share ownership trust and nil shares (2020: 50,000) shares were held by PLC.
168 Unilever Annual Report and Accounts 2021
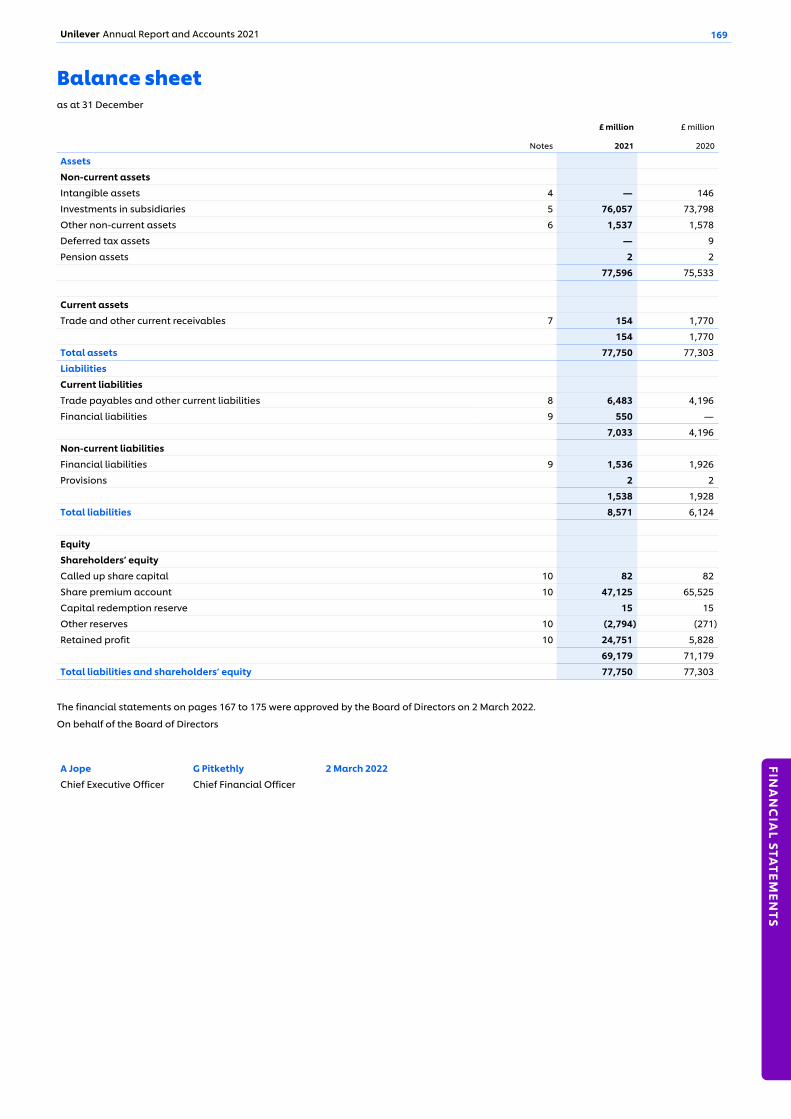
Balance sheet as at 31 December
£ million £ million
Notes 2021 2020
Assets
Non-current assets
Intangible assets 4 — 146
Investments in subsidiaries 5 76,057 73,798
Other non-current assets 6 1,537 1,578
Deferred tax assets — 9
Pension assets 2 2
77,596 75,533
Current assets
Trade and other current receivables 7 154 1,770
154 1,770
Total assets 77,750 77,303
Liabilities
Current liabilities
Trade payables and other current liabilities 8 6,483 4,196
Financial liabilities 9 550 —
7,033 4,196
Non-current liabilities
Financial liabilities 9 1,536 1,926
Provisions 2 2
1,538 1,928
Total liabilities 8,571 6,124
Equity
Shareholders’ equity
Called up share capital 10 82 82
Share premium account 10 47,125 65,525
Capital redemption reserve 15 15
Other reserves 10 (2,794) (271)
Retained profit 10 24,751 5,828
69,179 71,179
Total liabilities and shareholders’ equity 77,750 77,303
The financial statements on pages 167 to 175 were approved by the Board of Directors on 2 March 2022.
On behalf of the Board of Directors
A Jope G Pitkethly 2 March 2022
Chief Executive Officer Chief Financial Officer
Unilever Annual Report and Accounts 2021 169
FINA
NC
IAL STA
TEMEN
TS
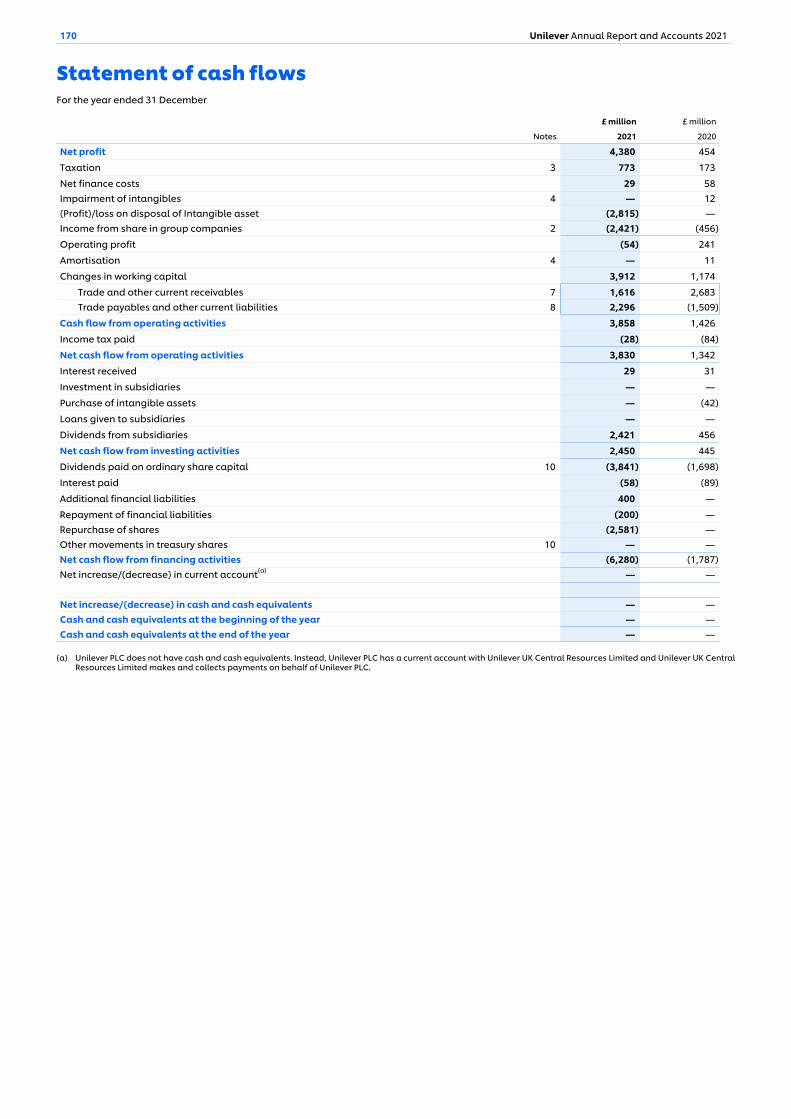
Statement of cash flows For the year ended 31 December
£ million £ million
Notes 2021 2020
Net profit 4,380 454
Taxation 3 773 173
Net finance costs 29 58 Impairment of intangibles 4 — 12 (Profit)/loss on disposal of Intangible asset (2,815) — Income from share in group companies 2 (2,421) (456)
Operating profit (54) 241
Amortisation 4 — 11
Changes in working capital 3,912 1,174
Trade and other current receivables 7 1,616 2,683 Trade payables and other current liabilities 8 2,296 (1,509)
Cash flow from operating activities 3,858 1,426
Income tax paid (28) (84)
Net cash flow from operating activities 3,830 1,342
Interest received 29 31
Investment in subsidiaries — —
Purchase of intangible assets — (42)
Loans given to subsidiaries — —
Dividends from subsidiaries 2,421 456
Net cash flow from investing activities 2,450 445
Dividends paid on ordinary share capital 10 (3,841) (1,698)
Interest paid (58) (89)
Additional financial liabilities 400 —
Repayment of financial liabilities (200) — Repurchase of shares (2,581) — Other movements in treasury shares 10 — — Net cash flow from financing activities (6,280) (1,787) Net increase/(decrease) in current account(a) — —
Net increase/(decrease) in cash and cash equivalents — — Cash and cash equivalents at the beginning of the year — — Cash and cash equivalents at the end of the year — —
(a) Unilever PLC does not have cash and cash equivalents. Instead, Unilever PLC has a current account with Unilever UK Central Resources Limited and Unilever UK Central Resources Limited makes and collects payments on behalf of Unilever PLC.
170 Unilever Annual Report and Accounts 2021
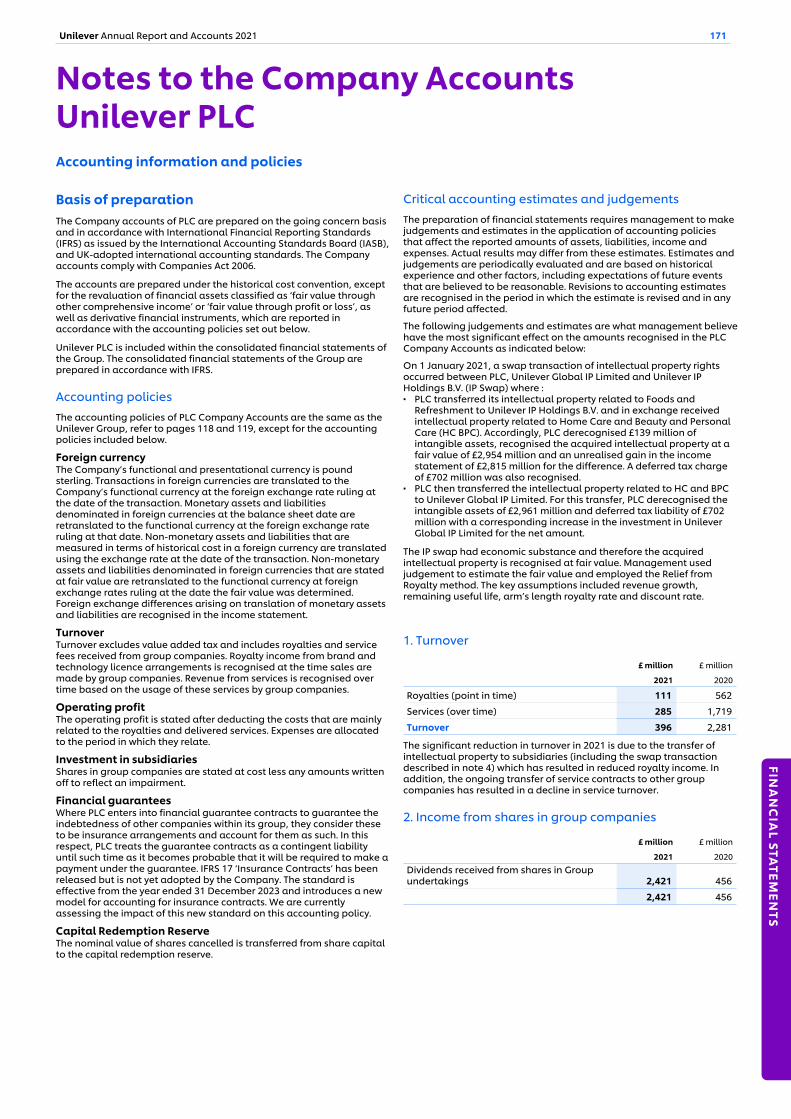
Notes to the Company Accounts Unilever PLCAccounting information and policies
Basis of preparation The Company accounts of PLC are prepared on the going concern basis and in accordance with International Financial Reporting Standards (IFRS) as issued by the International Accounting Standards Board (IASB), and UK-adopted international accounting standards. The Company accounts comply with Companies Act 2006.
The accounts are prepared under the historical cost convention, except for the revaluation of financial assets classified as ‘fair value through other comprehensive income’ or ‘fair value through profit or loss’, as well as derivative financial instruments, which are reported in accordance with the accounting policies set out below.
Unilever PLC is included within the consolidated financial statements of the Group. The consolidated financial statements of the Group are prepared in accordance with IFRS.
Accounting policiesThe accounting policies of PLC Company Accounts are the same as the Unilever Group, refer to pages 118 and 119, except for the accounting policies included below.
Foreign currency The Company’s functional and presentational currency is pound sterling. Transactions in foreign currencies are translated to the Company’s functional currency at the foreign exchange rate ruling at the date of the transaction. Monetary assets and liabilities denominated in foreign currencies at the balance sheet date are retranslated to the functional currency at the foreign exchange rate ruling at that date. Non-monetary assets and liabilities that are measured in terms of historical cost in a foreign currency are translated using the exchange rate at the date of the transaction. Non-monetary assets and liabilities denominated in foreign currencies that are stated at fair value are retranslated to the functional currency at foreign exchange rates ruling at the date the fair value was determined. Foreign exchange differences arising on translation of monetary assets and liabilities are recognised in the income statement.
Turnover Turnover excludes value added tax and includes royalties and service fees received from group companies. Royalty income from brand and technology licence arrangements is recognised at the time sales are made by group companies. Revenue from services is recognised over time based on the usage of these services by group companies.
Operating profit The operating profit is stated after deducting the costs that are mainly related to the royalties and delivered services. Expenses are allocated to the period in which they relate.
Investment in subsidiaries Shares in group companies are stated at cost less any amounts written off to reflect an impairment.
Financial guarantees Where PLC enters into financial guarantee contracts to guarantee the indebtedness of other companies within its group, they consider these to be insurance arrangements and account for them as such. In this respect, PLC treats the guarantee contracts as a contingent liability until such time as it becomes probable that it will be required to make a payment under the guarantee. IFRS 17 ‘Insurance Contracts’ has been released but is not yet adopted by the Company. The standard is effective from the year ended 31 December 2023 and introduces a new model for accounting for insurance contracts. We are currently assessing the impact of this new standard on this accounting policy.
Capital Redemption ReserveThe nominal value of shares cancelled is transferred from share capital to the capital redemption reserve.
Critical accounting estimates and judgementsThe preparation of financial statements requires management to make judgements and estimates in the application of accounting policies that affect the reported amounts of assets, liabilities, income and expenses. Actual results may differ from these estimates. Estimates and judgements are periodically evaluated and are based on historical experience and other factors, including expectations of future events that are believed to be reasonable. Revisions to accounting estimates are recognised in the period in which the estimate is revised and in any future period affected.
The following judgements and estimates are what management believe have the most significant effect on the amounts recognised in the PLC Company Accounts as indicated below:
On 1 January 2021, a swap transaction of intellectual property rights occurred between PLC, Unilever Global IP Limited and Unilever IP Holdings B.V. (IP Swap) where :▪ PLC transferred its intellectual property related to Foods and
Refreshment to Unilever IP Holdings B.V. and in exchange received intellectual property related to Home Care and Beauty and Personal Care (HC BPC). Accordingly, PLC derecognised £139 million of intangible assets, recognised the acquired intellectual property at a fair value of £2,954 million and an unrealised gain in the income statement of £2,815 million for the difference. A deferred tax charge of £702 million was also recognised.
▪ PLC then transferred the intellectual property related to HC and BPC to Unilever Global IP Limited. For this transfer, PLC derecognised the intangible assets of £2,961 million and deferred tax liability of £702 million with a corresponding increase in the investment in Unilever Global IP Limited for the net amount.
The IP swap had economic substance and therefore the acquired intellectual property is recognised at fair value. Management used judgement to estimate the fair value and employed the Relief from Royalty method. The key assumptions included revenue growth, remaining useful life, arm’s length royalty rate and discount rate.
1. Turnover
£ million £ million
2021 2020
Royalties (point in time) 111 562
Services (over time) 285 1,719
Turnover 396 2,281
The significant reduction in turnover in 2021 is due to the transfer of intellectual property to subsidiaries (including the swap transaction described in note 4) which has resulted in reduced royalty income. In addition, the ongoing transfer of service contracts to other group companies has resulted in a decline in service turnover.
2. Income from shares in group companies
£ million £ million
2021 2020
Dividends received from shares in Group undertakings 2,421 456
2,421 456
Unilever Annual Report and Accounts 2021 171
FINA
NC
IAL STA
TEMEN
TS
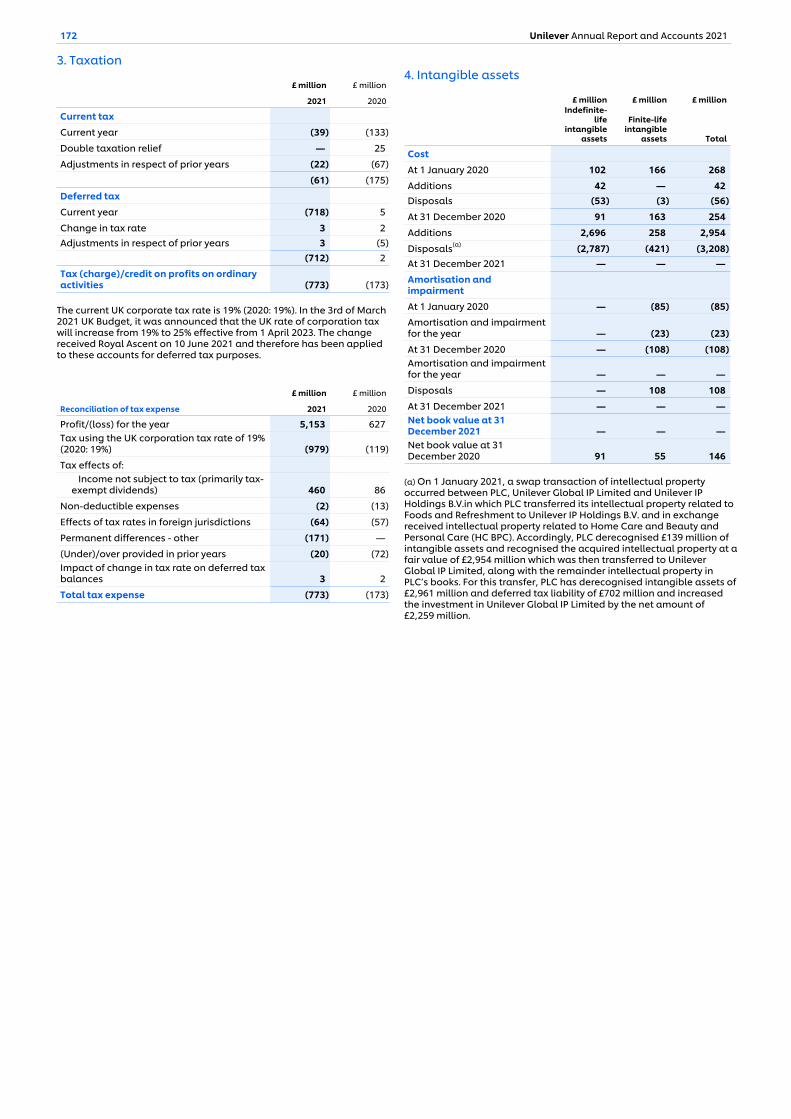
3. Taxation
£ million £ million
2021 2020
Current tax
Current year (39) (133)
Double taxation relief — 25
Adjustments in respect of prior years (22) (67)
(61) (175)
Deferred tax
Current year (718) 5
Change in tax rate 3 2 Adjustments in respect of prior years 3 (5)
(712) 2
Tax (charge)/credit on profits on ordinary activities (773) (173)
The current UK corporate tax rate is 19% (2020: 19%). In the 3rd of March 2021 UK Budget, it was announced that the UK rate of corporation tax will increase from 19% to 25% effective from 1 April 2023. The change received Royal Ascent on 10 June 2021 and therefore has been applied to these accounts for deferred tax purposes.
£ million £ million
Reconciliation of tax expense 2021 2020
Profit/(loss) for the year 5,153 627 Tax using the UK corporation tax rate of 19% (2020: 19%) (979) (119)
Tax effects of: Income not subject to tax (primarily tax-exempt dividends) 460 86
Non-deductible expenses (2) (13)
Effects of tax rates in foreign jurisdictions (64) (57)
Permanent differences - other (171) —
(Under)/over provided in prior years (20) (72) Impact of change in tax rate on deferred tax balances 3 2
Total tax expense (773) (173)
4. Intangible assets
£ million £ million £ million Indefinite-
life intangible
assets
Finite-life intangible
assets Total
Cost
At 1 January 2020 102 166 268
Additions 42 — 42 Disposals (53) (3) (56)
At 31 December 2020 91 163 254
Additions 2,696 258 2,954
Disposals(a) (2,787) (421) (3,208) At 31 December 2021 — — — Amortisation and impairment
At 1 January 2020 — (85) (85) Amortisation and impairment for the year — (23) (23)
At 31 December 2020 — (108) (108) Amortisation and impairment for the year — — —
Disposals — 108 108
At 31 December 2021 — — — Net book value at 31 December 2021 — — — Net book value at 31 December 2020 91 55 146
(a) On 1 January 2021, a swap transaction of intellectual property occurred between PLC, Unilever Global IP Limited and Unilever IP Holdings B.V.in which PLC transferred its intellectual property related to Foods and Refreshment to Unilever IP Holdings B.V. and in exchange received intellectual property related to Home Care and Beauty and Personal Care (HC BPC). Accordingly, PLC derecognised £139 million of intangible assets and recognised the acquired intellectual property at a fair value of £2,954 million which was then transferred to Unilever Global IP Limited, along with the remainder intellectual property in PLC’s books. For this transfer, PLC has derecognised intangible assets of £2,961 million and deferred tax liability of £702 million and increased the investment in Unilever Global IP Limited by the net amount of £2,259 million.
172 Unilever Annual Report and Accounts 2021
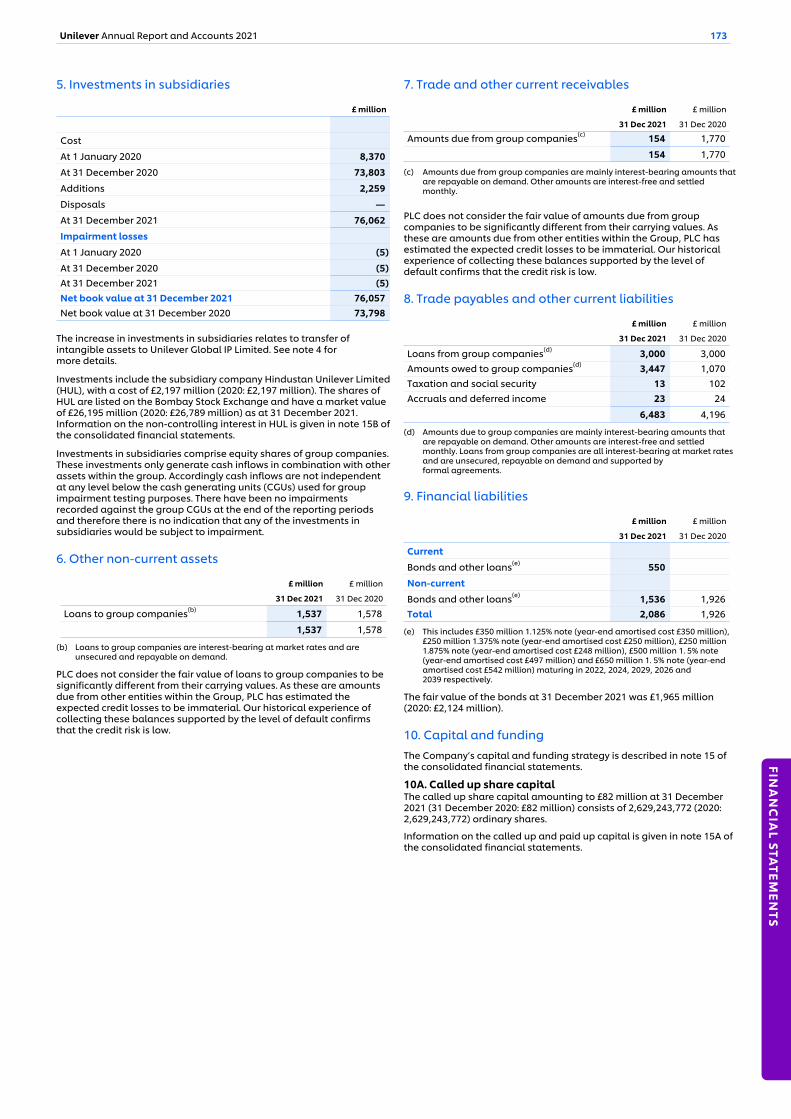
5. Investments in subsidiaries
£ million
Cost
At 1 January 2020 8,370
At 31 December 2020 73,803
Additions 2,259
Disposals —
At 31 December 2021 76,062
Impairment losses
At 1 January 2020 (5)
At 31 December 2020 (5) At 31 December 2021 (5) Net book value at 31 December 2021 76,057 Net book value at 31 December 2020 73,798
The increase in investments in subsidiaries relates to transfer of intangible assets to Unilever Global IP Limited. See note 4 for more details.
Investments include the subsidiary company Hindustan Unilever Limited (HUL), with a cost of £2,197 million (2020: £2,197 million). The shares of HUL are listed on the Bombay Stock Exchange and have a market value of £26,195 million (2020: £26,789 million) as at 31 December 2021. Information on the non-controlling interest in HUL is given in note 15B of the consolidated financial statements.
Investments in subsidiaries comprise equity shares of group companies. These investments only generate cash inflows in combination with other assets within the group. Accordingly cash inflows are not independent at any level below the cash generating units (CGUs) used for group impairment testing purposes. There have been no impairments recorded against the group CGUs at the end of the reporting periods and therefore there is no indication that any of the investments in subsidiaries would be subject to impairment.
6. Other non-current assets
£ million £ million
31 Dec 2021 31 Dec 2020
Loans to group companies(b) 1,537 1,578
1,537 1,578
(b) Loans to group companies are interest-bearing at market rates and are unsecured and repayable on demand.
PLC does not consider the fair value of loans to group companies to be significantly different from their carrying values. As these are amounts due from other entities within the Group, PLC has estimated the expected credit losses to be immaterial. Our historical experience of collecting these balances supported by the level of default confirms that the credit risk is low.
7. Trade and other current receivables
£ million £ million
31 Dec 2021 31 Dec 2020
Amounts due from group companies(c) 154 1,770
154 1,770
(c) Amounts due from group companies are mainly interest-bearing amounts that are repayable on demand. Other amounts are interest-free and settled monthly.
PLC does not consider the fair value of amounts due from group companies to be significantly different from their carrying values. As these are amounts due from other entities within the Group, PLC has estimated the expected credit losses to be immaterial. Our historical experience of collecting these balances supported by the level of default confirms that the credit risk is low.
8. Trade payables and other current liabilities
£ million £ million
31 Dec 2021 31 Dec 2020
Loans from group companies(d) 3,000 3,000 Amounts owed to group companies(d) 3,447 1,070 Taxation and social security 13 102 Accruals and deferred income 23 24
6,483 4,196
(d) Amounts due to group companies are mainly interest-bearing amounts that are repayable on demand. Other amounts are interest-free and settled monthly. Loans from group companies are all interest-bearing at market rates and are unsecured, repayable on demand and supported by formal agreements.
9. Financial liabilities
£ million £ million
31 Dec 2021 31 Dec 2020
Current
Bonds and other loans(e) 550
Non-current
Bonds and other loans(e) 1,536 1,926 Total 2,086 1,926
(e) This includes £350 million 1.125% note (year-end amortised cost £350 million), £250 million 1.375% note (year-end amortised cost £250 million), £250 million 1.875% note (year-end amortised cost £248 million), £500 million 1. 5% note (year-end amortised cost £497 million) and £650 million 1. 5% note (year-end amortised cost £542 million) maturing in 2022, 2024, 2029, 2026 and 2039 respectively.
The fair value of the bonds at 31 December 2021 was £1,965 million (2020: £2,124 million).
10. Capital and fundingThe Company’s capital and funding strategy is described in note 15 of the consolidated financial statements.
10A. Called up share capitalThe called up share capital amounting to £82 million at 31 December 2021 (31 December 2020: £82 million) consists of 2,629,243,772 (2020: 2,629,243,772) ordinary shares.
Information on the called up and paid up capital is given in note 15A of the consolidated financial statements.
Unilever Annual Report and Accounts 2021 173
FINA
NC
IAL STA
TEMEN
TS
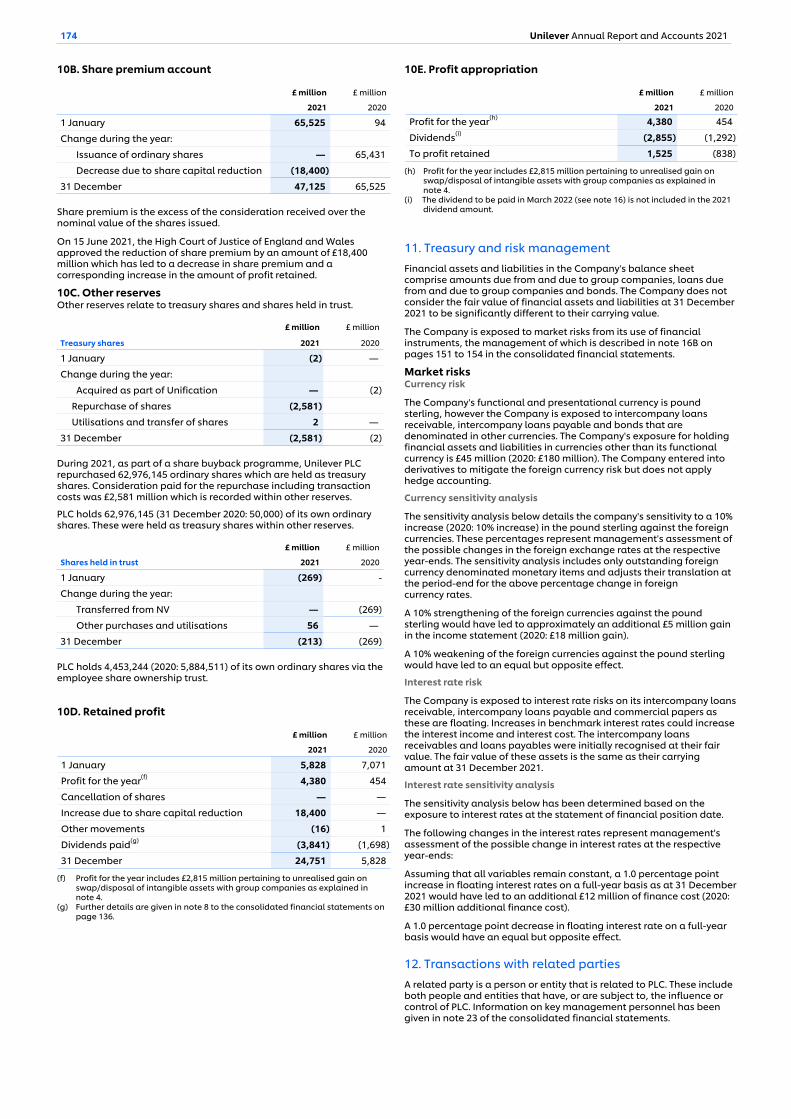
10B. Share premium account
£ million £ million
2021 2020
1 January 65,525 94
Change during the year:
Issuance of ordinary shares — 65,431
Decrease due to share capital reduction (18,400)
31 December 47,125 65,525
Share premium is the excess of the consideration received over the nominal value of the shares issued.
On 15 June 2021, the High Court of Justice of England and Wales approved the reduction of share premium by an amount of £18,400 million which has led to a decrease in share premium and a corresponding increase in the amount of profit retained.
10C. Other reservesOther reserves relate to treasury shares and shares held in trust.
£ million £ million
Treasury shares 2021 2020
1 January (2) —
Change during the year:
Acquired as part of Unification — (2)
Repurchase of shares (2,581)
Utilisations and transfer of shares 2 —
31 December (2,581) (2)
During 2021, as part of a share buyback programme, Unilever PLC repurchased 62,976,145 ordinary shares which are held as treasury shares. Consideration paid for the repurchase including transaction costs was £2,581 million which is recorded within other reserves.
PLC holds 62,976,145 (31 December 2020: 50,000) of its own ordinary shares. These were held as treasury shares within other reserves.
Shares held in trust
£ million £ million
2021 2020
1 January (269) -
Change during the year:
Transferred from NV — (269)
Other purchases and utilisations 56 —
31 December (213) (269)
PLC holds 4,453,244 (2020: 5,884,511) of its own ordinary shares via the employee share ownership trust.
10D. Retained profit
£ million £ million
2021 2020
1 January 5,828 7,071
Profit for the year(f) 4,380 454
Cancellation of shares — —
Increase due to share capital reduction 18,400 —
Other movements (16) 1
Dividends paid(g) (3,841) (1,698)
31 December 24,751 5,828
(f) Profit for the year includes £2,815 million pertaining to unrealised gain on swap/disposal of intangible assets with group companies as explained in note 4.
(g) Further details are given in note 8 to the consolidated financial statements on page 136.
10E. Profit appropriation
£ million £ million
2021 2020
Profit for the year(h) 4,380 454
Dividends(i) (2,855) (1,292)
To profit retained 1,525 (838)
(h) Profit for the year includes £2,815 million pertaining to unrealised gain on swap/disposal of intangible assets with group companies as explained in note 4.
(i) The dividend to be paid in March 2022 (see note 16) is not included in the 2021 dividend amount.
11. Treasury and risk managementFinancial assets and liabilities in the Company's balance sheet comprise amounts due from and due to group companies, loans due from and due to group companies and bonds. The Company does not consider the fair value of financial assets and liabilities at 31 December 2021 to be significantly different to their carrying value.
The Company is exposed to market risks from its use of financial instruments, the management of which is described in note 16B on pages 151 to 154 in the consolidated financial statements.
Market risksCurrency risk
The Company's functional and presentational currency is pound sterling, however the Company is exposed to intercompany loans receivable, intercompany loans payable and bonds that are denominated in other currencies. The Company's exposure for holding financial assets and liabilities in currencies other than its functional currency is £45 million (2020: £180 million). The Company entered into derivatives to mitigate the foreign currency risk but does not apply hedge accounting.
Currency sensitivity analysis
The sensitivity analysis below details the company's sensitivity to a 10% increase (2020: 10% increase) in the pound sterling against the foreign currencies. These percentages represent management's assessment of the possible changes in the foreign exchange rates at the respective year-ends. The sensitivity analysis includes only outstanding foreign currency denominated monetary items and adjusts their translation at the period-end for the above percentage change in foreign currency rates.
A 10% strengthening of the foreign currencies against the pound sterling would have led to approximately an additional £5 million gain in the income statement (2020: £18 million gain).
A 10% weakening of the foreign currencies against the pound sterling would have led to an equal but opposite effect.
Interest rate risk
The Company is exposed to interest rate risks on its intercompany loans receivable, intercompany loans payable and commercial papers as these are floating. Increases in benchmark interest rates could increase the interest income and interest cost. The intercompany loans receivables and loans payables were initially recognised at their fair value. The fair value of these assets is the same as their carrying amount at 31 December 2021.
Interest rate sensitivity analysis
The sensitivity analysis below has been determined based on the exposure to interest rates at the statement of financial position date.
The following changes in the interest rates represent management's assessment of the possible change in interest rates at the respective year-ends:
Assuming that all variables remain constant, a 1.0 percentage point increase in floating interest rates on a full-year basis as at 31 December 2021 would have led to an additional £12 million of finance cost (2020: £30 million additional finance cost).
A 1.0 percentage point decrease in floating interest rate on a full-year basis would have an equal but opposite effect.
12. Transactions with related partiesA related party is a person or entity that is related to PLC. These include both people and entities that have, or are subject to, the influence or control of PLC. Information on key management personnel has been given in note 23 of the consolidated financial statements.
174 Unilever Annual Report and Accounts 2021
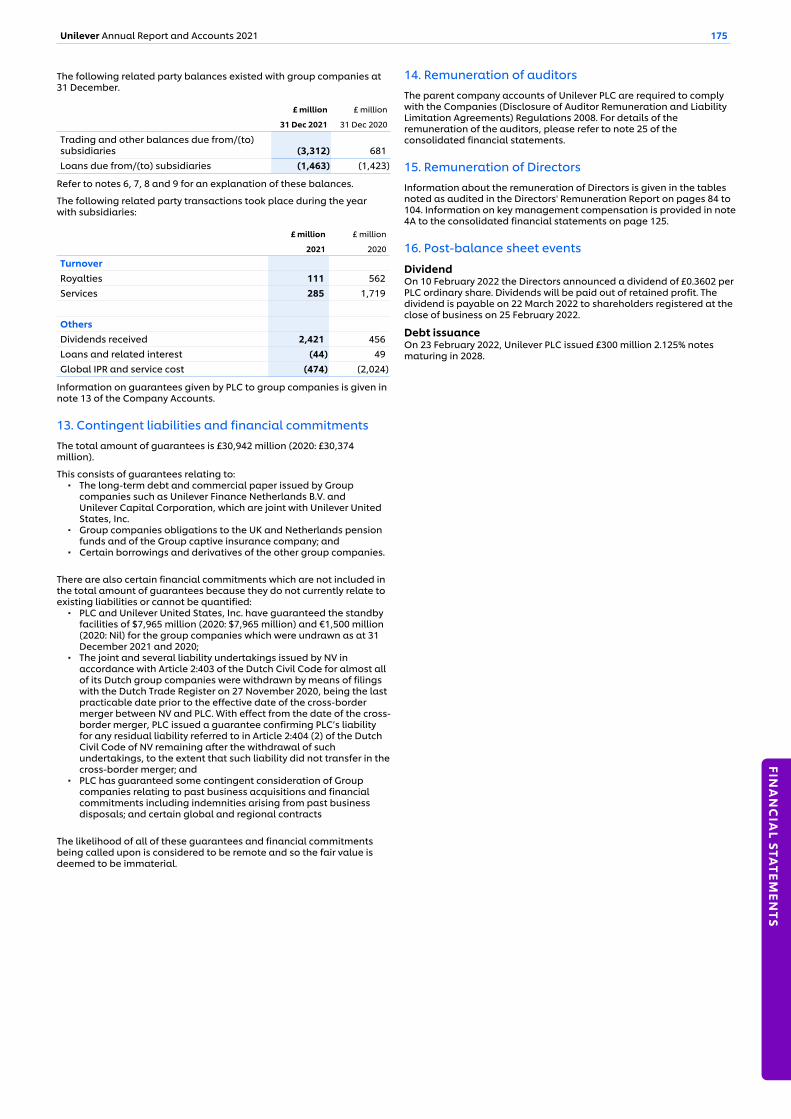
The following related party balances existed with group companies at 31 December.
£ million £ million
31 Dec 2021 31 Dec 2020
Trading and other balances due from/(to) subsidiaries (3,312) 681 Loans due from/(to) subsidiaries (1,463) (1,423)
Refer to notes 6, 7, 8 and 9 for an explanation of these balances.
The following related party transactions took place during the year with subsidiaries:
£ million £ million
2021 2020
TurnoverRoyalties 111 562 Services 285 1,719
OthersDividends received 2,421 456 Loans and related interest (44) 49 Global IPR and service cost (474) (2,024)
Information on guarantees given by PLC to group companies is given in note 13 of the Company Accounts.
13. Contingent liabilities and financial commitmentsThe total amount of guarantees is £30,942 million (2020: £30,374 million).
This consists of guarantees relating to:▪ The long-term debt and commercial paper issued by Group
companies such as Unilever Finance Netherlands B.V. and Unilever Capital Corporation, which are joint with Unilever United States, Inc.
▪ Group companies obligations to the UK and Netherlands pension funds and of the Group captive insurance company; and
▪ Certain borrowings and derivatives of the other group companies.
There are also certain financial commitments which are not included in the total amount of guarantees because they do not currently relate to existing liabilities or cannot be quantified: ▪ PLC and Unilever United States, Inc. have guaranteed the standby
facilities of $7,965 million (2020: $7,965 million) and €1,500 million (2020: Nil) for the group companies which were undrawn as at 31 December 2021 and 2020;
▪ The joint and several liability undertakings issued by NV in accordance with Article 2:403 of the Dutch Civil Code for almost all of its Dutch group companies were withdrawn by means of filings with the Dutch Trade Register on 27 November 2020, being the last practicable date prior to the effective date of the cross-border merger between NV and PLC. With effect from the date of the cross-border merger, PLC issued a guarantee confirming PLC’s liability for any residual liability referred to in Article 2:404 (2) of the Dutch Civil Code of NV remaining after the withdrawal of such undertakings, to the extent that such liability did not transfer in the cross-border merger; and
▪ PLC has guaranteed some contingent consideration of Group companies relating to past business acquisitions and financial commitments including indemnities arising from past business disposals; and certain global and regional contracts
The likelihood of all of these guarantees and financial commitments being called upon is considered to be remote and so the fair value is deemed to be immaterial.
14. Remuneration of auditorsThe parent company accounts of Unilever PLC are required to comply with the Companies (Disclosure of Auditor Remuneration and Liability Limitation Agreements) Regulations 2008. For details of the remuneration of the auditors, please refer to note 25 of the consolidated financial statements.
15. Remuneration of DirectorsInformation about the remuneration of Directors is given in the tables noted as audited in the Directors' Remuneration Report on pages 84 to 104. Information on key management compensation is provided in note 4A to the consolidated financial statements on page 125.
16. Post-balance sheet events
DividendOn 10 February 2022 the Directors announced a dividend of £0.3602 per PLC ordinary share. Dividends will be paid out of retained profit. The dividend is payable on 22 March 2022 to shareholders registered at the close of business on 25 February 2022.
Debt issuanceOn 23 February 2022, Unilever PLC issued £300 million 2.125% notes maturing in 2028.
Unilever Annual Report and Accounts 2021 175
FINA
NC
IAL STA
TEMEN
TS
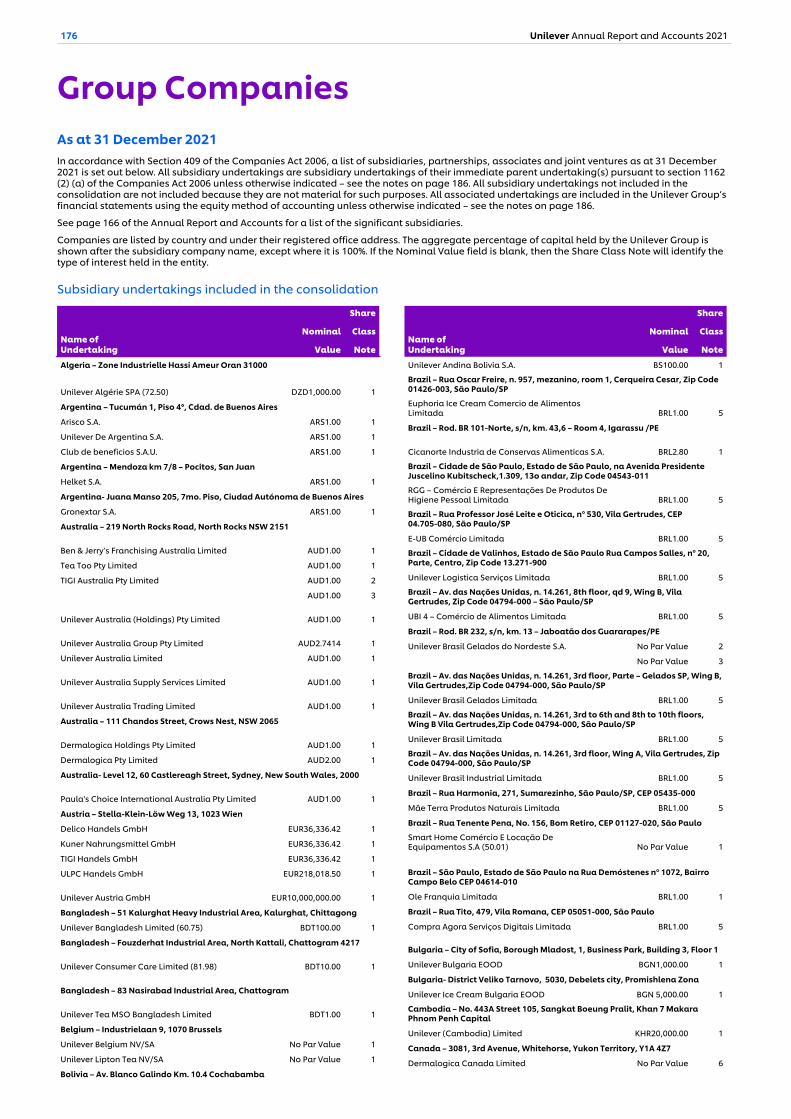
Group CompaniesAs at 31 December 2021In accordance with Section 409 of the Companies Act 2006, a list of subsidiaries, partnerships, associates and joint ventures as at 31 December 2021 is set out below. All subsidiary undertakings are subsidiary undertakings of their immediate parent undertaking(s) pursuant to section 1162 (2) (a) of the Companies Act 2006 unless otherwise indicated – see the notes on page 186. All subsidiary undertakings not included in the consolidation are not included because they are not material for such purposes. All associated undertakings are included in the Unilever Group’s financial statements using the equity method of accounting unless otherwise indicated – see the notes on page 186.
See page 166 of the Annual Report and Accounts for a list of the significant subsidiaries.
Companies are listed by country and under their registered office address. The aggregate percentage of capital held by the Unilever Group is shown after the subsidiary company name, except where it is 100%. If the Nominal Value field is blank, then the Share Class Note will identify the type of interest held in the entity.
Subsidiary undertakings included in the consolidation
Algeria – Zone Industrielle Hassi Ameur Oran 31000
Unilever Algérie SPA (72.50) DZD1,000.00 1
Argentina – Tucumán 1, Piso 4°, Cdad. de Buenos Aires
Arisco S.A. ARS1.00 1
Unilever De Argentina S.A. ARS1.00 1
Club de beneficios S.A.U. ARS1.00 1
Argentina – Mendoza km 7/8 – Pocitos, San Juan
Helket S.A. ARS1.00 1
Argentina- Juana Manso 205, 7mo. Piso, Ciudad Autónoma de Buenos Aires
Gronextar S.A. ARS1.00 1
Australia – 219 North Rocks Road, North Rocks NSW 2151
Ben & Jerry’s Franchising Australia Limited AUD1.00 1
Tea Too Pty Limited AUD1.00 1
TIGI Australia Pty Limited AUD1.00 2
AUD1.00 3
Unilever Australia (Holdings) Pty Limited AUD1.00 1
Unilever Australia Group Pty Limited AUD2.7414 1
Unilever Australia Limited AUD1.00 1
Unilever Australia Supply Services Limited AUD1.00 1
Unilever Australia Trading Limited AUD1.00 1
Australia – 111 Chandos Street, Crows Nest, NSW 2065
Dermalogica Holdings Pty Limited AUD1.00 1
Dermalogica Pty Limited AUD2.00 1
Australia- Level 12, 60 Castlereagh Street, Sydney, New South Wales, 2000
Paula's Choice International Australia Pty Limited AUD1.00 1
Austria – Stella-Klein-Löw Weg 13, 1023 Wien
Delico Handels GmbH EUR36,336.42 1
Kuner Nahrungsmittel GmbH EUR36,336.42 1
TIGI Handels GmbH EUR36,336.42 1
ULPC Handels GmbH EUR218,018.50 1
Unilever Austria GmbH EUR10,000,000.00 1
Bangladesh – 51 Kalurghat Heavy Industrial Area, Kalurghat, Chittagong
Unilever Bangladesh Limited (60.75) BDT100.00 1
Bangladesh – Fouzderhat Industrial Area, North Kattali, Chattogram 4217
Unilever Consumer Care Limited (81.98) BDT10.00 1
Bangladesh – 83 Nasirabad Industrial Area, Chattogram
Unilever Tea MSO Bangladesh Limited BDT1.00 1
Belgium – Industrielaan 9, 1070 Brussels
Unilever Belgium NV/SA No Par Value 1
Unilever Lipton Tea NV/SA No Par Value 1
Bolivia – Av. Blanco Galindo Km. 10.4 Cochabamba
Name of Undertaking
Nominal
Value
Share
Class
Note
Unilever Andina Bolivia S.A. BS100.00 1
Brazil – Rua Oscar Freire, n. 957, mezanino, room 1, Cerqueira Cesar, Zip Code 01426-003, São Paulo/SP
Euphoria Ice Cream Comercio de Alimentos Limitada BRL1.00 5
Brazil – Rod. BR 101-Norte, s/n, km. 43,6 – Room 4, Igarassu /PE
Cicanorte Industria de Conservas Alimenticas S.A. BRL2.80 1
Brazil – Cidade de São Paulo, Estado de São Paulo, na Avenida Presidente Juscelino Kubitscheck,1.309, 13o andar, Zip Code 04543-011
RGG – Comércio E Representações De Produtos De Higiene Pessoal Limitada BRL1.00 5
Brazil – Rua Professor José Leite e Oticica, nº 530, Vila Gertrudes, CEP 04.705-080, São Paulo/SP
E-UB Comércio Limitada BRL1.00 5
Brazil – Cidade de Valinhos, Estado de São Paulo Rua Campos Salles, nº 20, Parte, Centro, Zip Code 13.271-900
Unilever Logistica Serviços Limitada BRL1.00 5
Brazil – Av. das Nações Unidas, n. 14.261, 8th floor, qd 9, Wing B, Vila Gertrudes, Zip Code 04794-000 – São Paulo/SP
UBI 4 – Comércio de Alimentos Limitada BRL1.00 5
Brazil – Rod. BR 232, s/n, km. 13 – Jaboatão dos Guararapes/PE
Unilever Brasil Gelados do Nordeste S.A. No Par Value 2
No Par Value 3
Brazil – Av. das Nações Unidas, n. 14.261, 3rd floor, Parte – Gelados SP, Wing B, Vila Gertrudes,Zip Code 04794-000, São Paulo/SP
Unilever Brasil Gelados Limitada BRL1.00 5
Brazil – Av. das Nações Unidas, n. 14.261, 3rd to 6th and 8th to 10th floors, Wing B Vila Gertrudes,Zip Code 04794-000, São Paulo/SP
Unilever Brasil Limitada BRL1.00 5
Brazil – Av. das Nações Unidas, n. 14.261, 3rd floor, Wing A, Vila Gertrudes, Zip Code 04794-000, São Paulo/SP
Unilever Brasil Industrial Limitada BRL1.00 5
Brazil – Rua Harmonia, 271, Sumarezinho, São Paulo/SP, CEP 05435-000
Mãe Terra Produtos Naturais Limitada BRL1.00 5
Brazil – Rua Tenente Pena, No. 156, Bom Retiro, CEP 01127-020, São Paulo
Smart Home Comércio E Locação De Equipamentos S.A (50.01) No Par Value 1
Brazil – São Paulo, Estado de São Paulo na Rua Demóstenes nº 1072, Bairro Campo Belo CEP 04614-010
Ole Franquia Limitada BRL1.00 1
Brazil – Rua Tito, 479, Vila Romana, CEP 05051-000, São Paulo
Compra Agora Serviços Digitais Limitada BRL1.00 5
Bulgaria – City of Sofia, Borough Mladost, 1, Business Park, Building 3, Floor 1
Unilever Bulgaria EOOD BGN1,000.00 1
Bulgaria- District Veliko Tarnovo, 5030, Debelets city, Promishlena Zona
Unilever Ice Cream Bulgaria EOOD BGN 5,000.00 1
Cambodia – No. 443A Street 105, Sangkat Boeung Pralit, Khan 7 Makara Phnom Penh Capital
Unilever (Cambodia) Limited KHR20,000.00 1
Canada – 3081, 3rd Avenue, Whitehorse, Yukon Territory, Y1A 4Z7
Dermalogica Canada Limited No Par Value 6
Name of Undertaking
Nominal
Value
Share
Class
Note
176 Unilever Annual Report and Accounts 2021
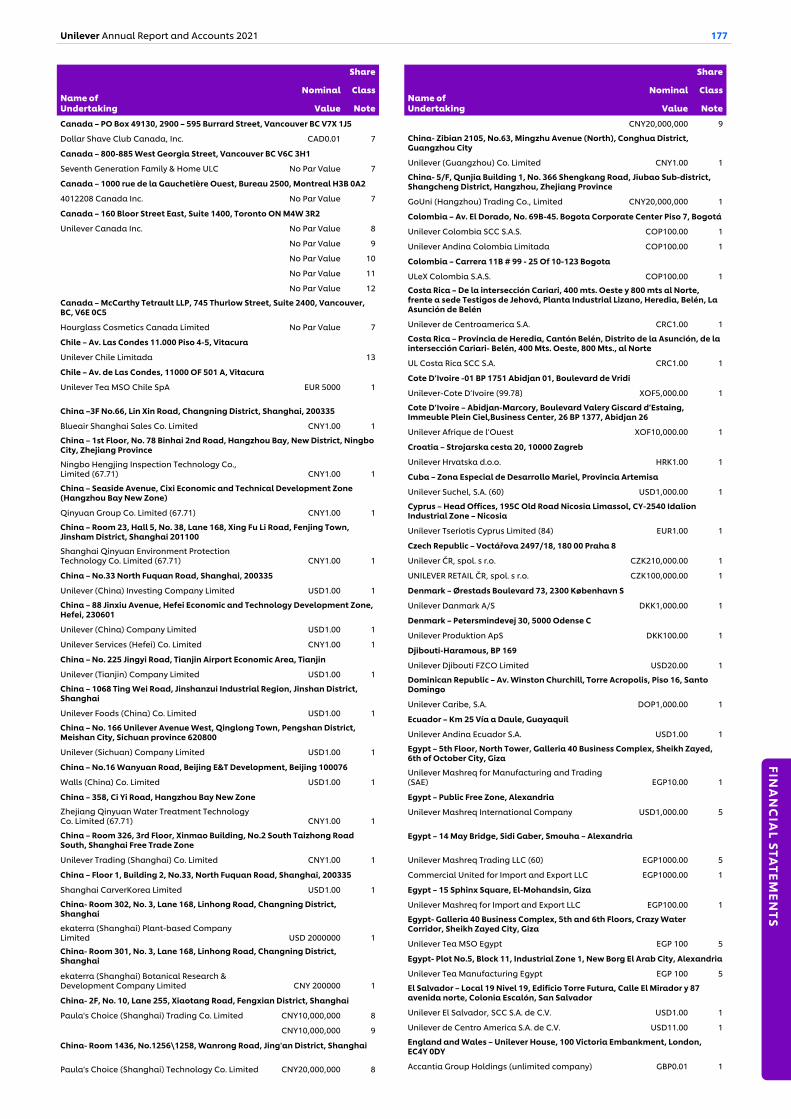
Canada – PO Box 49130, 2900 – 595 Burrard Street, Vancouver BC V7X 1J5
Dollar Shave Club Canada, Inc. CAD0.01 7
Canada – 800-885 West Georgia Street, Vancouver BC V6C 3H1
Seventh Generation Family & Home ULC No Par Value 7
Canada – 1000 rue de la Gauchetière Ouest, Bureau 2500, Montreal H3B 0A2
4012208 Canada Inc. No Par Value 7
Canada – 160 Bloor Street East, Suite 1400, Toronto ON M4W 3R2
Unilever Canada Inc. No Par Value 8
No Par Value 9
No Par Value 10
No Par Value 11
No Par Value 12
Canada – McCarthy Tetrault LLP, 745 Thurlow Street, Suite 2400, Vancouver, BC, V6E 0C5
Hourglass Cosmetics Canada Limited No Par Value 7
Chile – Av. Las Condes 11.000 Piso 4-5, Vitacura
Unilever Chile Limitada 13
Chile – Av. de Las Condes, 11000 OF 501 A, Vitacura
Unilever Tea MSO Chile SpA EUR 5000 1
China –3F No.66, Lin Xin Road, Changning District, Shanghai, 200335
Blueair Shanghai Sales Co. Limited CNY1.00 1
China – 1st Floor, No. 78 Binhai 2nd Road, Hangzhou Bay, New District, Ningbo City, Zhejiang Province
Ningbo Hengjing Inspection Technology Co., Limited (67.71) CNY1.00 1
China – Seaside Avenue, Cixi Economic and Technical Development Zone (Hangzhou Bay New Zone)
Qinyuan Group Co. Limited (67.71) CNY1.00 1
China – Room 23, Hall 5, No. 38, Lane 168, Xing Fu Li Road, Fenjing Town, Jinsham District, Shanghai 201100
Shanghai Qinyuan Environment Protection Technology Co. Limited (67.71) CNY1.00 1
China – No.33 North Fuquan Road, Shanghai, 200335
Unilever (China) Investing Company Limited USD1.00 1
China – 88 Jinxiu Avenue, Hefei Economic and Technology Development Zone, Hefei, 230601
Unilever (China) Company Limited USD1.00 1
Unilever Services (Hefei) Co. Limited CNY1.00 1
China – No. 225 Jingyi Road, Tianjin Airport Economic Area, Tianjin
Unilever (Tianjin) Company Limited USD1.00 1
China – 1068 Ting Wei Road, Jinshanzui Industrial Region, Jinshan District, Shanghai
Unilever Foods (China) Co. Limited USD1.00 1
China – No. 166 Unilever Avenue West, Qinglong Town, Pengshan District, Meishan City, Sichuan province 620800
Unilever (Sichuan) Company Limited USD1.00 1
China – No.16 Wanyuan Road, Beijing E&T Development, Beijing 100076
Walls (China) Co. Limited USD1.00 1
China – 358, Ci Yi Road, Hangzhou Bay New Zone
Zhejiang Qinyuan Water Treatment Technology Co. Limited (67.71) CNY1.00 1
China – Room 326, 3rd Floor, Xinmao Building, No.2 South Taizhong Road South, Shanghai Free Trade Zone
Unilever Trading (Shanghai) Co. Limited CNY1.00 1
China – Floor 1, Building 2, No.33, North Fuquan Road, Shanghai, 200335
Shanghai CarverKorea Limited USD1.00 1
China- Room 302, No. 3, Lane 168, Linhong Road, Changning District, Shanghai
ekaterra (Shanghai) Plant-based Company Limited USD 2000000 1
China- Room 301, No. 3, Lane 168, Linhong Road, Changning District, Shanghai
ekaterra (Shanghai) Botanical Research & Development Company Limited CNY 200000 1
China- 2F, No. 10, Lane 255, Xiaotang Road, Fengxian District, Shanghai
Paula's Choice (Shanghai) Trading Co. Limited CNY10,000,000 8
CNY10,000,000 9
China- Room 1436, No.1256\1258, Wanrong Road, Jing'an District, Shanghai
Paula's Choice (Shanghai) Technology Co. Limited CNY20,000,000 8
Name of Undertaking
Nominal
Value
Share
Class
Note
CNY20,000,000 9
China- Zibian 2105, No.63, Mingzhu Avenue (North), Conghua District, Guangzhou City
Unilever (Guangzhou) Co. Limited CNY1.00 1
China- 5/F, Qunjia Building 1, No. 366 Shengkang Road, Jiubao Sub-district, Shangcheng District, Hangzhou, Zhejiang Province
GoUni (Hangzhou) Trading Co., Limited CNY20,000,000 1
Colombia – Av. El Dorado, No. 69B-45. Bogota Corporate Center Piso 7, Bogotá
Unilever Colombia SCC S.A.S. COP100.00 1
Unilever Andina Colombia Limitada COP100.00 1
Colombia – Carrera 11B # 99 - 25 Of 10-123 Bogota
ULeX Colombia S.A.S. COP100.00 1
Costa Rica – De la intersección Cariari, 400 mts. Oeste y 800 mts al Norte, frente a sede Testigos de Jehová, Planta Industrial Lizano, Heredia, Belén, La Asunción de Belén
Unilever de Centroamerica S.A. CRC1.00 1
Costa Rica – Provincia de Heredia, Cantón Belén, Distrito de la Asunción, de la intersección Cariari- Belén, 400 Mts. Oeste, 800 Mts., al Norte
UL Costa Rica SCC S.A. CRC1.00 1
Cote D’Ivoire -01 BP 1751 Abidjan 01, Boulevard de Vridi
Unilever-Cote D’Ivoire (99.78) XOF5,000.00 1
Cote D’Ivoire – Abidjan-Marcory, Boulevard Valery Giscard d’Estaing, Immeuble Plein Ciel,Business Center, 26 BP 1377, Abidjan 26
Unilever Afrique de l’Ouest XOF10,000.00 1
Croatia – Strojarska cesta 20, 10000 Zagreb
Unilever Hrvatska d.o.o. HRK1.00 1
Cuba – Zona Especial de Desarrollo Mariel, Provincia Artemisa
Unilever Suchel, S.A. (60) USD1,000.00 1
Cyprus – Head Offices, 195C Old Road Nicosia Limassol, CY-2540 Idalion Industrial Zone – Nicosia
Unilever Tseriotis Cyprus Limited (84) EUR1.00 1
Czech Republic – Voctářova 2497/18, 180 00 Praha 8
Unilever ČR, spol. s r.o. CZK210,000.00 1
UNILEVER RETAIL ČR, spol. s r.o. CZK100,000.00 1
Denmark – Ørestads Boulevard 73, 2300 København S
Unilever Danmark A/S DKK1,000.00 1
Denmark – Petersmindevej 30, 5000 Odense C
Unilever Produktion ApS DKK100.00 1
Djibouti-Haramous, BP 169
Unilever Djibouti FZCO Limited USD20.00 1
Dominican Republic – Av. Winston Churchill, Torre Acropolis, Piso 16, Santo Domingo
Unilever Caribe, S.A. DOP1,000.00 1
Ecuador – Km 25 Vía a Daule, Guayaquil
Unilever Andina Ecuador S.A. USD1.00 1
Egypt – 5th Floor, North Tower, Galleria 40 Business Complex, Sheikh Zayed, 6th of October City, Giza
Unilever Mashreq for Manufacturing and Trading (SAE) EGP10.00 1
Egypt – Public Free Zone, Alexandria
Unilever Mashreq International Company USD1,000.00 5
Egypt – 14 May Bridge, Sidi Gaber, Smouha – Alexandria
Unilever Mashreq Trading LLC (60) EGP1000.00 5
Commercial United for Import and Export LLC EGP1000.00 1
Egypt – 15 Sphinx Square, El-Mohandsin, Giza
Unilever Mashreq for Import and Export LLC EGP100.00 1
Egypt- Galleria 40 Business Complex, 5th and 6th Floors, Crazy Water Corridor, Sheikh Zayed City, Giza
Unilever Tea MSO Egypt EGP 100 5
Egypt- Plot No.5, Block 11, Industrial Zone 1, New Borg El Arab City, Alexandria
Unilever Tea Manufacturing Egypt EGP 100 5
El Salvador – Local 19 Nivel 19, Edificio Torre Futura, Calle El Mirador y 87 avenida norte, Colonia Escalón, San Salvador
Unilever El Salvador, SCC S.A. de C.V. USD1.00 1
Unilever de Centro America S.A. de C.V. USD11.00 1
England and Wales – Unilever House, 100 Victoria Embankment, London, EC4Y 0DY
Accantia Group Holdings (unlimited company) GBP0.01 1
Name of Undertaking
Nominal
Value
Share
Class
Note
Unilever Annual Report and Accounts 2021 177
FINA
NC
IAL STA
TEMEN
TS
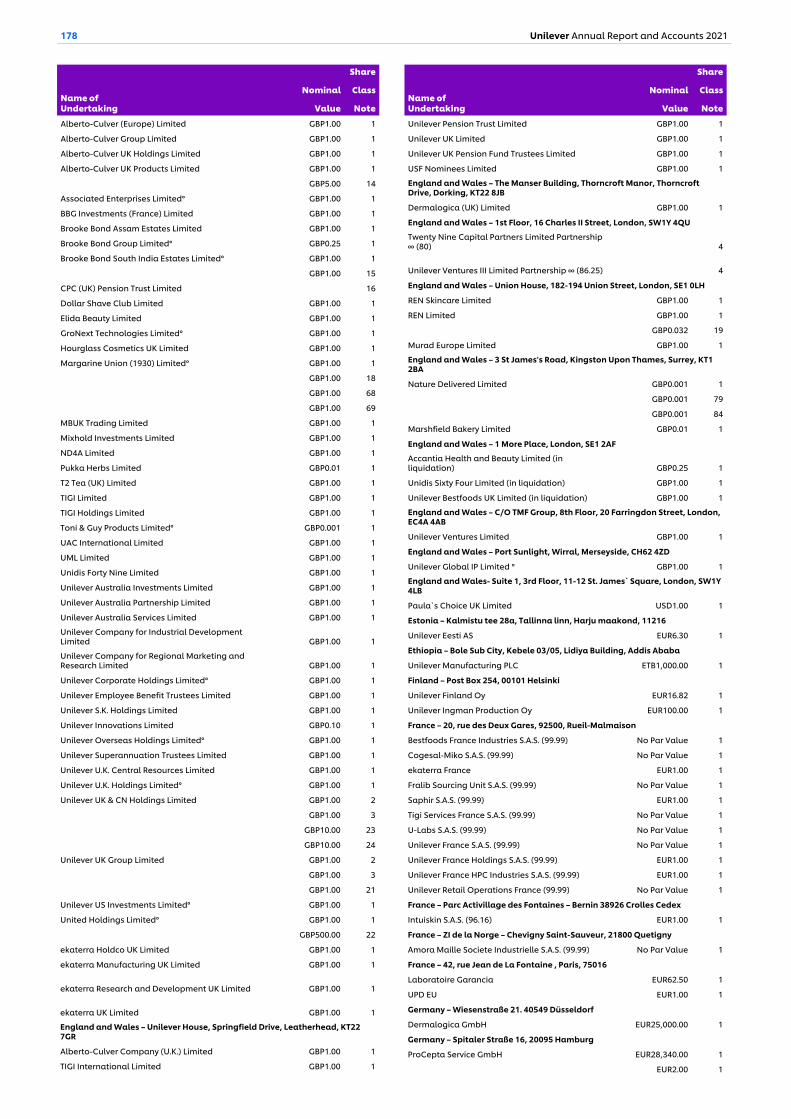
Alberto-Culver (Europe) Limited GBP1.00 1
Alberto-Culver Group Limited GBP1.00 1
Alberto-Culver UK Holdings Limited GBP1.00 1
Alberto-Culver UK Products Limited GBP1.00 1
GBP5.00 14
Associated Enterprises Limited° GBP1.00 1
BBG Investments (France) Limited GBP1.00 1
Brooke Bond Assam Estates Limited GBP1.00 1
Brooke Bond Group Limited° GBP0.25 1
Brooke Bond South India Estates Limited° GBP1.00 1
GBP1.00 15
CPC (UK) Pension Trust Limited 16
Dollar Shave Club Limited GBP1.00 1
Elida Beauty Limited GBP1.00 1
GroNext Technologies Limited° GBP1.00 1
Hourglass Cosmetics UK Limited GBP1.00 1
Margarine Union (1930) Limited° GBP1.00 1
GBP1.00 18
GBP1.00 68
GBP1.00 69
MBUK Trading Limited GBP1.00 1
Mixhold Investments Limited GBP1.00 1
ND4A Limited GBP1.00 1
Pukka Herbs Limited GBP0.01 1
T2 Tea (UK) Limited GBP1.00 1
TIGI Limited GBP1.00 1
TIGI Holdings Limited GBP1.00 1
Toni & Guy Products Limited° GBP0.001 1
UAC International Limited GBP1.00 1
UML Limited GBP1.00 1
Unidis Forty Nine Limited GBP1.00 1
Unilever Australia Investments Limited GBP1.00 1
Unilever Australia Partnership Limited GBP1.00 1
Unilever Australia Services Limited GBP1.00 1
Unilever Company for Industrial Development Limited GBP1.00 1
Unilever Company for Regional Marketing and Research Limited GBP1.00 1
Unilever Corporate Holdings Limited° GBP1.00 1
Unilever Employee Benefit Trustees Limited GBP1.00 1
Unilever S.K. Holdings Limited GBP1.00 1
Unilever Innovations Limited GBP0.10 1
Unilever Overseas Holdings Limited° GBP1.00 1
Unilever Superannuation Trustees Limited GBP1.00 1
Unilever U.K. Central Resources Limited GBP1.00 1
Unilever U.K. Holdings Limited° GBP1.00 1
Unilever UK & CN Holdings Limited GBP1.00 2
GBP1.00 3
GBP10.00 23
GBP10.00 24
Unilever UK Group Limited GBP1.00 2
GBP1.00 3
GBP1.00 21
Unilever US Investments Limited° GBP1.00 1
United Holdings Limited° GBP1.00 1
GBP500.00 22
ekaterra Holdco UK Limited GBP1.00 1
ekaterra Manufacturing UK Limited GBP1.00 1
ekaterra Research and Development UK Limited GBP1.00 1
ekaterra UK Limited GBP1.00 1
England and Wales – Unilever House, Springfield Drive, Leatherhead, KT22 7GR
Alberto-Culver Company (U.K.) Limited GBP1.00 1
TIGI International Limited GBP1.00 1
Name of Undertaking
Nominal
Value
Share
Class
Note
Unilever Pension Trust Limited GBP1.00 1
Unilever UK Limited GBP1.00 1
Unilever UK Pension Fund Trustees Limited GBP1.00 1
USF Nominees Limited GBP1.00 1
England and Wales – The Manser Building, Thorncroft Manor, Thorncroft Drive, Dorking, KT22 8JB
Dermalogica (UK) Limited GBP1.00 1
England and Wales – 1st Floor, 16 Charles II Street, London, SW1Y 4QU
Twenty Nine Capital Partners Limited Partnership∞ (80) 4
Unilever Ventures III Limited Partnership ∞ (86.25) 4
England and Wales – Union House, 182-194 Union Street, London, SE1 0LH
REN Skincare Limited GBP1.00 1
REN Limited GBP1.00 1
GBP0.032 19
Murad Europe Limited GBP1.00 1
England and Wales – 3 St James's Road, Kingston Upon Thames, Surrey, KT1 2BA
Nature Delivered Limited GBP0.001 1
GBP0.001 79
GBP0.001 84
Marshfield Bakery Limited GBP0.01 1
England and Wales – 1 More Place, London, SE1 2AF
Accantia Health and Beauty Limited (in liquidation) GBP0.25 1
Unidis Sixty Four Limited (in liquidation) GBP1.00 1
Unilever Bestfoods UK Limited (in liquidation) GBP1.00 1
England and Wales – C/O TMF Group, 8th Floor, 20 Farringdon Street, London, EC4A 4AB
Unilever Ventures Limited GBP1.00 1
England and Wales – Port Sunlight, Wirral, Merseyside, CH62 4ZD
Unilever Global IP Limited ° GBP1.00 1
England and Wales- Suite 1, 3rd Floor, 11-12 St. James` Square, London, SW1Y 4LB
Paula`s Choice UK Limited USD1.00 1
Estonia – Kalmistu tee 28a, Tallinna linn, Harju maakond, 11216
Unilever Eesti AS EUR6.30 1
Ethiopia – Bole Sub City, Kebele 03/05, Lidiya Building, Addis Ababa
Unilever Manufacturing PLC ETB1,000.00 1
Finland – Post Box 254, 00101 Helsinki
Unilever Finland Oy EUR16.82 1
Unilever Ingman Production Oy EUR100.00 1
France – 20, rue des Deux Gares, 92500, Rueil-Malmaison
Bestfoods France Industries S.A.S. (99.99) No Par Value 1
Cogesal-Miko S.A.S. (99.99) No Par Value 1
ekaterra France EUR1.00 1
Fralib Sourcing Unit S.A.S. (99.99) No Par Value 1
Saphir S.A.S. (99.99) EUR1.00 1
Tigi Services France S.A.S. (99.99) No Par Value 1
U-Labs S.A.S. (99.99) No Par Value 1
Unilever France S.A.S. (99.99) No Par Value 1
Unilever France Holdings S.A.S. (99.99) EUR1.00 1
Unilever France HPC Industries S.A.S. (99.99) EUR1.00 1
Unilever Retail Operations France (99.99) No Par Value 1
France – Parc Activillage des Fontaines – Bernin 38926 Crolles Cedex
Intuiskin S.A.S. (96.16) EUR1.00 1
France – ZI de la Norge – Chevigny Saint-Sauveur, 21800 Quetigny
Amora Maille Societe Industrielle S.A.S. (99.99) No Par Value 1
France – 42, rue Jean de La Fontaine , Paris, 75016
Laboratoire Garancia EUR62.50 1
UPD EU EUR1.00 1
Germany – Wiesenstraße 21. 40549 Düsseldorf
Dermalogica GmbH EUR25,000.00 1
Germany – Spitaler Straße 16, 20095 Hamburg
ProCepta Service GmbH EUR28,340.00 1
EUR2.00 1
Name of Undertaking
Nominal
Value
Share
Class
Note
178 Unilever Annual Report and Accounts 2021

EUR2.00 1
EUR2.00 1
EUR2.00 1
Germany – Neue Burg 1, 20457 Hamburg
DU Gesellschaft für Arbeitnehmerüberlassung mbH (99.99) DEM50,000.00 1
NU Business GmbH EUR25,000.00 1
Unilever Deutschland GmbH EUR90,000,000.00 1
EUR2,000,000.00 1
EUR1,000,000.00 1
EUR 100.000,00 1
Unilever Deutschland Holding GmbH EUR39,000.00 1
EUR18,000.00 1
EUR14,300.00 1
EUR5.200.00 1
EUR6,500.00 1
Unilever Deutschland Produktions GmbH & Co. OHG 4
Unilever Deutschland Produktions Verwaltungs GmbH EUR179,000.00 1
Unilever Deutschland Supply Chain Services GmbH EUR51,150.00 1
Dollar Shave Club GmbH EUR25,000.00 1
ekaterra Germany GmbH EUR1.00 1
T2 Germany GmbH EUR1.00 1
Germany – Langnesestraße 1, 64646 Heppenheim
Maizena Grundstücksverwaltung GmbH & Co. OHG 4
Rizofoor Gesellschaft mit beschränkter Haftung EUR15,350.00 1
EUR138,150.00 1
Schafft GmbH EUR63,920.00 1
EUR100,000.00 1
UBG Vermietungs GmbH EUR8,090,190.00 1
EUR136.377,489.00 1
Unilever Deutschland Immobilien Leasing GmbH & Co. OHG 4
Germany – Rotebühlplatz 21, 70178 Stuttgart
TIGI Eurologistic GmbH EUR100.00 1
EUR24,900.00 1
TIGI Haircare GmbH EUR25,600.00 1
Germany - Wiesenstr. 21, D-40549 Düsseldorf
Kate Somerville GmbH EUR1.00 1
Living Proof GmbH EUR1.00 1
Murad GmbH EUR1.00 1
Ren GmbH EUR1.00 1
Ghana – Swanmill, Kwame Nkrumah Avenue, Accra
Millers Swanzy (Ghana) Limited GHC1.00 1
Ghana – Plot No. Ind/A/3A-4, Heavy Industrial Area, Tema, P O Box 721, Tema
Unilever Ghana PLC (74.50) GHC0.0192 1
Unilever Tea Distribution Ghana Limited GHS1.00 1
Ghana – Plot No. Ind/A/3A-4, P O Box 721, Tema
Unilever Oleo Ghana Limited GHC2.50 1
Greece – Kymis ave & 10, Seneka str. GR-145 64 Kifissia
Elais Unilever Hellas SA EUR10.00 1
Unilever Knorr SA EUR10.00 1
Unilever Logistics SA EUR10.00 1
Guatemala – Diagonal 6. 10-50 zona 10, Ciudad de Guatemala. Nivel 17 Torre Norte Ed. Interamericas World Financial Center
Unilever de Centroamerica S.A. GTQ60.00 1
Haiti – 115, Rue Panamericaine, Estabissement Número 1, Petion Ville
Les Condiments Alimentaires, S.A. (61) HTG1000.00 1
Honduras – Anillo Periférico 600 metros después de la colonia, Residencial, Las Uvas contigua acceso de residencial Roble Oeste, Tegucigalpa M.D.C.
Unilever de Centroamerica S.A. HNL10.00 1
Hong Kong – Suite 1106-8, 11/F, Tai Yau Building, 181 Johnston Road, Wanchai
Name of Undertaking
Nominal
Value
Share
Class
Note
Blueair Asia Limited HKD0.10 1
Hong Kong – 6/F Alexandra House, 18 Charter Road, Central
T2 Hong Kong Limited HKD1.00 1
Hong Kong – 6 Dai Fu Street, Tai Po Industrial Estate, N.T.
Unilever Hong Kong Limited HKD0.10 1
Hong Kong – Suite 907, 9/F, Silvercord Tower 2, 30 Canton Road, Tsim Sha Tsui, Kowloon
Hourglass Cosmetics Hong Kong Limited HKD 1.00 7
Hong Kong – Room 1808, 18/F, Tower II Admiralty Centre, 18 Harcourt Road, Admiralty
Hong Kong CarverKorea Limited HKD1.00 7
Hong Kong – 14th Floor, One Taikoo Place, 979 King’s Road, Quarry Bay
UPD Hong Kong Limited HKD100.00 1
Hong Kong – 14/F, One Taikoo Place, 979 King’s Road, Quarry Bay
Go-Uni Limited (67) USD14,376,000.00 1
Hong Kong- Unit B, 17/F, United Centre, 95 Queensway, Admiralty
Paula's Choice Hong Kong Limited HKD100.00 1
Paula's Choice Hong Kong Distribution Services Limited HKD1,000.00 1
Hungary – 1138-Budapest, Váci út 121-127.
Unilever Magyarország Kft HUF1.00 1
India – Unilever House, B. D. Sawant Marg, Chakala, Andheri (E), Mumbai 400 099
Daverashola Estates Private Limited (61.90) INR10.00 1
Hindlever Trust Limited (61.90) INR10.00 1
Hindustan Unilever Limited° (61.90) INR1.00 1
Jamnagar Properties Private Limited (61.90) INR10.00 1
Lakme Lever Private Limited (61.90) INR10.00 1
Levers Associated Trust Limited (61.90) INR10.00 1
Levindra Trust Limited (61.90) INR10.00 1
Pond’s Exports Limited (61.90) INR1.00 1
Unilever India Limited (61.90) INR1.00 1
Unilever India Exports Limited (61.90) INR10.00 1
Unilever Industries Private Limited° INR10.00 1
Unilever Ventures India Advisory Private Limited INR10.00 1
India – S-327, Greater Kailash – II, New Delhi – 110048, Delhi
Blueair India Private Limited INR10. 00 1
India- 64 Main Road, Whitefield, Bangalore, Karnataka
Ekaterra Research and Development India Private Limited INR10. 00 1
Ekaterra Service India Private Limited INR10. 00 1
India- C/o.Vaish Associates, 106, Peninsula Centre, Dr S.S. Rao Road, Parel, Mumbai, Maharashtra, 400012
Jech India Private Limited INR10. 00 1
Indonesia – Grha Unilever, Green Office Park Kav 3, Jalan BSD Boulevard Barat, BSD City, Tangerang, 15345
PT Unilever Indonesia Tbk (84.99) IDR2.00 1
PT Unilever Enterprises Indonesia (99.99) IDR1,000.00 1
PT Unilever Trading Indonesia IDR1,003,875.00 1
Indonesia – Gedung Pasaraya Blok M Gedung B Lantai 6 dan 7 Jalan Iskandarsyah II no. 2, DKI Jakarta
PT Gerai Cepat Untung (75) IDR100,000.00 1
Indonesia – KEK Sei Mangkei, Nagori Sei Mangkei, Kecamatan Bosar Maligas, Kabupaten Simalungun 21183, Sumatera Utara
PT Unilever Oleochemical Indonesia IDR1,000,000.00 1
Iran – No. 23, Corner of 3rd Street, Zagros Street, Argentina Square, Tehran
Unilever Iran (Private Joint Stock Company) IRR1,000,000.00 1
Ireland – 20 Riverwalk, National Digital Park, Citywest Business Campus, Dublin 24
Lipton Soft Drinks (Ireland) Limited EUR1.26 1
Unilever Ireland (Holdings) Limited EUR1.26 1
Unilever Ireland Limited EUR1.26 1
Ireland- 2nd Floor, Palmerston House, Denzille Lane, Dublin, D02 WD37
ekaterra Ireland Limited EUR1.00 1
Isle of Man – Bridge Chambers, West Quay, Ramsey, Isle of Man, IM8 1DL
Rational International Enterprises Limited USD1.00 1
Israel – 3 Gilboa St., Airport City, Ben Gurion Airport
Beigel & Beigel Mazon (1985) Limited ILS1.00 1
Name of Undertaking
Nominal
Value
Share
Class
Note
Unilever Annual Report and Accounts 2021 179
FINA
NC
IAL STA
TEMEN
TS
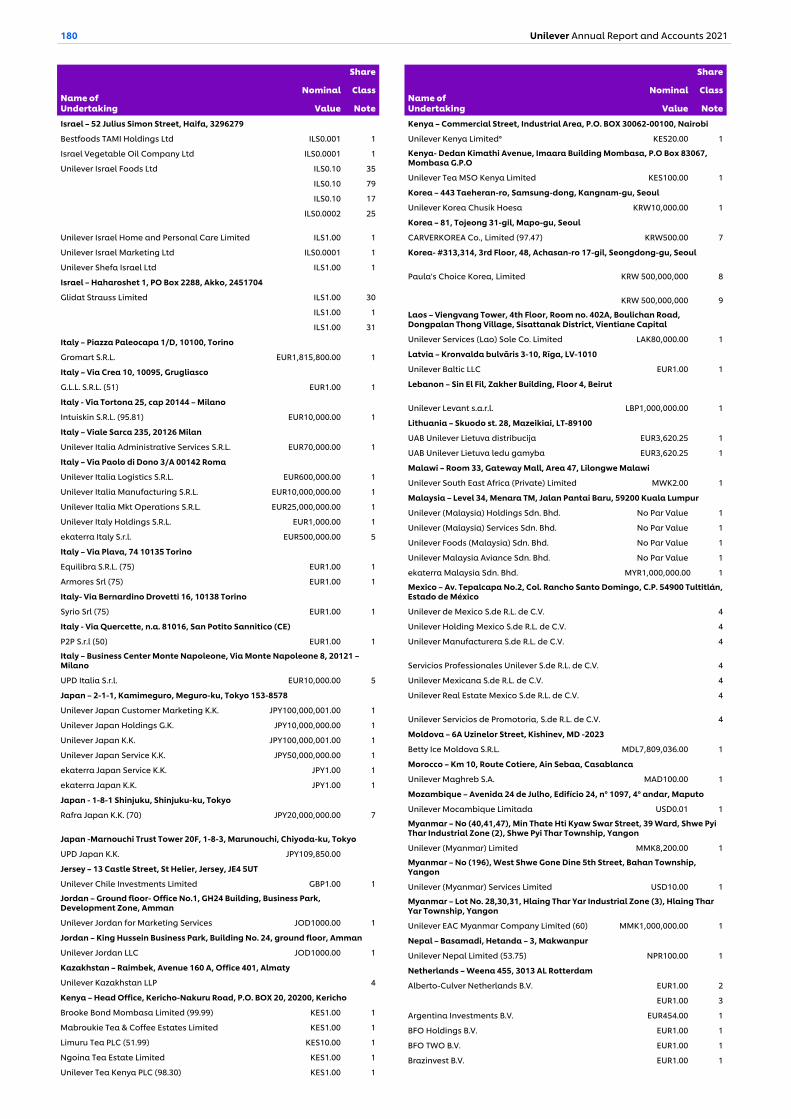
Israel – 52 Julius Simon Street, Haifa, 3296279
Bestfoods TAMI Holdings Ltd ILS0.001 1
Israel Vegetable Oil Company Ltd ILS0.0001 1
Unilever Israel Foods Ltd ILS0.10 35
ILS0.10 79
ILS0.10 17
ILS0.0002 25
Unilever Israel Home and Personal Care Limited ILS1.00 1
Unilever Israel Marketing Ltd ILS0.0001 1
Unilever Shefa Israel Ltd ILS1.00 1
Israel – Haharoshet 1, PO Box 2288, Akko, 2451704
Glidat Strauss Limited ILS1.00 30
ILS1.00 1
ILS1.00 31
Italy – Piazza Paleocapa 1/D, 10100, Torino
Gromart S.R.L. EUR1,815,800.00 1
Italy – Via Crea 10, 10095, Grugliasco
G.L.L. S.R.L. (51) EUR1.00 1
Italy - Via Tortona 25, cap 20144 – Milano
Intuiskin S.R.L. (95.81) EUR10,000.00 1
Italy – Viale Sarca 235, 20126 Milan
Unilever Italia Administrative Services S.R.L. EUR70,000.00 1
Italy – Via Paolo di Dono 3/A 00142 Roma
Unilever Italia Logistics S.R.L. EUR600,000.00 1
Unilever Italia Manufacturing S.R.L. EUR10,000,000.00 1
Unilever Italia Mkt Operations S.R.L. EUR25,000,000.00 1
Unilever Italy Holdings S.R.L. EUR1,000.00 1
ekaterra Italy S.r.l. EUR500,000.00 5
Italy – Via Plava, 74 10135 Torino
Equilibra S.R.L. (75) EUR1.00 1
Armores Srl (75) EUR1.00 1
Italy- Via Bernardino Drovetti 16, 10138 Torino
Syrio Srl (75) EUR1.00 1
Italy - Via Quercette, n.a. 81016, San Potito Sannitico (CE)
P2P S.r.l (50) EUR1.00 1
Italy – Business Center Monte Napoleone, Via Monte Napoleone 8, 20121 – Milano
UPD Italia S.r.l. EUR10,000.00 5
Japan – 2-1-1, Kamimeguro, Meguro-ku, Tokyo 153-8578
Unilever Japan Customer Marketing K.K. JPY100,000,001.00 1
Unilever Japan Holdings G.K. JPY10,000,000.00 1
Unilever Japan K.K. JPY100,000,001.00 1
Unilever Japan Service K.K. JPY50,000,000.00 1
ekaterra Japan Service K.K. JPY1.00 1
ekaterra Japan K.K. JPY1.00 1
Japan - 1-8-1 Shinjuku, Shinjuku-ku, Tokyo
Rafra Japan K.K. (70) JPY20,000,000.00 7
Japan -Marnouchi Trust Tower 20F, 1-8-3, Marunouchi, Chiyoda-ku, Tokyo
UPD Japan K.K. JPY109,850.00
Jersey – 13 Castle Street, St Helier, Jersey, JE4 5UT
Unilever Chile Investments Limited GBP1.00 1
Jordan – Ground floor- Office No.1, GH24 Building, Business Park, Development Zone, Amman
Unilever Jordan for Marketing Services JOD1000.00 1
Jordan – King Hussein Business Park, Building No. 24, ground floor, Amman
Unilever Jordan LLC JOD1000.00 1
Kazakhstan – Raimbek, Avenue 160 A, Office 401, Almaty
Unilever Kazakhstan LLP 4
Kenya – Head Office, Kericho-Nakuru Road, P.O. BOX 20, 20200, Kericho
Brooke Bond Mombasa Limited (99.99) KES1.00 1
Mabroukie Tea & Coffee Estates Limited KES1.00 1
Limuru Tea PLC (51.99) KES10.00 1
Ngoina Tea Estate Limited KES1.00 1
Unilever Tea Kenya PLC (98.30) KES1.00 1
Name of Undertaking
Nominal
Value
Share
Class
Note
Kenya – Commercial Street, Industrial Area, P.O. BOX 30062-00100, Nairobi
Unilever Kenya Limited° KES20.00 1
Kenya- Dedan Kimathi Avenue, Imaara Building Mombasa, P.O Box 83067, Mombasa G.P.O
Unilever Tea MSO Kenya Limited KES100.00 1
Korea – 443 Taeheran-ro, Samsung-dong, Kangnam-gu, Seoul
Unilever Korea Chusik Hoesa KRW10,000.00 1
Korea – 81, Tojeong 31-gil, Mapo-gu, Seoul
CARVERKOREA Co., Limited (97.47) KRW500.00 7
Korea- #313,314, 3rd Floor, 48, Achasan-ro 17-gil, Seongdong-gu, Seoul
Paula's Choice Korea, Limited KRW 500,000,000 8
KRW 500,000,000 9
Laos – Viengvang Tower, 4th Floor, Room no. 402A, Boulichan Road, Dongpalan Thong Village, Sisattanak District, Vientiane Capital
Unilever Services (Lao) Sole Co. Limited LAK80,000.00 1
Latvia – Kronvalda bulvāris 3-10, Rīga, LV-1010
Unilever Baltic LLC EUR1.00 1
Lebanon – Sin El Fil, Zakher Building, Floor 4, Beirut
Unilever Levant s.a.r.l. LBP1,000,000.00 1
Lithuania – Skuodo st. 28, Mazeikiai, LT-89100
UAB Unilever Lietuva distribucija EUR3,620.25 1
UAB Unilever Lietuva ledu gamyba EUR3,620.25 1
Malawi – Room 33, Gateway Mall, Area 47, Lilongwe Malawi
Unilever South East Africa (Private) Limited MWK2.00 1
Malaysia – Level 34, Menara TM, Jalan Pantai Baru, 59200 Kuala Lumpur
Unilever (Malaysia) Holdings Sdn. Bhd. No Par Value 1
Unilever (Malaysia) Services Sdn. Bhd. No Par Value 1
Unilever Foods (Malaysia) Sdn. Bhd. No Par Value 1
Unilever Malaysia Aviance Sdn. Bhd. No Par Value 1
ekaterra Malaysia Sdn. Bhd. MYR1,000,000.00 1
Mexico – Av. Tepalcapa No.2, Col. Rancho Santo Domingo, C.P. 54900 Tultitlán, Estado de México
Unilever de Mexico S.de R.L. de C.V. 4
Unilever Holding Mexico S.de R.L. de C.V. 4
Unilever Manufacturera S.de R.L. de C.V. 4
Servicios Professionales Unilever S.de R.L. de C.V. 4
Unilever Mexicana S.de R.L. de C.V. 4
Unilever Real Estate Mexico S.de R.L. de C.V. 4
Unilever Servicios de Promotoria, S.de R.L. de C.V. 4
Moldova – 6A Uzinelor Street, Kishinev, MD -2023
Betty Ice Moldova S.R.L. MDL7,809,036.00 1
Morocco – Km 10, Route Cotiere, Ain Sebaa, Casablanca
Unilever Maghreb S.A. MAD100.00 1
Mozambique – Avenida 24 de Julho, Edifício 24, nº 1097, 4º andar, Maputo
Unilever Mocambique Limitada USD0.01 1
Myanmar – No (40,41,47), Min Thate Hti Kyaw Swar Street, 39 Ward, Shwe Pyi Thar Industrial Zone (2), Shwe Pyi Thar Township, Yangon
Unilever (Myanmar) Limited MMK8,200.00 1
Myanmar – No (196), West Shwe Gone Dine 5th Street, Bahan Township, Yangon
Unilever (Myanmar) Services Limited USD10.00 1
Myanmar – Lot No. 28,30,31, Hlaing Thar Yar Industrial Zone (3), Hlaing Thar Yar Township, Yangon
Unilever EAC Myanmar Company Limited (60) MMK1,000,000.00 1
Nepal – Basamadi, Hetanda – 3, Makwanpur
Unilever Nepal Limited (53.75) NPR100.00 1
Netherlands – Weena 455, 3013 AL Rotterdam
Alberto-Culver Netherlands B.V. EUR1.00 2
EUR1.00 3
Argentina Investments B.V. EUR454.00 1
BFO Holdings B.V. EUR1.00 1
BFO TWO B.V. EUR1.00 1
Brazinvest B.V. EUR1.00 1
Name of Undertaking
Nominal
Value
Share
Class
Note
180 Unilever Annual Report and Accounts 2021
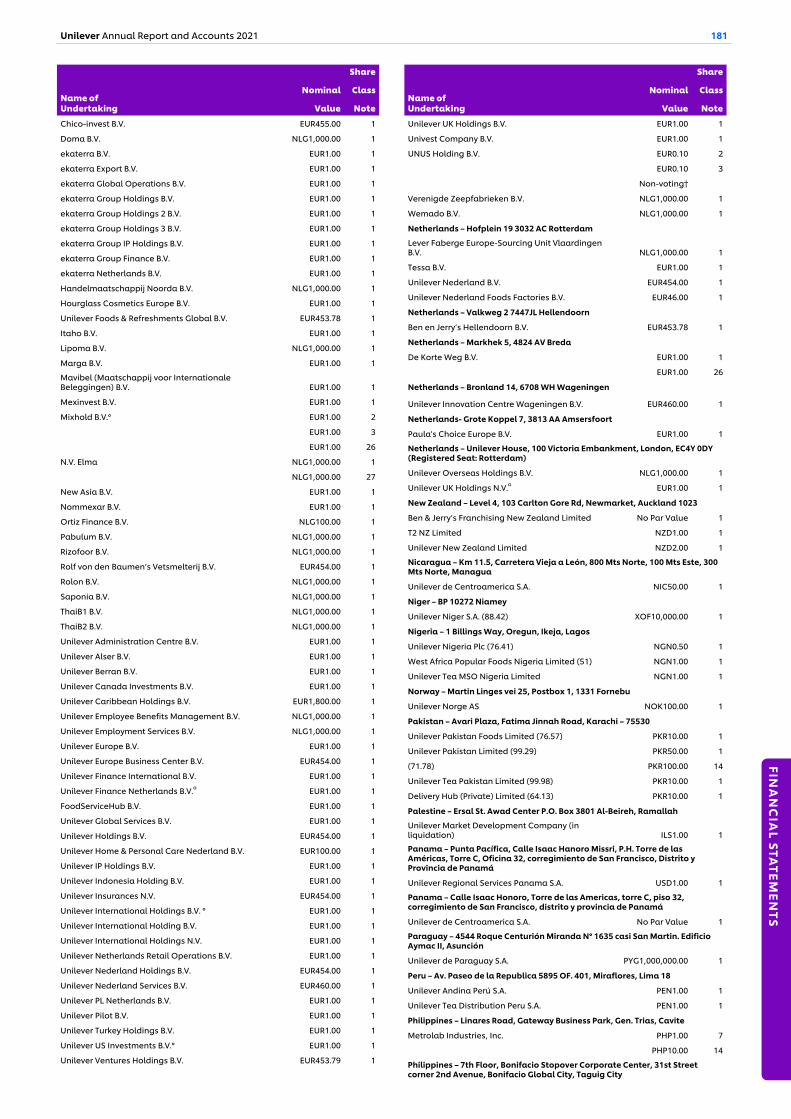
Chico-invest B.V. EUR455.00 1
Doma B.V. NLG1,000.00 1
ekaterra B.V. EUR1.00 1
ekaterra Export B.V. EUR1.00 1
ekaterra Global Operations B.V. EUR1.00 1
ekaterra Group Holdings B.V. EUR1.00 1
ekaterra Group Holdings 2 B.V. EUR1.00 1
ekaterra Group Holdings 3 B.V. EUR1.00 1
ekaterra Group IP Holdings B.V. EUR1.00 1
ekaterra Group Finance B.V. EUR1.00 1
ekaterra Netherlands B.V. EUR1.00 1
Handelmaatschappij Noorda B.V. NLG1,000.00 1
Hourglass Cosmetics Europe B.V. EUR1.00 1
Unilever Foods & Refreshments Global B.V. EUR453.78 1
Itaho B.V. EUR1.00 1
Lipoma B.V. NLG1,000.00 1
Marga B.V. EUR1.00 1
Mavibel (Maatschappij voor Internationale Beleggingen) B.V. EUR1.00 1
Mexinvest B.V. EUR1.00 1
Mixhold B.V.° EUR1.00 2
EUR1.00 3
EUR1.00 26
N.V. Elma NLG1,000.00 1
NLG1,000.00 27
New Asia B.V. EUR1.00 1
Nommexar B.V. EUR1.00 1
Ortiz Finance B.V. NLG100.00 1
Pabulum B.V. NLG1,000.00 1
Rizofoor B.V. NLG1,000.00 1
Rolf von den Baumen’s Vetsmelterij B.V. EUR454.00 1
Rolon B.V. NLG1,000.00 1
Saponia B.V. NLG1,000.00 1
ThaiB1 B.V. NLG1,000.00 1
ThaiB2 B.V. NLG1,000.00 1
Unilever Administration Centre B.V. EUR1.00 1
Unilever Alser B.V. EUR1.00 1
Unilever Berran B.V. EUR1.00 1
Unilever Canada Investments B.V. EUR1.00 1
Unilever Caribbean Holdings B.V. EUR1,800.00 1
Unilever Employee Benefits Management B.V. NLG1,000.00 1
Unilever Employment Services B.V. NLG1,000.00 1
Unilever Europe B.V. EUR1.00 1
Unilever Europe Business Center B.V. EUR454.00 1
Unilever Finance International B.V. EUR1.00 1
Unilever Finance Netherlands B.V.o EUR1.00 1
FoodServiceHub B.V. EUR1.00 1
Unilever Global Services B.V. EUR1.00 1
Unilever Holdings B.V. EUR454.00 1
Unilever Home & Personal Care Nederland B.V. EUR100.00 1
Unilever IP Holdings B.V. EUR1.00 1
Unilever Indonesia Holding B.V. EUR1.00 1
Unilever Insurances N.V. EUR454.00 1
Unilever International Holdings B.V. ° EUR1.00 1
Unilever International Holding B.V. EUR1.00 1
Unilever International Holdings N.V. EUR1.00 1
Unilever Netherlands Retail Operations B.V. EUR1.00 1
Unilever Nederland Holdings B.V. EUR454.00 1
Unilever Nederland Services B.V. EUR460.00 1
Unilever PL Netherlands B.V. EUR1.00 1
Unilever Pilot B.V. EUR1.00 1
Unilever Turkey Holdings B.V. EUR1.00 1
Unilever US Investments B.V.° EUR1.00 1
Unilever Ventures Holdings B.V. EUR453.79 1
Name of Undertaking
Nominal
Value
Share
Class
Note
Unilever UK Holdings B.V. EUR1.00 1
Univest Company B.V. EUR1.00 1
UNUS Holding B.V. EUR0.10 2
EUR0.10 3
Non-voting†
Verenigde Zeepfabrieken B.V. NLG1,000.00 1
Wemado B.V. NLG1,000.00 1
Netherlands – Hofplein 19 3032 AC Rotterdam
Lever Faberge Europe-Sourcing Unit Vlaardingen B.V. NLG1,000.00 1
Tessa B.V. EUR1.00 1
Unilever Nederland B.V. EUR454.00 1
Unilever Nederland Foods Factories B.V. EUR46.00 1
Netherlands – Valkweg 2 7447JL Hellendoorn
Ben en Jerry’s Hellendoorn B.V. EUR453.78 1
Netherlands – Markhek 5, 4824 AV Breda
De Korte Weg B.V. EUR1.00 1
EUR1.00 26
Netherlands – Bronland 14, 6708 WH Wageningen
Unilever Innovation Centre Wageningen B.V. EUR460.00 1
Netherlands- Grote Koppel 7, 3813 AA Amsersfoort
Paula's Choice Europe B.V. EUR1.00 1
Netherlands – Unilever House, 100 Victoria Embankment, London, EC4Y 0DY (Registered Seat: Rotterdam)
Unilever Overseas Holdings B.V. NLG1,000.00 1
Unilever UK Holdings N.V.o EUR1.00 1
New Zealand – Level 4, 103 Carlton Gore Rd, Newmarket, Auckland 1023
Ben & Jerry’s Franchising New Zealand Limited No Par Value 1
T2 NZ Limited NZD1.00 1
Unilever New Zealand Limited NZD2.00 1
Nicaragua – Km 11.5, Carretera Vieja a León, 800 Mts Norte, 100 Mts Este, 300 Mts Norte, Managua
Unilever de Centroamerica S.A. NIC50.00 1
Niger – BP 10272 Niamey
Unilever Niger S.A. (88.42) XOF10,000.00 1
Nigeria – 1 Billings Way, Oregun, Ikeja, Lagos
Unilever Nigeria Plc (76.41) NGN0.50 1
West Africa Popular Foods Nigeria Limited (51) NGN1.00 1
Unilever Tea MSO Nigeria Limited NGN1.00 1
Norway – Martin Linges vei 25, Postbox 1, 1331 Fornebu
Unilever Norge AS NOK100.00 1
Pakistan – Avari Plaza, Fatima Jinnah Road, Karachi – 75530
Unilever Pakistan Foods Limited (76.57) PKR10.00 1
Unilever Pakistan Limited (99.29) PKR50.00 1
(71.78) PKR100.00 14
Unilever Tea Pakistan Limited (99.98) PKR10.00 1
Delivery Hub (Private) Limited (64.13) PKR10.00 1
Palestine – Ersal St. Awad Center P.O. Box 3801 Al-Beireh, Ramallah
Unilever Market Development Company (in liquidation) ILS1.00 1
Panama – Punta Pacífica, Calle Isaac Hanoro Missri, P.H. Torre de las Américas, Torre C, Oficina 32, corregimiento de San Francisco, Distrito y Provincia de Panamá
Unilever Regional Services Panama S.A. USD1.00 1
Panama – Calle Isaac Honoro, Torre de las Americas, torre C, piso 32, corregimiento de San Francisco, distrito y provincia de Panamá
Unilever de Centroamerica S.A. No Par Value 1
Paraguay – 4544 Roque Centurión Miranda N° 1635 casi San Martin. Edificio Aymac II, Asunción
Unilever de Paraguay S.A. PYG1,000,000.00 1
Peru – Av. Paseo de la Republica 5895 OF. 401, Miraflores, Lima 18
Unilever Andina Perú S.A. PEN1.00 1
Unilever Tea Distribution Peru S.A. PEN1.00 1
Philippines – Linares Road, Gateway Business Park, Gen. Trias, Cavite
Metrolab Industries, Inc. PHP1.00 7
PHP10.00 14
Philippines – 7th Floor, Bonifacio Stopover Corporate Center, 31st Street corner 2nd Avenue, Bonifacio Global City, Taguig City
Name of Undertaking
Nominal
Value
Share
Class
Note
Unilever Annual Report and Accounts 2021 181
FINA
NC
IAL STA
TEMEN
TS

Unilever Philippines, Inc. PHP50.00 7
Philippines – 11th Avenue corner 39th Street, Bonifacio Triangle, Bonifacio Global City, Taguig City
Universal Philippines Body Care, Inc PHP100.00 7
Philippines – Manggahan Light Industrial Compound, A. Rodriguez Avenue, Bo. Manggahan, Pasig City
Unilever RFM Ice Cream, Inc. (50) PHP1.00 29
Philippines – Four/Neo, 12th Floor, Fourth Avenue, Bonifacio Global City, Barangay Fort Bonifacio, Taguig 1634, Metro Manila
Gronext Technologies Phils., Inc. PHP1.00 1
Poland – Jerozolimskie 134, 02-305, Warszawa
Unilever Polska Sp. z o.o. PLN50.00 1
Unilever Poland Services Sp. z o.o. PLN50.00 1
Unilever Polska S.A. PLN10.00 1
Unilever Tea Manufacturing Poland Sp. z o.o. PLN50.00 1
Unilever Tea MSO Poland Sp. z o.o. PLN50.00 1
Unilever Tea Service Co Poland Sp. z o.o. PLN50.00 1
Puerto Rico – Professional Services Park 997, San Roberto St., Suite 7, San Juan
Unilever de Puerto Rico, Inc° USD100.00 1
Romania – Ploiesti, 291 Republicii Avenue, Prahova County
Unilever Romania S.A. (99) ROL0.10 1
Unilever South Central Europe S.A. ROL260.50 1
Romania – 121 Cernăuţi Street, Suceava 720089
Betty Ice SRL RON10.00 1
Romania – 9-9A Dimitrie Pompei Blvd, Iride Business Park Buildings 5 and 6, 2nd District, Bucuresti
Good People SA (75) RON10.00 1
Russia – 644031, 205, 10 let Oktyabrya, Omsk
Inmarko-Trade LLCRUB
1,000,000.00 13
Russia – 123022, Floor 7, Premise 19, Room 36, 13, Sergeya Makeeva Street, Moscow
Unilever Rus LLCRUB
28,847,390, 269.19 13
OOO Unilever Tea LLCRUB
4,500,000.00 1
Russia – Tula region, Leninsky district, Ilyinskoye rural settlement, Varvarovka village, Varvarovsky pass, Building 15-F, Room 406, Floor 3
Gourmand LLC RUB10,000.00 4
Rwanda – Sanlam Towers, P.O.Box 973, Kigali
Unilever Rwanda Limited RWF 1,000 1
Rwanda – Nyarugenge, Nyarungenge, Umujyi wa Kigali, Rwanda, P.O. BOX 6428 Kigali
Unilever Tea Rwanda Limited RWF1000.00 1
Saudi Arabia – P.O. Box 5694, Jeddah 21432
Binzagr Unilever LimitedX (49) SAR1,000.00 1
Serbia – Belgrade, Serbia, Omladinskih brigada 90b – Novi Beograd
Unilever Beograd d.o.o. 13
Singapore – 18 Nepal Park, 139407
Unilever Asia Private Limited No Par Value 1
Unilever Singapore Pte. Limited No Par Value 1
UPD Singapore Pte. Limited No Par Value 1
Gronext Technologies Pte. Ltd. No Par Value 1
T2 Singapore Pte. Limited No Par Value 1
Slovakia – Karadzicova 10, 821 08 Bratislava
Unilever Slovensko, spol. s. r.o. EUR1.00 1
South Africa -15 Nollsworth Crescent, Nollsworth Park, La Lucia Ridge Office Estate, La Lucia, 4051
Nollsworth Park Properties (Pty) Limited (in liquidation) ZAR2.00 1
Unilever Market Development (Pty) Limited ZAR1.00 1
Unilever South Africa (Pty) Limited ZAR2.00 1
Unilever South Africa Holdings (Pty) Limited ZAR1.00 1
ZAR1.00 2
ZAR1.00 3
Tea Manufacturing South Africa (Pty) Limited No Par Value 1
Tea MSO South Africa (Pty) Limited No Par Value 1
South Africa – 4 Merchant Place, CNR Fredman Drive and Rivonia Road Sandton, 2196
Name of Undertaking
Nominal
Value
Share
Class
Note
Aconcagua 14 Investments (RF) (Pty) Limited ZAR1.00 1
South Korea- 443 Taeheran-ro, Samsung-dong, Kangnam-gu, Seoul
Unilever Tea Distribution Korea Co., LimitedKRW
10000.00 1
Spain – PA / Reding, 43, Izda 1, 29016 Malaga
Intuiskin S.L.U. (95.81) EUR1.00 1
Spain – C/ Tecnología 19, 08840 Viladecans
Unilever Espana S.A. EUR48.00 1
Unilever Services Espana S.A. EUR60.00 1
Spain – C/ Felipe del Río, 14 – 48940 Leioa
Unilever Foods Industrial Espana, S.L.U. EUR600.00 1
Sri Lanka – 258 M Vincent Perera Mawatha, Colombo 14
Brooke Bond Ceylon (Private) Limited LKR10.00 1
Ceytea (Private) Limited LKR10.00 1
Lever Brothers (Exports and Marketing) (Private) Limited° LKR2.00 1
Maddema Trading Company (Private) Limited LKR10.00 1
Premium Exports Ceylon (Private) Limited LKR10.00 1
R.O. Mennell & Co. (Ceylon) (Private) Limited LKR10.00 1
Unilever Ceylon Services (Private) Limited LKR10.00 1
Unilever Lipton Ceylon Limited LKR10.00 1
Unilever Sri Lanka Limited° LKR10.00 1
Unilever Tea MSO Ceylon (Private) Limited LKR10.00 1
Sudan – Property no. 125, block 2, Industrial Area, Kafuri District, Bahri, Kafori
Unilever Sudanese Investment Company SDG10,000.00 1
Sweden – Box 1056, Svetsarevägen 15, 171 22, Solna Stockholm
Alberto Culver AB SEK100.00 1
Unilever Holding AB SEK100.00 1
Unilever Produktion AB SEK50.00 1
Unilever Sverige AB SEK100.00 1
Sweden – Karlavagen 108, 115 26 Stockholm
Blueair AB SEK100.00 1
Sweden – Karlavagen 108, 115 26, Stockholm
Jonborsten AB SEK1.00 1
Sweden – Nordenskioldgatan 19, 413 09 Goteborg
Nature Delivered Sweden AB SEK1.00 1
Sweden- Östra Varvsgatan 4, Malmö, 211 75
ekaterra Tea Sweden AB SEK1.00 1
Switzerland – Bahnhofstrasse 19, CH 8240 Thayngen
Knorr-Nährmittel Aktiengesellschaft CHF1,000.00 1
Unilever Schweiz GmbH CHF100,000.00 1
ekaterra Switzerland AG CHF1.00 1
Switzerland – Spitalstrasse 5, 8200, Schaffhausen
Helmsman Capital AG CHF1,000.00 1
Unilever Supply Chain Company AG CHF1,000.00 1
Unilever ASCC AG CHF1,000.00 1
Unilever Finance International AG CHF1,000.00 1
Unilever Business and Marketing Support AG CHF1,000.00 1
Unilever Overseas Holdings AG CHF1,000.00 1
Unilever Schaffhausen Service AG CHF1,000.00 1
Unilever Swiss Holdings AG CHF1,000.00 1
Switzerland – Hinterbergstr. 30, CH-6312 Steinhausen
Oswald Nahrungsmittel GmbH CHF800,000.00 1
Taiwan – 3F, No. 550, Sec. 4, Zhongxiao East Rd., Xinyi District, Taipei City
Unilever Taiwan Limited (99.92) TWD10.00 1
Unilever Tea Distribution Taiwan Limited TWD10.00 1
Taiwan- 8F., No.186, Sec.1, Zhangmei Rd., Changhua City 500, Taipei (R.O.C.)
Paula's Choice Taiwan Co., Limited NTD10.00 1
Tanzania – Plot No.4A, Pugu Road, Dar Es Salaam
Unilever Tanzania Limited TZS20.00 1
Tanzania – P.O. Box 40, Mufindi, Iringa, 6423
Unilever Tea Tanzania Limited TZS20.00 1
Thailand – 161 Rama 9 Road, Huay Kwang, Bangkok 10310
Unilever Thai Holdings Limited THB100.00 1
Name of Undertaking
Nominal
Value
Share
Class
Note
182 Unilever Annual Report and Accounts 2021
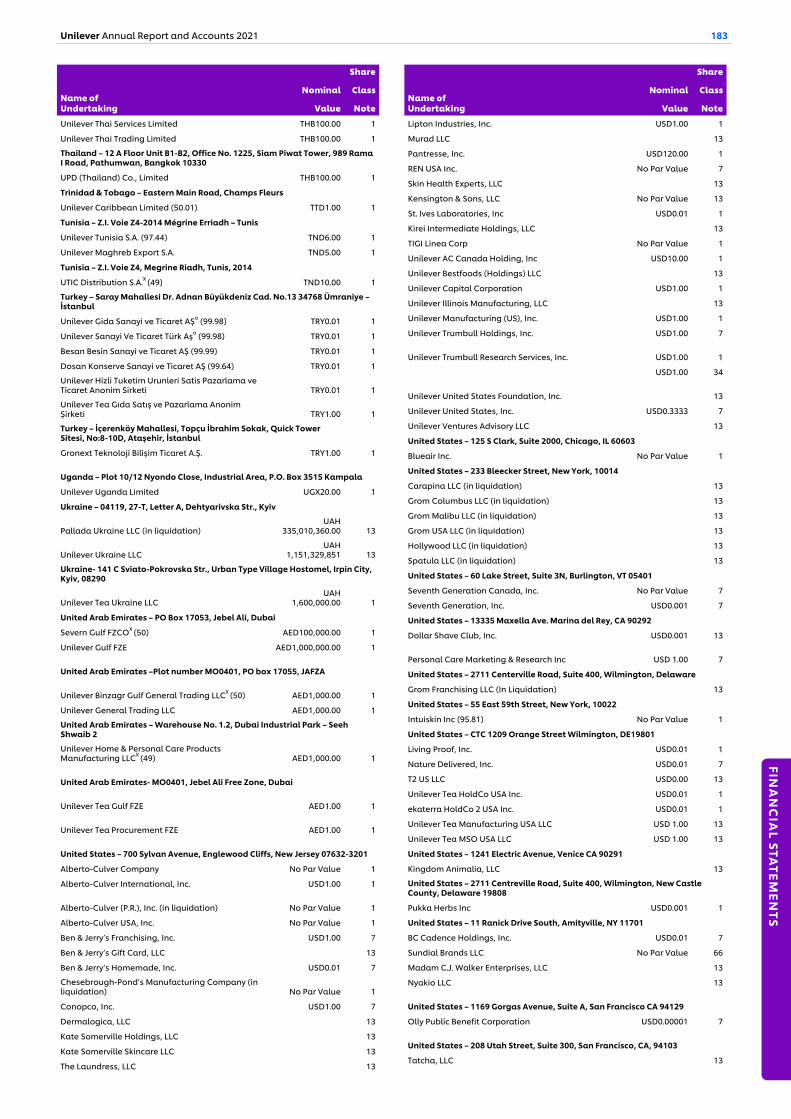
Unilever Thai Services Limited THB100.00 1
Unilever Thai Trading Limited THB100.00 1
Thailand – 12 A Floor Unit B1-B2, Office No. 1225, Siam Piwat Tower, 989 Rama I Road, Pathumwan, Bangkok 10330
UPD (Thailand) Co., Limited THB100.00 1
Trinidad & Tobago – Eastern Main Road, Champs Fleurs
Unilever Caribbean Limited (50.01) TTD1.00 1
Tunisia – Z.I. Voie Z4-2014 Mégrine Erriadh – Tunis
Unilever Tunisia S.A. (97.44) TND6.00 1
Unilever Maghreb Export S.A. TND5.00 1
Tunisia – Z.I. Voie Z4, Megrine Riadh, Tunis, 2014
UTIC Distribution S.A.X (49) TND10.00 1
Turkey – Saray Mahallesi Dr. Adnan Büyükdeniz Cad. No.13 34768 Ümraniye – İstanbul
Unilever Gida Sanayi ve Ticaret AŞo (99.98) TRY0.01 1
Unilever Sanayi Ve Ticaret Türk Aşo (99.98) TRY0.01 1
Besan Besin Sanayi ve Ticaret AŞ (99.99) TRY0.01 1
Dosan Konserve Sanayi ve Ticaret AŞ (99.64) TRY0.01 1
Unilever Hizli Tuketim Urunleri Satis Pazarlama ve Ticaret Anonim Sirketi TRY0.01 1
Unilever Tea Gıda Satış ve Pazarlama Anonim Şirketi TRY1.00 1
Turkey – İçerenköy Mahallesi, Topçu İbrahim Sokak, Quick Tower Sitesi, No:8-10D, Ataşehir, İstanbul
Gronext Teknoloji Bilişim Ticaret A.Ş. TRY1.00 1
Uganda – Plot 10/12 Nyondo Close, Industrial Area, P.O. Box 3515 Kampala
Unilever Uganda Limited UGX20.00 1
Ukraine – 04119, 27-T, Letter A, Dehtyarivska Str., Kyiv
Pallada Ukraine LLC (in liquidation)UAH
335,010,360.00 13
Unilever Ukraine LLCUAH
1,151,329,851 13
Ukraine- 141 C Sviato-Pokrovska Str., Urban Type Village Hostomel, Irpin City, Kyiv, 08290
Unilever Tea Ukraine LLCUAH
1,600,000.00 1
United Arab Emirates – PO Box 17053, Jebel Ali, Dubai
Severn Gulf FZCOX (50) AED100,000.00 1
Unilever Gulf FZE AED1,000,000.00 1
United Arab Emirates –Plot number MO0401, PO box 17055, JAFZA
Unilever Binzagr Gulf General Trading LLCX (50) AED1,000.00 1
Unilever General Trading LLC AED1,000.00 1
United Arab Emirates – Warehouse No. 1.2, Dubai Industrial Park – Seeh Shwaib 2
Unilever Home & Personal Care Products Manufacturing LLCX (49) AED1,000.00 1
United Arab Emirates- MO0401, Jebel Ali Free Zone, Dubai
Unilever Tea Gulf FZE AED1.00 1
Unilever Tea Procurement FZE AED1.00 1
United States – 700 Sylvan Avenue, Englewood Cliffs, New Jersey 07632-3201
Alberto-Culver Company No Par Value 1
Alberto-Culver International, Inc. USD1.00 1
Alberto-Culver (P.R.), Inc. (in liquidation) No Par Value 1
Alberto-Culver USA, Inc. No Par Value 1
Ben & Jerry’s Franchising, Inc. USD1.00 7
Ben & Jerry’s Gift Card, LLC 13
Ben & Jerry’s Homemade, Inc. USD0.01 7
Chesebrough-Pond’s Manufacturing Company (in liquidation) No Par Value 1
Conopco, Inc. USD1.00 7
Dermalogica, LLC 13
Kate Somerville Holdings, LLC 13
Kate Somerville Skincare LLC 13
The Laundress, LLC 13
Name of Undertaking
Nominal
Value
Share
Class
Note
Lipton Industries, Inc. USD1.00 1
Murad LLC 13
Pantresse, Inc. USD120.00 1
REN USA Inc. No Par Value 7
Skin Health Experts, LLC 13
Kensington & Sons, LLC No Par Value 13
St. Ives Laboratories, Inc USD0.01 1
Kirei Intermediate Holdings, LLC 13
TIGI Linea Corp No Par Value 1
Unilever AC Canada Holding, Inc USD10.00 1
Unilever Bestfoods (Holdings) LLC 13
Unilever Capital Corporation USD1.00 1
Unilever Illinois Manufacturing, LLC 13
Unilever Manufacturing (US), Inc. USD1.00 1
Unilever Trumbull Holdings, Inc. USD1.00 7
Unilever Trumbull Research Services, Inc. USD1.00 1
USD1.00 34
Unilever United States Foundation, Inc. 13
Unilever United States, Inc. USD0.3333 7
Unilever Ventures Advisory LLC 13
United States – 125 S Clark, Suite 2000, Chicago, IL 60603
Blueair Inc. No Par Value 1
United States – 233 Bleecker Street, New York, 10014
Carapina LLC (in liquidation) 13
Grom Columbus LLC (in liquidation) 13
Grom Malibu LLC (in liquidation) 13
Grom USA LLC (in liquidation) 13
Hollywood LLC (in liquidation) 13
Spatula LLC (in liquidation) 13
United States – 60 Lake Street, Suite 3N, Burlington, VT 05401
Seventh Generation Canada, Inc. No Par Value 7
Seventh Generation, Inc. USD0.001 7
United States – 13335 Maxella Ave. Marina del Rey, CA 90292
Dollar Shave Club, Inc. USD0.001 13
Personal Care Marketing & Research Inc USD 1.00 7
United States – 2711 Centerville Road, Suite 400, Wilmington, Delaware
Grom Franchising LLC (In Liquidation) 13
United States – 55 East 59th Street, New York, 10022
Intuiskin Inc (95.81) No Par Value 1
United States – CTC 1209 Orange Street Wilmington, DE19801
Living Proof, Inc. USD0.01 1
Nature Delivered, Inc. USD0.01 7
T2 US LLC USD0.00 13
Unilever Tea HoldCo USA Inc. USD0.01 1
ekaterra HoldCo 2 USA Inc. USD0.01 1
Unilever Tea Manufacturing USA LLC USD 1.00 13
Unilever Tea MSO USA LLC USD 1.00 13
United States – 1241 Electric Avenue, Venice CA 90291
Kingdom Animalia, LLC 13
United States – 2711 Centreville Road, Suite 400, Wilmington, New Castle County, Delaware 19808
Pukka Herbs Inc USD0.001 1
United States – 11 Ranick Drive South, Amityville, NY 11701
BC Cadence Holdings, Inc. USD0.01 7
Sundial Brands LLC No Par Value 66
Madam C.J. Walker Enterprises, LLC 13
Nyakio LLC 13
United States – 1169 Gorgas Avenue, Suite A, San Francisco CA 94129
Olly Public Benefit Corporation USD0.00001 7
United States – 208 Utah Street, Suite 300, San Francisco, CA, 94103
Tatcha, LLC 13
Name of Undertaking
Nominal
Value
Share
Class
Note
Unilever Annual Report and Accounts 2021 183
FINA
NC
IAL STA
TEMEN
TS
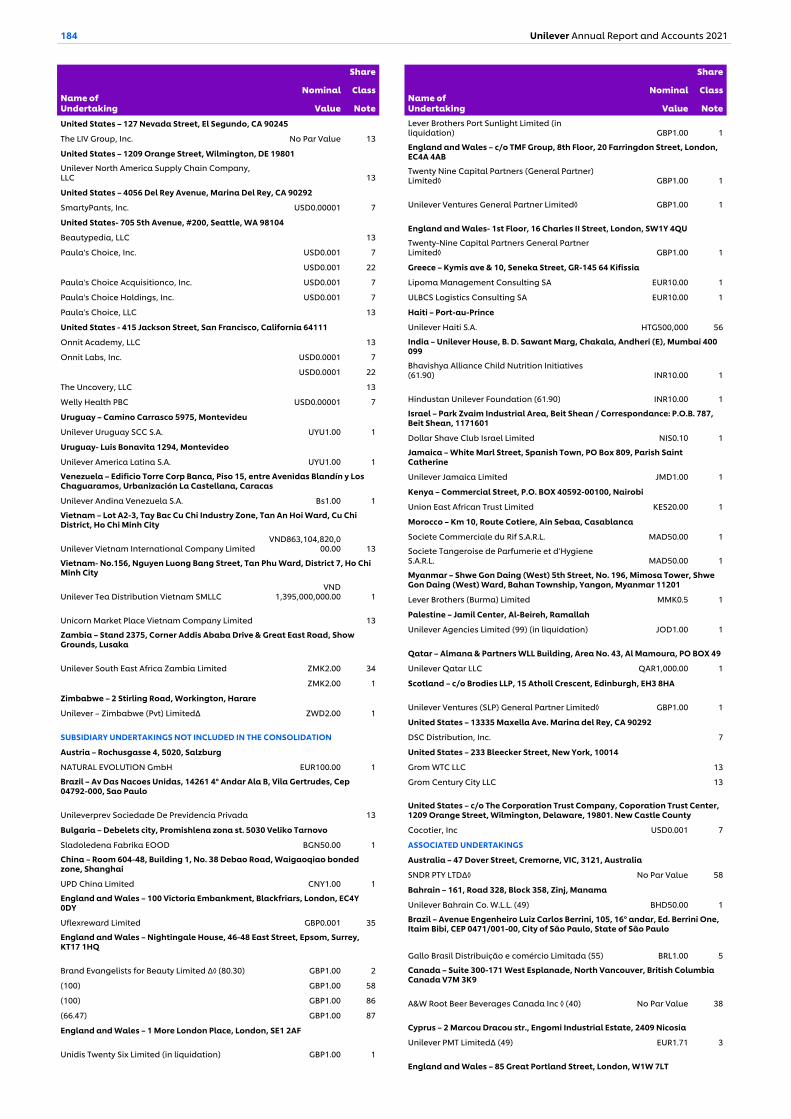
United States – 127 Nevada Street, El Segundo, CA 90245
The LIV Group, Inc. No Par Value 13
United States – 1209 Orange Street, Wilmington, DE 19801
Unilever North America Supply Chain Company, LLC 13
United States – 4056 Del Rey Avenue, Marina Del Rey, CA 90292
SmartyPants, Inc. USD0.00001 7
United States- 705 5th Avenue, #200, Seattle, WA 98104
Beautypedia, LLC 13
Paula's Choice, Inc. USD0.001 7
USD0.001 22
Paula's Choice Acquisitionco, Inc. USD0.001 7
Paula's Choice Holdings, Inc. USD0.001 7
Paula's Choice, LLC 13
United States - 415 Jackson Street, San Francisco, California 64111
Onnit Academy, LLC 13
Onnit Labs, Inc. USD0.0001 7
USD0.0001 22
The Uncovery, LLC 13
Welly Health PBC USD0.00001 7
Uruguay – Camino Carrasco 5975, Montevideu
Unilever Uruguay SCC S.A. UYU1.00 1
Uruguay- Luis Bonavita 1294, Montevideo
Unilever America Latina S.A. UYU1.00 1
Venezuela – Edificio Torre Corp Banca, Piso 15, entre Avenidas Blandín y Los Chaguaramos, Urbanización La Castellana, Caracas
Unilever Andina Venezuela S.A. Bs1.00 1
Vietnam – Lot A2-3, Tay Bac Cu Chi Industry Zone, Tan An Hoi Ward, Cu Chi District, Ho Chi Minh City
Unilever Vietnam International Company LimitedVND863,104,820,0
00.00 13
Vietnam- No.156, Nguyen Luong Bang Street, Tan Phu Ward, District 7, Ho Chi Minh City
Unilever Tea Distribution Vietnam SMLLCVND
1,395,000,000.00 1
Unicorn Market Place Vietnam Company Limited 13
Zambia – Stand 2375, Corner Addis Ababa Drive & Great East Road, Show Grounds, Lusaka
Unilever South East Africa Zambia Limited ZMK2.00 34
ZMK2.00 1
Zimbabwe – 2 Stirling Road, Workington, Harare
Unilever – Zimbabwe (Pvt) Limited∆ ZWD2.00 1
SUBSIDIARY UNDERTAKINGS NOT INCLUDED IN THE CONSOLIDATION
Austria – Rochusgasse 4, 5020, Salzburg
NATURAL EVOLUTION GmbH EUR100.00 1
Brazil – Av Das Nacoes Unidas, 14261 4º Andar Ala B, Vila Gertrudes, Cep 04792-000, Sao Paulo
Unileverprev Sociedade De Previdencia Privada 13
Bulgaria – Debelets city, Promishlena zona st. 5030 Veliko Tarnovo
Sladoledena Fabrika EOOD BGN50.00 1
China – Room 604-48, Building 1, No. 38 Debao Road, Waigaoqiao bonded zone, Shanghai
UPD China Limited CNY1.00 1
England and Wales – 100 Victoria Embankment, Blackfriars, London, EC4Y 0DY
Uflexreward Limited GBP0.001 35
England and Wales – Nightingale House, 46-48 East Street, Epsom, Surrey, KT17 1HQ
Brand Evangelists for Beauty Limited ∆◊ (80.30) GBP1.00 2
(100) GBP1.00 58
(100) GBP1.00 86
(66.47) GBP1.00 87
England and Wales – 1 More London Place, London, SE1 2AF
Unidis Twenty Six Limited (in liquidation) GBP1.00 1
Name of Undertaking
Nominal
Value
Share
Class
NoteLever Brothers Port Sunlight Limited (in liquidation) GBP1.00 1
England and Wales – c/o TMF Group, 8th Floor, 20 Farringdon Street, London, EC4A 4AB
Twenty Nine Capital Partners (General Partner) Limited◊ GBP1.00 1
Unilever Ventures General Partner Limited◊ GBP1.00 1
England and Wales- 1st Floor, 16 Charles II Street, London, SW1Y 4QU
Twenty-Nine Capital Partners General Partner Limited◊ GBP1.00 1
Greece – Kymis ave & 10, Seneka Street, GR-145 64 Kifissia
Lipoma Management Consulting SA EUR10.00 1
ULBCS Logistics Consulting SA EUR10.00 1
Haiti – Port-au-Prince
Unilever Haiti S.A. HTG500,000 56
India – Unilever House, B. D. Sawant Marg, Chakala, Andheri (E), Mumbai 400 099
Bhavishya Alliance Child Nutrition Initiatives (61.90) INR10.00 1
Hindustan Unilever Foundation (61.90) INR10.00 1
Israel – Park Zvaim Industrial Area, Beit Shean / Correspondance: P.O.B. 787, Beit Shean, 1171601
Dollar Shave Club Israel Limited NIS0.10 1
Jamaica – White Marl Street, Spanish Town, PO Box 809, Parish Saint Catherine
Unilever Jamaica Limited JMD1.00 1
Kenya – Commercial Street, P.O. BOX 40592-00100, Nairobi
Union East African Trust Limited KES20.00 1
Morocco – Km 10, Route Cotiere, Ain Sebaa, Casablanca
Societe Commerciale du Rif S.A.R.L. MAD50.00 1
Societe Tangeroise de Parfumerie et d’Hygiene S.A.R.L. MAD50.00 1
Myanmar – Shwe Gon Daing (West) 5th Street, No. 196, Mimosa Tower, Shwe Gon Daing (West) Ward, Bahan Township, Yangon, Myanmar 11201
Lever Brothers (Burma) Limited MMK0.5 1
Palestine – Jamil Center, Al-Beireh, Ramallah
Unilever Agencies Limited (99) (in liquidation) JOD1.00 1
Qatar – Almana & Partners WLL Building, Area No. 43, Al Mamoura, PO BOX 49
Unilever Qatar LLC QAR1,000.00 1
Scotland – c/o Brodies LLP, 15 Atholl Crescent, Edinburgh, EH3 8HA
Unilever Ventures (SLP) General Partner Limited◊ GBP1.00 1
United States – 13335 Maxella Ave. Marina del Rey, CA 90292
DSC Distribution, Inc. 7
United States – 233 Bleecker Street, New York, 10014
Grom WTC LLC 13
Grom Century City LLC 13
United States – c/o The Corporation Trust Company, Coporation Trust Center, 1209 Orange Street, Wilmington, Delaware, 19801. New Castle County
Cocotier, Inc USD0.001 7
ASSOCIATED UNDERTAKINGS
Australia – 47 Dover Street, Cremorne, VIC, 3121, Australia
SNDR PTY LTD∆◊ No Par Value 58
Bahrain – 161, Road 328, Block 358, Zinj, Manama
Unilever Bahrain Co. W.L.L. (49) BHD50.00 1
Brazil – Avenue Engenheiro Luiz Carlos Berrini, 105, 16º andar, Ed. Berrini One, Itaim Bibi, CEP 0471/001-00, City of São Paulo, State of São Paulo
Gallo Brasil Distribuição e comércio Limitada (55) BRL1.00 5
Canada – Suite 300-171 West Esplanade, North Vancouver, British Columbia Canada V7M 3K9
A&W Root Beer Beverages Canada Inc ◊ (40) No Par Value 38
Cyprus – 2 Marcou Dracou str., Engomi Industrial Estate, 2409 Nicosia
Unilever PMT Limited∆ (49) EUR1.71 3
England and Wales – 85 Great Portland Street, London, W1W 7LT
Name of Undertaking
Nominal
Value
Share
Class
Note
184 Unilever Annual Report and Accounts 2021
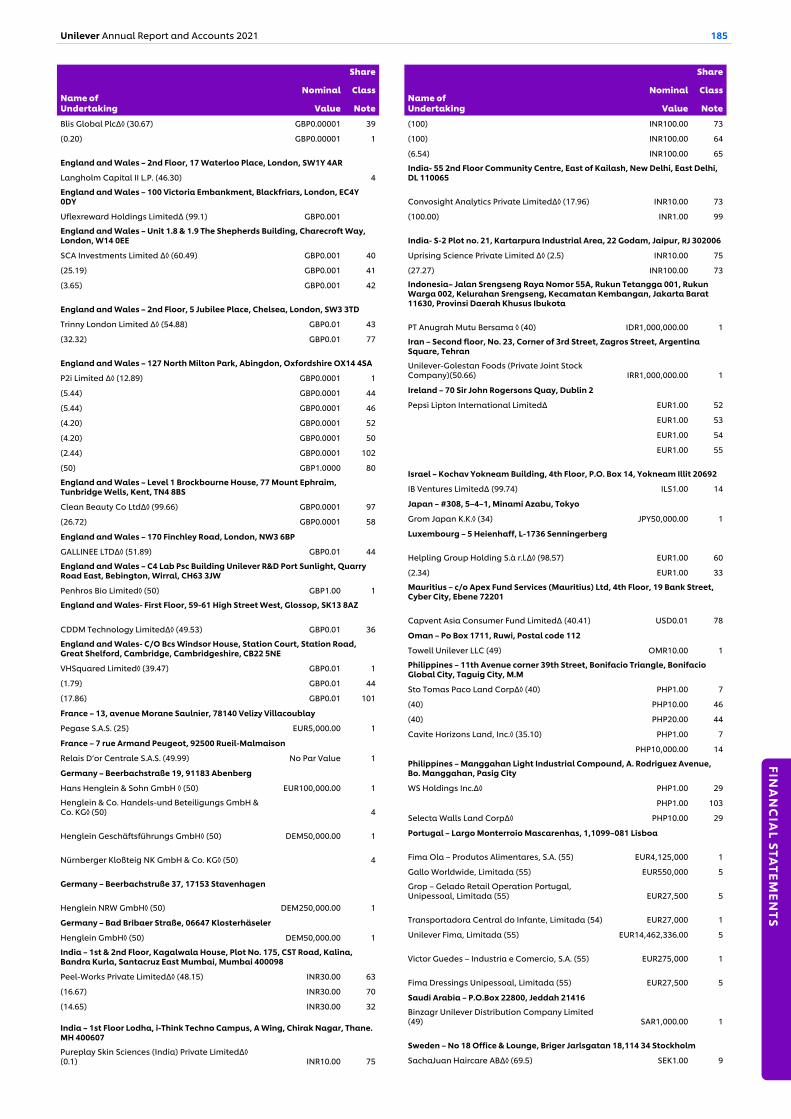
Blis Global Plc∆◊ (30.67) GBP0.00001 39
(0.20) GBP0.00001 1
England and Wales – 2nd Floor, 17 Waterloo Place, London, SW1Y 4AR
Langholm Capital II L.P. (46.30) 4
England and Wales – 100 Victoria Embankment, Blackfriars, London, EC4Y 0DY
Uflexreward Holdings LimitedΔ (99.1) GBP0.001
England and Wales – Unit 1.8 & 1.9 The Shepherds Building, Charecroft Way, London, W14 0EE
SCA Investments Limited ∆◊ (60.49) GBP0.001 40
(25.19) GBP0.001 41
(3.65) GBP0.001 42
England and Wales – 2nd Floor, 5 Jubilee Place, Chelsea, London, SW3 3TD
Trinny London Limited ∆◊ (54.88) GBP0.01 43
(32.32) GBP0.01 77
England and Wales – 127 North Milton Park, Abingdon, Oxfordshire OX14 4SA
P2i Limited ∆◊ (12.89) GBP0.0001 1
(5.44) GBP0.0001 44
(5.44) GBP0.0001 46
(4.20) GBP0.0001 52
(4.20) GBP0.0001 50
(2.44) GBP0.0001 102
(50) GBP1.0000 80
England and Wales – Level 1 Brockbourne House, 77 Mount Ephraim, Tunbridge Wells, Kent, TN4 8BS
Clean Beauty Co Ltd∆◊ (99.66) GBP0.0001 97
(26.72) GBP0.0001 58
England and Wales – 170 Finchley Road, London, NW3 6BP
GALLINEE LTD∆◊ (51.89) GBP0.01 44
England and Wales – C4 Lab Psc Building Unilever R&D Port Sunlight, Quarry Road East, Bebington, Wirral, CH63 3JW
Penhros Bio Limited◊ (50) GBP1.00 1
England and Wales- First Floor, 59-61 High Street West, Glossop, SK13 8AZ
CDDM Technology Limited∆◊ (49.53) GBP0.01 36
England and Wales- C/O Bcs Windsor House, Station Court, Station Road, Great Shelford, Cambridge, Cambridgeshire, CB22 5NE
VHSquared Limited◊ (39.47) GBP0.01 1
(1.79) GBP0.01 44
(17.86) GBP0.01 101
France – 13, avenue Morane Saulnier, 78140 Velizy Villacoublay
Pegase S.A.S. (25) EUR5,000.00 1
France – 7 rue Armand Peugeot, 92500 Rueil-Malmaison
Relais D’or Centrale S.A.S. (49.99) No Par Value 1
Germany – Beerbachstraße 19, 91183 Abenberg
Hans Henglein & Sohn GmbH ◊ (50) EUR100,000.00 1
Henglein & Co. Handels-und Beteiligungs GmbH & Co. KG◊ (50) 4
Henglein Geschäftsführungs GmbH◊ (50) DEM50,000.00 1
Nürnberger Kloßteig NK GmbH & Co. KG◊ (50) 4
Germany – Beerbachstruße 37, 17153 Stavenhagen
Henglein NRW GmbH◊ (50) DEM250,000.00 1
Germany – Bad Bribaer Straße, 06647 Klosterhäseler
Henglein GmbH◊ (50) DEM50,000.00 1
India – 1st & 2nd Floor, Kagalwala House, Plot No. 175, CST Road, Kalina, Bandra Kurla, Santacruz East Mumbai, Mumbai 400098
Peel-Works Private Limited∆◊ (48.15) INR30.00 63
(16.67) INR30.00 70
(14.65) INR30.00 32
India – 1st Floor Lodha, i-Think Techno Campus, A Wing, Chirak Nagar, Thane. MH 400607
Pureplay Skin Sciences (India) Private Limited∆◊ (0.1) INR10.00 75
Name of Undertaking
Nominal
Value
Share
Class
Note
(100) INR100.00 73
(100) INR100.00 64
(6.54) INR100.00 65
India- 55 2nd Floor Community Centre, East of Kailash, New Delhi, East Delhi, DL 110065
Convosight Analytics Private Limited∆◊ (17.96) INR10.00 73
(100.00) INR1.00 99
India- S-2 Plot no. 21, Kartarpura Industrial Area, 22 Godam, Jaipur, RJ 302006
Uprising Science Private Limited ∆◊ (2.5) INR10.00 75
(27.27) INR100.00 73
Indonesia– Jalan Srengseng Raya Nomor 55A, Rukun Tetangga 001, Rukun Warga 002, Kelurahan Srengseng, Kecamatan Kembangan, Jakarta Barat 11630, Provinsi Daerah Khusus Ibukota
PT Anugrah Mutu Bersama ◊ (40) IDR1,000,000.00 1
Iran – Second floor, No. 23, Corner of 3rd Street, Zagros Street, Argentina Square, Tehran
Unilever-Golestan Foods (Private Joint Stock Company)(50.66) IRR1,000,000.00 1
Ireland – 70 Sir John Rogersons Quay, Dublin 2
Pepsi Lipton International Limited∆ EUR1.00 52
EUR1.00 53
EUR1.00 54
EUR1.00 55
Israel – Kochav Yokneam Building, 4th Floor, P.O. Box 14, Yokneam Illit 20692
IB Ventures Limited∆ (99.74) ILS1.00 14
Japan – #308, 5–4–1, Minami Azabu, Tokyo
Grom Japan K.K.◊ (34) JPY50,000.00 1
Luxembourg – 5 Heienhaff, L-1736 Senningerberg
Helpling Group Holding S.à r.l.∆◊ (98.57) EUR1.00 60
(2.34) EUR1.00 33
Mauritius – c/o Apex Fund Services (Mauritius) Ltd, 4th Floor, 19 Bank Street, Cyber City, Ebene 72201
Capvent Asia Consumer Fund Limited∆ (40.41) USD0.01 78
Oman – Po Box 1711, Ruwi, Postal code 112
Towell Unilever LLC (49) OMR10.00 1
Philippines – 11th Avenue corner 39th Street, Bonifacio Triangle, Bonifacio Global City, Taguig City, M.M
Sto Tomas Paco Land Corp∆◊ (40) PHP1.00 7
(40) PHP10.00 46
(40) PHP20.00 44
Cavite Horizons Land, Inc.◊ (35.10) PHP1.00 7
PHP10,000.00 14
Philippines – Manggahan Light Industrial Compound, A. Rodriguez Avenue, Bo. Manggahan, Pasig City
WS Holdings Inc.∆◊ PHP1.00 29
PHP1.00 103
Selecta Walls Land Corp∆◊ PHP10.00 29
Portugal – Largo Monterroio Mascarenhas, 1,1099–081 Lisboa
Fima Ola – Produtos Alimentares, S.A. (55) EUR4,125,000 1
Gallo Worldwide, Limitada (55) EUR550,000 5
Grop – Gelado Retail Operation Portugal, Unipessoal, Limitada (55) EUR27,500 5
Transportadora Central do Infante, Limitada (54) EUR27,000 1
Unilever Fima, Limitada (55) EUR14,462,336.00 5
Victor Guedes – Industria e Comercio, S.A. (55) EUR275,000 1
Fima Dressings Unipessoal, Limitada (55) EUR27,500 5
Saudi Arabia – P.O.Box 22800, Jeddah 21416
Binzagr Unilever Distribution Company Limited (49) SAR1,000.00 1
Sweden – No 18 Office & Lounge, Briger Jarlsgatan 18,114 34 Stockholm
SachaJuan Haircare AB∆◊ (69.5) SEK1.00 9
Name of Undertaking
Nominal
Value
Share
Class
Note
Unilever Annual Report and Accounts 2021 185
FINA
NC
IAL STA
TEMEN
TS
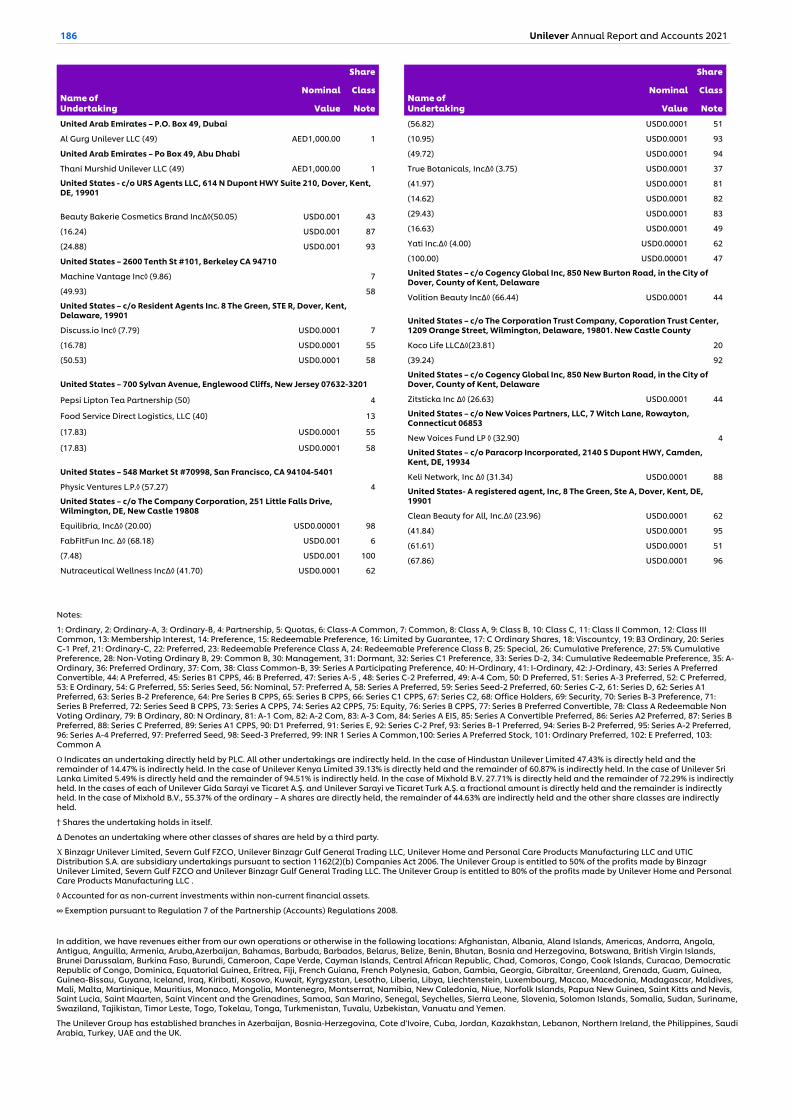
United Arab Emirates – P.O. Box 49, Dubai
Al Gurg Unilever LLC (49) AED1,000.00 1
United Arab Emirates – Po Box 49, Abu Dhabi
Thani Murshid Unilever LLC (49) AED1,000.00 1
United States - c/o URS Agents LLC, 614 N Dupont HWY Suite 210, Dover, Kent, DE, 19901
Beauty Bakerie Cosmetics Brand Inc∆◊(50.05) USD0.001 43
(16.24) USD0.001 87
(24.88) USD0.001 93
United States – 2600 Tenth St #101, Berkeley CA 94710
Machine Vantage Inc◊ (9.86) 7
(49.93) 58
United States – c/o Resident Agents Inc. 8 The Green, STE R, Dover, Kent, Delaware, 19901
Discuss.io Inc◊ (7.79) USD0.0001 7
(16.78) USD0.0001 55
(50.53) USD0.0001 58
United States – 700 Sylvan Avenue, Englewood Cliffs, New Jersey 07632-3201
Pepsi Lipton Tea Partnership (50) 4
Food Service Direct Logistics, LLC (40) 13
(17.83) USD0.0001 55
(17.83) USD0.0001 58
United States – 548 Market St #70998, San Francisco, CA 94104-5401
Physic Ventures L.P.◊ (57.27) 4
United States – c/o The Company Corporation, 251 Little Falls Drive, Wilmington, DE, New Castle 19808
Equilibria, Inc∆◊ (20.00) USD0.00001 98
FabFitFun Inc. ∆◊ (68.18) USD0.001 6
(7.48) USD0.001 100
Nutraceutical Wellness Inc∆◊ (41.70) USD0.0001 62
Name of Undertaking
Nominal
Value
Share
Class
Note
(56.82) USD0.0001 51
(10.95) USD0.0001 93
(49.72) USD0.0001 94
True Botanicals, Inc∆◊ (3.75) USD0.0001 37
(41.97) USD0.0001 81
(14.62) USD0.0001 82
(29.43) USD0.0001 83
(16.63) USD0.0001 49
Yati Inc.∆◊ (4.00) USD0.00001 62
(100.00) USD0.00001 47
United States – c/o Cogency Global Inc, 850 New Burton Road, in the City of Dover, County of Kent, Delaware
Volition Beauty Inc∆◊ (66.44) USD0.0001 44
United States – c/o The Corporation Trust Company, Coporation Trust Center, 1209 Orange Street, Wilmington, Delaware, 19801. New Castle County
Koco Life LLC∆◊(23.81) 20
(39.24) 92
United States – c/o Cogency Global Inc, 850 New Burton Road, in the City of Dover, County of Kent, Delaware
Zitsticka Inc ∆◊ (26.63) USD0.0001 44
United States – c/o New Voices Partners, LLC, 7 Witch Lane, Rowayton, Connecticut 06853
New Voices Fund LP ◊ (32.90) 4
United States – c/o Paracorp Incorporated, 2140 S Dupont HWY, Camden, Kent, DE, 19934
Keli Network, Inc ∆◊ (31.34) USD0.0001 88
United States- A registered agent, Inc, 8 The Green, Ste A, Dover, Kent, DE, 19901
Clean Beauty for All, Inc.∆◊ (23.96) USD0.0001 62
(41.84) USD0.0001 95
(61.61) USD0.0001 51
(67.86) USD0.0001 96
Name of Undertaking
Nominal
Value
Share
Class
Note
Notes:
1: Ordinary, 2: Ordinary-A, 3: Ordinary-B, 4: Partnership, 5: Quotas, 6: Class-A Common, 7: Common, 8: Class A, 9: Class B, 10: Class C, 11: Class II Common, 12: Class III Common, 13: Membership Interest, 14: Preference, 15: Redeemable Preference, 16: Limited by Guarantee, 17: C Ordinary Shares, 18: Viscountcy, 19: B3 Ordinary, 20: Series C-1 Pref, 21: Ordinary-C, 22: Preferred, 23: Redeemable Preference Class A, 24: Redeemable Preference Class B, 25: Special, 26: Cumulative Preference, 27: 5% Cumulative Preference, 28: Non-Voting Ordinary B, 29: Common B, 30: Management, 31: Dormant, 32: Series C1 Preference, 33: Series D-2, 34: Cumulative Redeemable Preference, 35: A-Ordinary, 36: Preferred Ordinary, 37: Com, 38: Class Common-B, 39: Series A Participating Preference, 40: H-Ordinary, 41: I-Ordinary, 42: J-Ordinary, 43: Series A Preferred Convertible, 44: A Preferred, 45: Series B1 CPPS, 46: B Preferred, 47: Series A-5 , 48: Series C-2 Preferred, 49: A-4 Com, 50: D Preferred, 51: Series A-3 Preferred, 52: C Preferred, 53: E Ordinary, 54: G Preferred, 55: Series Seed, 56: Nominal, 57: Preferred A, 58: Series A Preferred, 59: Series Seed-2 Preferred, 60: Series C-2, 61: Series D, 62: Series A1 Preferred, 63: Series B-2 Preference, 64: Pre Series B CPPS, 65: Series B CPPS, 66: Series C1 CPPS, 67: Series C2, 68: Office Holders, 69: Security, 70: Series B-3 Preference, 71: Series B Preferred, 72: Series Seed B CPPS, 73: Series A CPPS, 74: Series A2 CPPS, 75: Equity, 76: Series B CPPS, 77: Series B Preferred Convertible, 78: Class A Redeemable Non Voting Ordinary, 79: B Ordinary, 80: N Ordinary, 81: A-1 Com, 82: A-2 Com, 83: A-3 Com, 84: Series A EIS, 85: Series A Convertible Preferred, 86: Series A2 Preferred, 87: Series B Preferred, 88: Series C Preferred, 89: Series A1 CPPS, 90: D1 Preferred, 91: Series E, 92: Series C-2 Pref, 93: Series B-1 Preferred, 94: Series B-2 Preferred, 95: Series A-2 Preferred, 96: Series A-4 Preferred, 97: Preferred Seed, 98: Seed-3 Preferred, 99: INR 1 Series A Common,100: Series A Preferred Stock, 101: Ordinary Preferred, 102: E Preferred, 103: Common A
Indicates an undertaking directly held by PLC. All other undertakings are indirectly held. In the case of Hindustan Unilever Limited 47.43% is directly held and the �𐩲�remainder of 14.47% is indirectly held. In the case of Unilever Kenya Limited 39.13% is directly held and the remainder of 60.87% is indirectly held. In the case of Unilever Sri Lanka Limited 5.49% is directly held and the remainder of 94.51% is indirectly held. In the case of Mixhold B.V. 27.71% is directly held and the remainder of 72.29% is indirectly held. In the cases of each of Unilever Gida Sarayi ve Ticaret A.Ş. and Unilever Sarayi ve Ticaret Turk A.Ş. a fractional amount is directly held and the remainder is indirectly held. In the case of Mixhold B.V., 55.37% of the ordinary – A shares are directly held, the remainder of 44.63% are indirectly held and the other share classes are indirectly held.
† Shares the undertaking holds in itself.
Δ Denotes an undertaking where other classes of shares are held by a third party.
Binzagr Unilever Limited, Severn Gulf FZCO, Unilever Binzagr Gulf General Trading LLC, Unilever Home and Personal Care Products Manufacturing LLC and UTIC �𐰓�Distribution S.A. are subsidiary undertakings pursuant to section 1162(2)(b) Companies Act 2006. The Unilever Group is entitled to 50% of the profits made by Binzagr Unilever Limited, Severn Gulf FZCO and Unilever Binzagr Gulf General Trading LLC. The Unilever Group is entitled to 80% of the profits made by Unilever Home and Personal Care Products Manufacturing LLC .
◊ Accounted for as non-current investments within non-current financial assets.
∞ Exemption pursuant to Regulation 7 of the Partnership (Accounts) Regulations 2008.
In addition, we have revenues either from our own operations or otherwise in the following locations: Afghanistan, Albania, Aland Islands, Americas, Andorra, Angola, Antigua, Anguilla, Armenia, Aruba,Azerbaijan, Bahamas, Barbuda, Barbados, Belarus, Belize, Benin, Bhutan, Bosnia and Herzegovina, Botswana, British Virgin Islands, Brunei Darussalam, Burkina Faso, Burundi, Cameroon, Cape Verde, Cayman Islands, Central African Republic, Chad, Comoros, Congo, Cook Islands, Curacao, Democratic Republic of Congo, Dominica, Equatorial Guinea, Eritrea, Fiji, French Guiana, French Polynesia, Gabon, Gambia, Georgia, Gibraltar, Greenland, Grenada, Guam, Guinea, Guinea-Bissau, Guyana, Iceland, Iraq, Kiribati, Kosovo, Kuwait, Kyrgyzstan, Lesotho, Liberia, Libya, Liechtenstein, Luxembourg, Macao, Macedonia, Madagascar, Maldives, Mali, Malta, Martinique, Mauritius, Monaco, Mongolia, Montenegro, Montserrat, Namibia, New Caledonia, Niue, Norfolk Islands, Papua New Guinea, Saint Kitts and Nevis, Saint Lucia, Saint Maarten, Saint Vincent and the Grenadines, Samoa, San Marino, Senegal, Seychelles, Sierra Leone, Slovenia, Solomon Islands, Somalia, Sudan, Suriname, Swaziland, Tajikistan, Timor Leste, Togo, Tokelau, Tonga, Turkmenistan, Tuvalu, Uzbekistan, Vanuatu and Yemen.
The Unilever Group has established branches in Azerbaijan, Bosnia-Herzegovina, Cote d’Ivoire, Cuba, Jordan, Kazakhstan, Lebanon, Northern Ireland, the Philippines, Saudi Arabia, Turkey, UAE and the UK.
186 Unilever Annual Report and Accounts 2021
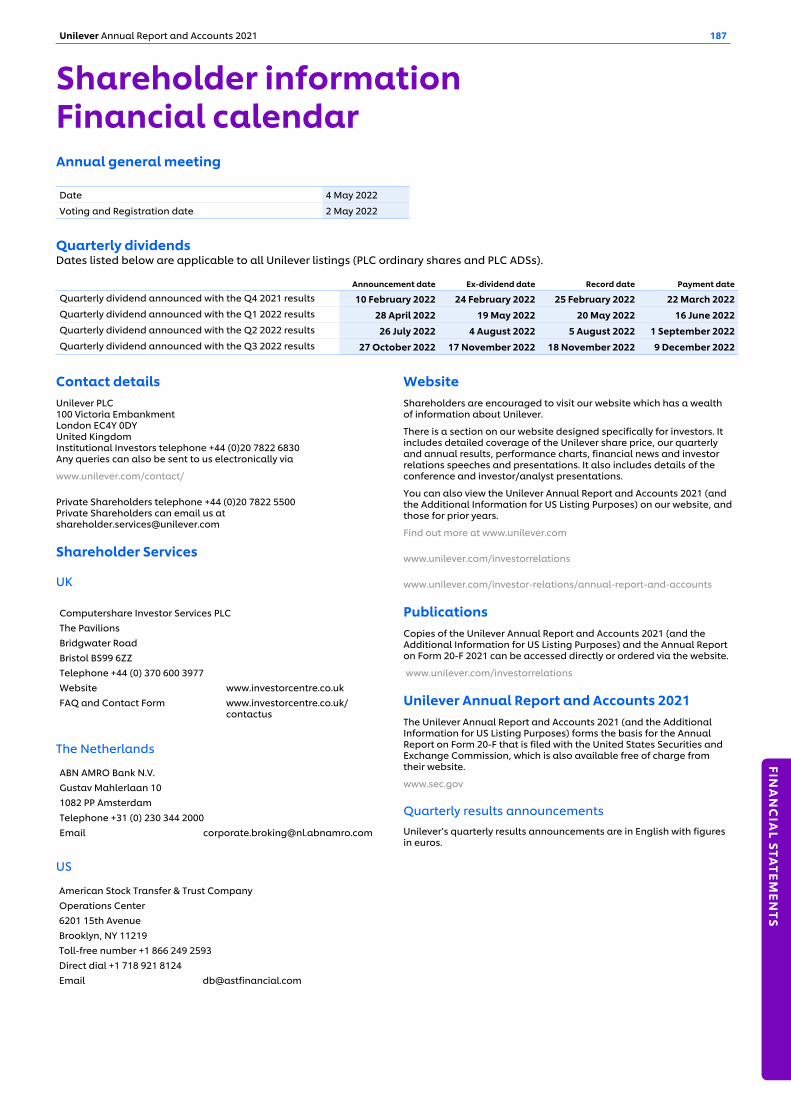
Shareholder information Financial calendar
Annual general meeting
Date 4 May 2022
Voting and Registration date 2 May 2022
Quarterly dividendsDates listed below are applicable to all Unilever listings (PLC ordinary shares and PLC ADSs).
Announcement date Ex-dividend date Record date Payment date
Quarterly dividend announced with the Q4 2021 results 10 February 2022 24 February 2022 25 February 2022 22 March 2022Quarterly dividend announced with the Q1 2022 results 28 April 2022 19 May 2022 20 May 2022 16 June 2022Quarterly dividend announced with the Q2 2022 results 26 July 2022 4 August 2022 5 August 2022 1 September 2022Quarterly dividend announced with the Q3 2022 results 27 October 2022 17 November 2022 18 November 2022 9 December 2022
Contact details Unilever PLC 100 Victoria Embankment London EC4Y 0DY United Kingdom Institutional Investors telephone +44 (0)20 7822 6830 Any queries can also be sent to us electronically via
www.unilever.com/contact/
Private Shareholders telephone +44 (0)20 7822 5500 Private Shareholders can email us at [email protected]
Shareholder Services
UK
Computershare Investor Services PLCThe PavilionsBridgwater RoadBristol BS99 6ZZTelephone +44 (0) 370 600 3977Website www.investorcentre.co.ukFAQ and Contact Form www.investorcentre.co.uk/
contactus
The Netherlands
ABN AMRO Bank N.V.Gustav Mahlerlaan 101082 PP AmsterdamTelephone +31 (0) 230 344 2000Email [email protected]
US
American Stock Transfer & Trust CompanyOperations Center6201 15th AvenueBrooklyn, NY 11219Toll-free number +1 866 249 2593Direct dial +1 718 921 8124 Email [email protected]
Website Shareholders are encouraged to visit our website which has a wealth of information about Unilever.
There is a section on our website designed specifically for investors. It includes detailed coverage of the Unilever share price, our quarterly and annual results, performance charts, financial news and investor relations speeches and presentations. It also includes details of the conference and investor/analyst presentations.
You can also view the Unilever Annual Report and Accounts 2021 (and the Additional Information for US Listing Purposes) on our website, and those for prior years.
Find out more at www.unilever.com
www.unilever.com/investorrelations
www.unilever.com/investor-relations/annual-report-and-accounts
Publications Copies of the Unilever Annual Report and Accounts 2021 (and the Additional Information for US Listing Purposes) and the Annual Report on Form 20-F 2021 can be accessed directly or ordered via the website.
www.unilever.com/investorrelations
Unilever Annual Report and Accounts 2021 The Unilever Annual Report and Accounts 2021 (and the Additional Information for US Listing Purposes) forms the basis for the Annual Report on Form 20-F that is filed with the United States Securities and Exchange Commission, which is also available free of charge from their website.
www.sec.gov
Quarterly results announcements Unilever’s quarterly results announcements are in English with figures in euros.
Unilever Annual Report and Accounts 2021 187
FINA
NC
IAL STA
TEMEN
TS
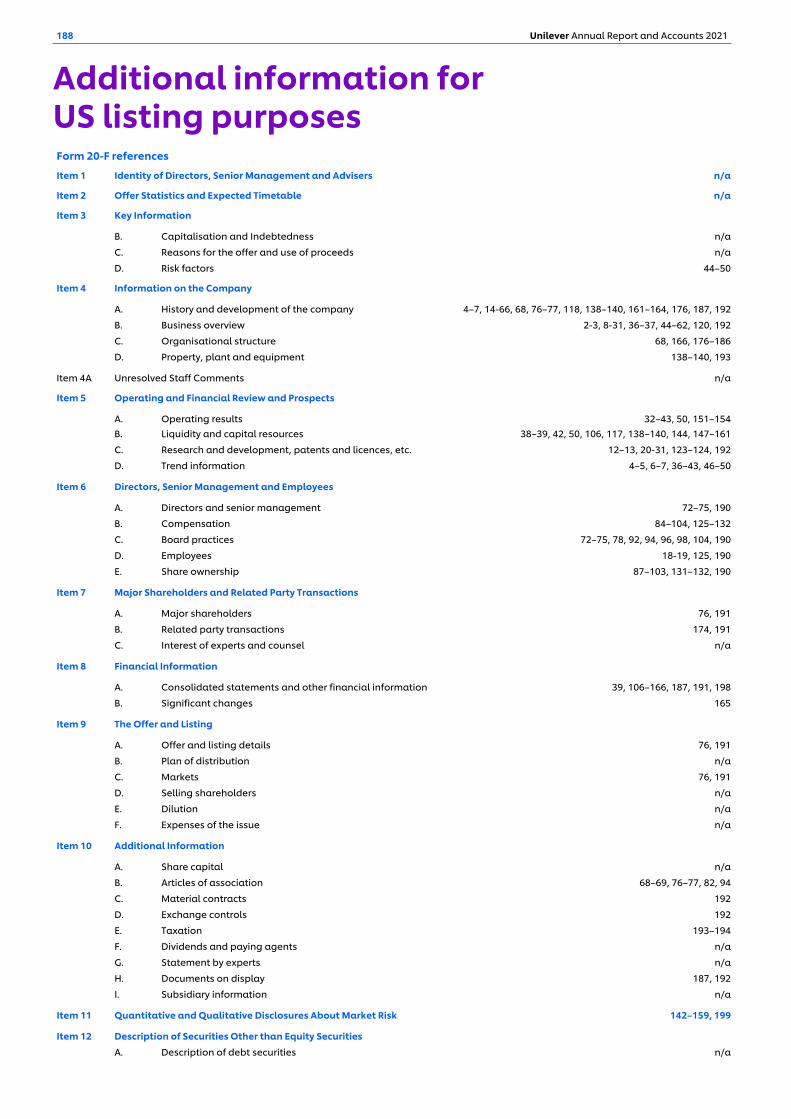
Additional information for US listing purposesForm 20-F references
Item 1 Identity of Directors, Senior Management and Advisers n/a
Item 2 Offer Statistics and Expected Timetable n/a
Item 3 Key Information
B. Capitalisation and Indebtedness n/a
C. Reasons for the offer and use of proceeds n/a
D. Risk factors 44–50
Item 4 Information on the Company
A. History and development of the company 4–7, 14-66, 68, 76–77, 118, 138–140, 161–164, 176, 187, 192
B. Business overview 2-3, 8-31, 36–37, 44–62, 120, 192
C. Organisational structure 68, 166, 176–186
D. Property, plant and equipment 138–140, 193
Item 4A Unresolved Staff Comments n/a
Item 5 Operating and Financial Review and Prospects
A. Operating results 32–43, 50, 151–154B. Liquidity and capital resources 38–39, 42, 50, 106, 117, 138–140, 144, 147–161
C. Research and development, patents and licences, etc. 12–13, 20-31, 123–124, 192
D. Trend information 4–5, 6–7, 36–43, 46–50
Item 6 Directors, Senior Management and Employees
A. Directors and senior management 72–75, 190
B. Compensation 84–104, 125–132
C. Board practices 72–75, 78, 92, 94, 96, 98, 104, 190
D. Employees 18-19, 125, 190
E. Share ownership 87–103, 131–132, 190
Item 7 Major Shareholders and Related Party Transactions
A. Major shareholders 76, 191
B. Related party transactions 174, 191
C. Interest of experts and counsel n/a
Item 8 Financial Information
A. Consolidated statements and other financial information 39, 106–166, 187, 191, 198
B. Significant changes 165
Item 9 The Offer and Listing
A. Offer and listing details 76, 191
B. Plan of distribution n/a
C. Markets 76, 191
D. Selling shareholders n/a
E. Dilution n/a
F. Expenses of the issue n/a
Item 10 Additional Information
A. Share capital n/a
B. Articles of association 68–69, 76–77, 82, 94
C. Material contracts 192
D. Exchange controls 192
E. Taxation 193–194
F. Dividends and paying agents n/a
G. Statement by experts n/a
H. Documents on display 187, 192
I. Subsidiary information n/a
Item 11 Quantitative and Qualitative Disclosures About Market Risk 142–159, 199
Item 12 Description of Securities Other than Equity Securities
A. Description of debt securities n/a
188 Unilever Annual Report and Accounts 2021
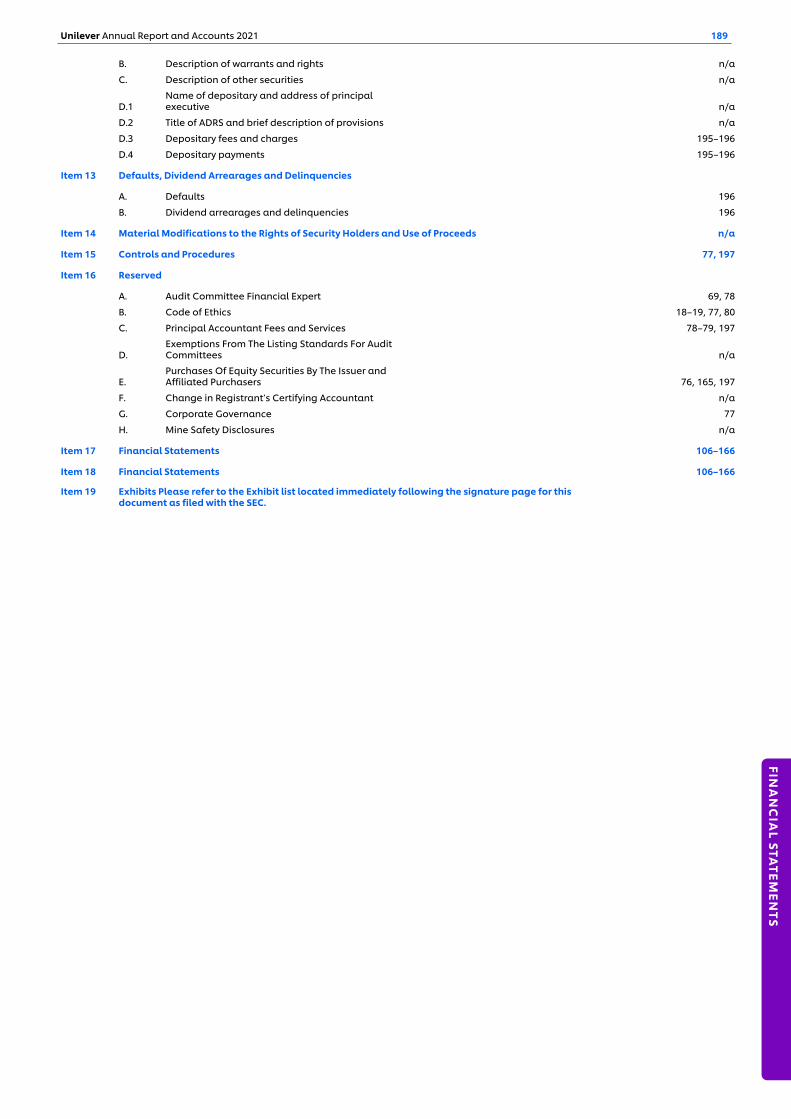
B. Description of warrants and rights n/a
C. Description of other securities n/a
D.1Name of depositary and address of principal executive n/a
D.2 Title of ADRS and brief description of provisions n/a
D.3 Depositary fees and charges 195–196
D.4 Depositary payments 195–196
Item 13 Defaults, Dividend Arrearages and Delinquencies
A. Defaults 196
B. Dividend arrearages and delinquencies 196
Item 14 Material Modifications to the Rights of Security Holders and Use of Proceeds n/a
Item 15 Controls and Procedures 77, 197
Item 16 Reserved
A. Audit Committee Financial Expert 69, 78
B. Code of Ethics 18–19, 77, 80
C. Principal Accountant Fees and Services 78–79, 197
D.Exemptions From The Listing Standards For Audit Committees n/a
E.Purchases Of Equity Securities By The Issuer and Affiliated Purchasers 76, 165, 197
F. Change in Registrant’s Certifying Accountant n/a
G. Corporate Governance 77
H. Mine Safety Disclosures n/a
Item 17 Financial Statements 106–166
Item 18 Financial Statements 106–166
Item 19 Exhibits Please refer to the Exhibit list located immediately following the signature page for this document as filed with the SEC.
Unilever Annual Report and Accounts 2021 189
FINA
NC
IAL STA
TEMEN
TS
Directors, senior management and employees
Employees The average number of employees for the last three years is provided in note 4A on page 125. The average number of employees during 2021 included 7,837 seasonal workers. We believe our relationship with our employees and any labour unions of which they may be part is satisfactory in all material respects.
Global employee share plans (shares) In November 2014, Unilever’s global employee plan ‘SHARES’ was launched in 17 countries. SHARES gives eligible Unilever employees below management level the opportunity to invest between €10 and €200 per month from their net salary in Unilever shares. For every three shares our employees buy (Investment Shares), Unilever will give them one free Matching Share, which will vest if employees hold their Investment Shares for at least three years. The Matching Shares are not subject to any performance conditions. In 2015, SHARES was rolled out globally and is now offered in more than 100 countries. Executive Directors are not eligible to participate in SHARES. As of 24 February 2022 (the latest practicable date for inclusion in this report), awards for 385,489 PLC shares were outstanding under SHARES.
North American share plans Unilever also maintains share plans for its North American employees that are governed by an umbrella plan referred to as the Unilever North America Omnibus Equity Compensation Plan, which was amended and restated as of 2 February 2021 to make appropriate changes in light of Unification. These plans are the North American equivalents of the Unilever Share Plan 2017 and SHARES plans, as amended from time to time. The rules governing these share plans are materially the same as the rules governing the Unilever Share Plan 2017 and SHARES plans, respectively. However, the plans contain non-competition and non-solicitation covenants and they are subject to US and Canadian employment and tax laws. The plans are administered by the North America Compensation Committee of Unilever United States, Inc. and they are governed by New York law.
The foregoing description of the Unilever North America Omnibus Equity Compensation Plan does not purport to be complete and is qualified in its entirety by reference to the Unilever North America Omnibus Equity Compensation Plan, including all amendments thereto, filed as Exhibit 99.1 to the Form S-8 (File No. 333-185299) filed with the SEC on 6 December 2012, which is incorporated herein by reference.
Compensation Committee The Committee is concerned with the remuneration of the Executive and Non-Executive Directors and the tier of management directly below the Board. The Committee also has responsibility for the cash and executive and all-employee share-based incentive plans, the Remuneration Policy and performance evaluation of the Unilever Leadership Executive and the periodic review of the remuneration and related policies of the wider workforce to assess alignment to PLC’s purpose, value and strategy.
Directors and senior management
Family relationship There are no family relationships between any of our Executive Directors, members of the ULE or Non-Executive Directors.
Other arrangements None of our Non-Executive Directors, Executive Directors or other key management personnel are elected or appointed under any arrangement or understanding with any major shareholder, customer, supplier or others.
190 Unilever Annual Report and Accounts 2021
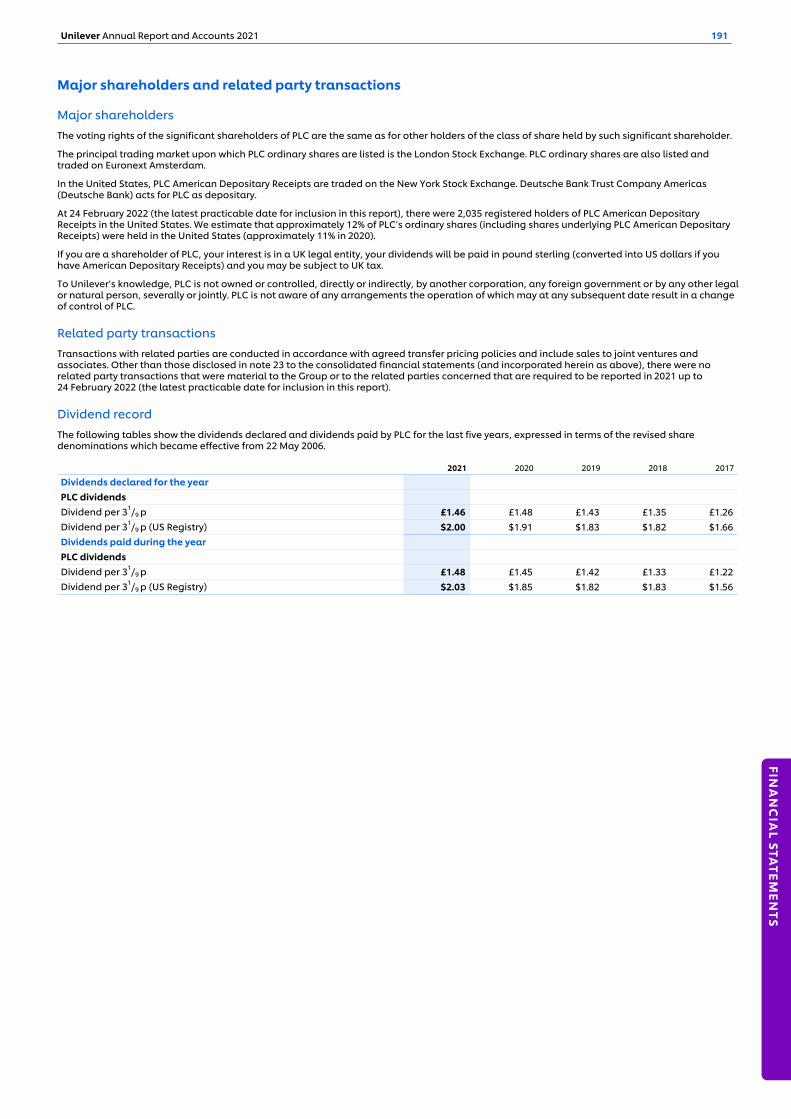
Major shareholders and related party transactions
Major shareholders The voting rights of the significant shareholders of PLC are the same as for other holders of the class of share held by such significant shareholder.
The principal trading market upon which PLC ordinary shares are listed is the London Stock Exchange. PLC ordinary shares are also listed and traded on Euronext Amsterdam.
In the United States, PLC American Depositary Receipts are traded on the New York Stock Exchange. Deutsche Bank Trust Company Americas (Deutsche Bank) acts for PLC as depositary.
At 24 February 2022 (the latest practicable date for inclusion in this report), there were 2,035 registered holders of PLC American Depositary Receipts in the United States. We estimate that approximately 12% of PLC’s ordinary shares (including shares underlying PLC American Depositary Receipts) were held in the United States (approximately 11% in 2020).
If you are a shareholder of PLC, your interest is in a UK legal entity, your dividends will be paid in pound sterling (converted into US dollars if you have American Depositary Receipts) and you may be subject to UK tax.
To Unilever’s knowledge, PLC is not owned or controlled, directly or indirectly, by another corporation, any foreign government or by any other legal or natural person, severally or jointly. PLC is not aware of any arrangements the operation of which may at any subsequent date result in a change of control of PLC.
Related party transactions Transactions with related parties are conducted in accordance with agreed transfer pricing policies and include sales to joint ventures and associates. Other than those disclosed in note 23 to the consolidated financial statements (and incorporated herein as above), there were no related party transactions that were material to the Group or to the related parties concerned that are required to be reported in 2021 up to 24 February 2022 (the latest practicable date for inclusion in this report).
Dividend record The following tables show the dividends declared and dividends paid by PLC for the last five years, expressed in terms of the revised share denominations which became effective from 22 May 2006.
2021 2020 2019 2018 2017
Dividends declared for the yearPLC dividendsDividend per 31/9 p £1.46 £1.48 £1.43 £1.35 £1.26 Dividend per 31/9 p (US Registry) $2.00 $1.91 $1.83 $1.82 $1.66 Dividends paid during the yearPLC dividendsDividend per 31/9 p £1.48 £1.45 £1.42 £1.33 £1.22 Dividend per 31/9 p (US Registry) $2.03 $1.85 $1.82 $1.83 $1.56
Unilever Annual Report and Accounts 2021 191
FINA
NC
IAL STA
TEMEN
TS
Material contracts At the date of this Annual Report and Accounts, Unilever is not party to any contracts that are considered material to its results or operations.
Exchange controls Other than certain economic sanctions which may be in place from time to time, there are currently no UK laws, decrees or regulations restricting the import or export of capital or affecting the remittance of dividends or other payments to holders of the PLC’s shares who are non-residents of the UK. Similarly, other than certain economic sanctions which may be in force from time to time, there are no limitations relating only to non-residents of the UK under English law or the PLC’s Articles of Association on the right to be a holder of, and to vote in respect of, the company’s shares.
Unilever Annual Report on Form 20-F 2021 Filed with the SEC on the SEC’s website. Printed copies are available, free of charge, upon request to Unilever PLC, Investor Relations department, 100 Victoria Embankment, London, EC4Y 0DY United Kingdom.
Documents on display in the United States Unilever files and furnishes reports and information with the United States SEC. Certain of our reports and other information that we file or furnish to the SEC are also available to the public over the internet on the SEC’s website.
Other information on the Company
Innovation, Research and Development We have over 20,000 patents protecting the ideas, discoveries and breakthroughs that our global team of 5,000 world-leading experts produce. We invest around €1 billion in R&D each year.
Technology sits at the heart of our approach to innovation. We are building automated technology into our innovation centres. Our UK Materials Innovation Factory has the highest concentration of robots doing material chemistry work in the world. It delivers data ten times faster than traditional methods. We run virtual tests and scenarios to optimise products before the lab stage, thereby innovating sooner and cutting time to market - in one year we can perform 12,000 rapid product tests. Shanghai, China is home to our AI Hub where we use insights from real time data to prototype innovations and test them via eCommerce in just a matter of days. Fast, efficient, effective innovating.
Research and development is powering our move away from petro-chemicals, stopping plastic pollution, in collaboration with our partners. Our goal is to make a Clean Future. One of the ways we will do this is by replacing 100% of the carbon derived from fossil fuels in our Home Care products with renewable or recycled carbon.
Innovation in biology unlocks significant benefits and will be a driver in achieving our climate and nature goals. We are a world leader in the microbiome space and have more than 100 patents in this area alone. We are exploring its influence on all aspects of health and wellbeing. We are also deepening our understanding of the skin and innovating accordingly. One example of this is a new pro-lipids technology that helps the skin to repair its barrier from the inside out.
Every Unilever product is based on an innovation crafted by our experts in collaboration with our network of partners. We translate our scientific discoveries into everyday products that care for the planet and improve people’s health, confidence and wellbeing. Some of our focus areas are hygiene, skin care, prestige beauty, plant-based foods and functional nutrition, such as vitamins, minerals and supplements, and we're constantly evolving alongside our consumers’ ever-changing lives and tastes.
Raw materials Our products use a wide variety of raw and packaging materials which we source locally and internationally, and which may be subject to price volatility either directly or as a result of movements in foreign exchange rates.
In 2021, we witnessed broad-based inflation across commodities as global demand recovering from the pandemic and exacerbated by persistent production and logistical disruptions particularly during the second and third wave of the pandemic. Weakening currencies in many emerging markets, such as Turkey, Argentina, and Brazil, meant further challenges.
Looking ahead to 2022, we expect continued volatility in commodity markets. We remain watchful of the impact of Covid, supply stabilisation and how the global economy recovers in the new normal.
Seasonality Certain of our businesses, such as ice cream, are subject to significant seasonal fluctuations in sales. However, Unilever operates globally in many different markets and product categories, and no individual element of seasonality is likely to be material to the results of the Group as a whole.
Intellectual property We have a large portfolio of patents and trademarks, and we conduct some of our operations under licences that are based on patents or trademarks owned or controlled by others. We are not dependent on any one patent or group of patents. We use all appropriate efforts to protect our brands and technology.
Competition As a fast-moving consumer goods (FMCG) company, we are competing with a diverse set of competitors. Some of these operate on an international scale like ourselves, while others have a more regional or local focus. Our business model centres on building brands which consumers know, trust, like and buy in conscious preference to those of our competitors. Our brands command loyalty and affinity and deliver superior performance.
Information on market share Unless otherwise stated, market share refers to value share as opposed to volume share. The market data and competitive position classifications are taken from independent industry sources in the markets in which Unilever operates.
Iran-related required disclosureUnilever operates in Iran through a non-US subsidiary. In 2021, sales in Iran were less than one per cent of Unilever’s worldwide turnover. During the year, this non-US subsidiary had approximately €2,375,543 in gross revenues and less than €1,021,483 in net profits attributable to the sale of food, personal care and home care products to entities affiliated with the Government of Iran. These entities were the Shahrvand Group, which is owned by the municipality of Tehran and Refah, which is a chain of 200 state-owned department stores. This non-US subsidiary has donated a de minimus amount of personal care products to Firoozgar Hospital, which is a hospital affiliated with goverment, to assist with the Covid-19 pandemic. Income, payroll and other taxes, duties and fees (including for utilities) were payable to the Government of Iran and affiliated entities in connection with our operations. Our non-US subsidiary maintains bank accounts in Iran with various banks to facilitate our business in the country and make any required payments to the Government of Iran and affiliated entities. While we currently continue our activities in Iran, we are continuously evaluating such activities in light of the evolving regulatory environment.
192 Unilever Annual Report and Accounts 2021

Property, plant and equipment The Group has interests in properties in most of the countries where there are Unilever operations. None of these interests are individually material in the context of the Group as a whole. The properties are used predominantly to house production and distribution activities and as offices. There is a mixture of leased and owned property throughout the Group. We are not aware of any environmental issues affecting the properties which would have a material impact upon the Group, and there are no material encumbrances on our properties. Any difference between the market value of properties held by the Group and the amount at which they are included in the balance sheet is not significant. We believe our existing facilities are satisfactory for our current business and we currently have no plans to construct new facilities or expand or improve our current facilities in a manner that is material to the Group.
Taxation The comments below in relation to United Kingdom and United States taxation are based on current United Kingdom and United States federal income tax law as applied in England and Wales and the United States respectively, and HM Revenue & Customs ('HMRC') and Internal Revenue Service (“IRS”) practice (which may not be binding on HMRC or the IRS) respectively, in each case as at the latest practicable date before the date of this document.
Taxation for US persons holding shares or American Depositary Shares in PLC The following notes are provided for guidance. US persons should consult their local tax advisers, particularly in connection with potential liability to pay US taxes on disposal, lifetime gift or bequest of their shares or American Depositary Shares ('ADSs'). A US person is a US individual citizen or resident, a corporation organised under the laws of the United States, any state or the District of Columbia, or any other legal person subject to US Federal Income Tax on its worldwide income.
United Kingdom taxation on dividends Under United Kingdom law, income tax is not withheld from dividends paid by most United Kingdom companies, including PLC. Shareholders of PLC, whether resident in the United Kingdom or not, receive the full amount of the dividend actually declared.
A non-UK resident shareholder or ADS holder holding their shares or ADSs otherwise than in connection with any trade, profession or vocation carried on through a branch, agency or permanent establishment in the UK will not generally be subject to UK tax in respect of dividends paid by PLC.
United States taxation on dividends If you are a US person, the distribution up to the amount of PLC’s earnings and profits for US Federal Income Tax purposes will be ordinary dividend income.
Any portion of the distribution that exceeds PLC’s earnings and profits is subject to different rules. This portion is a tax-free return of capital to the extent of your basis in PLC’s shares or ADSs, and thereafter is treated as a gain on a disposition of the shares or ADSs. PLC does not maintain calculations of its earnings and profits in accordance with US Federal Income Tax accounting principles. You should therefore assume that any distribution by PLC with respect to the shares will be reported as ordinary dividend income. You should consult your own tax advisers with respect to the appropriate US Federal Income Tax treatment of any distribution received from us.
Dividends received by an individual will be taxed at a maximum rate of 15% or 20%, depending on the income level of the individual, provided the individual has held the shares or ADSs for more than 60 days during the 121-day period beginning 60 days before the ex-dividend date, that PLC is a qualified foreign corporation and certain other conditions are satisfied. PLC is a qualified foreign corporation for this purpose. In addition, an additional tax of 3.8% will apply to dividends and other investment income received by individuals with incomes exceeding certain thresholds. The dividend is not eligible for the dividends received deduction allowable to corporations. The dividend is foreign source income for US foreign tax credit purposes.
For US Federal Income Tax purposes, the amount of any dividend paid in a non-US currency will be included in income in a US dollar amount calculated by reference to the exchange rate in effect on the date the dividends are received by you or the depositary (in the case of ADSs), regardless of whether they are converted into US dollars at that time. If the non-US currency is converted into US dollars on the day they are received, you generally will not be required to recognise foreign currency gain or loss in respect of this dividend income.
UK taxation on capital gains Under United Kingdom law, when you dispose of shares or ADSs you may be liable to pay United Kingdom tax in respect of any gain accruing on the disposal.
However, if you are either:▪ an individual who is not resident in the United Kingdom for the year
in question; or▪ a company which is not resident in the United Kingdom when the
gain accrues you will generally not be liable to United Kingdom tax on any gains made on disposal of your shares or ADSs.
There are exceptions to this general rule, two of which are: if the shares or ADSs are held in connection with a trade or business which is conducted in the United Kingdom through a branch, agency or permanent establishment; or if the shares or ADSs are held by an individual who becomes resident in the UK having left the UK for a period of non-residence of five years or less and who was resident for at least four of the seven tax years prior to leaving the UK. In such cases, you may be liable to United Kingdom tax in respect of the disposal of shares or ADSs.
United States taxation on capital gains A US person generally will recognise capital gain or loss for US Federal Income Tax purposes equal to the difference, if any, between the amount realised on the sale and the US person’s adjusted tax basis in the shares or ADSs, in each case as determined in US dollars. US persons should consult their own tax advisers about how to determine the US dollar value of any foreign currency received as proceeds on the sale of shares or ADSs and the treatment of any foreign currency gain or loss upon conversion of the foreign currency into US dollars. The capital gain or loss recognised on the sale will be long-term capital gain or loss if the US person’s holding period in the shares or ADSs exceeds one year. Non-corporate US persons are subject to tax on long-term capital gain at reduced rates. The deductibility of capital losses is subject to limitations.
UK inheritance tax Under the current estate and gift tax convention between the United States and the United Kingdom, shares or ADSs (regardless of whether they are situated in the United Kingdom for inheritance tax purposes) held by an individual shareholder who is: ▪ domiciled for the purposes of the convention in the United States;
and ▪ not for the purposes of the convention a national of the United
Kingdom
will generally not be subject to United Kingdom inheritance tax: ▪ on the individual’s death; or ▪ on a gift of the shares during the individual’s lifetime.
Where shares or ADSs are held on trust, they will generally not be subject to United Kingdom inheritance tax where the settlor at the time of the settlement: ▪ was domiciled for the purposes of the convention in the United
States; and ▪ was not for the purposes of the convention a national of the
United Kingdom.
An exception is if the shares or ADSs are part of the business property of a permanent establishment of the shareholder in the United Kingdom or, in the case of a shareholder who performs independent personal services, pertain to a fixed base situated in the United Kingdom.
Where shares or ADSs are subject to United Kingdom inheritance tax and United States federal gift or federal estate tax, the amount of the tax paid in one jurisdiction can generally be credited against the tax due in the other jurisdiction.
Unilever Annual Report and Accounts 2021 193
FINA
NC
IAL STA
TEMEN
TS
Where a United Kingdom inheritance tax liability is prima facie not payable by virtue of the convention, that tax can become payable if any applicable federal gift or federal estate tax on the shares or ADSs in the United States is not paid.
Where shares are dealt with through a clearing system or in the form of ADSs, the situs of the shares may not be determinative of the situs of the interests held by holders through such system or of such ADSs for United Kingdom inheritance tax purposes. Where shares are dealt with through Euroclear Nederland, there are arguments that the interests of participants in Euroclear Nederland will be situated outside the United Kingdom for the purposes of United Kingdom inheritance tax so long as Euroclear Nederland maintains the book-entry register of such participants’ interests outside the United Kingdom, although HMRC may not accept this analysis. Similarly, there are arguments that ADSs registered on a register outside the United Kingdom will be situated outside the United Kingdom for the purposes of United Kingdom inheritance tax, although again HMRC may not accept this analysis. Shareholders to whom this may be relevant should consult an appropriate professional adviser.
If the ADSs or the shares dealt with through Euroclear Nederland or both are not situated in the United Kingdom, a gift of such ADSs or such shares by, or the death of, an individual holder of such assets who is neither domiciled nor deemed to be domiciled (under certain rules relating to long residence or previous domicile) in the United Kingdom will not generally give rise to a liability to United Kingdom inheritance tax regardless of whether the estate and gift tax convention between the United States and the United Kingdom applies. Special rules may also apply to such ADSs or such shares dealt with through Euroclear Nederland which are held on trust.
UK stamp duty and stamp duty reserve tax The statements in this section are intended as a general guide to the current United Kingdom stamp duty and stamp duty reserve tax ('SDRT') position. Special rules apply to certain transactions such as transfers of the shares to a company connected with the transferor and those rules are not described below. Investors should also note that certain categories of person are not liable to stamp duty or SDRT and others may be liable at a higher rate or may, although not primarily liable for tax, be required to notify and account for SDRT under the Stamp Duty Reserve Tax Regulations 1986.
Backup withholding and information reporting Payments of dividends and other proceeds with respect to ordinary shares or ADSs by US persons will be reported to you and to the IRS as may be required under applicable regulations. Backup withholding may apply to these payments if you fail to provide an accurate taxpayer identification number or certification of exempt status or fail to comply with applicable certification requirements. Some holders are not subject to backup withholding. You should consult your tax adviser as to your qualification for an exemption from backup withholding and the procedure for obtaining an exemption.
Disclosure requirements for US individual holders US individuals that hold certain specified non-US financial assets, including stock in a non-US corporation, with values in excess of certain thresholds are required to file Form 8938 with their US Federal Income Tax return. Such Form requires disclosure of information concerning such non-US assets, including the value of the assets. Failure to file the Form when required is subject to penalties. An exemption from reporting applies to non-US assets held through a US financial institution generally including a non-US branch or subsidiary of a US institution and a US branch of a non-US institution. Investors are encouraged to consult with their own tax advisers regarding the possible application of this disclosure requirement to their investment in the shares or ADSs.
Issue of shares Subject to the points noted below in respect of shares issued to clearance services (such as Euroclear Nederland) or which are issued into a depositary receipt system where the shares are to be held in ADS form, no stamp duty or SDRT will arise on the issue of shares in registered form by PLC.
Transfer of shares Except in relation to clearance services and depositary receipt systems (to which special rules outlined below apply), stamp duty at the rate of 0.5 per cent (rounded up to the next multiple of £5) of the amount or value of the consideration given will generally be payable on an instrument transferring PLC shares. A charge to SDRT will also generally arise on an unconditional agreement to transfer PLC shares (at the rate of 0.5 per cent of the amount or value of the consideration payable). However, if within six years of the date of the agreement becoming unconditional, an instrument of transfer is executed pursuant to the agreement, and stamp duty is paid on that instrument, any SDRT already paid will be refunded (generally, but not necessarily, with interest) provided that a claim for repayment is made, and any outstanding liability to SDRT will be cancelled. The liability to pay stamp duty or SDRT is generally satisfied by the purchaser or transferee.
Shares held through clearance services including Euroclear Nederland Special rules apply where shares are issued or transferred to, or to a nominee or agent for, a person providing a clearance service. In such circumstances, SDRT or stamp duty may be charged at a rate of 1.5 per cent, with subsequent transfers within the clearance service then being free from SDRT and stamp duty (except in relation to clearance service providers that have made an election under section 97A(1) of the Finance Act 1986 which has been approved by HM Revenue & Customs, to which the special rules apply).
In light of EU case law, HMRC accepted that the 1.5 per cent charge is in breach of EU law so far as it applies to issues of shares or to transfers of shares that are an integral part of a share issue. This EU case law will continue to be recognised and followed pursuant to the provisions of the European Union (Withdrawal) Act 2018 (the 'EUWA').
194 Unilever Annual Report and Accounts 2021
HMRC’s published view is that the 1.5 per cent. SDRT or stamp duty charge continues to apply to other transfers of shares into a clearance service, although this has been disputed. In view of the continuing uncertainty, specific professional advice should be sought before incurring a 1.5 per cent stamp duty or SDRT charge in any circumstances. Any liability for stamp duty or SDRT in respect of a transfer of shares into a clearance service, or in respect of a transfer of shares within such a service, which does arise will strictly be accountable by the clearance service or its nominee but may, in practice, be payable by the relevant participant in the clearance service.
Shares held in ADS form On the basis of EU case law referred to above and the EUWA, there should be no stamp duty or SDRT on an issuance of shares into a depositary receipt system where such transfer is an integral part of the raising of capital by the company concerned. A transfer of shares into a depositary receipt system may be subject to SDRT or stamp duty may be charged at a rate of 1.5 per cent, with subsequent transfers of depositary receipts then being free from SDRT.
Any liability for stamp duty or SDRT in respect of a transfer of shares into a depositary receipt system which does arise will strictly be accountable by the depositary receipt system operator or its nominee but may, in practice, be payable by the relevant holder of the depositary receipts.
An issue of ADSs by Deutsche Bank Trust Company Americas as depositary in respect of the ADSs will not be subject to stamp duty or SDRT. An agreement for the transfer of ADSs will not be subject to SDRT but a charge to stamp duty will technically arise on the transfer of ADSs if it is executed in the UK or relates to any property situated, or to any matter or thing done or to be done, in the UK. However, the only sanction for failing to pay such stamp duty is that the instrument of transfer cannot be produced as evidence in a UK court. Therefore, no UK stamp duty should in practice be payable on the acquisition or transfer of existing ADSs or transfer of beneficial ownership of ADSs.
Description of securities other than equity securities Deutsche Bank serves as the depositary (Depositary) for PLC’s American Depositary Receipt Programme.
Depositary fees and charges for PLC Under the terms of the Deposit Agreement for the PLC American Depositary Shares (ADSs), an ADS holder may have to pay the following service fees to the depositary bank: ▪ Issuance of ADSs: up to US 5¢ per ADS issued. ▪ Cancellation of ADSs: up to US 5¢ per ADS cancelled. ▪ Processing of dividend and other cash distributions not made
pursuant to a cancellation or withdrawal: up to US 5¢ per ADS held.
An ADS holder will also be responsible for paying certain fees and expenses incurred by the depositary bank and certain taxes and governmental charges such as: ▪ fees for the transfer and registration of shares charged by the
registrar and transfer agent for the shares in the United Kingdom (i.e. upon deposit and withdrawal of shares);
▪ expenses incurred for converting foreign currency into US dollars; ▪ expenses for cable, telex and fax transmissions and for delivery of
securities; ▪ taxes and duties upon the transfer of securities (i.e. when shares are
deposited or withdrawn from deposit); ▪ fees and expenses incurred in connection with the delivery or
servicing of shares on deposit; and ▪ fees incurred in connection with the distribution of dividends.
Depositary fees payable upon the issuance and cancellation of ADSs are typically paid to the depositary bank by the brokers (on behalf of their clients) receiving the newly issued ADSs from the depositary bank and by the brokers (on behalf of their clients) delivering the ADSs to the depositary bank for cancellation. The brokers in turn charge these transaction fees to their clients.
Note that the fees and charges an investor may be required to pay may vary over time and may be changed by us and by the depositary bank. Notice of any changes will be given to investors.
Unilever Annual Report and Accounts 2021 195
FINA
NC
IAL STA
TEMEN
TS

Depositary payments – fiscal year 2021
Deutsche Bank has been the depositary bank for its American Depositary Receipt Programme since 1 July 2014. Under the terms of the Deposit Agreement, PLC is entitled to certain reimbursements, including processing of cash distributions, reimbursement of listing fees (NYSE), reimbursement of settlement infrastructure fees (including DTC feeds), reimbursement of proxy process expenses (printing, postage and distribution), dividend fees and program-related expenses (that include expenses incurred from the requirements of the US Sarbanes-Oxley Act of 2002). In relation to 2021, PLC received $3,830,334 from Deutsche Bank.
Defaults, dividend arrearages and delinquencies
Defaults Programme
There has been no material default in the payment of principal, interest, a sinking or purchase fund instalment or any other material default relating to indebtedness of the Group.
Dividend arrearages and delinquencies
There have been no arrears in payment of dividends on, and material delinquency with respect to, any class of preferred stock of any significant subsidiary of the Group.
196 Unilever Annual Report and Accounts 2021

Purchases of equity securities
Share purchases during 2021
Please also refer to ‘Our shares’ section on page 76.
62,976,145PLC ordinary shares or ADSs were purchased by or on behalf of PLC or any 'affiliated purchaser', as defined in Section 10b-18(a)(3) of the US Securities Exchange Act of 1934, during the period covered by this annual report on Form 20-F.
Between 31 December 2021 and 24 February 2022 (the latest practicable date for inclusion in this report), PLC did not conduct any share repurchases.
Management’s report on internal control over financial reportingIn accordance with the requirements of Section 404 of the US Sarbanes-Oxley Act of 2002, the following report is provided by management in respect of the Group’s internal control over financial reporting (as defined in rule 13a–15(f) or rule 15d–15(f) under the US Securities Exchange Act of 1934): ▪ Unilever’s management is responsible for establishing and maintaining adequate internal control over financial reporting for the Group; ▪ Unilever’s management has used the Committee of Sponsoring Organizations of the Treadway Commission (COSO) framework (2013) to
evaluate the effectiveness of our internal control over financial reporting. Management believes that the COSO framework (2013) is a suitable framework for its evaluation of our internal control over financial reporting because it is free from bias, permits reasonably consistent qualitative and quantitative measurements of internal controls, is sufficiently complete so that those relevant factors that would alter a conclusion about the effectiveness of internal controls are not omitted and is relevant to an evaluation of internal control over financial reporting;
▪ Management has assessed the effectiveness of internal control over financial reporting as of 31 December 2021, and has concluded that such internal control over financial reporting is effective. Management’s assessment and conclusion excludes the Paula's Choice, Welly and Onnit from this assessment, as they were acquired on 2 August 2021, 29 January 2021 and 28 May 2021 respectively. These entities are included in our 2021 consolidated financial statements, and together they constituted approximately 3.8% of our total assets as at 31 December 2021 (of which 94% represented goodwill and intangible assets acquired) and approximately 0.4% of total turnover for the year ended 31 December 2021; and
▪ KPMG LLP, who have audited the consolidated financial statements of the Group for the year ended 31 December 2021, have also audited the effectiveness of internal control over financial reporting as at 31 December 2021 and have issued an attestation report on internal control over financial reporting.
Principal accountant fees and services
Our independent registered public accounting firm is KPMG LLP, London, United Kingdom, Auditor Firm ID: 1118
€ million € million € million
2021 2020 2019
Audit fees(a) 22 19 17 Audit-related fees(b) 6 (d) 7
(d)
— Tax fees(c)
— — — All other fees(c)
— — —
(a) Amount payable to KPMG in respect of services supplied to associated pension schemes was less than €1 million individually and in aggregate (2020: less than €1 million individually and in aggregate; 2019: less than €1 million individually and in aggregate).
(b) Includes other audit services which comprise audit and similar work that regulations or agreements with third parties require the auditors to undertake.(c) Amounts paid in relation to each type of service are individually less than €1 million. In aggregate the fees paid were less than €1 million (2020: less than €1 million,
2019: less than €1 million). (d) 2021 includes €5 million (2020: €6 million) for audits and reviews of carve-out financial statements of ekaterra. 2020 also includes €1 million for assurance work on
Unification.
Unilever Annual Report and Accounts 2021 197
FINA
NC
IAL STA
TEMEN
TS

Guarantor statements
On 13 August 2020, Unilever N.V. (NV) and Unilever Capital Corporation (UCC) filed a US Shelf registration, which was unconditionally and fully guaranteed, jointly and severally, by NV, Unilever PLC (PLC) and Unilever United States, Inc. (UNUS) and that updated the NV and UCC US Shelf registration filed on 27 July 2017, which was unconditionally and fully guaranteed, jointly and severally, by NV, PLC and UNUS.
As a result of Unification, PLC assumed NV’s liabilities in relation to debt issued under the US shelf registration programme. UCC and UNUS are each indirectly 100% owned by PLC and consolidated in the financial statements of the Unilever Group. In relation to the US Shelf registration, US$12.1 billion of Notes were outstanding at 31 December 2021 (2020: US$11.5 billion; 2019: US$12.35 billion) with coupons ranging from 0.375% to 5.900%. These Notes are repayable between 07 March 2022 and 12 August 2051.
All debt securities issued by UCC are senior, unsecured, and unsubordinated and are fully and unconditionally guaranteed, on a joint and several basis, by PLC and UNUS.
In March 2020, the SEC amended Rule 3-10 of Regulation S-X and created Rule 13-01 to simplify disclosure requirements related to certain registered securities, which we have adopted effective immediately. As noted above UCC and UNUS are 100% subsidiaries of Unilever PLC and are consolidated in the financial statements of the Unilever Group. In addition, there are no material assets in the guarantor entities apart from intercompany investments and balances. Therefore, as allowed under Rule 13-01, we have excluded the summarised information for each issuer and guarantor.
The guarantees provide that, in case of the failure of the relevant issuer to punctually make payment of any principal, premium or interest, each guarantor agrees to ensure such payment is made when due whether at the stated maturity or by declaration of acceleration, call for redemption or otherwise. The guarantees also provide that the Trustee shall be paid any and all amounts due to it under the guarantee upon which the debt securities are endorsed.
198 Unilever Annual Report and Accounts 2021
Cautionary StatementThis document may contain forward-looking statements, including ‘forward-looking statements’ within the meaning of the United States Private Securities Litigation Reform Act of 1995. Words such as ‘will’, ‘aim’, ‘expects’, ‘anticipates’, ‘intends’, ‘looks’, ‘believes’, ‘vision’, or the negative of these terms and other similar expressions of future performance or results, and their negatives, are intended to identify such forward-looking statements. Forward-looking statements also include, but are not limited to, statements and information regarding the Unilever Group’s (the ‘Group’) emissions reduction targets and other climate change related matters (including actions, potential impacts and risks associated therewith). These forward-looking statements are based upon current expectations and assumptions regarding anticipated developments and other factors affecting the Group. They are not historical facts, nor are they guarantees of future performance or outcomes.
Because these forward-looking statements involve risks and uncertainties, there are important factors that could cause actual results to differ materially from those expressed or implied by these forward-looking statements. Among other risks and uncertainties, the material or principal factors which could cause actual results to differ materially are: Unilever’s global brands not meeting consumer preferences; Unilever’s ability to innovate and remain competitive; Unilever’s investment choices in its portfolio management; the effect of climate change on Unilever’s business; Unilever’s ability to find sustainable solutions to its plastic packaging; significant changes or deterioration in customer relationships; the recruitment and retention of talented employees; disruptions in our supply chain and distribution; increases or volatility in the cost of raw materials and commodities; the production of safe and high quality products; secure and reliable IT infrastructure; execution of acquisitions, divestitures and business transformation projects; economic, social and political risks and natural disasters; financial risks; failure to meet high and ethical standards; and managing regulatory, tax and legal matters. A number of these risks have increased as a result of the current Covid-19 pandemic.
These forward-looking statements speak only as of the date of this document. Except as required by any applicable law or regulation, the Group expressly disclaims any obligation or undertaking to release publicly any updates or revisions to any forward-looking statements contained herein to reflect any change in the Group’s expectations with regard thereto or any change in events, conditions or circumstances on which any such statement is based.
This document also contains data on the Group’s Scope 1, 2 and 3 emissions. Scope 1 and 2 emissions data is relatively easy to gather as it relates to emissions from the Group’s own activities and supplied heat, power and cooling. Scope 3 emissions relate to other organisations’ emissions and is therefore subject to a range of uncertainties, including that data used to model lifecycle footprints is typically industry-standard data rather than relating to individual suppliers; lifecycle models such as the Group’s cover many but not all products and markets; and international standards and protocols governing emissions calculations and categorisations evolve, as do accepted norms regarding terminology such as carbon neutral and net zero. As value chain emissions data improves, shifting over time from generic modelled data to more specific data, the data reported in this document is likely to evolve.
Further details of potential risks and uncertainties affecting the Group are described in the Group’s filings with the London Stock Exchange, Euronext Amsterdam and the US Securities and Exchange Commission, including in the Annual Report on Form 20-F 2021.
This document is not prepared in accordance with US GAAP and should not therefore be relied upon by readers as such. The Annual Report on Form 20-F 2021 is separately filed with the US Securities and Exchange Commission and is available on our corporate website.
www.unilever.com
In addition, a printed copy of the Annual Report on Form 20-F 2021 is available, free of charge, upon request to Unilever, Investor Relations Department, 100 Victoria Embankment, London EC4Y 0DY, United Kingdom.
This document comprises regulated information within the meaning of Sections 1:1 and 5:25c of the Act on Financial Supervision (‘Wet op het financieel toezicht (Wft)’) in the Netherlands.
The brand names shown in this report are trademarks owned by or licensed to companies within the Group.
References in this document to information on websites (and/or social media sites) are included as an aid to their location and such information is not incorporated in, and does not form part of, the Unilever Annual Report and Accounts 2021.
Unilever Annual Report and Accounts 2021 199
FINA
NC
IAL STA
TEMEN
TS


This document may contain forward-looking statements, including ‘forward-looking statements’ within the meaning of the United States Private Securities Litigation Reform Act of 1995. Words such as ‘will’, ‘aim’, ‘expects’, ‘anticipates’, ‘intends’, ‘looks’, ‘believes’, ‘vision’, or the negative of these terms and other similar expressions of future performance or results, and their negatives, are intended to identify such forward-looking statements. These forward-looking statements are based upon current expectations and assumptions regarding anticipated developments and other factors affecting the Unilever Group (the ‘Group’). They are not historical facts, nor are they guarantees of future performance.
Because these forward-looking statements involve risks and uncertainties, there are important factors that could cause actual results to differ materially from those expressed or implied by these forward-looking statements. Among other risks and uncertainties, the material or principal factors which could cause actual results to differ materially are: Unilever’s global brands not meeting consumer preferences; Unilever’s ability to innovate and remain competitive; Unilever’s investment choices in its portfolio management; the effect of climate change on Unilever’s business; Unilever's ability to find sustainable solutions to its plastic packaging; significant changes or deterioration in customer relationships; the recruitment and retention of talented employees; disruptions in our supply chain and distribution; increases or volatility in the cost of raw materials and commodities; the production of safe and high quality products; secure and reliable IT infrastructure; execution of acquisitions, divestitures and business transformation projects; economic, social and political risks and natural disasters; financial risks; failure to meet high and ethical standards; and managing regulatory, tax and legal matters.
These forward-looking statements speak only as of the date of this document. Except as required by any applicable law or regulation, the Group expressly disclaims any obligation or undertaking to release publicly any updates or revisions to any forward-looking statements contained herein to reflect any change in the Group’s expectations with regard thereto or any change in events, conditions or circumstances on which any such statement is based.
Further details of potential risks and uncertainties affecting the Group are described in the Group’s filings with the London Stock Exchange, Euronext Amsterdam and the US Securities and Exchange Commission, including in the Annual Report on Form 20-F 2019 and the Unilever Annual Report and Accounts 2019.
This document is not prepared in accordance with US GAAP and should not therefore be relied upon by readers as such. The Annual Report on Form 20-F 2019 is separately filed with the US Securities and Exchange Commission and is available on our corporate website
www.unilever.com
In addition, a printed copy of the Annual Report on Form 20-F 2019 is available, free of charge, upon request to Unilever, Investor Relations Department, 100 Victoria Embankment, London EC4Y 0DY, United Kingdom.
This document comprises regulated information within the meaning of Sections 1:1 and 5:25c of the Act on Financial Supervision (‘Wet op het financieel toezicht (Wft)’) in the Netherlands.
The brand names shown in this report are trademarks owned by or licensed to companies within the Group.
References in this document to information on websites (and/or social media sites) are included as an aid to their location and such information is not incorporated in, and does not form part of, the Unilever Annual Report and Accounts 2019 or the Annual Report on Form 20-F 2019.
Cautionary StatementCautionary Statement
Designed and produced by Unilever Communications.
Printed at Pureprint Group, ISO 14001. FSC® certified and CarbonNeutral®.
This document is printed on Revive 100% Recycled Silk. These papers have been exclusively supplied by Denmaur Independent Papers which has offset the carbon produced by the production and delivery of them to the printer.
These papers are 100% recycled and manufactured using de-inked post-consumer waste. All the pulp is bleached using an elemental chlorine free process (ECF). Printed in the UK by Pureprint using its pureprint® environmental printing technology. Vegetable inks were used throughout. Pureprint is a CarbonNeutral® company. Both the manufacturing mill and the printer are registered to the Environmental Management System ISO 14001 and are Forest Stewardship Council® (FSC®) chain-of-custody certified.
If you have finished with this document and no longer wish to retain it, please pass it on to other interested readers or dispose of it in your recycled paper waste. Thank you.
For further information about Unilever please visit our website:www.unilever.com
Unilever PLCHead Office 100 Victoria EmbankmentLondon EC4Y 0DYUnited KingdomT +44 (0)20 7822 5252
Registered Office Unilever PLCPort SunlightWirralMerseyside CH62 4ZDUnited Kingdom
Registered in England and WalesCompany Number: 41424


