Embed Size (px)
Citation preview
Potential investors and shareholders of the Company (the “Potential Investors and Shareholders”) are reminded that informationcontained in this Presentation comprises extracts of operational data and financial information of the Group, and of certain pro formafinancial information of the Group to illustrate how certain financial information of the Group for the year ended 31 December 2015might have been affected as if the Reorganisation was effective on 1 January 2015. The information included is solely for the use in thisPresentation and certain information has not been independently verified. No representations or warranties, expressed or implied, aremade as to, and no reliance should be placed on, the fairness, accuracy, completeness or correctness of the information or opinionspresented or contained in this Presentation. Potential Investors and Shareholders should refer to the 2015 Annual Report for the auditedresults of the Company which are published in accordance with the listing rules of the Stock Exchange of Hong Kong Limited.
The unaudited pro forma financial information of the Group contained within this Presentation have been prepared for additionalinformation and illustrative purpose only, and there is no assurance that the actual outcome of the Reorganisation at 1 January 2015would have been as presented. The performance and the results of operations of the Group contained within this Presentation arehistorical in nature, and past performance is no guarantee of the future results of the Group. Any forward-looking statements andopinions contained within this Presentation are based on current plans, estimates and projections, and therefore involve risks anduncertainties. Actual results may differ materially from expectations discussed in such forward-looking statements and opinions. TheGroup, the Directors, employees and agents of the Group assume (a) no obligation to correct or update the forward-looking statementsor opinions contained in this Presentation; and (b) no liability in the event that any of the forward-looking statements or opinions do notmaterialise or turn out to be incorrect.
Potential Investors and Shareholders should exercise caution when investing in or dealing in the securities of the Company.
2
Disclaimer
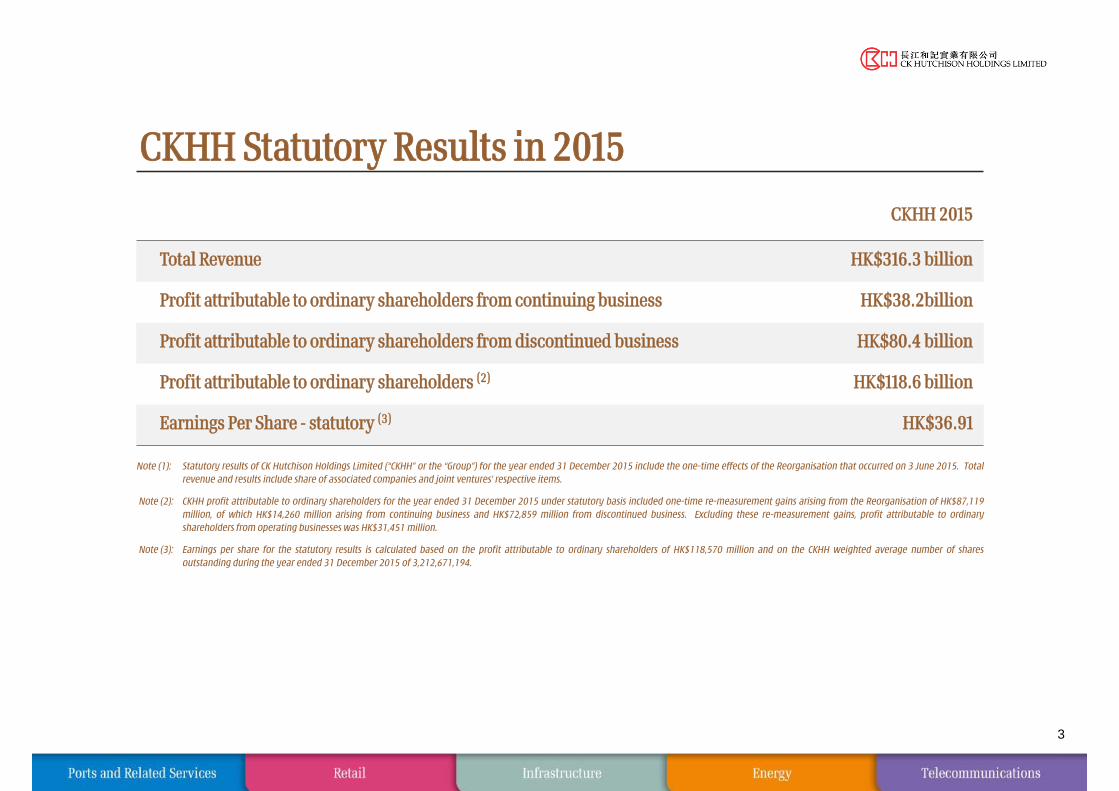
CKHH Statutory Results in 2015
3
CKHH 2015
Total Revenue HK$316.3 billion
Profit attributable to ordinary shareholders from continuing business HK$38.2billion
Profit attributable to ordinary shareholders from discontinued business HK$80.4 billion
Profit attributable to ordinary shareholders (2) HK$118.6 billion
Earnings Per Share - statutory (3) HK$36.91
Note (1): Statutory results of CK Hutchison Holdings Limited (“CKHH” or the “Group”) for the year ended 31 December 2015 include the one-time effects of the Reorganisation that occurred on 3 June 2015. Totalrevenue and results include share of associated companies and joint ventures’ respective items.
Note (2): CKHH profit attributable to ordinary shareholders for the year ended 31 December 2015 under statutory basis included one-time re-measurement gains arising from the Reorganisation of HK$87,119million, of which HK$14,260 million arising from continuing business and HK$72,859 million from discontinued business. Excluding these re-measurement gains, profit attributable to ordinaryshareholders from operating businesses was HK$31,451 million.
Note (3): Earnings per share for the statutory results is calculated based on the profit attributable to ordinary shareholders of HK$118,570 million and on the CKHH weighted average number of sharesoutstanding during the year ended 31 December 2015 of 3,212,671,194.
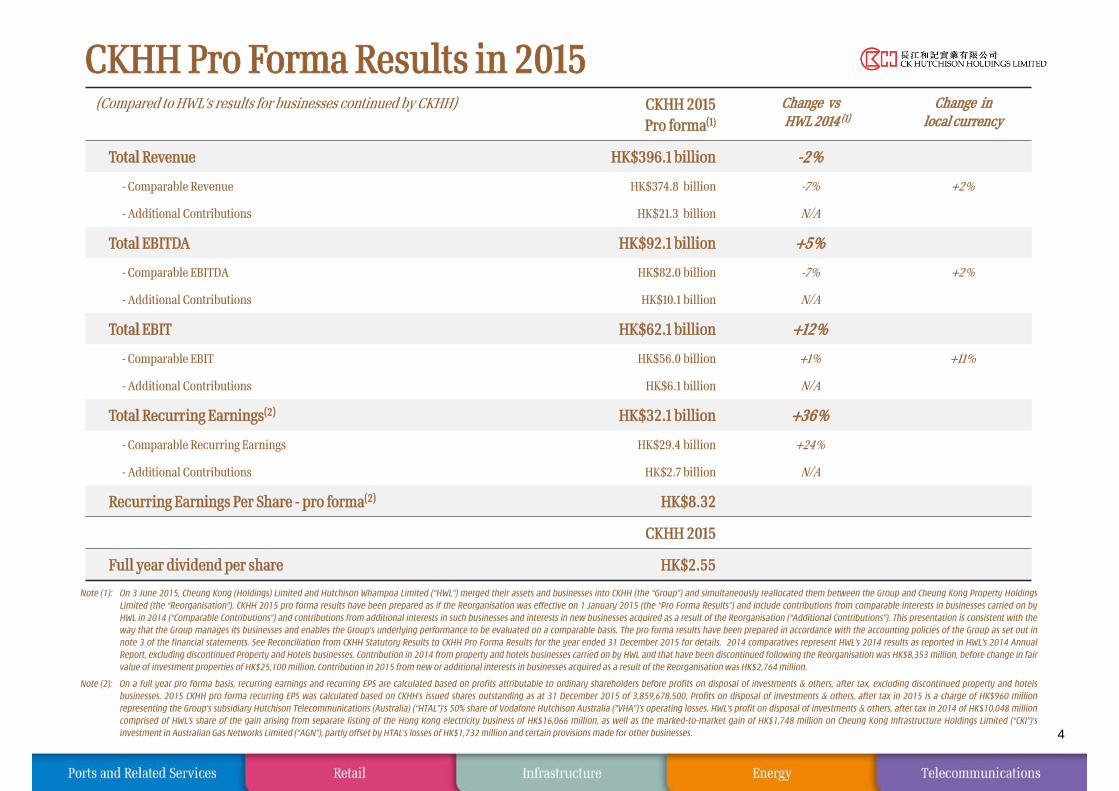
CKHH Pro Forma Results in 2015
4
(Compared to HWL’s results for businesses continued by CKHH) CKHH 2015 Pro forma(1)
Change vs HWL 2014 (1)
Change in local currency
Total Revenue HK$396.1 billion -2%
- Comparable Revenue HK$374.8 billion -7% +2%
- Additional Contributions HK$21.3 billion N/A
Total EBITDA HK$92.1 billion +5%
- Comparable EBITDA HK$82.0 billion -7% +2%
- Additional Contributions HK$10.1 billion N/A
Total EBIT HK$62.1 billion +12%
- Comparable EBIT HK$56.0 billion +1% +11%
- Additional Contributions HK$6.1 billion N/A
Total Recurring Earnings(2) HK$32.1 billion +36%
- Comparable Recurring Earnings HK$29.4 billion +24%
- Additional Contributions HK$2.7 billion N/A
Recurring Earnings Per Share - pro forma(2) HK$8.32
CKHH 2015
Full year dividend per share HK$2.55
Note (1): On 3 June 2015, Cheung Kong (Holdings) Limited and Hutchison Whampoa Limited (“HWL”) merged their assets and businesses into CKHH (the “Group”) and simultaneously reallocated them between the Group and Cheung Kong Property HoldingsLimited (the “Reorganisation”). CKHH 2015 pro forma results have been prepared as if the Reorganisation was effective on 1 January 2015 (the “Pro Forma Results”) and include contributions from comparable interests in businesses carried on byHWL in 2014 (“Comparable Contributions”) and contributions from additional interests in such businesses and interests in new businesses acquired as a result of the Reorganisation (“Additional Contributions”). This presentation is consistent with theway that the Group manages its businesses and enables the Group’s underlying performance to be evaluated on a comparable basis. The pro forma results have been prepared in accordance with the accounting policies of the Group as set out innote 3 of the financial statements. See Reconciliation from CKHH Statutory Results to CKHH Pro Forma Results for the year ended 31 December 2015 for details. 2014 comparatives represent HWL’s 2014 results as reported in HWL’s 2014 AnnualReport, excluding discontinued Property and Hotels businesses. Contribution in 2014 from property and hotels businesses carried on by HWL and that have been discontinued following the Reorganisation was HK$8,353 million, before change in fairvalue of investment properties of HK$25,100 million. Contribution in 2015 from new or additional interests in businesses acquired as a result of the Reorganisation was HK$2,764 million.
Note (2): On a full year pro forma basis, recurring earnings and recurring EPS are calculated based on profits attributable to ordinary shareholders before profits on disposal of investments & others, after tax, excluding discontinued property and hotelsbusinesses. 2015 CKHH pro forma recurring EPS was calculated based on CKHH’s issued shares outstanding as at 31 December 2015 of 3,859,678,500. Profits on disposal of investments & others, after tax in 2015 is a charge of HK$960 millionrepresenting the Group’s subsidiary Hutchison Telecommunications (Australia) (“HTAL”)’s 50% share of Vodafone Hutchison Australia (“VHA”)’s operating losses. HWL‘s profit on disposal of investments & others, after tax in 2014 of HK$10,048 millioncomprised of HWL’s share of the gain arising from separate listing of the Hong Kong electricity business of HK$16,066 million, as well as the marked-to-market gain of HK$1,748 million on Cheung Kong Infrastructure Holdings Limited (“CKI”)’sinvestment in Australian Gas Networks Limited (“AGN”), partly offset by HTAL’s losses of HK$1,732 million and certain provisions made for other businesses.
HWLActual2014
CKHHPro Forma
2015(1) (1)
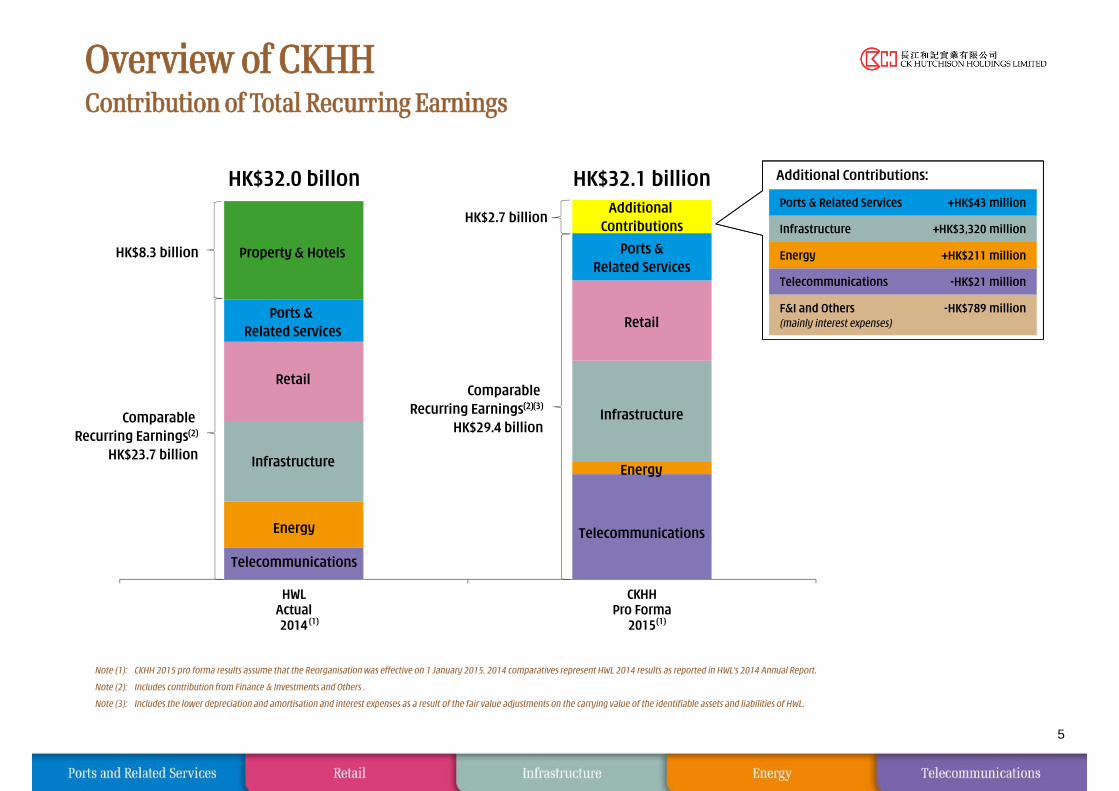
Overview of CKHH Contribution of Total Recurring Earnings
Note (1): CKHH 2015 pro forma results assume that the Reorganisation was effective on 1 January 2015. 2014 comparatives represent HWL 2014 results as reported in HWL’s 2014 Annual Report.
Note (2): Includes contribution from Finance & Investments and Others .
Note (3): Includes the lower depreciation and amortisation and interest expenses as a result of the fair value adjustments on the carrying value of the identifiable assets and liabilities of HWL.
Property & Hotels
Ports & Related Services
Retail
Infrastructure
Energy
Telecommunications
HK$32.0 billon HK$32.1 billion Additional
Contributions
Ports &Related Services
Retail
Infrastructure
Energy
Telecommunications
5
HK$8.3 billion
Comparable Recurring Earnings(2)
HK$23.7 billion
HK$2.7 billion
Comparable Recurring Earnings(2)(3)
HK$29.4 billion
Additional Contributions:
Ports & Related Services +HK$43 million
Infrastructure +HK$3,320 million
Energy +HK$211 million
Telecommunications -HK$21 million
F&I and Others (mainly interest expenses)
-HK$789 million
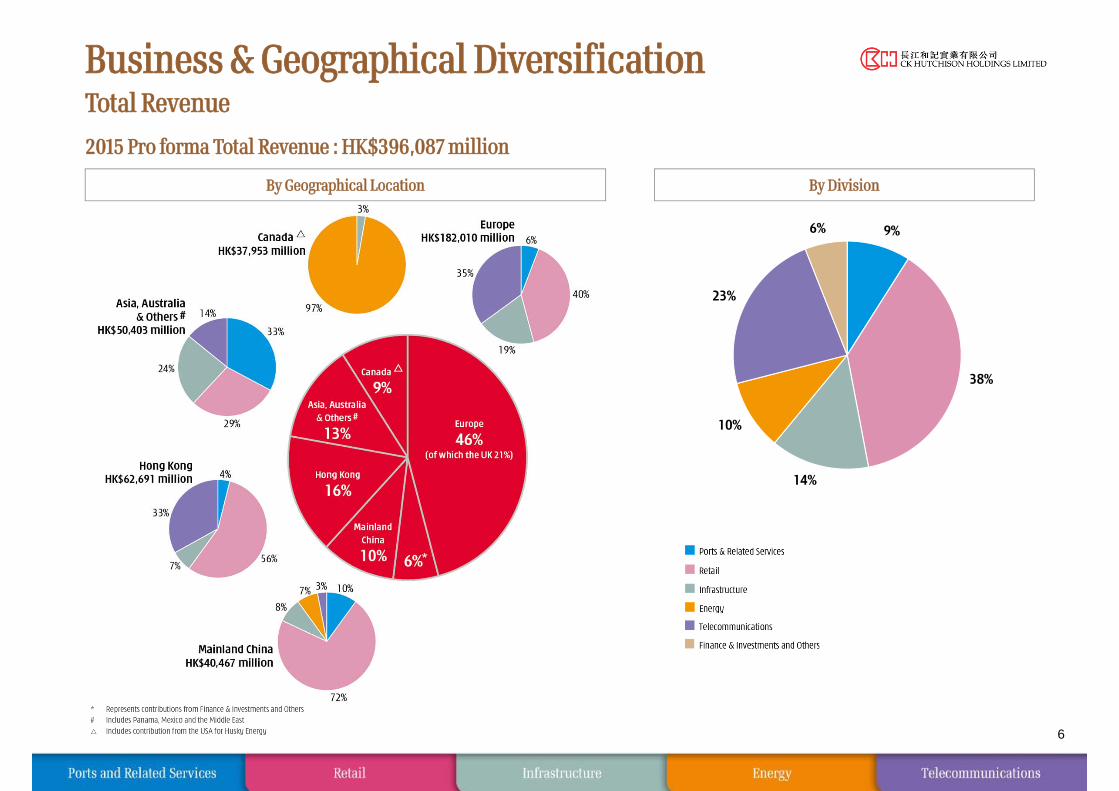
Business & Geographical Diversification Total Revenue
By Geographical Location By Division
6
2015 Pro forma Total Revenue : HK$396,087 million
9%
38%
14%
10%
23%
6%
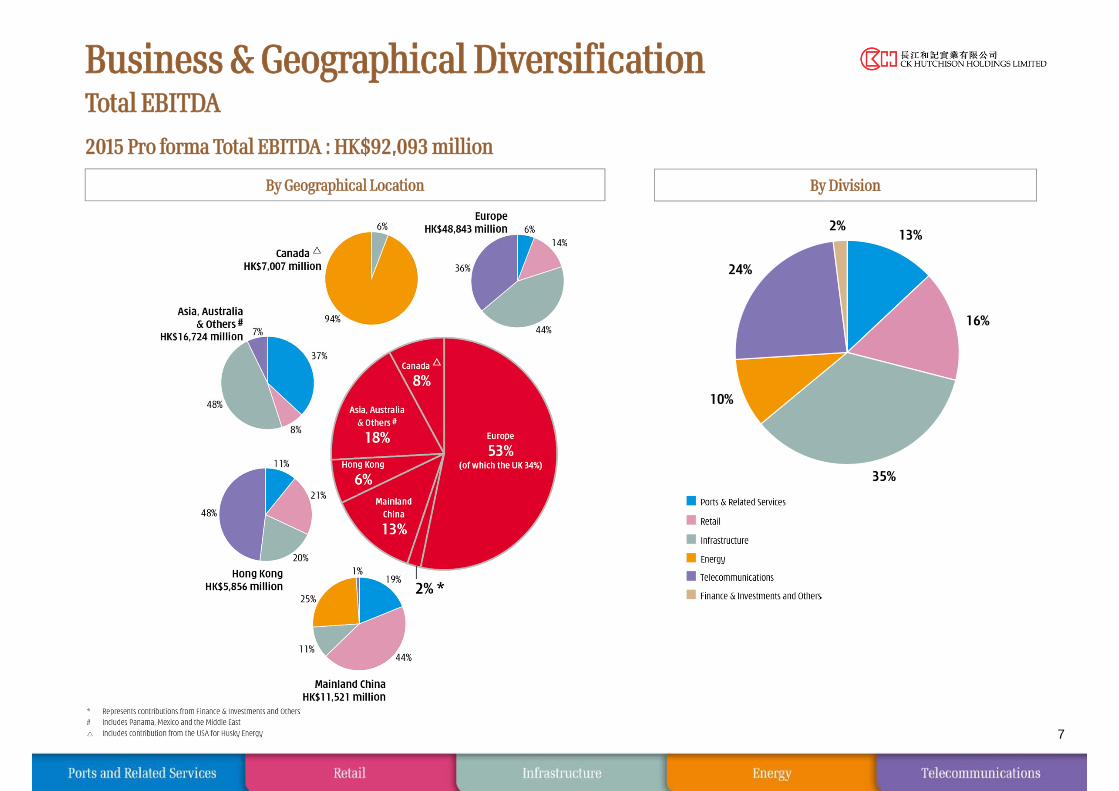
Business & Geographical Diversification Total EBITDA
By Geographical Location By Division
7
2015 Pro forma Total EBITDA : HK$92,093 million
13%
16%
35%
10%
24%
2%
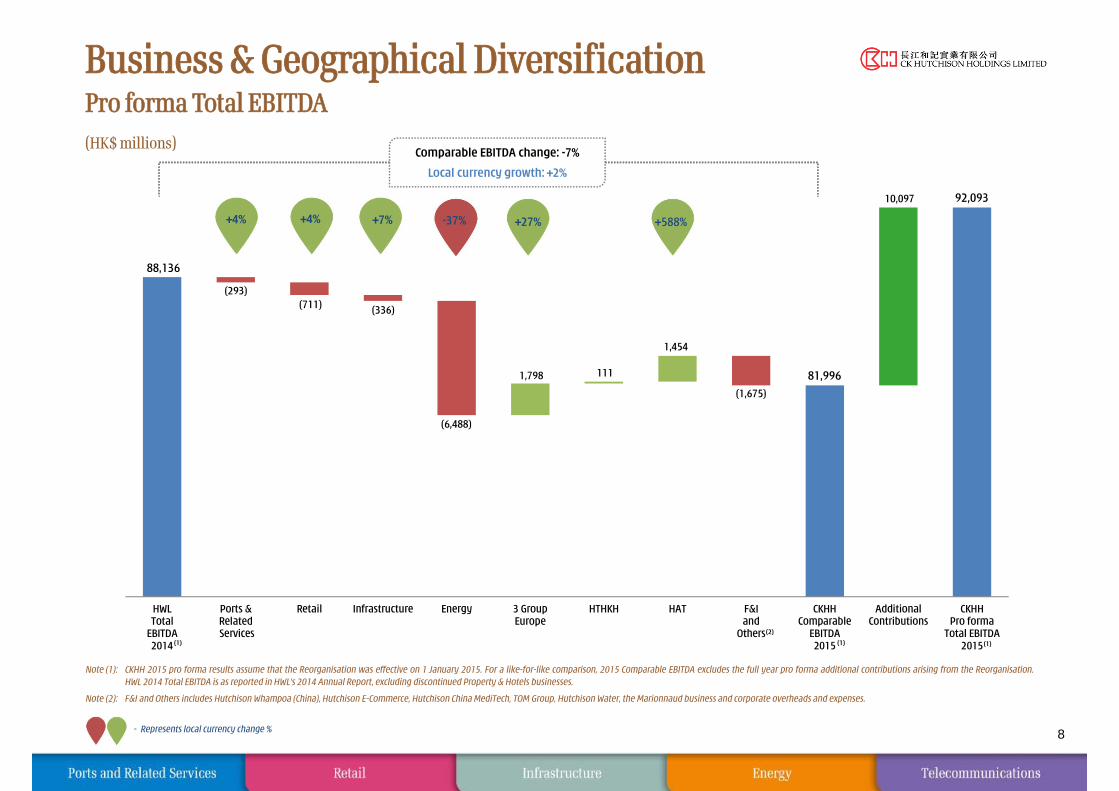
Business & Geographical Diversification Pro forma Total EBITDA
8
(HK$ millions)
Note (1): CKHH 2015 pro forma results assume that the Reorganisation was effective on 1 January 2015. For a like-for-like comparison, 2015 Comparable EBITDA excludes the full year pro forma additional contributions arising from the Reorganisation.HWL 2014 Total EBITDA is as reported in HWL’s 2014 Annual Report, excluding discontinued Property & Hotels businesses.
Note (2): F&I and Others includes Hutchison Whampoa (China), Hutchison E-Commerce, Hutchison China MediTech, TOM Group, Hutchison Water, the Marionnaud business and corporate overheads and expenses.
- Represents local currency change %
Comparable EBITDA change: -7%
Local currency growth: +2%
88,136
81,996
92,093
(293)(711) (336)
(6,488)
1,798 111
1,454
(1,675)
10,097
HWLTotal
EBITDA2014
Ports &Related Services
Retail Infrastructure Energy 3 GroupEurope
HTHKH HAT F&Iand
Others
CKHHComparable
EBITDA2015
AdditionalContributions
CKHHPro forma
Total EBITDA2015
(2)
(1)(1)(1)
+4% +4% +7% -37% +27% +588%

81,996
92,093
124
8,144
1,453 20356
CKHHComparable
EBITDA2015
Ports &RelatedServices
Infrastructure Energy Telcommunications Finance &Investmentsand Others
CKHHPro forma
Total EBITDA2015
Business & Geographical Diversification EBITDA – Additional Contributions
9
2015 Additional EBITDA Contributions(HK$ millions)
Note (1): Additional interest in 6 co-owned JVs with CKI includes Northumbrian Water, Park'N Fly, Australian Gas Networks, Dutch Enviro Energy (formerly AVR), Wales & West Utilities and UK Rails (formerly Eversholt).
Additional Interest in HPH Trust
Additional interest in 6 co-owned JVs with CKI (1)
Additional interest in Husky Energy
Additional Interest in HTHKH & its JV
Additional interest in Tom Group
Aircraft Leasing CK Life Sciences
Other Investments
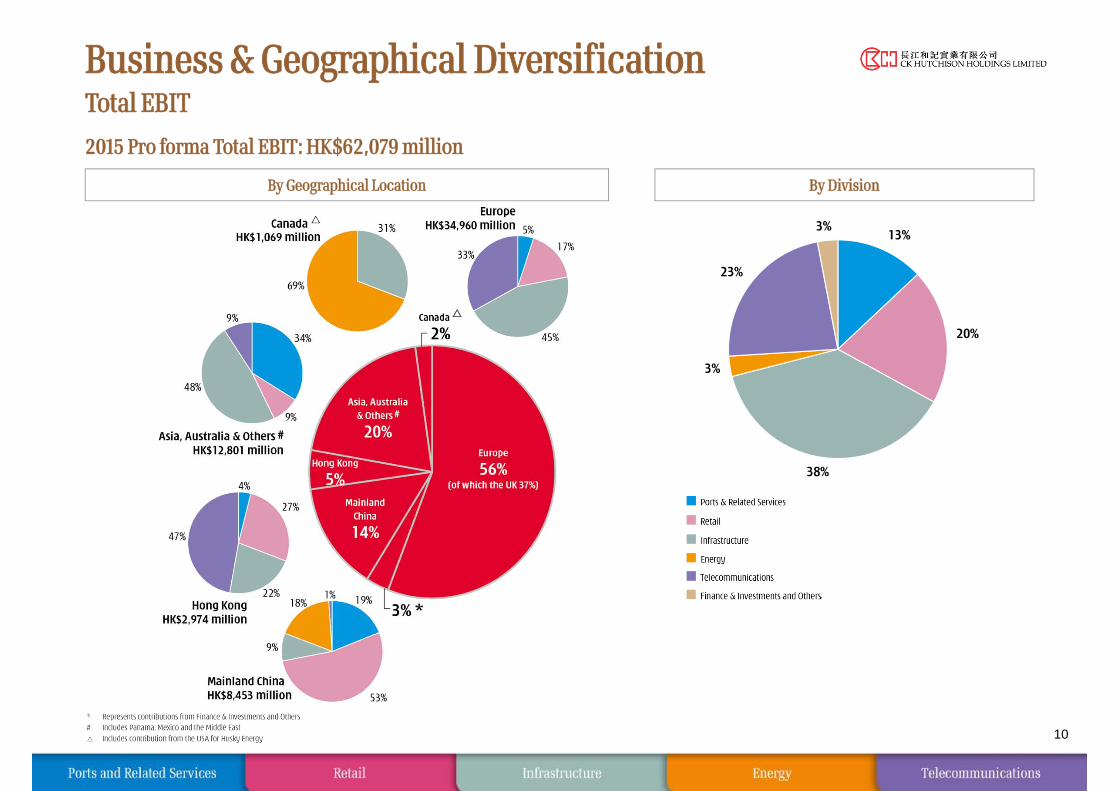
Business & Geographical Diversification Total EBIT
By Geographical Location By Division
10
2015 Pro forma Total EBIT: HK$62,079 million
13%
20%
38%
3%
23%
3%
55,313 56,028
62,079
(57)(695) (114)
(4,440)
4,772 68
2,641
(1,460)
6,051
HWLTotal EBIT
2014
Ports &RelatedServices
Retail Infrastructure Energy 3 GroupEurope
HTHKH HAT F&Iand
Others
CKHHComparable
EBIT2015
AdditionalContributions
CKHHPro formaTotal EBIT
2015
(2)
(1)
(1)
(1)
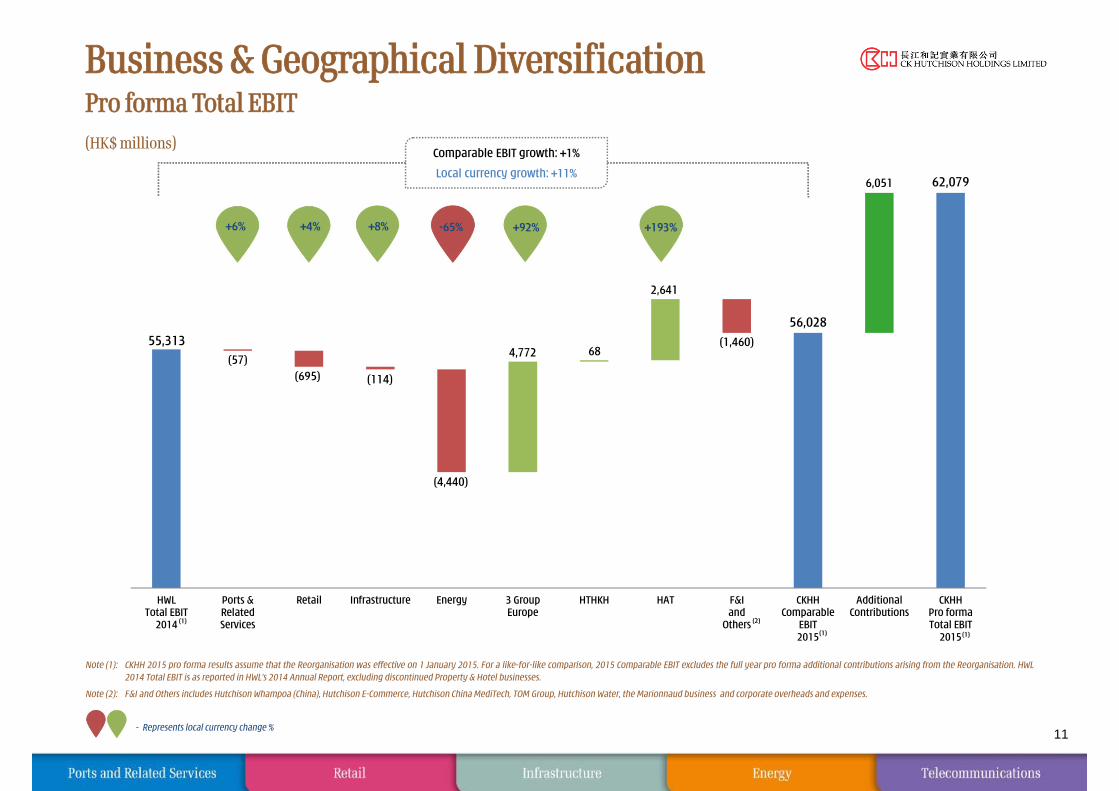
Business & Geographical Diversification Pro forma Total EBIT
11
(HK$ millions)
Note (1): CKHH 2015 pro forma results assume that the Reorganisation was effective on 1 January 2015. For a like-for-like comparison, 2015 Comparable EBIT excludes the full year pro forma additional contributions arising from the Reorganisation. HWL2014 Total EBIT is as reported in HWL’s 2014 Annual Report, excluding discontinued Property & Hotel businesses.
Note (2): F&I and Others includes Hutchison Whampoa (China), Hutchison E-Commerce, Hutchison China MediTech, TOM Group, Hutchison Water, the Marionnaud business and corporate overheads and expenses.
- Represents local currency change %
Comparable EBIT growth: +1%
Local currency growth: +11%
+6% -65%+4% +8% +92% +193%
56,028
62,079
70
5,376345
(22)
282
CKHHComparable
EBIT2015
Ports &RelatedServices
Infrastructure Energy Telcommunications Finance &Investments and Others
CKHHPro formaTotal EBIT
2015
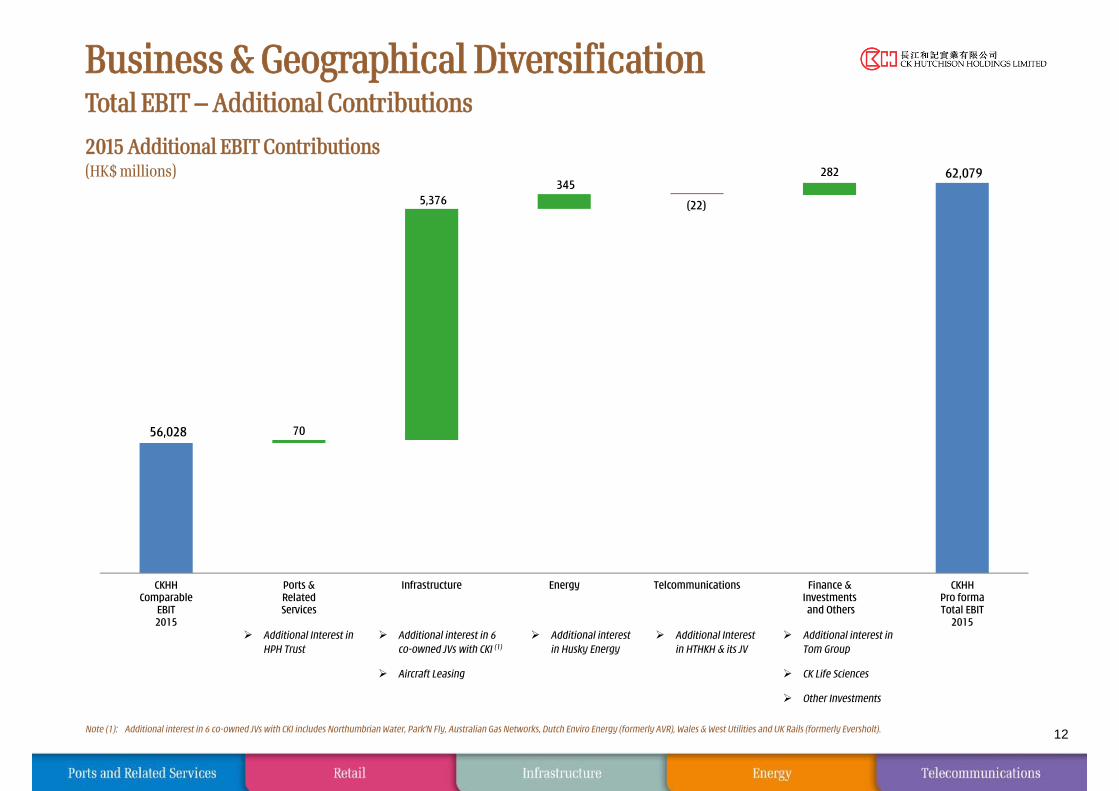
Business & Geographical Diversification Total EBIT – Additional Contributions
12
2015 Additional EBIT Contributions(HK$ millions)
Note (1): Additional interest in 6 co-owned JVs with CKI includes Northumbrian Water, Park'N Fly, Australian Gas Networks, Dutch Enviro Energy (formerly AVR), Wales & West Utilities and UK Rails (formerly Eversholt).
Additional Interest in HPH Trust
Additional interest in 6 co-owned JVs with CKI (1)
Additional interest in Husky Energy
Additional Interest in HTHKH & its JV
Additional interest in Tom Group
Aircraft Leasing CK Life Sciences
Other Investments
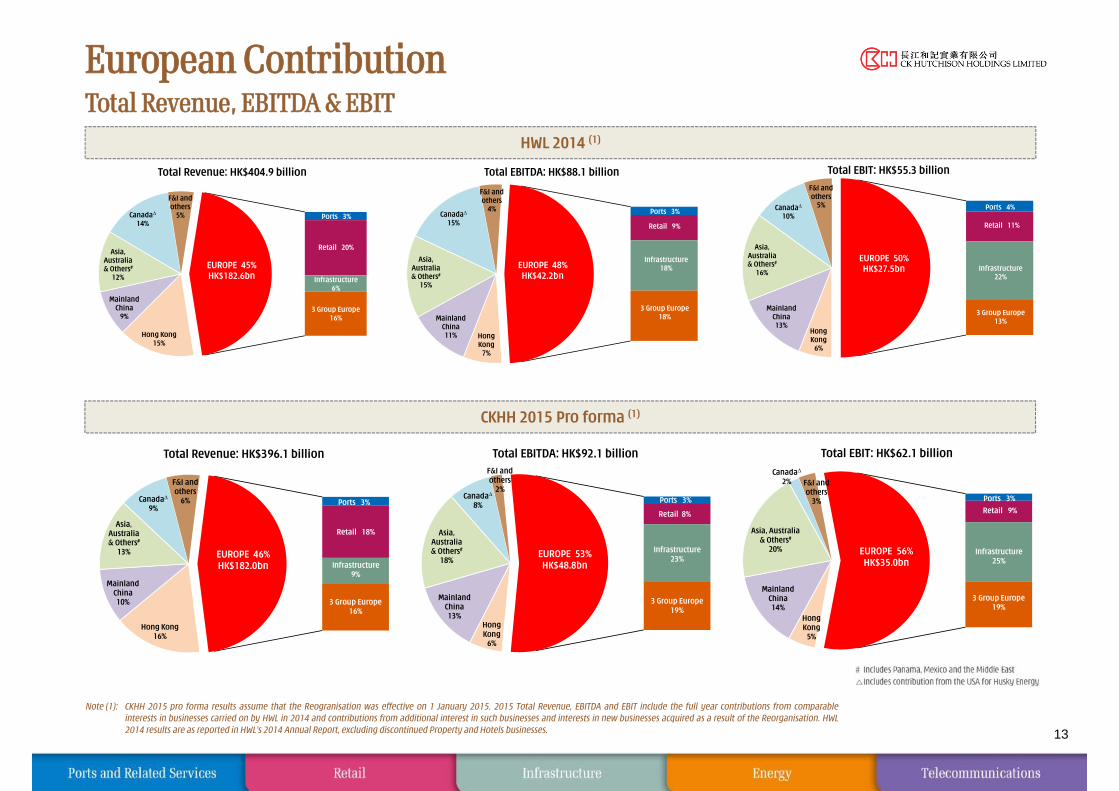
European ContributionTotal Revenue, EBITDA & EBIT
13
Note (1): CKHH 2015 pro forma results assume that the Reogranisation was effective on 1 January 2015. 2015 Total Revenue, EBITDA and EBIT include the full year contributions from comparableinterests in businesses carried on by HWL in 2014 and contributions from additional interest in such businesses and interests in new businesses acquired as a result of the Reorganisation. HWL2014 results are as reported in HWL’s 2014 Annual Report, excluding discontinued Property and Hotels businesses.
HWL 2014 (1)
CKHH 2015 Pro forma (1)
Hong Kong16%
MainlandChina10%
Asia, Australia& Others#
13%
Canada∆
9%
F&I andothers
6%
3 Group Europe16%
Infrastructure9%
Retail 18%
Ports 3%
EUROPE 46%HK$182.0bn
Total Revenue: HK$396.1 billion
HongKong
6%
MainlandChina13%
Asia, Australia& Others#
18%
Canada∆
8%
F&I andothers
2%
3 Group Europe19%
Infrastructure23%
Retail 8%
Ports 3%
EUROPE 53%HK$48.8bn
Total EBITDA: HK$92.1 billion
HongKong
5%
MainlandChina14%
Asia, Australia & Others#
20%
Canada∆
2% F&I andothers
3%
3 Group Europe19%
Infrastructure25%
Retail 9%
Ports 3%
EUROPE 56%HK$35.0bn
Total EBIT: HK$62.1 billion
Hong Kong15%
MainlandChina
9%
Asia, Australia& Others#
12%
Canada∆
14%
F&I andothers
5%
3 Group Europe16%
Infrastructure6%
Retail 20%
Ports 3%
EUROPE 45%HK$182.6bn
Total Revenue: HK$404.9 billion
HongKong
7%
MainlandChina11%
Asia, Australia& Others#
15%
Canada∆
15%
F&I andothers
4%
3 Group Europe18%
Infrastructure18%
Retail 9%
Ports 3%
EUROPE 48%HK$42.2bn
Total EBITDA: HK$88.1 billion
HongKong
6%
MainlandChina13%
Asia, Australia& Others#
16%
Canada∆
10%
F&I andothers
5%
3 Group Europe13%
Infrastructure22%
Retail 11%
Ports 4%
EUROPE 50%HK$27.5bn
Total EBIT: HK$55.3 billion
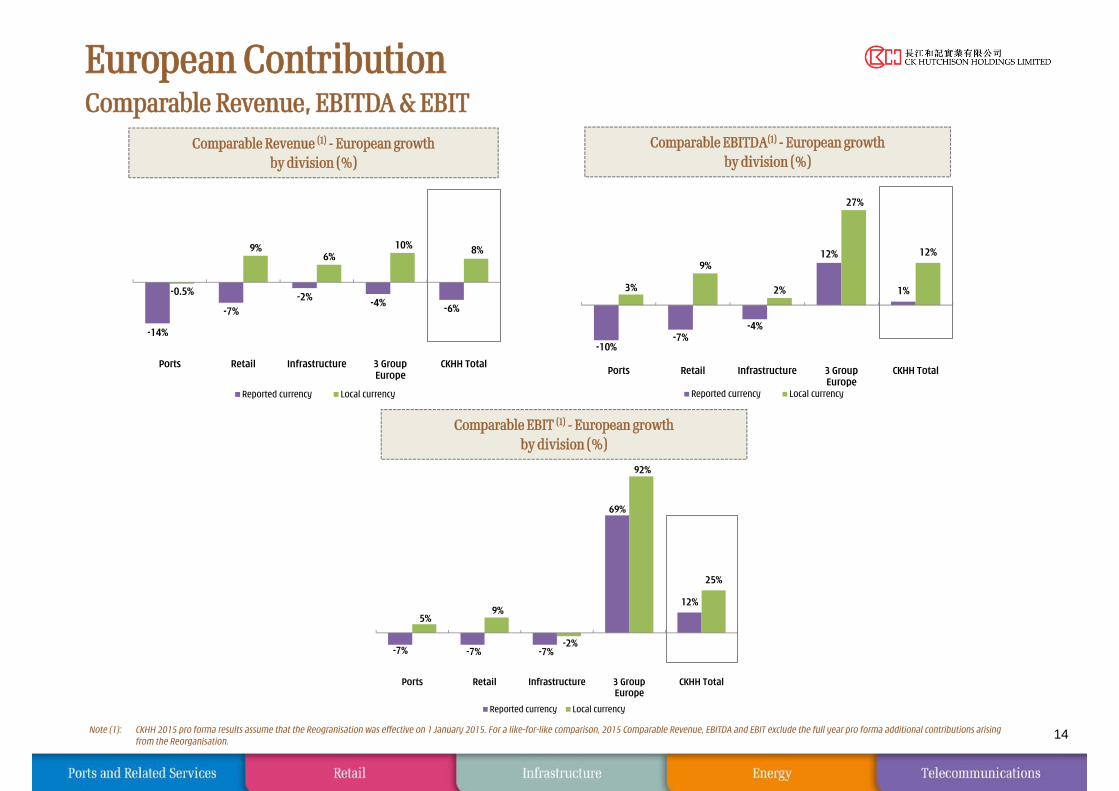
European ContributionComparable Revenue, EBITDA & EBIT
14Note (1): CKHH 2015 pro forma results assume that the Reogranisation was effective on 1 January 2015. For a like-for-like comparison, 2015 Comparable Revenue, EBITDA and EBIT exclude the full year pro forma additional contributions arisingfrom the Reorganisation.
Comparable EBITDA(1) - European growthby division (%)
Comparable Revenue (1) - European growthby division (%)
Comparable EBIT (1) - European growthby division (%)
-7% -7% -7%
69%
12%
5%9%
-2%
92%
25%
Ports Retail Infrastructure 3 GroupEurope
CKHH Total
Reported currency Local currency
-14%
-7%-2% -4% -6%
-0.5%
9%6%
10% 8%
Ports Retail Infrastructure 3 GroupEurope
CKHH Total
Reported currency Local currency
-10%-7%
-4%
12%
1%3%
9%
2%
27%
12%
Ports Retail Infrastructure 3 GroupEurope
CKHH Total
Reported currency Local currency
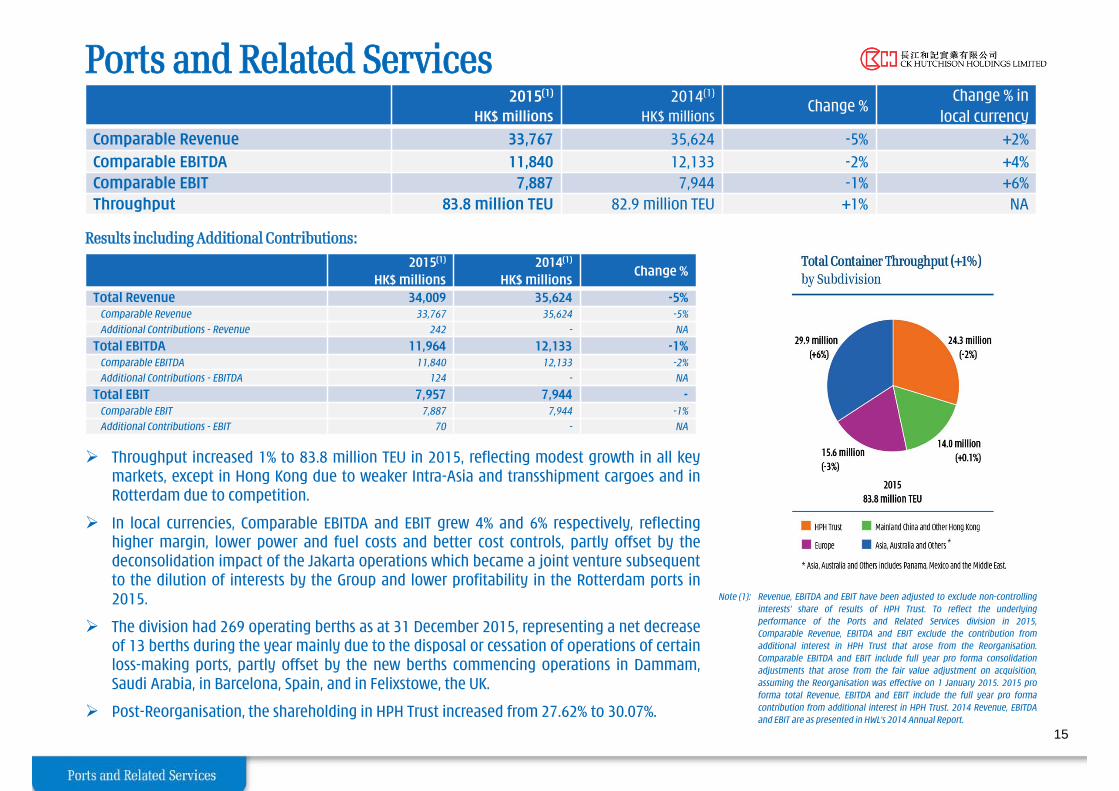
Ports and Related Services
Throughput increased 1% to 83.8 million TEU in 2015, reflecting modest growth in all keymarkets, except in Hong Kong due to weaker Intra-Asia and transshipment cargoes and inRotterdam due to competition.
In local currencies, Comparable EBITDA and EBIT grew 4% and 6% respectively, reflectinghigher margin, lower power and fuel costs and better cost controls, partly offset by thedeconsolidation impact of the Jakarta operations which became a joint venture subsequentto the dilution of interests by the Group and lower profitability in the Rotterdam ports in2015.
The division had 269 operating berths as at 31 December 2015, representing a net decreaseof 13 berths during the year mainly due to the disposal or cessation of operations of certainloss-making ports, partly offset by the new berths commencing operations in Dammam,Saudi Arabia, in Barcelona, Spain, and in Felixstowe, the UK.
Post-Reorganisation, the shareholding in HPH Trust increased from 27.62% to 30.07%.
Note (1): Revenue, EBITDA and EBIT have been adjusted to exclude non-controllinginterests’ share of results of HPH Trust. To reflect the underlyingperformance of the Ports and Related Services division in 2015,Comparable Revenue, EBITDA and EBIT exclude the contribution fromadditional interest in HPH Trust that arose from the Reorganisation.Comparable EBITDA and EBIT include full year pro forma consolidationadjustments that arose from the fair value adjustment on acquisition,assuming the Reorganisation was effective on 1 January 2015. 2015 proforma total Revenue, EBITDA and EBIT include the full year pro formacontribution from additional interest in HPH Trust. 2014 Revenue, EBITDAand EBIT are as presented in HWL’s 2014 Annual Report.
15
2015(1)
HK$ millions2014(1)
HK$ millionsChange %
Change % inlocal currency
Comparable Revenue 33,767 35,624 -5% +2%Comparable EBITDA 11,840 12,133 -2% +4%Comparable EBIT 7,887 7,944 -1% +6%Throughput 83.8 million TEU 82.9 million TEU +1% NA
Results including Additional Contributions:2015(1)
HK$ millions2014(1)
HK$ millionsChange %
Total Revenue 34,009 35,624 -5%Comparable Revenue 33,767 35,624 -5%
Additional Contributions - Revenue 242 - NA
Total EBITDA 11,964 12,133 -1%Comparable EBITDA 11,840 12,133 -2%
Additional Contributions - EBITDA 124 - NA
Total EBIT 7,957 7,944 -Comparable EBIT 7,887 7,944 -1%
Additional Contributions - EBIT 70 - NA
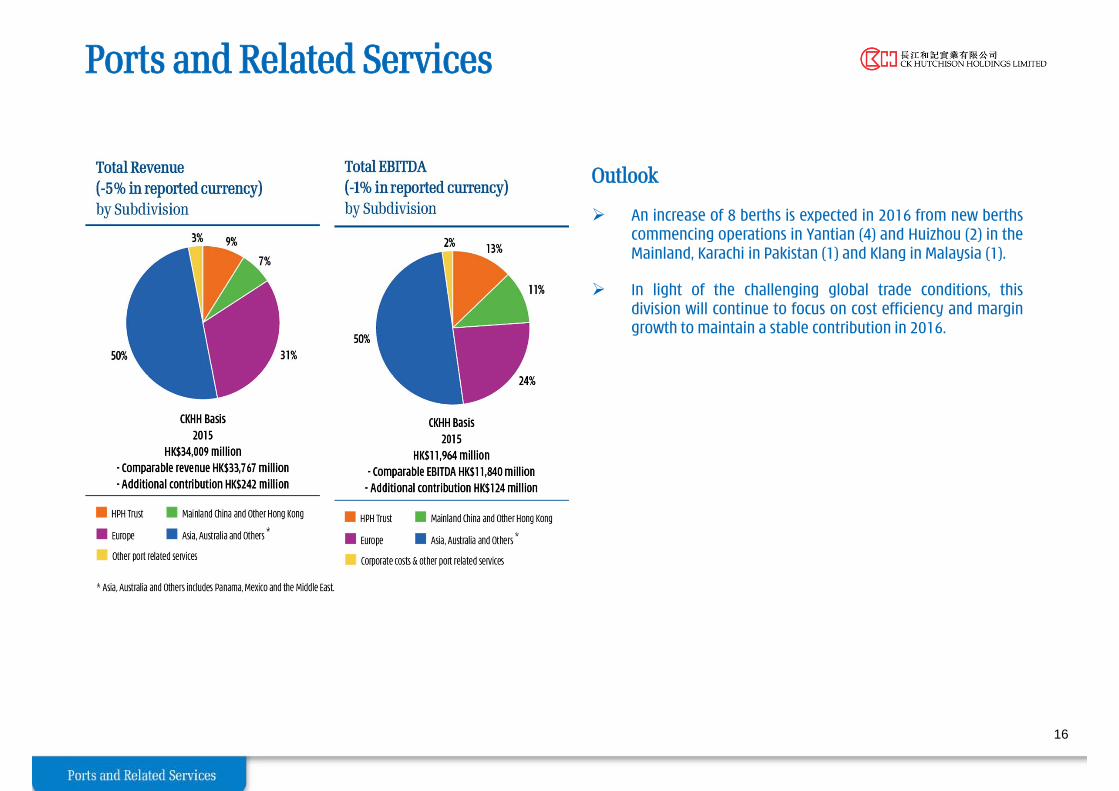
Ports and Related Services
Outlook
An increase of 8 berths is expected in 2016 from new berthscommencing operations in Yantian (4) and Huizhou (2) in theMainland, Karachi in Pakistan (1) and Klang in Malaysia (1).
In light of the challenging global trade conditions, thisdivision will continue to focus on cost efficiency and margingrowth to maintain a stable contribution in 2016.
16

Ports and Related ServicesEBITDA Growth
2015 Pro Forma Total EBITDA(1)
(HK$ millions)
17
Note (1): EBITDA has been adjusted to exclude non-controlling interests’ share of results of HPH Trust.
Note (2): CKHH pro forma results assume that the Reorganisation was effective on 1 January 2015. For a like-for-like comparison, 2015 Comparable EBITDA excludes the full year pro forma contribution from additional interest in HPH Trust that arose from the Reorganisation. HWL 2014 Total EBITDA is as presented in HWL’s 2014 Annual Report.
Note (3): Asia, Australia and others includes Panama, Mexico and the Middle East.
Comparable EBITDA change: -2%
Local currency growth: +4%
12,133
11,840
11,964
298
140
349
(64)
(818)
124
HWLTotal EBITDA
2014
HPH Trust Europe Mainland China and otherHong Kong
Asia, Australiaand others
Corporate costs& other port
related services
Foreigncurrency
translationimpact
CKHHComparable
EBITDA2015
AdditionalContribution- HPH Trust
CKHHPro forma
Total EBITDA2015
(3)
(2)
(2)(2)
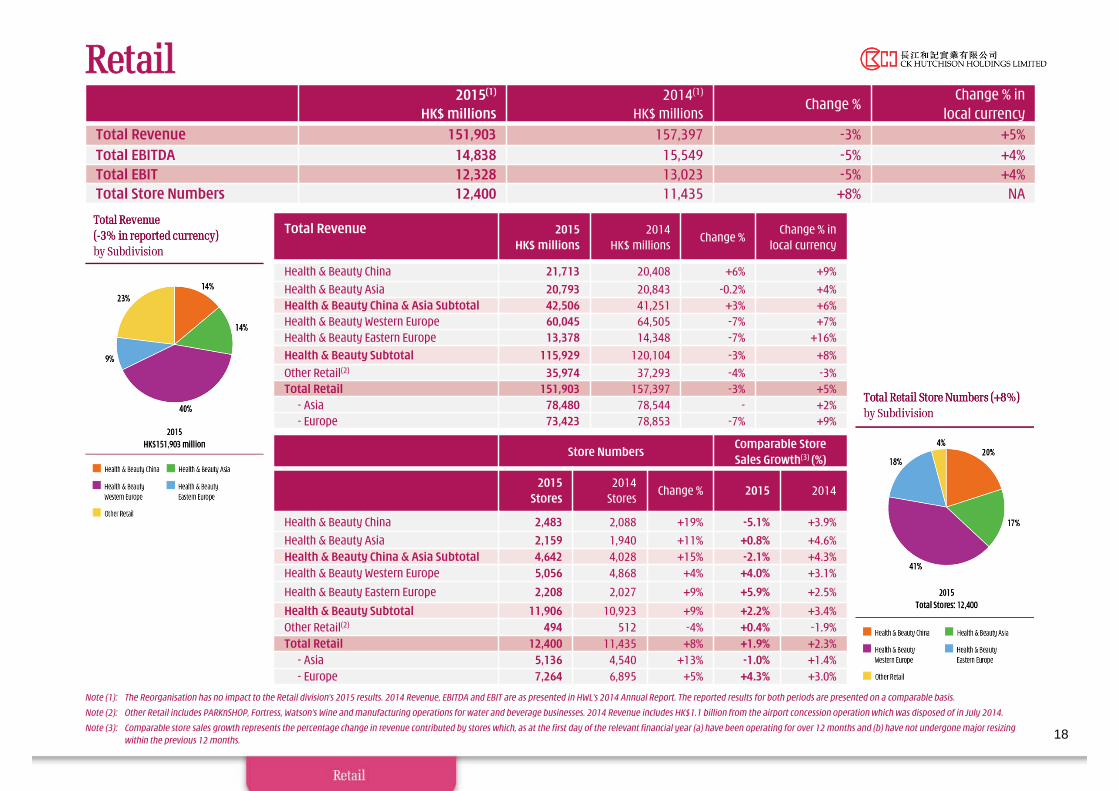
Store NumbersComparable Store Sales Growth(3) (%)
2015Stores
2014Stores
Change % 2015 2014
Health & Beauty China 2,483 2,088 +19% -5.1% +3.9%Health & Beauty Asia 2,159 1,940 +11% +0.8% +4.6%Health & Beauty China & Asia Subtotal 4,642 4,028 +15% -2.1% +4.3%Health & Beauty Western Europe 5,056 4,868 +4% +4.0% +3.1%
Health & Beauty Eastern Europe 2,208 2,027 +9% +5.9% +2.5%Health & Beauty Subtotal 11,906 10,923 +9% +2.2% +3.4%Other Retail(2) 494 512 -4% +0.4% -1.9%Total Retail 12,400 11,435 +8% +1.9% +2.3%
- Asia 5,136 4,540 +13% -1.0% +1.4%- Europe 7,264 6,895 +5% +4.3% +3.0%
Retail
Note (1): The Reorganisation has no impact to the Retail division’s 2015 results. 2014 Revenue, EBITDA and EBIT are as presented in HWL’s 2014 Annual Report. The reported results for both periods are presented on a comparable basis.
Note (2): Other Retail includes PARKnSHOP, Fortress, Watson’s Wine and manufacturing operations for water and beverage businesses. 2014 Revenue includes HK$1.1 billion from the airport concession operation which was disposed of in July 2014.
Note (3): Comparable store sales growth represents the percentage change in revenue contributed by stores which, as at the first day of the relevant financial year (a) have been operating for over 12 months and (b) have not undergone major resizing within the previous 12 months. 18
2015(1)
HK$ millions2014(1)
HK$ millionsChange %
Change % inlocal currency
Total Revenue 151,903 157,397 -3% +5%Total EBITDA 14,838 15,549 -5% +4%Total EBIT 12,328 13,023 -5% +4%Total Store Numbers 12,400 11,435 +8% NA
Total Revenue 2015HK$ millions
2014HK$ millions
Change %Change % in
local currency
Health & Beauty China 21,713 20,408 +6% +9%Health & Beauty Asia 20,793 20,843 -0.2% +4%Health & Beauty China & Asia Subtotal 42,506 41,251 +3% +6%Health & Beauty Western Europe 60,045 64,505 -7% +7%Health & Beauty Eastern Europe 13,378 14,348 -7% +16%Health & Beauty Subtotal 115,929 120,104 -3% +8%Other Retail(2) 35,974 37,293 -4% -3%Total Retail 151,903 157,397 -3% +5%
- Asia 78,480 78,544 - +2%- Europe 73,423 78,853 -7% +9%
Retail EBITDA by segment
EBITDA 2015
HK$ millions
EBITDAMargin %
2014HK$
millions
EBITDAMargin %
Change %Change %
in local currency
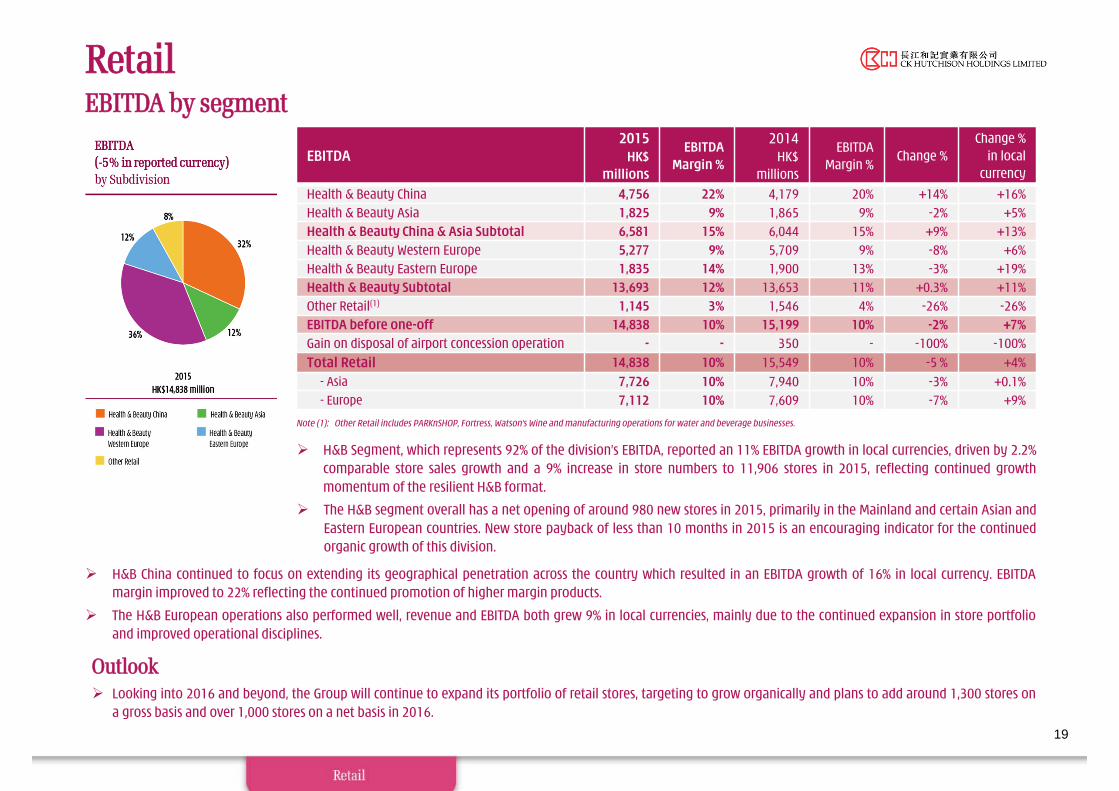
Health & Beauty China 4,756 22% 4,179 20% +14% +16%Health & Beauty Asia 1,825 9% 1,865 9% -2% +5%Health & Beauty China & Asia Subtotal 6,581 15% 6,044 15% +9% +13%Health & Beauty Western Europe 5,277 9% 5,709 9% -8% +6%Health & Beauty Eastern Europe 1,835 14% 1,900 13% -3% +19%Health & Beauty Subtotal 13,693 12% 13,653 11% +0.3% +11%Other Retail(1) 1,145 3% 1,546 4% -26% -26%EBITDA before one-off 14,838 10% 15,199 10% -2% +7%Gain on disposal of airport concession operation - - 350 - -100% -100%Total Retail 14,838 10% 15,549 10% -5 % +4%
- Asia 7,726 10% 7,940 10% -3% +0.1%- Europe 7,112 10% 7,609 10% -7% +9%
H&B China continued to focus on extending its geographical penetration across the country which resulted in an EBITDA growth of 16% in local currency. EBITDAmargin improved to 22% reflecting the continued promotion of higher margin products.
The H&B European operations also performed well, revenue and EBITDA both grew 9% in local currencies, mainly due to the continued expansion in store portfolioand improved operational disciplines.
Outlook Looking into 2016 and beyond, the Group will continue to expand its portfolio of retail stores, targeting to grow organically and plans to add around 1,300 stores on
a gross basis and over 1,000 stores on a net basis in 2016.
Note (1): Other Retail includes PARKnSHOP, Fortress, Watson’s Wine and manufacturing operations for water and beverage businesses.
19
H&B Segment, which represents 92% of the division’s EBITDA, reported an 11% EBITDA growth in local currencies, driven by 2.2%comparable store sales growth and a 9% increase in store numbers to 11,906 stores in 2015, reflecting continued growthmomentum of the resilient H&B format.
The H&B segment overall has a net opening of around 980 new stores in 2015, primarily in the Mainland and certain Asian andEastern European countries. New store payback of less than 10 months in 2015 is an encouraging indicator for the continuedorganic growth of this division.
Retail EBITDA Growth
2015 Total EBITDA(HK$ millions)
Note (1): Exclude gain on disposal of airport concession operation in July 2014 of HK$350 million.
Note (2): The Reorganisation has no impact to the Retail division’s 2015 results. 2014 Total EBITDA is as presented in HWL’s 2014 Annual Report.
Note (3): Other Retail includes PARKnSHOP, Fortress, Watson’s Wine and manufacturing operations for water and beverage businesses.
20
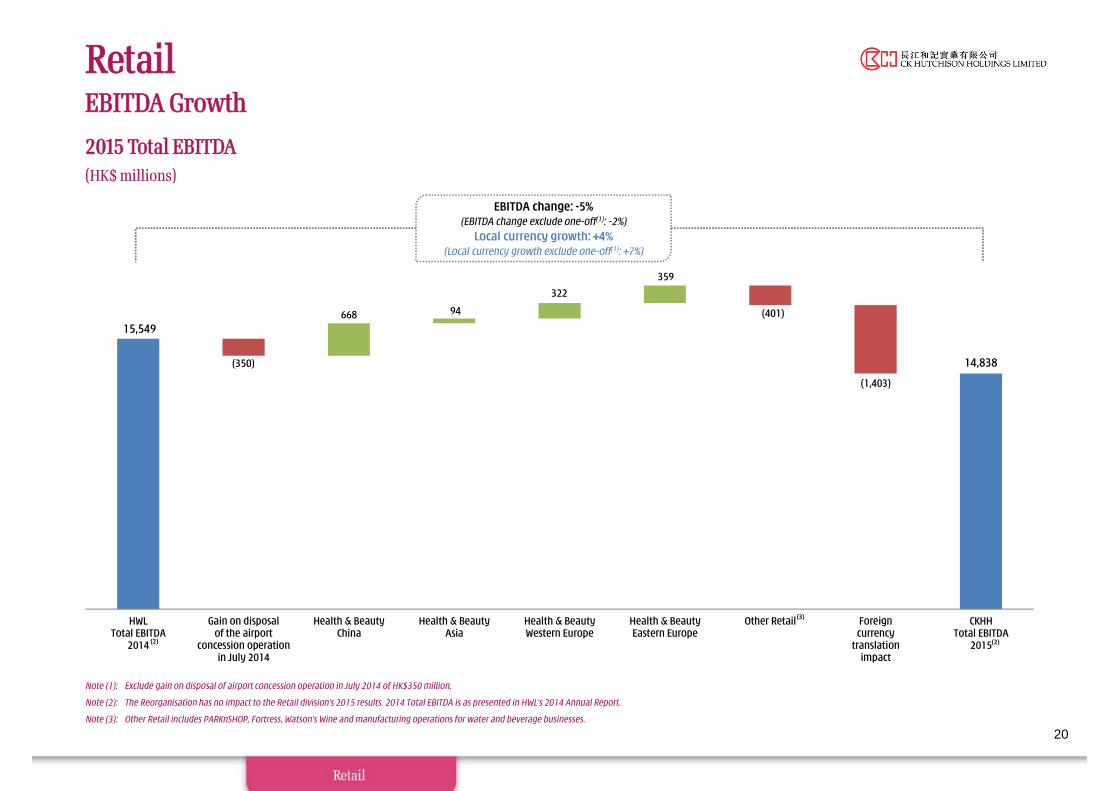
EBITDA change: -5%(EBITDA change exclude one-off(1): -2%)
Local currency growth: +4%(Local currency growth exclude one-off(1): +7%)
15,549
14,838 (350)
668 94
322
359
(401)
(1,403)
HWLTotal EBITDA
2014
Gain on disposalof the airport
concession operationin July 2014
Health & BeautyChina
Health & BeautyAsia
Health & BeautyWestern Europe
Health & BeautyEastern Europe
Other Retail Foreigncurrency
translationimpact
CKHHTotal EBITDA
2015
(3)
(2) (2)
Infrastructure
21
2015(1)
HK$ millions2014(1)
HK$ millionsChange %
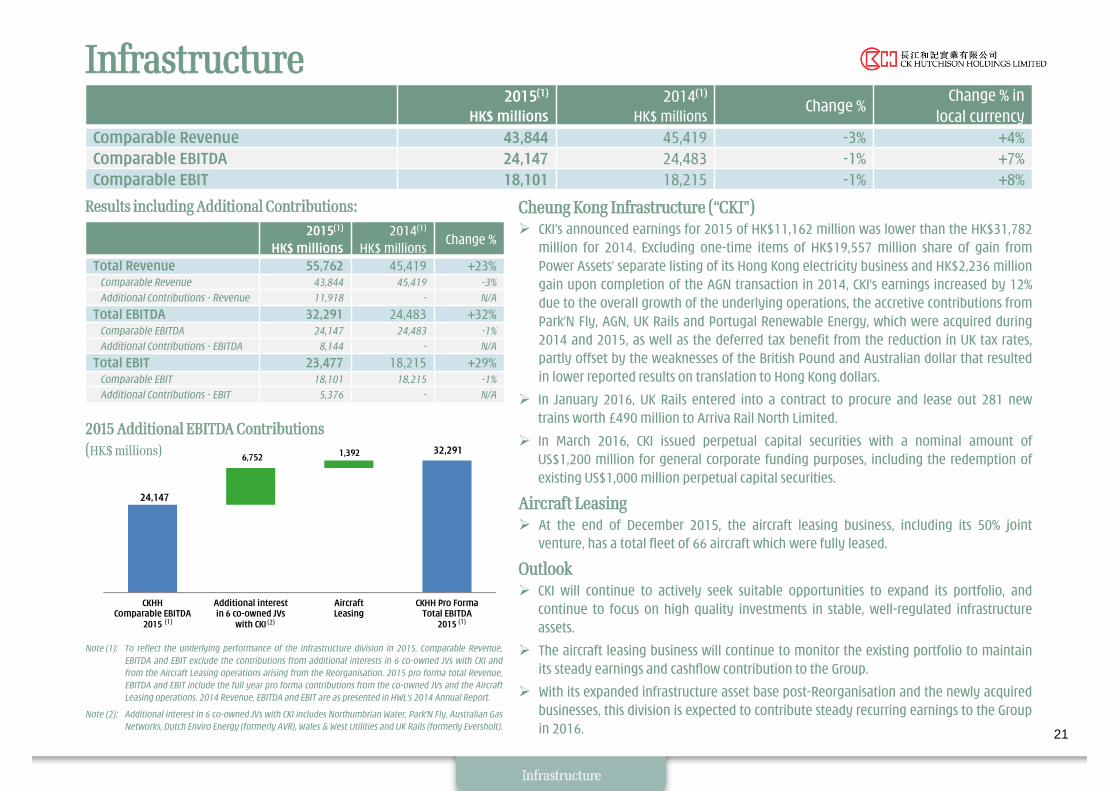
Total Revenue 55,762 45,419 +23%Comparable Revenue 43,844 45,419 -3%
Additional Contributions - Revenue 11,918 - N/A
Total EBITDA 32,291 24,483 +32%Comparable EBITDA 24,147 24,483 -1%
Additional Contributions - EBITDA 8,144 - N/A
Total EBIT 23,477 18,215 +29%Comparable EBIT 18,101 18,215 -1%
Additional Contributions - EBIT 5,376 - N/A
Results including Additional Contributions:
Note (1): To reflect the underlying performance of the Infrastructure division in 2015, Comparable Revenue,EBITDA and EBIT exclude the contributions from additional interests in 6 co-owned JVs with CKI andfrom the Aircraft Leasing operations arising from the Reorganisation. 2015 pro forma total Revenue,EBITDA and EBIT include the full year pro forma contributions from the co-owned JVs and the AircraftLeasing operations. 2014 Revenue, EBITDA and EBIT are as presented in HWL’s 2014 Annual Report.
Note (2): Additional interest in 6 co-owned JVs with CKI includes Northumbrian Water, Park'N Fly, Australian GasNetworks, Dutch Enviro Energy (formerly AVR), Wales & West Utilities and UK Rails (formerly Eversholt).
2015 Additional EBITDA Contributions(HK$ millions)
Cheung Kong Infrastructure (“CKI”) CKI’s announced earnings for 2015 of HK$11,162 million was lower than the HK$31,782
million for 2014. Excluding one-time items of HK$19,557 million share of gain fromPower Assets’ separate listing of its Hong Kong electricity business and HK$2,236 milliongain upon completion of the AGN transaction in 2014, CKI’s earnings increased by 12%due to the overall growth of the underlying operations, the accretive contributions fromPark’N Fly, AGN, UK Rails and Portugal Renewable Energy, which were acquired during2014 and 2015, as well as the deferred tax benefit from the reduction in UK tax rates,partly offset by the weaknesses of the British Pound and Australian dollar that resultedin lower reported results on translation to Hong Kong dollars.
In January 2016, UK Rails entered into a contract to procure and lease out 281 newtrains worth £490 million to Arriva Rail North Limited.
In March 2016, CKI issued perpetual capital securities with a nominal amount ofUS$1,200 million for general corporate funding purposes, including the redemption ofexisting US$1,000 million perpetual capital securities.
Aircraft Leasing At the end of December 2015, the aircraft leasing business, including its 50% joint
venture, has a total fleet of 66 aircraft which were fully leased.
Outlook CKI will continue to actively seek suitable opportunities to expand its portfolio, and
continue to focus on high quality investments in stable, well-regulated infrastructureassets.
The aircraft leasing business will continue to monitor the existing portfolio to maintainits steady earnings and cashflow contribution to the Group.
With its expanded infrastructure asset base post-Reorganisation and the newly acquiredbusinesses, this division is expected to contribute steady recurring earnings to the Groupin 2016.
2015(1)
HK$ millions2014(1)
HK$ millionsChange %
Change % in local currency
Comparable Revenue 43,844 45,419 -3% +4%Comparable EBITDA 24,147 24,483 -1% +7%Comparable EBIT 18,101 18,215 -1% +8%
24,147
32,291 6,752 1,392
CKHHComparable EBITDA
2015
Additional interestin 6 co-owned JVs
with CKI
AircraftLeasing
CKHH Pro FormaTotal EBITDA
2015(1) (1)(2)

Energy
22
Note (1): To reflect the underlying performance of the Energy division in 2015, Comparable Revenue, EBITDA and EBIT exclude thecontribution from additional interest in Husky Energy arising from the Reorganisation but includes the full year pro formaadjustment of the depletion, depreciation and amortisation impact arising from the fair value adjustment on acquisition,assuming the Reorganisation was effective on 1 January 2015. 2015 pro forma total Revenue, EBITDA and EBIT include the fullyear pro forma contribution from additional interest in Husky Energy. 2014 Revenue, EBITDA and EBIT are as presented in HWL’s2014 Annual Report.
Average Benchmark
2015(1)
HK$ millions2014(1)
HK$ millionsChange %
Total Revenue 40,029 57,368 -30%Comparable Revenue 33,824 57,368 -41%
Additional Contributions - Revenue 6,205 - N/A
Total EBITDA 9,375 14,410 -35%Comparable EBITDA 7,922 14,410 -45%
Additional Contributions - EBITDA 1,453 - N/A
Total EBIT 2,229 6,324 -65%Comparable EBIT 1,884 6,324 -70%
Additional Contributions - EBIT 345 - N/A
Results including Additional Contributions:
4.94
4.67
4.06 4.00
2.98
2.64 2.77 2.27
20.32 19.27 18.86 16.09
19.33
21.70 20.45 13.58
108.22 109.61
101.85
76.27
53.97
61.92
50.26
43.69
10.00
30.00
50.00
70.00
90.00
110.00
2.00
2.50
3.00
3.50
4.00
4.50
5.00
5.50
6.00
2014Q1
2014Q2
2014Q3
2014Q4
2015Q1
2015Q2
2015Q3
2015Q4
US$/bblUS$/mmbtu
NYMEX natural gas (US$/mmbtu) New York Harbour 3:2:1 crack spread (US$/bbl) Brent Crude Oil (US$/bbl)
Husky Energy’s announced net earnings, before impairment charge and asset writedowns, of C$165 million in 2015, a 92% decline when compared to 2014 due to adepressed oil price environment.
In light of the prolonged low oil price levels, Husky Energy has recognised an after-taxproperty, plant and equipment impairment charges, goodwill impairment charges,exploration and evaluation asset write-downs and inventory write-downs of C$4,015million on its crude oil and natural gas assets located in Western Canada in the secondhalf of 2015. As part of the Reorganisation, the Group had to rebase Husky Energy’sassets to their fair values on the date of completion of the Reorganisation.Consequently, a lower valuation was assigned to these Western Canadian assets forthe Group’s financial statements, consistent with prevailing conditions in the relevantenergy markets. As a result, the impairment charge and write downs of these assetsby Husky Energy had no impact on the Group’s reported results.
On a full year pro forma basis, the Group’s share of comparable EBITDA and EBIT,including consolidation adjustments, decreased by 37% and 65% respectively in localcurrency, as the average realised crude oil and North American natural gas priceswere negatively impacted by the prolonged weak market benchmarks. On a full yearpro forma basis, the adverse EBITDA variances were partly offset by lower depletion,depreciation and amortisation charges resulting from the rebasing of depreciableenergy assets under the Reorganisation.
Post-Reorganisation, the shareholding in Husky Energy increased from 33.96% tocurrently 40.18%.
2015(1)
HK$ millions2014(1)
HK$ millionsChange %
Change % in local currency
Comparable Revenue 33,824 57,368 -41% -32%Comparable EBITDA 7,922 14,410 -45% -37%Comparable EBIT 1,884 6,324 -70% -65%Production 345.7 mboe/day 340.1 mboe/day +2% NA
Energy
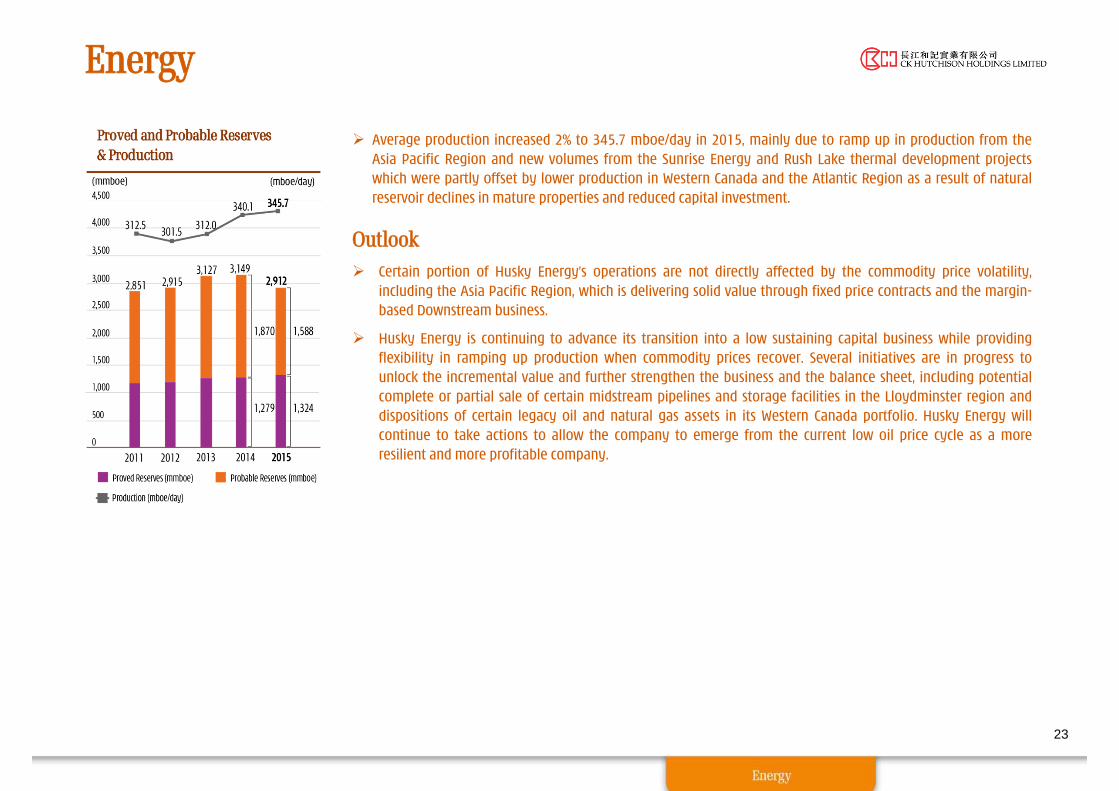
Average production increased 2% to 345.7 mboe/day in 2015, mainly due to ramp up in production from theAsia Pacific Region and new volumes from the Sunrise Energy and Rush Lake thermal development projectswhich were partly offset by lower production in Western Canada and the Atlantic Region as a result of naturalreservoir declines in mature properties and reduced capital investment.
Outlook Certain portion of Husky Energy’s operations are not directly affected by the commodity price volatility,
including the Asia Pacific Region, which is delivering solid value through fixed price contracts and the margin-based Downstream business.
Husky Energy is continuing to advance its transition into a low sustaining capital business while providingflexibility in ramping up production when commodity prices recover. Several initiatives are in progress tounlock the incremental value and further strengthen the business and the balance sheet, including potentialcomplete or partial sale of certain midstream pipelines and storage facilities in the Lloydminster region anddispositions of certain legacy oil and natural gas assets in its Western Canada portfolio. Husky Energy willcontinue to take actions to allow the company to emerge from the current low oil price cycle as a moreresilient and more profitable company.
23
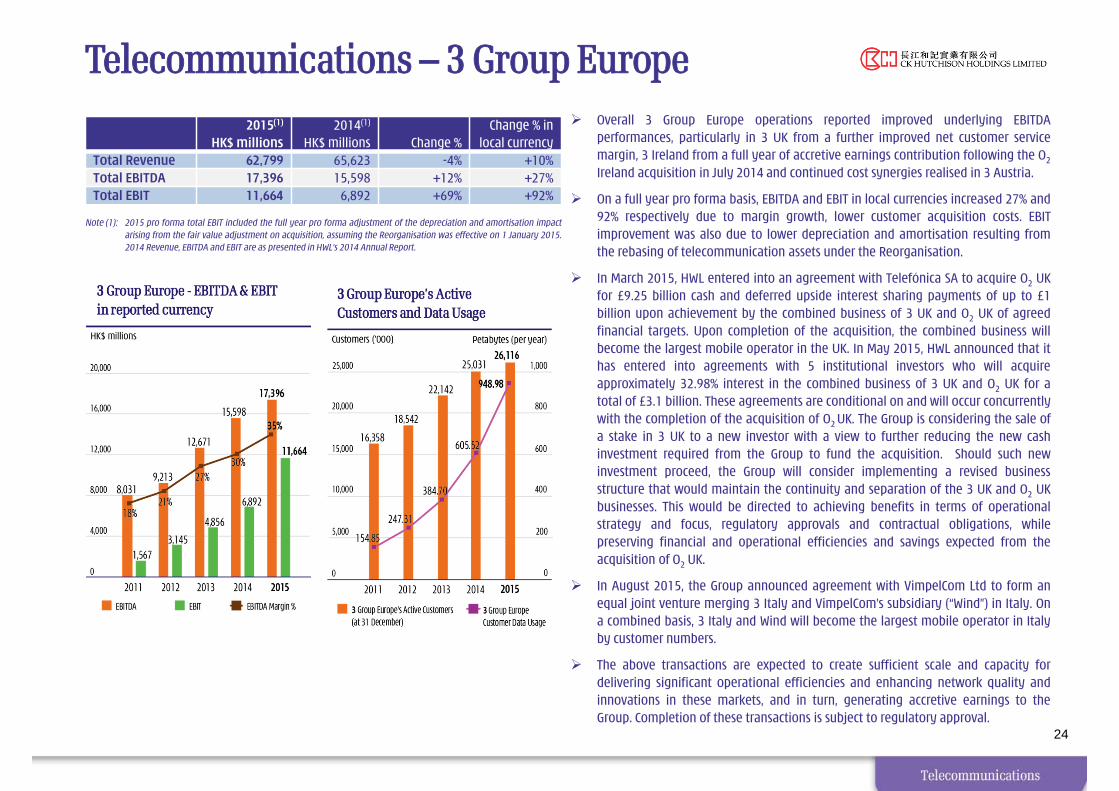
Telecommunications – 3 Group Europe Overall 3 Group Europe operations reported improved underlying EBITDA
performances, particularly in 3 UK from a further improved net customer servicemargin, 3 Ireland from a full year of accretive earnings contribution following the O2
Ireland acquisition in July 2014 and continued cost synergies realised in 3 Austria.
On a full year pro forma basis, EBITDA and EBIT in local currencies increased 27% and92% respectively due to margin growth, lower customer acquisition costs. EBITimprovement was also due to lower depreciation and amortisation resulting fromthe rebasing of telecommunication assets under the Reorganisation.
In March 2015, HWL entered into an agreement with Telefónica SA to acquire O2 UKfor £9.25 billion cash and deferred upside interest sharing payments of up to £1billion upon achievement by the combined business of 3 UK and O2 UK of agreedfinancial targets. Upon completion of the acquisition, the combined business willbecome the largest mobile operator in the UK. In May 2015, HWL announced that ithas entered into agreements with 5 institutional investors who will acquireapproximately 32.98% interest in the combined business of 3 UK and O2 UK for atotal of £3.1 billion. These agreements are conditional on and will occur concurrentlywith the completion of the acquisition of O2 UK. The Group is considering the sale ofa stake in 3 UK to a new investor with a view to further reducing the new cashinvestment required from the Group to fund the acquisition. Should such newinvestment proceed, the Group will consider implementing a revised businessstructure that would maintain the continuity and separation of the 3 UK and O2 UKbusinesses. This would be directed to achieving benefits in terms of operationalstrategy and focus, regulatory approvals and contractual obligations, whilepreserving financial and operational efficiencies and savings expected from theacquisition of O2 UK.
In August 2015, the Group announced agreement with VimpelCom Ltd to form anequal joint venture merging 3 Italy and VimpelCom’s subsidiary (“Wind”) in Italy. Ona combined basis, 3 Italy and Wind will become the largest mobile operator in Italyby customer numbers.
The above transactions are expected to create sufficient scale and capacity fordelivering significant operational efficiencies and enhancing network quality andinnovations in these markets, and in turn, generating accretive earnings to theGroup. Completion of these transactions is subject to regulatory approval.
24
2015(1)
HK$ millions2014(1)
HK$ millions Change %Change % in
local currencyTotal Revenue 62,799 65,623 -4% +10%Total EBITDA 17,396 15,598 +12% +27%Total EBIT 11,664 6,892 +69% +92%
Note (1): 2015 pro forma total EBIT included the full year pro forma adjustment of the depreciation and amortisation impactarising from the fair value adjustment on acquisition, assuming the Reorganisation was effective on 1 January 2015.2014 Revenue, EBITDA and EBIT are as presented in HWL’s 2014 Annual Report.
Telecommunications – 3 Group EuropeEBITDA Growth
25
Note (1): HWL 2014 Total EBITDA is as presented in HWL’s 2014 Annual Report.
2015 Total EBITDA(HK$ millions)
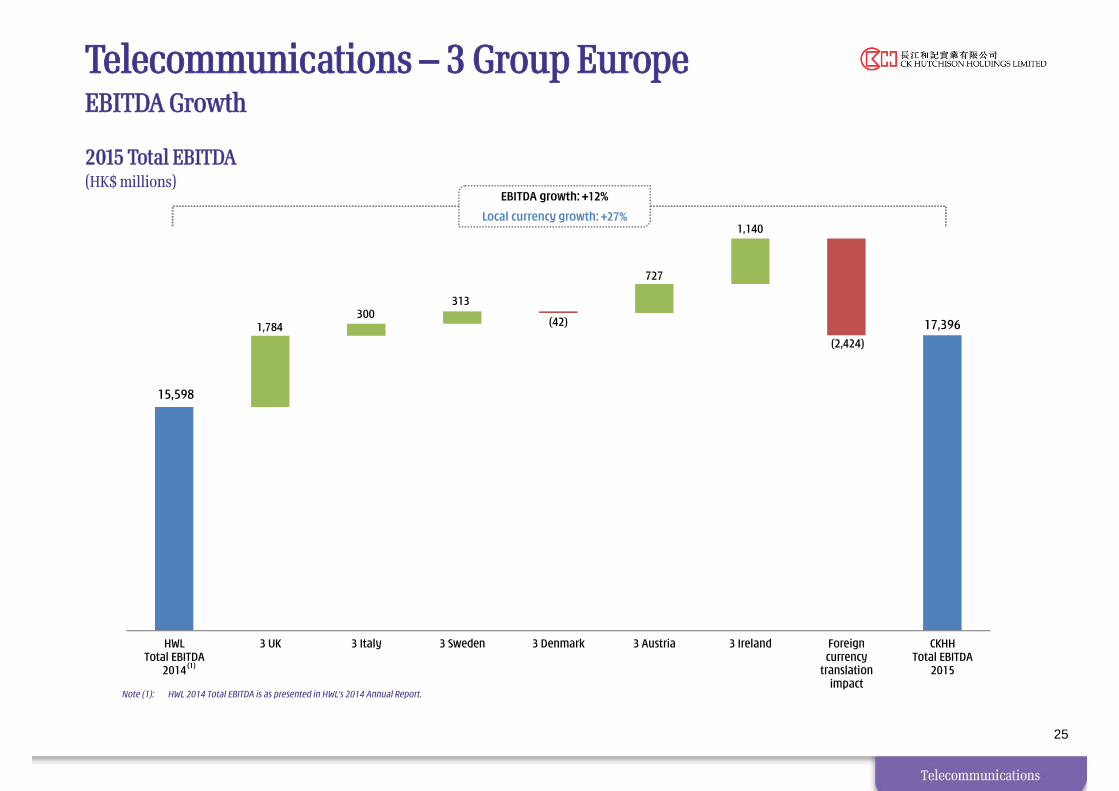
EBITDA growth: +12%
Local currency growth: +27%
15,598
17,396 1,784 300
313
(42)
727
1,140
(2,424)
HWLTotal EBITDA
2014
3 UK 3 Italy 3 Sweden 3 Denmark 3 Austria 3 Ireland Foreigncurrency
translationimpact
CKHHTotal EBITDA
2015(1)
Telecommunications – 3 Group EuropeResults by operations
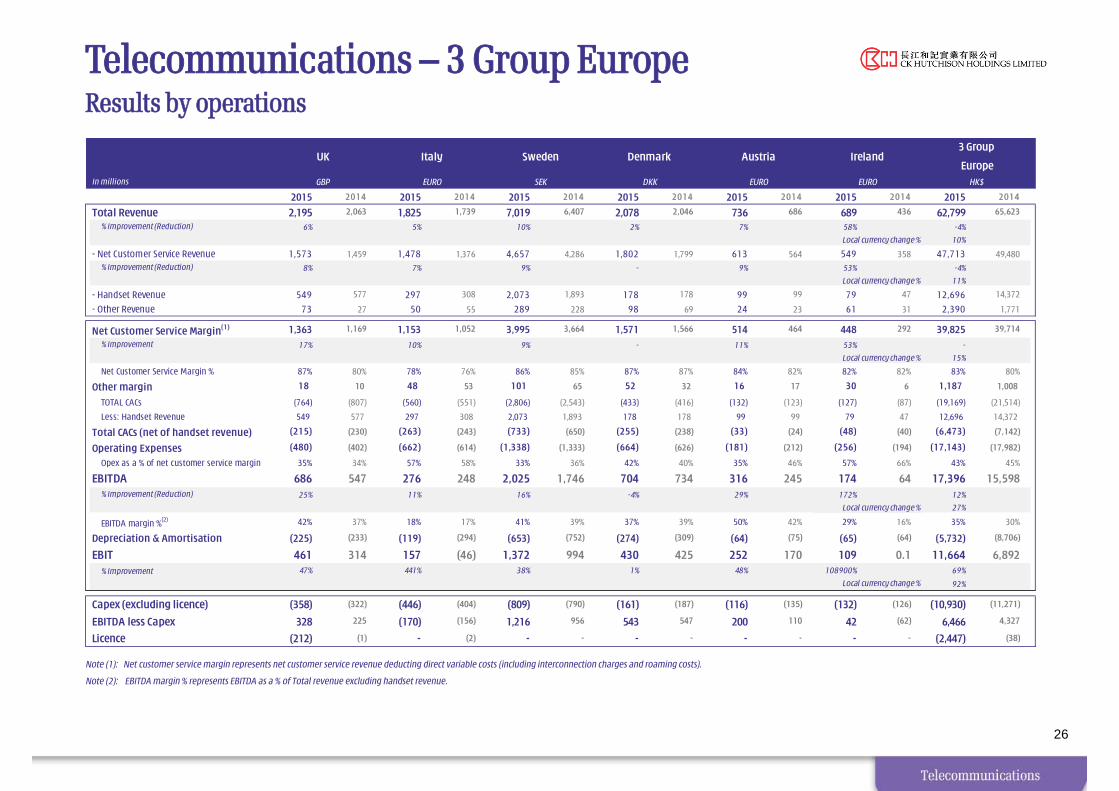
Note (1): Net customer service margin represents net customer service revenue deducting direct variable costs (including interconnection charges and roaming costs).
Note (2): EBITDA margin % represents EBITDA as a % of Total revenue excluding handset revenue.
26
In millions
2015 2014 2015 2014 2015 2014 2015 2014 2015 2014 2015 2014 2015 2014
Total Revenue 2,195 2,063 1,825 1,739 7,019 6,407 2,078 2,046 736 686 689 436 62,799 65,623
% Improvement (Reduction) 6% 5% 10% 2% 7% 58% -4%
10%
- Net Customer Service Revenue 1,573 1,459 1,478 1,376 4,657 4,286 1,802 1,799 613 564 549 358 47,713 49,480 % Improvement (Reduction) 8% 7% 9% - 9% 53% -4%
11%
- Handset Revenue 549 577 297 308 2,073 1,893 178 178 99 99 79 47 12,696 14,372
- Other Revenue 73 27 50 55 289 228 98 69 24 23 61 31 2,390 1,771
Net Customer Service Margin(1) 1,363 1,169 1,153 1,052 3,995 3,664 1,571 1,566 514 464 448 292 39,825 39,714
% Improvement 17% 10% 9% - 11% 53% -
15%
Net Customer Service Margin % 87% 80% 78% 76% 86% 85% 87% 87% 84% 82% 82% 82% 83% 80%
Other margin 18 10 48 53 101 65 52 32 16 17 30 6 1,187 1,008
TOTAL CACs (764) (807) (560) (551) (2,806) (2,543) (433) (416) (132) (123) (127) (87) (19,169) (21,514)
Less: Handset Revenue 549 577 297 308 2,073 1,893 178 178 99 99 79 47 12,696 14,372
Total CACs (net of handset revenue) (215) (230) (263) (243) (733) (650) (255) (238) (33) (24) (48) (40) (6,473) (7,142)
Operating Expenses (480) (402) (662) (614) (1,338) (1,333) (664) (626) (181) (212) (256) (194) (17,143) (17,982)
Opex as a % of net customer service margin 35% 34% 57% 58% 33% 36% 42% 40% 35% 46% 57% 66% 43% 45%
EBITDA 686 547 276 248 2,025 1,746 704 734 316 245 174 64 17,396 15,598 % Improvement (Reduction) 25% 11% 16% -4% 29% 172% 12%
27%
EBITDA margin %(2) 42% 37% 18% 17% 41% 39% 37% 39% 50% 42% 29% 16% 35% 30%
Depreciation & Amortisation (225) (233) (119) (294) (653) (752) (274) (309) (64) (75) (65) (64) (5,732) (8,706)
EBIT 461 314 157 (46) 1,372 994 430 425 252 170 109 0.1 11,664 6,892 % Improvement 47% 441% 38% 1% 48% 108900% 69%
92%
Capex (excluding licence) (358) (322) (446) (404) (809) (790) (161) (187) (116) (135) (132) (126) (10,930) (11,271)
EBITDA less Capex 328 225 (170) (156) 1,216 956 543 547 200 110 42 (62) 6,466 4,327
Licence (212) (1) - (2) - - - - - - - - (2,447) (38)
Local currency change %
Local currency change %
Local currency change %
Local currency change %
3 Group
EuropeEURO HK$
Ireland
Local currency change %
GBP EURO SEK DKK EURO
UK Italy Sweden Denmark Austria
Telecommunications – 3 Group EuropeKey Business Indicators
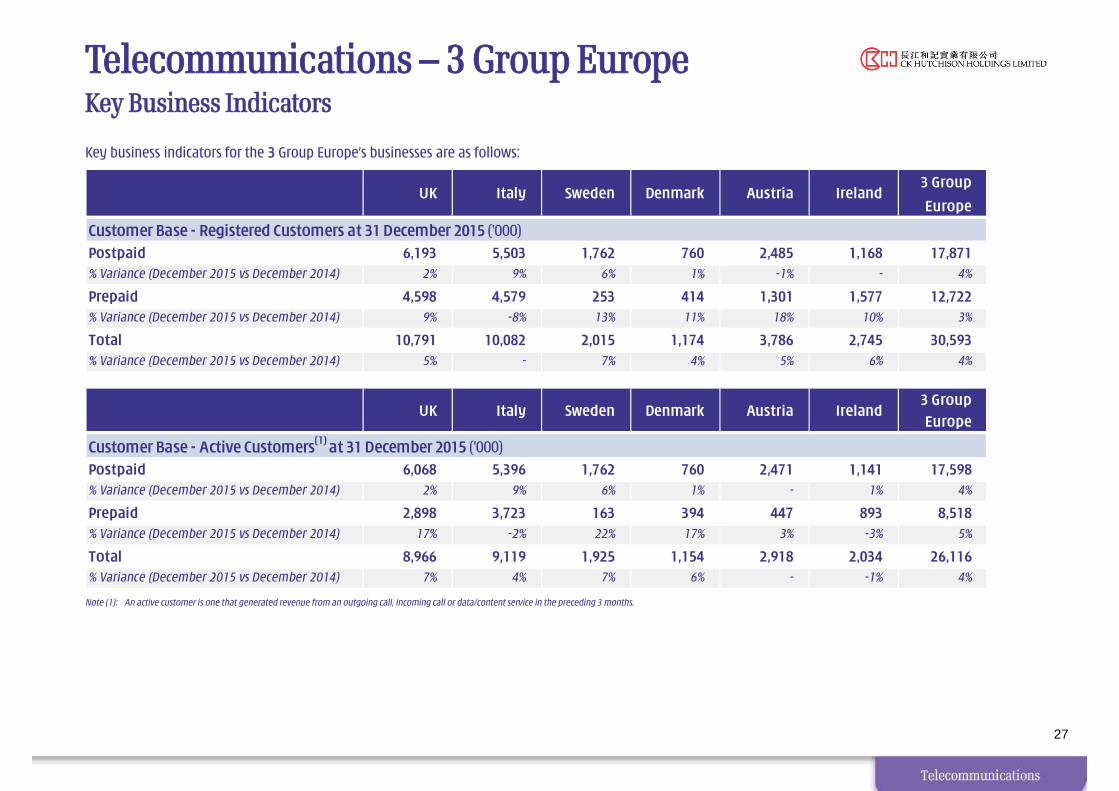
Key business indicators for the 3 Group Europe’s businesses are as follows:
Note (1): An active customer is one that generated revenue from an outgoing call, incoming call or data/content service in the preceding 3 months.
27
3 Group
Europe
Postpaid 6,193 5,503 1,762 760 2,485 1,168 17,871% Variance (December 2015 vs December 2014) 2% 9% 6% 1% -1% - 4%
Prepaid 4,598 4,579 253 414 1,301 1,577 12,722% Variance (December 2015 vs December 2014) 9% -8% 13% 11% 18% 10% 3%
Total 10,791 10,082 2,015 1,174 3,786 2,745 30,593% Variance (December 2015 vs December 2014) 5% - 7% 4% 5% 6% 4%
UK Italy Sweden Denmark Austria Ireland3 Group
Europe
Postpaid 6,068 5,396 1,762 760 2,471 1,141 17,598% Variance (December 2015 vs December 2014) 2% 9% 6% 1% - 1% 4%
Prepaid 2,898 3,723 163 394 447 893 8,518% Variance (December 2015 vs December 2014) 17% -2% 22% 17% 3% -3% 5%
Total 8,966 9,119 1,925 1,154 2,918 2,034 26,116% Variance (December 2015 vs December 2014) 7% 4% 7% 6% - -1% 4%
Ireland
Customer Base - Registered Customers at 31 December 2015 ('000)
Customer Base - Active Customers(1) at 31 December 2015 ('000)
UK Italy Sweden Denmark Austria
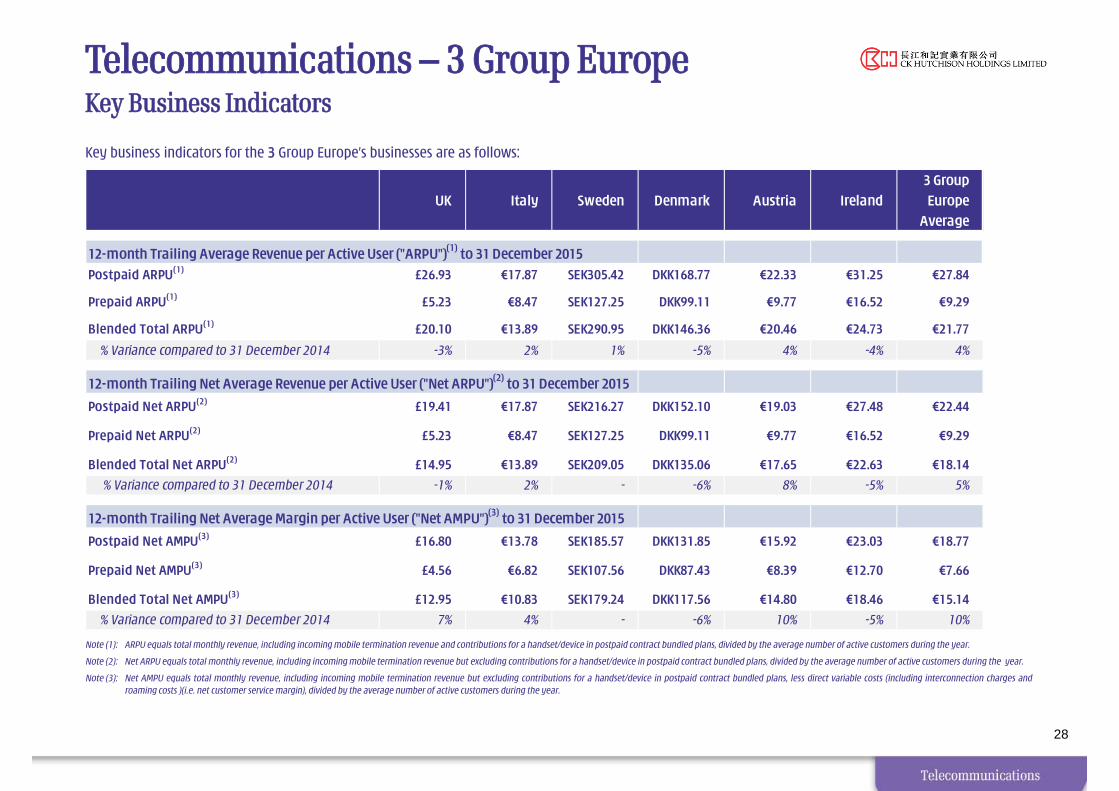
Telecommunications – 3 Group EuropeKey Business Indicators
Key business indicators for the 3 Group Europe’s businesses are as follows:
Note (1): ARPU equals total monthly revenue, including incoming mobile termination revenue and contributions for a handset/device in postpaid contract bundled plans, divided by the average number of active customers during the year.
Note (2): Net ARPU equals total monthly revenue, including incoming mobile termination revenue but excluding contributions for a handset/device in postpaid contract bundled plans, divided by the average number of active customers during the year.
Note (3): Net AMPU equals total monthly revenue, including incoming mobile termination revenue but excluding contributions for a handset/device in postpaid contract bundled plans, less direct variable costs (including interconnection charges androaming costs )(i.e. net customer service margin), divided by the average number of active customers during the year.
28
3 Group
Europe
Average
Postpaid ARPU(1) £26.93 €17.87 SEK305.42 DKK168.77 €22.33 €31.25 €27.84
Prepaid ARPU(1) £5.23 €8.47 SEK127.25 DKK99.11 €9.77 €16.52 €9.29
Blended Total ARPU(1) £20.10 €13.89 SEK290.95 DKK146.36 €20.46 €24.73 €21.77
% Variance compared to 31 December 2014 -3% 2% 1% -5% 4% -4% 4%
Postpaid Net ARPU(2) £19.41 €17.87 SEK216.27 DKK152.10 €19.03 €27.48 €22.44
Prepaid Net ARPU(2) £5.23 €8.47 SEK127.25 DKK99.11 €9.77 €16.52 €9.29
Blended Total Net ARPU(2) £14.95 €13.89 SEK209.05 DKK135.06 €17.65 €22.63 €18.14
% Variance compared to 31 December 2014 -1% 2% - -6% 8% -5% 5%
Postpaid Net AMPU(3) £16.80 €13.78 SEK185.57 DKK131.85 €15.92 €23.03 €18.77
Prepaid Net AMPU(3) £4.56 €6.82 SEK107.56 DKK87.43 €8.39 €12.70 €7.66
Blended Total Net AMPU(3) £12.95 €10.83 SEK179.24 DKK117.56 €14.80 €18.46 €15.14
% Variance compared to 31 December 2014 7% 4% - -6% 10% -5% 10%
Ireland
12-month Trailing Average Revenue per Active User ("ARPU")(1) to 31 December 2015
12-month Trailing Net Average Revenue per Active User ("Net ARPU")(2) to 31 December 2015
12-month Trailing Net Average Margin per Active User ("Net AMPU")(3) to 31 December 2015
UK Italy Sweden Denmark Austria
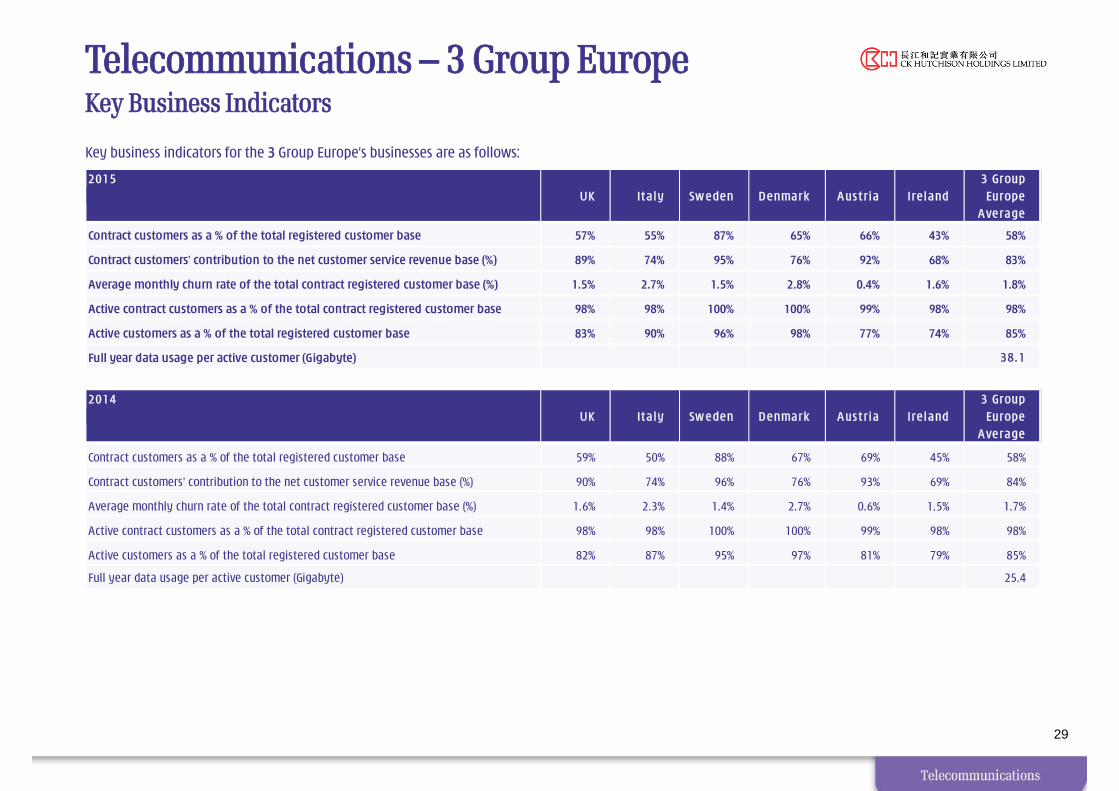
Telecommunications – 3 Group EuropeKey Business Indicators
Key business indicators for the 3 Group Europe’s businesses are as follows:
29
2015 3 GroupUK It a ly Sw eden Denmark A us t r ia Ire land Europe
A verage
Contract customers as a % of the total registered customer base 57% 55% 87% 65% 66% 43% 58%
Contract customers' contribution to the net customer service revenue base (%) 89% 74% 95% 76% 92% 68% 83%
Average monthly churn rate of the total contract registered customer base (%) 1.5% 2.7% 1.5% 2.8% 0.4% 1.6% 1.8%
Active contract customers as a % of the total contract registered customer base 98% 98% 100% 100% 99% 98% 98%
Active customers as a % of the total registered customer base 83% 90% 96% 98% 77% 74% 85%
Full year data usage per active customer (Gigabyte) 38. 1
2014 3 GroupUK It a ly Sw eden Denmark A us t r ia Ire land Europe
A verage
Contract customers as a % of the total registered customer base 59% 50% 88% 67% 69% 45% 58%
Contract customers' contribution to the net customer service revenue base (%) 90% 74% 96% 76% 93% 69% 84%
Average monthly churn rate of the total contract registered customer base (%) 1.6% 2.3% 1.4% 2.7% 0.6% 1.5% 1.7%
Active contract customers as a % of the total contract registered customer base 98% 98% 100% 100% 99% 98% 98%
Active customers as a % of the total registered customer base 82% 87% 95% 97% 81% 79% 85%
Full year data usage per active customer (Gigabyte) 25.4
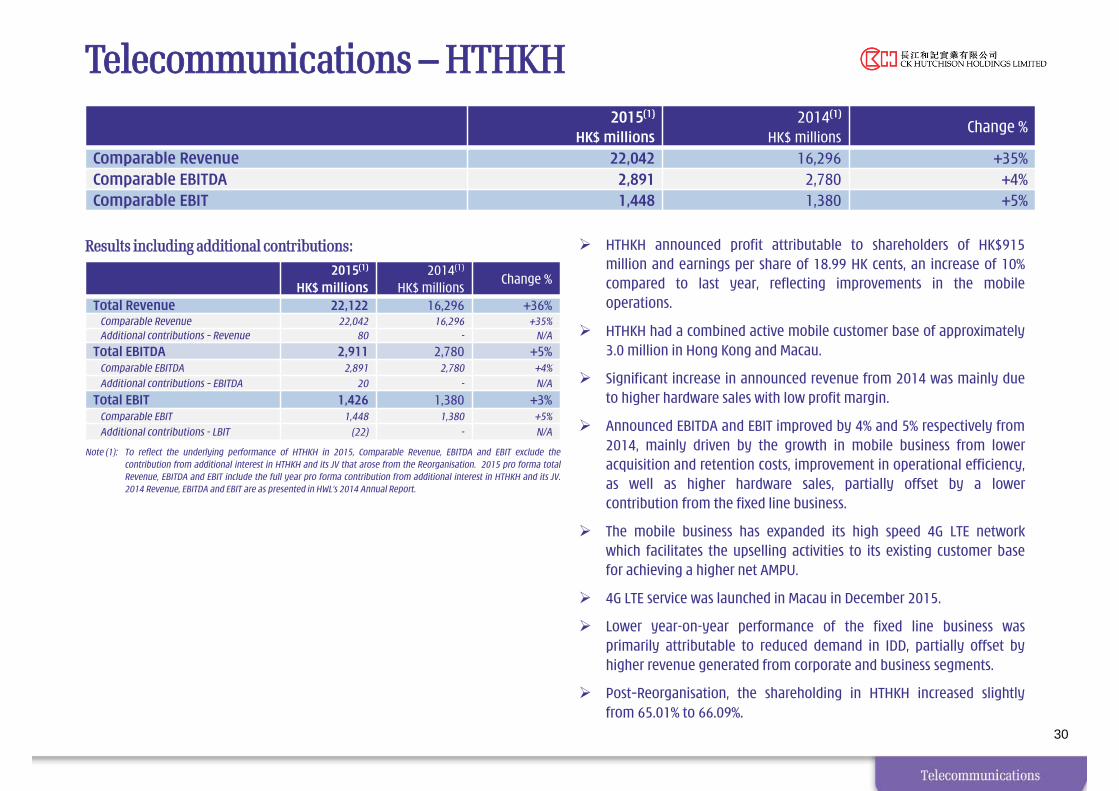
Telecommunications – HTHKH
30
Note (1): To reflect the underlying performance of HTHKH in 2015, Comparable Revenue, EBITDA and EBIT exclude thecontribution from additional interest in HTHKH and its JV that arose from the Reorganisation. 2015 pro forma totalRevenue, EBITDA and EBIT include the full year pro forma contribution from additional interest in HTHKH and its JV.2014 Revenue, EBITDA and EBIT are as presented in HWL’s 2014 Annual Report.
2015(1)
HK$ millions2014(1)
HK$ millionsChange %
Total Revenue 22,122 16,296 +36%Comparable Revenue 22,042 16,296 +35%Additional contributions – Revenue 80 - N/A
Total EBITDA 2,911 2,780 +5%Comparable EBITDA 2,891 2,780 +4%
Additional contributions – EBITDA 20 - N/A
Total EBIT 1,426 1,380 +3%Comparable EBIT 1,448 1,380 +5%
Additional contributions - LBIT (22) - N/A
Results including additional contributions: HTHKH announced profit attributable to shareholders of HK$915million and earnings per share of 18.99 HK cents, an increase of 10%compared to last year, reflecting improvements in the mobileoperations.
HTHKH had a combined active mobile customer base of approximately3.0 million in Hong Kong and Macau.
Significant increase in announced revenue from 2014 was mainly dueto higher hardware sales with low profit margin.
Announced EBITDA and EBIT improved by 4% and 5% respectively from2014, mainly driven by the growth in mobile business from loweracquisition and retention costs, improvement in operational efficiency,as well as higher hardware sales, partially offset by a lowercontribution from the fixed line business.
The mobile business has expanded its high speed 4G LTE networkwhich facilitates the upselling activities to its existing customer basefor achieving a higher net AMPU.
4G LTE service was launched in Macau in December 2015.
Lower year-on-year performance of the fixed line business wasprimarily attributable to reduced demand in IDD, partially offset byhigher revenue generated from corporate and business segments.
Post–Reorganisation, the shareholding in HTHKH increased slightlyfrom 65.01% to 66.09%.
2015(1)
HK$ millions2014(1)
HK$ millionsChange %
Comparable Revenue 22,042 16,296 +35%Comparable EBITDA 2,891 2,780 +4%Comparable EBIT 1,448 1,380 +5%
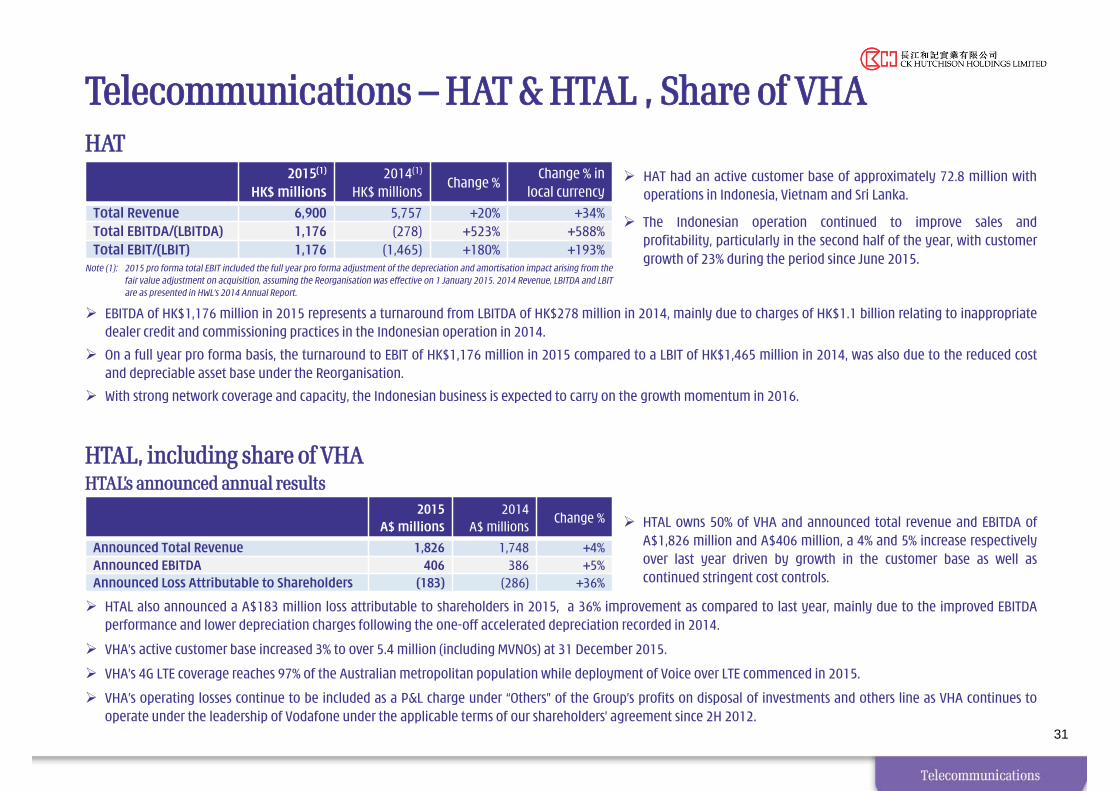
HAT had an active customer base of approximately 72.8 million withoperations in Indonesia, Vietnam and Sri Lanka.
The Indonesian operation continued to improve sales andprofitability, particularly in the second half of the year, with customergrowth of 23% during the period since June 2015.
31
2015(1)
HK$ millions2014(1)
HK$ millionsChange %
Change % in local currency
Total Revenue 6,900 5,757 +20% +34%Total EBITDA/(LBITDA) 1,176 (278) +523% +588%Total EBIT/(LBIT) 1,176 (1,465) +180% +193%
Note (1): 2015 pro forma total EBIT included the full year pro forma adjustment of the depreciation and amortisation impact arising from thefair value adjustment on acquisition, assuming the Reorganisation was effective on 1 January 2015. 2014 Revenue, LBITDA and LBITare as presented in HWL’s 2014 Annual Report.
Telecommunications – HAT & HTAL , Share of VHAHAT
HTAL, including share of VHAHTAL’s announced annual results
2015A$ millions
2014A$ millions
Change %
Announced Total Revenue 1,826 1,748 +4%Announced EBITDA 406 386 +5%Announced Loss Attributable to Shareholders (183) (286) +36%
HTAL owns 50% of VHA and announced total revenue and EBITDA ofA$1,826 million and A$406 million, a 4% and 5% increase respectivelyover last year driven by growth in the customer base as well ascontinued stringent cost controls.
HTAL also announced a A$183 million loss attributable to shareholders in 2015, a 36% improvement as compared to last year, mainly due to the improved EBITDAperformance and lower depreciation charges following the one-off accelerated depreciation recorded in 2014.
VHA’s active customer base increased 3% to over 5.4 million (including MVNOs) at 31 December 2015.
VHA’s 4G LTE coverage reaches 97% of the Australian metropolitan population while deployment of Voice over LTE commenced in 2015.
VHA’s operating losses continue to be included as a P&L charge under “Others” of the Group’s profits on disposal of investments and others line as VHA continues tooperate under the leadership of Vodafone under the applicable terms of our shareholders’ agreement since 2H 2012.
EBITDA of HK$1,176 million in 2015 represents a turnaround from LBITDA of HK$278 million in 2014, mainly due to charges of HK$1.1 billion relating to inappropriatedealer credit and commissioning practices in the Indonesian operation in 2014.
On a full year pro forma basis, the turnaround to EBIT of HK$1,176 million in 2015 compared to a LBIT of HK$1,465 million in 2014, was also due to the reduced costand depreciable asset base under the Reorganisation.
With strong network coverage and capacity, the Indonesian business is expected to carry on the growth momentum in 2016.
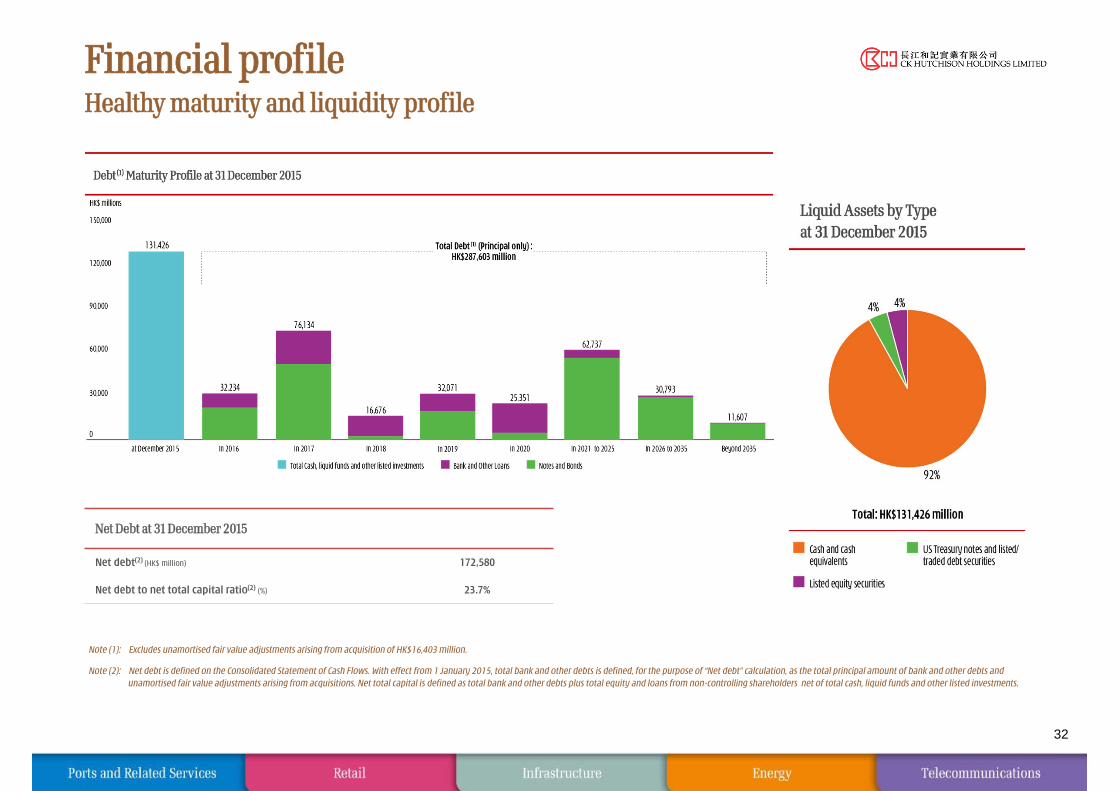
Financial profileHealthy maturity and liquidity profile
32
Note (1): Excludes unamortised fair value adjustments arising from acquisition of HK$16,403 million.
Note (2): Net debt is defined on the Consolidated Statement of Cash Flows. With effect from 1 January 2015, total bank and other debts is defined, for the purpose of “Net debt” calculation, as the total principal amount of bank and other debts and unamortised fair value adjustments arising from acquisitions. Net total capital is defined as total bank and other debts plus total equity and loans from non-controlling shareholders net of total cash, liquid funds and other listed investments.
Net Debt at 31 December 2015
Net debt(2) (HK$ million) 172,580
Net debt to net total capital ratio(2) (%) 23.7%

Note (1): EBITDA excludes (i) non-controlling interests’ share of results of HPH Trust and (ii) profits on disposal of investments & others.
Note (2): Dividends and distributions represent dividends and distributions of HWL businesses continued by CKHH in the year ended 31 December 2015 as well as 12 months pro forma additional dividends and distributions in FY2015arising from the Reorganisation.
Note (3): Capex and investments in Associates & JVs represent capex spending of HWL businesses continued by CKHH in the year ended 31 December 2015 and 12 months proforma additional capex and investments in FY2015 arising fromthe Reorganisation. As the acquisition of UK Rails is treated as an acquisition of subsidiary company (CKHH: 50% share ; CKI: 50% share) under CKHH pro forma basis, the capex and investments in Associates & JVs shown above donot include the acquisition cost.
Financial profile
33
2015 EBITDA , Dividends and distributions from Associates & JVs less Capex of Company & Subsidiaries and Investments in Associates & JVsCKHH Pro forma basis by division(HK$ millions)
54,639 54,639
29,729
37,454
11,375
6,587
92,093
66,014
36,316
2,449
Total
8,004 8,004
12,317 12,317 11,770 11,770 11,253
17,398
2,846 1,128 1,128
3,960 2,305
2,521 830
20,521
5,364 4,162
2,717
(2)
651,014 1594,206
1,891
10,930
1,066 47 336
1,883
3
2,447
852 454
11,964
10,309
6,089
14,838
13,147
32,291
17,134
15,415
9,375
17,396
10,933
2,911
1,151
1,176
2,1421,287
790
EBITDA - Company & Subsidiaries EBITDA - Associates & JVs Capex Capex - Telecom Licences
Dividends & Distributions from Associates & JVs
Retail Infrastructure Energy F&I and Others
Ports HTHKH HAT3 Group Europe
(1) (1)
(2) Investment in Associates & JVs (3)
(3)(3)

3.654
2.550
1.400
3.950
2.415
2.5501.7442
1.400
0.9576
3.950
2.7018
34
Note (1): Growth % represents % increase in full year dividend per share assuming CKHH shareholders hold both their existing CKHH shares and the Cheung Kong Property shares received throughthe Reorganisation on the shareholders full year dividend entitlement record date for both companies.
Note (2): Growth % represents % increase in full year dividend per share assuming ex-HWL shareholders hold both CKHH and Cheung Kong Property shares received through the Reorganisation onthe shareholder’s full year dividend entitlement record date for both companies.
Note (3): Exclude special dividend of HK$7.00 per share in 2014.
HWL 2014Full year
Dividend(3)
CKHH / Cheung Kong Property 2015
Full yeardividend
CKHH / Cheung Kong Property 2015
EffectiveFull year dividend
for ex-HWL shareholders
based on an exchange ratio of 0.684
CKH 2014Full year
Dividend(3)
CKHH / Cheung Kong Property 2015
Full yeardividend
Ex-HWL ShareholdersEx-CKH Shareholders
Growth % : +8.1% (1) Growth % : +11.9% (2)
(in HK$)
HWL CKHH Cheung Kong Property
CKHH / Cheung Kong PropertyFull Year Dividend Growth


![ck< fu;U=.k d{k] vtesj 2017](https://img.dokumen.tips/doc/110x75/6333d57a4cd921f2410d0d1f/ck-fuuk-dk-vtesj-2017.jpg)


