Embed Size (px)
Citation preview
Diffusion of Water in Nafion Using Time-Resolved Fourier Transform Infrared-AttenuatedTotal Reflectance Spectroscopy
Daniel T. Hallinan, Jr. and Yossef A. Elabd*Department of Chemical and Biological Engineering, Drexel UniVersity, Philadelphia, PennsylVania 19104
ReceiVed: December 22, 2008; ReVised Manuscript ReceiVed: January 26, 2009
Hydrogen fuel cells are attractive alternative power sources for applications such as transportation; however,fuel cell performance is a strong function of water equilibrium content and water sorption and desorptionkinetics in polymer electrolyte membranes (e.g., Nafion). Although similar water sorption isotherms for Nafionhave been reproduced in many laboratories, reported diffusion coefficients of water in Nafion vary by 4orders of magnitude. In this study, sorption and desorption dynamics of water vapor in Nafion were measuredas a function of water vapor activity and flow rate using time-resolved Fourier transform infrared-attenuatedtotal reflectance (FTIR-ATR) spectroscopy. Both integral and differential experiments were performed, whereintegral experiments consisted of increasing the vapor activity from 0% RH to one of five values (22, 43, 56,80, or 100% RH), while in differential experiments the activity was sequentially increased in smaller stepsfrom 0 to 22 to 43 to 56 to 80 to 100% RH. For integral experiments, non-Fickian behavior was observed atboth low and high vapor activities, while Fickian behavior was observed at moderate vapor activities. Fordifferential experiments, Fickian behavior was observed at all vapor activities except at low vapor activities(0-22% RH). Sorption kinetics was found to be a function of flow rate, where mass transfer resistance at thevapor/polymer interface was significant at low flow rates but was insignificant at high flow rates. Accuratesorption and desorption diffusion coefficients were calculated in this study (measured at high flow rates withno mass transfer resistance) and were similar, on the order of 10-7 cm2/s, and weak functions of water vaporactivity.
IntroductionNafion, a perfluorosulfonic acid polymer, has been widely
studied,1 particularly because of its use as a polymer electrolytemembrane (PEM) in hydrogen fuel cells. One of the firstapplications of the hydrogen PEM fuel cell was onboardNASA’s Gemini space craft in the 1960s.2 Today, the hydrogenPEM fuel cell has generated a great deal of interest for largemarket applications, such as transportation,3 where numerousfuel cell buses and cars have been manufactured and demon-strated since the 1990s.4 Hydrogen PEM fuel cells offer aninnovative alternative to current power sources with an abilityfor low-temperature operation, rapid start-up times, and thepotential to achieve higher efficiencies with fuels from renew-able sources at a lower environmental cost (clean byproducts).2
In PEM fuel cells, Nafion serves as the electrolyte, exchangingprotons (proton conduction) from the anode to the cathode toderive electrical energy directly from a chemical fuel. Nafionis the most frequently used polymer membrane in PEM fuelcells, because it exhibits sufficient proton conductivity at optimalwater contents and is thermally, chemically, and oxidativelystable. However, proton conductivity in Nafion is highlydependent on water content with values on the order of 10-1
S/cm when fully saturated, but this value drops by orders ofmagnitude at low water contents.5-7 Furthermore, fuel cellperformance is directly linked to water balance (production,diffusion, and removal) in the system and, specifically, watercontent in the membrane (sorption and desorption kinetics),where significant losses have been observed at low Nafion watercontents.2 Fuel cell operating conditions, with events such as
higher temperatures, start-up, and shut-down, also can have asignificant impact on the water balance in the system, and inturn the overall fuel cell performance. Therefore, a fundamentalunderstanding of water dynamics in Nafion is desirable.
Several researchers have measured the diffusion of water inNafion using various techniques, including conventional tech-niques, such as dynamic vapor sorption8-11 and permeation,12-14
as well as less common techniques, such as pulsed field gradientnuclear magnetic resonance (PFG-NMR) spectroscopy,5,6,15-18
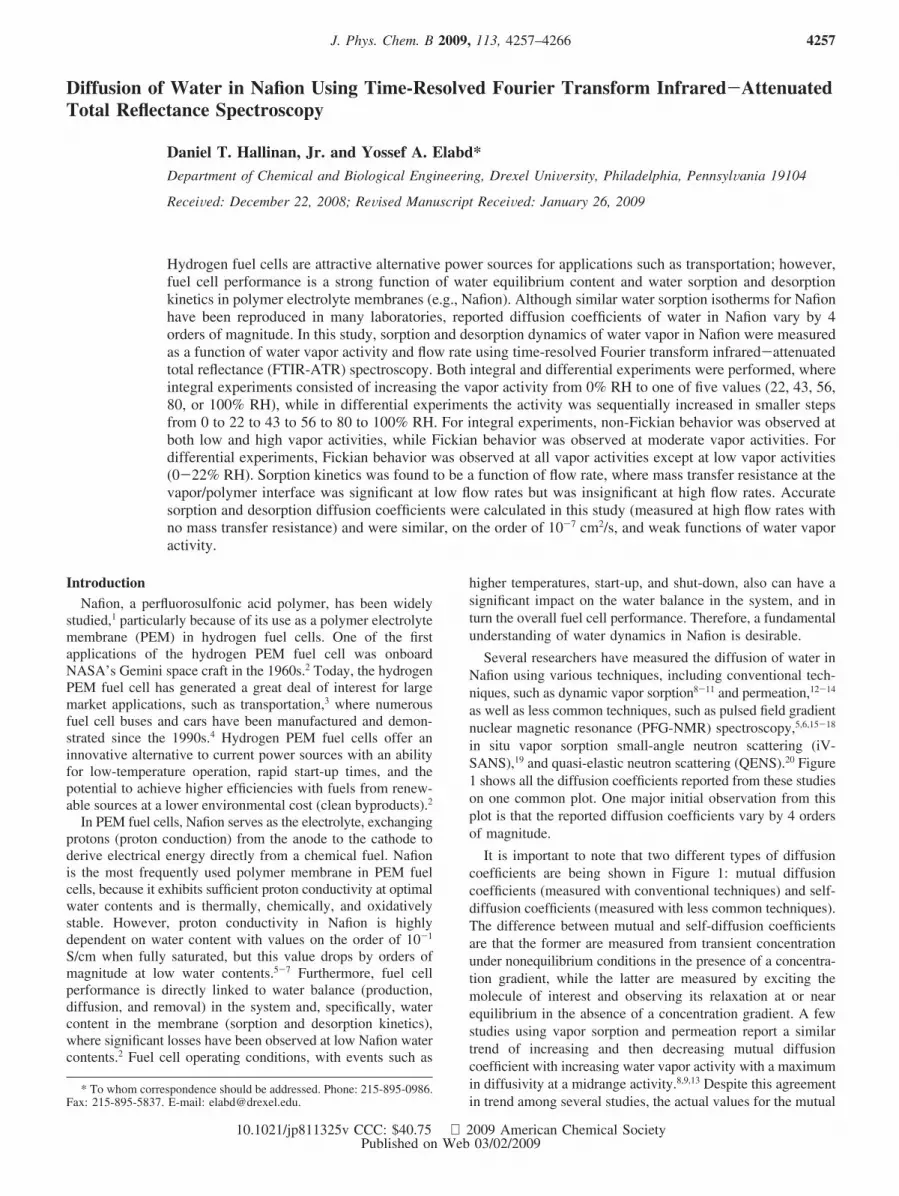
in situ vapor sorption small-angle neutron scattering (iV-SANS),19 and quasi-elastic neutron scattering (QENS).20 Figure1 shows all the diffusion coefficients reported from these studieson one common plot. One major initial observation from thisplot is that the reported diffusion coefficients vary by 4 ordersof magnitude.
It is important to note that two different types of diffusioncoefficients are being shown in Figure 1: mutual diffusioncoefficients (measured with conventional techniques) and self-diffusion coefficients (measured with less common techniques).The difference between mutual and self-diffusion coefficientsare that the former are measured from transient concentrationunder nonequilibrium conditions in the presence of a concentra-tion gradient, while the latter are measured by exciting themolecule of interest and observing its relaxation at or nearequilibrium in the absence of a concentration gradient. A fewstudies using vapor sorption and permeation report a similartrend of increasing and then decreasing mutual diffusioncoefficient with increasing water vapor activity with a maximumin diffusivity at a midrange activity.8,9,13 Despite this agreementin trend among several studies, the actual values for the mutual
* To whom correspondence should be addressed. Phone: 215-895-0986.Fax: 215-895-5837. E-mail: [email protected].
J. Phys. Chem. B 2009, 113, 4257–4266 4257
10.1021/jp811325v CCC: $40.75 2009 American Chemical SocietyPublished on Web 03/02/2009
diffusion coefficients measured from these conventional tech-niques still vary by up to 3 orders of magnitude.
Among the PFG-NMR studies, there appears to be a closeragreement among the self-diffusion coefficients reported fromdifferent studies. Several of the less common techniques alsoprovide more information compared to conventional techniques,such as molecular level resolution of the water-Nafion system.However, the mutual diffusion coefficients measured from vaporsorption and permeation may be a more useful tool as it appliesto the fuel cell application, since thermodynamics (watersolubility and concentration gradient) are not neglected.
In this study, the diffusion of water in Nafion was measuredusing time-resolved Fourier transform infrared-attenuated totalreflectance (FTIR-ATR) spectroscopy. Similar to conventionaltechniques, this technique measures a mutual diffusion coef-ficient in the presence of a concentration gradient. However,unlike conventional transport measurements, time-resolvedFTIR-ATR spectroscopy provides molecular-level contrastbetween diffusant(s) and the polymer as the entire mid-infraredspectrum (chemical bond vibrations absorbing light at differentwavelengths) of both are measured in situ as a function of time.In other words, time-resolved FTIR-ATR spectroscopy combinesthe benefits of conventional (mutual diffusion coefficients) andless common (molecular-level detail) techniques. In additionto measuring molecular changes in the diffusant/polymer system,this technique can also quantitatively measure molecular interac-tions between diffusant and polymer through shifts in theinfrared spectra.21,22
Although time-resolved FTIR-ATR spectroscopy is lessfrequently used compared to conventional measurements, thistechnique has been used by numerous researchers to measurediffusion in polymers,33 where a number of these studies havecompared their results to gravimetric sorption and permeationand have reported excellent agreement between the techniques.Recently, Hallinan and Elabd7 reported on the diffusion andsorption of methanol and water in Nafion using time-resolvedFTIR-ATR spectroscopy, where the dynamics of liquid methanol/water mixtures in saturated (swollen with water) Nafion wasinvestigated as it relates to the methanol fuel cell. The resultsfrom this study were in excellent agreement with data obtainedfrom permeation.
Several studies have reported on the mid-infrared spectra ofthe water/Nafion system at equilibrium.23-27 This current study
differs in that the dynamics of water vapor sorption anddesorption were measured using time-resolved FTIR-ATRspectroscopy, where these results have an impact on thehydrogen fuel cell. Other investigators have noted that thedynamics of water vapor in dry Nafion can result in both non-Fickian behavior and mass transfer resistance at the vapor/polymer interface.11,28-31 These phenomena were considered inthis study, in addition to investigating a more accurate deter-mination of the diffusion coefficient, with a systematic inves-tigation of water dynamics in Nafion as a function of watervapor activity and flow rate using time-resolved FTIR-ATRspectroscopy.
Experimental Section
Materials. Nafion 117 (1100 EW, 178 µm (0.007 in.) as-received thickness, commercially extruded film) was purchasedfrom Aldrich. The following chemicals were used to purifyNafion membranes: hydrogen peroxide (Aldrich, 30-32 wt %)diluted to 3 wt %, reverse osmosis (RO) water (resistivity >16MΩ cm), and sulfuric acid (Aldrich, 99.999% purity, ACSreagent). Breathing quality compressed air purchased fromAirgas was used in all transport experiments. Air either flowedthrough a glass moisture trap (Restek) packed with indicatingDrierite and Molecular Sieve 5A (0% RH) or bubbled throughsaturated aqueous salt solutions containing potassium acetate(KC2H3O2 1.5H2O), potassium carbonate (K2CO3), sodiumbromide (NaBr), potassium bromide (KBr), or pure RO water(H2O). All salts were 99% pure and purchased from Aldrich.
Membrane Preparation. Membranes for FTIR-ATR experi-ments were cut into 6 × 1 cm rectangles. All membrane sampleswere subsequently purified, similar to a procedure reportedelsewhere,5 by refluxing in 3 wt % hydrogen peroxide then inRO water. This was followed by refluxing in 1 M sulfuric acidand then in RO water again. Membranes were excessively rinsedafter every reflux step, where each reflux step was 1 h. Finally,all membranes were stored in separate vials filled with RO water.
Diffusion (Time-Resolved FTIR-ATR Spectroscopy). Time-resolved infrared spectra for diffusion experiments were col-lected using an FTIR spectrometer (Nicolet 6700 Series; ThermoElectron) equipped with a horizontal, temperature-controlledATR cell (Specac, Inc.). A multiple reflection, trapezoidal (72× 10 × 6 mm), zinc selenide (ZnSe) ATR crystal (Specac, Inc.)with 45° beveled faces (infrared angle of incidence, θ) was used.Infrared spectra were collected using a liquid-nitrogen-cooledmercury-cadmium-telluride detector that collected 32 scansper spectrum at a resolution of 4 cm-1 (a spectrum was collectedevery 12.75 s). All spectra were corrected by a backgroundsubtraction of the ATR element spectrum. A schematic diagramof the ATR experiment can be found elsewhere.7 Relativehumidity was controlled by bubbling compressed air, at acontrolled flow rate, through a specific salt solution in atemperature-controlled tank (1000 mL, AceGlass) and thenthrough a temperature-controlled connector (30 cm long, Ace-Glass), which was attached to the temperature-controlled ATRcell. A circulating water thermal bath (NESLab RTE10) wasused to control the temperature of the tank, connector, and ATRcell at 30.0 ( 0.1 °C for all diffusion experiments. Relativehumidities of 22, 43, 56, and 80% were generated withcorresponding saturated aqueous salt solutions of KC2H3O2,K2CO3, NaBr, and KBr, respectively, while 100% RH wasgenerated using pure RO water.
For each diffusion experiment, a background spectrum of theATR crystal was collected. After a background spectrum wasrecorded and saved, the flow-through ATR cell was opened and
Figure 1. Reported diffusion coefficients of water in Nafion usingvarious experimental techniques: vapor sorption (0,8 9,9 crossedsquare,11 .14), permeation (O,12 b,13 .14), NMR (4,15 2,5 3,6 1,16 [,17
]18), iV-SANS (×19), and QENS (cross20).
4258 J. Phys. Chem. B, Vol. 113, No. 13, 2009 Hallinan and Elabd
the ATR crystal removed. A hydrated, precut section of Nafion117 was placed onto the crystal. Note that the original 6 × 1cm precut Nafion membrane swells in water and therefore wastrimmed again to the exact size of the ATR crystal. Themembrane-covered crystal was then returned to the cell and thecell was tightened. A Kalrez gasket was used to ensure adequateadhesion between membrane and crystal. The membrane wasthen dried for 4 h by flowing dry air through the ATR cell. TheOH stretching and bending vibrations associated with water inNafion were monitored to ensure a dry steady state was reached.Drying was necessary to achieve repeatable starting points fordiffusion experiments and to ensure adequate adhesion betweenthe membrane and crystal. In other words, no bulk liquid waspresent between the membrane and crystal during theseexperiments.
Two types of ATR diffusion experiments were performed:(1) integral experiments, which include separate experimentsthat all have an initial condition of 0% RH at the vapor/polymerinterface and can include large concentration gradients (e.g.,100% RH at t > 0) and (2) differential experiments, whichinclude a series of experiments with smaller concentrationgradients (e.g., vapor/polymer interface boundary condition waschanged from 0 to 22% RH until steady state was achievedand then changed from 22 to 43% RH and so on). Thisvocabulary, integral and differential, has been adapted from otherinvestigators.32 More specifically, to begin each integral diffusionexperiment, at a carefully recorded time the dry air (0% RH)was removed from the vapor/polymer interface and a selectedrelative humidity (22, 43, 56, 80, or 100% RH) air was imposedat that interface. For differential experiments, the vapor/polymerinterface was cycled from 0% RH to 100% RH (sorption) andback to 0% RH (desorption) in approximately 20% RHincrements allowing for steady state to be achieved at eachincrement.
For all experiments air flow rate was controlled by a rotameter(Matheson Tri-Gas). In this study, the effect of flow rate onmass transfer resistance was investigated using flow ratesranging from 3 to 150 mL/min. The ATR cell outlet was bubbledthrough a beaker of water to verify the flow rate through theentire system. With a flow rate of 150 mL/min, the ATR cell(V ) 550 µL) was completely refreshed 58 times per data point(spectrum).
Unsteady-state diffusion of water in Nafion for this ATRsystem7 can be simply described by a one-dimensional continuityequation (binary Fickian diffusion):
where C is concentration of the diffusant, t is time, z is distance,and Deff is the “effective” concentration-averaged diffusioncoefficient. The initial and boundary conditions for the ATRconfiguration7 with a polymer membrane of thickness, l, exposedto an infinite reservoir of diffusant with negligible mass transferresistance (constant surface concentration) are
The coordinates were chosen such that z ) 0 at the polymer/ATR element interface and z ) l for the vapor/polymer interface.For integral experiments, C0 equals the concentration of waterin Nafion equilibriated at 0% RH and 30 °C. For differentialexperiments, C0 equals Ceq from the previous step. An analyticalsolution to eq 1 with these initial and boundary conditions isgiven
where
For weak IR absorption, concentration is related to absorbancethrough the differential Beer-Lambert law and incorporates theevanescent wave decay of the ATR infrared light:33
Substitution of eq 5 into eq 7 and integration yields33
where A(t) is the ATR absorbance at time t, and Aeq is theabsorbance value at equilibrium. The depth of penetration, dp,is essentially the sampling distance into the polymer at whichthe evanescent wave has decayed to 1/3 the maximum intensity.It is determined by the wavelength of light, refractive indicesof the crystal and polymer, and the angle of incident light, andis given by
where the refractive indices of the ATR element and polymerare 2.4 (nZnSe) and 1.364 (nNafion),34 respectively.
When l/dp > 10, then eq 8 is equivalent to eq 5, where theconcentration profile is essentially constant in the samplingregion close to the polymer/crystal interface (z ) 0) resultingin a spatially independent solution:
∂C∂t
) Deff∂
2C
∂z2(1)
C ) C0 @t ) 0; 0 < z < l (2)
C ) Ceq @z ) l; t g 0 (3)
dCdz
) 0 @z ) 0; t g 0 (4)
C - C0
Ceq - C0) 1 - 4
π× ∑
n)0
∞(-1)n
2n + 1exp(-Deff f 2t) cos(fz)
(5)
f ) (2n + 1)π2l
(6)
A(t) ) ∫0
lε*C(t) exp(-2z
dp) dz (7)
A(t) - A0
Aeq - A0) 1 - 8
πdp[1 - exp(-2l/dp)]∑n)0
∞1
2n + 1×
[ exp(-f 2Defft)[f exp(-2l/dp) + (-1)n2/dp]
(2/dp)2 + f 2 ] (8)
dp ) ( λ
2πnZnSe√sin2(θ) - (nNafion/nZnSe)2) (9)
C - C0
Ceq - C0) 1 - 4
π× ∑
n)0
∞(-1)n
2n + 1exp(-Defff
2t) (10)
Diffusion of Water in Nafion J. Phys. Chem. B, Vol. 113, No. 13, 2009 4259
This is referred to as the thick film approximation.35 In thisstudy, l/dp . 10, where dp ∼ 1 µm and l ∼180 µm. Diffusioncurves (ATR absorbance as a function of time) can be regressedto eq 10 with the binary diffusion coefficient of water in Nafion(Deff) being the only adjustable parameter in this model. At leastthree integral and three differential diffusion experiments wereconducted at each relative humidity (22, 43, 56, 80, and 100%).Immediately following each experiment, the membrane thick-ness was measured with a digital micrometer (Mitutoyo) with1 µm accuracy. These thicknesses were used in the calculationof each diffusion coefficient to accurately account for theincrease in thickness with increasing humidity. Each thicknessmeasurement was the average of five readings at differentpositions on the membrane. The average standard deviation was4% of the average thickness. The measured thicknesses arereported in Table 1.
Results
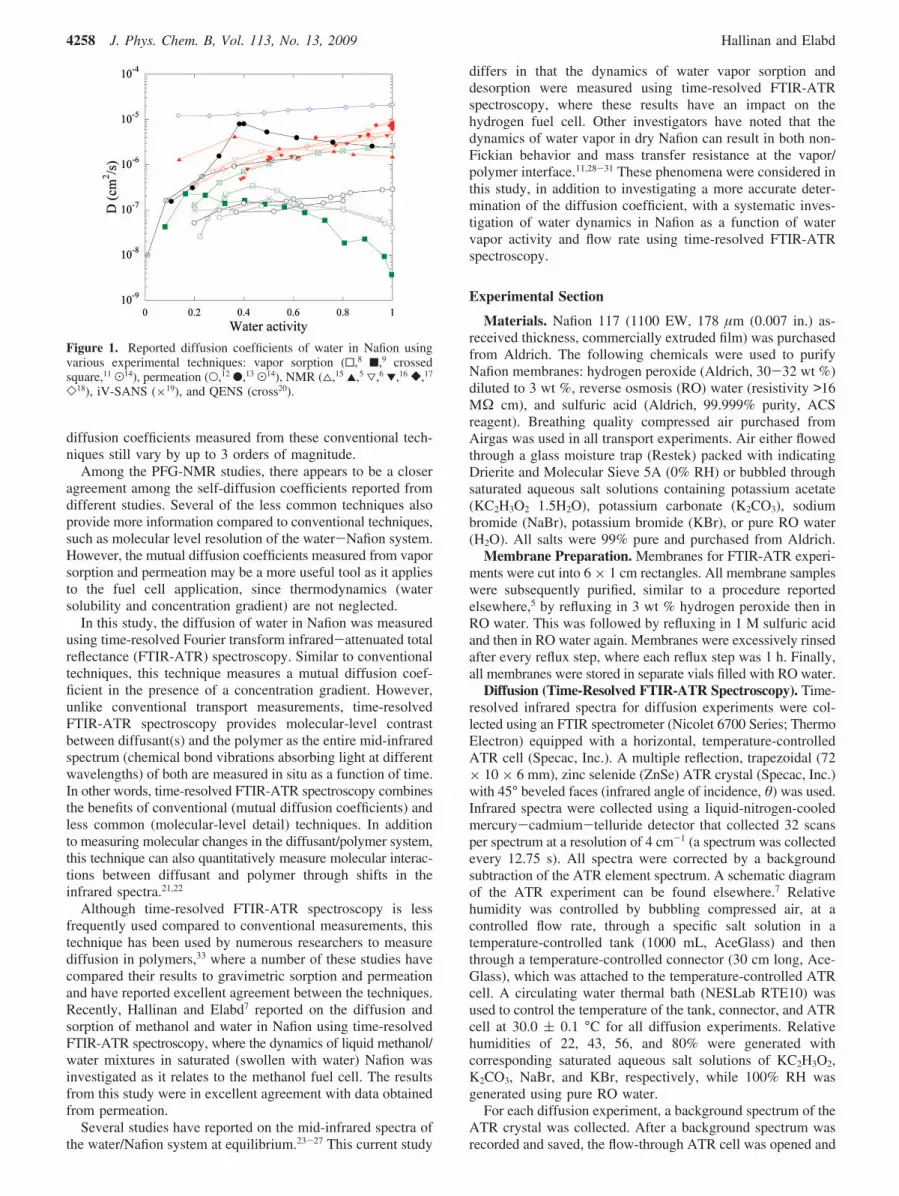
Integral Diffusion. Figure 2 shows time-resolved infraredspectra of a selected integral diffusion experiment: 80% RHwater vapor diffusing into dry Nafion 117. The inset in Figure2 shows the O-H stretching absorbance at 3450 cm-1 andH-O-H bending band at 1630 cm-1 of water increasing withtime, which represents the diffusion of water in Nafion to theregion close to the polymer/crystal interface. The dissociationof anhydrous sulfonic acid, SO3H, to protonated water ions,(H2O)nH+, and sulfonate anions, SO3
-, was also observed. Thiswas shown by a decrease in the anhydrous sulfonic acid (SO3H)stretching bands at 2722 and 2220 cm-1 and an increase in theprotonated water ion ((H2O)nH+) bending band at 1715 cm-1
and the sulfonate anion (SO3-) stretching at 1060 cm-1 (not
shown in inset).23-27,36-38
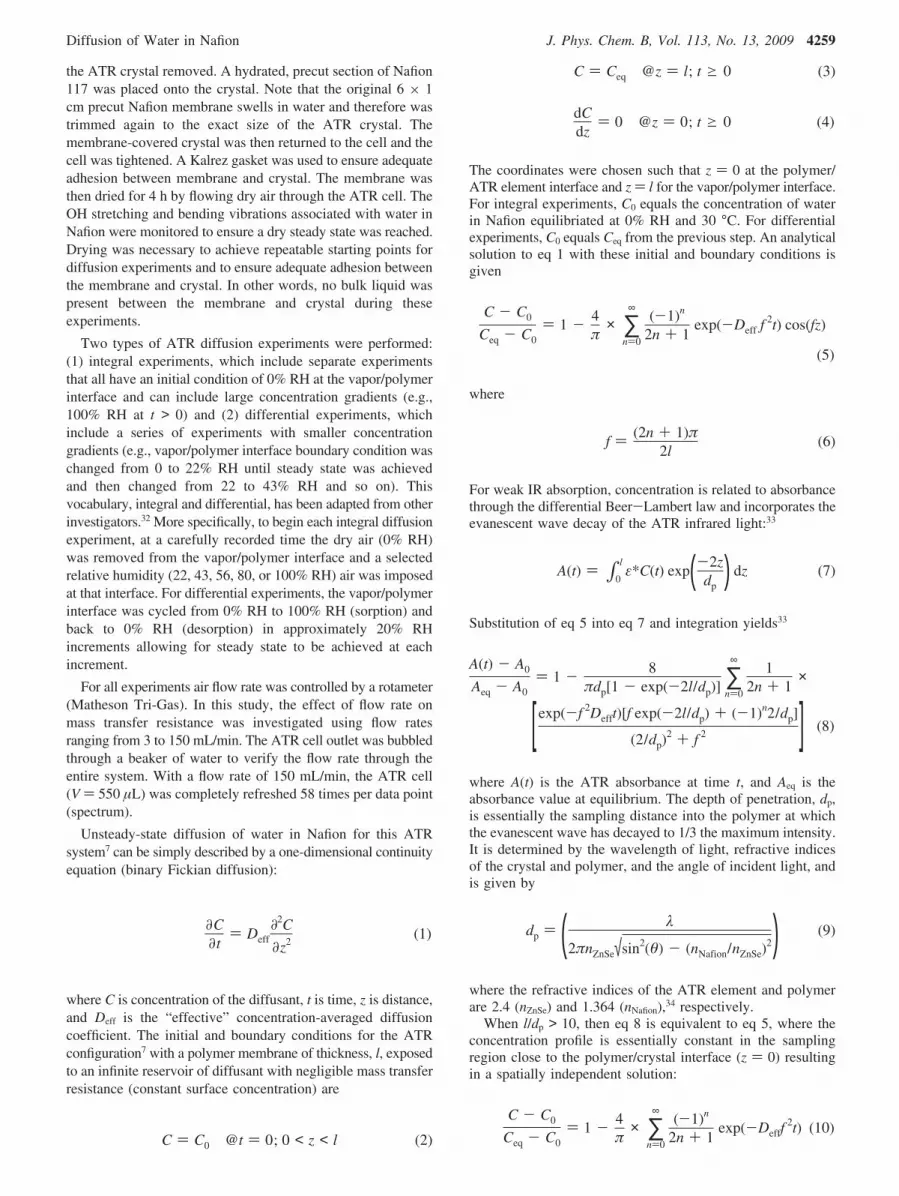
The area of the O-H stretching absorbance of water (at3450 cm-1) was integrated at each time point over the range
of 3774 to 2874 cm-1. Figure 3a shows the integrated areasas a function of time for integral experiments 22, 43, 56, 80,and 100% RH. First, the steady-state absorbance increaseswith increasing activity of the vapor phase. Second, the rateor early time slope appears to increase with increasing activityin the vapor phase. Finally, the data shows an interestingslow approach to final steady state only for the 0-100% RHexperiment. Figure 3b shows the data in Figure 3a normalizedto each equilibrium value to highlight several additional keyobservations. The 22% RH experiment has a time lag beforea steep slope. The 43% RH experiment has no significanttime lag and a steep early time slope. It should be noted thatthe time lag in this sense refers to an initial delay longerthan that predicted by the Fickian model with the initial andboundary conditions specific to this ATR experiment. Theexpected short delay is a function of the experiment andresults from the time it takes for water to diffuse from thevapor-membrane interface to the membrane-crystal inter-face where it is detected. The early time slope increasesfurther in the 56% RH experiment but decreases when thevapor-phase concentration was increased to 80 and 100% RH.Qualitatively, the time lag and the shape of the diffusion
Figure 2. Infrared spectra of water vapor (80% RH) diffusing intodry Nafion at selected time points. Inset shows increase of the O-Hstretching and H-O-H bending bands as a function of time. Arrowsshow direction of spectral change with time.
TABLE 1: Nafion Thickness As a Function of RelativeHumidity
% RH thickness (µm)
22 131.5 ( 3.143 137.5 ( 2.856 137.4 ( 3.880 139.4 ( 5.7100 179.5 ( 11.6
Figure 3. (a) Time-resolved absorbance of the water O-H stretchingband during water vapor diffusion into dry Nafion. Each experimentwas from dry conditions to the designated relative humidity (22% 4,43% ], 56% +, 80% 0, and 100% RH O). Some data points wereomitted for clarity. (b) Normalized, time-resolved absorbance of thewater O-H stretching band during water vapor diffusion into dryNafion. Some data points were omitted for clarity.
4260 J. Phys. Chem. B, Vol. 113, No. 13, 2009 Hallinan and Elabd
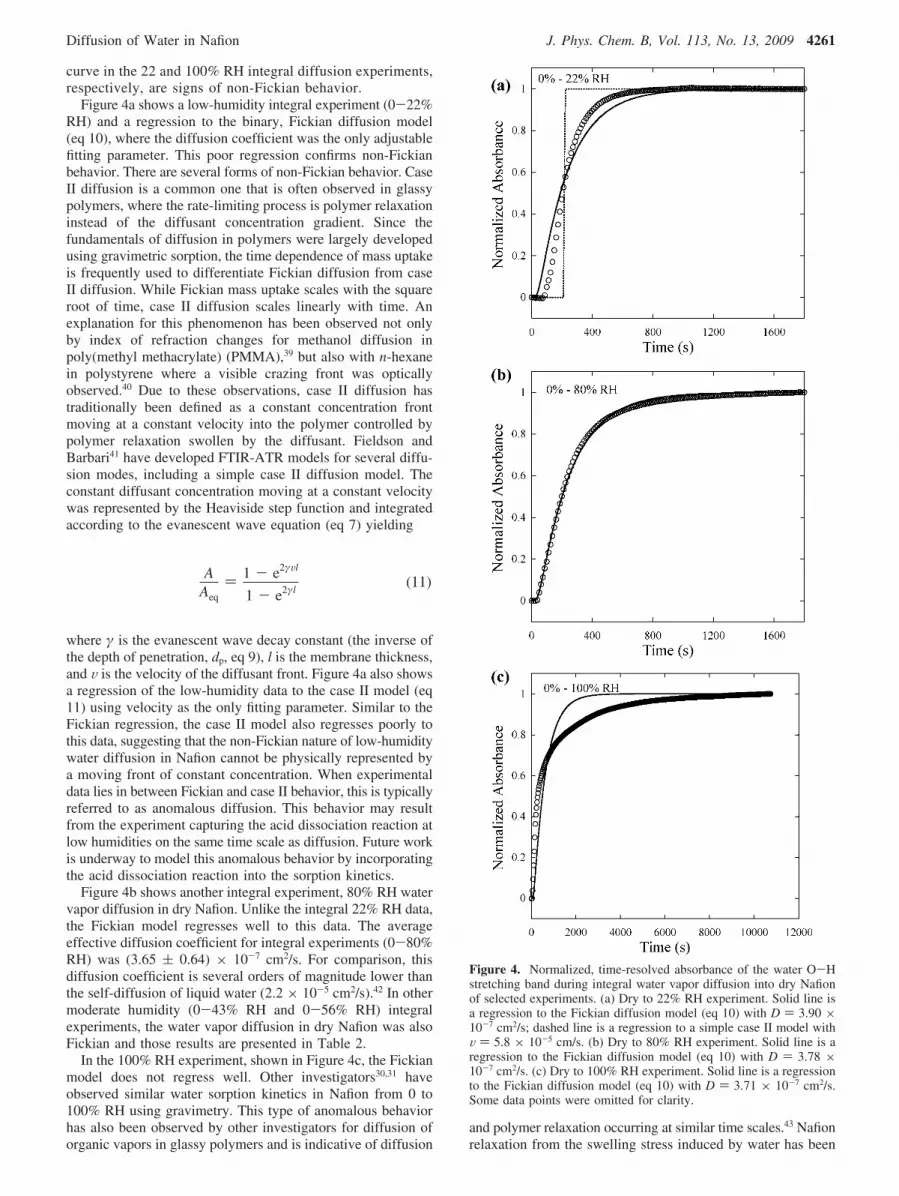
curve in the 22 and 100% RH integral diffusion experiments,respectively, are signs of non-Fickian behavior.
Figure 4a shows a low-humidity integral experiment (0-22%RH) and a regression to the binary, Fickian diffusion model(eq 10), where the diffusion coefficient was the only adjustablefitting parameter. This poor regression confirms non-Fickianbehavior. There are several forms of non-Fickian behavior. CaseII diffusion is a common one that is often observed in glassypolymers, where the rate-limiting process is polymer relaxationinstead of the diffusant concentration gradient. Since thefundamentals of diffusion in polymers were largely developedusing gravimetric sorption, the time dependence of mass uptakeis frequently used to differentiate Fickian diffusion from caseII diffusion. While Fickian mass uptake scales with the squareroot of time, case II diffusion scales linearly with time. Anexplanation for this phenomenon has been observed not onlyby index of refraction changes for methanol diffusion inpoly(methyl methacrylate) (PMMA),39 but also with n-hexanein polystyrene where a visible crazing front was opticallyobserved.40 Due to these observations, case II diffusion hastraditionally been defined as a constant concentration frontmoving at a constant velocity into the polymer controlled bypolymer relaxation swollen by the diffusant. Fieldson andBarbari41 have developed FTIR-ATR models for several diffu-sion modes, including a simple case II diffusion model. Theconstant diffusant concentration moving at a constant velocitywas represented by the Heaviside step function and integratedaccording to the evanescent wave equation (eq 7) yielding
where γ is the evanescent wave decay constant (the inverse ofthe depth of penetration, dp, eq 9), l is the membrane thickness,and V is the velocity of the diffusant front. Figure 4a also showsa regression of the low-humidity data to the case II model (eq11) using velocity as the only fitting parameter. Similar to theFickian regression, the case II model also regresses poorly tothis data, suggesting that the non-Fickian nature of low-humiditywater diffusion in Nafion cannot be physically represented bya moving front of constant concentration. When experimentaldata lies in between Fickian and case II behavior, this is typicallyreferred to as anomalous diffusion. This behavior may resultfrom the experiment capturing the acid dissociation reaction atlow humidities on the same time scale as diffusion. Future workis underway to model this anomalous behavior by incorporatingthe acid dissociation reaction into the sorption kinetics.
Figure 4b shows another integral experiment, 80% RH watervapor diffusion in dry Nafion. Unlike the integral 22% RH data,the Fickian model regresses well to this data. The averageeffective diffusion coefficient for integral experiments (0-80%RH) was (3.65 ( 0.64) × 10-7 cm2/s. For comparison, thisdiffusion coefficient is several orders of magnitude lower thanthe self-diffusion of liquid water (2.2 × 10⁻⁵ cm2/s).42 In othermoderate humidity (0-43% RH and 0-56% RH) integralexperiments, the water vapor diffusion in dry Nafion was alsoFickian and those results are presented in Table 2.
In the 100% RH experiment, shown in Figure 4c, the Fickianmodel does not regress well. Other investigators30,31 haveobserved similar water sorption kinetics in Nafion from 0 to100% RH using gravimetry. This type of anomalous behaviorhas also been observed by other investigators for diffusion oforganic vapors in glassy polymers and is indicative of diffusion
and polymer relaxation occurring at similar time scales.43 Nafionrelaxation from the swelling stress induced by water has been
AAeq
) 1 - e2γVl
1 - e2γl(11)
Figure 4. Normalized, time-resolved absorbance of the water O-Hstretching band during integral water vapor diffusion into dry Nafionof selected experiments. (a) Dry to 22% RH experiment. Solid line isa regression to the Fickian diffusion model (eq 10) with D ) 3.90 ×10⁻⁷ cm2/s; dashed line is a regression to a simple case II model withV ) 5.8 × 10⁻⁵ cm/s. (b) Dry to 80% RH experiment. Solid line is aregression to the Fickian diffusion model (eq 10) with D ) 3.78 ×10⁻⁷ cm2/s. (c) Dry to 100% RH experiment. Solid line is a regressionto the Fickian diffusion model (eq 10) with D ) 3.71 × 10⁻⁷ cm2/s.Some data points were omitted for clarity.
Diffusion of Water in Nafion J. Phys. Chem. B, Vol. 113, No. 13, 2009 4261
measured31 and has been shown to be significant. This appearsto be a reasonable explanation for the diffusion-relaxationphenomena observed, especially since from 0 to 100% RHNafion thickness swells by 37%. Future work is underway tomodel this diffusion-relaxation phenomena, where the time-resolved infrared bands that represent chemical bonds in thepolymer provide experimental evidence of relaxation to validatethis modeling effort.
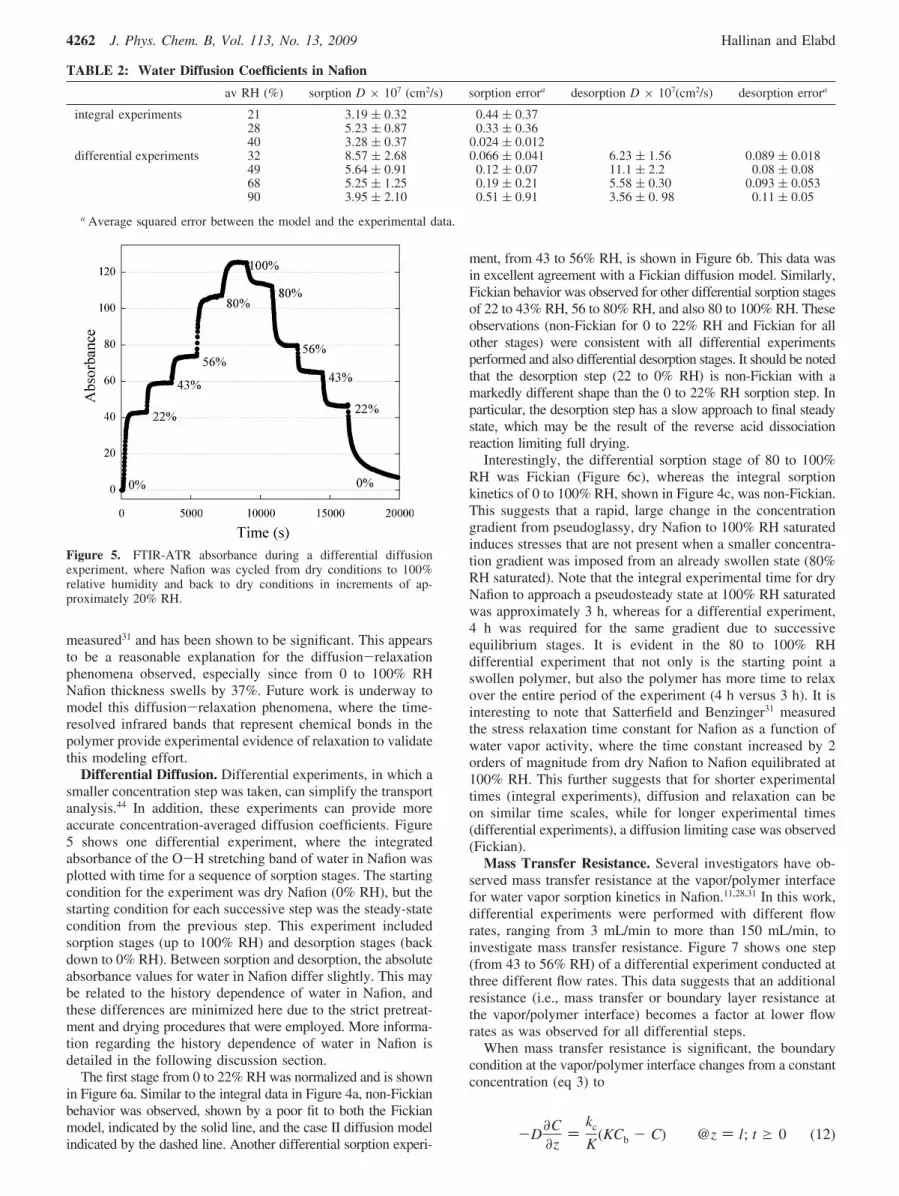
Differential Diffusion. Differential experiments, in which asmaller concentration step was taken, can simplify the transportanalysis.44 In addition, these experiments can provide moreaccurate concentration-averaged diffusion coefficients. Figure5 shows one differential experiment, where the integratedabsorbance of the O-H stretching band of water in Nafion wasplotted with time for a sequence of sorption stages. The startingcondition for the experiment was dry Nafion (0% RH), but thestarting condition for each successive step was the steady-statecondition from the previous step. This experiment includedsorption stages (up to 100% RH) and desorption stages (backdown to 0% RH). Between sorption and desorption, the absoluteabsorbance values for water in Nafion differ slightly. This maybe related to the history dependence of water in Nafion, andthese differences are minimized here due to the strict pretreat-ment and drying procedures that were employed. More informa-tion regarding the history dependence of water in Nafion isdetailed in the following discussion section.
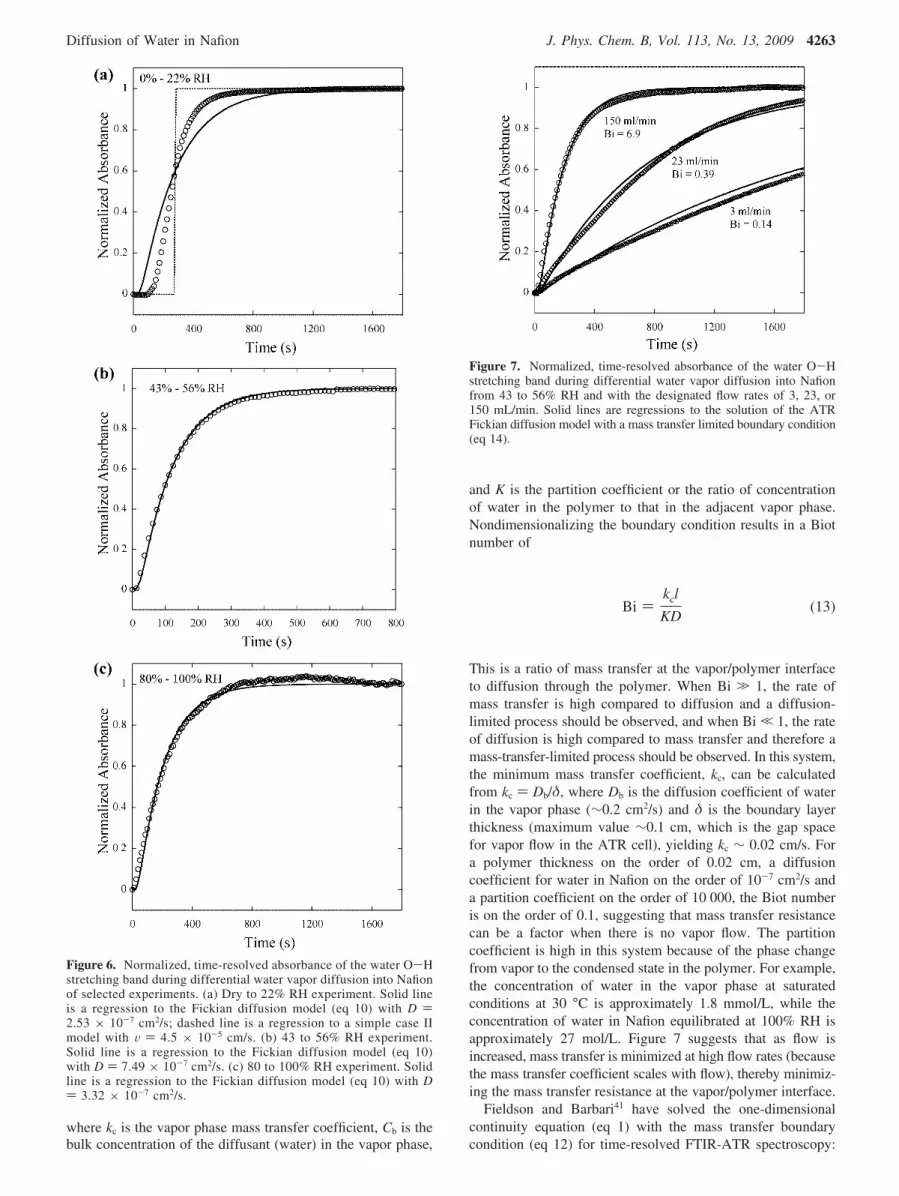
The first stage from 0 to 22% RH was normalized and is shownin Figure 6a. Similar to the integral data in Figure 4a, non-Fickianbehavior was observed, shown by a poor fit to both the Fickianmodel, indicated by the solid line, and the case II diffusion modelindicated by the dashed line. Another differential sorption experi-
ment, from 43 to 56% RH, is shown in Figure 6b. This data wasin excellent agreement with a Fickian diffusion model. Similarly,Fickian behavior was observed for other differential sorption stagesof 22 to 43% RH, 56 to 80% RH, and also 80 to 100% RH. Theseobservations (non-Fickian for 0 to 22% RH and Fickian for allother stages) were consistent with all differential experimentsperformed and also differential desorption stages. It should be notedthat the desorption step (22 to 0% RH) is non-Fickian with amarkedly different shape than the 0 to 22% RH sorption step. Inparticular, the desorption step has a slow approach to final steadystate, which may be the result of the reverse acid dissociationreaction limiting full drying.
Interestingly, the differential sorption stage of 80 to 100%RH was Fickian (Figure 6c), whereas the integral sorptionkinetics of 0 to 100% RH, shown in Figure 4c, was non-Fickian.This suggests that a rapid, large change in the concentrationgradient from pseudoglassy, dry Nafion to 100% RH saturatedinduces stresses that are not present when a smaller concentra-tion gradient was imposed from an already swollen state (80%RH saturated). Note that the integral experimental time for dryNafion to approach a pseudosteady state at 100% RH saturatedwas approximately 3 h, whereas for a differential experiment,4 h was required for the same gradient due to successiveequilibrium stages. It is evident in the 80 to 100% RHdifferential experiment that not only is the starting point aswollen polymer, but also the polymer has more time to relaxover the entire period of the experiment (4 h versus 3 h). It isinteresting to note that Satterfield and Benzinger31 measuredthe stress relaxation time constant for Nafion as a function ofwater vapor activity, where the time constant increased by 2orders of magnitude from dry Nafion to Nafion equilibrated at100% RH. This further suggests that for shorter experimentaltimes (integral experiments), diffusion and relaxation can beon similar time scales, while for longer experimental times(differential experiments), a diffusion limiting case was observed(Fickian).
Mass Transfer Resistance. Several investigators have ob-served mass transfer resistance at the vapor/polymer interfacefor water vapor sorption kinetics in Nafion.11,28,31 In this work,differential experiments were performed with different flowrates, ranging from 3 mL/min to more than 150 mL/min, toinvestigate mass transfer resistance. Figure 7 shows one step(from 43 to 56% RH) of a differential experiment conducted atthree different flow rates. This data suggests that an additionalresistance (i.e., mass transfer or boundary layer resistance atthe vapor/polymer interface) becomes a factor at lower flowrates as was observed for all differential steps.
When mass transfer resistance is significant, the boundarycondition at the vapor/polymer interface changes from a constantconcentration (eq 3) to
TABLE 2: Water Diffusion Coefficients in Nafion
av RH (%) sorption D × 107 (cm2/s) sorption errora desorption D × 107(cm2/s) desorption errora
integral experiments 21 3.19 ( 0.32 0.44 ( 0.3728 5.23 ( 0.87 0.33 ( 0.3640 3.28 ( 0.37 0.024 ( 0.012
differential experiments 32 8.57 ( 2.68 0.066 ( 0.041 6.23 ( 1.56 0.089 ( 0.01849 5.64 ( 0.91 0.12 ( 0.07 11.1 ( 2.2 0.08 ( 0.0868 5.25 ( 1.25 0.19 ( 0.21 5.58 ( 0.30 0.093 ( 0.05390 3.95 ( 2.10 0.51 ( 0.91 3.56 ( 0. 98 0.11 ( 0.05
a Average squared error between the model and the experimental data.
Figure 5. FTIR-ATR absorbance during a differential diffusionexperiment, where Nafion was cycled from dry conditions to 100%relative humidity and back to dry conditions in increments of ap-proximately 20% RH.
-D∂C∂z
)kc
K(KCb - C) @z ) l; t g 0 (12)
4262 J. Phys. Chem. B, Vol. 113, No. 13, 2009 Hallinan and Elabd
where kc is the vapor phase mass transfer coefficient, Cb is thebulk concentration of the diffusant (water) in the vapor phase,
and K is the partition coefficient or the ratio of concentrationof water in the polymer to that in the adjacent vapor phase.Nondimensionalizing the boundary condition results in a Biotnumber of
This is a ratio of mass transfer at the vapor/polymer interfaceto diffusion through the polymer. When Bi . 1, the rate ofmass transfer is high compared to diffusion and a diffusion-limited process should be observed, and when Bi , 1, the rateof diffusion is high compared to mass transfer and therefore amass-transfer-limited process should be observed. In this system,the minimum mass transfer coefficient, kc, can be calculatedfrom kc ) Db/δ, where Db is the diffusion coefficient of waterin the vapor phase (∼0.2 cm2/s) and δ is the boundary layerthickness (maximum value ∼0.1 cm, which is the gap spacefor vapor flow in the ATR cell), yielding kc ∼ 0.02 cm/s. Fora polymer thickness on the order of 0.02 cm, a diffusioncoefficient for water in Nafion on the order of 10-7 cm2/s anda partition coefficient on the order of 10 000, the Biot numberis on the order of 0.1, suggesting that mass transfer resistancecan be a factor when there is no vapor flow. The partitioncoefficient is high in this system because of the phase changefrom vapor to the condensed state in the polymer. For example,the concentration of water in the vapor phase at saturatedconditions at 30 °C is approximately 1.8 mmol/L, while theconcentration of water in Nafion equilibrated at 100% RH isapproximately 27 mol/L. Figure 7 suggests that as flow isincreased, mass transfer is minimized at high flow rates (becausethe mass transfer coefficient scales with flow), thereby minimiz-ing the mass transfer resistance at the vapor/polymer interface.
Fieldson and Barbari41 have solved the one-dimensionalcontinuity equation (eq 1) with the mass transfer boundarycondition (eq 12) for time-resolved FTIR-ATR spectroscopy:
Figure 6. Normalized, time-resolved absorbance of the water O-Hstretching band during differential water vapor diffusion into Nafionof selected experiments. (a) Dry to 22% RH experiment. Solid lineis a regression to the Fickian diffusion model (eq 10) with D )2.53 × 10⁻⁷ cm2/s; dashed line is a regression to a simple case IImodel with V ) 4.5 × 10⁻⁵ cm/s. (b) 43 to 56% RH experiment.Solid line is a regression to the Fickian diffusion model (eq 10)with D ) 7.49 × 10⁻⁷ cm2/s. (c) 80 to 100% RH experiment. Solidline is a regression to the Fickian diffusion model (eq 10) with D) 3.32 × 10⁻⁷ cm2/s.
Figure 7. Normalized, time-resolved absorbance of the water O-Hstretching band during differential water vapor diffusion into Nafionfrom 43 to 56% RH and with the designated flow rates of 3, 23, or150 mL/min. Solid lines are regressions to the solution of the ATRFickian diffusion model with a mass transfer limited boundary condition(eq 14).
Bi )kcl
KD(13)
Diffusion of Water in Nafion J. Phys. Chem. B, Vol. 113, No. 13, 2009 4263
where ns are the positive roots of n tan(n) ) R, and R ) Bi) kcl/KD. In eq 14, when R ) ∞ then eq 10 (with no masstransfer resistance) is recovered.
The data in Figure 7 was regressed to eq 14, where Bi wasthe only fitting parameter. The average diffusion coefficientsdetermined from regressing eq 10 to the high flow rate data(150 mL/min) were used as a fixed parameter for the data at allflow rates. Table 3 lists the results for the regressed Bi numbersat all flow rates for all experiments except 0 to 22% RH and 0to 100% RH. The Bi numbers at low flow rates are on the orderof 0.1, similar to the values predicted for a no flow experiment,further suggesting mass transfer resistance at low flow rates.However, at a flow rate of 150 mL/min, the Biot number wason the order of 10, suggesting diffusion-dominated phenomena.Experiments above 200 mL/min (data not shown here) werealso conducted, and these results were identical to the 150 mL/min experiments, suggesting mass transfer resistance was nolonger a factor at this flow rate.
In order to illustrate the importance of accounting for vapor-phase mass transfer, the data in this study collected at differentflow rates was also regressed to eq 10, where the diffusioncoefficient was the only fitting parameter. In other words, thedata at each flow rate was fit to the Fickian model with aconstant concentration boundary condition assuming no masstransfer resistance. The diffusion coefficients at high flow rateswere on the order of 10-7 cm2/s (Table 2), while the diffusioncoefficients at low flow rates for all differential steps were anorder of magnitude lower (10-8 cm2/s). Diffusion coefficientson this order of magnitude are similar to the values reported byothers using no-flow experiments (gravimetry), in which themass transfer resistance was not accurately accounted in themodel regression. Because of the fast diffusion of water inNafion and the large partition coefficient (phase change on watersorption from vapor into a condensed state in Nafion), vapor-phase mass transfer can be significant in mutual diffusionexperiments of water vapor into Nafion and could account forsome of the variability in the reported mutual diffusioncoefficients. With the exception of the mass transfer resistancestudy, all diffusion experiments reported in this work wereperformed at the high flow rate condition of 150 mL/min.
Accuracy. Table 2 lists the mutual sorption and desorptiondiffusion coefficients determined in this study for both integraland differential experiments. Each reported diffusion coefficientis the average and standard deviation of multiple experimentsat each condition, where diffusion coefficients were obtainedfrom regressing each experiment to the Fickian ATR diffusionmodel (eq 10). The regression consisted of minimizing the sumof squared error between the model and the experimental data,where the diffusion coefficient was the only adjustable param-eter. The average error and standard deviation of those regres-sions are also listed in Table 2. Integral experiments show alarger error compared to the differential experiments, which islikely due to the larger concentration step over which theconcentration-averaged diffusion coefficients were regressed.The diffusion coefficients reported in Table 2 are only those
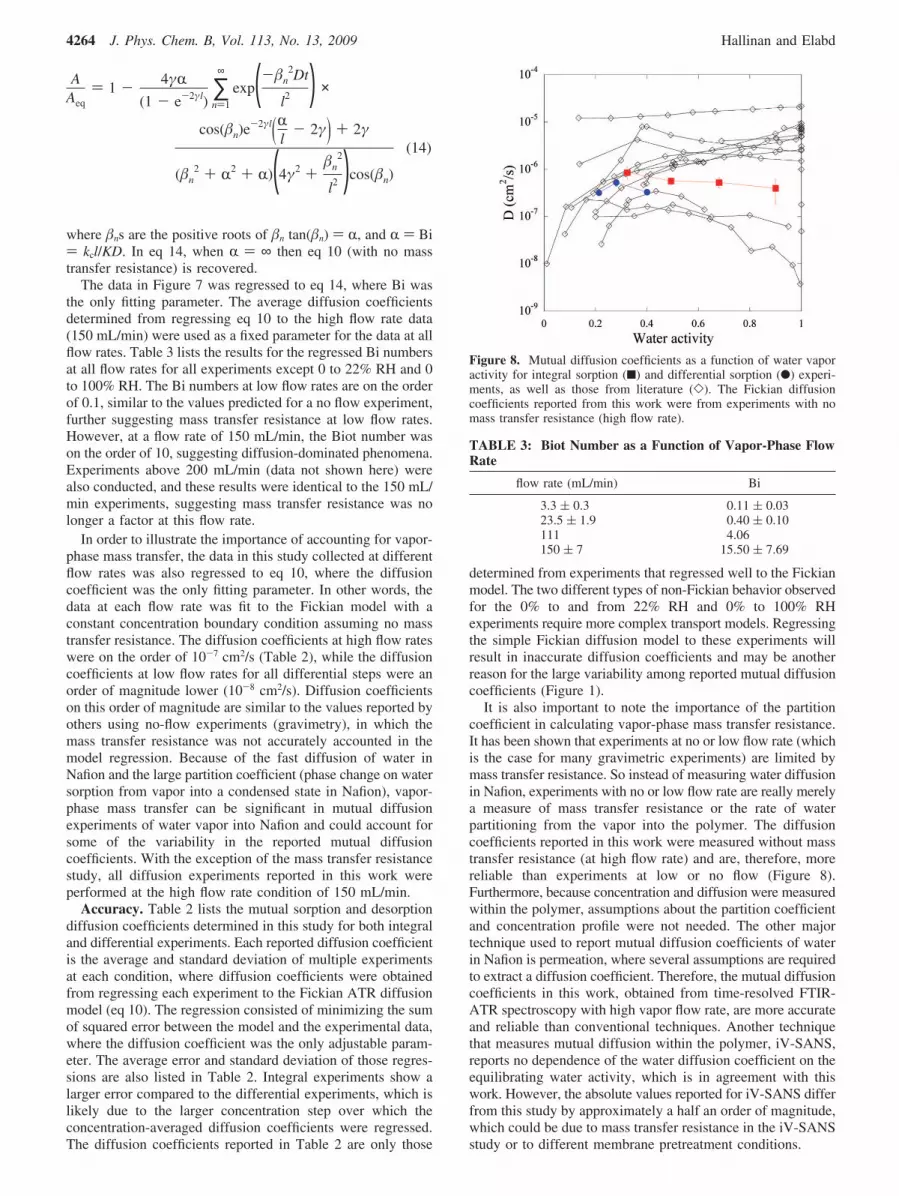
determined from experiments that regressed well to the Fickianmodel. The two different types of non-Fickian behavior observedfor the 0% to and from 22% RH and 0% to 100% RHexperiments require more complex transport models. Regressingthe simple Fickian diffusion model to these experiments willresult in inaccurate diffusion coefficients and may be anotherreason for the large variability among reported mutual diffusioncoefficients (Figure 1).
It is also important to note the importance of the partitioncoefficient in calculating vapor-phase mass transfer resistance.It has been shown that experiments at no or low flow rate (whichis the case for many gravimetric experiments) are limited bymass transfer resistance. So instead of measuring water diffusionin Nafion, experiments with no or low flow rate are really merelya measure of mass transfer resistance or the rate of waterpartitioning from the vapor into the polymer. The diffusioncoefficients reported in this work were measured without masstransfer resistance (at high flow rate) and are, therefore, morereliable than experiments at low or no flow (Figure 8).Furthermore, because concentration and diffusion were measuredwithin the polymer, assumptions about the partition coefficientand concentration profile were not needed. The other majortechnique used to report mutual diffusion coefficients of waterin Nafion is permeation, where several assumptions are requiredto extract a diffusion coefficient. Therefore, the mutual diffusioncoefficients in this work, obtained from time-resolved FTIR-ATR spectroscopy with high vapor flow rate, are more accurateand reliable than conventional techniques. Another techniquethat measures mutual diffusion within the polymer, iV-SANS,reports no dependence of the water diffusion coefficient on theequilibrating water activity, which is in agreement with thiswork. However, the absolute values reported for iV-SANS differfrom this study by approximately a half an order of magnitude,which could be due to mass transfer resistance in the iV-SANSstudy or to different membrane pretreatment conditions.
AAeq
) 1 - 4γR(1 - e-2γl)
∑n)1
∞
exp(-n2Dt
l2 ) ×
cos(n)e-2γl(Rl - 2γ) + 2γ
(n2 + R2 + R)(4γ2 +
n2
l2 )cos(n)
(14)
Figure 8. Mutual diffusion coefficients as a function of water vaporactivity for integral sorption (9) and differential sorption (b) experi-ments, as well as those from literature (]). The Fickian diffusioncoefficients reported from this work were from experiments with nomass transfer resistance (high flow rate).
TABLE 3: Biot Number as a Function of Vapor-Phase FlowRate
flow rate (mL/min) Bi
3.3 ( 0.3 0.11 ( 0.0323.5 ( 1.9 0.40 ( 0.10111 4.06150 ( 7 15.50 ( 7.69
4264 J. Phys. Chem. B, Vol. 113, No. 13, 2009 Hallinan and Elabd
Sorption and Desorption. Mixed results have been publishedon the sorption and desorption rates for water in Nafion, wheresome investigators have observed similar rates8 and others reportdesorption rates that are up to an order of magnitude higherthan sorption rates.11,31 Table 2 lists the mutual diffusioncoefficients determined in this study from both sorption anddesorption differential experiments. Over the entire activityrange, sorption and desorption kinetics are similar, where bothhave almost no dependence on water activity. These diffusivitieswere calculated at high flow rates, where mass transfer resistancewas negligible. At low flow or no flow (similar to gravimetry),mass transfer resistance will significantly impact sorptionkinetics, as previously described, but may not have a significantimpact on desorption kinetics, since the direction of transport isreversed. Others have also noted that differences in sorption anddesorption kinetics may result from mass transfer resistance.11,28
Discussion
With the use of time-resolved FTIR-ATR spectroscopy(differential and integral experiments at high flow rates), fourdifferent transport phenomena or regimes were observed: (1)low-humidity sorption, (2) moderate- and high-humidity sorptionwith small concentration gradients, (3) high-humidity sorptionwith large concentration gradients, and (4) low-humidity de-sorption. At low humidity, the water sorption absorbance dataappears non-Fickian because of an extended initial time lag thatcannot be predicted by Fickian sorption kinetics. This time lagmay be the result of the hydrolysis reaction between water andsulfonic acid sites in the polymer when the initial watermolecules sorb into dry Nafion.
This reaction may prolong the time it takes for water to reachthe polymer-crystal interface (where the absorbance of wateris detected) resulting in this extended time lag. Interestingly,the time-resolved FTIR-ATR spectra provides experimentalevidence of all four species in the hydrolysis or dissociationreaction (eq 15) as shown in Figure 2, where bands for water,H2O (at 3450 and 1630 cm-1), anhydrous sulfonic acid, SO3H(at 2722 and 2220 cm-1), protonated water ion, (H2O)nH+ (at1715 cm-1), and sulfonate anion, SO3
- (at 1060 cm-1; not shownin Figure 2) are present. In addition, as predicted from thestoichiometric reaction, the rate of SO3H decrease matches therate of increase in (H2O)nH+ and SO3
- and is on the sametime scale as the time lag in H2O sorption. The experimentalevidence of the hydrolysis reaction at low humidities furthersupports the theory that the reaction consumes water and causesthe extended initial time lag at low humidities.
In the second regime, a simple Fickian model accuratelyregressed to the normalized water absorbance data. Not onlywas water diffusion in Nafion Fickian in this regime, but alsothe dependence of the water diffusion coefficient on relativehumidity (and therefore water content in Nafion) was shown tobe fairly insignificant. This is important with respect to thehydrogen fuel cell, where performance is related to protonconductivity, which is a strong function of water content inNafion.
The third regime exhibited non-Fickian behavior in the formof water sorption having a slow approach to steady statesuggesting that polymer relaxation and water sorption kineticsare on a similar time scale. Interestingly, the time-resolvedFTIR-ATR spectra also provide information regarding polymer
relaxation, where infrared bands associated with the polymerbackbone and side chain, such as sulfur oxygen (S-O), ether(C-O-C), and carbon fluorine (C-F) were observed anddecreased with time during water sorption. The rates of decreaseof S-O and C-O-C absorbance were similar, while that ofC-F was slower. It is generally accepted that Nafion is a phase-segregated two-phase system consisting of hydrophilic ion-richdomains within an ion-poor hydrophobic matrix. Both the S-Oand C-O-C groups would be located in the hydrophilicdomains and therefore decrease due to being diluted as waterdiffuses into and swells those domains. The swelling of thehydrophilic domains will impose a stress on the hydrophobicmatrix. The concentration of the hydrophobic matrix, orabsorbance of the C-F groups, will therefore not decrease fromwater diffusion because no significant amount of water entersthat domain. The C-F absorbance decrease will only be inducedby polymer relaxation, which dissipates the stress imposed bythe hydrophilic domains. It is possible then to apply a relaxationmodel to the C-F absorbance, where it would be possible toseparate polymer relaxation from water diffusion.
Finally, the fourth regime (low humidity desorption) was non-Fickian with a different shape from low-humidity sorption. Itstands to reason that the reverse of the acid dissociation reactioncould be occurring under these conditions. A slower reversereaction rate constant would be expected based on the strengthof sulfonic acid, which may explain the slow approach to steadystate in these experiments.
It is important to point out that Nafion is typically purifiedaccording to a standard protocol, as was done in this work priorto all diffusion experiments. However, varying the pretreatmentcondition can impact Nafion morphology and therefore bothwater content and diffusion. For example, Hinatsu, et al.45 havestudied Nafion in three forms, which they refer to as unpurified,expanded, and shrunken. Unpurified or as-received Nafionconsisted of no pretreatment procedure and had a water uptakeof 27 wt %.46 Expanded Nafion consisted of performing astandard purification procedure and can be recovered from adry membrane by boiling in water and has a water uptake of34 wt % at room temperature. Shrunken Nafion consisted offully drying the expanded form, where the water uptake wasreported as 20 wt % at room temperature.47 The effect of historyis more complex than this simple example, because shrunkenNafion has varying degrees of water content based on thetemperature of drying.10,47 This history dependence suggests thatNafion is in a nonequilibrium state, typical of glassy polymersand random graft copolymers.48 Therefore, the prediction ofwater content in Nafion would require a nonequilibriumthermodynamic model. The overall purpose of this work wasto assess diffusion kinetics and not the equilibrium state of waterin Nafion. However, it is important to highlight the pseudoequi-librium state of water in Nafion even at long equilibration times,which is best observed in this work in the 0 to 100% RHsorption and 22 to 0% RH desorption experiments.
Conclusions
Time-resolved FTIR-ATR spectroscopy allows for the de-termination of accurate mutual diffusion coefficients withmolecular-scale resolution. In this study, mutual diffusioncoefficients of water in Nafion were measured as a function ofwater vapor activity. Both integral and differential experimentsshow Fickian behavior at moderate activities. Fickian behaviorwas also observed for differential experiments at higher activi-ties. Accurate Fickian diffusion coefficients were regressed fromthis data at high flow rates (where mass transfer resistance was
H2O + SO3H T H3O+ + SO3
- (15)
Diffusion of Water in Nafion J. Phys. Chem. B, Vol. 113, No. 13, 2009 4265
negligible). Sorption and desorption coefficients were similarover the entire activity range, were on the order of 10-7 cm2/s,and were weak functions of vapor phase activity. At lowactivities, non-Fickian behavior was observed, while anothertype of non-Fickian behavior was observed for a large step inactivity (0 to 100% RH).
More specifically, four different transport regimes wereobserved: (1) low-humidity sorption, (2) moderate- and high-humidity sorption with small concentration gradients, (3) high-humidity sorption with large concentration gradients, and (4)low-humidity desorption. There are several important things tonote regarding the four regimes of water sorption and desorptionkinetics observed in this study. The data in this study usingtime-resolved FTIR-ATR spectroscopy is the first to the authors’knowledge that report on all four phenomena using onetechnique. In particular, one of these regimes has not beenobserved before (e.g., low-humidity desorption) using anytechnique. In addition, the time-resolved FTIR-ATR spectraprovides real-time molecular information regarding the aciddissociation reaction and polymer relaxation, which not onlyprovides new insights into the fundamental transport mecha-nisms of water in Nafion but this data can also be used inconjunction with more complex models that accurately capturediffusion-reaction and diffusion-relaxation phenomena withminimal fitting parameters required. These models are currentlybeing developed to accurately account for the additionalphenomena observed in these experiments.
Acknowledgment. The authors acknowledge the financialsupport of the National Science Foundation (CARRER 0644593;IGERT 0221664) and the U.S. Army Research Office (W911NF-07-1-0149). The authors also thank Prof. Giulio Sarti of theUniversity of Bologna for helpful discussions regarding thiswork.
References and Notes
(1) Mauritz, K. A.; Moore, R. B. Chem. ReV. 2004, 104, 4535–4585.(2) Larminie, J.; Dicks, A. Fuel Cell Systems Explained, 2nd ed.; Wiley:
New York, 2003.(3) Mathias, M. F.; Makharia, R.; Gasteiger, H. A.; Conley, J. J.; Fuller,
T. J.; Gittleman, C. J.; Kocha, S. S.; Miller, D. P.; Mittelsteadt, C. K.; Xie,T.; Yan, S. G.; Yu, P. T. Electrochem. Soc. Interface 2005, 14, 24–35.
(4) Edinger, R.; Kaul, S. Sustainable Mobility: Renewable Energiesfor Powering Fuel Cell Vehicles; Praeger Publishers: Santa Barbara, CA,2003.
(5) Zawodzinski, T. A., Jr.; Neeman, M.; Sillerud, L. O.; Gottesfeld,S. J. Phys. Chem. 1991, 95, 6040–6044.
(6) Edmondson, C. A.; Fontanella, J. J. Solid State Ionics 2002, 152-153, 355–361.
(7) Hallinan Jr., D. T.; Elabd, Y. A. J. Phys. Chem. B 2007, 111, 13221–13230.
(8) Morris, D. R.; Sun, X. J. Appl. Polym. Sci. 1993, 50, 1445–1452.(9) Legras, M.; Hirata, Y.; Nguyen, Q. T.; Langevin, D.; Metayer, M.
Desalination 2002, 147, 351–357.(10) De Angelis, M. G.; Lodge, S.; Giacinti Baschetti, M.; Sarti, G. C.;
Doghieri, F.; Sanguineti, A.; Fossati, P. Desalination 2006, 193, 398–404.
(11) Rivin, D.; Kendrick, C. E.; Gibson, P. W.; Schneider, N. S. Polymer2001, 42, 623–635.
(12) Reineke, C. A.; Moll, D. J.; Reddy, D.; Wessling, R. A. WaterTransport in Ionic Polymers; Water in Polymers; American ChemicalSociety: Washington, DC, 1980; pp 69-84.
(13) Ye, X.; LeVan, D. J. Membr. Sci. 2003, 221, 147–161.(14) Zelsmann, H. R.; Pineri, M.; Thomas, M.; Escoubes, M. J. Appl.
Polym. Sci. 1990, 41, 1673–1684.(15) Zhang, J.; Giotto, M. V.; Wen, W. Y.; Jones, A. A. J. Membr. Sci.
2006, 269, 118–125.(16) Kreuer, K. D.; Paddison, S. J.; Spohr, E.; Schuster, M. Chem. ReV.
2004, 104, 4637–4678.(17) Gong, X.; Bandis, A.; Tao, A.; Meresi, G.; Wang, Y.; Inglefield,
P. T.; Jones, A. A.; Wen, W.-Y. Polymer 2001, 42, 6485–6492.(18) Tsushima, S.; Teranishi, K.; Hirai, S. Energy 2005, 30, 235–245.(19) Kim, M.-H.; Glinka, C. J.; Grot, S. A.; Grot, W. G. Macromolecules
2006, 39, 4775–4787.(20) Pivovar, A. M.; Pivovar, B. S. J. Phys. Chem. B 2005, 109, 785–
793.(21) Elabd, Y. A.; Barbari, T. A. AIChE J. 2002, 48, 1610–1620.(22) Elabd, Y. A.; Barbari, T. A. AIChE J. 2001, 47, 1255–1262.(23) Pushpa, K. K.; Nandan, D.; Iyer, R. M. J. Chem. Soc., Faraday
Trans. 1988, 84, 2047–2056.(24) Laporta, M.; Pegoraro, M.; Zanderighi, L. Phys. Chem. Chem. Phys.
1999, 1, 4619–4628.(25) Gruger, A.; Regis, A.; Schmatko, T.; Colomban, P. Vib. Spectrosc.
2001, 26, 215–225.(26) Ostrowska, J.; Narebska, A. Colloid Polym. Sci. 1983, 261, 93–
98.(27) Falk, M. Can. J. Chem. 1980, 58, 1495–1501.(28) Ge, S. H.; Li, X. G.; Yi, B. L.; Hsing, I. M. J. Electrochem. Soc.
2005, 152, A1149–A1157.(29) Krtil, P.; Trojanek, A.; Samec, Z. J. Phys. Chem. B 2001, 105,
7979–7983.(30) Majsztrik, P. W.; Satterfield, M. B.; Bocarsly, A. B.; Benziger, J. B.
J. Membr. Sci. 2007, 301, 93–106.(31) Satterfield, M. B.; Benziger, J. B. J. Phys. Chem. B 2008, 112,
3693–3704.(32) Billovits, G. F.; Durning, C. J. Macromolecules. 1993, 26, 6927–
6936.(33) Elabd, Y. A.; Baschetti, M. G.; Barbari, T. A. J. Polym. Sci. Part
B: Polym Phys. 2003, 41, 2794–2807.(34) Opilski, Z.; Pustelny, T.; Maciak, E.; Bednorz, M.; Stolarczyk, A.;
Jadamiec, M. Bull. Pol. Acad.: Tech. 2005, 53, 151–156.(35) Elabd, Y. A. Ph.D. Dissertation, Johns Hopkins University, 2000.(36) Buck, U.; Huisken, F. Chem. ReV. 2000, 100, 3863–3890.(37) Pereira, M. R.; Yarwood, J. J. Chem. Soc., Faraday Trans. 1996,
92, 2731–2735.(38) Murphy, D.; de Pinho, M. N. J. Membr. Sci. 1995, 106, 245–257.(39) Leiderman, P.; Gepshtein, R.; Uritski, A.; Genosar, L.; Huppert,
D. J. Phys. Chem. A 2006, 110, 9039–9050.(40) Sarti, G. C.; Doghieri, F. Chem. Eng. Sci. 1994, 49, 733–748.(41) Fieldson, G. T.; Barbari, T. A. AIChE J. 1995, 41, 795–804.(42) Marcus, Y. Fluid Phase Equilib. 1999, 164, 131–142.(43) Berens, A. R.; Hopfenberg, H. B. Polymer 1978, 19, 489–496.(44) Durning, C. J. J. Polym. Sci.: Polym. Phys. Ed. 1985, 23, 1831–
1855.(45) Hinatsu, J. T.; Mizuhata, M.; Takenaka, H. J. Electrochem. Soc.
1994, 141, 1493–1498.(46) Moore, R. B.; Cable, K. M.; Croley, T. L. J. Membr. Sci. 1992,
75, 7–14.(47) Zawodzinski, T. A., Jr.; Derouin, C.; Radzinski, S.; Sherman, R. J.;
Smith, V. T.; Springer, T. E.; Gottesfeld, S. J. Electrochem. Soc. 1993,140, 1041–1047.
(48) Eitouni, H. B.; Rappl, T. J.; Gomez, E. D.; Balsara, N. P.; Qi, S.;Chakraborty, A. K.; Frechet, J. M. J.; Pople, J. A. Macromolecules 2004,37, 8487–8490.
JP811325V
4266 J. Phys. Chem. B, Vol. 113, No. 13, 2009 Hallinan and Elabd


