Embed Size (px)
Citation preview
Determining Competitive Advantage and Feasibility Study of Steam Power Plant in Kalimantan Tengah
Astien Setianingrum1, Johan Oscar Ong2 Faculty of Engineering, Industrial Engineering Department, President University
Jl. Ki Hajar Dewantara Kota Jababeka,Cikarang, Bekasi - Indonesia 17550 Email: [email protected] , [email protected]
ABSTRACT This journal explores the feasibility study analysis of a steam power plant project which is
conducted by PT Pamapersada Nusantara (PAMA). Previously, PAMA has identified its strategy to expand the market and the result is business diversification in power plant construction. This statement becomes the background of the project. The project feasibility is checked based on three aspects: marketing, technical, and financial. Before those aspects are analyzed, the study of power plant engineering is elaborated here to help in understanding the power plant process. The marketing aspects used SWOT analysis and Porter 5 Forces to define the competitive advantage. Then, the technical aspects discussed about the project location, specification, and schedule of construction and operation. The project feasibility is evaluated by conducting financial analysis by calculating payback period, NPV, and IRR. The result is the project constructs 2x60 steam power plant that has 25 years lifetime with 80% capacity factor in Kapuas district, Kalimantan Tengah. The operation is started in 2017. The electricity is distributed to PLN, internal company, and loading port at excess power tariff. This project is feasible since the NPV is positive. The IRR is 16.71% and the payback time of investment is in 2027.
Keywords: power plant construction, operation, SWOT, competitive, feasible, payback period, NPV, IRR, investment
1. Introduction
PAMA is Indonesia leading mining contractor since 1992. Its market share in Indonesia is 41.4% compare to other competitors in 2013. Has been running 20 years, PAMA only runs its business in mining construction whereas it has strengths and opportunities to expand the market. PAMA conducts a business diversification as the strategy for its market expansion. Related to coal, PAMA diversifies its business in power plant construction by making a project of steam power plant. It is known that the number of coal resources in Indonesia is very high especially in Kalimantan. PAMA has three subsidiaries as coal producer in Kalimantan Tengah. While, Kalimantan Tengah has 5-6 billion tons of coal. On the contrary, the coal price since 2013 is very low. It only reach $76 per tons while in the previous year, the price can be more than $90 per tons. Because of that, many companies reduce the number of coal export due to the low price. Moreover, the government establish a new policy to increase coal domestic utilization. It is aligned with the National Electricity Development Program which is arranged in Rencana Umum Ketenagalistrikan Nasional 2012-2031 by General Directorate of Electricity and Energy Utilization. Before the implementation, the project is analyzed if it is feasible through three aspects; marketing, technical, and financial. Beside the project feasibility, this research will result a product competitive advantage. In this case PAMA wants to analyze the feasibility of its power plant construction project. Thus, the objectives of this research are to gives an overview of electricity supply in Kalimantan Tengah, to develop power plant capacity in Kalimantan Tengah, to determine the competitive advantage of steam plant, and analyze the project feasibility.
2. Methods
The method in this research is feasibility study analysis. Feasible or feasibility has related meaning to the probability of achievement level of identified objectives (Soeharto, 2002). Assessment of feasibility is done by conducting a group of activities starting from developing, analyzing, and selecting the idea until exploring many aspects (market, technical, financial, social, environment, law, etc.) and the result of project implementation. This comprehensive assessment also observe the project feasibility aspects and investment. Then, it should be able to present a quantitative result of analysis. This research only discuss marketing analysis, technical analysis, and financial analysis. 2.1. Marketing Analysis
Marketing aspect has a function to relate a management of an organization with the related market through information. Marketing aspects discuss the relationship between buyer and supplier. Based on the principle of marketing (Kotler, 2006), the marketing aspects will be analyzed through marketing mix. This term will also elaborates the competitive advantage and the strategy to reach competitive advantage. 2.1.1. Marketing Mix
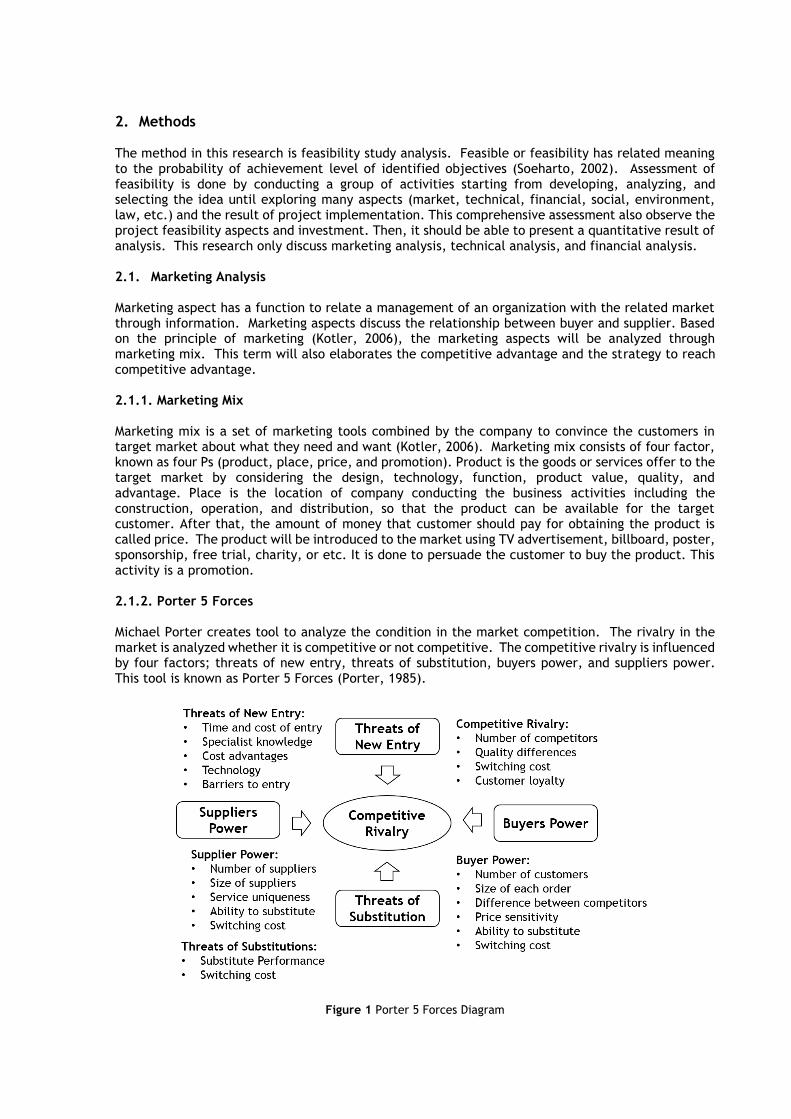
Marketing mix is a set of marketing tools combined by the company to convince the customers in target market about what they need and want (Kotler, 2006). Marketing mix consists of four factor, known as four Ps (product, place, price, and promotion). Product is the goods or services offer to the target market by considering the design, technology, function, product value, quality, and advantage. Place is the location of company conducting the business activities including the construction, operation, and distribution, so that the product can be available for the target customer. After that, the amount of money that customer should pay for obtaining the product is called price. The product will be introduced to the market using TV advertisement, billboard, poster, sponsorship, free trial, charity, or etc. It is done to persuade the customer to buy the product. This activity is a promotion. 2.1.2. Porter 5 Forces Michael Porter creates tool to analyze the condition in the market competition. The rivalry in the market is analyzed whether it is competitive or not competitive. The competitive rivalry is influenced by four factors; threats of new entry, threats of substitution, buyers power, and suppliers power. This tool is known as Porter 5 Forces (Porter, 1985).
Figure 1 Porter 5 Forces Diagram
2.2. Technical Analysis The project is also analyzed technically in terms of location, schedule, and product specification. Selecting a location for a project should be based on an economical unit of the project is going to be installed, whether in point of construction (land, climate, and earthquake) or operational performance and future production. The location should consider the availability of raw material, basic needs, communication, infrastructure, and also the distribution path. Next, there is a project schedule arranges how many times required to finish the project, what activity should be done, and who has the responsibility for each project. In the project schedule, the activity arranged can give information about resource allocation, budget, and duration. Its objectives are to identify the specific project duration, to maintain the activity based on plan, to make the project finished punctually, to give an overview for budgeting in financial analysis. 2.3. Financial Analysis
This is the closing of evaluation that calculate the whole fund needed in marketing and technical aspects. It also discuss about how the profitable financial structure, the capital resources and how much the capital required, and when the turnover time and time for company reach profit. This analysis gives information the project is feasible if it is profitable and able to satisfy the financial obligation. The project feasibility is defined using calculation of Net Present Value, Internal Rate of Return, and Payback Period. The data is obtained by company financial report in the cash flow. Cash flow can be said as a statement reporting company revenues and expenses including the taxes and loan repayment. 2.3.1. Net Present Value (NPV)
Net Present Value (NPV) is the difference between current investment and cash income in the future. The rate in NPV is defined using MARR (Minimum Acceptable Rate of Return). The investment is feasible when the value of NPV is positive. It will not be feasible if its value is negative. This is the equation to define NPV (Brigham, 2011):
𝑃𝑉 = ∑𝐴𝑡
(1+𝑘)𝑡𝑛𝑡=0 (1)
Where, t = time of cash flow k = required rate of return At = net cash flow in t
2.3.2. Internal Rate of Return (IRR)
The present value of expected cash outflows is equated to the present value of expected inflow using a discount rate, called Internal Rate of Return (IRR), which is represented by the rate r. (Brigham, 2011).
∑ [𝐴𝑡
(1+𝑟)𝑡] = 0𝑛𝑡=0 (2)
where, A = cash flow for period t n = the last period in which a cash flow is expected r = rate that discounts the stream of future cash flows – A1, through An – to equal the initial outlay
at time 0, A0
2.3.3. Payback Period This method determines the time of the investment going back. The unit is not in percentage but in time (year, month, etc.). It is the ratio of the initial fixed investment over the annual cash inflows for the recovery period. If the payback period is shorter than the plan means the project is profitable but, if it is longer than the plan, the project will be rejected (Brigham, 2011).
𝑷𝒂𝒚𝒃𝒂𝒄𝒌 𝑷𝒆𝒓𝒊𝒐𝒅 =Initial Investment
Cash flow per Period (3)
3. Result and Discussion
PT Pamapersada Nusantara (PAMA) will build a steam power plant that will be used to supply electricity for Kalimantan Tengah area and its internal usage. The electricity for public in Kalimantan Tengah is distributed through PLN transmission. The result of analysis will be divided into three parts based on aspects of marketing, technical, and financial. 3.1. Marketing Aspects
Aspect of marketing consists of customer and seller that meet in a commercial transaction. Marketing aspects will discuss about the customer target, what the strategy is, and what kind of product will be launched. First, the essential thing should be considered before launch the product is demand. 3.1.1. Demand
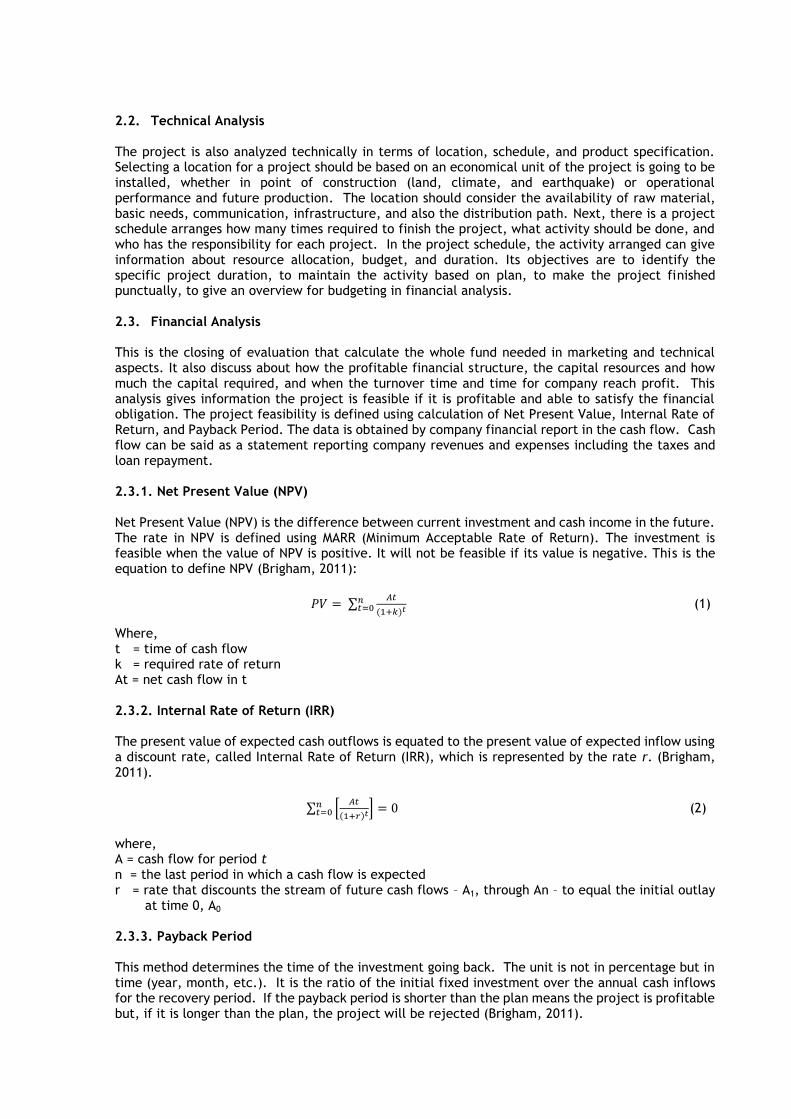
The customer’s desire and ability to buy the goods or services is called demand. In this case, PAMA will distribute electricity to public and its subsidiaries. The demand is obtained by the number of electricity consumption in Kalimantan Tengah. It is projected from 2012 to 2031.
Source: Rancangan Umum Ketenagalistrikan Nasional 2012-2031
Figure 2 Electricity Consumption based on Sector in Kalimantan Tengah
Firstly, the biggest number of consumption is from household sector and followed by business, public, and industry sector. Household consumption is about 60% in 2012 until 2017 and decrease become 53% from 2018 until 2021. Business consumption is about 20% to 33% since 2012 until 2021. Then,
0
500
1000
1500
2000
2012 2013 2014 2015 2016 2017 2018 2019 2020 2021
Electricity Consumption in Kalimantan Tengah
2012 - 2021
Household Business Public
Industry TOTAL
0
2000
4000
6000
8000
2022 2023 2024 2025 2026 2027 2028 2029 2030 2031
Electricity Consumption in Kalimantan Tengah
2022 - 2031
Household Business Public
Industry TOTAL

public consumption consists of social consumption, government building, and public road. It spends only 10% for public consumption. The smallest number among other is for industry sector that only 2,9%. In the second graph, it is shown that business sector increases its electricity demands. Even it overcomes the household sector. The demands between them become similar in 2025 and for the following year, business sector has bigger number of demands. It is because Kalimantan Tengah is predicted to develop many businesses in the future. Kalimantan Tengah has three districts considered as national strategic areas. This also leads many investors coming to open their business.
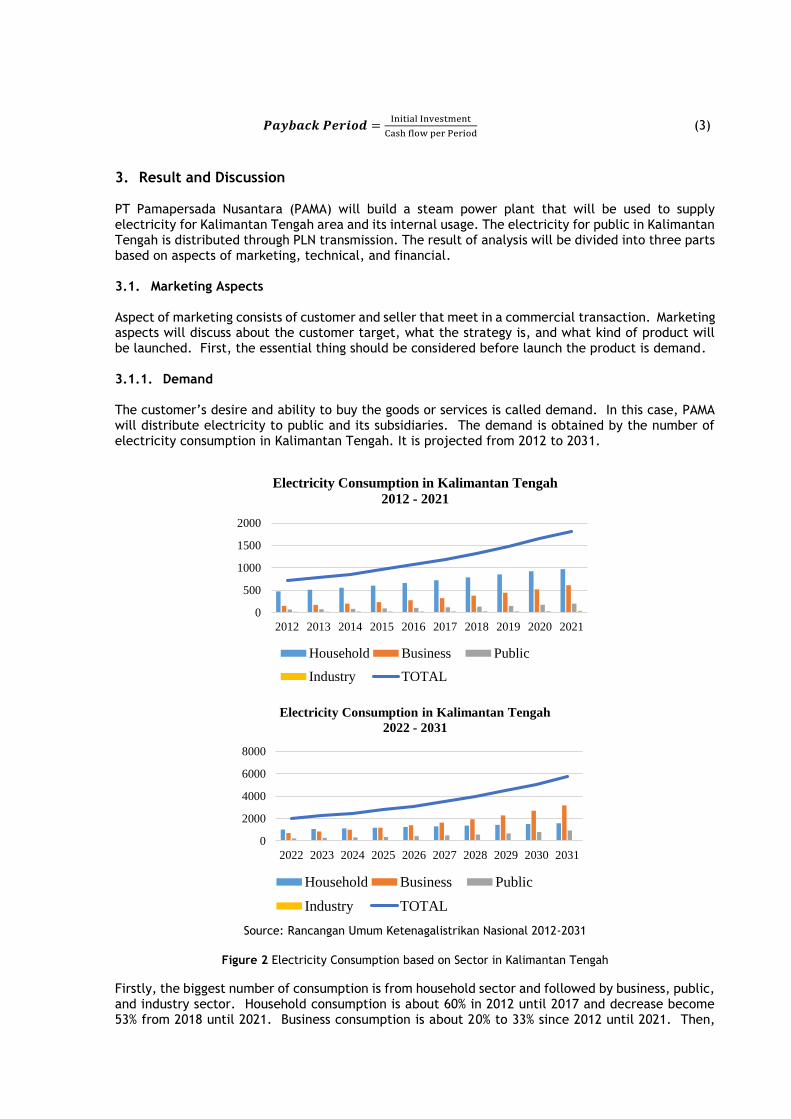
Source: Rencana Umum Ketenagalistrikan Nasional, 2012-2031
Figure 3 Electricity Supply Capacity in Kalimantan Tengah
The number of power requirements in Kalimantan Tengah increase about 10% per year. The population growth and the industry development may influence electricity needs. However, the number of existing capacity will decrease about 2% per year. The decline can be caused by the depreciation of the power plant. The difference between the number of power requirements and the number of existing capacity is the number of electricity power should be satisfied.
3.1.2. Marketing Mix
Marketing mix has three factors that are known as 4Ps: product, place, price, and promoting (Kotler, 2006). The marketing mix will be discussed only product, price, and place. a. Product
It is the goods or service that a firm offers to the target customers. The product is steam power plant that its capacity is defined by the demand of electricity. It uses coal for the resources. The electricity demand of Kalimantan Tengah which needs 364 MW. This number is obtained from the calculation in Figure 2 which the power requirements in 2021 is 496 MW and the existing capacity is 132 MW. The plan is the steam power plant will supply internal consumption and partial public consumption. So, the project will construct 2x60 MW steam power plant.
b. Place Place is the location of company conducting the business activities so that the product can be available for the target customer. The activity of supplying electricity is conducted in Kalimantan Tengah since coal reserved can be found there. The place will be in area of PT Asmin Bara Bronang, PT Asmin Bara Jaan, and PT Telen Orbit Prima.
c. Price Price means the amount of money that customer should pay for obtaining the product. PAMA will sell the electricity at excess power tariff which is $83.00/MWh. The price is charged both for external sales and internal sales. This price is expected to provide high quality product and much better than other suppliers.
0
200
400
600
800
1000
Electricity in Kalimantan Tengah
Requirements Existing Capacities
3.1.3. SWOT
To define the competitive advantage, company should know first what factor that can help it to achieve competitive advantage and what factor should be eliminated. So, company will be able to win in market competition.
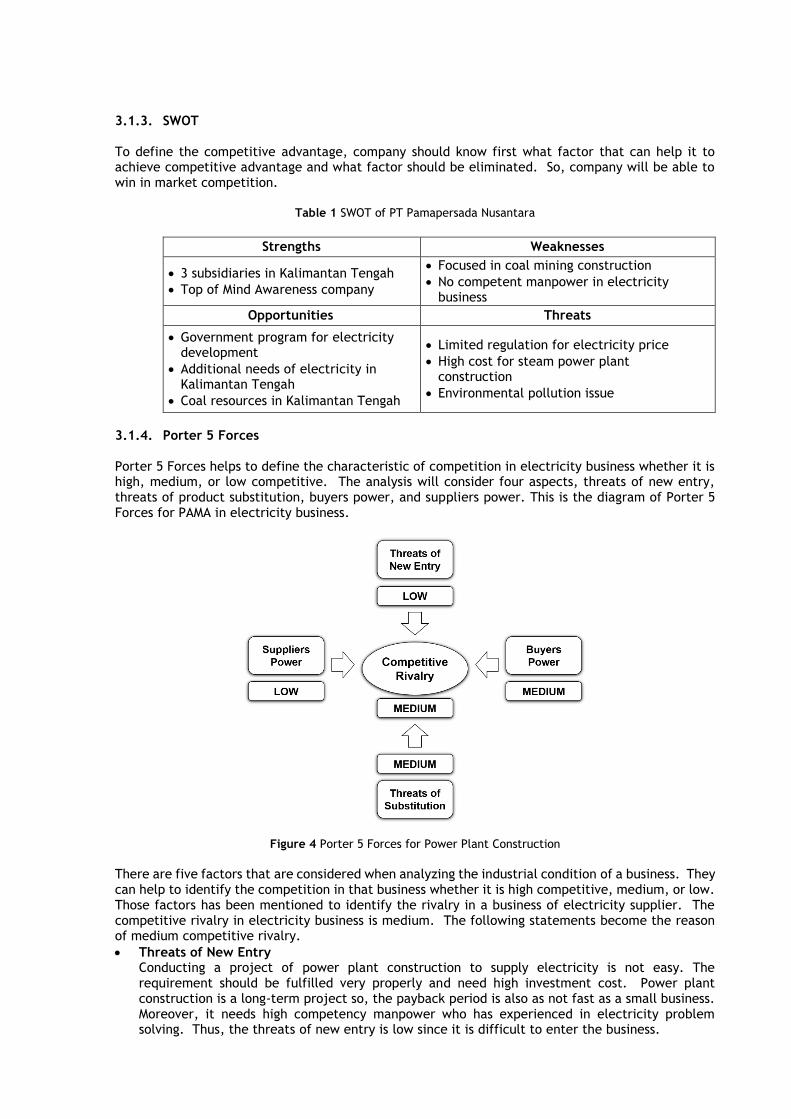
Table 1 SWOT of PT Pamapersada Nusantara
Strengths Weaknesses
3 subsidiaries in Kalimantan Tengah
Top of Mind Awareness company
Focused in coal mining construction
No competent manpower in electricity business
Opportunities Threats
Government program for electricity development
Additional needs of electricity in Kalimantan Tengah
Coal resources in Kalimantan Tengah
Limited regulation for electricity price
High cost for steam power plant construction
Environmental pollution issue
3.1.4. Porter 5 Forces
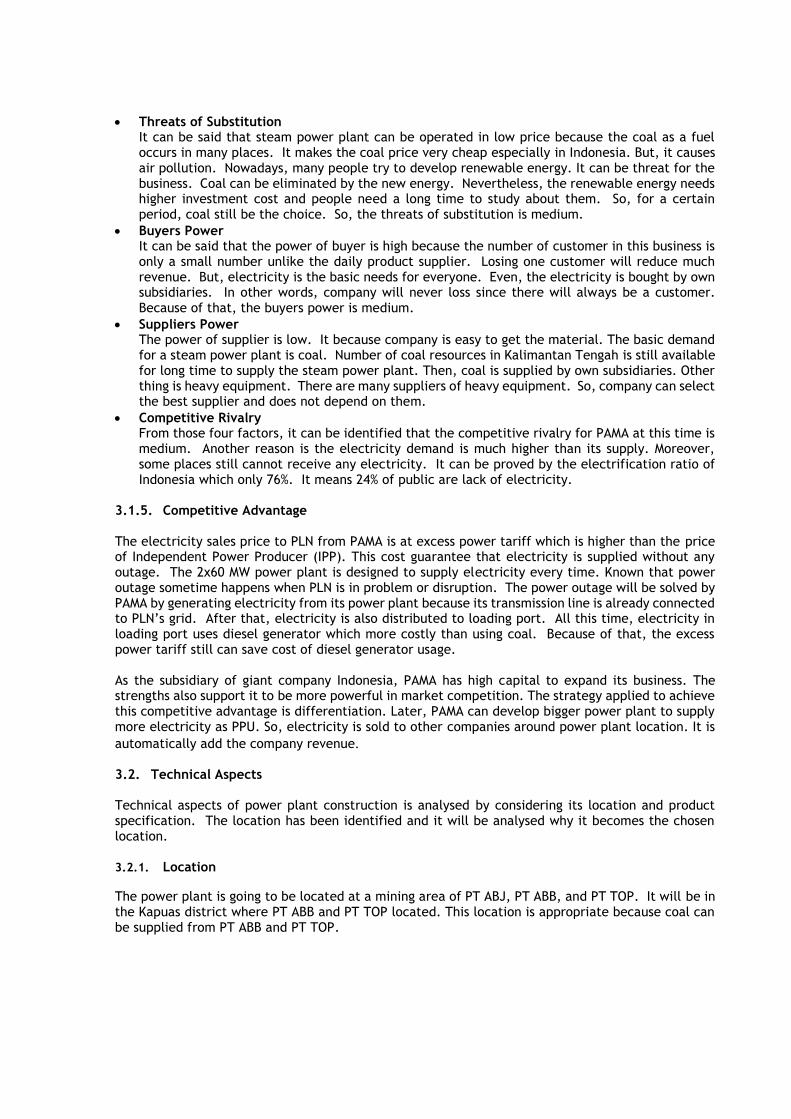
Porter 5 Forces helps to define the characteristic of competition in electricity business whether it is high, medium, or low competitive. The analysis will consider four aspects, threats of new entry, threats of product substitution, buyers power, and suppliers power. This is the diagram of Porter 5 Forces for PAMA in electricity business.
Figure 4 Porter 5 Forces for Power Plant Construction
There are five factors that are considered when analyzing the industrial condition of a business. They can help to identify the competition in that business whether it is high competitive, medium, or low. Those factors has been mentioned to identify the rivalry in a business of electricity supplier. The competitive rivalry in electricity business is medium. The following statements become the reason of medium competitive rivalry.
Threats of New Entry Conducting a project of power plant construction to supply electricity is not easy. The requirement should be fulfilled very properly and need high investment cost. Power plant construction is a long-term project so, the payback period is also as not fast as a small business. Moreover, it needs high competency manpower who has experienced in electricity problem solving. Thus, the threats of new entry is low since it is difficult to enter the business.
Threats of Substitution It can be said that steam power plant can be operated in low price because the coal as a fuel occurs in many places. It makes the coal price very cheap especially in Indonesia. But, it causes air pollution. Nowadays, many people try to develop renewable energy. It can be threat for the business. Coal can be eliminated by the new energy. Nevertheless, the renewable energy needs higher investment cost and people need a long time to study about them. So, for a certain period, coal still be the choice. So, the threats of substitution is medium.
Buyers Power It can be said that the power of buyer is high because the number of customer in this business is only a small number unlike the daily product supplier. Losing one customer will reduce much revenue. But, electricity is the basic needs for everyone. Even, the electricity is bought by own subsidiaries. In other words, company will never loss since there will always be a customer. Because of that, the buyers power is medium.
Suppliers Power The power of supplier is low. It because company is easy to get the material. The basic demand for a steam power plant is coal. Number of coal resources in Kalimantan Tengah is still available for long time to supply the steam power plant. Then, coal is supplied by own subsidiaries. Other thing is heavy equipment. There are many suppliers of heavy equipment. So, company can select the best supplier and does not depend on them.
Competitive Rivalry From those four factors, it can be identified that the competitive rivalry for PAMA at this time is medium. Another reason is the electricity demand is much higher than its supply. Moreover, some places still cannot receive any electricity. It can be proved by the electrification ratio of Indonesia which only 76%. It means 24% of public are lack of electricity.
3.1.5. Competitive Advantage
The electricity sales price to PLN from PAMA is at excess power tariff which is higher than the price of Independent Power Producer (IPP). This cost guarantee that electricity is supplied without any outage. The 2x60 MW power plant is designed to supply electricity every time. Known that power outage sometime happens when PLN is in problem or disruption. The power outage will be solved by PAMA by generating electricity from its power plant because its transmission line is already connected to PLN’s grid. After that, electricity is also distributed to loading port. All this time, electricity in loading port uses diesel generator which more costly than using coal. Because of that, the excess power tariff still can save cost of diesel generator usage. As the subsidiary of giant company Indonesia, PAMA has high capital to expand its business. The strengths also support it to be more powerful in market competition. The strategy applied to achieve this competitive advantage is differentiation. Later, PAMA can develop bigger power plant to supply more electricity as PPU. So, electricity is sold to other companies around power plant location. It is
automatically add the company revenue.
3.2. Technical Aspects
Technical aspects of power plant construction is analysed by considering its location and product specification. The location has been identified and it will be analysed why it becomes the chosen location. 3.2.1. Location
The power plant is going to be located at a mining area of PT ABJ, PT ABB, and PT TOP. It will be in the Kapuas district where PT ABB and PT TOP located. This location is appropriate because coal can be supplied from PT ABB and PT TOP.
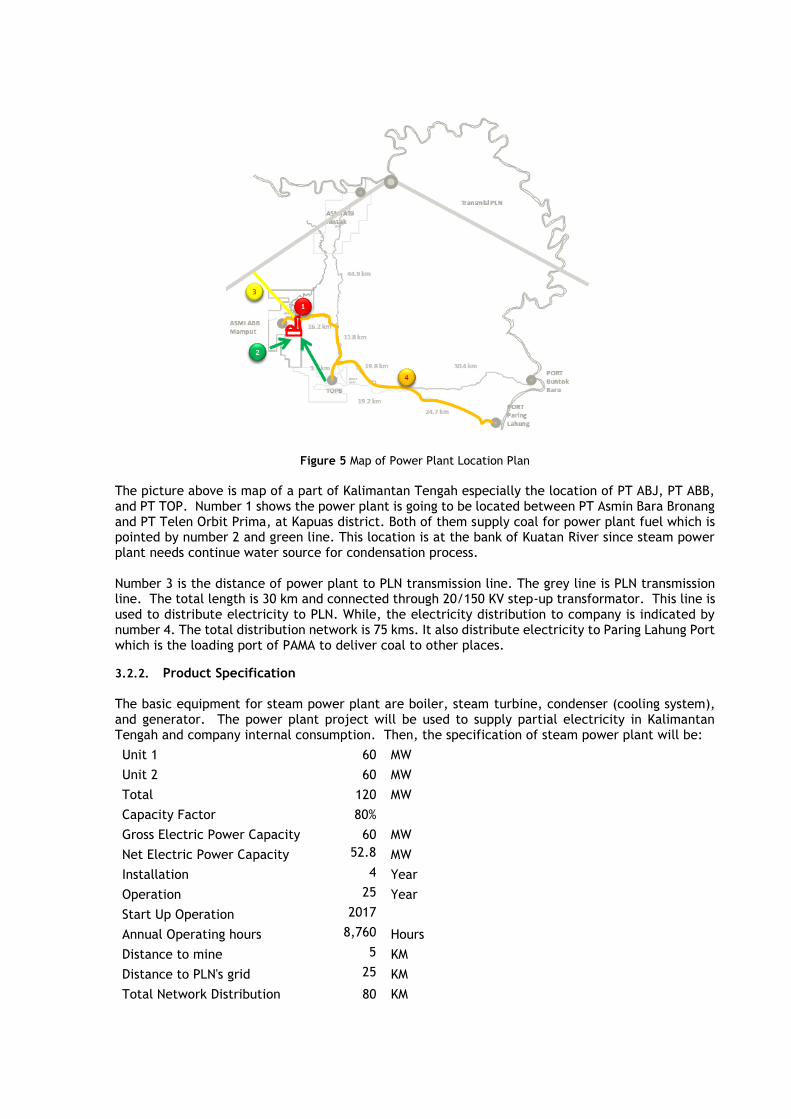
Figure 5 Map of Power Plant Location Plan
The picture above is map of a part of Kalimantan Tengah especially the location of PT ABJ, PT ABB, and PT TOP. Number 1 shows the power plant is going to be located between PT Asmin Bara Bronang and PT Telen Orbit Prima, at Kapuas district. Both of them supply coal for power plant fuel which is pointed by number 2 and green line. This location is at the bank of Kuatan River since steam power plant needs continue water source for condensation process. Number 3 is the distance of power plant to PLN transmission line. The grey line is PLN transmission line. The total length is 30 km and connected through 20/150 KV step-up transformator. This line is used to distribute electricity to PLN. While, the electricity distribution to company is indicated by number 4. The total distribution network is 75 kms. It also distribute electricity to Paring Lahung Port which is the loading port of PAMA to deliver coal to other places.
3.2.2. Product Specification
The basic equipment for steam power plant are boiler, steam turbine, condenser (cooling system), and generator. The power plant project will be used to supply partial electricity in Kalimantan Tengah and company internal consumption. Then, the specification of steam power plant will be:
Unit 1 60 MW
Unit 2 60 MW
Total 120 MW
Capacity Factor 80%
Gross Electric Power Capacity 60 MW
Net Electric Power Capacity 52.8 MW
Installation 4 Year
Operation 25 Year
Start Up Operation 2017
Annual Operating hours 8,760 Hours
Distance to mine 5 KM
Distance to PLN's grid 25 KM
Total Network Distribution 80 KM
The project will build 2 units of steam power plant with capacity 60 MW. The capacity factor is 80% per unit. Capacity factor is the value of the product utilized in a period. It means the power plant is utilized 80% in a year and the rest is usually used for maintenance or reparation if any problem occurs. 60 MW capacity can supply about 460,000 MWh. The steam power plant is provided in two units to cover if there is an outage from one unit, another unit can cover the operation. So, the electricity keep turning on.
3.3. Financial Aspects
The analysis covers all the fund required from the beginning until the end of the project. Steam power plant construction requires a big amount of fund. This financial analysis will inform whether the power plant project is feasible. There will be 28 years spent for this project. 3 years for the preparation and installation and 25 years for operation. The investment cost for the power plant construction is $105.621,35 for Engineering Procurement and Construction include the interest during construction (IDC) and obtained by 30% of equity and 70% of loan.
Capital Cost
EPC $101,832.12
Financing Cost
Interest During Construction $3,789.23
Total Cost Required $105,621.35
Sources of Fund
Equity $31,686.40 30%
Debt $73,934.95 70%
Total $105,621.35 After that, PAMA have to pay taxable income 25% of its revenues. It also obligates to pay the loan with 4% rate. Selling electricity at excess power tariff at $83.00/kWh, the business is expected to be feasible. The calculation required for project feasibility evaluation such as Payback Period, Net Present Value (NPV), and Internal Rate of Return (IRR) has been done. 3.3.1. Payback Period
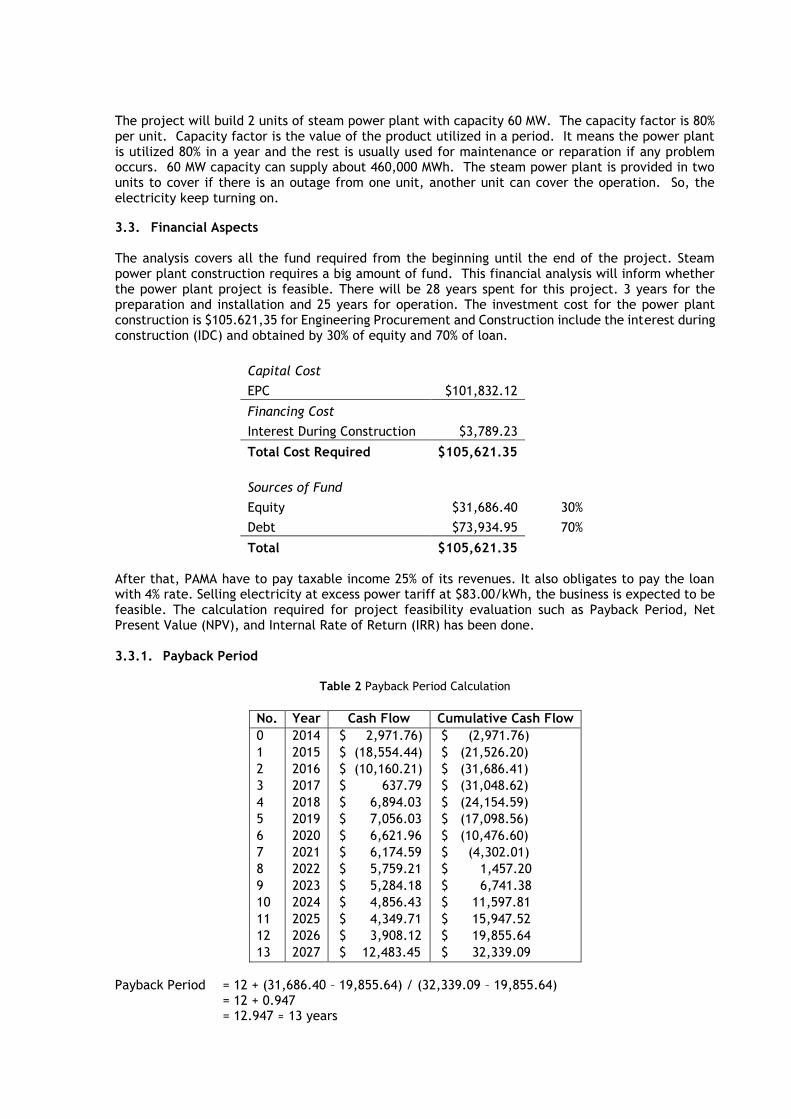
Table 2 Payback Period Calculation
No. Year Cash Flow Cumulative Cash Flow
0 2014 $ 2,971.76) $ (2,971.76)
1 2015 $ (18,554.44) $ (21,526.20)
2 2016 $ (10,160.21) $ (31,686.41)
3 2017 $ 637.79 $ (31,048.62)
4 2018 $ 6,894.03 $ (24,154.59)
5 2019 $ 7,056.03 $ (17,098.56)
6 2020 $ 6,621.96 $ (10,476.60)
7 2021 $ 6,174.59 $ (4,302.01)
8 2022 $ 5,759.21 $ 1,457.20
9 2023 $ 5,284.18 $ 6,741.38
10 2024 $ 4,856.43 $ 11,597.81
11 2025 $ 4,349.71 $ 15,947.52
12 2026 $ 3,908.12 $ 19,855.64
13 2027 $ 12,483.45 $ 32,339.09
Payback Period = 12 + (31,686.40 – 19,855.64) / (32,339.09 – 19,855.64)
= 12 + 0.947 = 12.947 ≈ 13 years
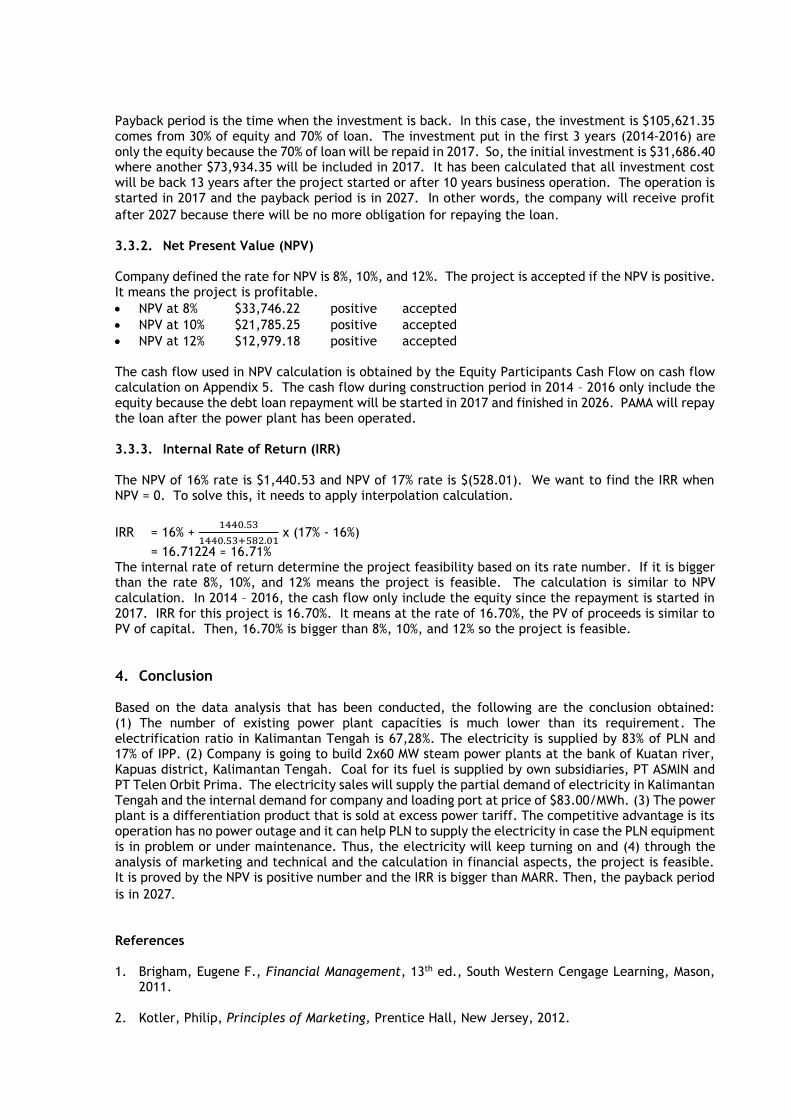
Payback period is the time when the investment is back. In this case, the investment is $105,621.35 comes from 30% of equity and 70% of loan. The investment put in the first 3 years (2014-2016) are only the equity because the 70% of loan will be repaid in 2017. So, the initial investment is $31,686.40 where another $73,934.35 will be included in 2017. It has been calculated that all investment cost will be back 13 years after the project started or after 10 years business operation. The operation is started in 2017 and the payback period is in 2027. In other words, the company will receive profit
after 2027 because there will be no more obligation for repaying the loan.
3.3.2. Net Present Value (NPV)
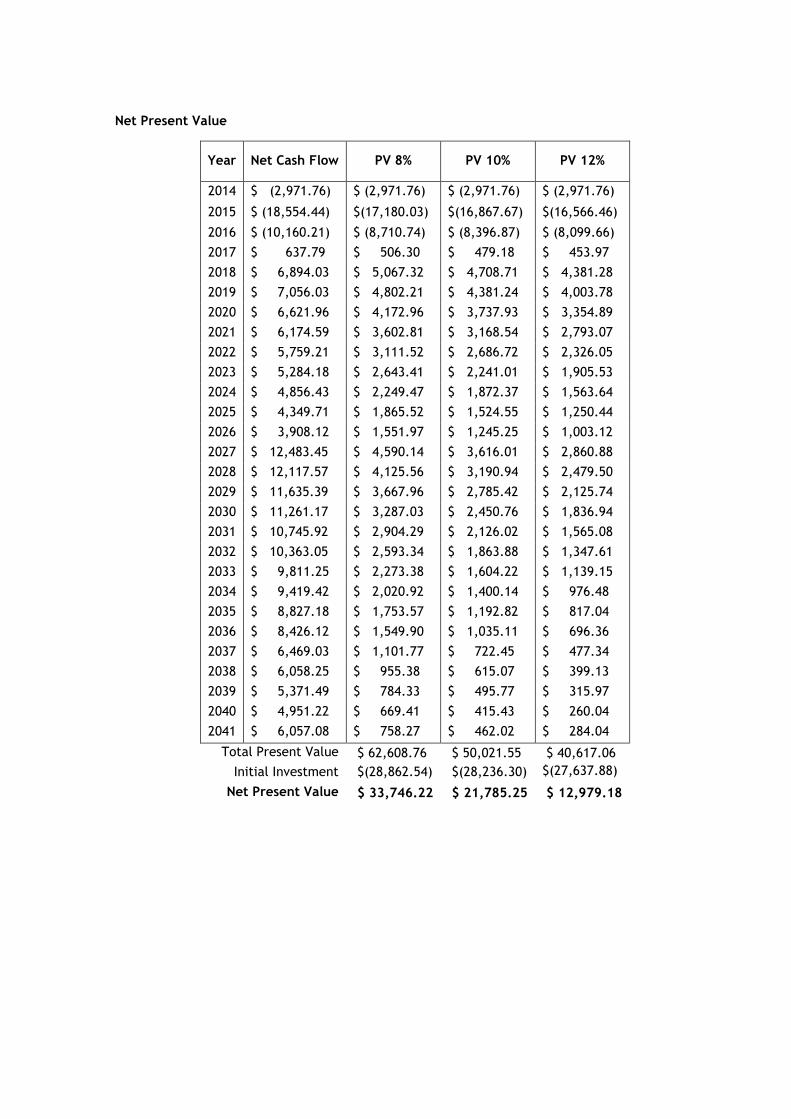
Company defined the rate for NPV is 8%, 10%, and 12%. The project is accepted if the NPV is positive. It means the project is profitable.
NPV at 8% $33,746.22 positive accepted
NPV at 10% $21,785.25 positive accepted
NPV at 12% $12,979.18 positive accepted
The cash flow used in NPV calculation is obtained by the Equity Participants Cash Flow on cash flow calculation on Appendix 5. The cash flow during construction period in 2014 – 2016 only include the equity because the debt loan repayment will be started in 2017 and finished in 2026. PAMA will repay the loan after the power plant has been operated.
3.3.3. Internal Rate of Return (IRR)
The NPV of 16% rate is $1,440.53 and NPV of 17% rate is $(528.01). We want to find the IRR when NPV = 0. To solve this, it needs to apply interpolation calculation.
IRR = 16% + 1440.53
1440.53+582.01 x (17% - 16%)
= 16.71224 ≈ 16.71% The internal rate of return determine the project feasibility based on its rate number. If it is bigger than the rate 8%, 10%, and 12% means the project is feasible. The calculation is similar to NPV calculation. In 2014 – 2016, the cash flow only include the equity since the repayment is started in 2017. IRR for this project is 16.70%. It means at the rate of 16.70%, the PV of proceeds is similar to PV of capital. Then, 16.70% is bigger than 8%, 10%, and 12% so the project is feasible.
4. Conclusion
Based on the data analysis that has been conducted, the following are the conclusion obtained: (1) The number of existing power plant capacities is much lower than its requirement. The electrification ratio in Kalimantan Tengah is 67,28%. The electricity is supplied by 83% of PLN and 17% of IPP. (2) Company is going to build 2x60 MW steam power plants at the bank of Kuatan river, Kapuas district, Kalimantan Tengah. Coal for its fuel is supplied by own subsidiaries, PT ASMIN and PT Telen Orbit Prima. The electricity sales will supply the partial demand of electricity in Kalimantan Tengah and the internal demand for company and loading port at price of $83.00/MWh. (3) The power plant is a differentiation product that is sold at excess power tariff. The competitive advantage is its operation has no power outage and it can help PLN to supply the electricity in case the PLN equipment is in problem or under maintenance. Thus, the electricity will keep turning on and (4) through the analysis of marketing and technical and the calculation in financial aspects, the project is feasible. It is proved by the NPV is positive number and the IRR is bigger than MARR. Then, the payback period
is in 2027. References
1. Brigham, Eugene F., Financial Management, 13th ed., South Western Cengage Learning, Mason,
2011.
2. Kotler, Philip, Principles of Marketing, Prentice Hall, New Jersey, 2012.
3. Porter, Michael E., Competitive Advantage – Creating and Sustaining Superior Performance, Macmillan, New York, 1985.
4. Rencana Usaha Penyediaan Tenaga Listrik 2012 – 2031, Perusahaan Listrik Negara, 2012.
Appendices
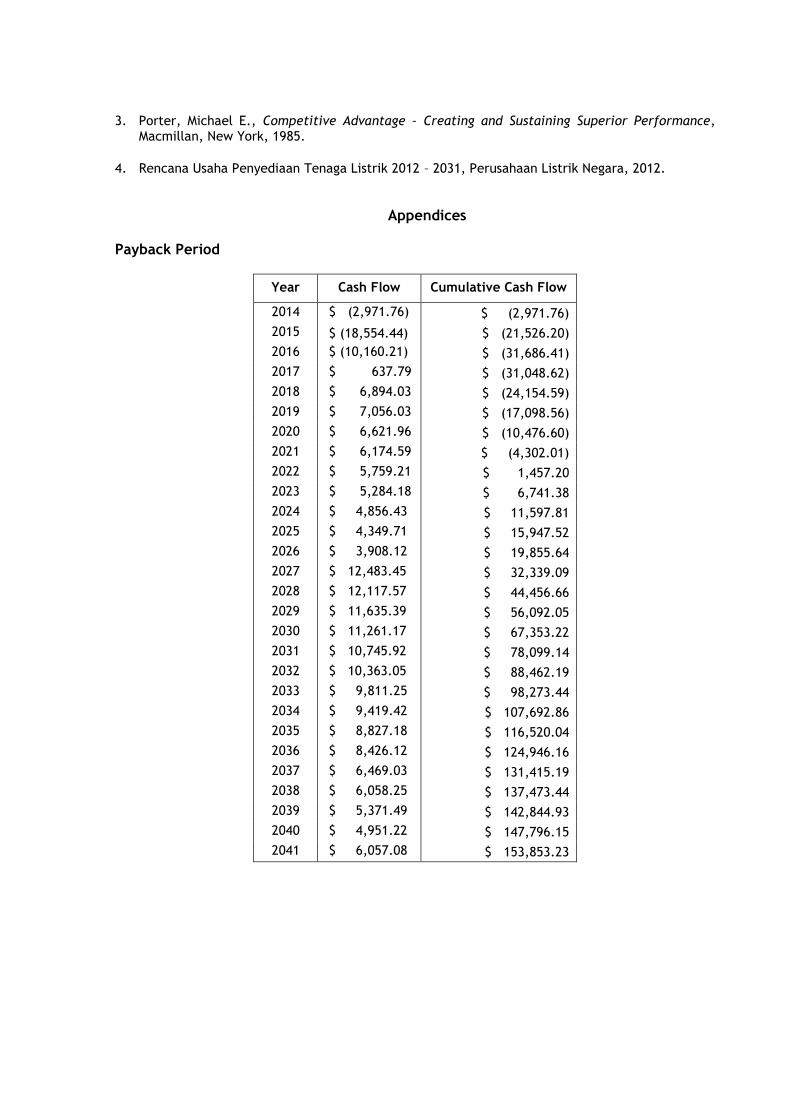
Payback Period
Year Cash Flow Cumulative Cash Flow
2014 $ (2,971.76) $ (2,971.76)
2015 $ (18,554.44) $ (21,526.20)
2016 $ (10,160.21) $ (31,686.41)
2017 $ 637.79 $ (31,048.62)
2018 $ 6,894.03 $ (24,154.59)
2019 $ 7,056.03 $ (17,098.56)
2020 $ 6,621.96 $ (10,476.60)
2021 $ 6,174.59 $ (4,302.01)
2022 $ 5,759.21 $ 1,457.20
2023 $ 5,284.18 $ 6,741.38
2024 $ 4,856.43 $ 11,597.81
2025 $ 4,349.71 $ 15,947.52
2026 $ 3,908.12 $ 19,855.64
2027 $ 12,483.45 $ 32,339.09
2028 $ 12,117.57 $ 44,456.66
2029 $ 11,635.39 $ 56,092.05
2030 $ 11,261.17 $ 67,353.22
2031 $ 10,745.92 $ 78,099.14
2032 $ 10,363.05 $ 88,462.19
2033 $ 9,811.25 $ 98,273.44
2034 $ 9,419.42 $ 107,692.86
2035 $ 8,827.18 $ 116,520.04
2036 $ 8,426.12 $ 124,946.16
2037 $ 6,469.03 $ 131,415.19
2038 $ 6,058.25 $ 137,473.44
2039 $ 5,371.49 $ 142,844.93
2040 $ 4,951.22 $ 147,796.15
2041 $ 6,057.08 $ 153,853.23
Net Present Value
Year Net Cash Flow PV 8% PV 10% PV 12%
2014 $ (2,971.76) $ (2,971.76) $ (2,971.76) $ (2,971.76)
2015 $ (18,554.44) $(17,180.03) $(16,867.67) $(16,566.46)
2016 $ (10,160.21) $ (8,710.74) $ (8,396.87) $ (8,099.66)
2017 $ 637.79 $ 506.30 $ 479.18 $ 453.97
2018 $ 6,894.03 $ 5,067.32 $ 4,708.71 $ 4,381.28
2019 $ 7,056.03 $ 4,802.21 $ 4,381.24 $ 4,003.78
2020 $ 6,621.96 $ 4,172.96 $ 3,737.93 $ 3,354.89
2021 $ 6,174.59 $ 3,602.81 $ 3,168.54 $ 2,793.07
2022 $ 5,759.21 $ 3,111.52 $ 2,686.72 $ 2,326.05
2023 $ 5,284.18 $ 2,643.41 $ 2,241.01 $ 1,905.53
2024 $ 4,856.43 $ 2,249.47 $ 1,872.37 $ 1,563.64
2025 $ 4,349.71 $ 1,865.52 $ 1,524.55 $ 1,250.44
2026 $ 3,908.12 $ 1,551.97 $ 1,245.25 $ 1,003.12
2027 $ 12,483.45 $ 4,590.14 $ 3,616.01 $ 2,860.88
2028 $ 12,117.57 $ 4,125.56 $ 3,190.94 $ 2,479.50
2029 $ 11,635.39 $ 3,667.96 $ 2,785.42 $ 2,125.74
2030 $ 11,261.17 $ 3,287.03 $ 2,450.76 $ 1,836.94
2031 $ 10,745.92 $ 2,904.29 $ 2,126.02 $ 1,565.08
2032 $ 10,363.05 $ 2,593.34 $ 1,863.88 $ 1,347.61
2033 $ 9,811.25 $ 2,273.38 $ 1,604.22 $ 1,139.15
2034 $ 9,419.42 $ 2,020.92 $ 1,400.14 $ 976.48
2035 $ 8,827.18 $ 1,753.57 $ 1,192.82 $ 817.04
2036 $ 8,426.12 $ 1,549.90 $ 1,035.11 $ 696.36
2037 $ 6,469.03 $ 1,101.77 $ 722.45 $ 477.34
2038 $ 6,058.25 $ 955.38 $ 615.07 $ 399.13
2039 $ 5,371.49 $ 784.33 $ 495.77 $ 315.97
2040 $ 4,951.22 $ 669.41 $ 415.43 $ 260.04
2041 $ 6,057.08 $ 758.27 $ 462.02 $ 284.04
Total Present Value $ 62,608.76 $ 50,021.55 $ 40,617.06
Initial Investment $(28,862.54) $(28,236.30) $(27,637.88)
Net Present Value $ 33,746.22 $ 21,785.25 $ 12,979.18

Internal Rate of Return
Year Cash Flow DF 16% PV DF 17% PV
2014 $ (2,971.76) 1 $ (2,971.76) 1 $ (2,971.76)
2015 $ (18,554.44) 0.862069 $ (15,995.20) 0.854701 $(15,858.49)
2016 $ (10,160.21) 0.743163 $ (7,550.69) 0.730514 $ (7,422.17)
2017 $ 637.79 0.640658 $ 408.61 0.624371 $ 398.22
2018 $ 6,894.03 0.552291 $ 3,807.51 0.53365 $ 3,679.00
2019 $ 7,056.03 0.476113 $ 3,359.47 0.456111 $ 3,218.33
2020 $ 6,621.96 0.410442 $ 2,717.93 0.389839 $ 2,581.50
2021 $ 6,174.59 0.35383 $ 2,184.75 0.333195 $ 2,057.35
2022 $ 5,759.21 0.305025 $ 1,756.71 0.284782 $ 1,640.12
2023 $ 5,284.18 0.262953 $ 1,389.49 0.243404 $ 1,286.19
2024 $ 4,856.43 0.226684 $ 1,100.87 0.208037 $ 1,010.32
2025 $ 4,349.71 0.195417 $ 850.01 0.17781 $ 773.42
2026 $ 3,908.12 0.168463 $ 658.37 0.151974 $ 593.93
2027 $ 12,483.45 0.145227 $ 1,812.93 0.129892 $ 1,621.50
2028 $ 12,117.57 0.125195 $ 1,517.06 0.111019 $ 1,345.28
2029 $ 11,635.39 0.107927 $ 1,255.77 0.094888 $ 1,104.06
2030 $ 11,261.17 0.093041 $ 1,047.74 0.081101 $ 913.29
2031 $ 10,745.92 0.080207 $ 861.90 0.069317 $ 744.88
2032 $ 10,363.05 0.069144 $ 716.55 0.059245 $ 613.96
2033 $ 9,811.25 0.059607 $ 584.82 0.050637 $ 496.81
2034 $ 9,419.42 0.051385 $ 484.02 0.04328 $ 407.67
2035 $ 8,827.18 0.044298 $ 391.02 0.036991 $ 326.53
2036 $ 8,426.12 0.038188 $ 321.77 0.031616 $ 266.40
2037 $ 6,469.03 0.03292 $ 212.96 0.027022 $ 174.81
2038 $ 6,058.25 0.02838 $ 171.93 0.023096 $ 139.92
2039 $ 5,371.49 0.024465 $ 131.41 0.01974 $ 106.03
2040 $ 4,951.22 0.021091 $ 104.43 0.016872 $ 83.54
2041 $ 6,057.08 0.018182 $ 110.13 0.014421 $ 87.35
Total Present Value $ 27,958.18 $ 25,670.42
Initial Investment $ (26,517.66) $(26,252.42)
Net Present Value $ 1,440.53 $ (582.01)


