Embed Size (px)
Citation preview
Available online at www.sciencedirect.com
Magnetic Resonance Imagi
ng 28 (2010) 784–789Detection of T2 changes in an early mouse brain tumor☆
Barbara Blasiaka,b,c, Boguslaw Tomaneka,b,c,⁎, Abedelnasser Abulrobd,e,Umar Iqbald,e, Danica Stanimirovicd,e, Homam Albaghdadid,e, Tadeusz Foniokc,
Xueqing Luna, Peter Forsytha, Garnette R. SutherlandaaDepartment of Clinical Neurosciences, University of Calgary, Calgary, Alberta, Canada T2N 4N1bInstitute of Nuclear Physics, Polish Academy of Sciences, 31-342 Krakow, Malopolska, Poland
cInstitute for Biodiagnostics (West), National Research Council of Canada, Calgary, Alberta, Canada T2N 4N1dInstitute for Biological Sciences, National Research Council of Canada, Ottawa, Ontario, Canada K1A 0R8eDepartment of Cellular and Molecular Medicine, University of Ottawa, Ottawa, Ontario, Canada K1N 6N5
Received 27 February 2010; revised 11 March 2010; accepted 14 March 2010
Abstract
The aim of the study was to determine the effect of early tumor growth on T2 relaxation times in an experimental glioma model. A 9.4-Tmagnetic resonance imaging (MRI) system was used for the investigations. An animal model (n=12) of glioma was established using anintracranial inoculation of U87MGdEGFRvIII cells. The imaging studies were performed from Day 10 through Day 13 following tumorinoculation. Tumor blood vessel density was determined using quantitative immunochemistry. Tumor volume was measured daily using MRimages. T2 values of the tumor were measured in five areas across the tumor and calculated using a single exponential fitting of the echotrain. The measurements on Days 10 and 13 after tumor inoculation showed a 20% increase in T2. The changes in T2 correlated with the sizeof the tumor. Statistically significant differences in T2 values were observed between the edge of the tumor and the brain tissue on Days 11,12 and 13 (P=.014, .008, .001, respectively), but not on Day 10 (P=.364). The results show that T2-weighted MRI may not detect gliomaduring an early phase of growth. T2 increases in growing glioma and varies heterogenously across the tumor.Crown Copyright © 2010 Published by Elsevier Inc. All rights reserved.
Keywords: MRI; Glioma; Molecular imaging; 9.4 T; Mouse model; Brain cancer
1. Introduction
High-grade glioma is the most common central nervoussystem (CNS) tumor in adults. These tumors have poorlydefined margins and directly invade the adjacent brainparenchyma, making complete surgical resection problem-atic [1]. Additionally, invasive tumor cells are associatedwith the initiation of angiogenesis with disruption of theblood–brain barrier due to the release of vasomodulatorycytokines [2]. These factors contribute to a rapid growth ofthe tumor and likely contribute to tumor recurrence [1].
☆ Grant support: The work was supported by the Canadian Institutes ofHealth Research Emerging Team Grant (RMF-79031).
⁎ Corresponding author. Institute for Biodiagnostics (West), NationaResearch Council of Canada, 3330 Hospital Dr NW, Calgary, AlbertaCanada T2N 4N1. Tel.: +1 403 221 3222; fax: +1 403 221 3230.
E-mail address: [email protected] (B. Tomanek).
0730-725X/$ – see front matter. Crown Copyright © 2010 Published bydoi:10.1016/j.mri.2010.03.004
l,
Elsevie
Whereas patients with low-grade glioma can survive for 7 to15 years, the diagnosis of high-grade glioma carries a mediansurvival of only 9 months [3].
Despite a number of therapeutic approaches over the pastseveral decades, mean survival has been minimally impacted.This can largely be attributed to late tumor detection, itsheterogeneity and variable response to conventional therapies.Therefore, better methods allowing tumor detection at theearly stage of its growth would enable faster and potentiallymore efficient treatment. Furthermore, improvement in tumordetection at the early stage is essential because we still rely ontumor size to determine a patient's response to therapy. Sincecurrent diagnosis of glioma is often based on magneticresonance imaging (MRI), early cancer detection using thismethod is of particular interest. However, studies of earlyglioma tumor detection with MRI are lacking.
Conventional MRI methods, including T1-, T2-weightedand Gd-enhanced MRI, have been used in glioma diagnosis
r Inc. All rights reserved.
785B. Blasiak et al. / Magnetic Resonance Imaging 28 (2010) 784–789
[4], therapymonitoring [5] and even predicting glioma grades[6]. In particular, T2 methods are among the most frequentlyused techniques [7], but the changes in T2 associated withtumor growth remain poorly understood.
In high-grade glioma, T2 enhancement is associated withretention of plasma fluid and protein in the extracellular space[8] together with infiltrating tumor cells [9]. Furthermore,overexpression of CXCR4, a chemokine receptor known tomediate glioma cell invasiveness, correlates with T2 signalabnormality [10].
A study with multi-photon fluorescence microscopy [11]demonstrated that tumor growth involves the development ofboth tumor cells and tumor blood vessels. Tumor vasculardensity is a prognostic indicator in glioma patients [1,12].Neovascularization in glioblastomas is rapid and involvesseveral mechanisms including co-option, intussusceptionand sprouting angiogenesis [1,9]. High-grade gliomaangiogenesis results in highly abnormal, tortuous vesselsexhibiting increased permeability and vasogenic edema [13].
Recently introduced molecular MRI [14] uses targetedcontrast agents comprising superparamagnetic nanoparticlesdelivered to the specific cell sites by biologically activetargeting moieties, such as antibodies. These agents reduceT2, thus creating a void signal from tumor in MR images[1,15]. As targeted contrast agents can increase the specificityof MRI, any changes in T2 due to the tumor growth aloneshould be carefully considered in MRI of glioma using T2
contrast agents. Therefore, in this study, the relationshipbetween T2, glioma tumor size and vasculature in the earlygrowth was investigated.
2. Methods
2.1. Tumor cell preparation
The U87MGdEGFRvIII cell line, which overexpressesthe EGFR type III variant and is highly malignant, wasderived from a human tumor known to express high levels ofvascular endothelial growth factor (VEGF) and epidermalgrowth factor receptor (EGFR) [16]. This cell line exhibitsenhanced tumor invasiveness in vivo compared to theU87MG parental and U87MG overexpressing the exogenouswild-type EGFR cell lines [17]. The EGFR is highlyexpressed in approximately 50% of glioblastoma patientsamples owing to the gene amplification [18], while thenormal brain exhibits low EGFR expression [19].
The cell line for the study was provided by Dr. W.L.Cavenee (Ludwig Institute for Cancer Research, La Jolla,CA, USA). The U87MG implants grow as solid, nonen-capsulated spheroidal tumors. The tumor displays a densevascular network, with many characteristics of glioblastomavessels [4], including tortuous vessels with abnormalvascular basement membrane and increased permeability.U87MG cells were cultured in DMEM solution supple-mented with 10% fetal calf serum and maintained in ahumidified 5% CO2 atmosphere at 37°C. Cells were
harvested by trypsinization in ethylenediaminetetraaceticacid/trypsin, washed in phosphate-buffered saline (PBS) andcentrifuged three times at 200×g. Viability was assessedusing a 0.4% trypan blue exclusion test. After cell densitywas determined, cells were brought into suspension at afinal concentration of 5×10⁴/2.5 μl and mixed with 2.5 μl ofmatrigel for a total volume of 5 μl. Cells were kept on iceuntil inoculation.
2.2. Tumor model
Twelve CD-1 nude mice (male, 6 weeks old, CharlesRiver, Canada) were anesthetized by intraperitoneal injec-tion of a mixture of ketamine (8–120 mg/kg) and xylazine(6 mg/kg) and placed in a stereotactic head frame. Tumorcells were inoculated using procedures described previously[20]. Briefly, the scalp was shaved and swabbed with iodineand alcohol. The skin was incised and a 0.18-mm-diameterhole was drilled in the skull. Approximately 5×10⁴
U87MGdEGFRvIII glioma cells, suspended in a totalvolume of 5 μl, were injected intracerebrally into the frontallobe of each mouse with a chromatography syringe at a depthof 2.5–3 mm (1 mm anterior and 1.8 mm lateral to thebregma) using a Kopf stereotactic apparatus (Kopf Instru-ments, Tujunga, CA, USA). Subsequently, the bonycalvarium was sealed by a droplet of bone wax to preventreflux and the skin was sutured. After the surgery, animalswere allowed to recover from the anesthesia and were placedin the cages. Mice were euthanized on Day 14 withpentobarbital (120 mg/kg iv). The animal procedures wereapproved by the University of Calgary and NationalResearch of Canada Animal Care Committees.
2.3. MRI Protocol
The MR imaging sessions started 10 days after cellinoculation. A 9.4-T/21-cm horizontal bore magnet (Mag-nex, UK) with a Biospec console (Bruker, Germany) wasused. Data acquisition was gated with the respiratory cycle.A volume (3 cm diameter, 2.5 cm long) radiofrequency coilwas placed over the animal's head covering the region ofinterest (ROI). T2 images were acquired from the tumorregion. Axial slices were positioned within the tumor. Amultislice, multiecho sequence was used with TR=5000 ms,16 echoes, 10 ms apart each, first echo at 10 ms, FOV=3×3cm, matrix size of 256×256 and slice thickness of 1 mm. T2
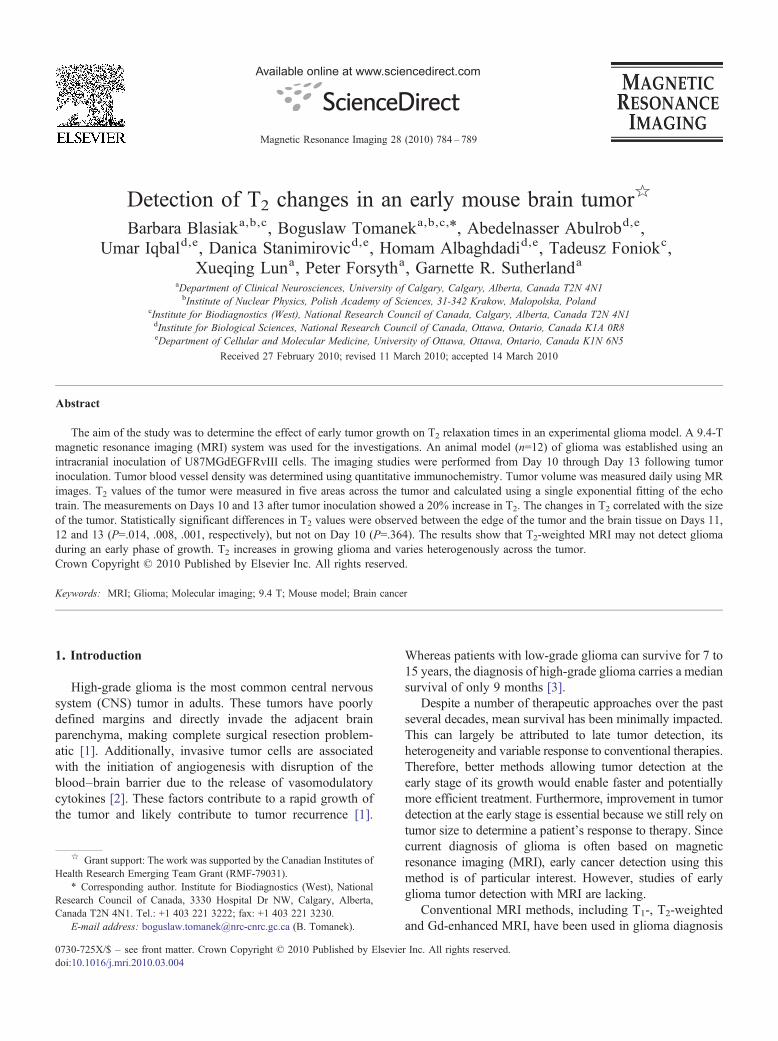
values of the tumor tissues were measured using a singleexponential fitting of the echo train from ROIs (Marevisi,NRC, Canada). T2 values were calculated in five areas acrossthe tumor (Fig. 1): in the center of the tumor (Point C), at itsedge (Points A and E), in two points around the center(Points B and D) and outside the tumor (Point Y). Each areacomprised 4 pixels. The volume of the tumor was calculatedusing MRI by measuring the area of each slice and multipliedby slice thickness and adding the results over the entiretumor volume.
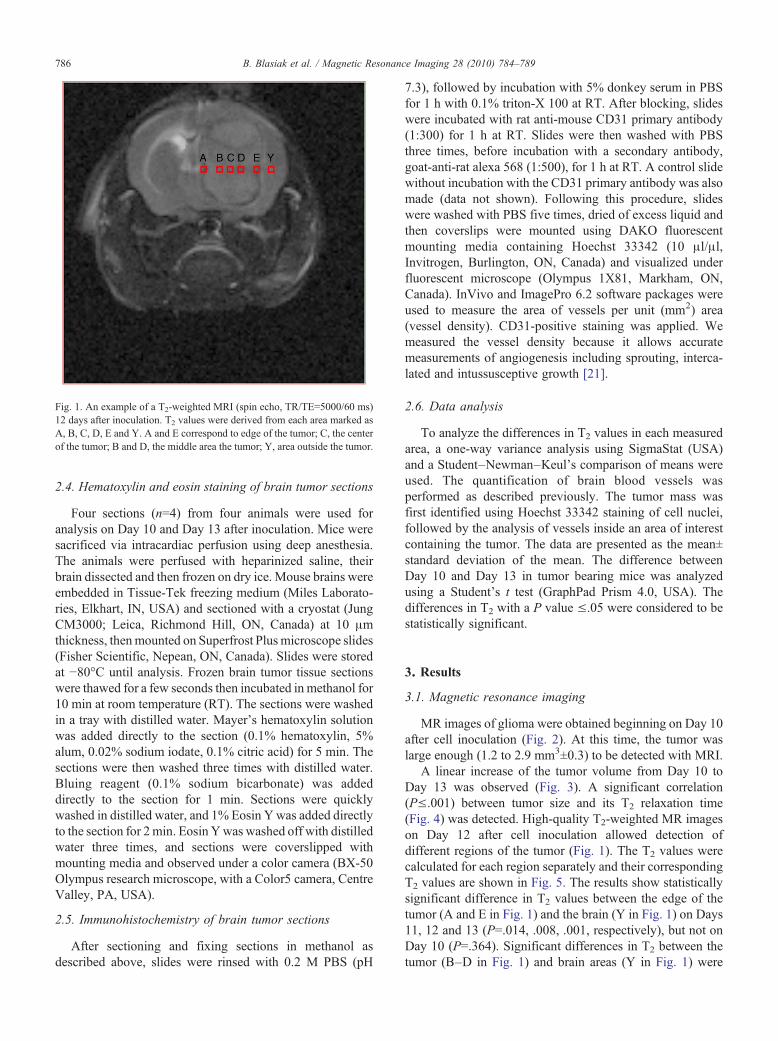
Fig. 1. An example of a T2-weighted MRI (spin echo, TR/TE=5000/60 ms)12 days after inoculation. T2 values were derived from each area marked asA, B, C, D, E and Y. A and E correspond to edge of the tumor; C, the centerof the tumor; B and D, the middle area the tumor; Y, area outside the tumor.
786 B. Blasiak et al. / Magnetic Resonance Imaging 28 (2010) 784–789
2.4. Hematoxylin and eosin staining of brain tumor sections
Four sections (n=4) from four animals were used foranalysis on Day 10 and Day 13 after inoculation. Mice weresacrificed via intracardiac perfusion using deep anesthesia.The animals were perfused with heparinized saline, theirbrain dissected and then frozen on dry ice. Mouse brains wereembedded in Tissue-Tek freezing medium (Miles Laborato-ries, Elkhart, IN, USA) and sectioned with a cryostat (JungCM3000; Leica, Richmond Hill, ON, Canada) at 10 μmthickness, thenmounted on Superfrost Plus microscope slides(Fisher Scientific, Nepean, ON, Canada). Slides were storedat −80°C until analysis. Frozen brain tumor tissue sectionswere thawed for a few seconds then incubated in methanol for10 min at room temperature (RT). The sections were washedin a tray with distilled water. Mayer's hematoxylin solutionwas added directly to the section (0.1% hematoxylin, 5%alum, 0.02% sodium iodate, 0.1% citric acid) for 5 min. Thesections were then washed three times with distilled water.Bluing reagent (0.1% sodium bicarbonate) was addeddirectly to the section for 1 min. Sections were quicklywashed in distilled water, and 1% Eosin Ywas added directlyto the section for 2min. Eosin Ywas washed off with distilledwater three times, and sections were coverslipped withmounting media and observed under a color camera (BX-50Olympus research microscope, with a Color5 camera, CentreValley, PA, USA).
2.5. Immunohistochemistry of brain tumor sections
After sectioning and fixing sections in methanol asdescribed above, slides were rinsed with 0.2 M PBS (pH
7.3), followed by incubation with 5% donkey serum in PBSfor 1 h with 0.1% triton-X 100 at RT. After blocking, slideswere incubated with rat anti-mouse CD31 primary antibody(1:300) for 1 h at RT. Slides were then washed with PBSthree times, before incubation with a secondary antibody,goat-anti-rat alexa 568 (1:500), for 1 h at RT. A control slidewithout incubation with the CD31 primary antibody was alsomade (data not shown). Following this procedure, slideswere washed with PBS five times, dried of excess liquid andthen coverslips were mounted using DAKO fluorescentmounting media containing Hoechst 33342 (10 μl/μl,Invitrogen, Burlington, ON, Canada) and visualized underfluorescent microscope (Olympus 1X81, Markham, ON,Canada). InVivo and ImagePro 6.2 software packages wereused to measure the area of vessels per unit (mm2) area(vessel density). CD31-positive staining was applied. Wemeasured the vessel density because it allows accuratemeasurements of angiogenesis including sprouting, interca-lated and intussusceptive growth [21].
2.6. Data analysis
To analyze the differences in T2 values in each measuredarea, a one-way variance analysis using SigmaStat (USA)and a Student–Newman–Keul's comparison of means wereused. The quantification of brain blood vessels wasperformed as described previously. The tumor mass wasfirst identified using Hoechst 33342 staining of cell nuclei,followed by the analysis of vessels inside an area of interestcontaining the tumor. The data are presented as the mean±standard deviation of the mean. The difference betweenDay 10 and Day 13 in tumor bearing mice was analyzedusing a Student's t test (GraphPad Prism 4.0, USA). Thedifferences in T2 with a P value ≤.05 were considered to bestatistically significant.
3. Results
3.1. Magnetic resonance imaging
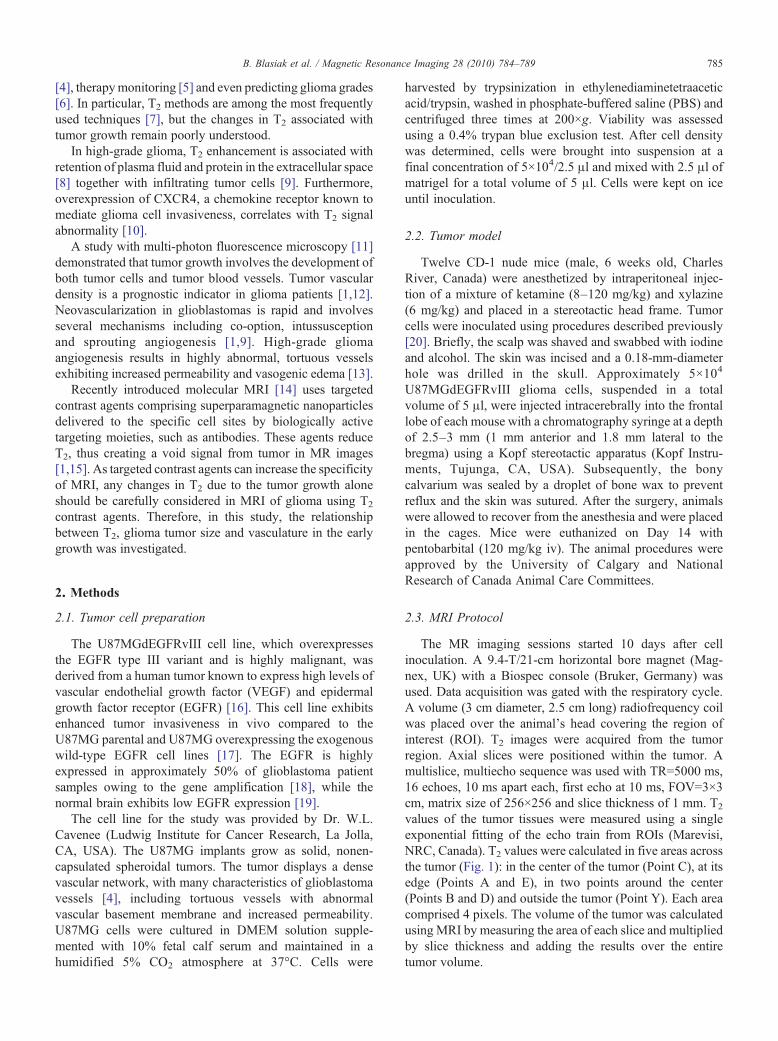
MR images of glioma were obtained beginning on Day 10after cell inoculation (Fig. 2). At this time, the tumor waslarge enough (1.2 to 2.9 mm3±0.3) to be detected with MRI.
A linear increase of the tumor volume from Day 10 toDay 13 was observed (Fig. 3). A significant correlation(P≤.001) between tumor size and its T2 relaxation time(Fig. 4) was detected. High-quality T2-weighted MR imageson Day 12 after cell inoculation allowed detection ofdifferent regions of the tumor (Fig. 1). The T2 values werecalculated for each region separately and their correspondingT2 values are shown in Fig. 5. The results show statisticallysignificant difference in T2 values between the edge of thetumor (A and E in Fig. 1) and the brain (Y in Fig. 1) on Days11, 12 and 13 (P=.014, .008, .001, respectively), but not onDay 10 (P=.364). Significant differences in T2 between thetumor (B–D in Fig. 1) and brain areas (Y in Fig. 1) were
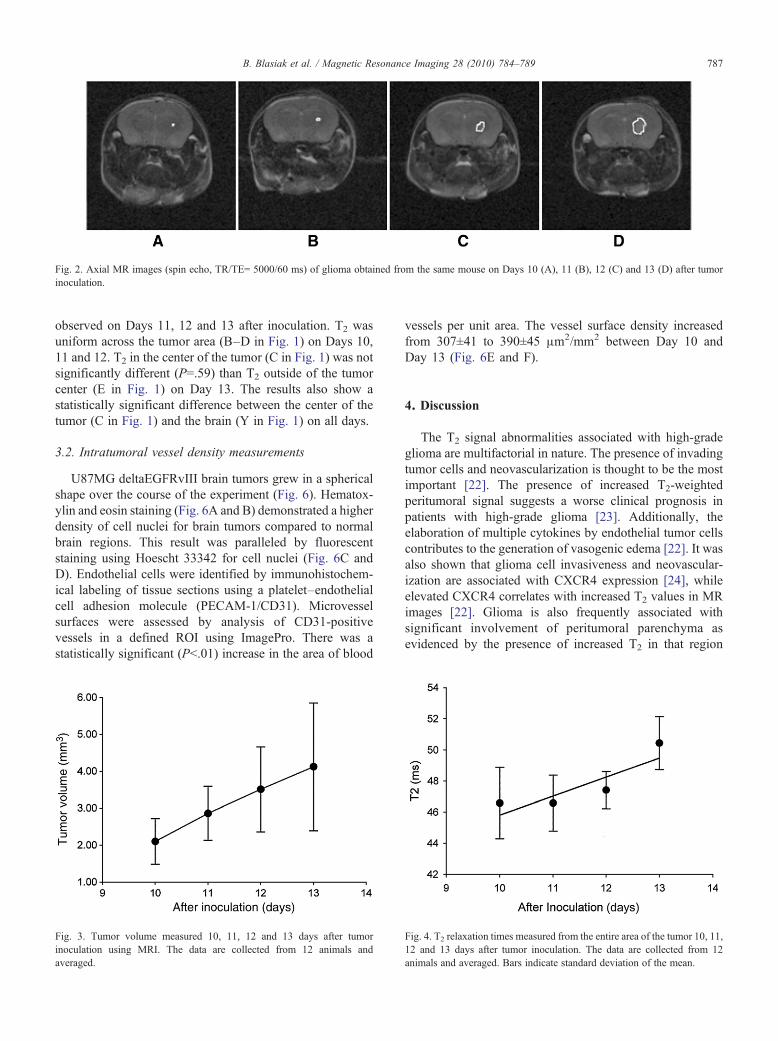
Fig. 2. Axial MR images (spin echo, TR/TE= 5000/60 ms) of glioma obtained from the same mouse on Days 10 (A), 11 (B), 12 (C) and 13 (D) after tumorinoculation.
787B. Blasiak et al. / Magnetic Resonance Imaging 28 (2010) 784–789
observed on Days 11, 12 and 13 after inoculation. T2 wasuniform across the tumor area (B–D in Fig. 1) on Days 10,11 and 12. T2 in the center of the tumor (C in Fig. 1) was notsignificantly different (P=.59) than T2 outside of the tumorcenter (E in Fig. 1) on Day 13. The results also show astatistically significant difference between the center of thetumor (C in Fig. 1) and the brain (Y in Fig. 1) on all days.
3.2. Intratumoral vessel density measurements
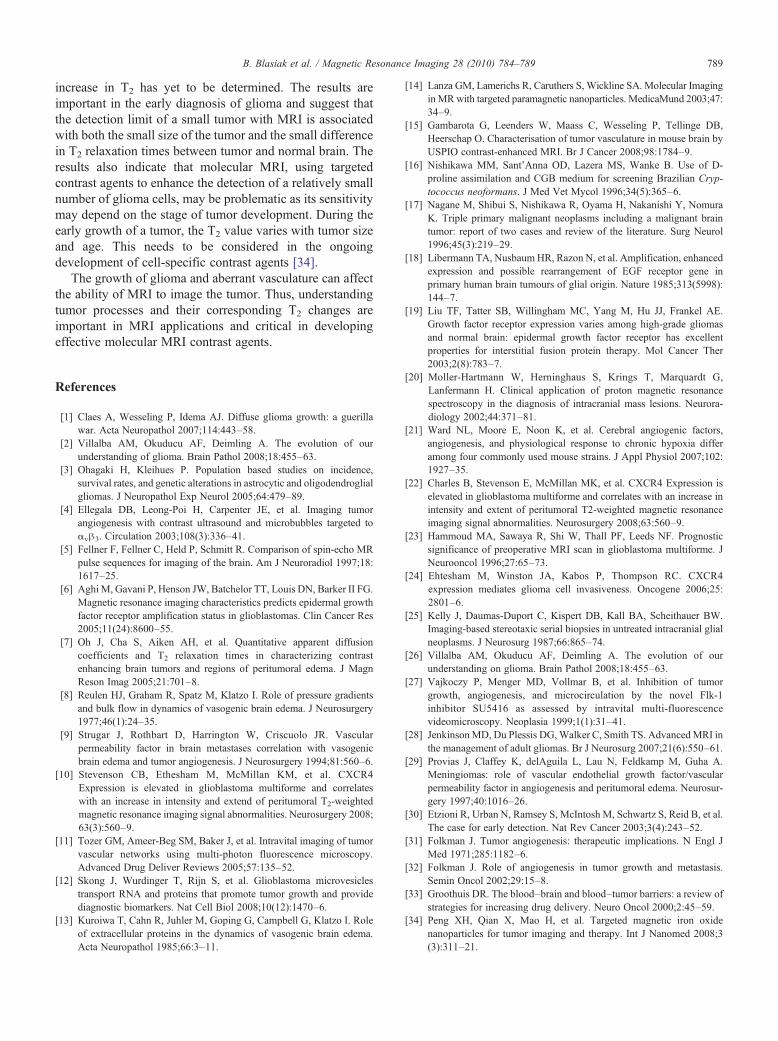
U87MG deltaEGFRvIII brain tumors grew in a sphericalshape over the course of the experiment (Fig. 6). Hematox-ylin and eosin staining (Fig. 6A and B) demonstrated a higherdensity of cell nuclei for brain tumors compared to normalbrain regions. This result was paralleled by fluorescentstaining using Hoescht 33342 for cell nuclei (Fig. 6C andD). Endothelial cells were identified by immunohistochem-ical labeling of tissue sections using a platelet–endothelialcell adhesion molecule (PECAM-1/CD31). Microvesselsurfaces were assessed by analysis of CD31-positivevessels in a defined ROI using ImagePro. There was astatistically significant (Pb.01) increase in the area of blood
Fig. 3. Tumor volume measured 10, 11, 12 and 13 days after tumorinoculation using MRI. The data are collected from 12 animals andaveraged.
vessels per unit area. The vessel surface density increasedfrom 307±41 to 390±45 μm2/mm2 between Day 10 andDay 13 (Fig. 6E and F).
4. Discussion
The T2 signal abnormalities associated with high-gradeglioma are multifactorial in nature. The presence of invadingtumor cells and neovascularization is thought to be the mostimportant [22]. The presence of increased T2-weightedperitumoral signal suggests a worse clinical prognosis inpatients with high-grade glioma [23]. Additionally, theelaboration of multiple cytokines by endothelial tumor cellscontributes to the generation of vasogenic edema [22]. It wasalso shown that glioma cell invasiveness and neovascular-ization are associated with CXCR4 expression [24], whileelevated CXCR4 correlates with increased T2 values in MRimages [22]. Glioma is also frequently associated withsignificant involvement of peritumoral parenchyma asevidenced by the presence of increased T2 in that region
Fig. 4. T2 relaxation times measured from the entire area of the tumor 10, 11,12 and 13 days after tumor inoculation. The data are collected from 12animals and averaged. Bars indicate standard deviation of the mean.
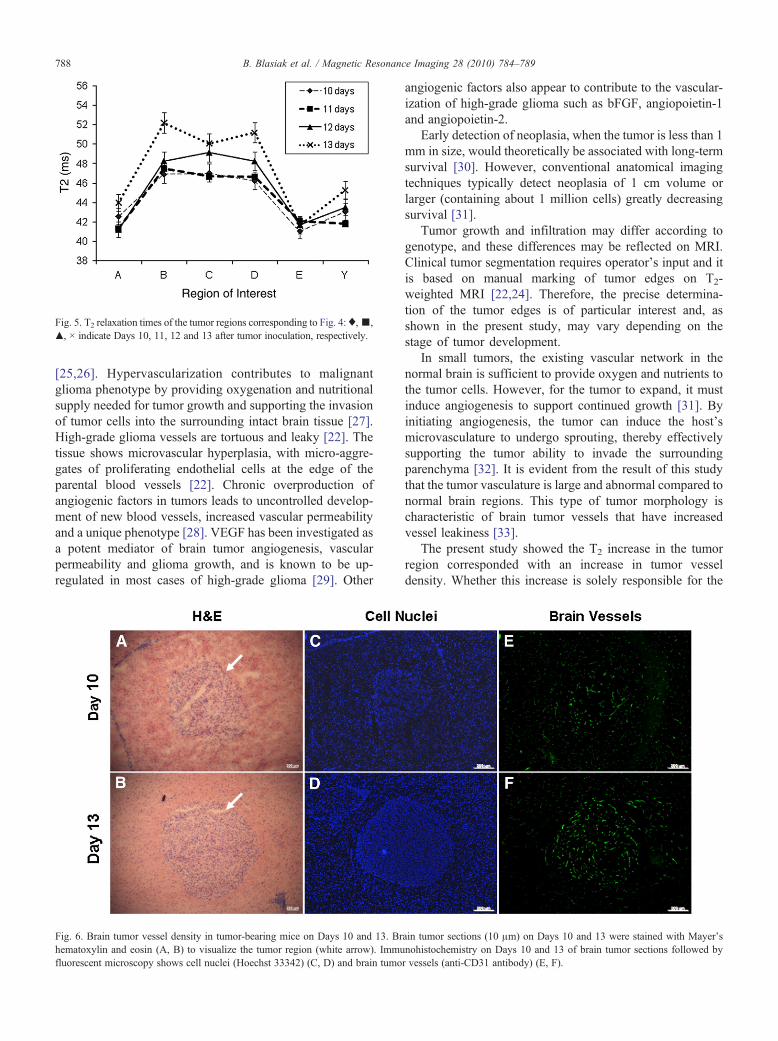
Fig. 5. T2 relaxation times of the tumor regions corresponding to Fig. 4:♦,▪,▴, × indicate Days 10, 11, 12 and 13 after tumor inoculation, respectively.
788 B. Blasiak et al. / Magnetic Resonance Imaging 28 (2010) 784–789
[25,26]. Hypervascularization contributes to malignantglioma phenotype by providing oxygenation and nutritionalsupply needed for tumor growth and supporting the invasionof tumor cells into the surrounding intact brain tissue [27].High-grade glioma vessels are tortuous and leaky [22]. Thetissue shows microvascular hyperplasia, with micro-aggre-gates of proliferating endothelial cells at the edge of theparental blood vessels [22]. Chronic overproduction ofangiogenic factors in tumors leads to uncontrolled develop-ment of new blood vessels, increased vascular permeabilityand a unique phenotype [28]. VEGF has been investigated asa potent mediator of brain tumor angiogenesis, vascularpermeability and glioma growth, and is known to be up-regulated in most cases of high-grade glioma [29]. Other
Fig. 6. Brain tumor vessel density in tumor-bearing mice on Days 10 and 13. Brhematoxylin and eosin (A, B) to visualize the tumor region (white arrow). Immufluorescent microscopy shows cell nuclei (Hoechst 33342) (C, D) and brain tumo
angiogenic factors also appear to contribute to the vascular-ization of high-grade glioma such as bFGF, angiopoietin-1and angiopoietin-2.
Early detection of neoplasia, when the tumor is less than 1mm in size, would theoretically be associated with long-termsurvival [30]. However, conventional anatomical imagingtechniques typically detect neoplasia of 1 cm volume orlarger (containing about 1 million cells) greatly decreasingsurvival [31].
Tumor growth and infiltration may differ according togenotype, and these differences may be reflected on MRI.Clinical tumor segmentation requires operator's input and itis based on manual marking of tumor edges on T2-weighted MRI [22,24]. Therefore, the precise determina-tion of the tumor edges is of particular interest and, asshown in the present study, may vary depending on thestage of tumor development.
In small tumors, the existing vascular network in thenormal brain is sufficient to provide oxygen and nutrients tothe tumor cells. However, for the tumor to expand, it mustinduce angiogenesis to support continued growth [31]. Byinitiating angiogenesis, the tumor can induce the host'smicrovasculature to undergo sprouting, thereby effectivelysupporting the tumor ability to invade the surroundingparenchyma [32]. It is evident from the result of this studythat the tumor vasculature is large and abnormal compared tonormal brain regions. This type of tumor morphology ischaracteristic of brain tumor vessels that have increasedvessel leakiness [33].
The present study showed the T2 increase in the tumorregion corresponded with an increase in tumor vesseldensity. Whether this increase is solely responsible for the
ain tumor sections (10 μm) on Days 10 and 13 were stained with Mayer'snohistochemistry on Days 10 and 13 of brain tumor sections followed byr vessels (anti-CD31 antibody) (E, F).
789B. Blasiak et al. / Magnetic Resonance Imaging 28 (2010) 784–789
increase in T2 has yet to be determined. The results areimportant in the early diagnosis of glioma and suggest thatthe detection limit of a small tumor with MRI is associatedwith both the small size of the tumor and the small differencein T2 relaxation times between tumor and normal brain. Theresults also indicate that molecular MRI, using targetedcontrast agents to enhance the detection of a relatively smallnumber of glioma cells, may be problematic as its sensitivitymay depend on the stage of tumor development. During theearly growth of a tumor, the T2 value varies with tumor sizeand age. This needs to be considered in the ongoingdevelopment of cell-specific contrast agents [34].
The growth of glioma and aberrant vasculature can affectthe ability of MRI to image the tumor. Thus, understandingtumor processes and their corresponding T2 changes areimportant in MRI applications and critical in developingeffective molecular MRI contrast agents.
References
[1] Claes A, Wesseling P, Idema AJ. Diffuse glioma growth: a guerillawar. Acta Neuropathol 2007;114:443–58.
[2] Villalba AM, Okuducu AF, Deimling A. The evolution of ourunderstanding of glioma. Brain Pathol 2008;18:455–63.
[3] Ohagaki H, Kleihues P. Population based studies on incidence,survival rates, and genetic alterations in astrocytic and oligodendroglialgliomas. J Neuropathol Exp Neurol 2005;64:479–89.
[4] Ellegala DB, Leong-Poi H, Carpenter JE, et al. Imaging tumorangiogenesis with contrast ultrasound and microbubbles targeted toαvβ3. Circulation 2003;108(3):336–41.
[5] Fellner F, Fellner C, Held P, Schmitt R. Comparison of spin-echo MRpulse sequences for imaging of the brain. Am J Neuroradiol 1997;18:1617–25.
[6] Aghi M, Gavani P, Henson JW, Batchelor TT, Louis DN, Barker II FG.Magnetic resonance imaging characteristics predicts epidermal growthfactor receptor amplification status in glioblastomas. Clin Cancer Res2005;11(24):8600–55.
[7] Oh J, Cha S, Aiken AH, et al. Quantitative apparent diffusioncoefficients and T2 relaxation times in characterizing contrastenhancing brain tumors and regions of peritumoral edema. J MagnReson Imag 2005;21:701–8.
[8] Reulen HJ, Graham R, Spatz M, Klatzo I. Role of pressure gradientsand bulk flow in dynamics of vasogenic brain edema. J Neurosurgery1977;46(1):24–35.
[9] Strugar J, Rothbart D, Harrington W, Criscuolo JR. Vascularpermeability factor in brain metastases correlation with vasogenicbrain edema and tumor angiogenesis. J Neurosurgery 1994;81:560–6.
[10] Stevenson CB, Ethesham M, McMillan KM, et al. CXCR4Expression is elevated in glioblastoma multiforme and correlateswith an increase in intensity and extend of peritumoral T2-weightedmagnetic resonance imaging signal abnormalities. Neurosurgery 2008;63(3):560–9.
[11] Tozer GM, Ameer-Beg SM, Baker J, et al. Intravital imaging of tumorvascular networks using multi-photon fluorescence microscopy.Advanced Drug Deliver Reviews 2005;57:135–52.
[12] Skong J, Wurdinger T, Rijn S, et al. Glioblastoma microvesiclestransport RNA and proteins that promote tumor growth and providediagnostic biomarkers. Nat Cell Biol 2008;10(12):1470–6.
[13] Kuroiwa T, Cahn R, Juhler M, Goping G, Campbell G, Klatzo I. Roleof extracellular proteins in the dynamics of vasogenic brain edema.Acta Neuropathol 1985;66:3–11.
[14] Lanza GM, Lamerichs R, Caruthers S, Wickline SA. Molecular ImaginginMRwith targeted paramagnetic nanoparticles. MedicaMund 2003;47:34–9.
[15] Gambarota G, Leenders W, Maass C, Wesseling P, Tellinge DB,Heerschap O. Characterisation of tumor vasculature in mouse brain byUSPIO contrast-enhanced MRI. Br J Cancer 2008;98:1784–9.
[16] Nishikawa MM, Sant’Anna OD, Lazera MS, Wanke B. Use of D-proline assimilation and CGB medium for screening Brazilian Cryp-tococcus neoformans. J Med Vet Mycol 1996;34(5):365–6.
[17] Nagane M, Shibui S, Nishikawa R, Oyama H, Nakanishi Y, NomuraK. Triple primary malignant neoplasms including a malignant braintumor: report of two cases and review of the literature. Surg Neurol1996;45(3):219–29.
[18] Libermann TA, Nusbaum HR, Razon N, et al. Amplification, enhancedexpression and possible rearrangement of EGF receptor gene inprimary human brain tumours of glial origin. Nature 1985;313(5998):144–7.
[19] Liu TF, Tatter SB, Willingham MC, Yang M, Hu JJ, Frankel AE.Growth factor receptor expression varies among high-grade gliomasand normal brain: epidermal growth factor receptor has excellentproperties for interstitial fusion protein therapy. Mol Cancer Ther2003;2(8):783–7.
[20] Moller-Hartmann W, Herninghaus S, Krings T, Marquardt G,Lanfermann H. Clinical application of proton magnetic resonancespectroscopy in the diagnosis of intracranial mass lesions. Neurora-diology 2002;44:371–81.
[21] Ward NL, Moore E, Noon K, et al. Cerebral angiogenic factors,angiogenesis, and physiological response to chronic hypoxia differamong four commonly used mouse strains. J Appl Physiol 2007;102:1927–35.
[22] Charles B, Stevenson E, McMillan MK, et al. CXCR4 Expression iselevated in glioblastoma multiforme and correlates with an increase inintensity and extent of peritumoral T2-weighted magnetic resonanceimaging signal abnormalities. Neurosurgery 2008;63:560–9.
[23] Hammoud MA, Sawaya R, Shi W, Thall PF, Leeds NF. Prognosticsignificance of preoperative MRI scan in glioblastoma multiforme. JNeurooncol 1996;27:65–73.
[24] Ehtesham M, Winston JA, Kabos P, Thompson RC. CXCR4expression mediates glioma cell invasiveness. Oncogene 2006;25:2801–6.
[25] Kelly J, Daumas-Duport C, Kispert DB, Kall BA, Scheithauer BW.Imaging-based stereotaxic serial biopsies in untreated intracranial glialneoplasms. J Neurosurg 1987;66:865–74.
[26] Villalba AM, Okuducu AF, Deimling A. The evolution of ourunderstanding on glioma. Brain Pathol 2008;18:455–63.
[27] Vajkoczy P, Menger MD, Vollmar B, et al. Inhibition of tumorgrowth, angiogenesis, and microcirculation by the novel Flk-1inhibitor SU5416 as assessed by intravital multi-fluorescencevideomicroscopy. Neoplasia 1999;1(1):31–41.
[28] JenkinsonMD, Du Plessis DG,Walker C, Smith TS. AdvancedMRI inthe management of adult gliomas. Br J Neurosurg 2007;21(6):550–61.
[29] Provias J, Claffey K, delAguila L, Lau N, Feldkamp M, Guha A.Meningiomas: role of vascular endothelial growth factor/vascularpermeability factor in angiogenesis and peritumoral edema. Neurosur-gery 1997;40:1016–26.
[30] Etzioni R, Urban N, Ramsey S, McIntosh M, Schwartz S, Reid B, et al.The case for early detection. Nat Rev Cancer 2003;3(4):243–52.
[31] Folkman J. Tumor angiogenesis: therapeutic implications. N Engl JMed 1971;285:1182–6.
[32] Folkman J. Role of angiogenesis in tumor growth and metastasis.Semin Oncol 2002;29:15–8.
[33] Groothuis DR. The blood–brain and blood–tumor barriers: a review ofstrategies for increasing drug delivery. Neuro Oncol 2000;2:45–59.
[34] Peng XH, Qian X, Mao H, et al. Targeted magnetic iron oxidenanoparticles for tumor imaging and therapy. Int J Nanomed 2008;3(3):311–21.


