Embed Size (px)
Citation preview

J Physiol 587.4 (2009) pp 753–768 753
GABAergic activities enhance macrophage inflammatoryprotein-1α release from microglia (brain macrophages)in postnatal mouse brain
Giselle Cheung1, Oliver Kann2, Shinichi Kohsaka3, Katrin Faerber1 and Helmut Kettenmann1
1Cellular Neurosciences, Max-Delbrueck-Center for Molecular Medicine, Robert-Roessle-Strasse 10, D-13092 Berlin, Germany2Institute for Neurophysiology, Charite – Universitaetsmedizin Berlin, Tucholskystrasse 2, D-10117 Berlin, Germany3Department of Neurochemistry, National Institute of Neuroscience, Kodaira, Tokyo 187-8502, Japan
Microglial cells (brain macrophages) invade the brain during embryonic and early postnataldevelopment, migrate preferentially along fibre tracts to their final position and transform froman amoeboid to a ramified morphology. Signals by which the invading microglia communicatewith other brain cells are largely unknown. Here, we studied amoeboid microglia in postnatalcorpus callosum obtained from 6- to 8-day-old mice. These cells accumulated on the surface ofacute brain slices. Whole-cell patch-clamp recordings revealed that the specific GABAA receptoragonist muscimol triggered a transient increase in conductance typical for inward rectifyingpotassium channels in microglia. This current increase was not mediated by microglial GABAA
receptors since microglial cells removed from the slice surface no longer reacted and culturedmicroglia only responded when a brain slice was placed in their close vicinity. Muscimol triggereda transient increase in extracellular potassium concentration ([K+]o) in brain slices and anexperimental elevation of [K+]o mimicked the muscimol response in microglial cells. Moreover,in adult brain slices, muscimol led only to a minute increase in [K+]o and microglial cellsfailed to respond to muscimol. In turn, an increase in [K+]o stimulated the release of chemo-kine macrophage inflammatory protein-1α (MIP1-α) from brain slices and from cultures ofmicroglia but not astrocytes. Our observations indicate that invading microglia in early post-natal development sense GABAergic activities indirectly via sensing changes in [K+]o whichresults in an increase in MIP1-α release.
(Resubmitted 24 September 2008; accepted after revision 27 November 2008; first published online 1 December 2008)Corresponding author H. Kettenmann: Cellular Neurosciences, Max-Delbrueck-Center for Molecular Medicine,Robert-Roessle-Strasse 10, D-13092 Berlin, Germany. Email: [email protected]
Microglia are of mesodermal origin, share many featureswith monocytes and invade the central nervous system(CNS) early in development (Perry et al. 1985; Cuadros& Navascues, 2001). del Rio-Hortega (1932) found thatthe microglial progenitors, or microgliocytes as he calledthem, are characterized by amoeboid morphology andhave preferred regions of invasion. One of those regionsis the supraventricular corpus callosum. These immaturemicroglial cells use axon tracts and vessels as guidingstructures. As a consequence, migrating microglial cellsaccumulate in white matter tracts such as in the corpuscallosum in early postnatal days. These highly motilemicroglial cells perform active phagocytosis of cellulardebris in response to naturally occurring cell death (Ferreret al. 1990; Brockhaus et al. 1996). Using postnatal acute
This paper has online supplemental material.
brain slices, invading amoeboid microglia can be studiedwith imaging or patch-clamp techniques. They activelyscan the slice surface with their processes and expressprominent inward-rectifying K+ channels (Kir; Brockhauset al. 1993) similar to microglia in vitro (Kettenmann et al.1990). Recent evidence indicates that microglial propertieslike motility and migration, phagocytosis, release ofcytokines and reactive oxygen species are modulated byneurotransmitters (Pocock & Kettenmann, 2007). Foramoeboid microglia, functional expression of purinergic(Haas et al. 1996), adrenergic and dopaminergic (Farberet al. 2005) receptors have been described.
The majority of microglial studies have focused ontheir roles in pathology (Aloisi, 2001; Bajetto et al.2002). It is well established that microglia, activatedby a pathological event, recruit haemopoietic cells bythe release of chemokines such as keratinocyte-derivedchemokine (KC), macrophage inflammatory protein-1α/β
C© 2009 The Authors. Journal compilation C© 2009 The Physiological Society DOI: 10.1113/jphysiol.2008.163923

754 G. Cheung and others J Physiol 587.4
(MIP1-α/β), MIP2, monocyte chemoattractant protein-1(MCP-1), RANTES, γ interferon, inducible protein-10(IP-10) and IL-8 (Hanisch, 2002; Ambrosini & Aloisi,2004). Recent studies have provided strong evidencethat chemokines including stromal cell-derived factor-1(SDF-1), RANTES, MCP-1, MIP1-α, IL-8, KC andfractalkine appear to regulate developmental processes(Ambrosini & Aloisi, 2004; Rostene et al. 2007). Sincemicroglial cells are an important source of chemokinesin the CNS, they have the potential to regulate braindevelopment.
The formation of neuronal circuits duringbrain development requires intricate mechanismsinvolving different cell types and signalling molecules.γ-Amino-butyric acid (GABA) is released from growthcones of developing axons prior to synapse formation(Gao & van den Pol, 2000) and acts as a trophic factor inthe developing brain. Microglial cells have been shownto express GABAB receptors (Kuhn et al. 2004), butat present there is no evidence for functional GABAA
receptors in microglia. In the present study we haveaddressed the question of whether GABA will affectmicroglial properties in the developing brain.
Methods
Animals
Wild-type Naval Medical Research Institute (NMRI) micewere provided by Charles River Laboratories (Sulzfeld,Germany). Transgenic mice expressing enhanced greenfluorescent protein (EGFP) under the control of theionized calcium binding adaptor molecule 1 (Iba1) andglial fibrillary acidic protein (GFAP) promoters werepreviously described (Nolte et al. 2001; Hirasawa et al.2005). All animals were bred and maintained in ourinstitutional animal facility. All experimental procedureswere approved by official committees and adhere toinstitutional guidelines.
Acute brain slice preparation
Acute brain slices were prepared from postnatal(postnatal days (P)6–8) and adult (P35–40) mice aspreviously described (Haas et al. 1996). In brief, micewere decapitated and brains were carefully removed andwashed in standard brain slice buffer containing (in mM):NaCl 134; KCl 2.5; MgCl2 1.3; CaCl2 2; K2HPO4 1.25;NaHCO3 26; D-glucose 10; pH 7.4. The buffer solution wassaturated with carbogen (95% O2, 5% CO2). Coronal slicesof 150 μm were made at 4◦C using a vibratome (Leica,Heidelberg, Germany). They were then gently transferredand maintained in brain slice buffer at room temperature(21–25◦C) until used.
Cell cultures
Primary cultures of astrocytes and microglia wereprepared from cerebral cortex of newborn NMRI miceas previously described (Prinz et al. 1999; Kresse et al.2005). In brief, cortical tissue freed of blood vesselsand meninges was trypsinized for 2 min. It was thendissociated with a fire-polished pipette and washed twice.Mixed glial cells were cultured in Dulbecco’s modifiedEagle’s medium (DMEM) supplemented with 10% fetalcalf serum (FCS), 2 mM L-glutamine, and antibiotics(100 units ml−1 penicillin and 100 μg ml−1 streptomycin).After 9–12 days with a medium change every thirdday, microglial cells were separated from the underlyingastrocytic layer by gentle shaking for 1 h at 37◦C with ashaker incubator (100 r.p.m.). Cells were then seeded onglass coverslips or 96-well plates at a density of 5 × 10⁴ percoverslip or 2 × 10⁵ cells per well, respectively. Primarycultures of microglia and astrocytes typically contained> 95% microglial cells or> 90% astrocytes as detected by amicroglia marker, Griffonia simplicifolia isolectin B4(Sigma) or an antibody against GFAP (DAKO, Hamburg,Germany), respectively. Plated cells were used forexperiments within 1–3 days after plating. Cell media andsupplements were purchased from Seromed/Biochrom(Berlin, Germany). Microglial depletion was performedwith clodronate liposomes prepared according topreviously described protocols (Van Rooijen & Sanders,1994).
Electrophysiological recordings
Acute brain slices or culture coverslips were placed in aholding chamber mounted on the stage of an uprightlight microscope (Axioskop, Zeiss, Jena, Germany). Tomaintain constant condition during experiments, thechamber was continuously perfused with standard brainslice or Hepes buffer for brain slices or cultures,respectively, at 4–6 ml min−1. Hepes buffer contained (inmM): NaCl 150; KCl 5.4; CaCl2 2; MgCl2 1; Hepes 5;D-glucose 10 at pH 7.4. Amoeboid microglia accumulatedon the surface of postnatal brain slices at the corpuscallosum region which became evident 1 h after the slicepreparation. They could be identified by their distinctivemorphology under light microscopy as previouslydescribed (Brockhaus et al. 1993). Acute brain slicesobtained from Iba1- and GFAP-EGFP mice were used toselectively observe microglia and astrocyte populations,respectively. EGFP-positive cells were identified using anexcitation beam at 488 nm generated by a monochromator(Polychrome IV, Till Photonics, Martinsried, Germany).The emitted light was collected at 530 ± 10 nm. Patchpipettes were pulled from borosilicate capillaries (innerdiameter 0.87 mm; outer diameter 1.5 mm; Hilgenberg,Malsfeld, Germany) using a P-2000 laser-based pipette
C© 2009 The Authors. Journal compilation C© 2009 The Physiological Society
J Physiol 587.4 Invading microglia and GABAergic activities 755
puller (Sutter Instrument Co., Novato, CA, USA) and filledwith pipette solution containing (in mM): KCl 130; MgCl2
2; CaCl2 0.5; Hepes 10; EGTA 5 at pH 7.3. To confirmintracellular access, Alexa Fluor 594 (10 μg ml−1,Invitrogen, Karlsruhe, Germany) was added to the pipettesolution. Pipette resistance ranged from 5 to 8 M�.Whole-cell voltage-clamp experiments were performedaccording to previously described protocols (Hamillet al. 1981). Currents filtered at 2.9 kHz were recordedusing an EPC-9 amplifier coupled to TIDA software(HEKA Electronics, Lambrecht, Germany). Capacitativetransients and series resistance were compensated bythe software. Membrane potential and resistance weremeasured on screen. Only cells with stable membranepotential throughout measurements were used. Drugapplication was achieved by changing the perfusate. Thetime of perfusion exchange was determined by measuringthe time course of an increase in [K+]o by K+-sensitivemicroelectrodes in the chamber and within the slice.The time constant of exchange was 22 ± 4 s (n = 15)in the chamber and 80 ± 6 s (n = 8) in the slices. Asample trace is shown in Supplemental Fig. 1 of the onlineSupplemental material. All experiments were performedat room temperature.
Extracellular potassium measurement
Recordings of extracellular potassium concentration([K+]o) in acute brain slices were performed accordingto previously described protocols (Heinemann & Arens,1992; Kann et al. 2003). Changes in [K+]o were recordedwith double-barrel microelectrodes from theta glass(Science Products, Hofheim, Germany). One barrel wasfilled with 154 mM NaCl and served as a reference channel;the other barrel was filled with K+ ionophore I cocktail A(60031; Fluka Chemie, Buchs, Switzerland) and 100 mM
KCl, and served as the ion-sensitive channel. The amplifierwas equipped with negative capacitance feedback control,which permitted recordings of changes in [K+]o with timeconstants of 50–200 ms. Changes in voltage were digitizedat 10 Hz using FeliX software (Photon TechnologyInstruments, Wedel, Germany). To translate the recordedpotential values (mV) in [K+]o, a modified Nernstequation was used (Heinemann & Arens, 1992; Kann et al.2003): log[Ion]1 = EM(s × v)−1 + log[Ion]0, where EM
represents recorded potential; s, electrode slope obtainedat calibration; v, valency of the specific ion; [Ion]0, ionconcentration at rest; and [Ion]1, ion concentration duringactivation.
Microchemotaxis assay
Microglial migration assay was performed in 48-wellmicrochemotaxis chambers (Neuroprobe, Gaithersburg,
MD, USA) as previously described (Nolte et al. 1996).Test substances diluted in serum-free DMEM were addedto each of the lower wells. Upper and lower wells wereseparated by a polycarbonate filter with a pore size of8 μm (Poretics Corp., Livermore, CA, USA). Culturedmicroglia were added to the upper wells (4 × 10⁴ perwell), and the chamber was incubated at 37◦C and 5%CO2 for 2 h. Filters were then removed and stained formicroglia with Diff-Quik-Fix stain set (MedionDiagnostics, Dudingen, Switzerland) according to themanufacturer’s instructions. The rate of microglialmigration was calculated by counting cells in four randomfields of each well and normalized to control conditions.
Microglial proliferation assay
Microglial cells plated in 96-well plates were treatedfor 24 or 48 h with the test substance in the presenceof 10 μM bromodeoxyuridine (BrdU) diluted inDMEM/10% FCS. Proliferation was assessed using BrdUlabelling and detection kit (Roche, Mannheim, Germany)according to the manufacturer’s instructions. The amountof BrdU incorporated by cells after the treatment periodwas taken as a measure of proliferation. The resultingcolorimetric reaction product was measured at 405 nmagainst 490 nm using a microplate reader (Perkin Wallac,Freiburg, Germany). Proliferation was normalized tocontrol conditions.
Cytokine and chemokine quantification
To determine chemokine released in situ, 150 μm-thickhalf-hemispheres of postnatal corpus callosum slices werestored in 96-well plates in standard brain slice buffer whilemaintaining 5% CO2 and 95% O2 at pH 7.4. After at least1 h of resting period, slices were washed once with bufferand incubated with test substances for 1.5 or 3 h. Forcytokine and chemokine released in vitro, cells platedin 96-well plates were treated for 1.5, 3 or 24 hwith test substances diluted in DMEM/10% FCS.Buffer or culture medium was collected after treatmentperiods and measured for the amount of IL-6,IL-12, KC, tumour necrosis factor-α (TNF-α), andMIP1-α using enzyme-linked immunosorbent assay(ELISA) according to the manufacturer’s instructions(R&D Systems, Wiesbaden, Germany). The resultingcolorimetric reaction product was measured at 450 nmagainst 540 nm using a microplate reader (Perkin Wallac).Cytokine and chemokine release was normalized tocontrol conditions. Standard curves ranging from 125to 4000 pg ml−1 were obtained using respective proteinstandards.
C© 2009 The Authors. Journal compilation C© 2009 The Physiological Society
756 G. Cheung and others J Physiol 587.4
Cell viability test
Lactate dehydrogenase (LDH) cytotoxicity detection kitwas used for quantification of cell viability accordingto the manufacturer’s instructions (Roche, Mannheim,Germany). The colorimetric assay was quantified at490 nm against 620 nm using a microplate reader (PerkinWallac). The measurement of the activity of LDH releasedfrom the cytosol of damaged cells into the supernatantwas taken as a measure of cell death and lysis in microglialcultures treated with the test substance.
Statistical analysis
Statistical analyses were performed using MicrosoftExcel and Origin (OriginLab, Northampton, MA,USA) software. Differences between groups wereevaluated by two-sample Student’s t test. P values < 0.05were considered statistically significant with ∗P < 0.05;∗∗P < 0.01.
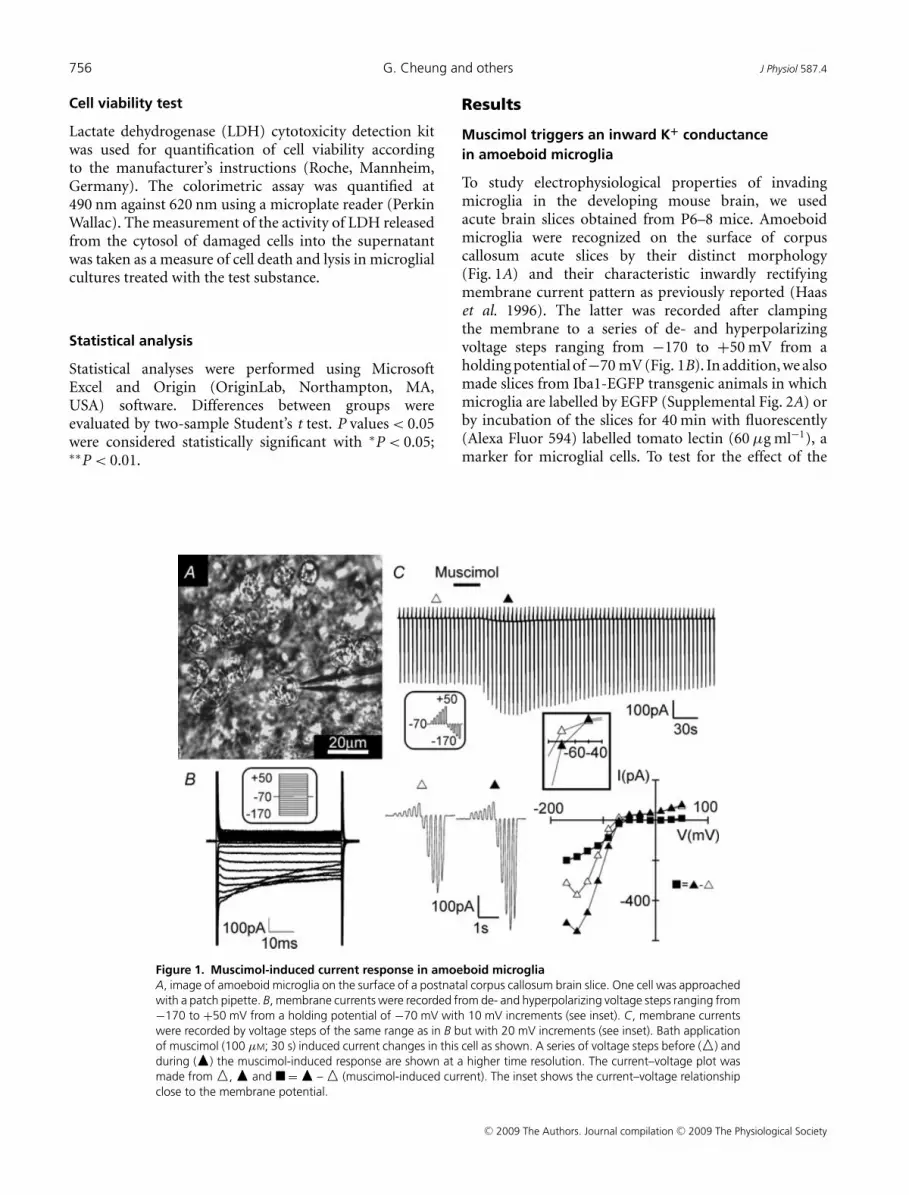
Figure 1. Muscimol-induced current response in amoeboid microgliaA, image of amoeboid microglia on the surface of a postnatal corpus callosum brain slice. One cell was approachedwith a patch pipette. B, membrane currents were recorded from de- and hyperpolarizing voltage steps ranging from−170 to +50 mV from a holding potential of −70 mV with 10 mV increments (see inset). C, membrane currentswere recorded by voltage steps of the same range as in B but with 20 mV increments (see inset). Bath applicationof muscimol (100 μM; 30 s) induced current changes in this cell as shown. A series of voltage steps before (�) andduring (�) the muscimol-induced response are shown at a higher time resolution. The current–voltage plot wasmade from �, � and � = � – � (muscimol-induced current). The inset shows the current–voltage relationshipclose to the membrane potential.
Results
Muscimol triggers an inward K+ conductancein amoeboid microglia
To study electrophysiological properties of invadingmicroglia in the developing mouse brain, we usedacute brain slices obtained from P6–8 mice. Amoeboidmicroglia were recognized on the surface of corpuscallosum acute slices by their distinct morphology(Fig. 1A) and their characteristic inwardly rectifyingmembrane current pattern as previously reported (Haaset al. 1996). The latter was recorded after clampingthe membrane to a series of de- and hyperpolarizingvoltage steps ranging from −170 to +50 mV from aholding potential of−70 mV (Fig. 1B). In addition, we alsomade slices from Iba1-EGFP transgenic animals in whichmicroglia are labelled by EGFP (Supplemental Fig. 2A) orby incubation of the slices for 40 min with fluorescently(Alexa Fluor 594) labelled tomato lectin (60 μg ml−1), amarker for microglial cells. To test for the effect of the
C© 2009 The Authors. Journal compilation C© 2009 The Physiological Society

J Physiol 587.4 Invading microglia and GABAergic activities 757
specific GABAA receptor agonist muscimol (100 μM), theseries of voltage jumps was repetitively applied (every 5 s).When muscimol was applied via the bath solution for 30 s,the current elicited with hyperpolarizing voltage jumpsincreased (Fig. 1C). At −170 mV, the increase amountedto 130 ± 23 pA (n = 32; P < 0.01). The peak responsewas reached after 21 ± 2 s and returned to baseline after149 ± 2 s. An increase at the peak response was consideredsignificant when it was above a threshold of three timesmembrane noise standard deviation. Moreover, we foundthat muscimol elicited only one response in each cell.A second muscimol application even after a 10 minwashout did not trigger a response (n = 8; Fig. 2A). Thecells were, however, still responsive to 1 mM ATP. Inthe presence of the GABAA receptor antagonist gabazine(10 μM; 1.5 min pre-application), we only observed aresponse to muscimol in 20% of cells (n = 10; Fig. 2B).This response was significantly smaller compared to themuscimol response (47 ± 5 pA at −170 mV; P < 0.01) inthe absence of the antagonist. Furthermore, we can showthat muscimol-induced current response can be blockedby the K+ channel blocker BaCl2 (100 μM), in 8 out of 9cells (Fig. 2C) and was unaffected by addition of 0.5 μM
tetrodotoxin (TTX; n = 5; data not shown).We also recorded from tomato lectin-positive microglial
cells located within the slice tissue. These cells showeda similar response to bath application of muscimol asthe amoeboid cells on the surface (n = 6; SupplementalFig. 2B). In addition, we have also tested the effectGABA and observed a similar inward current response inamoeboid microglia. However, the amplitude was muchsmaller as compared to muscimol (25 ± 3%, n = 5; datanot shown). The smaller response to GABA could beexplained by GABA uptake and therefore, the specific
Figure 2. GABAA receptor-specificmuscimol-induced current response inamoeboid microgliaMembrane currents from amoeboidmicroglia were recorded in response tovoltage steps as described in Fig. 1C. Theindividual voltage steps cannot be resolvedat this low time resolution display. A,muscimol (100 μM; 30 s) was applied twiceinterrupted by a 10 min interval. Afteranother 3 min, ATP was applied (500 μM;30 s). B, muscimol (100 μM; 30 s) was alsoapplied in the presence of gabazine (10 μM;1.5 min pre-application) followed by ATP(1 mM; 30 s). C, muscimol (100 μM; 30 s)was applied in the presence of BaCl2(100 μM; 2 min pre-application).
GABAA agonist muscimol was used throughout thisstudy.
The muscimol-induced current response is mediatedby a factor released from the slice
To test whether muscimol directly stimulates microglialcells or indirectly by the release of a factor from the slice,we tested muscimol on amoeboid microglial cells afterremoval from the slice. After establishing the seal withthe recording pipette using the whole-cell patch-clampconfiguration, amoeboid microglia were carefully liftedup from the surface of the slice as illustrated in Fig. 3A.The cells were maintained for 5 min and then muscimol(100 μM) was applied for 30 s. Whereas 100% of cellsshowed a muscimol-induced response at the surface, 5out of 6 and only 3 out of 15 cells responded at a distanceof 150 and 300 μm, respectively (Fig. 3B). In cells whichshowed a muscimol-induced response at 150 and 300 μm,the inward current was 39 ± 13 pA and 20 ± 7 pA forthe −170 mV voltage jump, respectively, thus 30% and16% of the average response at the surface. As a control,the response to ATP (0.5–1 mM) following muscimolapplication did not significantly change in relation to thedistance from the slice.
To establish that muscimol triggers the release of afactor from brain slices that induces a response in micro-glia, we tested for the responsiveness of microglial cellsfrom primary cultures towards muscimol. We also placeda brain slice of a half-hemisphere on the coverslip with themicroglial culture (Fig. 3C). After observing thatmuscimol (100 μM) did not trigger a current responsein microglial cells in culture (n = 43, Fig. 3D left trace),we recorded the membrane current response to muscimol
C© 2009 The Authors. Journal compilation C© 2009 The Physiological Society

758 G. Cheung and others J Physiol 587.4
Figure 3. Muscimol-induced current responses in microglia are only observed in the vicinity of postnatalbrain sliceA, illustration showing how an amoeboid microglial cell could be lifted up from the brain slice while still attachedto the patch pipette (left). Image of a cell lifted up 300 μm from the slice (right). B, membrane currents wererecorded as described in Fig. 1C while muscimol (100 μM; 30 s) was applied. ATP (500 μM; 30 s) was applied asa positive control 4 min later. C, an illustration showing how the brain slice was cut into half-hemispheres andone was placed on a coverslip with cultured microglial cells (left). Images showing the brain slice and a culturedmicroglial cell approached with the patch pipette at high and low resolutions (right). D, similar to B, membranecurrents of cultured microglial cells were recorded during muscimol (100 μM; 30 s) application in the absence(left) and presence of a brain slice (middle). The current–voltage plot was made from �, � and � = � – �(muscimol-induced current). E, a ramified microglial cell in the cortex close to the corpus callosum in an acute brainslice prepared from an adult (P35–40) Iba1-EGFP transgenic mouse is shown. EGFP fluorescence and the samecell filled with Alexa Fluor 594 (10 μg ml−1) via the patch pipette are shown (left). Membrane currents typical fora ramified microglial cell were recorded as described in Fig. 1B (middle). Similar to B, membrane currents wererecorded while applying muscimol (100 μM; 30 s) and ATP (1 mM; 30 s) 5 min apart.
C© 2009 The Authors. Journal compilation C© 2009 The Physiological Society
J Physiol 587.4 Invading microglia and GABAergic activities 759
from a cultured microglial cell close to the brain slice.Eighty-nine per cent of primary cultured microglialcells in close vicinity to the slice (within 1 mmdistance) responded with an increase in inwardcurrent in response to muscimol similar to thatobserved in amoeboid microglia on brain slices (n = 18;Fig. 3D middle trace and right-hand current–voltageplot). The muscimol-triggered current recorded at−170 mV (−43 ± 6 pA) was, however, significantlysmaller (P < 0.05) than that observed in amoeboid micro-glia from brain slices. The peak of the muscimol-inducedresponse was reached 22 ± 3 s after muscimol application.These results demonstrate that GABAA receptor activationin acute brain slices from early postnatal age induced therelease of an intrinsic factor which stimulates microglialcells.
To analyse whether this GABAA-mediated effect isspecific for early postnatal development, we recordedmembrane currents from microglial cells in acute brainslices obtained from adult (P35–40) Iba1-EGFP mice. Themicroglial cells had a ramified morphology as revealed bydye filling with Alexa Fluor 594 (10 μg ml−1) included inthe pipette. These cells were also characterized by smallinward currents induced by hyperpolarizing voltage steps
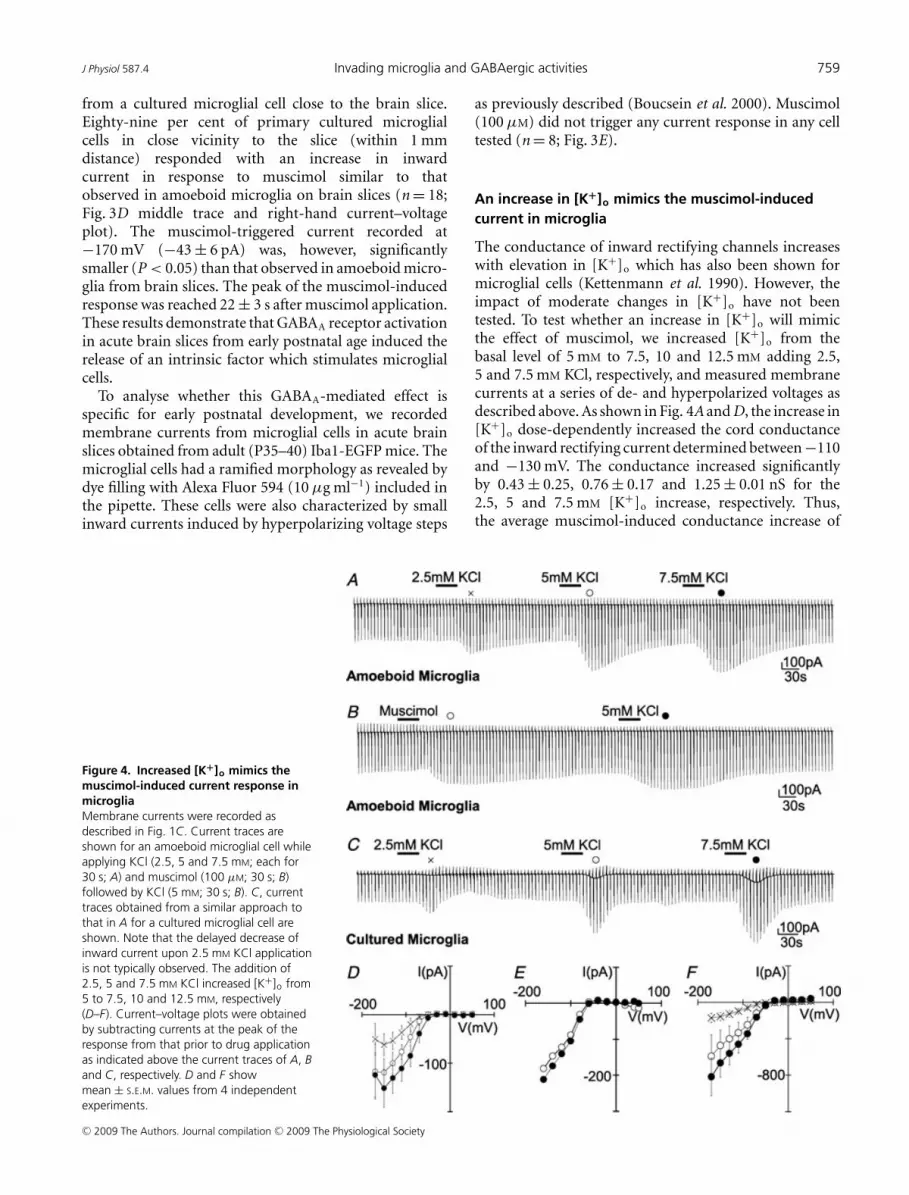
Figure 4. Increased [K+]o mimics themuscimol-induced current response inmicrogliaMembrane currents were recorded asdescribed in Fig. 1C. Current traces areshown for an amoeboid microglial cell whileapplying KCl (2.5, 5 and 7.5 mM; each for30 s; A) and muscimol (100 μM; 30 s; B)followed by KCl (5 mM; 30 s; B). C, currenttraces obtained from a similar approach tothat in A for a cultured microglial cell areshown. Note that the delayed decrease ofinward current upon 2.5 mM KCl applicationis not typically observed. The addition of2.5, 5 and 7.5 mM KCl increased [K+]o from5 to 7.5, 10 and 12.5 mM, respectively(D–F). Current–voltage plots were obtainedby subtracting currents at the peak of theresponse from that prior to drug applicationas indicated above the current traces of A, Band C, respectively. D and F showmean ± S.E.M. values from 4 independentexperiments.
as previously described (Boucsein et al. 2000). Muscimol(100 μM) did not trigger any current response in any celltested (n = 8; Fig. 3E).
An increase in [K+]o mimics the muscimol-inducedcurrent in microglia
The conductance of inward rectifying channels increaseswith elevation in [K+]o which has also been shown formicroglial cells (Kettenmann et al. 1990). However, theimpact of moderate changes in [K+]o have not beentested. To test whether an increase in [K+]o will mimicthe effect of muscimol, we increased [K+]o from thebasal level of 5 mM to 7.5, 10 and 12.5 mM adding 2.5,5 and 7.5 mM KCl, respectively, and measured membranecurrents at a series of de- and hyperpolarized voltages asdescribed above. As shown in Fig. 4A and D, the increase in[K+]o dose-dependently increased the cord conductanceof the inward rectifying current determined between −110and −130 mV. The conductance increased significantlyby 0.43 ± 0.25, 0.76 ± 0.17 and 1.25 ± 0.01 nS for the2.5, 5 and 7.5 mM [K+]o increase, respectively. Thus,the average muscimol-induced conductance increase of
C© 2009 The Authors. Journal compilation C© 2009 The Physiological Society

760 G. Cheung and others J Physiol 587.4
0.81 ± 0.09 nS was similar to the increase triggeredby 5 mM K+ (Fig. 4B and E). A similar conductanceincrease by elevated [K+]o was also obtained in culturedmicroglial cells. The conductance increased significantlyby 1.74 ± 0.66, 3.32 ± 1.31 and 4.99 ± 1.61 nS for anelevation to 7.5, 10 and 12.5 mM (Fig. 4C and F). Thus,an increase in [K+]o could explain the muscimol-inducedconductance change both in the amoeboid microglia fromthe slice and the cultured microglial cells placed close to aslice.
Muscimol triggers an increase in [K+]o withinand on the surface of the brain slice
To test whether muscimol would induce an increase in[K+]o, we measured [K+]o using K+-sensitive micro-electrodes. The electrodes were either placed on the surfaceof the slice close to the amoeboid microglia or insertedabout 30 μm within the slice. When placed on the surfaceof the slice, a first application of muscimol (100 μM) for30 s increased [K+]o transiently from 5 to 7.5 ± 0.2 mM
(n = 6; Fig. 5A and E). The peak of the increase wasreached within 54 ± 7 s. The [K+]o returned to baselineafter 342 ± 18 s. A second or third application separatedby 15 min washout induced a significantly smaller increaseto only 5.7 mM (n = 6). In the presence of the GABAA
receptor antagonist gabazine (with 2 min pre-application,10 μM), muscimol failed to trigger an increase in [K+]o
Figure 5. [K+]o in brain slices during GABAAreceptor stimulationA K+-sensitive microelectrode was used to measure[K+]o during repetitive muscimol applications (Mus;100 μM; 30 s; A) and muscimol application (Mus;100 μM; 30 s; B) in the presence and absence ofgabazine (Gbz; 10 μM; 2 min pre-application) at thesurface of a postnatal (P6–8) corpus callosum slice. C,similar recording to that in A, but with themicroelectrode placed 30 μm below the surface of thecorpus callosum. D, similar recording to that in C, butfrom an adult (P35–40) corpus callosum slice. E,mean ± S.E.M. values of peak amplitudes are plottedfrom 6 independent experiments. First, second and thirdmuscimol response and that in the presence of gabazine(Mus + Gbz) are shown. In all experiments, baseline[K+]o was adjusted to 5 mM. ∗P < 0.05, ∗∗P < 0.01compared to the first muscimol response unlessindicated otherwise.
(n = 4; Fig. 5B and E). With the K+-sensitive micro-electrodes inserted about 30 μm into the corpus callosumslice, a [K+]o increase to 9.6 ± 0.8 mM was detected uponfirst application of 100 μM muscimol (n = 4; Fig. 5C andE), significantly greater than that observed at the surface.Subsequent responses were also smaller in amplitude asobserved on the surface. We also analysed for potentialdifferences in [K+]o elevation between postnatal corpuscallosum and cortical regions (n = 6; data not shown),but did not find any significant difference, either on thesurface or within the slice, indicating that K+ releasedto the extracellular space was similar in neighbouringbrain regions. To study age-dependent K+ release uponGABAA receptor stimulation, [K+]o was measured inadult brain slices obtained from 35- to 40-day-old mice.Significantly smaller [K+]o increases were observed bothon the surface (to 5.6 ± 0.1 mM; n = 5) and within adultslices (to 6.5 ± 0.2 mM; n = 3) as compared to postnatalones (Fig. 5D and E).
Macroglial cells in the corpus callosum showGABAA receptor-mediated responses
To study GABA responses in macroglial cells of thecorpus callosum, astrocytes and oligodendrocytes, weidentified cells by recording membrane currents atpotentials ranging from −170 to +50 mV. Based on thecurrent pattern, we could distinguish between three cell
C© 2009 The Authors. Journal compilation C© 2009 The Physiological Society

J Physiol 587.4 Invading microglia and GABAergic activities 761
populations. As previously described, oligodendrocytesare characterized by a linear current–voltage curve withdecaying currents and large tail currents (Berger et al.1992). After injection with Alexa Fluor 594, we couldrecognize the processes orientated in parallel to the fibres,the typical morphological feature of oligodendrocytes(Fig. 6A). Similar to recordings for hippocampus, cortexor cerebellum, astrocytes (Fig. 7A) are characterized bya linear current–voltage curve without current decay(Muller et al. 1992; Steinhauser et al. 1992; Schipkeet al. 2001). In addition, we found a third populationof cells with an outwardly rectifying current pattern(Fig. 6B) previously described as glial progenitor cells inthe corpus callosum (Berger et al. 1991), complex cells orNG2 cells in the hippocampus and other brain regions(Bergles et al. 2000; Lin & Bergles, 2002; Lin et al. 2005;Ziskin et al. 2007). The astrocytes had processes with adiffuse appearance, while the glial progenitor cells werecharacterized by thin and elongated processes. In addition,we studied cells in slices from GFAP-EGFP transgenicmice in which astrocytes are strongly labelled by EGFPand could thus be distinguished from oligodendrocytesand glial progenitor cells. All three cell types respondedto application of muscimol (100 μM; 30 s) with an inwardcurrent recorded at −70 mV. Oligodendrocytes responded
Figure 6. Muscimol-induced currentresponse from an oligodendrocyte anda glial progenitor cell in the corpuscallosumAn oligodendrocyte with characteristic tailcurrent (A) and a glial progenitor cell withvoltage-gated membrane current (B) in theneighbourhood of amoeboid microglia inthe postnatal corpus callosum werevoltage-clamped. Images of cells filled withAlexa Fluor 594 (10 μg ml−1) via patchpipette are shown (top left). Membranecurrents (top middle and bottom left) wererecorded as described in Fig. 1 in responseto muscimol (100 μM; 30 s). Voltage stepsbefore (1), during (2) and after (3)muscimol-induced response are shown at ahigher time resolution (bottom middle).Current–voltage plots were obtained bysubtracting current responses at varioustime points as indicated (right).
to muscimol with an inward current of 171 ± 38 pA(n = 4; Fig. 6A) and glial progenitor cells with an inwardcurrent of 228 ± 52 pA (n = 9; Fig. 6B) and astrocytes withan inward current of 188 ± 39 pA (n = 9; Fig. 7A). Tomeasure membrane conductance, we repetitively clampedthe membrane to a series of potentials ranging from −170to +50 mV with 20 mV increments. We generally observedthat the resting conductance permanently decreased afterapplication of muscimol, similar to previous reports forBergmann glial cells (Muller et al. 1994) or astrocytes,oligodendrocytes and glial progenitor cells in the spinalcord (Pastor et al. 1995). In all the three cell typeswe observed a conductance increase when comparingcurrent–voltage curves at the peak of the response andafter washout. The current reversed at positive potentialsranging from 10 to 40 mV. It was, however, evident that themuscimol-induced current showed inward rectification.The extrapolated reversal potential of the current recordedat negative membrane potentials was closer to 0 mV.
We also recorded from neurons which were locatedin the cortex at the border of the corpus callosum.These cells were identified by their large Na+ currentsand their ability to generate action potentials (datanot shown). The muscimol-triggered inward current at−70 mV was 1129 ± 130 pA (n = 13), thus significantly
C© 2009 The Authors. Journal compilation C© 2009 The Physiological Society

762 G. Cheung and others J Physiol 587.4
larger as in glial cells (Fig. 7B). Similar to glial cells and aspreviously reported for granule neurons of the cerebellum(Labrakakis et al. 1997), we observed a permanent decreaseof the resting conductance after application of muscimol.The reversal potential at the peak of the response was atabout 20 mV and, similar to glial cells, the extrapolatedreversal potential from currents recorded at negativemembrane potentials was close to 0 mV.
When muscimol was applied a second time after15 min washout, a markedly smaller responsewas observed in complex cells (n = 4), neurons(n = 3) and oligodendrocytes (n = 3). To excludea contribution of indirect effect via activation ofglutamate receptors or action potentials, we studiedmuscimol-induced currents in the presence of α-amino-3-hydroxy-5-methyl-4-isoxazolepropionic acid (AMPA)/kainate receptor antagonist 2,3-dihydroxy-6-nitro-7-sulfamoyl-benzo[f]quinoxaline-2,3-dione (NBQX;10 μM), N-methyl-D-aspartic acid (NMDA) receptorantagonist amino-5-phosphonovaleric acid (APV; 50 μM)and TTX (0.5 μM) in glial progenitor cells (n = 3) andoligodendrocytes (n = 3). We observed similar responsesto those in control experiments (see SupplementalFig. 3 for a sample trace). We conclude that macroglial
Figure 7. Muscimol-induced currentresponse from an astrocyte in thecorpus callosum and a neuron at theborder of cortex to corpus callosumA, an astrocyte with passive membranecurrent was identified by its strong EGFPfluorescence (top left) in a GFAP-EGFPtransgenic animal. B, a cortical neuron closeto the corpus callosum was also identifiedby large Na+ currents in NMRI mice. Imagesof cells filled with Alexa Fluor 594(10 μg ml−1) via patch pipette are shown(top left). Membrane currents (top middleand bottom left) were recorded as describedin Fig. 1 in response to muscimol (100 μM;30 s). Voltage steps before (1), during (2)and after (3) muscimol-induced response areshown at a higher time resolution (bottommiddle). Current–voltage plots wereobtained by subtracting current responsesat various time points as indicated (right).
cells in the corpus callosum express functional GABAA
receptors.
Muscimol and increased [K+]o potentiated basalMIP1-α release
MIP1-α release from corpus callosum brain slices intostandard brain slice buffer was quantified by ELISA.After 1.5 h, muscimol (100 μM) and KCl (additionof 5 mM) led to a small, but significant increase inMIP1-α production to 117 ± 5% (n = 15) and 115 ± 6%(n = 16) of control, respectively (Fig. 8A). The effectof muscimol and KCl was not observed in thepresence of BaCl2 (100 μM). Similarly, themuscimol-induced MIP1-α production was blockedby gabazine (10 μM). The KCl effect was not mimickedby equimolar NaCl indicating that increased osmolaritydid not play a role in the induced release. Addition of10 mM KCl resulted in an even higher increase in MIP1-αproduction after 1.5 h (130 ± 7% of control; n = 11). Therelative increase in MIP1-α release induced by additionof 10 mM KCl was similar after 3 h, namely 127 ± 9%(n = 13). Shorter stimulation on longer-termed MIP1-αproduction was also tested. Brain slices were treated with
C© 2009 The Authors. Journal compilation C© 2009 The Physiological Society

J Physiol 587.4 Invading microglia and GABAergic activities 763
muscimol or addition of 10 mM KCl for only 15 min.Total MIP1-α released after 1.5 h (n = 8) was not differentfrom control indicating that prolonged stimulation wasrequired (data not shown). It is feasible that a shortapplication would lead to significant release but thiscannot be measured in the supernatant.
To establish that the elevation in K+ stimulates theMIP1-α release by microglial cells, we tested the effectof an increase in K+ on microglial cultures. Cellsplated on 96-well plates were treated with muscimol(100 μM) or addition of K+ (5 and 10 mM) for 1.5, 3and 24 h. Culture medium was collected and MIP1-αlevels were determined by ELISA. Whereas muscimolhad no effect, KCl dose-dependently enhanced micro-glial release of MIP1-α. In particular, 5 mM KCl inducedan increase to 145 ± 10% of control after 24 h (4independent experiments; Fig. 8B). KCl (20 mM), evenenhanced MIP1-α release to 197 ± 19% of control atthis time point (data not shown). Basal release of othercytokines, namely IL-6, IL-12, KC and TNF-α was notaffected by either muscimol or KCl (data not shown). Toassess MIP1-α release from astrocytes, primary astrocyteculture was used. Cells plated on 96-well plates weredepleted of any residual microglia by treatment withclodronate liposomes for 24 h. We have demonstrated pre-
Figure 8. Effect of muscimol and [K+]oelevation on MIP1-α release in situ andin vitroPostnatal acute brain slices containingcorpus callosum (A), and cultured microgliaor astrocytes (B), were incubated withvarious substances for 1.5, 3 or 24 h. Theamount of MIP1-α released into thestandard brain slice buffer or culturemedium was quantified by ELISA andnormalized to corresponding controls at thesame time point. KCl, 5 or 10 mM, wasadded resulting in a total [K+]o of 10 or15 mM; Mus = muscimol (100 μM);Gbz = gabazine (10 μM); BaCl2 = 100 μM.NaCl (5 mM) was used as control for effectof osmotic changes. Results are expressed asmean ± S.E.M. values. ∗P < 0.05; ∗∗P < 0.01compared with corresponding controlsunless indicated otherwise.
viously that clodronate selectively depleted microglial cellswithout affecting astrocytes and neurons in organotypicslice cultures (Markovic et al. 2005). Here, we observedthat microglial depletion in astrocyte cultures significantlydecreased the constitutive MIP1-α release to 76 ± 2%(data not shown). After microglia depletion, muscimol(100 μM) and KCl (addition of 5 and 10 mM) incubationfor 1.5 and 3 h did not affect MIP1-α release into culturemedium (4 independent experiments; Fig. 8B). As theeffect of elevated K+ on MIP1-α was observed in microgliabut not astrocytes culture, we postulate that microglia arethe source of K+-induced MIP1-α release in situ.
As a control for cytotoxicity, we observed that 3 hincubation of microglial cultures with KCl (5 and 10 mM)and muscimol (100 μM) did not enhance LDH activity(3 independent experiments; data not shown).
Increased [K+]o did not affect microglial chemotaxisnor proliferation in vitro
The ability of cultured microglia to migrate towardsATP in the presence of different concentrations of K+
was assessed using a microchemotaxis chamber. Over thecourse of 2 h, 300 μM ATP alone significantly increasedmicroglial migration rate to 226 ± 27% as compared to
C© 2009 The Authors. Journal compilation C© 2009 The Physiological Society

764 G. Cheung and others J Physiol 587.4
control. However, no effect of increased [K+]o on basalnor ATP-stimulated microglial migration was observed (5independent experiments; data not shown). [K+]o waselevated from 5 mM to 7.5, 10, 15, or 25 mM by additionof 2.5, 5, 10, or 20 mM KCl, respectively.
To assess the effect of increased [K+]o on basaland lipopolysaccharide (LPS)-attenuated microglialproliferation, cultured microglia in 96-well plates weretreated with different concentrations of KCl with orwithout LPS (100 ng ml−1) for 24 and 48 h in thepresence of 10 μM BrdU. Proliferation was measured by theamount of BrdU incorporation relative to DMEM control.Whereas LPS significantly decreased control proliferationby 81 ± 7 and 54 ± 7% after 24 and 48 h, respectively,increase of [K+]o by 2.5, 5, 10, or 20 mM did not affectbasal or LPS-attenuated proliferation in microglia (6independent experiments; data not shown).
Discussion
Here, we demonstrate that invading microglial cells couldsense the activities of GABAA receptors in postnatal whitematter. They responded to a GABA-mediated increase in[K+]o by opening intrinsic Kir channels. As a result, anenhanced release of MIP1-α was observed.
Macroglia in the corpus callosum and neurons inadjacent brain regions express functional GABAA
receptors and are the presumed source for theGABA-mediated [K+]o increase
Prior to synapse formation, when neuronal precursorcells and immature neurons begin to express functionalGABAA receptors (Owens & Kriegstein, 2002), GABAis released from growth cones of developing axons(Gao & van den Pol, 2000). It occurs spontaneouslyand is enhanced by increased neuronal activity. Atthis stage of development, it acts as a trophic factorwhich modulates developmental processes like neuronalgrowth, migration, proliferation and differentiation andparticipates in the formation of synapse and constructionof brain network (Ben-Ari et al. 2007). Thus, it isconceivable that GABA is released in the postnatal corpuscallosum. Using a receptor-specific agonist muscimol,we observed that astrocytes, oligodendrocytes and glialprecursor cells in the corpus callosum of postnatalbrain slices as well as cortical neurons near this regionexpress functional GABAA receptors. These observationsare in line with our previous studies. A specific GABAA
receptor-mediated current response was detected incultured astrocytes (Bormann & Kettenmann, 1988) andoligodendrocytes (Von Blankenfeld et al. 1991). Bergeret al. (1992) characterized GABAA receptors in glialprecursors and pro-myelinating oligodendrocytes in
mouse corpus callosum brain slices during the first 2postnatal weeks. Astrocytic GABAA receptors were alsowell documented in the grey matter (Steinhauser et al.1994). In addition, complex glial cells in rat hippocampusresponded towards GABAA but not GABAB receptoragonists (Bekar et al. 1999). Apart from muscimol-inducedinward currents, we have also observed a sustained effecton K+ currents which was previously described in glialcells and neurons (Muller et al. 1994; Pastor et al. 1995;Labrakakis et al. 1997). The activation of these twotypes of responses induced by muscimol, activation ofa (presumably Cl−) conductance and blockade of restingK+ conductance resulted in a complex response with areversal potential at positive voltages. In complex cells,there was no K+ conductance at potentials negative to−70 mV and the extrapolated reversal potential was closeto 0 mV. Furthermore, the muscimol-induced responsewas strongly reduced when elicited a second time evenafter a long washout period and receptor desensitizationseemed likely. However, other possibilities such as receptorinternalization or other mechanisms which can lead to adisappearance of the response could not be ruled out.Functions of glial GABAA receptors have been proposedas a way to sense neuronal activities (von Blankenfeld &Kettenmann, 1991), regulate extracellular pH (Kaila et al.1991) and K+ homeostasis (Barres et al. 1990). Althougha recent study by Karadottir et al. (2008) identified andcharacterized NG2 cells with large Na+ currents andrepetitive action potentials in the white matter of thecerebellum, we have not observed such cells in the corpuscallosum.
GABA has a depolarizing action in the developingbrain due to high [Cl−]i (Ben-Ari et al. 2007). Anincrease in [K+]o upon GABAA receptor stimulation isoften observed as a result of membrane depolarizationin immature neurons and glia leading to an efflux of K+
and Cl− (Hoppe & Kettenmann, 1989). GABA-mediateddepolarization of glial precursor cells even activates Ca2+
channels (Kirchhoff & Kettenmann, 1992). Thus, it is likelythat elevation of [K+]o detected in postnatal brain slices isdue to K+ efflux from glial cells and/or immature neurons.
Muscimol-induced [K+]o elevation was age dependentin that it was significantly smaller in adult brainslices. As neurons mature, GABAA receptors becomeinhibitory resulting in membrane hyperpolarization. Thisexcitatory-to-inhibitory switch of GABA action in neuronsbegins during P5–8 (Leinekugel et al. 1995; Kuner &Augustine, 2000; Marandi et al. 2002).
Elevated [K+]o increases conductance of intrinsicmicroglial Kir channels
Our data indicate that microglial cells respond to GABA,not directly, but indirectly to a factor released in and from
C© 2009 The Authors. Journal compilation C© 2009 The Physiological Society

J Physiol 587.4 Invading microglia and GABAergic activities 765
the brain slice. This factor is K+ and microglia respond toan increase in [K+]o by an increase of their intrinsic K+
current conductance. Amoeboid microglia at the corpuscallosum of postnatal brain slices have similar membraneproperties to those observed in cultured microglia despitetheir different morphology. Both amoeboid microglia andcultured microglia express prominent inwardly but nooutwardly rectifying K+ channels as previously described(Kettenmann et al. 1990; Brockhaus et al. 1993). The Kir
currents displayed time-dependent inactivation and canbe blocked by extracellular Ba2+ at a range of 1–100 μM
(Franchini et al. 2004). Muscimol and an increase in[K+]o triggered an increase in membrane conductancewhich showed inward rectification and was sensitive to100 μM BaCl2, suggesting that it was mediated by intrinsicKir channels. Kir channel activity is strongly dependenton [K+]o. An increase in [K+]o from 4.5 to 50 mM
increased the conductance of the channel more thantwofold (Kettenmann et al. 1990). In the present study,moderate elevation in [K+]o by 2.5, 5 and 7.5 mM from abaseline of 5 mM dose-dependently increased the inwardK+ conductance in amoeboid and cultured microglia.These experimental elevations in [K+]o were clearly in therange of values obtained in brain slices because muscimolapplication mimicked the increase in [K+]o by 5 mM. Wethus conclude that muscimol does not directly activateGABAA receptors in microglial cells, but triggers a K+
release from other cells and the resulting elevation in[K+]o increases the conductance of the intrinsic inwardrectifying channels. The increase of the conductance isdue to the fact that permeability of inward rectifiers isstrongly enhanced by an increase in [K+]o. As shownby Sakmann and Trube, the single channel conductancedepends on the square root of [K+] (Sakmann & Trube,1984). This is a general property of inward rectifiers butwe have also shown this for microglial cells (Kettenmannet al. 1990). Moreover, at higher [K+]o the channel losesits rectifying properties which explains the appearanceof the outward current. Our experiments in acute sliceswere carried out at room temperature based on previousobservations that responses are usually larger at lowertemperatures (Kettenmann et al. 1987).
Basal MIP1-α release in situ and by cultured microgliais enhanced by elevated [K+]o implying a potentialrole in postnatal development
Among various cytokines tested in this study, onlyMIP1-α release was affected by elevated [K+]o. Althoughconstitutively expressed in low amounts, astrocytes andfetal microglia promptly synthesize and release MIP1proteins in vitro upon stimulation (McManus et al.1998; Miyamoto & Kim, 1999). MIP1-α binds toG-protein-coupled receptors CCR1 and CCR5 leading todownstream processes important for many inflammatory
conditions (Murdoch & Finn, 2000; Maurer & vonStebut, 2004). The majority of studies on microglialchemokine receptor expression and release focus on theirrole in neurodegenerative and inflammatory conditions(Hanisch, 2002). Due to low and undetectable levelsof constitutive release, the roles of chemokines underphysiological conditions are often neglected. Recent datasuggest potential functions of chemokines in modulatingnormal brain activities in addition to their classical rolesin inflammatory responses (Rostene et al. 2007).
There are a few recent studies which indicate a roleof MIP1-α in brain development. During cerebellardevelopment, physiologically activated microglia expressMIP1-α during a defined time window between P7 andP14 (Cowell & Silverstein, 2003), thus at a developmentalstage similar to that of our studies. Cowell andSilverstein also reported that MIP1-α-positive cells werefrequently located near the processes and cell bodies ofCCR1-immunoreactive cells during times of neuronal andglial maturation suggesting that MIP1-α plays a role inpostnatal cerebellar development.
Using in situ hybridization, Tran et al. (2004)demonstrated the expression of CCR1 and CCR5, thereceptors for MIP1-α, but also CCR2, CXCR3 and CXCR4chemokine receptors by neural precursor cells in thedentate gyrus, subventricular zone of the lateral ventricle,and olfactory bulb. The effects of MIP1-α on astrocyteshave also been described. MIP1-α and MCP-1 treatmentpromoted astrocyte migration in vitro possibly via novelastrocytic receptors (Heesen et al. 1996). Moreover,subnanomolar concentrations of MIP1-α could inducechemotactic responses in astrocytes in vitro (Tanabeet al. 1997). Oligodendrocytes are probably not affectedsince they lack the expression of MIP1-α receptors(Maysami et al. 2006). MIP1-α might even exert an auto-crine effect on microglia since it affects migration andcytoskeleton reorganization in vitro (Cross & Woodroofe,1999; Maciejewski-Lenoir et al. 1999). Microglial cellscan acquire different states and the classical activatedstate is the full pro-inflammatory phenotype (Hanisch &Kettenmann, 2007). However, in our experimental model,we do not claim that the microglial cells are activated.Instead, we think that during development, the amoeboidphenotype may have its own characteristic state bothdistinct from the surveying (formerly resting) micro-glia and the fully blown pro-inflammatory phenotype.Taken together, our results suggest that GABA-triggeredMIP1-α release has the potential to control some certainproperties of microglia, astrocytes and precursor cells inthe developing corpus callosum.
References
Aloisi F (2001). Immune function of microglia. Glia 36,165–179.
C© 2009 The Authors. Journal compilation C© 2009 The Physiological Society

766 G. Cheung and others J Physiol 587.4
Ambrosini E & Aloisi F (2004). Chemokines and glial cells: acomplex network in the central nervous system. NeurochemRes 29, 1017–1038.
Bajetto A, Bonavia R, Barbero S & Schettini G (2002).Characterization of chemokines and their receptors in thecentral nervous system: physiopathological implications. JNeurochem 82, 1311–1329.
Barres BA, Chun LL & Corey DP (1990). Ion channels invertebrate glia. Annu Rev Neurosci 13, 441–474.
Bekar LK, Jabs R & Walz W (1999). GABAA receptor agonistsmodulate K+ currents in adult hippocampal glial cells insitu. Glia 26, 129–138.
Ben-Ari Y, Gaiarsa JL, Tyzio R & Khazipov R (2007). GABA: apioneer transmitter that excites immature neurons andgenerates primitive oscillations. Physiol Rev 87,1215–1284.
Berger T, Schnitzer J & Kettenmann H (1991). Developmentalchanges in the membrane current pattern, K+ buffercapacity, and morphology of glial cells in the corpuscallosum slice. J Neurosci 11, 3008–3024.
Berger T, Walz W, Schnitzer J & Kettenmann H (1992). GABA-and glutamate-activated currents in glial cells of the mousecorpus callosum slice. J Neurosci Res 31, 21–27.
Bergles DE, Roberts JD, Somogyi P & Jahr CE (2000).Glutamatergic synapses on oligodendrocyte precursor cellsin the hippocampus. Nature 405, 187–191.
Bormann J & Kettenmann H (1988). Patch-clamp study ofγ-aminobutyric acid receptor Cl− channels in culturedastrocytes. Proc Natl Acad Sci U S A 85,9336–9340.
Boucsein C, Kettenmann H & Nolte C (2000).Electrophysiological properties of microglial cells in normaland pathologic rat brain slices. Eur J Neurosci 12, 2049–2058.
Brockhaus J, Ilschner S, Banati RB & Kettenmann H (1993).Membrane properties of ameboid microglial cells in thecorpus callosum slice from early postnatal mice. J Neurosci13, 4412–4421.
Brockhaus J, Moller T & Kettenmann H (1996). Phagocytozingameboid microglial cells studied in a mouse corpus callosumslice preparation. Glia 16, 81–90.
Cowell RM & Silverstein FS (2003). Developmental changes inthe expression of chemokine receptor CCR1 in the ratcerebellum. J Comp Neurol 457, 7–23.
Cross AK & Woodroofe MN (1999). Chemokines inducemigration and changes in actin polymerization in adult ratbrain microglia and a human fetal microglial cell line invitro. J Neurosci Res 55, 17–23.
Cuadros MA & Navascues J (2001). Early origin andcolonization of the developing central nervous system bymicroglial precursors. Prog Brain Res 132, 51–59.
del Rio-Hortega P (1932). In Cytology and Cellular Pathology ofthe Nervous System, ed. Penfield W, pp. 481–534. Hoeber,New York.
Farber K, Pannasch U, Kettenmann H (2005). Dopamine andnoradrenaline control distinct functions in rodent microglialcells. Mol Cell Neurosci 29, 128–138.
Ferrer I, Bernet E, Soriano E, del Rio T & Fonseca M (1990).Naturally occurring cell death in the cerebral cortex of therat and removal of dead cells by transitory phagocytes.Neuroscience 39, 451–458.
Franchini L, Levi G & Visentin S (2004). Inwardly rectifying K+channels influence Ca2+ entry due to nucleotidereceptor activation in microglia. Cell Calcium 35,449–459.
Gao XB & Van Den Pol AN (2000). GABA release from mouseaxonal growth cones. J Physiol 523, 629–637.
Haas S, Brockhaus J, Verkhratsky A & Kettenmann H (1996).ATP-induced membrane currents in ameboid microgliaacutely isolated from mouse brain slices. Neuroscience 75,257–261.
Hamill OP, Marty A, Neher E, Sakmann B & Sigworth FJ(1981). Improved patch-clamp techniques forhigh-resolution current recording from cells andcell-free membrane patches. Pflugers Arch 391,85–100.
Hanisch UK & Kettenmann H (2007). Microglia: active sensorand versatile effector cells in the normal and pathologicbrain. Nat Neurosci 10, 1387–1394.
Hanisch UK (2002). Microglia as a source and target ofcytokines. Glia 40, 140–155.
Heesen M, Tanabe S, Berman MA, Yoshizawa I, Luo Y, Kim RJ,Post TW, Gerard C & Dorf ME (1996). Mouse astrocytesrespond to the chemokines MCP-1 and KC, but reversetranscriptase-polymerase chain reaction does not detectmRNA for the KC or new MCP-1 receptor. J Neurosci Res 45,382–391.
Heinemann U & Arens J (1992). Production and calibration ofion-sensitive microelectrodes. In PracticalElectrophysiological Methods, ed. Kettenmann H & GrantynR, pp. 206–212. Wiley-Liss, New York.
Hirasawa T, Ohsawa K, Imai Y, Ondo Y, Akazawa C, Uchino S& Kohsaka S (2005). Visualization of microglia in livingtissues using Iba1-EGFP transgenic mice. J Neurosci Res 81,357–362.
Hoppe D & Kettenmann H (1989). GABA triggers a Cl− effluxfrom cultured mouse oligodendrocytes. Neurosci Lett 97,334–339.
Kaila K, Panula P, Karhunen T & Heinonen E (1991). Fall inintracellular pH mediated by GABAA receptors in culturedrat astrocytes. Neurosci Lett 126, 9–12.
Kann O, Kovacs R & Heinemann U (2003). Metabotropicreceptor-mediated Ca2+ signaling elevates mitochondrialCa2+ and stimulates oxidative metabolism in hippocampalslice cultures. J Neurophysiol 90, 613–621.
Karadottir R, Hamilton NB, Bakiri Y & Attwell D (2008).Spiking and nonspiking classes of oligodendrocyte precursorglia in CNS white matter. Nat Neurosci 11, 450–456. Erratumin: Nat Neurosci (2008) 11, 851.
Kettenmann H, Backus KH & Schachner M (1987).γ-Aminobutyric acid opens Cl− channels in culturedastrocytes. Brain Res 404, 1–9.
Kettenmann H, Hoppe D, Gottmann K, Banati R & KreutzbergG (1990). Cultured microglial cells have a distinct pattern ofmembrane channels different from peritoneal macrophages.J Neurosci Res 26, 278–287.
Kresse W, Sekler I, Hoffmann A, Peters O, Nolte C, Moran A &Kettenmann H (2005). Zinc ions are endogenousmodulators of neurotransmitter-stimulated capacitativeCa2+ entry in both cultured and in situ mouse astrocytes.Eur J Neurosci 21, 1626–1634.
C© 2009 The Authors. Journal compilation C© 2009 The Physiological Society

J Physiol 587.4 Invading microglia and GABAergic activities 767
Kirchhoff F & Kettenmann H (1992). GABA triggers a [Ca2+]i
increase in murine precursor cells of the oligodendrocytelineage. Eur J Neurosci 4, 1049–1058.
Kuhn SA, van Landeghem FK, Zacharias R, Farber K, RappertA, Pavlovic S, Hoffmann A, Nolte C & Kettenmann H(2004). Microglia express GABAB receptors tomodulate interleukin release. Mol Cell Neurosci 25,312–322.
Kuner T & Augustine GJ (2000). A genetically encodedratiometric indicator for chloride: capturing chloridetransients in cultured hippocampal neurons. Neuron 27,447–459.
Labrakakis C, Muller T, Schmidt K & Kettenmann H (1997).GABAA receptor activation triggers a Cl− conductanceincrease and a K+ channel blockade in cerebellar granulecells. Neuroscience 79, 177–189.
Leinekugel X, Tseeb V, Ben-Ari Y & Bregestovski P (1995).Synaptic GABAA activation induces Ca2+ rise in pyramidalcells and interneurons from rat neonatal hippocampal slices.J Physiol 487, 319–329.
Lin SC & Bergles DE (2002). Physiological characteristics ofNG2-expressing glial cells. J Neurocytol 31,537–549.
Lin SC, Huck JH, Roberts JD, Macklin WB, Somogyi P &Bergles DE (2005). Climbing fiber innervation ofNG2-expressing glia in the mammalian cerebellum. Neuron46, 773–785.
Maciejewski-Lenoir D, Chen S, Feng L, Maki R & Bacon KB(1999). Characterization of fractalkine in rat brain cells:migratory and activation signals for CX3CR-1-expressingmicroglia. J Immunol 163, 1628–1635.
McManus CM, Brosnan CF & Berman JW (1998). Cytokineinduction of MIP-1α and MIP-1β in human fetal microglia.J Immunol 160, 1449–1455.
Marandi N, Konnerth A & Garaschuk O (2002). Two-photonchloride imaging in neurons of brain slices. Pflugers Arch445, 357–365.
Markovic DS, Glass R, Synowitz M, Rooijen N & KettenmannH (2005). Microglia stimulate the invasiveness of gliomacells by increasing the activity of metalloprotease-2.J Neuropathol Exp Neurol 64, 754–762.
Maurer M & von Stebut E (2004). Macrophage inflammatoryprotein-1. Int J Biochem Cell Biol 36, 1882–1886.
Maysami S, Nguyen D, Zobel F, Heine S, Hopfner M & StangelM (2006). Oligodendrocyte precursor cells express afunctional chemokine receptor CCR3: implications formyelination. J Neuroimmunol 178, 17–23.
Miyamoto Y & Kim SU (1999). Cytokine-induced productionof macrophage inflammatory protein-1α (MIP-1α) incultured human astrocytes. J Neurosci Res 55,245–251.
Muller T, Fritschy JM, Grosche J, Pratt GD, Mohler H &Kettenmann H (1994). Developmental regulation ofvoltage-gated K+ channel and GABAA receptor expression inBergmann glial cells. J Neurosci 14, 2503–2514.
Muller T, Moller T, Berger T, Schnitzer J & Kettenmann H(1992). Calcium entry through kainate receptors andresulting potassium-channel blockade in Bergmann glialcells. Science 256, 1563–1566.
Murdoch C & Finn A (2000). Chemokine receptors and theirrole in inflammation and infectious diseases. Blood 95,3032–3043.
Nolte C, Matyash M, Pivneva T, Schipke CG, Ohlemeyer C,Hanisch UK, Kirchhoff F & Kettenmann H (2001). GFAPpromoter-controlled EGFP-expressing transgenic mice: atool to visualize astrocytes and astrogliosis in living braintissue. Glia 33, 72–86.
Nolte C, Moller T, Walter T & Kettenmann H (1996).Complement 5a controls motility of murine microglial cellsin vitro via activation of an inhibitory G-protein and therearrangement of the actin cytoskeleton. Neuroscience 73,1091–1107.
Owens DF & Kriegstein AR (2002). Is there more to GABAthan synaptic inhibition? Nat Rev Neurosci 3, 715–727.
Pastor A, Chvatal A, Sykova E & Kettenmann H (1995).Glycine- and GABA-activated currents in identified glial cellsof the developing rat spinal cord slice. Eur J Neurosci 7,1188–1198.
Perry VH, Hume DA & Gordon S (1985).Immunohistochemical localization of macrophages andmicroglia in the adult and developing mouse brain.Neuroscience 15, 313–326.
Pocock JM & Kettenmann H (2007). Neurotransmitterreceptors on microglia. Trends Neurosci 30, 527–535.
Prinz M, Kann O, Draheim HJ, Schumann RR, Kettenmann H,Weber JR & Hanisch UK (1999). Microglial activation bycomponents of gram-positive and -negative bacteria: distinctand common routes to the induction of ion channels andcytokines. J Neuropathol Exp Neurol 58, 1078–1089.
Rostene W, Kitabgi P & Parsadaniantz SM (2007). Chemokines:a new class of neuromodulator? Nat Rev Neurosci 8,895–903.
Sakmann B & Trube G (1984). Conductance properties ofsingle inwardly rectifying potassium channels in ventricularcells from guinea-pig heart. J Physiol 347, 641–657.
Schipke CG, Ohlemeyer C, Matyash M, Nolte C, KettenmannH & Kirchhoff F (2001). Astrocytes of the mouse neocortexexpress functional N-methyl-D-aspartate receptors. FASEB J15, 1270–1272.
Steinhauser C, Berger T, Frotscher M & Kettenmann H (1992).Heterogeneity in the membrane current pattern of identifiedglial cells in the hippocampal slice. Eur J Neurosci 4, 472–484.
Steinhauser C, Jabs R & Kettenmann H (1994). Properties ofGABA and glutamate responses in identified glial cells of themouse hippocampal slice. Hippocampus 4, 19–35.
Tanabe S, Heesen M, Berman MA, Fischer MB, Yoshizawa I,Luo Y & Dorf ME (1997). Murine astrocytes express afunctional chemokine receptor. J Neurosci 17, 6522–6528.
Tran PB, Ren D, Veldhouse TJ & Miller RJ (2004). Chemokinereceptors are expressed widely by embryonic and adultneural progenitor cells. J Neurosci Res 76, 20–34.
Van Rooijen N & Sanders A (1994). Liposome mediateddepletion of macrophages: mechanism of action, preparationof liposomes and applications. J Immunol Methods 174,83–93.
von Blankenfeld G & Kettenmann H (1991). Glutamate andGABA receptors in vertebrate glial cells. Mol Neurobiol 5,31–43.
C© 2009 The Authors. Journal compilation C© 2009 The Physiological Society

768 G. Cheung and others J Physiol 587.4
Von Blankenfeld G, Trotter J & Kettenmann H (1991).Expression and developmental regulation of a GABAA
receptor in cultured murine cells of the oligodendrocytelineage. Eur J Neurosci 3, 310–316.
Ziskin JL, Nishiyama A, Rubio M, Fukaya M & Bergles DE(2007). Vesicular release of glutamate from unmyelinatedaxons in white matter. Nat Neurosci 10,321–330.
Acknowledgements
We thank Irene Haupt for excellent technical assistance. Thisresearch was supported by Deutsche Forschungsgemeinschaftand BMBF.
Supplemental material
Online supplemental material for this paper can be accessed at:http://jp.physoc.org/cgi/content/full/jphysiol.2008.163923/DC1
C© 2009 The Authors. Journal compilation C© 2009 The Physiological Society


![In vivo neurochemical profiling of rat brain by 1 H-[ 13 C] NMR spectroscopy: cerebral energetics and glutamatergic/GABAergic neurotransmission](https://img.dokumen.tips/doc/110x75/6349259b09e11fdd740b2349/in-vivo-neurochemical-profiling-of-rat-brain-by-1-h-13-c-nmr-spectroscopy-cerebral.jpg)


