Embed Size (px)
Citation preview
1 23
Acta Theriologica ISSN 0001-7051 Acta TheriolDOI 10.1007/s13364-011-0038-9
Density of tiger and leopard in a tropicaldeciduous forest of Mudumalai TigerReserve, southern India, as estimatedusing photographic capture–recapturesamplingRiddhika Kalle, Tharmalingam Ramesh,Qamar Qureshi & KalyanasundaramSankar
1 23
Your article is protected by copyright and
all rights are held exclusively by Mammal
Research Institute, Polish Academy of
Sciences, Bia#owie#a, Poland. This e-offprint
is for personal use only and shall not be self-
archived in electronic repositories. If you
wish to self-archive your work, please use the
accepted author’s version for posting to your
own website or your institution’s repository.
You may further deposit the accepted author’s
version on a funder’s repository at a funder’s
request, provided it is not made publicly
available until 12 months after publication.
ORIGINAL PAPER
Density of tiger and leopard in a tropical deciduous forestof Mudumalai Tiger Reserve, southern India, as estimatedusing photographic capture–recapture sampling
Riddhika Kalle & Tharmalingam Ramesh &
Qamar Qureshi & Kalyanasundaram Sankar
Received: 14 June 2010 /Accepted: 23 March 2011# Mammal Research Institute, Polish Academy of Sciences, Białowieża, Poland 2011
Abstract Density of tiger Panthera tigris and leopardPanthera pardus was estimated using photographic capture–recapture sampling in a tropical deciduous forest of Mudu-malai Tiger Reserve, southern India, from November 2008 toFebruary 2009. A total of 2,000 camera trap nights for100 days yielded 19 tigers and 29 leopards within anintensive sampling area of 107 km2. Population size of tigerfrom closed population estimator model Mb Zippin was 19tigers (SE=±0.9) and for leopards Mh Jackknife estimated 53(SE=±11) individuals. Spatially explicit maximum likelihoodand Bayesian model estimates were 8.31 (SE=±2.73) and 8.9(SE=±2.56) per 100 km2 for tigers and 13.17 (SE=±3.15)and 13.01 (SE=±2.31) per 100 km2 for leopards, respectively.Tiger density for MMDM models ranged from 6.07(SE=±1.74) to 9.72 (SE=±2.94) per 100 km2 and leoparddensity ranged from 13.41 (SE=±2.67) to 28.91 (SE=±7.22)per 100 km2. Spatially explicit models were more appropriateas they handle information at capture locations in a morespecific manner than some generalizations assumed in theclassical approach. Results revealed high density of tiger andleopard in Mudumalai which is unusual for other high density
tiger areas. The tiger population in Mudumalai is a part of thelargest population at present in India and a source for thesurrounding Reserved Forest.
Keywords Large felids . Camera traps . Spatially explicitcapture–recapture models . Mudumalai Tiger Reserve
Introduction
Large carnivore population estimates have always beeninfluential in the allocation of resources for conservationefforts and for evaluating the success of conservationprograms (Nowell and Jackson 1996; Karanth and Nichols2000). Often, abundance has been a state variable ofinterest to wildlife managers assessing the impacts ofmanagement actions and it is commonly the central variablein long-term monitoring programs. Reliable estimates ofstatus and population trends are critical for the conservationof large terrestrial carnivores as they play an important rolein providing benchmark data for future managementdecisions. Over the years, camera trapping in a capture–recapture framework has proven to be a credible andpractical technique for quantitative estimation of carnivorepopulations in varied habitats. In India, this method hasalso been used for estimating tiger densities in a number ofprotected areas (Sharma et al. 2010; Jhala et al. 2008;Karanth 1995; Karanth and Nichols 1998, 2000, 2002;Karanth et al. 2004, 2006). The use of camera traps toestimate tiger density was first proposed by Karanth (1995)and received further development by Karanth and Nichols(1998, 2000, 2002). Since then, it has been widely used onseveral individually identifiable carnivore species (O'Brienet al. 2003; Trolle and Kéry 2003; Karanth et al. 2004,2006; Silver et al. 2004; Wegge et al. 2004; Soisalo and
Communicated by: Krzysztof Schmidt
R. Kalle (*) : T. Ramesh :Q. Qureshi :K. SankarWildlife Institute of India,P.O. Box 18, Chandrabani,Dehra Dun 248 001 Uttarakhand, Indiae-mail: [email protected]
T. Rameshe-mail: [email protected]
Q. Qureshie-mail: [email protected]
K. Sankare-mail: [email protected]
Acta TheriolDOI 10.1007/s13364-011-0038-9
Author's personal copy
Cavalcanti 2006). Leopard densities achieved from photo-graphic capture–recapture sampling method have beenreported in only few parts of the country (Harihar et al.2009; Edgaonkar et al. 2007; Sankar et al. 2008; Mondal2006; Chauhan et al. 2005a).
Mudumalai Tiger Reserve (TR) is a typical tropicalforest that was established to conserve an integral assem-blage of large mammals with diverse habitats. MudumalaiTR, which is a part of the Western Ghats Complex, haslarge and contiguous forest tracts with the adjoining forestareas thereby forming a crucial linkage for geneticexchange between the Western Ghat animal populationsand supporting one of the largest breeding populations(source populations) of tiger and leopard in India (Jhala etal. 2008). This forest possesses a high prey density(Ramesh et al. 2009) thereby having the potential to sustainhigh density source populations of tiger and leopardprovided they are devoid of anthropogenic disturbance.Food habits of tiger and leopard in Mudumalai revealedtheir coexistence by feeding on a broad choice of preyspecies (Ramesh et al. 2009).
Our objective in this study was to determine theabundance of tiger and leopard in Mudumalai using cameratraps and apply our findings as a basis for a long-termpopulation monitoring program.
Study area
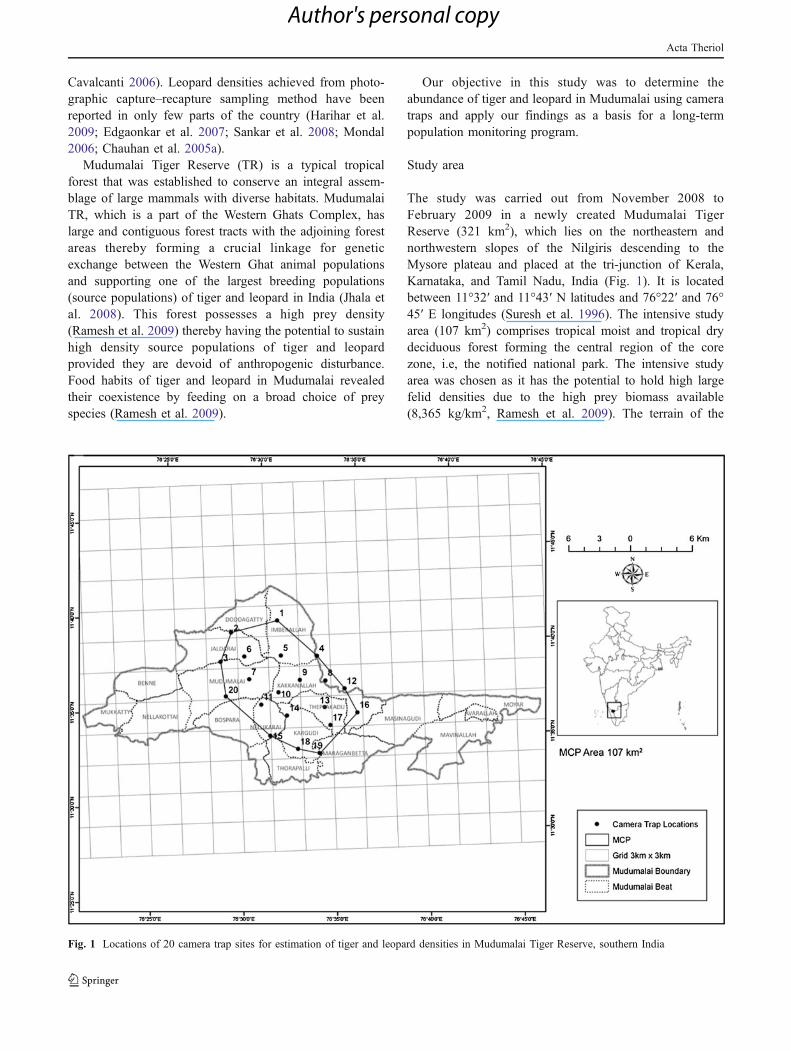
The study was carried out from November 2008 toFebruary 2009 in a newly created Mudumalai TigerReserve (321 km2), which lies on the northeastern andnorthwestern slopes of the Nilgiris descending to theMysore plateau and placed at the tri-junction of Kerala,Karnataka, and Tamil Nadu, India (Fig. 1). It is locatedbetween 11°32′ and 11°43′ N latitudes and 76°22′ and 76°45′ E longitudes (Suresh et al. 1996). The intensive studyarea (107 km2) comprises tropical moist and tropical drydeciduous forest forming the central region of the corezone, i.e, the notified national park. The intensive studyarea was chosen as it has the potential to hold high largefelid densities due to the high prey biomass available(8,365 kg/km2, Ramesh et al. 2009). The terrain of the
Fig. 1 Locations of 20 camera trap sites for estimation of tiger and leopard densities in Mudumalai Tiger Reserve, southern India
Acta Theriol
Author's personal copy
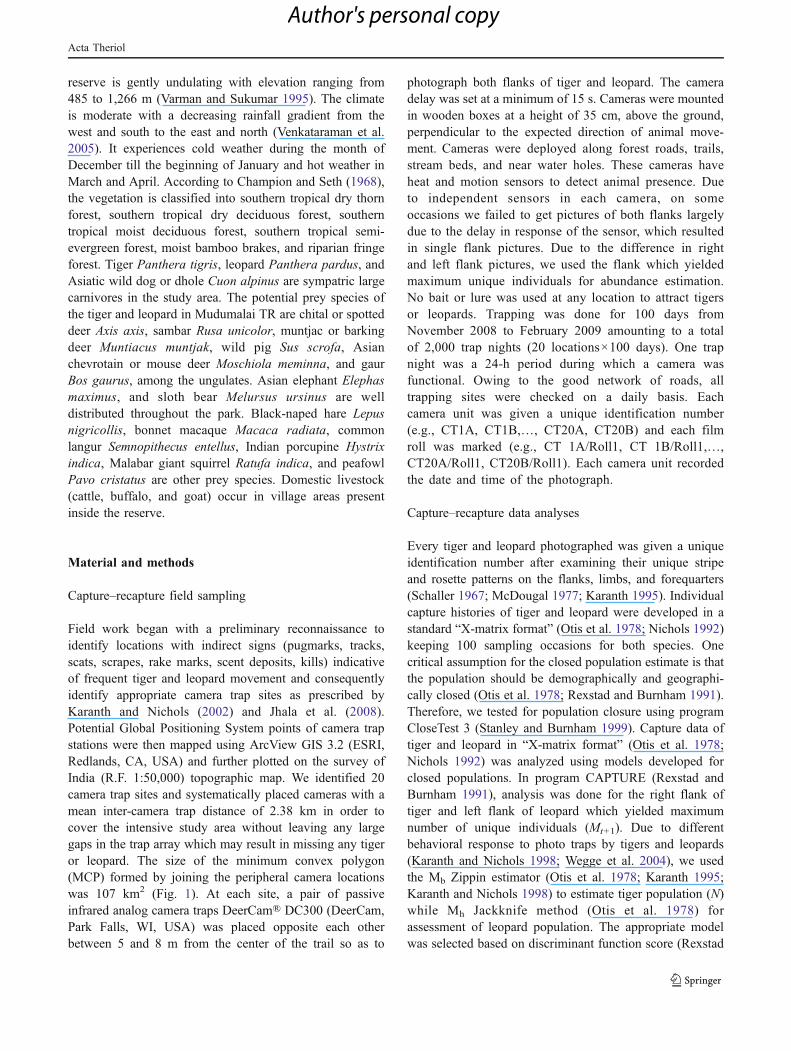
reserve is gently undulating with elevation ranging from485 to 1,266 m (Varman and Sukumar 1995). The climateis moderate with a decreasing rainfall gradient from thewest and south to the east and north (Venkataraman et al.2005). It experiences cold weather during the month ofDecember till the beginning of January and hot weather inMarch and April. According to Champion and Seth (1968),the vegetation is classified into southern tropical dry thornforest, southern tropical dry deciduous forest, southerntropical moist deciduous forest, southern tropical semi-evergreen forest, moist bamboo brakes, and riparian fringeforest. Tiger Panthera tigris, leopard Panthera pardus, andAsiatic wild dog or dhole Cuon alpinus are sympatric largecarnivores in the study area. The potential prey species ofthe tiger and leopard in Mudumalai TR are chital or spotteddeer Axis axis, sambar Rusa unicolor, muntjac or barkingdeer Muntiacus muntjak, wild pig Sus scrofa, Asianchevrotain or mouse deer Moschiola meminna, and gaurBos gaurus, among the ungulates. Asian elephant Elephasmaximus, and sloth bear Melursus ursinus are welldistributed throughout the park. Black-naped hare Lepusnigricollis, bonnet macaque Macaca radiata, commonlangur Semnopithecus entellus, Indian porcupine Hystrixindica, Malabar giant squirrel Ratufa indica, and peafowlPavo cristatus are other prey species. Domestic livestock(cattle, buffalo, and goat) occur in village areas presentinside the reserve.
Material and methods
Capture–recapture field sampling
Field work began with a preliminary reconnaissance toidentify locations with indirect signs (pugmarks, tracks,scats, scrapes, rake marks, scent deposits, kills) indicativeof frequent tiger and leopard movement and consequentlyidentify appropriate camera trap sites as prescribed byKaranth and Nichols (2002) and Jhala et al. (2008).Potential Global Positioning System points of camera trapstations were then mapped using ArcView GIS 3.2 (ESRI,Redlands, CA, USA) and further plotted on the survey ofIndia (R.F. 1:50,000) topographic map. We identified 20camera trap sites and systematically placed cameras with amean inter-camera trap distance of 2.38 km in order tocover the intensive study area without leaving any largegaps in the trap array which may result in missing any tigeror leopard. The size of the minimum convex polygon(MCP) formed by joining the peripheral camera locationswas 107 km2 (Fig. 1). At each site, a pair of passiveinfrared analog camera traps DeerCam® DC300 (DeerCam,Park Falls, WI, USA) was placed opposite each otherbetween 5 and 8 m from the center of the trail so as to
photograph both flanks of tiger and leopard. The cameradelay was set at a minimum of 15 s. Cameras were mountedin wooden boxes at a height of 35 cm, above the ground,perpendicular to the expected direction of animal move-ment. Cameras were deployed along forest roads, trails,stream beds, and near water holes. These cameras haveheat and motion sensors to detect animal presence. Dueto independent sensors in each camera, on someoccasions we failed to get pictures of both flanks largelydue to the delay in response of the sensor, which resultedin single flank pictures. Due to the difference in rightand left flank pictures, we used the flank which yieldedmaximum unique individuals for abundance estimation.No bait or lure was used at any location to attract tigersor leopards. Trapping was done for 100 days fromNovember 2008 to February 2009 amounting to a totalof 2,000 trap nights (20 locations×100 days). One trapnight was a 24-h period during which a camera wasfunctional. Owing to the good network of roads, alltrapping sites were checked on a daily basis. Eachcamera unit was given a unique identification number(e.g., CT1A, CT1B,…, CT20A, CT20B) and each filmroll was marked (e.g., CT 1A/Roll1, CT 1B/Roll1,…,CT20A/Roll1, CT20B/Roll1). Each camera unit recordedthe date and time of the photograph.
Capture–recapture data analyses
Every tiger and leopard photographed was given a uniqueidentification number after examining their unique stripeand rosette patterns on the flanks, limbs, and forequarters(Schaller 1967; McDougal 1977; Karanth 1995). Individualcapture histories of tiger and leopard were developed in astandard “X-matrix format” (Otis et al. 1978; Nichols 1992)keeping 100 sampling occasions for both species. Onecritical assumption for the closed population estimate is thatthe population should be demographically and geographi-cally closed (Otis et al. 1978; Rexstad and Burnham 1991).Therefore, we tested for population closure using programCloseTest 3 (Stanley and Burnham 1999). Capture data oftiger and leopard in “X-matrix format” (Otis et al. 1978;Nichols 1992) was analyzed using models developed forclosed populations. In program CAPTURE (Rexstad andBurnham 1991), analysis was done for the right flank oftiger and left flank of leopard which yielded maximumnumber of unique individuals (Mt+1). Due to differentbehavioral response to photo traps by tigers and leopards(Karanth and Nichols 1998; Wegge et al. 2004), we usedthe Mb Zippin estimator (Otis et al. 1978; Karanth 1995;Karanth and Nichols 1998) to estimate tiger population (N)while Mh Jackknife method (Otis et al. 1978) forassessment of leopard population. The appropriate modelwas selected based on discriminant function score (Rexstad
Acta Theriol
Author's personal copy
and Burnham 1991). The density was estimated usinglikelihood-based spatially explicit capture–recapture(SECR) model in program DENSITY 4.4 (Efford 2009)and Bayesian-based SECR model using R-WinBugs code(Royle et al. 2009) and SPACECAP 1 (Singh et al. 2010).The likelihood-based SECR model has two components:state mode which describes the distribution of animal'shome range centers in the landscape and observationmodel which describes capture probability as a function ofthe distance from the home range center to the trap(Pledger and Efford 1998; Efford 2009; Efford et al.2004). In this analysis, Poisson distribution was assumed,buffer of 6 km was used, and proximity trap option waschosen which allowed for multiple captures on the sameoccasion. Half normal function was fitted to the distancebetween the home range center and trap. Program SPACE-CAP 1 was used to achieve spatial Bayesian estimate(Royle et al. 2009) with Bernoulli distribution and trapresponse absent for leopard and present for tiger asbehavioral response was observed for tiger. SpatialBayesian method incorporates data augmentation to dealwith unobserved capture histories where data was aug-mented with more than double the estimated populationand uniform priors were used (Royle and Dorazio 2008).We generated systematic home range centers in an areacontained within 6 km buffer (larger than mean maximumdistance moved, MMDM; Karanth and Nichols 1998)around camera traps. The large buffer around the sampledarea was used to ensure inclusion of all individual homeranges within a reach of cameras (Royle and Dorazio2008). In SECR models buffer width of 3–6 km varied tillestimates stabilized, buffer and augmentation values werechanged till these two parameters did not seem to causechanges in density estimates. The effective trapping areafor traditional models was calculated by full MMDM andhalf mean maximum distance moved (MMDM/2) asdescribed by Karanth and Nichols (1998, 2002).
Results
Capture success
The total sampling effort of 2,000 trap nights for 100 daysyielded 69 tiger photographs (44 right flanked and 25 leftflanked) and 119 leopard photographs (56 right flanked and63 left flanked). Nineteen individual tigers were identifiedfrom right flank photos and 16 individual tigers from left flankphotos. Twenty-three individual leopards were identified fromright flank photos and 29 individual leopards from left flankphotos (Table 1).
Statistical tests for population closure in programCloseTest 3 (Stanley and Burnham 1999) supported thepopulation closure assumption both for tiger (χ2=29.99, P=1.0) and leopard (χ2=43.03, P=1.0).
Estimates of population sizes and densities
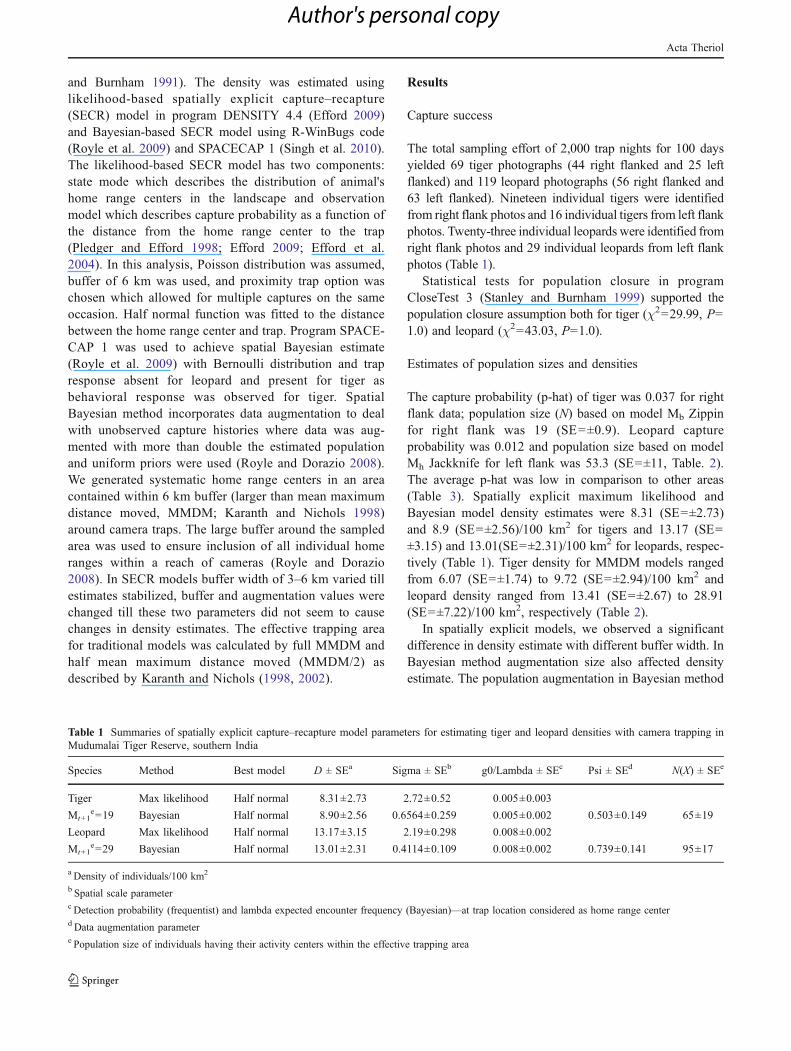
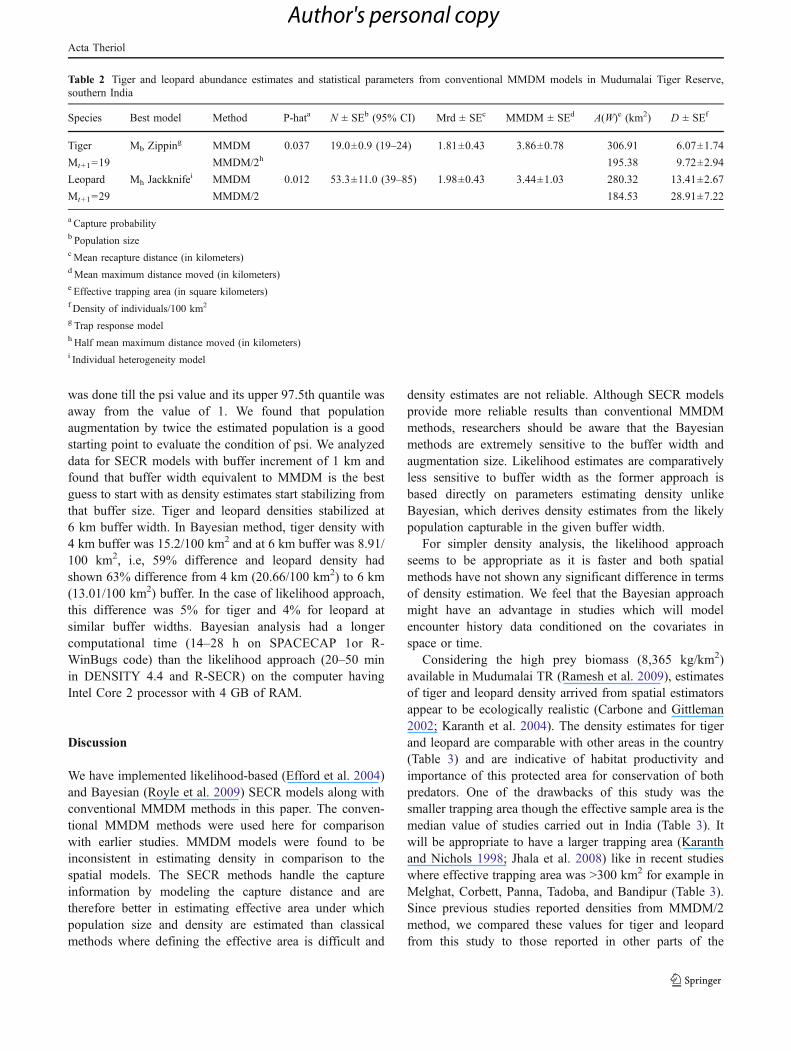
The capture probability (p-hat) of tiger was 0.037 for rightflank data; population size (N) based on model Mb Zippinfor right flank was 19 (SE=±0.9). Leopard captureprobability was 0.012 and population size based on modelMh Jackknife for left flank was 53.3 (SE=±11, Table. 2).The average p-hat was low in comparison to other areas(Table 3). Spatially explicit maximum likelihood andBayesian model density estimates were 8.31 (SE=±2.73)and 8.9 (SE=±2.56)/100 km2 for tigers and 13.17 (SE=±3.15) and 13.01(SE=±2.31)/100 km2 for leopards, respec-tively (Table 1). Tiger density for MMDM models rangedfrom 6.07 (SE=±1.74) to 9.72 (SE=±2.94)/100 km2 andleopard density ranged from 13.41 (SE=±2.67) to 28.91(SE=±7.22)/100 km2, respectively (Table 2).
In spatially explicit models, we observed a significantdifference in density estimate with different buffer width. InBayesian method augmentation size also affected densityestimate. The population augmentation in Bayesian method
Table 1 Summaries of spatially explicit capture–recapture model parameters for estimating tiger and leopard densities with camera trapping inMudumalai Tiger Reserve, southern India
Species Method Best model D ± SEa Sigma ± SEb g0/Lambda ± SEc Psi ± SEd N(X) ± SEe
Tiger Max likelihood Half normal 8.31±2.73 2.72±0.52 0.005±0.003
Mt+1e=19 Bayesian Half normal 8.90±2.56 0.6564±0.259 0.005±0.002 0.503±0.149 65±19
Leopard Max likelihood Half normal 13.17±3.15 2.19±0.298 0.008±0.002
Mt+1e=29 Bayesian Half normal 13.01±2.31 0.4114±0.109 0.008±0.002 0.739±0.141 95±17
a Density of individuals/100 km2
b Spatial scale parameterc Detection probability (frequentist) and lambda expected encounter frequency (Bayesian)—at trap location considered as home range centerd Data augmentation parametere Population size of individuals having their activity centers within the effective trapping area
Acta Theriol
Author's personal copy
was done till the psi value and its upper 97.5th quantile wasaway from the value of 1. We found that populationaugmentation by twice the estimated population is a goodstarting point to evaluate the condition of psi. We analyzeddata for SECR models with buffer increment of 1 km andfound that buffer width equivalent to MMDM is the bestguess to start with as density estimates start stabilizing fromthat buffer size. Tiger and leopard densities stabilized at6 km buffer width. In Bayesian method, tiger density with4 km buffer was 15.2/100 km2 and at 6 km buffer was 8.91/100 km2, i.e, 59% difference and leopard density hadshown 63% difference from 4 km (20.66/100 km2) to 6 km(13.01/100 km2) buffer. In the case of likelihood approach,this difference was 5% for tiger and 4% for leopard atsimilar buffer widths. Bayesian analysis had a longercomputational time (14–28 h on SPACECAP 1or R-WinBugs code) than the likelihood approach (20–50 minin DENSITY 4.4 and R-SECR) on the computer havingIntel Core 2 processor with 4 GB of RAM.
Discussion
We have implemented likelihood-based (Efford et al. 2004)and Bayesian (Royle et al. 2009) SECR models along withconventional MMDM methods in this paper. The conven-tional MMDM methods were used here for comparisonwith earlier studies. MMDM models were found to beinconsistent in estimating density in comparison to thespatial models. The SECR methods handle the captureinformation by modeling the capture distance and aretherefore better in estimating effective area under whichpopulation size and density are estimated than classicalmethods where defining the effective area is difficult and
density estimates are not reliable. Although SECR modelsprovide more reliable results than conventional MMDMmethods, researchers should be aware that the Bayesianmethods are extremely sensitive to the buffer width andaugmentation size. Likelihood estimates are comparativelyless sensitive to buffer width as the former approach isbased directly on parameters estimating density unlikeBayesian, which derives density estimates from the likelypopulation capturable in the given buffer width.
For simpler density analysis, the likelihood approachseems to be appropriate as it is faster and both spatialmethods have not shown any significant difference in termsof density estimation. We feel that the Bayesian approachmight have an advantage in studies which will modelencounter history data conditioned on the covariates inspace or time.
Considering the high prey biomass (8,365 kg/km2)available in Mudumalai TR (Ramesh et al. 2009), estimatesof tiger and leopard density arrived from spatial estimatorsappear to be ecologically realistic (Carbone and Gittleman2002; Karanth et al. 2004). The density estimates for tigerand leopard are comparable with other areas in the country(Table 3) and are indicative of habitat productivity andimportance of this protected area for conservation of bothpredators. One of the drawbacks of this study was thesmaller trapping area though the effective sample area is themedian value of studies carried out in India (Table 3). Itwill be appropriate to have a larger trapping area (Karanthand Nichols 1998; Jhala et al. 2008) like in recent studieswhere effective trapping area was >300 km2 for example inMelghat, Corbett, Panna, Tadoba, and Bandipur (Table 3).Since previous studies reported densities from MMDM/2method, we compared these values for tiger and leopardfrom this study to those reported in other parts of the
Table 2 Tiger and leopard abundance estimates and statistical parameters from conventional MMDM models in Mudumalai Tiger Reserve,southern India
Species Best model Method P-hata N ± SEb (95% CI) Mrd ± SEc MMDM ± SEd A(W)e (km2) D ± SEf
Tiger Mb Zipping MMDM 0.037 19.0±0.9 (19–24) 1.81±0.43 3.86±0.78 306.91 6.07±1.74
Mt+1=19 MMDM/2h 195.38 9.72±2.94
Leopard Mh Jackknifei MMDM 0.012 53.3±11.0 (39–85) 1.98±0.43 3.44±1.03 280.32 13.41±2.67
Mt+1=29 MMDM/2 184.53 28.91±7.22
a Capture probabilityb Population sizecMean recapture distance (in kilometers)dMean maximum distance moved (in kilometers)e Effective trapping area (in square kilometers)f Density of individuals/100 km2
g Trap response modelh Half mean maximum distance moved (in kilometers)i Individual heterogeneity model
Acta Theriol
Author's personal copy
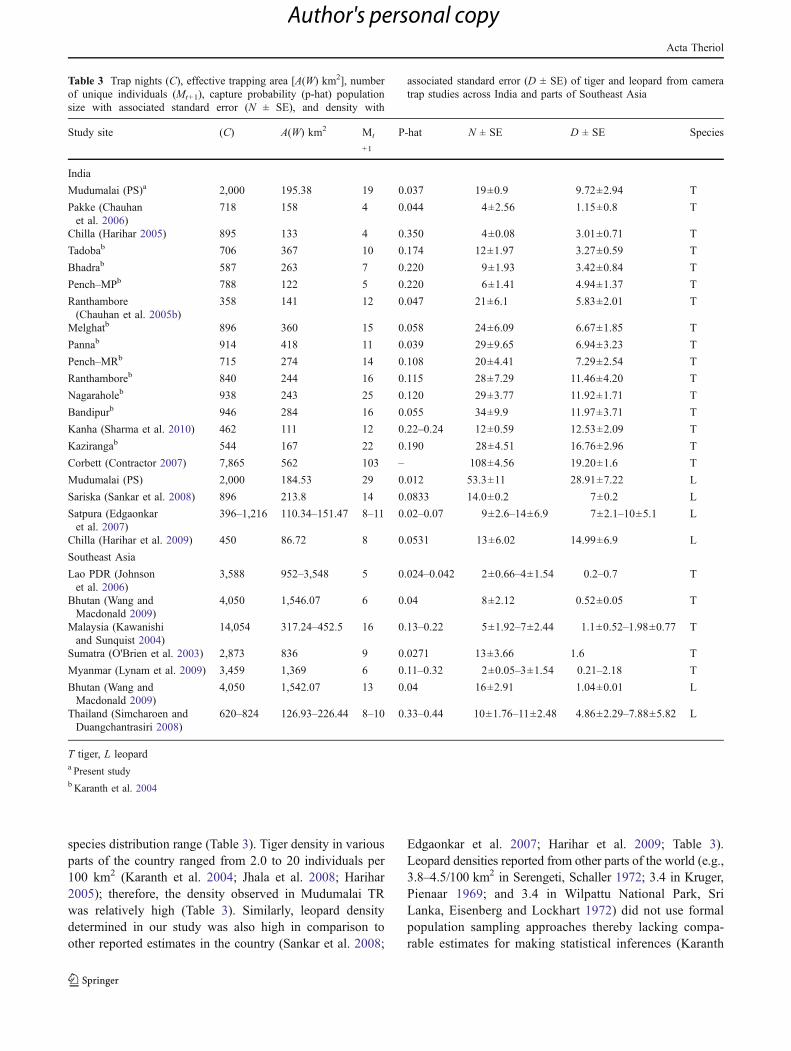
species distribution range (Table 3). Tiger density in variousparts of the country ranged from 2.0 to 20 individuals per100 km2 (Karanth et al. 2004; Jhala et al. 2008; Harihar2005); therefore, the density observed in Mudumalai TRwas relatively high (Table 3). Similarly, leopard densitydetermined in our study was also high in comparison toother reported estimates in the country (Sankar et al. 2008;
Edgaonkar et al. 2007; Harihar et al. 2009; Table 3).Leopard densities reported from other parts of the world (e.g.,3.8–4.5/100 km2 in Serengeti, Schaller 1972; 3.4 in Kruger,Pienaar 1969; and 3.4 in Wilpattu National Park, SriLanka, Eisenberg and Lockhart 1972) did not use formalpopulation sampling approaches thereby lacking compa-rable estimates for making statistical inferences (Karanth
Table 3 Trap nights (C), effective trapping area [A(W) km2], numberof unique individuals (Mt+1), capture probability (p-hat) populationsize with associated standard error (N ± SE), and density with
associated standard error (D ± SE) of tiger and leopard from cameratrap studies across India and parts of Southeast Asia
Study site (C) A(W) km2 Mt
+1
P-hat N ± SE D ± SE Species
India
Mudumalai (PS)a 2,000 195.38 19 0.037 19±0.9 9.72±2.94 T
Pakke (Chauhanet al. 2006)
718 158 4 0.044 4±2.56 1.15±0.8 T
Chilla (Harihar 2005) 895 133 4 0.350 4±0.08 3.01±0.71 T
Tadobab 706 367 10 0.174 12±1.97 3.27±0.59 T
Bhadrab 587 263 7 0.220 9±1.93 3.42±0.84 T
Pench–MPb 788 122 5 0.220 6±1.41 4.94±1.37 T
Ranthambore(Chauhan et al. 2005b)
358 141 12 0.047 21±6.1 5.83±2.01 T
Melghatb 896 360 15 0.058 24±6.09 6.67±1.85 T
Pannab 914 418 11 0.039 29±9.65 6.94±3.23 T
Pench–MRb 715 274 14 0.108 20±4.41 7.29±2.54 T
Ranthamboreb 840 244 16 0.115 28±7.29 11.46±4.20 T
Nagaraholeb 938 243 25 0.120 29±3.77 11.92±1.71 T
Bandipurb 946 284 16 0.055 34±9.9 11.97±3.71 T
Kanha (Sharma et al. 2010) 462 111 12 0.22–0.24 12±0.59 12.53±2.09 T
Kazirangab 544 167 22 0.190 28±4.51 16.76±2.96 T
Corbett (Contractor 2007) 7,865 562 103 – 108±4.56 19.20±1.6 T
Mudumalai (PS) 2,000 184.53 29 0.012 53.3±11 28.91±7.22 L
Sariska (Sankar et al. 2008) 896 213.8 14 0.0833 14.0±0.2 7±0.2 L
Satpura (Edgaonkaret al. 2007)
396–1,216 110.34–151.47 8–11 0.02–0.07 9±2.6–14±6.9 7±2.1–10±5.1 L
Chilla (Harihar et al. 2009) 450 86.72 8 0.0531 13±6.02 14.99±6.9 L
Southeast Asia
Lao PDR (Johnsonet al. 2006)
3,588 952–3,548 5 0.024–0.042 2±0.66–4±1.54 0.2–0.7 T
Bhutan (Wang andMacdonald 2009)
4,050 1,546.07 6 0.04 8±2.12 0.52±0.05 T
Malaysia (Kawanishiand Sunquist 2004)
14,054 317.24–452.5 16 0.13–0.22 5±1.92–7±2.44 1.1±0.52–1.98±0.77 T
Sumatra (O'Brien et al. 2003) 2,873 836 9 0.0271 13±3.66 1.6 T
Myanmar (Lynam et al. 2009) 3,459 1,369 6 0.11–0.32 2±0.05–3±1.54 0.21–2.18 T
Bhutan (Wang andMacdonald 2009)
4,050 1,542.07 13 0.04 16±2.91 1.04±0.01 L
Thailand (Simcharoen andDuangchantrasiri 2008)
620–824 126.93–226.44 8–10 0.33–0.44 10±1.76–11±2.48 4.86±2.29–7.88±5.82 L
T tiger, L leoparda Present studyb Karanth et al. 2004
Acta Theriol
Author's personal copy
and Nichols 1998). Leopard density is fairly high in spiteof good tiger density and this trend (Qureshi, unpublisheddata) seems to be due to high prey biomass of cervids(Ramesh et al. 2009) and heterogeneous landscape, whichprovide opportunity for coexistence of these two largepredators at higher densities.
Mudumalai TR is a part of Bandipur–Nagarahole–Mudumalai–Wynad landscape unit with an estimated tigerpopulation of 267 (207–327) individuals occupying9,087 km2 (Jhala et al. 2008) and harbors probably thelargest continuous tiger population in the world. The stateof Tamil Nadu also has a large leopard populationdistributed within 14,484 km2 (Jhala et al. 2008). Mudu-malai TR being the most important conservation unitlinking western and eastern parts of Western Ghats requireshabitat protection along with regular monitoring of largecarnivores and their prey population with the incorporationof robust scientific methods. This study has providedimportant baseline information for long-term monitoringof tiger and leopard in Mudumalai TR which is one of thefew areas where both predators occur in good densities.Future studies should aim at understanding the factorsgoverning high density of both felids.
Acknowledgments We thank the Tamil Nadu Forest Department forgranting permission to conduct this study in Mudumalai TigerReserve. This research was undertaken as part of “Sympatric carnivorestudies,” funded by Wildlife Institute of India. We sincerely thank thedirector and dean, Wildlife Institute of India, for their support andencouragement in carrying out this study. We are grateful to our fieldassistants Madan, James, and Ketan for all their hard work and whole-hearted cooperation in the field. We thank the two anonymousreviewers and editors for their critical review and suggestions whichsignificantly improved this manuscript.
References
Carbone C, Gittleman JL (2002) A common rule for the scaling ofcarnivore density. Science 295:2273–2276. doi:10.1126/science.1067994
Champion HG, Seth SK (1968) A revised survey of the forest types ofIndia. Government of India Publication, New Delhi
Chauhan DS, Harihar A, Goyal SP, Qureshi Q, Lal P, Mathur VB(2005a) Estimating leopard population using camera traps inSariska Tiger Reserve. Wildlife Institute of India, Dehra Dun
Chauhan DS, Harihar A, Goyal SP, Qureshi Q, Lal PR, Mathur VB(2005b) Estimating tiger population using camera traps inRanthambore National Park. Wildlife Institute of India, DehraDun
Chauhan DS, Singh R, Mishra S, Dadda T, Goyal SP (2006)Estimation of tiger population in an intensive study area ofPakke Tiger Reserve, Arunachal Pradesh. Wildlife Institute ofIndia, Dehra Dun
Contractor D (2007) Evaluating the effect of design and samplingintensity on estimating tiger population and density. MScDissertation, Saurashtra University
Edgaonkar A, Chellam R, Qureshi Q (2007) Ecology of the leopard(Panthera pardus fusca) in Satpura National Park and BoriWildlife Sanctuary. Wildlife Institute of India, Dehra Dun
Efford MG (2009) DENSITY 4.4: software for spatially explicitcapture–recapture. Department of Zoology, University of Otago,Dunedin, New Zealand. http://www.otago.ac.nz/density.Accessed 10 Oct 2010
Efford MG, Dawson DK, Robbins CS (2004) DENSITY: software foranalysing capture–recapture data from passive detector arrays.Anim Biodivers Conserv 27:217–228
Eisenberg JF, Lockhart M (1972) An ecological reconnaissance ofWilpattu National Park, Ceylon. Smithson Contrib Zool 101:1–118
Harihar A (2005) Population, food habits and prey densities of tiger inChilla Range, Rajaji National Park, Uttaranchal, India. MScDissertation, Saurashtra University
Harihar A, Pandav B, Goyal SP (2009) Density of leopards (Pantherapardus) in the Chilla Range of Rajaji National Park, Uttarakhand,India. Mammalia 73:68–71. doi:10.1515/MAMM.2009.007
Jhala YV, Gopal R, Qureshi Q (eds) (2008) Status of tigers, co-predators,and prey in India. National Tiger Conservation Authority andWildlife Institute of India, Dehra Dun, TR08/001:1–164
Johnson A, Vongkhamheng C, Hedemark M, Saithongdam T (2006)Effects of human–carnivore conflict on tiger (Panthera tigris)and prey populations in Lao PDR. Anim Conserv 9:421–430.doi:10.1111/j.1469-1795.2006.00049.x
Karanth KU (1995) Estimating tiger Panthera tigris populations fromcamera-trap data using capture–recapture models. Biol Conserv71:333–338. doi:10.1016/0006-3207(94)00057W
Karanth KU, Nichols JD (1998) Estimation of tiger densities in Indiausing photographic captures and recaptures. Ecology 79:2852–2862. doi:10.1890/0012-9658(1998)079[2852:EOTDII]2.0.CO;2
Karanth KU, Nichols JD (2000) Ecological status and conservation oftigers in India. Final technical report to the US Fish and WildlifeService (Division of International Conservation), WashingtonDC, Wildlife Conservation Society, New York. Centre forWildlife Studies, Bangalore, India
Karanth KU, Nichols JD (2002) Monitoring tigers and their prey.Centre for Wildlife Studies, Bangalore, India
Karanth KU, Nichols JD, Kumar NS, Link WA, Hines JE (2004)Tigers and their prey: predicting carnivore densities from preyabundance. Proc Natl Acad Sci USA 101:4854–4858.doi:10.1073/pnas.0306210101
Karanth KU, Nichols JD, Kumar NS, Hines JE (2006) Assessing tigerpopulation dynamics using photographic capture–recapture sam-pling. Ecology 87:2925–2937. doi:10.1890/0012-9658(2006)87[2925:ATPDUP]2.0.CO;2
Kawanishi K, Sunquist ME (2004) Conservation status of tigers in aprimary rainforest of Peninsular Malaysia. Biol Conserv120:329–344. doi:10.1016/j.biocon.2004.03.005
Lynam AJ, Rabinowitz A, Myint T, Maung M, Latt KT, Po SHT (2009)Estimating abundance with sparse data: tigers in northern Myanmar.Popul Ecol 51:115–121. doi:10.1007/s10144-008-0093-5
McDougal C (1977) The face of the tiger. Rivington Books and AndreDeutsch, London, pp 1–180
Mondal K (2006) Leopard and ungulate abundance estimation inRajaji National Park, Uttaranchal. MSc Dissertation, ForestResearch Institute (Deemed University), Dehra Dun
Nichols JD (1992) Capture–recapture models: using marked animals tostudy population dynamics. BioScience 42:94–102. doi:10.2307/1311650
Nowell K, Jackson P (1996) Wild cats: status survey and conservationaction plan. IUCN Publications, Cambridge, pp 1–382
O'Brien TG, Kinnaird MF, Wibisono HT (2003) Crouching tigers,hidden prey: Sumatran tiger and prey populations in a tropicalforest landscape. Anim Conserv 6:131–139. doi:10.1017/S1367943003003172
Acta Theriol
Author's personal copy
Otis DL, Burnham KP, White GC, Anderson DR (1978) Statisticalinference from capture data on closed animal populations. WildlMonogr 62:1–135
Pienaar U de V (1969) Predator–prey relationships amongst the largermammals of the Kruger National Park. Koedoe 12:108–176
Pledger S, Efford M (1998) Correction of bias due to heterogeneouscapture probability in capture–recapture studies of open popula-tions. Biometrics 54:888–898
Ramesh T, Snehalatha V, Sankar K, Qureshi Q (2009) Food habits andprey selection of tiger and leopard in Mudumalai Tiger Reserve,Tamil Nadu, India. J Sci Trans Environ Technov 2:170–181
Rexstad E, Burnham KP (1991) User's guide for interactive programCAPTURE: abundance estimation of closed animal populations.Colorado Cooperative Fish and Wildlife Research Unit, ColoradoState University, Fort Collins, Colorado
Royle JA, Dorazio RM (2008) Hierarchical modeling and inference inecology: The analysis of data from populations, metapopulationsand communities. Academic Press, Bullington, MA, USA, pp 1–444
Royle JA, Karanth KU, Gopalaswamy AM, Kumar NS (2009) Bayesianinference in camera trapping studies for a class of spatial capture–recapture models. Ecology 90:3233–3244. doi:10.1890/08-1481.1
Sankar K, Qureshi Q, Mondal K, Worah D, Srivastava T, Gupta S,Basu S (2008) Ecological studies in Sariska Tiger Reserve,Rajasthan. Wildlife Institute of India, Dehra Dun
Schaller GB (1967) The deer and the tiger. University of ChicagoPress, Chicago, pp 1–370
Schaller GB (1972) The Serengeti Lion: a study of predator–preyrelations. University of Chicago Press, Chicago, pp 1–494
Sharma RK, Jhala Y, Qureshi Q, Vattakaven J, Gopal R, Nayak K (2010)Evaluating capture–recapture population and density estimation oftigers in a population with known parameters. Anim Conserv13:94–103. doi:10.1111/j.1469-1795.2009.00305.x
Silver SC, Ostro LET, Marsh LK, Maffei L, Noss AJ, Kelly MJ,Wallace RB, Gómez H, Ayala G (2004) The use of camera trapsfor estimating jaguar Panthera onca abundance and density usingcapture/recapture analysis. Oryx 38:148–154. doi:10.1017/S0030605303000000
Simcharoen S, Duangchantrasiri S (2008) Monitoring of the LeopardPopulation at Khao Nang Rum in Huai Kha Khaeng WildlifeSactuary. Thai J For 27:68–80
Singh P, Gopalaswamy AM, Royle AJ, Kumar NS, Karanth KU(2010) SPACECAP: A Program to Estimate Animal Abundanceand Density using Bayesian Spatially-Explicit Capture-RecaptureModels. Wildlife Conservation Society, India Program, Centrefor Wildlife Studies, Bangalore, India. Version 1.0 Accessed 3Oct 2010
Soisalo MK, Cavalcanti SMC (2006) Estimating the density of ajaguar population in the Brazilian Pantanal using camera-trapsand capture–recapture sampling in combination with GPSradio-telemetry. Biol Conserv 129:487–496. doi:10.1016/j.biocon.2005.11.023
Stanley TR, Burnham KP (1999) A closure test for time-specificcapture–recapture data. Environ Ecol Stat 6:197–209.doi:10.1023/A:1009674322348
Suresh HS, Dattaraja HS, Sukumar R (1996) Tree flora of MudumalaiSanctuary, southern India. The Indian Forester 122:507–519
Trolle M, Kéry M (2003) Estimation of ocelot density in the Pantanalusing capture–recapture analysis of camera-trapping data. JMammal 84:607–614
Varman KS, Sukumar R (1995) The line transect method forestimating densities of large mammals in a tropical deciduousforest: an evaluation of methods and field experiments. J Biosci20:273–287
Venkataraman M, Shanker K, Sukumar R (2005) Small mammalcommunities of tropical forest habitats in Mudumalai WildlifeSanctuary, southern India. Mammalia 69:349–358. doi:10.1515/mamm.2005.028
Wang SW, Macdonald DW (2009) The use of camera traps forestimating tiger and leopard populations in the high altitudemountains of Bhutan. Biol Conserv 142:606–613. doi:10.1016/j.biocon.2008.11.023
Wegge P, Pokheral CP, Jnawali SR (2004) Effects of trapping effortand trap shyness on estimates of tiger abundance from cameratrap studies. Anim Conserv 7:251–256. doi:10.1017/S1367943004001441
Acta Theriol
Author's personal copy


