Embed Size (px)
Citation preview
Dealing with the Increasing Public Debt in Egypt
ByAli A. Massoud*
* The author is an associate professor at Economics Department, Faculty of Commerce, Sohag University, Egypt and a visiting scholar at Claremont Institute for Economic Policy Studies, Claremont Graduate University, U.S.A.
Email: [email protected]
Phone: ++1(909) 331-9804 (USA)
++(20)1113131215 (Egypt)
1
Keywords: Public Debt, Public Debt Sustainability, Fiscal Reaction Function, and Fiscal Consolidation.
Dealing with The Increasing Public Debt in Egypt
By
Ali A. Massoud
Sohag University, Egypt and Claremont Graduate University, USA
Email: [email protected]
Abstract:
The objective of this paper is to identify the magnitude of the
public debt problem in Egypt and to provide some guidelines for
policymakers in dealing with the increasing public debt. In the
paper, the issue of public debt is looked at as a result of the
interaction of fiscal policy and the economic performance, and
not as a statistical concept only. It consists of four sections
and an introduction. Section (1) provides an identification of
the magnitude of the public debt problem in Egypt. Section (2)
presents a forecast of the level of public debt in Egypt till the
year 2020 using a VAR model. Section (3) provides a forecast for
the size of the public debt in Egypt under various scenarios
where both economic growth and fiscal policy were considered.
2
Section (4) summarizes the findings and policy recommendations
that came out of this study.
The conclusions drawn from this research may be summarized as
follows. (1) Based on the model used in the paper and public debt
indicators, public debt in Egypt is expected to be sustainable
till the year 2020. (2) Economic growth has a very strong impact
on reducing public debt in Egypt. (3) Fiscal consolidation is
very important in reducing public debt because of its impact on
economic growth. However, in the process of fiscal consolidation,
the Egyptian government has to consider rationalizing spending
and not to cut investment spending.
Introduction:
Increasing debt to GDP ratio is an important issue not only for
developing and emerging market countries, but also for advanced
economies as well. As a matter of fact, the debt to GDP ratio for
advanced economies, as a group, is much higher than for
developing and emerging countries, as another group. In 2010 the
ratio of debt to GDP for the former group was 102% and it is
expected to be 133% by the year 2020. For emerging markets, the
ratio of debt to GDP in 2010 was only 46% and it is expected to
decline to 35% by the year 2020, Becker (2010).
3
What are the factors that cause debt to GDP ratio to increase?
Abas, et al. (2013) argued that identifying the factors moving the
debt to GDP ratio is not always straightforward. Even though the
increases in this ratio are found to be associated with low or
negative growth rate and weak primary balances, the underlying
correlations vary across countries and time. They identified
other factors that affect debt dynamics such as inflation,
interest rates, and stock-flow adjustments. However, the impact
of these factors is less clear than for primary balance and
growth.
Regardless of what caused debt to increase in a country, keeping
debt sustainable should be the main concern for policymakers
because an infinite increase of debt hurts economic growth in the
long run. High level of debt crowds out private investment and
puts constraints on fiscal policy. Government debt is considered
sustainable only if the government can serve its debt without
taking measures that are economically and politically costly.
Reinhart and Rogoff (2010 and 2012) argue that if the debt to GDP ratio
exceeds 90%, the economic growth will be affected negatively in a
strong way. Baum, et al. (2013) supports the existence of debt
threshold. They argue that in the Euro area, if the debt to GDP
ratio exceeds 95%, it will lead to a lower growth. Roubini (2001)
challenged the existence of debt threshold as follows.
“As long as the debt ratio to GDP is stabilized over the medium term, it is considered as
sustainable regardless of its level; i.e. a debt to GDP ratio of 150% is as sustainable as a
debt to GDP ratio of 50%”
4
Eberhardt and Presbitero (2013) also supported Robinin’s view. Even
though, they found some support for a nonlinear relationship
between debt and long-run growth across countries, they found no
evidence for common debt thresholds within countries over time.
Pescatori, et al. (2014) also, found no evidence of any particular debt
threshold above which medium-term growth prospects are
dramatically compromised. However, they found that higher debt is
associated with a higher degree of output volatility. Ghosh et al.
(2010 and 2011) moved the argument forward and showed that even
what is used to be considered formerly as a sustainable level of
debt may become unsustainable and triggers default. Many other
studies have tried to test the sustainability of public debt in
various countries and across nations & regions, i.e.,Sopek (2011), Di
Bella (2008), Tanner and Samake (2006), Mediros (2012), Stoian (2011). The IMF and
the World Bank also have been given an increasing attention to
debt sustainability. The IMF conventional framework on
“sustainability assessment” was first released in 2002. In 2005,
the World Bank and the IMF together created the Debt
Sustainability Analysis (DSA) in order to guide the low-income
countries borrowing decisions and to reduce the chances of
excessive debt accumulations. In 2014, IMF released its new
toolkit for assessing public debt sustainability in countries
that have access to international capital markets. This approach
is called public debt sustainability analysis in market access
countries (MAC DSA). It takes a more holistic view, assessing the
level and trajectory of debt, government financing needs, and
5
vulnerability in the debt structure. For more details on this
issue, review IMF (2013), World Bank and the IMF (2012, 2009 and 2001), Escolano
(2010), and Akyiiz (2007).
It might be argued that debt limits are not static over time.
Rather, they change from time to time and across countries as
well. The main factors affecting the debt limit for a country may
be identified as follows. (1) The performance of the national
economy and its ability to recover after shocks. (2) The
willingness and the ability of the authorities to undertake
serious fiscal adjustments. Abiad and Ostry (2005) emphasized
countries surplus-generating capacity that are linked to its
fundamentals, the country historical experience in managing its
debt & its budget and the country’s fiscal institutions to
deliver primary surpluses as main factors that affect debt limit.
In managing public debt, we should consider the activities that
debt finances. Public debt that finances growth enhancing
activities, i.e., infrastructure, is expected to increase the
surplus-generating capacity. However, public debt that finances
current expenditure for the government is more likely to put
constraints on fiscal policy over the medium and long term. For
many of low-income countries in order to meet their public
investment needs in infrastructure, energy, health, education,
and other critical sectors, they have to depend on debt in
financing these investments. Building up public debt can have
destructive outcomes on growth over the long run via what is
known as a debt overhang. Moreover, countries cannot carry out an
6
increasing debt over the long term. This leads to debt
unsustainability problems.
In the process of debt management, we should differentiate
between solvency and liquidity. The former concept is related to
a medium to long-term and requires that the government’s net
present value budget constraint to hold. This means that the net
present value of the government’s future primary balances must be
at least equal to the net present value of the government debt.
While the concept of liquidity is related to a short-term time
frame, it requires that the government is able to serve its debt
obligations in the short term. The differentiation between
external and internal debt is another issue that we have to
consider in debt management process. Buffie, et al. (2012) argues that
while external borrowing provides external resources, it has two
main shortages. (1) It may be attached to undesirable conditions.
(2) In the presence of weak structural and policy conditions
and / or unexpected exogenous shocks, it induces unsustainable
public debt dynamics. Even though domestic borrowings are
favorable for policymakers because they give them a broad range
of options to deal with public debt, they worsen the crowding out
of the private investment. Also, they may lead to excessive
borrowing by the government.
Chan-Lau and Santos (2010) identified six principles, advanced by the
IMF and the World Bank, for sound management of the risks
associated with debt. These principles are: (1) the alignment of
the objectives of debt management, monetary policy, and fiscal
7
policy; (2) adequate transparency and accountability; (3)
institutional capacity; (4) the optimal debt structure; (5) an
appropriate risk-management framework; and (6) developing an
efficient government security market.
Debt reduction is one of the tools that government uses in
managing public debt. Great Britain, France, and Germany
succeeded to reduce their debt dramatically in the past. Even
developing and underdeveloped countries managed to do so by a
high level of policy commitment to reduce their debt. This is
what international experiences also emphasize, i.e. , Guyana
managed to decrease the percentage of public debt to GDP form
575% in 2002 to 183% in 2005 as a result of debt reliefs,
structural reform that enhances growth, i.e. modernization of
sugar sector, and fiscal consolidation. Apergis and Cooray (2013) has
shown that the only aggressive growth policy could permit a
country, such as Greece to achieve debt sustainability. The debt
problem started in Greece as the debt ratio to the GDP reached a
high level of 171% of GDP in 2011. This raised a question
regarding Greece's ability to pay its debt back. In order to calm
down the market, the Greek government adopted very tough fiscal
measures including cutting expenditures and raising taxes. These
measures hurt growth and put the country on a vicious cycle and
deep recession. Most of the literature on debt reduction
encourages public spending cuts in order to restore the primary
balance. However, reducing public spending may harm economic
growth over the medium term, which in return harms the fiscal
8
position for the country. Baldacci et al. (2013) has shown that public
debt consolidations should be gradual and based on an appropriate
combination of revenues’ increase and public spending cuts. They
also emphasized that the public spending cuts should not include
the public investments that enhance growth over the medium and
long terms. Reinhard and Rogoff (2013) cited five ways to reduce large
debt to GDP ratios that authorities had used one or a combination
of them. (1) Economic growth. (2) Fiscal adjustment-austerity.
(3) Explicit (de jure) default or restructuring. (4) Inflation.
(5) A steady dose of financial repression accompanied by a steady
dose of inflation.
Public debt and its sustainability has been a major concern for
policymakers in Egypt. Before the adoption of Economic Reform
Program in Egypt in the 1990s, external debt was the main issue.
Holding a high level of external debt, given the current account
deficit and the continuous depreciation of the Egyptian Pound,
may lead not only to a liquidity problem but also it could lead
to an insolvency problem. Policymakers in Egypt have got this
correctly and moved steadily toward financing the deficit in
public budget via domestic debt. Domestic debt has increased
dramatically during the last two decades making policymakers in
Egypt facing a great challenge. This challenge is how can Egypt
continue to serve its debt without adopting unrealistically large
correction to its public budget? In other words, how can Egypt
achieve both liquidity and solvency? It might be argued that the
real challenge for the Egyptian policymakers is not the external
9
debt; rather it is the domestic debt. From the liquidity aspect,
Egypt must be able to find sufficient amount of financing in each
period to close any financing gaps without having to resort
disorderly adjustment. From a solvency perspective, Egypt must be
able to generate sufficient funds in the coming periods to cover
its debt service obligations without indefinitely accumulating
debt. If policymakers in Egypt are able to do that, the public
debt in Egypt will be sustainable in the future.
There are two studies that dealt with public debt sustainability
in Egypt. The first study was El-Mahdy and Torayeh (2009). They examined
two issues related to debt in Egypt. (1) They examined the impact
of domestic debt on economic growth in Egypt during the period
from 1981 to 2006. By using a co-integration model, they found
out that domestic debt had a robust and negative impact on
economic growth. (2) They also examined the sustainability of
domestic debt. They found out that domestic debt in Egypt during
this period has been sustainable. The second study was Abutaleb and
Hamad (2010). They assessed the foreign debt policy in Egypt
during the period from 1985 to 2008 and contrasted it with the
optimal policy. They used a stochastic control approach in order
to determine the optimal debt policy. They found out that Egypt’s
foreign debt was higher than the optimal level before 1997.
However, after 1997, the foreign debt was below its optimal
level.
The objective of this paper is to identify the magnitude of the
public debt problem in Egypt and to provide some guidelines for
10
policymakers in dealing with the increasing public debt. In this
paper, the public debt is looked at as a result of the
interaction of fiscal policy and the economic performance, and
not as a statistical concept only. This differs from the previous
studies based only on what is known in literature as the present-
value borrowing constraints according to which government must
intertemporally balance their budgets by setting the current
value of debt equal to discounted sum of expected future
surpluses. The violation of this constraint leads to a debt
explosion over time at rates faster than the economic growth
rates in this country.
The second part of the paper is organized as follows. Section (1)
provides an identification of the magnitude of the public debt
problem in Egypt. Section (2) presents a forecast of the level of
public debt in Egypt till the year 2020. Section (3) provides a
forecast of the size of the public debt in Egypt under various
scenarios. Section (4) summarizes the conclusion and policy
recommendations that come out of this study.
(1) The magnitude of the public debt in Egypt
Over the past two decades, public debt in Egypt has increased
dramatically. In 1991, net domestic debt was only 71.4 billion
L.E. It increased steadily to reach a level of more than 1.6
11
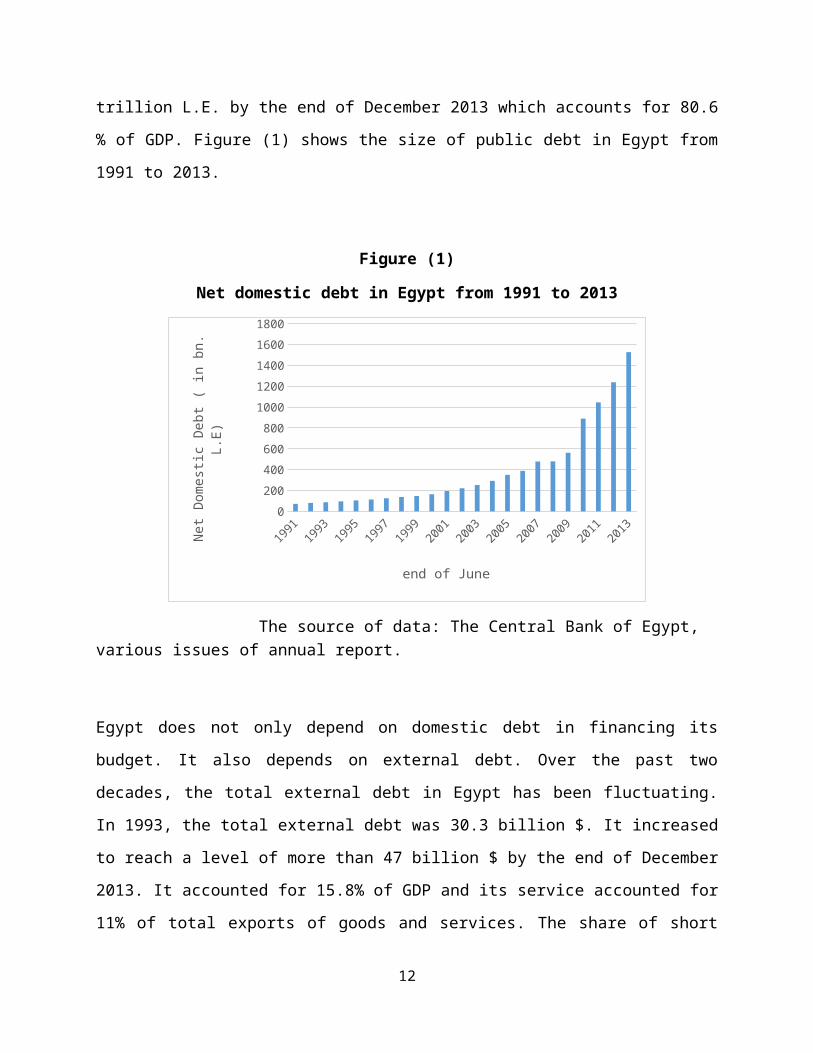
trillion L.E. by the end of December 2013 which accounts for 80.6
% of GDP. Figure (1) shows the size of public debt in Egypt from
1991 to 2013.
Figure (1)
Net domestic debt in Egypt from 1991 to 2013
020040060080010001200140016001800
end of June
Net
Dome
stic
Deb
t (
in b
n.
L.E)
The source of data: The Central Bank of Egypt, various issues of annual report.
Egypt does not only depend on domestic debt in financing its
budget. It also depends on external debt. Over the past two
decades, the total external debt in Egypt has been fluctuating.
In 1993, the total external debt was 30.3 billion $. It increased
to reach a level of more than 47 billion $ by the end of December
2013. It accounted for 15.8% of GDP and its service accounted for
11% of total exports of goods and services. The share of short
12
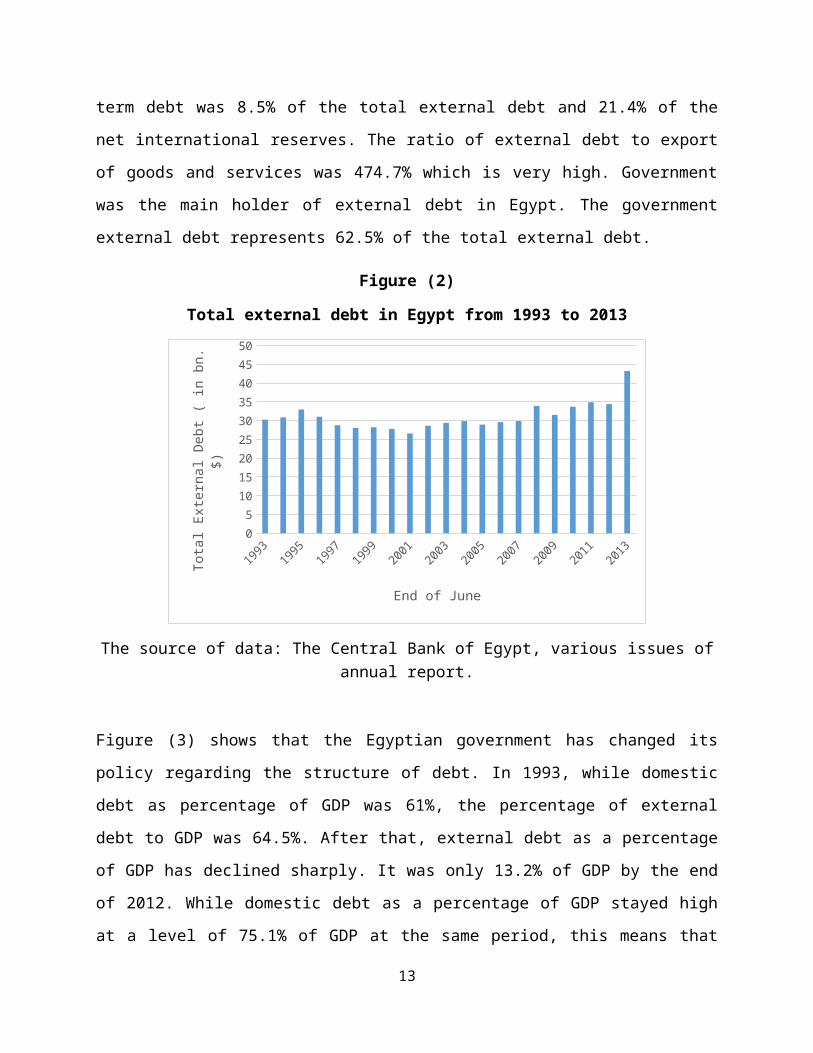
term debt was 8.5% of the total external debt and 21.4% of the
net international reserves. The ratio of external debt to export
of goods and services was 474.7% which is very high. Government
was the main holder of external debt in Egypt. The government
external debt represents 62.5% of the total external debt.
Figure (2)
Total external debt in Egypt from 1993 to 2013
05101520253035404550
End of June
Tota
l Ex
tern
al D
ebt
( in
bn.
$)
The source of data: The Central Bank of Egypt, various issues ofannual report.
Figure (3) shows that the Egyptian government has changed its
policy regarding the structure of debt. In 1993, while domestic
debt as percentage of GDP was 61%, the percentage of external
debt to GDP was 64.5%. After that, external debt as a percentage
of GDP has declined sharply. It was only 13.2% of GDP by the end
of 2012. While domestic debt as a percentage of GDP stayed high
at a level of 75.1% of GDP at the same period, this means that
13
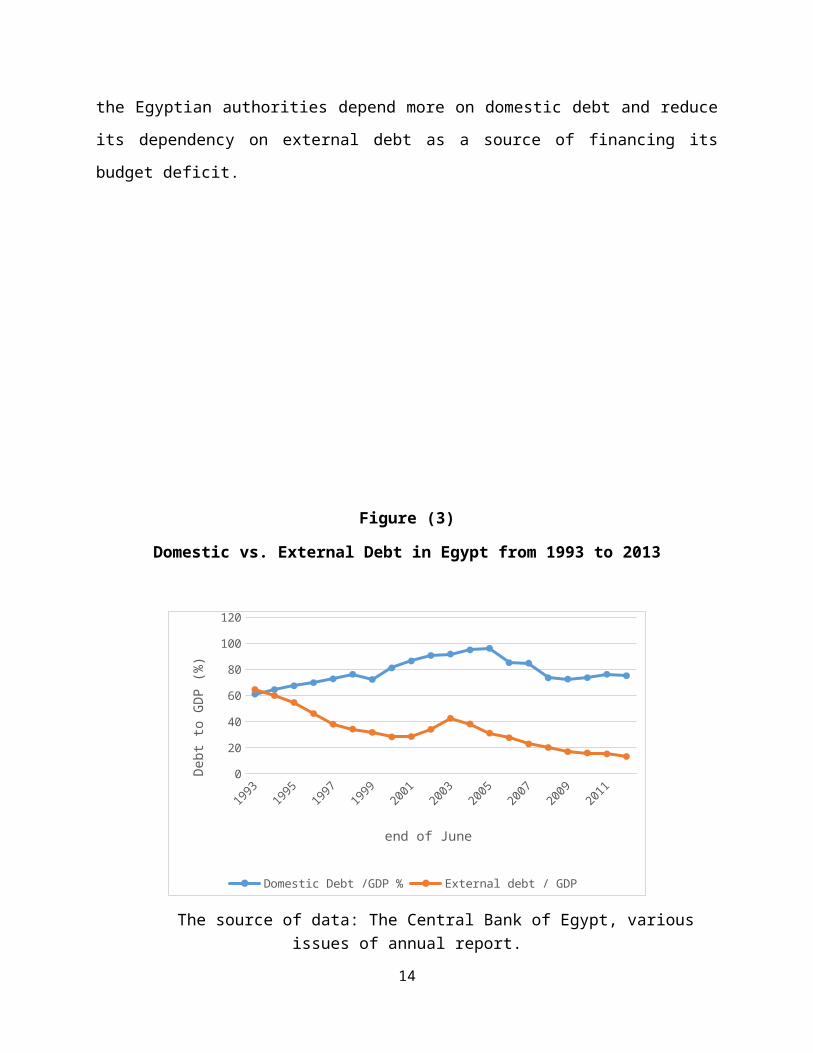
the Egyptian authorities depend more on domestic debt and reduce
its dependency on external debt as a source of financing its
budget deficit.
Figure (3)
Domestic vs. External Debt in Egypt from 1993 to 2013
0
20
40
60
80
100
120
Domestic Debt /GDP % External debt / GDP
end of June
Debt
to
GDP
(%)
The source of data: The Central Bank of Egypt, variousissues of annual report.
14
The question is: why should we have concern about the rising
level of public debt in Egypt? The answer is that Egypt pays
26.5% of its public budget in forms of domestic and foreign
interest. This is very close to the share of the employees’
compensations which account for 30.6% of the total expenditure.
It is very obvious that public debt in Egypt puts heavy
constraints on its fiscal policy. Also there are three other
reasons for the Egyptian authorities to be concerned about the
increasing public debt in Egypt. (1) A country with high public
debt ratio faces increasing difficulties in accessing financial
market in the short term and it could suffer from a serious debt
sustainability problem over the medium term. (2) It may lead to a
default or inflationary finance. The default most likely leads to
a financial crisis. For inflation even though it reduces the real
cost of debt service; it is associated with higher interest rate
which is also expected to increase debt service, Apergis and Cooray
(2013). (3) High public debt ratios may crowed out private
investments. (4) External debt could lead to a financial crisis
similar to what happened in Latin America in the 1980s.
(2) Forecasting the magnitude of the public debt in Egypt:
In order to forecast the magnitude of the public debt in Egypt
over the coming period, I used a Vector Autoregression (VAR)
model. Five variables were included in this model as follows:
Domestic Debt / GDP (%), Real GDP per Capita Growth Rate, Overall Public Budget
15
Deficit / GDP (%), Inflation, and Real Interest Rate. The variables were used in
the model in the same order as stated above. The World
Development Indicators (WDI) published by the World Bank, were
the source of the data for the real GDP per capita growth rate,
inflation, and real interest rate. While the Central Bank of
Egypt (CBE) was the source of data used for domestic debt and
public deficit (primary balance). The data used in the model
covers the period from 1991 to 2012. Data was transferred from
annual frequency to quarterly using E-Views 8.
Because stationarity is an important issue in time series data as
well as in VAR models, I conducted Dickey-Fuller tests for unit
root to all variables. Augmented Dickey-Fuller tests for unit
root suggest that all variables have unit roots. In order to make
the series stationary, I took the long and the first difference
for all series. By conducting Augmented Dickey-Fuller tests for
the new series, all variables were found to be stationary at
I(1). Following Medeiros (2012), the optimal number of lags for this
model is two lags.
To forecast the magnitude of public debt in Egypt using the model
explained above, first I estimated the model, and then I
forecasted the future values of public debt to GDP (%) in the
baseline scenario. Figure (4) shows the actual size of public
debt as a percentage of GDP through the period from the first
quarter of year 1991 to the fourth quarter of year 2012. This
figure also shows the forecasted size of public debt as a
percentage of GDP from the first quarter of year 2013 to the
16
fourth quarter of year 2020. According to it, the public debt to
GDP ratio is forecasted to be 85.5% at the end of year 2020
compared with the current percentage which is 77.7 %. This
assumes that the Egyptian government will not adopt any radical
changes in its fiscal & monetary policy and economic growth will
grow at the same level as it used to from 1991 to 2012. On one
hand, if the Egyptian government adopts more radical fiscal
policies that reduce budget deficit and enhance economic growth
over the medium term, I expect that the size of public debt as a
percentage of GDP will decrease substantially. However, on the
other hand, if the political and social instability that have
been taking place in Egypt after 25th of January 2011 continues
over the medium term; the Egyptian authorities are not able to
adopt an appropriate fiscal policy; the economic growth stays in
its low levels, the public debt as a percentage of GDP is
expected to be even worse than this forecasted value.
Figure (4)
The Actual and Forecasted Debt to GDP (%) in Egypt from 1991 to2020
17

Table (1) shows in more details the magnitude of public debt in Egypt as forecasted in this model.
Table (1)
The Forecasted Debt to GDP (%) in Egypt from 2014 to 2020
End of Year 2014 2015 2016 2017 2018 2019 2020Debt / GDP (%)
79.2 83.4 86.1 87.1 87.1 86.5 85.5
To test the accuracy of the model forecasts, six quarters of
available actual data on the ratios of debt to GDP were compared
with the forecasted values of the ratios by the model over the
same period. Figure (5) provides a comparison between the actual
and the forecasted magnitude of public debt as a percentage of
GDP. Through the period from the first quarter of year 2013 to
the second quarter of year 2014, as figure (5) shows, the model
provides a reasonably acceptable forecast of the magnitude of
public debt in Egypt. Over the six quarters that forecasted and
18
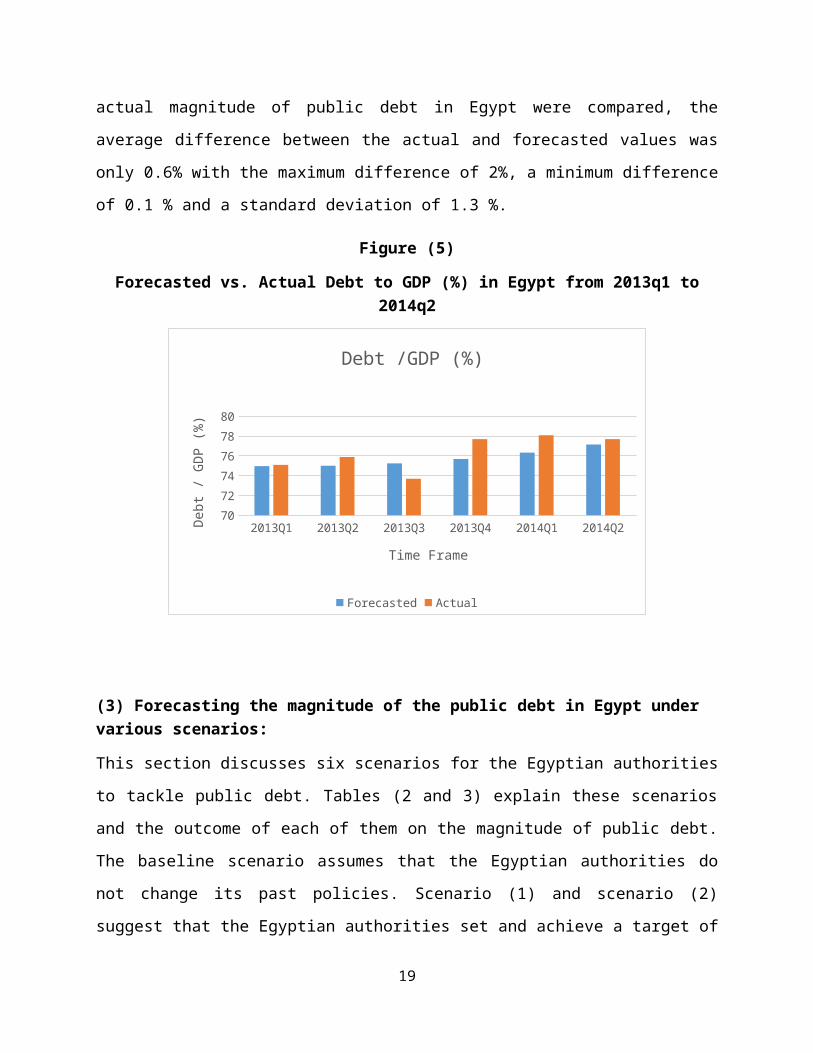
actual magnitude of public debt in Egypt were compared, the
average difference between the actual and forecasted values was
only 0.6% with the maximum difference of 2%, a minimum difference
of 0.1 % and a standard deviation of 1.3 %.
Figure (5)
Forecasted vs. Actual Debt to GDP (%) in Egypt from 2013q1 to2014q2
2013Q1 2013Q2 2013Q3 2013Q4 2014Q1 2014Q2707274767880
Debt /GDP (%)
Forecasted Actual
Time Frame
Debt
/ G
DP (
%)
(3) Forecasting the magnitude of the public debt in Egypt under various scenarios:
This section discusses six scenarios for the Egyptian authorities
to tackle public debt. Tables (2 and 3) explain these scenarios
and the outcome of each of them on the magnitude of public debt.
The baseline scenario assumes that the Egyptian authorities do
not change its past policies. Scenario (1) and scenario (2)
suggest that the Egyptian authorities set and achieve a target of
19
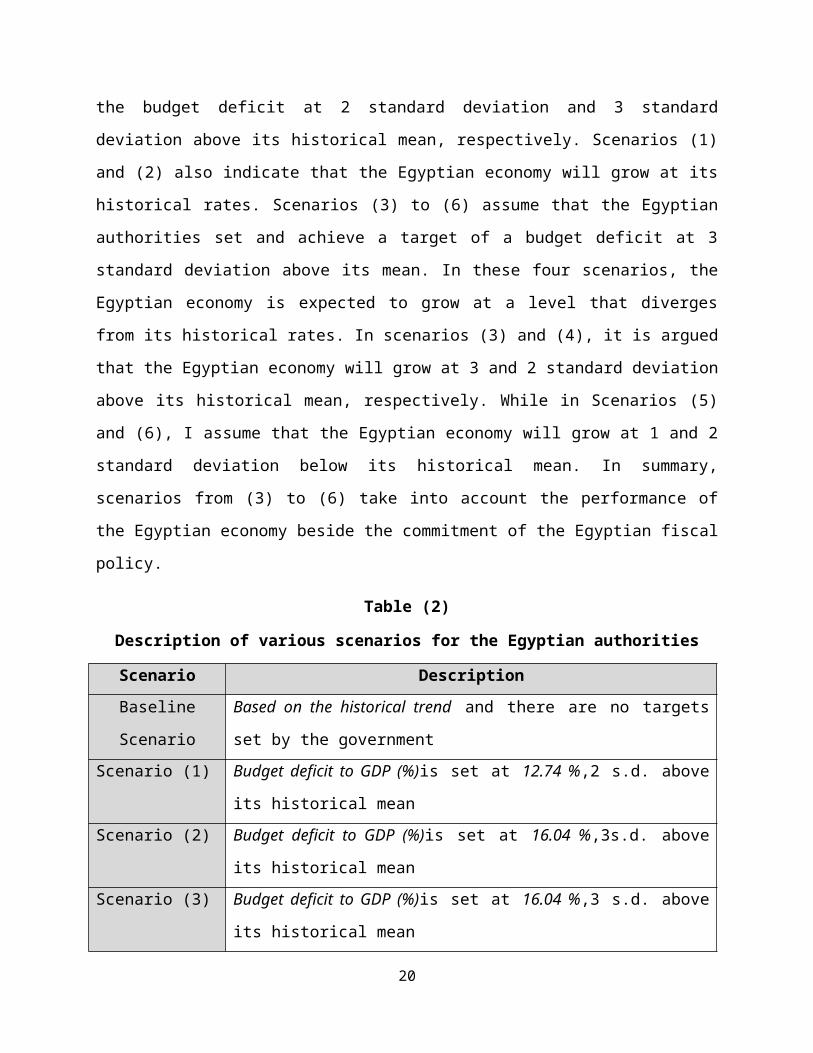
the budget deficit at 2 standard deviation and 3 standard
deviation above its historical mean, respectively. Scenarios (1)
and (2) also indicate that the Egyptian economy will grow at its
historical rates. Scenarios (3) to (6) assume that the Egyptian
authorities set and achieve a target of a budget deficit at 3
standard deviation above its mean. In these four scenarios, the
Egyptian economy is expected to grow at a level that diverges
from its historical rates. In scenarios (3) and (4), it is argued
that the Egyptian economy will grow at 3 and 2 standard deviation
above its historical mean, respectively. While in Scenarios (5)
and (6), I assume that the Egyptian economy will grow at 1 and 2
standard deviation below its historical mean. In summary,
scenarios from (3) to (6) take into account the performance of
the Egyptian economy beside the commitment of the Egyptian fiscal
policy.
Table (2)
Description of various scenarios for the Egyptian authorities
Scenario DescriptionBaseline
Scenario
Based on the historical trend and there are no targets
set by the governmentScenario (1) Budget deficit to GDP (%)is set at 12.74 %,2 s.d. above
its historical meanScenario (2) Budget deficit to GDP (%)is set at 16.04 %,3s.d. above
its historical meanScenario (3) Budget deficit to GDP (%)is set at 16.04 %,3 s.d. above
its historical mean
20
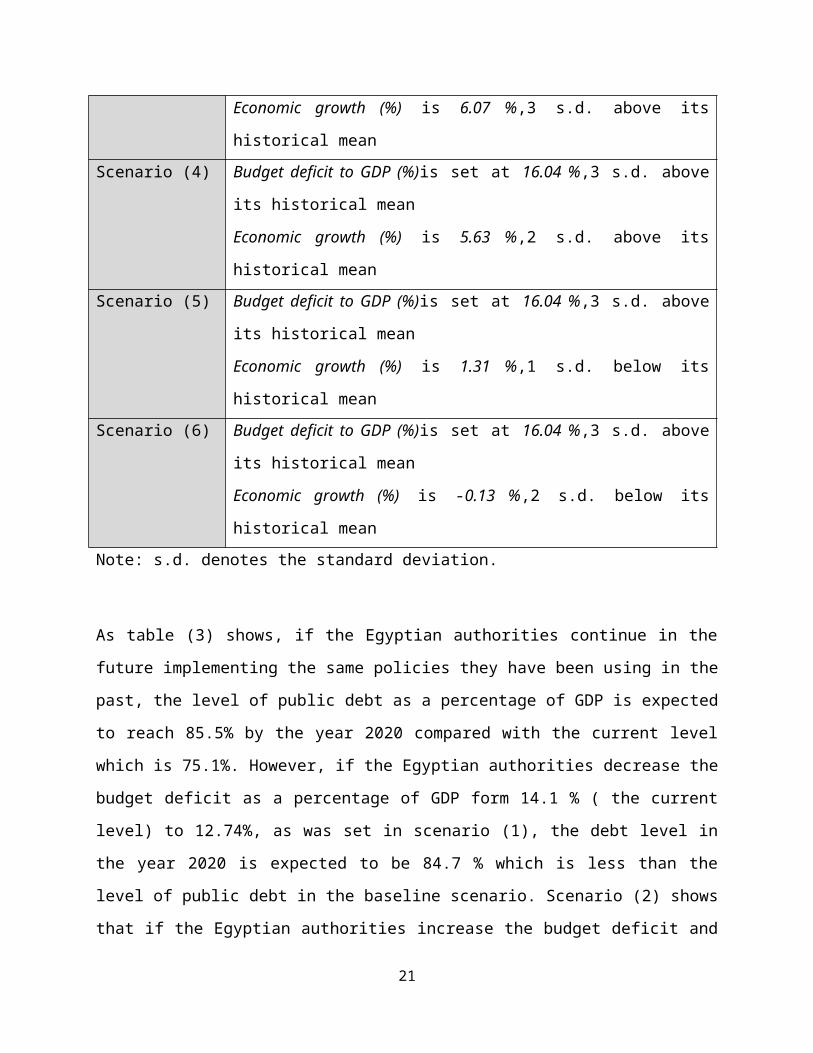
Economic growth (%) is 6.07 %,3 s.d. above its
historical meanScenario (4) Budget deficit to GDP (%)is set at 16.04 %,3 s.d. above
its historical mean
Economic growth (%) is 5.63 %,2 s.d. above its
historical meanScenario (5) Budget deficit to GDP (%)is set at 16.04 %,3 s.d. above
its historical mean
Economic growth (%) is 1.31 %,1 s.d. below its
historical meanScenario (6) Budget deficit to GDP (%)is set at 16.04 %,3 s.d. above
its historical mean
Economic growth (%) is -0.13 %,2 s.d. below its
historical meanNote: s.d. denotes the standard deviation.
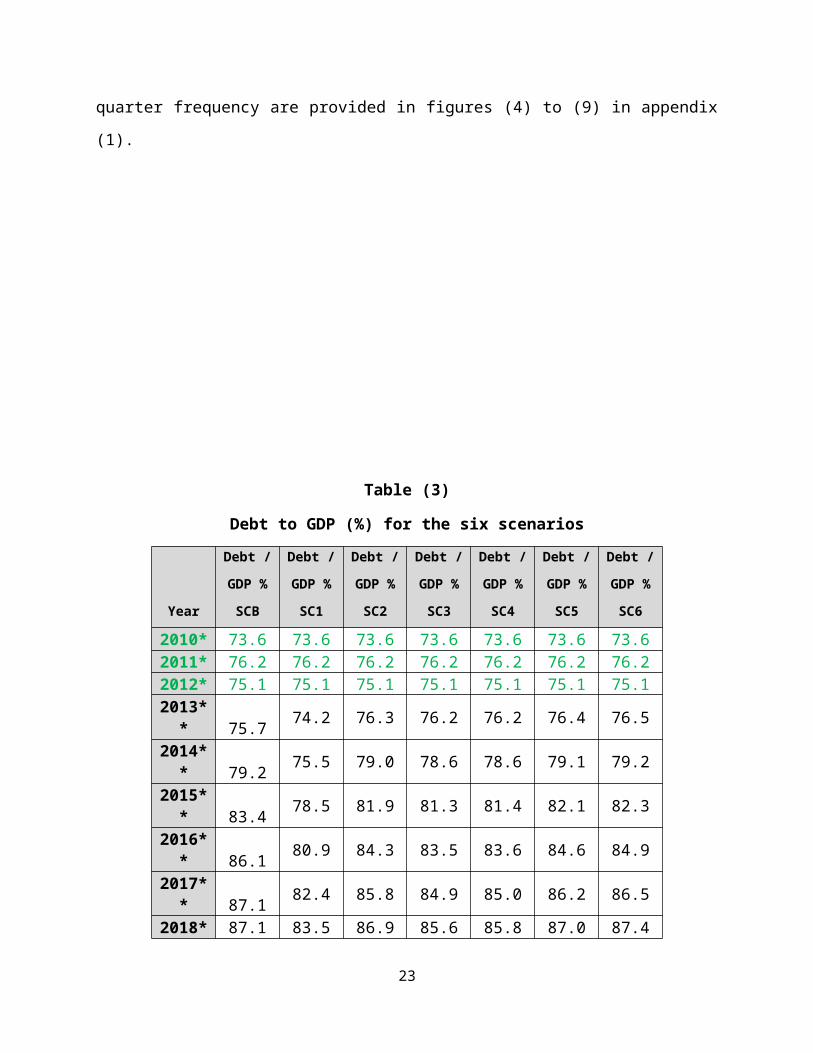
As table (3) shows, if the Egyptian authorities continue in the
future implementing the same policies they have been using in the
past, the level of public debt as a percentage of GDP is expected
to reach 85.5% by the year 2020 compared with the current level
which is 75.1%. However, if the Egyptian authorities decrease the
budget deficit as a percentage of GDP form 14.1 % ( the current
level) to 12.74%, as was set in scenario (1), the debt level in
the year 2020 is expected to be 84.7 % which is less than the
level of public debt in the baseline scenario. Scenario (2) shows
that if the Egyptian authorities increase the budget deficit and
21
the economy grows at the same rates it has been growing in the
past, the debt level is expected to be worse even more and reach
to 87.7%. Scenarios (4) to (6) show to what extent economic
growth makes difference in affecting the public debt level in
Egypt even though with high levels of budget deficit. If the
Egyptian economy grows in rates higher than it was in the past,
as set in scenarios (3) and (4), the public debt will decrease in
the future compared to its level in scenario (2). Scenarios (5)
and (6) show to what extent the weak performance of the Egyptian
economy will have negative impacts on the level of the public
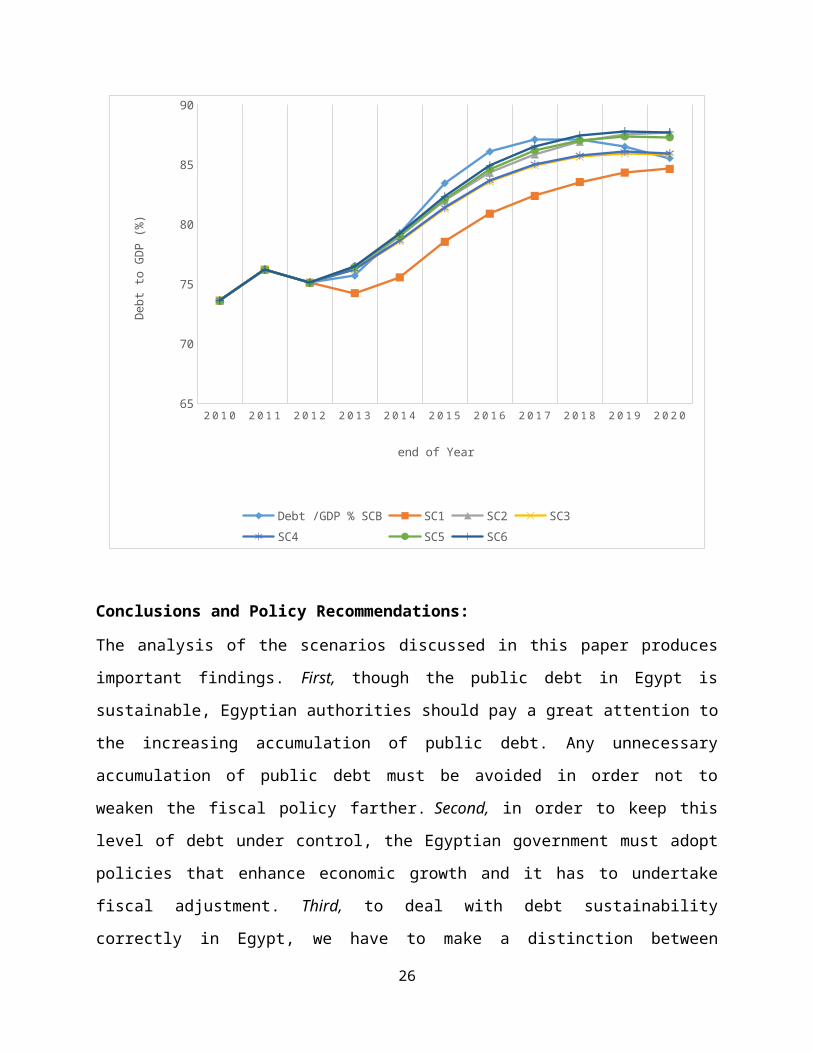
debt in Egypt. Figure (6) provides a comparison between these six
scenarios regarding their impact on public debt in Egypt.
According to the analysis of all these scenarios, we may
conclude:
1-Public debt in Egypt is going to be sustainable. In other
words, it is not going to get out of control over the period till
the year 2020.
2- Achieving high rates of economic growth is very important for
reducing the ratio of debt to GDP in the future.
3- Even though reducing budget deficit has less impact on debt
reduction than achieving high rates of economic growth; it is
very important in order to make fiscal policy more effective in
enhancing the stability and growth.
Figures (1) to (3) in appendix (1) provide a comparison among
different scenarios. Also, more details for the six scenarios at
22
quarter frequency are provided in figures (4) to (9) in appendix
(1).
Table (3)
Debt to GDP (%) for the six scenarios
Year
Debt /
GDP %
SCB
Debt /
GDP %
SC1
Debt /
GDP %
SC2
Debt /
GDP %
SC3
Debt /
GDP %
SC4
Debt /
GDP %
SC5
Debt /
GDP %
SC6
2010* 73.6 73.6 73.6 73.6 73.6 73.6 73.62011* 76.2 76.2 76.2 76.2 76.2 76.2 76.22012* 75.1 75.1 75.1 75.1 75.1 75.1 75.12013*
* 75.7 74.2 76.3 76.2 76.2 76.4 76.5
2014** 79.2 75.5 79.0 78.6 78.6 79.1 79.2
2015** 83.4 78.5 81.9 81.3 81.4 82.1 82.3
2016** 86.1 80.9 84.3 83.5 83.6 84.6 84.9
2017** 87.1 82.4 85.8 84.9 85.0 86.2 86.5
2018* 87.1 83.5 86.9 85.6 85.8 87.0 87.4
23

*2019*
* 86.5 84.3 87.5 85.9 86.1 87.4 87.8
2020** 85.5 84.6 87.7 85.8 85.9 87.3 87.7
* Actual ** Forecasted
24

Figure (3)
Debt to GDP (%) for the six scenarios
25
2 0 1 0 2 0 1 1 2 0 1 2 2 0 1 3 2 0 1 4 2 0 1 5 2 0 1 6 2 0 1 7 2 0 1 8 2 0 1 9 2 0 2 065
70
75
80
85
90
Debt /GDP % SCB SC1 SC2 SC3SC4 SC5 SC6
end of Year
Debt to GDP (%)
Conclusions and Policy Recommendations:
The analysis of the scenarios discussed in this paper produces
important findings. First, though the public debt in Egypt is
sustainable, Egyptian authorities should pay a great attention to
the increasing accumulation of public debt. Any unnecessary
accumulation of public debt must be avoided in order not to
weaken the fiscal policy farther. Second, in order to keep this
level of debt under control, the Egyptian government must adopt
policies that enhance economic growth and it has to undertake
fiscal adjustment. Third, to deal with debt sustainability
correctly in Egypt, we have to make a distinction between
26
domestic debt and external debt. Domestic debt issued in Egyptian
Pound offers a far wider range of partial default options than
does foreign currency-dominated external debt, Reinhart and Rogoff
(2013). The implications of that approach can be summarized in two
points: (1) The Egyptian government can stuff debt into local
pension funds, state-owned banks, and public insurance companies.
This can be done through forcing these institutions to accept
lower rates of return on their investments in public loans &
bonds than they might otherwise accept. (2)The Egyptian
government can reduce domestic debt through inflation if it faces
problem in repaying public debt back. These options, even they
are very difficult and they have strong and negative consequences
on financial stability and economic growth, are not available for
the government in the case of external debt.
Based on this study, the following is a summary of most relevant
recommendations directed to the Egyptian authorities in order to
deal with the problem of public debt.
1- The Egyptian government must rationalize public
expenditures, i.e., move toward monetary subsidies instead
of commodity subsidies; consider the left of energy
subsidies seriously and endeavor to change its magnitude &
structure. The expenditure should move more toward capital
expenditure. However, the Egyptian government must take into
consideration the negative impact of lowering government
spending and higher taxes on economic growth, which could
27
hurts the debt to GDP ratio in the short run in the process
of fiscal consolidation.
2- Egyptian government should adopt economic policies that
enhance investment and economic growth. High level of
productive investment and economic growth typically
generates additional tax revenue without necessitating an
increase in tax rates.
3- In order to make debt sustainable in the future, Egyptian
government has to strengthen the institutional capacity of
generating revenue.
4- Fiscal decentralization is an important aspect that Egyptian
government has to take in consideration. Fiscal
decentralization leads to a better use of public spending
and enhances growth at the governorate level.
5- The coordination between fiscal policy and monetary policy
is a very important issue in order to maintain the domestic
real interest rate below the real output growth rate and to
ensure a stable inflation and exchange rate. For instance,
low interest rate has two effects: first, it improves the
budget balance as the government issues new bonds to finance
the remaining deficit and the old debt. Second, low interest
rate encourage investors to invest more and consumers to
spend more, an action which may lead to an increase in GDP
and a decline in debt to GDP ratio, Abas (2013). Stable
inflation and exchange rate reduce the risk premium in
28

Egypt. This encourages foreign investors and strengths the
access to the international financial markets.
6- The Egyptian government may consider financial repression as
a tool to be used over the short term in order to reduce the
burden of the domestic debt. It can do so by forcing the
state banks and insurance companies to lend the government
at a rate less than it would lend otherwise.
7- Egyptian authorities need to engage in debt relief
arrangements and consider the option of debt relief and
development swaps. Debt relief takes financial obligations
off the government’s shoulder which increases the fiscal
space for the government.
29
References:[1] Abbas, A., B. Akitoby, J. Andritzky, H.Berger, T.
Komastsuzaki, and J. Tyson, 2013. “Dealing with High Debt in an
Era of Low Growth.” IMF Staff Discussion Note, SDN/13/07.
[2] Abiad, A. and J. D., Ostry, 2005. “Primary Surpluses and
Sustainable Debt Levels in Emerging Market Countries.”IMF Policy
Discussion Paper, PDP/05/6.
[3] Abutaleb, A. and M., Hamad, 2010. “Optimal foreign Debt for
Egypt: A Stochastic Control Approach.”The Inauguration Conference for
Launching Information and Decision Support Center-Working Paper Series (IDSC-WPS),
held on Sunday 28 March 2010, In Cairo, Egypt.
[4] Akyiiz, Y., 2007.“Debt Sustainability in Emerging Markets: A
Critical Appraisal.” DESA Working Paper No. 61.
[5] Apergis, N. and A. Cooray, 2013. “New Evidence on the
Remedies of the Greek Sovereign Debt Problem.”HELLENIC OBSERVATORY
European Institute, GreeSE Paper No.79.
30
[6] Baldacci, E., S. Gupta, and C. Mulas-Granados, 2013. “Debt
Reduction, Fiscal Adjustment, and Growth in Credit-Constrained
Economics.” IMF Working Papers, WP/13/238.
[7] Baum, A., C. Checheritan and P. Rother, 2013. “ Debt and
Growth: New Evidence from the Euro Area.” Journal of International Money
and Finance, Vol.32, pp. 809-21.
[8] Becker, S., 2010. “Public debt in 2020, A sustainability
analysis for DM and EM economies.” Deutsche Bank Research, Current Issues.
[9] Buffie, E., A. Berg, C. Pattillo, R. Portillo, and L. Zanna,
2012. “Public Investments, Growth, and Debt Sustainability:
Putting Together the Pieces.” IMF Working Paper, WP/12/144.
[10] Chan-Lau, J.A and A.O. Santos, 2010. “Public Debt
Sustainability and Management in a Compound Option Framework.”
IMF working paper, WP/10/2.
[11] Di Bella, G., 2008. “A Stochastic Framework for Public Debt
Sustainability Analysis.” IMF Working Paper, WP/08/58.
[12] Eberhardt, M. and A. Presbitero, 2013. “This Time They Are
Different: Heterogeneity and Nonlinearity in the Relationship
Between Debt and Growth.” IMF Working Papers, WP/13/248.
[13] El-Mahdy, A. and N. Torayeh, 2009. “Debt Sustainability and
Economic Growth in Egypt.” International Journal of Applied Econometrics and
Quantitative Studies, Vol.6-1.
31
[14] Escolano, J., 2010. “A Practical Guide to Public Debt
Dynamics, Fiscal Sustainability, and Cyclical Adjustment of
Budgetary Aggregates.” IMF, Technical Notes and Manuals.
[15] Ghosh, A., J. Kim, E. Ostry, and M. Qureshi, 2011. “Fiscal
Fatigue, Fiscal Space and Debt Sustainability in Advanced
Economies.”NBER Working Papers, W16782.
[16] IMF, 2013. “Staff Guidance Note for Public Debt
Sustainability Analysis in Market- Access Countries.” IMF.
[17] IMF and the World Bank, 2012. “Revisiting the Debt
Sustainability Framework for Low-Income Countries.” IMF and the
World Bank.
[18] IMF and the World Bank, 2009. “Managing Public Debt:
Formulating Strategies and Strengthening Institutional Capacity.”
IMF and the World Bank.
[19] IMF and the World Bank, 2001. “Guidelines for Public Debt
Management.” IMF and the World Bank.
[20] Medeiros, J., 2012. “Stochastic debt simulation using VAR
models and a panel fiscal reaction function: results for a
selected number of countries.”European Commission, European Economy,
Economic Papers 459.
[21] Ostry, J., A. Ghosh, J.Kim, and M. Qureshi, 2010. “Fiscal
Space.” IMF Staff Position Note, SPN/10/11.
[22] Pescatori, A., D. Sandri, and J. Simon, 2014. “Debt and
Growth: Is There a Magic Threshold?” IMF Working Paper, WP/14/34.
32
[23] Reinhart, C. and K., Rogoff, 2013.”Financial and Sovereign
Debt Crises: Some Lessons Learned and Those Forgotten.”IMF Working
Paper, WP/13/266.
[24] Rienhart, C. and K. Rogoff, 2010.“Growth in a Time of Debt.”
American Economic Review: Papers & Proceedings, Vol. 100, No. 2, pp. 573-78.
[25] Reinhart, C., V.,Reinhart, and K. Rogoff, 2012.“Public Debt
Overhanges: Advance-Economy Episodes since 1800.” Journal of Economic
Perspectives, Vol. 29, No. 3, PP. 69-86.
[26] Spoek, P., 2011. “Testing the sustainability of the Croatian
public debt with dynamic models.” Privrednabanka Zagreb.
[27] Stoian, A., 2011. “A Simple Public Debt Dynamic Model for
Assessing Fiscal Vulnerability: Empirical Evidence for EU
Countries.”Macrothink Institute, Research in Applied Economics, Vol. 3, No.2 :E3.
[28] Tanner, E., and I. Samake, 2006. “Probabilistic
Sustainability of Public Debt: A Vector Autoregression Approach
for Brazil, Mexico, and Turkey.”IMF Working Paper, WP/06
33
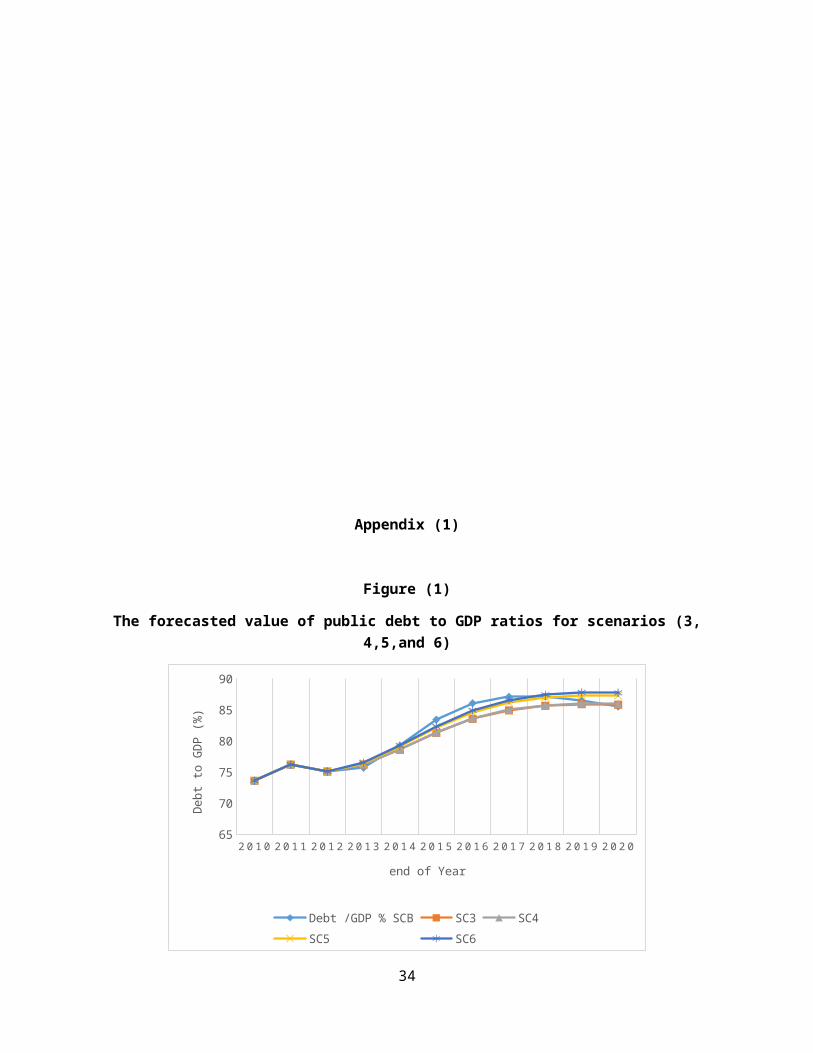
Appendix (1)
Figure (1)
The forecasted value of public debt to GDP ratios for scenarios (3,4,5,and 6)
2 0 1 0 2 0 1 1 2 0 1 2 2 0 1 3 2 0 1 4 2 0 1 5 2 0 1 6 2 0 1 7 2 0 1 8 2 0 1 9 2 0 2 065
70
75
80
85
90
Debt /GDP % SCB SC3 SC4SC5 SC6
end of Year
Debt to GDP (%)
34
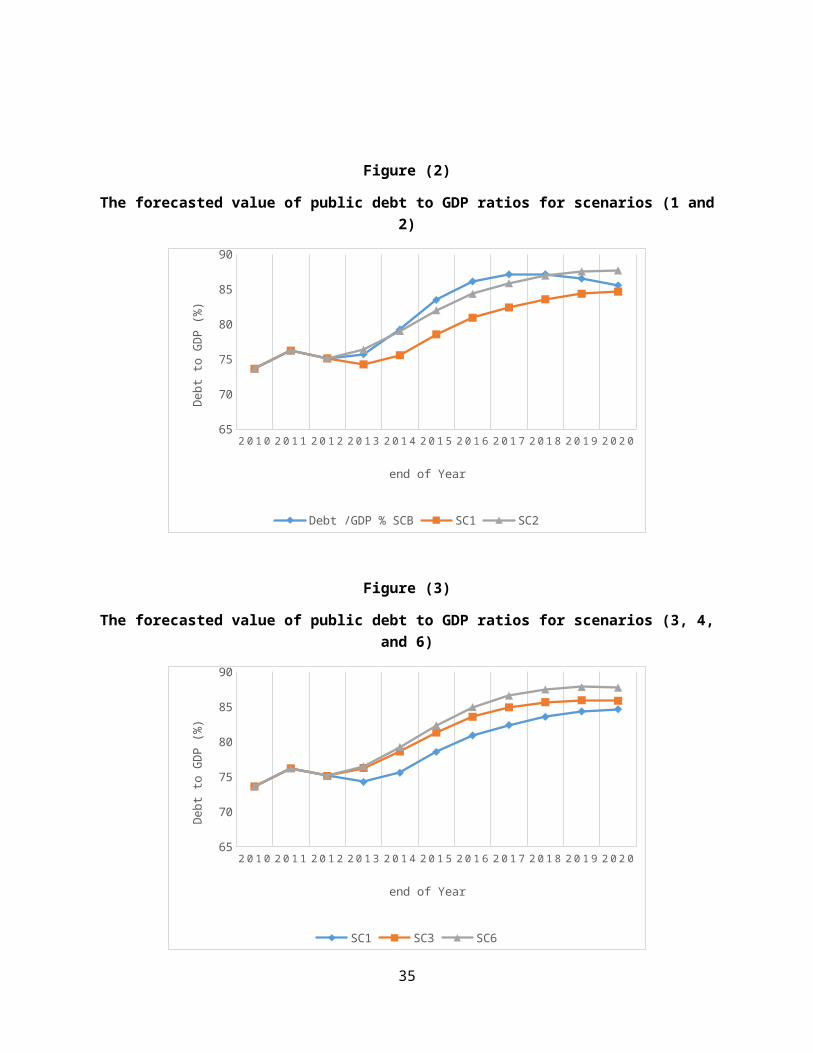
Figure (2)
The forecasted value of public debt to GDP ratios for scenarios (1 and2)
2 0 1 0 2 0 1 1 2 0 1 2 2 0 1 3 2 0 1 4 2 0 1 5 2 0 1 6 2 0 1 7 2 0 1 8 2 0 1 9 2 0 2 065
70
75
80
85
90
Debt /GDP % SCB SC1 SC2
end of Year
Debt to GDP (%)
Figure (3)
The forecasted value of public debt to GDP ratios for scenarios (3, 4,and 6)
2 0 1 0 2 0 1 1 2 0 1 2 2 0 1 3 2 0 1 4 2 0 1 5 2 0 1 6 2 0 1 7 2 0 1 8 2 0 1 9 2 0 2 065
70
75
80
85
90
SC1 SC3 SC6
end of Year
Debt to GDP (%)
35
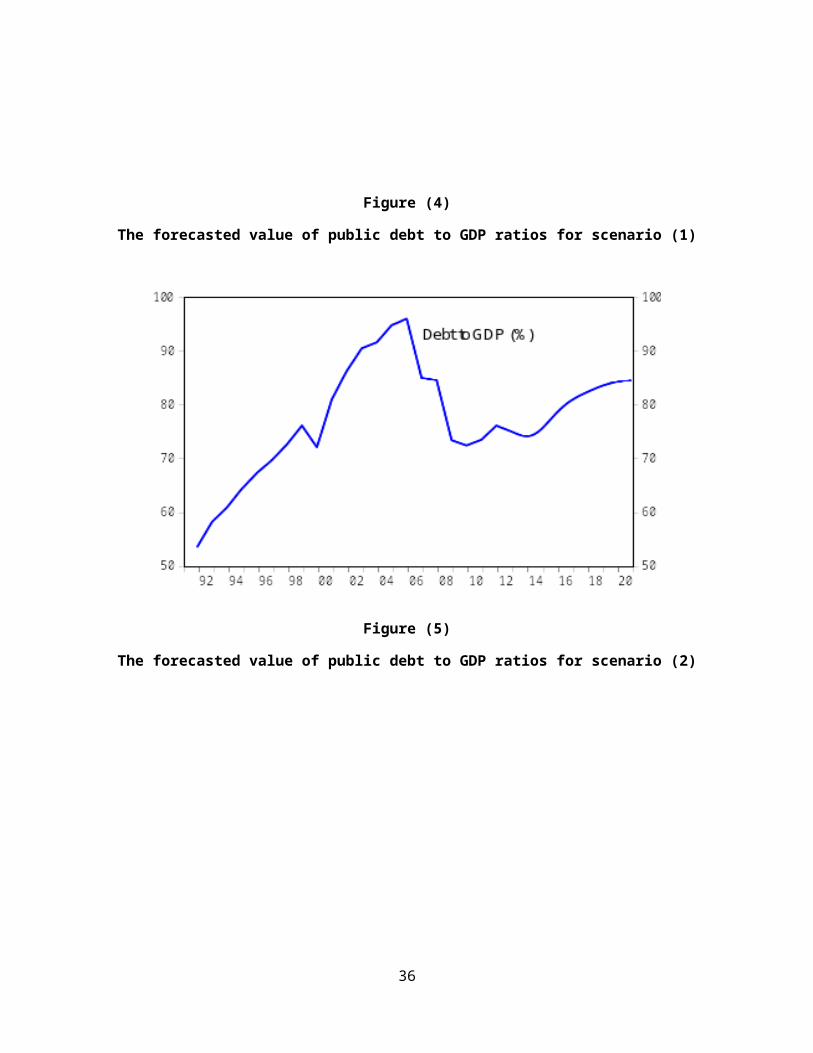
Figure (4)
The forecasted value of public debt to GDP ratios for scenario (1)
Figure (5)
The forecasted value of public debt to GDP ratios for scenario (2)
36
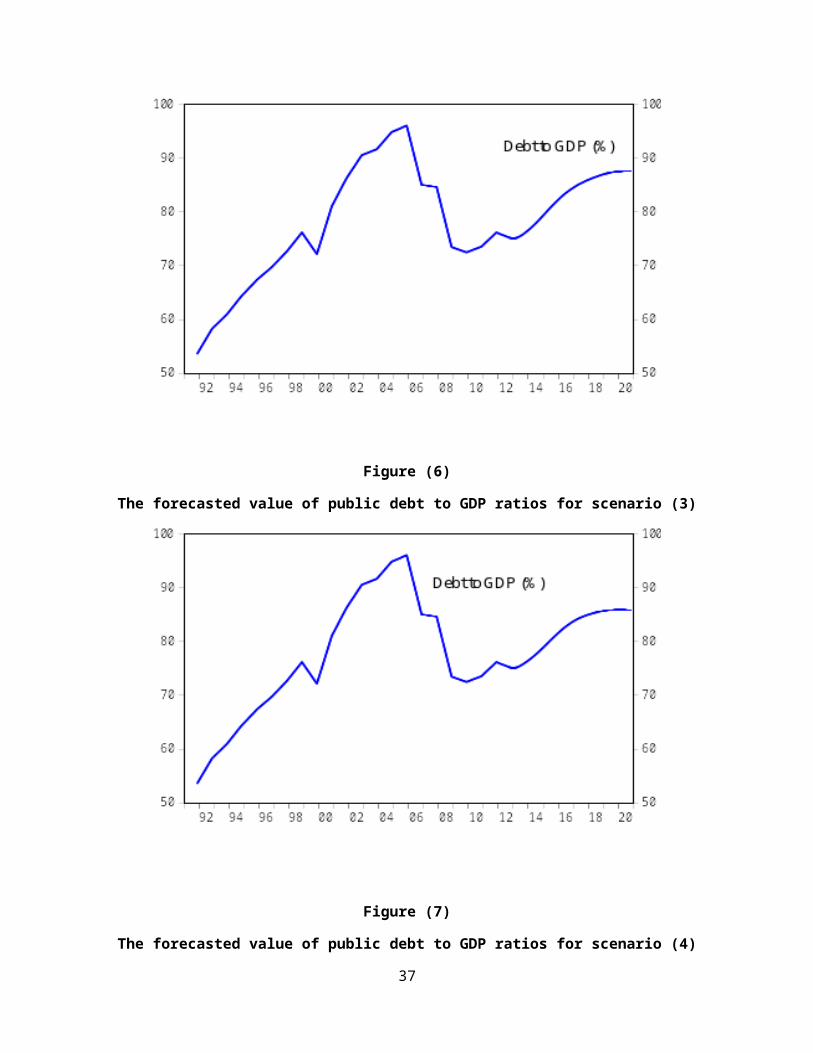
Figure (6)
The forecasted value of public debt to GDP ratios for scenario (3)
Figure (7)
The forecasted value of public debt to GDP ratios for scenario (4)
37
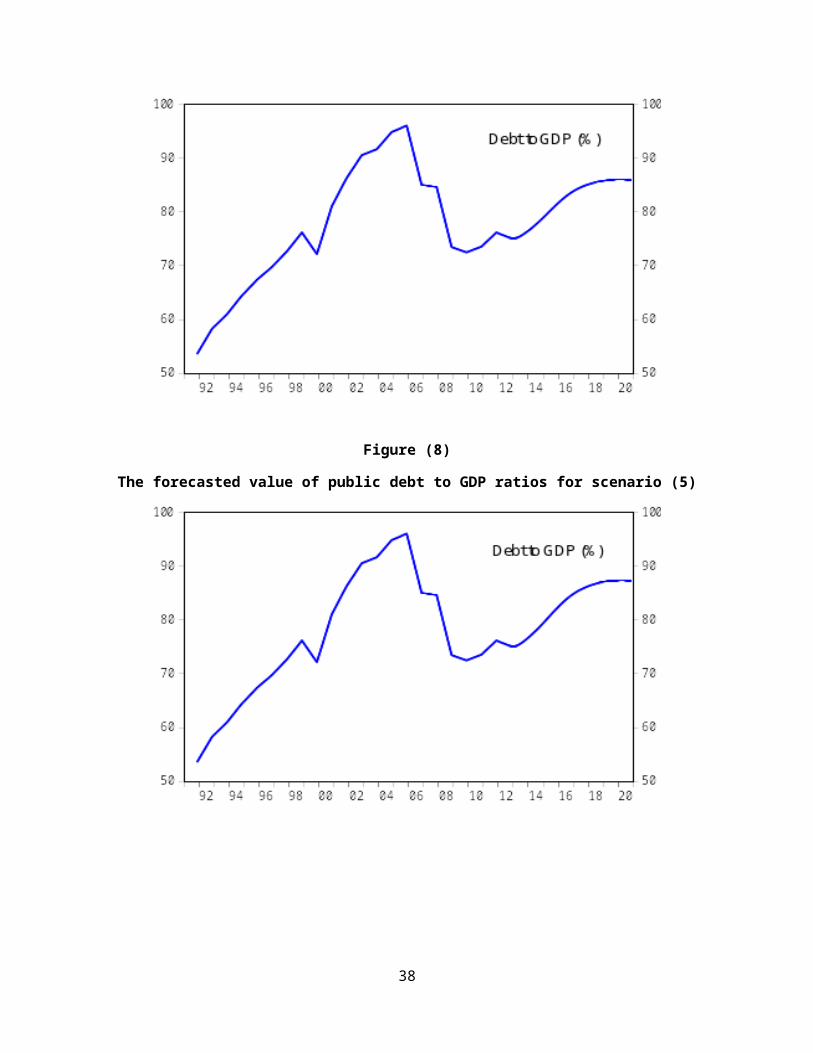
Figure (8)
The forecasted value of public debt to GDP ratios for scenario (5)
38
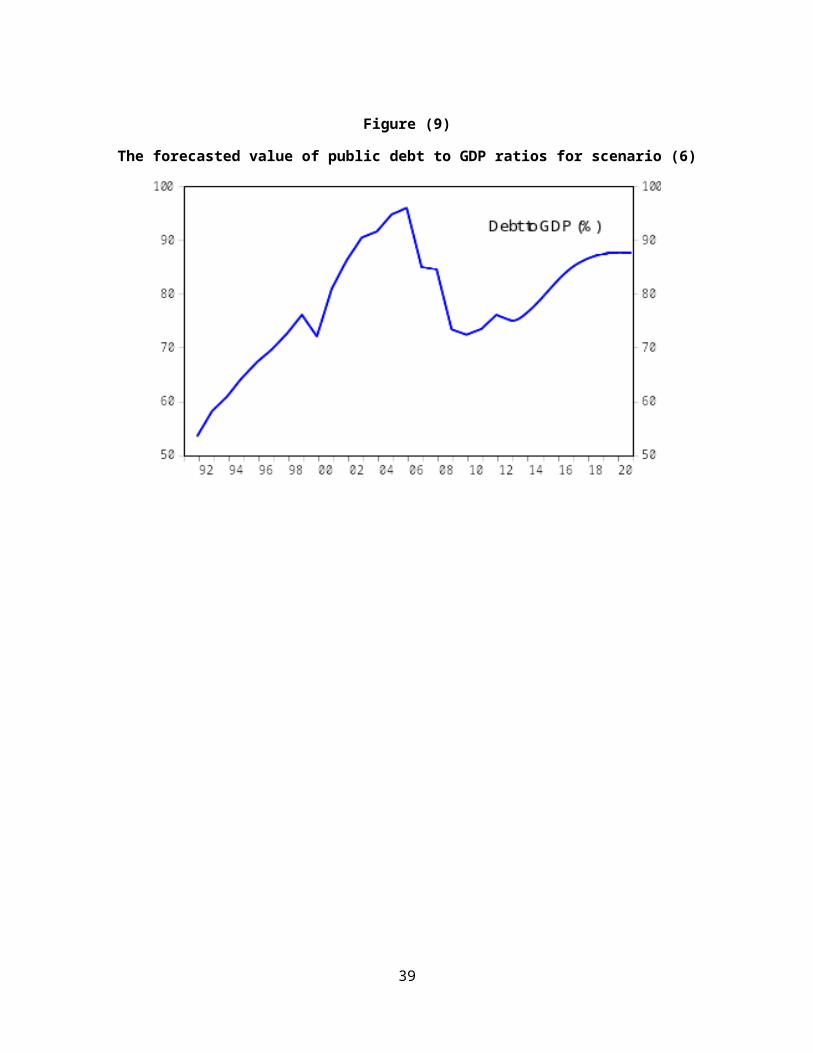
Figure (9)
The forecasted value of public debt to GDP ratios for scenario (6)
39