Embed Size (px)
Citation preview
Funded by:
KURT SALMON ASSOCIATES
Prepared by:
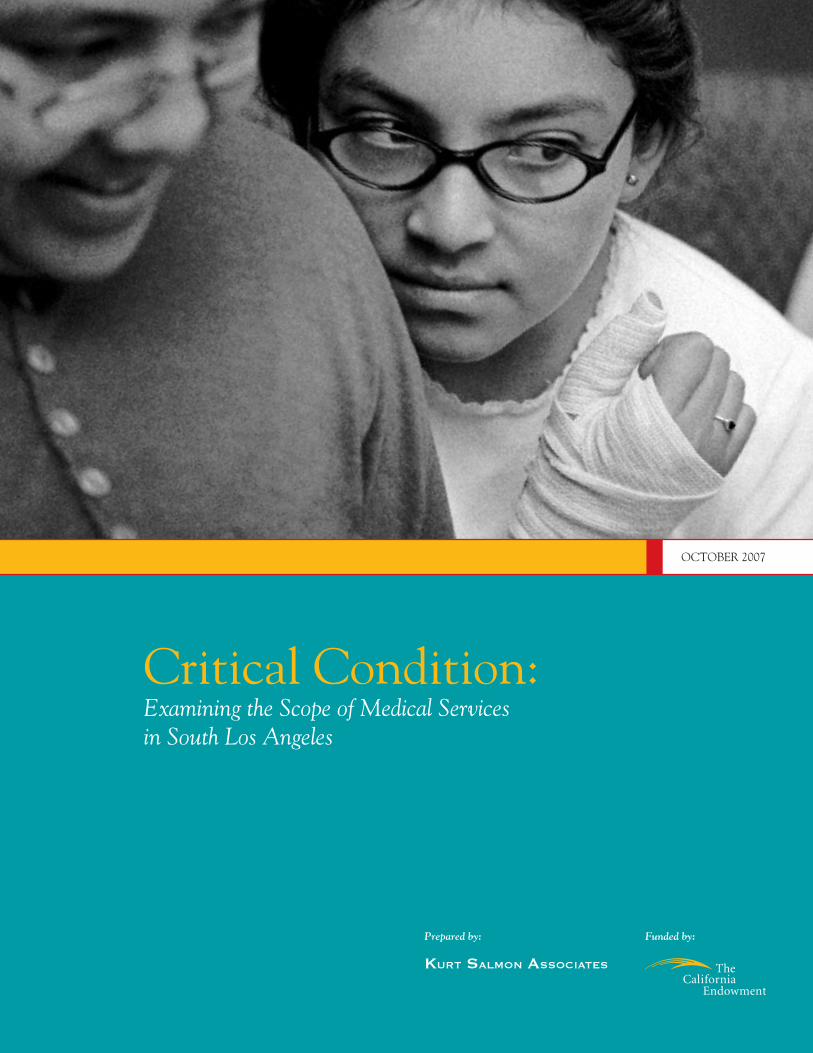
Critical Condition:Examining the Scope of Medical Servicesin South Los Angeles
OCTOBER 2007
The purpose of this report
is to strengthen our
collective understanding
of the health needs
of the residents of
South Los Angeles.
Foreword
The county’s decision to close Martin Luther King Jr.-Harbor Hospital, following several inspections
citing serious quality of care issues and the subsequent loss of federal funding, is a sad one for the people
of South Los Angeles and, indeed, the entire county.
It is particularly distressing because the establishment of a comprehensive teaching hospital in the heart
of this community, in 1972, represented such a pivotal change and hopeful moment. The hospital was a
major step to correct the health injustices cited by the McCone Commission, which was formed in the
wake of the 1965 L.A. riots, and issued the following statement as part of its findings:
“Statistics indicate that health conditions of the residents of south central Los Angeles are relatively poor and
facilities to provide medical care are insufficient… Life expectancies are considerably shorter… the number of
doctors in the southeastern part of Los Angeles is grossly inadequate as compared to other parts of the city…
The hospitals readily accessible to the citizens in southeastern Los Angeles are also grossly inadequate in quality
and in numbers of beds “
Today, more than four decades later, it is both regrettable and shameful that the Commission’s findings
sound so current. Based on virtually every indicator, the residents of South Los Angeles experience
worse health outcomes. Diabetes rates are 44% higher than elsewhere in the county, while HIV/AIDS
rates are 38% higher. A generation of young people is being lost in South L.A., as the infant mortality
rate is 20% higher than the county as a whole. And, South L.A. has the highest percentage of children
without health insurance in the county.
“Shallow understanding from people of good will is
more frustrating than absolute misunderstanding
from people of ill will.”– MARTIN LUTHER KING, JR.
LETTER FROM BIRMINGHAM JAIL, APRIL 1963
Foreword 3
4
Martin Luther King/Charles R. Drew Medical Center (subsequently renamed MLK Harbor Hospital)
was opened to help provide critically needed medical services. Unfortunately, the medical center has
lurched from crisis to crisis almost since the beginning as a result of poor medical care and a failure of
effective governance and oversight. In response, critical services have been reduced over the last several
years. First, the trauma center was closed. Then the residency programs that supported many specialty
services were eliminated. Sadly, the hospital was further downsized, until, most recently, the
ER was closed and all inpatient services terminated.
In March 2005, The California Endowment established a Steering Committee on the Future of King
Drew Medical Center made up of noted health experts. Following extensive consultation and analysis,
it issued a report that constituted a roadmap to enable the medical center to fulfill its original purpose.
In that report, the Committee issued several recommendations to reform both the hospital and Drew
University. Some of them were heeded; many were not.
Precipitated by the most recent sequence of events, and the ensuing discussions about the needs of the
community, The Endowment then commissioned an independent analysis of the health needs and
provider capacity of South Los Angeles. Kurt Salmon Associations (KSA), a consulting firm specializing
in hospital planning, compiled data from a broad range of sources to provide an accurate and holistic
portrayal of the health care infrastructure – as well as the needs – in South Los Angeles. This analysis
was designed to provide a common base of information upon which policymakers, health care providers,
advocates and health consumers can develop priorities for action.
Not unexpectedly, the analysis found that Service Planning Area (SPA) 6 in South Los Angeles is one
of the most underserved communities in the entire nation, with desperate health care challenges. The
findings paint an alarming picture of a broken health system that has failed to meet the needs of South
Los Angeles, even prior to the recent closure of the MLK-Harbor inpatient facility. They include:
Emergency and Trauma ServicesIn 2004, SPA 6 had the lowest number of emergency department treatment stations compared
to LA County and other geographic areas. The current capacity of 59 treatment stations is well
below the estimated need for between 100 and 150 stations.
Inpatient ServicesThe SPA 6 population is at risk for limited access to inpatient services based on analysis of
existing available beds. The estimated bed need, based on current utilization patterns, is more
Critical Condition: Examining the Scope of Medical Services in South Los Angeles
Foreword 5
than 2,000 beds. Yet, there are now only approximately 700 existing beds. South Los Angeles
has among the lowest number of beds per 1,000 residents in the nation.
Specialty CareSouth Los Angeles residents experience long wait times to see a specialist, which delays effective
diagnosis and treatment. Public-Private Partnerships, which provide primary care but must refer
patients to county facilities for specialty care, report average wait times of six months to one
year for specialty care.
These data, and others contained in this report, should not numb us into inaction. On the contrary,
the analysis demonstrates that we must immediately re-think how to address these unmet needs.
Forty-two years have taught us, at a minimum, that this community requires a comprehensive hospital
that delivers high-quality care. Moreover, as this analysis documents, the community also needs greater
access to specialty services and better integration of primary care with mental health, public health, and
specialty care. These would be significant improvements and represent the core set of services needed for
a functioning health care infrastructure.
At the same time, to truly improve the health of South Los Angeles residents, we must also commit
to addressing the broader social determinants – such as economic opportunities, education, safety
and nutrition – that significantly contribute to a community’s overall health status. Responding to
the inpatient and specialty care needs, as outlined in this report, is a critical first step, but it cannot
be the only step. We will fail again if we convince ourselves that we can stop there.
From the standpoint of the McCone Commission and those who fought to open a medical center
in South Los Angeles, the plight of the King-Harbor hospital represents a dream deferred, to use
the famous words of poet Langston Hughes. This time we must do better and achieve the goal of a
healthy community.
Sincerely,
Robert K. Ross, M.D.President and CEO
The California Endowment

To assess if we are
meeting the medical needs
of the SPA 6 population
we have developed three
categories of assessment:
Service Area and Target
Population, Health Care
Services, Subsets of the
Targeted Population.
Table of Contents
Part 1 10Summary of Key Findings
Part 2 20Service Area and Target Population
Part 3 28Health Care Services
Part 4 58Subsets of the Targeted Population
Part 5 68Appendix
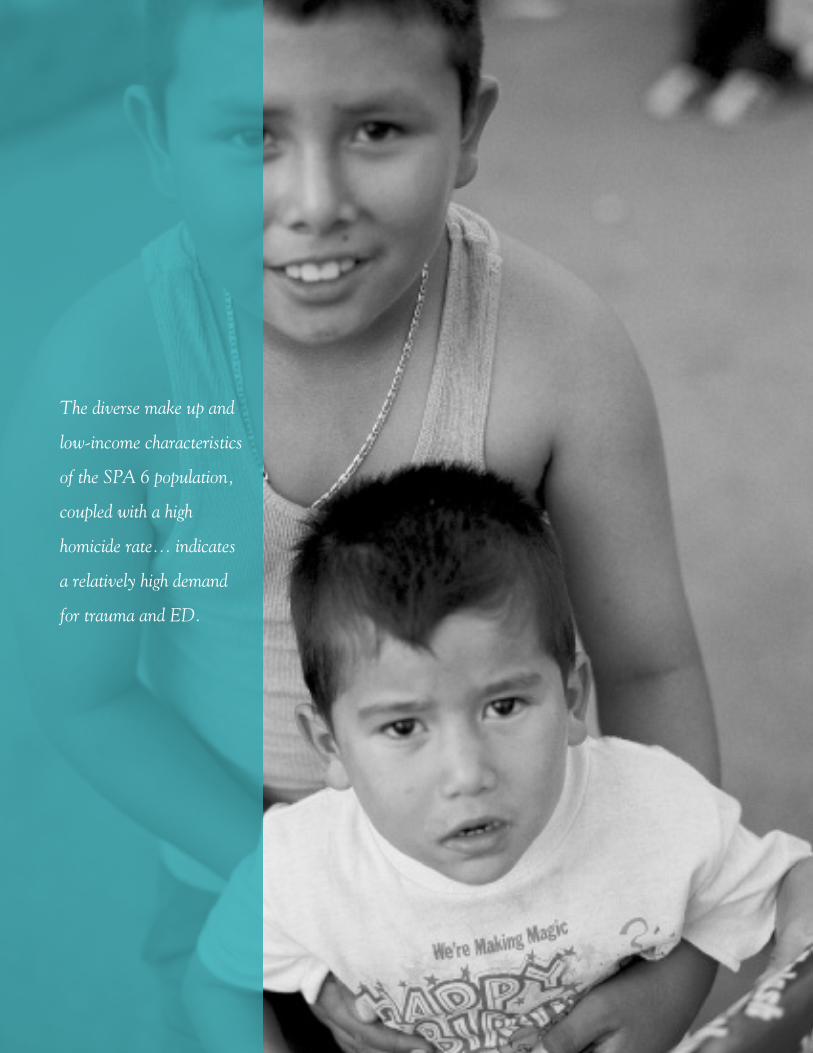
The diverse make up and
low-income characteristics
of the SPA 6 population,
coupled with a high
homicide rate... indicates
a relatively high demand
for trauma and ED.
Trauma and Emergency Services 11
Acute Care 11
Ambulatory Care 12
Post Acute Care 12
Public Health 13
Target Population 13
Women and Children 14
Mental Health 14
Chronic Disease and the Elderly 15
Recommendations for Next Steps 15
Part 1Summary of Key Findings
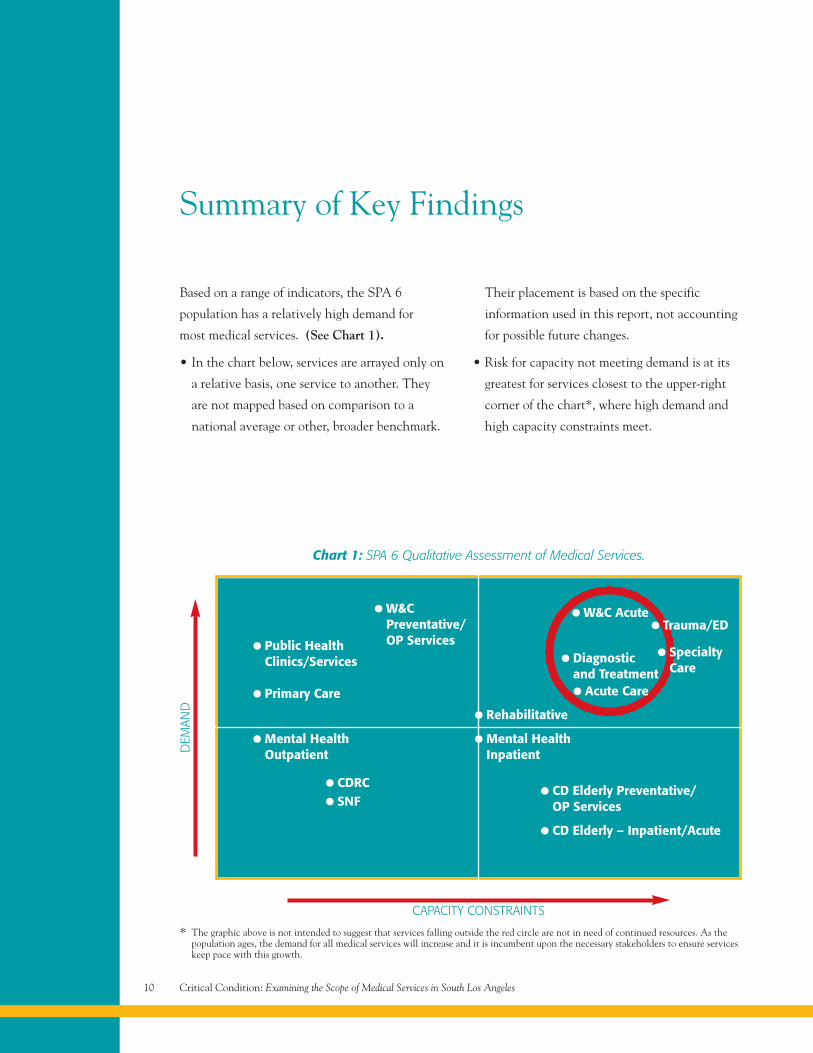
Chart 1: SPA 6 Qualitative Assessment of Medical Services.
• Public HealthClinics/Services
• Primary Care
• W&CPreventative/OP Services
• Mental HealthOutpatient
• CDRC• SNF
• Rehabilitative• Mental HealthInpatient
• CD Elderly Preventative/OP Services
• CD Elderly – Inpatient/Acute
• Acute Care
• Diagnosticand Treatment
• W&C Acute• Trauma/ED
• SpecialtyCare
CAPACITY CONSTRAINTS
DEM
AND
* The graphic above is not intended to suggest that services falling outside the red circle are not in need of continued resources. As thepopulation ages, the demand for all medical services will increase and it is incumbent upon the necessary stakeholders to ensure serviceskeep pace with this growth.
Critical Condition: Examining the Scope of Medical Services in South Los Angeles10
Summary of Key Findings
Based on a range of indicators, the SPA 6
population has a relatively high demand for
most medical services. (See Chart 1).
• In the chart below, services are arrayed only on
a relative basis, one service to another. They
are not mapped based on comparison to a
national average or other, broader benchmark.
Their placement is based on the specific
information used in this report, not accounting
for possible future changes.
• Risk for capacity not meeting demand is at its
greatest for services closest to the upper-right
corner of the chart*, where high demand and
high capacity constraints meet.
Part 1 – Summary of Key Findings 11
Trauma and Emergency ServicesThe diverse make up and low-income
characteristics of the SPA 6 population,
coupled with a high homicide rate [a proxy
for overall violence] indicates a relatively
high demand for trauma and ED.
• These findings are consistent with the Kurt
Salmon Associates/California HealthCare
Foundation study that identified populations
in south central and southeast LA to be most
at risk for limited access to ED and trauma.
• In 2004-2005 there was 1 trauma center
(St. Francis) and 2 hospital EDs (King/Harbor
and St. Francis) to serve the population of SPA 6.
• SPA 6 had the lowest number of ED treatment
stations per 100,000 compared to LAC and
other SPAs.
• There are 2 additional trauma centers (USC
and Harbor/UCLA) and 18 hospitals with
emergency services located within the 10-mile
radius surrounding SPA 6.
• Access to trauma units is crucial for victims of
violent crimes. The time allotted to reach a
trauma center is 30 minutes. The urban sprawl
and traffic patterns in LAC may impede quick
access to these services.
Implication
For truly emergent cases, quick access
to trauma and ED services is crucial
for the SPA 6 population.
Acute CareThe SPA 6 population is at risk for limited
access to inpatient services based on analysis
of existing available beds.
• In 2005, residents in SPA 6 were the highest
users of inpatient services compared to LA
County and CA (107 discharges/1,000 in
SPA6 vs. 101 discharges/1,000 in CA).
— SPA 6 use rates were comparable to
populations with similar characteristics
(e.g. LA Co. and San Bernardino Co.).
• Demand for services in SPA 6 is comparable to
the state of CA, with slight differences that
likely reflect the demographic profile of SPA 6.
— Highest demand is for Women and
Children services.
• Estimated bed need in SPA 6, based on current
utilization patterns, is over 2,000 beds (existing
beds ~ 1,000).
— The actual needs of the population
(defined as access to an available bed)
may differ from demand estimates
suggesting that we may be
underestimating the true bed need.
Implication
Inpatient demand may be met in the
short-term, however, population growth
will increase use of and demand for
these services in the future.
Critical Condition: Examining the Scope of Medical Services in South Los Angeles12
Ambulatory CareThe SPA 6 population has significant needs for
all ambulatory/outpatient services.
• Despite indications to the contrary, ~40% of
the population in SPA 6 does not have a usual
source of care.
— Compared to other SPAs, SPA 6 had
the 2nd highest number of clinics per
population (as reported by OSHPD), but
many of the PPP clinics are closed to new
patients because of capacity constraints.
• The SPA 6 population has a higher need for
specialty services compared to LA County.
— Individuals in SPA 6 reported a higher
percentage of asthma, diabetes and
hypertension compared to LA County.
— ~ 50% of people had to wait a month or
more to see a specialist.
— There is a clear shortage of outpatient
specialty clinics in SPA 6 including
outpatient rehab and surgery (possible
exception is dialysis centers).
— Only 2 hospitals offer diagnostics and
treatment modalities.
• Further research will be needed to assess the
dental needs of SPA 6 population.
Implication
As the demand for ambulatory care continues to
increase, the SPA 6 population is currently most
at risk for an inadequate supply of specialty care
and D&T services.
Post-Acute CareFor the SPA 6 population, all post-acute care
services (Rehab, Skilled Nursing Facilities, and
Chemical Dependency Recovery Centers) are
in high demand. As the population ages, the
demand for these services will only increase.
• There are no designated inpatient or outpatient
rehabilitative facilities in SPA 6.
— In 2005, LAC/Rancho had reported
occupancy of ~70% suggesting available
capacity in surrounding areas. Rehab
services are also available at four acute
care facilities in SPA 6.
• There are 2 Skilled Nursing Facilities in SPA 6
and 13 SNFs in the surrounding 10-mile radius.
— Trends show a decline in discharges from
2002 to 2005 with the highest users
being the 65 and over age cohort.
— In 2005, over 80% of SNF discharges
generated by SPA 6 residents took place
at facilities located outside of SPA 6.
• Data suggest the demand for outpatient/
preventative care CDRCs may be higher
for than CDRC inpatient services.
Part 1 – Summary of Key Findings 13
— SPA 6 appears to have more CDRC-
related outpatient clinics than expected
when compared to other SPAs.
Implication
Current capacity for Rehab and SNF appear to be
meeting the demands of the population in the
short-term; however, the true need for these services
remains to be determined. Existing CDRC clinics
may offer the opportunity for additional outreach
and preventative care.
Public HealthHealth status, preventative health and health
outcome indicators suggest SPA 6 is in greater
need of public health services than other areas
in LA County.
• Several, comprehensive studies have been
conducted on public health issues. This assessment
draws from all studies, isolating only a few key
indicators to show demand for public health
services. We offer citations for the detailed
studies for those wanting additional information.
• Though the SPA 6 population is worse off than
national and state averages for several public
health access indicators, evidence of significant
overall health improvements have appeared in
the last few years of available data.
• 37 Primary Care and Public Health clinics are
available in SPA 6 to provide preventative or
public health services.
• A large percentage of the clinics offer
community services, especially in areas
affecting public health (e.g., education,
nutrition, outreach, and social services).
Implication
Given the diverse population and resultant
differences in utilization of services, determining
whether or not public health clinics are meeting
the needs of the population remains a challenge.
One approach to address this question may be to
survey the population on public health issues
including access to and quality of care received.
Short-term opportunities may include additional
outreach and education around existing public
health resources.
Target PopulationThe SPA 6 population is young, growing, and
diverse with a higher proportion of low-income
and uninsured residents compared to other
LAC areas.
• The population in SPA 6 is estimated to
grow 1.3% per year over the next few years
(higher than U.S. average of ~1.0%).
— 75% of the population is under 45
suggesting a need for OB/GYN,
Trauma/ED, and Public/Preventative Care.
— While only 8% of the population is 65
and over, this population is forecasted to
grow 2.5% or more the next several years
Critical Condition: Examining the Scope of Medical Services in South Los Angeles14
implying a need for cardiac, cancer, ortho
and chronic disease services.
• The SPA 6 population has a more diverse
population compared to LA County and the
US (~ 70% non-white and over 50% Hispanic).
— Different ethnicities have been shown to
have a higher level of health disparities
suggesting the need for a wider range of
medical services.
• Approximately 60% of the SPA 6 population
relies on Medi-Cal or “Other” (e.g., self pay)
reimbursement or are indigent. In addition,
SPA 6 has the lowest average per capita income
compared to other SPAs and LAC ($11,000
SPA 6 vs. $26,000 LAC).
— Under-and uninsured, low-income
populations often are more at risk
for access to medical services.
Implication
SPA 6 population and demographics indicate a
high demand for a wide range of medical services.
The resulting impact may be a higher demand
on the County/Community to ensure access to
County hospitals and clinics for SPA 6 residents.
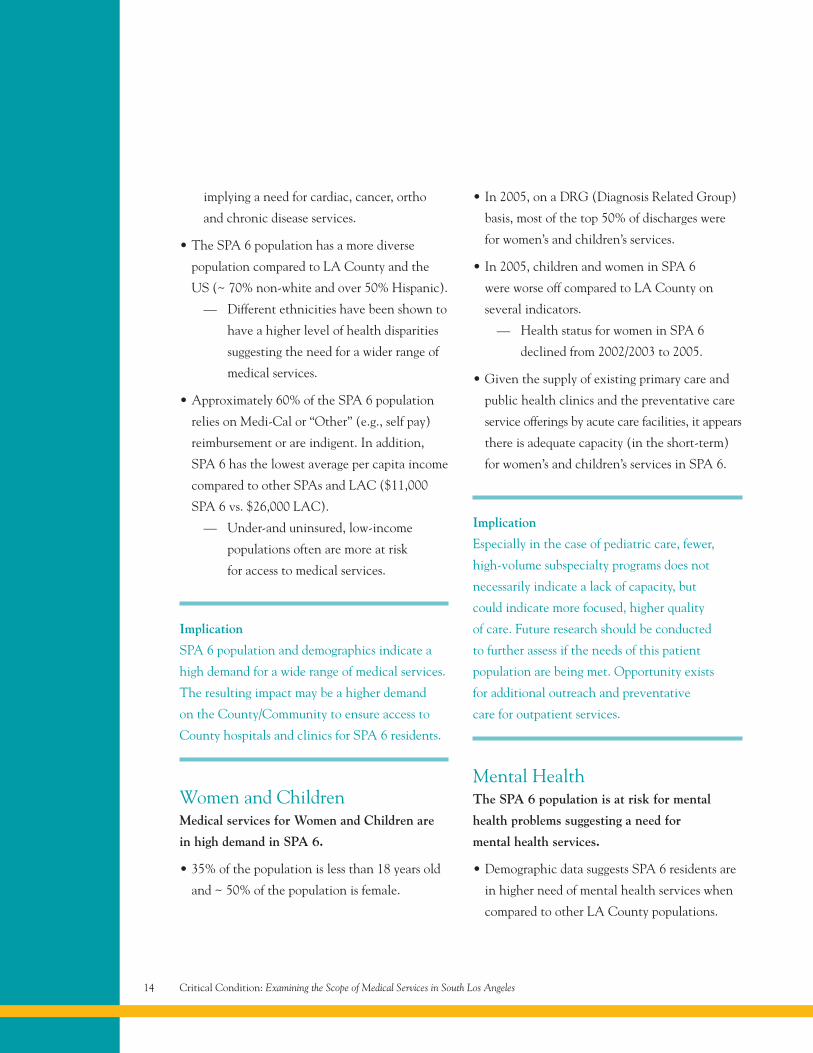
Women and ChildrenMedical services for Women and Children are
in high demand in SPA 6.
• 35% of the population is less than 18 years old
and ~ 50% of the population is female.
• In 2005, on a DRG (Diagnosis Related Group)
basis, most of the top 50% of discharges were
for women’s and children’s services.
• In 2005, children and women in SPA 6
were worse off compared to LA County on
several indicators.
— Health status for women in SPA 6
declined from 2002/2003 to 2005.
• Given the supply of existing primary care and
public health clinics and the preventative care
service offerings by acute care facilities, it appears
there is adequate capacity (in the short-term)
for women’s and children’s services in SPA 6.
Implication
Especially in the case of pediatric care, fewer,
high-volume subspecialty programs does not
necessarily indicate a lack of capacity, but
could indicate more focused, higher quality
of care. Future research should be conducted
to further assess if the needs of this patient
population are being met. Opportunity exists
for additional outreach and preventative
care for outpatient services.
Mental HealthThe SPA 6 population is at risk for mental
health problems suggesting a need for
mental health services.
• Demographic data suggests SPA 6 residents are
in higher need of mental health services when
compared to other LA County populations.
Part 1 – Summary of Key Findings 15
• Conflicting data regarding inpatient use:
In 2005, only 26% of SPA 6 residents received
MH treatment at SPA 6 facilities.
— Patients are currently taken to other
facilities due to lack of available beds
in SPA 6.
— In contrast, using 2005 inpatient use
rates, the demand for psych beds was
~241 beds. In 2005, the total number
of psych beds available was 262
(includes King/Harbor) suggesting
a surplus of beds available.
• There are at least 32 outpatient facilities
available to treat MH patients. An additional
12 facilities are available within a 10-mile
radius from SPA 6.
Implication
Despite existing bed capacity, access to an
available bed appears to be the real issue.
Additional research is needed to further assess
the mental health needs (as opposed to demand)
of the SPA 6 population. Opportunities exist to
educate the population regarding mental health
conditions and available resources.
Chronic Disease and the ElderlyAlthough SPA 6 has a young demography,
the 65-and-over population drives much
of the demand for and use of medical services.
• The 65-and-over SPA 6 population represents
the smallest percentage of the population
(~8%), however, this cohort represents the
highest users of services and is estimated to
grow ~2.5% per year over the next few years.
• 11 out of 27 hospitals report having senior
wellness/geriatric programs within a 10-mile
radius of SPA 6.
• The subset of the population itself – Chronic
Disease and Elderly – has an expected demand
for ~700 inpatient beds, which represents 70%
of existing SPA 6 beds (~1,000 beds).
Implication
As the population ages the demand for these
services will continue to increase. Additional
research may be required in this area. Based on
information available, this population could be
at risk for access to inpatient and outpatient
services in the future.
Recommendations for Next StepsFactoring in the challenges with the findings
throughout this assessment, the following are
suggested recommendations for next steps:
Recommendation #1:
• Work towards compiling all data in a
central location.
Recommendation #2:
• In drawing conclusions and making
related decisions, quantitative data must
be combined with qualitative data.
Critical Condition: Examining the Scope of Medical Services in South Los Angeles16
• Continue to advance data collection methods
with a focus on capturing real-time information
(e.g., train staff, invest in technology, etc.)
and filling in gaps that would allow us to
better assess the community’s overall health.
Recommendation #3:
• Maintain the role of the Advisory Group
for continuity and communication.
• Seek out additional feedback to gain a
community perspective.
Recommendation #4:
• Learn from current successes and build upon
existing SPA 6 community assets.
In KSA’s review of a variety of materials, the
following statement captures a long-term vision
for addressing the unmet health care needs of the
South Los Angeles community that will require
long-term, sustained commitment:
To move forward on improving the health
status of low-income, uninsured South L.A.
residents, we should re-envision the fragmented
safety net system to address the changing
demographics and tremendous unmet health
needs in the community. Based on data
presented and input from community
experts, primary care, public health and
mental health should be integrated to create
a population-based, chronic disease-focused
model of health care delivery.
Sources: [1] LACDHS, The L.A. County Medicaid Demonstration Project (Section 1115): Stabilizing the Safety Net: 1995-2005 (June 2005).[2] Leong D, The Power of Partnerships: Solutions Created and Lessons Learned by the Public Private Partnership Program, CommunityClinic Association of Los Angeles County (May 2005).[3] LACDHS Office of Ambulatory Care, Public-Private Partnership (PPP) Program– Clinic Status (June 18, 2007). Accessed at www.ladhs.org/ambcare/patients/pdf/clinicstatuslist.pdf. [4] Southside Coalition of CommunityHealth Centers, Early Diagnostic and Invention Center (2007).
Current SPA 6 SuccessesThe Public-Private Partnership program (PPPs) has proven itself to offer efficient, coordinated,high-quality and cost-effective ambulatory care to the county’s vulnerable patient population.It allowed LACDHS to increase the number of primary care access points, improve geographicaccess to services in areas of high need, and provide better care and management of patientswith chronic conditions such as diabetes and high cholesterol. [1], [2] These disease managementinitiatives served as the basis for the county’s recently awarded $54 million Coverage Initiative,Healthy Way LA. [3]
The Southside Coalition of Community Health Centers has partnered with Orthopaedic Hospital todevelop the clinical footprint for specialty care that will complement the county’s existing deliverysystem. Starting in January 2007, podiatry has been piloted. To date, nearly 150 patients have beenprovided podiatry services with waiting times reduced to an average of two weeks as compared to3 to 6 months previously. [4]
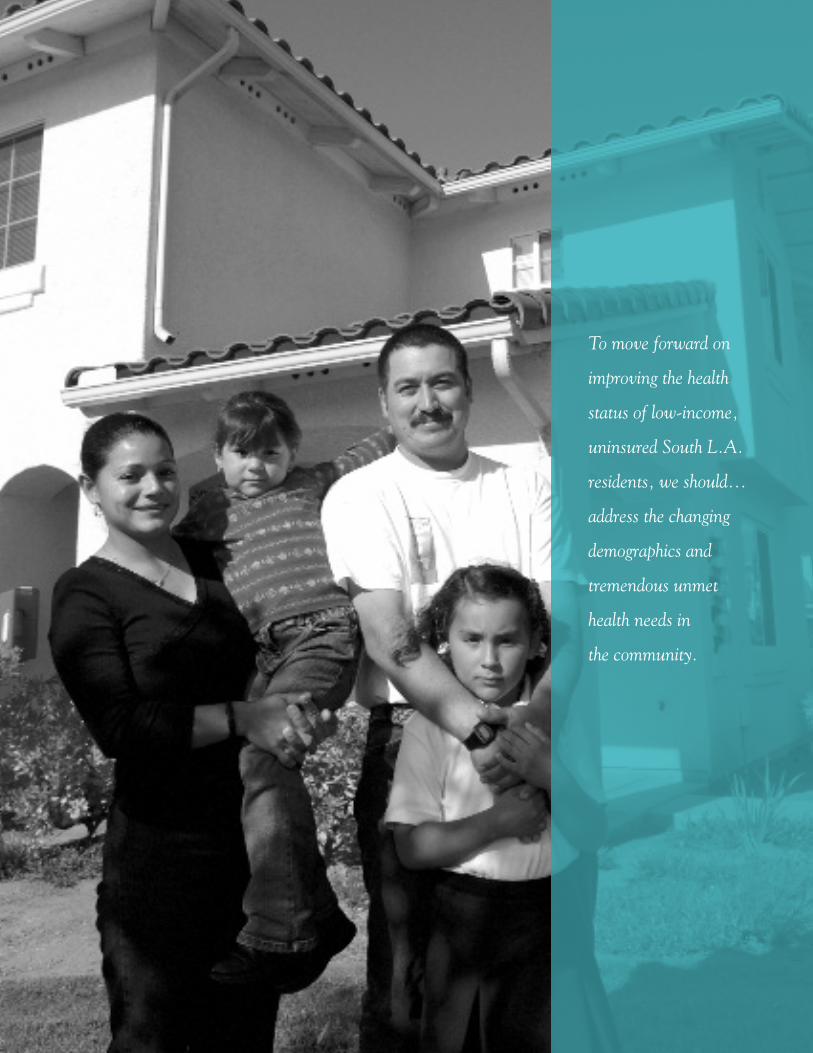
To move forward on
improving the health
status of low-income,
uninsured South L.A.
residents, we should...
address the changing
demographics and
tremendous unmet
health needs in
the community.
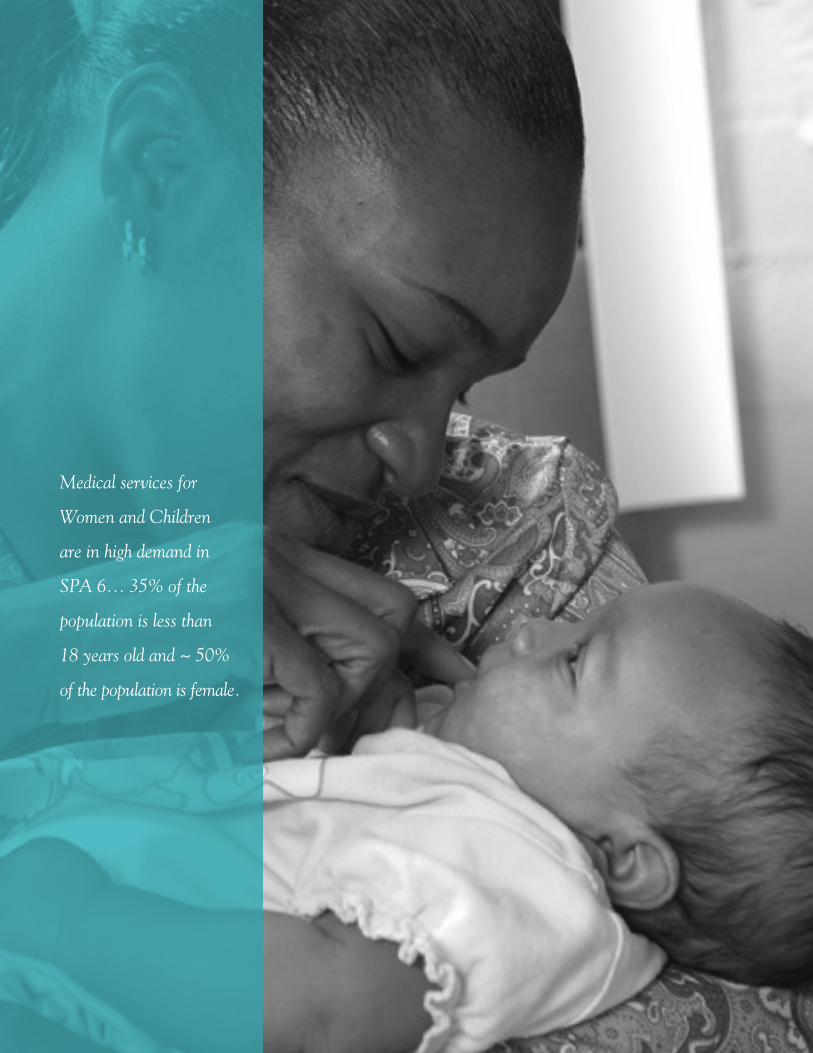
Medical services for
Women and Children
are in high demand in
SPA 6... 35% of the
population is less than
18 years old and ~ 50%
of the population is female.
Definition of South Los Angeles 20
Geographic Definition of Analyses 21
Rationale 21
Characteristics of the Population 22
Change in Population 23
Self Reported Health Status 23
Racial and Ethnic Groups 24
Insurance Status 24
Uninsured by SPA 24
Income 24
Part 2Service Area andTarget Population
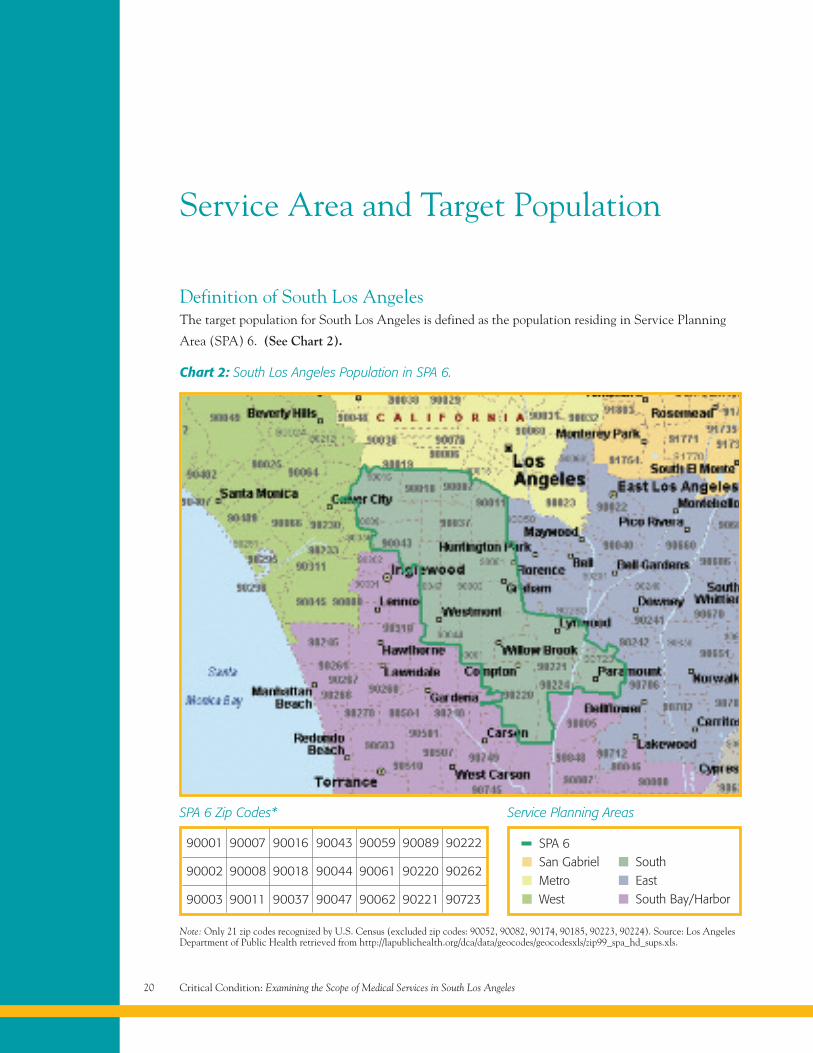
Definition of South Los AngelesThe target population for South Los Angeles is defined as the population residing in Service Planning
Area (SPA) 6. (See Chart 2).
Chart 2: South Los Angeles Population in SPA 6.
SPA 6San GabrielMetroWest
SouthEastSouth Bay/Harbor
Note: Only 21 zip codes recognized by U.S. Census (excluded zip codes: 90052, 90082, 90174, 90185, 90223, 90224). Source: Los AngelesDepartment of Public Health retrieved from http://lapublichealth.org/dca/data/geocodes/geocodesxls/zip99_spa_hd_sups.xls.
Service Area and Target Population
Service Planning AreasSPA 6 Zip Codes*
Critical Condition: Examining the Scope of Medical Services in South Los Angeles20
90001
90002
90003
90007
90008
90011
90016
90018
90037
90043
90044
90047
90059
90061
90062
90089
90220
90221
90222
90262
90723
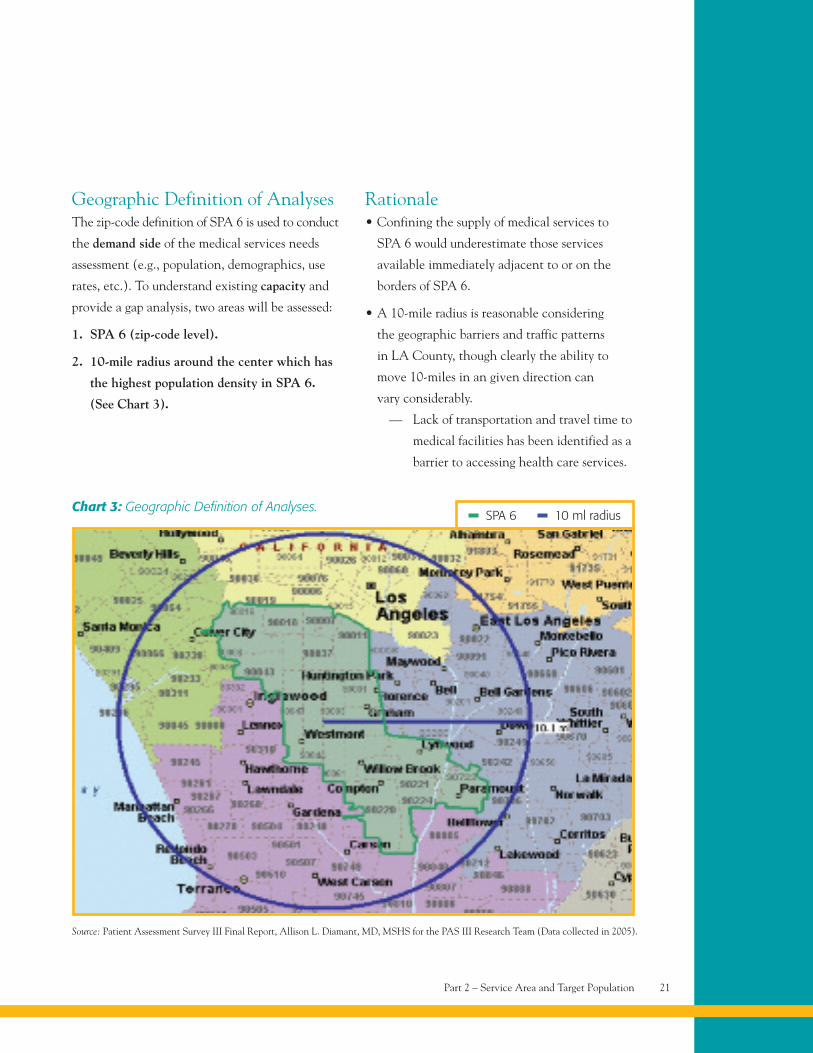
Geographic Definition of AnalysesThe zip-code definition of SPA 6 is used to conduct
the demand side of the medical services needs
assessment (e.g., population, demographics, use
rates, etc.). To understand existing capacity and
provide a gap analysis, two areas will be assessed:
1. SPA 6 (zip-code level).
2. 10-mile radius around the center which has
the highest population density in SPA 6.
(See Chart 3).
Rationale• Confining the supply of medical services to
SPA 6 would underestimate those services
available immediately adjacent to or on the
borders of SPA 6.
• A 10-mile radius is reasonable considering
the geographic barriers and traffic patterns
in LA County, though clearly the ability to
move 10-miles in an given direction can
vary considerably.
— Lack of transportation and travel time to
medical facilities has been identified as a
barrier to accessing health care services.
Chart 3: Geographic Definition of Analyses.SPA 6 10 ml radius
Source: Patient Assessment Survey III Final Report, Allison L. Diamant, MD, MSHS for the PAS III Research Team (Data collected in 2005).
Part 2 – Service Area and Target Population 21
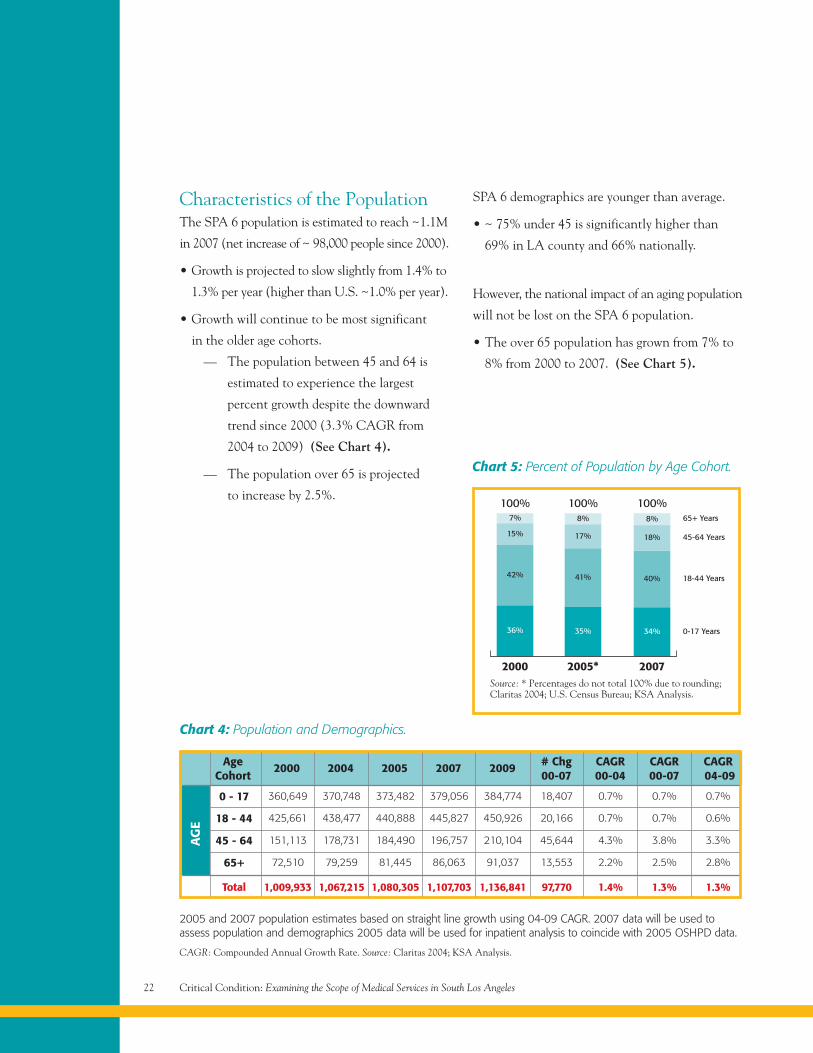
Chart 4: Population and Demographics.
CAGR: Compounded Annual Growth Rate. Source: Claritas 2004; KSA Analysis.
2005 and 2007 population estimates based on straight line growth using 04-09 CAGR. 2007 data will be used toassess population and demographics 2005 data will be used for inpatient analysis to coincide with 2005 OSHPD data.
0 - 17 360,649 370,748 373,482 379,056 384,774 18,407 0.7% 0.7% 0.7%
18 - 44 425,661 438,477 440,888 445,827 450,926 20,166 0.7% 0.7% 0.6%
45 - 64 151,113 178,731 184,490 196,757 210,104 45,644 4.3% 3.8% 3.3%
65+ 72,510 79,259 81,445 86,063 91,037 13,553 2.2% 2.5% 2.8%
Total 1,009,933 1,067,215 1,080,305 1,107,703 1,136,841 97,770 1.4% 1.3% 1.3%
AgeCohort
2000 2004 2005 2007 2009 # Chg00-07
CAGR00-04
CAGR00-07
CAGR04-09
AGE
Critical Condition: Examining the Scope of Medical Services in South Los Angeles22
Characteristics of the PopulationThe SPA 6 population is estimated to reach ~1.1M
in 2007 (net increase of ~ 98,000 people since 2000).
• Growth is projected to slow slightly from 1.4% to
1.3% per year (higher than U.S. ~1.0% per year).
• Growth will continue to be most significant
in the older age cohorts.
— The population between 45 and 64 is
estimated to experience the largest
percent growth despite the downward
trend since 2000 (3.3% CAGR from
2004 to 2009) (See Chart 4).
— The population over 65 is projected
to increase by 2.5%.
SPA 6 demographics are younger than average.
• ~ 75% under 45 is significantly higher than
69% in LA county and 66% nationally.
However, the national impact of an aging population
will not be lost on the SPA 6 population.
• The over 65 population has grown from 7% to
8% from 2000 to 2007. (See Chart 5).
2000
100%7%
15%
42%
36%
2005*
100%8%
17%
41%
35%
2007
100%8%
40%
34%
65+ Years
45-64 Years
18-44 Years
0-17 Years
18%
Chart 5: Percent of Population by Age Cohort.
Source: * Percentages do not total 100% due to rounding;Claritas 2004; U.S. Census Bureau; KSA Analysis.
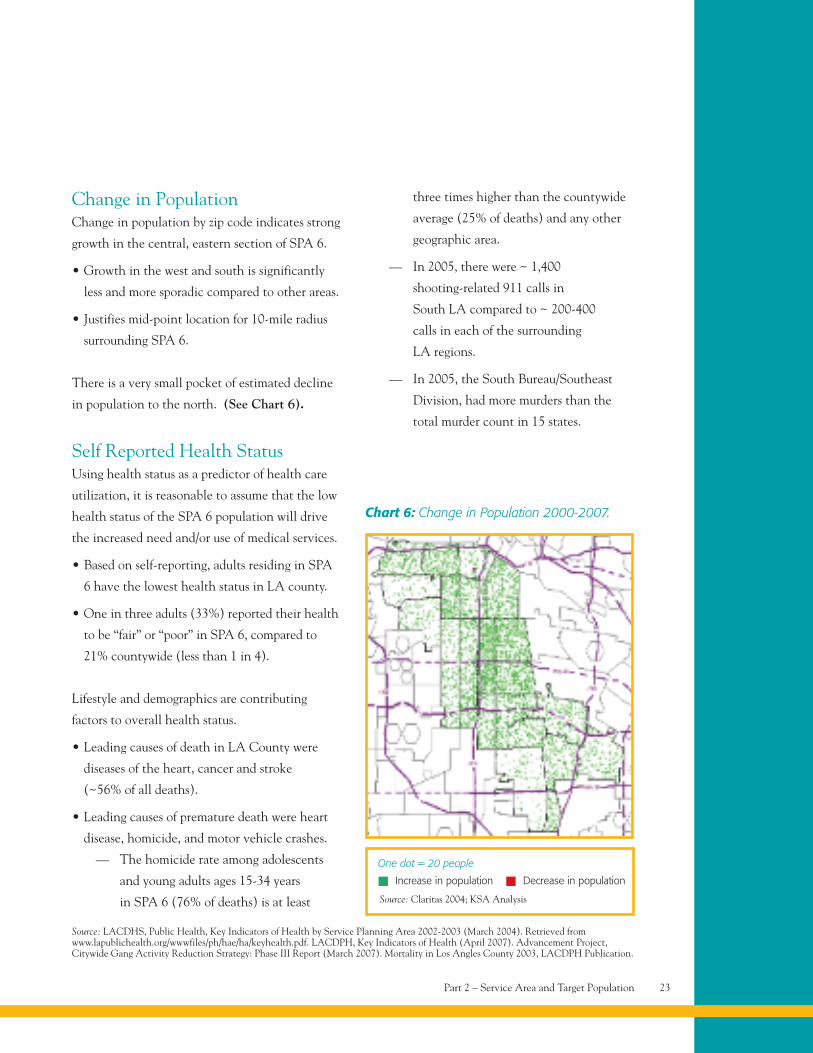
Change in PopulationChange in population by zip code indicates strong
growth in the central, eastern section of SPA 6.
• Growth in the west and south is significantly
less and more sporadic compared to other areas.
• Justifies mid-point location for 10-mile radius
surrounding SPA 6.
There is a very small pocket of estimated decline
in population to the north. (See Chart 6).
Self Reported Health StatusUsing health status as a predictor of health care
utilization, it is reasonable to assume that the low
health status of the SPA 6 population will drive
the increased need and/or use of medical services.
• Based on self-reporting, adults residing in SPA
6 have the lowest health status in LA county.
• One in three adults (33%) reported their health
to be “fair” or “poor” in SPA 6, compared to
21% countywide (less than 1 in 4).
Lifestyle and demographics are contributing
factors to overall health status.
• Leading causes of death in LA County were
diseases of the heart, cancer and stroke
(~56% of all deaths).
• Leading causes of premature death were heart
disease, homicide, and motor vehicle crashes.
— The homicide rate among adolescents
and young adults ages 15-34 years
in SPA 6 (76% of deaths) is at least
three times higher than the countywide
average (25% of deaths) and any other
geographic area.
— In 2005, there were ~ 1,400
shooting-related 911 calls in
South LA compared to ~ 200-400
calls in each of the surrounding
LA regions.
— In 2005, the South Bureau/Southeast
Division, had more murders than the
total murder count in 15 states.
Source: LACDHS, Public Health, Key Indicators of Health by Service Planning Area 2002-2003 (March 2004). Retrieved fromwww.lapublichealth.org/wwwfiles/ph/hae/ha/keyhealth.pdf. LACDPH, Key Indicators of Health (April 2007). Advancement Project,Citywide Gang Activity Reduction Strategy: Phase III Report (March 2007). Mortality in Los Angles County 2003, LACDPH Publication.
Part 2 – Service Area and Target Population 23
Increase in population Decrease in population
One dot = 20 people
Source: Claritas 2004; KSA Analysis
Chart 6: Change in Population 2000-2007.
Critical Condition: Examining the Scope of Medical Services in South Los Angeles24
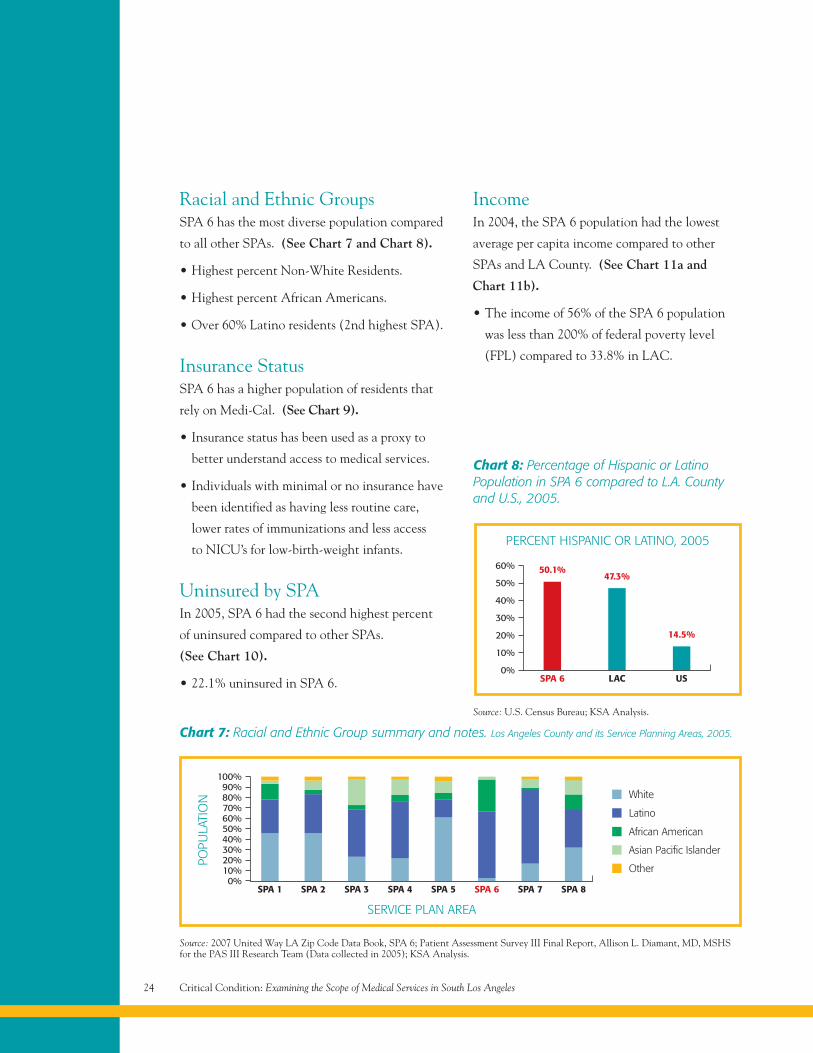
Racial and Ethnic GroupsSPA 6 has the most diverse population compared
to all other SPAs. (See Chart 7 and Chart 8).
• Highest percent Non-White Residents.
• Highest percent African Americans.
• Over 60% Latino residents (2nd highest SPA).
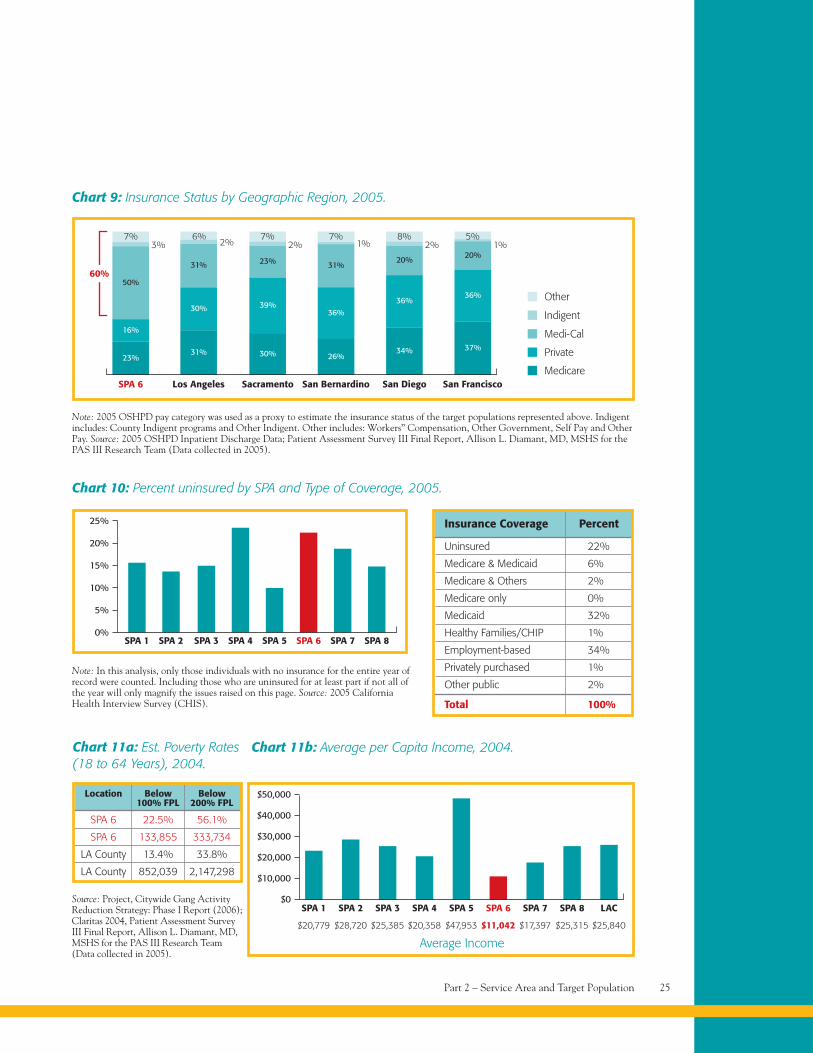
Insurance StatusSPA 6 has a higher population of residents that
rely on Medi-Cal. (See Chart 9).
• Insurance status has been used as a proxy to
better understand access to medical services.
• Individuals with minimal or no insurance have
been identified as having less routine care,
lower rates of immunizations and less access
to NICU’s for low-birth-weight infants.
Uninsured by SPAIn 2005, SPA 6 had the second highest percent
of uninsured compared to other SPAs.
(See Chart 10).
• 22.1% uninsured in SPA 6.
IncomeIn 2004, the SPA 6 population had the lowest
average per capita income compared to other
SPAs and LA County. (See Chart 11a and
Chart 11b).
• The income of 56% of the SPA 6 population
was less than 200% of federal poverty level
(FPL) compared to 33.8% in LAC.
SPA 1
100%90%80%70%60%50%40%30%20%10%0%
SPA 2 SPA 3 SPA 4 SPA 5 SPA 6 SPA 7
Chart 7: Racial and Ethnic Group summary and notes. Los Angeles County and its Service Planning Areas, 2005.
Source: 2007 United Way LA Zip Code Data Book, SPA 6; Patient Assessment Survey III Final Report, Allison L. Diamant, MD, MSHSfor the PAS III Research Team (Data collected in 2005); KSA Analysis.
White
Latino
African American
Asian Pacific Islander
Other
Chart 8: Percentage of Hispanic or LatinoPopulation in SPA 6 compared to L.A. Countyand U.S., 2005.
Source: U.S. Census Bureau; KSA Analysis.
SPA 8
POPU
LATION
SERVICE PLAN AREA
SPA 60%
LAC US
PERCENT HISPANIC OR LATINO, 2005
10%
20%
30%
40%
50%
60% 50.1%47.3%
14.5%
60%
Part 2 – Service Area and Target Population 25
SPA 6
50%
16%
23%
Los Angeles
31%
30%
31%
Sacramento San Bernardino San Diego San Francisco
39%
30%
23%
36%
26%
31%
36%
34%
20%
36%
37%
20%
Chart 9: Insurance Status by Geographic Region, 2005.
Note: 2005 OSHPD pay category was used as a proxy to estimate the insurance status of the target populations represented above. Indigentincludes: County Indigent programs and Other Indigent. Other includes: Workers” Compensation, Other Government, Self Pay and OtherPay. Source: 2005 OSHPD Inpatient Discharge Data; Patient Assessment Survey III Final Report, Allison L. Diamant, MD, MSHS for thePAS III Research Team (Data collected in 2005).
7%3%
6%2%
7%2%
7%1%
8%2%
5%1%
Other
Indigent
Medi-Cal
Private
Medicare
SPA 10%
SPA 2 SPA 3 SPA 4 SPA 5 SPA 6 SPA 7
Chart 10: Percent uninsured by SPA and Type of Coverage, 2005.
Note: In this analysis, only those individuals with no insurance for the entire year ofrecord were counted. Including those who are uninsured for at least part if not all ofthe year will only magnify the issues raised on this page. Source: 2005 CaliforniaHealth Interview Survey (CHIS).
SPA 8
10%
15%
20%
25%
5%
Uninsured 22%
Medicare & Medicaid 6%
Medicare & Others 2%
Medicare only 0%
Medicaid 32%
Healthy Families/CHIP 1%
Employment-based 34%
Privately purchased 1%
Other public 2%
Total 100%
Insurance Coverage Percent
SPA 6 22.5% 56.1%
SPA 6 133,855 333,734
LA County 13.4% 33.8%
LA County 852,039 2,147,298
Location Below Below100% FPL 200% FPL
Chart 11a: Est. Poverty Rates(18 to 64 Years), 2004.
SPA 1$0
SPA 2 SPA 3 SPA 4 SPA 5 SPA 6 SPA 7
Chart 11b: Average per Capita Income, 2004.
Source: Project, Citywide Gang ActivityReduction Strategy: Phase I Report (2006);Claritas 2004, Patient Assessment SurveyIII Final Report, Allison L. Diamant, MD,MSHS for the PAS III Research Team(Data collected in 2005).
SPA 8 LAC
$20,779 $28,720 $25,385 $20,358 $47,953 $11,042 $17,397 $25,315 $25,840
Average Income
$10,000
$20,000
$30,000
$40,000
$50,000

SPA 6 has the most
diverse populations
compared to all
other SPAs, with a
high percentage of
African Americans.
Part 3Health Care Services
Trauma and Emergency Services 28
Acute Care 30
Ambulatory Care 35
Post Acute Care 48
Public Health 54
Critical Condition: Examining the Scope of Medical Services in South Los Angeles28
Health Care Services
Trauma and Emergency ServicesTo assess if residents of SPA 6 have access to
trauma and emergent services, we will identify
the current demand for these services in relation
to the existing capacity of trauma centers and
emergency departments.
Indicators of demand include the following:
• Population/demographic characteristics.
• Income/Health Insurance.
• Homicide rates.
• ED treatment station need.
The diverse make up and low income characteristics
of the SPA 6 population, coupled to the high
homicide rate indicates a relatively high demand
for trauma and emergency services.
• Additionally, access to trauma centers/emergency
departments is crucial for victims of violent
crimes. Using homicides as a proxy to assess the
rate of violent crimes, the SPA 6 population is
in further demand for trauma/emergent services.
– In 2003, homicide was the second
leading cause of pre-mature death
in the County.
– It was the 4th cause of death and
1st cause of premature death among
Hispanics, and;
– The 5th leading cause of death and
1st cause of premature death among
African Americans.
— In 2005, SPA 6 had the highest rate
of homicides among 15-34 year-olds
compared to other SPAs and LAC
(75.6% SPA 6 vs. 25.0% LAC).
• From 2002 to 2004, 70% of King/Harbor patients
were from SPA 6 and 80% of patients were
admitted through the ED.
• African Americans and Whites were found to be
more in need of ED services compared to Latinos
and Asian/Pacific Islanders (~ 40% vs. 18%).
• ~ 75% of LAC-DHS patients were in need of
emergency services (e.g., they felt their condition
was an emergency, they were told to go to the
ED by their doctor, or they were brought to the
ED by ambulance).
• Insured consumers (specifically chronically ill
adults and patients covered by Medi-Cal) are
most prone to ED use.
In 2004-2005 there was 1 trauma center (St.
Francis) and 2 hospitals with EDs (King/Harbor
and St. Francis) to serve the population of SPA 6.
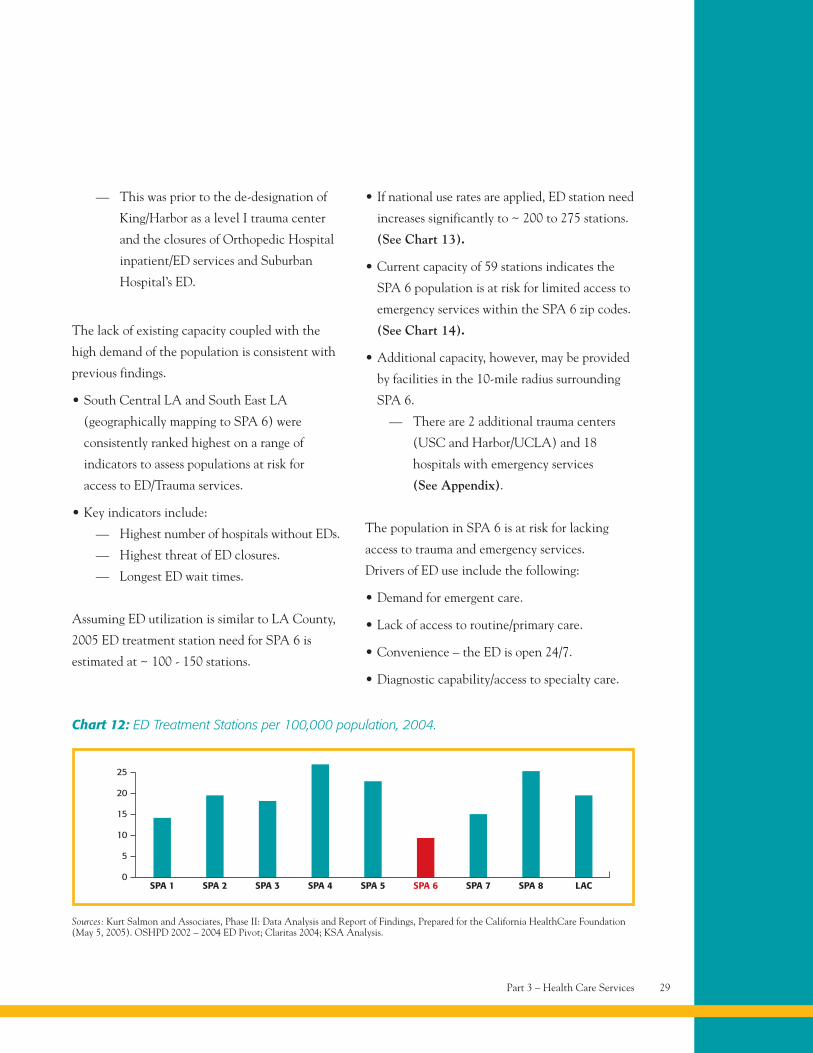
• In 2004, SPA 6 had the lowest number of ED
treatment stations per 100,000 compared to
LAC and other SPAs. (See Chart 12).
Sources: Overuse of Emergency Departments Among Insured Californians, CHCF Issue Brief Oct. 2006; Key Indicators of Health by ServicePlanning Area, 2007 (LACDPH Publication); Bitler, M and Shi, W., Health Insurance, Health Care Use and Health Status in Los AngelesCounty, Public Policy Institute of CA 2006; Patient Assessment Survey III, Final Report; King/Harbor Hospital Transition Report, NHF2005; KSA Analysis.).
Part 3 – Health Care Services 29
— This was prior to the de-designation of
King/Harbor as a level I trauma center
and the closures of Orthopedic Hospital
inpatient/ED services and Suburban
Hospital’s ED.
The lack of existing capacity coupled with the
high demand of the population is consistent with
previous findings.
• South Central LA and South East LA
(geographically mapping to SPA 6) were
consistently ranked highest on a range of
indicators to assess populations at risk for
access to ED/Trauma services.
• Key indicators include:
— Highest number of hospitals without EDs.
— Highest threat of ED closures.
— Longest ED wait times.
Assuming ED utilization is similar to LA County,
2005 ED treatment station need for SPA 6 is
estimated at ~ 100 - 150 stations.
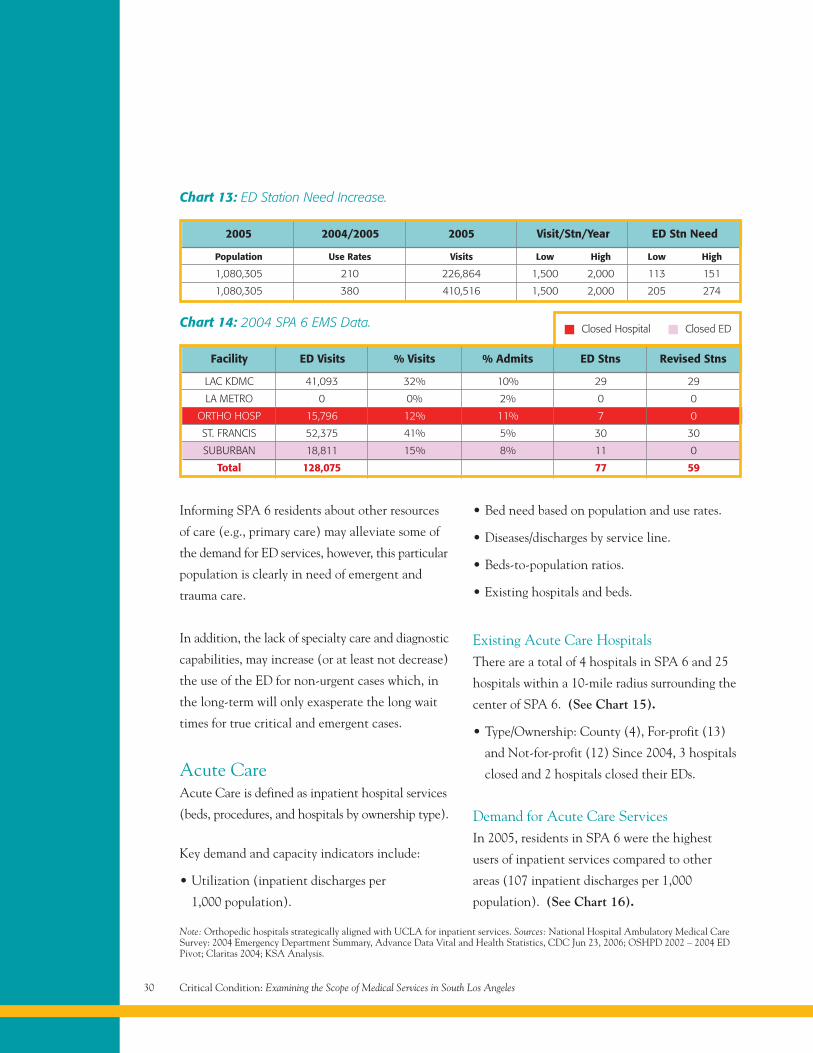
• If national use rates are applied, ED station need
increases significantly to ~ 200 to 275 stations.
(See Chart 13).
• Current capacity of 59 stations indicates the
SPA 6 population is at risk for limited access to
emergency services within the SPA 6 zip codes.
(See Chart 14).
• Additional capacity, however, may be provided
by facilities in the 10-mile radius surrounding
SPA 6.
— There are 2 additional trauma centers
(USC and Harbor/UCLA) and 18
hospitals with emergency services
(See Appendix).
The population in SPA 6 is at risk for lacking
access to trauma and emergency services.
Drivers of ED use include the following:
• Demand for emergent care.
• Lack of access to routine/primary care.
• Convenience – the ED is open 24/7.
• Diagnostic capability/access to specialty care.
Sources: Kurt Salmon and Associates, Phase II: Data Analysis and Report of Findings, Prepared for the California HealthCare Foundation(May 5, 2005). OSHPD 2002 – 2004 ED Pivot; Claritas 2004; KSA Analysis.
SPA 10
SPA 2 SPA 3 SPA 4 SPA 5 SPA 6 SPA 7
Chart 12: ED Treatment Stations per 100,000 population, 2004.
SPA 8 LAC
5
10
15
20
25
Critical Condition: Examining the Scope of Medical Services in South Los Angeles30
Note: Orthopedic hospitals strategically aligned with UCLA for inpatient services. Sources: National Hospital Ambulatory Medical CareSurvey: 2004 Emergency Department Summary, Advance Data Vital and Health Statistics, CDC Jun 23, 2006; OSHPD 2002 – 2004 EDPivot; Claritas 2004; KSA Analysis.
Population Use Rates Visits Low High Low High
1,080,305 210 226,864 1,500 2,000 113 151
1,080,305 380 410,516 1,500 2,000 205 274
2005 2004/2005 2005 Visit/Stn/Year ED Stn Need
Chart 13: ED Station Need Increase.
LAC KDMC 41,093 32% 10% 29 29
LA METRO 0 0% 2% 0 0
ORTHO HOSP 15,796 12% 11% 7 0
ST. FRANCIS 52,375 41% 5% 30 30
SUBURBAN 18,811 15% 8% 11 0
Total 128,075 77 59
Facility ED Visits % Visits % Admits ED Stns Revised Stns
Chart 14: 2004 SPA 6 EMS Data. Closed Hospital Closed ED
Informing SPA 6 residents about other resources
of care (e.g., primary care) may alleviate some of
the demand for ED services, however, this particular
population is clearly in need of emergent and
trauma care.
In addition, the lack of specialty care and diagnostic
capabilities, may increase (or at least not decrease)
the use of the ED for non-urgent cases which, in
the long-term will only exasperate the long wait
times for true critical and emergent cases.
Acute CareAcute Care is defined as inpatient hospital services
(beds, procedures, and hospitals by ownership type).
Key demand and capacity indicators include:
• Utilization (inpatient discharges per
1,000 population).
• Bed need based on population and use rates.
• Diseases/discharges by service line.
• Beds-to-population ratios.
• Existing hospitals and beds.
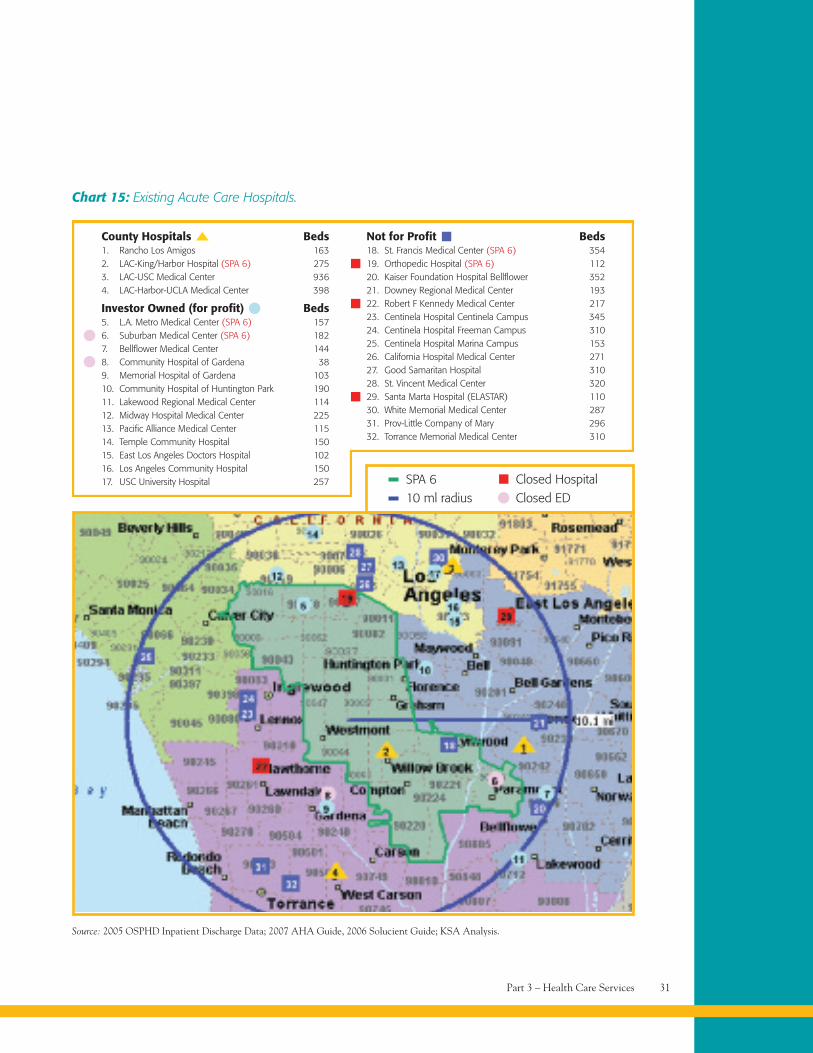
Existing Acute Care HospitalsThere are a total of 4 hospitals in SPA 6 and 25
hospitals within a 10-mile radius surrounding the
center of SPA 6. (See Chart 15).
• Type/Ownership: County (4), For-profit (13)
and Not-for-profit (12) Since 2004, 3 hospitals
closed and 2 hospitals closed their EDs.
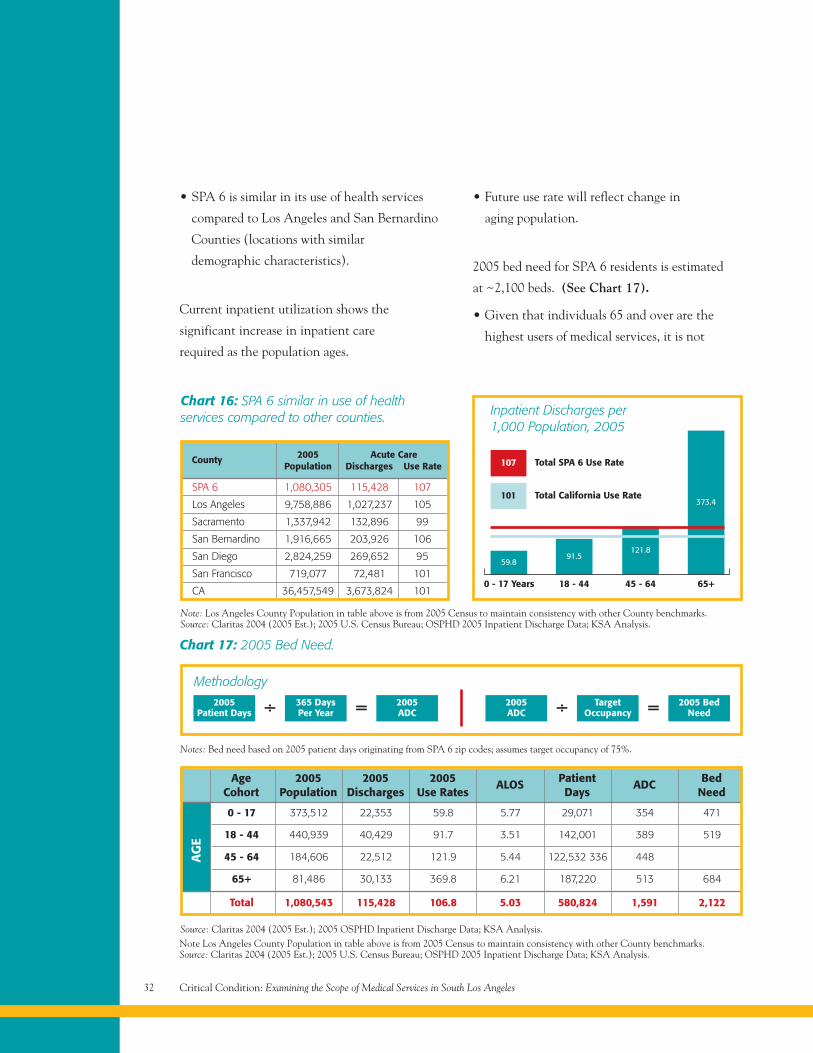
Demand for Acute Care ServicesIn 2005, residents in SPA 6 were the highest
users of inpatient services compared to other
areas (107 inpatient discharges per 1,000
population). (See Chart 16).
Part 3 – Health Care Services 31
Chart 15: Existing Acute Care Hospitals.
Source: 2005 OSPHD Inpatient Discharge Data; 2007 AHA Guide, 2006 Solucient Guide; KSA Analysis.
County Hospitals Beds1. Rancho Los Amigos 1632. LAC-King/Harbor Hospital (SPA 6) 2753. LAC-USC Medical Center 9364. LAC-Harbor-UCLA Medical Center 398
Investor Owned (for profit) Beds5. L.A. Metro Medical Center (SPA 6) 1576. Suburban Medical Center (SPA 6) 1827. Bellflower Medical Center 1448. Community Hospital of Gardena 389. Memorial Hospital of Gardena 10310. Community Hospital of Huntington Park 19011. Lakewood Regional Medical Center 11412. Midway Hospital Medical Center 22513. Pacific Alliance Medical Center 11514. Temple Community Hospital 15015. East Los Angeles Doctors Hospital 10216. Los Angeles Community Hospital 15017. USC University Hospital 257 SPA 6
10 ml radiusClosed HospitalClosed ED
Not for Profit Beds18. St. Francis Medical Center (SPA 6) 35419. Orthopedic Hospital (SPA 6) 11220. Kaiser Foundation Hospital Bellflower 35221. Downey Regional Medical Center 19322. Robert F Kennedy Medical Center 21723. Centinela Hospital Centinela Campus 34524. Centinela Hospital Freeman Campus 31025. Centinela Hospital Marina Campus 15326. California Hospital Medical Center 27127. Good Samaritan Hospital 31028. St. Vincent Medical Center 32029. Santa Marta Hospital (ELASTAR) 11030. White Memorial Medical Center 28731. Prov-Little Company of Mary 29632. Torrance Memorial Medical Center 310
Critical Condition: Examining the Scope of Medical Services in South Los Angeles32
County 2005 Acute CarePopulation Discharges Use Rate
Chart 16: SPA 6 similar in use of healthservices compared to other counties.
SPA 6 1,080,305 115,428 107
Los Angeles 9,758,886 1,027,237 105
Sacramento 1,337,942 132,896 99
San Bernardino 1,916,665 203,926 106
San Diego 2,824,259 269,652 95
San Francisco 719,077 72,481 101
CA 36,457,549 3,673,824 1010 - 17 Years
59.8
18 - 44
91.5
45 - 64 65+
121.8
373.4
Note: Los Angeles County Population in table above is from 2005 Census to maintain consistency with other County benchmarks.Source: Claritas 2004 (2005 Est.); 2005 U.S. Census Bureau; OSPHD 2005 Inpatient Discharge Data; KSA Analysis.
107 Total SPA 6 Use Rate
101 Total California Use Rate
Chart 17: 2005 Bed Need.
÷ =
Notes: Bed need based on 2005 patient days originating from SPA 6 zip codes; assumes target occupancy of 75%.
18 - 44 440,939 40,429 91.7 3.51 142,001 389 519
45 - 64 184,606 22,512 121.9 5.44 122,532 336 448
65+ 81,486 30,133 369.8 6.21 187,220 513 684
Total 1,080,543 115,428 106.8 5.03 580,824 1,591 2,122
AGE
Source: Claritas 2004 (2005 Est.); 2005 OSPHD Inpatient Discharge Data; KSA Analysis.
AgeCohort
2005Population
2005Discharges
2005Use Rates
ALOS PatientDays
ADC BedNeed
0 - 17 373,512 22,353 59.8 5.77 29,071 354 471
Methodology2005
Patient Days365 DaysPer Year
2005ADC ÷ =2005
ADCTarget
Occupancy2005 BedNeed
Inpatient Discharges per1,000 Population, 2005
• SPA 6 is similar in its use of health services
compared to Los Angeles and San Bernardino
Counties (locations with similar
demographic characteristics).
Current inpatient utilization shows the
significant increase in inpatient care
required as the population ages.
• Future use rate will reflect change in
aging population.
2005 bed need for SPA 6 residents is estimated
at ~2,100 beds. (See Chart 17).
• Given that individuals 65 and over are the
highest users of medical services, it is not
Note Los Angeles County Population in table above is from 2005 Census to maintain consistency with other County benchmarks.Source: Claritas 2004 (2005 Est.); 2005 U.S. Census Bureau; OSPHD 2005 Inpatient Discharge Data; KSA Analysis.
Part 3 – Health Care Services 33
surprising that this age cohort drives the
largest need for acute care beds (~680 beds).
• ~470 beds are needed for the young
adult/pediatric populations (age 0-17).
• Note: Bed NEED defined as DEMAND for acute
care beds based on current utilization patterns.
Does not assess if beds are available upon need.
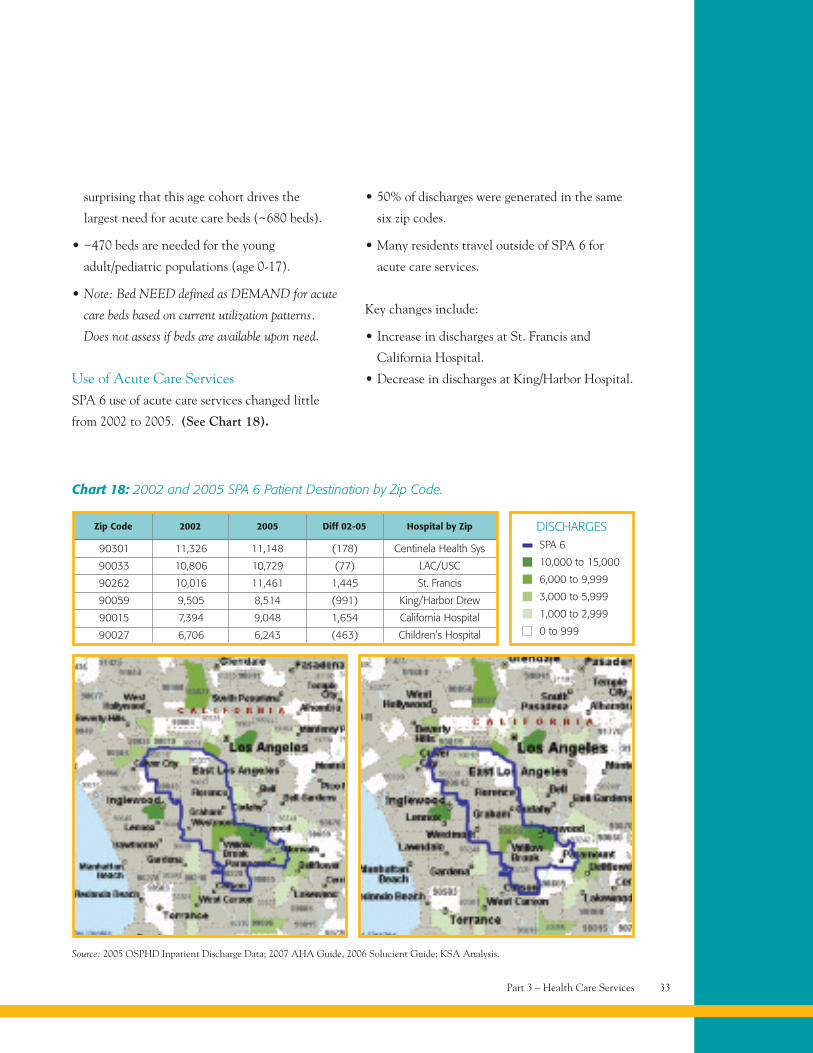
Use of Acute Care ServicesSPA 6 use of acute care services changed little
from 2002 to 2005. (See Chart 18).
• 50% of discharges were generated in the same
six zip codes.
• Many residents travel outside of SPA 6 for
acute care services.
Key changes include:
• Increase in discharges at St. Francis and
California Hospital.
• Decrease in discharges at King/Harbor Hospital.
Zip Code 2002 2005 Diff 02-05 Hospital by Zip
Chart 18: 2002 and 2005 SPA 6 Patient Destination by Zip Code.
Source: 2005 OSPHD Inpatient Discharge Data; 2007 AHA Guide, 2006 Solucient Guide; KSA Analysis.
10,000 to 15,000
6,000 to 9,999
3,000 to 5,999
1,000 to 2,999
0 to 999
DISCHARGES
90301 11,326 11,148 (178) Centinela Health Sys
90033 10,806 10,729 (77) LAC/USC
90262 10,016 11,461 1,445 St. Francis
90059 9,505 8,514 (991) King/Harbor Drew
90015 7,394 9,048 1,654 California Hospital
90027 6,706 6,243 (463) Children’s Hospital
SPA 6
Critical Condition: Examining the Scope of Medical Services in South Los Angeles34
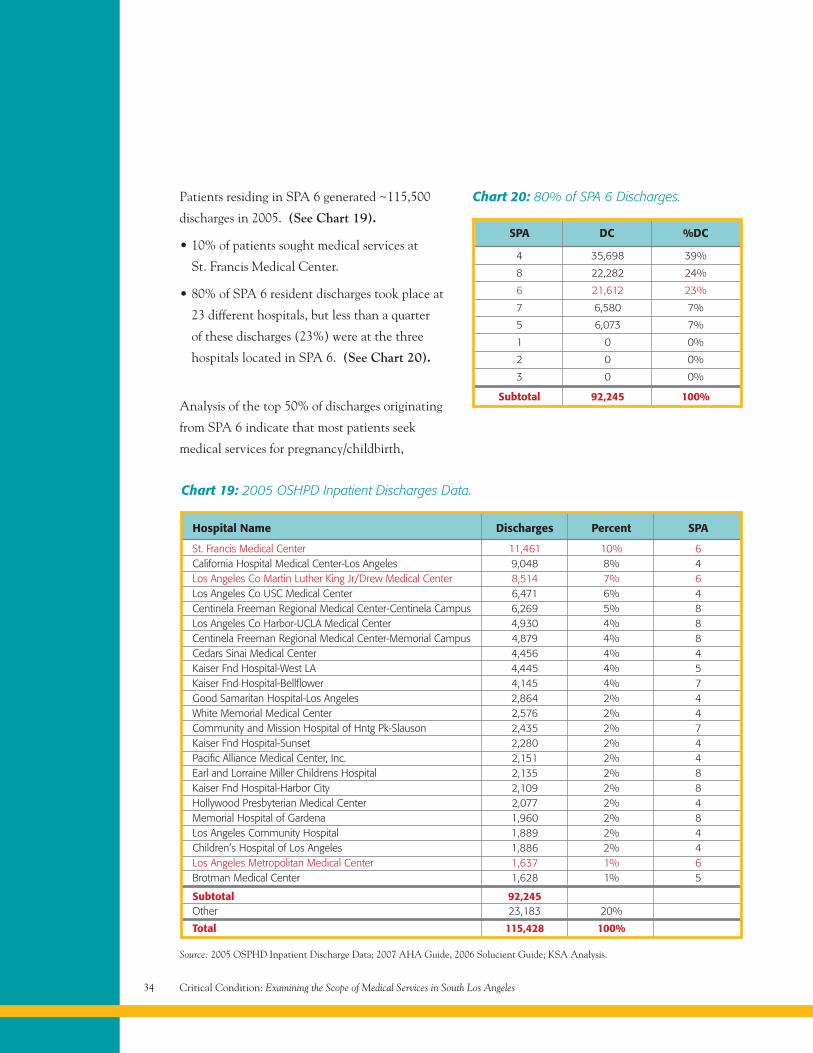
Source: 2005 OSPHD Inpatient Discharge Data; 2007 AHA Guide, 2006 Solucient Guide; KSA Analysis.
Chart 19: 2005 OSHPD Inpatient Discharges Data.
Hospital Name Discharges Percent SPA
St. Francis Medical Center 11,461 10% 6California Hospital Medical Center-Los Angeles 9,048 8% 4Los Angeles Co Martin Luther King Jr/Drew Medical Center 8,514 7% 6Los Angeles Co USC Medical Center 6,471 6% 4Centinela Freeman Regional Medical Center-Centinela Campus 6,269 5% 8Los Angeles Co Harbor-UCLA Medical Center 4,930 4% 8Centinela Freeman Regional Medical Center-Memorial Campus 4,879 4% 8Cedars Sinai Medical Center 4,456 4% 4Kaiser Fnd Hospital-West LA 4,445 4% 5Kaiser Fnd Hospital-Bellflower 4,145 4% 7Good Samaritan Hospital-Los Angeles 2,864 2% 4White Memorial Medical Center 2,576 2% 4Community and Mission Hospital of Hntg Pk-Slauson 2,435 2% 7Kaiser Fnd Hospital-Sunset 2,280 2% 4Pacific Alliance Medical Center, Inc. 2,151 2% 4Earl and Lorraine Miller Childrens Hospital 2,135 2% 8Kaiser Fnd Hospital-Harbor City 2,109 2% 8Hollywood Presbyterian Medical Center 2,077 2% 4Memorial Hospital of Gardena 1,960 2% 8Los Angeles Community Hospital 1,889 2% 4Children’s Hospital of Los Angeles 1,886 2% 4Los Angeles Metropolitan Medical Center 1,637 1% 6Brotman Medical Center 1,628 1% 5
Subtotal 92,245Other 23,183 20%
Total 115,428 100%
Patients residing in SPA 6 generated ~115,500
discharges in 2005. (See Chart 19).
• 10% of patients sought medical services at
St. Francis Medical Center.
• 80% of SPA 6 resident discharges took place at
23 different hospitals, but less than a quarter
of these discharges (23%) were at the three
hospitals located in SPA 6. (See Chart 20).
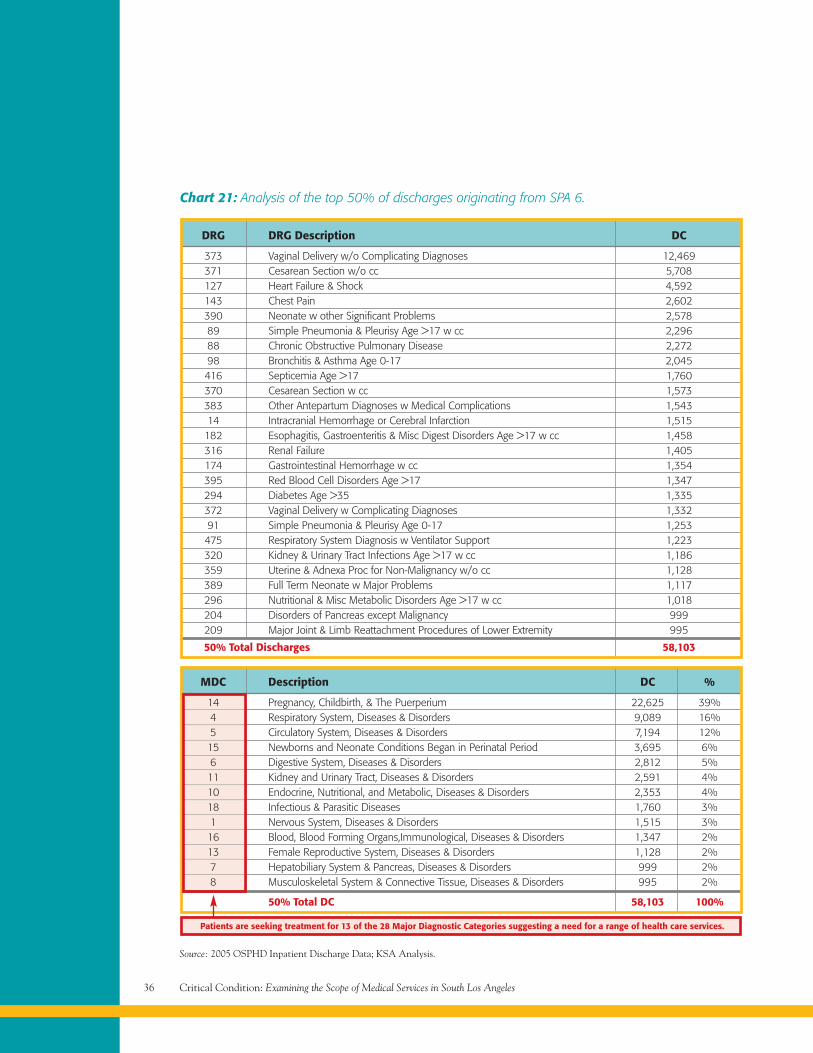
Analysis of the top 50% of discharges originating
from SPA 6 indicate that most patients seek
medical services for pregnancy/childbirth,
4 35,698 39%
8 22,282 24%
6 21,612 23%
7 6,580 7%
5 6,073 7%
1 0 0%
2 0 0%
3 0 0%
Subtotal 92,245 100%
SPA DC %DC
Chart 20: 80% of SPA 6 Discharges.
Part 3 – Health Care Services 35
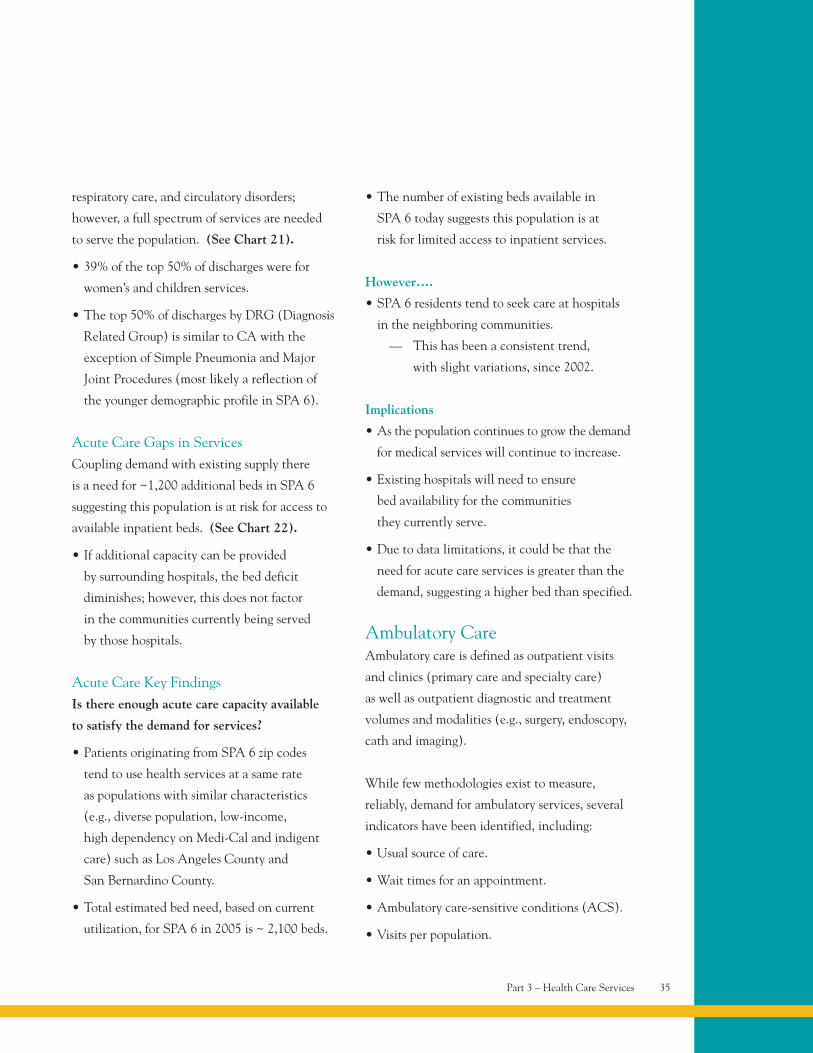
respiratory care, and circulatory disorders;
however, a full spectrum of services are needed
to serve the population. (See Chart 21).
• 39% of the top 50% of discharges were for
women’s and children services.
• The top 50% of discharges by DRG (Diagnosis
Related Group) is similar to CA with the
exception of Simple Pneumonia and Major
Joint Procedures (most likely a reflection of
the younger demographic profile in SPA 6).
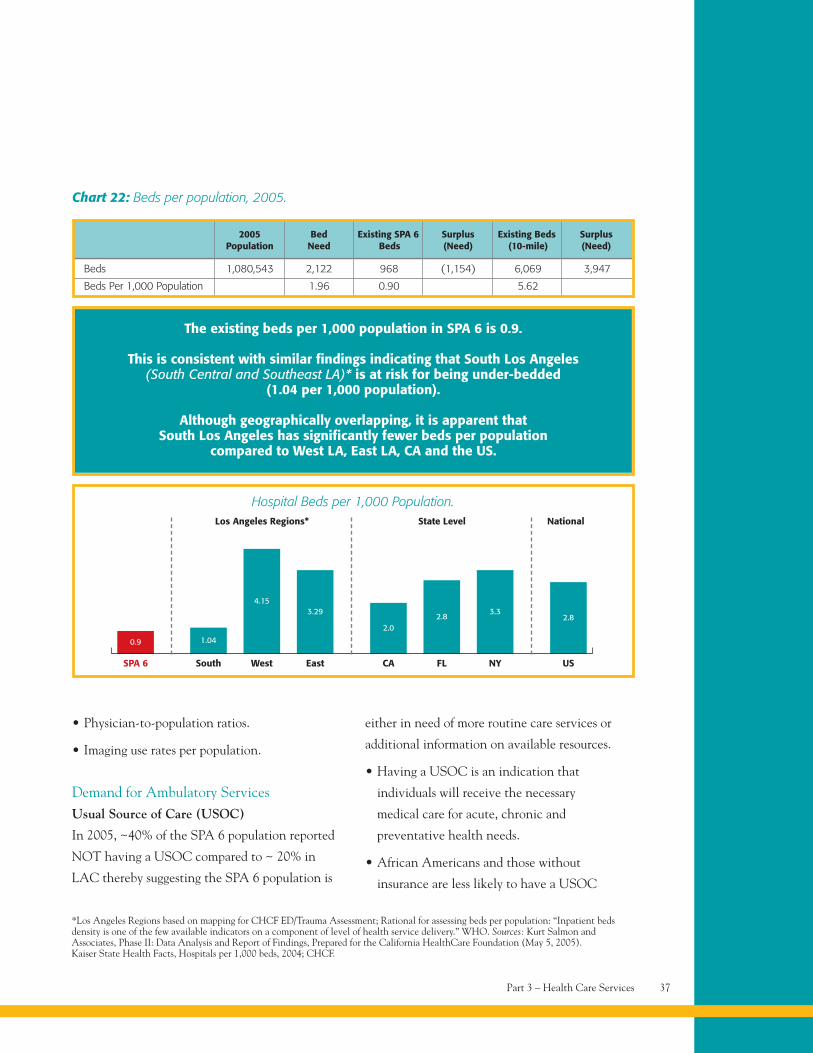
Acute Care Gaps in ServicesCoupling demand with existing supply there
is a need for ~1,200 additional beds in SPA 6
suggesting this population is at risk for access to
available inpatient beds. (See Chart 22).
• If additional capacity can be provided
by surrounding hospitals, the bed deficit
diminishes; however, this does not factor
in the communities currently being served
by those hospitals.
Acute Care Key FindingsIs there enough acute care capacity available
to satisfy the demand for services?
• Patients originating from SPA 6 zip codes
tend to use health services at a same rate
as populations with similar characteristics
(e.g., diverse population, low-income,
high dependency on Medi-Cal and indigent
care) such as Los Angeles County and
San Bernardino County.
• Total estimated bed need, based on current
utilization, for SPA 6 in 2005 is ~ 2,100 beds.
• The number of existing beds available in
SPA 6 today suggests this population is at
risk for limited access to inpatient services.
However….
• SPA 6 residents tend to seek care at hospitals
in the neighboring communities.
— This has been a consistent trend,
with slight variations, since 2002.
Implications
• As the population continues to grow the demand
for medical services will continue to increase.
• Existing hospitals will need to ensure
bed availability for the communities
they currently serve.
• Due to data limitations, it could be that the
need for acute care services is greater than the
demand, suggesting a higher bed than specified.
Ambulatory CareAmbulatory care is defined as outpatient visits
and clinics (primary care and specialty care)
as well as outpatient diagnostic and treatment
volumes and modalities (e.g., surgery, endoscopy,
cath and imaging).
While few methodologies exist to measure,
reliably, demand for ambulatory services, several
indicators have been identified, including:
• Usual source of care.
• Wait times for an appointment.
• Ambulatory care-sensitive conditions (ACS).
• Visits per population.
Critical Condition: Examining the Scope of Medical Services in South Los Angeles36
Source: 2005 OSPHD Inpatient Discharge Data; KSA Analysis.
Chart 21: Analysis of the top 50% of discharges originating from SPA 6.
DRG DRG Description DC
373 Vaginal Delivery w/o Complicating Diagnoses 12,469371 Cesarean Section w/o cc 5,708127 Heart Failure & Shock 4,592143 Chest Pain 2,602390 Neonate w other Significant Problems 2,57889 Simple Pneumonia & Pleurisy Age >17 w cc 2,29688 Chronic Obstructive Pulmonary Disease 2,27298 Bronchitis & Asthma Age 0-17 2,045416 Septicemia Age >17 1,760370 Cesarean Section w cc 1,573383 Other Antepartum Diagnoses w Medical Complications 1,54314 Intracranial Hemorrhage or Cerebral Infarction 1,515182 Esophagitis, Gastroenteritis & Misc Digest Disorders Age >17 w cc 1,458316 Renal Failure 1,405174 Gastrointestinal Hemorrhage w cc 1,354395 Red Blood Cell Disorders Age >17 1,347294 Diabetes Age >35 1,335372 Vaginal Delivery w Complicating Diagnoses 1,33291 Simple Pneumonia & Pleurisy Age 0-17 1,253475 Respiratory System Diagnosis w Ventilator Support 1,223320 Kidney & Urinary Tract Infections Age >17 w cc 1,186359 Uterine & Adnexa Proc for Non-Malignancy w/o cc 1,128389 Full Term Neonate w Major Problems 1,117296 Nutritional & Misc Metabolic Disorders Age >17 w cc 1,018204 Disorders of Pancreas except Malignancy 999209 Major Joint & Limb Reattachment Procedures of Lower Extremity 995
50% Total Discharges 58,103
Patients are seeking treatment for 13 of the 28 Major Diagnostic Categories suggesting a need for a range of health care services.
MDC Description DC %
14 Pregnancy, Childbirth, & The Puerperium 22,625 39%4 Respiratory System, Diseases & Disorders 9,089 16%5 Circulatory System, Diseases & Disorders 7,194 12%15 Newborns and Neonate Conditions Began in Perinatal Period 3,695 6%6 Digestive System, Diseases & Disorders 2,812 5%11 Kidney and Urinary Tract, Diseases & Disorders 2,591 4%10 Endocrine, Nutritional, and Metabolic, Diseases & Disorders 2,353 4%18 Infectious & Parasitic Diseases 1,760 3%1 Nervous System, Diseases & Disorders 1,515 3%16 Blood, Blood Forming Organs,Immunological, Diseases & Disorders 1,347 2%13 Female Reproductive System, Diseases & Disorders 1,128 2%7 Hepatobiliary System & Pancreas, Diseases & Disorders 999 2%8 Musculoskeletal System & Connective Tissue, Diseases & Disorders 995 2%
50% Total DC 58,103 100%
Part 3 – Health Care Services 37
• Physician-to-population ratios.
• Imaging use rates per population.
Demand for Ambulatory ServicesUsual Source of Care (USOC)
In 2005, ~40% of the SPA 6 population reported
NOT having a USOC compared to ~ 20% in
LAC thereby suggesting the SPA 6 population is
either in need of more routine care services or
additional information on available resources.
• Having a USOC is an indication that
individuals will receive the necessary
medical care for acute, chronic and
preventative health needs.
• African Americans and those without
insurance are less likely to have a USOC
2005 Bed Existing SPA 6 Surplus Existing Beds SurplusPopulation Need Beds (Need) (10-mile) (Need)
Chart 22: Beds per population, 2005.
Beds 1,080,543 2,122 968 (1,154) 6,069 3,947
Beds Per 1,000 Population 1.96 0.90 5.62
The existing beds per 1,000 population in SPA 6 is 0.9.
This is consistent with similar findings indicating that South Los Angeles(South Central and Southeast LA)* is at risk for being under-bedded
(1.04 per 1,000 population).
Although geographically overlapping, it is apparent thatSouth Los Angeles has significantly fewer beds per population
compared to West LA, East LA, CA and the US.
SPA 6
0.9
South
1.04
West
4.15
East
3.29
CA
2.0
FL
2.8
NY
3.3
US
2.8
Hospital Beds per 1,000 Population.
*Los Angeles Regions based on mapping for CHCF ED/Trauma Assessment; Rational for assessing beds per population: “Inpatient bedsdensity is one of the few available indicators on a component of level of health service delivery.” WHO. Sources: Kurt Salmon andAssociates, Phase II: Data Analysis and Report of Findings, Prepared for the California HealthCare Foundation (May 5, 2005).Kaiser State Health Facts, Hospitals per 1,000 beds, 2004; CHCF.
Los Angeles Regions* State Level National
compared to other races/ethnicities and
those with insurance.
— The high percentage of African
Americans and under/uninsured in
SPA 6 puts this population further
at risk for limited access to a USOC**.
Access/Wait Times
• Long wait times indicate the supply of
ambulatory services (whether physicians
or clinics) is not meeting the demands
of the population.
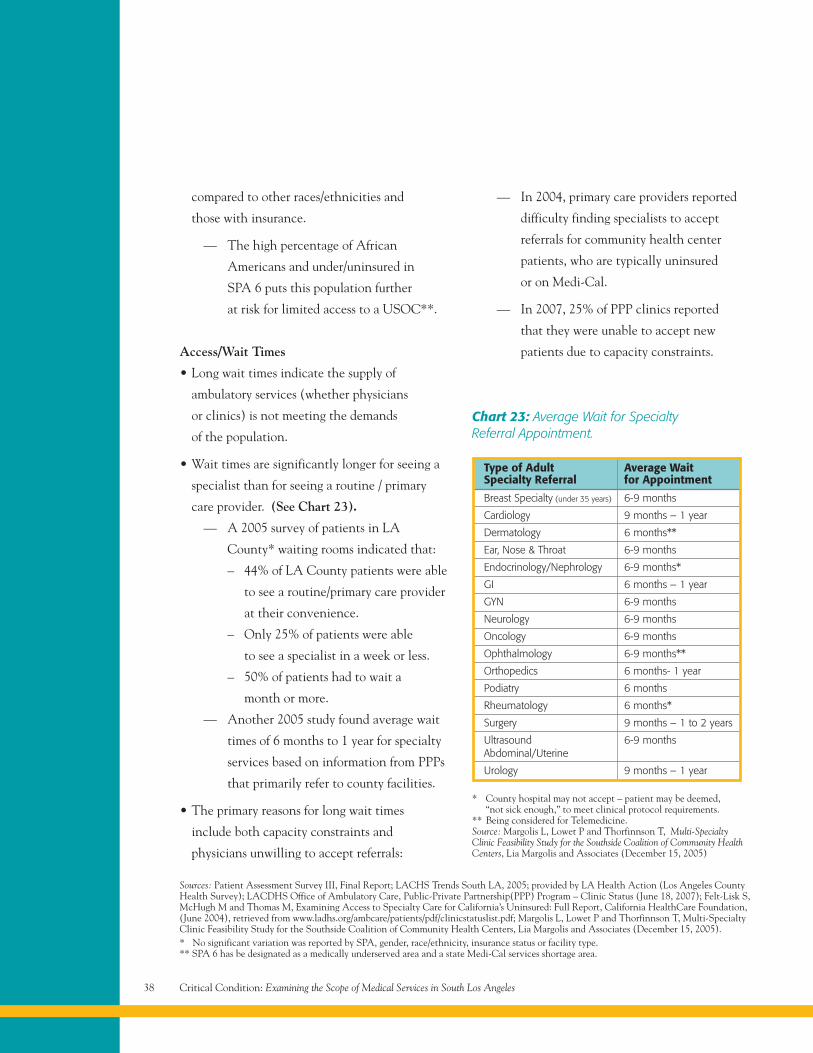
• Wait times are significantly longer for seeing a
specialist than for seeing a routine / primary
care provider. (See Chart 23).
— A 2005 survey of patients in LA
County* waiting rooms indicated that:
– 44% of LA County patients were able
to see a routine/primary care provider
at their convenience.
– Only 25% of patients were able
to see a specialist in a week or less.
– 50% of patients had to wait a
month or more.
— Another 2005 study found average wait
times of 6 months to 1 year for specialty
services based on information from PPPs
that primarily refer to county facilities.
• The primary reasons for long wait times
include both capacity constraints and
physicians unwilling to accept referrals:
— In 2004, primary care providers reported
difficulty finding specialists to accept
referrals for community health center
patients, who are typically uninsured
or on Medi-Cal.
— In 2007, 25% of PPP clinics reported
that they were unable to accept new
patients due to capacity constraints.
Critical Condition: Examining the Scope of Medical Services in South Los Angeles38
Sources: Patient Assessment Survey III, Final Report; LACHS Trends South LA, 2005; provided by LA Health Action (Los Angeles CountyHealth Survey); LACDHS Office of Ambulatory Care, Public-Private Partnership(PPP) Program – Clinic Status (June 18, 2007); Felt-Lisk S,McHugh M and Thomas M, Examining Access to Specialty Care for California’s Uninsured: Full Report, California HealthCare Foundation,(June 2004), retrieved from www.ladhs.org/ambcare/patients/pdf/clinicstatuslist.pdf; Margolis L, Lowet P and Thorfinnson T, Multi-SpecialtyClinic Feasibility Study for the Southside Coalition of Community Health Centers, Lia Margolis and Associates (December 15, 2005).* No significant variation was reported by SPA, gender, race/ethnicity, insurance status or facility type.** SPA 6 has be designated as a medically underserved area and a state Medi-Cal services shortage area.
Breast Specialty (under 35 years) 6-9 months
Cardiology 9 months – 1 year
Dermatology 6 months**
Ear, Nose & Throat 6-9 months
Endocrinology/Nephrology 6-9 months*
GI 6 months – 1 year
GYN 6-9 months
Neurology 6-9 months
Oncology 6-9 months
Ophthalmology 6-9 months**
Orthopedics 6 months- 1 year
Podiatry 6 months
Rheumatology 6 months*
Surgery 9 months – 1 to 2 years
Ultrasound 6-9 monthsAbdominal/Uterine
Urology 9 months – 1 year
Type of Adult Average WaitSpecialty Referral for Appointment
Chart 23: Average Wait for SpecialtyReferral Appointment.
* County hospital may not accept – patient may be deemed,“not sick enough,” to meet clinical protocol requirements.
** Being considered for Telemedicine.Source: Margolis L, Lowet P and Thorfinnson T, Multi-SpecialtyClinic Feasibility Study for the Southside Coalition of Community HealthCenters, Lia Margolis and Associates (December 15, 2005)
Part 3 – Health Care Services 39
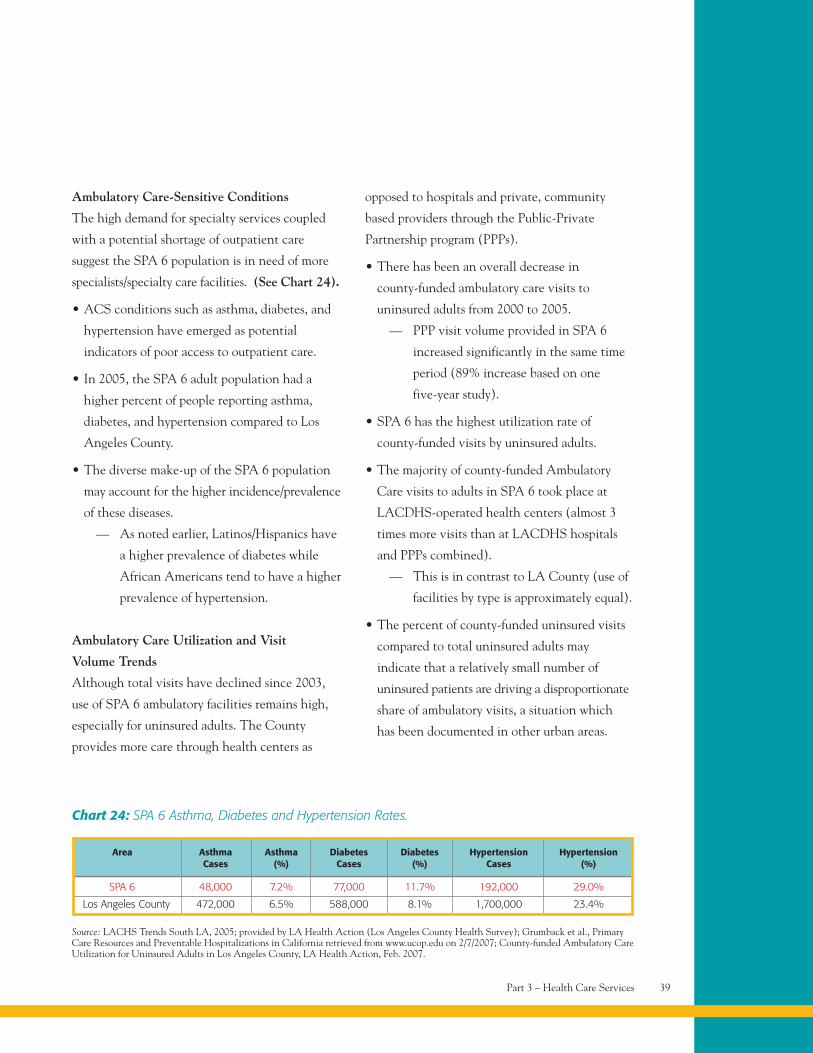
Ambulatory Care-Sensitive Conditions
The high demand for specialty services coupled
with a potential shortage of outpatient care
suggest the SPA 6 population is in need of more
specialists/specialty care facilities. (See Chart 24).
• ACS conditions such as asthma, diabetes, and
hypertension have emerged as potential
indicators of poor access to outpatient care.
• In 2005, the SPA 6 adult population had a
higher percent of people reporting asthma,
diabetes, and hypertension compared to Los
Angeles County.
• The diverse make-up of the SPA 6 population
may account for the higher incidence/prevalence
of these diseases.
— As noted earlier, Latinos/Hispanics have
a higher prevalence of diabetes while
African Americans tend to have a higher
prevalence of hypertension.
Ambulatory Care Utilization and Visit
Volume Trends
Although total visits have declined since 2003,
use of SPA 6 ambulatory facilities remains high,
especially for uninsured adults. The County
provides more care through health centers as
opposed to hospitals and private, community
based providers through the Public-Private
Partnership program (PPPs).
• There has been an overall decrease in
county-funded ambulatory care visits to
uninsured adults from 2000 to 2005.
— PPP visit volume provided in SPA 6
increased significantly in the same time
period (89% increase based on one
five-year study).
• SPA 6 has the highest utilization rate of
county-funded visits by uninsured adults.
• The majority of county-funded Ambulatory
Care visits to adults in SPA 6 took place at
LACDHS-operated health centers (almost 3
times more visits than at LACDHS hospitals
and PPPs combined).
— This is in contrast to LA County (use of
facilities by type is approximately equal).
• The percent of county-funded uninsured visits
compared to total uninsured adults may
indicate that a relatively small number of
uninsured patients are driving a disproportionate
share of ambulatory visits, a situation which
has been documented in other urban areas.
Source: LACHS Trends South LA, 2005; provided by LA Health Action (Los Angeles County Health Survey); Grumback et al., PrimaryCare Resources and Preventable Hospitalizations in California retrieved from www.ucop.edu on 2/7/2007; County-funded Ambulatory CareUtilization for Uninsured Adults in Los Angeles County, LA Health Action, Feb. 2007.
Area Asthma Asthma Diabetes Diabetes Hypertension HypertensionCases (%) Cases (%) Cases (%)
SPA 6 48,000 7.2% 77,000 11.7% 192,000 29.0%
Los Angeles County 472,000 6.5% 588,000 8.1% 1,700,000 23.4%
Chart 24: SPA 6 Asthma, Diabetes and Hypertension Rates.
Critical Condition: Examining the Scope of Medical Services in South Los Angeles40
— 21% of county-funded visits by uninsured
adults took place at SPA 6 facilities (2nd
highest compared to other SPAs); range
was 2% in SPA 5 to 25% in SPA 4)).
— But only 12% of LA County’s uninsured
adults live in SPA 6.
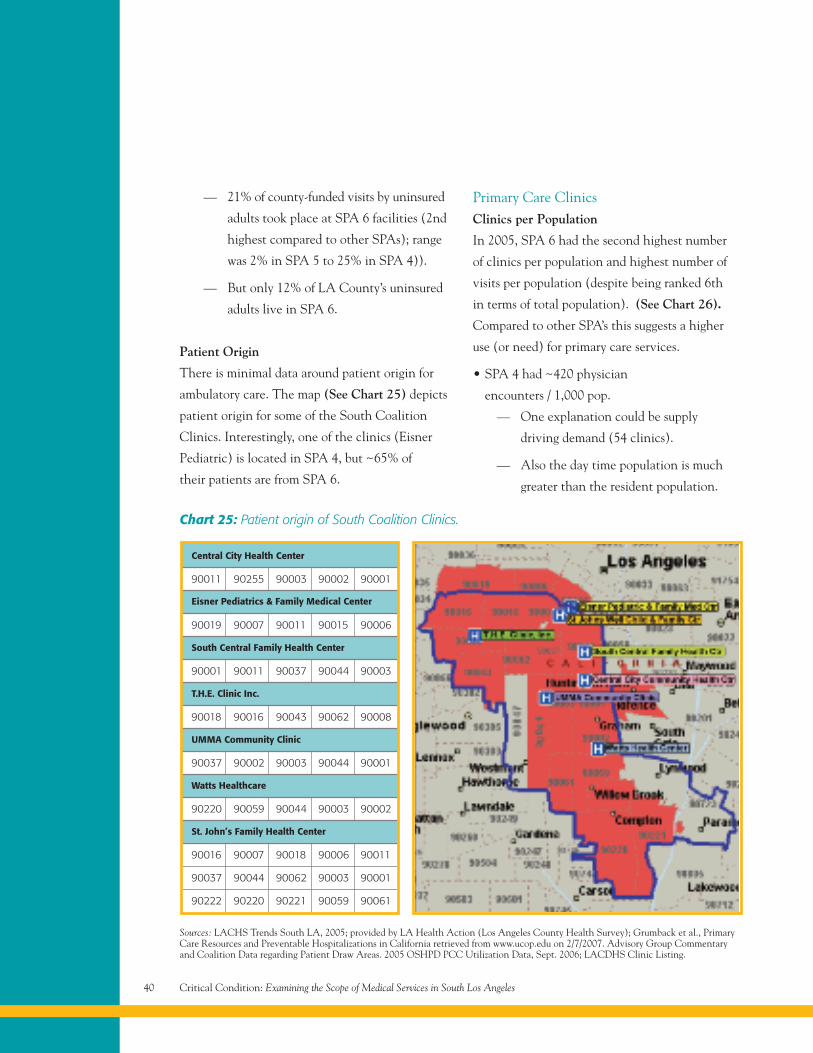
Patient Origin
There is minimal data around patient origin for
ambulatory care. The map (See Chart 25) depicts
patient origin for some of the South Coalition
Clinics. Interestingly, one of the clinics (Eisner
Pediatric) is located in SPA 4, but ~65% of
their patients are from SPA 6.
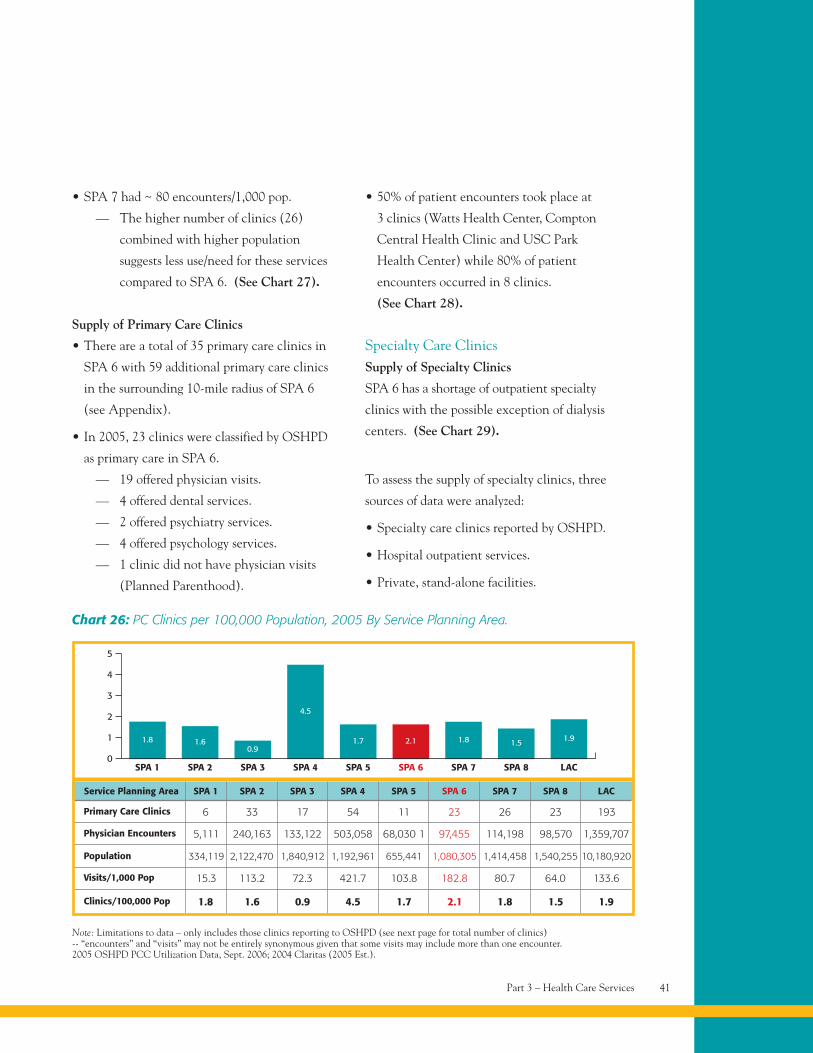
Primary Care ClinicsClinics per Population
In 2005, SPA 6 had the second highest number
of clinics per population and highest number of
visits per population (despite being ranked 6th
in terms of total population). (See Chart 26).
Compared to other SPA’s this suggests a higher
use (or need) for primary care services.
• SPA 4 had ~420 physician
encounters / 1,000 pop.
— One explanation could be supply
driving demand (54 clinics).
— Also the day time population is much
greater than the resident population.
Chart 25: Patient origin of South Coalition Clinics.
Central City Health Center
Eisner Pediatrics & Family Medical Center
South Central Family Health Center
T.H.E. Clinic Inc.
UMMA Community Clinic
Watts Healthcare
St. John’s Family Health Center
90011 90255 90003 90002 90001
90019 90007 90011 90015 90006
90001 90011 90037 90044 90003
90018 90016 90043 90062 90008
90037 90002 90003 90044 90001
90220 90059 90044 90003 90002
90016 90007 90018 90006 90011
90037 90044 90062 90003 90001
90222 90220 90221 90059 90061
Sources: LACHS Trends South LA, 2005; provided by LA Health Action (Los Angeles County Health Survey); Grumback et al., PrimaryCare Resources and Preventable Hospitalizations in California retrieved from www.ucop.edu on 2/7/2007. Advisory Group Commentaryand Coalition Data regarding Patient Draw Areas. 2005 OSHPD PCC Utilization Data, Sept. 2006; LACDHS Clinic Listing.
Part 3 – Health Care Services 41
Note: Limitations to data – only includes those clinics reporting to OSHPD (see next page for total number of clinics)-- “encounters” and “visits” may not be entirely synonymous given that some visits may include more than one encounter.2005 OSHPD PCC Utilization Data, Sept. 2006; 2004 Claritas (2005 Est.).
SPA 10
SPA 2 SPA 3 SPA 4 SPA 5 SPA 6 SPA 7
Chart 26: PC Clinics per 100,000 Population, 2005 By Service Planning Area.
SPA 8 LAC
1
2
3
4
5
1.8 1.60.9
4.5
1.7 2.1 1.8 1.5 1.9
Primary Care Clinics
Physician Encounters
Population
Visits/1,000 Pop
Clinics/100,000 Pop
6 33 17 54 11 23 26 23 193
5,111 240,163 133,122 503,058 68,030 1 97,455 114,198 98,570 1,359,707
15.3 113.2 72.3 421.7 103.8 182.8 80.7 64.0 133.6
1.8 1.6 0.9 4.5 1.7 2.1 1.8 1.5 1.9
Service Planning Area SPA 1 SPA 2 SPA 3 SPA 4 SPA 5 SPA 6 SPA 7 SPA 8 LAC
334,119 2,122,470 1,840,912 1,192,961 655,441 1,080,305 1,414,458 1,540,255 10,180,920
• SPA 7 had ~ 80 encounters/1,000 pop.
— The higher number of clinics (26)
combined with higher population
suggests less use/need for these services
compared to SPA 6. (See Chart 27).
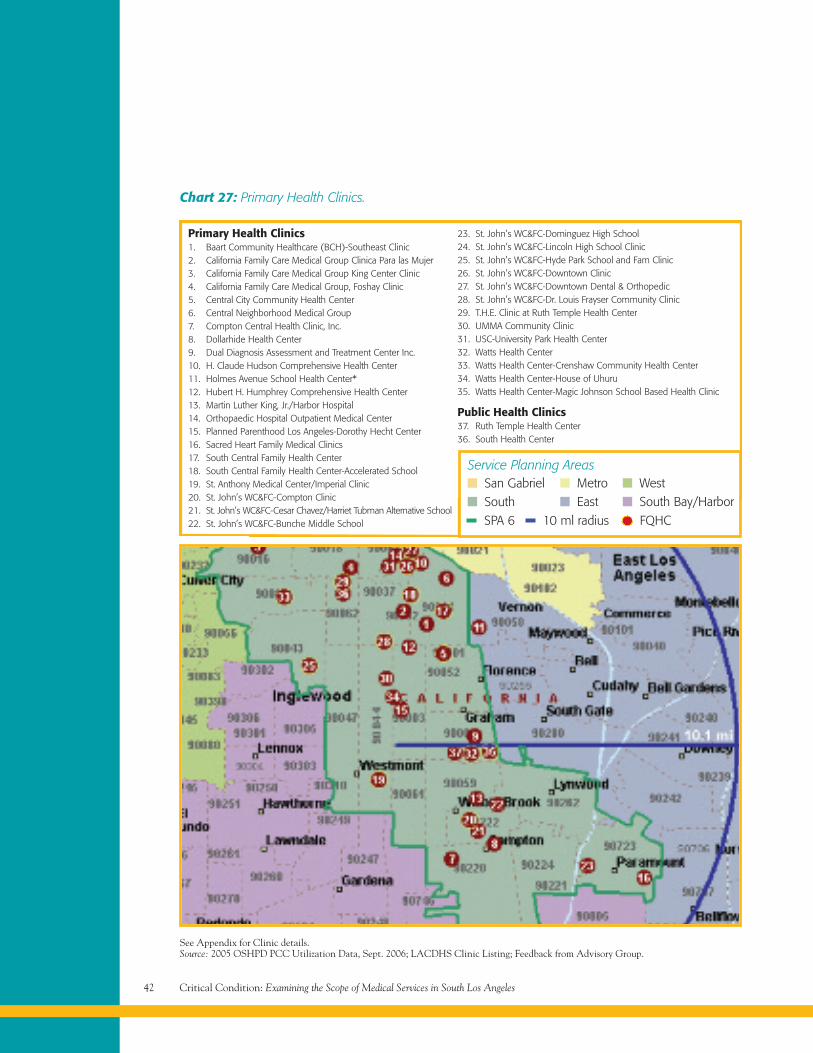
Supply of Primary Care Clinics
• There are a total of 35 primary care clinics in
SPA 6 with 59 additional primary care clinics
in the surrounding 10-mile radius of SPA 6
(see Appendix).
• In 2005, 23 clinics were classified by OSHPD
as primary care in SPA 6.
— 19 offered physician visits.
— 4 offered dental services.
— 2 offered psychiatry services.
— 4 offered psychology services.
— 1 clinic did not have physician visits
(Planned Parenthood).
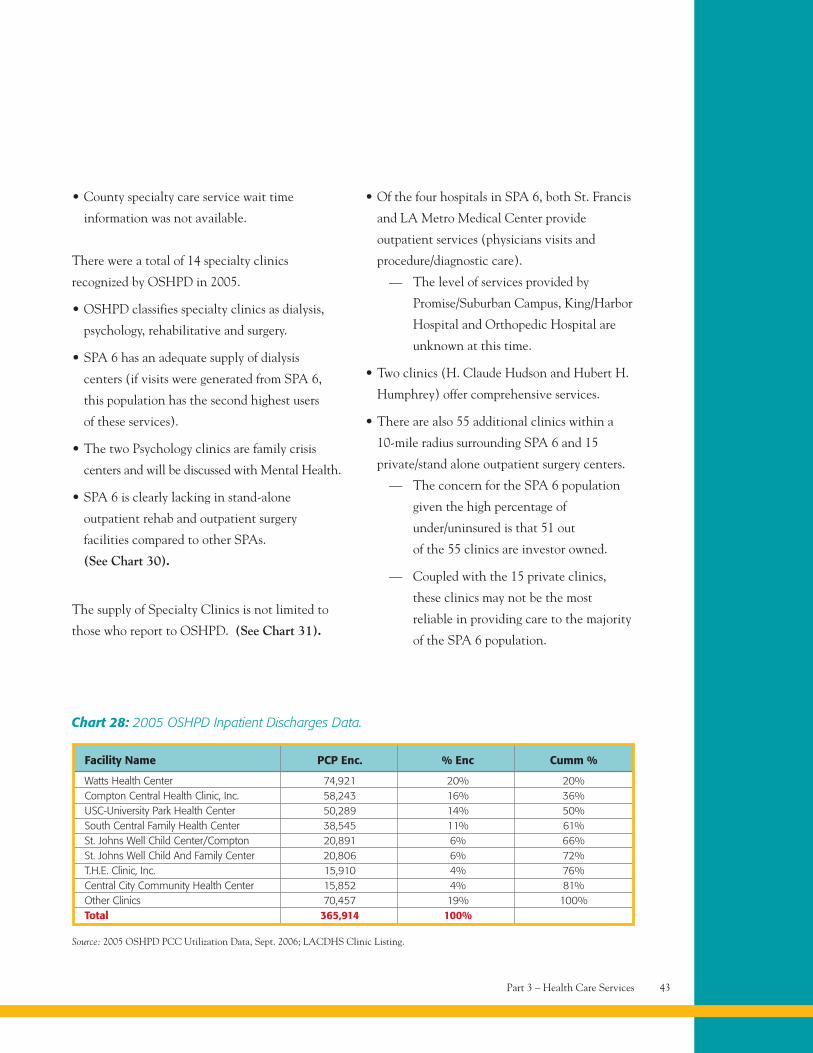
• 50% of patient encounters took place at
3 clinics (Watts Health Center, Compton
Central Health Clinic and USC Park
Health Center) while 80% of patient
encounters occurred in 8 clinics.
(See Chart 28).
Specialty Care ClinicsSupply of Specialty Clinics
SPA 6 has a shortage of outpatient specialty
clinics with the possible exception of dialysis
centers. (See Chart 29).
To assess the supply of specialty clinics, three
sources of data were analyzed:
• Specialty care clinics reported by OSHPD.
• Hospital outpatient services.
• Private, stand-alone facilities.
Critical Condition: Examining the Scope of Medical Services in South Los Angeles42
Chart 27: Primary Health Clinics.
See Appendix for Clinic details.Source: 2005 OSHPD PCC Utilization Data, Sept. 2006; LACDHS Clinic Listing; Feedback from Advisory Group.
Primary Health Clinics1. Baart Community Healthcare (BCH)-Southeast Clinic2. California Family Care Medical Group Clinica Para las Mujer3. California Family Care Medical Group King Center Clinic4. California Family Care Medical Group, Foshay Clinic5. Central City Community Health Center6. Central Neighborhood Medical Group7. Compton Central Health Clinic, Inc.8. Dollarhide Health Center9. Dual Diagnosis Assessment and Treatment Center Inc.10. H. Claude Hudson Comprehensive Health Center11. Holmes Avenue School Health Center*12. Hubert H. Humphrey Comprehensive Health Center13. Martin Luther King, Jr./Harbor Hospital14. Orthopaedic Hospital Outpatient Medical Center15. Planned Parenthood Los Angeles-Dorothy Hecht Center16. Sacred Heart Family Medical Clinics17. South Central Family Health Center18. South Central Family Health Center-Accelerated School19. St. Anthony Medical Center/Imperial Clinic20. St. John’s WC&FC-Compton Clinic21. St. John’s WC&FC-Cesar Chavez/Harriet Tubman Alternative School22. St. John’s WC&FC-Bunche Middle School
23. St. John’s WC&FC-Dominguez High School24. St. John’s WC&FC-Lincoln High School Clinic25. St. John’s WC&FC-Hyde Park School and Fam Clinic26. St. John’s WC&FC-Downtown Clinic27. St. John’s WC&FC-Downtown Dental & Orthopedic28. St. John’s WC&FC-Dr. Louis Frayser Community Clinic29. T.H.E. Clinic at Ruth Temple Health Center30. UMMA Community Clinic31. USC-University Park Health Center32. Watts Health Center33. Watts Health Center-Crenshaw Community Health Center34. Watts Health Center-House of Uhuru35. Watts Health Center-Magic Johnson School Based Health Clinic
Public Health Clinics37. Ruth Temple Health Center36. South Health Center
Service Planning Areas
SPA 6 10 ml radius FQHC
San GabrielSouth
MetroEast
WestSouth Bay/Harbor
Part 3 – Health Care Services 43
Chart 28: 2005 OSHPD Inpatient Discharges Data.
Facility Name PCP Enc. % Enc Cumm %
Watts Health Center 74,921 20% 20%Compton Central Health Clinic, Inc. 58,243 16% 36%USC-University Park Health Center 50,289 14% 50%South Central Family Health Center 38,545 11% 61%St. Johns Well Child Center/Compton 20,891 6% 66%St. Johns Well Child And Family Center 20,806 6% 72%T.H.E. Clinic, Inc. 15,910 4% 76%Central City Community Health Center 15,852 4% 81%Other Clinics 70,457 19% 100%Total 365,914 100%
Source: 2005 OSHPD PCC Utilization Data, Sept. 2006; LACDHS Clinic Listing.
• County specialty care service wait time
information was not available.
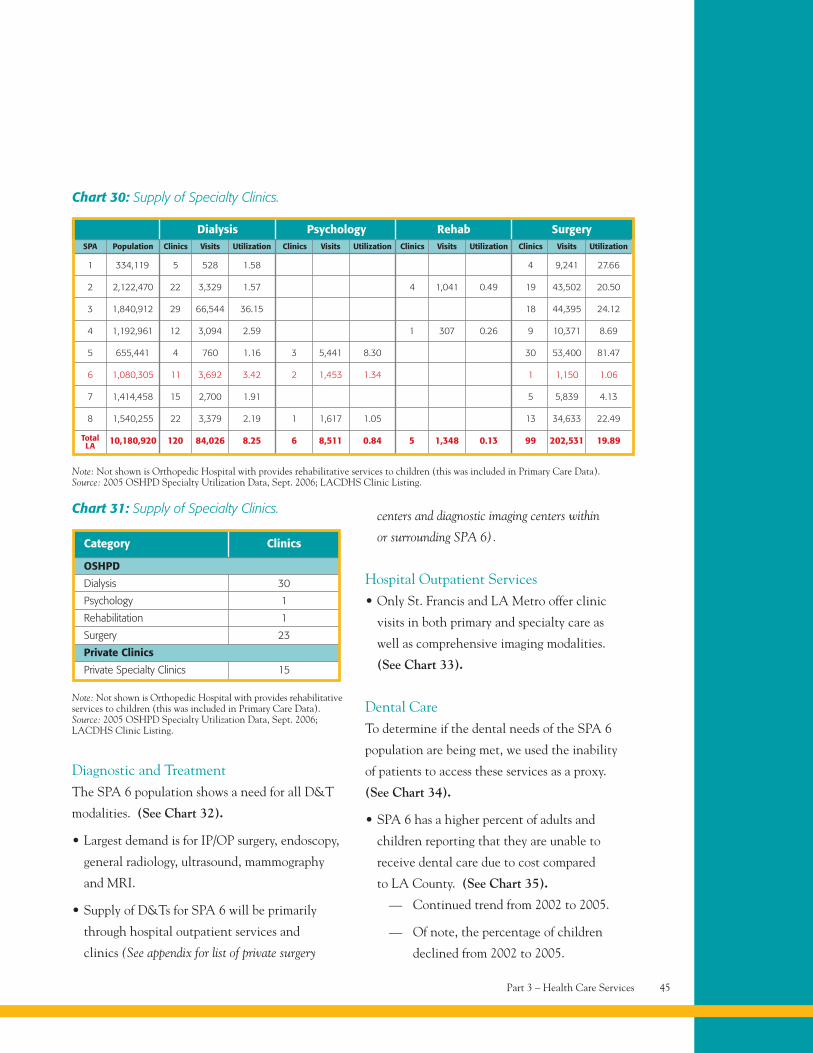
There were a total of 14 specialty clinics
recognized by OSHPD in 2005.
• OSHPD classifies specialty clinics as dialysis,
psychology, rehabilitative and surgery.
• SPA 6 has an adequate supply of dialysis
centers (if visits were generated from SPA 6,
this population has the second highest users
of these services).
• The two Psychology clinics are family crisis
centers and will be discussed with Mental Health.
• SPA 6 is clearly lacking in stand-alone
outpatient rehab and outpatient surgery
facilities compared to other SPAs.
(See Chart 30).
The supply of Specialty Clinics is not limited to
those who report to OSHPD. (See Chart 31).
• Of the four hospitals in SPA 6, both St. Francis
and LA Metro Medical Center provide
outpatient services (physicians visits and
procedure/diagnostic care).
— The level of services provided by
Promise/Suburban Campus, King/Harbor
Hospital and Orthopedic Hospital are
unknown at this time.
• Two clinics (H. Claude Hudson and Hubert H.
Humphrey) offer comprehensive services.
• There are also 55 additional clinics within a
10-mile radius surrounding SPA 6 and 15
private/stand alone outpatient surgery centers.
— The concern for the SPA 6 population
given the high percentage of
under/uninsured is that 51 out
of the 55 clinics are investor owned.
— Coupled with the 15 private clinics,
these clinics may not be the most
reliable in providing care to the majority
of the SPA 6 population.
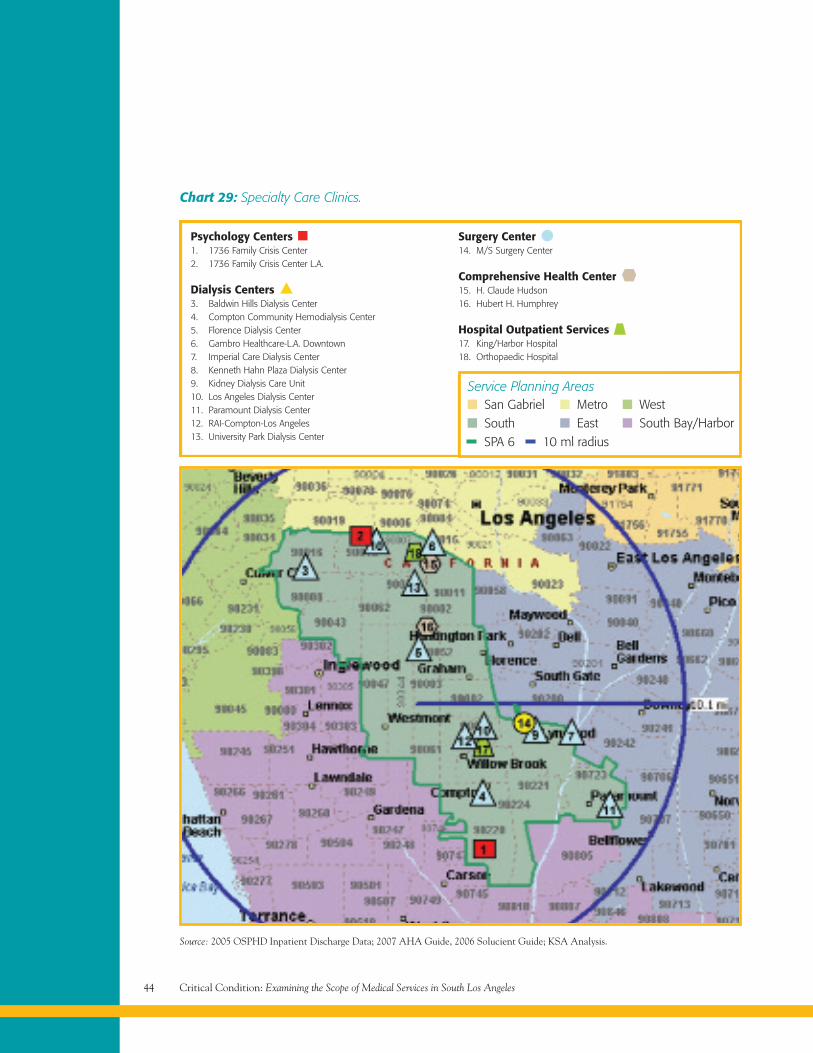
Surgery Center14. M/S Surgery Center
Comprehensive Health Center15. H. Claude Hudson16. Hubert H. Humphrey
Hospital Outpatient Services17. King/Harbor Hospital18. Orthopaedic Hospital
Critical Condition: Examining the Scope of Medical Services in South Los Angeles44
Chart 29: Specialty Care Clinics.
Source: 2005 OSPHD Inpatient Discharge Data; 2007 AHA Guide, 2006 Solucient Guide; KSA Analysis.
Psychology Centers1. 1736 Family Crisis Center2. 1736 Family Crisis Center L.A.
Dialysis Centers3. Baldwin Hills Dialysis Center4. Compton Community Hemodialysis Center5. Florence Dialysis Center6. Gambro Healthcare-L.A. Downtown7. Imperial Care Dialysis Center8. Kenneth Hahn Plaza Dialysis Center9. Kidney Dialysis Care Unit10. Los Angeles Dialysis Center11. Paramount Dialysis Center12. RAI-Compton-Los Angeles13. University Park Dialysis Center
Service Planning Areas
SPA 6 10 ml radius
San GabrielSouth
MetroEast
WestSouth Bay/Harbor
Diagnostic and TreatmentThe SPA 6 population shows a need for all D&T
modalities. (See Chart 32).
• Largest demand is for IP/OP surgery, endoscopy,
general radiology, ultrasound, mammography
and MRI.
• Supply of D&Ts for SPA 6 will be primarily
through hospital outpatient services and
clinics (See appendix for list of private surgery
centers and diagnostic imaging centers within
or surrounding SPA 6).
Hospital Outpatient Services• Only St. Francis and LA Metro offer clinic
visits in both primary and specialty care as
well as comprehensive imaging modalities.
(See Chart 33).
Dental CareTo determine if the dental needs of the SPA 6
population are being met, we used the inability
of patients to access these services as a proxy.
(See Chart 34).
• SPA 6 has a higher percent of adults and
children reporting that they are unable to
receive dental care due to cost compared
to LA County. (See Chart 35).
— Continued trend from 2002 to 2005.
— Of note, the percentage of children
declined from 2002 to 2005.
Part 3 – Health Care Services 45
Chart 30: Supply of Specialty Clinics.
Note: Not shown is Orthopedic Hospital with provides rehabilitative services to children (this was included in Primary Care Data).Source: 2005 OSHPD Specialty Utilization Data, Sept. 2006; LACDHS Clinic Listing.
Rehab SurgerySPA Population Clinics Visits Utilization Clinics Visits Utilization Clinics Visits Utilization
1 5 528 1.58 4 9,241 27.66334,119
2 22 3,329 1.57 4 1,041 0.49 19 43,502 20.502,122,470
3 29 66,544 36.15 18 44,395 24.121,840,912
4 12 3,094 2.59 1 307 0.26 9 10,371 8.691,192,961
5 4 760 1.16 30 53,400 81.47655,441
6 11 3,692 3.42 1 1,150 1.061,080,305
7 15 2,700 1.91 5 5,839 4.131,414,458
8 22 3,379 2.19 13 34,633 22.491,540,255
120 84,026 8.25 5 1,348 0.13 99 202,531 19.8910,180,920
Dialysis PsychologyClinics Visits Utilization
3 5,441 8.30
2 1,453 1.34
1 1,617 1.05
6 8,511 0.84TotalLA
Category Clinics
Chart 31: Supply of Specialty Clinics.
Note: Not shown is Orthopedic Hospital with provides rehabilitativeservices to children (this was included in Primary Care Data).Source: 2005 OSHPD Specialty Utilization Data, Sept. 2006;LACDHS Clinic Listing.
OSHPD
Dialysis 30
Psychology 1
Rehabilitation 1
Surgery 23
Private Clinics
Private Specialty Clinics 15
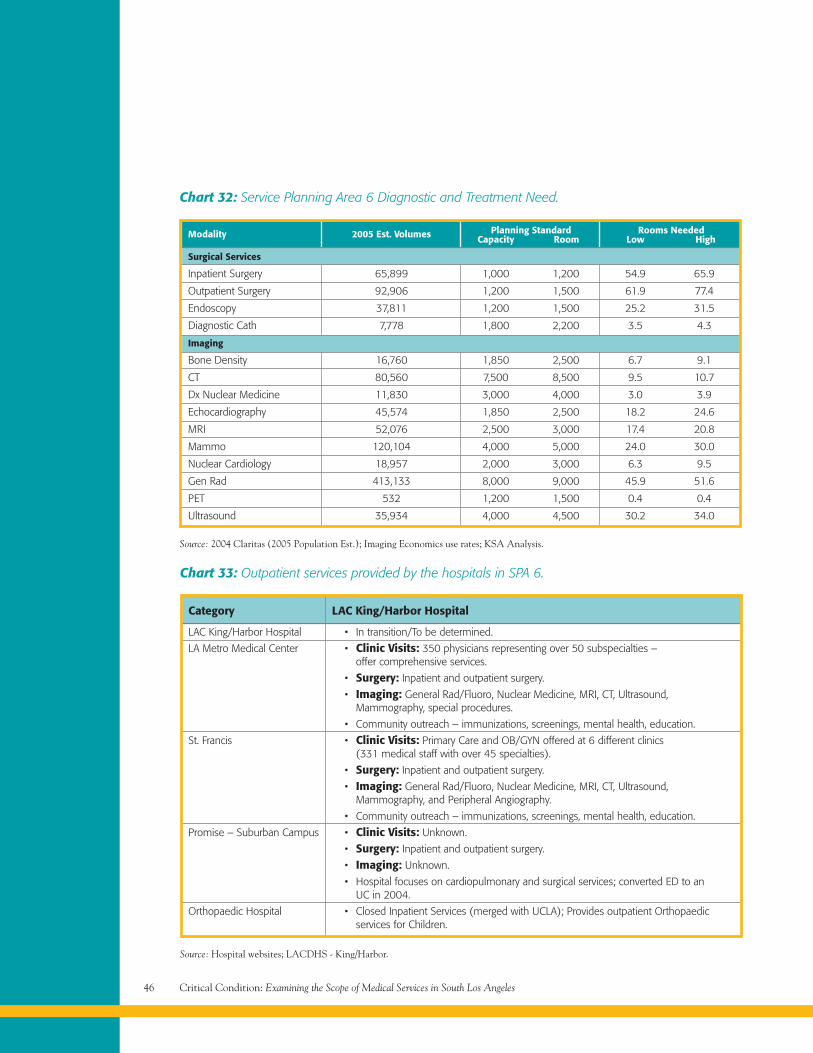
Critical Condition: Examining the Scope of Medical Services in South Los Angeles46
Modality 2005 Est. Volumes Planning Standard Rooms NeededCapacity Room Low High
Chart 32: Service Planning Area 6 Diagnostic and Treatment Need.
Surgical Services
Inpatient Surgery 65,899 1,000 1,200 54.9 65.9
Outpatient Surgery 92,906 1,200 1,500 61.9 77.4
Endoscopy 37,811 1,200 1,500 25.2 31.5
Diagnostic Cath 7,778 1,800 2,200 3.5 4.3
Imaging
Bone Density 16,760 1,850 2,500 6.7 9.1
CT 80,560 7,500 8,500 9.5 10.7
Dx Nuclear Medicine 11,830 3,000 4,000 3.0 3.9
Echocardiography 45,574 1,850 2,500 18.2 24.6
MRI 52,076 2,500 3,000 17.4 20.8
Mammo 120,104 4,000 5,000 24.0 30.0
Nuclear Cardiology 18,957 2,000 3,000 6.3 9.5
Gen Rad 413,133 8,000 9,000 45.9 51.6
PET 532 1,200 1,500 0.4 0.4
Ultrasound 35,934 4,000 4,500 30.2 34.0
Source: 2004 Claritas (2005 Population Est.); Imaging Economics use rates; KSA Analysis.
Category LAC King/Harbor Hospital
Chart 33: Outpatient services provided by the hospitals in SPA 6.
LAC King/Harbor Hospital • In transition/To be determined.
LA Metro Medical Center • Clinic Visits: 350 physicians representing over 50 subspecialties –offer comprehensive services.
• Surgery: Inpatient and outpatient surgery.
• Imaging: General Rad/Fluoro, Nuclear Medicine, MRI, CT, Ultrasound,Mammography, special procedures.
• Community outreach – immunizations, screenings, mental health, education.
St. Francis • Clinic Visits: Primary Care and OB/GYN offered at 6 different clinics(331 medical staff with over 45 specialties).
• Surgery: Inpatient and outpatient surgery.
• Imaging: General Rad/Fluoro, Nuclear Medicine, MRI, CT, Ultrasound,Mammography, and Peripheral Angiography.
• Community outreach – immunizations, screenings, mental health, education.
Promise – Suburban Campus • Clinic Visits: Unknown.• Surgery: Inpatient and outpatient surgery.
• Imaging: Unknown.• Hospital focuses on cardiopulmonary and surgical services; converted ED to an
UC in 2004.
Orthopaedic Hospital • Closed Inpatient Services (merged with UCLA); Provides outpatient Orthopaedicservices for Children.
Source: Hospital websites; LACDHS - King/Harbor.
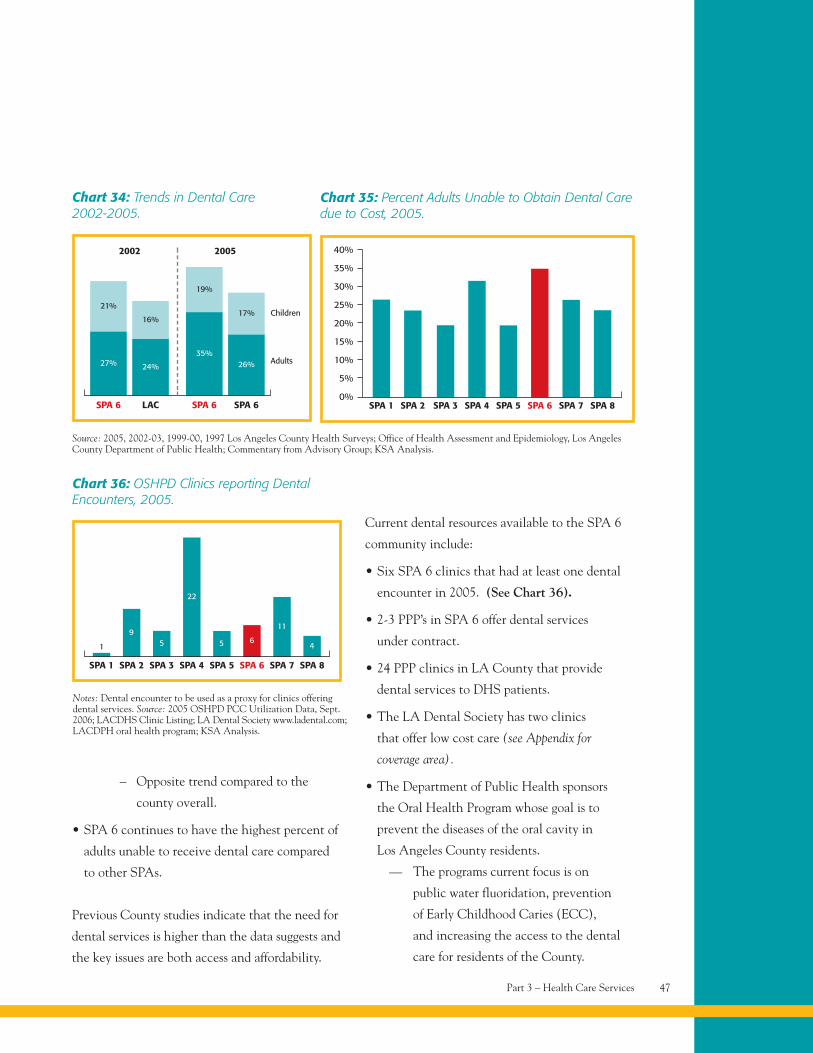
– Opposite trend compared to the
county overall.
• SPA 6 continues to have the highest percent of
adults unable to receive dental care compared
to other SPAs.
Previous County studies indicate that the need for
dental services is higher than the data suggests and
the key issues are both access and affordability.
Current dental resources available to the SPA 6
community include:
• Six SPA 6 clinics that had at least one dental
encounter in 2005. (See Chart 36).
• 2-3 PPP’s in SPA 6 offer dental services
under contract.
• 24 PPP clinics in LA County that provide
dental services to DHS patients.
• The LA Dental Society has two clinics
that offer low cost care (see Appendix for
coverage area).
• The Department of Public Health sponsors
the Oral Health Program whose goal is to
prevent the diseases of the oral cavity in
Los Angeles County residents.
— The programs current focus is on
public water fluoridation, prevention
of Early Childhood Caries (ECC),
and increasing the access to the dental
care for residents of the County.
Part 3 – Health Care Services 47
SPA 6
27%
LAC
24%
SPA 6 SPA 6
35%26%
21%
16%
19%
17%
Chart 34: Trends in Dental Care2002-2005.
Source: 2005, 2002-03, 1999-00, 1997 Los Angeles County Health Surveys; Office of Health Assessment and Epidemiology, Los AngelesCounty Department of Public Health; Commentary from Advisory Group; KSA Analysis.
2002 2005
Children
Adults
SPA 1 SPA 2 SPA 3 SPA 4 SPA 5 SPA 6 SPA 7
Chart 35: Percent Adults Unable to Obtain Dental Caredue to Cost, 2005.
SPA 8
40%
35%
30%
25%
20%
15%
10%
5%
0%
Notes: Dental encounter to be used as a proxy for clinics offeringdental services. Source: 2005 OSHPD PCC Utilization Data, Sept.2006; LACDHS Clinic Listing; LA Dental Society www.ladental.com;LACDPH oral health program; KSA Analysis.
SPA 1 SPA 2 SPA 3 SPA 4 SPA 5 SPA 6 SPA 7
Chart 36: OSHPD Clinics reporting DentalEncounters, 2005.
SPA 8
1
95
22
5 6
11
4
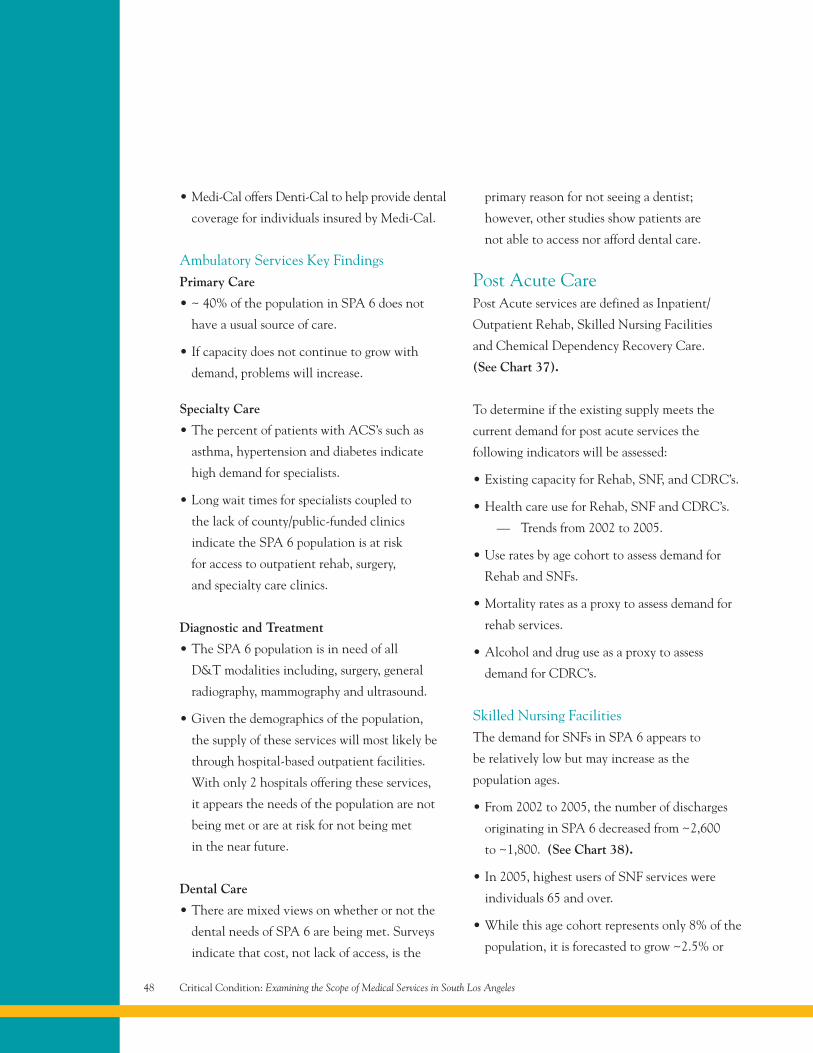
• Medi-Cal offers Denti-Cal to help provide dental
coverage for individuals insured by Medi-Cal.
Ambulatory Services Key FindingsPrimary Care
• ~ 40% of the population in SPA 6 does not
have a usual source of care.
• If capacity does not continue to grow with
demand, problems will increase.
Specialty Care
• The percent of patients with ACS’s such as
asthma, hypertension and diabetes indicate
high demand for specialists.
• Long wait times for specialists coupled to
the lack of county/public-funded clinics
indicate the SPA 6 population is at risk
for access to outpatient rehab, surgery,
and specialty care clinics.
Diagnostic and Treatment
• The SPA 6 population is in need of all
D&T modalities including, surgery, general
radiography, mammography and ultrasound.
• Given the demographics of the population,
the supply of these services will most likely be
through hospital-based outpatient facilities.
With only 2 hospitals offering these services,
it appears the needs of the population are not
being met or are at risk for not being met
in the near future.
Dental Care
• There are mixed views on whether or not the
dental needs of SPA 6 are being met. Surveys
indicate that cost, not lack of access, is the
primary reason for not seeing a dentist;
however, other studies show patients are
not able to access nor afford dental care.
Post Acute CarePost Acute services are defined as Inpatient/
Outpatient Rehab, Skilled Nursing Facilities
and Chemical Dependency Recovery Care.
(See Chart 37).
To determine if the existing supply meets the
current demand for post acute services the
following indicators will be assessed:
• Existing capacity for Rehab, SNF, and CDRC’s.
• Health care use for Rehab, SNF and CDRC’s.
— Trends from 2002 to 2005.
• Use rates by age cohort to assess demand for
Rehab and SNFs.
• Mortality rates as a proxy to assess demand for
rehab services.
• Alcohol and drug use as a proxy to assess
demand for CDRC’s.
Skilled Nursing FacilitiesThe demand for SNFs in SPA 6 appears to
be relatively low but may increase as the
population ages.
• From 2002 to 2005, the number of discharges
originating in SPA 6 decreased from ~2,600
to ~1,800. (See Chart 38).
• In 2005, highest users of SNF services were
individuals 65 and over.
• While this age cohort represents only 8% of the
population, it is forecasted to grow ~2.5% or
Critical Condition: Examining the Scope of Medical Services in South Los Angeles48
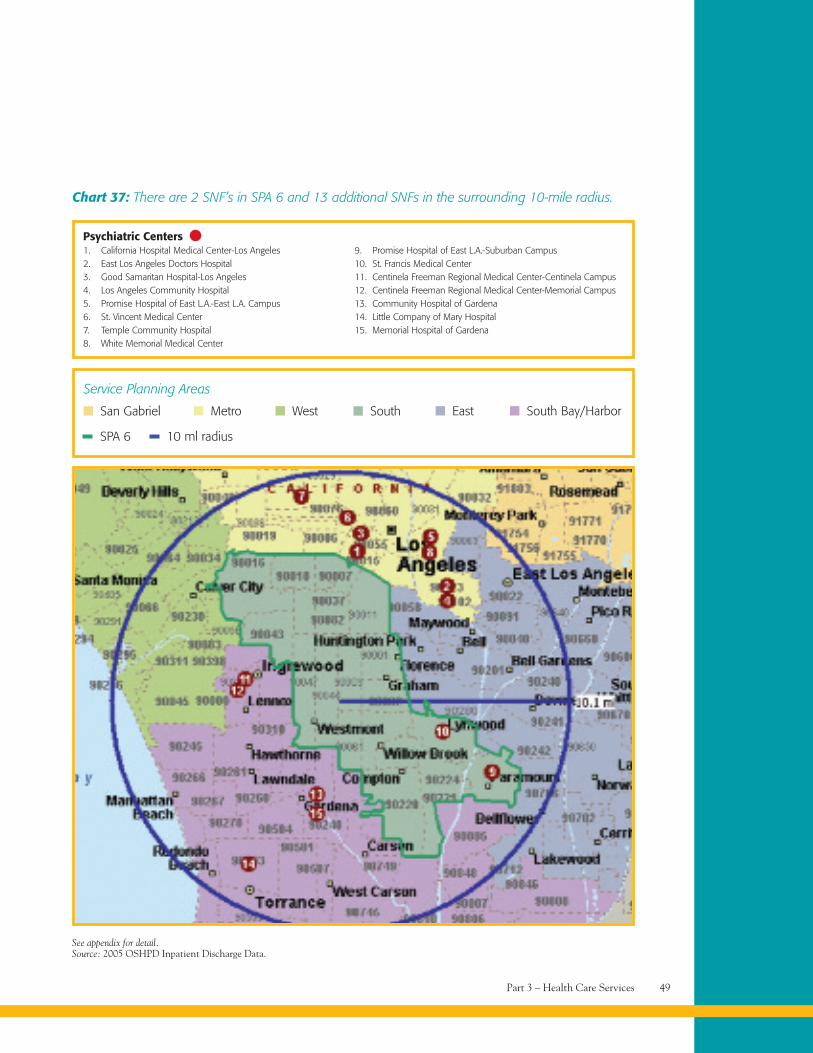
Part 3 – Health Care Services 49
Chart 37: There are 2 SNF’s in SPA 6 and 13 additional SNFs in the surrounding 10-mile radius.
Psychiatric Centers1. California Hospital Medical Center-Los Angeles2. East Los Angeles Doctors Hospital3. Good Samaritan Hospital-Los Angeles4. Los Angeles Community Hospital5. Promise Hospital of East L.A.-East L.A. Campus6. St. Vincent Medical Center7. Temple Community Hospital8. White Memorial Medical Center
9. Promise Hospital of East L.A.-Suburban Campus10. St. Francis Medical Center11. Centinela Freeman Regional Medical Center-Centinela Campus12. Centinela Freeman Regional Medical Center-Memorial Campus13. Community Hospital of Gardena14. Little Company of Mary Hospital15. Memorial Hospital of Gardena
Service Planning Areas
SPA 6 10 ml radius
San Gabriel Metro West South East South Bay/Harbor
See appendix for detail.Source: 2005 OSHPD Inpatient Discharge Data.
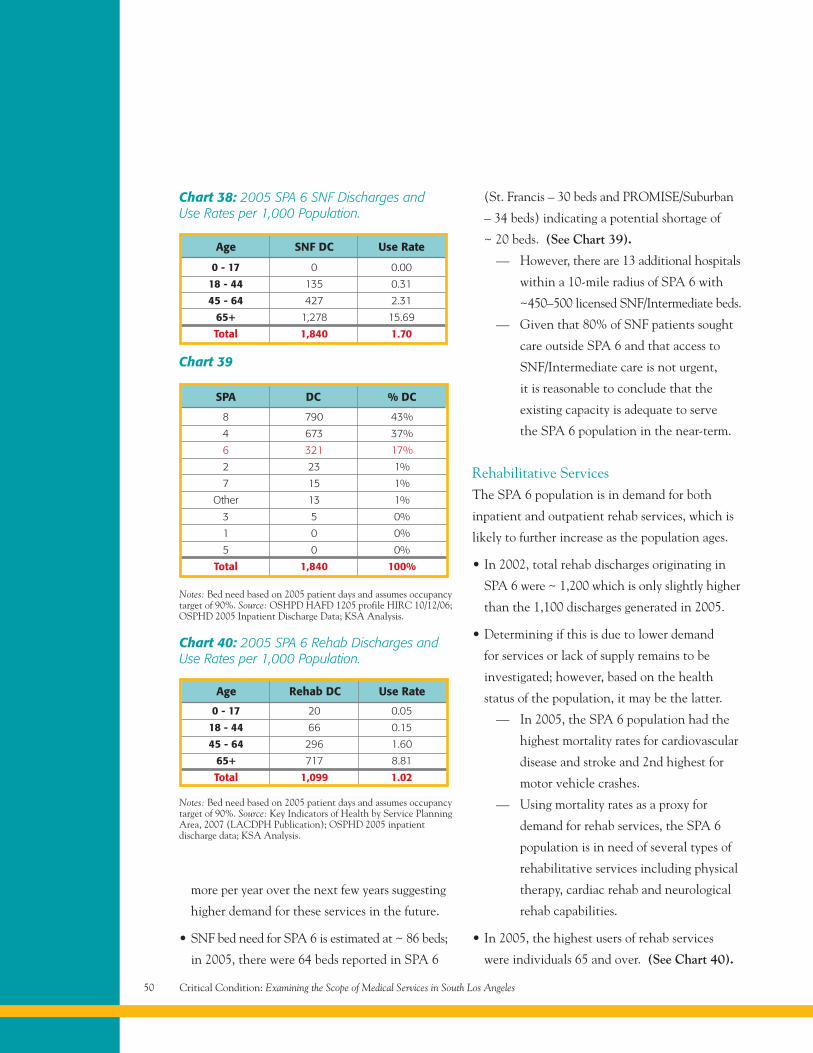
more per year over the next few years suggesting
higher demand for these services in the future.
• SNF bed need for SPA 6 is estimated at ~ 86 beds;
in 2005, there were 64 beds reported in SPA 6
(St. Francis – 30 beds and PROMISE/Suburban
– 34 beds) indicating a potential shortage of
~ 20 beds. (See Chart 39).
— However, there are 13 additional hospitals
within a 10-mile radius of SPA 6 with
~450–500 licensed SNF/Intermediate beds.
— Given that 80% of SNF patients sought
care outside SPA 6 and that access to
SNF/Intermediate care is not urgent,
it is reasonable to conclude that the
existing capacity is adequate to serve
the SPA 6 population in the near-term.
Rehabilitative ServicesThe SPA 6 population is in demand for both
inpatient and outpatient rehab services, which is
likely to further increase as the population ages.
• In 2002, total rehab discharges originating in
SPA 6 were ~ 1,200 which is only slightly higher
than the 1,100 discharges generated in 2005.
• Determining if this is due to lower demand
for services or lack of supply remains to be
investigated; however, based on the health
status of the population, it may be the latter.
— In 2005, the SPA 6 population had the
highest mortality rates for cardiovascular
disease and stroke and 2nd highest for
motor vehicle crashes.
— Using mortality rates as a proxy for
demand for rehab services, the SPA 6
population is in need of several types of
rehabilitative services including physical
therapy, cardiac rehab and neurological
rehab capabilities.
• In 2005, the highest users of rehab services
were individuals 65 and over. (See Chart 40).
Critical Condition: Examining the Scope of Medical Services in South Los Angeles50
Chart 38: 2005 SPA 6 SNF Discharges andUse Rates per 1,000 Population.
Notes: Bed need based on 2005 patient days and assumes occupancytarget of 90%. Source: OSHPD HAFD 1205 profile HIRC 10/12/06;OSPHD 2005 Inpatient Discharge Data; KSA Analysis.
Notes: Bed need based on 2005 patient days and assumes occupancytarget of 90%. Source: Key Indicators of Health by Service PlanningArea, 2007 (LACDPH Publication); OSPHD 2005 inpatientdischarge data; KSA Analysis.
Chart 39
Chart 40: 2005 SPA 6 Rehab Discharges andUse Rates per 1,000 Population.
8 790 43%
4 673 37%
6 321 17%
2 23 1%
7 15 1%
Other 13 1%
3 5 0%
1 0 0%
5 0 0%
Total 1,840 100%
0 - 17 0 0.00
18 - 44 135 0.31
45 - 64 427 2.31
65+ 1,278 15.69
Total 1,840 1.70
0 - 17 20 0.05
18 - 44 66 0.15
45 - 64 296 1.60
65+ 717 8.81
Total 1,099 1.02
Age Rehab DC Use Rate
SPA DC % DC
Age SNF DC Use Rate
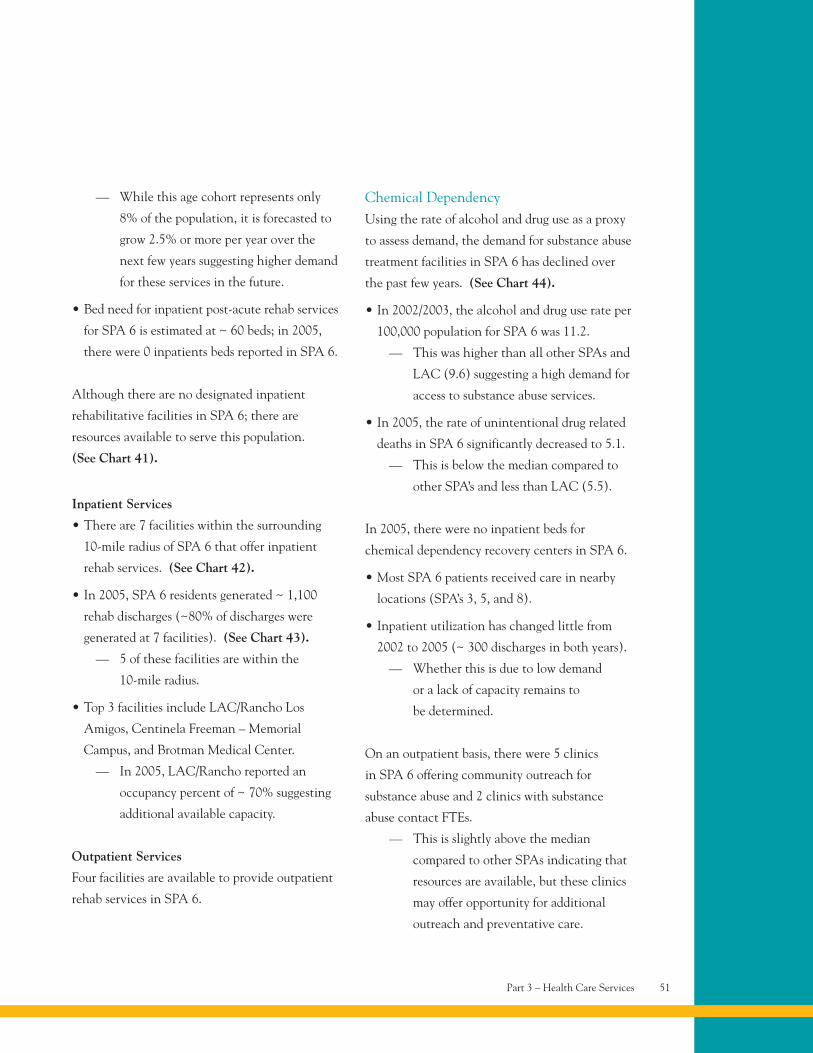
— While this age cohort represents only
8% of the population, it is forecasted to
grow 2.5% or more per year over the
next few years suggesting higher demand
for these services in the future.
• Bed need for inpatient post-acute rehab services
for SPA 6 is estimated at ~ 60 beds; in 2005,
there were 0 inpatients beds reported in SPA 6.
Although there are no designated inpatient
rehabilitative facilities in SPA 6; there are
resources available to serve this population.
(See Chart 41).
Inpatient Services
• There are 7 facilities within the surrounding
10-mile radius of SPA 6 that offer inpatient
rehab services. (See Chart 42).
• In 2005, SPA 6 residents generated ~ 1,100
rehab discharges (~80% of discharges were
generated at 7 facilities). (See Chart 43).
— 5 of these facilities are within the
10-mile radius.
• Top 3 facilities include LAC/Rancho Los
Amigos, Centinela Freeman – Memorial
Campus, and Brotman Medical Center.
— In 2005, LAC/Rancho reported an
occupancy percent of ~ 70% suggesting
additional available capacity.
Outpatient Services
Four facilities are available to provide outpatient
rehab services in SPA 6.
Chemical DependencyUsing the rate of alcohol and drug use as a proxy
to assess demand, the demand for substance abuse
treatment facilities in SPA 6 has declined over
the past few years. (See Chart 44).
• In 2002/2003, the alcohol and drug use rate per
100,000 population for SPA 6 was 11.2.
— This was higher than all other SPAs and
LAC (9.6) suggesting a high demand for
access to substance abuse services.
• In 2005, the rate of unintentional drug related
deaths in SPA 6 significantly decreased to 5.1.
— This is below the median compared to
other SPA’s and less than LAC (5.5).
In 2005, there were no inpatient beds for
chemical dependency recovery centers in SPA 6.
• Most SPA 6 patients received care in nearby
locations (SPA’s 3, 5, and 8).
• Inpatient utilization has changed little from
2002 to 2005 (~ 300 discharges in both years).
— Whether this is due to low demand
or a lack of capacity remains to
be determined.
On an outpatient basis, there were 5 clinics
in SPA 6 offering community outreach for
substance abuse and 2 clinics with substance
abuse contact FTEs.
— This is slightly above the median
compared to other SPAs indicating that
resources are available, but these clinics
may offer opportunity for additional
outreach and preventative care.
Part 3 – Health Care Services 51
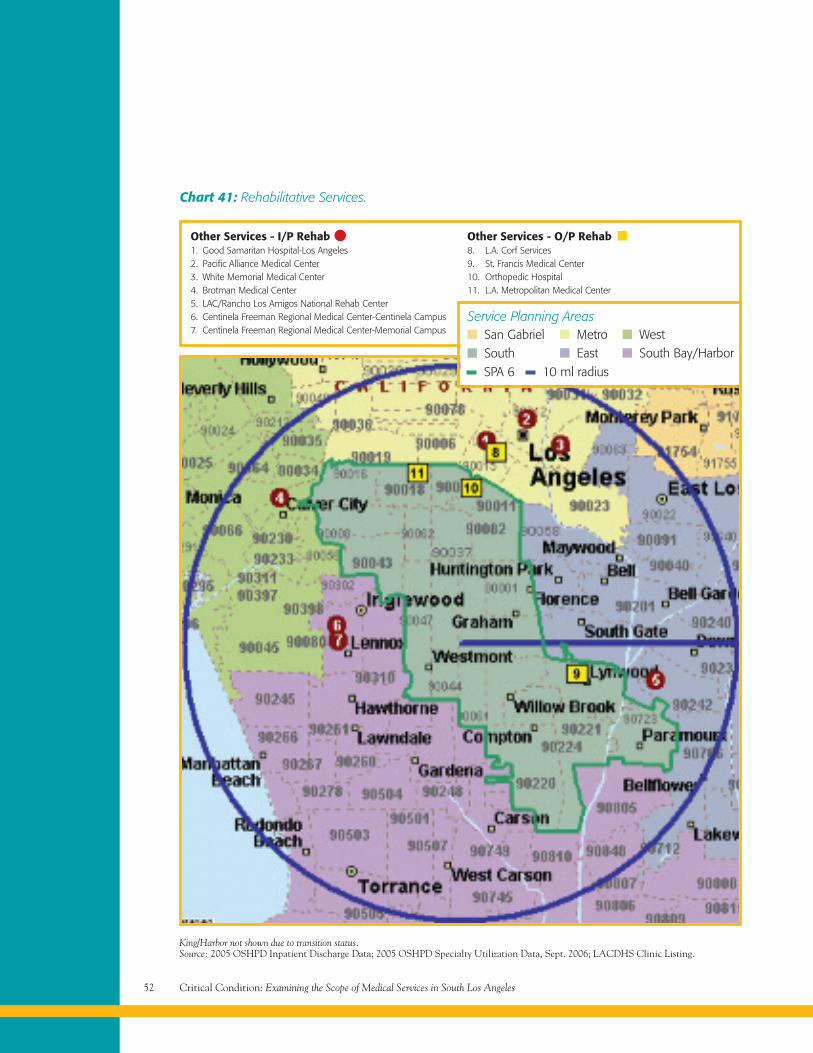
Critical Condition: Examining the Scope of Medical Services in South Los Angeles52
Chart 41: Rehabilitative Services.
Other Services - I/P Rehab1. Good Samaritan Hospital-Los Angeles2. Pacific Alliance Medical Center3. White Memorial Medical Center4. Brotman Medical Center5. LAC/Rancho Los Amigos National Rehab Center6. Centinela Freeman Regional Medical Center-Centinela Campus7. Centinela Freeman Regional Medical Center-Memorial Campus
Other Services - O/P Rehab8. L.A. Corf Services9. St. Francis Medical Center10. Orthopedic Hospital11. L.A. Metropolitan Medical Center
King/Harbor not shown due to transition status.Source: 2005 OSHPD Inpatient Discharge Data; 2005 OSHPD Specialty Utilization Data, Sept. 2006; LACDHS Clinic Listing.
Service Planning Areas
SPA 6 10 ml radius
San GabrielSouth
MetroEast
WestSouth Bay/Harbor
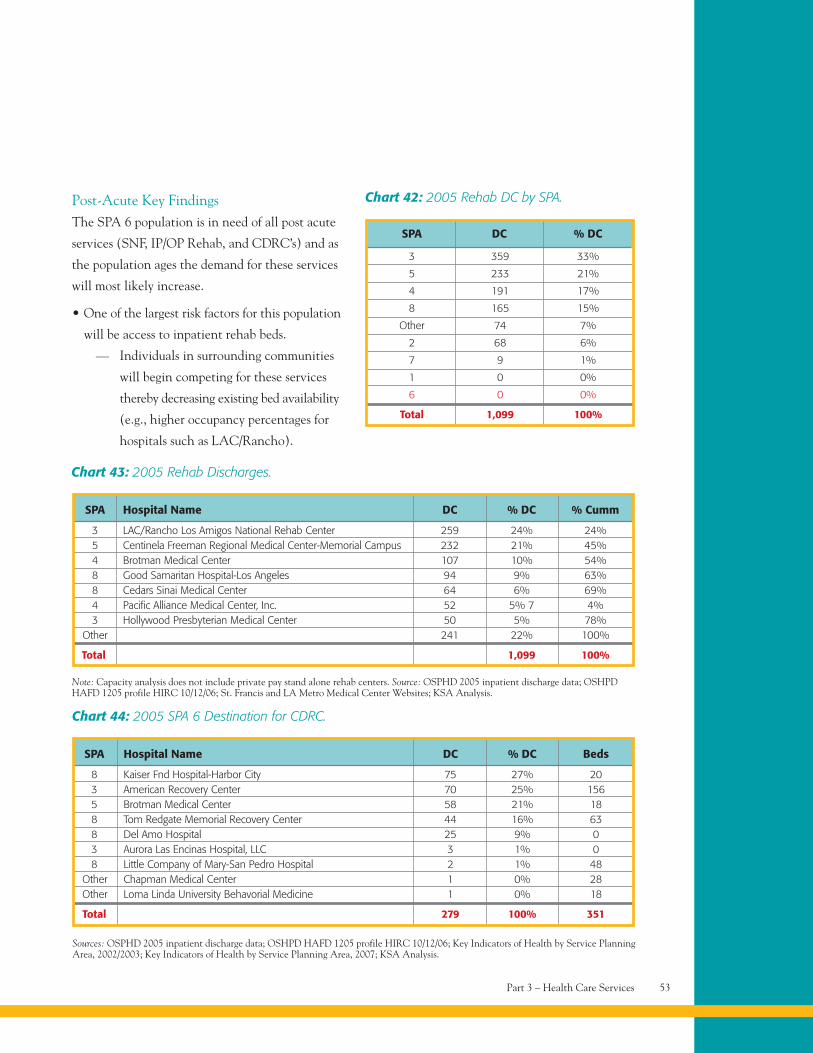
Part 3 – Health Care Services 53
Chart 43: 2005 Rehab Discharges.
SPA Hospital Name DC % DC % Cumm
3 LAC/Rancho Los Amigos National Rehab Center 259 24% 24%5 Centinela Freeman Regional Medical Center-Memorial Campus 232 21% 45%4 Brotman Medical Center 107 10% 54%8 Good Samaritan Hospital-Los Angeles 94 9% 63%8 Cedars Sinai Medical Center 64 6% 69%4 Pacific Alliance Medical Center, Inc. 52 5% 7 4%3 Hollywood Presbyterian Medical Center 50 5% 78%
Other 241 22% 100%
Total 1,099 100%
3 359 33%
5 233 21%
4 191 17%
8 165 15%
Other 74 7%
2 68 6%
7 9 1%
1 0 0%
6 0 0%
Total 1,099 100%
SPA DC % DC
Chart 42: 2005 Rehab DC by SPA.
Note: Capacity analysis does not include private pay stand alone rehab centers. Source: OSPHD 2005 inpatient discharge data; OSHPDHAFD 1205 profile HIRC 10/12/06; St. Francis and LA Metro Medical Center Websites; KSA Analysis.
Chart 44: 2005 SPA 6 Destination for CDRC.
SPA Hospital Name DC % DC Beds
8 Kaiser Fnd Hospital-Harbor City 75 27% 203 American Recovery Center 70 25% 1565 Brotman Medical Center 58 21% 188 Tom Redgate Memorial Recovery Center 44 16% 638 Del Amo Hospital 25 9% 03 Aurora Las Encinas Hospital, LLC 3 1% 08 Little Company of Mary-San Pedro Hospital 2 1% 48
Other Chapman Medical Center 1 0% 28Other Loma Linda University Behavorial Medicine 1 0% 18
Total 279 100% 351
Sources: OSPHD 2005 inpatient discharge data; OSHPD HAFD 1205 profile HIRC 10/12/06; Key Indicators of Health by Service PlanningArea, 2002/2003; Key Indicators of Health by Service Planning Area, 2007; KSA Analysis.
Post-Acute Key FindingsThe SPA 6 population is in need of all post acute
services (SNF, IP/OP Rehab, and CDRC’s) and as
the population ages the demand for these services
will most likely increase.
• One of the largest risk factors for this population
will be access to inpatient rehab beds.
— Individuals in surrounding communities
will begin competing for these services
thereby decreasing existing bed availability
(e.g., higher occupancy percentages for
hospitals such as LAC/Rancho).
Critical Condition: Examining the Scope of Medical Services in South Los Angeles54
Despite the high demand for services, it appears
that the existing capacity of these services within
and surrounding SPA 6 appears to be meeting the
needs of this population in the short-term.
• In addition, the non-urgent/non-emergent
nature of post acute care suggests having a
great post acute presence in SPA 6 is not as
important as other services such as ED/Trauma.
• With that said, access to these resources should
be re-evaluated in the future.
Public HealthTo identify how public health services in SPA 6
compare to other areas and determine if the
needs of the SPA 6 population are being met,
the following indicators will be assessed:
• Outpatient clinics.
• Disease control and prevention.
• Vital statistics.
• Environmental health services.
Demand for Public HealthTo assess the demand for public health, the SPA 6
population will be evaluated and compared
to LA County in three areas: Health Status,
Preventative Health and Health Outcomes.
Health Status
• In general, most adults in SPA 6 report having
poorer health compared to LAC.
— They are more obese, less physically
active and eat less fruits and vegetables
per day. (See Chart 45).
Preventative Health
• In 2005, SPA 6 adults reported the lowest
percent of adults receiving flu shots compared
other SPAs and LAC.
•Percent of adults screened for colorectal cancer
increased from 31.4% in 2002 to 64.3% in 2005.
• 35% of SPA 6 adults reported that they did not
have routine dental check up because of cost.
(See Chart 46).
Note: Not inclusive of all indicators; Sources provided for those wanting additional information.Sources: Key Indicators of Health by Service Planning Area, 2007; KSA Analysis.
Area Flu Vaccination Colorectal Screenings No Access to Dental Care(65 and over)
SPA 6 49.5% 64.3% 35.1%
Los Angeles County 57.7% 63.8% 25.6%
Chart 46: Preventative Health.
Area % Obese Adults % Active Adults % Nutrition % Poor Health(Fruits/Veggies)
SPA 6 30.0% 45.6% 10.7% 33.4%
Los Angeles County 20.9% 51.8% 14.6% 20.6%
Chart 45: Health Status.
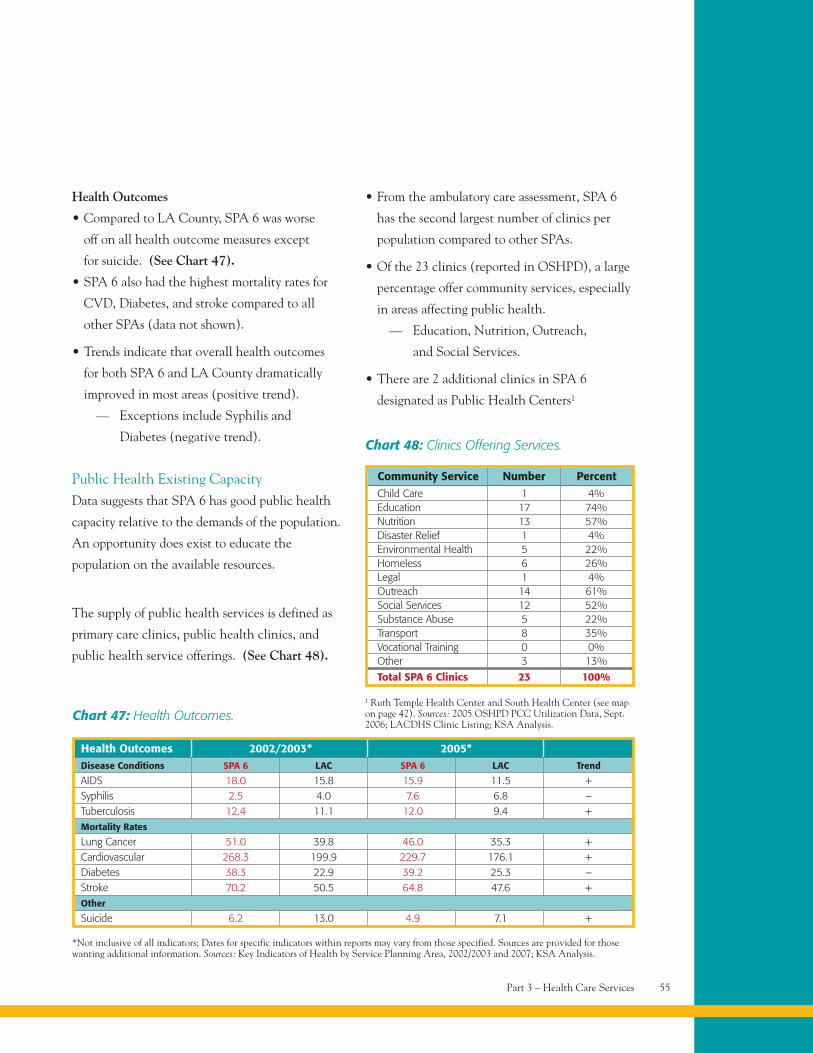
Health Outcomes
• Compared to LA County, SPA 6 was worse
off on all health outcome measures except
for suicide. (See Chart 47).
• SPA 6 also had the highest mortality rates for
CVD, Diabetes, and stroke compared to all
other SPAs (data not shown).
• Trends indicate that overall health outcomes
for both SPA 6 and LA County dramatically
improved in most areas (positive trend).
— Exceptions include Syphilis and
Diabetes (negative trend).
Public Health Existing CapacityData suggests that SPA 6 has good public health
capacity relative to the demands of the population.
An opportunity does exist to educate the
population on the available resources.
The supply of public health services is defined as
primary care clinics, public health clinics, and
public health service offerings. (See Chart 48).
• From the ambulatory care assessment, SPA 6
has the second largest number of clinics per
population compared to other SPAs.
• Of the 23 clinics (reported in OSHPD), a large
percentage offer community services, especially
in areas affecting public health.
— Education, Nutrition, Outreach,
and Social Services.
• There are 2 additional clinics in SPA 6
designated as Public Health Centers1
Community Service Number Percent
Chart 48: Clinics Offering Services.
1 Ruth Temple Health Center and South Health Center (see mapon page 42). Sources: 2005 OSHPD PCC Utilization Data, Sept.2006; LACDHS Clinic Listing; KSA Analysis.
Child Care 1 4%Education 17 74%Nutrition 13 57%Disaster Relief 1 4%Environmental Health 5 22%Homeless 6 26%Legal 1 4%Outreach 14 61%Social Services 12 52%Substance Abuse 5 22%Transport 8 35%Vocational Training 0 0%Other 3 13%
Total SPA 6 Clinics 23 100%
Part 3 – Health Care Services 55
Health Outcomes 2002/2003* 2005*
Chart 47: Health Outcomes.
Disease Conditions SPA 6 LAC SPA 6 LAC Trend
AIDS 18.0 15.8 15.9 11.5 +Syphilis 2.5 4.0 7.6 6.8 –Tuberculosis 12.4 11.1 12.0 9.4 +Mortality Rates
Lung Cancer 51.0 39.8 46.0 35.3 +Cardiovascular 268.3 199.9 229.7 176.1 +Diabetes 38.3 22.9 39.2 25.3 –Stroke 70.2 50.5 64.8 47.6 +Other
Suicide 6.2 13.0 4.9 7.1 +
*Not inclusive of all indicators; Dates for specific indicators within reports may vary from those specified. Sources are provided for thosewanting additional information. Sources: Key Indicators of Health by Service Planning Area, 2002/2003 and 2007; KSA Analysis.
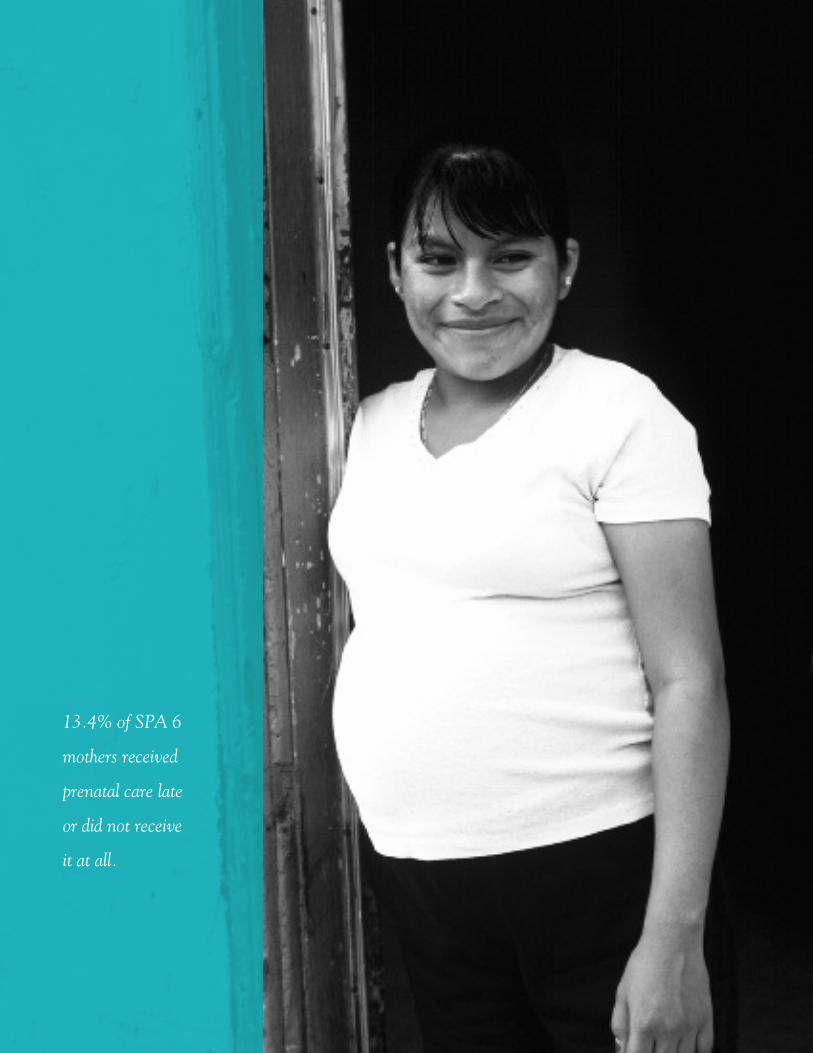
13.4% of SPA 6
mothers received
prenatal care late
or did not receive
it at all.
Mental Health Services 58
Mental Health Facilities 59
Inpatient Psychiatric Care 61
Mental Health Key Findings 62
Women and Children 62
Part 4Subsets of theTargeted Population
Critical Condition: Examining the Scope of Medical Services in South Los Angeles58
Subsets of the Targeted Population
Mental Health ServicesMental Health (MH) is defined as inpatient
psychiatric services and outpatient psychiatric,
psychology, and therapy services.
The following indicators will be used to determine
if the mental health needs of the SPA 6 population
are being met:
• Demand based on population/demographics.
• Use of inpatient services (comparison of
demand vs. supply).
• Supply of mental health services compared to
other locations.
The SPA 6 population is at risk for mental health
problems suggesting a high demand for mental
health services.
• The diverse and low-income population
suggests SPA 6 residents are in higher
need of mental health services.
— Ethnic and racial minority groups with
high levels of poverty and low levels of
education are thought to be more at risk
for mental-health problems.
— The under/uninsured are less likely to
receive treatment; racially and ethnically
diverse populations may also be less likely
to seek mental health care services.
• In 2001, 3.7% of the SPA 6 population sought
treatment for MH services; of these,
— 88% were for non 24-hour services
including major depression, personality
disorders, bipolar/psychosis, and
schizophrenia.
— 10% received 24-hour acute hospital
treatment and 2% sought treatment
in 24-hour non hospital facilities.
– The top diagnosis for these patients
was schizophrenia.
• More recently, it was found that the high rates
of depressive disorders in LA County call for an
expansion of MH services.
— It should be noted, however, that
the percent of adults diagnosed with
depression in SPA 6 is lower compared
to other SPAs and LA County (6.6%
SPA 6 vs. 9.8% LAC).
Substance abuse and failure to undergo treatment
(e.g., medication) for mental health disorders are
considered major predictors of homelessness.
The Treatment Advocacy Center states that at
any given time there are more people who go
untreated for severe psychiatric illness compared
to the number of people receiving care in hospitals.
Sources: Ethnic Minorities Still Lack Adequate MH Care, Experts State (American Psychiatric Association) retrieved from the Networkof Care-Los Angeles-Mental Health on 2/22/07; Mental Health and Racial Ethnic Minorities (American Association of World Health)retrieved from the Network of Care-Los Angeles-Mental Health on 2/22/07; Patient Assessment Survey III, Final Report; Key Indicatorsof Health by Service Planning Area 2002/2003 LACDPH.
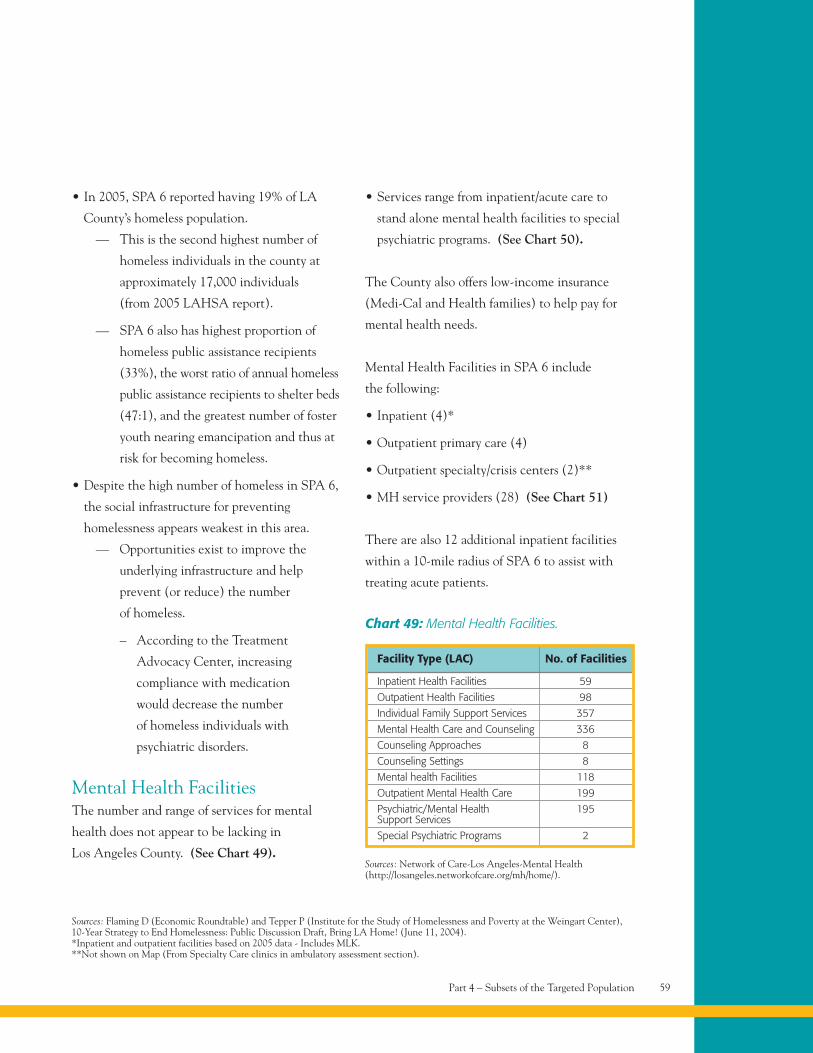
• In 2005, SPA 6 reported having 19% of LA
County’s homeless population.
— This is the second highest number of
homeless individuals in the county at
approximately 17,000 individuals
(from 2005 LAHSA report).
— SPA 6 also has highest proportion of
homeless public assistance recipients
(33%), the worst ratio of annual homeless
public assistance recipients to shelter beds
(47:1), and the greatest number of foster
youth nearing emancipation and thus at
risk for becoming homeless.
• Despite the high number of homeless in SPA 6,
the social infrastructure for preventing
homelessness appears weakest in this area.
— Opportunities exist to improve the
underlying infrastructure and help
prevent (or reduce) the number
of homeless.
– According to the Treatment
Advocacy Center, increasing
compliance with medication
would decrease the number
of homeless individuals with
psychiatric disorders.
Mental Health FacilitiesThe number and range of services for mental
health does not appear to be lacking in
Los Angeles County. (See Chart 49).
• Services range from inpatient/acute care to
stand alone mental health facilities to special
psychiatric programs. (See Chart 50).
The County also offers low-income insurance
(Medi-Cal and Health families) to help pay for
mental health needs.
Mental Health Facilities in SPA 6 include
the following:
• Inpatient (4)*
• Outpatient primary care (4)
• Outpatient specialty/crisis centers (2)**
• MH service providers (28) (See Chart 51)
There are also 12 additional inpatient facilities
within a 10-mile radius of SPA 6 to assist with
treating acute patients.
Part 4 – Subsets of the Targeted Population 59
Sources: Flaming D (Economic Roundtable) and Tepper P (Institute for the Study of Homelessness and Poverty at the Weingart Center),10-Year Strategy to End Homelessness: Public Discussion Draft, Bring LA Home! (June 11, 2004).*Inpatient and outpatient facilities based on 2005 data - Includes MLK.**Not shown on Map (From Specialty Care clinics in ambulatory assessment section).
Facility Type (LAC) No. of Facilities
Chart 49: Mental Health Facilities.
Sources: Network of Care-Los Angeles-Mental Health(http://losangeles.networkofcare.org/mh/home/).
Inpatient Health Facilities 59
Outpatient Health Facilities 98
Individual Family Support Services 357
Mental Health Care and Counseling 336
Counseling Approaches 8
Counseling Settings 8
Mental health Facilities 118
Outpatient Mental Health Care 199
Psychiatric/Mental Health 195Support Services
Special Psychiatric Programs 2
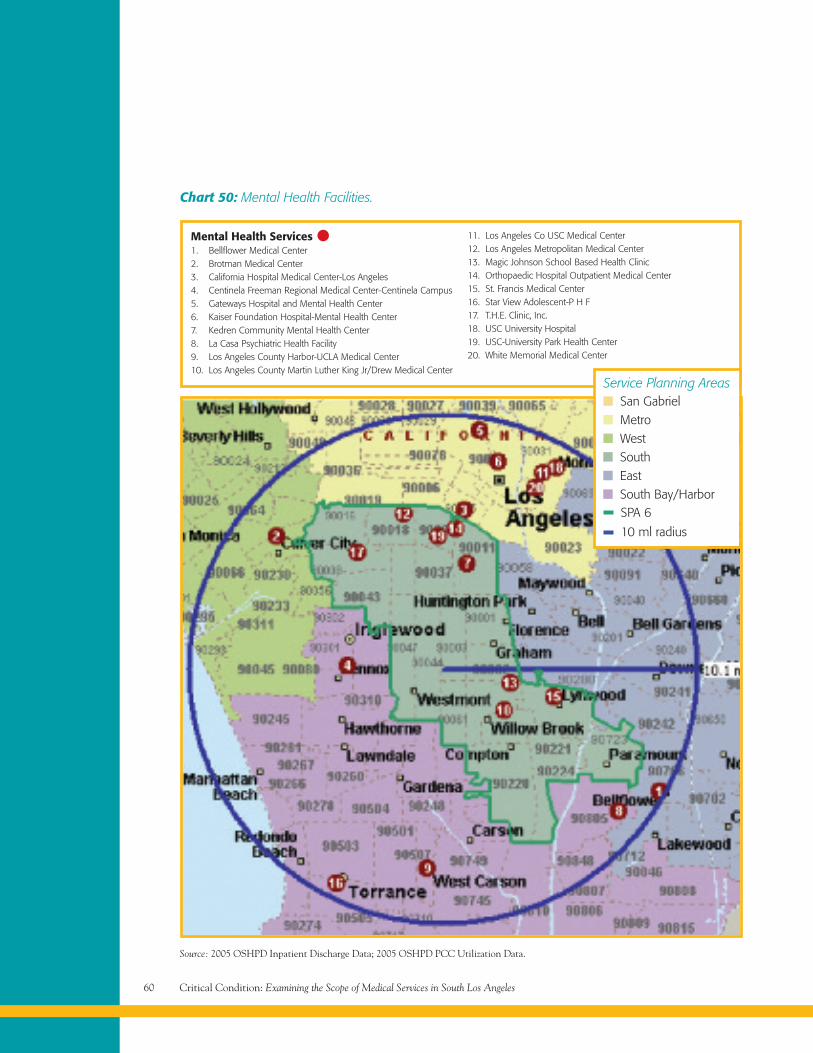
Critical Condition: Examining the Scope of Medical Services in South Los Angeles60
Chart 50: Mental Health Facilities.
Mental Health Services1. Bellflower Medical Center2. Brotman Medical Center3. California Hospital Medical Center-Los Angeles4. Centinela Freeman Regional Medical Center-Centinela Campus5. Gateways Hospital and Mental Health Center6. Kaiser Foundation Hospital-Mental Health Center7. Kedren Community Mental Health Center8. La Casa Psychiatric Health Facility9. Los Angeles County Harbor-UCLA Medical Center10. Los Angeles County Martin Luther King Jr/Drew Medical Center
11. Los Angeles Co USC Medical Center12. Los Angeles Metropolitan Medical Center13. Magic Johnson School Based Health Clinic14. Orthopaedic Hospital Outpatient Medical Center15. St. Francis Medical Center16. Star View Adolescent-P H F17. T.H.E. Clinic, Inc.18. USC University Hospital19. USC-University Park Health Center20. White Memorial Medical Center
Source: 2005 OSHPD Inpatient Discharge Data; 2005 OSHPD PCC Utilization Data.
Service Planning Areas
SPA 6
10 ml radius
SouthEastSouth Bay/Harbor
San GabrielMetroWest
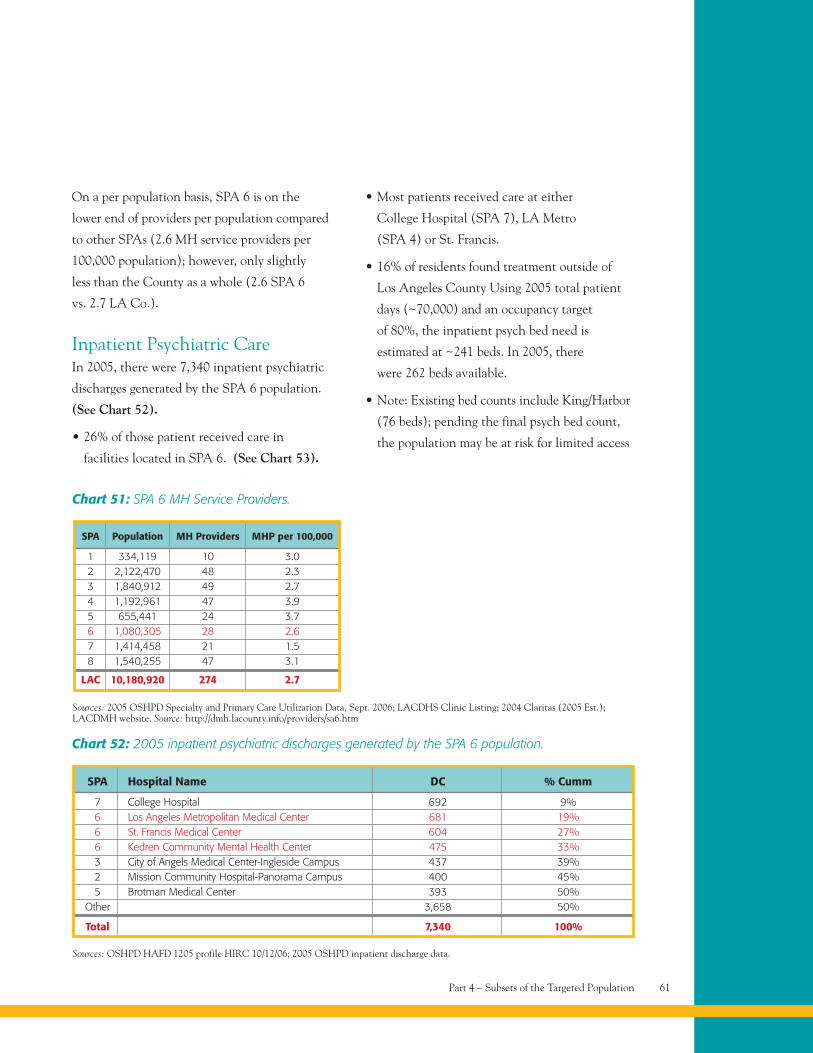
On a per population basis, SPA 6 is on the
lower end of providers per population compared
to other SPAs (2.6 MH service providers per
100,000 population); however, only slightly
less than the County as a whole (2.6 SPA 6
vs. 2.7 LA Co.).
Inpatient Psychiatric CareIn 2005, there were 7,340 inpatient psychiatric
discharges generated by the SPA 6 population.
(See Chart 52).
• 26% of those patient received care in
facilities located in SPA 6. (See Chart 53).
• Most patients received care at either
College Hospital (SPA 7), LA Metro
(SPA 4) or St. Francis.
• 16% of residents found treatment outside of
Los Angeles County Using 2005 total patient
days (~70,000) and an occupancy target
of 80%, the inpatient psych bed need is
estimated at ~241 beds. In 2005, there
were 262 beds available.
• Note: Existing bed counts include King/Harbor
(76 beds); pending the final psych bed count,
the population may be at risk for limited access
Part 4 – Subsets of the Targeted Population 61
Sources: 2005 OSHPD Specialty and Primary Care Utilization Data, Sept. 2006; LACDHS Clinic Listing; 2004 Claritas (2005 Est.);LACDMH website. Source: http://dmh.lacounty.info/providers/sa6.htm
SPA Population MH Providers MHP per 100,000
1 334,119 10 3.02 2,122,470 48 2.33 1,840,912 49 2.74 1,192,961 47 3.95 655,441 24 3.76 1,080,305 28 2.67 1,414,458 21 1.58 1,540,255 47 3.1
LAC 10,180,920 274 2.7
Chart 51: SPA 6 MH Service Providers.
Chart 52: 2005 inpatient psychiatric discharges generated by the SPA 6 population.
SPA Hospital Name DC % Cumm
7 College Hospital 692 9%6 Los Angeles Metropolitan Medical Center 681 19%6 St. Francis Medical Center 604 27%6 Kedren Community Mental Health Center 475 33%3 City of Angels Medical Center-Ingleside Campus 437 39%2 Mission Community Hospital-Panorama Campus 400 45%5 Brotman Medical Center 393 50%
Other 3,658 50%
Total 7,340 100%
Sources: OSHPD HAFD 1205 profile HIRC 10/12/06; 2005 OSHPD inpatient discharge data.
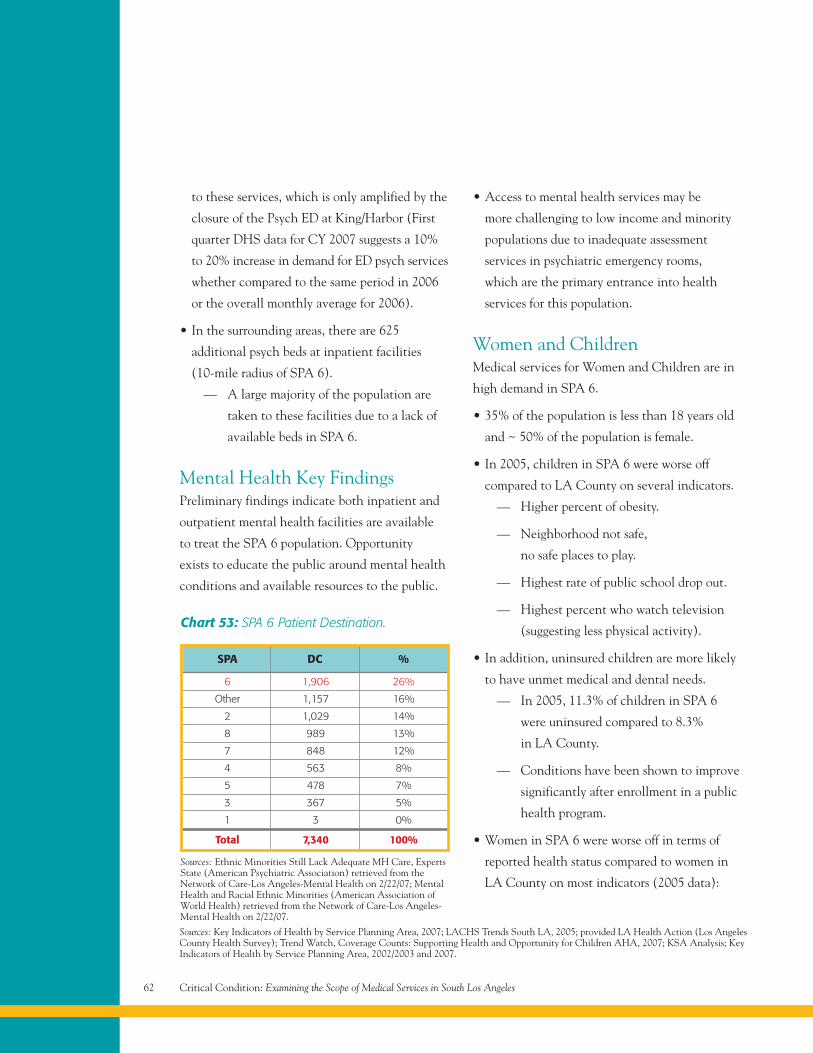
to these services, which is only amplified by the
closure of the Psych ED at King/Harbor (First
quarter DHS data for CY 2007 suggests a 10%
to 20% increase in demand for ED psych services
whether compared to the same period in 2006
or the overall monthly average for 2006).
• In the surrounding areas, there are 625
additional psych beds at inpatient facilities
(10-mile radius of SPA 6).
— A large majority of the population are
taken to these facilities due to a lack of
available beds in SPA 6.
Mental Health Key FindingsPreliminary findings indicate both inpatient and
outpatient mental health facilities are available
to treat the SPA 6 population. Opportunity
exists to educate the public around mental health
conditions and available resources to the public.
• Access to mental health services may be
more challenging to low income and minority
populations due to inadequate assessment
services in psychiatric emergency rooms,
which are the primary entrance into health
services for this population.
Women and ChildrenMedical services for Women and Children are in
high demand in SPA 6.
• 35% of the population is less than 18 years old
and ~ 50% of the population is female.
• In 2005, children in SPA 6 were worse off
compared to LA County on several indicators.
— Higher percent of obesity.
— Neighborhood not safe,
no safe places to play.
— Highest rate of public school drop out.
— Highest percent who watch television
(suggesting less physical activity).
• In addition, uninsured children are more likely
to have unmet medical and dental needs.
— In 2005, 11.3% of children in SPA 6
were uninsured compared to 8.3%
in LA County.
— Conditions have been shown to improve
significantly after enrollment in a public
health program.
• Women in SPA 6 were worse off in terms of
reported health status compared to women in
LA County on most indicators (2005 data):
Critical Condition: Examining the Scope of Medical Services in South Los Angeles62
6 1,906 26%
Other 1,157 16%
2 1,029 14%
8 989 13%
7 848 12%
4 563 8%
5 478 7%
3 367 5%
1 3 0%
Total 7,340 100%
SPA DC %
Chart 53: SPA 6 Patient Destination.
Sources: Ethnic Minorities Still Lack Adequate MH Care, ExpertsState (American Psychiatric Association) retrieved from theNetwork of Care-Los Angeles-Mental Health on 2/22/07; MentalHealth and Racial Ethnic Minorities (American Association ofWorld Health) retrieved from the Network of Care-Los Angeles-Mental Health on 2/22/07.
Sources: Key Indicators of Health by Service Planning Area, 2007; LACHS Trends South LA, 2005; provided LA Health Action (Los AngelesCounty Health Survey); Trend Watch, Coverage Counts: Supporting Health and Opportunity for Children AHA, 2007; KSA Analysis; KeyIndicators of Health by Service Planning Area, 2002/2003 and 2007.
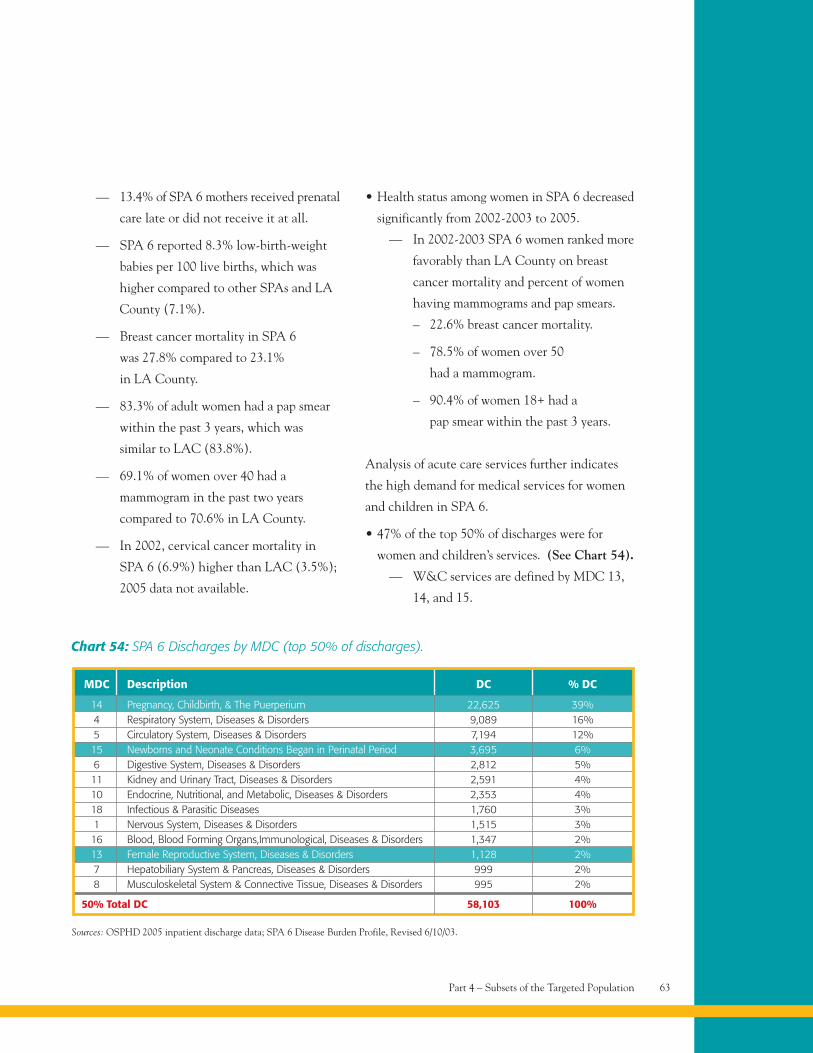
Part 4 – Subsets of the Targeted Population 63
— 13.4% of SPA 6 mothers received prenatal
care late or did not receive it at all.
— SPA 6 reported 8.3% low-birth-weight
babies per 100 live births, which was
higher compared to other SPAs and LA
County (7.1%).
— Breast cancer mortality in SPA 6
was 27.8% compared to 23.1%
in LA County.
— 83.3% of adult women had a pap smear
within the past 3 years, which was
similar to LAC (83.8%).
— 69.1% of women over 40 had a
mammogram in the past two years
compared to 70.6% in LA County.
— In 2002, cervical cancer mortality in
SPA 6 (6.9%) higher than LAC (3.5%);
2005 data not available.
• Health status among women in SPA 6 decreased
significantly from 2002-2003 to 2005.
— In 2002-2003 SPA 6 women ranked more
favorably than LA County on breast
cancer mortality and percent of women
having mammograms and pap smears.
– 22.6% breast cancer mortality.
– 78.5% of women over 50
had a mammogram.
– 90.4% of women 18+ had a
pap smear within the past 3 years.
Analysis of acute care services further indicates
the high demand for medical services for women
and children in SPA 6.
• 47% of the top 50% of discharges were for
women and children’s services. (See Chart 54).
— W&C services are defined by MDC 13,
14, and 15.
Chart 54: SPA 6 Discharges by MDC (top 50% of discharges).
MDC Description DC % DC
14 Pregnancy, Childbirth, & The Puerperium 22,625 39%4 Respiratory System, Diseases & Disorders 9,089 16%5 Circulatory System, Diseases & Disorders 7,194 12%15 Newborns and Neonate Conditions Began in Perinatal Period 3,695 6%6 Digestive System, Diseases & Disorders 2,812 5%11 Kidney and Urinary Tract, Diseases & Disorders 2,591 4%10 Endocrine, Nutritional, and Metabolic, Diseases & Disorders 2,353 4%18 Infectious & Parasitic Diseases 1,760 3%1 Nervous System, Diseases & Disorders 1,515 3%16 Blood, Blood Forming Organs,Immunological, Diseases & Disorders 1,347 2%13 Female Reproductive System, Diseases & Disorders 1,128 2%7 Hepatobiliary System & Pancreas, Diseases & Disorders 999 2%8 Musculoskeletal System & Connective Tissue, Diseases & Disorders 995 2%
50% Total DC 58,103 100%
Sources: OSPHD 2005 inpatient discharge data; SPA 6 Disease Burden Profile, Revised 6/10/03.
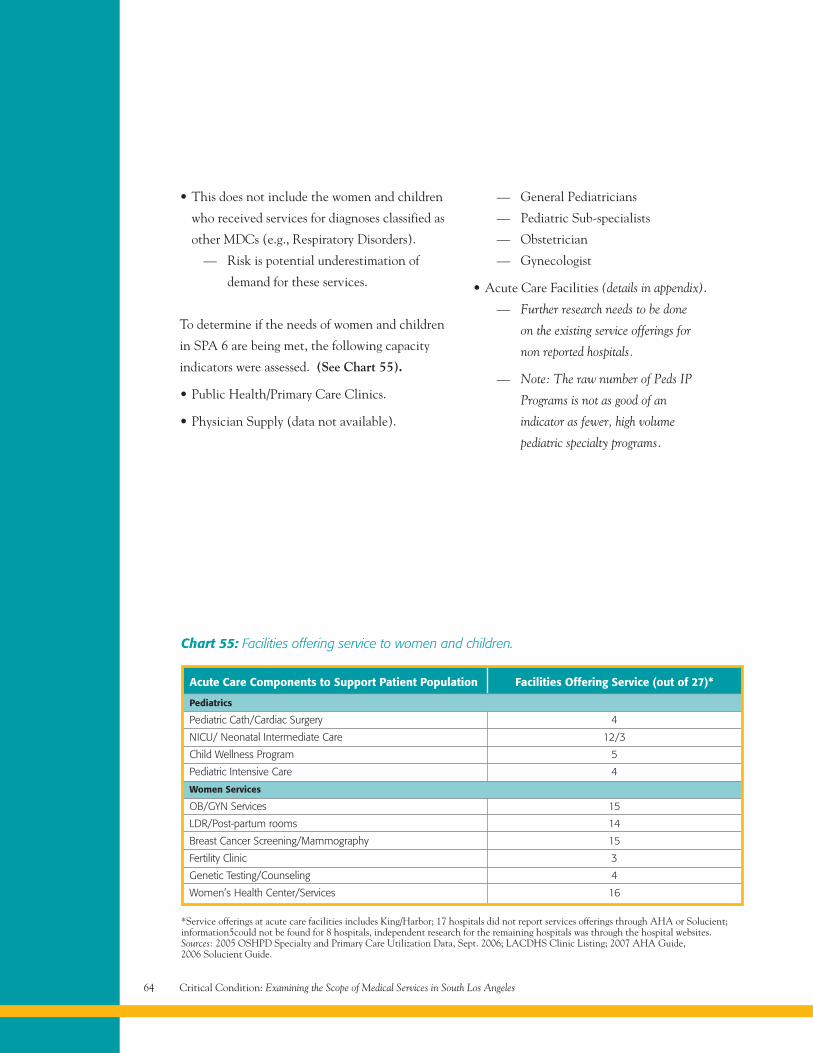
Critical Condition: Examining the Scope of Medical Services in South Los Angeles64
• This does not include the women and children
who received services for diagnoses classified as
other MDCs (e.g., Respiratory Disorders).
— Risk is potential underestimation of
demand for these services.
To determine if the needs of women and children
in SPA 6 are being met, the following capacity
indicators were assessed. (See Chart 55).
• Public Health/Primary Care Clinics.
• Physician Supply (data not available).
— General Pediatricians
— Pediatric Sub-specialists
— Obstetrician
— Gynecologist
• Acute Care Facilities (details in appendix).
— Further research needs to be done
on the existing service offerings for
non reported hospitals.
— Note: The raw number of Peds IP
Programs is not as good of an
indicator as fewer, high volume
pediatric specialty programs.
Acute Care Components to Support Patient Population Facilities Offering Service (out of 27)*
Chart 55: Facilities offering service to women and children.
Pediatrics
Pediatric Cath/Cardiac Surgery 4
NICU/ Neonatal Intermediate Care 12/3
Child Wellness Program 5
Pediatric Intensive Care 4
Women Services
OB/GYN Services 15
LDR/Post-partum rooms 14
Breast Cancer Screening/Mammography 15
Fertility Clinic 3
Genetic Testing/Counseling 4
Women’s Health Center/Services 16
*Service offerings at acute care facilities includes King/Harbor; 17 hospitals did not report services offerings through AHA or Solucient;information5could not be found for 8 hospitals, independent research for the remaining hospitals was through the hospital websites.Sources: 2005 OSHPD Specialty and Primary Care Utilization Data, Sept. 2006; LACDHS Clinic Listing; 2007 AHA Guide,2006 Solucient Guide.
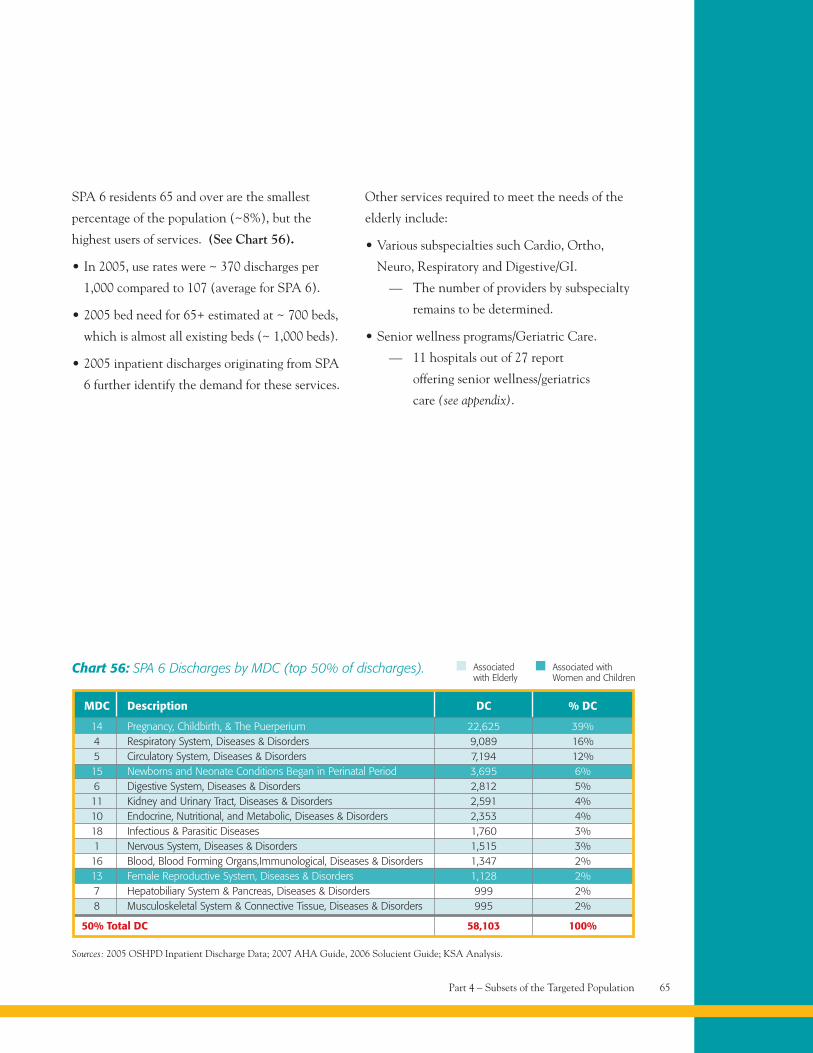
Part 4 – Subsets of the Targeted Population 65
Chart 56: SPA 6 Discharges by MDC (top 50% of discharges).
MDC Description DC % DC
14 Pregnancy, Childbirth, & The Puerperium 22,625 39%4 Respiratory System, Diseases & Disorders 9,089 16%5 Circulatory System, Diseases & Disorders 7,194 12%15 Newborns and Neonate Conditions Began in Perinatal Period 3,695 6%6 Digestive System, Diseases & Disorders 2,812 5%11 Kidney and Urinary Tract, Diseases & Disorders 2,591 4%10 Endocrine, Nutritional, and Metabolic, Diseases & Disorders 2,353 4%18 Infectious & Parasitic Diseases 1,760 3%1 Nervous System, Diseases & Disorders 1,515 3%16 Blood, Blood Forming Organs,Immunological, Diseases & Disorders 1,347 2%13 Female Reproductive System, Diseases & Disorders 1,128 2%7 Hepatobiliary System & Pancreas, Diseases & Disorders 999 2%8 Musculoskeletal System & Connective Tissue, Diseases & Disorders 995 2%
50% Total DC 58,103 100%
Sources: 2005 OSHPD Inpatient Discharge Data; 2007 AHA Guide, 2006 Solucient Guide; KSA Analysis.
Associatedwith Elderly
Associated withWomen and Children
SPA 6 residents 65 and over are the smallest
percentage of the population (~8%), but the
highest users of services. (See Chart 56).
• In 2005, use rates were ~ 370 discharges per
1,000 compared to 107 (average for SPA 6).
• 2005 bed need for 65+ estimated at ~ 700 beds,
which is almost all existing beds (~ 1,000 beds).
• 2005 inpatient discharges originating from SPA
6 further identify the demand for these services.
Other services required to meet the needs of the
elderly include:
• Various subspecialties such Cardio, Ortho,
Neuro, Respiratory and Digestive/GI.
— The number of providers by subspecialty
remains to be determined.
• Senior wellness programs/Geriatric Care.
— 11 hospitals out of 27 report
offering senior wellness/geriatrics
care (see appendix).

Substance abuse
and failure to
undergo treatment
for mental health
disorders are considered
major predictors
of homelessness.
Project Overview 68
Key Challenges 68
Population and 71Demographics
Ethnicity and Race 72
Payor Category and 73Insurance Status
Benchmark Criteria 74
2005 Census Data – 74Benchmarks
Inpatient Acute Care Facilities 76
SPA 6 Patient Origin – 79Discharges by Hospital
Primary Care Clinics 83
Primary Care Utilization 84Benchmarks
Primary Care Clinics 85Detailed – Revised
Primary Care Clinics 86(SPA 6 and 10-Mile)
Specialty Clinics 90Detailed – Revised
Specialty Clinics 91(SPA 6 and 10-Mile)
Specialty Clinics 93(Private/Stand Alone)
Diagnostic Imaging Centers 94
Diagnostic and Treatment 95Projections
LA Dental Society Map 98
Trauma and Emergency 99Services
Demand for Trauma and 100Emergency Services
Emergency Services 100
KSA/CHCF Study 101
KSA/CHCF Study – 102Summary of Findings
Trauma and Emergency 103Services
Skilled Nursing 104Facilities – Discharges
Rehabilitative Services 105
Public Health Clinics 106
Mental Health Facilities 106
Psychiatric – Discharges 107
Women, Children 108and the Elderly
Advisory Group 110
Bibliography 110
Part 5Appendix
Critical Condition: Examining the Scope of Medical Services in South Los Angeles68
Appendix
Project OverviewKey Points of Clarification
• The assessment is based on a wide
range of indicators.
— A measure of demand and capacity was
analyzed for each indicator.
— Outcomes should be evaluated
as a whole rather than by
individual indicators.
— Broader social determinants that
contribute to community health
status were not assessed in detail.
• DEMAND indicators were used as a
proxy to assess NEED in relative terms
given data limitations.
• The LA Health Surveys and other County
Departmental studies indicate that the
medical services NEEDS of the SPA 6
population are not being met.
• Services provided by King/Harbor Hospital
are included in the analyses depending
on year of data.
• Summary of key findings are just that. This
report should be read in total to gain a more
comprehensive understanding of the true
medical needs of the SPA 6 population.
Limitations of the Data
The analyses conducted in this effort are to
identify the medical services needs of South
Los Angeles residents based on where demand
appears to be mismatched with capacity. We have
aggregated publicly available information as of
early 2007 and have articulated salient themes
that are reflected in the data. We have NOT
conducted primary research nor have we
independently assessed the validity of the
individual reports and data sources that we cite
throughout this material. In fact, we hope that
this material will spur additional research as
appropriate (and not to the detriment of action)
to clarify the status in health access categories
about which less is available publicly.
This analysis is NOT…
• A conclusive analysis.
• An analysis of cause and effect.
Key ChallengesThroughout this assessment three key challenges
surfaced that deserve additional commentary:
Challenge #1
Significant data exists on the demand and supply
of medical services for the SPA 6 population,
however, there is no single repository to house all
of the available information for the community.
Implication: Limits the ability to develop a
comprehensive assessment.
Implication: Impedes access to the most current
available data.
Part 5 – Appendix 69
Implication: Focuses resources to individual
efforts rather than the community as a whole.
Challenge #2
Despite the amount of data available, gaps in
information continue to exist.
• Homeless population: There is limited
information available regarding the need for, and
use of, medical services among the homeless.
Implication: Underestimates the true
demand/need for medical services.
– Given that most homeless typically
access the health care system through
the ED, it is difficult to measure if
and how this population might use
other services.
Implication: Overestimates the true demand/need
for medical services.
– OSHPD captures the homeless
population for inpatient care
suggesting the potential risk of
double counting if we overlap this
population on the existing
inpatient demand.
• Primary/Specialty Ambulatory Care:
Available data for ambulatory/outpatient
services is not as robust nor as accurate
as inpatient data. Discussions around this
information often generate the most
debate, further reinforcing the need for
more accurate data.
Implication: Prohibits the ability to identify
existing demand/need for these services.
Implication: Prohibits the ability to determine if
capacity for these services is meeting the demand.
Implication: Requires the use of proxies to help
understand the situation.
Implication: Derails the ability to move forward
given that the reality of the situation may not
match directly with the available information.
Despite the amount of data available, gaps
continue to exist.
• Physician Data: To our knowledge, there is no
single source of physician data by specialty
available for LA County. Several alternatives
exist, however, given the pros and cons of each,
their value was minimal.
Implication: limits the ability to assess if the
population has an adequate supply of physicians
(on a per population basis).
Implication: prevents a true understanding
of the level of subspecialty services available
to the community.
Note: Recent studies in the U.S. have suggested
physician mix is important, such as demonstrating
links between greater availability of primary
care physicians and lower death rates as well
as higher cancer screening rates among racial
and ethnic minorities.*
*Source: Dowling PT, Who Will Care for South Central LA? Presentation to the LA Health Collaborative (December 21, 2006). Accessedat www.lahealthaction.org/library/South_Central-LA_Talk_12-21-06.pdf.
Critical Condition: Examining the Scope of Medical Services in South Los Angeles70
• Diagnostic and Treatment: To date, data on
visit volumes and existing capacity for major
D&Ts (e.g., surgery, cath labs, imaging, etc.)
is confined to individual hospitals
and/or other facilities.
Implication: Prohibits the ability to assess if the
needs of the SPA 6 population (on a per
population basis) are being met.
• Mental Health: The nature of mental health
services, with high rates of co-morbidity and
dual-diagnosis and the available data (e.g.,
psychiatric ED visits vs. ED visits, psychiatric
patient days vs. primary diagnosis, dual
diagnoses of substance abuse and mental
health, current wait times, etc.), present
a challenge to understanding the
need for these services.
Implication: Prohibits the ability to assess if the
needs of the SPA 6 population are being met.
Implication: Presents difficulty when trying to
allocate resources appropriately.
Despite the amount of data available, gaps
continue to exist.
• Quality of Care: Similar to outpatient data,
capturing quality data is still in the initial
phases of development.
Implication: Limits the ability to determine if the
SPA 6 population is receiving high-quality care.
Implication: Could potentially harm existing
SPA 6 facilities financially if paying patients
choose to go elsewhere for their medical services.
Challenge #3
Collecting data is easier than taking action and
can lead to “analysis paralysis.”
Implication: Constant data gathering may hinder
progress toward reaching a goal.
Implication: If change is to occur, strategic goals
and subsequent action plans need to be developed
and implemented based on the best available data.
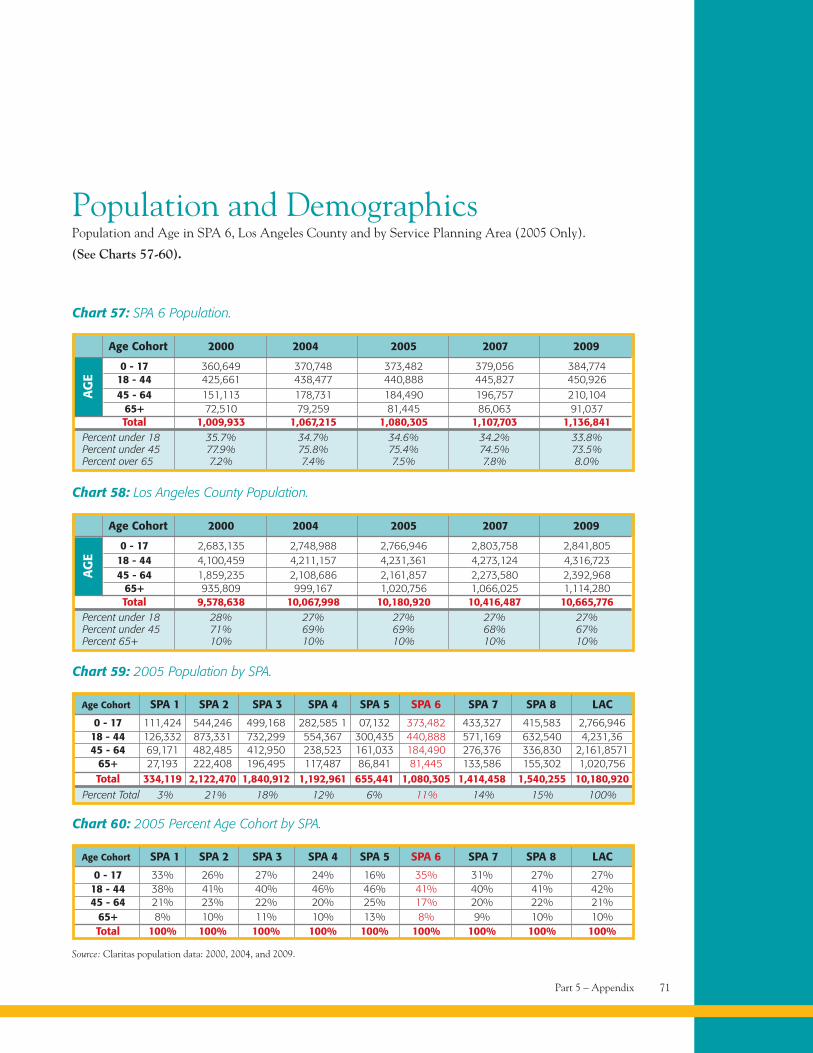
AGE
Part 5 – Appendix 71
Population and DemographicsPopulation and Age in SPA 6, Los Angeles County and by Service Planning Area (2005 Only).
(See Charts 57-60).
Chart 57: SPA 6 Population.
0 - 17 360,649 370,748 373,482 379,056 384,77418 - 44 425,661 438,477 440,888 445,827 450,92645 - 64 151,113 178,731 184,490 196,757 210,10465+ 72,510 79,259 81,445 86,063 91,037Total 1,009,933 1,067,215 1,080,305 1,107,703 1,136,841
Percent under 18 35.7% 34.7% 34.6% 34.2% 33.8%Percent under 45 77.9% 75.8% 75.4% 74.5% 73.5%Percent over 65 7.2% 7.4% 7.5% 7.8% 8.0%
Age Cohort 2000 2004 2005 2007 2009
Chart 59: 2005 Population by SPA.
0 - 17 111,424 544,246 499,168 282,585 1 07,132 373,482 433,327 415,583 2,766,94618 - 44 126,332 873,331 732,299 554,367 300,435 440,888 571,169 632,540 4,231,3645 - 64 69,171 482,485 412,950 238,523 161,033 184,490 276,376 336,830 2,161,857165+ 27,193 222,408 196,495 117,487 86,841 81,445 133,586 155,302 1,020,756Total 334,119 2,122,470 1,840,912 1,192,961 655,441 1,080,305 1,414,458 1,540,255 10,180,920
Age Cohort SPA 1 SPA 2 SPA 3 SPA 4 SPA 5 SPA 6 SPA 7 SPA 8 LAC
Source: Claritas population data: 2000, 2004, and 2009.
AGE
Chart 58: Los Angeles County Population.
0 - 17 2,683,135 2,748,988 2,766,946 2,803,758 2,841,80518 - 44 4,100,459 4,211,157 4,231,361 4,273,124 4,316,72345 - 64 1,859,235 2,108,686 2,161,857 2,273,580 2,392,96865+ 935,809 999,167 1,020,756 1,066,025 1,114,280Total 9,578,638 10,067,998 10,180,920 10,416,487 10,665,776
Percent under 18 28% 27% 27% 27% 27%Percent under 45 71% 69% 69% 68% 67%Percent 65+ 10% 10% 10% 10% 10%
Percent Total 3% 21% 18% 12% 6% 11% 14% 15% 100%
Age Cohort 2000 2004 2005 2007 2009
Chart 60: 2005 Percent Age Cohort by SPA.
0 - 17 33% 26% 27% 24% 16% 35% 31% 27% 27%18 - 44 38% 41% 40% 46% 46% 41% 40% 41% 42%45 - 64 21% 23% 22% 20% 25% 17% 20% 22% 21%65+ 8% 10% 11% 10% 13% 8% 9% 10% 10%Total 100% 100% 100% 100% 100% 100% 100% 100% 100%
Age Cohort SPA 1 SPA 2 SPA 3 SPA 4 SPA 5 SPA 6 SPA 7 SPA 8 LAC
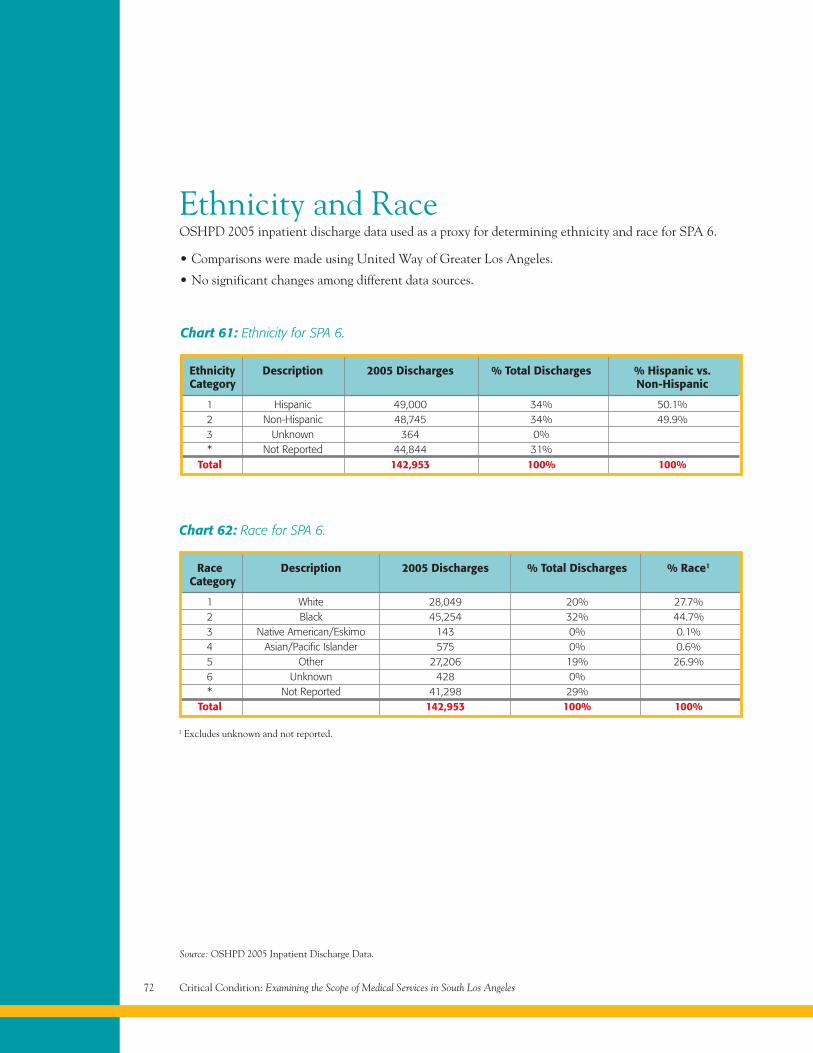
Critical Condition: Examining the Scope of Medical Services in South Los Angeles72
Ethnicity and RaceOSHPD 2005 inpatient discharge data used as a proxy for determining ethnicity and race for SPA 6.
• Comparisons were made using United Way of Greater Los Angeles.
• No significant changes among different data sources.
Chart 61: Ethnicity for SPA 6.
Ethnicity Description 2005 Discharges % Total Discharges % Hispanic vs.Category Non-Hispanic
1 Hispanic 49,000 34% 50.1%2 Non-Hispanic 48,745 34% 49.9%3 Unknown 364 0%* Not Reported 44,844 31%
Total 142,953 100% 100%
Chart 62: Race for SPA 6.
Race Description 2005 Discharges % Total Discharges % Race1Category
1 White 28,049 20% 27.7%2 Black 45,254 32% 44.7%3 Native American/Eskimo 143 0% 0.1%4 Asian/Pacific Islander 575 0% 0.6%5 Other 27,206 19% 26.9%6 Unknown 428 0%* Not Reported 41,298 29%
Total 142,953 100% 100%
Source: OSHPD 2005 Inpatient Discharge Data.
1 Excludes unknown and not reported.
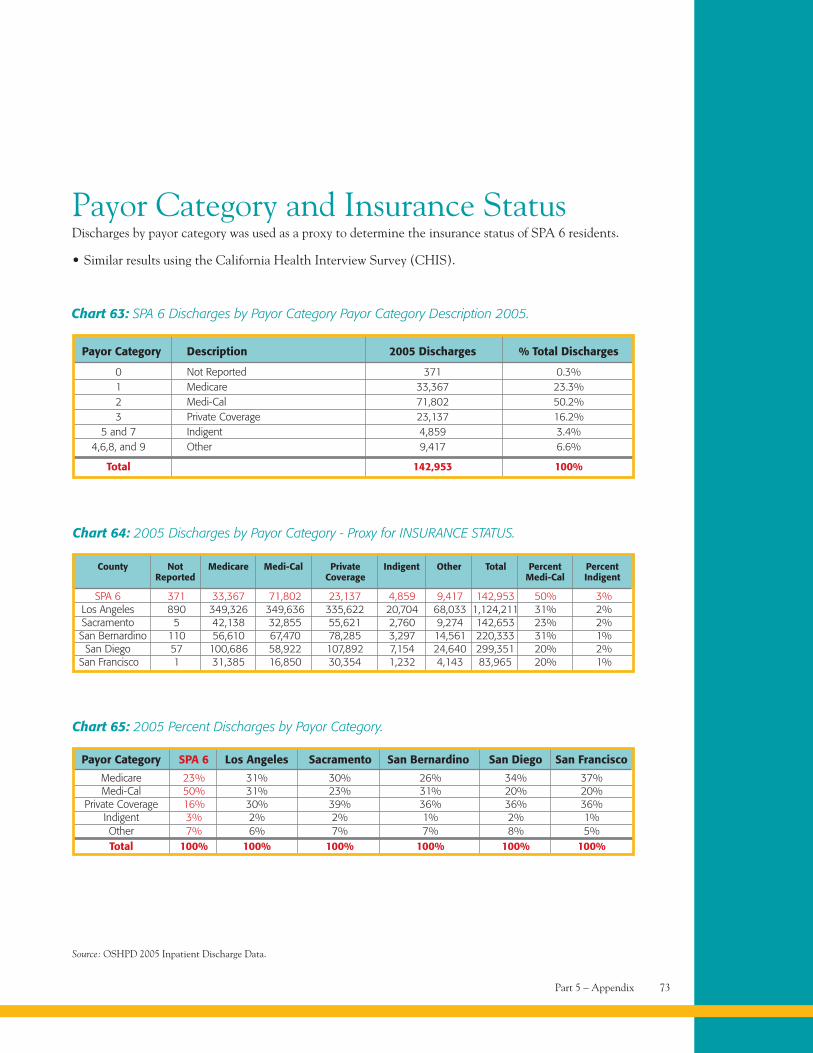
Part 5 – Appendix 73
Payor Category and Insurance StatusDischarges by payor category was used as a proxy to determine the insurance status of SPA 6 residents.
• Similar results using the California Health Interview Survey (CHIS).
Chart 63: SPA 6 Discharges by Payor Category Payor Category Description 2005.
Payor Category Description 2005 Discharges % Total Discharges
0 Not Reported 371 0.3%1 Medicare 33,367 23.3%2 Medi-Cal 71,802 50.2%3 Private Coverage 23,137 16.2%
5 and 7 Indigent 4,859 3.4%4,6,8, and 9 Other 9,417 6.6%
Total 142,953 100%
Chart 64: 2005 Discharges by Payor Category - Proxy for INSURANCE STATUS.
SPA 6 371 33,367 71,802 23,137 4,859 9,417 142,953 50% 3%Los Angeles 890 349,326 349,636 335,622 20,704 68,033 1,124,211 31% 2%Sacramento 5 42,138 32,855 55,621 2,760 9,274 142,653 23% 2%San Bernardino 110 56,610 67,470 78,285 3,297 14,561 220,333 31% 1%San Diego 57 100,686 58,922 107,892 7,154 24,640 299,351 20% 2%
San Francisco 1 31,385 16,850 30,354 1,232 4,143 83,965 20% 1%
County Not Medicare Medi-Cal Private Indigent Other Total Percent PercentReported Coverage Medi-Cal Indigent
Source: OSHPD 2005 Inpatient Discharge Data.
Chart 65: 2005 Percent Discharges by Payor Category.
Medicare 23% 31% 30% 26% 34% 37%Medi-Cal 50% 31% 23% 31% 20% 20%
Private Coverage 16% 30% 39% 36% 36% 36%Indigent 3% 2% 2% 1% 2% 1%Other 7% 6% 7% 7% 8% 5%Total 100% 100% 100% 100% 100% 100%
Payor Category SPA 6 Los Angeles Sacramento San Bernardino San Diego San Francisco
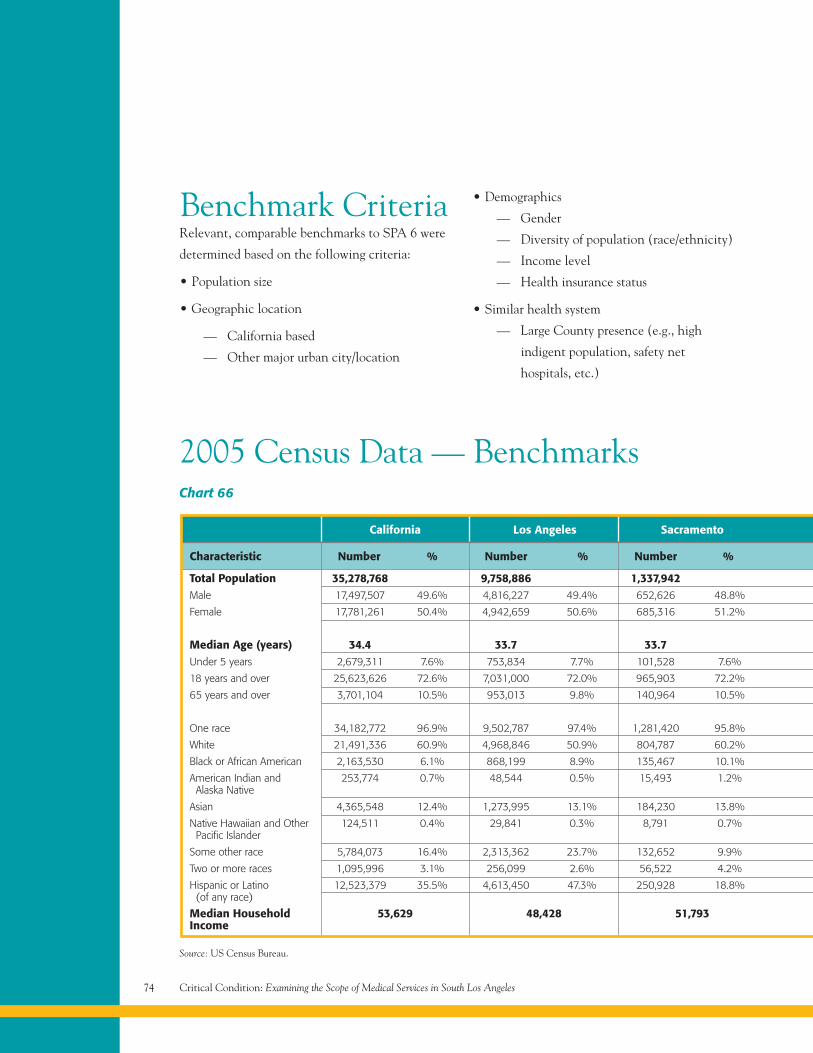
Critical Condition: Examining the Scope of Medical Services in South Los Angeles74
Benchmark CriteriaRelevant, comparable benchmarks to SPA 6 were
determined based on the following criteria:
• Population size
• Geographic location
— California based
— Other major urban city/location
• Demographics
— Gender
— Diversity of population (race/ethnicity)
— Income level
— Health insurance status
• Similar health system
— Large County presence (e.g., high
indigent population, safety net
hospitals, etc.)
Chart 66
California Los Angeles Sacramento
Characteristic Number % Number % Number %
Total Population 35,278,768 9,758,886 1,337,942Male 17,497,507 49.6% 4,816,227 49.4% 652,626 48.8%
Female 17,781,261 50.4% 4,942,659 50.6% 685,316 51.2%
Median Age (years) 34.4 33.7 33.7Under 5 years 2,679,311 7.6% 753,834 7.7% 101,528 7.6%
18 years and over 25,623,626 72.6% 7,031,000 72.0% 965,903 72.2%
65 years and over 3,701,104 10.5% 953,013 9.8% 140,964 10.5%
One race 34,182,772 96.9% 9,502,787 97.4% 1,281,420 95.8%
White 21,491,336 60.9% 4,968,846 50.9% 804,787 60.2%
Black or African American 2,163,530 6.1% 868,199 8.9% 135,467 10.1%
American Indian and 253,774 0.7% 48,544 0.5% 15,493 1.2%Alaska Native
Asian 4,365,548 12.4% 1,273,995 13.1% 184,230 13.8%
Native Hawaiian and Other 124,511 0.4% 29,841 0.3% 8,791 0.7%Pacific Islander
Some other race 5,784,073 16.4% 2,313,362 23.7% 132,652 9.9%
Two or more races 1,095,996 3.1% 256,099 2.6% 56,522 4.2%
Hispanic or Latino 12,523,379 35.5% 4,613,450 47.3% 250,928 18.8%(of any race)
Median Household 53,629 48,428 51,793Income
Source: US Census Bureau.
2005 Census Data — Benchmarks
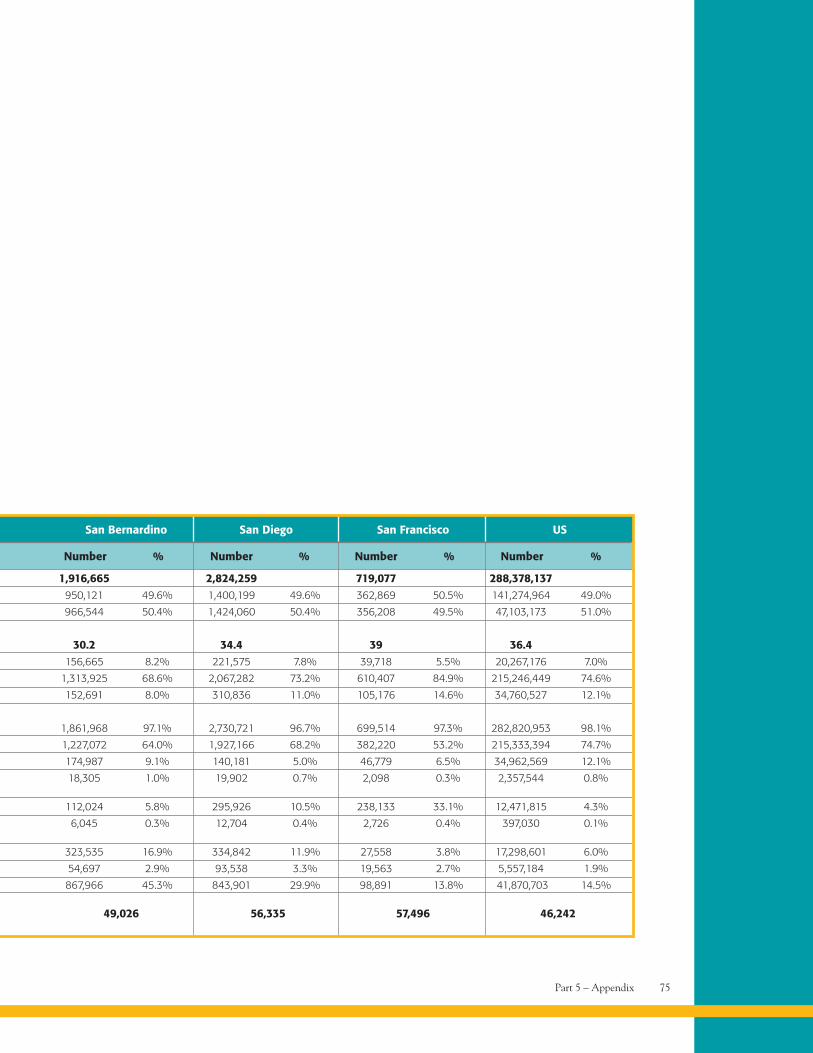
Part 5 – Appendix 75
San Bernardino San Diego San Francisco US
Number % Number % Number % Number %
1,916,665 2,824,259 719,077 288,378,137950,121 49.6% 1,400,199 49.6% 362,869 50.5% 141,274,964 49.0%
966,544 50.4% 1,424,060 50.4% 356,208 49.5% 47,103,173 51.0%
30.2 34.4 39 36.4156,665 8.2% 221,575 7.8% 39,718 5.5% 20,267,176 7.0%
1,313,925 68.6% 2,067,282 73.2% 610,407 84.9% 215,246,449 74.6%
152,691 8.0% 310,836 11.0% 105,176 14.6% 34,760,527 12.1%
1,861,968 97.1% 2,730,721 96.7% 699,514 97.3% 282,820,953 98.1%
1,227,072 64.0% 1,927,166 68.2% 382,220 53.2% 215,333,394 74.7%
174,987 9.1% 140,181 5.0% 46,779 6.5% 34,962,569 12.1%
18,305 1.0% 19,902 0.7% 2,098 0.3% 2,357,544 0.8%
112,024 5.8% 295,926 10.5% 238,133 33.1% 12,471,815 4.3%
6,045 0.3% 12,704 0.4% 2,726 0.4% 397,030 0.1%
323,535 16.9% 334,842 11.9% 27,558 3.8% 17,298,601 6.0%
54,697 2.9% 93,538 3.3% 19,563 2.7% 5,557,184 1.9%
867,966 45.3% 843,901 29.9% 98,891 13.8% 41,870,703 14.5%
49,026 56,335 57,496 46,242
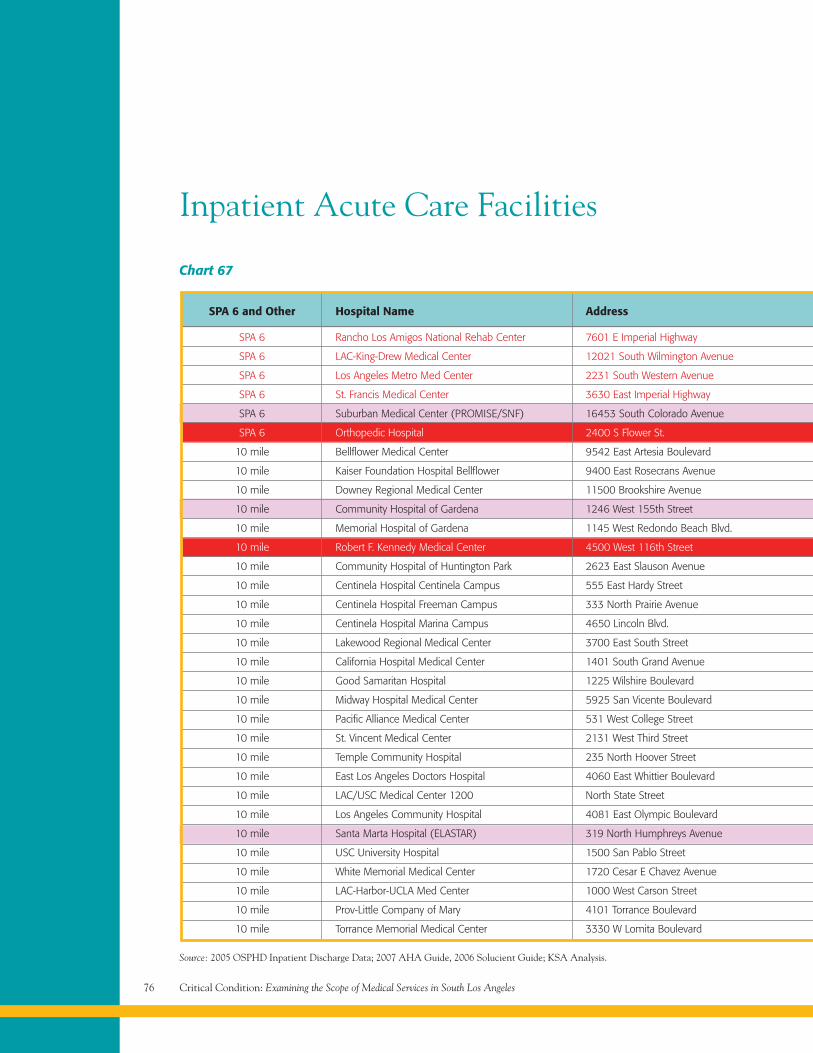
Critical Condition: Examining the Scope of Medical Services in South Los Angeles76
Inpatient Acute Care Facilities
Chart 67
Source: 2005 OSPHD Inpatient Discharge Data; 2007 AHA Guide, 2006 Solucient Guide; KSA Analysis.
SPA 6 and Other Hospital Name Address
SPA 6 Rancho Los Amigos National Rehab Center 7601 E Imperial Highway
SPA 6 LAC-King-Drew Medical Center 12021 South Wilmington Avenue
SPA 6 Los Angeles Metro Med Center 2231 South Western Avenue
SPA 6 St. Francis Medical Center 3630 East Imperial Highway
SPA 6 Suburban Medical Center (PROMISE/SNF) 16453 South Colorado Avenue
SPA 6 Orthopedic Hospital 2400 S Flower St.
10 mile Bellflower Medical Center 9542 East Artesia Boulevard
10 mile Kaiser Foundation Hospital Bellflower 9400 East Rosecrans Avenue
10 mile Downey Regional Medical Center 11500 Brookshire Avenue
10 mile Community Hospital of Gardena 1246 West 155th Street
10 mile Memorial Hospital of Gardena 1145 West Redondo Beach Blvd.
10 mile Robert F. Kennedy Medical Center 4500 West 116th Street
10 mile Community Hospital of Huntington Park 2623 East Slauson Avenue
10 mile Centinela Hospital Centinela Campus 555 East Hardy Street
10 mile Centinela Hospital Freeman Campus 333 North Prairie Avenue
10 mile Centinela Hospital Marina Campus 4650 Lincoln Blvd.
10 mile Lakewood Regional Medical Center 3700 East South Street
10 mile California Hospital Medical Center 1401 South Grand Avenue
10 mile Good Samaritan Hospital 1225 Wilshire Boulevard
10 mile Midway Hospital Medical Center 5925 San Vicente Boulevard
10 mile Pacific Alliance Medical Center 531 West College Street
10 mile St. Vincent Medical Center 2131 West Third Street
10 mile Temple Community Hospital 235 North Hoover Street
10 mile East Los Angeles Doctors Hospital 4060 East Whittier Boulevard
10 mile LAC/USC Medical Center 1200 North State Street
10 mile Los Angeles Community Hospital 4081 East Olympic Boulevard
10 mile Santa Marta Hospital (ELASTAR) 319 North Humphreys Avenue
10 mile USC University Hospital 1500 San Pablo Street
10 mile White Memorial Medical Center 1720 Cesar E Chavez Avenue
10 mile LAC-Harbor-UCLA Med Center 1000 West Carson Street
10 mile Prov-Little Company of Mary 4101 Torrance Boulevard
10 mile Torrance Memorial Medical Center 3330 W Lomita Boulevard
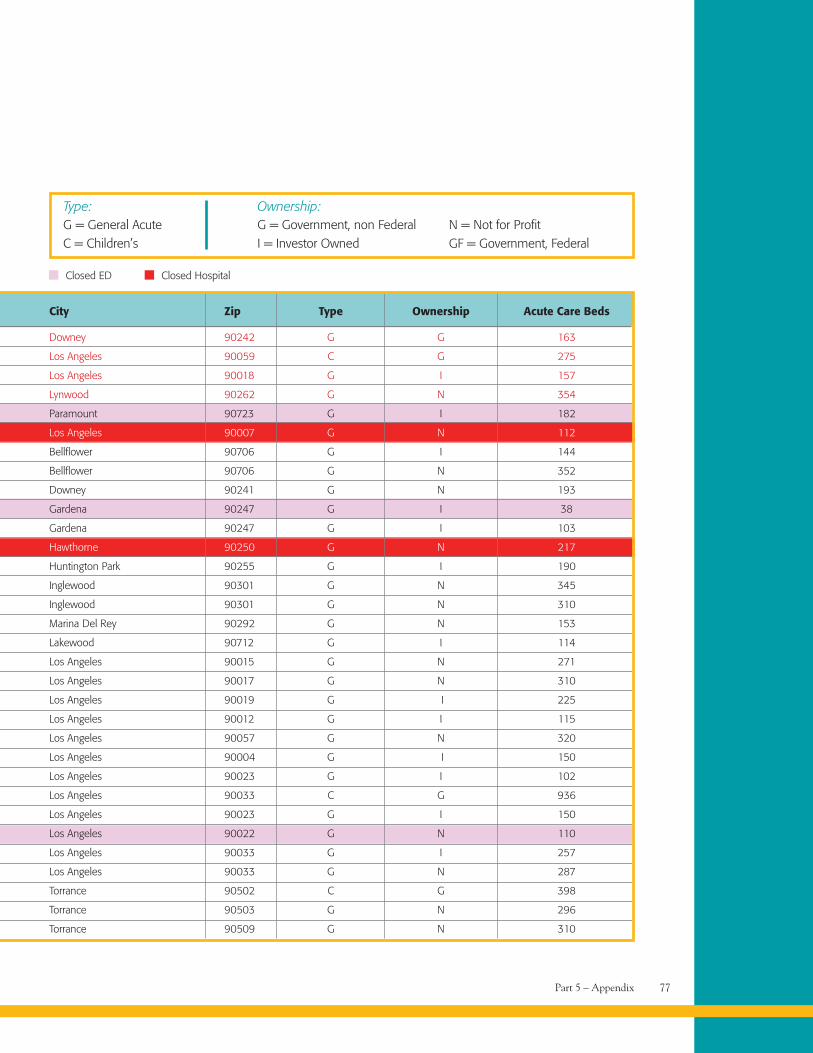
Part 5 – Appendix 77
G = General AcuteC = Children’s
Type:G = Government, non FederalI = Investor Owned
N = Not for ProfitGF = Government, Federal
Ownership:
Closed ED Closed Hospital
City Zip Type Ownership Acute Care Beds
Downey 90242 G G 163
Los Angeles 90059 C G 275
Los Angeles 90018 G I 157
Lynwood 90262 G N 354
Paramount 90723 G I 182
Los Angeles 90007 G N 112
Bellflower 90706 G I 144
Bellflower 90706 G N 352
Downey 90241 G N 193
Gardena 90247 G I 38
Gardena 90247 G I 103
Hawthorne 90250 G N 217
Huntington Park 90255 G I 190
Inglewood 90301 G N 345
Inglewood 90301 G N 310
Marina Del Rey 90292 G N 153
Lakewood 90712 G I 114
Los Angeles 90015 G N 271
Los Angeles 90017 G N 310
Los Angeles 90019 G I 225
Los Angeles 90012 G I 115
Los Angeles 90057 G N 320
Los Angeles 90004 G I 150
Los Angeles 90023 G I 102
Los Angeles 90033 C G 936
Los Angeles 90023 G I 150
Los Angeles 90022 G N 110
Los Angeles 90033 G I 257
Los Angeles 90033 G N 287
Torrance 90502 C G 398
Torrance 90503 G N 296
Torrance 90509 G N 310
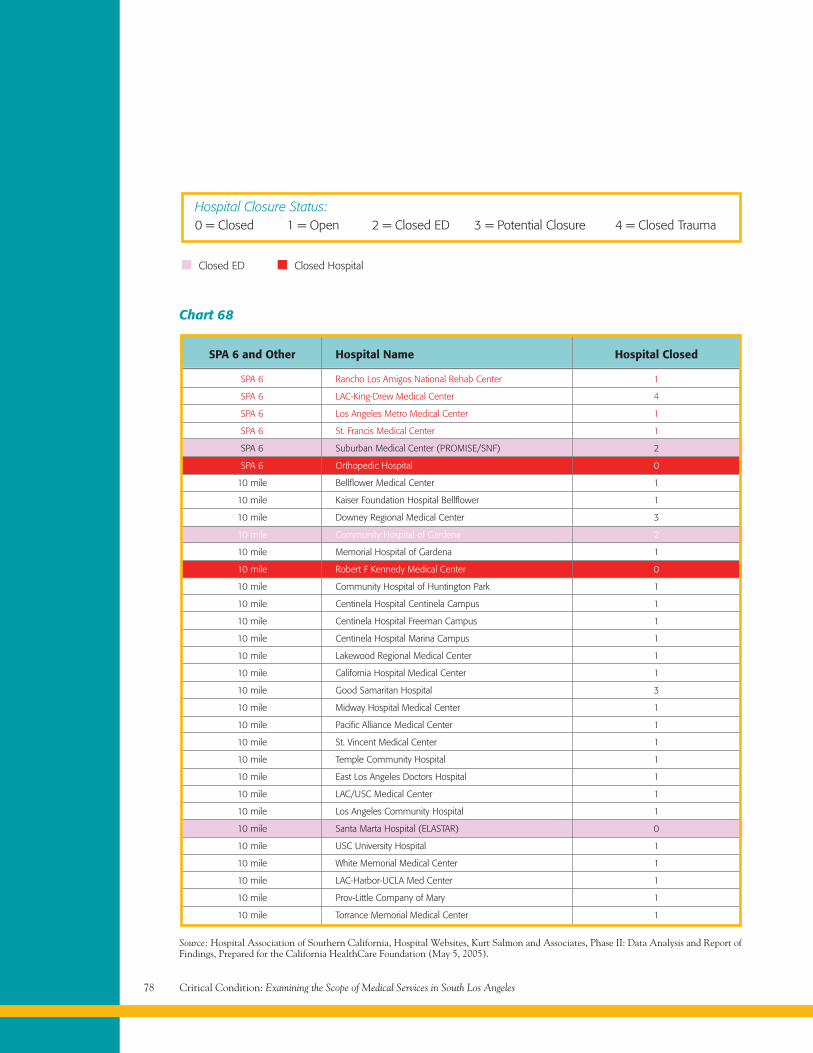
Critical Condition: Examining the Scope of Medical Services in South Los Angeles78
Chart 68
SPA 6 and Other Hospital Name Hospital Closed
SPA 6 Rancho Los Amigos National Rehab Center 1
SPA 6 LAC-King-Drew Medical Center 4
SPA 6 Los Angeles Metro Medical Center 1
SPA 6 St. Francis Medical Center 1
SPA 6 Suburban Medical Center (PROMISE/SNF) 2
SPA 6 Orthopedic Hospital 0
10 mile Bellflower Medical Center 1
10 mile Kaiser Foundation Hospital Bellflower 1
10 mile Downey Regional Medical Center 3
10 mile Community Hospital of Gardena 2
10 mile Memorial Hospital of Gardena 1
10 mile Robert F Kennedy Medical Center 0
10 mile Community Hospital of Huntington Park 1
10 mile Centinela Hospital Centinela Campus 1
10 mile Centinela Hospital Freeman Campus 1
10 mile Centinela Hospital Marina Campus 1
10 mile Lakewood Regional Medical Center 1
10 mile California Hospital Medical Center 1
10 mile Good Samaritan Hospital 3
10 mile Midway Hospital Medical Center 1
10 mile Pacific Alliance Medical Center 1
10 mile St. Vincent Medical Center 1
10 mile Temple Community Hospital 1
10 mile East Los Angeles Doctors Hospital 1
10 mile LAC/USC Medical Center 1
10 mile Los Angeles Community Hospital 1
10 mile Santa Marta Hospital (ELASTAR) 0
10 mile USC University Hospital 1
10 mile White Memorial Medical Center 1
10 mile LAC-Harbor-UCLA Med Center 1
10 mile Prov-Little Company of Mary 1
10 mile Torrance Memorial Medical Center 1
Source: Hospital Association of Southern California, Hospital Websites, Kurt Salmon and Associates, Phase II: Data Analysis and Report ofFindings, Prepared for the California HealthCare Foundation (May 5, 2005).
0 = Closed 1 = Open 2 = Closed ED 3 = Potential Closure 4 = Closed TraumaHospital Closure Status:
Closed ED Closed Hospital
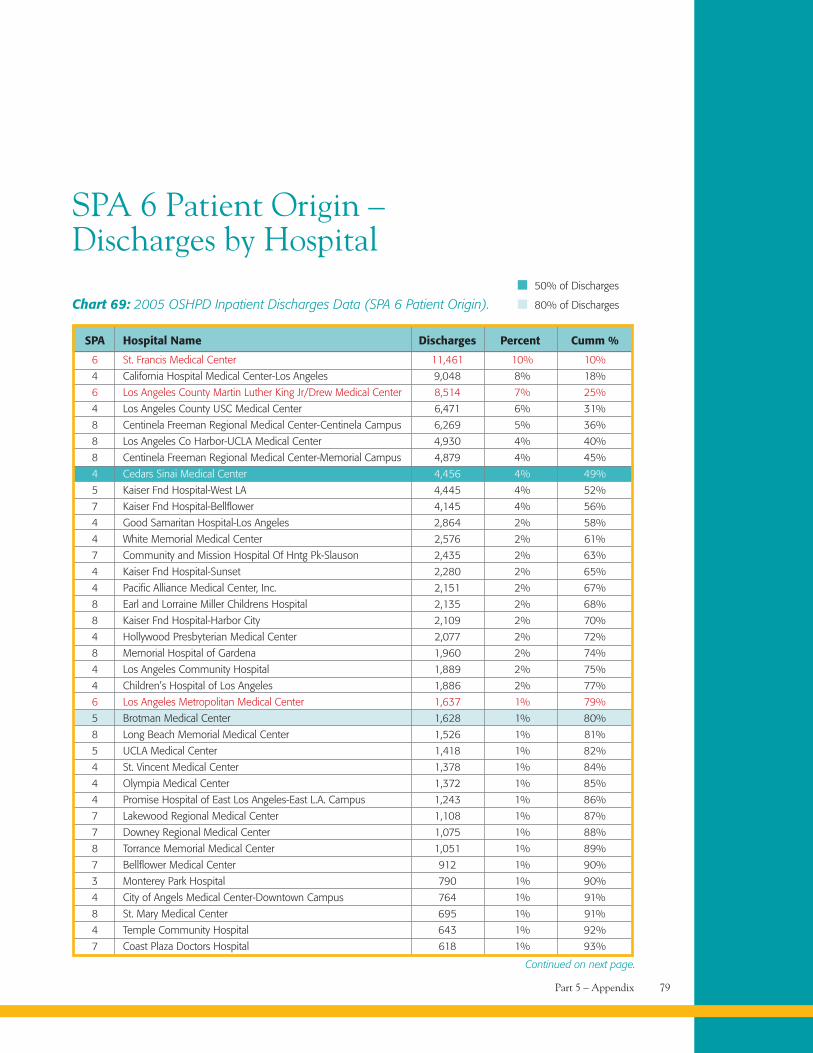
Part 5 – Appendix 79
SPA 6 Patient Origin –Discharges by Hospital
Chart 69: 2005 OSHPD Inpatient Discharges Data (SPA 6 Patient Origin).
SPA Hospital Name Discharges Percent Cumm %
6 St. Francis Medical Center 11,461 10% 10%
4 California Hospital Medical Center-Los Angeles 9,048 8% 18%
6 Los Angeles County Martin Luther King Jr/Drew Medical Center 8,514 7% 25%
4 Los Angeles County USC Medical Center 6,471 6% 31%
8 Centinela Freeman Regional Medical Center-Centinela Campus 6,269 5% 36%
8 Los Angeles Co Harbor-UCLA Medical Center 4,930 4% 40%
8 Centinela Freeman Regional Medical Center-Memorial Campus 4,879 4% 45%
4 Cedars Sinai Medical Center 4,456 4% 49%
5 Kaiser Fnd Hospital-West LA 4,445 4% 52%
7 Kaiser Fnd Hospital-Bellflower 4,145 4% 56%
4 Good Samaritan Hospital-Los Angeles 2,864 2% 58%
4 White Memorial Medical Center 2,576 2% 61%
7 Community and Mission Hospital Of Hntg Pk-Slauson 2,435 2% 63%
4 Kaiser Fnd Hospital-Sunset 2,280 2% 65%
4 Pacific Alliance Medical Center, Inc. 2,151 2% 67%
8 Earl and Lorraine Miller Childrens Hospital 2,135 2% 68%
8 Kaiser Fnd Hospital-Harbor City 2,109 2% 70%
4 Hollywood Presbyterian Medical Center 2,077 2% 72%
8 Memorial Hospital of Gardena 1,960 2% 74%
4 Los Angeles Community Hospital 1,889 2% 75%
4 Children’s Hospital of Los Angeles 1,886 2% 77%
6 Los Angeles Metropolitan Medical Center 1,637 1% 79%
5 Brotman Medical Center 1,628 1% 80%
8 Long Beach Memorial Medical Center 1,526 1% 81%
5 UCLA Medical Center 1,418 1% 82%
4 St. Vincent Medical Center 1,378 1% 84%
4 Olympia Medical Center 1,372 1% 85%
4 Promise Hospital of East Los Angeles-East L.A. Campus 1,243 1% 86%
7 Lakewood Regional Medical Center 1,108 1% 87%
7 Downey Regional Medical Center 1,075 1% 88%
8 Torrance Memorial Medical Center 1,051 1% 89%
7 Bellflower Medical Center 912 1% 90%
3 Monterey Park Hospital 790 1% 90%
4 City of Angels Medical Center-Downtown Campus 764 1% 91%
8 St. Mary Medical Center 695 1% 91%
4 Temple Community Hospital 643 1% 92%
7 Coast Plaza Doctors Hospital 618 1% 93%
50% of Discharges
80% of Discharges
Continued on next page.
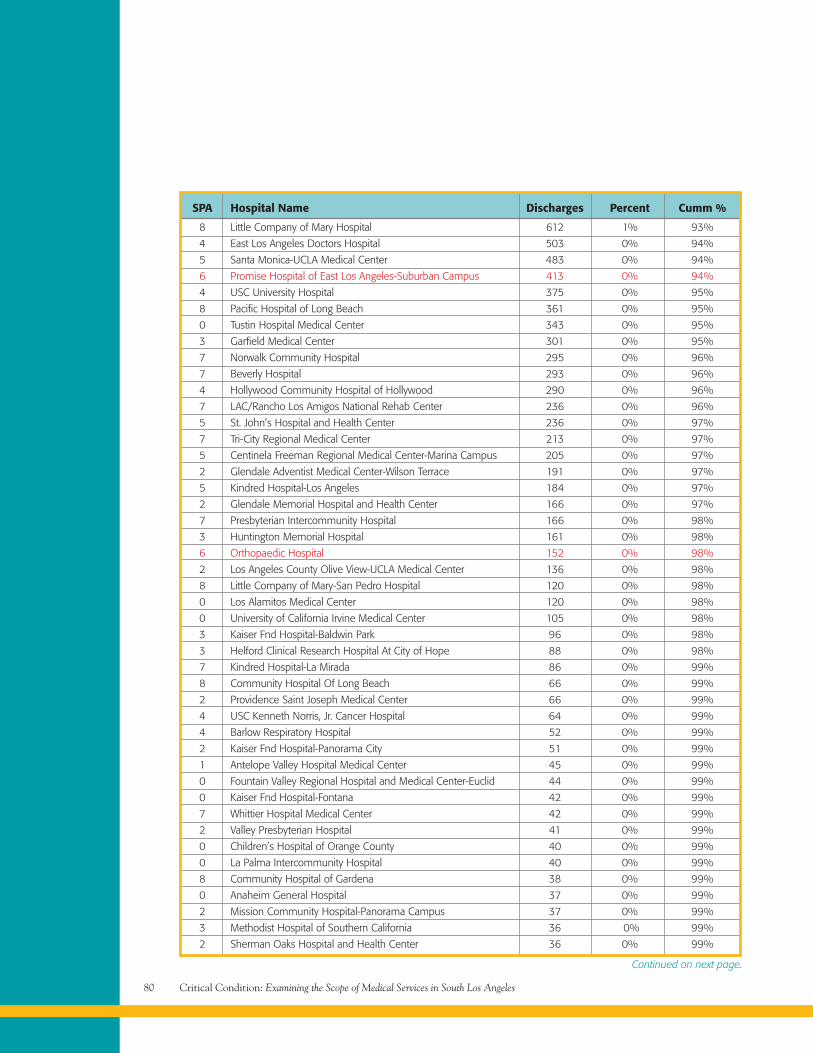
Critical Condition: Examining the Scope of Medical Services in South Los Angeles80
SPA Hospital Name Discharges Percent Cumm %
8 Little Company of Mary Hospital 612 1% 93%
4 East Los Angeles Doctors Hospital 503 0% 94%
5 Santa Monica-UCLA Medical Center 483 0% 94%
6 Promise Hospital of East Los Angeles-Suburban Campus 413 0% 94%
4 USC University Hospital 375 0% 95%
8 Pacific Hospital of Long Beach 361 0% 95%
0 Tustin Hospital Medical Center 343 0% 95%
3 Garfield Medical Center 301 0% 95%
7 Norwalk Community Hospital 295 0% 96%
7 Beverly Hospital 293 0% 96%
4 Hollywood Community Hospital of Hollywood 290 0% 96%
7 LAC/Rancho Los Amigos National Rehab Center 236 0% 96%
5 St. John’s Hospital and Health Center 236 0% 97%
7 Tri-City Regional Medical Center 213 0% 97%
5 Centinela Freeman Regional Medical Center-Marina Campus 205 0% 97%
2 Glendale Adventist Medical Center-Wilson Terrace 191 0% 97%
5 Kindred Hospital-Los Angeles 184 0% 97%
2 Glendale Memorial Hospital and Health Center 166 0% 97%
7 Presbyterian Intercommunity Hospital 166 0% 98%
3 Huntington Memorial Hospital 161 0% 98%
6 Orthopaedic Hospital 152 0% 98%
2 Los Angeles County Olive View-UCLA Medical Center 136 0% 98%
8 Little Company of Mary-San Pedro Hospital 120 0% 98%
0 Los Alamitos Medical Center 120 0% 98%
0 University of California Irvine Medical Center 105 0% 98%
3 Kaiser Fnd Hospital-Baldwin Park 96 0% 98%
3 Helford Clinical Research Hospital At City of Hope 88 0% 98%
7 Kindred Hospital-La Mirada 86 0% 99%
8 Community Hospital Of Long Beach 66 0% 99%
2 Providence Saint Joseph Medical Center 66 0% 99%
4 USC Kenneth Norris, Jr. Cancer Hospital 64 0% 99%
4 Barlow Respiratory Hospital 52 0% 99%
2 Kaiser Fnd Hospital-Panorama City 51 0% 99%
1 Antelope Valley Hospital Medical Center 45 0% 99%
0 Fountain Valley Regional Hospital and Medical Center-Euclid 44 0% 99%
0 Kaiser Fnd Hospital-Fontana 42 0% 99%
7 Whittier Hospital Medical Center 42 0% 99%
2 Valley Presbyterian Hospital 41 0% 99%
0 Children’s Hospital of Orange County 40 0% 99%
0 La Palma Intercommunity Hospital 40 0% 99%
8 Community Hospital of Gardena 38 0% 99%
0 Anaheim General Hospital 37 0% 99%
2 Mission Community Hospital-Panorama Campus 37 0% 99%
3 Methodist Hospital of Southern California 36 0% 99%
2 Sherman Oaks Hospital and Health Center 36 0% 99%
Continued on next page.
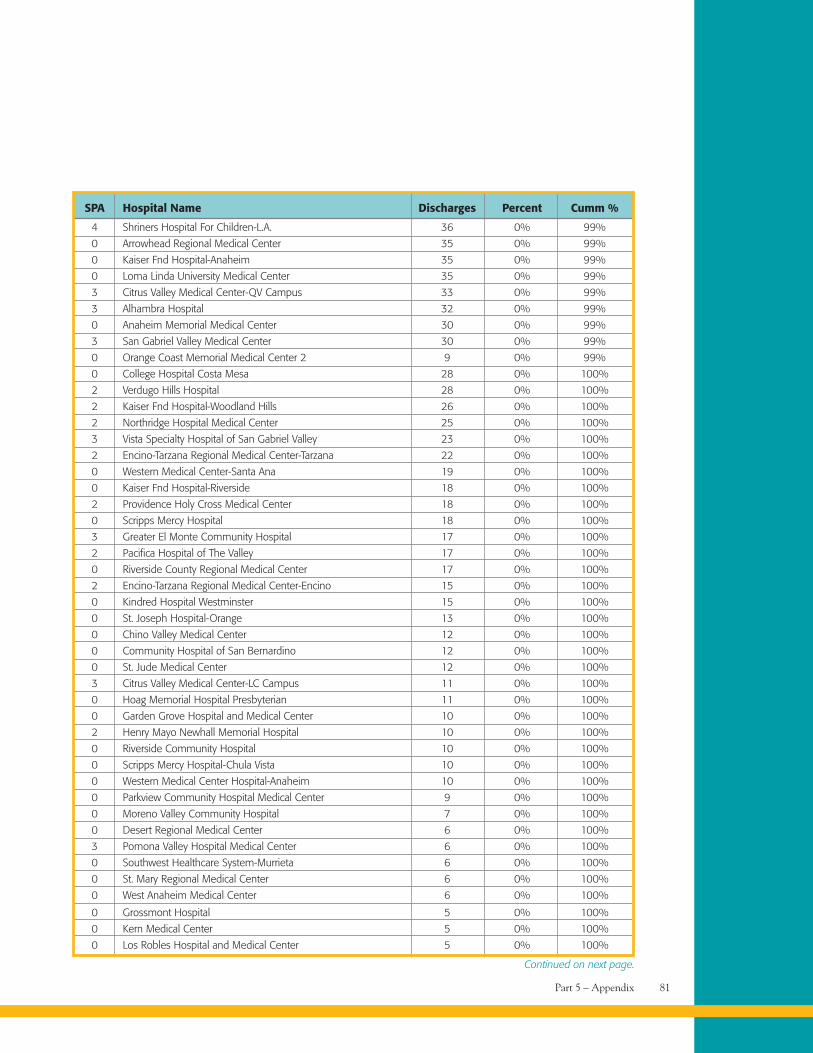
Part 5 – Appendix 81
SPA Hospital Name Discharges Percent Cumm %
4 Shriners Hospital For Children-L.A. 36 0% 99%
0 Arrowhead Regional Medical Center 35 0% 99%
0 Kaiser Fnd Hospital-Anaheim 35 0% 99%
0 Loma Linda University Medical Center 35 0% 99%
3 Citrus Valley Medical Center-QV Campus 33 0% 99%
3 Alhambra Hospital 32 0% 99%
0 Anaheim Memorial Medical Center 30 0% 99%
3 San Gabriel Valley Medical Center 30 0% 99%
0 Orange Coast Memorial Medical Center 2 9 0% 99%
0 College Hospital Costa Mesa 28 0% 100%
2 Verdugo Hills Hospital 28 0% 100%
2 Kaiser Fnd Hospital-Woodland Hills 26 0% 100%
2 Northridge Hospital Medical Center 25 0% 100%
3 Vista Specialty Hospital of San Gabriel Valley 23 0% 100%
2 Encino-Tarzana Regional Medical Center-Tarzana 22 0% 100%
0 Western Medical Center-Santa Ana 19 0% 100%
0 Kaiser Fnd Hospital-Riverside 18 0% 100%
2 Providence Holy Cross Medical Center 18 0% 100%
0 Scripps Mercy Hospital 18 0% 100%
3 Greater El Monte Community Hospital 17 0% 100%
2 Pacifica Hospital of The Valley 17 0% 100%
0 Riverside County Regional Medical Center 17 0% 100%
2 Encino-Tarzana Regional Medical Center-Encino 15 0% 100%
0 Kindred Hospital Westminster 15 0% 100%
0 St. Joseph Hospital-Orange 13 0% 100%
0 Chino Valley Medical Center 12 0% 100%
0 Community Hospital of San Bernardino 12 0% 100%
0 St. Jude Medical Center 12 0% 100%
3 Citrus Valley Medical Center-LC Campus 11 0% 100%
0 Hoag Memorial Hospital Presbyterian 11 0% 100%
0 Garden Grove Hospital and Medical Center 10 0% 100%
2 Henry Mayo Newhall Memorial Hospital 10 0% 100%
0 Riverside Community Hospital 10 0% 100%
0 Scripps Mercy Hospital-Chula Vista 10 0% 100%
0 Western Medical Center Hospital-Anaheim 10 0% 100%
0 Parkview Community Hospital Medical Center 9 0% 100%
0 Moreno Valley Community Hospital 7 0% 100%
0 Desert Regional Medical Center 6 0% 100%
3 Pomona Valley Hospital Medical Center 6 0% 100%
0 Southwest Healthcare System-Murrieta 6 0% 100%
0 St. Mary Regional Medical Center 6 0% 100%
0 West Anaheim Medical Center 6 0% 100%
0 Grossmont Hospital 5 0% 100%
0 Kern Medical Center 5 0% 100%
0 Los Robles Hospital and Medical Center 5 0% 100%
Continued on next page.
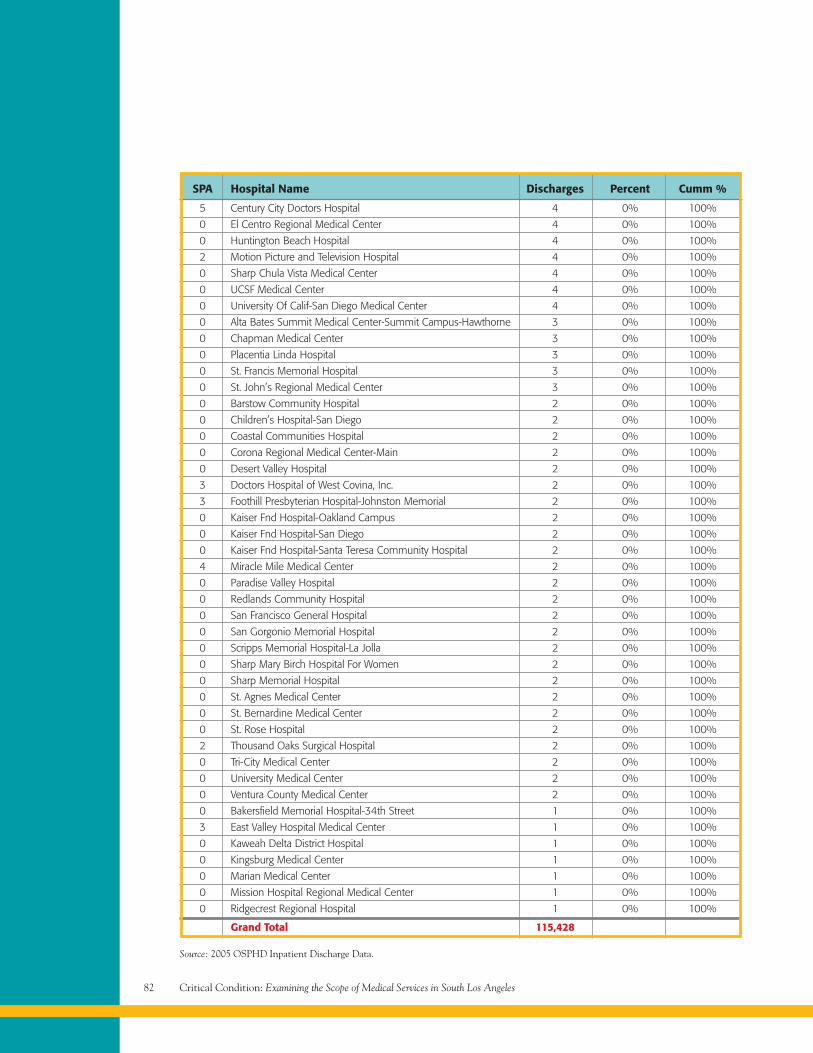
Critical Condition: Examining the Scope of Medical Services in South Los Angeles82
SPA Hospital Name Discharges Percent Cumm %
5 Century City Doctors Hospital 4 0% 100%
0 El Centro Regional Medical Center 4 0% 100%
0 Huntington Beach Hospital 4 0% 100%
2 Motion Picture and Television Hospital 4 0% 100%
0 Sharp Chula Vista Medical Center 4 0% 100%
0 UCSF Medical Center 4 0% 100%
0 University Of Calif-San Diego Medical Center 4 0% 100%
0 Alta Bates Summit Medical Center-Summit Campus-Hawthorne 3 0% 100%
0 Chapman Medical Center 3 0% 100%
0 Placentia Linda Hospital 3 0% 100%
0 St. Francis Memorial Hospital 3 0% 100%
0 St. John’s Regional Medical Center 3 0% 100%
0 Barstow Community Hospital 2 0% 100%
0 Children’s Hospital-San Diego 2 0% 100%
0 Coastal Communities Hospital 2 0% 100%
0 Corona Regional Medical Center-Main 2 0% 100%
0 Desert Valley Hospital 2 0% 100%
3 Doctors Hospital of West Covina, Inc. 2 0% 100%
3 Foothill Presbyterian Hospital-Johnston Memorial 2 0% 100%
0 Kaiser Fnd Hospital-Oakland Campus 2 0% 100%
0 Kaiser Fnd Hospital-San Diego 2 0% 100%
0 Kaiser Fnd Hospital-Santa Teresa Community Hospital 2 0% 100%
4 Miracle Mile Medical Center 2 0% 100%
0 Paradise Valley Hospital 2 0% 100%
0 Redlands Community Hospital 2 0% 100%
0 San Francisco General Hospital 2 0% 100%
0 San Gorgonio Memorial Hospital 2 0% 100%
0 Scripps Memorial Hospital-La Jolla 2 0% 100%
0 Sharp Mary Birch Hospital For Women 2 0% 100%
0 Sharp Memorial Hospital 2 0% 100%
0 St. Agnes Medical Center 2 0% 100%
0 St. Bernardine Medical Center 2 0% 100%
0 St. Rose Hospital 2 0% 100%
2 Thousand Oaks Surgical Hospital 2 0% 100%
0 Tri-City Medical Center 2 0% 100%
0 University Medical Center 2 0% 100%
0 Ventura County Medical Center 2 0% 100%
0 Bakersfield Memorial Hospital-34th Street 1 0% 100%
3 East Valley Hospital Medical Center 1 0% 100%
0 Kaweah Delta District Hospital 1 0% 100%
0 Kingsburg Medical Center 1 0% 100%
0 Marian Medical Center 1 0% 100%
0 Mission Hospital Regional Medical Center 1 0% 100%
0 Ridgecrest Regional Hospital 1 0% 100%
Grand Total 115,428
Source: 2005 OSPHD Inpatient Discharge Data.
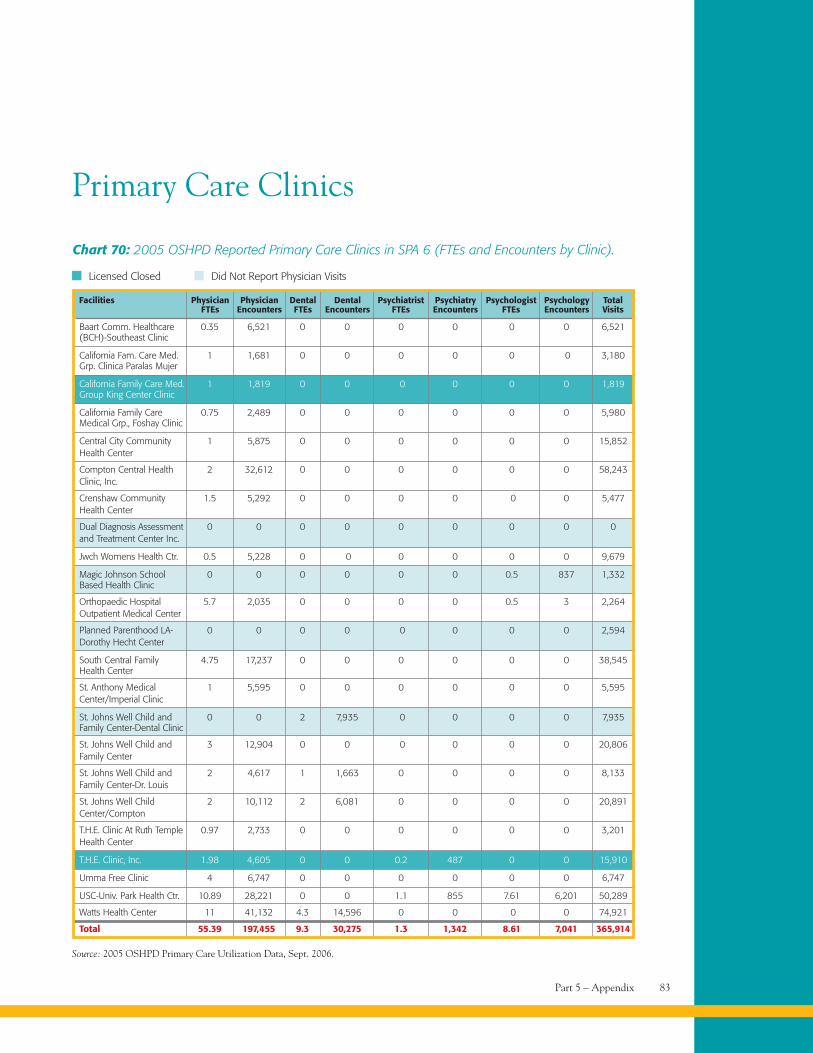
Part 5 – Appendix 83
Source: 2005 OSHPD Primary Care Utilization Data, Sept. 2006.
Primary Care Clinics
Chart 70: 2005 OSHPD Reported Primary Care Clinics in SPA 6 (FTEs and Encounters by Clinic).
Baart Comm. Healthcare 0.35 6,521 0 0 0 0 0 0 6,521(BCH)-Southeast Clinic
California Fam. Care Med. 1 1,681 0 0 0 0 0 0 3,180Grp. Clinica Paralas Mujer
California Family Care Med. 1 1,819 0 0 0 0 0 0 1,819Group King Center Clinic
California Family Care 0.75 2,489 0 0 0 0 0 0 5,980Medical Grp., Foshay Clinic
Central City Community 1 5,875 0 0 0 0 0 0 15,852Health Center
Compton Central Health 2 32,612 0 0 0 0 0 0 58,243Clinic, Inc.
Crenshaw Community 1.5 5,292 0 0 0 0 0 0 5,477Health Center
Dual Diagnosis Assessment 0 0 0 0 0 0 0 0 0and Treatment Center Inc.
Jwch Womens Health Ctr. 0.5 5,228 0 0 0 0 0 0 9,679
Magic Johnson School 0 0 0 0 0 0 0.5 837 1,332Based Health Clinic
Orthopaedic Hospital 5.7 2,035 0 0 0 0 0.5 3 2,264Outpatient Medical Center
Planned Parenthood LA- 0 0 0 0 0 0 0 0 2,594Dorothy Hecht Center
South Central Family 4.75 17,237 0 0 0 0 0 0 38,545Health Center
St. Anthony Medical 1 5,595 0 0 0 0 0 0 5,595Center/Imperial Clinic
St. Johns Well Child and 0 0 2 7,935 0 0 0 0 7,935Family Center-Dental Clinic
St. Johns Well Child and 3 12,904 0 0 0 0 0 0 20,806Family Center
St. Johns Well Child and 2 4,617 1 1,663 0 0 0 0 8,133Family Center-Dr. Louis
St. Johns Well Child 2 10,112 2 6,081 0 0 0 0 20,891Center/Compton
T.H.E. Clinic At Ruth Temple 0.97 2,733 0 0 0 0 0 0 3,201Health Center
T.H.E. Clinic, Inc. 1.98 4,605 0 0 0.2 487 0 0 15,910
Umma Free Clinic 4 6,747 0 0 0 0 0 0 6,747
USC-Univ. Park Health Ctr. 10.89 28,221 0 0 1.1 855 7.61 6,201 50,289
Watts Health Center 11 41,132 4.3 14,596 0 0 0 0 74,921
Total 55.39 197,455 9.3 30,275 1.3 1,342 8.61 7,041 365,914
Facilities Physician Physician Dental Dental Psychiatrist Psychiatry Psychologist Psychology TotalFTEs Encounters FTEs Encounters FTEs Encounters FTEs Encounters Visits
Licensed Closed Did Not Report Physician Visits
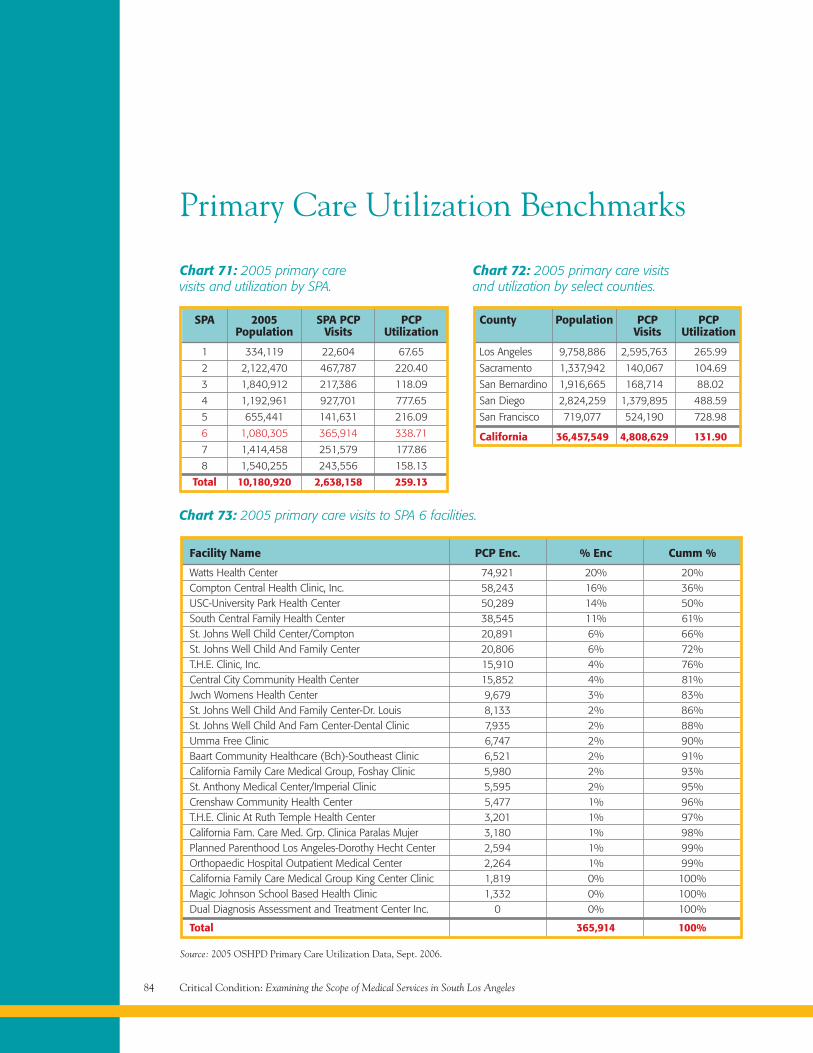
Critical Condition: Examining the Scope of Medical Services in South Los Angeles84
Primary Care Utilization Benchmarks
1 334,119 22,604 67.65
2 2,122,470 467,787 220.40
3 1,840,912 217,386 118.09
4 1,192,961 927,701 777.65
5 655,441 141,631 216.09
6 1,080,305 365,914 338.71
7 1,414,458 251,579 177.86
8 1,540,255 243,556 158.13
Total 10,180,920 2,638,158 259.13
SPA 2005 SPA PCP PCPPopulation Visits Utilization
Chart 71: 2005 primary carevisits and utilization by SPA.
Los Angeles 9,758,886 2,595,763 265.99
Sacramento 1,337,942 140,067 104.69
San Bernardino 1,916,665 168,714 88.02
San Diego 2,824,259 1,379,895 488.59
San Francisco 719,077 524,190 728.98
California 36,457,549 4,808,629 131.90
County Population PCP PCPVisits Utilization
Chart 72: 2005 primary care visitsand utilization by select counties.
Source: 2005 OSHPD Primary Care Utilization Data, Sept. 2006.
Chart 73: 2005 primary care visits to SPA 6 facilities.
Facility Name PCP Enc. % Enc Cumm %
Watts Health Center 74,921 20% 20%Compton Central Health Clinic, Inc. 58,243 16% 36%USC-University Park Health Center 50,289 14% 50%South Central Family Health Center 38,545 11% 61%St. Johns Well Child Center/Compton 20,891 6% 66%St. Johns Well Child And Family Center 20,806 6% 72%T.H.E. Clinic, Inc. 15,910 4% 76%Central City Community Health Center 15,852 4% 81%Jwch Womens Health Center 9,679 3% 83%St. Johns Well Child And Family Center-Dr. Louis 8,133 2% 86%St. Johns Well Child And Fam Center-Dental Clinic 7,935 2% 88%Umma Free Clinic 6,747 2% 90%Baart Community Healthcare (Bch)-Southeast Clinic 6,521 2% 91%California Family Care Medical Group, Foshay Clinic 5,980 2% 93%St. Anthony Medical Center/Imperial Clinic 5,595 2% 95%Crenshaw Community Health Center 5,477 1% 96%T.H.E. Clinic At Ruth Temple Health Center 3,201 1% 97%California Fam. Care Med. Grp. Clinica Paralas Mujer 3,180 1% 98%Planned Parenthood Los Angeles-Dorothy Hecht Center 2,594 1% 99%Orthopaedic Hospital Outpatient Medical Center 2,264 1% 99%California Family Care Medical Group King Center Clinic 1,819 0% 100%Magic Johnson School Based Health Clinic 1,332 0% 100%Dual Diagnosis Assessment and Treatment Center Inc. 0 0% 100%
Total 365,914 100%
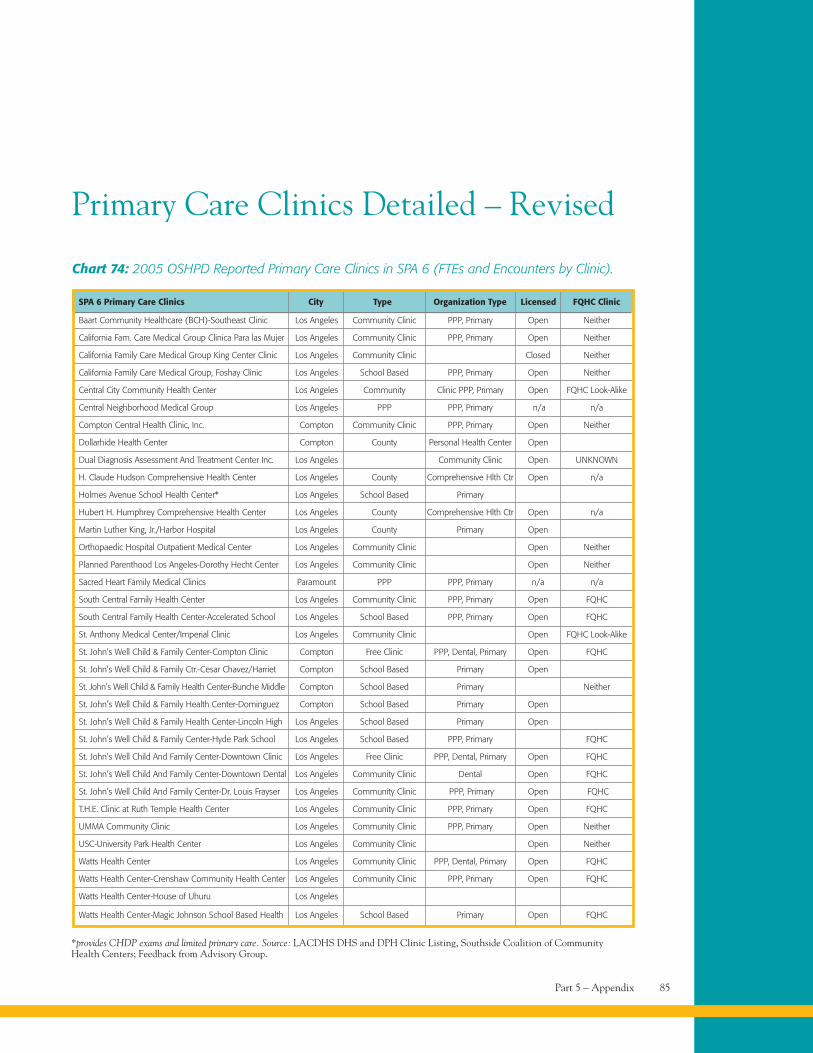
Part 5 – Appendix 85
*provides CHDP exams and limited primary care. Source: LACDHS DHS and DPH Clinic Listing, Southside Coalition of CommunityHealth Centers; Feedback from Advisory Group.
Primary Care Clinics Detailed – Revised
Chart 74: 2005 OSHPD Reported Primary Care Clinics in SPA 6 (FTEs and Encounters by Clinic).
Baart Community Healthcare (BCH)-Southeast Clinic Los Angeles Community Clinic PPP, Primary Open Neither
California Fam. Care Medical Group Clinica Para las Mujer Los Angeles Community Clinic PPP, Primary Open Neither
California Family Care Medical Group King Center Clinic Los Angeles Community Clinic Closed Neither
California Family Care Medical Group, Foshay Clinic Los Angeles School Based PPP, Primary Open Neither
Central City Community Health Center Los Angeles Community Clinic PPP, Primary Open FQHC Look-Alike
Central Neighborhood Medical Group Los Angeles PPP PPP, Primary n/a n/a
Compton Central Health Clinic, Inc. Compton Community Clinic PPP, Primary Open Neither
Dollarhide Health Center Compton County Personal Health Center Open
Dual Diagnosis Assessment And Treatment Center Inc. Los Angeles Community Clinic Open UNKNOWN
H. Claude Hudson Comprehensive Health Center Los Angeles County Comprehensive Hlth Ctr Open n/a
Holmes Avenue School Health Center* Los Angeles School Based Primary
Hubert H. Humphrey Comprehensive Health Center Los Angeles County Comprehensive Hlth Ctr Open n/a
Martin Luther King, Jr./Harbor Hospital Los Angeles County Primary Open
Orthopaedic Hospital Outpatient Medical Center Los Angeles Community Clinic Open Neither
Planned Parenthood Los Angeles-Dorothy Hecht Center Los Angeles Community Clinic Open Neither
Sacred Heart Family Medical Clinics Paramount PPP PPP, Primary n/a n/a
South Central Family Health Center Los Angeles Community Clinic PPP, Primary Open FQHC
South Central Family Health Center-Accelerated School Los Angeles School Based PPP, Primary Open FQHC
St. Anthony Medical Center/Imperial Clinic Los Angeles Community Clinic Open FQHC Look-Alike
St. John’s Well Child & Family Center-Compton Clinic Compton Free Clinic PPP, Dental, Primary Open FQHC
St. John’s Well Child & Family Ctr.-Cesar Chavez/Harriet Compton School Based Primary Open
St. John’s Well Child & Family Health Center-Bunche Middle Compton School Based Primary Neither
St. John’s Well Child & Family Health Center-Dominguez Compton School Based Primary Open
St. John’s Well Child & Family Health Center-Lincoln High Los Angeles School Based Primary Open
St. John’s Well Child & Family Center-Hyde Park School Los Angeles School Based PPP, Primary FQHC
St. John’s Well Child And Family Center-Downtown Clinic Los Angeles Free Clinic PPP, Dental, Primary Open FQHC
St. John’s Well Child And Family Center-Downtown Dental Los Angeles Community Clinic Dental Open FQHC
St. John’s Well Child And Family Center-Dr. Louis Frayser Los Angeles Community Clinic PPP, Primary Open FQHC
T.H.E. Clinic at Ruth Temple Health Center Los Angeles Community Clinic PPP, Primary Open FQHC
UMMA Community Clinic Los Angeles Community Clinic PPP, Primary Open Neither
USC-University Park Health Center Los Angeles Community Clinic Open Neither
Watts Health Center Los Angeles Community Clinic PPP, Dental, Primary Open FQHC
Watts Health Center-Crenshaw Community Health Center Los Angeles Community Clinic PPP, Primary Open FQHC
Watts Health Center-House of Uhuru Los Angeles
Watts Health Center-Magic Johnson School Based Health Los Angeles School Based Primary Open FQHC
SPA 6 Primary Care Clinics City Type Organization Type Licensed FQHC Clinic
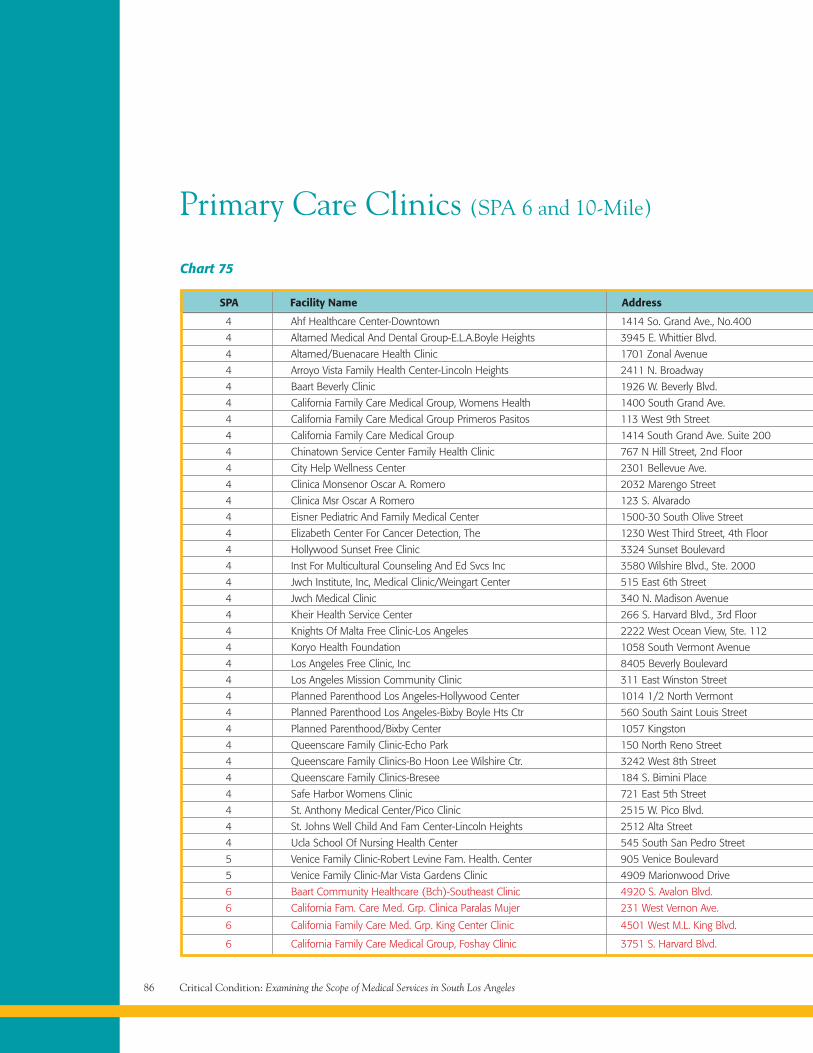
Critical Condition: Examining the Scope of Medical Services in South Los Angeles86
Primary Care Clinics (SPA 6 and 10-Mile)
Chart 75
4 Ahf Healthcare Center-Downtown 1414 So. Grand Ave., No.400
4 Altamed Medical And Dental Group-E.L.A.Boyle Heights 3945 E. Whittier Blvd.
4 Altamed/Buenacare Health Clinic 1701 Zonal Avenue
4 Arroyo Vista Family Health Center-Lincoln Heights 2411 N. Broadway
4 Baart Beverly Clinic 1926 W. Beverly Blvd.
4 California Family Care Medical Group, Womens Health 1400 South Grand Ave.
4 California Family Care Medical Group Primeros Pasitos 113 West 9th Street
4 California Family Care Medical Group 1414 South Grand Ave. Suite 200
4 Chinatown Service Center Family Health Clinic 767 N Hill Street, 2nd Floor
4 City Help Wellness Center 2301 Bellevue Ave.
4 Clinica Monsenor Oscar A. Romero 2032 Marengo Street
4 Clinica Msr Oscar A Romero 123 S. Alvarado
4 Eisner Pediatric And Family Medical Center 1500-30 South Olive Street
4 Elizabeth Center For Cancer Detection, The 1230 West Third Street, 4th Floor
4 Hollywood Sunset Free Clinic 3324 Sunset Boulevard
4 Inst For Multicultural Counseling And Ed Svcs Inc 3580 Wilshire Blvd., Ste. 2000
4 Jwch Institute, Inc, Medical Clinic/Weingart Center 515 East 6th Street
4 Jwch Medical Clinic 340 N. Madison Avenue
4 Kheir Health Service Center 266 S. Harvard Blvd., 3rd Floor
4 Knights Of Malta Free Clinic-Los Angeles 2222 West Ocean View, Ste. 112
4 Koryo Health Foundation 1058 South Vermont Avenue
4 Los Angeles Free Clinic, Inc 8405 Beverly Boulevard
4 Los Angeles Mission Community Clinic 311 East Winston Street
4 Planned Parenthood Los Angeles-Hollywood Center 1014 1/2 North Vermont
4 Planned Parenthood Los Angeles-Bixby Boyle Hts Ctr 560 South Saint Louis Street
4 Planned Parenthood/Bixby Center 1057 Kingston
4 Queenscare Family Clinic-Echo Park 150 North Reno Street
4 Queenscare Family Clinics-Bo Hoon Lee Wilshire Ctr. 3242 West 8th Street
4 Queenscare Family Clinics-Bresee 184 S. Bimini Place
4 Safe Harbor Womens Clinic 721 East 5th Street
4 St. Anthony Medical Center/Pico Clinic 2515 W. Pico Blvd.
4 St. Johns Well Child And Fam Center-Lincoln Heights 2512 Alta Street
4 Ucla School Of Nursing Health Center 545 South San Pedro Street
5 Venice Family Clinic-Robert Levine Fam. Health. Center 905 Venice Boulevard
5 Venice Family Clinic-Mar Vista Gardens Clinic 4909 Marionwood Drive
6 Baart Community Healthcare (Bch)-Southeast Clinic 4920 S. Avalon Blvd.
6 California Fam. Care Med. Grp. Clinica Paralas Mujer 231 West Vernon Ave.
6 California Family Care Med. Grp. King Center Clinic 4501 West M.L. King Blvd.
6 California Family Care Medical Group, Foshay Clinic 3751 S. Harvard Blvd.
SPA Facility Name Address
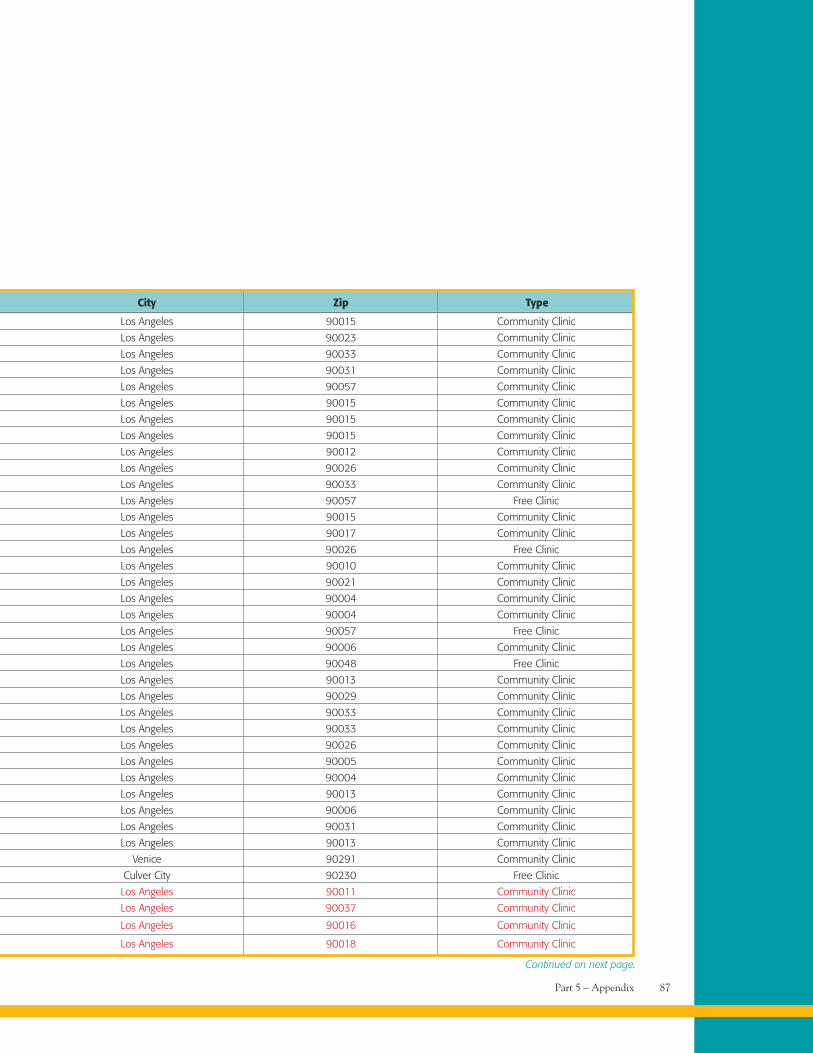
Part 5 – Appendix 87
Los Angeles 90015 Community Clinic
Los Angeles 90023 Community Clinic
Los Angeles 90033 Community Clinic
Los Angeles 90031 Community Clinic
Los Angeles 90057 Community Clinic
Los Angeles 90015 Community Clinic
Los Angeles 90015 Community Clinic
Los Angeles 90015 Community Clinic
Los Angeles 90012 Community Clinic
Los Angeles 90026 Community Clinic
Los Angeles 90033 Community Clinic
Los Angeles 90057 Free Clinic
Los Angeles 90015 Community Clinic
Los Angeles 90017 Community Clinic
Los Angeles 90026 Free Clinic
Los Angeles 90010 Community Clinic
Los Angeles 90021 Community Clinic
Los Angeles 90004 Community Clinic
Los Angeles 90004 Community Clinic
Los Angeles 90057 Free Clinic
Los Angeles 90006 Community Clinic
Los Angeles 90048 Free Clinic
Los Angeles 90013 Community Clinic
Los Angeles 90029 Community Clinic
Los Angeles 90033 Community Clinic
Los Angeles 90033 Community Clinic
Los Angeles 90026 Community Clinic
Los Angeles 90005 Community Clinic
Los Angeles 90004 Community Clinic
Los Angeles 90013 Community Clinic
Los Angeles 90006 Community Clinic
Los Angeles 90031 Community Clinic
Los Angeles 90013 Community Clinic
Venice 90291 Community Clinic
Culver City 90230 Free Clinic
Los Angeles 90011 Community Clinic
Los Angeles 90037 Community Clinic
Los Angeles 90016 Community Clinic
Los Angeles 90018 Community Clinic
City Zip Type
Continued on next page.
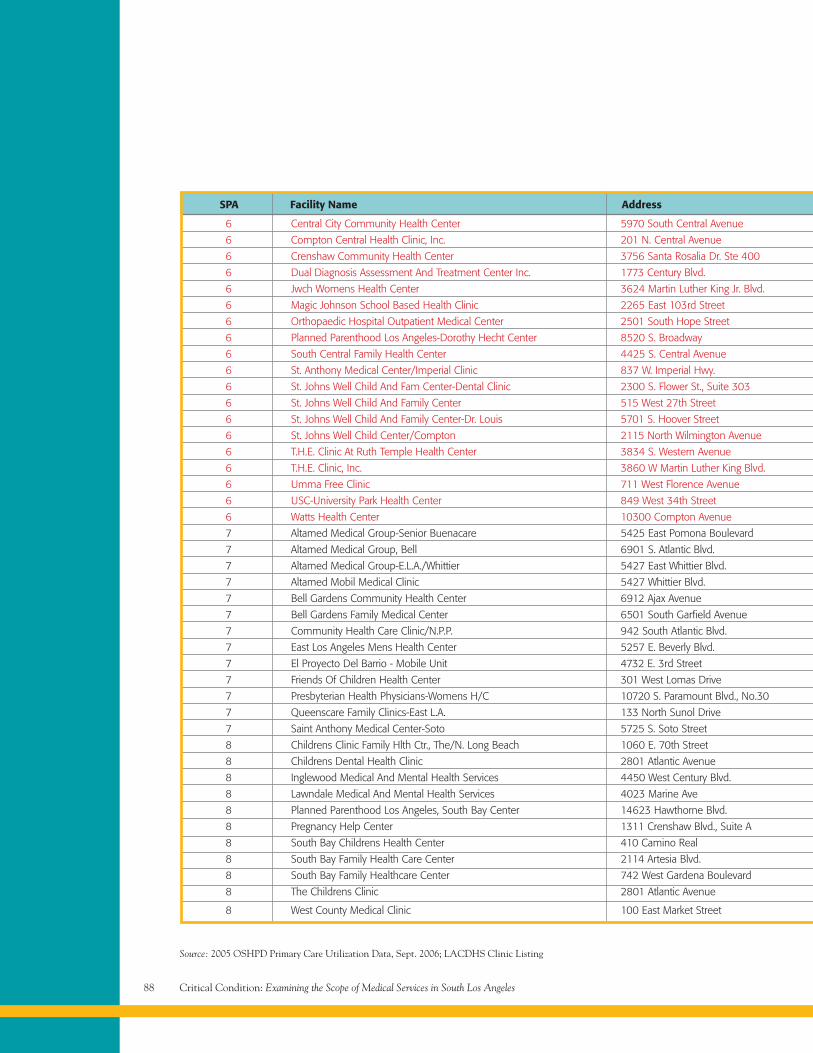
Critical Condition: Examining the Scope of Medical Services in South Los Angeles88
Source: 2005 OSHPD Primary Care Utilization Data, Sept. 2006; LACDHS Clinic Listing
6 Central City Community Health Center 5970 South Central Avenue
6 Compton Central Health Clinic, Inc. 201 N. Central Avenue
6 Crenshaw Community Health Center 3756 Santa Rosalia Dr. Ste 400
6 Dual Diagnosis Assessment And Treatment Center Inc. 1773 Century Blvd.
6 Jwch Womens Health Center 3624 Martin Luther King Jr. Blvd.
6 Magic Johnson School Based Health Clinic 2265 East 103rd Street
6 Orthopaedic Hospital Outpatient Medical Center 2501 South Hope Street
6 Planned Parenthood Los Angeles-Dorothy Hecht Center 8520 S. Broadway
6 South Central Family Health Center 4425 S. Central Avenue
6 St. Anthony Medical Center/Imperial Clinic 837 W. Imperial Hwy.
6 St. Johns Well Child And Fam Center-Dental Clinic 2300 S. Flower St., Suite 303
6 St. Johns Well Child And Family Center 515 West 27th Street
6 St. Johns Well Child And Family Center-Dr. Louis 5701 S. Hoover Street
6 St. Johns Well Child Center/Compton 2115 North Wilmington Avenue
6 T.H.E. Clinic At Ruth Temple Health Center 3834 S. Western Avenue
6 T.H.E. Clinic, Inc. 3860 W Martin Luther King Blvd.
6 Umma Free Clinic 711 West Florence Avenue
6 USC-University Park Health Center 849 West 34th Street
6 Watts Health Center 10300 Compton Avenue
7 Altamed Medical Group-Senior Buenacare 5425 East Pomona Boulevard
7 Altamed Medical Group, Bell 6901 S. Atlantic Blvd.
7 Altamed Medical Group-E.L.A./Whittier 5427 East Whittier Blvd.
7 Altamed Mobil Medical Clinic 5427 Whittier Blvd.
7 Bell Gardens Community Health Center 6912 Ajax Avenue
7 Bell Gardens Family Medical Center 6501 South Garfield Avenue
7 Community Health Care Clinic/N.P.P. 942 South Atlantic Blvd.
7 East Los Angeles Mens Health Center 5257 E. Beverly Blvd.
7 El Proyecto Del Barrio - Mobile Unit 4732 E. 3rd Street
7 Friends Of Children Health Center 301 West Lomas Drive
7 Presbyterian Health Physicians-Womens H/C 10720 S. Paramount Blvd., No.30
7 Queenscare Family Clinics-East L.A. 133 North Sunol Drive
7 Saint Anthony Medical Center-Soto 5725 S. Soto Street
8 Childrens Clinic Family Hlth Ctr., The/N. Long Beach 1060 E. 70th Street
8 Childrens Dental Health Clinic 2801 Atlantic Avenue
8 Inglewood Medical And Mental Health Services 4450 West Century Blvd.
8 Lawndale Medical And Mental Health Services 4023 Marine Ave
8 Planned Parenthood Los Angeles, South Bay Center 14623 Hawthorne Blvd.
8 Pregnancy Help Center 1311 Crenshaw Blvd., Suite A
8 South Bay Childrens Health Center 410 Camino Real
8 South Bay Family Health Care Center 2114 Artesia Blvd.
8 South Bay Family Healthcare Center 742 West Gardena Boulevard
8 The Childrens Clinic 2801 Atlantic Avenue
8 West County Medical Clinic 100 East Market Street
SPA Facility Name Address
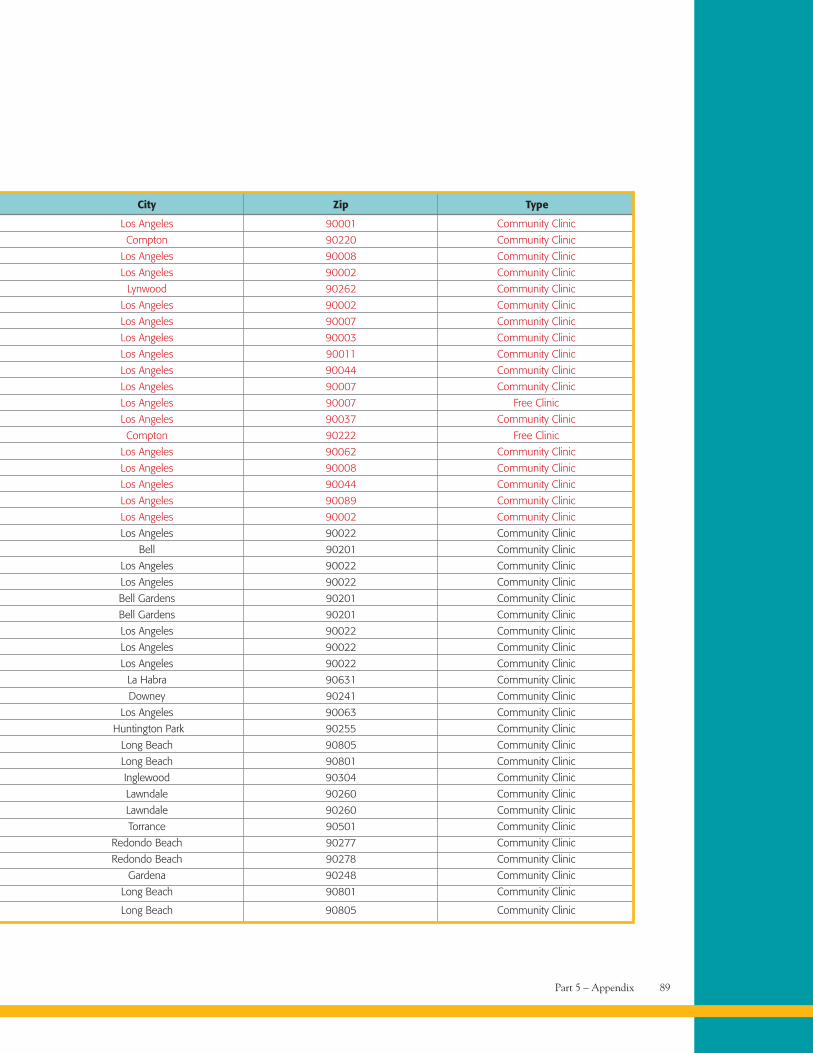
Part 5 – Appendix 89
Los Angeles 90001 Community Clinic
Compton 90220 Community Clinic
Los Angeles 90008 Community Clinic
Los Angeles 90002 Community Clinic
Lynwood 90262 Community Clinic
Los Angeles 90002 Community Clinic
Los Angeles 90007 Community Clinic
Los Angeles 90003 Community Clinic
Los Angeles 90011 Community Clinic
Los Angeles 90044 Community Clinic
Los Angeles 90007 Community Clinic
Los Angeles 90007 Free Clinic
Los Angeles 90037 Community Clinic
Compton 90222 Free Clinic
Los Angeles 90062 Community Clinic
Los Angeles 90008 Community Clinic
Los Angeles 90044 Community Clinic
Los Angeles 90089 Community Clinic
Los Angeles 90002 Community Clinic
Los Angeles 90022 Community Clinic
Bell 90201 Community Clinic
Los Angeles 90022 Community Clinic
Los Angeles 90022 Community Clinic
Bell Gardens 90201 Community Clinic
Bell Gardens 90201 Community Clinic
Los Angeles 90022 Community Clinic
Los Angeles 90022 Community Clinic
Los Angeles 90022 Community Clinic
La Habra 90631 Community Clinic
Downey 90241 Community Clinic
Los Angeles 90063 Community Clinic
Huntington Park 90255 Community Clinic
Long Beach 90805 Community Clinic
Long Beach 90801 Community Clinic
Inglewood 90304 Community Clinic
Lawndale 90260 Community Clinic
Lawndale 90260 Community Clinic
Torrance 90501 Community Clinic
Redondo Beach 90277 Community Clinic
Redondo Beach 90278 Community Clinic
Gardena 90248 Community Clinic
Long Beach 90801 Community Clinic
Long Beach 90805 Community Clinic
City Zip Type
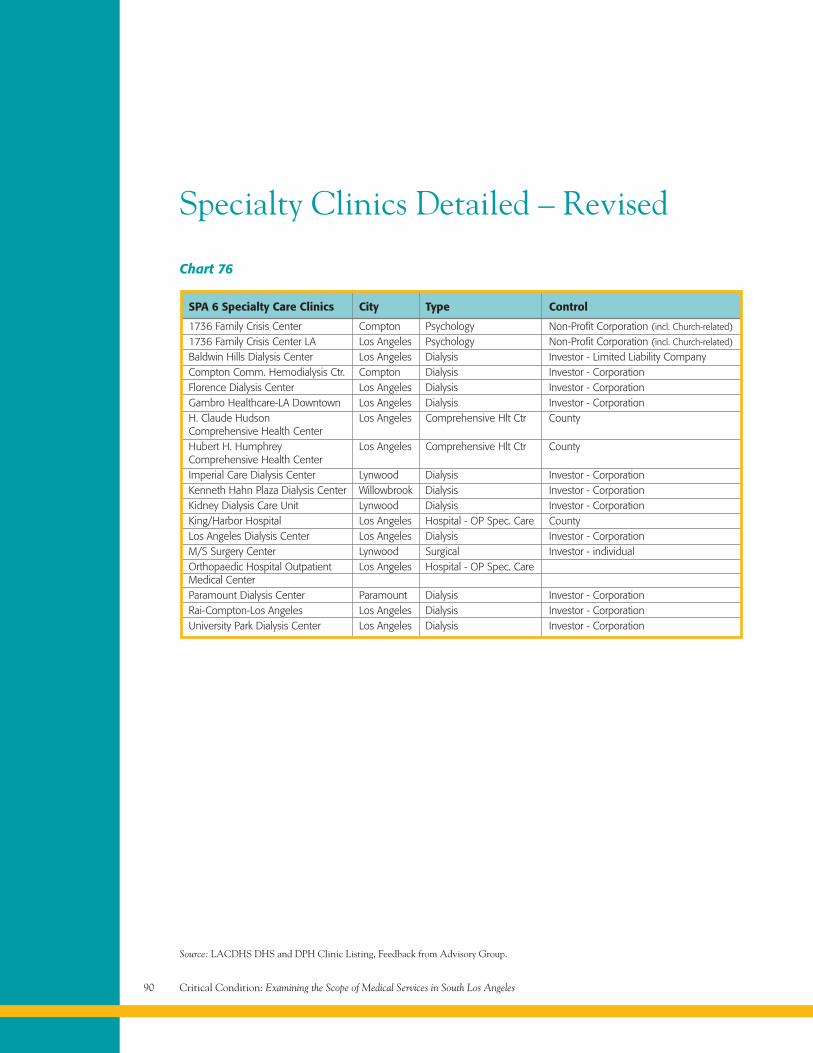
Critical Condition: Examining the Scope of Medical Services in South Los Angeles90
Source: LACDHS DHS and DPH Clinic Listing, Feedback from Advisory Group.
Chart 76
SPA 6 Specialty Care Clinics City Type Control
1736 Family Crisis Center Compton Psychology Non-Profit Corporation (incl. Church-related)
1736 Family Crisis Center LA Los Angeles Psychology Non-Profit Corporation (incl. Church-related)
Baldwin Hills Dialysis Center Los Angeles Dialysis Investor - Limited Liability CompanyCompton Comm. Hemodialysis Ctr. Compton Dialysis Investor - CorporationFlorence Dialysis Center Los Angeles Dialysis Investor - CorporationGambro Healthcare-LA Downtown Los Angeles Dialysis Investor - CorporationH. Claude Hudson Los Angeles Comprehensive Hlt Ctr CountyComprehensive Health CenterHubert H. Humphrey Los Angeles Comprehensive Hlt Ctr CountyComprehensive Health CenterImperial Care Dialysis Center Lynwood Dialysis Investor - CorporationKenneth Hahn Plaza Dialysis Center Willowbrook Dialysis Investor - CorporationKidney Dialysis Care Unit Lynwood Dialysis Investor - CorporationKing/Harbor Hospital Los Angeles Hospital - OP Spec. Care CountyLos Angeles Dialysis Center Los Angeles Dialysis Investor - CorporationM/S Surgery Center Lynwood Surgical Investor - individualOrthopaedic Hospital Outpatient Los Angeles Hospital - OP Spec. CareMedical CenterParamount Dialysis Center Paramount Dialysis Investor - CorporationRai-Compton-Los Angeles Los Angeles Dialysis Investor - CorporationUniversity Park Dialysis Center Los Angeles Dialysis Investor - Corporation
Specialty Clinics Detailed – Revised
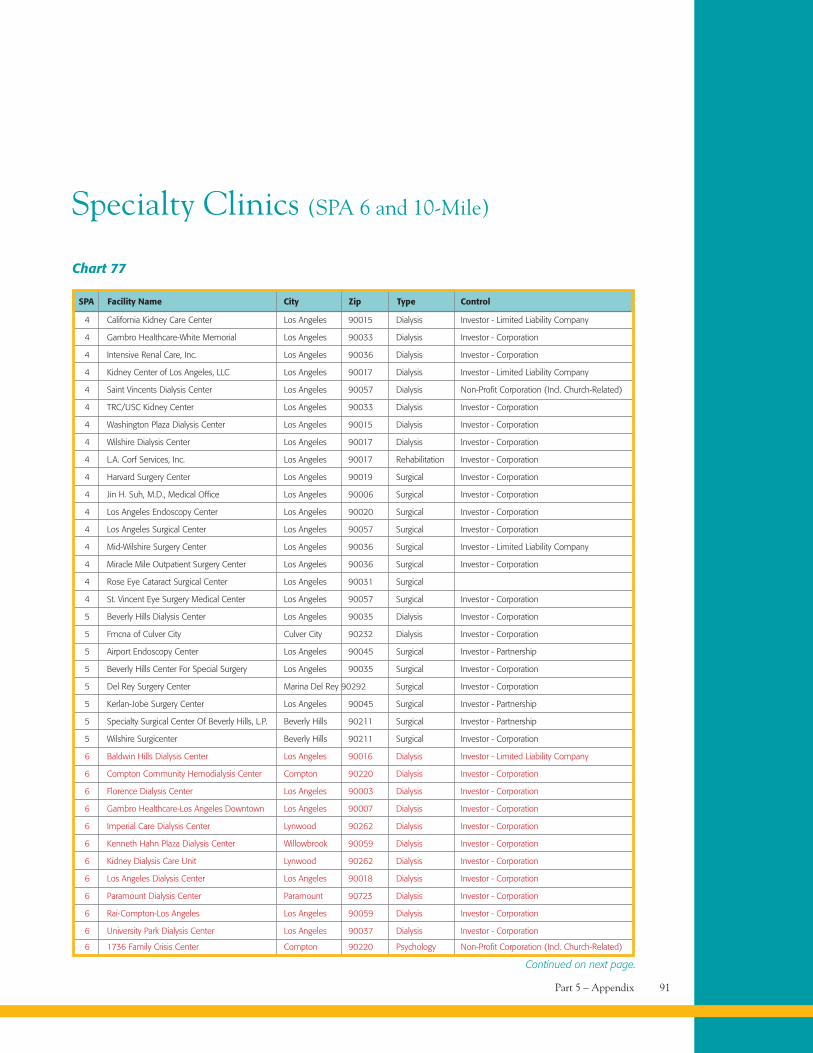
Part 5 – Appendix 91
Specialty Clinics (SPA 6 and 10-Mile)
Chart 77
4 California Kidney Care Center Los Angeles 90015 Dialysis Investor - Limited Liability Company
4 Gambro Healthcare-White Memorial Los Angeles 90033 Dialysis Investor - Corporation
4 Intensive Renal Care, Inc. Los Angeles 90036 Dialysis Investor - Corporation
4 Kidney Center of Los Angeles, LLC Los Angeles 90017 Dialysis Investor - Limited Liability Company
4 Saint Vincents Dialysis Center Los Angeles 90057 Dialysis Non-Profit Corporation (Incl. Church-Related)
4 TRC/USC Kidney Center Los Angeles 90033 Dialysis Investor - Corporation
4 Washington Plaza Dialysis Center Los Angeles 90015 Dialysis Investor - Corporation
4 Wilshire Dialysis Center Los Angeles 90017 Dialysis Investor - Corporation
4 L.A. Corf Services, Inc. Los Angeles 90017 Rehabilitation Investor - Corporation
4 Harvard Surgery Center Los Angeles 90019 Surgical Investor - Corporation
4 Jin H. Suh, M.D., Medical Office Los Angeles 90006 Surgical Investor - Corporation
4 Los Angeles Endoscopy Center Los Angeles 90020 Surgical Investor - Corporation
4 Los Angeles Surgical Center Los Angeles 90057 Surgical Investor - Corporation
4 Mid-Wilshire Surgery Center Los Angeles 90036 Surgical Investor - Limited Liability Company
4 Miracle Mile Outpatient Surgery Center Los Angeles 90036 Surgical Investor - Corporation
4 Rose Eye Cataract Surgical Center Los Angeles 90031 Surgical
4 St. Vincent Eye Surgery Medical Center Los Angeles 90057 Surgical Investor - Corporation
5 Beverly Hills Dialysis Center Los Angeles 90035 Dialysis Investor - Corporation
5 Fmcna of Culver City Culver City 90232 Dialysis Investor - Corporation
5 Airport Endoscopy Center Los Angeles 90045 Surgical Investor - Partnership
5 Beverly Hills Center For Special Surgery Los Angeles 90035 Surgical Investor - Corporation
5 Del Rey Surgery Center Marina Del Rey 90292 Surgical Investor - Corporation
5 Kerlan-Jobe Surgery Center Los Angeles 90045 Surgical Investor - Partnership
5 Specialty Surgical Center Of Beverly Hills, L.P. Beverly Hills 90211 Surgical Investor - Partnership
5 Wilshire Surgicenter Beverly Hills 90211 Surgical Investor - Corporation
6 Baldwin Hills Dialysis Center Los Angeles 90016 Dialysis Investor - Limited Liability Company
6 Compton Community Hemodialysis Center Compton 90220 Dialysis Investor - Corporation
6 Florence Dialysis Center Los Angeles 90003 Dialysis Investor - Corporation
6 Gambro Healthcare-Los Angeles Downtown Los Angeles 90007 Dialysis Investor - Corporation
6 Imperial Care Dialysis Center Lynwood 90262 Dialysis Investor - Corporation
6 Kenneth Hahn Plaza Dialysis Center Willowbrook 90059 Dialysis Investor - Corporation
6 Kidney Dialysis Care Unit Lynwood 90262 Dialysis Investor - Corporation
6 Los Angeles Dialysis Center Los Angeles 90018 Dialysis Investor - Corporation
6 Paramount Dialysis Center Paramount 90723 Dialysis Investor - Corporation
6 Rai-Compton-Los Angeles Los Angeles 90059 Dialysis Investor - Corporation
6 University Park Dialysis Center Los Angeles 90037 Dialysis Investor - Corporation
6 1736 Family Crisis Center Compton 90220 Psychology Non-Profit Corporation (Incl. Church-Related)
SPA Facility Name City Zip Type Control
Continued on next page.
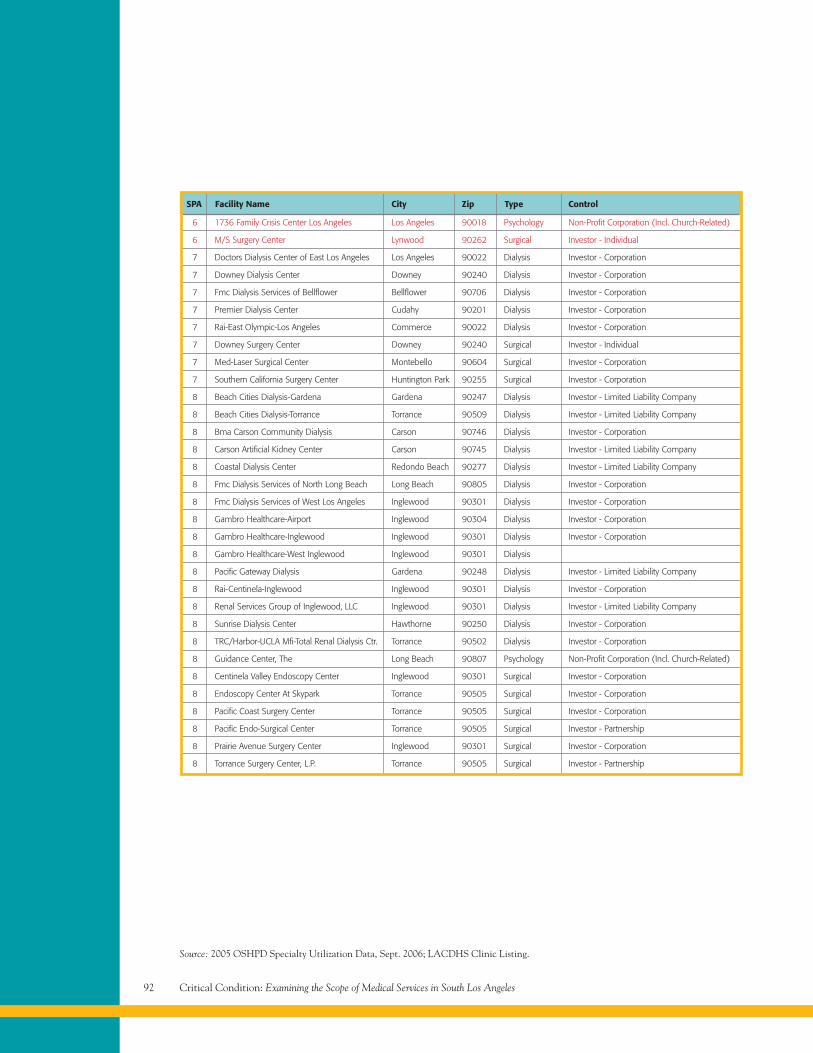
Critical Condition: Examining the Scope of Medical Services in South Los Angeles92
Source: 2005 OSHPD Specialty Utilization Data, Sept. 2006; LACDHS Clinic Listing.
6 1736 Family Crisis Center Los Angeles Los Angeles 90018 Psychology Non-Profit Corporation (Incl. Church-Related)
6 M/S Surgery Center Lynwood 90262 Surgical Investor - Individual
7 Doctors Dialysis Center of East Los Angeles Los Angeles 90022 Dialysis Investor - Corporation
7 Downey Dialysis Center Downey 90240 Dialysis Investor - Corporation
7 Fmc Dialysis Services of Bellflower Bellflower 90706 Dialysis Investor - Corporation
7 Premier Dialysis Center Cudahy 90201 Dialysis Investor - Corporation
7 Rai-East Olympic-Los Angeles Commerce 90022 Dialysis Investor - Corporation
7 Downey Surgery Center Downey 90240 Surgical Investor - Individual
7 Med-Laser Surgical Center Montebello 90604 Surgical Investor - Corporation
7 Southern California Surgery Center Huntington Park 90255 Surgical Investor - Corporation
8 Beach Cities Dialysis-Gardena Gardena 90247 Dialysis Investor - Limited Liability Company
8 Beach Cities Dialysis-Torrance Torrance 90509 Dialysis Investor - Limited Liability Company
8 Bma Carson Community Dialysis Carson 90746 Dialysis Investor - Corporation
8 Carson Artificial Kidney Center Carson 90745 Dialysis Investor - Limited Liability Company
8 Coastal Dialysis Center Redondo Beach 90277 Dialysis Investor - Limited Liability Company
8 Fmc Dialysis Services of North Long Beach Long Beach 90805 Dialysis Investor - Corporation
8 Fmc Dialysis Services of West Los Angeles Inglewood 90301 Dialysis Investor - Corporation
8 Gambro Healthcare-Airport Inglewood 90304 Dialysis Investor - Corporation
8 Gambro Healthcare-Inglewood Inglewood 90301 Dialysis Investor - Corporation
8 Gambro Healthcare-West Inglewood Inglewood 90301 Dialysis
8 Pacific Gateway Dialysis Gardena 90248 Dialysis Investor - Limited Liability Company
8 Rai-Centinela-Inglewood Inglewood 90301 Dialysis Investor - Corporation
8 Renal Services Group of Inglewood, LLC Inglewood 90301 Dialysis Investor - Limited Liability Company
8 Sunrise Dialysis Center Hawthorne 90250 Dialysis Investor - Corporation
8 TRC/Harbor-UCLA Mfi-Total Renal Dialysis Ctr. Torrance 90502 Dialysis Investor - Corporation
8 Guidance Center, The Long Beach 90807 Psychology Non-Profit Corporation (Incl. Church-Related)
8 Centinela Valley Endoscopy Center Inglewood 90301 Surgical Investor - Corporation
8 Endoscopy Center At Skypark Torrance 90505 Surgical Investor - Corporation
8 Pacific Coast Surgery Center Torrance 90505 Surgical Investor - Corporation
8 Pacific Endo-Surgical Center Torrance 90505 Surgical Investor - Partnership
8 Prairie Avenue Surgery Center Inglewood 90301 Surgical Investor - Corporation
8 Torrance Surgery Center, L.P. Torrance 90505 Surgical Investor - Partnership
SPA Facility Name City Zip Type Control
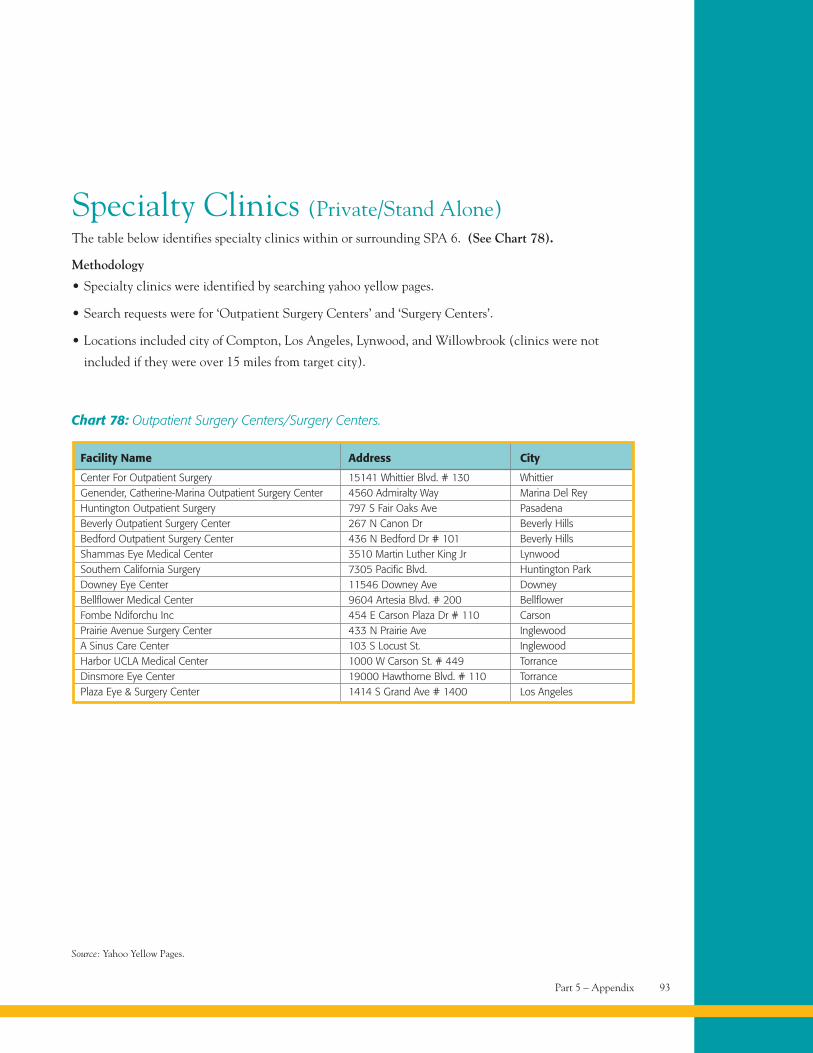
Part 5 – Appendix 93
Specialty Clinics (Private/Stand Alone)The table below identifies specialty clinics within or surrounding SPA 6. (See Chart 78).
Methodology
• Specialty clinics were identified by searching yahoo yellow pages.
• Search requests were for ‘Outpatient Surgery Centers’ and ‘Surgery Centers’.
• Locations included city of Compton, Los Angeles, Lynwood, and Willowbrook (clinics were not
included if they were over 15 miles from target city).
Source: Yahoo Yellow Pages.
Chart 78: Outpatient Surgery Centers/Surgery Centers.
Facility Name Address City
Center For Outpatient Surgery 15141 Whittier Blvd. # 130 WhittierGenender, Catherine-Marina Outpatient Surgery Center 4560 Admiralty Way Marina Del ReyHuntington Outpatient Surgery 797 S Fair Oaks Ave PasadenaBeverly Outpatient Surgery Center 267 N Canon Dr Beverly HillsBedford Outpatient Surgery Center 436 N Bedford Dr # 101 Beverly HillsShammas Eye Medical Center 3510 Martin Luther King Jr LynwoodSouthern California Surgery 7305 Pacific Blvd. Huntington ParkDowney Eye Center 11546 Downey Ave DowneyBellflower Medical Center 9604 Artesia Blvd. # 200 BellflowerFombe Ndiforchu Inc 454 E Carson Plaza Dr # 110 CarsonPrairie Avenue Surgery Center 433 N Prairie Ave InglewoodA Sinus Care Center 103 S Locust St. InglewoodHarbor UCLA Medical Center 1000 W Carson St. # 449 TorranceDinsmore Eye Center 19000 Hawthorne Blvd. # 110 TorrancePlaza Eye & Surgery Center 1414 S Grand Ave # 1400 Los Angeles
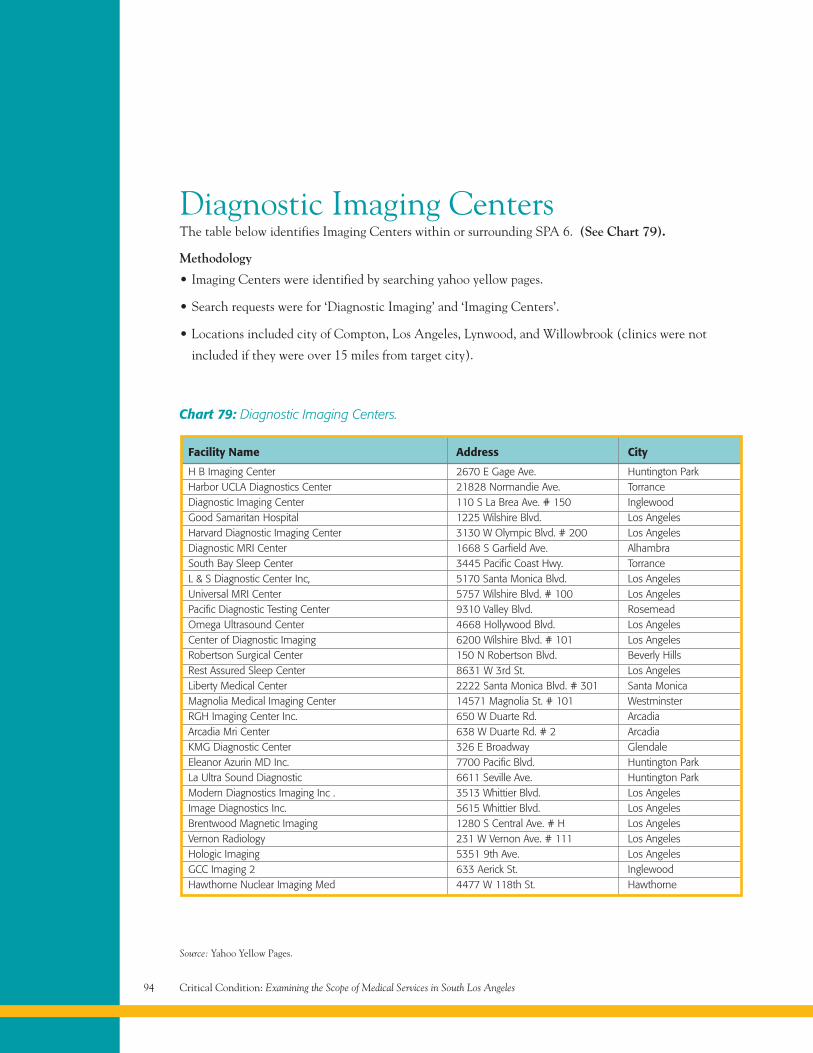
Critical Condition: Examining the Scope of Medical Services in South Los Angeles94
Diagnostic Imaging CentersThe table below identifies Imaging Centers within or surrounding SPA 6. (See Chart 79).
Methodology
• Imaging Centers were identified by searching yahoo yellow pages.
• Search requests were for ‘Diagnostic Imaging’ and ‘Imaging Centers’.
• Locations included city of Compton, Los Angeles, Lynwood, and Willowbrook (clinics were not
included if they were over 15 miles from target city).
Source: Yahoo Yellow Pages.
Chart 79: Diagnostic Imaging Centers.
Facility Name Address City
H B Imaging Center 2670 E Gage Ave. Huntington ParkHarbor UCLA Diagnostics Center 21828 Normandie Ave. TorranceDiagnostic Imaging Center 110 S La Brea Ave. # 150 InglewoodGood Samaritan Hospital 1225 Wilshire Blvd. Los AngelesHarvard Diagnostic Imaging Center 3130 W Olympic Blvd. # 200 Los AngelesDiagnostic MRI Center 1668 S Garfield Ave. AlhambraSouth Bay Sleep Center 3445 Pacific Coast Hwy. TorranceL & S Diagnostic Center Inc, 5170 Santa Monica Blvd. Los AngelesUniversal MRI Center 5757 Wilshire Blvd. # 100 Los AngelesPacific Diagnostic Testing Center 9310 Valley Blvd. RosemeadOmega Ultrasound Center 4668 Hollywood Blvd. Los AngelesCenter of Diagnostic Imaging 6200 Wilshire Blvd. # 101 Los AngelesRobertson Surgical Center 150 N Robertson Blvd. Beverly HillsRest Assured Sleep Center 8631 W 3rd St. Los AngelesLiberty Medical Center 2222 Santa Monica Blvd. # 301 Santa MonicaMagnolia Medical Imaging Center 14571 Magnolia St. # 101 WestminsterRGH Imaging Center Inc. 650 W Duarte Rd. ArcadiaArcadia Mri Center 638 W Duarte Rd. # 2 ArcadiaKMG Diagnostic Center 326 E Broadway GlendaleEleanor Azurin MD Inc. 7700 Pacific Blvd. Huntington ParkLa Ultra Sound Diagnostic 6611 Seville Ave. Huntington ParkModern Diagnostics Imaging Inc . 3513 Whittier Blvd. Los AngelesImage Diagnostics Inc. 5615 Whittier Blvd. Los AngelesBrentwood Magnetic Imaging 1280 S Central Ave. # H Los AngelesVernon Radiology 231 W Vernon Ave. # 111 Los AngelesHologic Imaging 5351 9th Ave. Los AngelesGCC Imaging 2 633 Aerick St. InglewoodHawthorne Nuclear Imaging Med 4477 W 118th St. Hawthorne
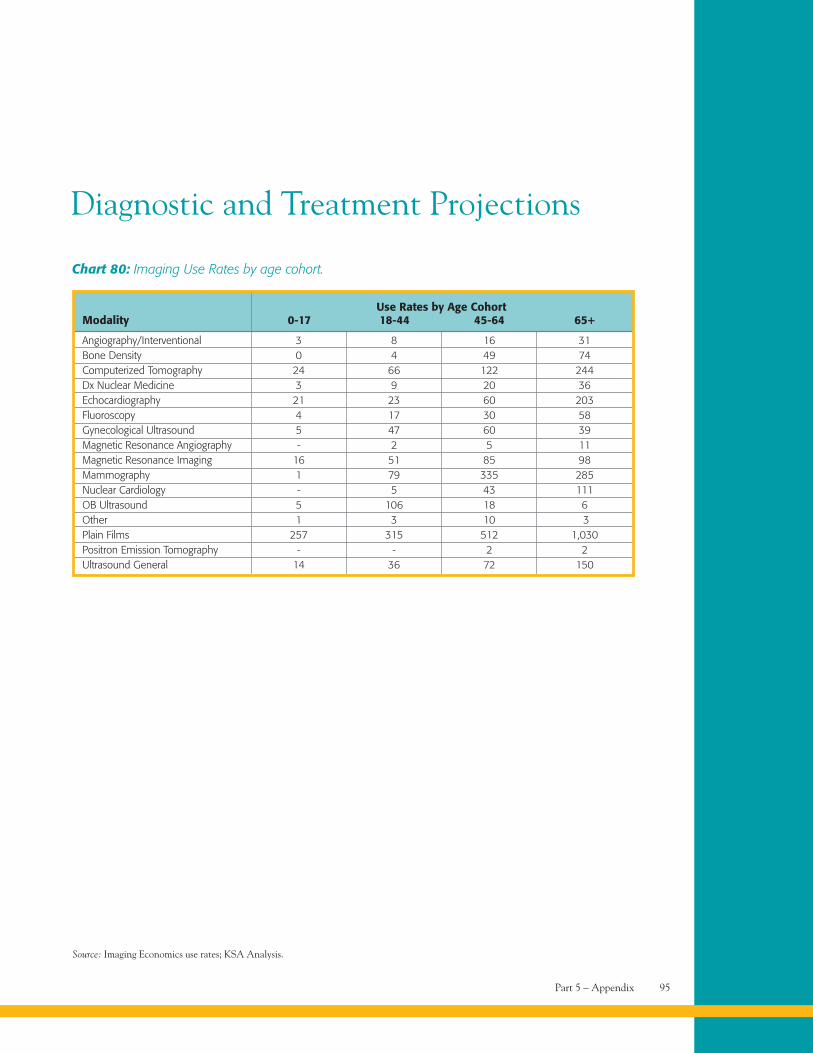
Part 5 – Appendix 95
Chart 80: Imaging Use Rates by age cohort.
Use Rates by Age CohortModality 0-17 18-44 45-64 65+
Angiography/Interventional 3 8 16 31Bone Density 0 4 49 74Computerized Tomography 24 66 122 244Dx Nuclear Medicine 3 9 20 36Echocardiography 21 23 60 203Fluoroscopy 4 17 30 58Gynecological Ultrasound 5 47 60 39Magnetic Resonance Angiography - 2 5 11Magnetic Resonance Imaging 16 51 85 98Mammography 1 79 335 285Nuclear Cardiology - 5 43 111OB Ultrasound 5 106 18 6Other 1 3 10 3Plain Films 257 315 512 1,030Positron Emission Tomography - - 2 2Ultrasound General 14 36 72 150
Source: Imaging Economics use rates; KSA Analysis.
Diagnostic and Treatment Projections
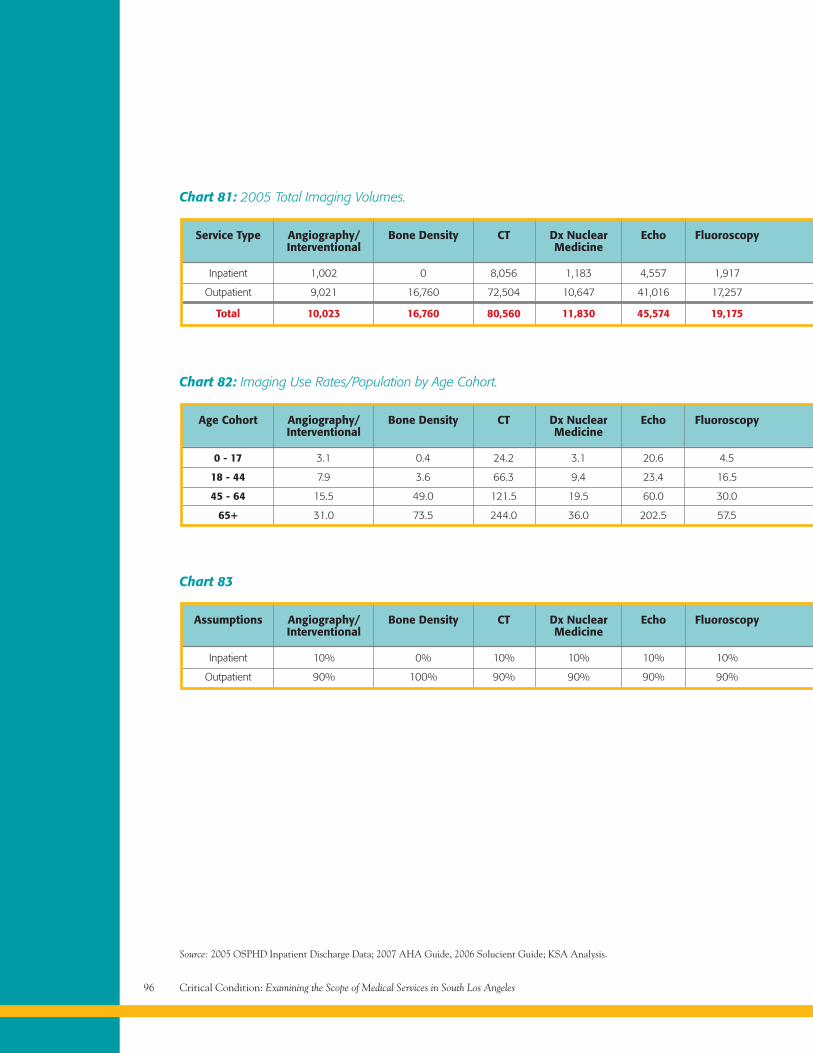
Critical Condition: Examining the Scope of Medical Services in South Los Angeles96
Chart 81: 2005 Total Imaging Volumes.
Service Type Angiography/ Bone Density CT Dx Nuclear Echo FluoroscopyInterventional Medicine
Inpatient 1,002 0 8,056 1,183 4,557 1,917
Outpatient 9,021 16,760 72,504 10,647 41,016 17,257
Total 10,023 16,760 80,560 11,830 45,574 19,175
Chart 83
Assumptions Angiography/ Bone Density CT Dx Nuclear Echo FluoroscopyInterventional Medicine
Inpatient 10% 0% 10% 10% 10% 10%
Outpatient 90% 100% 90% 90% 90% 90%
Chart 82: Imaging Use Rates/Population by Age Cohort.
Source: 2005 OSPHD Inpatient Discharge Data; 2007 AHA Guide, 2006 Solucient Guide; KSA Analysis.
Age Cohort Angiography/ Bone Density CT Dx Nuclear Echo FluoroscopyInterventional Medicine
0 - 17 3.1 0.4 24.2 3.1 20.6 4.5
18 - 44 7.9 3.6 66.3 9.4 23.4 16.5
45 - 64 15.5 49.0 121.5 19.5 60.0 30.0
65+ 31.0 73.5 244.0 36.0 202.5 57.5
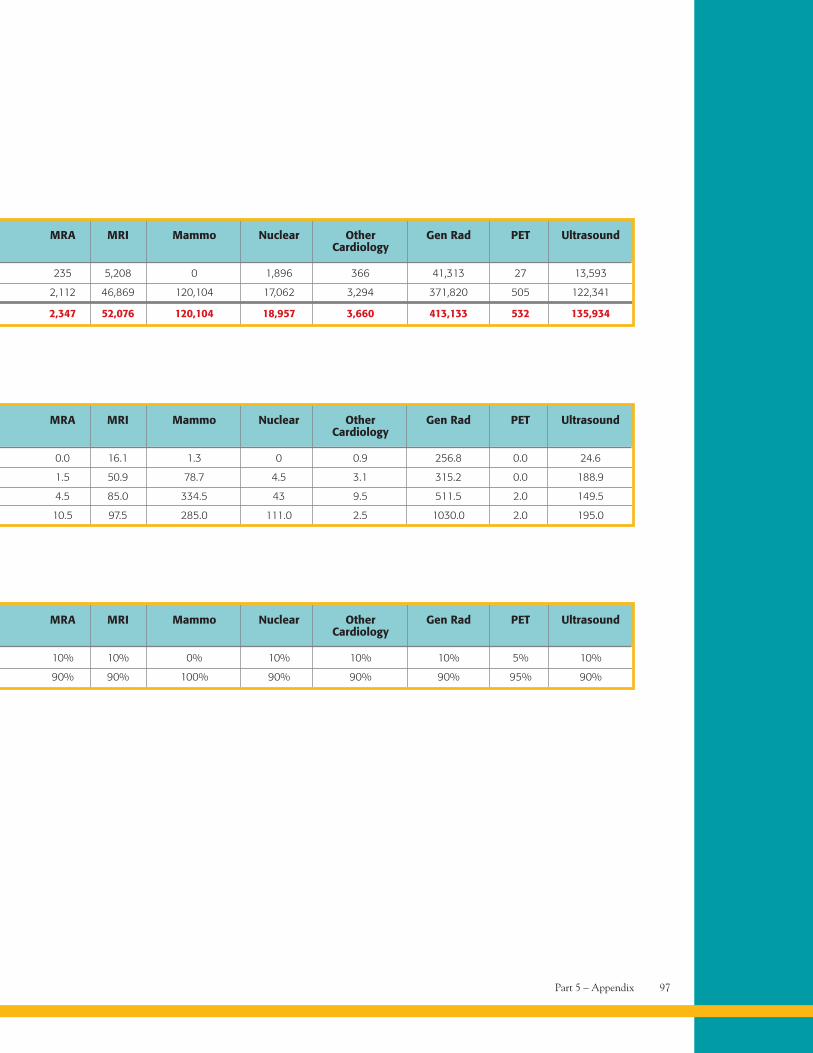
Part 5 – Appendix 97
MRA MRI Mammo Nuclear Other Gen Rad PET UltrasoundCardiology
235 5,208 0 1,896 366 41,313 27 13,593
2,112 46,869 120,104 17,062 3,294 371,820 505 122,341
2,347 52,076 120,104 18,957 3,660 413,133 532 135,934
MRA MRI Mammo Nuclear Other Gen Rad PET UltrasoundCardiology
10% 10% 0% 10% 10% 10% 5% 10%
90% 90% 100% 90% 90% 90% 95% 90%
MRA MRI Mammo Nuclear Other Gen Rad PET UltrasoundCardiology
0.0 16.1 1.3 0 0.9 256.8 0.0 24.6
1.5 50.9 78.7 4.5 3.1 315.2 0.0 188.9
4.5 85.0 334.5 43 9.5 511.5 2.0 149.5
10.5 97.5 285.0 111.0 2.5 1030.0 2.0 195.0
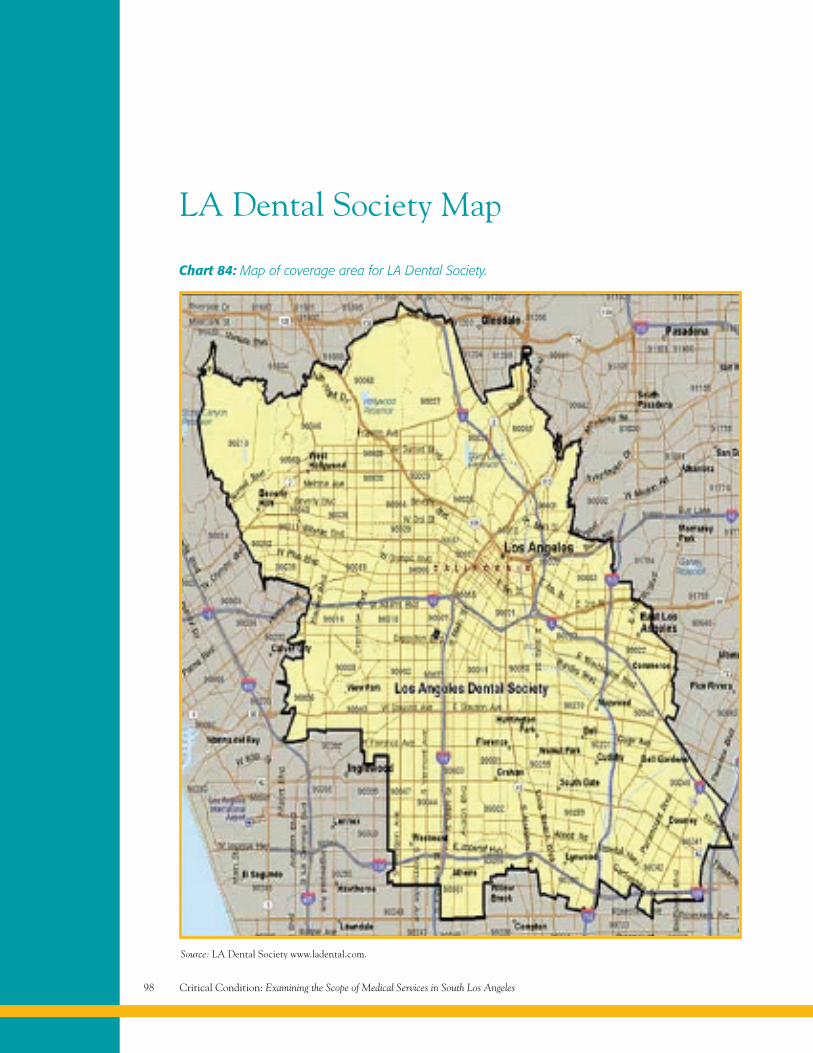
Critical Condition: Examining the Scope of Medical Services in South Los Angeles98
LA Dental Society Map
Chart 84: Map of coverage area for LA Dental Society.
Source: LA Dental Society www.ladental.com.
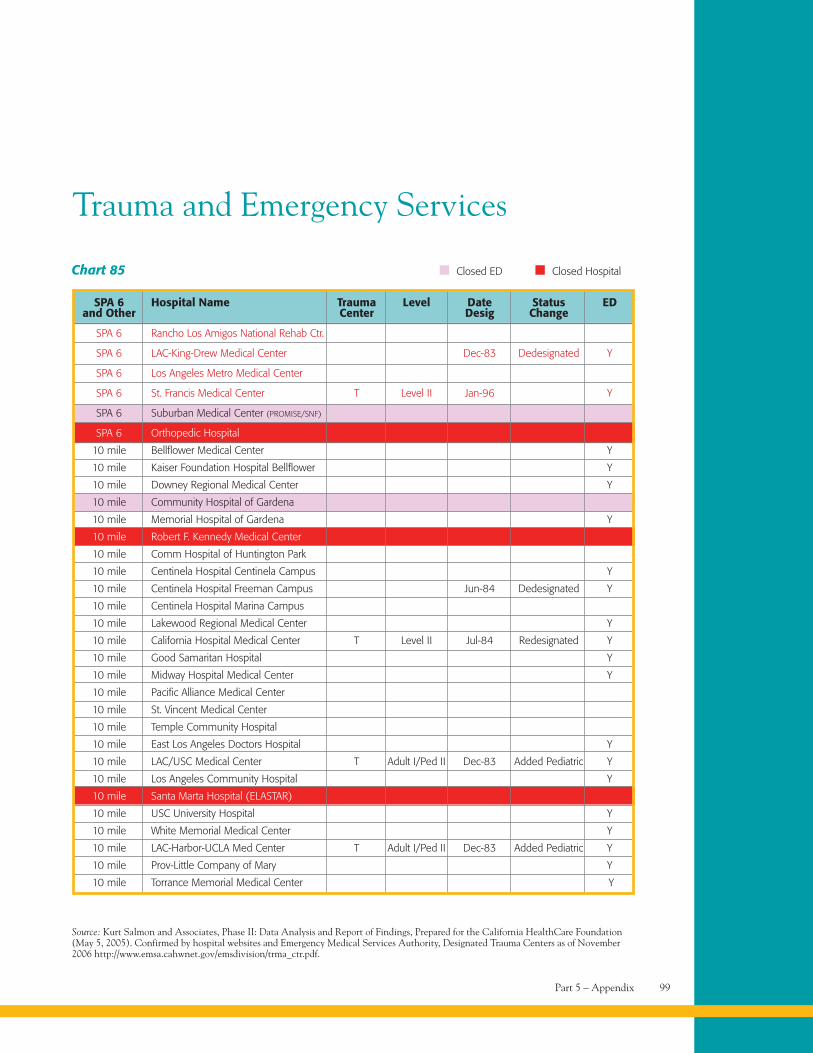
Part 5 – Appendix 99
Trauma and Emergency Services
Chart 85
SPA 6 Hospital Name Trauma Level Date Status EDand Other Center Desig Change
SPA 6 Rancho Los Amigos National Rehab Ctr.
SPA 6 LAC-King-Drew Medical Center Dec-83 Dedesignated Y
SPA 6 Los Angeles Metro Medical Center
SPA 6 St. Francis Medical Center T Level II Jan-96 Y
SPA 6 Suburban Medical Center (PROMISE/SNF)
SPA 6 Orthopedic Hospital
10 mile Bellflower Medical Center Y
10 mile Kaiser Foundation Hospital Bellflower Y
10 mile Downey Regional Medical Center Y
10 mile Community Hospital of Gardena
10 mile Memorial Hospital of Gardena Y
10 mile Robert F. Kennedy Medical Center
10 mile Comm Hospital of Huntington Park
10 mile Centinela Hospital Centinela Campus Y
10 mile Centinela Hospital Freeman Campus Jun-84 Dedesignated Y
10 mile Centinela Hospital Marina Campus
10 mile Lakewood Regional Medical Center Y
10 mile California Hospital Medical Center T Level II Jul-84 Redesignated Y
10 mile Good Samaritan Hospital Y
10 mile Midway Hospital Medical Center Y
10 mile Pacific Alliance Medical Center
10 mile St. Vincent Medical Center
10 mile Temple Community Hospital
10 mile East Los Angeles Doctors Hospital Y
10 mile LAC/USC Medical Center T Adult I/Ped II Dec-83 Added Pediatric Y
10 mile Los Angeles Community Hospital Y
10 mile Santa Marta Hospital (ELASTAR)
10 mile USC University Hospital Y
10 mile White Memorial Medical Center Y
10 mile LAC-Harbor-UCLA Med Center T Adult I/Ped II Dec-83 Added Pediatric Y
10 mile Prov-Little Company of Mary Y
10 mile Torrance Memorial Medical Center Y
Source: Kurt Salmon and Associates, Phase II: Data Analysis and Report of Findings, Prepared for the California HealthCare Foundation(May 5, 2005). Confirmed by hospital websites and Emergency Medical Services Authority, Designated Trauma Centers as of November2006 http://www.emsa.cahwnet.gov/emsdivision/trma_ctr.pdf.
Closed ED Closed Hospital
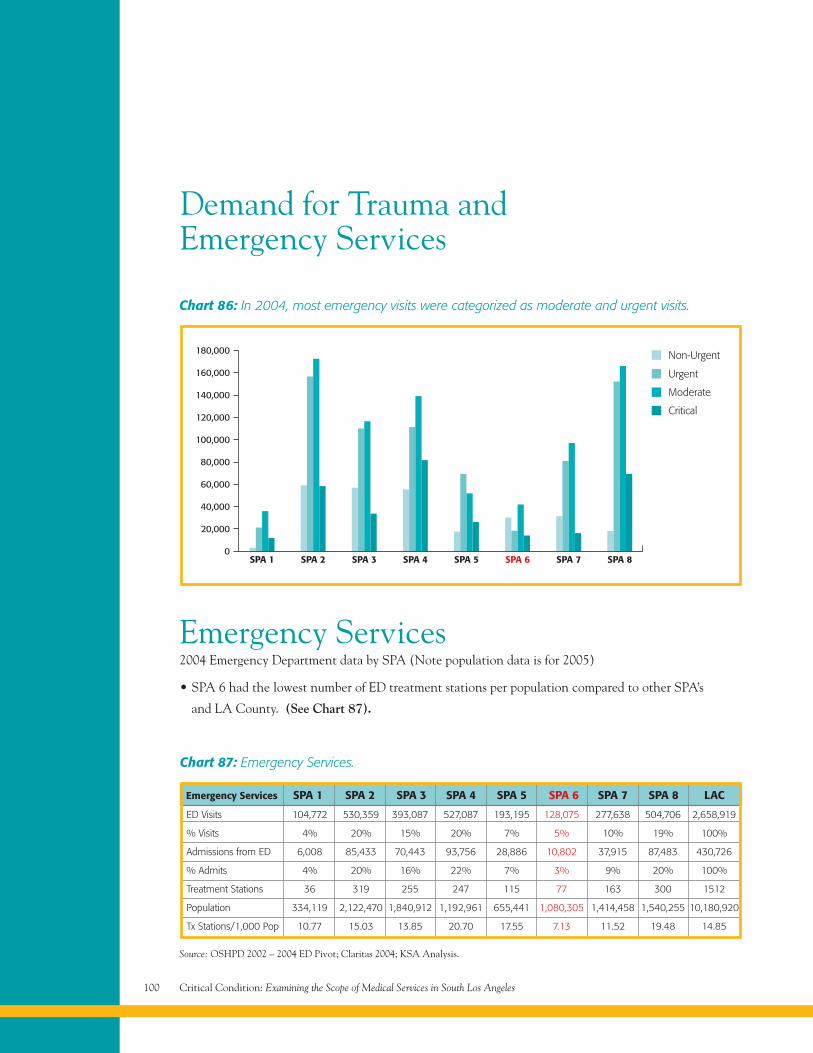
Critical Condition: Examining the Scope of Medical Services in South Los Angeles100
Emergency Services2004 Emergency Department data by SPA (Note population data is for 2005)
• SPA 6 had the lowest number of ED treatment stations per population compared to other SPA’s
and LA County. (See Chart 87).
Demand for Trauma andEmergency Services
Chart 86: In 2004, most emergency visits were categorized as moderate and urgent visits.
SPA 10
SPA 2 SPA 3 SPA 4 SPA 5 SPA 6 SPA 7 SPA 8
40,000
60,000
80,000
100,000
120,000
140,000
160,000
180,000
20,000
Non-Urgent
Urgent
Moderate
Critical
Source: OSHPD 2002 – 2004 ED Pivot; Claritas 2004; KSA Analysis.
Chart 87: Emergency Services.
ED Visits 104,772 530,359 393,087 527,087 193,195 128,075 277,638 504,706 2,658,919
% Visits 4% 20% 15% 20% 7% 5% 10% 19% 100%
Admissions from ED 6,008 85,433 70,443 93,756 28,886 10,802 37,915 87,483 430,726
% Admits 4% 20% 16% 22% 7% 3% 9% 20% 100%
Treatment Stations 36 319 255 247 115 77 163 300 1512
Population 334,119 2,122,470 1,840,912 1,192,961 655,441 1,080,305 1,414,458 1,540,255 10,180,920
Tx Stations/1,000 Pop 10.77 15.03 13.85 20.70 17.55 7.13 11.52 19.48 14.85
Emergency Services SPA 1 SPA 2 SPA 3 SPA 4 SPA 5 SPA 6 SPA 7 SPA 8 LAC
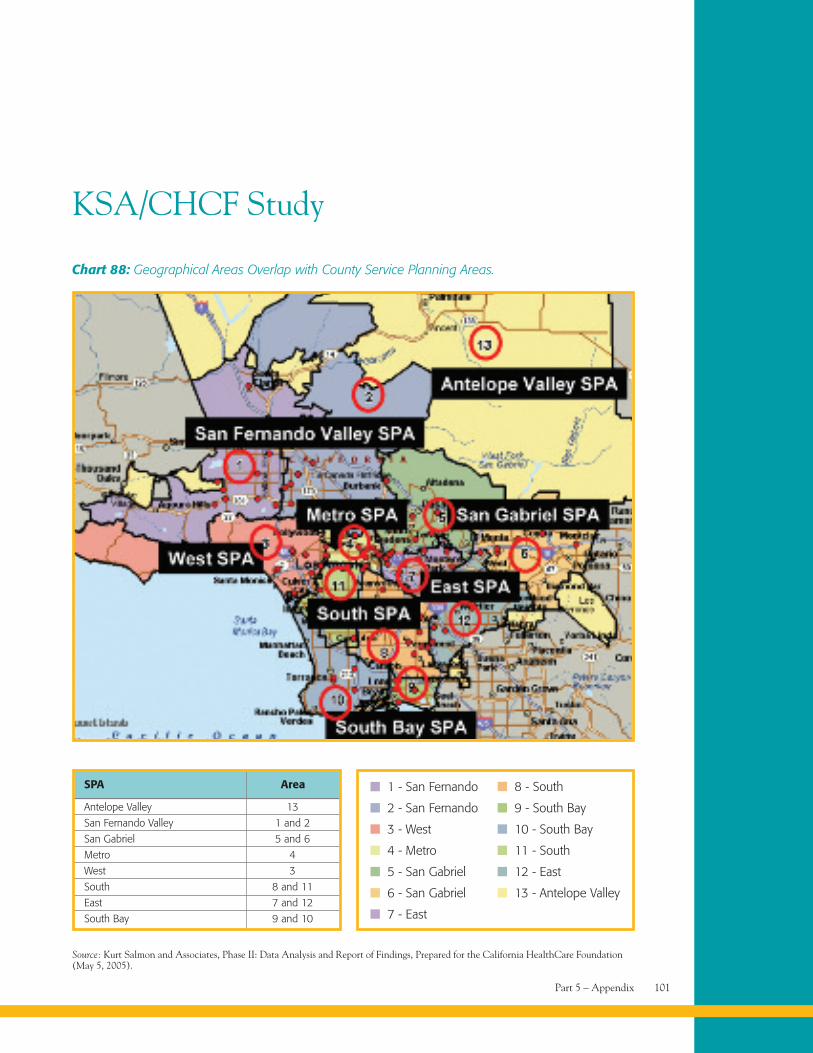
Part 5 – Appendix 101
KSA/CHCF Study
Chart 88: Geographical Areas Overlap with County Service Planning Areas.
Source: Kurt Salmon and Associates, Phase II: Data Analysis and Report of Findings, Prepared for the California HealthCare Foundation(May 5, 2005).
SPA Area
Antelope Valley 13
San Fernando Valley 1 and 2
San Gabriel 5 and 6
Metro 4
West 3
South 8 and 11
East 7 and 12
South Bay 9 and 10
1 - San Fernando
2 - San Fernando
3 - West
8 - South
9 - South Bay
10 - South Bay
4 - Metro 11 - South
5 - San Gabriel 12 - East
6 - San Gabriel 13 - Antelope Valley
7 - East
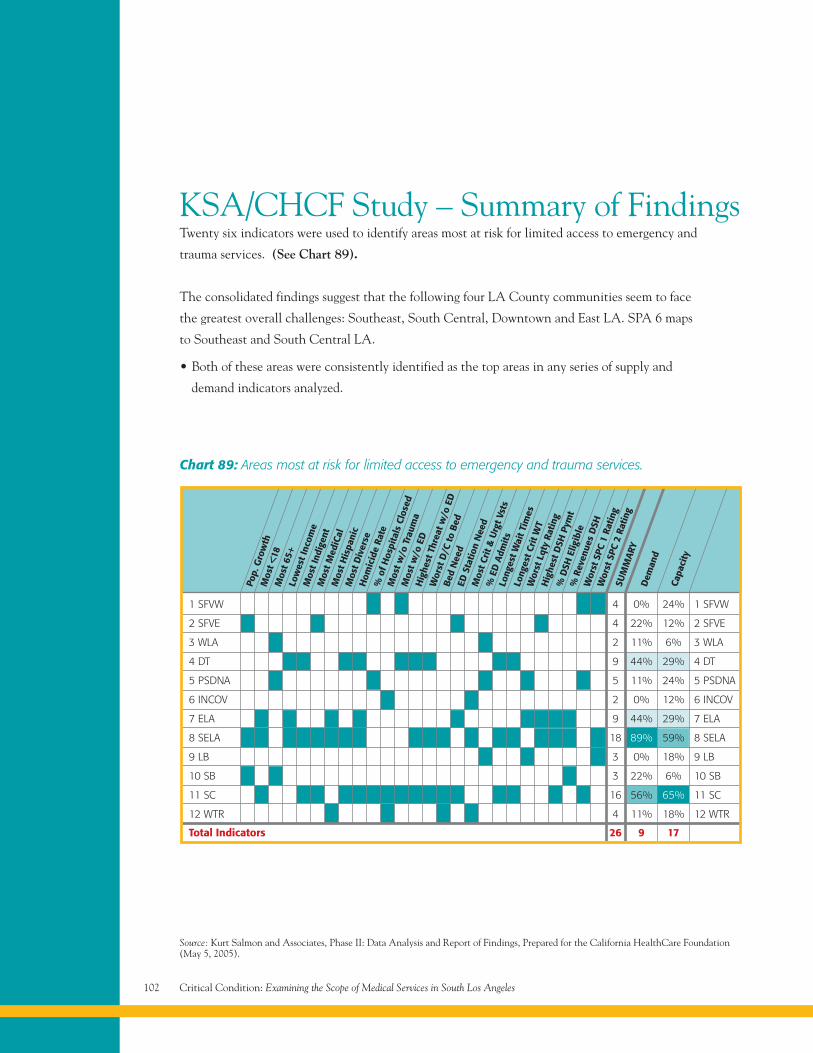
Critical Condition: Examining the Scope of Medical Services in South Los Angeles102
KSA/CHCF Study – Summary of FindingsTwenty six indicators were used to identify areas most at risk for limited access to emergency and
trauma services. (See Chart 89).
The consolidated findings suggest that the following four LA County communities seem to face
the greatest overall challenges: Southeast, South Central, Downtown and East LA. SPA 6 maps
to Southeast and South Central LA.
• Both of these areas were consistently identified as the top areas in any series of supply and
demand indicators analyzed.
Chart 89: Areas most at risk for limited access to emergency and trauma services.
Pop.Growth
Most <
18Most 6
5+Lowest Incom
eMost Ind
igent
Most M
ediCal
Most H
ispanic
Most D
iverse
Hom
icideRate
%of
HospitalsClosed
Most w
/oTrauma
Most w
/oED
HighestThreat
w/o
ED
WorstD/C
toBe
dBe
dNeed
EDStationNeed
Most C
rit &
Urgt Vsts
%ED
Adm
itsLongest W
ait Times
Longest C
rit W
TWorstLqtyRatin
gHighestDSH
Pymt
%DSH
Eligible
%Revenu
esDSH
WorstSPC1Ratin
gWorstSPC2Ratin
gSU
MMARY
Dem
and
Capacity
1 SFVW 4 0% 24% 1 SFVW
2 SFVE 4 22% 12% 2 SFVE
3 WLA 2 11% 6% 3 WLA
4 DT 9 44% 29% 4 DT
5 PSDNA 5 11% 24% 5 PSDNA
6 INCOV 2 0% 12% 6 INCOV
7 ELA 9 44% 29% 7 ELA
8 SELA 18 89% 59% 8 SELA
9 LB 3 0% 18% 9 LB
10 SB 3 22% 6% 10 SB
11 SC 16 56% 65% 11 SC
12 WTR 4 11% 18% 12 WTR
Total Indicators 26 9 17
Source: Kurt Salmon and Associates, Phase II: Data Analysis and Report of Findings, Prepared for the California HealthCare Foundation(May 5, 2005).
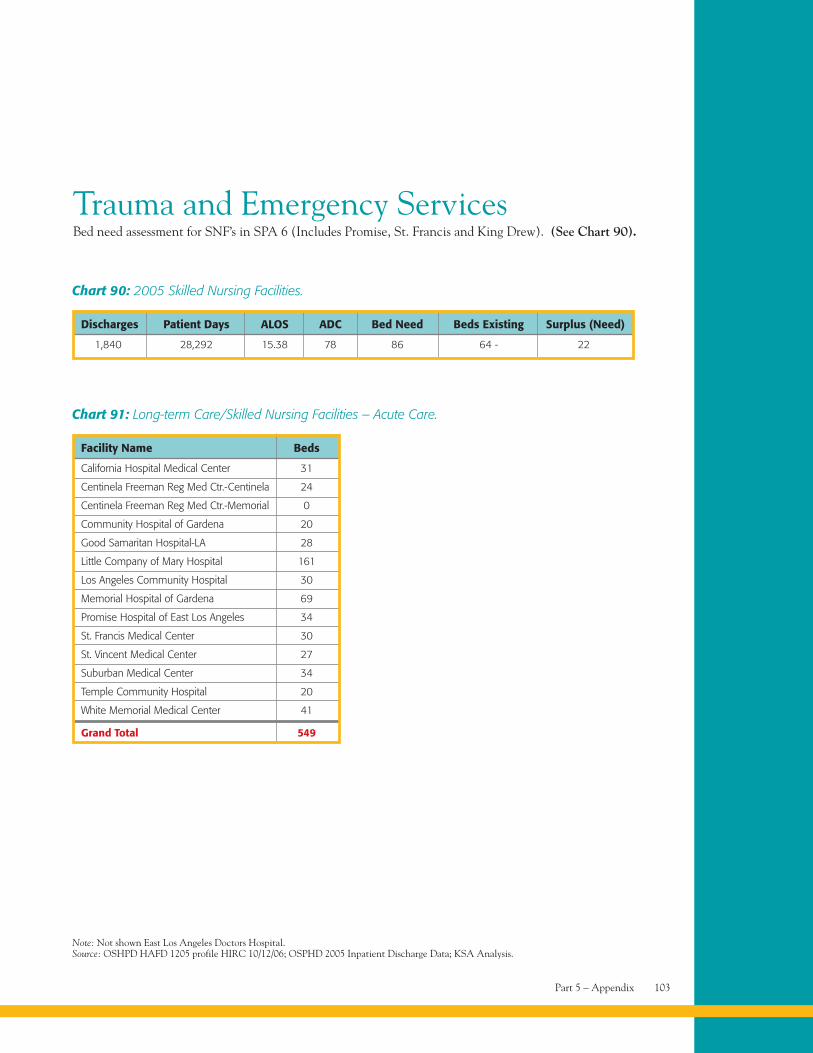
Part 5 – Appendix 103
Trauma and Emergency ServicesBed need assessment for SNF’s in SPA 6 (Includes Promise, St. Francis and King Drew). (See Chart 90).
Chart 90: 2005 Skilled Nursing Facilities.
Discharges Patient Days ALOS ADC Bed Need Beds Existing Surplus (Need)
1,840 28,292 15.38 78 86 64 - 22
Note: Not shown East Los Angeles Doctors Hospital.Source: OSHPD HAFD 1205 profile HIRC 10/12/06; OSPHD 2005 Inpatient Discharge Data; KSA Analysis.
Chart 91: Long-term Care/Skilled Nursing Facilities – Acute Care.
Facility Name Beds
California Hospital Medical Center 31
Centinela Freeman Reg Med Ctr.-Centinela 24
Centinela Freeman Reg Med Ctr.-Memorial 0
Community Hospital of Gardena 20
Good Samaritan Hospital-LA 28
Little Company of Mary Hospital 161
Los Angeles Community Hospital 30
Memorial Hospital of Gardena 69
Promise Hospital of East Los Angeles 34
St. Francis Medical Center 30
St. Vincent Medical Center 27
Suburban Medical Center 34
Temple Community Hospital 20
White Memorial Medical Center 41
Grand Total 549
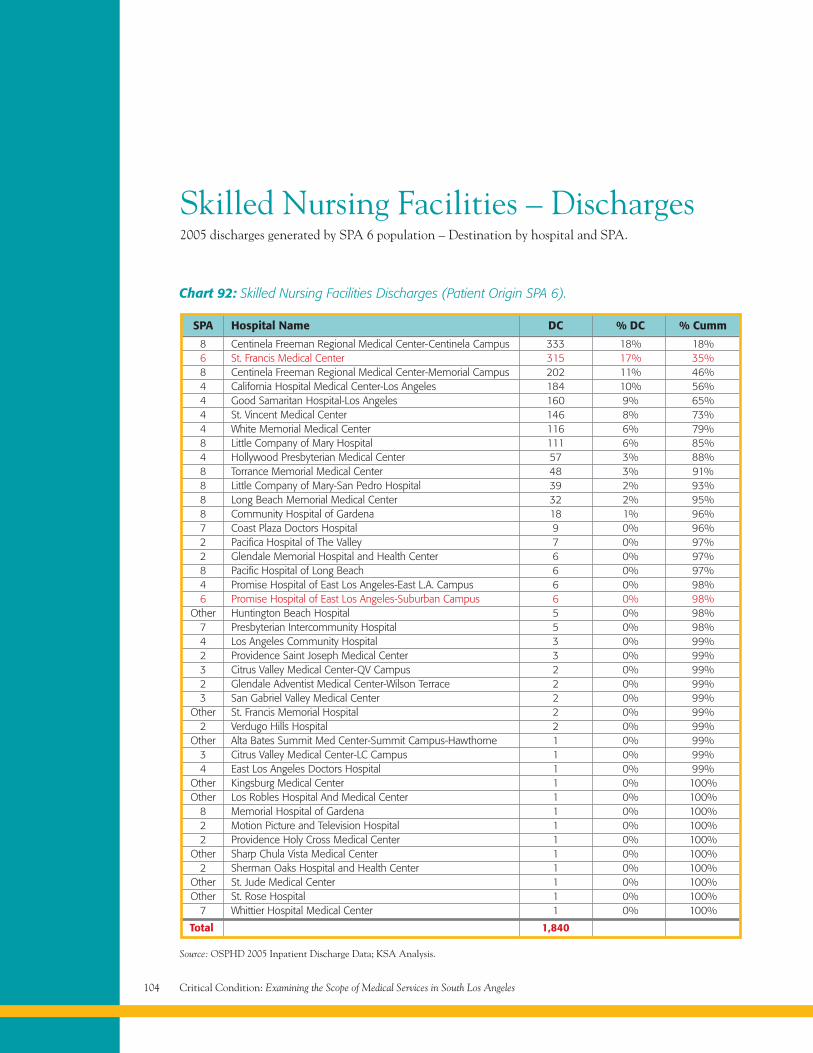
Critical Condition: Examining the Scope of Medical Services in South Los Angeles104
Skilled Nursing Facilities – Discharges2005 discharges generated by SPA 6 population – Destination by hospital and SPA.
Chart 92: Skilled Nursing Facilities Discharges (Patient Origin SPA 6).
SPA Hospital Name DC % DC % Cumm
8 Centinela Freeman Regional Medical Center-Centinela Campus 333 18% 18%6 St. Francis Medical Center 315 17% 35%8 Centinela Freeman Regional Medical Center-Memorial Campus 202 11% 46%4 California Hospital Medical Center-Los Angeles 184 10% 56%4 Good Samaritan Hospital-Los Angeles 160 9% 65%4 St. Vincent Medical Center 146 8% 73%4 White Memorial Medical Center 116 6% 79%8 Little Company of Mary Hospital 111 6% 85%4 Hollywood Presbyterian Medical Center 57 3% 88%8 Torrance Memorial Medical Center 48 3% 91%8 Little Company of Mary-San Pedro Hospital 39 2% 93%8 Long Beach Memorial Medical Center 32 2% 95%8 Community Hospital of Gardena 18 1% 96%7 Coast Plaza Doctors Hospital 9 0% 96%2 Pacifica Hospital of The Valley 7 0% 97%2 Glendale Memorial Hospital and Health Center 6 0% 97%8 Pacific Hospital of Long Beach 6 0% 97%4 Promise Hospital of East Los Angeles-East L.A. Campus 6 0% 98%6 Promise Hospital of East Los Angeles-Suburban Campus 6 0% 98%
Other Huntington Beach Hospital 5 0% 98%7 Presbyterian Intercommunity Hospital 5 0% 98%4 Los Angeles Community Hospital 3 0% 99%2 Providence Saint Joseph Medical Center 3 0% 99%3 Citrus Valley Medical Center-QV Campus 2 0% 99%2 Glendale Adventist Medical Center-Wilson Terrace 2 0% 99%3 San Gabriel Valley Medical Center 2 0% 99%
Other St. Francis Memorial Hospital 2 0% 99%2 Verdugo Hills Hospital 2 0% 99%
Other Alta Bates Summit Med Center-Summit Campus-Hawthorne 1 0% 99%3 Citrus Valley Medical Center-LC Campus 1 0% 99%4 East Los Angeles Doctors Hospital 1 0% 99%
Other Kingsburg Medical Center 1 0% 100%Other Los Robles Hospital And Medical Center 1 0% 100%8 Memorial Hospital of Gardena 1 0% 100%2 Motion Picture and Television Hospital 1 0% 100%2 Providence Holy Cross Medical Center 1 0% 100%
Other Sharp Chula Vista Medical Center 1 0% 100%2 Sherman Oaks Hospital and Health Center 1 0% 100%
Other St. Jude Medical Center 1 0% 100%Other St. Rose Hospital 1 0% 100%7 Whittier Hospital Medical Center 1 0% 100%
Total 1,840
Source: OSPHD 2005 Inpatient Discharge Data; KSA Analysis.
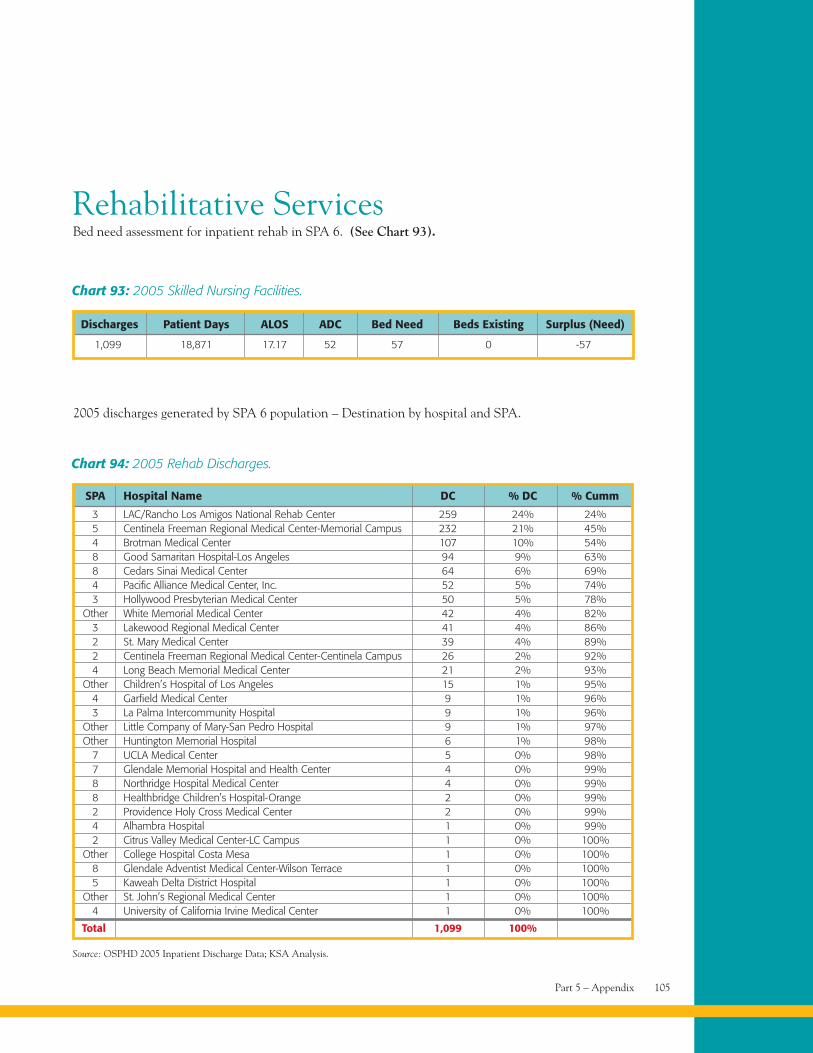
Part 5 – Appendix 105
Chart 94: 2005 Rehab Discharges.
SPA Hospital Name DC % DC % Cumm
3 LAC/Rancho Los Amigos National Rehab Center 259 24% 24%5 Centinela Freeman Regional Medical Center-Memorial Campus 232 21% 45%4 Brotman Medical Center 107 10% 54%8 Good Samaritan Hospital-Los Angeles 94 9% 63%8 Cedars Sinai Medical Center 64 6% 69%4 Pacific Alliance Medical Center, Inc. 52 5% 74%3 Hollywood Presbyterian Medical Center 50 5% 78%
Other White Memorial Medical Center 42 4% 82%3 Lakewood Regional Medical Center 41 4% 86%2 St. Mary Medical Center 39 4% 89%2 Centinela Freeman Regional Medical Center-Centinela Campus 26 2% 92%4 Long Beach Memorial Medical Center 21 2% 93%
Other Children’s Hospital of Los Angeles 15 1% 95%4 Garfield Medical Center 9 1% 96%3 La Palma Intercommunity Hospital 9 1% 96%
Other Little Company of Mary-San Pedro Hospital 9 1% 97%Other Huntington Memorial Hospital 6 1% 98%7 UCLA Medical Center 5 0% 98%7 Glendale Memorial Hospital and Health Center 4 0% 99%8 Northridge Hospital Medical Center 4 0% 99%8 Healthbridge Children’s Hospital-Orange 2 0% 99%2 Providence Holy Cross Medical Center 2 0% 99%4 Alhambra Hospital 1 0% 99%2 Citrus Valley Medical Center-LC Campus 1 0% 100%
Other College Hospital Costa Mesa 1 0% 100%8 Glendale Adventist Medical Center-Wilson Terrace 1 0% 100%5 Kaweah Delta District Hospital 1 0% 100%
Other St. John’s Regional Medical Center 1 0% 100%4 University of California Irvine Medical Center 1 0% 100%
Total 1,099 100%
Source: OSPHD 2005 Inpatient Discharge Data; KSA Analysis.
Rehabilitative ServicesBed need assessment for inpatient rehab in SPA 6. (See Chart 93).
Chart 93: 2005 Skilled Nursing Facilities.
Discharges Patient Days ALOS ADC Bed Need Beds Existing Surplus (Need)
1,099 18,871 17.17 52 57 0 -57
2005 discharges generated by SPA 6 population – Destination by hospital and SPA.
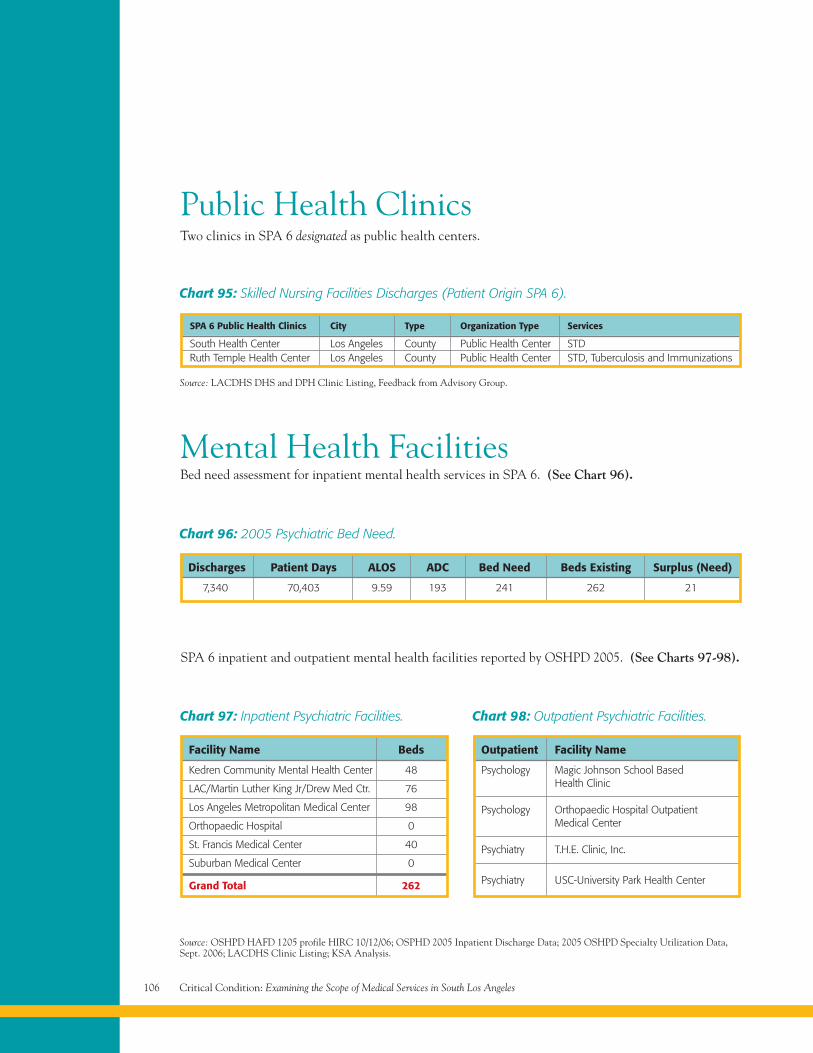
Critical Condition: Examining the Scope of Medical Services in South Los Angeles106
Public Health ClinicsTwo clinics in SPA 6 designated as public health centers.
Chart 95: Skilled Nursing Facilities Discharges (Patient Origin SPA 6).
SPA 6 Public Health Clinics City Type Organization Type Services
South Health Center Los Angeles County Public Health Center STDRuth Temple Health Center Los Angeles County Public Health Center STD, Tuberculosis and Immunizations
Source: LACDHS DHS and DPH Clinic Listing, Feedback from Advisory Group.
Mental Health FacilitiesBed need assessment for inpatient mental health services in SPA 6. (See Chart 96).
Chart 96: 2005 Psychiatric Bed Need.
Discharges Patient Days ALOS ADC Bed Need Beds Existing Surplus (Need)
7,340 70,403 9.59 193 241 262 21
SPA 6 inpatient and outpatient mental health facilities reported by OSHPD 2005. (See Charts 97-98).
Chart 97: Inpatient Psychiatric Facilities.
Facility Name Beds
Kedren Community Mental Health Center 48
LAC/Martin Luther King Jr/Drew Med Ctr. 76
Los Angeles Metropolitan Medical Center 98
Orthopaedic Hospital 0
St. Francis Medical Center 40
Suburban Medical Center 0
Grand Total 262
Chart 98: Outpatient Psychiatric Facilities.
Outpatient Facility Name
Psychology Magic Johnson School BasedHealth Clinic
Psychology Orthopaedic Hospital OutpatientMedical Center
Psychiatry T.H.E. Clinic, Inc.
Psychiatry USC-University Park Health Center
Source: OSHPD HAFD 1205 profile HIRC 10/12/06; OSPHD 2005 Inpatient Discharge Data; 2005 OSHPD Specialty Utilization Data,Sept. 2006; LACDHS Clinic Listing; KSA Analysis.
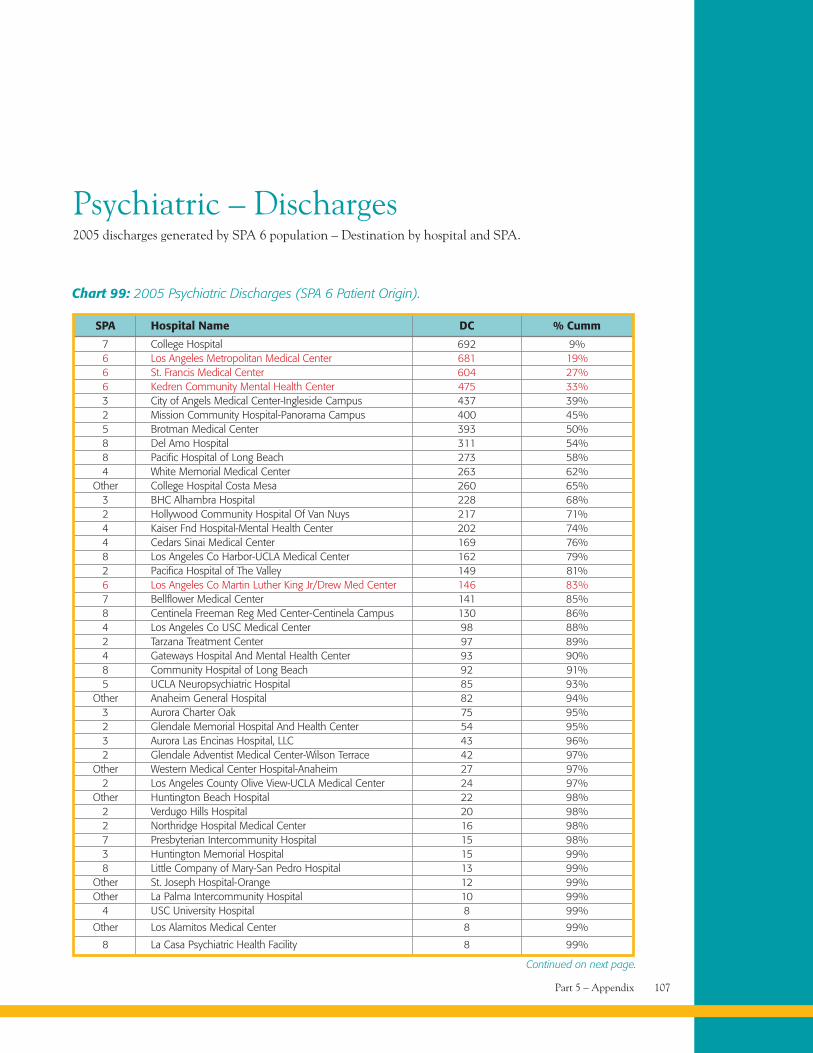
Part 5 – Appendix 107
Psychiatric – Discharges2005 discharges generated by SPA 6 population – Destination by hospital and SPA.
Chart 99: 2005 Psychiatric Discharges (SPA 6 Patient Origin).
SPA Hospital Name DC % Cumm
7 College Hospital 692 9%6 Los Angeles Metropolitan Medical Center 681 19%6 St. Francis Medical Center 604 27%6 Kedren Community Mental Health Center 475 33%3 City of Angels Medical Center-Ingleside Campus 437 39%2 Mission Community Hospital-Panorama Campus 400 45%5 Brotman Medical Center 393 50%8 Del Amo Hospital 311 54%8 Pacific Hospital of Long Beach 273 58%4 White Memorial Medical Center 263 62%
Other College Hospital Costa Mesa 260 65%3 BHC Alhambra Hospital 228 68%2 Hollywood Community Hospital Of Van Nuys 217 71%4 Kaiser Fnd Hospital-Mental Health Center 202 74%4 Cedars Sinai Medical Center 169 76%8 Los Angeles Co Harbor-UCLA Medical Center 162 79%2 Pacifica Hospital of The Valley 149 81%6 Los Angeles Co Martin Luther King Jr/Drew Med Center 146 83%7 Bellflower Medical Center 141 85%8 Centinela Freeman Reg Med Center-Centinela Campus 130 86%4 Los Angeles Co USC Medical Center 98 88%2 Tarzana Treatment Center 97 89%4 Gateways Hospital And Mental Health Center 93 90%8 Community Hospital of Long Beach 92 91%5 UCLA Neuropsychiatric Hospital 85 93%
Other Anaheim General Hospital 82 94%3 Aurora Charter Oak 75 95%2 Glendale Memorial Hospital And Health Center 54 95%3 Aurora Las Encinas Hospital, LLC 43 96%2 Glendale Adventist Medical Center-Wilson Terrace 42 97%
Other Western Medical Center Hospital-Anaheim 27 97%2 Los Angeles County Olive View-UCLA Medical Center 24 97%
Other Huntington Beach Hospital 22 98%2 Verdugo Hills Hospital 20 98%2 Northridge Hospital Medical Center 16 98%7 Presbyterian Intercommunity Hospital 15 98%3 Huntington Memorial Hospital 15 99%8 Little Company of Mary-San Pedro Hospital 13 99%
Other St. Joseph Hospital-Orange 12 99%Other La Palma Intercommunity Hospital 10 99%4 USC University Hospital 8 99%
Other Los Alamitos Medical Center 8 99%
8 La Casa Psychiatric Health Facility 8 99%
Continued on next page.
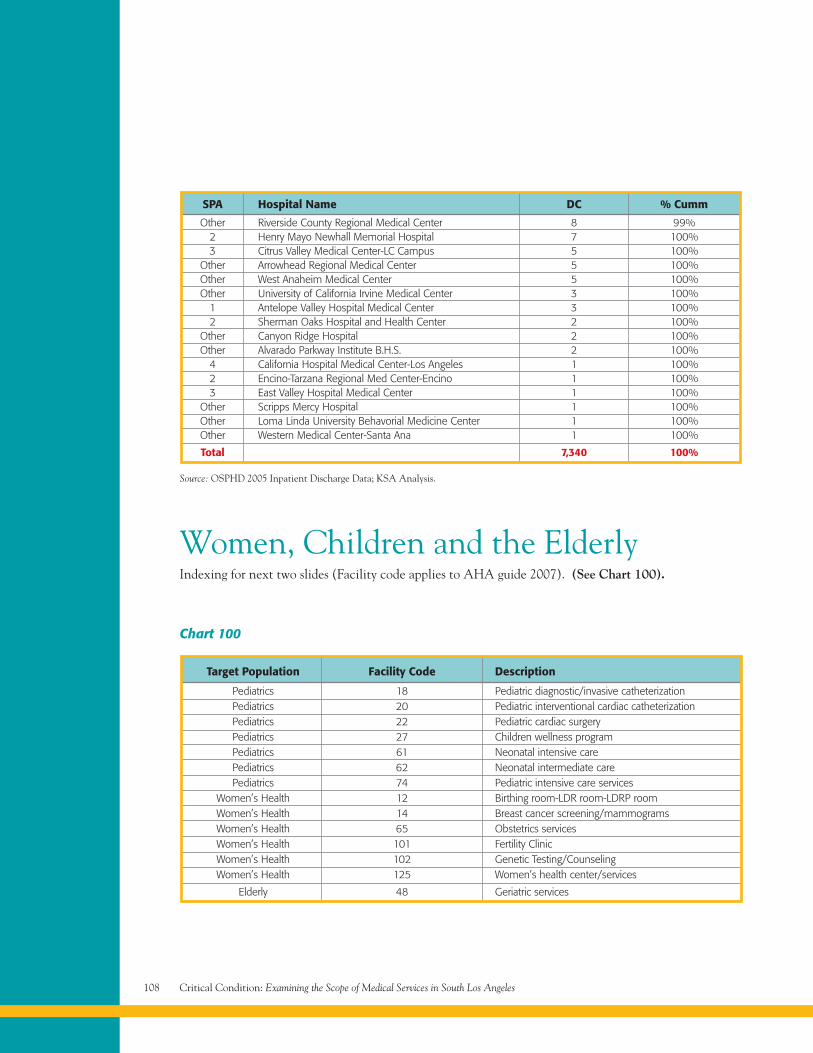
Critical Condition: Examining the Scope of Medical Services in South Los Angeles108
Source: OSPHD 2005 Inpatient Discharge Data; KSA Analysis.
SPA Hospital Name DC % Cumm
Other Riverside County Regional Medical Center 8 99%2 Henry Mayo Newhall Memorial Hospital 7 100%3 Citrus Valley Medical Center-LC Campus 5 100%
Other Arrowhead Regional Medical Center 5 100%Other West Anaheim Medical Center 5 100%Other University of California Irvine Medical Center 3 100%1 Antelope Valley Hospital Medical Center 3 100%2 Sherman Oaks Hospital and Health Center 2 100%
Other Canyon Ridge Hospital 2 100%Other Alvarado Parkway Institute B.H.S. 2 100%4 California Hospital Medical Center-Los Angeles 1 100%2 Encino-Tarzana Regional Med Center-Encino 1 100%3 East Valley Hospital Medical Center 1 100%
Other Scripps Mercy Hospital 1 100%Other Loma Linda University Behavorial Medicine Center 1 100%Other Western Medical Center-Santa Ana 1 100%
Total 7,340 100%
Women, Children and the ElderlyIndexing for next two slides (Facility code applies to AHA guide 2007). (See Chart 100).
Chart 100
Target Population Facility Code Description
Pediatrics 18 Pediatric diagnostic/invasive catheterizationPediatrics 20 Pediatric interventional cardiac catheterizationPediatrics 22 Pediatric cardiac surgeryPediatrics 27 Children wellness programPediatrics 61 Neonatal intensive carePediatrics 62 Neonatal intermediate carePediatrics 74 Pediatric intensive care services
Women’s Health 12 Birthing room-LDR room-LDRP roomWomen’s Health 14 Breast cancer screening/mammogramsWomen’s Health 65 Obstetrics servicesWomen’s Health 101 Fertility ClinicWomen’s Health 102 Genetic Testing/CounselingWomen’s Health 125 Women’s health center/services
Elderly 48 Geriatric services
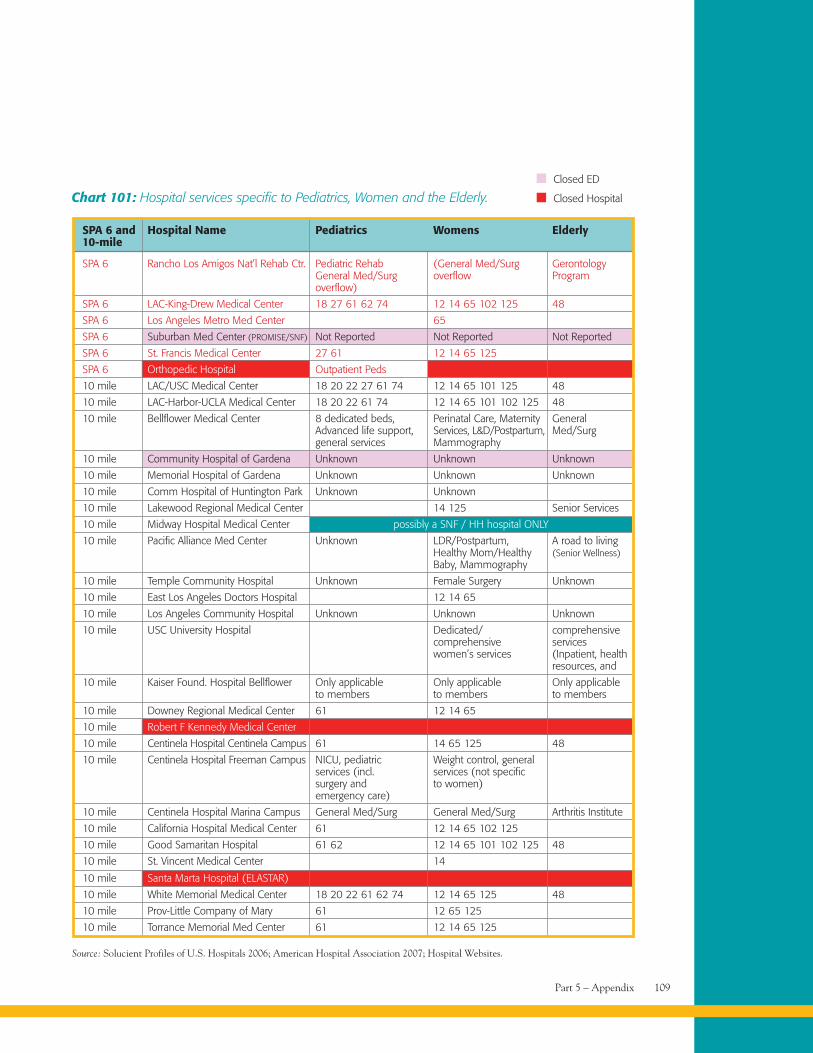
Part 5 – Appendix 109
Chart 101: Hospital services specific to Pediatrics, Women and the Elderly.
SPA 6 and Hospital Name Pediatrics Womens Elderly10-mile
SPA 6 Rancho Los Amigos Nat’l Rehab Ctr. Pediatric Rehab (General Med/Surg GerontologyGeneral Med/Surg overflow Programoverflow)
SPA 6 LAC-King-Drew Medical Center 18 27 61 62 74 12 14 65 102 125 48
SPA 6 Los Angeles Metro Med Center 65
SPA 6 Suburban Med Center (PROMISE/SNF) Not Reported Not Reported Not Reported
SPA 6 St. Francis Medical Center 27 61 12 14 65 125
SPA 6 Orthopedic Hospital Outpatient Peds
10 mile LAC/USC Medical Center 18 20 22 27 61 74 12 14 65 101 125 48
10 mile LAC-Harbor-UCLA Medical Center 18 20 22 61 74 12 14 65 101 102 125 48
10 mile Bellflower Medical Center 8 dedicated beds, Perinatal Care, Maternity GeneralAdvanced life support, Services, L&D/Postpartum, Med/Surggeneral services Mammography
10 mile Community Hospital of Gardena Unknown Unknown Unknown
10 mile Memorial Hospital of Gardena Unknown Unknown Unknown
10 mile Comm Hospital of Huntington Park Unknown Unknown
10 mile Lakewood Regional Medical Center 14 125 Senior Services
10 mile Midway Hospital Medical Center possibly a SNF / HH hospital ONLY
10 mile Pacific Alliance Med Center Unknown LDR/Postpartum, A road to livingHealthy Mom/Healthy (Senior Wellness)Baby, Mammography
10 mile Temple Community Hospital Unknown Female Surgery Unknown
10 mile East Los Angeles Doctors Hospital 12 14 65
10 mile Los Angeles Community Hospital Unknown Unknown Unknown
10 mile USC University Hospital Dedicated/ comprehensivecomprehensive serviceswomen’s services (Inpatient, health
resources, and
10 mile Kaiser Found. Hospital Bellflower Only applicable Only applicable Only applicableto members to members to members
10 mile Downey Regional Medical Center 61 12 14 65
10 mile Robert F Kennedy Medical Center
10 mile Centinela Hospital Centinela Campus 61 14 65 125 48
10 mile Centinela Hospital Freeman Campus NICU, pediatric Weight control, generalservices (incl. services (not specificsurgery and to women)emergency care)
10 mile Centinela Hospital Marina Campus General Med/Surg General Med/Surg Arthritis Institute
10 mile California Hospital Medical Center 61 12 14 65 102 125
10 mile Good Samaritan Hospital 61 62 12 14 65 101 102 125 48
10 mile St. Vincent Medical Center 14
10 mile Santa Marta Hospital (ELASTAR)
10 mile White Memorial Medical Center 18 20 22 61 62 74 12 14 65 125 48
10 mile Prov-Little Company of Mary 61 12 65 125
10 mile Torrance Memorial Med Center 61 12 14 65 125
Source: Solucient Profiles of U.S. Hospitals 2006; American Hospital Association 2007; Hospital Websites.
Closed ED
Closed Hospital
Critical Condition: Examining the Scope of Medical Services in South Los Angeles110
Advisory GroupObjectives• To advise and inform such that the research andanalyses remain grounded and attainable.
• To ensure the right questions are being askedregarding the medical needs assessment of SPA 6.
• To provide additional data where applicable to helpsupplement the analyses.
• To provide specific expertise and knowledge.
• To participate in discussion of key issues.
Time Commitment and ScheduleParticipation and attendance in phone calls andin-person meetings over the course of Phase I.
Advisory Group ParticipantsLark Galloway-Gilliam (Executive Director,Community Health Councils)
Nancy Watson (Policy Director, CommunityHealth Councils)
Irene Dyer (Director, Office of Planning and Analysis,Los Angeles County Department of Health Services)
Gloria Rodriguez (CEO, Community ClinicAssociation of Los Angeles County)
Brian Nolan (Vice President of Member Services,Community Clinic Association of Los Angeles County)
Nina Vaccaro (Director, Southside Coalition ofCommunity Health Centers)
Barbara Siegel (Managing Attorney, Health ConsumerCenter of Neighborhood Legal Services)
Wendy Schiffer (Director of Planning, Evaluation andDevelopment, Los Angeles County Department ofPublic Health Services)
Dr. Kathleen Daly (Medical Director, Adult Systems ofCare/Jail Mental Health Services, Los Angeles CountyDepartment of Mental Health)
Jim Allen (Deputy Director, Adult Systems of Care,Los Angeles County Department of Mental Health)
BibliographyKey Websites2000 and 2005 U.S. Census Bureau,http://www.census.gov/
All Hospital Websites – See listing of hospitalsin appendix
Los Angeles County Department of Health Services,http://www.ladhs.org/
Los Angeles County Department of Mental Health,
Los Angeles County Department of Public Health,http://lapublichealth.org/services.htm
SPA 6 Patient Resources,http://lapublichealth.org/spa6/index.htm
Data/Benchmark Comparisons2007 AHA Guide - America’s Directory of Hospitalsand Healthcare Systems
California Health Interview Survey, Insurance Data
Imaging Economics, Outpatient Use Rates, 2005
The Comparative Performance of U.S. Hospitals: TheSourcebook, 2006
US Centers for Disease Control and Prevention
Zip Code Data Book, Service Planning Area Six,South, United Way of Greater Los Angeles, 2007
General Information/Geography/Population/DemographicsAdvancement Project, Citywide Gang ActivityReduction Strategy: Phase III Report (March 2007)
Claritas Population Data, 2004 (KSA Internal Resource)
Dowling PT, Who Will Care for South Central LA?Presentation to the LA Health Collaborative(December 21, 2006). Retrieved fromwww.lahealthaction.org/library/South_Central-LA_Talk_12-21-06.pdf
Grumback et al., Primary Care Resources andPreventable Hospitalizations in California retrievedfrom www.ucop.edu/cprc/bindman.html on 2/7/2007
Part 5 – Appendix 111
LACHS Trends South LA, 2005; provided by LAHealth Action (Los Angeles County Health Survey)
Patient Assessment Survey III Final Report, Allison L.Diamant, MD, MSHS for the PAS III Research Team(Data collected in 2005)
Project, Citywide Gang Activity Reduction Strategy:Phase I Report (2006)
Public Policy Institute of California, Just the Facts,California Children, March 2005 www.ppic.org
Public Policy Institute of California, Just the Facts,Los Angeles County, March 2005 www.ppic.org
Service Planning Area 6 – Disease Burden Profile, Revised6.10.03, retrieved from http://chipts.cch.ucla.edu/ interven-tions/coordinated_networks/SPA6_profile_061003.pdf
The Drew Service Area: Profile of an UrbanUnderserved Community, Research Centersin Minority Institutions, retrieved fromhttp://www.cdrewu.edu/rcmi/community/default.asp
Zip Code Definition by SPA, Los Angeles Departmentof Public Health retrieved from http://lapublichealth.org/
Hospitals, Clinics, and HealthStatus InformationBitler, M and Shi, W., Health Insurance, Health CareUse and Health Status in Los Angeles County, PublicPolicy Institute of CA 2006
Community Acquired Pneumonia: Hospital Outcomesin California, 2002 – 2004; California HospitalOutcomes Program Report, 2006, OSHPD
County-funded Ambulatory Care Utilization forUninsured Adults in Los Angeles County, LA HealthAction, Feb. 2007
Emergency Medical Services Authority, DesignatedTrauma Centers as of November 2006http://www.emsa.cahwnet.gov/emsdivision/trma_ctr.pdf
Ethnic Minorities Still Lack Adequate MH Care,Experts State (American Psychiatric Association)retrieved from the Network of Care-Los Angeles-Mental Health on 2/22/07
Felt-Lisk S, McHugh M and Thomas M, ExaminingAccess to Specialty Care for California’s Uninsured: FullReport, California HealthCare Foundation, (June 2004)
Grumback et al., Primary Care Resources andPreventable Hospitalizations in California retrievedfrom www.ucop.edu/cprc/bindman.html on 2/7/2007
Kaiser State Health Facts, Hospitals per 1,000 beds, 2004retrieved from http://www.statehealthfacts.org/cgibin/healthfacts.cgi?previewid=290&action=compare&category=Providers+%26+Service+Use&subcategory=Hospitals&topic=Beds
Key Indicators of Health by Service Planning Area,2002/2003 (LACDPH Publication)
Key Indicators of Health by Service Planning Area,April 2007 (LACDPH Publication)
King/Drew Medical Center Transition Report,National Health Foundation Research Team, 2005
Kurt Salmon and Associates, Phase II: Data Analysisand Report of Findings, Prepared for the CaliforniaHealthCare Foundation (May 5, 2005).
LADental Society retrieved from http://www.ladental.com/
LACDHS Office of Ambulatory Care, Public-PrivatePartnership (PPP) Program – Clinic Status (June 18,2007). Accessed at www.ladhs.org/ambcare/patients/pdf/clinicstatuslist.pdf
LACDHS, The L.A. County Medicaid DemonstrationProject (Section 1115): Stabilizing the Safety Net:1995-2005 (June 2005).
LACDPH oral health program retrieved fromhttp://lapublichealth.org/ohp/
Leong D, The Power of Partnerships: Solutions Createdand Lessons Learned by the Public Private PartnershipProgram, Community Clinic Association of Los AngelesCounty (May 2005).
Los Angeles County Department of Health Services –Clinic Listings (Health Services Directory)
Margolis L, Lowet P and Thorfinnson T, Multi-SpecialtyClinic Feasibility Study for the Southside Coalition ofCommunity Health Centers, Lia Margolis and Associates(December 15, 2005)
Mental Health and Racial Ethnic Minorities(American Association of World Health) retrievedfrom the Network of Care-Los Angeles-Mental Healthon 2/22/07 http://losangeles.networkofcare.org/mh/library/detail.cfm?id=1424&cat=42
Critical Condition: Examining the Scope of Medical Services in South Los Angeles112
Mortality in 2003, Leading Causes of Death andPremature Death, A publication of the Los AngelesCounty Department of Public Health
National Hospital Ambulatory Medical Care Survey:2004 Emergency Department Summary, Advance DataVital and Health Statistics, CDC Jun 23, 2006
Office of Statewide Health Planning and Development
— 2002 – 2004 ED Pivot and Trends
— 2005 Inpatient Discharge Data
— 2005 OSHPD PCC Utilization Data, Sept. 2006
— 2005 OSHPD Specialty Utilization Data, Sept. 2006
— Hospital Profile data (Pivot and Trends), HAFD1205 profile HIRC 10/12/06
Overuse of Emergency Departments Among InsuredCalifornians, CHCF Issue Brief Oct. 2006
Public Policy Institute of California, health Insurance,Health Care Use, and Health Status in Los AngelesCounty, 2006
Trend Watch, Coverage Counts: Supporting Healthand Opportunity for Children American HospitalAssociation, 2007
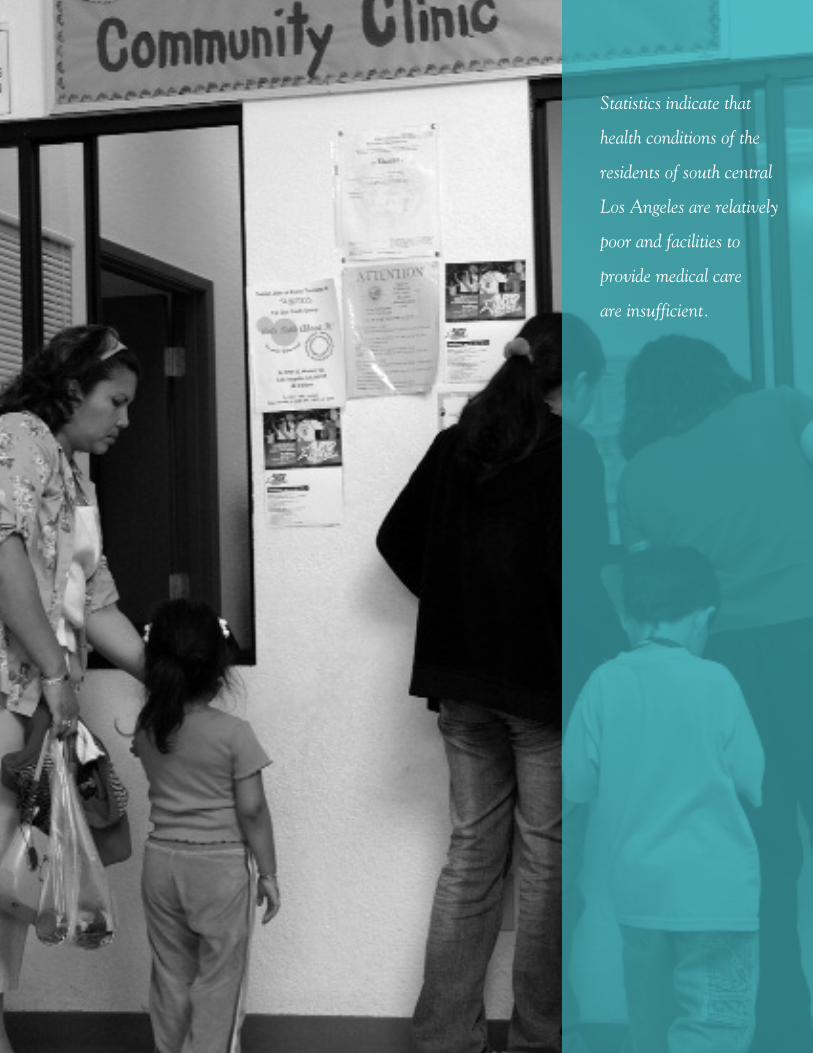
Statistics indicate that
health conditions of the
residents of south central
Los Angeles are relatively
poor and facilities to
provide medical care
are insufficient.

CPA/Critical ConditionTCE 1022-07