Embed Size (px)
Citation preview
Editorial 1
Vol : LXXXV, No. 3 July - September 2015
Editorial 3
Gender Audit for Engendering Governance, 5
Gender Responsive Budgets and Gender Just Lawsfor Empowerment of Women in South AsiaVibhuti Patel
Decentralization Process in India and Pakistan: 16
A Comparative StudySaikat Roy
Cities and the Aged: Grey Clouds Over Mankind 27
Ramanath Jha
Smart Citizens Behaviour: 55
The Core of Smart Cities in IndiaP. H. Rao
Leveraging Land Resource for ULB Finance: 81
Framework and Action Plan for Land DisposalRamakrishna Nallathiga
Mohd Taquiddin
Where are we on Decentralization? 91
G. Palanithurai
Health Status of the Rural Elderly in Tamil Nadu: 102
A Study of Perceptions with Referenceto Madurai DistrictR. Hariharan
M. V. Vaithilingam
Gender Sensitive Self-Assessment and Planning by 116
Vulnerable Populations vis-à-vis EnvironmentalSustainability and Sustainable Development GoalsMukesh Kanaskar
Book Review 125
Our Contributors
Contents
Loc
al G
over
nmen
t Qua
rter
lyPu
blish
ed b
y the
All
Indi
a In
stitu
te o
f Loc
al S
elf-G
over
nmen
t
2 Local Government Quarterly July - September 2015
All India Institute of Local Self-GovernmentM. N. Roy Human Development Campus, Plot No. 6, F Block,
TPS Road No. 12, Bandra (East), Mumbai - 400 051.Telephones : 0091 - 22 - 2657 17 13 / 2657 17 14 / 2657 17 15 Fax : 0091 - 22 - 2657 21 15
E-mail : [email protected] Website : www.aiilsg.org
Ranjit S. Chavan Ramanath JhaPresident Director General
Local Government QuarterlyEdi torial Board
Chief EditorRamanath Jha
Members
Sneha Palnitkar Mukesh Kanaskar
Nachiket Dhruva Ashish Deosthali
Advait Aundhkar Ajay Agrawal
V. Vijay Kumar G. V. Tendolkar
The views expressed in the articles are the personal opinions of the contributors and do not necessari ly reflect theopinion of the All India Insti tute of Local Self - Government. Articles, letters to the edi tor, views and reviews arewelcome. They may be addressed to the Chief Edi tor, or sent by e-mai l to ai i lsgquarterlyjournal@gmai l.com
Printed by Dr. Ramanath Jha, The Di rector-General, All India Insti tute of Local Self-Government, at NSD Art Pvt.Ltd., Andheri - 93 and published by him at the All India Insti tute of Local Self-Government, 11, Horniman Ci rcle,Mumbai - 400 023.
Editorial 3
Being an academic institution itself, this organisation recognises the vital roleacademic institutions can and should play in shaping the future. In the context oflocal governments, development and social work studies have always been aninfluential factor in developing new cadre of development professionals. Their ambitencompasses a wide array of themes from poverty to infrastructure and from publichealth to education. A crucial forthcoming event vis-à-vis development studies inAsia-Pacific context is the 23rd Regional Conference of Asian and Pacific Associationfor Social Work Education. Dedicated to the theme of ‘Growth and Crisis: SocialWork and Policy Discourses’, the Conference is expected to revisit the fundamentaltenets of the social work and development studies. A key question which will runthrough the sub-conscious at this conference, reflecting the current churning in thedevelopment studies and social work fraternity not only in Asia-Pacific but alsothroughout the world is: “Is the current academic system dynamic and flexible enoughto respond to the new emerging challenges faced by the development fraternity?”
The challenges faced by the local governments are transforming very fast.While the old societal challenges are still around, the new challenges are emerging ata rapid pace and grappling for the center-stage in tandem. Consider the issue ofmigrants. The conflict situation in many countries is forcing out many more migrantsthan in past. Even the willing host countries are grappling with the right ways ofassimilating the new influx. A good example is of Sweden- known for its humaneapproach and a proactive intent to extend social welfare support to all. Sweden iswitnessing an increasing influx of nomadic population from within Europe (notablyfrom Romania) and migrants from countries in conflict from outside Europe. TheSwedish welfare system is intensely scouting with urgency for human resourcescapable of providing an effective interface between this nomadic population and thesocial welfare mechanism.
Editorial
The Horizons for Development andSocial Work Studies
4 Local Government Quarterly July - September 2015
Take example of a totally different type: Safety and security vis-à-vis terrorismwhich is becoming a key concern for all local governments. Ironically it has struck ablow to the city hosting the aforesaid conference, the city of Bangkok, which hithertowas absent from the map of terrorism attacks.
While keeping the focus on the Asian context, the answer to the key questionof dynamism of the academic institutions to respond to the newer challenges is notencouraging. The newer challenges are addressed to a limited extent through one-off seminars and conferences. But, when it comes to a sustained institutionalisedresponse in terms of building a cadre of future enablers addressing the basic cause,the performance is far from satisfactory. Though, there are a few examples ofinstitutions dedicated to the newer themes such as of ‘habitat’, these are more asexceptions than rule. The academic engrossment is still predominantly oriented towardsthe ‘traditional specialisations’. Though no one can deny the importance of thesetraditional specialisations, there is also an urgent need for appreciating thetransformations at the spatial and societal levels. In view of the fact that the world isnow more urban than rural, and the rapid urbanisation in developing countries likeIndia, the development studies need to add to their repository, courses related tourban development, urban governance, decentralisation, infrastructure, etc.
It is very important to note that these new themes are opening up newer careeravenues too. Illustratively, as the world is gaining more sensitivity towards disastersand vulnerability of women and children to disasters, there is a growing demand fordevelopment professionals addressing the physical as well as the softer issues ofdisaster risk mitigation. However there is an acute dearth of academic institutionsoffering scientific education and training on these newer themes.
These limited set of institutions striving to imbibe the pro-modern era flexibilityare facing a key issue- the kind of certification to offer. A more rigorous programmein line with traditional academics implies a Master’s or post-graduation degree whichis a longer route of academic bureaucracy. An option perceived by many as morepractical is developing more focussed, condensed, relatively shorter-term certificatecourses with strong entry point filters as a quality assurance mechanism.
The Asian development academics fraternity is eagerly looking forward to thetakeaways from the forthcoming Bangkok conference ‘Growth and Crisis: SocialWork and Policy Discourses’ to understand how this crisis of acute shortage ofdevelopment professionals vis-à-vis newer challenges to local governments can beaddressed.
Gender Audit for Engendering Governance 5
“A gender audit enhances thecollective capacity of the organization toexamine its activities from a genderperspective and identify strengths andweaknesses in promoting gender equalityissues. It monitors and assesses therelative progress made in gendermainstreaming and helps to buildorganizational ownership for genderequality init iatives and sharpensorganizational learning on gender througha process of team building, informationsharing and reflection on gender.” ILOParticipatory Gender Audit: A Tool forOrganisational Change, 2004
Gender gap in governance in SouthAsia in all spheres is very high. Women’srepresentation in management and politicalpositions is extremely low: only 7 per centin parliament, 9 per cent in cabinet, 20 percent in local governance, 9 per cent in civilservices and 6 per cent in judiciary. Thisis a result of subordinate status accruedto women in all private and public domainsnamely household, community, state,market and civil society. (Panda, 2008)
If women were given equalopportunities, equal treatment and equal
Gender Audit for Engendering Governance,Gender Responsive Budgets and Gender JustLaws for Empowerment of Women in South Asia
Vibhuti Patel
remuneration/ equal share in propertythrough gender sensitivity in planning,policy making and programmeimplementation, it would be possible forthe country to have more output, moredevelopment of capacities, more well-being and more leisure due to combinedcontribution of men and women. Whenwe do gender audit, we do not see womenas beneficiaries of the crumbs thrown atthem by the system but we perceivewomen as active participants in thedevelopment process and as citizens. Forhealthy governance,
“We need a vision of mankind notas patients whose interests have tobe looked after, but as agents whocan do effective things- bothindividually and jointly. We alsohave to go beyond the role of humanbeings specifically as ‘consumers’or as ‘people with need’, andconsider, more broadly, their generalrole as agents of change who can-given opportunity- think, assess,evaluate, resolve, inspire, agitate,and through these means, reshapethe world.” (Sen, 2000)
6 Local Government Quarterly July - September 2015
With this vision, we need to makegender audit an integral part of alldevelopment efforts by the state and non-state actors.
Gender audit of constitutionalguarantees and legislations- fundamentalrights, directive principles, family laws,criminal legal system-substantive law,procedural law, rules and infrastructure,labour and population policies, political andelectoral systems have proved to beimportant tools for public education,transformatory process for women’sdevelopment and legal reforms to ensuregender-justice.
Gender audit of macro policiesis done to show how internationaleconomics impacts the local processes ofempowerment of women. Gender auditsof economic reforms, globalisation andstructural adjustment programmes, andnational plans are done to identifyconceptual and operational biases in theapproach, design and gender differentialimplications.
Gender audit of mega developmentalschemes and programmes have beenextremely useful to seal the leakages thatdis-empower women and bring to the forewomen’s component in terms ofemployment, educational opportunities, skilldevelopment, health facilities, entitlementand assets ownership. This exercise needsto be mainstreamed in all projects involvingdisplacement, relocation and rehabilitationof affected population.
Gender audit of statistics andindicators is a must to identify conceptualand operational biases of the data system
that invisiblise women’s contribution, stakeand concerns. Visibility of women (alongwith men) in statistics and indicatorsprovide a realistic picture for allocation ofresources for women specific projects andgender-neutral projects with respect toeducation, health, public utilities-transport,toilets, information desk, etc.
Gender audits of documents ofstate and central governments such asstatus of women’s Committee Reports,State Policies for Women, Amendmentsin the Local Self Government Act to grantreservation of seats for women andHuman Development Reports havesensitised the administrators, politicians,non-government organisations and socialmovements to women’s needs, aspirationsand demands.
Gender audits of housing policy,water policy, energy and environmentpolicy, population policy, national healthpolicy, mental health policy, disastermanagement policy, policy for financialassistance and foreign policy and theMillennium Development Goals havehelped to evolve safety nets for women’ssurvival and subsistence. This is a mustas women’s interests in all sectors havebeen historically neglected and there is anurgency to deconstruct institutionalisedhegemony that maintains gender gapbetween formal equality & substantiveequality.
Gender audit of budgets providespolicy framework, methodology and a setof tools to assist governments to integratea gender perspective into the budget asthe main national plan of public
Gender Audit for Engendering Governance 7
expenditure. It also aims to facilitateattention to gender analysis whilereviewing macroeconomic performance,ministerial budget preparations,parliamentary debate and mainstreammedia coverage. (Nakray, 2013)
Gender audit has direct implicationsfor Strategic Gender Needs (SGNs) andPractical Gender Needs (PGNs). SGNsare different in different economic contextsand are determined by statutory provisions,affirmative action by the state, and pro-active role of the employers to enhancewomen’s position in the economy andsocial movements. PGNs are identifiedkeeping into consideration, gender baseddivision of labour or women’s subordinateposition in the economy. They are aresponse to immediate perceivednecessity, identified within a specificcontext. They are practical in nature andoften are concerned with inadequacies inliving conditions such as provision of fuel,water, sanita tion, healthcare andemployment.
Considering the large numbers ofwomen in unpaid work and women’scentral role to the care economy, toaddress women’s concerns in thesesectors, policies need to focus on socialservices to support women’s care roles(old age, child care). With increasingwomen’s role in the care economy (bothpaid and unpaid), adequate resourceallocations need to be made to supportwomen’s care roles. In the absence of sexdisaggregated data, evaluation of schemesthrough a gender lens or any effort atstrengthening gender dimensions of
existing schemes poses a big question. So,provision of such data should beprioritized. In the light of the presentagrarian crisis and the changing face ofagriculture being highly gendered, thevulnerability of South Asian womenfarmers in particular due to globalisationissignificant.
Considering the huge genderdisparities in land ownership patterns,women’s access to land needs to bestrengthened immediately. This could bedone by(a) Improving women’s claims to family
land (by enhancing legal awarenesson inheritance laws, provide legalsupport services, etc.);
(b) Improving access to public land byensuring that all land transfers forpoverty alleviation, resettlementschemes, etc., recognize women’sclaims;
(c) Improving women’s access to landvia market through provision ofsubsidized credit to poor, byencouraging group formation for landpurchase or lease by poor women,etc.Women’s rights organizations have
demanded that the Government shouldensure adequate gender budgeting in allministries and departments, enact acomprehensive and universal FoodSecurity Act to ensure right to food as acore component, allocate 6 per cent ofGDP for health, allocate 6 per cent of GDPfor education, make budgetary allocationto cover special schemes for women
8 Local Government Quarterly July - September 2015
workers, increase allocation of resourcesfor women farmers, enhance resourceallocation for tribal, dalit, and minoritywomen and increase budgetary supportfor schemes to assist women-headedhouseholds and differently abled women.(Patel & Karne, 2006).
The target of 30 per cent genderallocations under all ministries has not yetbeen achieved. This must be implementedimmediately. There is need for genderaudit and gender outcome appraisal of allministries and departments at the centraland state levels. Very often, resourceallocations made under gender budgetingdo not reach in time and they remainunspent. There should be propermonitoring and supervision of the allocatedfunds with greater transparency andaccountability at all levels. Gendereconomists have strongly recommendedtax reduction for working, self employedand business women. Lowering tax ratesfor women will put more money in theirhands and encourage those not yet in thejob market to join the work force. Similarly,property tax rules should be amendedfurther to encourage ownership of assetsamong women. (Patel, 2009a)
Budget audit from the perspective ofpoor, women, minorities, people withdisability, children, geriatric groups andother vulnerable sections is now practicedby many countries with an objective tosupport government and civil society inexamining national, regional and localbudgets from a sectional perspective andapplying the study results for theformulation of responsive budgets. There
is no single approach or model of asensitive budget exercise. In somecountries, e.g., these exercises areimplemented by the government while inother countries individuals and groupsoutside government undertake thebudgetary analysis.
Budgets garner resources throughthe taxation policies and allocate resourcesto different sections of the economy.There is a need to highlight participatoryapproaches to pro-poor budgeting, bottomup budget, child budget, SC budget, STbudget, green budgeting, local and globalimplications of pro-poor and pro-womenbudgeting, alternative macro scenariosemerging out of alternative budgets andinter-linkages between gender-sensitivebudgeting and women’s empowerment.Bottom up budgets have emerged as animportant and widespread strategy forscrutinizing government budgets for theircontribution to marginalised sections of theeconomy. They have utilized a variety oftools and processes to assess the impactof government expenditures and revenueson the social and economic position of men,women, boys and gir ls. Ser iousexamination of budgets calls for greatertransparency at the level of internationaleconomics to local processes ofempowerment. There is a need to providetraining and capacity building workshopsfor decision-makers in the governmentstructures, gram sabhas, parliamentariansand audio-visual media (Patel, 2009b).
Budget is an important tool in thehands of state for affirmative action forimprovement of gender relations through
Gender Audit for Engendering Governance 9
reduction of gender gap in thedevelopment process in 5 crucial areas-education, health, employment, economicopportunities and political participation. Itcan help to reduce economic inequalitiesbetween men and women as well asbetween the rich and the poor. Hence,the budgetary policies need to take intoconsideration the gender dynamicsoperating in the economy and in the civilsociety.
Public debate on gender sensitivebudget will help the country to tilt thebalance in favour of area developmentand peaceful use of resources in thepresent atmosphere of jingoism. Gendercommitments must be translated intobudgetary commitment. By using the Rightto Information, transparency /accountability for revenue generation &public expenditure can be ensured. Forreprioritisation in public spending, we mustprepare ‘bottom up budgets’ and lobby forits realisation in collaboration with theelected representatives. Gendereconomists must lift the veil of statisticalinvisibility of the unpaid ‘care economy’managed by poor women and highlightequality & efficiency dimension andtransform macro-policies so that theybecome women friendly (Patel, 2010).
Gender Just Laws
In all South Asian countries, judicialactivism has made landmark contributionin challenging antiquated laws- doublestandards in family laws, criminal laws andlabour laws (Serajuddin, 2011).
Violence against women (VAW) hasbecome a central issue in the discourse ofthe international women’s movement inthe 21st century. Women’s networks inthe South Asia have taken up a wide rangeof issues concerning violence againstwomen (VAW) in their personal lives aswell as against the systems perpetuatingit (Goonsekera, 2004). “Personal ispolitical”, a slogan popularised by twodecades of women’s movement in the lastcentury signifies consistent campaignsagainst all forms of violence in women’sintimate/personal and public/societal lives.Social construction of masculinity in theregion is defined by cultural nationalism,jingoism and militarisation of the economyas well as ethnic/caste/religiouschauvinism in the context of worseningeconomic crisis due to liberalisation,privatisation, and globalisation (LPG).Escalating fundamentalist backlash in theSouth Asian countries takes the mostbarbaric form in terms of a wide range ofviolence against women at different stagesof their lives, from womb to tomb.Moreover, as a result of modernisation andcommercialisation of subsistenceeconomies, family ties have become lesssupportive. Increasing intra-state, inter-state and cross country migration as wellas trafficking of women and girls has asole purpose of SEXPLOITATION-ferocious and complete control over theirsexuality, fertility and labour. Cut throatcompetition among the nation states hasincreased work-burden drastically due toshift from just-in-case approach to just-in-time approach to meet the targets ofproduction at the cheapest possible cost.
10 Local Government Quarterly July - September 2015
During the eighties, women’s rightsorganisations mushroomed in South Asiain response to varied manifestations ofVAWG by the state apparatus and in thecivil society in the form of anti-womenfamily laws and customary laws,communal carnage, sexual harassment atthe workplace and assaults on individualwomen in the family and in society. Theyorganised rallies and demonstrations, sit-ins and conventions, seminars andconferences, which culminated into politicsof protest movements and petitioning. Inthe 1990s, the women’s groupsconsolidated their base by finding theirallies in the state apparatus and createdtheir institutional base and shelter homesof women and children victims ofviolence.
Adverse Sex Ratio (Number ofwomen per 1000 men)
The Skewed Sex Ratios have beenfound in most of the South Asian Countries.Historical legacy of strong son-preferenceand neglect of daughters has taken adangerous turn where scientifictechnologies for sex-determination suchas amniocentesis, chorion-villi-biopsy,foetoscopy, ultra sonography are abusedfor selective abortion of female fetusesby money-minded medical professionals.All South Asian Countries need PreConception and Pre Natal Diagnostictechniques (PCPNDT) Act to stop sexselective abortions of female fetuses(Patel, 2009).
Globalisation and new forms of VAWG
In the absence of any safety-netprovided by the multinational andtransnational Corporations or thegovernments, globalisation has enhancedcontrol over sexuality, fertility and labourof women migrants in the region. Innocentrural girls as well as high-school educatedadolescent girls are inducted into theworkforce. Cross country migration ofgirls and women for domestic work,industrial and professional work andservices like nursing, secretarial practice,tele-working and business processoutsourcing (BPO) has increased manyfolds.
Mail-order brides from Asiancountries are in demand in Europe so thataging patriarchs can be looked after by‘docile’ Asian women. Organ trade ofdestitute women, children and fetusesfrom the poor Asian communities hasgained demonic proportion. Soft porn aswell as hard-core pornography and cybersexual violence are used for terrorisation,humiliation and intimidation of women andgirls. Cyber stalking in the computer labsof offices, colleges, universities andcommercially run cyber-cafes has invitedattention of the decision makers who aredivided in their opinions. Some scholarsbelieve that it reduces actual violenceagainst women as people derivepsychological satisfaction throughvoyeurism. Others see it as an extensionof verbal and physical violence. Policyinterventions are needed to deal withonline sexual violence. Use of SMS tosend scary messages to girls, is another
Gender Audit for Engendering Governance 11
important area that demands urgentattention. Only the East Asian countrieshave addressed cyber violence withgendered perspective. In all cities like thoseof South Asia; increasing number ofwomen are reporting harassment by onlinesexual violence through spam mail, cyberporn and SMS messages.
To deal with these complex issues,laws to protect South Asian Women arethe need of the hour.
Domestic Violence
Mapping of domestic violence in theregion reveals universality of itsoccurrence. Still, health data collectedroutinely by governments and WHO donot yet report on the incidence of violenceagainst women. For the South Asianregion, country prevalence studies showthat the prevalence of violence by anintimate partner ranges between 16 and40 per cent” (OXFAM, 2004). Domesticabuse is everywhere still there are hardlyany shelter-homes for women. In all SouthAsian countries, there is no legal or stateprovision against marital rape. The reporttitled In Pursuit of Justice notes that onlyfour South Asian countries - Sri Lanka,India, Nepal, and Bangladesh - have lawsspecifically prohibiting domestic violence.But even where laws exist, scholars saylack of awareness, poverty, and socialstigma often prevent women fromaccessing legal help. (UN Report, 2011)
How to Prevent Child Sexual Abuse?
Increasing incidences of child sexualabuse are reported in the region, mostly
by street children and child labourers. Inthis situation, counselling of children onlyin school is not adequate. There is needfor community and neighbourhood-centered approach. We also need publicdiscussion, TV coverage, radio-talks tolegitimize experiences of the victims andempower them. Code of conductconcerning adult-child relationship, dos &don’ts and unsafe touch/intimacy shouldbe discussed openly, not in a hush-hushtone. We should teach our children that“It is O.K. to say ‘No’”, instead ofunconditional obedience. We shouldorganise assertiveness training sessionsand create a non-threatening atmospherefor children to emphasize, “Speak out, don’tsuffer in silence.” Docudrama and role-play for class room teaching shouldhighlight all potential situations of childsexual abuse. Custodial situations-hostels,jails, mental hospitals, orphanages, shelterhomes and family need special mention.Accountability, transparency, andresponsible media coverage areimperative on the part of the criminaljustice system. Visually effective postersshowing safe alternatives to abusiveconditions should be addressed to school-going and non school-going children. Banon the use of children for childpornography should be made effective inthe region. Sleazy remixes of old songsare making obscene use of women’sbodies. Two yearsago, the IndianParliament passed Protection of Childrenfrom Sexual Offense (POCSO) Act,2012.
12 Local Government Quarterly July - September 2015
Human Trafficking and ForcedProstitution
Sex tourism in South & South EastAsia perpetuates and promotes child-prostitution. (Patel, 2010). In Burma, everyyear 10000 women and girls are traffickedinto sex-slavery in Thai brothels. Same isthe case with rural girls in India, Nepal,Bangladesh, and Sri Lanka in South Asia.Both, worsening economic situation andcultural practices condoning multiple sex-partners are responsible for proliferationof prostitution. HIV-AIDs scare has hadno effect in curbing sex-trade in theabsence of economically viablealternatives for sex-workers.
An act to prevent trafficking ofwomen and children should ensure de-criminalisation of victims of prostitutiontargeting 4 Ps- procurers, pimps, police,and power elite. Dealing with blackmailersneeds support of the community groupsand civil society initiatives. State fundingfor rehabilitation of prostitutes and salaryof frontline workers should be increasedso that better quality of custodial care anddevelopmental needs of ex-prostitutes interms of education, skills, employment, andhealthy recreational activities can beprovided. Close collaboration betweenGOs and NGOs can be most effective.
HIV AIDs as a Worst Form of VAW
This is a very important issue facedin the 21st century. Both sex-workers withmultiple sex-partners and housewives withsingle sex-partner (i.e., her husband) areat risk of getting HIV-AIDs. Counseling
for dealing with social stigma and creatingan alternate support network are the mostimportant aspects of providing emotionalsupport to the HIV-AIDs patients. TheLawyers’ Collective HIV/AIDS Unit holdsmonthly drop-in meetings, with anobjective of sharing information,experiences and resolving mind-bogglingissues affecting the lives of HIV/AIDSpatients. It also provides legal aid andallied services to the needy. “The mainobjective of the Unit is to protect andpromote the fundamental rights of personsliving with HIV/AIDS who have beendenied their rights in areas such ashealthcare, employment, terminal dues likegratuity, pension, marital rights relating tomaintenance, custody of children andhousing” (Lawyers’ Collective, 2000).
Culture Specific Violence againstWomen
Culture specific violence againstwomen in different Asian countries shouldbe approached sensitively, without makingany racist or chauvinist remarks againstthe concerned community. We needuniversal applicability of human rights andacceptance of the fact that women’srights are human rights. This approachshould be kept in mind while dealing withdowry harassment and bride burningamong Hindu, Muslim and Christianwomen of Indian origin, widow-burning-Suttee (Sati) in India, throwing of acid-bulbs against women in Bangladesh,Hadood Ordinance-women as witnessesin cases of rape, battering, assault,molestation and Islamic punishment for
Gender Audit for Engendering Governance 13
“Adulteress”, son preference and neglectof girl child in Asia. Denial of human rightsand fundamental rights enshrined in theConstitution of India by thefundamentalists by imposition of dresscode, not granting right to work andattacks on female headed householdshave been objected to by women’s rightsgroups throughout the world. In somecountries, an extreme form of punishmentis meted out to women by thefundamentalists is in the form of stoningto death of “an adulterous woman” by theassembled community. During the lastdecade, innumerable women in severalcountries have lost their lives in painfuland undignified manner at the hands ofself-appointed ‘custodians of morality’.‘Honour killing’ has become mostwidespread in Bangladesh, India, Pakistan,and Afghanistan.
Ban on Inter-caste, Inter-religiousand Inter-racial Marriages
Obsession about racial, caste andreligious purity are so deep in the psycheof fundamentalists that they have strongaversion against inter-mixing and inter-marriages among citizens of differentcaste groups, religious communities andracial backgrounds. Newspapers are fullof incidences of torture, abduction, forcedabortion, lynching, and murder of newlymarried couples with different caste,religious, ethnic or racial backgrounds.Even the state and criminal justice systemmiserably fails to provide adequateprotection to such love marriages. Such
couples have to face social boycott, can’teasily get jobs, accommodation, and schooladmissions for their children.
Conversion of husband or wife as aconditionality for “allowing” couples to getmarried is a logical extension of the inwardlooking mentality generated by thefundamentalist mindset.
Sexual Violence against Women
In the month following the gang rapeof a 23-year-old physiotherapist in amoving bus in Delhi on 16th December2013, debates over the social constructionof gender that perpetuates sexualharassment in all walks of life have takencentre stage in India. The general public,community leaders, parents, youth,education providers, corporates, policymakers, politicians and the media: all arediscussing the prevalence of sexualviolence in our society. The masses,spanning four generations, have starteddeconstructing workplace safety in thecontext of misogyny, barbarism, theinfluence of pornography in valorisingsadomasochistic relations between menand women, the influence ofWesternisation on women’s dress codes,consumerist culture, hedonism, and howthe chivalry toward women that existedamong civilized cultures is being replacedby hostility towards women.
Sexual harassment at the workplacehas been one of the central concerns ofthe women’s movement in India since the80s. After 30 years of consistent effort,Indian women have managed to get The
14 Local Government Quarterly July - September 2015
Sexual Harassment of Women atWorkplace (Prevention, Prohibition andRedressal) Act, 2013. Due to pressurefrom child rights organizations, last yearthe Indian Parliament passed TheProtection of Children from SexualOffences Act, 2012, aimed at protectingchildren in India against the evil of childsexual abuse. It came into force on14-11-2012, Children’s Day (in India)along with the rules framed under the Act.
Acid Attacks on women and Girls:A Serious Concern in South Asia
During 1999 to 2012, there were 3112incidences of acid attacks in Bangladeshas per Acid Survivors FoundationBangladesh. In 2012 in India, over 56 acidattacks were reported and over 150 acidattacks were reported in Pakistan. TheProgressive Women’s Association ofPakistan recorded over 7000 attacks injust 2 towns between 1994 and 2008. Outof the 7000, only 2 per cent of these weresuccessfully prosecuted. The AcidSurvivors Foundation of Pakistan has overa 100 cases of acid attacks a year butthey estimate that the real figures aremuch higher. These attacks are frequentlylinked to domestic violence or revenge byrejected men. (The World Outline, 10-6-2013)
UN Report (2011) states morewomen in law enforcement and the justicesystem could greatly help victims ofviolence. Currently, in South Asia, womenmake up just 9 per cent of judges,4 per cent of prosecution staff and just3 per cent of police. The report
recommends that ‘increasing the numberof women in such positions could betterhelp South Asian women understand andnavigate the justice process. Many ofthese women are impoverished, illiterateand unaware of the laws and programmesin place to protect them.’
Conclusion
The concept of gender audit hasgained tremendous popularity among thedevelopment economists, social scientists,policy makers and practitioners in the newmillennium. It is perceived as crucial fromthe point of view of equity and efficiency.Increasingly the scholars and the decision-makers in government as well as non-government organisations are acceptingthat gender-bias is not only harmful andcostly for women, but it is equally harmfulto the children and the households.
References
Goonsekera, Savitri (2004). Violence,Law and Women’s Rights in South Asia,UNIFEM. Delhi : Sage Publications.
ILO. (2004). Retrieved from http://www.ilo.org/wcmsp5/groups/public/dgreports/gender/documents/publication/wcms 01030.pdf 2004
Lawyers Collective. Retrieved fromwww.lawyers collective.org/magazine/may-2000
Nakray, Keerty (Ed.). (2013).Gender Based Violence and PublicHealth: International Perspectives onBudgets and Policies, London: Routledge.
Gender Audit for Engendering Governance 15
Towards Ending Violence againstWomen in South Asia, 2004 Retrievedfrom. www.oxfam.org/sites/www.oxfam.org/files/violence.pdf
Panda, Smita Mishra. (2008).Engendering Governance Institutions,State, Market and Civil Society, Delhi:Sage Publications.
Patel, Vibhuti and Karne, Manisha(Eds.). (2006). The MacroeconomicPolicies and the MillenniumDevelopment Goals. Delhi: Gyan BooksPvt. Ltd.
Patel, Vibhuti (2009a) http://www.gender-budgets.org/content/view/292/156/ United Nations DevelopmentFund for Women (UNIFEM) and TheCommonwealth Secretariat.
Patel, Vibhuti (Ed). (2009b)Discourse on Women and Empowerment,Delhi: The Women Press.
Patel, Vibhuti (2010, November-December). Gender Audit of Budgets inIndia, Colombo: Nivedini - Journal ofGender Studies. pp. 146-172.
Patel, Vibhuti (Ed). (2010). Girls andGirlhoods at the Threshold of Youth andGender, Delhi: The Women Press.
Sen, Amartya Kumar. (2000). Keynote Address on ‘Transition toSustainability in the 21st Century’ at theInter-Academy Panel called Sustainabilityand Freedom on International Issues.Tokyo, May 15, 2000.
Serajuddin, Alamgir Muhammad(2011). Muslim Family Law: SecularCourts and Muslim Women of SouthAsia, Karachi : Oxford University Press.
http://theworldoutline.com/2013/06/the-disturbing-rise-of-acid-violence-in-south-asia/10-6-2013
UN Report (2011): South AsianWomen Need More Domestic ViolenceProtection Retrieved from http://www.voanews.com/content/un-report-south-asian-women-need-more-domestic-violence-protection—125160294/167731.html
South Asia Initiative to EndViolence against Children (2012-2015)Retrieved from. www.unicef.org/rosa/protection_ 7734.htm.
16 Local Government Quarterly July - September 2015
This paper is a comparative study ofthe paths to decentralisation taken by twovery different countries- India andPakistan. It provides an explanation of themethodology applied for the comparisonof two extremely different cases, an in-depth reflection on the decentralisationphenomenon itself, as well as observationof the two different styles ofdecentralization adopted by these twocountries. This reflection on the wholeleads to a renewed questioning of thenotion of decentralization itself aspresented in comparative literature, whichoften compares Western countries only.
In the present golden era ofdecentralisation, support for shifting powerto local tiers of government is gainingimportance day by day. This perspectiveis grounded in the belief that doing so willincrease government responsiveness andaccountability to citizens, increasegovernment flexibility to address thediverse needs of often a highlyheterogeneous population and reducecorruption through enhanced oversight. Inthis process, it is argued, decentralisation
Decentralization Process in India and Pakistan:A Comparative Study
Saikat Roy
will augment greater political legitimacywhile strengthening a sense of citizenownership of their government.
“Decentralisation, or decentralisinggovernance, refers to the restructuring orre-organisation of authority so that thereis a system of co-responsibility betweeninstitutions of governance at the central,regional and local levels according to theprinciple of subsidiary, thus increasing theauthority and capacities at sub-nationallevels. Decentralisation could also beexpected of good governance such asincreasing people’s opportunities forparticipation in economic, social andpolitical decisions; assisting in developingpeople’s capacities; and enhancinggovernment responsiveness, transparencyand accountability” (UNDP: 1997).
Conceptually, decentralisation relatesto the role of, and the relationship between,central and local institutions, whether theyare public, private or civic. According toParker and Serrano (2000), the processof decentralisation, focuses on the “formalinstitutions of government”, both politicaland administrative. Crook and Manor
Decentralization Process in India and Pakistan: A Comparative Study 17
(1998) define decentralisation as the‘transfer of power away from a centralauthority to lower levels in a territorialhierarchy’. Rojer Boesche (1987) arguedthat, “decentralised political and economicparticipation push men and women fromtheir private self-interested worlds into thepublic, teach them in a practical way howto master their surroundings, remind themof their independence and of the pleasersof cooperation, and to militate against thedocility and sterility encouraged bycentralisation. Cooperative decentralizedefforts - efforts that rely on the talentpotential for popular energy and that impelmen and women to master their politicalworld-are the first mark of a free nation”.
Decentralisation has always beeninspired by the following two arguments
1. Decentralisation can lead to anincrease in efficiency. Control stateauthorities usually lack the “time andplace knowledge” (Hayek cited inOstrom et al. 1993: 51) to implementpolicies and programmes that reflectpeople’s ‘real’ needs andpreferences. If properly managed,decentralisation is seen as a way toimprove allocative efficiency(Musgrave: 1983, Oates: 1972).
2. Decentralisation can lead toimproved governance.Decentralisation enhancesaccountability and monitoring ofgovernment officials and decisionmakers. Unchecked authority andinadequate incentives encourage,“rent seeking behaviour” by
government officials. Decentralisationundermines these opportunities bycreating institutional arrangementsthat formalise the relationshipbetween citizens and public servants.Political decentralisation, especiallythe election of local officials bycitizens, when accompanied by astrong legal framework, can createlocal accountability and therebyfoster officials’ legitimacy, bolsteringcitizen involvement and interest inpolitics, and deepening thedemocratic nature of institutions(Blair: 2000, Crook and Manoor:1988, Manoor: 1999).Underlying the concept of
decentralisation is an assertion that a moredecentralised state apparatus will be moreexposed and therefore, more responsiveto local needs and aspirations (Crook andSverrison: 2001). This, it is argued, willproduce systems of governance that aremore effective and accountable to localpeople (Blair: 2000, Crook and Manoor:1998, Manoor: 1999, Rondinelli et al.:1989). In the words of Blair (2000),“decentralisation can be defined asmeaningful authority devolved to local unitsof governance that are accessible andaccountable to the local citizenry, whoenjoy full political rights and liberty”.
Decentralisation is complex andencompasses a wide range of elements(Parker: 1995). Going through assessmentof different academics the concept ofdecentralisation can be categorised intothree types: political decentralisation, fiscaldecentralisation and administra tive
18 Local Government Quarterly July - September 2015
decentralisation (Smith: 1985, Hicks: 1961,Manoor: 1999). At its best,decentralisation does not simply transfercentralised functions to the local levels butsimultaneously reorganises the roles andresponsibilities of central governments,local government and communities, andopens government process to greaterinvolvement by the people.
The notion of decentralisation showsthat there are some variations withindecentralisation. The variants ofdecentralisation are, Devolution, whichinvolves a full transfer of responsibility,decision-making, resources and revenuegeneration to a local level of publicauthority that is autonomous and fullyindependent from the developing authority.De-concentration, that transfers authorityand responsibility from one level of thecentral government to another whilemaintaining the same hierarchical level ofaccountability from the local units to thecentral government ministry or agencywhich has been decentralised. Delegationredistributes authority and responsibility tolocal units of government or agencies thatare not always necessarily, branches orlocal offices of the delegating authority.Privatisation connotes the transfer ofresponsibility and resources for certaingovernmental functions to the privatesector.
Decentralisation in South Asiancountries
During the 1970’s, many governmentsin Asia, Latin America and Africa beganto experiment not only with the new
approaches to development, but also withnew political and administra tivearrangements for planning and managingdevelopment programmes and projects.The increasing interest in decentralisingauthority for planning and administrationto state, regional, district and localagencies, field units of central ministers,local governments and special purposeorganisations arose from three convergingforces (Cheema and Rondinelli: 1983).First, from disillusionment with the resultsof central planning and control ofdevelopment activities during the 1950’sand 1960’s; second, from the implicitrequirements for new ways of managingdevelopment programmes and projectsthat were embodied in growth with equitystrategies that emerged during the 1970’s;and third, from the growing realisation thatas societies become more complex andgovernment activities begin to expand, itbecomes increasingly difficult to plan andadminister all development activitieseffectively and efficiently from the centre.
Hence, to ensure development, thethird world countries moved towards thedecentralised political system.
Recent studies show that on theSouth Asian countries have adopteddecentralisation with varying degrees ofsuccess in public participation (Azis andArnold: 1996). For a long time, localdemocracy was not taken seriously bySouth Asian elites. But, with theemergence of the modernisation paradigm,the South Asian governments from the1950’s were initially convinced of theimportance of local government with thetop-down projects.
Decentralization Process in India and Pakistan: A Comparative Study 19
Presently, many developing countriesare engaged in the re-structuring and re-inventing their governments. Among theseSouth Asian developing countries, Indiaand Pakistan happen to be the leadingproponents. One has been decentralisedby the parliamentary democratic systemand the other has received its decentralisedcharacter from the military regimes.
Evolution of Decentralisation in India
Immediately after independence, forthe sake of development in the rural areas,Community Development CD programmewas introduced in India. In the second halfof 1950’s India introduced the PanchayatiRaj system. In India the roots of modernPanchayati Raj (i.e., democraticdecentralisation) lie in many recentcommission reports, particularly in the1957 report of the Balwant Rai MehtaCommittee (Palmer: 1960). This reportemphasized two aspects of PanchayatiRaj-its autonomous character and itselective nature. Initially in 1959 theRajasthan government adopted thePanchayati Raj system. Panchayati Rajinstitutions being developed as powermechanisms have not had encouragingresults. However, in a summaryassessment, it is generally accepted thatPanchayati Raj has awakened politicalconsciousness in the villagers and has seta foot the democratic process in ruralIndia.
In India, the Janata Party led unionGovernment in 1977 appointed a committeeknown as the Ashok Mehta Committee toinquire into the working of Panchayati Raj
Institutions and suggest measures tostrengthen them, “so as to enable adecentralized system of planning anddevelopment to be effective”. TheCommittee made recommendations forreform and revitalization of Panchayati Rajbased upon the main premise of linkinginstitutions of democratic decentralisationwith socially motivated economicdevelopment. But the recommendationsof the Committee were not accepted bythe Union Government due to a changeof party in power, although actions weretaken on some of the recommendationsby a few state governments.
Later on in 1984, the Indira Gandhigovernment took some initiatives tostrengthen Panchayati Raj as a Vibrantlocal institutional set up (Austin: 1999). Asa result, in 1985 and 1986 two committeeswere set up under the chairmanship ofG.V.K. Rao and L.M. Singhvi. Taking intoaccount the views of these committees,in 1989 the Union Government introducedin parliament Sixty Fourth ConstitutionAmendment Bill for reorganization of thePanchayati Raj system, structurally andfunctionally. But in practice, the bill didnot come into being. Again in 1990 theNational Front Government introducedanother bill for reorganization of both thePanchayats and Municipalities. But sincethe National Front Government went outof office soon thereafter, the bill lapsed.And finally, in 1991 through the 73rd and74th amendments, the decentralisationprocess took its ultimate shape.
In the decade of globalization andliberalization in India, the Panchayati Raj
20 Local Government Quarterly July - September 2015
system acquired its constitutional statusunder the 73rd and 74th constitutionalamendment act . The act is largelymodelled after the previous Panchayat Billof 1989 and has also incorporated someof the features of the Panchayat Bill 1990.The act considers a three Tier localgovernment system comprising GramPanchayat, Panchayat Samiti and ZillaParishad to ensure more peoples’participation. The act reserved seats forSCs, STs and one third seats for thewomen at the grassroot level. It alsointroduced gram sabha within the villagepanchayat.
Evolution of Decentralisation inPakistan
Immediately after independence, forthe sake of development in the rural areas,the Village Agricultural and IndustrialDevelopment Programme (V-AID)wasset up in Pakistan. In the second half of1950s, in Pakistan it was BasicDemocracies which came into being inPakistan.
The introduction of the BasicDemocracies Scheme in Pakistan wasprompted by the failure of parliamentarydemocracy, political instability, corruptadministration and a lack of popularinvolvement in the process of economicdevelopment. The scheme envisioned anintegrated and interdependent five-tiersystem of councils at the Union, Thana,District, Division and Provincial levels(Basic Democracies Manual, no. 1).
Two major changes took place duringthis period: (1) decline the Yahya Khan
Regime and (2) emergence of constitutionunder the Zulfikar Ali Bhutto Regime. TheBhutto government abolished the BasicDemocracies system which was in amoribund state after 1969. The Bhuttogovernment passed a local GovernmentOrdinance in 1972 for providing a generallegal framework for setting up areorganized local self-government system.But requisite steps for putting into actionthe new local Government systemappropriately, was not taken by Bhuttogovernment.
In the 1980s both India and Pakistanwent through a phase of resurgence oflocal governments. In case of Pakistanafter a gap of ten years, local governmentreceived a boost by the introduction of localgovernment ordinance in 1979 under theZia-Ul-Haq government. ProvincialGovernments and Area Administrationswere directed by the Central Governmentto issue ordinances to provide statutorybasis to the proposed local government.The local government ordinance startedfunctioning since 1979-80 and existed till1999. The organized rural localgovernment differed from the BasicDemocracies in certain aspects:1. There was no longer any hierarchy
of local bodies as was in BasicDemocracies.
2. In local government ordinance therewere no division level councils likeBasic Democracies.
3. Some additional functions andautonomy were given to councils ascompared to the Basic Democracies.
Decentralization Process in India and Pakistan: A Comparative Study 21
4. Integration between rural and urbanlocal governments was discontinued.But, the local government ordinance
was unable to make any dramatic changein rural governance, because there was abasic imbalance between the assignedrange of functions and the fiscal powersgranted to councils. Scarcity of resourceswas the major constrain and restricted theeffective functioning of the councils.Furthermore, the policy did not representa radical departure from the past, nor didit provide for wholesale devolution ofauthority.
Since, the local governmentordinance was unable to fulfil therequirements of local self government andin the absence of devolution of power, atthe end of the decade due to the pressurefrom various quarters the Musharrafregime introduced a NationalReconstruction Bureau to revitalize thelocal governments, which resulted in the‘Devolution of Power Plan’ of 2000 andwas implemented after a series of localgovernment elections that ended byAugust 2001. It introduced a three tierlocal governmental system consistingDistrict, Tehsil and Union Council. Themajor changes brought about by thedevolution plan were (Cheema et. al.,:2005):A. Engendering electoral accountability.B. Reducing bureaucratic power.C. Greater presence and scope of
elected government at the local level.D. Changed local electoral process.E. Limited constitutional support.
F. Provincial to local decentralization.G. Uneasy integration between
provincial/federal and district levelelected governments.
Comparison between the decentralisationprocesses of India and Pakistan
The major differences between Indiaand Pakistan so far as local levelgovernmental system is concerned is thatin instability. In India there is always acontinuation of government policies, butin the case of Pakistan, with every changeof regime at the national level,simultaneous changes are also reflectedin the system of local government.
Thus, the major comparisonsbetween the current decentralisationprocess of India and Pakistan are asfollowing:1. In 2001, at the start of the new
millennium, Pakistan came out witha local government ordinance,simultaneously issued by its fourprovinces. It introduced three tierlocal governments- district, tehsil andunion council.In India decentralisation has beenensured through the 73rdconstitutional amendment act of1992. The local government in Indiaalso consists of three tiers: GramPanchayat, Panchayat Samiti andZilla Parishad.
2. The purpose of the local governmentreform in Pakistan in 2001 wasdevolution of political power andfinancial authority to local
22 Local Government Quarterly July - September 2015
governments. It also emphasises onadministrative decentralisation.In the case of India, the 73rd and 74thconstitutional amendment acts gavethe rural and urban governments aconstitutional status, empowered therural self governments andestablished an effective decentralizedgovernment structure at the levelbelow the state government.
3. Local Government in Pakistan wasaccorded constitutional protectionunder the 17th amendment in 2000.The local government ordinances(LGOs) were promulgated by theprovinces under the 6th Schedule.Conferment of constitutional statusto local governments in Pakistan hasa few features, such as, (a) no taxhas been considered for reform ordevolution, (b) local governmentfunctions and finance have only beende-concentrated in Pakistan, but notdeveloped, and (c) devolution underfederal direction has fur therweakened its provincial layer.In India, the 73rd and 74thamendments for panchayats andmunicipalities were passed in 1991and became effective in 1993, whichconferred the right of existence andtimely elections of the local bodies,reservation of seats and 33 per centreservation to women, creation ofindependent state election andfinance commissions, specifying ofthree levels of panchayats andestablishment of two planningcommittees for district andmetropolitan areas.
4. Local councils in Pakistan havepowers to levy certain taxes; theymay increase, reduce, suspend,abolish or exempt the levy of any taxkeep in mind public objectives.In India, municipal taxation powerscomprise: property taxes,entertainment tax, professions tax,advertisement tax, a miscellany oftaxes, e.g., toll taxes and nonmotorized vehicles, etc. Panchayatsenjoy similar power of taxationexcept advertisement tax; insteadthey are authorized to levy a cess onland revenue assessment.
5. In Pakistan a Provincial FinanceCommission (PFC) has beenestablished in 2002 by each province.The PFC is to recommend distributionof allocable funds according to aformula to the district, tehsil andunion councils.In India, there is a two layered
system of fiscal transfer to the local bodies,one by the Finance Commission thatpasses through states and other, grantsfrom the states out of their tax revenuesor from specific taxes.
Conclusion
Concept of decentralisation haschanged rapidly over the last quarter ofthe last century with increasing processof democratisation of governments. Since,the 1980s increasing international trade andinvestment; growing economic, social andpolitical interaction across nationalborders; and rapidly emergingtechnological innovations have changed the
Decentralization Process in India and Pakistan: A Comparative Study 23
perceptions of governance and the roleof the state.
An evolutionary study of the processof decentralisation in India shows thatfrom the very beginning, India startedadopting policies to make the governmentdecentralized. India has always witnesseda strong, stable and vibrant governmentand administrative system. Under thefederal system of India, the Constitutionis regarded as the supreme law the of land.Article 40 of the Indian Constitution hasalready made a reference of Panchayatas unit of local self-government at the timeof inception of the constitution. However,Panchayati Raj system as a product ofdemocratic decentralisation has been amuch later phenomenon in the history oflocal government in India. It was anoffshoot of constitutional developmentprogramme during the later half of the1950s. Panchayati Raj Institutions as unitsof local self government in India areexpected to perform a dual role.Panchayati Raj has been viewed first andforemost as an extension of democracybelow the state level. Secondly, it isregarded as a tool and instrument for theimplementation of developmentprogrammes at the grassroots level in ruralIndia. The 73rd Constitutional AmendmentAct 1992 endowed Panchayati Raj withconstitutional status.This decentralisedPanchayati Raj system has been able toensure service delivery, accountability,social justice and financial assistance atthe grassroots level. The process ofdecentralisation has also encouragedpeople’s participation in the political
process at the local level. It has also raisedthe position of women in political andadministrative participation by making33 per cent reservation.
On the other hand, in Pakistan themajor challenge has been instability of thegovernment resulting in frequent changesin the constitutional set-up. Democracy isnot a permanent feature in Pakistanbecause of constant disruption by militarydictatorship. Since inception, Pakistan hasalways focused on various policies to builda powerful local government. Despite thecontinuous efforts of making a self-sufficient government structure at the locallevel, constitutionally Pakistan is still a twolevel federal state. With the absence of3rd level of local government, local peopleare not able to participate in thegovernmental process. It was said thatlocal government ordinance 2001 wasprepared by the federal government buteach province was directed to notify it asits own law but from the very begining,the military regime has carefully controlledthe pace and direction of devolution. Theseventeenth constitutional amendmentprovided limited protection to the localgovernments for a period of only six yearswith provision for change within thisperiod. On the other hand, devolutioninvolved transfer of provincial powers andresponsibilities to the lower level ofgovernments but no decentralization of anyfederal power to either the provincial orlocal level. Another key problem with thedevolution scheme is the lack of checksand balances between and across thevarious levels of district government.There is a virtual absence of accountability
24 Local Government Quarterly July - September 2015
at the district level. The shortage of fundsbecame a barrier in obtaining servicedelivery at the grass roots level. There waslack of financial assistance to the localunits; as a result the local government wasunable to implement the policies properly.The tendency shows that localgovernments have been created by non-representative regimes to legitimize theircontrol over the state. Legitimacy has beensought by creating a localized patronagestructure. In Pakistan the military’s needfor legitimization of state control appearsto be a prime reason behind the recurringattempts at local-government reforms. Itis also important to note that all militarygovernments, including the current regime,have required local-government electionsto be held on a non-party basis. Suchelections have invariably ended upweakening political linkages betweenelected provincial governments and localgovernments. Thus, each elected federalgovernment that has followed the militaryregimes that introduced local governmentshas at best ignored these localgovernments and often suspended themaltogether. In the case of Pakistan themilitary junta, which dominated the nationalpower during most of the Republic’shistory, favoured a decentralized systemwhich was to operate concurrently withcentrally planned and implementedgovernment programmes and was to servefor rural development. Local governmentsat the district and village levels areenjoying the elected status during periodsof military rule. But, with limited powerand resources, they have played only amarginal role in rural development.
The most interesting part in case ofPakistan is that the decentralisationpolicies or local government reforms areintroduced not during the democraticregimes but when the military governmentsare in power to ensure their legitimacy atthe local level. But, democratically electedgovernments failed to make local levelgovernments strong. Due to lack of theneed for legitimacy, the democraticregimes always focused on the federalstructure till state level, which underminedthe invisibility of the local level democraticdecentralisation.
It has been seen that whenever thereis any sort of political or economic turmoilin the domestic polity, the mechanismsgoverning the grass roots governmentalstructure fail to perform as desired.Rather, they simply ignore the power ofthe central government or turn into puppetsof local chiefs especially in a semi-feudalsetup like that of India as well Pakistan,where the essence of democracy remainsan alien concept. That is why, incomparison to that of India, which has morestable democratic structure, Pakistan, evenwith all the good intentions of theirrespective leaderships has failed to initiatethe proper process of decentralisation asintended. Only with a proper and stabledemocratic mechanism in the centre cana stable democratic, transparent andaccountable federal polity withdecentralised governing mechanisms beestablished in the true sense.
References
1. Austin, G. (1999). Working ademocratic constitutions: a history
Decentralization Process in India and Pakistan: A Comparative Study 25
of the Indian experience. NewDelhi: Oxford University Press.
2. Azis, Abdul, and David A. Arnold.(1996). Decentralized governancein Asian countries. New Delhi:Sage Publications.
3. Pakistan Academy for VillageDevelopment (1959). BasicDemocratic Manual. (Vol. I).Comilla : Pakistan Academy forVillage Development.
4. Blair, H. (2000). Participation andaccountability at the periphery:democratic local governance in sixcountries. World Development .Vol.28, (1).
5. Boesche, Rojer. (1987). The strangeliberalism of alex de Tocqueville.Ithaka: Cornell University Press.
6. Cheema, G. Shabbier, and RodinelliDennis A. (1983). Decentralizationand development policyimpleamension in developingcountries. London: Sage Publications.
7. Crook, Richard C. and Alan SturlaSverrisson. (2001). Decentralisationand poverty-alleviation in developingcountries: a comparative analysis or,is West Bengal unique (IDS WorkingPaper No. 130). Brighton: Instituteof Development Studies.
8. Crook, Richard C., and ManorJames. (1998). Democracy anddecentralization in South Asia andWest Africa. Cambridge: CambridgeUniversity Press.
9 Hicks, U. K. (1961). Developmentfrom the below: local government
and f inance in the developingcountries. West Heartford:Clearendon Press.
10. Manor, J. (1999). Political economicdemocratic decentralization.Washington D.C. : World Bank.
11. Musgrave, R. A. (1983). Who saidtax where, and what? In C.EMcLaren (Ed.), Tax assignment infederal countries . Centre forresearch on federal financial relation.
12. Oates, W. (1972). Fiscal federalism.New York: Harcourt Brace.
13. Ostrom, E., Schroeder, L. andWynne, S. (1993). InstitutionalIncentives and SustainableD eve l o pm en t : In f r a s t r u c tu rePolicies in Perspective. Oxford:Westview Press.
14. Palmer, N. D. (1960). The Indianpolitical system. Boston: Houghtonhifflin company.
15 Parker, A. and Serrano.( 2000).Promoting good governancethrough social funds anddecentralizations. Social Protection.(Discussion paper series no. 0022).Washington DC: World Bank.
16. Parker, Andrew. (1995).Decentralization the way forwardfor rural development . (Policyresearch working paper no 1475).Washington D.C. : World Bank.
17. Passeron, J . C., ‘Histoire etsociologie-Identite sociale et identitelogique d’une discipline’, In J. C.Passeron (Ed.), Le raisonnement
26 Local Government Quarterly July - September 2015
sociologique-L’espace non-popperien du raisonnementnatural. Paris: Nathan, 1991, pp. 57-88.
18. Rehman, A. T. R. (1968). Ruralinstitutions in India and Pakistan.Asian Survey. Vol.8, (9).
19. Rondenelli et al. (1989). Analyzingdecentralization policies in developingcountries: a political economicframework. Development andChange. Vol. 20.
20. Rondinelli, Dennis A. (1981).Government decentralization aimcomparative perspective: theory and
practice in developing countries.International Review ofAdministrative Sciences . Vol.xlvii,(2).
21. Smith, B. C. (1985). Decentralization:the territorial dimension of thestate. London: George Allen andUnwin.
22. UNDP, Decentralised GovernanceProgramme (1997, September).Strengthening Capacity forPeople-centred Development,Management Development andGovernance Division, Bureau forDevelopment Policy.
An InvitationThe Local Government Quarterly invites contributions in the form of articles andresearch papers from its readers and well wishers.
Contributions may be sent in the manuscript form though we would prefer to have adigital copy e-mailed to us.
Articles should normally be between 3000 and 4000 words, though we do not wish tolimit the size.
Contributors may mail their articles to the Chief Editor, Local Government Quarterly.
All India Institute of Local Self - GovernmentM. N. Roy Human Development Campus, Plot No. 6,‘F’ Block,
TPS Road No. 12, Bandra (East), Mumbai - 400 051, India.Tel : 0091-22-2657 17 13 / 2657 17 14 / 2657 17 15
Email : [email protected] : 0091-22-2657 21 15
Cities and the Aged: Grey Clouds Over Mankind 27
Ageing World
One of the key demographichighlights of the twentieth century was theglobal ‘population ageing’. This is a“process by which older individualsbecome a proportionately larger share ofthe total population” (UN, 2001).Recognizing this demographicphenomenon, the United Nationsdesignated 1999 as ‘The Year of the OlderPerson’. This quite clearly was not therevelation of fresh information –demographers over the past severaldecades had laboured to establish this andwere already cautioning that the world wasentering a phase of an unprecedented rateof ageing. There was, however, no reasonfor complete despondency on thisaccount. There were voices around theworld that discovered a silver lining.“Population aging represents, in one sense,a human success story; societies nowhave the luxury of aging.” (U.S. CensusBureau, An Aging World: 2001,International Population Reports, Page 1).Indeed, disease and pestilence in precedingcenturies had killed in such vast numbers
Cities and the Aged: Grey Clouds Over Mankind
Ramanath Jha
and at such speed that large portions ofhumankind found themselves felled inyouth and immaturity, never to savour thefruits of hard work in their old age.
Such demographic trend was fuelledby a decrease in fertility and mortality rateson the one hand and an increase in lifeexpectancy on the other. “Initiallyexperienced by the more developedcountries, the process has recentlybecome apparent in much of thedeveloping world as well. For the nearfuture, virtually all countries will facepopulation ageing, although at varyinglevels of intensity and in different timeframes.”(UN, 2001)
Global knowledge on the ageing ofpopulation collected at the beginning of thecentury has been further updated. Recentdata reveals that the global share of olderpeople (aged 60 years or over) increasedfrom 8 per cent in 1950 to 9.2 per cent in1990 and 12 per cent in 2013. This trendis predicted to continue and the old willreach 21 per cent as a proportion of theworld population by 2050 (UN, 2013).Translated into numbers, the number of
28 Local Government Quarterly July - September 2015
older persons (aged 60 years or over) isexpected to more than double, from 841million people in 2013 to more than 2 billionin 2050. Older persons are projected toexceed the number of children for the firsttime in 2047.
The developing countries themselveswill not escape the process of nationalageing. The current phase of growth inthese countries is witnessing largerdemographic expansion, and therefore thebirth of a large number of children. Butwithin five decades, “just over 80 per centof the world’s older people will be living indeveloping countries compared with 60per cent in 2005". (Global Age-friendlyCities: A Guide, World HealthOrganization, 2007, Page 3).
This is also confirmed by UN studies.Presently, about two thirds of the world’solder persons live in developing countries.Because the older population in lessdeveloped regions is growing faster thanin the more developed regions, theprojections show that older persons willbe increasingly concentrated in the lessdeveloped regions of the world. By 2050,nearly 8 in 10 of the world’s olderpopulation will live in the less developedregions.”(World Population Ageing, 2013,Ex. Summary, Pg xii). What needs to befurther added is that this rising populationof the old in the developing world wouldbe on account of the twin factors of verylarge populations in the less developedregions and dwindling populations in thedeveloped world. While in absolutenumbers, the developing world will houseproportionately huge numbers of the aged,
as an internal country percentage, thedeveloped countries would be much, mucholder.
In view of the enormous gains madeby human kind in longevity, it is evidentthat the old demographically will constitutesegmented decadal groups and at variousstages of vitality. As the UN Report states,“The older population is itself ageing.Globally, the share of older persons aged80 years or over (the “oldest old”) withinthe older population was 14 per cent in2013 and is projected to reach 19 per centin 2050. If this projection is realized, therewill be 392 million persons aged 80 yearsor over by 2050, more than three timesthe present.” (World Population Ageing,2013, Ex. Summary, Pg xiii)
Ageing Women
Women have proved that theirphysique, despite being second in brutemuscular strength, can rough out vagariesof life more successfully than men andsurvive longer. As a consequence, theolder population is predominantly female.‘’Because women tend to live longer thanmen, older women outnumber older menalmost everywhere. In 2013, globally, therewere 85 men per 100 women in the agegroup 60 years or over and 61 men per100 women in the age group 80 years orover. These sex ratios are expected toincrease moderately during the nextseveral decades, reflecting a slightly fasterprojected improvement in old-agemortality among males than amongfemales.” (World Population Ageing, 2013,Ex. Summary, Pg xiii). A fur ther
Cities and the Aged: Grey Clouds Over Mankind 29
classification shows that while globally asa composite average 11.7 per centpopulation is above 60, 8 per cent above65 and 1.7 per cent above 80, the figuresfor women are slightly higher. 12.8 percent, 8.9 per cent and 2.1 per cent of thoseabove 60, 65 and 80 respectively arewomen.
Countries and the Aged
Japan leads the geriatric percentagein the world with 33 per cent of itspopulation above 60. Germany (28 percent), Italy (27 per cent) and a host ofother European nations follow at the top.Among other countries with largepopulations, the United States of Americahas 20 per cent population above 60, Chinastands at 14 per cent and India at 9 per centof their populations above 60. (Annex 1)
European countries seem to be moretightly in the greying grip. It is predictedthat the median age in Europe will increasefrom 37.7 years in 2003 to 52.3 years in2050 (Brookings Institution Think Tank).The European Commission believes thatby 2025 more than 20 per cent of theEuropeans will be 65 or over and moreworrisome will be the rapid increase inthe very old group of 80 and above. Infact, as cited above, Germany, Italy andGreece are already over 20 per cent;Bulgaria, Finland, Latvia, Portugal andSweden are hovering around that markand Austria, Belgium, Croatia, Denmark,Estonia, France and Spain are only a percent behind. With the exception of Japan,European countries top the chart listingthe highest percentages of aged population.
As a whole, therefore, European countriesare far ahead of the world average. (TheUnited Nations, DESA, PopulationDivision’s World Population Prospects,2012 Revision).
Asia, as a region, has the largesthuman population. Many of the Asiancountries rode their demographic dividendto achieve remarkable economic growth.The ADB Report ‘Asian DevelopmentOutlook 2011 Update’ reveals rapidlyshifting demographics in Asia. “Asia’spopulation is aging at a speedunprecedented in human history,” saidChangyong Rhee, ADB’s ChiefEconomist upon the launch of the Report.Asia’s elderly population is projected toreach 922.7 million by the middle of thiscentury. As a result, Asia, as a region, inthe next few decades will become hometo the largest number of old in the world.
In our presentation of demographicdata, it would be interesting to presentcomparative scenarios in China and India.For one, they are the most populouscountries in the world, and additionally,they are destined to play momentous roleson the global scene.
Aged in China
China, the most peopled country, isquite rapidly getting older. In the mid 80s,China had only 5 per cent of its populationover 65 years. But with its advocacy of‘later, longer, fewer’ lifestyle and a onechild policy, the proportion has now risento 9 per cent or a total of 123 million. Areport released by a government think tankforecasts that China will become the
30 Local Government Quarterly July - September 2015
world’s most aged society in 2030. Tomake it worse, by 2050, China’s olderpopulation will likely swell to 330 million,or a quarter of its total population. In otherwords, out of every hundred people agedbetween twenty and sixty-four, there willbe 45 persons over 65 compared withabout 15 today. That is a staggeringnumber.
“Rapid aging in China has beendriven by three distinctive developments.First, robust economic growth over the pastdecades has been associated withincreased average life expectancy inChina—from 68 in 1981 to 74 today.Second, the generation of baby boomers(those Chinese born in the 1950s and1960s) has started to join the olderpopulation. Third, the draconian populationcontrol policy, introduced in the early1980s, resulted in an extremely low fertilityrate, further increasing the proportion ofthe older population.”(Huang, 2013)
Aged in India
India itself will not have the completeluxury of deriving comfort from being oneof the youngest nations on the globe. TheNational Policy on Older Persons, 1999recognizes that ‘Demographic ageing, aglobal phenomenon has hit Indian shoresas well’. It further adds that lifeexpectancy ‘at birth for males has showna steady rise from 42 years in 1951-60 to58 years in 1986-90’ and ‘is projected tobe 67 years in 2011-16.’ Further, infemales, ‘the increase in expectation oflife has been higher - about 11 years duringthe same period, from 58 years in 1986-
90 to 69 years in 2011-16’ (Para 1, Policy1999).The Policy further adds that the‘percentage of persons 60+ in the totalpopulation has seen a steady rise from5.1 per cent in 1901 to 6.8 per cent in 1991.It is expected to reach 8.9 per cent in2016. Projections beyond 2016 made byUnited Nations (1996 Revision) hasindicated that 21 per cent of the Indianpopulation will be 60+by 2050’.It also statesthat ‘in a twenty five year period starting1991 the population 60+ will nearly doubleitself.’ (Para 3, Policy 1999). In terms ofnumbers, whereas the country had only19 million people above 60 years in 1947,this number grew to 100 million in 2001and is expected to be 150 million by 2020.According to another Report essayed bythe Technical Group on PopulationProjections, constituted by the NationalCommission on Population in May 2006,senior citizens in India will constitute 12.40per cent of the population by 2026. In afurther recent report released by theUnited Nations Population Fund and HelpAge India, the number of the old isexpected to grow to 173 million by 2026.
Consequences of the World Ageingand Urbanizing
All such demographic movement isgetting the world trapped in a strangesituation. On the one hand, the characterof human settlements is turningpredominantly urban. This has alreadyhappened in the more developed parts ofthe world and the developing countries aremarching on the same path of urbanization.On the other hand, human populations over
Cities and the Aged: Grey Clouds Over Mankind 31
the world are ageing. With urbanization,quite naturally, most of the old will live incities. And a very large number will live inthe mega cities. Such cities are appearingin larger numbers in the developing world.The oddity in the situation is that whileeconomic development over a largenumber of countries has added to theability of people to eat and live well, thefact that they will live in cities does notinspire confidence about the well-being ofthe old. Cities appear to be unkind to theold, and the mega cities seem to be evenless kind. Thus, while on the one hand,fruits of greater prosperity and betterpublic health have given human beingslonger lives, cities do not seem to providethe environment in which they can live happily.
Aged in Megacities
Many megacities around the worldwill have to contend with high percentagesof senior citizens. Since, Japan has abriskly ageing population on the one handand a declining population on the other,Tokyo will lose population over the yearsand will have a very high percentage ofthe old. A study group constituted by theTokyo Metropolitan Government went farinto the future and estimated that Tokyofrom a peak of 13.35 million people in 2020will house only 7.13 million in 2100 out ofwhich 3.27 million or about 46 per centwould have crossed the age of 65. (TheTelegraph, Sep 2012). New York City willalso experience severe greying as theirover 65 population standing at 938,000 in2000 will be 1.35 million or 44.2 per centin 2030. (New York City PopulationProjections by Age/sex & Borough, 2000-
2030, Department of City Planning, Page7, Dec 2006). Similarly, the elderlypopulation in London is expected to growrapidly. The Census 2011 revealed that thepercentage of the population aged 65 andover in England and Wales was the highestseen in any census at 16.4 per cent, thatis one in six people in the population. InLondon, those over 65 would in alllikelihood reach 1.85 million by 2029,almost double of what they have today.The over-90s population is expected todouble to 91,000. Given the facts ofsimultaneous urbanization and ageing,Shanghai, Beijing, Mumbai, Delhi, Dhaka,Karachi, Lahore, Manila, Bangkok, Seoul,Jakarta, Mexico City, Sao Paulo and Riode Janeiro and scores of other megacitieswill be home to massive numbers of seniorcitizens.
Rural vs Urban for the Old
In view of the hustle and bustle ofmegacities, their pace, cost and distancesand the relentless fight for survival - allseem to point towards more serene andpeaceful surroundings for the lives of theold, probably the villages, where retiredlife can be led in the lap of nature and farfrom the urban noise and din. Some datareveal that this is actually the reality.‘Despite the increasingly urban nature oftoday’s elderly populations, rural areasremain disproportionately elderly in amajority of countries. In most nations, thisis primarily the result of the migration ofyoung adults to urban areas, and to someextent of return migration of older adultsfrom urban areas back to rural homes.Data for 39 countries from the period 1989
32 Local Government Quarterly July - September 2015
to1997 show that the per cent of all elderlyliving in rural areas was higher than theper cent of total population in rural areasin 27 of the 39 nations’ surveyed. (U.S.Census Bureau, An Aging World: 2001,International Population Reports, Page 50)
Many old people, however, have lefttheir rural environment, seeking the densityof large cities for their variety of leisureactivities, rich cultural life, better accessto employment and anonymity, though ata cost. Clearly, many inhabitants of largemetropolitan areas do very well both interms of health and life quality as theybenefit from better infrastructure, and amore dense system of social, health care,cultural and educational options.
These facts have led many thinkersto believe that as people grow old and arenot able to fend for themselves, it makessense to live closer to amenities and in ahigher density of people. The thindistribution of the elderly over a large landmass requires social care and medical careto be reached over and across a large area,as would happen if they live in villages.That does not make these services costeffective and time effective. Hence foran ageing society, cities appear to be thebest option. To this, there is the addedconcern about their safety and security.Their vulnerability is extreme wherepeople are not around in theneighbourhoods, policing is scarce and theyhave little personal ability to protectthemselves.
Theoretically, there is merit in theabove argument. However, empiricalevidence shows that cities, very largely,are not designed for the aged. Neither is
it in their nature to be crafted for this. Aconscious effort, would, therefore, haveto be made, to see that cities temper theirdrive for efficiency and productivity tostrive, through inclusive strategies, toprovide for children, women and the old.This is possible, as many small andmedium sized cities in Europe and thedeveloped world have proven. The qualityof life surveys carried out globally haveshown this year after year. However, fromthe current evidence in the developingnations, this looks highly unlikely. And ifmega cities are the urban trend where themajority of people and elders would live,inclusive strategies are going to be eventougher to implement.
Current Situation
A few examples may cogentlyillustrate the prevailing urban state ofaffairs. Hong Kong, a global mega city,has one of the world’s highest lifeexpectancies of 82.5 years. It has aswanky international airport with worldbeating services and a top transportsystem that reaches people from theairport into the city in less than half anhour. One of the finest mass transitsystems carries an average of four millionpassengers per day. Its GDP stands atUSD 32,000 per annum. However, belowthe glitter are low-income groups that earnless than what they earned a decade ago.Part of the poor population is packed intocage homes or cubicle flats. “For theelderly, their limited mobility causes a lackof a firm social and family supportnetwork. As a result, they become isolatedand cut off from the community. Some
Cities and the Aged: Grey Clouds Over Mankind 33
had been relocated from the older districtsin Kowloon and Hong Kong Island,breaking social networks. These olderpeople feel disconnected from a newsystem yet to be established. With HongKong’s increasingly greying population anda dependency ratio of 334 per 1,000 ofthe working population (aged 15 to 64)that’s expected to increase rapidly in thenext decade, the number of suicidesamong the elderly is a growing problem.”(Yip, 2011)
Indian Cities
In India, in a survey carried out byHelp Age India, a non-governmentalorganisation, Bengaluru emerged as oneof the least age-friendly cities in thecountry from among 20 cities surveyed.While Bhopal emerged as the mostunfriendly city for elders, Bengaluru cameseventh after cities such as Guwahati,Lucknow and Ahmedabad. By being laston the list of 20 surveyed cities, Jaipuremerged the best city for the elderly tolive in. The survey was conducted in Delhi,Mumbai, Kolkata, Bengaluru, Hyderabad,Guwahati, Patna, Chandigarh, Panaji,Ahmedabad, Shimla, Jammu, Kochi,Bhopal, Bhubaneswar, Puducherry, Jaipur,Chennai, Dehradun and Lucknow. Thereport says that at least 37.14 per cent ofthe elderly population in Bengaluru arevictims of abuse. In Bhopal, 77.12 per centof the elderly people are subjected toabuse. Guwahati comes next with 60.55per cent and Lucknow in the third positionwith 52 per cent. (Help Age India, 2014)
In another recent survey by HelpAge International, India was ranked 71among 96 countries based on the socialand economic wellbeing of older people.(Help Age International, 2015)
Law and the Aged in India
It would be apposite to note thatArticle 41 of the Constitution of Indiamandates that the State shall, within thelimits of its economic capacity anddevelopment, make effective provision forsecuring the right of public assistance incases of old age. In pursuance of thisdirective, in 1999, Ministry of Social Justiceand Empowerment, Government of India,came out with a National Policy on OlderPersons. The Policy noted that adoptionof small family norms, education of thegirl child and rising readiness to acceptemployment by women was putting theold at a greater disadvantage since thiswas resulting in fewer care givers. In thecircumstance, the Policy visualizes that theState will extend support for financialsecurity, health care, shelter, welfare andother needs of older persons, provideprotection against abuse and exploitation,make available opportunities fordevelopment of the potential of olderpersons, seek their participation, andprovide services so that they can improvethe quality of their lives.
A further step was taken for the agedin 2007, when the Indian Parliamentlegislated the ‘Maintenance and Welfareof Parents and Senior Citizens Act, 2007’.This was with a view to provide moreeffective provision for maintenance and
34 Local Government Quarterly July - September 2015
welfare of parents and senior citizens. ThisAct makes it a legal obligation for childrenand heirs to provide maintenance to theirold parents by setting aside a monthlyallowance.
An old parent who is unable able tomaintain himself out of his own earning orout of the property owned by him, is entitledto get relief under this Act. Children/grandchildren are under obligation tomaintain their parents/grandparents. Incase of failure to do so, the parents canseek the assistance of the Tribunalconstituted under this Act, to enforce theremedy of maintenance. Failure to obeythe orders of the Tribunal may result inimprisonment till such time maintenancemoney is paid up.The maximum amountof maintenance that can be allowed bythe Tribunal is Rs. ten thousand per month.
If a senior citizen has transferred hisproperty, either moveable or immovable,by way of gift or otherwise, subject to thecondition that the transferee shall providehim basic amenities and physical needsand thereafter such transferee refuses orfails to provide such amenities, suchtransfer of property shall be deemed tohave been made by fraud, coercion orundue influence and the Tribunal candeclare such transfer as void.
Also, abandoning a senior citizen inany place by a person who is having thecare or protection of such senior citizen isa criminal offence and such person shallbe punishable with imprisonment for aterm which may extend to three monthsor fine which may extend to five thousandrupees or both. This Act also provides
simple, speedy and inexpensivemechanism for the protection of life andproperty of the older persons. This Actexhorts state governments to establish oldage homes - at least one in one district toaccommodate indigent senior citizens.State governments may also ensure propermedical care for senior citizens. However,there is no obligation cast on the stategovernment to establish old age homes.
In a recent judgment, the BombayHigh Court asked the state governmentto adopt the public-private partnershipmodel and rope in big corporate houses toestablish old-age homes for almost 75 lakhsenior citizens in the state. The Court saidit was the State’s responsibility to runhomes for the aged and not the NGOs.Mission Justice, a non-profit organisationhad filed a public interest litigation (PIL),seeking directions be given to the Stateand Centre on implementing differentaspects of the Maintenance and Welfareof Parents and Senior Citizens Act,2007.The HC has directed the state toconduct a survey of all old-age homes inthe city and also to consider building newones. (The Indian Express, 2015)
Cities and Inclusiveness
The question, however, we are tryingto tackle here is not about theresponsibilities of kin, the higher echelonsof Government and a host of institutionsthat could be engaged in addressing thematter. It is essentially about cities wherethe majority of the old will spend the lastleg of their lives. While even ‘the bestvitality cannot excel decay’, the question
Cities and the Aged: Grey Clouds Over Mankind 35
is how can this be mitigated, whether citiesare designed to do this, and if not, whetherthey can be customized to make lives ofelders more comfortable, convenient andhappier. There is indeed a conflict ofobjectives. As argued earlier, cities by theirnature are economies that look forefficiency, speed and resultantproductivity. The needs of the oldoftentimes will not gel with such pursuits.However, the old have spent theirproductive lives and made theircontributions in the past. Now they needthe city to pay back and not leave themnaked in their years. If the cities were todo this, they would need to modifythemselves for the sake of the old, andgive up part of their productivity drive tolook after the old.
It is agreed that cities are abode todifferent demographic age groups, culturalgroups and economic groups and cityinclusiveness would have to be cateringto all their different needs.Demographically, this would includechildren, the young, and the old. At thesame time cities ought to be gender-friendly, business friendly, culture-friendlyand so on. City authorities may contendthat such inclusiveness may not alwaysbe possible. In such a situation, cities willhave to take a call on priorities and overallcity sustainability. However, it is clear thatif more than one-fourth of any city’spopulation is in the category of the aged,surely the group is too large to be ignored.
Old Age and Role Change
Women and men undergo a radicalchange of role in their old age. This in itself,
in many cases, could be traumatic. Tillnow, they went to a full time job, travelledto places, brought up a family, spent moneyand time on the education and settlementof their children, bought a home, car andmade such purchases for quality living thattheir purse allowed. Then things changed.The job came to an end; children gotsettled and went their own way. Climbingstairs became uncomfortable, and thelargeness of their houses began to hurt asthere were too many rooms to clean. Theybegan to prefer living in smallerapar tments. Driving a car was nopleasure, and the body began to pain inareas hitherto robust. And instead of theworkout in the gymnasium, frailties of thebody needed them to visit the doctor andseek medical attention. In the case of thepoor, the frailties of body and the inabilityto work and earn have far graverconsequences.
Infirmities of the Old
Quite clearly, age begins to make onephysically infirm and faculties of hearing,seeing and moving slow. In all kinds ofsettlements, the old could be visited byfailing health, isolation, neglect, boredom,abuse and fear. Old age is a stage of lossof vitality and the onset of decay. TheWHO study cited above emphaticallyestablishes that the old like a pleasant andclean environment, gardens, green andopen spaces, safety and security and safepedestrian crossings. They need to visittoilets frequently, cross roads slowly, andget into buses easily. They do not earnany longer or have incomes much less than
36 Local Government Quarterly July - September 2015
earlier and would therefore like a stableeconomy and no inflation that would eatinto their savings by continuously pushingup costs. They would like to read bookswith large letters, television programmeswith little violence and medical care of awide variety as different members of theelder group develop different infirmities.Outside on the roads and public places,they need resting and sitting places as theyquickly tire. The old definitely dislike noise,darkness, undulating and pot-holedfootpaths, traffic and climbing up steepsteps.
Urban living is promoting living insmall families or single households. In themidst of such living are the old. As the oldlive in loneliness, they also get increasinglystressed. ‘Stress is the unspecificphysiological and psychological reactionto perceived threats to our physical,psychological or social integrity’ (MazdaAdli, 2011). And urban living can bethreatening if one is constrained for space,if there is the experience of insufficientsecurity or unstable economic conditions.Stress increases with the anticipation ofadverse situations and the fear of nothaving the adequate resources to respondto them. From an evolutionary point ofview, stress is the mechanism thatprepares us for any ‘fight-or-flight’reaction, and also causes us to evolve inorder to better adapt to our environment.Although not harmful per se, stress mayjeopardise our health when stress exposureis chronic or when complete recovery isnot possible.
Beard and Petitot point out that ‘Boththe “differential vulnerability” hypothesisand social stress theory posit thatdisadvantaged neighbourhoods caninfluence health by directly increasing thelikelihood of experiencing personal stressevents such as trauma or unemployment.Physical conditions such as urban decay,physical disorder, and high levels of crimemay generate more chronic levels ofstress and fear.’ (Ageing and Urbanization,Page 429)
Living in an urban environment is longknown to be a risk factor for psychiatricdiseases such as major depression orschizophrenia. This is true even thoughinfrastructure, socio-economic conditions,nutrition and health care services areclearly better in cities than in rural areas.Higher stress exposure and higher stressvulnerability seem to play a crucial role.Social stress may be the most importantfactor for the increased risk of mentaldisorders in urban areas. It may beexperienced as social evaluative threat, oras chronic social stress, both of which arelikely to occur as a direct consequence ofhigh population densities in cities. As forthe impact on mental health, social stressseems to outweigh other urban stressorssuch as pollution or noise. Living incrowded areas is associated withincreased social stress, since theenvironment becomes less controllable forthe individual. Social disparities alsobecome much more prominent in cities andcan impose stress on the individual. Arecent meta-analysis showed that urbandwellers have a 20 per cent higher risk of
Cities and the Aged: Grey Clouds Over Mankind 37
developing anxiety disorders, and a 40 percent higher risk of developing mooddisorders. The World Health Organizationhas highlighted stress as one of the majorhealth challenges of the twenty-firstcentury. Urban living is quickly developingas a major contributor to this. Clearly, forthe old living in cities, these stress factorswould be larger and deadlier.
Old Women
The situation is even more difficultfor aging women. Unfortunately,established and adverse socio-economicarchetypes hurt them the most at this age.And it gets worse, as aging figures thatwe have cited reveal that women tend tolive longer than men and therefore, havelonger older lives. Gender relationsstructure the entire life cycle, from birthto old age, influencing access to resourcesand opportunities and shaping life choicesat every stage. Good health, economic andsocial security and adequate housing areessential requirements of aging withdignity, but older women in both developedand developing countries face difficultiesin accessing these on a basis of equalitywith men. Their rights are often violated.Many older women face neglect as theyare considered no longer economically orreproductively useful, and are seen asburdens on their families. In addition,widowhood, divorce, lack of care-giversfor older women, post-menopausaldifficulties and absence of geriatricmedicine and health care are other groundsof discrimination that prohibit olderwomen from enjoying their human rights.
It often results in unfair resourceallocation, maltreatment, abuse, gender-based violence and prevention of accessto basic services. Their ownership of, oraccess to, land may be restricted due todiscriminatory inheritance laws andpractices. Thus, they would need todepend on the family or the state forfinancial support and living arrangements.
Most of them live in the shadow ofthe males throughout their lives – father,husband, son or male relatives like nephew,brother, uncle. In most of the cases theydo not earn money and even when theydo, their employment is often guided byfamily considerations. Moreover, theirearnings are managed by the malecounterpart. Most of the women do notown property and even when they own itthey do not manage it. They arecompletely dependent on the malemembers of the family for fulfilment of alltheir basic needs. Besides aging, womenface specific health problems. They areprone to arthritis, osteoporosis andhypertension, cervical and breast cancer,anaemia, and most of all depression. Therich educated women may be self-sufficient but could be facing problems ofemotional insecurity and physicalvulnerability. Even these women are oftensubject to threats of crime and fraud bytheir own relatives or children.
Analysis of Cities
An analysis of cities would showmajor deficits from the point of view ofthe needs of the aged. Most outdoorspaces are not designed to suit the older
38 Local Government Quarterly July - September 2015
population. Stairs, lighting, signage are notparticularly age-friendly. The walkingenvironment is poor and many timesdangerous. Public facilities are difficult toaccess. Public transportation is crowded,unreliable and mostly absent in many citiesof the developing world. Citizens in anycase place higher reliance on semi-publicor private transport. Housing is largelyunaffordable and not designed for the old.The employment market is not customizedand the old would find it extremely toughto penetrate the job market. Informationavailability is poor and many of the oldare not computer literate. High victim ratefrom information fraud has been observedin relation to the aged. Neither ismedication affordable.
In cities, as they are built today, theelders face more problems. Today, thehousing sector, in addition to problems ofaffordability, is not geared to factor in thepeculiar requirements of age. Cities havenot adopted land use, zoning and fiscalpolicies that encourage and support suchdevelopment that is specifically tailored tomeet the housing and health-care needsof seniors. Very few housing projects havebeen taken up that were planned after afull appreciation of the needs of the elders.City policies do not address urban locationconsiderations to ensure that the benefitsof city living for elderly residents and thecity as a whole are realized. In the currentscheme of things in urban housing,relatively few viable residential options forseniors exist within central cities or denselydeveloped urban areas near city centres.Most senior housing is located in low-density suburbs or in small towns, where
land is cheap and development costs arelower. At the same time, services forseniors in those areas are often dispersedand limited.
This situation recently prompted HelpAge India to write to the Prime Ministerstressing the need to create or design citiesfor aged and disabled persons, along withthe creation of smart cities. In aconference on “Universal Design andDevelopment” in Bengaluru, the MD ofHelp Age India remarked that “the majorityof the designers and architects weredesigning and creating projects keeping inmind the normal and affluent people ofthe society.” This quite clearly ignores theneeds of other demographic and socio-economic groups of the society.
One of the factors that complicatethe situation for the urban old is themounting population and building densities.Evidence reveals that as Indian citiesexpand, their densities rise. It is true thatthis article cited opinions that advisedhigher densities in which the old shouldlive. However, proponents of such densitiesclearly did not have the densities of Indiancities in mind. Quite evidently, highdensities in our cities have led to hightraffic density, less walkability and reducedopen spaces. Such high densities (20,000to 30,000 persons per sq. km) do notsupport living comfort for the old.
The Impact of Conducive UrbanEnvironment on the Old
Do conducive urban environmentspositively impact well-being? It appearsso as studies have begun to establish thatpositive urban environment assists positive
Cities and the Aged: Grey Clouds Over Mankind 39
health and the salubrity of the old can inseveral ways be extended until the lastyears of life in a wholesome physical andsocial environment that promotes theirproductive engagement in society. Theycan then be converted into valuable societalresource rather than be liabilities. Manyurban initiatives, therefore, that have beenput in place to make cities more supportiveof older people are on the right track andneed replication.
A positive residential environmentmay provide social resources that bufferthe impact of life stressors. Readilyaccessible and affordable nutritional foodcould make it easier for older people toeat a healthy diet. Physical characteristicssuch as trees and parks foster a sense ofwell-being and provide a recuperativeenvironment that supports resilience.‘Good street design, access to publictransport and diverse retail outlets mayencourage individuals to remain engagedwith their local community and maintainsupportive social networks. Such featuresmay also encourage walking and otherphysical activity, which may exertprotective effects by strengthening thephysiological systems of older adults andreducing functional limitation (e.g., fromosteoarthritis)’. (Ageing and Urbanization,Page 429)
Projects on these lines have beenattempted in urban environments. Theseinclude the City of Calgary’s ElderFriendly Community, the Valuing OlderPeople Partnership in Manchester in theUnited Kingdom, and the Canberra Plan,an Age-friendly City project in Australia.
These projects do suggest a generalcourse of action for cities in the contextof the old.
‘A number of approaches seemjustifiable. These include strategies tofoster the ongoing social engagement ofolder people through improving access tobuildings and public transport, improvingwalkability, creating destinations thatencourage older people to leave theirhomes, strengthening intergenerationallinks and developing innovative technologysuch as web-based networking andvideoconferencing. Other interventionsworth considering include reducing crimeand improving urban safety, improvinghousing design and strengtheningneighbourhood social resources. But theseare just a few examples of a diverse arraythat span both the physical and socialenvironments of an older person and thatmay be neighbourhood specific’. (Ageingand Urbanization: Can Cities be Designedto Foster Active Ageing? John R Beard& Charles Petitot, Public Health Reviews,Vol. 32, No 2, 427-450)
Moving Towards Solutions
The first fact that cities shouldappreciate is that their age profile willundergo change, and without exception,very soon, they will carry more and moreold people. And as conscientious cities theywill have to adopt policies that adequatelyanswer the needs of senior citizens. Inessence, this means that cities will allowsenior citizens to age actively. As theWHO puts it, ‘An age-friendly cityencourages active ageing by optimizing
40 Local Government Quarterly July - September 2015
opportunities for health, participation andsecurity’.
Given that old age is taken to beginat 60 and goes beyond till death, a highpercentage of the elders would have aremnant life span of a decade and areasonable percentage of people wouldlive beyond a decade. Echoing such aformulation, the National Policy on OldPersons 1999 of Government of Indiaclassified the old into decadal groups.‘Sixty three per cent of the population in1991 (36 million) is in the age group 60-69years, often referred to as ‘youngold’……while 11 per cent (6 million) is inthe age group 80 years and over i.e., inthe ‘very old’ category. In 2016, thepercentage in these age groups will bealmost the same, but the numbers areexpected to be 69 million and 11 millionrespectively. In other words, close to sixtenths of population 60-69 years can beexpected to be in reasonably good physicaland mental health, free of serious disabilityand capable of leading an active life. Aboutone third of the population 70-79 years canalso be expected to be fit for a reasonablyactive life. This is indicative of the hugereserve of human resource.’ (NationalPolicy on Old Persons 1999, Para 4)
The ideal situation would be that theelders continue to do such activities,normally and with ease, that their stage ofmental and physical fitness permits themto perform. Such a situation would allowa progressive reduction of work and worktypes and the gradual petering of activitiesand activity types commensurate with theirability. This would have several salubrious
impacts on the city. One, it wouldcommand a larger number of people inthe workforce adding to the man hours ofproductive work per day. This would addto the economic performance of the city.Second, it would allow a larger number ofcitizens to spend happier and morecomfortable lives, thereby adding to thehappiness quotient of a city. Third, it wouldbe in consonance with the societal respectthat is due to the elders.
This is possible if the city takes intoaccount the needs of the elders on the onehand and their vulnerabilities on the other.In all of its planning, infrastructure andactivities, the city decision-makers wouldhave to ask the question – does this factorin the requirements of the aged? Aquestion that could be raised here is howcustomized could cities be. Along with theold, there are many other constituents thatalso occupy the city and have their ownpeculiar needs. And some of these couldbe adversarial. For instance, the youngwant life that is fast, music that is modernand aspects that are boisterous. These runcounter to the needs of the aged.However, the ideal city, without ignoringthe needs of any group would try to arriveat the largest synergy possible and the bestprovisioning of needs of all that can beskilfully managed. Inclusive cities wouldhave to expand the definition of inclusivesince as human settlements they have themost diverse group of stakeholders andtheir interests have to be cared for over avery, very long period. Such inclusivenessis possible if cities exhibit the will and begindesigning themselves accordingly. It isnecessary for the built environment of a
Cities and the Aged: Grey Clouds Over Mankind 41
city to anticipate users with differentcapacities instead of designing for what itconsiders the average normal person. Anage-friendly city emphasizes enablementrather than disablement; it is friendly forall ages.
What Some Cities are doing
A number of cities in the developedworld have begun to devise programmesthat assist the aged. Since, they are locatedin countries already highly urbanized andwith large old populations, this is decidedlya rising concern in their context. However,it is apparent that they have not slept overthe issue but have moved with purpose tofind solutions. These provide a range ofservices to the old comprising deliveredmeals at home, domestic care such ashome cleaning, home maintenance suchas minor repairs, personal care such asshowering and dressing, respite care thatallows a break for the primary carer, socialsupport such as cultural and recreationalopportunities and transport services suchas to and fro travel to a doctor. These arefee-based services and are calibrated inaccordance with annual income.However, a common feature of suchprogrammes is that these are practised inselect city enclaves. These services maynot be through and across the city buttargeted to serve upper middle class areas.
Singapore has started an initiativecalled “a city for all ages”. In 2011, thecity carried out a survey in Marine Parade,one of the planning areas of the CentralRegion. More than 2500 residents aged60 and above in the area were surveyedin regard to their requirements. This was
aptly called a ‘hardware audit’ ofresidential units. This led to plans to retrofitmore than 500 flats that equipped themwith elder-friendly features. Theseincluded slip resistant tiles in bathroomsand wheelchair ramps. Outside on roads,steps were taken to eliminate potentialhazards for the old and longer ‘green man’time for traffic light crossings. (MakingSingapore a City for All Ages, Cover Storyby Denyse Yeo in Challenge: Approachingthe Public Service Differently, 07 Jan 2013)
In Canada, where the number ofaged people has been rising, the law-makers are devising new ways ofaddressing this problem. It is attemptingto make communities “age-friendly”. It isalso putting in place policies, services andstructures that enable the senior citizen to‘age actively’.
In view of many cities around theworld showing heightened concern aboutthe aged, a ‘WHO Global Network of Age-friendly Cities and Communities’ has beenestablished in 2009 to foster the exchangeof experience and mutual learningbetween cit ies and communitiesworldwide. These cities may be of varioussizes and set in dissimilar cultural andsocio-economic contexts. However, theyshare ‘the desire and commitment topromote healthy and active ageing and agood quality of life for their olderresidents.’ (WHO, 2015). As of 23 April2015, two Indian local bodies, Kolkata andSouth Delhi Municipal Corporation wereon the Network.
The Network was the outcome of aprogramme specifically launched in 2006
42 Local Government Quarterly July - September 2015
to subjectively identify the characteristicsof the urban environment that might fosterthe health of the old. ‘Academic partnersin 33 cities around the world asked olderpeople in focus groups to describe theadvantages and barriers they experiencedin eight areas of city living. In most cities,the reports from older people werecomplemented by focus groups ofcaregivers and service providers. Theeight domains considered included featuresof a city’s physical environment that mayhave an influence on personal mobility,safety from injury, security from crime,health behaviour and social participation;different aspects of the social environmentand of culture that may affect participationand mental well-being; characteristics thatfoster communication and access toinformation; and community support andhealth services.’ (Beard & Petitot, PublicHealth Review).
What Other Cities Could Do
Cities should easily and definitely takea number of steps to make the old morecomfortable. There should be enoughpublic seating and toilet facilities; droppedcurbs and ramps to buildings should bestandard features, and lights at pedestriancrossings should be safely timed. Buildingand housing design should be barrier-free.Information materials and communicationtechnologies should be adapted to suitdiverse perceptual, intellectual and culturalneeds.
The above means that the city’splanning - its landscape, buildings,transportation system, its cultural andrecreational mix, its healthcare and its
libraries, its housing and its services suchas policing need to be planned in such away that they contribute to confidentmobility, healthy behaviour, socialparticipation and self-determination. Ifthese get neglected, the outcomeconversely would be isolation, insecurity,inactivity and social exclusion.
City Community and the Aged
Acknowledging and respecting theold should characterize social and servicerelationships no less than physicalstructures and materials. Such socialetiquette would have to be drilled inmembers of the community. Respect andconsideration for the old has been an age-old custom in this country and shouldcontinue to be major values on the street,at home and on the road, in public andcommercial services, in employment andin care settings. In an age-friendly city,users of public spaces should beconsiderate in sharing the amenities andpriority seating in public transport andspecial needs stopping and parking areasshould be respected. Services shouldemploy friendly staff who take the time togive personal assistance. Traders shouldserve older people as well and as promptlyas other clients. Employers and agenciesshould offer flexible conditions and trainingto older workers and volunteers. Becauseeducation fosters awareness,schoolchildren should be taught aboutageing and older people. The media shouldportray them in realistic ways.
Another important characteristic ofan age-friendly city is that it should foster
Cities and the Aged: Grey Clouds Over Mankind 43
solidarity between generations and withincommunities. Opportunities for neighboursto get to know each other should befostered; they should watch out for eachother’s safety and help and inform eachother. Thanks to a network of trustedfamily, friends, neighbours and serviceproviders, older members of thecommunity should feel integrated andsafe.
Housing must be considered inconnection with outdoor spaces and therest of the built environment such thatolder people’s homes are located in areassafe from natural hazards and are closeto services, other age groups and civicattractions that keep them integrated.Transportation services and infrastructuremust always be linked to opportunities forsocial, civic and economic participation,as well as be accessible to essential healthservices. Social inclusion of older peoplemust target social arenas and roles thatcarry power and status in society, such asdecision- making in civic life, paid workand media programming. Since knowledgeis empowerment, information about allaspects of city living must be accessible.
National Policy on Older Persons,1999
Many of the suggestions that havebeen listed in different WHO documentsalready found place in the National Policyon Older Persons, 1999 of Governmentof India (henceforth referred to as Policy).Some of the suggestions made in the Policywere the following:
‘Public hospitals will be directed toensure that elderly patients are not
subjected to long waits and visits todifferent counters for medical tests andtreatment. They will endeavour to provideseparate counters and convenient timingson specified days. Geriatric wards will beset up’. (Policy, Para 39)
‘Medical and para-medical personnelin primary, secondary and tertiary healthcare facilities will be given training andorientation in health care of the elderly.Facilities for specialization in geriatricmedicine will be provided in the medicalcolleges. Training in nursing care willinclude geriatric care. Problems ofaccessibility and use of health services bythe elderly arise due to distance, absenceof escort and transportation. Difficultiesin reaching a public health care facility willbe addressed through mobile healthservices, special camps and ambulanceservices by charitable institutions and notfor profit health care organizations.’(Policy, Para 40)
‘The concept of healthy ageing willbe promoted. It is necessary to educateolder persons and their families thatdiseases are not a corollary of advancingage nor is a particular chronological agethe starting point for decline in healthstatus. On the contrary, preventive healthcare and early diagnosis can keep a personin reasonable good health and preventdisability’. (Policy Para 44)
‘Layouts of housing colonies will haveto respond to the life styles of the elderly.It will have to be ensured that there areno physical barriers to mobility, andaccessibility to shopping complexes,community centres, parks and other
44 Local Government Quarterly July - September 2015
services is safe and easy. A multi-purposecentre for older persons is a necessity forsocial interaction and to meet other needs.It will therefore, be necessary to earmarksites for such centres in all housingcolonies. Segregation of older persons inhousing colonies has to be avoided as itprevents interaction with the rest of thecommunity. Three or four storied houseswithout lifts are unfriendly to olderpersons, tend to isolate them, restraintstheir movement outside the home, and area serious barrier to access to services.Preferences will be given to older personsin the allotment of flats on the groundfloor.’ (Policy, Para 49)
‘Group housing of older personscomprising flat lets with common servicefacilities for meals, laundry, common roomand rest rooms will be encouraged. Thesewould have easy access to communityservices, medicare, parks, recreation andcultural centres.’ (Policy, Para 50)
‘Educational curriculum at all stagesof formal education as also non-formaleducation programmes will incorporatematerial to strengthen intergenerationalbonds and mutually supportingrelationships. Interactions with educationalinstitutions will be facilitated wherebyolder persons with professionalqualifications and knowledge in science,arts, environment, socio-cultural heritage,sports and other areas could interact withchildren and young persons. Schools willbe encouraged and assisted to developout-reach programmes for interacting witholder persons on a regular basis, participatein the running of senior citizens centres
and develop activities in them. Individualsof all ages, families and communities willbe provided with information about theageing process and the changing roles,responsibilities and relationships atdifferent stages of the life cycle. Thecontributions of older persons inside thehousehold and outside will be highlightedthrough the media and other forums andnegative images, myths and stereotypesdispelled’. (Policy, Para 57)
‘Old persons have become softtargets for criminal elements. They alsobecome victims of fraudulent dealings andof physical and emotional abuse within thehousehold by family members to forcethem to part with their ownership rights.Widow’s rights of inheritance, occupancyand disposal are at times violated by theirown children and relatives. It is importantthat protection is available to older persons.The introduction of special provisions inIPC to protect older persons from domesticviolence will be considered and machineryprovided to attend all such cases promptly.Tenancy legislation will be reviewed sothat the rights of occupancy of olderpersons are restored speedily’. (Policy,Para 65)
‘There are various other areas whichwould need affirmative action of the Stateto ensure that policies and programmesreflect sensitivity to older persons. Amongthese are issue of identity cards by theadministration; fare concessions in allmodes of travel; preference in reservationof seats and earmarking of seats in localpublic transport; modifications in designsof public transport vehicles for easy entry
Cities and the Aged: Grey Clouds Over Mankind 45
and exit; strict enforcement of trafficdiscipline at zebra crossings to facilitateolder persons to cross streets; priority ingas and telephone connections and in faultrepairs; removal of physical barriers tofacilitate easy movement, concessions inentrance fees in leisure and entertainmentfacilities art and cultural centres andplaces of tourist interest’. (Policy, Para 68)
The steps suggested by WHOthrough global consultations have beensummarized by WHO and are attachedas Annex 2. These and the suggestionsmade by Help Age and India’s NationalPolicy on Old Persons are fur thersummarized as Annex 3. They areexcellent guides in relation to what citiescould do to help the old.
Emerging Framework ofUrbanization and the Aged
While cities undertake to take suchsteps that would make the lives of the agedmore livable, the larger picture that isstaring in our face is the emergingframework of urbanization. Several citiesin the developing world are moving beyondthe definition of megacities, withpopulations beyond 10 million. It would beuseful to categorize these as ‘giga cities’(defined by me as above 10 million). Now,if the future pattern of urbanization is goingto be ‘gigacities’ (cities above 10 million),megacities (5 million to ten million) andvery large metropolitan cities (3 to 5million), and where the majority ofurbanites including the old would live, thenthe aged will have an awfully tough timeageing. They indeed would have little
opportunity for ‘active ageing’. Despitethe best efforts that such cities would maketo provide infrastructure and conveniencesfor the aged, demographic additions wouldseem to have an adverse impact on thelives of the aged in terms of pollution,congestion, costs and comfort – all addingup to subtract from the happiness quotient.All additions to infrastructure and services,based on past empirical evidence, wouldget quickly lapped up by current andadditional entrants, mostly the well to do.But they would also engender entry of thepoor in large numbers to get enough tosurvive but not enough to live.
Mumbai, for instance, the largest cityof India, began the last century with apopulation slightly more than 800,000.Given that the area of Mumbai has moreor less remained stable at around 437 sq.km, the city had a per sq. km humandensity of 1860 persons. Based on theCensus data of 2011, it is seen that thecity’s average density now is around28,000 per sq. km. Within the city,populations are not evenly spread andsome areas have much higher density withDharavi slums going beyond 100,000persons per sq. km.
More people would bring morevehicles on Mumbai’s roads. TheTransport Department of Maharashtrasometime back reported that the vehicularpopulation of Mumbai doubles every sevenyears. This number now stands at around2.5 million. Public transport in the city ispoor, despite additions of suburban railwaycapacity, metro and monorail. More thanhalf the vehicular addition is cars, with very
46 Local Government Quarterly July - September 2015
little to show in terms of addition to buses,taxis and auto rickshaws. The naturalresult has been the clogging of city roadswith vehicles and a travel speed of around20 km per hour. In terms of the old usingthe suburban rail or buses, they do notstand a chance in the kind of crushingcongestion witnessed in such transport.
The annual Environment StatusReport of Greater Mumbai prepared bythe ULB has documented the rapiddecline of air quality and rising noisepollution, both exceeding prescribed healthnorms. The city witnessed a rise in thecases of asthma, gastroenteritis and otherdisease related to noise and hygiene.
Affordable housing in Mumbai is likea square circle – a preposterous concept.It is, therefore, not surprising that 60 percent of the population is packed into slumsover land that is less than 10 per cent ofMumbai. With a larger population, therewill be more people in slums as this wouldbe the only kind of shelter that the majoritywould afford.
The above cited facts about density,slums, transport, air, noise, water andhousing are different in other cities suchas Delhi, Kolkata, Chennai, Bengaluru,Hyderabad and others only in smalldegrees. The same trends overall arenoticeable in all large Indian cities. Theseclearly demonstrate that in the currentIndian context, very large cities keepgetting more dense as they grow, keepgetting more congested, more polluted,more unhealthy. As a consequence, theywould quite evidently get more inefficient.For the old, they clearly are unsupportivesince most of the aged would not findhousing unless they are very rich, wouldnot be able to move out unless they haveprivate transport, would not have openspaces to relax as open spaces are fewand would run the risk of disease throughair, water and noise. Whereas low density,on the one hand, is poor for security andservices to the old, very heavy density onthe other is poor for housing, movement,health and relaxation. Alas, the old willhave to make a choice between the deviland the deep sea.
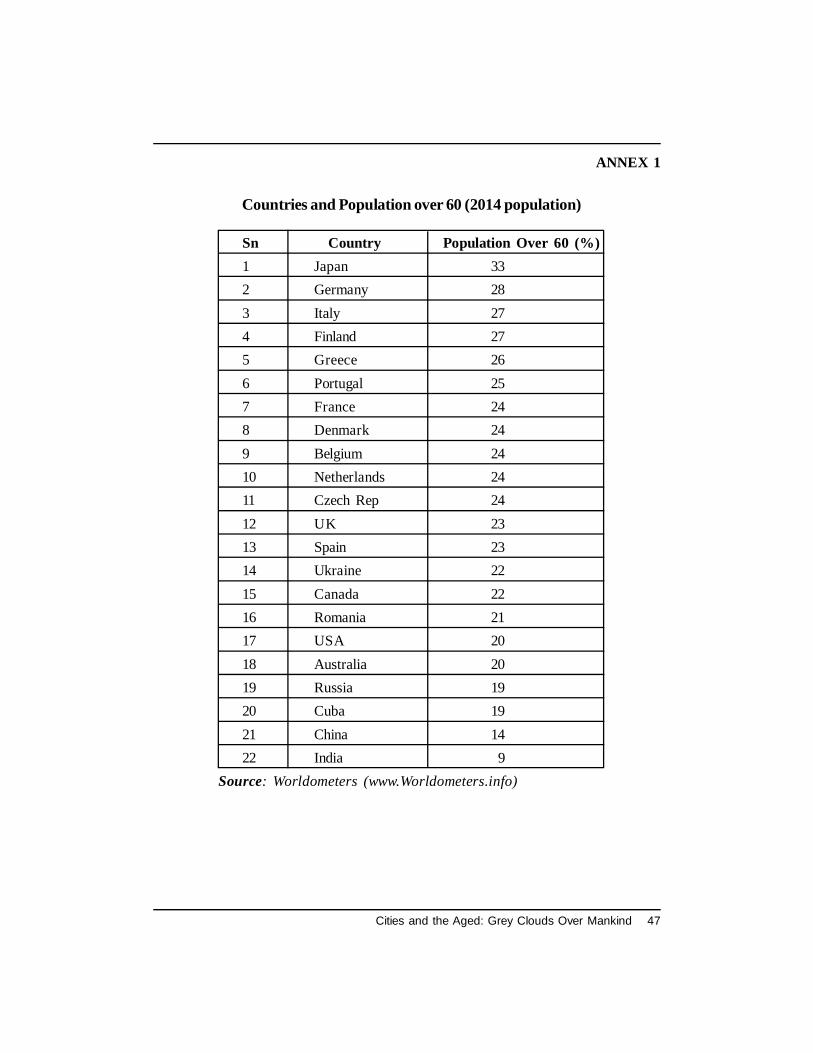
Cities and the Aged: Grey Clouds Over Mankind 47
ANNEX 1
Countries and Population over 60 (2014 population)
Sn Country Population Over 60 (%)1 Japan 332 Germany 283 Italy 274 Finland 275 Greece 266 Portugal 257 France 248 Denmark 249 Belgium 2410 Netherlands 2411 Czech Rep 2412 UK 2313 Spain 2314 Ukraine 2215 Canada 2216 Romania 2117 USA 2018 Australia 2019 Russia 1920 Cuba 1921 China 1422 India 9
Source: Worldometers (www.Worldometers.info)
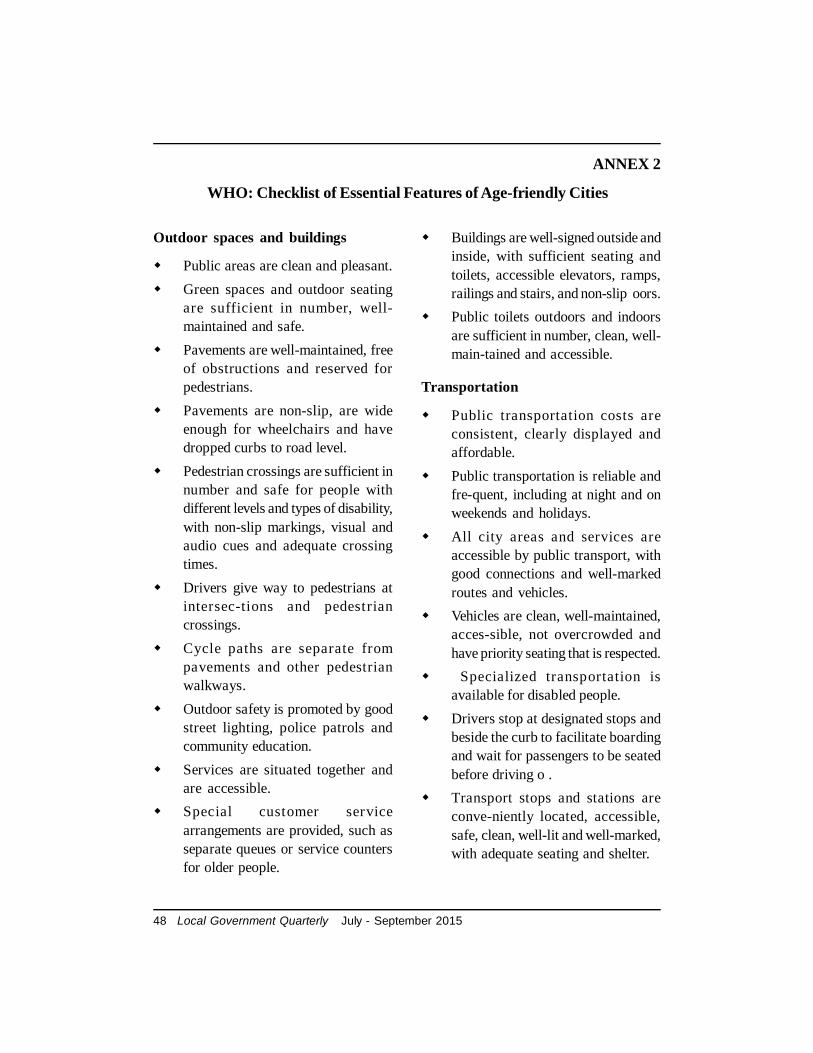
48 Local Government Quarterly July - September 2015
ANNEX 2
WHO: Checklist of Essential Features of Age-friendly Cities
Outdoor spaces and buildings
Public areas are clean and pleasant. Green spaces and outdoor seating
are sufficient in number, well-maintained and safe.
Pavements are well-maintained, freeof obstructions and reserved forpedestrians.
Pavements are non-slip, are wideenough for wheelchairs and havedropped curbs to road level.
Pedestrian crossings are sufficient innumber and safe for people withdifferent levels and types of disability,with non-slip markings, visual andaudio cues and adequate crossingtimes.
Drivers give way to pedestrians atintersec-tions and pedestriancrossings.
Cycle paths are separate frompavements and other pedestrianwalkways.
Outdoor safety is promoted by goodstreet lighting, police patrols andcommunity education.
Services are situated together andare accessible.
Special customer servicearrangements are provided, such asseparate queues or service countersfor older people.
Buildings are well-signed outside andinside, with sufficient seating andtoilets, accessible elevators, ramps,railings and stairs, and non-slip oors.
Public toilets outdoors and indoorsare sufficient in number, clean, well-main-tained and accessible.
Transportation
Public transportation costs areconsistent, clearly displayed andaffordable.
Public transportation is reliable andfre-quent, including at night and onweekends and holidays.
All city areas and services areaccessible by public transport, withgood connections and well-markedroutes and vehicles.
Vehicles are clean, well-maintained,acces-sible, not overcrowded andhave priority seating that is respected.
Specialized transportation isavailable for disabled people.
Drivers stop at designated stops andbeside the curb to facilitate boardingand wait for passengers to be seatedbefore driving o .
Transport stops and stations areconve-niently located, accessible,safe, clean, well-lit and well-marked,with adequate seating and shelter.
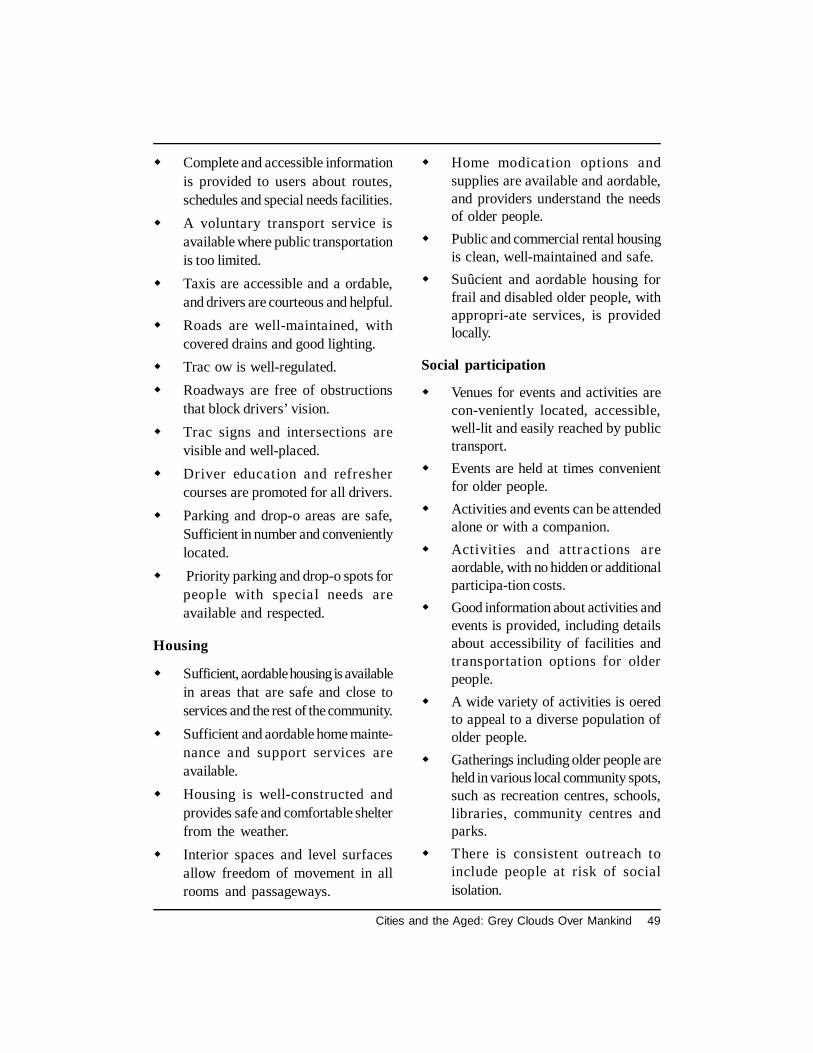
Cities and the Aged: Grey Clouds Over Mankind 49
Complete and accessible informationis provided to users about routes,schedules and special needs facilities.
A voluntary transport service isavailable where public transportationis too limited.
Taxis are accessible and a ordable,and drivers are courteous and helpful.
Roads are well-maintained, withcovered drains and good lighting.
Trac ow is well-regulated. Roadways are free of obstructions
that block drivers’ vision. Trac signs and intersections are
visible and well-placed. Driver education and refresher
courses are promoted for all drivers. Parking and drop-o areas are safe,
Sufficient in number and convenientlylocated.
Priority parking and drop-o spots forpeople with special needs areavailable and respected.
Housing
Sufficient, aordable housing is availablein areas that are safe and close toservices and the rest of the community.
Sufficient and aordable home mainte-nance and support services areavailable.
Housing is well-constructed andprovides safe and comfortable shelterfrom the weather.
Interior spaces and level surfacesallow freedom of movement in allrooms and passageways.
Home modication options andsupplies are available and aordable,and providers understand the needsof older people.
Public and commercial rental housingis clean, well-maintained and safe.
Suûcient and aordable housing forfrail and disabled older people, withappropri-ate services, is providedlocally.
Social participation
Venues for events and activities arecon-veniently located, accessible,well-lit and easily reached by publictransport.
Events are held at times convenientfor older people.
Activities and events can be attendedalone or with a companion.
Activities and attractions areaordable, with no hidden or additionalparticipa-tion costs.
Good information about activities andevents is provided, including detailsabout accessibility of facilities andtransportation options for olderpeople.
A wide variety of activities is oeredto appeal to a diverse population ofolder people.
Gatherings including older people areheld in various local community spots,such as recreation centres, schools,libraries, community centres andparks.
There is consistent outreach toinclude people at risk of socialisolation.
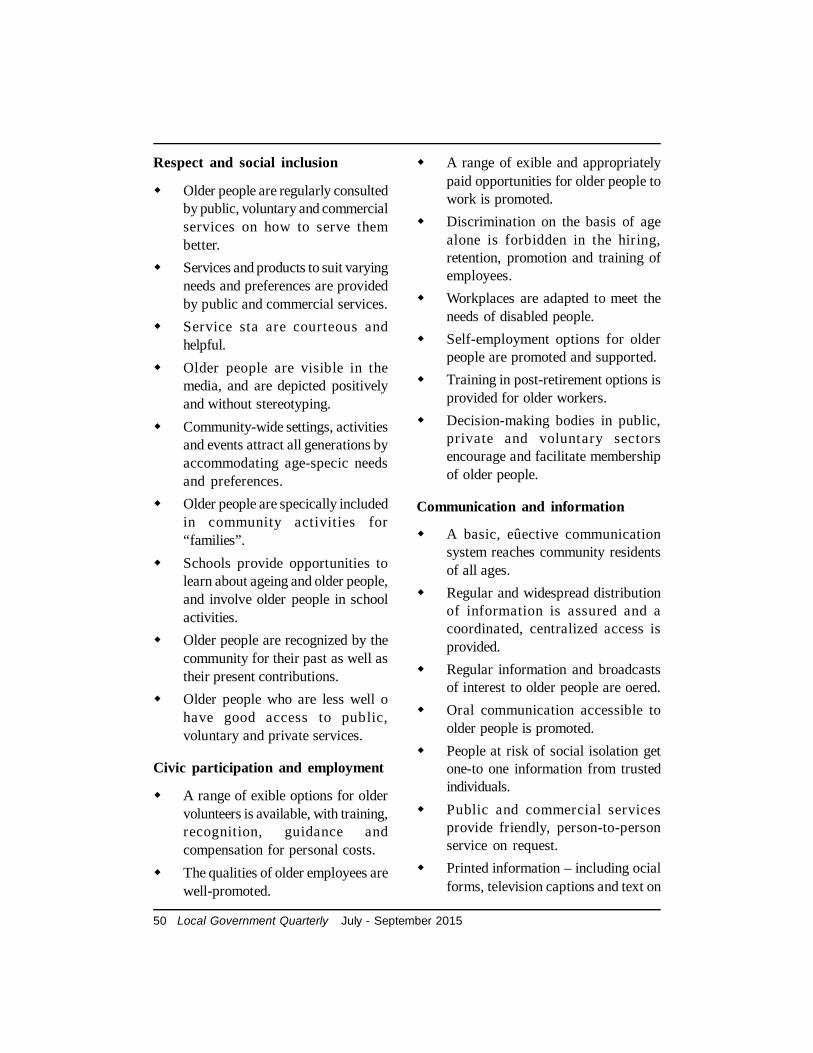
50 Local Government Quarterly July - September 2015
Respect and social inclusion
Older people are regularly consultedby public, voluntary and commercialservices on how to serve thembetter.
Services and products to suit varyingneeds and preferences are providedby public and commercial services.
Service sta are courteous andhelpful.
Older people are visible in themedia, and are depicted positivelyand without stereotyping.
Community-wide settings, activitiesand events attract all generations byaccommodating age-specic needsand preferences.
Older people are specically includedin community activities for“families”.
Schools provide opportunities tolearn about ageing and older people,and involve older people in schoolactivities.
Older people are recognized by thecommunity for their past as well astheir present contributions.
Older people who are less well ohave good access to public,voluntary and private services.
Civic participation and employment
A range of exible options for oldervolunteers is available, with training,recognition, guidance andcompensation for personal costs.
The qualities of older employees arewell-promoted.
A range of exible and appropriatelypaid opportunities for older people towork is promoted.
Discrimination on the basis of agealone is forbidden in the hiring,retention, promotion and training ofemployees.
Workplaces are adapted to meet theneeds of disabled people.
Self-employment options for olderpeople are promoted and supported.
Training in post-retirement options isprovided for older workers.
Decision-making bodies in public,private and voluntary sectorsencourage and facilitate membershipof older people.
Communication and information
A basic, eûective communicationsystem reaches community residentsof all ages.
Regular and widespread distributionof information is assured and acoordinated, centralized access isprovided.
Regular information and broadcastsof interest to older people are oered.
Oral communication accessible toolder people is promoted.
People at risk of social isolation getone-to one information from trustedindividuals.
Public and commercial servicesprovide friendly, person-to-personservice on request.
Printed information – including ocialforms, television captions and text on
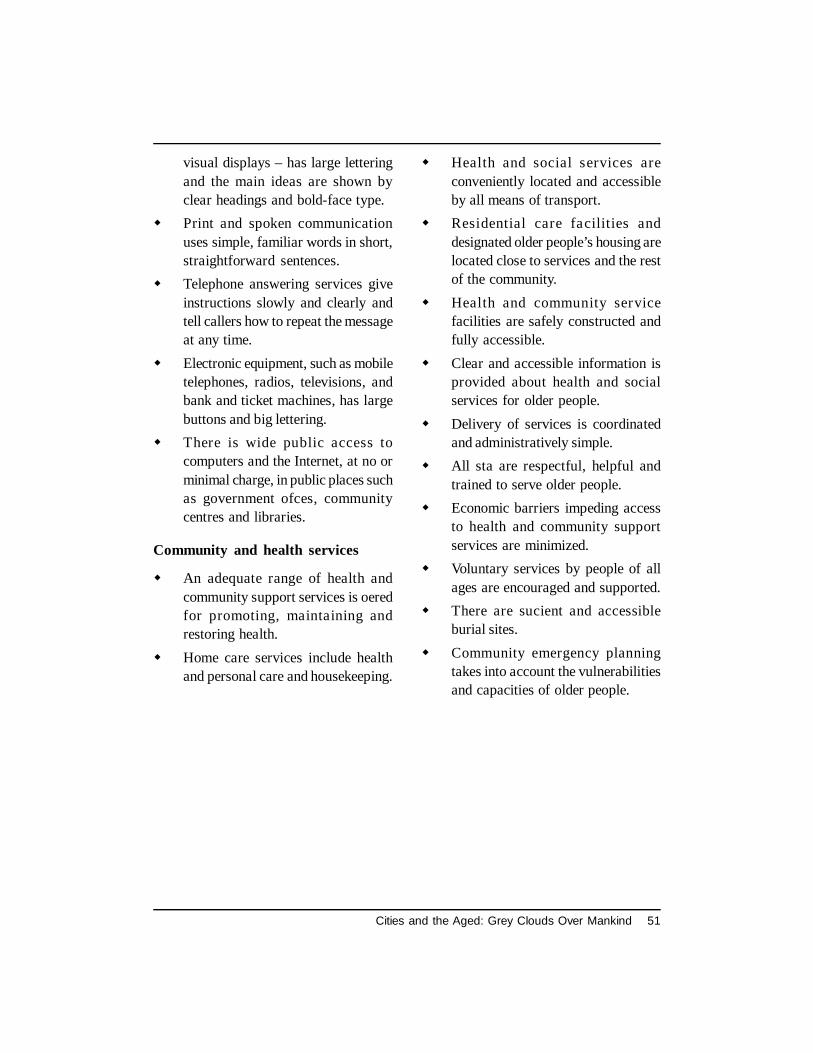
Cities and the Aged: Grey Clouds Over Mankind 51
visual displays – has large letteringand the main ideas are shown byclear headings and bold-face type.
Print and spoken communicationuses simple, familiar words in short,straightforward sentences.
Telephone answering services giveinstructions slowly and clearly andtell callers how to repeat the messageat any time.
Electronic equipment, such as mobiletelephones, radios, televisions, andbank and ticket machines, has largebuttons and big lettering.
There is wide public access tocomputers and the Internet, at no orminimal charge, in public places suchas government ofces, communitycentres and libraries.
Community and health services
An adequate range of health andcommunity support services is oeredfor promoting, maintaining andrestoring health.
Home care services include healthand personal care and housekeeping.
Health and social services areconveniently located and accessibleby all means of transport.
Residential care facilities anddesignated older people’s housing arelocated close to services and the restof the community.
Health and community servicefacilities are safely constructed andfully accessible.
Clear and accessible information isprovided about health and socialservices for older people.
Delivery of services is coordinatedand administratively simple.
All sta are respectful, helpful andtrained to serve older people.
Economic barriers impeding accessto health and community supportservices are minimized.
Voluntary services by people of allages are encouraged and supported.
There are sucient and accessibleburial sites.
Community emergency planningtakes into account the vulnerabilitiesand capacities of older people.
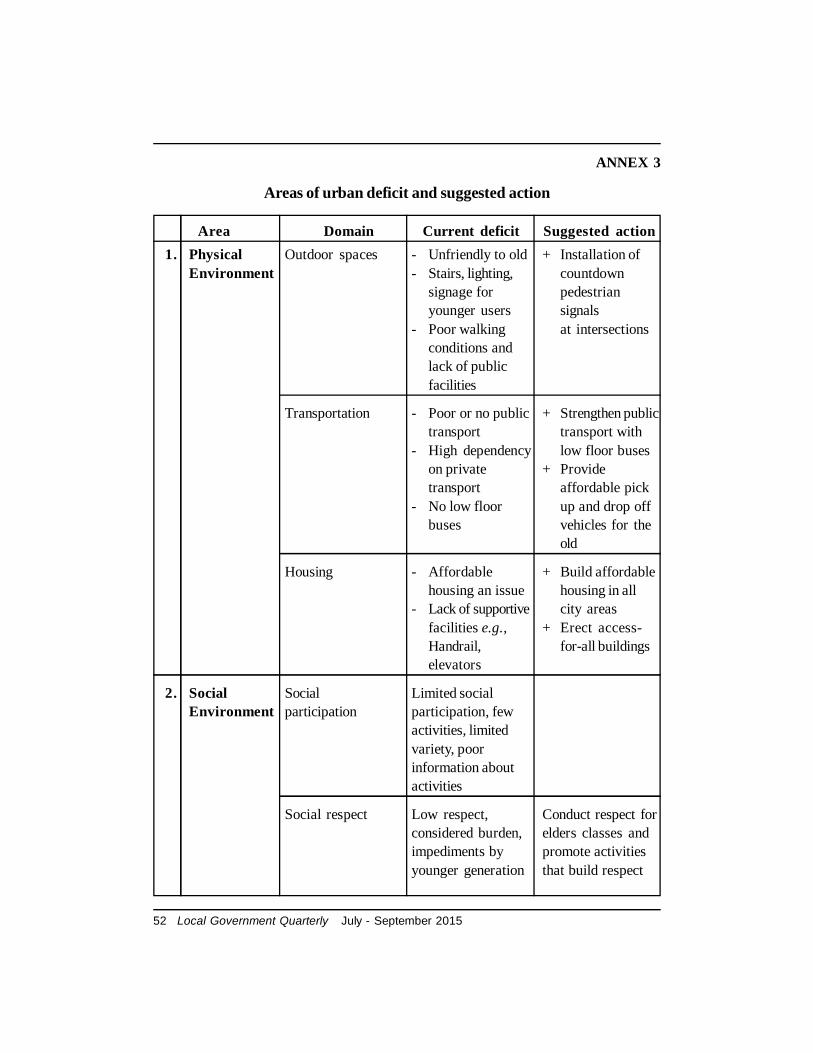
52 Local Government Quarterly July - September 2015
Areas of urban deficit and suggested action
Area Domain Current deficit Suggested action1. Physical Outdoor spaces - Unfriendly to old + Installation of
Environment - Stairs, lighting, countdownsignage for pedestrianyounger users signals
- Poor walking at intersectionsconditions andlack of publicfacilities
Transportation - Poor or no public + Strengthen publictransport transport with
- High dependency low floor buseson private + Providetransport affordable pick
- No low floor up and drop offbuses vehicles for the
old
Housing - Affordable + Build affordablehousing an issue housing in all
- Lack of supportive city areasfacilities e.g., + Erect access-Handrail, for-all buildingselevators
2. Social Social Limited socialEnvironment participation participation, few
activities, limitedvariety, poorinformation aboutactivities
Social respect Low respect, Conduct respect forconsidered burden, elders classes andimpediments by promote activitiesyounger generation that build respect
ANNEX 3
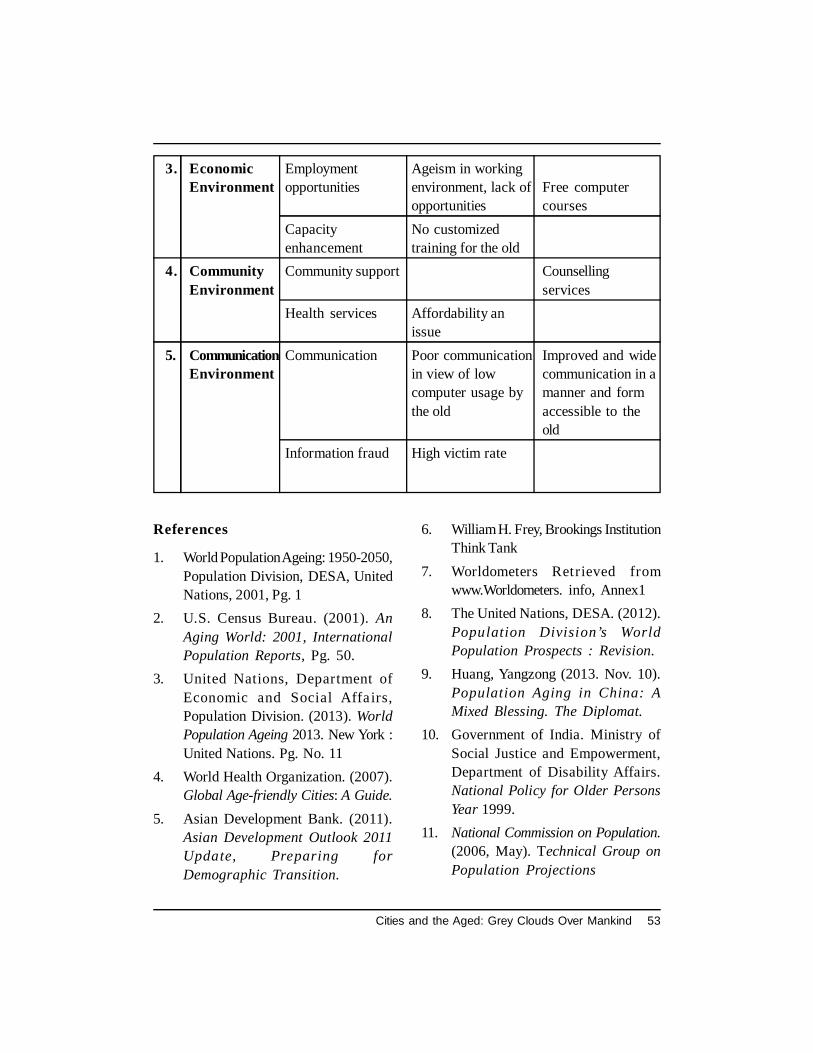
Cities and the Aged: Grey Clouds Over Mankind 53
3. Economic Employment Ageism in workingEnvironment opportunities environment, lack of Free computer
opportunities coursesCapacity No customizedenhancement training for the old
4. Community Community support CounsellingEnvironment services
Health services Affordability anissue
5. Communication Communication Poor communication Improved and wideEnvironment in view of low communication in a
computer usage by manner and formthe old accessible to the
oldInformation fraud High victim rate
References
1. World Population Ageing: 1950-2050,Population Division, DESA, UnitedNations, 2001, Pg. 1
2. U.S. Census Bureau. (2001). AnAging World: 2001, InternationalPopulation Reports, Pg. 50.
3. United Nations, Department ofEconomic and Social Affairs,Population Division. (2013). WorldPopulation Ageing 2013. New York :United Nations. Pg. No. 11
4. World Health Organization. (2007).Global Age-friendly Cities: A Guide.
5. Asian Development Bank. (2011).Asian Development Outlook 2011Update, Preparing forDemographic Transition.
6. William H. Frey, Brookings InstitutionThink Tank
7. Worldometers Retrieved fromwww.Worldometers. info, Annex1
8. The United Nations, DESA. (2012).Population Division’s WorldPopulation Prospects : Revision.
9. Huang, Yangzong (2013. Nov. 10).Population Aging in China: AMixed Blessing. The Diplomat.
10. Government of India. Ministry ofSocial Justice and Empowerment,Department of Disability Affairs.National Policy for Older PersonsYear 1999.
11. National Commission on Population.(2006, May). Technical Group onPopulation Projections
54 Local Government Quarterly July - September 2015
12. Julian Ryall. (2012, September 4).Tokyo Population to halve in next 90years. The Telegraph, Asia,
13. Yip, Paul S. F. (2011, August, 11).Isolated in a connected city. HealthPost. South China Morning Post.
14. Help Age India.(2014). Report onElder Abuse in India, 2014, andSurvey of Select Indian Cities.
15. Maintenance and Welfare of Parentsand Senior Citizens Act, 2007.
16. Report on PIL by Mission Justice inthe Bombay High Court forestablishing Old Age Homes. (2015,January 15). The Indian Express,Mumbai.
17. Adli, Mazda. (2011, November).Urban Stress and Mental Health.LSE Cities.
18. Beard, John R. & Petitot, Charles.Ageing and Urbanization: Can Citiesbe Designed to Foster ActiveAgeing?. Public Health Reviews,32, (2). 427-450
Diploma in Local Government Financial Management(Government recognized - Based on Accrual Base Double Entry Accounting System for ULBs - through Distance Learning)
Course Contents
Municipal Finance & Resource Mobilization Financial Management and Control Mercantile Accounting Management and Management Techniques Municipal Accounts Eligibility : Minimum age 18 Years Medium : English / Marathi Minimum education : 10 + 2 Pass Duration : One year from April to March & October to September (Including examination)
For further details & application for admission, obtain Prospectus by post on payment of Rs. 200/-by Demand Draft from :
The Regional DirectorAll India Institute of Local Self-Government
Distance Learning Centre, Sthanikraj Bhavan, Near Bhagyanagar 2nd Cross,Pandit Nehru Road, Tilakwadi (East), Belgaum - 590 006, Karnataka.
Tel. No. 0831-2481075
Smart Citizens Behaviour – The Core of Smart Cities in India Frame Work 55
Smart Citizens Behaviour– The Core of Smart Cities in India
P. H. Rao
“Technology is the answer. But what is the question?” - Cedric Price‘If you only focus on technology and not on human behaviour, you will not becomesmart’ – (Copenhagen Cleantech, 2013)
Today ‘Smart Cities’ are acclaimed,all over the world, as the answer to meetthe challenges of massive urbanization.Developed as well as the developingcountries are embracing the concept ofsmart cities to effectively meet challengessuch as urban sprawl, environment,sustainability, transportation, energyconstraints, among other things. India hasalso began the pursuit of its own vision of‘Smart Cities’ with the cabinet approvalof the Smart Cities Mission with an outlayof Rs. 48,000 crores on 29th May 2015.The curtain was raised for the race ofSMART cities in India with the PrimeMinister of India launching the ‘Smartcities Mission’ on 25th June 2015.
It is widely acknowledged that thereis no universally accepted, agreeddefinition of a SMART city. Is it whenevery citizen in India is equipped with aSMART phone? Or is it when Wi-Fi is
freely available in public places throughhot-spots? Or is it when all of us areenabled for on-line transactions like payingutility bills, order breakfast or buyinganything using numerous apps on ourmobiles. Are we smart if we consume onlybottled mineral/RO purified water fordrinking? It is indeed difficult to give asatisfactory and universally acceptableanswer.
Conversely, it is easier to visualize,what a SMART city is NOT or when acity can never think of becoming a smartcity. Municipal corporations adopt smartsolutions (technology) like ‘Offsite RealMonitoring System’ for effectivemanagement of solid waste. Yet garbagepiles up everywhere, even in the heart ofthe city. Public Private Partnerships (PPP)are forged to construct public toilets, whichoften fetch good advertising revenue tothe contractor, but still fail to prevent peoplefrom urinating or defecating in open. A
56 Local Government Quarterly July - September 2015
city may have a GIS based property taxinformation system, yet fails to collectproperty tax arrears for many years, evenfrom people living in posh colonies/areasof the city. Delhi and other mega citieshave smart transportation namely metroand the smart part comes to an end withthe metro ride. The reality sprouts onceyou step out of the metro as pan stainedwalls, street vendors freely throwingwaste, haphazardly parked autos andminibuses, etc., are common sights
The definition used by O P Agarwal,Executive Director, Punj Lloyd Institutefor Infrastructure Management, IndianSchool of Business - A smart city is onethat is socially, environmentally andfinancially sustainable and which strivesto minimize waste of resources, likeenergy and water, in meeting the needs ofits residents (PTI, 2015a) is more realisticand applicable in the Indian context. Theultimate indicator of a smart city is ‘Qualityof Life’ (QoL) of their citizens. The VisionStatement of Andhra Pradesh, after thebifurcation on 2nd June 2014 has QoL asthe focus (Government of AndhraPradesh, 2014). Haryana, a state on fastlane in terms of smart city readiness, hasidentified citizens’ readiness, as a keyparameter and focuses on citizen centricsolutions (PWC & CII, 2015). The ‘DraftPolicy on Internet of Things’ (IoT) placesemphasis on building answers for ‘WhatData will Service the Citizens’. It alsoadds that the goal should be ‘Value Up’and ‘Cost Down’ (DeitY, 2015). There is
a need to understand how smart cityimplementation affects the social behaviorof citizens towards more efficient andsubstantial utilization of city resources(Khansari, 2013).
In order to improve QoL the citizensof a city also have a significant and activerole. Without change in the behavior ofthe people who live in the city, a city cannever aspire to become a SMART CITY,no matter how many crores of public and/or private money are spent on smartsolutions based on technologies such asIoT, Location Based Services, GIS etc.,(with mind boggling claims and eachclaiming better than their rivals) andcreating SMART INFRASTRUCTURE.“Citizens, not technology makes a smartcity” avers Karuna Gopal, President ofFoundation for Futuristic Cities, wholaunched “Citizens for City” in Hyderabadin September 2009 (Express Features,2015). One thing is clear: Citizens behavioris core to smart cities. Hence, this paperdwells on smart citizen behavior in light ofsmart cities in India.
Two major initiat ives of theGovernment of India namely ‘SwacchBharat’ and ‘Digital India’ contributesignificantly to the development of SmartCities in India.
Swachh Bharat
It addresses the ground realities likeopen defecation; waste management,
Smart Citizens Behaviour – The Core of Smart Cities in India Frame Work 57
water, sanitation and hygiene amongothers.
Digital India
It is concerned with the aspirationsof future India. This programme aims totransform India into a digitally empoweredsociety and knowledge economy. Digitalempowerment of citizens means
(a) digital literacy,
(b) access to digital resources in Indianlanguages,
(c) availability of all documents onclouds,
(d) collaborative digital platforms forparticipative governance, and
(e) portability of entitlements throughclouds.
This involves broadband highway forall, universal access to mobile connectivity,public internet access, electronic deliveryof services, information for all, training forpeople for IT sector jobs, targeted massmessaging, public Wi-Fi hot spots, SMSbased weather information and disasteralerts. Some of the digital applications/solutions hopefully can contribute to citiesachieving the service level benchmarks forSwachh Bharat.
This paper presents a situationalanalysis with respect to ‘SwachhBehaviour’ and ‘Technology/DigitalBehavior ’ of Indian cities and theircitizens. Role of technology and otherfacilitating and enabling factors and other
interventions for rendering behaviour ofcitizens SMART are explored. A strategyfor smart behavior by citizens is offered.
Situational Analysis
Citizens with smart behavior i.e.,Smart Citizens are imperative to theemergence of smart cities in India.Applying basic marketing principles ofidentifying needs, understanding wants andestimating demand (willingness and abilityto pay) for different services and productsis the first step in behavior change processof people towards SMART CITIES. Twoon-line surveys of consumers’ satisfactionwith 30 aspects of city life in 2011 and2012, covering 27 major cities around theworld (Ericsson, 2014) identified
(a) traffic situation,
(b) the mechanisms for communicationwith city authorities currently opento them and
(c) aspects of health as the majorsources of discontent. Hence,understanding citizens’ needs andpreparedness to accept smartsolutions/technologies will be criticalto their acceptance and optimalusage.
Swachh Behaviour
The situational analysis focuses onfour cities viz., Varanasi, Allahabad, Ajmerand Visakhapatnam, whose names weresounded as the first among the smart citiesselected in India. It provides information
58 Local Government Quarterly July - September 2015
on the basic services available in thesecities, which in turn influence the behaviorof their citizens.
Water
Every citizen needs adequate andcontinuous supply of water at door step tomeet various needs like bathing, hygiene,washing cloths and utensils, etc. Thedrinking water should be safe, potable andmore importantly affordable. The tablebelow presents the scenario with respectto these aspects of water supply in theproposed four smart cities first to beshortlisted for smart cities. (Table 1)
Affordability
Inability of Urban Local Bodies inIndia to supply safe water for drinkingforces citizen to install water purifiers orto buy bottled water, increasing the costof drinking water enormously.
Equity
Does supplying 135 lpcd, the servicelevel bench mark set by the Governmentof India, makes a city smart? For examplewith about 280-300 lpcd, Delhi, as a city,ranks highest in per capita availability ofwater. However, the standard for differenttarget groups vary widely – for (a) plannedcolonies is 225 lpcd; (b) resettlementcolonies and urban villages it is 155 lpcdand (c) jhuggi-jhopdi (JJ) clusters it is only50 lpcd. On the other hand, each room ina five-star hotel consumes on an average1,600 liters of water every day. The
residence of prime minister, president andministers consumes about 73,300, 67,000and 30,000-45,000 liters per day (Singh,2005). Such disparity in waterconsumption level by different groups ofcitizens is neither equitable nor sustainable.Obviously, such a city cannot be smart.Reaching equity and sustainability in asmart city also require significant andwidespread changes in consumptionbehavior of people.
Sanitation
Lack of access to toilets (individual,community or public) is a major reasonfor people defecating in the open. Not usingthe accessible toilets is a more importantfactor. The sanitation scenario of the fourproposed smart cities is given in the Table 2.
As a result about 13 per cent of theurban population in India defecate in open(WHO & UNICEF, 2013) resulting insanitation and health hazards.
Solid Waste Management
Absence of arrangements for door-to-door collection of solid waste by theULB results in citizens throwing waste onthe streets and in open spaces. Lack ofsegregation of waste at source, especiallyby the households, render even systematicwaste collection ineffective. The wastemanagement scenario of four proposedsmart cities is given in the Table 3.
In Varanasi, one of the first in Indiato be chosen for development as a smart
Smart Citizens Behaviour – The Core of Smart Cities in India Frame Work 59
city, segregation of solid waste is nil anddoor to door collection covers only7 per cent of the total population and4 per cent of the city area (CEPT, 2011, p.95).
Clean Air
Prolonged exposure to Ambient AirPollution (AAP), with pollutants such assulphur dioxide (SO2), nitrogen oxides(NOx), carbon monoxide (CO), ozone (O3)and Particulate Matter (PM10 and PM2.5)leads to increased rates of respiratorydisease, chronic obstructive pulmonarydisorder, and lung cancer. PM10 is knownto cause severe damage to the lungs. AAPis the fifth largest killer in India. Annualcost of AAP generated morbidity andmortality is estimated at Rs. 1,103 billionor 1.7 per cent of GDP in 2009 (PublicHealth Foundation of India, 2014).According to a 2014 WHO report, out ofthe 124 Indian cities monitored 63 (50.8per cent) cities have critical level (>90)and another 33 (26.6 per cent) have highlevels (61 to 90) of PM10. Out of a total of164 cities in the world with critical levelsof PM10, 63 are Indian cities. The airpollution scenario of three of the proposedsmart cities is given in the Table 4.
According to the latest sources,Pollution Index of Varanasi is 157(moderate) on May 1, 2015 and 127(moderate) on June 27 2015 (CPCB, 2015).
Education
A smart city also means literate andwell educated citizens. According to
Census 2011, about 74 per cent of 7+ yrs.are literate. Can India become digitallyliterate, in spite of illiterate population?
Transportation
Bus Rapid Transport System (BRTS)was adopted by some Indian cities withlot of fanfare and backing by transportationexperts. In Delhi, BRTS failed due to anumber of reasons. People driving othervehicles use BRTS corridor in peak hoursand the traffic police looking the other wayis a major cause. Now BRTS inAhmedabad, which has been acclaimedand has learnt lessons from Delhi, is fallingprey to a similar trend. The typicalAmdavadi bothers little about the trafficrules devised for BRTS and prefers to payfines for breaking into BRTS lanes ratherthan abide by the rules and wait in trafficjams. Cyclists are forced to travel in mixed-traffic lanes as dedicated cycle tracks areunsafe because of broken infrastructure,encroachment by hawkers, squatters andparked cars, as it is in Delhi (John, 2013).With such (unsmart) behavior of citizens,a potential smart solution to solvetransportation problems of a city, will berendered useless.
Technology/Digital Behaviour
Indian citizens are way ahead inDigital Behavior than in Swachh Behavior.An average Indian household may nothave a toilet (and freely urinate & defecatein the open) but is more likely to own amobile phone as shown by Census 2011.
60 Local Government Quarterly July - September 2015
While it took 10 years to reach from 10 to100 million mobile users, the next 100million were added in 3, whereas the last100 million (from 200m to 300m) happenedin just one year. India would reach 500million users before end of 2016 (Desai,2014). Policy of “calling party pays”(which helps to lower the costs of mobilephone ownership for users who make fewoutgoing calls); “ultra-low-cost handsets”(that reduce the barrier to mobile phoneownership) and prepaid accounts (enableusers to keep their mobile service activewith small amounts) have contributed torapid growth in mobile subscribers in India(Aspen Institute of India, 2008). Accordingto the ‘Internet India 2014 Report’ Indiais third, just behind the USA, with anestimated 302 million internet user by theend of 2014 of which 190 million are inurban areas. Mobile internet is used by173 million Indian with 128 million in urbanareas (IAMAI, 2014).
Smart Solutions
The illustrative list of the MissionStatement & Guidelines of Governmentof India (MoUD, 2015, p.6) has six setsof smart solutions viz., (a) e-governanceand citizen services, (b) wastemanagement, (c) water management, (d)energy management, (e) urban mobilityand (f) others such as telemedicine andtele-education. Smart solutions, whichhave implications for citizen behaviour, arediscussed in this paper as SwachhSolutions and Digital Solutions.
Swachh Solutions
Smart consumption of water andenergy (electricity and fuels like LPG andpetrol/diesel) are core to Swachh solutions.
Water
From the citizen’s point of view‘Smart Water’ is continuous (24 x 7)availability of safe drinking water andwater supply of acceptable quality forother uses. Simple measures to enablecitizens to test the quality of drinking waterand guidelines for taking simple andaffordable steps, when the water needsto be purified, to make it suitable fordrinking make smart water.
Sanitation
Washing hands with soap after goingto the toilet and before eating food is oneof the simple yet highly effective hygienesolutions. Availability of adequate wateris the key to maintenance of public andcommunity toilets, to encourage theirusage. E-toilets and bio-toilets areinnovative solutions in this regard.
Energy
According to Energy EfficiencyServices (EELS) Ltd., use of LightEmitting Diode Bulbs (LED) byhouseholds could reduce energyconsumption by 88 per cent (as comparedto ordinary bulbs) and 50 per cent (ascompared to CFLs). The Demand SideManagement based Efficient Lighting
Smart Citizens Behaviour – The Core of Smart Cities in India Frame Work 61
Programme (DELP) under which 4 LEDbulbs will be provided, each householdcould save INR 648 per annum in itselectricity bill, which is more than the LEDbulbs cost. This scheme will result in annualreduction of energy consumption by 504million units, which thus would be availablefor a lternative purposes (http://eeslindia.org/DELP-Delhi/ Accessed on15 June 2015).
Similarly people need to use/switchover to household appliances with energyconserving features that are availabletoday in the market.
Transportation
Smart Fuel
Compressed Natural Gas (CNG) andbattery operated personal vehicles are lesspolluting and more environmental friendly.Payback period of cost of conversion toCNG, of Rs. 40,000 for a private car of anaverage 50 km run per day is 10 and 7months in Delhi and Mumbai, respectively.The cost advantage of CNG (at likely priceof INR 59.8/kg) over petrol is about40 per cent and 20 per cent over diesel(AF-MERCADOS EMI, 2013, p.30).Reduction in the gap of price of CNG andpetrol / diesel, led to drop in demand forCNG cars in 2013 (Chauhan, 2014). Highinitial costs, volatile prices of CNG andinadequate fueling stations are some ofthe barriers preventing people from shiftingto or from buying vehicles using alternate
fuels which are more environmentalfriendly. In the USA, Texas offered arebate of $2,500 to motivate its citizen toshit to or purchase qualified alternative-fuel vehicles – CNG, liquefied petroleumgas and electric vehicles (Cunningham,2014).
Public Transport
Share of buses in all registeredmotorized vehicles in India fell from 11.1per cent in 1951 to 0.9 per cent by 2011(Tiwari, 2012). Safe, convenient,dependable, affordable and environmentalfriendly public transportation is one smartsolution Indian citizens need in the contextof smart cities.
Cycle Sharing
It is a flexible form of personal publictransport. Rojas-Rueda (2011) affirmsthat the health benefits from cycling in thebicycle sharing scheme are greatercompared with the risks from inhalationof air pollutants and road traffic incidentswith benefit: risk ratio 77. In consonancewith the spirit of India’s National UrbanTransport Policy – “moving people, notvehicles” - MoUD brought out a planningtoolkit for Indian cities promoting ‘PublicCycle Sharing Systems’. Namma Cycle,in Bangalore IISC campus logged 4500km in 2012, preventing a ton of CO2
emissions because 300 liters of petrol werenot used and saved 25,000 rupees (http://www.nammacycle.in/).
62 Local Government Quarterly July - September 2015
Digital Solutions
NASSCOM (2015) has collaboratedwith a number of organizations to comeout with ‘Integrated ICT and GeospatialTechnologies framework for 100 SmartCities Mission. The framework covers(a) physical infrastructure (energy, water,waste, mobility and real estate); (b) socialinfrastructure (health, education, safety,culture and citizen services); (c)environment (climate change, pollution,disaster management,) and (d) governance(policies, municipalities, operations,). Keyissues and challenges have been identifiedfor each smart element (smart energy,smart water, smart mobility/transportation,solid waste management, smart urbanplanning, smart social infrastructure, smarteducation, smart public safety, smartcitizen services, smart climate change,etc., Accordingly, ICT enablers and smartsolutions have been identified forovercoming them. Stanislawski (2014)alleges that new solutions vigorouslypushed by ICT companies often fail todeliver the promised benefits – orsometimes any benefits –because theyignore behavioural factors associated withthe problems. Even if there are formalpolicy commitments, behavioural norms ororganizational constraints may well besignificant.
Smart Water Meters
Adoption of Automated MeterReading (AMR) technology in Malkapur,Maharashtra for all 4,200 water
connections enabled the municipality tocharge households for actual consumption,instead of fixed annual tariff. This helpedthe utility to earn a profit of Rs. 3 lakh,whereas it suffered a loss of Rs 32 lakh in2008. Also, citizens will be more prudentin usage of water when they are chargedfor actual consumption, compared to whenthey are levied a flat rate. However,Brihanmumbai Municipal Corporation(BMR) faced problems in maintenanceand picking up remote meter readings anddecided to be more conservative asreplacing a stolen/damaged sensor (dueto unsmart behavior of people) costs Rs.5000 (Seth, 2012).
Sanitation and Hygiene
Indigenous technology has beendeveloped for e-toilets, which are portable,hygienically maintained, and eco-friendlyby using solar energy. They can be (a)GPS enabled to allow entry to onlyauthorized persons and (b) programmedto clean themselves at pre-determinedintervals. They are well ventilated, andhave independent water and seweragesystems. They use convergenttechnologies - electronics, mechanical,web-mobile technologies –are remotelymonitored and can adopt multiple revenueoptions. The insertion of a coin opens thedoor of the e-Toilet for the user, switcheson a light-thus saving energy-and evendirects the person with audio commands(Pareek, 2014). Such mechanisms enablecitizens use public toilets and avoid opendefecation and urination.
Smart Citizens Behaviour – The Core of Smart Cities in India Frame Work 63
Smart Energy Meters
They can help understand andquantify energy use by providing accuratereal time data to households on an in-homedisplay about consumption of electricityand low and high demand periods, so thatcitizens can use appliances in home attimes when demand is low and cost is less.The information can also be accessed bythe energy supplier remotely. Widedisclosure of energy consumption datacould also stimulate favourable changesin behavior. Historical information onenergy use and cost will allow consumersto compare current and past use. A loadlimiter in the smart meter can sendcommand to users to reduce electricityusage when the demand for energy getsout of control. New smart systems wouldprotect consumers from power shutoffsby notifying them about scheduled loadshedding/a power outage by sending textmessages to a cell phone or to the in-homedisplay on the smart meter. Empowermentof consumers with easy and free-of-charge access to real-time data onhistorical energy consumption with the helpof more accurate individual metering willenable them to manage their energyconsumption more efficiently (EuropeanCommission, 2014).
e-Governance
In a number of states in India, anumber of citizen’s services like paymentof taxes, applying and obtaining
certificates and licenses etc., are availableonline either through a central state levelportal or websites of respective ULBs.Some of them are mobile based also. Oneneeds to understand the access to andusage of such services by citizens and if itin consonance with the ownership/usageof mobiles and internet. If not, understandthe barriers for their more effective usageand plan for overcoming them to encouragesmart behavior. New technologies canfoster new relationship between localgovernment and citizens. Behavior(acceptance/rejection/apathy) of citizenshas significant impact on the servicesoffered using new technologies.
e-commerce
Similarly, while there are a largenumber of apps and opportunities forordering/buying numerous things online,how many citizens actually use them.Normally, it is argued that a typical Indianwould like to touch and feel the product,be it rice, fruits, clothes or more expensiveitems like jewelry. Do they see the valueaddition in terms of time and costs savedcompared to going to a store.
e-Health
Tele-medicine/remote consultationenable citizens to consult doctors and otherhealth care staff over telephone/internet/video conferencing to overcome theshortage of qualified medical andparamedical staff, avoid time delay andreduce distance barriers to Quality Care.
64 Local Government Quarterly July - September 2015
m-Health can deliver information(schedule appointments), monitor patients(access blood glucose levels) and offerconsultation and advice with a mobilephone or a connected device. Barrierssuch as poor network (which becomescrucial when you are monitoring a heartpatient); security and privacy of healthcare information, too complex to adopt(such as vast number of languages) needto be understood and addressed to makem-health more acceptable in India.Willingness to pay and a lack of value werecited half as often as other barriers (Lunde,2013).
e-education
Digital India needs to look for digitalsolutions which can motivate the illiterateto learn writing and reading and geteducated. The differentiating elementbetween digital city and smart city is smartpeople, who are well educated. Newtechnologies enable virtual educationoffering benefits like low cost, flexiblehours and greater interaction (ResurgentIndia & CEDAI, 2014).
Smart Behaviour Change Interventions
In light of the above situationalanalysis and potential smart solutions,desirable Swachh and Digital behavior ofcitizens and necessary enabling andfacilitating environment, which areconducive to the development of smartcities in India are given in the tables below
Swachh Behaviour Change
The Table 5 describes importantSwachh behaviours and correspondingfacilitators and enablers.
An evaluation in Delhi (Schlebush,2010) identified issues coming in the wayof wider acceptance of bicycle sharingalong the BRT corridor in Delhi. Theyinclude (a) the policy of returning thebicycle from the place of hiring, (b)uniform cost and no financial incentive forshort trips, (c) need for depositingdocuments every time and (d) low bicycleoccupancy and utilization rate and others.Recently launched Delhi Metro RailCorporation (DMRC) limited cycle sharingservice between the Saket metro stationand the nearby Neb Sarai area, addressessome of the limitations of earlier schemesby allowing registered users to check outa cycle using a smart card and ride for aflat fee of Rs 10 per hour (http://www.cyclesha r ing. in/delhi-metro-launches-cycle-sharing-pilot/). In June2015 the Delhi Development Authority(DDA) formulated a cycle-sharing policyto encourage use of bicycles for last-mileconnectivity. It allows a hired cycle to beused and returned by multiple users anduses a smart card, linked to the useridentity and accepted by Metro, DTCcluster buses, and in shops. Land-owningagencies will provide lanes for non-motorised transport (NMT) and relatedinfrastructure for ensuring safety andmobility of cyclists and pedestrians (PTI,2015b).
Smart Citizens Behaviour – The Core of Smart Cities in India Frame Work 65
Digital Behaviour Change
The Table 6 describes importantDigital behaviours and correspondingfacilitators and enablers.
Technology alone will not besufficient to change the way peopleconsume energy and smart meters needto be accompanied by some incentives andsupport systems to make us change ourbehavior according to Christie, coordinatorof the Sustainable Lifestyles ResearchGroup at the University of Surrey (Portilla,2013). However, Nunes (2014) argues thatusing only economic incentives may notlead to a considerable and lastingconsumption behavior in the context ofsmart grids and recommends creation ofemotional incentives. Awareness and trustare crucial to induce customers to triggera different behavior. The six Es ofemotional incentives are explore,experience, ease, exemplify engage andempower.
Communication Strategies
The Behaviour ChangeCommunication (BCC) should focus onusing multi-media for making peopleaware of need for change, availability ofsmart solutions and the benefits that wouldaccrue to them due to adoption of newtechnology and consequent smartbehavior. This should be followed by useof citizen groups for disseminatinginformation as well as use of the peerpressure. Finally, Inter Personal
Communication to motivate people foractually adopting the new technologies andbehavior. Demonstration of various toolsand application, at places where peoplestill are using manual methods; and enableusers to tryout the methods also will beuseful for early adoption of technologiesand behavior change. Information needsto be communicated through user-friendlyplatforms using multi-media.
Sustenance of changed behavior willdepend on how successful the smartsolutions are, in delivering the tangiblebenefits, promised by them and peopleenjoy the rewards of behavior changeadvocated.
Citizen Consultation and Participation
Citizens in Chennai carried GPS unitswhile travelling in buses to helpTransparent Chennai in mapping routes(Governance Knowledge Center and OneWorld Foundation India, 2010). Anotherimportant behavior change of citizens isactively participating in the consultations,development and implementation of smartsolutions for the building of smart cities.The cities should make necessaryprovisions for participation such as easilyaccessible platforms and by givingfeedback and encouragement.
Crowd-sourcing is an importantmeans of encouraging citizens to reportissues related water, electricity, waste, badroads, dysfunctional street lights etc.,which need urgent at tention fromauthorities.
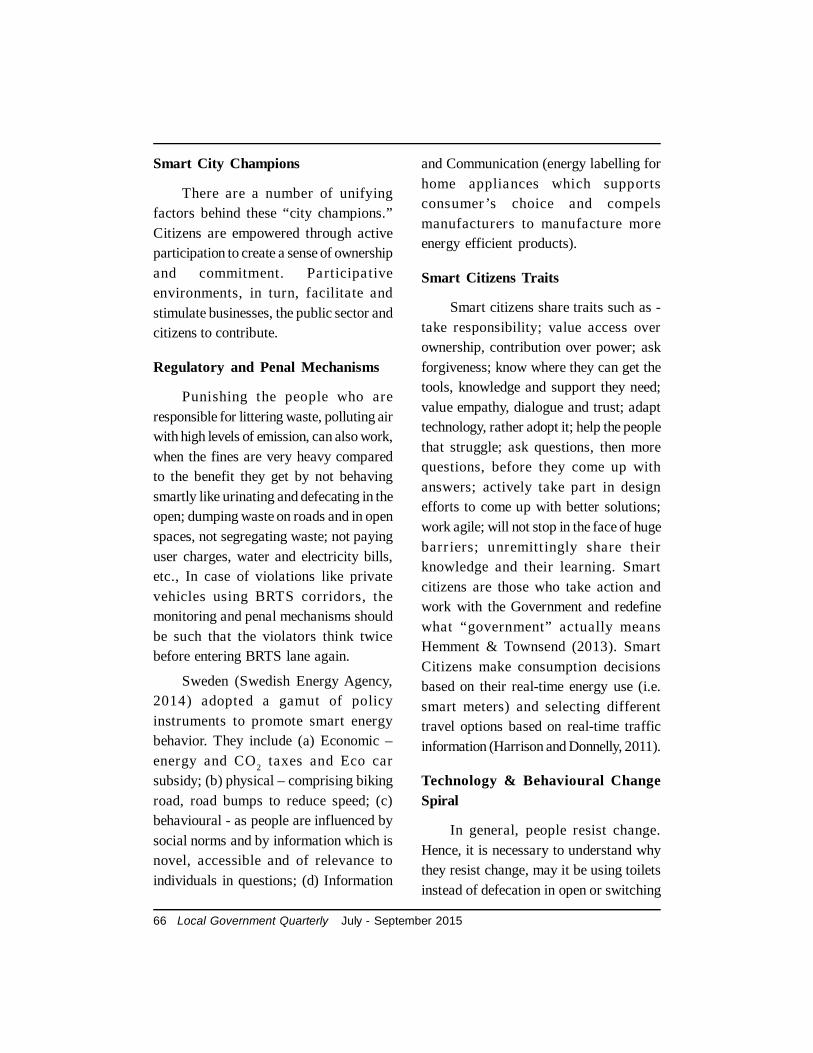
66 Local Government Quarterly July - September 2015
Smart City Champions
There are a number of unifyingfactors behind these “city champions.”Citizens are empowered through activeparticipation to create a sense of ownershipand commitment. Participativeenvironments, in turn, facilitate andstimulate businesses, the public sector andcitizens to contribute.
Regulatory and Penal Mechanisms
Punishing the people who areresponsible for littering waste, polluting airwith high levels of emission, can also work,when the fines are very heavy comparedto the benefit they get by not behavingsmartly like urinating and defecating in theopen; dumping waste on roads and in openspaces, not segregating waste; not payinguser charges, water and electricity bills,etc., In case of violations like privatevehicles using BRTS corridors, themonitoring and penal mechanisms shouldbe such that the violators think twicebefore entering BRTS lane again.
Sweden (Swedish Energy Agency,2014) adopted a gamut of policyinstruments to promote smart energybehavior. They include (a) Economic –energy and CO2 taxes and Eco carsubsidy; (b) physical – comprising bikingroad, road bumps to reduce speed; (c)behavioural - as people are influenced bysocial norms and by information which isnovel, accessible and of relevance toindividuals in questions; (d) Information
and Communication (energy labelling forhome appliances which supportsconsumer ’s choice and compelsmanufacturers to manufacture moreenergy efficient products).
Smart Citizens Traits
Smart citizens share traits such as -take responsibility; value access overownership, contribution over power; askforgiveness; know where they can get thetools, knowledge and support they need;value empathy, dialogue and trust; adapttechnology, rather adopt it; help the peoplethat struggle; ask questions, then morequestions, before they come up withanswers; actively take part in designefforts to come up with better solutions;work agile; will not stop in the face of hugebarr iers; unremitt ingly share theirknowledge and their learning. Smartcitizens are those who take action andwork with the Government and redefinewhat “government” actually meansHemment & Townsend (2013). SmartCitizens make consumption decisionsbased on their real-time energy use (i.e.smart meters) and selecting differenttravel options based on real-time trafficinformation (Harrison and Donnelly, 2011).
Technology & Behavioural ChangeSpiral
In general, people resist change.Hence, it is necessary to understand whythey resist change, may it be using toiletsinstead of defecation in open or switching
Smart Citizens Behaviour – The Core of Smart Cities in India Frame Work 67
to CFL bulbs in place of fluorescent tubesin houses. The causes for resistance varywidely – which could be fear of facing anew situation, or initial costs, or lack ofknowledge of benefits, or simple apathy.Hence, analyzing and understandinghuman behaviour is a key component ofany applied research in Smart Cities.
On one hand acceptance of smarttechnology/solution requires behaviorchange of citizens and on the other handuse of smart technologies can lead tofurther behavior changes. In this chain, itis important that the so called smartsolutions deliver the tangible benefitpromised to the citizens.
For example, adoption of automatedwater Reading Meter technology, will leadto a behaviour change namely paying for
water they actually consume, rather thana fixed annual tariff. This in turn is likelyto trigger another behavior change, namelyusing water more judiciously as theyrealise, they have to pay for water, whichthey also waste. Such acceptance andbehavior change is also likely to facilitateacceptance of similar technologies likesmart electricity meters.
One needs to be wary of unintendedand harmful behaviour changes of ICTimplementation also. Bhoomi, an e-governance initiative in Bangalore, whichis expected to reduce, if not remove,corruption in land dealings, resulted in somepeople monopolizing land holdings throughrapid access to land records in a newlycentralized digital clearing houseTownsend (2013). Is this smart behaviorthat we require in order to build smartcities.
Framework for Smart Behaviour
No amount of water audit or energyaudit will help to reduce the problemrelated to water or energy, when citizens,do not close the tap, when water isoverflowing or switch off lights, fans andTV, when not in use or required. In manybig government office buildings it is notuncommon to see that all lights are stillswitched on in the corridors, even afterall people have left in the night and theplace is locked up. What energy audit willbe able to do or what replacement withLED bulbs will save? CCTV monitoringmay help to identify a wrong doer, but may
68 Local Government Quarterly July - September 2015
not be able to prevent a crime be it rashdriving or molesting a woman, as it willtake quite some time, before help arrives.Hence, cities in India need to give toppriority to Behavior ChangeCommunication (BCC) and otherfacilitators and enablers and investsubstantially, if they want to become reallysmart. Change in behavior requires changein thinking of citizens.
A framework for Swachh and DigitalBehaviour of citizens in the advent ofSmart cities in India is depicted in Figure 1.
References
AF-MERCADOS EMI (2013).Natural Gas Vehicles Securing aSustainable Transport Future for India.Asia Pacific Natural Gas VehiclesAssociation (ANGVA) – 5THInternational Biennial Conference &Exhibition, India. Knowledge Paper, GAILGas Limited, New Delhi. Retrieved fromhttp://www.gailgas.com/pdf/Publication/Knowledge%20Paper%20on%20CNG%20Sector. pdf & Accessed on 15 June 2015.
Aspen Institute (2008). m-PoweringIndia: Mobile Communications forInclusive Growth. Report of the ThirdAnnual Joint Roundtable onCommunications Policy, Gurgaon.Retrieved from http://www.aspeninstitute.org/sites/default/files/content/docs/pubs/M-Powering_India.pdf &Accessed on 13June 13, 2015.
Chauhan, C.P. (2014). CNG car salesdrop as fuel becomes costlier. Retrieved
fromhttp://articles. economictimes. indiatimes.com/2014-01-13/news/46149977_1_cng-prices-cng- cars-ertiga & Accessed on 15June 2015.
CEPT. (2011). City Sanitation Planfor Varanasi. Retrieved from http://www.urbansanitation.org/live/hrdpmp/hrdpmaster/hrdpasem/content/e8451/e8981/e31428/e31429/e41485/eventReport41488/3rdCTF_Report.pdf
CPCB (2012). National Ambient AirQuality Status & Trends in India - 2010,pp 17-22. Central Pollution Control Board,New Delhi. Retrieved from http://www.cpcb.nic. in/upload/NewItems/NewItem_192_NAAQSTI.pdf & Accessedon 8 June 29, 2015.
CPCB. (2015). Air Quality Index onMay 01, 2015 @ 4:00 P.M. CentralPollution Control Board, New Delhi.Retrieved from http://www.cpcb.nic.in/AQI_Bulletin_01052015.pdf & http://www. cp cb . n ic . in / AQ I_ Bu l let in_28062015.pdf & Accessed on 8 June 2015.
Cunningham, N. (2014). NaturalGas-Powered Vehicles Should Be BiggerIn The U.S. Why Aren’t They? Retrievedfrom http://oilprice.com/Energy/Natural-Gas/Natural-Gas-Powered-Vehicles-Should-Be-Bigger-In-The-U.S.-Why-Arent-They.html & Accessed on 15 June2015.
DeitY (2015). Draft Policy onInternet of Things. Department ofElectronics & Information Technology(DeitY), Ministry of Communication and
Smart Citizens Behaviour – The Core of Smart Cities in India Frame Work 69
Information Technology, Government ofIndia, New Delhi. Retrieved from http://deity.gov.in/sites/upload_files/dit/files/Revised-Draft-IoT-Policy.pdf & Accessedon 5 June 2015.
Desai, A.P. (2014). India Crosses300M Internet Users Milestone: IAMAI.Retrieved from http://trak.in/tags/business/2014/11/19/india-300m-internet-users-2014/ & Accessed on 11 June 11, 2015.
Ericsson (2014). Smart Citizens.How internet facilitates smart choices incity life. Retrieved from http://www.er icsson.com/res/docs/2014/consumerlab/ericsson-consumerlab-smart-citizens.pdf & Accessed on 20 May2015.
European Commission (2014.Behavioural Aspects of Smart Cities.(Available at https://setis.ec.europa.eu/energy-research/sites/default/files/library/E R K C _ % 2 0 T R S _ S m a r t % 2 0 _Cities_Behavioural_Aspects.pdf &Accessed on 20 May 2015)
Express Features (2015). Citizens,Not Technology make a Smart City.(Available at http://www.newindianexpress.com/cities/hyderabad/Citizens-Not-Technology-make-a-Smart-City/2015/02/25/article2685116.ece & Accessedon 1 June 1, 2015.
Governance Knowledge Center andOneWorld Foundation India (2010).Transparent Chennai. Case Study.Retrieved from http://indiagovernance.
gov.in/files/gkc_oneworld_ transparent_chennai.pdf & Accessed on 23 June 2015.
Government of Andhra Pradesh(2014). Reimagining Andhra Pradesh.Role of e-Governance, electronics and IT.Information Technology Electronics &Communications Department. Retrievedfrom http://www.aponline.gov.in/apportal/Downloads/Re-imagining_AP_Ver_3.pdf& Accessed on 1 June 1, 2015.
Government of Rajasthan (2006).City Development Plan for Ajmer andPushkar. (http://jnnurm.nic.in/wp-content/uploads/2010/12/final_CDPAjmer-Pushkar.pdf & Accessed on 30 June2015).
Harrison, C., Donnely, I.A. (2011).A theory of smart cities. (Available at http:// j o u r n a l s . i s s s . o r g / i n d e x . p h p /proceedings55th/article/viewFile/1703/572& Accessed on 3 July 2015).
Hemment, D., Townsend, A. (2013).Smart Citizens. Future Every Thing.Manchester, UK. (Available at http://futureeverything.org/wp-content/uploads/2014/03/smartcitizens1.pdf & Accessedon 27 May 27, 2015).
IAMAI (2014). India to cross 300million Internet Users by Dec 2014.(Available at http://www.iamai.in/PRelease_deta il. a spx?nid=3498&NMonth=11&NYear=2014 & Accessedon 17 June 17, 2015).
John, P. (2013). Ahmedabad BRTSgoing down Delhi drain. Times of India,
70 Local Government Quarterly July - September 2015
Dec 16, 2013, 04.16AM IST. Retrievedfrom http://timesofindia.indiatimes.com/city/ahmedabad/Ahmedabad-BRTS-going-down-Delhi-drain/articleshow/27442460.cms & Accessed on 2 July 2015.
Khansari, N., Mostashari, A.,Mansouri, M. (2013). ImpactingSustainable Behaviour and Planning inSmart City. International Journal ofSustainable Land Use and Urban Planning,Vol. 1 No. 2, pp. 46-61. ISSN 1927-8845Retrieved from https://www. sciencetarget.com/ Journal/ index.php/ IJSLUP/article/.../104 & Accessed on 23 June 2015.
Kulthe, B. (2012, may 12). Watermeters detect loss through leakages’.Saturday, 12 May 2012 - 5:08pm IST |Place: Pune | Agency: DNA. (Availableat http://www.dnaindia.com/pune/report-wa ter -meter s-detect -loss- through-leakages-1687901 & Accessed on 18 June2015).
Lunde, S. (2013). The Health Casein India. Telco-led transformation ofhealthcare service delivery in India. WiproCouncil for Industry Research, Bangalore.Retrieved from http://www.wipro.com/documents/the-mHealth-case-in-India.pdf& Accessed on 13 June 27, 2015.
MoUD. (2013). Rapid BaselineAssessment – Allahabad city, draft report.Retrieved from http://jnnurm.nic.in/wp-content/uploads/2014/03/2-Allahabad_Draft-Report.pdf & Accessed on 30 June2015.
MoUD. (2013). Rapid BaselineAssessment – Varanasi, draft report.Retrieved from http://jnnurm.nic.in/wp-content/uploads/2014/03/28-Varanasi-Draft-Report.pdf & Accessed on 30 June2015.
MoUD. (2013). Rapid BaselineAssessment – Visakhapatnam, draftreport. Retrieved from http://jnnurm.nic.in/wp-content/uploads/2014/03/29-Vishakapatnam-Draft-Report.pdf& Accessed on 30 June 2015.
MoUD (2015). Smart City. MissionStatement & Guidelines, New Delhi.Ministry of Urban Development,Government of India.
NASSCOM & Accenture (2015).Integrated ICT and GeospatialTechnologies. Framework for 100 SmartCities Mission. New Delhi NationalAssociation of Software and ServicesCompanies (NASSCOM).
Nunes, J., Albuquerque, S., Pires, G.(2014). Smart Grids Need Smart Citizens.CIRED Workshop - Rome, 11-12 June2014. Paper 0126. Retrieved from http://w w w. c i r e d . n e t / p u b l i c a t i o n s /workshop2014/papers/CIRED 2014WS_0126_final.pdf & Accessed 18 June 18,2015.
Pareek, S. (2014). This e-Toilet isChanging the Way Public Sanitation Worksin India. September 2, 2014. Retrievedfrom http://www.thebetterindia.com/13940/etoilet-changing-way-public-sanitation-works-india-eram-marico/
Smart Citizens Behaviour – The Core of Smart Cities in India Frame Work 71
#sthash.JVLgW8VO.dpuf & Accessedon 2 July 3, 2015.
Portilla, K. (2013). Will smart metersreally help homeowners save energy? TheGuardian, Friday 28 June. Retrieved fromhttp://www.theguardian.com/environment/b log/ 2 0 1 3 / ju n/ 28 / s ma r t -met er s -homeowners -save-energy & Accessedon 3 July 2015.
PTI (2015a). ISB to develop SmartCity Index for Indian cities. Retrieved fromhttp://www.rediff.com/business/report/tech-isb-to-develop-smart-city-index-for-indian-cities/20150311.htm & Accessed on27 May 2015.
PTI (2015b). Najeeb Jung approvescycle-sharing policy for Delhi. Retrievedfrom http://www.ibnlive.com/news/india/najeeb-jung-approves-cycle-sharing-policy-for-delhi-1000239.html & Accessedon 3 June 2015.
Public Health Foundation of India(2014). Ambient Air Pollution and PublicHealth: A Call to Action. Position Paper.New Delhi. Retrieved from http://southasia.oneworld.net/Files/phfi-position-paper & Accessed on 8 June 8, 2015.
PWC & CII (2015). MakingHaryana Smart. PricewaterhouseCoopersand Confederation of Indian Industries.Retrieved from https://www.pwc.in/en_IN/ in/assets/pdfs/publications/ 2015/making-haryana-smart.pdf & Accessedon 1 June 1, 2015.
Resurgent India & CREDAI. (2014).Smart Cities. (Available at http://
www.credai.org/sites/default /files/Conclave-2014-Report-smart-cities.pdf &Accessed on 2 July 2015.)
Rojas-Rueda, D., de Nazelle, A.Tainio, M., Nieuwenhuijsen, M.J. (2011).The health risks and benefits of cycling inurban environments compared with caruse: health impact assessment study.British Medical Journal 2011;343:d4521.doi: 10.1136/bmj.d4521. Retrieved fromhttp://www.bmj.com/content/bmj/343/bmj.d4521.full.pdf & Accessed on 3 June3, 2015.
Schlebusch, S. (2010). BicycleSharing in Delhi - Users EvaluationReport. March 2010. Intern, GTZ-ASEM.Retrieved from http:/ /www.cleanairinstitute.org/cops/bd/file/tnm/66-Delhi-Bicycle-Sharing-Report.pdf & 3June 3, 2015.
Seth, B.L. (2012). Smart but pricey.Down to Earth, Mar 31, Print Edition.Retrieved from (http://www.downtoearth.org.in/content/smart-pricey & Accessedon 18 June 2015.
Singh, A.K. (2005). 30 liters for some,1,600 for others: Inequities in Delhi’s watersupply. (Available at http://www.thehindu.com/features/homes-and-gardens/how-much-water-does-an-urban-citizen-need/article4393634.ece & Accessed on 1 June2015
Stanislawski, S., Jones, R. (2014).Assessing the readiness of smart cities andmajor real estate developments.November 2014. FTTH Council MENA
72 Local Government Quarterly July - September 2015
Smart Cities Operations and ApplicationsCommittee. Retrieved from http://www.ftthcouncilmena.org/documents/Presentations/Assessing% 20 Readiness%2 0 of%2 0 S ma r t%2 0 C i t ies %2 0 -%20White%20Paper% 20- Final_ Nov.14.pdf &
Swedish Energy Agency. (2014).Communicating Energy EfficientBehaviour, Stockholm. (Working paper)Retrieved from http://www. energimyndigheten.se/Global/Internationellt/BEE%20Indien/Working Paper_ Communicating% 20Energy% 20 Efficient%20Behaviour.pdf & Accessed on 28 May 2015.
Tiwari, R. (2012). Smart Mobility forIndia: Needs, Opportunities & Challenges.Germany Hamburg University ofTechnology, Retrieved from http://www.global-innovation.net/team/tiwari/PDF/Smart_ Mobility_ Version_Final_Public.pdf & accessed on 27May27, 2015.
Townsend, A.M. (2013) Smart Cities:Big data, civic hackers, and the quest fora new utopia. New York: W.W. Norton &Co. cited in Sadoway, D. Shekjkar, S.(2014). Re Prioritizing Citizens in SmartCities Governance: Examples of SmartCitizenship from Urban India. The Journalof Community Informatics, Vol 10, No (3).Retrieved from http://ci-journal.net/index.php/ciej/article/view/1179/1115 &Accessed on 19 June 2015
World Health Organization, UnitedNations Children’s Fund. (2013). Progresson Sanitation and Drinking-Water. 2013Update. Joint Monitoring Programme.Retrieved from http://apps.who.int/iris/bitstream/10665/81245/1/9789241505390_eng.pdf & 3 March 2015.)
World Health Organization (2014).Ambient (outdoor) air pollution in citiesdatabase 2014. Retrieved from http://www.who.int/phe/health_topics/outdoorair/databases/cities/en/& Accessed on 8 June2015.
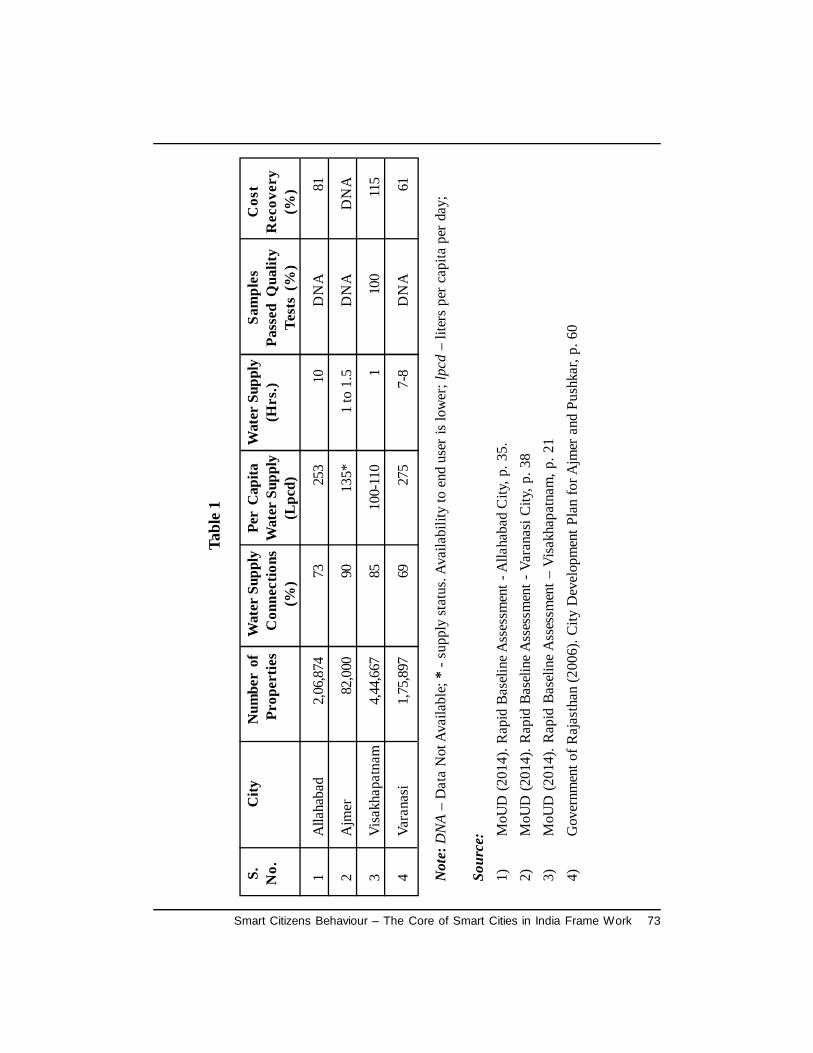
Smart Citizens Behaviour – The Core of Smart Cities in India Frame Work 73
S.C
ityN
umbe
r of
Wat
er S
uppl
yPe
r C
apita
Wat
er S
uppl
ySa
mpl
esC
ost
No.
Pro
pert
ies
Con
nect
ions
Wat
er S
uppl
y(H
rs.)
Pass
ed Q
ualit
yR
ecov
ery
(%)
(Lpc
d)Te
sts
(%)
(%)
1A
llaha
bad
2,06
,874
7325
310
DN
A81
2A
jmer
82,0
0090
135*
1 to
1.5
DN
AD
NA
3Vi
sakh
apat
nam
4,44
,667
8510
0-11
01
100
115
4Va
rana
si1,
75,8
9769
275
7-8
DN
A61
Not
e: D
NA
– D
ata
Not
Ava
ilabl
e; *
- su
pply
stat
us. A
vaila
bilit
y to
end
use
r is l
ower
; lpc
d –
liter
s pe
r cap
ita p
er d
ay;
Sour
ce:
1)M
oUD
(201
4). R
apid
Bas
elin
e Ass
essm
ent -
Alla
haba
d C
ity, p
. 35.
2)M
oUD
(201
4). R
apid
Bas
elin
e Ass
essm
ent -
Var
anas
i City
, p. 3
83)
MoU
D (2
014)
. Rap
id B
asel
ine
Ass
essm
ent –
Visa
khap
atna
m, p
. 21
4)G
over
nmen
t of R
ajas
than
(200
6). C
ity D
evel
opm
ent P
lan
for A
jmer
and
Pus
hkar
, p. 6
0
Tabl
e 1
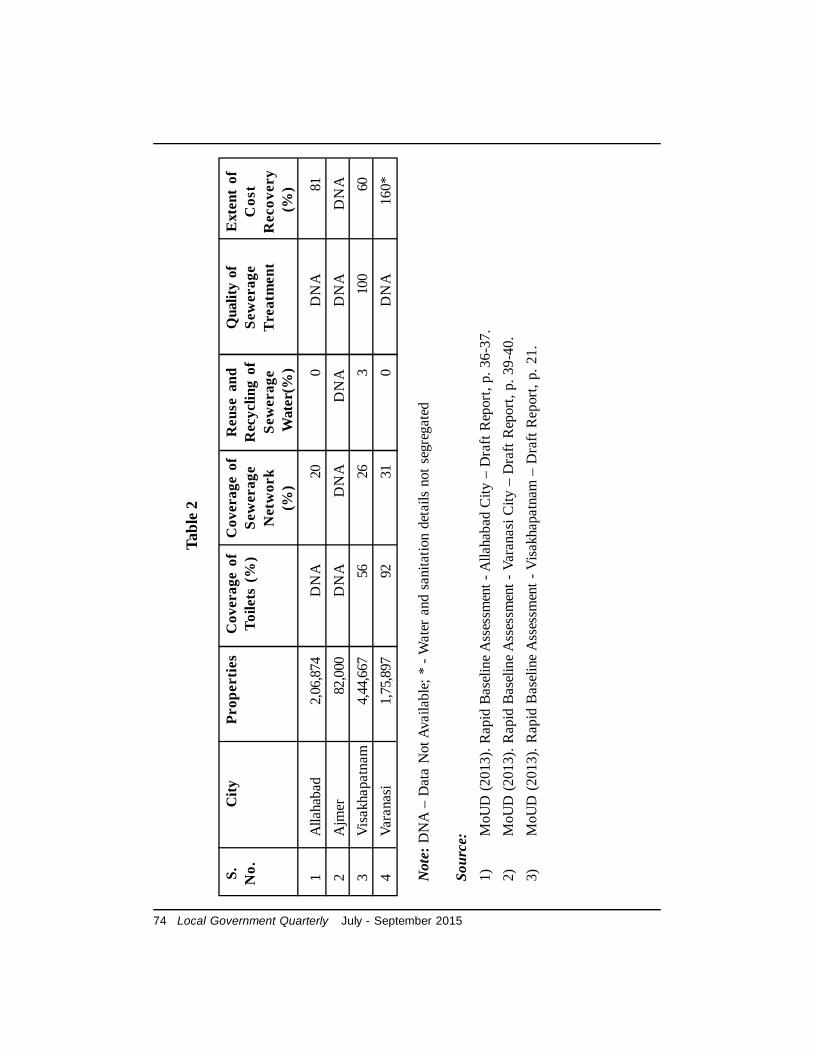
74 Local Government Quarterly July - September 2015
S.C
ityPr
oper
ties
Cov
erag
e of
Cov
erag
e of
Reu
se a
ndQ
ualit
y of
Ext
ent
ofN
o.To
ilets
(%
)Se
wer
age
Rec
yclin
g of
Sew
erag
eC
ost
Net
wor
kSe
wer
age
Trea
tmen
tR
ecov
ery
(%)
Wat
er(%
) (%
)
1A
llaha
bad
2,06
,874
DN
A20
0D
NA
812
Ajm
er82
,000
DN
AD
NA
DN
AD
NA
DN
A3
Visa
khap
atna
m4,
44,6
6756
263
100
604
Vara
nasi
1,75
,897
9231
0D
NA
160*
Not
e: D
NA
– D
ata
Not
Ava
ilabl
e; *
- W
ater
and
san
itatio
n de
tails
not
seg
rega
ted
Sour
ce:
1)M
oUD
(201
3). R
apid
Bas
elin
e Ass
essm
ent -
Alla
haba
d C
ity –
Dra
ft R
epor
t, p.
36-
37.
2)M
oUD
(201
3). R
apid
Bas
elin
e Ass
essm
ent -
Var
anas
i City
– D
raft
Rep
ort,
p. 3
9-40
.3)
MoU
D (2
013)
. Rap
id B
asel
ine
Ass
essm
ent -
Visa
khap
atna
m –
Dra
ft R
epor
t, p.
21.
Tabl
e 2
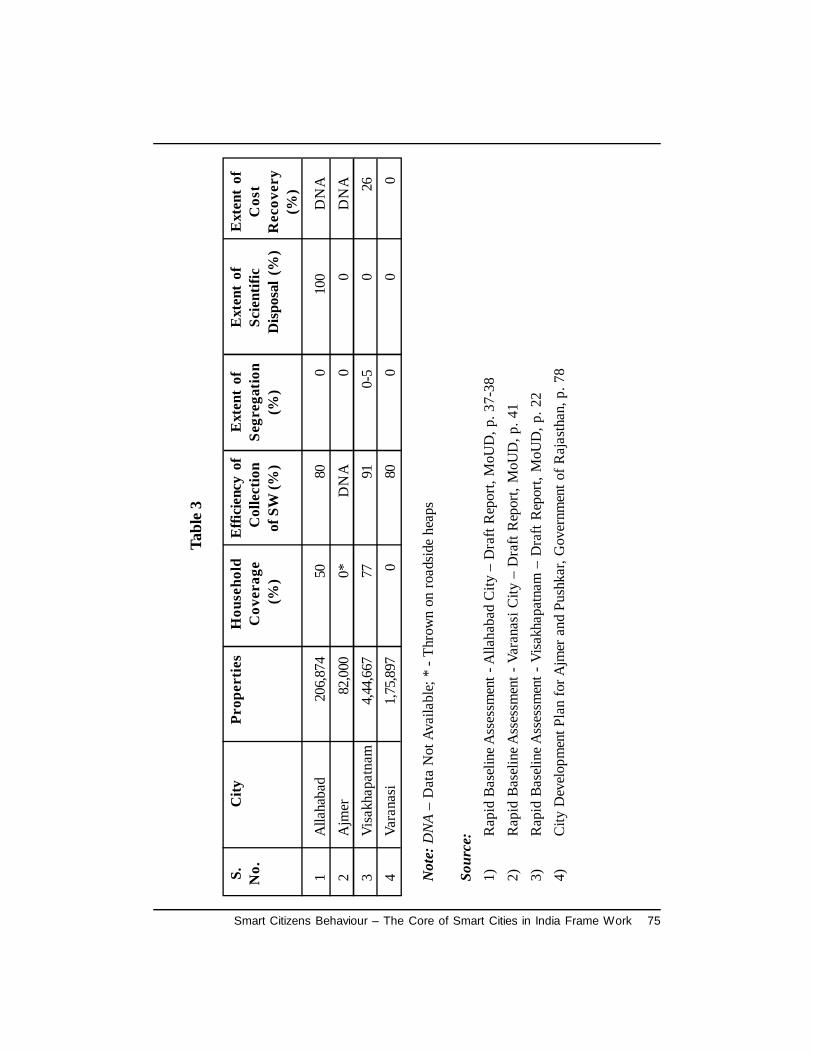
Smart Citizens Behaviour – The Core of Smart Cities in India Frame Work 75
S.C
ityPr
oper
ties
Hou
seho
ldE
ffici
ency
of
Ext
ent
ofE
xten
t of
Ext
ent
ofN
o.C
over
age
Col
lect
ion
Segr
egat
ion
Scie
ntifi
cC
ost
(%)
of S
W (%
)(%
)
Dis
posa
l (%
)R
ecov
ery
(%)
1A
llaha
bad
206,
874
5080
010
0D
NA
2A
jmer
82,0
000*
DN
A0
0D
NA
3Vi
sakh
apat
nam
4,44
,667
7791
0-5
026
4Va
rana
si1,
75,8
970
800
00
Not
e: D
NA
– D
ata
Not
Ava
ilabl
e; *
- Th
row
n on
road
side
heap
s
Sour
ce:
1)R
apid
Bas
elin
e Ass
essm
ent -
Alla
haba
d C
ity –
Dra
ft R
epor
t, M
oUD
, p. 3
7-38
2)R
apid
Bas
elin
e Ass
essm
ent -
Var
anas
i City
– D
raft
Rep
ort,
MoU
D, p
. 41
3)R
apid
Bas
elin
e Ass
essm
ent -
Visa
khap
atna
m –
Dra
ft R
epor
t, M
oUD
, p. 2
24)
City
Dev
elop
men
t Pla
n fo
r Ajm
er a
nd P
ushk
ar, G
over
nmen
t of R
ajas
than
, p. 7
8
Tabl
e 3
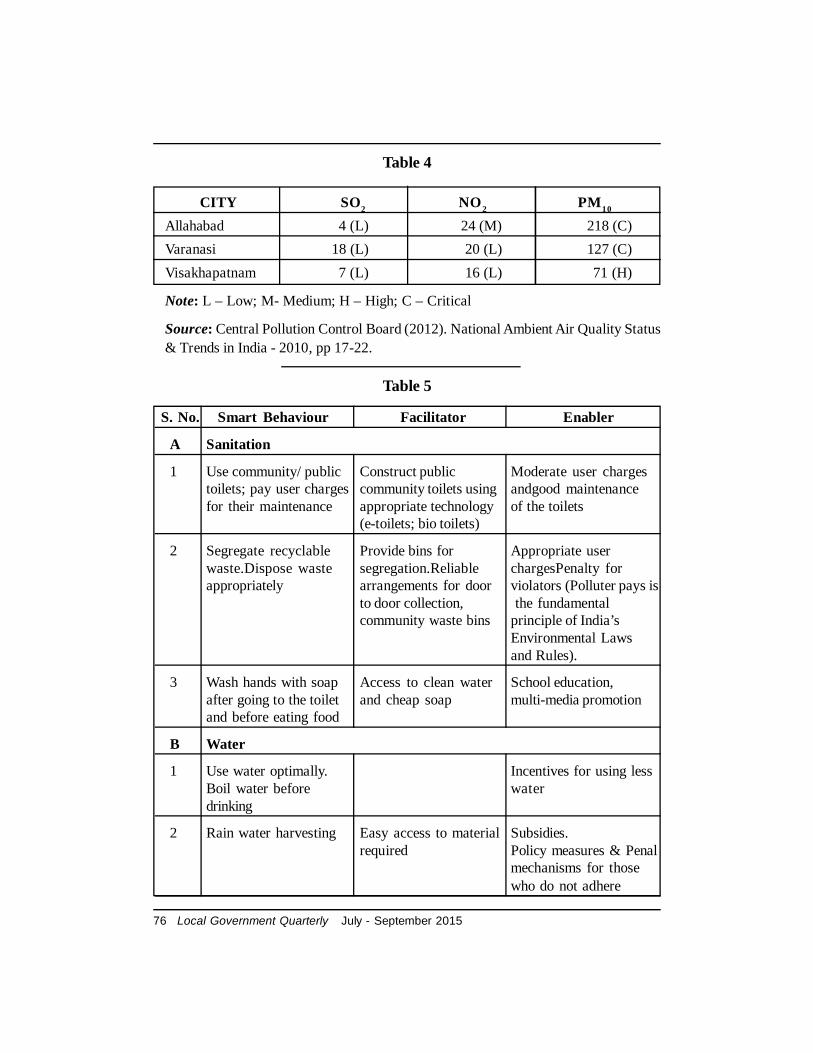
76 Local Government Quarterly July - September 2015
CITY SO2 NO2 PM10
Allahabad 4 (L) 24 (M) 218 (C)Varanasi 18 (L) 20 (L) 127 (C)Visakhapatnam 7 (L) 16 (L) 71 (H)
Note: L – Low; M- Medium; H – High; C – Critical
Source: Central Pollution Control Board (2012). National Ambient Air Quality Status& Trends in India - 2010, pp 17-22.
Table 4
Table 5
S. No. Smart Behaviour Facilitator Enabler
A Sanitation
1 Use community/ public Construct public Moderate user chargestoilets; pay user charges community toilets using andgood maintenancefor their maintenance appropriate technology of the toilets
(e-toilets; bio toilets)
2 Segregate recyclable Provide bins for Appropriate userwaste.Dispose waste segregation.Reliable chargesPenalty forappropriately arrangements for door violators (Polluter pays is
to door collection, the fundamentalcommunity waste bins principle of India’s
Environmental Lawsand Rules).
3 Wash hands with soap Access to clean water School education,after going to the toilet and cheap soap multi-media promotionand before eating food
B Water
1 Use water optimally. Incentives for using lessBoil water before waterdrinking
2 Rain water harvesting Easy access to material Subsidies.required Policy measures & Penal
mechanisms for thosewho do not adhere
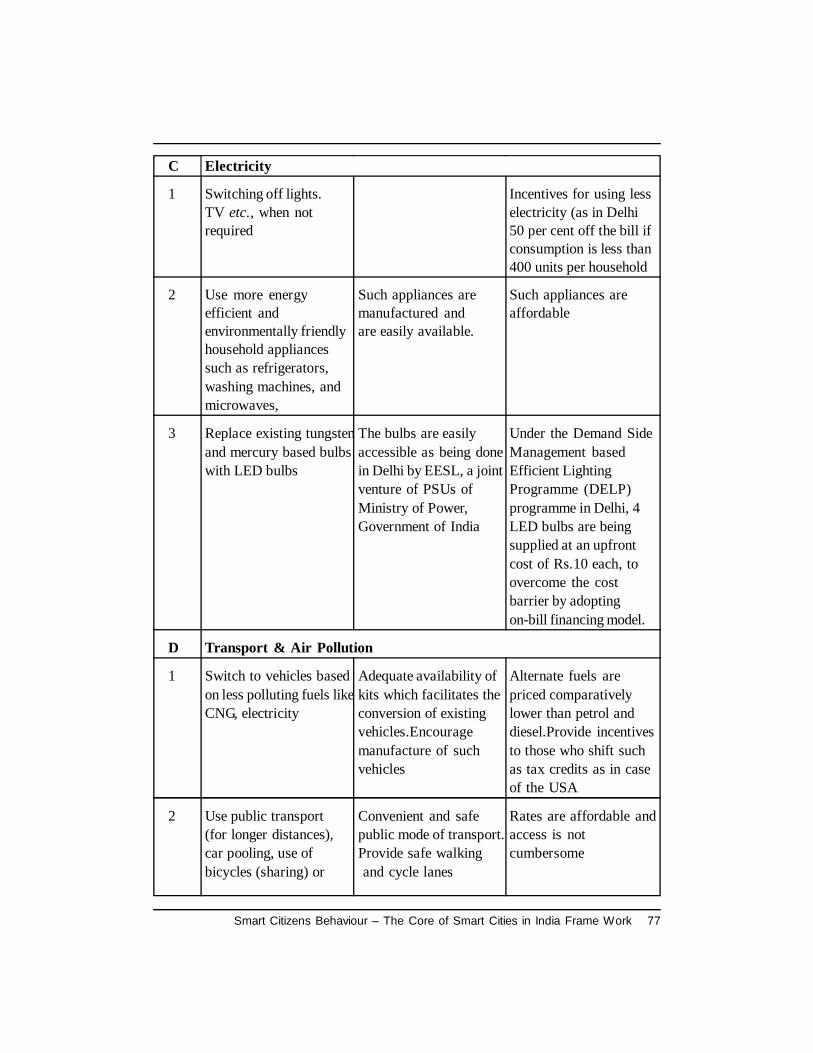
Smart Citizens Behaviour – The Core of Smart Cities in India Frame Work 77
C Electricity
1 Switching off lights. Incentives for using lessTV etc., when not electricity (as in Delhirequired 50 per cent off the bill if
consumption is less than400 units per household
2 Use more energy Such appliances are Such appliances areefficient and manufactured and affordableenvironmentally friendly are easily available.household appliancessuch as refrigerators,washing machines, andmicrowaves,
3 Replace existing tungsten The bulbs are easily Under the Demand Sideand mercury based bulbs accessible as being done Management basedwith LED bulbs in Delhi by EESL, a joint Efficient Lighting
venture of PSUs of Programme (DELP)Ministry of Power, programme in Delhi, 4Government of India LED bulbs are being
supplied at an upfrontcost of Rs.10 each, toovercome the costbarrier by adoptingon-bill financing model.
D Transport & Air Pollution
1 Switch to vehicles based Adequate availability of Alternate fuels areon less polluting fuels like kits which facilitates the priced comparativelyCNG, electricity conversion of existing lower than petrol and
vehicles.Encourage diesel.Provide incentivesmanufacture of such to those who shift suchvehicles as tax credits as in case
of the USA
2 Use public transport Convenient and safe Rates are affordable and(for longer distances), public mode of transport. access is notcar pooling, use of Provide safe walking cumbersomebicycles (sharing) or and cycle lanes
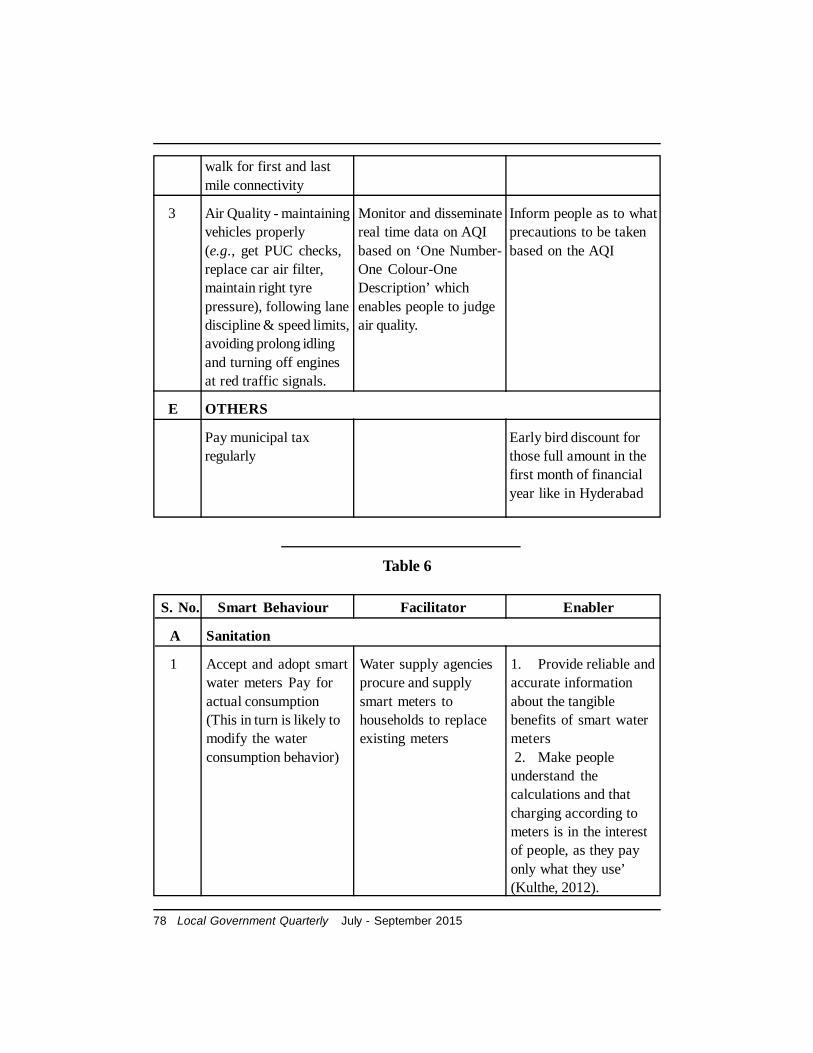
78 Local Government Quarterly July - September 2015
walk for first and lastmile connectivity
3 Air Quality - maintaining Monitor and disseminate Inform people as to whatvehicles properly real time data on AQI precautions to be taken(e.g., get PUC checks, based on ‘One Number- based on the AQIreplace car air filter, One Colour-Onemaintain right tyre Description’ whichpressure), following lane enables people to judgediscipline & speed limits, air quality.avoiding prolong idlingand turning off enginesat red traffic signals.
E OTHERS
Pay municipal tax Early bird discount forregularly those full amount in the
first month of financialyear like in Hyderabad
Table 6
S. No. Smart Behaviour Facilitator Enabler
A Sanitation
1 Accept and adopt smart Water supply agencies 1. Provide reliable andwater meters Pay for procure and supply accurate informationactual consumption smart meters to about the tangible(This in turn is likely to households to replace benefits of smart watermodify the water existing meters metersconsumption behavior) 2. Make people
understand thecalculations and thatcharging according tometers is in the interestof people, as they payonly what they use’(Kulthe, 2012).
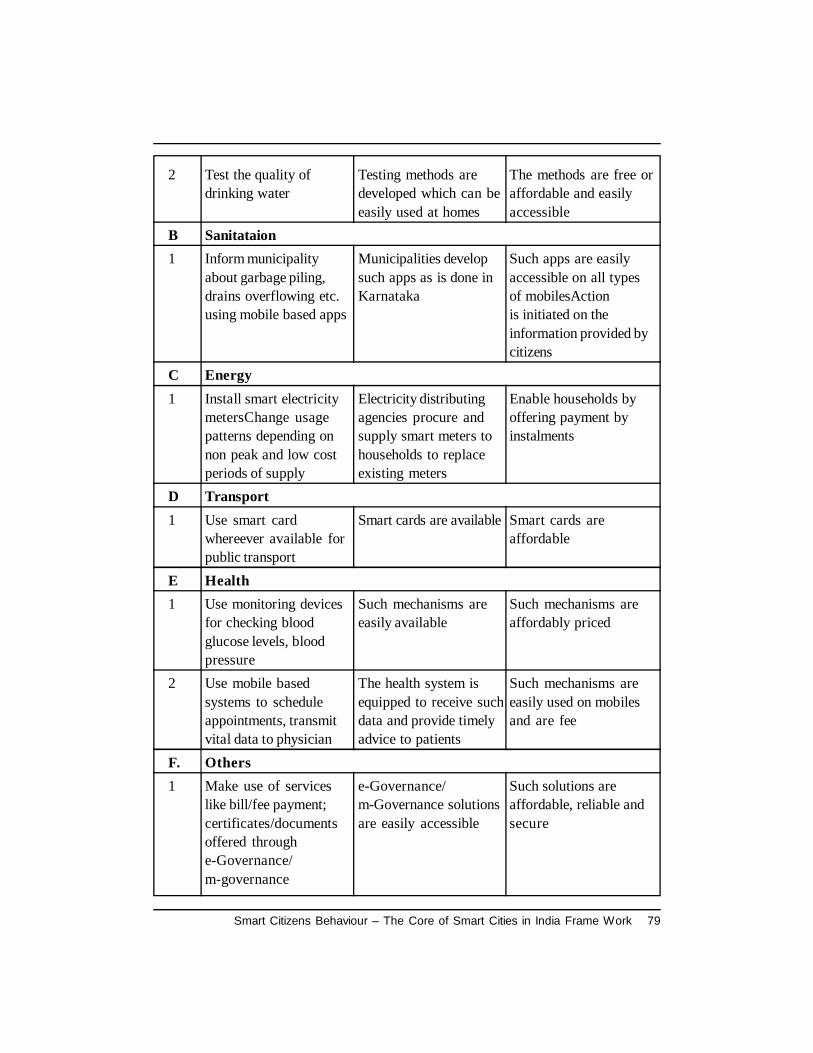
Smart Citizens Behaviour – The Core of Smart Cities in India Frame Work 79
2 Test the quality of Testing methods are The methods are free ordrinking water developed which can be affordable and easily
easily used at homes accessibleB Sanitataion1 Inform municipality Municipalities develop Such apps are easily
about garbage piling, such apps as is done in accessible on all typesdrains overflowing etc. Karnataka of mobilesActionusing mobile based apps is initiated on the
information provided bycitizens
C Energy1 Install smart electricity Electricity distributing Enable households by
metersChange usage agencies procure and offering payment bypatterns depending on supply smart meters to instalmentsnon peak and low cost households to replaceperiods of supply existing meters
D Transport1 Use smart card Smart cards are available Smart cards are
whereever available for affordablepublic transport
E Health1 Use monitoring devices Such mechanisms are Such mechanisms are
for checking blood easily available affordably pricedglucose levels, bloodpressure
2 Use mobile based The health system is Such mechanisms aresystems to schedule equipped to receive such easily used on mobilesappointments, transmit data and provide timely and are feevital data to physician advice to patients
F. Others1 Make use of services e-Governance/ Such solutions are
like bill/fee payment; m-Governance solutions affordable, reliable andcertificates/documents are easily accessible secureoffered throughe-Governance/m-governance
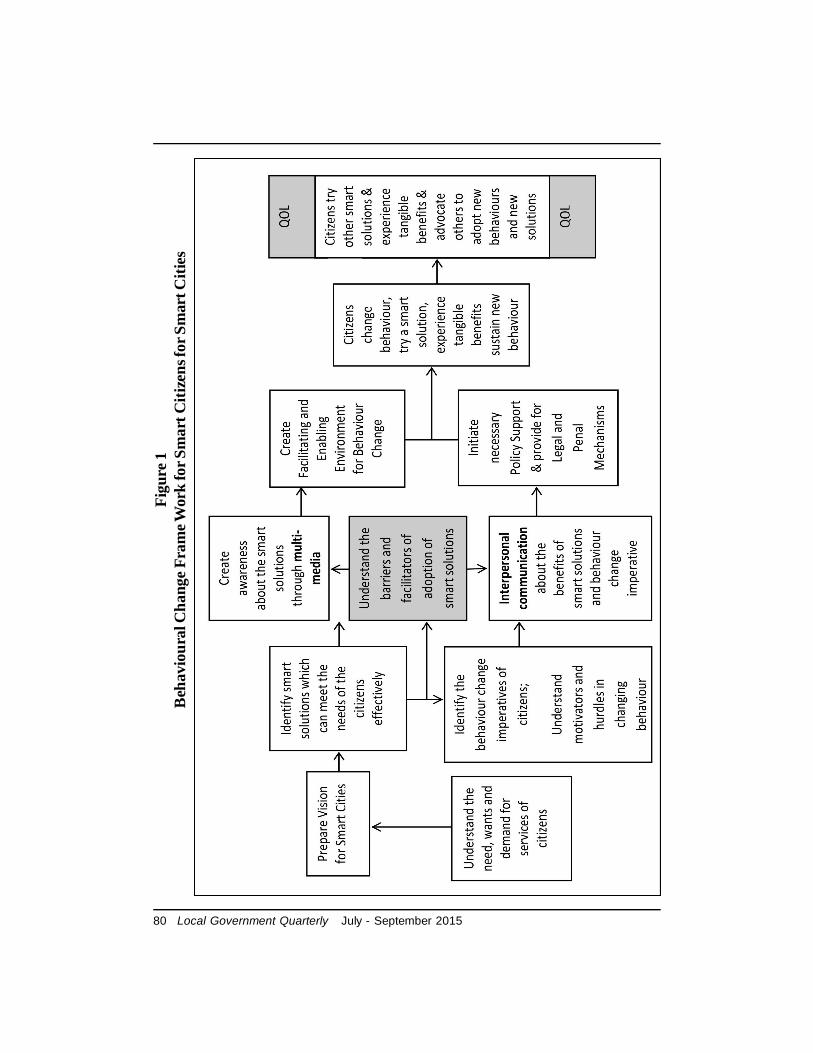
80 Local Government Quarterly July - September 2015
Figu
re 1
Beh
avio
ural
Cha
nge F
ram
e Wor
k fo
r Sm
art C
itize
ns fo
r Sm
art C
ities
Leveraging Land Resource for ULB Finance: Framework and Action Plan for Land Disposal 81
Cities are increasingly coming underpressure to provide urban infrastructureservices to an increasing urban populationin developing countries like India. Localinfrastructure services provision andimprovement in their delivery needs largeresources in the hands of the urban localbodies (ULBs). But, the resources arescarce while the demand for infrastructureis growing rapidly. Therefore, it isemphasized by experts that rapid growthof urban population in developing countrieswarrants greater fiscal performance bothin terms of autonomy of decision makingas well as fiscal devolution (Peterson andClarke 2008). In fact, resourcerequirements of various civic services arevery large in the case of cities and theULBs have to resort to alternateresources for financing infrastructureservice delivery (Nallathiga 2009).
Peterson (2007) points out that urbanlocal governments have more flexibility inmanaging their assets than they do inintroducing new taxes.The latter requires
Leveraging Land Resource for ULB Finance:Framework and Action Plan for Land Disposal
Ramakrishna NallathigaMohd Taquiddin
higher-level governmental approval or itis prohibited by the constitutionalframework. In the absence of a flexibletaxation system, there is a need to designinnovative financing methods to fund urbaninfrastructure projects. One aspect thatreceived much attention in municipalfinances is land assets (Mohanty 2003,Vaidya 2008). It is a fact that variousinvestments made by ULBs on their landfor creating public amenities have aidedthe increase in the land value. Also, withthe rising population, the value of land(both public and private) is on the rise.Thus, urban land is the most valuable assetof the ULBs, since rapid urbanization isdriving up demand for urban land and thusits prices. Hence, ULBs with large landbanks have the potential to realize thebenefits of economic growth by disposingof municipal lands for the purpose ofrevenue generation (Nallathiga 2010).
Across the world, cities areincreasingly looking at the tools to capturepublic land value in order to finance urban
82 Local Government Quarterly July - September 2015
infrastructure development (Peterson andClarke 2008; Peterson 2007). Some of theland based instruments are finding placein resource mobilization efforts by someof the Indian cities too (CGG 2010).However, there are some inherent risksand limitations to this programme. With agreater share of private land, theleveraging effect of public land may belimited and political interference mayfurther jeopardize. Given such potentialrisks of misuse/ abuse from public/municipal authorities, a governanceframework for the same has to be welldefined so that the process is not onlyefficient but also transparent andcorruption-free. In this paper, an attemptis made to list out the important areaswhich need to be considered towardsdeveloping such a frame work for thedisposal of public land to finance keyinfrastructure requirements for sustainabledevelopment.
Land Asset Disposal: Principles andConditions
The following general principles areto be applied to all decisions regarding thedisposal of public lands held by the ULBor similar authority: The ULB shall not dispose land
assets which are essential for thedelivery of civic services or wherethe retention of land is necessary inpublic interest.
Disposal of land assets shall be atmarket value and should ensuremaximum value gain.
Disposal of land assets are to be fullyaccounted for in the appropriatefinancial statements.
The proceeds from land sales shallbe used only for either newinfrastructure investment orpreventive maintenance but not tomeet the routine operation andmaintenance expenditure.
Further, land assets can be disposedsubject to satisfaction of followingconditions
Where there are no strategic reasonsfor retention of excess vacant land
Where land assets are not fullyutilized
Where conflict exists between thecurrent use of a land asset and whatits intended use is from a planningviewpoint (zoning and structureplanning)
Framework for the Disposal ofPublic Land
1. ObjectivesFor achieving the disposal of public
land, a framework needs to be developed.The following are the key objectives ofsuch frame work: To identify the excess/unused land
that has the potential to be sold inconjunction with the demand forfunds
To establish open and accountableprocesses for monetizing the ULBs’lands
Leveraging Land Resource for ULB Finance: Framework and Action Plan for Land Disposal 83
To appropriately plan for theresources required to undertake landdisposal
2. SafeguardsMeasures/safeguards also have to be
ensured for the disposal of public land sothat there is no adverse impact on the
social amenities of the locality inwhich the land is located
Development potential of adjoiningland is not disturbed
The process is undertaken in an openand accountable manner and inaccordance with law
Community participation in theprocess in enabled
3. Valuation
There should be maximum return tothe ULB from the sale of land. Thevaluation should be used as a benchmarkfor the sale.
The valuation of land proposed fordisposal should be based on marketvalue
Valuations can be obtained fromeither the Municipal Valuation Officeor an independent valuer
Phased Approach to the Disposal ofPublic Land
The public land disposal has to bedone in four key stages:
Evaluation,
Implementation,
Disposal,
Risk management.
1. EvaluationThe first stage of evaluation
represents the means through which theULB identifies and evaluates alternativeoptions in respect of its land portfolio. Theprocess should take into account publicinterest considerations. These include:
Where an underutilized land assethas some form of communitysignificance,
Where an underutilized land assethas strategic significance for futureinfrastructure development
Where there are significant heritage,environmental or public usageaspects associated with the landasset
2. ImplementationThe ULB shall manage its land
disposal process in accordance with legalrequirements. The ULBs Planning divisionshall closely involve its solicitors at criticalstages of the land disposal process to assistin maintaining legislative compliance.
The asset disposal plans should coverthe same period of time as CapitalInvestment Plan of the ULBs. Theimplementation mechanism for disposalmust be carefully chosen to ensure thatthe disposal of assets is carried out to:
Satisfy probity considerations
Provide adequate and equalopportunity to purchasers
84 Local Government Quarterly July - September 2015
Achieve the best return toULB
Avoid any adverseenvironmental impacts.
3 Disposal
Disposal will generally be by auction(public) or tender (competitive) and thechoice of instrument has to be made basedon an assessment of likely participants,their familiarity with the instrument, theircultural background and organizationpriorities.
Auction is a common method ofasset disposal that is morestraightforward and the process isopen to public scrutiny. In somecircumstances, the environment of anauction may generate a higher price;but the price can also be broughtdown by collusion amongparticipants. Further, any auction hasto be held in a pre-determinedprocess, which can be simplifiedthrough an e-auction.
Tender is preferred where morecontrol over the actual disposal ofasset is required or where thecredentials of the buyer need to beassessed in detail. Tender has anadvantage of the person/ agency notphysically present and negotiationwith a tenderer is always possibleafter shortlisting/evaluation.However, tendering may at times
lead to bias/ favour and non-competitive environment may lead toinappropriate price discovery.
4. Risk management
There are certain risks associatedwith land based financing of infrastructure.The sale of lands generates a large amountof money to the ULBs through such off-budget transactions, which has a potentialfor wastefulness and corruption. If thedisposal process is not supported bycompetent and professional advice and theuse of accurate and relevant information,this may result in:
inadequate return on thedisposal of land
poor coordination of cashflow with capital investmentrequirements
Therefore, clear institutionalarrangements need to be made foraccounting the revenues generated by landsales and utilizing such funds for wellplanned actions.
Governance and Action Points forImplementation
1. Governance
The following is the broadgovernance framework for disposingpublic land:
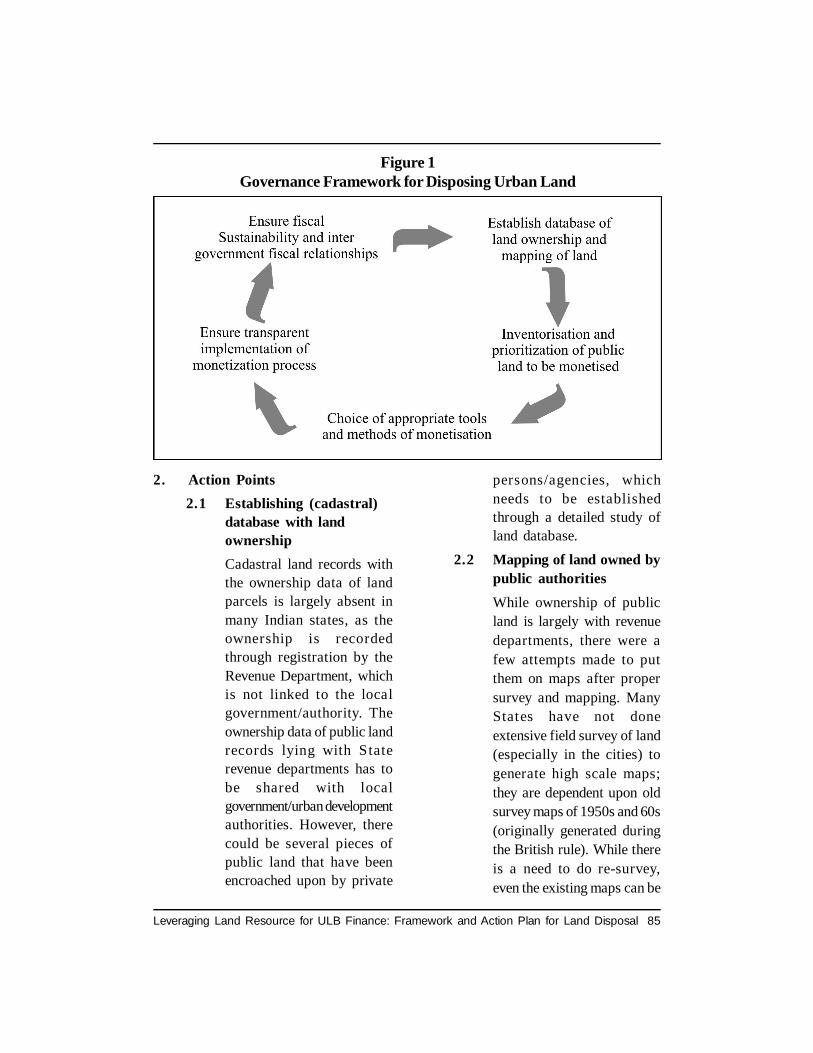
Leveraging Land Resource for ULB Finance: Framework and Action Plan for Land Disposal 85
2. Action Points2.1 Establishing (cadastral)
database with landownershipCadastral land records withthe ownership data of landparcels is largely absent inmany Indian states, as theownership is recordedthrough registration by theRevenue Department, whichis not linked to the localgovernment/authority. Theownership data of public landrecords lying with Staterevenue departments has tobe shared with localgovernment/urban developmentauthorities. However, therecould be several pieces ofpublic land that have beenencroached upon by private
persons/agencies, whichneeds to be establishedthrough a detailed study ofland database.
2.2 Mapping of land owned bypublic authoritiesWhile ownership of publicland is largely with revenuedepartments, there were afew attempts made to putthem on maps after propersurvey and mapping. ManyStates have not doneextensive field survey of land(especially in the cities) togenerate high scale maps;they are dependent upon oldsurvey maps of 1950s and 60s(originally generated duringthe British rule). While thereis a need to do re-survey,even the existing maps can be
Figure 1Governance Framework for Disposing Urban Land
86 Local Government Quarterly July - September 2015
put under appropriate formatse.g., digital map files ratherthan image files, so that theycan be printed, preserved andused widely.
2.3 Inventorisation of public land
Following the establishmentof ownership and mapping, aninventory of public land canbe prepared and shown on themap so that the location aswell as the type of public useto which the land is put canbe indicated. The specificuses to which it has been putcan be further added using theexisting land use map of thelocal government/authority.This gives an effective anduseful inventory of public landwith current use. This alsogives an idea of whether theland is under encroachmentor not, which can be furtherpursued by detailed check onthe ownership of land.
2.4 Prioritisation of public landto be disposed of
Once an inventory of land useis prepared, the prioritsationof public land which is inexcess can be done and it canbe shown on map showing thesize of land parcel, currentuse, development potential (asinferred from designated use
under master plan) and thecommercial/real estate valueof land parcel (as per thevaluation done byprofessional valuers). Theprioritization can givepreference to such lands withlow current use, highdevelopment potential andhigh real estate value. Also,the land which is free of anylitigation or encroachmentmay get preference over otherland so that the proceeds canbe realized without any majorhurdles. The encroached ordisputed land has to be takeninto possession before movingto its lease or sale.
2.5 Choice of appropriatetools of disposal
There are three major tools forachieving monetization:
(a) Lease of public land and/orproperty
(b) Sale of public land and/orproperty
(c) Exchange of public land and/or property. Each of the toolshas its own advantages anddisadvantages.
Leasing will enable retention ofownership but realization of marketrent (if revision of rent is periodic andon agreed principle) but there haveto be systems and capacity for
Leveraging Land Resource for ULB Finance: Framework and Action Plan for Land Disposal 87
protecting and monitoring the leasedeeds as well as renewal/ possessionafter the expiry of lease period.
Sale of land allows immediatecapture of market value of public landand/ or property and improves fiscalposition but it needs to be governedcarefully and may lead to loss of itfor future use. The past experienceand future risks may be kept in mindbefore choosing the right tool.
Exchange of land can be used as aninstrument if the right options toexchange exist with the othergovernment agency/ department.2.6 Choice of appropriate
methods of disposalApart from the choice ofdisposal tool, it is the methodunder which the disposaltakes place which is muchmore important. The methodhas to be efficient and yieldmaximum value to thegovernment, for which publicauctions are widely used.Within the auctions, openauctions are considered to bethe better as they allow theprice to be revealed to othersso that they can revise theirown bids, which is not possiblein a closed auction as itfollows the placement of bidin sealed manner.
However, even open auctions areonly efficient if there are more seriousparticipants that compete for the public
land being auctioned. For this, the auctionprocess has to follow good governanceprinciples - transparency, accountabilityand participation. The potential participantshave to be informed well in advanced andit has to be widely notified in newspapers.The public auction terms and conditionsshould be explicit and such that they donot provide any scope for mischievous playon the part of participants, e.g., proxyparticipation, corruption, cartelization etc.Framing appropriate rules under whichauctions will be held is an important stepthat requires legal and practical knowledge.
E-auctions (on the lines ofe-tendering of public works, which is nowwidely used for procurement of materialand services) are open auctions that arenot only efficient but also can giveadvantages of giving better control overauction process (in an IT enabledenvironment) as well as giving betterknowledge of the participants. However,it needs to be ensured that either theparticipants are technologically savvy orthey have other channels to participate inthe auctions.
2.7 Ensuring that the disposalis fiscally sustainableDisposal of public land shouldalso keep the fiscal conditionof local government/ authorityinto consideration. It shouldnot make the localgovernment/authority tooliquid with the cash flow frommonetization; neither it should
88 Local Government Quarterly July - September 2015
become an expensive processto execute, both of which willaffect fiscal sustainability. Aphased approach needs to beadopted to the monetizationprocess, with a targetestimated value to bemobilized through monetizationset in each stage so that itcomplements the budget -capital income – of the ULBs.
Overzealous land sale/leasing alsohas the pitfall of under-realisation of thepotential value when the markets of land/real estate are not fully developed orprepared to absorb it at the right price/quantity. Some of fiscal measures likesetting limit/cap on the proportion of theamount from land lease/sales to totalincome or revenue income is one way ofsetting controls. Also, the plans may beplaced before municipal council or standingcommittee of the ULB for approval.
2.8 Ensuring that the entireprocess is transparent andproceeds are knownThe aim of disposal processis to capture the real estatevalue of public land lying idlein money terms so that itimproves/strengthens thefinances of local government/authority and othergovernments. However, as itpertains to public land,transparency has to bemaintained at all levels —
from preparation to processto proceeds. The details ofpublic land to be monetizedhave to be kept in publicdomain (print and electronic)so that both general public aswell as serious participants(e.g., developers, investorsand businesses) would knowwell about it.
The disposal process has tobe implemented in atransparent method so that itwould not give rise to anybiased or manipulatedoutcome. Based on the choiceof instrument – tender orauction – modus operandi andpreparation have to be inplace for the conduct ofprocess to be followed underit. The proceeds frommonetization have also to bedeclared in public (throughmedia) and placed in thebudget documents of localgovernment/authority andother concerned governments.
2.9 Ensuring that the inter-governmental fiscalrelations would not becompromised
The monetization process hasdifferent implications to different levels ofgovernments. While it improves fiscalcondition of lower tiers of governments, itshould not put the finances of these
Leveraging Land Resource for ULB Finance: Framework and Action Plan for Land Disposal 89
governments at the risk of getting penalizedfor such action (as capital and revenuegrants devolved by union/state governmentuse per capita revenue as an importantmeasure for determining transfers). It isessential that the process is isolated fromthe grant making criteria of nationalgovernment.
At the same time, the proceeds fromdisposal of land should give adequate fundsto local governments/authorities so thatthey take care of urban infrastructuremanagement in a better manner, with thefunds going to either capital formation orpreventive maintenance. Monetisation.however, should not be seen as a meansof abiding the provisions of FiscalResponsibility and Budge Management(FRBM) Act by the State governments(local governments have balanced budgetrequirement).
2.10 Utilising the proceedstowards urban infrastructure- developing ring-fencedbudgets
An important objective of thedisposal programme is to help the urbanlocal governments to mobilize fiscalresources to undertake capital works andtheir maintenance so that the urbaninfrastructure development does not stopfor the want of funds. Therefore, it isimportant to ensure that the proceeds fromthe land auctions are used for the creationand maintenance of urban infrastructure,but do not get lost in general budget. Thisrequires earmarking the proceeds from
monetization into urban local governmentbudgets to be deployed/used for urbaninfrastructure only.
This can be better done through thedevelopment of ring-fenced funds for thedevelopment of urban infrastructure. Thecurrent local government accounts are notstructured with reference to infrastructureservices, except a few cities like Mumbai.With the preparation of infrastructureservice oriented budgets, the proceedsfrom monetization of urban land can bewell deployed and used for thedevelopment of urban infrastructurethrough adequate plans for the same i.e.,Capital Improvement Plan (CIP), in placebefore hand, which is now mandated underJNNURM.
Conclusion
This paper has set out a frameworkfor the disposal of public land in the caseof ULBs in India so that they can utilizethis opportunity towards providing betterinfrastructure service delivery without anyfiscal hurdles. By following the principlesoutlined in the process of land disposal, itis hoped that the ULBs will provide betterservices with infrastructure and ring-fencetheir budgets towards financing them.
References
CGG (2010, December 20-21),Utilising Land as a Resource. InProceedings of the national workshoporganized by the Centre for GoodGovernance (CGG). Hyderabad.
90 Local Government Quarterly July - September 2015
Vaidya, Chetan. (2008, June 28).Innovative Resource Mobilisation inIndia. Paper presented at the NationalWorkshop on Resource Mobilisation inIndia. Centre for Good Governance,Hyderabad.
Mohanty, P. K. (2003): FinancingUrban Infrastructure: Some InnovativePractices of Local ResourceMobilisation, (CGG Working Paper),Hyderabad : Centre for GoodGovernance.
Nallathiga, Ramakrishna. (2009).Resource Mobilisation for UrbanDevelopment: Some Options for andexperiences of ULB’s in India, (CGGWorking Paper) Hyderabad : Centre forGood Governance.
Nallathiga, Ramakrishna (2010).Land based Resource Mobilisation forUrban Development, (CGG Working
Paper). Hyderabad : Centre for GoodGovernance.
Peterson, George E. (2007): Unlockingland values to finance urban infrastructure,The World Bank and PPIAF, WashingtonDC : The world Bank
Peterson, George E. and Patricia,Clarke Annez. (2008). Financing cities:Fiscal Responsibili ty and UrbanInfrastructure in Brazil, China, India,Poland and South Africa. The WorldBank, New Delhi : Sage Publications.
Pandey, K.K. (2011). StimulatingRevenue Base of Municipalities. NewDelhi : Indian Institute of PublicAdministration.
RBI-DRG. (2008). Municipal Financein India- An Assessment. Delhi:Development Research Group, ReserveBank of India.
Where are we on Decentralization? 91
Kerala has conducted severalexperiments in decentralization and has alot to share with other states and countries.No other Indian state has displayed asmuch enthusiasm and passion indecentralization as the state of Kerala. Itis a sharing and learning experience of thedecentralization process for others. It isworthwhile looking at the experience ofdecentralization in other states andcountries from the perspective of theexperience that Kerala has gained in thecourse of implementing the 73rdAmendment to the Constitution of India.In the twenty years of democraticdecentralization efforts that have takenplace in Kerala, what are the takeawaysfor other states. It has to be evaluatedthrough an introspection process by thestate governments themselves in India aslocal governance is a state subject. TheCentral government has its own limitationsand hence it cannot exert direct pressureon the state governments to devolvepowers to local bodies. Through the
Where are we on Decentralization?
G. Palanithurai
decentralization process what has Keralasociety gained, what innovations havebeen done in governance - these have tobe assessed. It is a well known fact thatdecentralisation process in Kerala is notflawless. It has its own short comings anddrawbacks. They are to be evaluated.Kerala government is open to learn andkeen to receive advice.
Practically speaking, a ten yearperiod is sufficient to evaluate theperformance of any political regime. Now,twenty years have gone by after enactingthe 73rd and 74th amendments to theConstitution of India. Hence, it isappropriate to evaluate the performanceof the local bodies and to generatetheoretical nuances of decentralization ofpowers in India. Many of the theoreticalpropositions on decentralization have to betested in the new context. Manytheoretical prepositions could have beenevolved by this time on democraticdecentralization of powers in India.Unfortunately, there was no such serious
92 Local Government Quarterly July - September 2015
attempt on the part of the academics eitherin India or abroad. In my opinion barring afew, based on initial decentralizationactivities, no worthwhile document hasbeen prepared on the strengths andweaknesses of democraticdecentralization even in Kerala. Keralahas undertaken some unique exercises indecentralization in the last two decades.People have been mobilized for localgovernance through local planning. Suchexercises have not been undertakenanywhere in India on such a massivescale. Kerala state has traditionally beinggoverned by either of two fronts the LDFor the UDF. Yet the decentralizationprocess has always remained in focus.Though, the LDF took the initiative to giveshape to the new local body system inKerala, the subsequent UDF regime alsocarried it forward. Thus, local governanceculture has been created in Kerala. Ofcourse documentation have been done.They are narratives and are in Malayalamand not in English. However, a deepanalysis has to be done on different aspectsof decentralization with the objective ofevolving theoretical nuances ondecentralization. There are some pathbreaking studies on Kerala’s socialtransformation. In the light of these works,an anthology has to emerge on thetransformative process of Kerala societythrough research analysis on thedeepening of democracy in Kerala. Thereare certain aspects of decentralizationwhich are vibrant even after twenty years
in Kerala. There are also certain areas indecentralization which are regarded asunique in decentralization which are notas vibrant as they were in the initial stages.
Decentralization processes andpractices have to be analyzed from theperspective of sustainability. A realisticanalysis and evaluation is needed at presentto understand whether we are progressingor regressing. This evaluation has to beundertaken by a team of scholars, bothfrom other states in India and from abroadwho have contributed richly indecentralization. Barring a few individuals,no university in Kerala has taken earnestefforts to organize scholars to pursuedeeper research analysis ondecentralization in Kerala. Academicapathy on decentralization is not unique inKerala, it is an all India phenomenon. Tilldate, there is no organized effort amongthe academics to form a group of scholarsto pursue research on decentralizationcontinuously to strengthen localgovernance systems in India throughpolicy advocacy. But, I found that thereare a few scholars from abroad evincingkeen interest in analyzing the impact ofdecentralization of powers. These scholarswork as teams. But in India, there is nosuch team work. Till date, there is no suchinitiative to organize a research academyexclusively for doing research indecentralization.
Opportunity Missed
In the last two decades we had aninspiring journey in decentralization as
Where are we on Decentralization? 93
three million representatives of the peoplehave been in various positions ingovernance institutions of which over onemillion are women representatives.Among the three million, around 20 percent are from marginalised communities.It is being viewed by the scholars as apath breaking democratic experience atthe community level as social conditionsin India are often not in synch with thecore values of democracy. The processof democratization of communities isunique and needs to be researched andanalysed. While perusing the existingliterature, both macro and micro, onewould find that the local bodies deliverservices and goods despite obstacles andbarriers1. They argue for more powers andresources to local bodies to perform moreeffectively and efficiently than at present.Having seen the potential, why both thecentral and state governments are notkeen in strengthening the local governancesystem is a big question among many2.
As we have positive environmentalconditions and basic structures forconducting free and fair elections, massivelocal body elections had been conducted.In a democracy, both ruling and oppositionhave active roles in governance. In Indiaopposition cannot be ignored or crushed.They have a vibrant, active voice ingovernance. People tend to changeregimes. Worrisome social sector issuesin India can be tackled through activemicro action as institutions for governanceand development are in position. If they
are strengthened, activated,professionalised, conferred with adequatepowers, functions and functionaries, thenissues like hunger, malnutrition, anemia,sanitation, water supply, illiteracy, dropouts in school can be addressed. In thetwenty years journey there have beencertain states taking earnest efforts to putthe local body institutions in place withpowers, finance and competent persons.As a result, these institutions were ableto make an impact on society. Many ofthe states are still reluctant to strengthenthe local body institutions and they havemissed an opportunity of using the newarrangement.
There are reasons for this kind ofreluctance. One is obvious that themembers of Legislative Assembly find thelocal body leaders are active competitorsin the political process as they maintainclose contact with people through theirdevelopment activities. There is yetanother reason, namely that the membersof State Legislature may need the supportof the local body leaders to progress inthe political career. Some stategovernments feel that the decentralizationcarried out in India is partial in nature. Thepowers tend to devolve from the centralgovernment to state government have notbeen devolved further. Slowly federalgovernment is taking away the vitalpowers of the state governments. At thesame time through the 73rd and 74thconstitutional amendments, states havebeen asked to devolve powers to local
94 Local Government Quarterly July - September 2015
bodies. Some of the regional politicalpart ies powerfully argue that thisdecentralization is a strategy to weakenthe state government3. Knowing fully wellthat decentralization delivers benefits tothe poor, why state governments and eventhe central government are not taking harddecisions to push decentralizationeffectively. This paradox has to beexplained through research.
Micro Planning
While, recently the Central PlanningCommission has been abolished, theDistrict Planning Committee has not beendone away with as it is a constitutionalbody. In the subsequent announcement, ithas been reiterated that the DistrictPlanning Committee will be strengthenedfor the purpose of preparing localdevelopment plans. The fact of the matteris only a few states had taken initiativesfor micro plan. Many of the states havenot taken any step in this regard. It is ablatant violation of a provision in theconstitution. Now, the Fourteenth FinanceCommission has given itsrecommendations for strengthening thelocal governance system through planningat Panchayat levels4. Huge amount ofmoney goes to Panchayats and they haveto be spent for basic services and facilities.Even after raising the revenue share ofthe states from 32 per cent to 42 per cent,the commission has recommendedsubstantial increase in allocation to localbodies. While going through the figures,
one would assume that each and everyGram Panchayat would be able to provideall basic facilities and services to the peoplein the villages by using the money abovethrough a process of Par ticipatoryPlanning at the Gram Panchayat level. Ithas to be seen to what extent the CentralGovernment will push this planningexercise to be implemented at GramPanchayat level. Here it is to be notedthat the Panchayat Raj Ministry had abudget allocation of Rs. 7000 corespreviously but at present it has beenreduced to Rs. 90 Cores. Why this cut?This is to be understood. It is presumedthat the large allocation for backward arearegion development fund scheme to cover272 districts has been stopped. Here onehas to see as to what extent this Schemehas helped strengthen the Panchayati RajSystem in the scheme operated districtsin India.
Core Functions Missed
Local bodies have to work foreconomic development and social justicewhich includes gender justice. It isessential to assess the performances ofthe local bodies from the perspective ofcore functions assigned to local bodiesthrough the act passed in parliament.From both micro and macro studies onewould find the deviation of the localgovernments from the assigned corefunctions. In fact, we have witnessedsocial conflict and social tension in the
Where are we on Decentralization? 95
rural areas. But, the local bodies arecompletely relegated to the background.There is no organised effort to gear upthe local bodies to concentrate on the corefunctions assigned to the local bodiesstatutorily.
Transformational Leadership
Through a cursory analysis one willfind the emergence of unique leadershipfrom the grassroots institutions. They areof different types. There are certainstrikingly distinct qualities developed by theleaders in the process of working withcommunities, organizations and institutionsto mange development at the grassroots.Their leadership qualities are unique to bedocumented and analysed. So far no suchstudy has been done on this area. A fewmicro studies have been conducted5. Yetconceptual and theoretical nuances havenot been developed in those studies. Inthe backdrop of the theory ontransformational leadership, acomprehensive study can be carried outin India.
Questions to be answered
Twenty years have passed inpracticing democratic decentralization inIndia and what are all the impacts onsociety due to decentralization? Have wedone any comprehensive analysis? Havewe moved beyond the three ‘F’s andactivity mapping in our analysis? What isthe literature generated on decentralizationthrough research? What are all the new
research methodological nuances evolvedover a period of time to study the newdecentralization process? Do we havedocuments on the new democratizationprocess in India? Do we find a worthwhilepolicy note generated out of our researchstudies conducted on democraticdecentralization? These are all questionsto be pondered over by the researchers inIndia. The literature generated overdemocratic decentralization in India isgenerally verylimited, sketchy and bare.Only a very few comprehensive studieshave been done on democraticdecentralization in India6. To the given sizeof the country and its diversity, India needsa larger number of studies in this field.But, available studies are very limited. Onthe theoretical front there is absolutely noworthwhile study or any attempt made bythe scholars. Of the studies at hand, mostof them are related to power devolution.Our research has not moved beyondpower devolution.
Disappearance of Donor Agencies
There is yet another aspect one hasto look into it as a large number of donoragencies who have worked indecentralization through civil society havewithdrawn their support to theprogrammes on decentralization in India.In the beginning, after passing of the 73rdand 74th Amendments to the Constitutionof India bilateral and multilateral agencieshad evinced keen interest in thedecentralization process. They pumped in
96 Local Government Quarterly July - September 2015
large amounts of money to create theneeded climate for decentralization ofpowers. As a result, a large number ofcivil society organizations involved in theactivities akin to decentralization ofpowers. They organized events andprogrammes throughout the year. Aftersometime, many of the agencies haveshifted their priorities as there is no signof devolving powers to local bodies in Indiaboth by the states and the Centre. In thebeginning they evinced keen interest as itwas part of democracy promotionactivities. By devolving powers to lowerlevel units for governance anddevelopment, many democratic practicescan be promoted and with this assumptionthe donor agencies supported the activitiesrelating to decentralization of powers. Theystrongly felt that many of the criticaldevelopment issues could be solvedthrough micro actions by the local bodies.From this perspective, many donoragencies evinced keen interest instrengthening local governance system inIndia. But, this potentials was not used bythe state governments. As a result wefound many agencies have started fundingcivil society organisations foraccountability activities instead of fundingdecentralization activities. This shift isvisible after the donor agencies have cometo the conclusion that devolution of powersdid not pickup well in India.
Studies on Democratization
It is also visible that scholars whowere enthusiastic in decentralization in the
beginning have disappeared suddenly atpresent. Why this disappearance? Only afew at the national and regional level havebeen working on decentralization for thepast twenty years. There are a largenumber of propositions generated out ofmicro studies. They are to be tested andexplained. By doing so, new theoreticalnuances can be evolved on democraticdecentralization. It requires theinvolvement of hard core academics fromacademic and research institutions. Thefirst time the democratic values andpractices are being taken to the communitylevel to change the attitude and behaviorof the people through the new governancearrangement. Indian social practices aretotally against the democratic practice. Insuch a situation, how democratic valuesare being practiced at the grassroots is amajor area of research7. Deepening ofdemocracy is a process and to analyzethe process new set of nuances is needed.There is no worthy literature on this aspectin India. Our democracy is minimal as it isconfirmed to institutions and not to thebehavior of the people8. For qualityresearch on this subject, significant outlaysare required but they are not forthcomingto the research community from thegovernment.
Panchayats and Rights Revolution
The rural transformation processstarted with community development
Where are we on Decentralization? 97
movement and has now moved to rightsbased development schemes. We have along history of rights in India. Our freedomstruggle started with the right togovernment and it has now reached uptoright to development. While talking aboutthe rights, one has to visualize thebehavioral traits of society in India. Still,in many parts, society is in the grip of thefeudal mind set. Despite the revolution onrights, the poor are not able to claim theirrights as they are not facilitated to claimtheir rights9. That is the reason manyargued that the historic rights revolutionhas not created significant impact on thesociety as it ought to have. Scholars havenot evinced any interest in looking at therights revolution from the perspective ofpanchayats. From a common senseapproach one can conclude that weakcannot help the meak. To help the peopleto claim their entitlements as rights, thepanchayats require strength. At presentthey are weak and substantially work onprogrammes and schemes of thegovernment of India and the states.
Interface between Globalization andDecentralisation
Democratization, deepening ofdemocracy and the transformationprocess of the communities through newlocal governance needs the attention ofthe hard core academics which is missingin India. No doubt “Globalization andDecentralization” are global phenomena.Decentralization has the capacity to
manage the ill effects of globalization byempowering people through establishingparticipatory governance at the grassroots.On this aspect of interface betweenGlobalization and Decentralization, only afew studies have been conducted. It needsdeeper analysis which is missing in IndianSocial Science Research10.
Here one has to ponder over therelationship between globalization anddecentralization. Globalization is inevitableand it brings wealth and prosperity. But, itdoes not happen to all. Globalization willleave an enormous negative impact on thelife and livelihood of the poor. To mitigateall those ill effects, decentralization willhelp. To get the positive out of globalizationfor the poor and to mitigate the negativeeffects of globalization, positioning localbodies is the imperative need. But, atpresent the local bodies barring those inKerala are not in such a condition eitherto use the advantages of globalization orto manage the ill effects of globalizationthrough decentralization.
In the new local governance system,planning with the participation of peoplewill alter the entire paradigm ofdevelopment from top down to bottom up.The question is to what extent the systemhas been in place in every state to preparea plan at the grassroots level when planningexercise is started at the community level.The governments, both the at Centre andthe states have to work on the needs ofthe people mentioned in the plan documentthrough the schemes, programmes and
98 Local Government Quarterly July - September 2015
allocation of resources of the Centre andthe states. In the absence of CentralPlanning Commission, the District PlanningCommittee assumes significance as it is aconstitutionally mandatedbody. Till date,we do not find a District PlanningCommittee with all wherewithal to preparea comprehensive District DevelopmentPlan excepting those in the state of Kerala.There is yet another issue; the datagenerating system at the grassroots is animperative need for micro planning. Buttill date we have no established system togenerate and validate the data needed forplanning. It is absolutely missing. But, evenafter the establishment of the newPanchayati Raj system if we make sucha statement, it is a deliberate attempt toviolate a provision of the Constitution ofIndia. In the fast urbanizing context, lookingat development from rural and urbanperspectives separately is illogical. Theyare integral and inseparable. Rural andurban are in continuum. Even the planningprocess has to be done integrally at thedistrict level and that is why the creationof the District Planning Committee hasbeen provided for in the urban local bodyact.
We have three divisions ofestablishments in India both at the federaland state government levels forgovernance. We have rural development,urban development and Panchayati Rajministries at the centre. In the same waywe have ministries at the stategovernment. However, there is no synergy
among the three ministries anddepartments. Apart from the above, thereare thirty seven departments which areworking with people for ruraltransformation. But, one hardly findscoordination and synergy. Micro levelplanning will certainly bring them together.To look at the above issues, academicattention is necessary from theacademics.
One more Committee
Having spent fifteen years in powersince the passage of the 73rd and 74thamendments to the Constitution of India,the UPA government constituted acommittee under the leadership of ManiShankar Aiyar to strengthen thePanchayati Raj institutions by making useof the centrally sponsored schemes. Thecommittee gives a picture that even thecentral ministries under UPA have notbeen supportive of strengthening thePanchayati Raj system11. Here one hasto assess the supportive measures of boththe Central and state governments. It isalways a criticism against the stategovernments for their refusal to devolveadequate powers and finances to localbodies. But equally, the Centralgovernment is also reluctant to strengthenthe Panchayati Raj system. This isrevealed through the reports of the ManiShankar Aiyar Committee. A scholar fromSwitzerland who came to a conference inIndia made one critical observation aboutthe Panchayati Raj system in India. He
Where are we on Decentralization? 99
stated that Indian governance arrangementis so designed to govern centrally and notin a decentralized way. Decentralizationis only in words and not in actions. Nocountry has generated such voluminousdocuments as we have seen in India fordecentralization. But no action has takenplace either at the government levels orat the ground. Always it is in deliberation.He said that no more deliberation isneeded, India needs only action now. Stillwe are waiting.
Report Fine but Action Nil
There is yet another evidence offailure on the part of the government onthe Second Administrative ReformCommission Report12. One full volumehas been devoted for strengthening localgovernance. Detailed recommendationshave been made separately for Centraland state governments. As per therecommendations of the SecondAdministrative Reforms CommissionReport, a series of reforms have to beundertaken both by the Central and stategovernments. When secretaries havebeen asked to react to the suggestion,barring a few, most of them have notresponded even at the Central governmentlevel. Till date nothing has moved on theserecommendations. There is no responsefrom the state governments. Now, it is adocument only for research. But nothingelse has been achieved.
Absence of Pressure Groups
Where is the pressure group for localgovernance? There are institutions andindividuals working on decentralizationcontinuously in the last twenty years, butthey are not organized effectively andefficiently to exert pressure on thegovernments to strengthen localgovernance. Even the Dalit and women’sorganizations have not exerted pressureon the governments for greater devolutioneven though Dalits and women would getsubstantial benefits out of decentralization.Why such reluctance on the part of Dalitand women outfits for empowering localbodies in India? It is a matter of concern.
Lack of Capacity Building Policy
There are three millionrepresentatives of the people involved inlocal governance in the new context. Theyare to be trained and oriented to the newprocess of governance, development andtransformation. Their perception, behaviorand skills have to be changed and enhancedto meet the new requirements. But, thereis no training or capacity building policyeither at the federal level or at the statelevel. In the same way the capacity of thetraining institutions has to be enhanced.But in reality capacity building traininginstitutions have been infrastructurallyequipped but not on the substantial aspectof the training faculty. It has been aserious lapse indicated by many agencies.Hence, in the new context, by taking into
100 Local Government Quarterly July - September 2015
account all those points, a status reporthas to be prepared with an objective ofpreparing a policy note.
Summary
Based on the studies conducted sofar, it has been noticed that despitedrawbacks, barriers and poor devolutionof powers, the local bodies haveperformed well. In order to deliver publicbenefits, local bodies are the best vehiclesas understood by the world. Haringrealized the truth based on evidence, localbodies have been created constitutionallyin India. This is the best opportunity forthe country to make use of the local bodiesto deliver services effectively andefficiently. But, India is missing thisopportunity as many of the stategovernments are not interested instrengthening the local bodies by devolvingadequate powers. What is to be done isthe basic question. First, local bodies haveto make it clear that they shouldconcentrate only on governance and notin implementing the schemes of the centreand state governments. Implementingschemes has to be done only by thegovernment departments. Local bodieshave to empower people through GramSabha and to make the governmentdepartments accountable to the people byconducting social audit. By doing so it canemerge as a powerful instrument ofgovernance. By using the existing powersit can make State Governmentsdepartments accountable.
Notes and References
1. Nagarajan, Hari K., BinswangerMkhize, Hans P. & Meenkshisundaram, S. S. (2015). Decentralizationand Empowerment for RuralDevelopment . New Delhi :Foundations Books.
2. Manor, James (2010) LocalGovernance. In Niraja Gopal Jayal,Pratap Bhanu Mehta (Eds.). TheOxford Companion to Politics inIndia. New Delhi: Oxford universityPress. pp61-78.
3. Palanithurai, G. (2015). DecentralizationProcess in Tamil Nadu. In G.Palanithurai (Ed.). Decentralizationin South Indian States, New Delhi:MJP Publishers.
4. India. Fourteenth Finance CommissionReport. (2015). Local Government(Chapter 9) New Delhi: Govt ofIndia, pp 98-125.
5. Palanithurai, G. Thirunavukkarasu,M. A. & Uma, G. (2008). ChangeMakers at Grassroots. New Delhi:Concept Publishing Company.
6. Institute of Rural ManagementAnand. (2010). State of PanchayatsReport 2008-2009 Vol I-II NewDelhi: Ministry of Panchayati Raj.____________________________________________
India. Ministry of Panchayati Raj(2008). Study on Elected WomenRepresentatives in Panchayati RajInstitutions. New Delhi : Governmentof India.
Where are we on Decentralization? 101
7. Palanithurai, G. (2015, January –June). Democracy and Decentralization:Strategy to Take the issues ofExclusion. KILA Journal of LocalGovernance, Vol 2: (1). 12.
8. Danile Caramani (2010).Comparative Politics New York:Oxford University Press, pp108-131.
9. Das, S. K. (2013). India’s RightsRevolution: Has it worked for thePoor? New Delhi: Oxford UniversityPress, pp303-312
10. Palanithurai G. and Ramesh (2008).Globalization Issue at the Grassroots.
New Delhi: Concept PublishingCompany. Palanithurai, G. andRamesh (2011).Globalization andRural Development New Delhi:Concept Publishing Company.
11. Government of India (2013).Manishankar Ayar CommitteeReport New Delhi: Ministry ofPanchayati Raj.
12. Second Administra tive ReformCommission. (2009). An InspiringJourney in Decentralization NewDelhi: Government of India.
Diploma in Estate ManagementRecommendation: UD No. 2009/267/39/20 Dated 21 Aug 2009
Course Content Broad Principles of Estate Management Management & Management Techniques Different Legislations in relation to Property Management Town Planning, Valuation & Disaster Management Economics and Finance
Duration: One Year (August to July); Lectures on HolidaysEligibility:Graduate/Diploma with 3 Years Experience.For further details & Applications for admission, obtain Prospectus by post on payment ofRs. 200/- by D. D. from:
The Regional DirectorAll India Institute of Local Self-Government
Pinnac Memories, Phase-II, L-Building, Kothrud, Pune, Maharashtra - 411 038.Phone : 020- 25460793, 25461624.
E-mail : [email protected]
102 Local Government Quarterly July - September 2015
Globally, population is ageing as theproportion of older people is projected toincrease from 9.9 per cent in 2000 to 22per cent by 2050. Increase in the proportionof aged people is one of the major featuresof demographic transition in the world.This is expected to have ser iousconsequences on local, regional, andglobal economies. Due to rising old-age,dependency ratio of elderly to working-age population, the burden of caring forthe elderly is shifting from families togovernment, businesses, unions and otherinstitutions as well as to the elderlythemselves through personal savings forold age.
Population has been increasingmuch faster in developing countries dueto rapid mortality decline and increasinglife span through medical interventions,providing effective treatment andprevention of fatal diseases. In recentyears, rapid growth of elderly populationdue to fertility decline has become a
Health Status of the Rural Elderly in Tamilnadu:A Study of Perceptions with Referenceto Madurai District
R. HariharanM. V. Vaithilingam
serious challenge to public health globally.The population explosion is of greatconcern as it leads to poverty, neglect,abuse, violence, crime, and moreimportantly overcrowding, all of whichhave direct relation to health status of theolder persons. The aged comprise one ofthe important vulnerable groups havinghealth problems mostly due todegenerative changes. Thus, social,physical and economic well-being of thisgroup has become a challenging issue.
Literature Review
There have been various studies onhealth characteristics of the rural elderlyand their progress in day-to-day life. Intraditional and culture bound societies likeIndia, family takes care of the ageingduring their old age, especially when theyare not earning and in the state of frailand ill-health. One of the main factorswhich determines well-being at old age isthe absence of chronic Non-
Health Status of the Rural Elderly in Tamilnadu 103
Communicable Disease (NCD) likediabetes and hear t disease. Due tomodernization and fertility transition, inaddition to urbanization and migration, thejoint family system in India is slowlydisintegrating into nuclear family system,especially in a state like Tamil Nadu, withhighly urbanized population (48 per cent).The share of persons aged at least 60years in the Tamil Nadu state was highwith 8.8 per cent in 2001 and it is projectedto increase to 16 per cent by 2021 (Census2001).
Gender as a theme in ageing is partfrom the recognition that womenpredominate among the elderly owermortality among women has resulted inan imbalance in the sex ratio among olderpersons in almost all countries, withwomen out numbering men particularlyamong the oldest-old (Mason, 2001).Gender systems also influence the relativeaccess of older men and women to familyassets both before and after the death ofa spouse (Rahman et al., 2009). Economicsatisfaction also varies by gender. Highereconomic satisfaction generally leads tohigher life satisfaction particularly in acountry where most of the people are livingbelow poverty line. In terms of financialsatisfaction males experience moreeconomic satisfaction than females.Generally, males enjoy moreindependence and financial security thanfemales.
Case and Paxson (2004) pointed outthat the women have worst self-rated
health and more hospitalization episodesthan men from early adolescence to latemiddle age, but are less likely to die atearly age. The studies by Haaga (2004);Zhou et al., (2004); Mutharayappa andBhat (2008) reveal that lifestyle adverselyaffected health and increased morbidityconditions among the rural elderly.Karuppiah (2002) reported that in the ruralareas, problems of health arise due to pooreconomic conditions. Majority of them liveunder common shelter, they do not getproper food and they do not go for regularmedical check-ups. Keeping these in view,an attempt has been made in this paper tostudy health status of the rural elderly inTamilnadu based on the perceptions withreference to Madurai district.
Objectives
The primary objectives of this paper are:
(1) to study the socio-demographic andeconomic characteristics of the ruralelderly population;
(2) to understand and analyse the healthproblems of elderly men and womenand their perceptions; and
(3) to suggest suitable policy measuresto improve the health of the elderlypopulation.
Data and Method
The data collected from the householdsurvey were age, sex, religion, caste, andmarital status, completed years ofeducation, personal income, source of
104 Local Government Quarterly July - September 2015
income and their health problems andperception of their health status. The itemsof information collected through personalinterview were the level of physical andeconomic support from their children, levelof their satisfaction in getting such supportand their present need and perception fortheir happy survival. The data wereevaluated and analysed using SPSSSoftware. Z-test analysis was used forjudging the significance of differencebetween proportions of elderly men andwomen with any health problem in twoindependent large samples. Contentanalysis was done to capture theperception of the elderly on the availabilityof health and physical support from theirchildren and the level of their satisfaction.
Madurai district was chosen as thestudy area. The rationale behind selectingthe district is that the share of the elderlyin the district is closer (8.5 per cent) tothat of Tamil Nadu (8.8 per cent) and thisdistrict is an average district in most ofthe demographic, socio-economic andhealth characteristics. The next stage ofsampling involved selection of one talukin Madurai District. The researcher hasselected Madurai South Taluk out of seventaluks in this district on the basis of thehighest number of households, highesttotal population and highest number ofelderly persons. In rural area of MaduraiSouth taluk, Vilacher i, Nilaiyur,Thanakkankulam and Perungudi villageswere selected out of 60 villagesconstituting the rural sample frame on the
basis of the highest number of households.Among the four selected villages in ruralarea, a disproportionate stratified randomsample of 40 elderly persons comprising20 males and 20 females was got byselecting one from each of the 40households selected at random to get asample of 160 elderly persons throughhousehold survey and personal interviewwith the help of a well-administrated andpre-tested interview schedule.
In today’s human society, age basedprejudices and discrimination are firmlyembedded. Therefore, the word like‘elderly’ has in itself acquired a negativeconnotation. For practical purposes, wedefine elderly as those people who havecrossed a given life span, 65 years indeveloped countries and 60 years indeveloping countries like India. As theGovernment of India as well as theGovernment of Tamil Nadu recommendsthe welfare programmes for the elderlyto those who are 60 years and above, thisstudy also considers the same age criteriafor its respondents.
Results and Discussion
As stated in the review, the problemsof the elderly differ with respect toincome, residence, age, sex, education,occupation, health, marital status, familytype and satisfaction. The demographicand social characteristics, economic andliving arrangement characteristics, theirperception on health status of the ruralelderly are discussed in detail with the help
Health Status of the Rural Elderly in Tamilnadu 105
of results obtained through Z-testanalyses.
Socio-Demographic and HouseholdCharacteristics
The elderly persons were more (50.6per cent) in young-old (60-69 years) agegroups followed by middle old (35.0 percent) and less (14.4 per cent) in old-old(80 years and above) age groups whichmay be due to a decrease in longevity withincrease in the number of old persons andgender was equally represented. Peoplebelonging to Hindu religion are higher inproportion among the inhabitants of India.In the study area also, Hindus (79.4 percent) have the higher representationcompared to Muslims (15.0 per cent) andChristians (5.6 per cent). Majority of theelderly persons are backward caste (59.4per cent) followed by scheduled caste(23.8 per cent) and forward caste (16.8per cent) in the study area. An increase innumber of widowed may be due to greaternumber of deaths among male elderlypersons. As far as the marital status ofthe elderly persons is concerned, most ofthem are widowed (50.0 per cent)followed by married (48.1 per cent) andseparated (1.9 per cent). The data revealthat most of the elderly persons are fromnuclear families (85.0 per cent) ascompared to joint families (15.0 per cent).With the advent of industrialization andmodernization, the number of those livingin nuclear families increases due to thebreakdown of joint family system in the
rural areas. The percentage of illiterates(44.4 per cent) and completed primaryschool education (35 per cent) are morein the rural areas than the secondary andthe above level education (20.6 per cent)(Table 1).
Lifestyle and EconomicCharacteristics of the Rural Elderly
It is very important to study thelifestyle and economic characteristics ofthe rural elderly to assess their healthstatus. Studies by Nanda, et al. (1987),Bali (1999), Prakash (1999) andIrudayarajan, et al. (1999) show thatparents still predominantly prefer to livewith their children even when they haveproblems with them. In particular, livingwith the eldest son, is the most preferredone. In this study, the results also focusthat majority of the elderly persons areliving with their children (47.4 per cent)followed by spouse (38.8 per cent) andliving alone (13.8 per cent). More thanone–third of the study population lived inbelongs to family member house (36.9 percent) followed by rented house and almostone-third of the study population lived inself owned independent house (26.9 percent).
Majority of the respondent’s earningincome range was between 1001 to 5000rupees (42.5 per cent). As far as theincome is concerned, almost one-third ofthe respondent’s income comes from acombination of salary, pension andfinancial investments (27.5 per cent)
106 Local Government Quarterly July - September 2015
closely followed by financially dependenton their children and others (26.8 per cent).Personal habits are a kind of the majordeterminants of health of the elderly. Asfound in the studies by Haaga (2004) andZhou et al., (2004), these personal habitshave adversely affected health byincreasing morbidity conditions among theelderly persons. Most of the elderlypersons had the habit of drinking tea/coffee (68.8 per cent) followed bychewing pan parag (16.9 per cent), betelleaves (16.3 per cent), drinking alcohol(13.1 per cent) and smoking (11.3 percent). Only two of the female elderly hadthe habit of drinking alcohol and none ofthe female elderly persons had the habitof smoking (Table 2).
Health Problems of the Elderly
Health problems and medical careare major concerns of elderly persons.According to the study conducted byMurray and Lopez, (1996) on ‘globalburden of disease’, ill-health accounted for10 per cent of the global disease burdenamong older people with 60 years andabove. This section deals with the numberof old age persons affected by long-termmorbidity, short-term morbidity andphysical incapacity by their genderperspective.
In this study back pain, bloodpressure, diabetes, asthma, heart diseaseswere termed as long-term morbidity orchronic illnesses. Fever, body weakness,headache, cough, wheezing are termed asshort-term morbidity or acute diseases.Physical incapacity is termed as visual,
walking, memory, sleep, and hearing. Itmay occur during a person’s lifetime ormay be present since birth.
In case of long-term morbidity,majority of the elderly persons are affectedby back pain (56.3 per cent) followed byblood pressure (50.5 per cent) and diabetes(32.0 per cent) but when we look at itgender wise, more males (14.0 per cent)are affected by asthma than femaleelderly (3.8 per cent) persons. It reflectsthe result of male elderly have moresmoking habits. Nearly half of therespondents reported that they areaffected by fever problem (46.7 per cent)followed by body pain. Almost an equalpercentage of elderly persons is affectedby headache, cough and wheezing whilefever (53.6 per cent) was significantlymore common among women. In case ofphysical incapacity, majority of elderlypersons were affected by visual problemand almost equal percentage of elderlywere affected by walking difficulty,memory loss, sleeplessness and hearingproblems in both genders. More or lessequal numbers of elderly persons wereusing medical aid for their physicalincapacity in both genders. Majority of therespondents reported currently having anyone of the medical problems (81.8 per cent)and this problem was more in femaleelderly (86.2 per cent) than male elderly(75.0 per cent) persons. This indicates thatthe females are not given proper care ascompared to males, and lack of sufficientmedical facilities in rural areas may alsobe one of the main reasons for more illnessand physical incapacity in female elderlypersons (Table 3).
Health Status of the Rural Elderly in Tamilnadu 107
Health Care System of the RuralElderly
Majority of the elderly personsreceived treatment for long-term morbiditygovernment hospital (72.2 per cent)followed by private hospital (15.6 per cent)and home medicine (12.2 per cent), whichproves the poverty condition of the elderlypersons in rural areas. The same patternhas been noticed among both males andfemales and for both short-term morbidityand physical incapacity. As far as thegender difference in treatment seekingbehaviour among rural elderly, majority ofthe female elderly received treatment fromgovernment hospital as compared to maleelderly and more number of male elderlyreceived treatments from private hospitalthan female elderly for all type of illness(Table 4).
Hypothesis (H1): Health problemsdiffer between men elderly and womenelderly.
Framework of Analysis
Z – Test was used for judgingthe significance of difference betweenproportions of elderly men and womenwith any health problem in two independentlarge samples. Health problems amongelderly persons were analysed using theprevalence ratio of illness in terms of long-term morbidity (LTM) and short-termmorbidity (STM), physical incapacityseparately for men and women elderlypersons in rural areas for different age-groups.
Prevalence of Illness and PhysicalIncapacity
Prevalence Ratio of Illness wascalculated from number of personsaffected with at-least one long-termmorbidity or short-term morbidity out of10 morbidities in men and women dividedby total number of sample elderly personsin that group and multiplied by 100. So,
Prevalence Ratio of Illness
Prevalence Ratio of PhysicalIncapacity is calculated from number ofpersons affected with atleast one physicalincapacity out of 5 in men and womendivided by total number of sample elderlyperson in that group and multiplied by 100.So,
Prevalence Ratio of Physical Incapacity
The incidence of health problems interms of long-term and short-term illnessesas well as physical incapacities are greaterfor women as compared to men in ruralareas at either 1 per cent level or 5 percent level of significance. As comparedto physical incapacity, prevalence ratio of
Number of men / womenwith atleast one illnessTotal Number of sampleaged persons in that group
x 100)=(
Number of men / women withatleast one physical incapacityTotal Number of sampleaged persons in that group
x 100)= (
108 Local Government Quarterly July - September 2015
illness was greater in all age groups inrural areas. As age increases, theprevalence ratios of illness as well asphysical incapacity also increase in the mencategory. However, the absolutedifference between men and womendecreases as age increases. These resultsimply that women are more prone to healthproblems to a greater extent than men,which increase with the age in rural areas.These results also confirm the findings ofCase and Paxson (2004) andBalasubrmanian and Sundarai (2008) thatwomen are from the most affected groupbecause of the lack of adequate supportfrom the family and care for their ownhealth (Table 5).
Perceptions of the Rural Elderly
This section discusses theperceptions of the rural elderly from theinformation obtained with the help of theirpersonal interviews regarding theavailability of health, physical, economicand social supports from their children andthe level of their satisfaction by conductingin-depth interviews.
Health Problems
An elderly man states, “I have oneson, he lives in a town. He keepssending us sufficient money regularly.But still we have a feeling of missingsomething. He suffers from sugar, bloodpressure and eye problem. When I fallill, I become mentally depressed due tolack of support. Once we became old
we are considered as burden for thefamily. Our son will do what we wantbut his wife is not interested in us.”
Lack of Physical Support
An elderly woman opines, “I amliving alone, my husband is not livingwith me because I have no children. Isuffer from mental distress due toblindness. My neighbours are friendlyand cooperative but there seems to beindication of poor adjustment withmanagement. When I see old womenlike me they are happy with their sonsor daughters, in-laws and grand-children. I feel I am not fortunate to bewith my own dears.”
Social Problems
In the words of an elderly widow,“I have two children; they are marriedand live in the same area. I have beenforced to stay alone. My family membersare less bothered about my well being,financial and emotional support. I amfeeling lonely, hopeless and sorrowful.I am not sufficiently respected by myown family members and relative in allsocial ceremonies and occasions. I alsodon’t get any help from government.Now I don’t want to live any more”.
Economic Problems
An elderly man says, “I have onedaughter, and she lives with her familyin my house. Before my daughtermarriage, the house and land were inmy name. Now all the properties have
Health Status of the Rural Elderly in Tamilnadu 109
been transferred to my son-in-law. Theynever used to consult with me for anymajor decision-making of the family.Now I am totally dependent on theirsupport for all my needs. I always feelalone due to detachment with familymembers.
Conclusion and Recommendations
The young-old (60-69 years) elderlypersons had more representation in thestudy area as compared to the middle-oldand the old-old. Hindus among the elderlypersons were more in number ascompared to Muslims and Christians. Theelderly persons who belonged to backwardcaste were more in rural areas ascompared to scheduled and forwardcastes. There is an increase in the numberof widowed persons which may be due tomore number of deaths among maleelderly persons. Majority of the elderlypersons were from nuclear families (85.0per cent) as compared to joint families(15.0 per cent). With industrialization andmodernization, the number of persons livingin nuclear families increases due to thebreakdown of joint family system in therural areas. Higher educated respondentswere very less and the number of illiterateis more in the rural areas. Almost half ofthe elderly (47.4 per cent) were living withtheir children. Majority of the respondentslived with their family members followedby those who lived in rented houses.Majority of the respondents’ income
ranged between 1001 to 5000 rupees andalmost one-third of the respondents’income source was the combination ofsalary, pension and financial investments.Majority of the elderly persons have thehabit of drinking tea/coffee and two of thefemale elderly had the habit of drinkingalcohol and none of the female elderlypersons had the habit of smoking.
Majority of the female elderly wereaffected by long term morbidity in backpain, blood pressure and diabetes, andmajority of the male elderly were affectedby short-term morbidity in body pain, coughand wheezing. More or less equal numbersof elderly persons in both genders wereusing medical aid for their physicalincapacity in both genders. Majority ofthem were affected by any one healthproblem in last one-year period and therewere conclusive data which showed thatwomen suffered more than men.
Majority of the elderly personsreceived treatment from governmenthospitals followed by private hospitals, andhome medicine for all type illness andphysical incapacity. Majority of the femaleelderly persons received treatment fromgovernment hospitals than male elderlypersons and more number of male elderlypersons received treatment from privatehospital than female elderly persons.
From the z-test analysis, we observedthat the incidence of health problems interms of long-term and short-term illnessesas well as physical incapacities were
110 Local Government Quarterly July - September 2015
greater for women as compared to menat either 1 per cent level or 5 per centlevel of significance. As compared tophysical incapacity, prevalence ratio ofillness is greater in all age-groups. As ageincreases, the prevalence ratios of illnessas well as physical incapacity alsoincrease. However, the absolutedifference between men and womendecreases as age increases.
The overall scenario of the healthstatus of the elderly population is not foundsatisfactory. Still much work has to becarried out in this area of research to copewith other problems of our country.
In the light of the above discussionsthe following recommendations aresuggested to improve and sustain thehealth status of the rural elderly. Theelderly persons may be recommended forsome amenable programmes enhancingthem to get an additional source of incomeespecially in rural areas. There is a needto increase geriatric centres for thetreatment of the elderly as there is anincrease in the number and proportion ofthe elderly having a direct impact on thedemand for health services. Health needsof older persons are multidimensional. Notonly physical health but mental andemotional health of older persons is equallyimportant for their well being. A systemof coordinated care needs to be providedinstead of personal oriented intervention.
Health education programmes suchas yoga and meditation may be introducedbased on the felt-need of the rural elderly
in the rural areas. The NGOs striving toprotect the welfare of the rural aged maytake part along with relevant departmentsof the government in various stages of theprogrammes with an innovative approachsuiting the modern needs of the elderly.The family members may be encouraged,by giving education/counselling, to provideproper care, especially, food, clothing andshelter for the elderly in their houses.
References
Anne, Case and Christina, Paxson.(2004). Sex Differences in Morbidity andMortality, National Bureau of EconomicResearch. (Working Paper No: 10653).
Balasubramanian, P. and T. K.Sundari Ravindran. (2008, February 22-23). Gender and Social determinants ofHealth of Older population in TamilNadu. UGC Sponsored National Seminaron Ageing in India. Chidambaram:Annamalai University.
Bali, A. (1999). Understandinggreying people of India, Indian Councilfor Social Science Research, New Delhi:Inter-India Publications.
Haaga, John. (2004). Demographicand Socioeconomic Change inAppalachia, The Aging of Appalachia.Population Reference Bureau,Washington, DC.
Irudayarajan, S., Mishra, U. S. andSharma Shankara P. (1999). India’selderly burden or challenge. New Delhi:Sage Publications.
Health Status of the Rural Elderly in Tamilnadu 111
Karuppiah, C. (2002). HealthProblems and Health Needs of the Agedin the Villages of Tamil Nadu, In Tharabhai,L. (Ed). Aging: Indian Perspectives.(pp.159-176). New Delhi: Decent Books.
Mason, K.O. (2001). Gender andfamily system in the fertility transition,Global Fertility Transition. Populationand Development Review. 27(Suppl.):160-176
Murray, C. L., and Lopez, A. (1996).The Global Burden of Disease: Acomprehensive assessment of mortalityand disability from diseases, injuriesand risk factors in 1990 and projectedto 2020, Vol. I of The Global Burden ofDisease Publication Series. Cambridge,MA: Harvard School of Public Health,World Health Organisation and WorldBank.
Mutharayappa R. and Bhat T. N.(2008), Is Lifestyle influencing Morbidityamong elderly, Journal of HealthManagement, 10(2):203-217. New Delhi: Sage publications.
Nanda, D., Khatri R. S., KadianK.S., (1987), Ageing problems in thestructural contexts. In Sharma, M.L. andTak, T. M. (Eds.), Ageing in India:challenge for the society. New Delhi:Amanita.
Prakash, I. J. (1999). Ageing in IndiaGeneva: World Health Organization.
Rahman, Mustafizur K. M., Md.Ismail Tareque and Md. MostafizurRahman (2009). Gender Differences inEconomic Support, Wellbeing andSatisfaction of the Rural Elderly inNaogaon District, Bangladesh. IndianJournal of Gerontology, 23(3):343 -357.
Zhou Yang, Donna B. Gilleskie,Edward C. Norton (2004). PrescriptionDrugs, Medical care, and HealthOutcomes: A Model of Elderly HealthDynamics, National Bureau of EconomicResearch (Working paper no. 10964).Cambridge, MA 02138. Retrieved fromhttp://www.nber.org/papers/w10964.
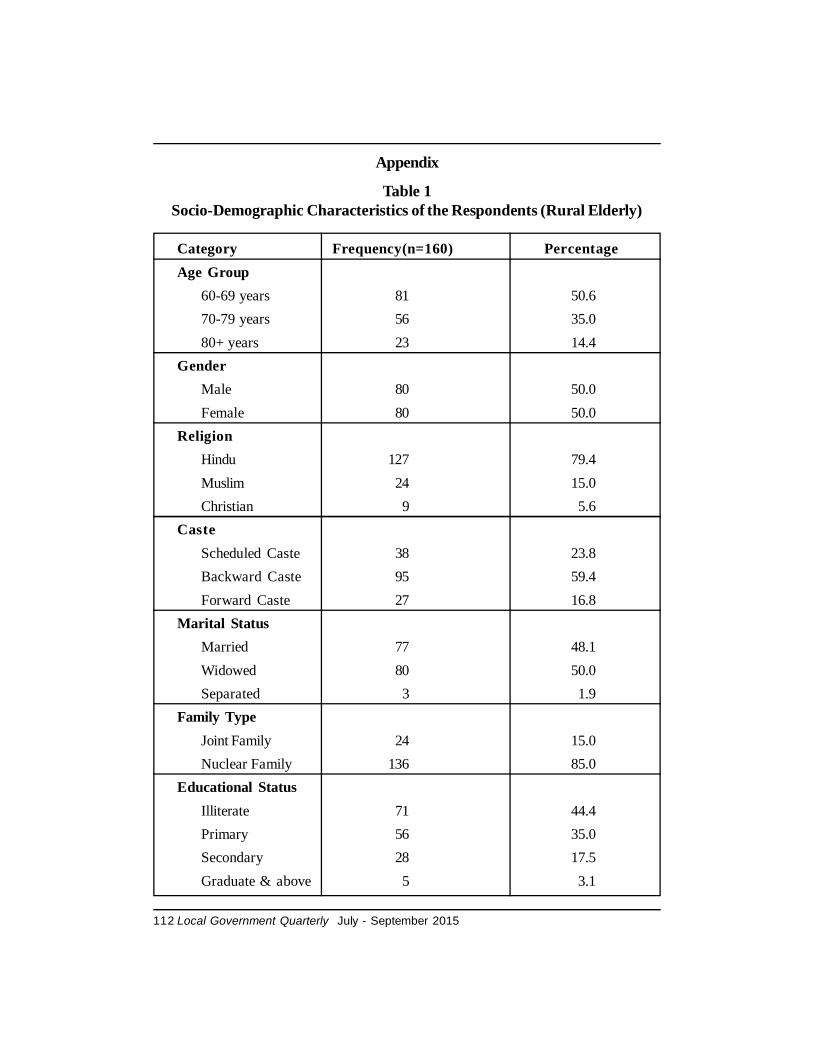
112 Local Government Quarterly July - September 2015
Appendix
Table 1Socio-Demographic Characteristics of the Respondents (Rural Elderly)
Category Frequency(n=160) PercentageAge Group
60-69 years 81 50.670-79 years 56 35.080+ years 23 14.4
GenderMale 80 50.0Female 80 50.0
ReligionHindu 127 79.4Muslim 24 15.0Christian 9 5.6
CasteScheduled Caste 38 23.8Backward Caste 95 59.4Forward Caste 27 16.8
Marital StatusMarried 77 48.1Widowed 80 50.0Separated 3 1.9
Family TypeJoint Family 24 15.0Nuclear Family 136 85.0
Educational StatusIlliterate 71 44.4Primary 56 35.0Secondary 28 17.5Graduate & above 5 3.1
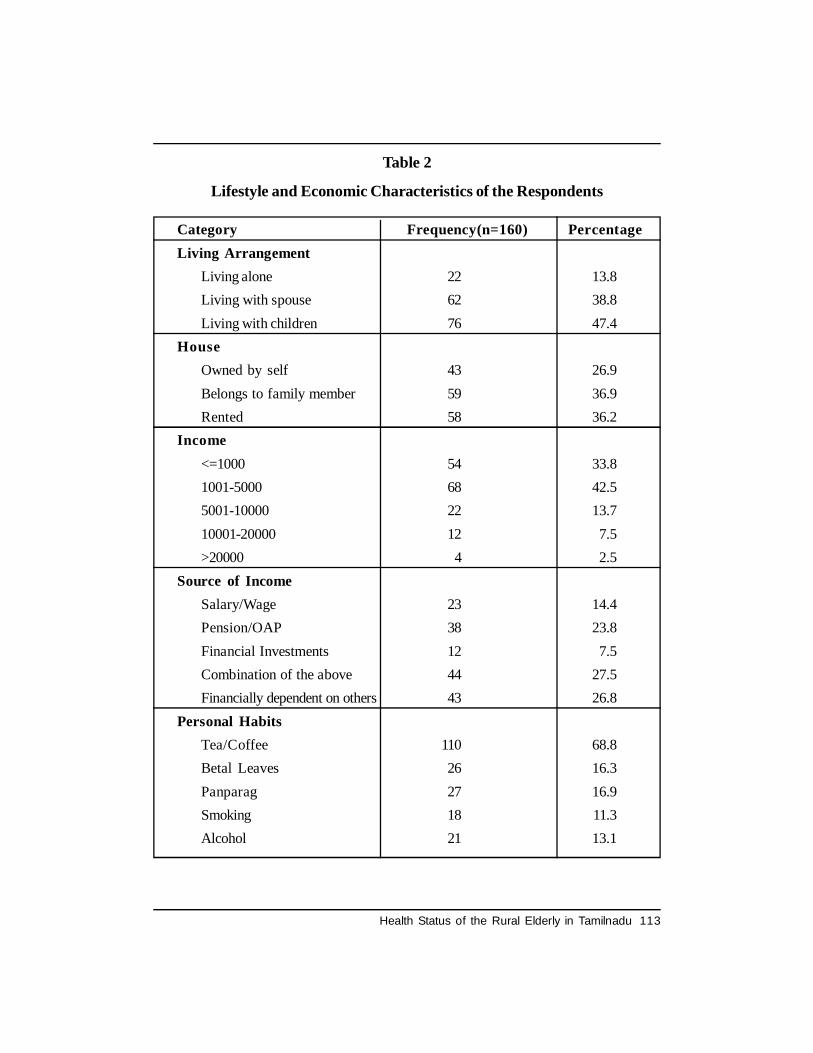
Health Status of the Rural Elderly in Tamilnadu 113
Table 2
Lifestyle and Economic Characteristics of the Respondents
Category Frequency(n=160) PercentageLiving Arrangement
Living alone 22 13.8Living with spouse 62 38.8Living with children 76 47.4
HouseOwned by self 43 26.9Belongs to family member 59 36.9Rented 58 36.2
Income<=1000 54 33.81001-5000 68 42.55001-10000 22 13.710001-20000 12 7.5>20000 4 2.5
Source of IncomeSalary/Wage 23 14.4Pension/OAP 38 23.8Financial Investments 12 7.5Combination of the above 44 27.5Financially dependent on others 43 26.8
Personal HabitsTea/Coffee 110 68.8Betal Leaves 26 16.3Panparag 27 16.9Smoking 18 11.3Alcohol 21 13.1
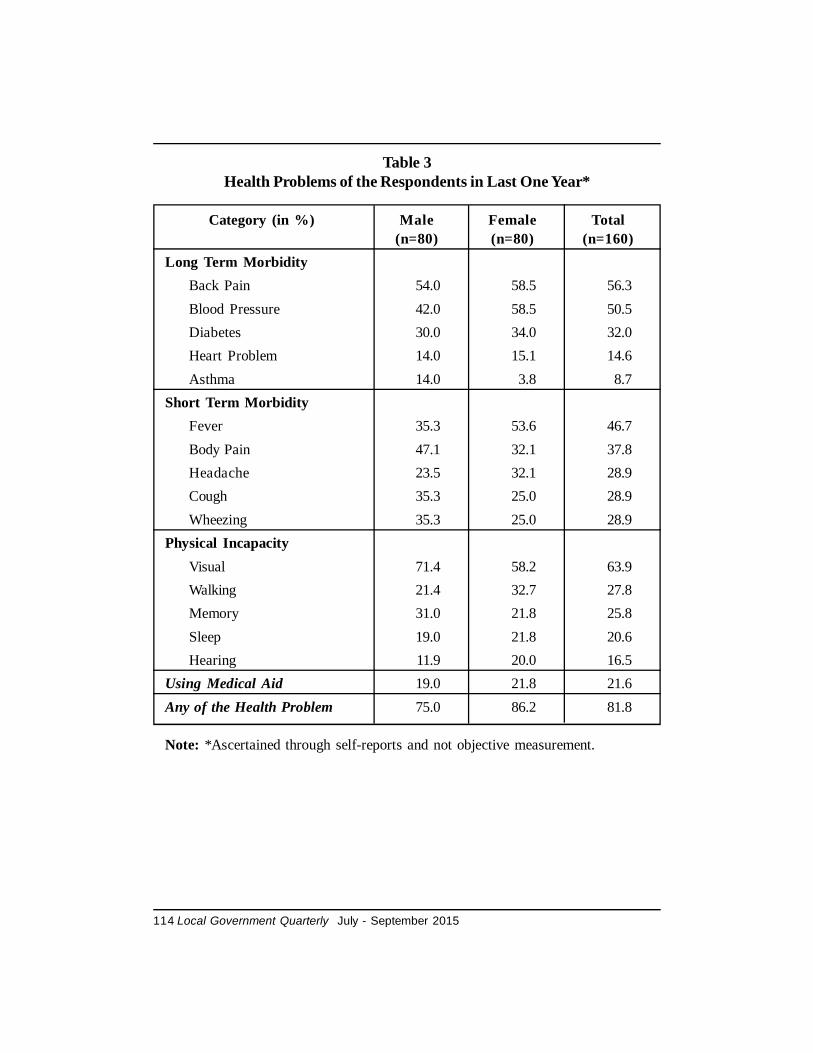
114 Local Government Quarterly July - September 2015
Table 3Health Problems of the Respondents in Last One Year*
Category (in %) Male Female Total(n=80) (n=80) (n=160)
Long Term MorbidityBack Pain 54.0 58.5 56.3Blood Pressure 42.0 58.5 50.5Diabetes 30.0 34.0 32.0Heart Problem 14.0 15.1 14.6Asthma 14.0 3.8 8.7
Short Term MorbidityFever 35.3 53.6 46.7Body Pain 47.1 32.1 37.8Headache 23.5 32.1 28.9Cough 35.3 25.0 28.9Wheezing 35.3 25.0 28.9
Physical IncapacityVisual 71.4 58.2 63.9Walking 21.4 32.7 27.8Memory 31.0 21.8 25.8Sleep 19.0 21.8 20.6Hearing 11.9 20.0 16.5
Using Medical Aid 19.0 21.8 21.6Any of the Health Problem 75.0 86.2 81.8
Note: *Ascertained through self-reports and not objective measurement.
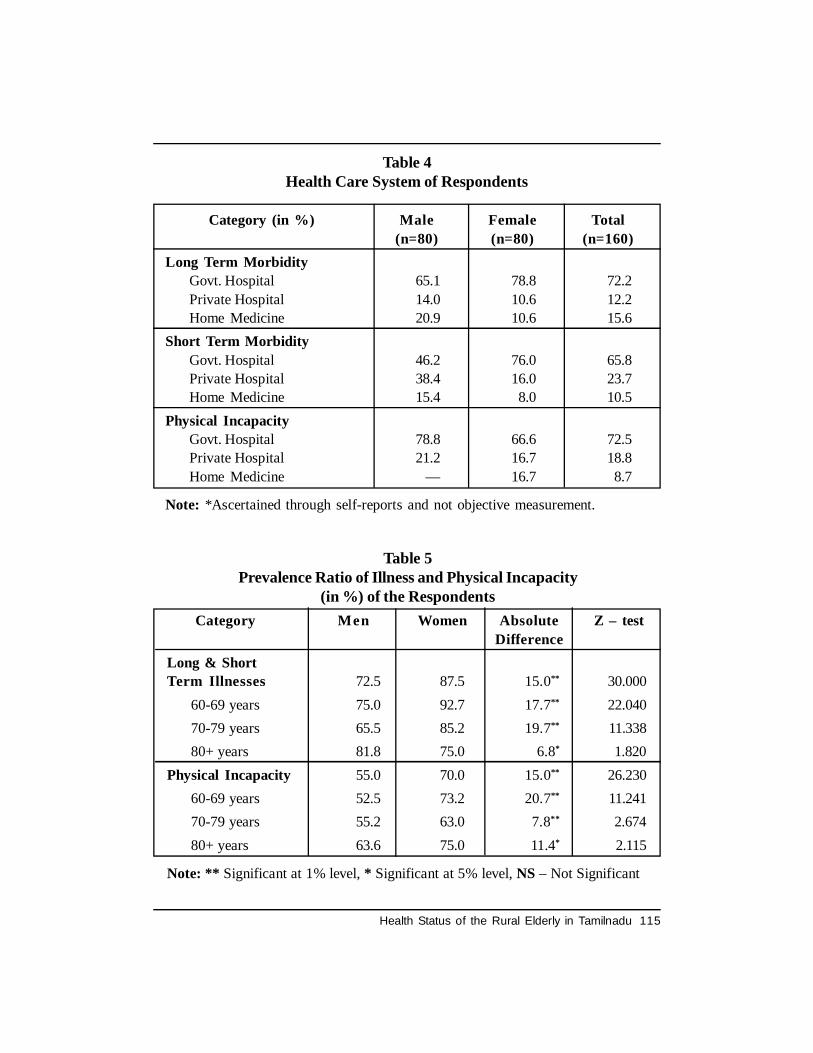
Health Status of the Rural Elderly in Tamilnadu 115
Table 4Health Care System of Respondents
Category (in %) Male Female Total(n=80) (n=80) (n=160)
Long Term MorbidityGovt. Hospital 65.1 78.8 72.2Private Hospital 14.0 10.6 12.2Home Medicine 20.9 10.6 15.6
Short Term MorbidityGovt. Hospital 46.2 76.0 65.8Private Hospital 38.4 16.0 23.7Home Medicine 15.4 8.0 10.5
Physical IncapacityGovt. Hospital 78.8 66.6 72.5Private Hospital 21.2 16.7 18.8Home Medicine — 16.7 8.7
Note: *Ascertained through self-reports and not objective measurement.
Table 5Prevalence Ratio of Illness and Physical Incapacity
(in %) of the RespondentsCategory Men Women Absolute Z – test
DifferenceLong & ShortTerm Illnesses 72.5 87.5 15.0** 30.000
60-69 years 75.0 92.7 17.7** 22.04070-79 years 65.5 85.2 19.7** 11.33880+ years 81.8 75.0 6.8* 1.820
Physical Incapacity 55.0 70.0 15.0** 26.23060-69 years 52.5 73.2 20.7** 11.24170-79 years 55.2 63.0 7.8** 2.67480+ years 63.6 75.0 11.4* 2.115
Note: ** Significant at 1% level, * Significant at 5% level, NS – Not Significant
116 Local Government Quarterly July - September 2015
The United Nations Summit for theadoption of the post-2015 developmentagenda will be held from 25 to 27September 2015, in New York. More than150 world leaders are expected to attendthe Summit. The ambitious new sustainabledevelopment agenda, “Transforming ourWorld: The 2030 Agenda for SustainableDevelopment”, will serve as the launchpad for action by the internationalcommunity and by national governmentsto promote shared prosperity and well-being for all over the next 15 years. Thenew sustainable development agenda isanchored around 17 SustainableDevelopment Goals (SDGs). These goalstogether provide a neatly blended mix ofenvironmental issues with other issues suchas of poverty, inclusion, etc. This is verysignificant as environmental concerns areassuming worrisome proportionsmanifested in climate change processesand other environmental challenges. Therehave been some concerted efforts andinstruments in this direction at the globaland national levels.
Gender Sensitive Self-Assessment andPlanning by Vulnerable Populationsvis-à-vis Environmental Sustainability andSustainable Development Goals
Mukesh Kanaskar
However, the environmental dialoguetill date has one important stakeholder atthe periphery of its radar- the communitieswhich are the most vulnerable to theenvironmental impacts. In urban areas,these are slum dwellers while in rural andtribal areas they are the persons in deepclutches of poverty and on the thresholdof survival. Thus, we have an ironicalsituation whereby those who should be theprimary stakeholders owing to theirextreme vulnerability to environmentalrisks are hitherto not included in theenvironmental debate and planning.
For the environmental efforts vis-à-vis “Transforming our World: The 2030Agenda for Sustainable Development”and SDGs to succeed, they have to beowned up through proactive participationby the primary stakeholders. This formsone of the biggest lacunas in the currentefforts for environmental sustainability.The environmental domain, especiallyplanning for its conservation andimprovement is hitherto presumed morein the domain of the suppliers of the
Gender Sensitive Self-Assessment and Planning by Vulnerable Populations 117
services than the populations which arethe most vulnerable and worst affectedby the environmental risks. Theenvironmental concerns and urge foraction should be demystified from itscurrent predominance of jargon to simplevocabulary easily understandable forcommon populace. Moreover, it is crucialto nurture micro-level Sustainability Plansright from the grassroots.
The chronic environmentalsustainability challenges demand afundamental paradigm shift. Currently theprimary stakeholders are considered moreas recipient of services while the serviceproviders are presumed to be the primarystakeholders. Another underlying premisefor the current exclusion of the primarystakeholders- the most vulnerables- is thedoubt over their ability to participate in theprocess.
Against this premise, this paperelucidates a global award winninginnovation the author has developed andpractised in field for more than 12 years(since year 2003) in diverse kinds ofenvironmental sustainability contexts-urban, rural as well as tribal: the innovationof ‘Gender Sensitive Self-Assessment andPlanning by the Vulnerable Populations(GSSAPV)’. It also finds a mention in theflagship policy document ‘State of theUrban Poor 2013’, which is a jointpublication of Ministry of Housing andUrban Poverty Alleviation, Government ofIndia and Oxford University Press. Theinnovative methodology of communityself-assessment and planning by slumdwellers for disaster risk reduction was
selected for a prestigious global award,‘Risk Award 2015’, endowed upon AllIndia Institute of Local Self-Government(AIILSG) from among 145 entries from62 countries. The award is jointlysupported by ‘The United Nations Officefor Disaster Risk Reduction’ (UNISDR),‘Global Risk Forum’, Davos & ‘MunichRe Foundation’, Germany.
Moreover, another two salientaspects are: 1) The GSSAPVmethodology has been practised in thecontext of populations which are the mostvulnerable and worst affected by theenvironmental risks. 2) The in-built genderdimension in appreciation of the fact thatwomen are the most vulnerable and worstaffected of all environmental risks anddisasters among such populations.
This methodology bears significancefor environmentally sound sustainabledevelopment of 65.49 million slum dwellerpopulations in India (equivalent topopulation of 193 countries from 213enumerated countries on the earth) and863 million slum dweller populations indeveloping countries (equivalent topopulation of 211 countries on the earth),833.4 million rural and tribal populationsin India and similar high numbers of ruraland tribal populations in developingcountries.
The methodology was developed bythe author while he shouldered theresponsibility as Project Director of aEuropean Union supported project“Transfer of Technologies for SustainableDevelopment” implemented by an NGOand also anchored the responsibility of
118 Local Government Quarterly July - September 2015
fostering of People’s Organisations(Community Organisations) forSustainability for this project. The projectwith a funding support of 19.5 million Eurosbrought about environmentally soundsustainable development with 33,000vulnerable families constituting about 0.165million population from 217 under-developed locations in India. Apart frompoverty alleviation of the projectparticipant vulnerable families, the impactsof the project on environment frontincluded 4155 ha of degraded lands wasconverted to productive purposes,watershed development and improvedagricultural practices were adopted over23,356 ha, increased the cropping intensityfrom 22 per cent to 93 per cent and thecrop yield from 27 per cent to 75 per cent.Soil and water conservation measuresgenerated over one million person days oflabour. This resulted in an increase in theground water table by 1 to 2.5 meters. Topromote efficient water use, theparticipating families adopted group wells,drip irrigation and water budgeting. Allthe project villages had safe drinking waterthroughout the year. This has a directinfluence on drudgery reduction of womenand improvement in community health.
Since then, GSSAPV has beenalready utilised for environmentalupgradation in 17 urban locationsencompassing a population of about 29076,337 rural and tribal locations encompassinga population of 0.267 million.
A crucial feature of the abovereferred impacts is environmentalsustainability attained through fostering of
community organisations. The processwas instrumental in establishing 229grassroots organisations taking care ofsustainability. These organisations togetherworked on various environment relatedmeasures such as celebrating GreenFestival (an innovation), combating severedrought, etc.
About GSSAPV
GSSAPV is a methodology whichenables participatory development with aproactive role for the community. In thismethodology, the vulnerable community-who are the primary stakeholders for thedevelopment issue under consideration-assumes the centre stage, defines theindicators for its own development,assesses its current status as against theseindicators and plans for improving thesituation. The concept is applicable indiverse kinds of development issues suchas environment, women’s empowerment,etc. Core strength of the methodology liesin the fact that the primary stakeholdersare not mere beneficiaries of thedevelopment process but they are activepartners in identifying the root causes oftheir plight, designing the strategies forupliftment and plan for those strategies.Moreover, equal participation of womenat every stage is a mandatory pre-requisite. This ensures women’s role asdecision makers in planning, actions andreview. This is especially of importancein case of communities having high genderinequalities and discrimination.
The experience shows thatidentification of indicators with the
Gender Sensitive Self-Assessment and Planning by Vulnerable Populations 119
participation of the primary stakeholdersis key for identifying the real issues andcause-effect dynamics. Moreover, theindicators are also identified inparticipatory manner with the need basedfacilitation from the facilita tivedevelopment professional.
The community then undertakes self-assessment and planning at specificfrequency (usually annual). As themethodology basically involves thevulnerables, the literacy levels are usuallyvery low. Thus, a verbose narration of anindicator will not be of any value. Insteadeach indicator is translated into a symbolicpicture presentation. This is done with thehelp of a professional artist. Variousalternate depictions of an indicator areformed and field tested with thecommunity before finalising a symbolicpicture for an indicator.
The self-assessment by thevulnerable community for each indicatorbuilds on the commonly understood signalcodes. This assessment is done usually ina focus group kind of setting. Theassessment ranks are, at a very simplifiedlevel, presented in colours - Dark green for excellent status Light green for good status Orange for a satisfactory status, but
with scope for improvement Light red for un-satisfactory condition
needing corrective action Red for a precarious status on which
urgent actions are needed(The earlier version of a 3 colour
scale- Red, Orange and Green- was
refined to this 5 colour scale based on thelearnings from field.)
As a part of self-assessment, thecommunity ticks on the relevant colour forcurrent status of each parameter. Whatwill be of greater interest is the reasonwhy community feels so. The discussionis further channelized towards actions forimprovement on each indicator in termsof concrete actions for improvement. Inother words, this constitutes the ActionPlan. A set of developmental activitiesrequired to achieve progress envisagedunder each indicator are thus identified.These activities are then prioritized.
The actions are segregated into 1) tobe undertaken by the community itself, and2) to be undertaken by outsiders, especiallythe local government. Resourcerequirements and timelines are fixed tomake a comprehensive action plan.
GSSAV as a global innovation
The important features which makesGSSAPV a global innovation are : In the context of many
developmental challenges such asthose related to environment orwomen’s empowerment, communityis regarded as a beneficiary than apartner proactive in all stagesincluding planning to review.GSSAPV provides a systematicparticipatory methodology to enablecommunity to part icipate inmeaningful manner.
It provides an actionable frameworkin the hands of the community to
120 Local Government Quarterly July - September 2015
assess its own situation, introspectfor the reasons and plan actions withclear understanding of those set ofactions within its direct locus ofcontrol and actions expected fromother stakeholders for which liaisingis needed from them.
Community becomes partner rightfrom the problem identification stage.It identifies the indicators forsustainable development in its owncontext. This ensures that a strongsense of ownership by the communityis in-built.
In appreciation of the fact thatwomen are the most vulnerableamong the vulnerable communities,the role of women is institutionalisedin the process. This forms amandatory precondition.
The GSSAPV methodologydemystifies the social andenvironmental issues to great extent.The social concepts and thoughts aredeciphered into commonlyunderstood depictions, visual innature, to enable participation ofeven illiterate communities. Anillustration is of India where thenumber of illiterates as per the officialliberal definition (inability to read andwrite in any language by a person ofmore than 7 years of age) is 282.6mn (27 per cent of India’s totalPopulation) as per Census 2011. Thisis indicative of the significance ofmaking visual tools while workingwith the vulnerable communities.
The self-assessment process is alsohighly demystified with the use ofcommonly understood signal colorcode. Thus the assessment processis made very easy for use by all kindsof vulnerable communities.
The process of development andevolution of the GSSAPV
The concept was developed whileenabling development of SustainabilityPlans under the aegis of the EuropeanUnion supported project “Transfer ofTechnologies for SustainableDevelopment”. The project covereddiverse range of environmentalconsiderations. The challenge wasdeveloping a common methodology whichcould be applicable in these diverseenvironmental regions to enable planningfor sustainable development.
Subsequently, the process wasevolved further based on the learning fromits application at the grassroots in diverseenvironmental and spatial contexts leadingto its current form.
Application of GSSAPV forenvironmental sustainability issueswith 2 real life illustrations
a) Global RISK Award 2015AIILSG’s innovation ‘Community
Self-Assessment and Planning withWomen’s Participation for Disaster RiskReduction of Vulnerable Communities’was felicitated with prestigious ‘RISKAWARD 2015’1 in Sendai, Japan this year.This innovation is currently being
Gender Sensitive Self-Assessment and Planning by Vulnerable Populations 121
implemented in 13 environmentallyvulnerable slums across two citiescovering about 25672 slum dwellerpopulations. The disaster management anddisaster preparedness efforts are plannedat macro level i.e. National, State and Citylevel with less focus on micro levelplanning for addressing the concerns ofvulnerable populations.
The participation of the vulnerablepopulations, who are most susceptible toenvironmental degradation and climatechange impacts, has remained hithertoneglected aspect in city level strategiesand plans for disaster management anddisaster preparedness.
Through this innovation for the firsttime at grassroots level, micro levelplanning for disaster risk reduction is beingundertaken. The efforts for this has beentranslated into concrete action plansdeveloped with active participation of theenvironmentally vulnerable communityespecially women and children in the formof ‘Slum Level Disaster Risk ReductionPlans’. The unique feature of thisapproach is utilising innovativemethodologies e.g. (a) participatory visualtools for self-assessment& planning,(b)child friendly tools to enable participationof children in the process, (c) ‘gendersensitive approach’ as women and youngchildren are worst affected by the disaster
1 The RISK AWARD is a joint initiative of‘The United Nations Office for DisasterRisk Reduction’ (UNISDR), ‘Global RiskForum’, Davos & ‘Munich ReFoundation’, Germany.
impacts.Apart from these, community-friendly methods such as street plays,puppet, and magician for disseminating theenvironment and disaster risk reductionrelated messages are also being utilised.
The ‘Self-Assessment and Planning’methodology has become a vehicle forempowerment of vulnerable communitiesby enabling/ catalysing their activeparticipation in the development process.The ‘SAP’ goes beyond assessment andplanning by the community/ vulnerable butit also focuses on establishing ‘GrassrootsParticipatory Mechanisms’ for ensuringthe sustainability of the initiative.
b) ‘Community Self-Assessment andPlanning for Management &Maintenance of Tenements’ (in thecontext of slums redevelopment).The innovative methodology was
developed under the aegis of Governmentof India and DFID supported projectimplemented by AIILSG: ‘Support toNational Policies for Urban PovertyReduction’. The methodology has crucialsignificance in the wake of large scaleslum redevelopment projects beingundertaken in India and other developingcountries. A major rising concern is thatin absence/ lack of proper maintenanceof these redeveloped housing units, thehorizontal slums translate into verticalslums.
The ‘Community Self-Assessmentand Planning’ methodology was designedto understand (1) current maintenancestatus of the redeveloped housing
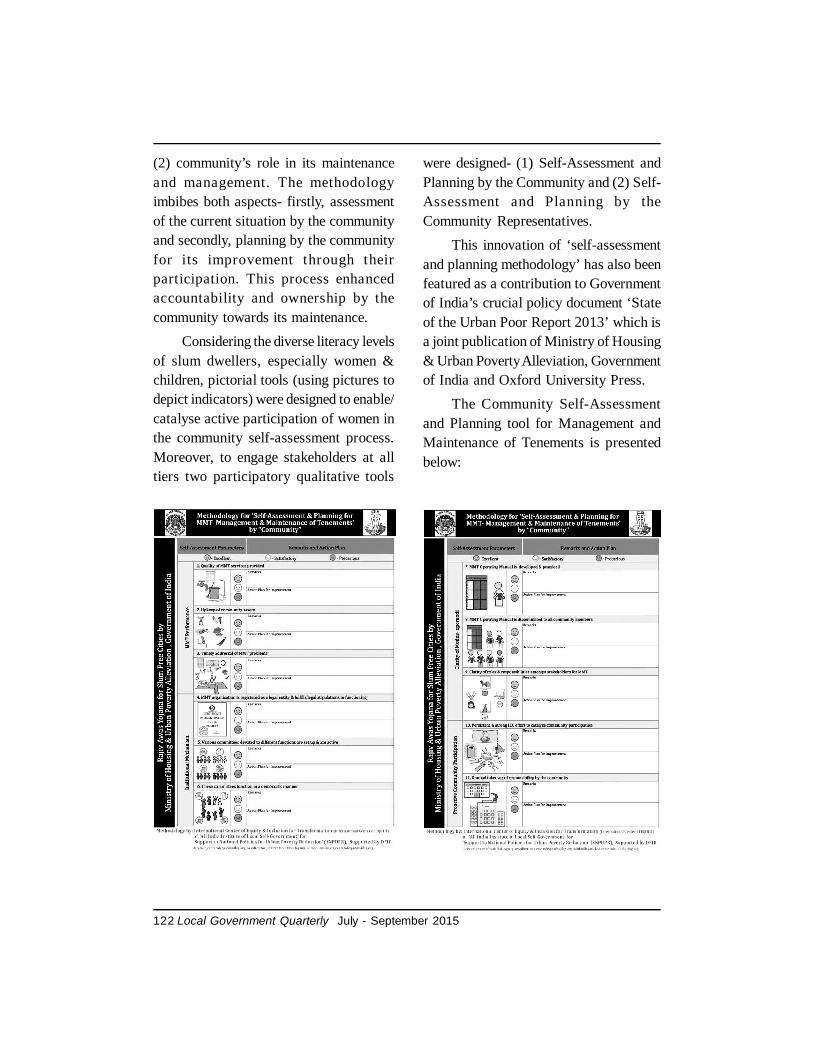
122 Local Government Quarterly July - September 2015
(2) community’s role in its maintenanceand management. The methodologyimbibes both aspects- firstly, assessmentof the current situation by the communityand secondly, planning by the communityfor its improvement through theirparticipation. This process enhancedaccountability and ownership by thecommunity towards its maintenance.
Considering the diverse literacy levelsof slum dwellers, especially women &children, pictorial tools (using pictures todepict indicators) were designed to enable/catalyse active participation of women inthe community self-assessment process.Moreover, to engage stakeholders at alltiers two participatory qualitative tools
were designed- (1) Self-Assessment andPlanning by the Community and (2) Self-Assessment and Planning by theCommunity Representatives.
This innovation of ‘self-assessmentand planning methodology’ has also beenfeatured as a contribution to Governmentof India’s crucial policy document ‘Stateof the Urban Poor Report 2013’ which isa joint publication of Ministry of Housing& Urban Poverty Alleviation, Governmentof India and Oxford University Press.
The Community Self-Assessmentand Planning tool for Management andMaintenance of Tenements is presentedbelow:
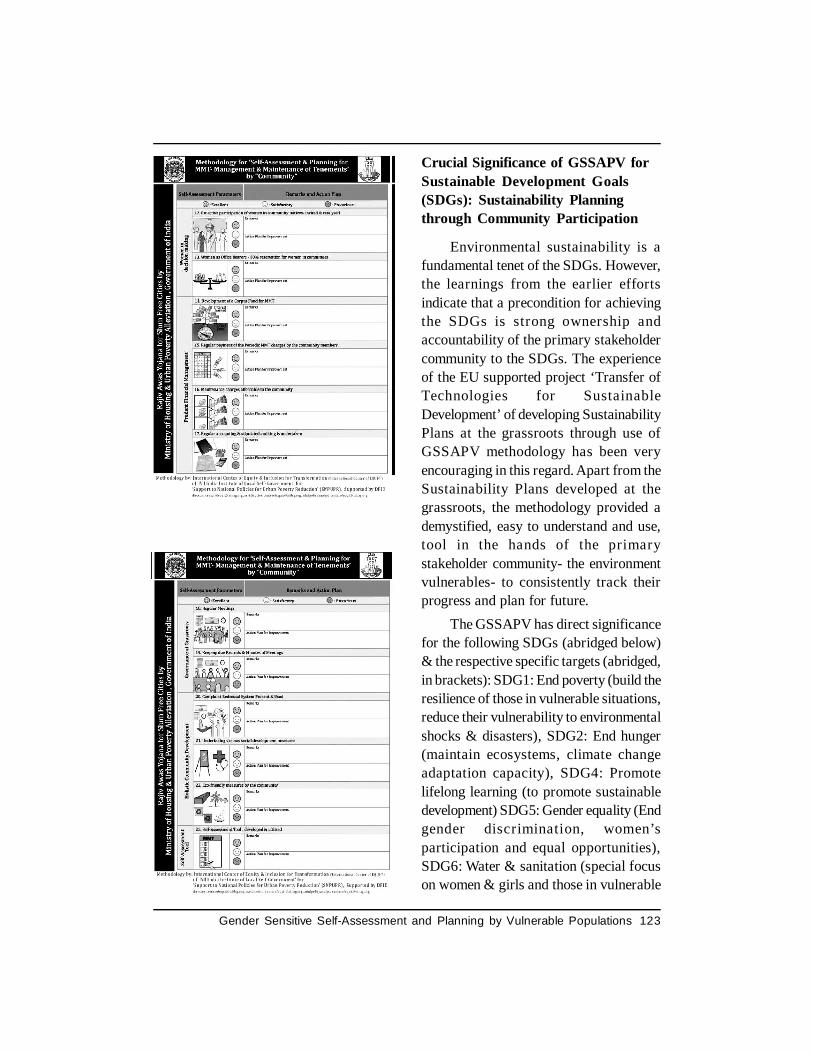
Gender Sensitive Self-Assessment and Planning by Vulnerable Populations 123
Crucial Significance of GSSAPV forSustainable Development Goals(SDGs): Sustainability Planningthrough Community Participation
Environmental sustainability is afundamental tenet of the SDGs. However,the learnings from the earlier effortsindicate that a precondition for achievingthe SDGs is strong ownership andaccountability of the primary stakeholdercommunity to the SDGs. The experienceof the EU supported project ‘Transfer ofTechnologies for SustainableDevelopment’ of developing SustainabilityPlans at the grassroots through use ofGSSAPV methodology has been veryencouraging in this regard. Apart from theSustainability Plans developed at thegrassroots, the methodology provided ademystified, easy to understand and use,tool in the hands of the primarystakeholder community- the environmentvulnerables- to consistently track theirprogress and plan for future.
The GSSAPV has direct significancefor the following SDGs (abridged below)& the respective specific targets (abridged,in brackets): SDG1: End poverty (build theresilience of those in vulnerable situations,reduce their vulnerability to environmentalshocks & disasters), SDG2: End hunger(maintain ecosystems, climate changeadaptation capacity), SDG4: Promotelifelong learning (to promote sustainabledevelopment) SDG5: Gender equality (Endgender discrimination, women’sparticipation and equal opportunities),SDG6: Water & sanitation (special focuson women & girls and those in vulnerable
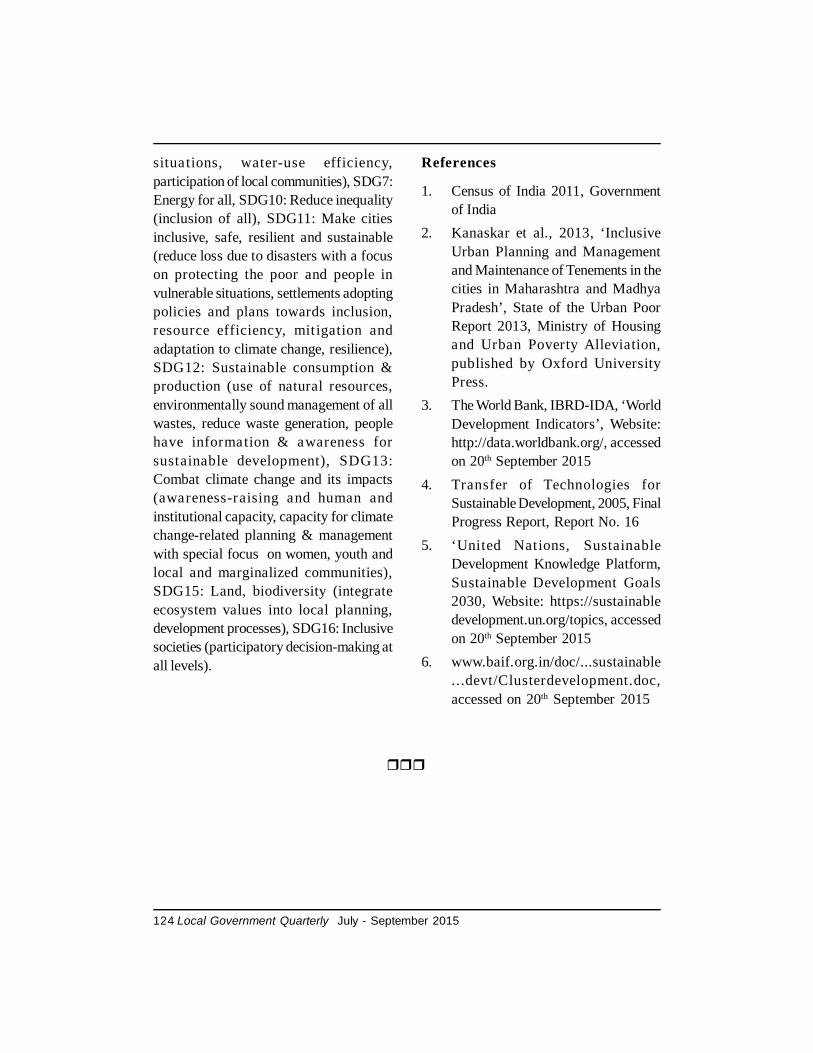
124 Local Government Quarterly July - September 2015
situations, water-use efficiency,participation of local communities), SDG7:Energy for all, SDG10: Reduce inequality(inclusion of all), SDG11: Make citiesinclusive, safe, resilient and sustainable(reduce loss due to disasters with a focuson protecting the poor and people invulnerable situations, settlements adoptingpolicies and plans towards inclusion,resource efficiency, mitigation andadaptation to climate change, resilience),SDG12: Sustainable consumption &production (use of natural resources,environmentally sound management of allwastes, reduce waste generation, peoplehave information & awareness forsustainable development), SDG13:Combat climate change and its impacts(awareness-raising and human andinstitutional capacity, capacity for climatechange-related planning & managementwith special focus on women, youth andlocal and marginalized communities),SDG15: Land, biodiversity (integrateecosystem values into local planning,development processes), SDG16: Inclusivesocieties (participatory decision-making atall levels).
References
1. Census of India 2011, Governmentof India
2. Kanaskar et al., 2013, ‘InclusiveUrban Planning and Managementand Maintenance of Tenements in thecities in Maharashtra and MadhyaPradesh’, State of the Urban PoorReport 2013, Ministry of Housingand Urban Poverty Alleviation,published by Oxford UniversityPress.
3. The World Bank, IBRD-IDA, ‘WorldDevelopment Indicators’, Website:http://data.worldbank.org/, accessedon 20th September 2015
4. Transfer of Technologies forSustainable Development, 2005, FinalProgress Report, Report No. 16
5. ‘United Nations, SustainableDevelopment Knowledge Platform,Sustainable Development Goals2030, Website: https://sustainabledevelopment.un.org/topics, accessedon 20th September 2015
6. www.baif.org.in/doc/...sustainable...devt/Clusterdevelopment.doc,accessed on 20th September 2015
Book Review 125
Book Review
World Development Report 2015:Mind, Society and Behavior.World Bank GroupISSN:0163-5085ISBN: 978-1-4648-0342-0Pages xiv plus 215.
The World War II ravaged Europe and hada devastating effect on the world economy. Theneed of reconstruction was huge and far-reaching. This called for some world level bodiesto rise to the occasion to meet the needs ofreconstruction and bring stability in the worldeconomies, to work for the lost prosperitythrough economic cooperation. To quote JohnMaynard Keynes, “We have to perform at oneand same time the tasks appropriate to theeconomist, to the financier, to the politician, tothe journalist, to the propagandist, to the lawyer,to the statesman-even I think to the prophet andto the soothsayer.” Some 730 delegates from44 Allied Nations, which had fought against theAxis aggression, gathered in Mount WashingtonHotel in Bretton Woods, New Hampshire, UnitedStates, for a conference to deliberate upon thefinancial needs of reconstruction, to set up asystem of rules, institutions and proceduresto regulate the international monetary system,etc. They decided to set up an international bank,the International Bank for Reconstruction andDevelopment and the International MonetaryFund.
The International Bank for Reconstructionand Development (IBRD), over the years,expanded its scope and objectives. It acquiredthe nomenclature of the World Bank, consistingof itself and the International DevelopmentAssociation (IDA). The World Bank is a vitalsource of financial and technical assistance todeveloping countries around the world. In thewords of its President, “We are not a bank inthe ordinary sense but a unique partnershipto reduce poverty and support development.The World Bank Group comprises fiveinstitutions managed by their member countries.”
Thus, today it is the World Bank Group,comprising the IBRD, IDA and three otherbodies as its part, namely, the InternationalFinance Corporation (IFC), the MultilateralInvestment Guarantee Agency (MIGA), and theInternational Centre for Settlement of InvestmentDisputes (ICSID). Thus, the Bank in additionto its main activities of being a vital source offinancial and technical assistance to developingcountries around the world, operates as theWorld Bank Group. The scope of work of theBank has been expanding. Its goals now includeachievement of the following by 2030:
End extreme poverty by decreasing thepercentage of people living on less than$1.25 a day to no more than 3 per cent.
Promote shared prosperity by fostering theincome growth of the bottom 40 per centfor every country
The World Bank Group has a huge corpusof the knowledge of the economies and societalconditions prevalent in the world, and keeps trackof happenings, compiles data, analyses and
126 Local Government Quarterly April - June 2015
studies it. Every year it comes out with a veryvaluable document called World DevelopmentReport. The report contains analyses of variouseconomic and social problems facing variouscountries in the world, and suggests policypostulates. It contains time-relevant data andanalyses and useful information for economicpolicy, social approach and governance. It hasbeen bringing out this report by focusing onsome relevant theme. As such, the report of2015 is on the theme Mind, Society andBehavior.
At any point of time many countries,especially the poor countries in Africa and Asiaare in the throes of some crisis or the other, beit outbreak of some epidemics, internal disorderand violence, terrorism, resulting into a massmisery and displacement of millions. Trigger forthe theme of this report was Ebola outbreak inWest Africa, as the Foreword begins: “ahuman tragedy that has cost thousands oflives and brought suffering to familiesacross entire communities. The outbreak isa tragedy not lonely for those directlyaffected by the disease but also for theirneighbors and fellow citizens.” The indirecteffect of the Ebola crisis showed in slowingbusiness activity, falling wages and rising foodprices that made life even more difficult formillions of people who already live in extremepoverty in that region of the world.
According to the Report some of suchbehavioral effects are unavoidable as Ebola isa terrible disease which necessitatesquarantines and other public health measures.But the fact is that the behavioral responsesare partly driven by stigma, inaccurate
understanding of disease transmission,exaggerated panic and other biases and cognitiveillusions, as had earlier happened with HIV/AIDs,H1N1, etc. The Report proceeds on the premisethat how people make decisions can lead to newinterventions that help households to save more,firms to increase productivity, communities toreduce the prevalence of diseases, etc. as recentresearch has advanced our understanding of thepsychological, social and cultural influences ondecision making and human behavior and hasdemonstrated that they have a significant impacton development outcomes.
The Overview of the Report speaks aboutthree principles of human decision making uponwhich the organizing framework of the Reportrests; Thinking automatically, Thinking sociallyand Thinking with mental models: AutomaticThinking, is effortless, associative and intuitive.It gives a partial view since men jump toconclusions based on limited information.Deliberative System considers a broad set ofrelevant factors; it is effortful, based on reasoningand reflective. Since, men are affected by whatothers are doing and what they expect from us,this pulls men toward certain frames and patternsof collective behavior. The Second Principle,Thinking socially speaks about how individualsare influenced by social preferences, identities,networks and norms and states that many areguided by a sense of fairplay, reciprocity andcooperation. The third principle is Thinking withmental models in which individuals do notrespond to objective experience but to mentalrepresentations of experience, using interpretativeframes provided by mental models. Part 1 of thereport discusses principles of human behavior
Book Review 127
with the belief that an expanded understandingof human behavior can improve developmentpolicy. Part 2 contains how these principles canbe applied in a number of policy domains. Thereport as a whole seeks to accelerate the processof applying the new insights into decision makingto development policy. The Report further saysthat it is only the beginning of an approach thatcould eventually alter the field of developmenteconomics and enhance its effectiveness.
Chapter 1 with the title Thinkingautomatically discusses framing, anchoring,simplification, reminders and commitmentdevices, which policy makers can employ to helppeople make better decisions, which in turn canreduce poverty, and concludes that takingbehavioral perspective on decision making withseemingly minor and low-cost policy changesmay have a large impact on the achievement ofdevelopment goals and the reduction of poverty.
Chapter 2 on Thinking Sociallydemonstrates that recognizing the effect of socialinfluences on action can help developmentpractitioners understand why standard policiessometimes fail and why it is necessary to developnew interventions to combat poverty andpromote shared prosperity.
Chapter 3 on Thinking with MentalModels illustrates how a focus on mental modelsboth gives policy makers new tools for promotingdevelopment and provides new understandingsfor why policies based on standard economicassumptions can fail, and concludes thateconomic and political forces influence mentalmodels, but mental models can have anindependent influence on development by
shaping attention, perception, interpretation andthe associations that automatically come to mind.
Part 2 of the Report containing chapters 4to 9 is concerned with psychological and socialperspectives on policy. Even the affluent nationshave people with poverty. Poverty reduction isthe avowed goal of all the nations and one ofthe chief objectives of the World Bank Group.Chapter 4 focuses on this topic. Though poorhave always existed, the chapter empiricallyshows that ‘poverty is a fluid state, not a stablecondition’. It further says that ‘poverty is notsimply a shortfall of money…….poverty canblunt the capacity to aspire and to takeadvantage of the opportunities that dopresent themselves’. Chapter 5 draws fromstudies, a hard fact that children in poor familiescan differ dramatically from children in richerfamilies in their cognitive and non-cognitiveabilities, resulting in enormous loss of humanpotential for themselves and society. It describesthe critical role that parenting plays in shapingthe child’s early development. It relies on theresults from a small number of high-qualitystudies which found that carefully designedinterventions can pay lifelong returns forindividuals born in poverty. It advocates moreexperimentation and testing to arrive atinterventions to situations that parentsexperience, harnessing insights fromneurobiology and the behavioral sciences tounderstand and tackle the psychological andcultural barriers to effective parenting that arisefrom the contexts in which individuals live. Thechapter recognizes that parents’ beliefs and care-giving practices differ across groups, withconsequences for children’s development
128 Local Government Quarterly April - June 2015
outcomes. It advocates for carefully designinganti-poverty programmes and social policies tohave a powerful indirect effect on childdevelopment by reducing key psychologicalstresses that prevent parents from attending toand engaging positively with their children.
Financial decision making is always makinga hard choice for people in poverty. Chapter 6presents key insights into the social andbehavioral influences on financial decisionmaking. It shows that loss aversion, present bias,cognitive overload and the social psychology ofadvice make financial decision making hard. Thechapter therefore makes a case for policyinterventions to address these tendencies forincluding changing default options, using socialnetworks in micro-finance, employing nudges andreminders, offering commitment devices,simplifying financial education and usingemotional persuasion.
Increasing productivity necessitatesunderstanding motivation and behavior at workby looking into cognitive and psychologicalbarriers that individuals face and the frames thatwork- environments create, and also to examinethe social contexts in which work takes place.These things are brought out effectively by usinggraphics in chapter 7. Chapter 8 with examples,suggests that people think automatically, interpretthe world based on implicit mental models andthink socially that allows policy makers to makemajor strides in improving health outcomes. Itrecommends framing effects that make socialexpectations and social approvals that act tomotivate individuals to seek preventive care andadhere to treatment when they otherwise wouldnot. It further says that individuals can suffer
from an intention-action divide and that throughhealth care providers and commitment devicesand reminders this divide can be narrowed.
Climate change is one of the majorchallenges of our time and adds considerablestress to our societies and to the environment. Itis such a large problem that multiple, coordinatedapproaches are needed to address it. Amongother things it requires every individual to usethe energy and other natural resources prudentlyand avoid waste, and for this, psychological,social and cultural insights can make significantcontributions. Through a case study of Columbia,the Report provides a real world example of howinterventions that take into account conditionalcooperation can be useful for achieving policygoals.
Part 3 of the Report containing chapters10 and 11 is addressed to the developmentprofessionals. Chapter 10 begins with a real factof life that development professionals can besusceptible to a host of cognitive biases, can beinfluenced by their social tendencies and socialenvironments and can use deeply ingrainedmindsets when making choices. Thus, thepurpose of this chapter is to explain why goodpeople can make bad decisions, that theirdecisions are likely to favor certain groups overothers. It points out that in the developmentcontext, where knowledge, status, and powerdifferentials are rife, this often means thatdisadvantaged groups face additional hurdles togetting their voices heard, their concerns heeded.The chapter also admits that while the goal ofdevelopment is to end poverty, developmentprofessionals are not always good at predictinghow poverty shapes mindsets. It shows the
Book Review 129
dichotomy between development and theirclients and states that good social science, hard-won experience, basic professional ethics, andeveryday common sense suggest that an ounceof prevention is a far preferable course of actionfor delivering on the World Bank’s core agendaand mandate.
Finally, chapter 11 contains the suggestedsolution for development professionals includingpolicy makers. It says that to account for thefact that development practitioners themselvesface cognitive constraints, abide by social norms,and use mental models in their work,development organizations may need to changetheir incentive structure, budget processes andinstitutional culture. One of the purposes of theReport, as stated, has been to synthesize someof the most compelling scientific research on thetopic i.e. mind, society and behavior. TheReport hopes that it can inspire developmentprofessionals who are ready to take up challenge.
Poverty alleviation is one of the prime goalsof all the countries- the affluent and the poor,the developed, developing and theunderdeveloped. The book is addressed to policymakers and development professionals. TheReport shows that poverty reduction requiresmuch more than doling financial assistance tothe disadvantaged, and requires an approach bytaking account of the process of thinking of the
target group and of the professionals who handlethe work. It underscores the fact that thinkingprocesses of the limited and narrow kind needto be broadened by realizing the three thinkingprocesses.
It must be acknowledged that the Reportis not an easy reading, but it is a necessaryreading for policy makers, developmentprofessionals and students of developmenteconomics. It addresses deep rooted mindsetsof people, the poor and those working for them.It shows how a richer view of human behaviorcan help achieve development goals in manyareas, including early childhood development,household finance, productivity, health andclimate change. It also shows how a more subtleview of human behavior provides new tools forinterventions. The Report effectively shows thatpoverty is not simply a state of materialdeprivation, but also tells upon cognitiveresources that affects the quality of decisionmaking. It gives a psychological perspective todevelopment economics. The Reportdemonstrates the need for more discovery,learning and adaptation in policy design andimplementation. As is claimed, “This newapproach to development economics hasimmense purpose with a vast scope ofapplication and introduces an important newagenda for the development community.”
F.B. Khan

130 Local Government Quarterly April - June 2015
Our Contributors
Vibhuti Patel
Dr. Vibhuti Patel is Director, Centre for Study of Social Exclusion & Inclusive
Policy, Professor and Head, P.G. Department of Economics, S.N. D. T.
Women’s University, Mumbai.
Saikat Roy
Mr. Saikat Roy is Research Scholar, Department of Political Science,
University of North Bengal, Darjeeling.
Ramanath Jha
Dr. Ramanath Jha is Academic Head and Chief Executive, International
Academy of Urban Dynamics, All India Institute of Local Self-
Government, Mumbai.
P. H. Rao
Dr. P. H. Rao is Fellow (IIM B) Team Leader, Staff Support Unit for Capacity
Building (SUCB), JNNURM, Ministry of Urban Development, Government
of India Nirman Bahavan, New Delhi & CEO, Center for Symbiosis of
Technology, Environment and Management (STEM), Bangalore.
Contd...
Ramakrishna Nallathiga
Mr. Ramakrishna Nallathiga is Associate Professor, National Institute of
Construction Management and Research, 25/1, Balewadi, Pune.
Mohd Taquiddin
Mr. Mohd Taquiddin is Deputy Executive Director, Centre for Good
Governance, Road No. 25, Jubilee Hills, Hyderabad.
G. Palanithurai
Dr. G. Palanithurai is Professor, Rajiv Gandhi Chair for Panchayati Raj
Studies, Department of Political Science and Development
Administration, Gandhigram Rural Institute - Deemed University,
Gandhigram.
R. Hariharan
Dr. R. Hariharan is Assistant Professor of Economics, Centre for Rural
Development, Annamalai University, Annamalainagar, Tamil Nadu.
M. V. Vaithilingam
Dr. M. V. Vaithilingam is Research Officer, Department of Fertility Studies,
International Institute for Population Sciences, Mumbai.
Mukesh Kanaskar
Dr. Mukesh Kanaskar is Professor & Academic Head (Research,Publications and Documentation) All India Institute of Local Self-Government
F. B. Khan
Mr. F. B. Khan is Advisor (Legal and Urban Services and Publications) of
the All India Institute of Local Self-Government, Mumbai.