Embed Size (px)
Citation preview

District of Columbia Five-Year Consolidated Plan FY2011-2015
Page 2 of 184
Cover Photography Attributions
• Bike photo: <div xmlns:cc="http://creativecommons.org/ns#" about="http://www.flickr.com/photos/barton/143990409/"><a rel="cc:attributionURL" href="http://www.flickr.com/photos/barton/">http://www.flickr.com/photos/barton/</a> / <a rel="license" href="http://creativecommons.org/licenses/by-nc-nd/2.0/">CC BY-NC-ND 2.0</a></div>
• Mixed-use building: <div xmlns:cc="http://creativecommons.org/ns#" about="http://www.flickr.com/photos/koshalek/3792036449/in/photostream/"><a rel="cc:attributionURL" href="http://www.flickr.com/photos/koshalek/">http://www.flickr.com/photos/koshalek/</a> / <a rel="license" href="http://creativecommons.org/licenses/by/2.0/">CC BY 2.0</a></div>
• Henson Ridge housing development: DHCD photography file
• Brookland Festival: <div xmlns:cc="http://creativecommons.org/ns#" about="http://www.flickr.com/photos/mr_t_in_dc/1460209527/"><a rel="cc:attributionURL" href="http://www.flickr.com/photos/mr_t_in_dc/">http://www.flickr.com/photos/mr_t_in_dc/</a> / <a rel="license" href="http://creativecommons.org/licenses/by-nc-nd/2.0/">CC BY-NC-ND 2.0</a></div>
District of Columbia Five-Year Consolidated Plan
Page 3 of 184
Table of Contents
Chapter One: General Information
Executive Summary ..................................................................................................................... 8 Strategic Plan .............................................................................................................................. 9
Mission................................................................................................................................... 10 Resources .............................................................................................................................. 13
General Questions ....................................................................................................................... 37 Demographic Profile .............................................................................................................. 38 Geographic Priority Areas...................................................................................................... 46 Basis for Allocation Funding ................................................................................................. 50 Obstacles to Meeting Underserved Needs ............................................................................. 53
Managing the Process .................................................................................................................. 55 Lead Agency ......................................................................................................................... 56 Plan Development Process..................................................................................................... 56 Plan Development Consultations ........................................................................................... 57
Citizen Participation..................................................................................................................... 60 Citizen Participation Process ................................................................................................ 61 Citizen Comments.................................................................................................................. 62 Efforts to Broaden Citizen Participation ................................................................................ 62 Comments Not Accepted ....................................................................................................... 63
Institutional Structure................................................................................................................... 64 Strengths and Gaps in the Delivery System........................................................................... 65 Strengths and Gaps in Delivery of DCHA............................................................................. 66
Monitoring ................................................................................................................................... 67 Monitoring ............................................................................................................................. 68
Priority Needs, Analysis, and Strategies ..................................................................................... 72 Basis for Assigning Priority................................................................................................... 73 Obstacles to Meeting Underserved Needs ............................................................................. 73
Lead-Based Paint ......................................................................................................................... 74 Housing Units Containing Lead-Based Paint ........................................................................ 75 Actions to Reduce Lead Based Paint Hazards ....................................................................... 75
Chapter Two: Housing Housing Needs ............................................................................................................................. 78
Housing Needs ...................................................................................................................... 79 Disproportionate Needs.......................................................................................................... 81
Priority Housing Needs ................................................................................................................ 84 Priority Housing Needs .......................................................................................................... 85 Community Priorities ............................................................................................................. 85 Basis for Assigning Priority................................................................................................... 89 Obstacles to Meeting Underserved Needs ............................................................................. 89
Housing Market Analysis............................................................................................................. 90 Market Characteristics ........................................................................................................... 91 Assisted Housing.................................................................................................................... 98
District of Columbia Five-Year Consolidated Plan FY2011-2015
Page 4 of 184
Housing Markets Influence on Use of Funds......................................................................... 99 Specific Housing Objectives ........................................................................................................ 103
Specific Priorities and Objectives .......................................................................................... 104 Available Resources............................................................................................................... 105
Needs of Public Housing.............................................................................................................. 106 Public Housing Needs ............................................................................................................ 107
Public Housing Strategy............................................................................................................... 108 Housing Agency’s Strategy.................................................................................................... 109 Addressing Resident Needs and Encouraging Involvement .................................................. 110 HUD Designation .................................................................................................................. 110
Barriers to Affordable Housing.................................................................................................... 111 Barriers to Affordable Housing.............................................................................................. 112 Efforts to Remove Barriers to Affordable Housing ............................................................... 112
Chapter Three: Homeless Homeless Needs ......................................................................................................................... 115 Priority Homeless Need .............................................................................................................. 116
Homelessness and Homelessness Prevention Priorities......................................................... 117 Chronic Homelessness ........................................................................................................... 118
Homeless Inventory .................................................................................................................... 119 Homeless Inventory .............................................................................................................. 120
Homeless Strategic Plan .............................................................................................................. 142 Homelessness ........................................................................................................................ 143 Chronic Homelessness ......................................................................................................... 149 Homelessness Prevention....................................................................................................... 149 Institutional Structure............................................................................................................. 151 Discharge Coordination Policy ............................................................................................. 152
Emergency Shelter Grants (ESG) ................................................................................................ 156 Chapter Four: Community Development Community Development ............................................................................................................ 157
Priority Community Development Needs.............................................................................. 158 Basis for Assigning Priorities ............................................................................................... 159 Obstacles to Meeting Underserved Needs ......................................................................... 161 Specific Community Development Objectives...................................................................... 161
Anti-poverty Strategy .................................................................................................................. 164 Antipoverty Programs and Strategies .................................................................................... 165 Strategy for Reducing Poverty............................................................................................... 166
LIHTC Coordination.................................................................................................................... 167 Low Income Housing Tax Credit .......................................................................................... 168
Chapter Five: Non-Homeless Special Needs Specific Special Needs Objectives .............................................................................................. 169
Priorities and Specific Objectives .......................................................................................... 170 Use of Available Resources .................................................................................................. 170
Non-Homeless Special Needs Analysis ....................................................................................... 171 Non-Homeless Population Estimate ...................................................................................... 172 Priority Housing and Supportive Service Needs.................................................................... 174

District of Columbia Five-Year Consolidated Plan
Page 5 of 184
Level of Priority Special Needs Justification......................................................................... 174 Obstacles to Meeting Underserved Special Needs................................................................. 174 Existing Facilities and Services ............................................................................................. 175 Tenant Based Rental Assistance Need Justification .............................................................. 175
HOPWA ..................................................................................................................................... 176 Specific HOPWA Objectives ...................................................................................................... 177 Chapter Six: Other Narrative Other Narrative............................................................................................................................. 178
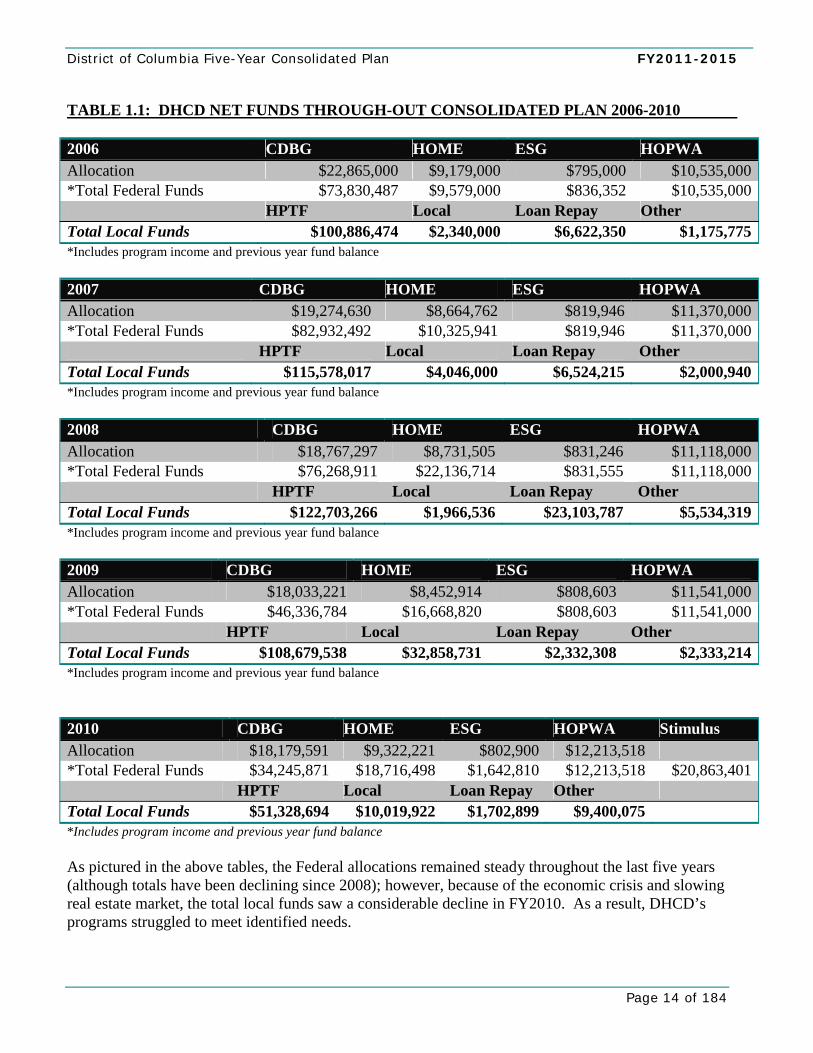
Table of Tables 1.1: DHCD Net Funds Through-Out Consolidated Plan 2006-2010.............................................................................. 14
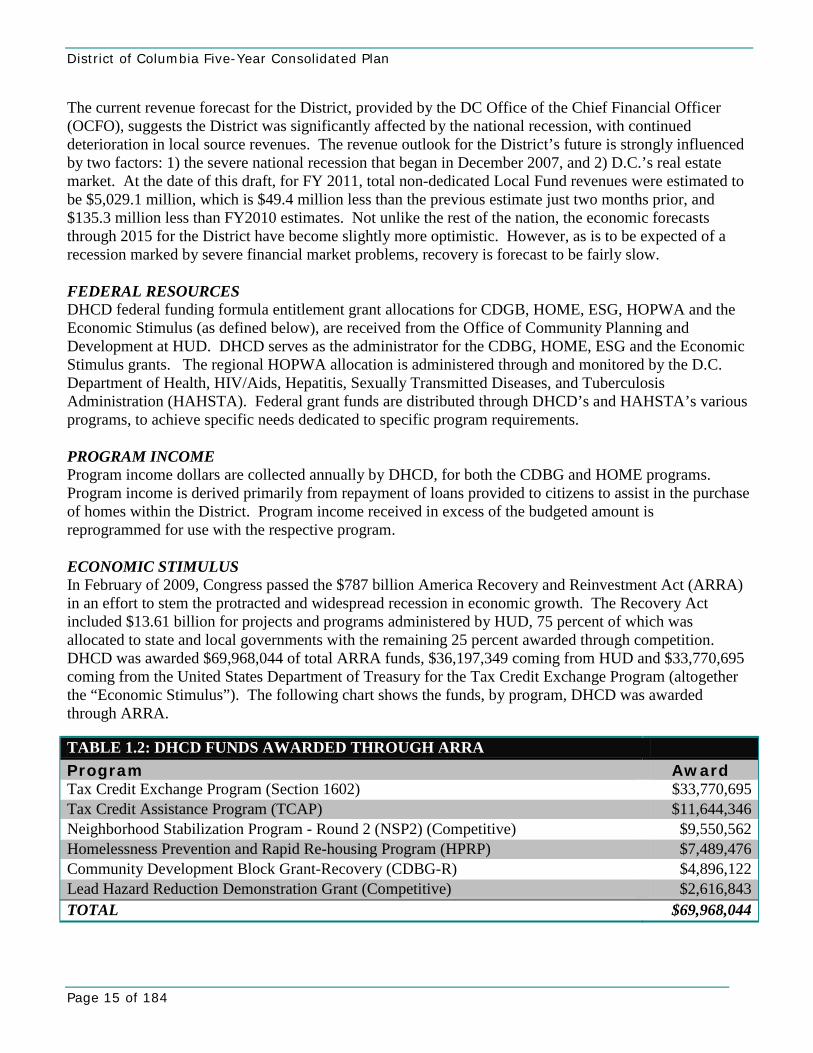
1.2: DHCD Funds Awarded Through ARRA ............................................................................................................... 15
1.3: Housing Regulation Administration Key Performance Indicator ........................................................................... 20
1.4: Rental Housing Commission Key Performance Indicator ..................................................................................... 21
1.5: Development Finance Division Key Performance Indicator................................................................................... 21
1.6: Residential and Community Services Key Performance Indicator ....................................................................... 21
1.7: Property Acquisition and Disposition Key Performance Indicator ......................................................................... 22
1.8: Program Monitoring Division Key Performance Indicator .................................................................................... 22
1.9: Portfolio and Asset Management Division Key Performance Indicator ................................................................. 23
1.10: Outcome and Objectives ....................................................................................................................................... 25
1.11: Summary of Specific Annual Objectives .............................................................................................................. 32
1.12: DC Ward Demographics ....................................................................................................................................... 44
1.13: Unemployment by Ward ....................................................................................................................................... 45
1.14: Federal Entitlement Grant Allocation .................................................................................................................. 53
1.15: HPTF Funding Allocation .................................................................................................................................... 54
1.16: Estimated Number of Homes with Lead Paint ...................................................................................................... 75
1.17: Lead Hazard for Elderly Households ..................................................................................................................... 75
2.1: Low-Moderate Income Households, Income Distribution ...................................................................................... 79
2.2: Low-Moderate Income Households, Household Types .......................................................................................... 79
2.3: Low-Moderate Income Households, Housing Problems......................................................................................... 80
2.4: Housing Needs by Race/Ethnicity........................................................................................................................... 80
2.5: Household Income Levels Relative to MFI ............................................................................................................. 81
2.6: Disproportionate Needs by Race and Ethnicity ...................................................................................................... 82
2.7: Housing Needs ....................................................................................................................................................... 86
2.8: Housing Market Statistics ...................................................................................................................................... 91
2.9: Supply of District Housing ..................................................................................................................................... 92
2.10: Pipeline of Projects Under Construction Delivering through 2012....................................................................... 92
2.11: Special Housing Priorities..................................................................................................................................... 104
District of Columbia Five-Year Consolidated Plan FY2011-2015
Page 6 of 184
2.12: CDBG, HOME, Stimulus and Local Funding for Housing .................................................................................. 105
2.13: Local Funding for Housing ................................................................................................................................... 105
3.1: Homeless Needs ...................................................................................................................................................... 117
3.2: Homeless Housing Inventory.................................................................................................................................. 121
3.3: Recommended PSH Unit Production by Year ......................................................................................................... 141
3.4: Actual PSH Unit Production by Year...................................................................................................................... 141
3.5: Homeless Mitigation Goals...................................................................................................................................... 147
4.1: Community Development Priority Needs Funding................................................................................................. 159
4.2: Community Development Objectives of the CDBG Program ................................................................................ 161
5.1: Disable Elderly Households .................................................................................................................................... 172
5.2: Special Needs Housing Needs................................................................................................................................. 173
Table of Figures 1.1: DHCD Recovery Act Funding Summary of Formula and Competitive Grants ....................................................... 16
1.2: District of Columbia Black Population per Acre by Census Tract........................................................................... 39
1.3: District of Columbia White Population per Acre by Census Tract .......................................................................... 40
1.4: District of Columbia Asian Population per Acre by Census Tract........................................................................... 41
1.5: District of Columbia Hispanic Population per Acre by Census Tract...................................................................... 42
1.6: District of Columbia Percent of Persons Below Poverty Level by Census Tract..................................................... 49
1.7: DHCD Targeted Areas............................................................................................................................................. 51
2.1: Ratio of Units-for-Sale to Sales-per-Month ............................................................................................................. 93
2.2: Distribution of Potential DC Households by Percent of AMI (Short Term Forecast).............................................. 94
2.3: Distribution of Potential DC Households by Percent of AMI (Mid-Term Forecast) ............................................... 94
2.4: Percent Annual Change in the Washington DC & MSA CMHPI by Quarter: 1994 - Present ................................. 95
2.5: Price per Square Foot of Single-Family Homes and New Condominiums .............................................................. 96
2.6: Price Per Square Foot of One Bedroom Apartments................................................................................................ 96
2.7: District of Columbia Foreclosure Concentrations February 2008-December 2009 ................................................. 97
3.1: DC Homeless Assistance Beds, 2009 ...................................................................................................................... 139
3.2: Public and Private Beds by Shelter Type, 2009 ....................................................................................................... 140
Appendices • Appendix A- The Annual Action Plan, FY 2011 • Appendix B- HOPWA 5-Year Consolidated Plan, FY2011-FY2015, and HOPWA FY2011 Action
Plan • Appendix C- Maps • Appendix D- Citizen Participation Plan • Appendix E- Citizen Participation-Summary of Hearings and Citizen Comments • Appendix F- Citizen Participation- Survey Results • Appendix G- Glossary of Acronyms
District of Columbia Five-Year Consolidated Plan
Page 7 of 184
CHAPTER ONE: GENERAL INFORMATION
Executive Summary The Executive Summary is required. Include the objectives and outcomes identified in the plan and an evaluation of past performance. 3-5 Year Strategic Plan Executive Summary:
District of Columbia Five-Year Consolidated Plan FY2011-2015
Page 8 of 184
1 Executive Summary This document contains the Five-Year Consolidated Plan for the District of Columbia, (Fiscal Years 2011-2015), identifying policies and strategies to address the housing and community development needs of low to moderate income residents with funds from local sources and from the following federal entitlement grants: Community Development Block Grant (CDBG); the HOME Investment Partnerships Program (HOME); the Emergency Shelter Grant Program (ESG); and the Housing Opportunities for Persons with Aids Program (HOPWA). Accompanying the Five-Year Plan is the District’s FY 2011 Annual Action Plan which contains the District’s first year plan for implementation of its strategies, including budget details, and required Certifications. The projections contained in these two documents are based on the continuation of HUD entitlement funding at approximately the level of the District’s Fiscal Year (FY) 2010, and the same federal programmatic processes and requirements. Likewise, the projections are based on a similar level of local funding for housing production as in FY 2010. Changes in these funding sources and parameters will require the District to revise these plans. Additionally, the housing market in the District of Columbia, as elsewhere in the country, is in a period of flux. Estimates made today for five years from now may be obsolete within a few months, hence the need for a robust yearly Action Plan process going forward within the Consolidated Plan period.
The Five-Year Consolidated Plan contains the following:
Application to HUD for entitlement grants under the Five-Year Consolidated Plan • Chapter One General Information • Chapter Two Housing • Chapter Three Homeless • Chapter Four Community Development • Chapter Five Non-Homeless Special Needs • Chapter Six Other Narrative • Appendices:
Appendix A- THE ANNUAL ACTION PLAN, FY 2011 Appendix B- HOPWA 5-Year Consolidated Plan, FY2011-FY2015, and HOPWA
FY2011 Action Plan Appendix C- Maps Appendix D- Citizen Participation Plan Appendix E- Citizen Participation-Summary of Hearings and Citizen Comments Appendix F- Citizen Participation- Survey Results Appendix G- Certifications
Note on Tables: The Department of Housing and Community Development has used the tables in HUD’s Consolidated Plan Management Process (CPMP) tool to capture its housing, special needs population, homeless family and individual population, and community development needs information. Objectives and outcomes, as well as past performance, are addressed extensively in the Resources section of the Consolidated Plan.
District of Columbia Five-Year Consolidated Plan
Page 9 of 184
Strategic Plan Due every three, four, or five years (length of period is at the grantee’s discretion) no less than 45 days prior to the start of the grantee’s program year start date. HUD does not accept plans between August 15 and November 15. Mission:
District of Columbia Five-Year Consolidated Plan FY2011-2015
Page 10 of 184
1 Mission The mission of the Department of Housing and Community Development (DHCD) is to create and preserve opportunities for affordable housing and economic development and to revitalize underserved communities in the District of Columbia. DHCD's key objectives are to:
• Preserve and increase the supply of quality affordable housing; • Increase homeownership opportunities; and • Revitalize neighborhoods, promote community development, and provide economic opportunities.
DHCD undertakes this work within the context of a local government committed to a sustainable city with complete neighborhoods. DHCD’s FY2011-2015 Consolidated Plan builds extensively on the District’s Comprehensive Plan, Growing an Inclusive City: From Vision to Reality, adopted in 2006. The cornerstone of this plan can be described succinctly: “We strive to be a more ‘inclusive’ city—to ensure that economic opportunities reach all of our residents, and to protect and conserve the things we value most about communities” (Comprehensive Plan, 1-1). Its overriding emphasis is on improving the quality of life for current and future residents of the District of Columbia. The Comprehensive Plan process began in November 2003, when then Mayor Anthony Williams held a Citizens’ Summit, attended by over 3,000 residents to discuss citywide priorities. Almost 90 percent of the attendees identified “creating an inclusive city” as one of the highest priorities for the city, an aspiration which ultimately became the theme of the Comprehensive Plan: “Growing inclusively is the singular expression of our vision for DC’s future.” Three main challenges were identified: creating successful neighborhoods, increasing access to education and employment, and connecting the whole city. As the Office of Planning moved forward from the Citizens’ Summit, the Mayor and City Council appointed a task force of stakeholders to help guide the plan process. Throughout 2005 and 2006, hundreds of residents attended workshops, community fairs and town meetings held throughout the city to discuss the Draft Comprehensive Plan. In addition to broad community input, the Office of Planning held small group discussions on particular topic areas, such as arts and culture, and Latinos and planning, as well as meeting with dozens of neighborhood and civic organizations, and business groups. An interactive website (www.inclusivecity.org) complemented these in-person meetings. Almost 800 pages of public comment and feedback were received throughout this extensive process, which culminated in a Mayor’s formal hearing in June 2006. The Comprehensive Plan was adopted by the City Council in December 2006. Since its approval, the Comprehensive Plan continues to serve as a blueprint for the city, guiding future development. Acknowledging the work to be done in overcoming the physical, social and economic inequalities that exist in the District, five core themes are used as a yardstick to measure implementation progress: managing growth and change; creating successful neighborhoods; increasing access to education and employment; connecting the whole city; and building green and healthy communities. The Inclusive City planning process and themes detailed above are closely calibrated to the six Livability Principles recently released by the federal Partnership for Sustainable Communities (HUD, DOT and EPA): provide more transportation choices; promote equitable, affordable housing; enhance economic competitiveness; support existing communities; coordinate policies and leverage investment; and value communities and neighborhoods.
District of Columbia Five-Year Consolidated Plan
Page 11 of 184
Many of the sustainability measures that will meet community needs and build on the District’s existing assets will be addressed by other District government agencies and non-profit organizations, using a combination of local and federal funds, but not specifically CDBG, HOME, ESG or HOPWA funding. The use of other government or private funds by these agencies enables DHCD to focus its HUD funds and local funds on housing and neighborhood development priorities, while fostering a holistic approach to a sustainable city with complete neighborhoods. Specific instances of collaboration within and beyond the District government are included throughout the Consolidated Plan. Clearly, DHCD’s mission aligns with a number of the Livability Principles, most notably, promoting equitable, affordable housing; supporting existing communities; and valuing communities and neighborhoods. Beyond these “core” agency principles, DHCD coordinates with other District agencies to ensure that all Livability Principles are embodied in our built environment, as addressed briefly below.
Livability Principles
1. PROVIDE MORE TRANSPORTATION CHOICES According to the American Community Survey (ACS), 2008, the Washington, DC metro area has the second longest mean travel time to work, 33.2 minutes, following only the New York metro area, at 34.5 minutes. As noted later in this document, the District’s population is currently increasing, reversing decades of population decline, driven in part by an increased interest in urban living and leaving behind lengthy commutes. The Washington, DC metropolitan area experience mirrors national trends of increased desire for more walkable communities, and for residences in closer proximity to workplaces. In addition to its comprehensive Metro system, the District provides residents more transportation choices through a variety of methods, including expanded Circulator bus service, and GPS-enabled “next bus” technology, which let riders determine the arrival of the next bus at particular stops throughout the city via cell phones or mobile devices. In terms of non-motorized transit, the District is in the national vanguard with its bicycle and pedestrian programs, including the SmartBike self-service public bike sharing program; Union Station Bike Transit Center with bike commuter facilities and storage; and the ongoing installation of designated bike lanes on city streets, including within the downtown core. Future plans include strategic new streetcar lines and the separation of freeway and local traffic across the rebuilt 11th Street bridges. Preliminary data suggests that the District is seeing reduced vehicle registrations as transportation options expand across neighborhoods.
2. PROMOTE EQUITABLE, AFFORDABLE HOUSING The promotion of equitable, affordable housing is at the core DHCD’s mission and, likewise, at the core of this Consolidated Plan. The population increases and in-migration of new households noted above are positive developments; however, they underscore the vital importance of preserving affordable housing opportunities in the District. DHCD collaborates with partners within the government and outside of it to preserve and produce affordable housing units for people of all ages, abilities, incomes, races, and ethnicities. Notably, in addition to its full complement of affordable housing development finance activities, the District recently implemented an Inclusionary Zoning (IZ) program. This program requires
District of Columbia Five-Year Consolidated Plan FY2011-2015
Page 12 of 184
residential developments of 10 units or more to set aside between eight and 10 percent of housing units for low and moderate income households, and will help ensure that location efficient housing choices are available to households of all income levels.
3. ENHANCE ECONOMIC COMPETITIVENESS This principle includes improving economic competitiveness through reliable and timely access to employment centers, educational opportunities, services and other basic needs by workers as well as expanding business access to markets. In the local context, preparing District residents to compete for jobs in the city and the region through expanded education and job training opportunities is critical in enhancing economic competitiveness. The Mayor’s Education Reform Plan highlights educational achievement and accountability, and, at the adult and continuing education end of the spectrum, is complemented by the recent establishment of the Community College by the University of the District of Columbia (UDC), which offers 20 associate degree and certificate programs and more than 25 workforce development programs. Collaboration and innovation to enhance economic competitiveness are evident in citywide initiatives such as the Green Collar Jobs Initiative, which targets the development of sustainability job opportunities for residents, and the Creative DC Action Agenda, a strategy to strengthen the District’s creative economy in design, media, museums, and the visual, performing and culinary arts. Lastly, and addressed in more detail later in the Comprehensive Plan, DHCD has now fully implemented its Section 3 program, which provides training, employment and contracting opportunities for low and very-low income residents in jurisdictions receiving housing and community development program funding from the Department of Housing and Urban Development (HUD).
4. SUPPORT EXISTING COMMUNITIES Supporting existing communities is fundamental in a dense, transit-rich environment with well-established neighborhoods like the District. DHCD works hand in hand with other District agencies and non-governmental partners to continuously strengthen and revitalize its neighborhoods. Examples within DHCD include the façade improvement program, small business technical assistance, and targeted investment in particular neighborhoods generally, and in particular with Neighborhood Stabilization Program (NSP) and NSP2 federal funds. Infill development which makes use of existing infrastructure and transportation linkages is standard practice in the District, complemented by comprehensive commercial corridor revitalization initiatives, such as Great Streets.
5. COORDINATE POLICIES AND LEVERAGE INVESTMENT Managing growth and change within the District is a primary focus of the Comprehensive Plan, as noted earlier, with a number of initiatives underway to ensure that growth is both sustainable and inclusive. Planning for future growth is guided by zoning, and will be markedly improved by the District’s comprehensive review of zoning regulations. Last undertaken in 1958, this process began anew in 2008 and has included 20 subject area working groups as well as a community task force. The modernized zoning regulations will be a more effective tool for guiding growth.
District of Columbia Five-Year Consolidated Plan
Page 13 of 184
The District continues to innovate and build more sustainability, guided by the Green Building Act of 2006 and recent revisions to the building codes which require enhanced efficiencies in water and energy use, among other changes. Likewise, the Clean and Affordable Energy Act of 2008 established goals for cleaner energy sources and distribution accessible to all, setting a goal that by 2012, 20 percent of the District’s consumed energy come from renewable sources.
6. VALUE COMMUNITIES AND NEIGHBORHOODS Investing in healthy, safe and walkable neighborhoods is critically important to the future of the District. A creative example of putting this concern into action is the Healthy by Design initiative, a framework for District government policies and programs to encourage enhanced resident health through increased access to healthy food, recreational opportunities, and primary care facilities, in addition to walkable destinations. These principles were included in a small area plan which was recently completed for the Bellevue neighborhood. Additionally, the District continues to preserve and foster the distinct qualities that make each of its neighborhoods special. Plans and programs such as small area plans and retail action strategies help communities identify and capitalize on their unique assets.
Building upon the core principles from the 2006 Comprehensive Plan, and incorporating elements of the six Livability Principles, DHCD used the framework, “Sustainable City Complete Neighborhoods” in determining its policies and programs over the next five fiscal years. DHCD defines a complete neighborhood as one that provides access to high quality schools, open space, jobs, affordable housing, public transportation, healthcare and other essential services. Each of these components might not be located in the actual neighborhood, but all residents have safe, reliable access to these goods and services. In order to move District neighborhoods toward completion, the District of Columbia creates Small Area Plans that describe the current needs and assets of neighborhoods, along with recommendations for providing access to essential goods and services. This five-year consolidated plan will build upon the idea of a sustainable city and complete neighborhood throughout.
2 Resources Available and Anticipated Resources DHCD relies on two sources of funding to finance housing and community development projects, programs, and project delivery costs. These include: 1) federal resources from HUD and program income; and 2) local resources composed of District appropriated funds, dedicated tax revenues and special purpose revenues. DHCD makes direct investments and uses funding to leverage private investments. The following tables represent a summary of DHCD’s available net funds, throughout the previous consolidated planning period (FY2006-FY2010). The tables paint a portrait of the previous years’ financial landscape and the resources DHCD had available to accomplish its overall mission and goals.
District of Columbia Five-Year Consolidated Plan FY2011-2015
Page 14 of 184
TABLE 1.1: DHCD NET FUNDS THROUGH-OUT CONSOLIDATED PLAN 2006-2010 2006 CDBG HOME ESG HOPWA Allocation $22,865,000 $9,179,000 $795,000 $10,535,000 *Total Federal Funds $73,830,487 $9,579,000 $836,352 $10,535,000 HPTF Local Loan Repay Other Total Local Funds $100,886,474 $2,340,000 $6,622,350 $1,175,775 *Includes program income and previous year fund balance 2007 CDBG HOME ESG HOPWA Allocation $19,274,630 $8,664,762 $819,946 $11,370,000 *Total Federal Funds $82,932,492 $10,325,941 $819,946 $11,370,000 HPTF Local Loan Repay Other Total Local Funds $115,578,017 $4,046,000 $6,524,215 $2,000,940 *Includes program income and previous year fund balance 2008 CDBG HOME ESG HOPWA Allocation $18,767,297 $8,731,505 $831,246 $11,118,000 *Total Federal Funds $76,268,911 $22,136,714 $831,555 $11,118,000 HPTF Local Loan Repay Other Total Local Funds $122,703,266 $1,966,536 $23,103,787 $5,534,319 *Includes program income and previous year fund balance 2009 CDBG HOME ESG HOPWA Allocation $18,033,221 $8,452,914 $808,603 $11,541,000 *Total Federal Funds $46,336,784 $16,668,820 $808,603 $11,541,000 HPTF Local Loan Repay Other Total Local Funds $108,679,538 $32,858,731 $2,332,308 $2,333,214 *Includes program income and previous year fund balance 2010 CDBG HOME ESG HOPWA Stimulus Allocation $18,179,591 $9,322,221 $802,900 $12,213,518 *Total Federal Funds $34,245,871 $18,716,498 $1,642,810 $12,213,518 $20,863,401 HPTF Local Loan Repay Other Total Local Funds $51,328,694 $10,019,922 $1,702,899 $9,400,075 *Includes program income and previous year fund balance As pictured in the above tables, the Federal allocations remained steady throughout the last five years (although totals have been declining since 2008); however, because of the economic crisis and slowing real estate market, the total local funds saw a considerable decline in FY2010. As a result, DHCD’s programs struggled to meet identified needs.
District of Columbia Five-Year Consolidated Plan
Page 15 of 184
The current revenue forecast for the District, provided by the DC Office of the Chief Financial Officer (OCFO), suggests the District was significantly affected by the national recession, with continued deterioration in local source revenues. The revenue outlook for the District’s future is strongly influenced by two factors: 1) the severe national recession that began in December 2007, and 2) D.C.’s real estate market. At the date of this draft, for FY 2011, total non-dedicated Local Fund revenues were estimated to be $5,029.1 million, which is $49.4 million less than the previous estimate just two months prior, and $135.3 million less than FY2010 estimates. Not unlike the rest of the nation, the economic forecasts through 2015 for the District have become slightly more optimistic. However, as is to be expected of a recession marked by severe financial market problems, recovery is forecast to be fairly slow. FEDERAL RESOURCES DHCD federal funding formula entitlement grant allocations for CDGB, HOME, ESG, HOPWA and the Economic Stimulus (as defined below), are received from the Office of Community Planning and Development at HUD. DHCD serves as the administrator for the CDBG, HOME, ESG and the Economic Stimulus grants. The regional HOPWA allocation is administered through and monitored by the D.C. Department of Health, HIV/Aids, Hepatitis, Sexually Transmitted Diseases, and Tuberculosis Administration (HAHSTA). Federal grant funds are distributed through DHCD’s and HAHSTA’s various programs, to achieve specific needs dedicated to specific program requirements. PROGRAM INCOME Program income dollars are collected annually by DHCD, for both the CDBG and HOME programs. Program income is derived primarily from repayment of loans provided to citizens to assist in the purchase of homes within the District. Program income received in excess of the budgeted amount is reprogrammed for use with the respective program. ECONOMIC STIMULUS In February of 2009, Congress passed the $787 billion America Recovery and Reinvestment Act (ARRA) in an effort to stem the protracted and widespread recession in economic growth. The Recovery Act included $13.61 billion for projects and programs administered by HUD, 75 percent of which was allocated to state and local governments with the remaining 25 percent awarded through competition. DHCD was awarded $69,968,044 of total ARRA funds, $36,197,349 coming from HUD and $33,770,695 coming from the United States Department of Treasury for the Tax Credit Exchange Program (altogether the “Economic Stimulus”). The following chart shows the funds, by program, DHCD was awarded through ARRA.
TABLE 1.2: DHCD FUNDS AWARDED THROUGH ARRA Program Award Tax Credit Exchange Program (Section 1602) $33,770,695 Tax Credit Assistance Program (TCAP) $11,644,346 Neighborhood Stabilization Program - Round 2 (NSP2) (Competitive) $9,550,562 Homelessness Prevention and Rapid Re-housing Program (HPRP) $7,489,476 Community Development Block Grant-Recovery (CDBG-R) $4,896,122 Lead Hazard Reduction Demonstration Grant (Competitive) $2,616,843 TOTAL $69,968,044

District of Columbia Five-Year Consolidated Plan FY2011-2015
Page 16 of 184
Figure 1.1: DHCD RECOVERY ACT FUNDING
All ARRA funds must be spent within two to three years, although each grant program has specific milestone spending requirements. In the outset of the Consolidated Plan, these funds will be used towards homeless prevention throughout the District, neighborhood stabilization (NSP 2) in the Ivy City/Trinidad, Deanwood and Anacostia neighborhoods, lead abatement throughout the District, façade improvements in targeted District commercial corridors, small business assistance, non housing community development in targeted areas throughout the District and tax credit assistance to developers of affordable housing. *In addition to the ARRA funding, DHCD received funds through the first round of the Neighborhood Stabilization Program (NSP1), through the Housing and Economic Recovery Act of 2008 (HERA). Pursuant to HERA, DHCD received an allocation of $2.8 million from HUD, which is being invested in the Ivy City/Trinidad neighborhood in Ward 5 to create 50 units of affordable housing from 37 vacant properties. Under NSP1, grantees have 18 months from the date HUD signed their grant agreements to obligate these funds and four years to expend allocations. In the first year of the consolidated plan, DHCD will expend the funds receive to complete the NSP1 portion of the project and continue complimentary activities under NSP2. HOUSING CHOICE VOUCHER PROGRAM (SECTION 8) The D.C. Housing Authority (DCHA) receives, administers, and monitors funds for the Section 8 Program, known as the Housing Choice Voucher Program (HCVP). The Section 8 funds allocated will be
District of Columbia Five-Year Consolidated Plan
Page 17 of 184
used to increase affordable housing choices for very low-income households by allowing families to choose privately owned rental housing. The funds are not part of the DHCD budget, but may be used by low-income families to obtain affordable housing in projects funded by DHCD. LOW INCOME HOUSING TAX CREDITS (LIHTC) The LIHTC Program was enacted by Congress in 1986 to provide owners of qualifying properties a federal tax incentive with the Internal Revenue Service (IRS) for providing rental housing at affordable rents for individuals and families of low or moderate income levels. The IRS charged the administration of the LIHTC program in the District of Columbia to DHCD. DHCD delegates the underwriting of the 4% LIHTC to the District of Columbia’s Housing Finance Agency (DCHFA), and independent agency that specializes in housing related bond financing. DHCD allocates and underwrites the District’s annual allowance of 9% LIHTC. In FY 2010, DHCD’s 9% LIHTC allowance was $2,500,000, and that amount is expected to remain steady. As mandated by the IRS, DHCD is charged with insuring the on-going compliance of LIHTC properties in the District of Columbia by conducting monitoring. DHCD meets this requirement by conducting physical inspections of the project’s buildings and tax credit units, as well as review of the tenant files to determine their status with the rules and regulations of the LIHTC program. Residents of tax credit units are required to be within the income limits, released annually by HUD, and owners of tax credit housing are required to meet the rent restrictions for tax credit units. Owners of rental housing receiving an allocation of tax credits from the DHCD are required to enter into a restrictive covenant. The restrictive covenant adds an additional 15 years to the 15-year tax credit compliance period. The LIHTC program annual total funding is estimated upon the revenue from fees and the previous year’s fund balance. LOCAL RESOURCES DHCD’s local resources consist of appropriated and local revenue-based funds, including the Housing Production Trust Fund (HPTF), Local Appropriation, Loan Repayments, Unified Fund, Intra-District Fund and Nuisance Fund. The HPTF is a local source of money for affordable housing development, established by the Housing Production Trust Fund Act of 1988. Capital for the HPTF is supplied from the legislated share of DC deed recordation taxes and real estate transfer taxes, currently 15%. The HPTF is designed to direct assistance toward the housing needs of the most vulnerable District residents, very low- and extremely low-income renters. Pending the receipt of feasible project proposals, the statute requires that:
• A minimum of 40% of all HPTF monies disbursed each year must benefit households earning up to 30% of the area median income (AMI);
• A second minimum of 40% of the HPTF monies must benefit households earning between 31% and 50% of the AMI;
• The remainder must benefit households earning between 51% and 80% of the AMI: and • At least 50% of the HPTF monies disbursed each year must be used for the development of rental
housing. The rest of the HPTF monies may be used for, but are not limited to, for-sale housing development, single family housing rehabilitation, and loans and title clearing costs associated with PADD.
District of Columbia Five-Year Consolidated Plan FY2011-2015
Page 18 of 184
DHCD will continue to utilize the HPTF Site Acquisition Funding Initiative (SAFI), which combines HPTF money with money from private lenders to provide loans to non-profit housing developers to facilitate acquisition of sites for affordable housing. DHCD also receives separate, local budget appropriations and repayments on loans originally funded with local dollars, for its HPAP, which it uses to make more homebuyer assistance loans. In addition, DHCD will continue to use the combined special purpose revenues of the DHCD Unified Fund; Intra-District funds from other District Agencies, including a portion of the Rental Unit Fee revenues deposited into DCRA’s Nuisance Abatement Fund; and condominium/cooperative conversion fees deposited into DHCD’s Housing Assistance Fund. PRIVATE FUNDS AND LEVERAGING The grant award criteria for the District’s housing and community development programs require the maximum use of private financial resources. Because DHCD uses its funds to “close the gap” of needed financing for its selected projects, private financing sector generally provides a significant portion of each project’s funds. Banks and savings and loan institutions serve as the primary financing sources of all housing production, rehabilitation, or capital improvements. Many banks have special community lending operations, partly in response to the provisions of the Community Reinvestment Act, which encourages local lenders to invest in affordable housing and other community support projects. Several local banks have been active in supporting nonprofit affordable housing development. The District’s public dollars leverage these private funds. DHCD also works in tandem with non-profit and semi-governmental development organizations to leverage funds for affordable housing and economic opportunity. In addition, the District government and nonprofit developers have actively reached out to capture foundation grants. Many nonprofit organizations seek foundation funding to provide social support services, especially to special needs populations. Among the organizations that are active in this area are the Fannie Mae Foundation, Local Initiatives Support Corporation (LISC), and the Enterprise Foundation. MATCHING FUNDS Three HUD programs require matching funds: HOME, ESG and Lead Hazard Control. The District must provide a matching contribution of local appropriated funds to HOME-funded or other affordable housing projects as a condition of using HOME monies. Throughout the five-year plan, the District’s contribution will not be less than 25 percent of our non-administrative HOME draws. DHCD generally meets its HOME obligation through contributions from the Housing Production Trust Fund. Eighty percent of all HPTF funds must benefit households earning up to a true 50 percent of the area median income, which is below the HOME income eligibility maximum; moreover, HPTF-assisted rental projects must be affordable for 40 years, which exceeds the HOME affordability period requirement. As the Department incurs HOME match-eligible expenses, it will ensure that adequate funding is provided for the matching contribution. In addition to its federal ESG funds, the District of Columbia will provide local match dollars to support outreach and prevention services; support shelter operations and fund renovation of shelter space. The District will work to provide assistance for the homeless through community-based organizations, faith-based organizations and other non-profit service providers. DHCD also has a local match requirement for its Lead Hazard Control monies. This funding is used to abate lead-based hazards in single- and multi-family properties.
District of Columbia Five-Year Consolidated Plan
Page 19 of 184
CAPITAL FUNDS The District Capital Improvement Program (“Capital”) funds various modernization, acquisition and improvement efforts. DHCD will receive an annual allocation of Capital funds for activities in PADD. These activities will consist of acquisition, assemblage, site preparations, and demolition and stabilization of property to promote housing, affordable housing, and economic development opportunities. Projects for acquisition are identified in target areas where the District can make an investment to enhance and compliment development opportunities or projects being undertaken by the private or non-profit sectors, and more importantly neighborhoods with substantial concentrations of vacant and abandoned property. Once the District owns the property, Capital funds pay for costs related to the maintenance, rehabilitation and/or stabilization of the real property. DMPED will also receive Capital dollars for the Great Streets Initiative projects, where the District will continue to work with private and not-for–profit developers to develop key public and quasi-public owned parcels. In addition, DHCD’s capital budget provides gap financing to the DC Housing Authority (DCHA) to complete large-scale HOPE VI redevelopment projects. Performance Measurement, Goals and Specific Objectives Performance measurement is a tool that allows the District to gain insight into, and make judgments about, the effectiveness and efficiency of government programs, processes and people. By collecting and analyzing meaningful data and focusing on results that benefit District residents, the administration can improve the performance of city government. Performance management and measurement in the District is by no means new, however, the District and DHCD have taken several steps to make the process and the results more transparent, accessible and efficient. For years, the city has included performance information in its budget books and in annual reports. In 2008, the Office of the City Administrator (OCA) expanded the use of performance measures in CapStat accountability sessions, built a web-based data submission tool, and revised year-end reports to make them more visually accessible and informative. Agencies often have supplemented citywide reports with their own performance reports. Historically, many of the city’s performance metrics tracked outputs. Starting in the 2010 planning cycle, and carrying forward throughout the remainder of this plan, the emphasis has been shifted towards sustainability to balance the perspective between outputs, outcomes and efficiency. Effective sustainable performance measures, measure not just internal agency efficiency and outputs, but more importantly, external outcomes. Before the 2010 planning cycle, DHCD reported on the agency as a whole, including a scope of services, objectives, initiatives and key performance indicators. Beginning in 2010, DHCD was asked by the Executive Office of the Mayor (EOM), to submit division level performance information. This implementation has allowed DHCD to analyze, on a monthly basis, the productivity of each division and its progress in meeting spending plans and program commitments to HUD, to the Mayor and to the Council of the District of Columbia. In a commitment to transparency and accountability, the District has established a CapStat website to allow residents to track how District Government is working for them. Residents can use these pages to track the performance of individual agencies, find neighborhood statistics and learn how government is responding to the city’s most pressing challenges. DHCD’s annual performance plans and annual
District of Columbia Five-Year Consolidated Plan FY2011-2015
Page 20 of 184
performance accountability reports are available on this site. In addition, newly established TrackDC, is available to allow the public to track the performance of individual agencies, learn more about agencies Key Performance Indicators, Budget, Spending and News, access agency Data and Connect directly to the agency. DHCD’s internal reporting measurements now align directly with its budgeting methods, and include efforts to work towards a more sustainable community. The Departments measurements are divided among eight programmatic divisions:
• Office of the Director • Housing Regulation Administration (HRA) • Rental Housing Commission (RHC) • Development Finance Division (DFD) • Residential and Community Services Division (RCSD) • Property Acquisition and Disposition Division (PADD) • Office of Program Monitoring (OPM) • Portfolio Management Division (PMD)
In this structure, DHCD focuses on three strategic objectives:
• Preserving and increasing the supply of quality affordable housing; • Increasing homeownership opportunities; and • Revitalizing neighborhoods, promoting community development, and providing economic
opportunities.
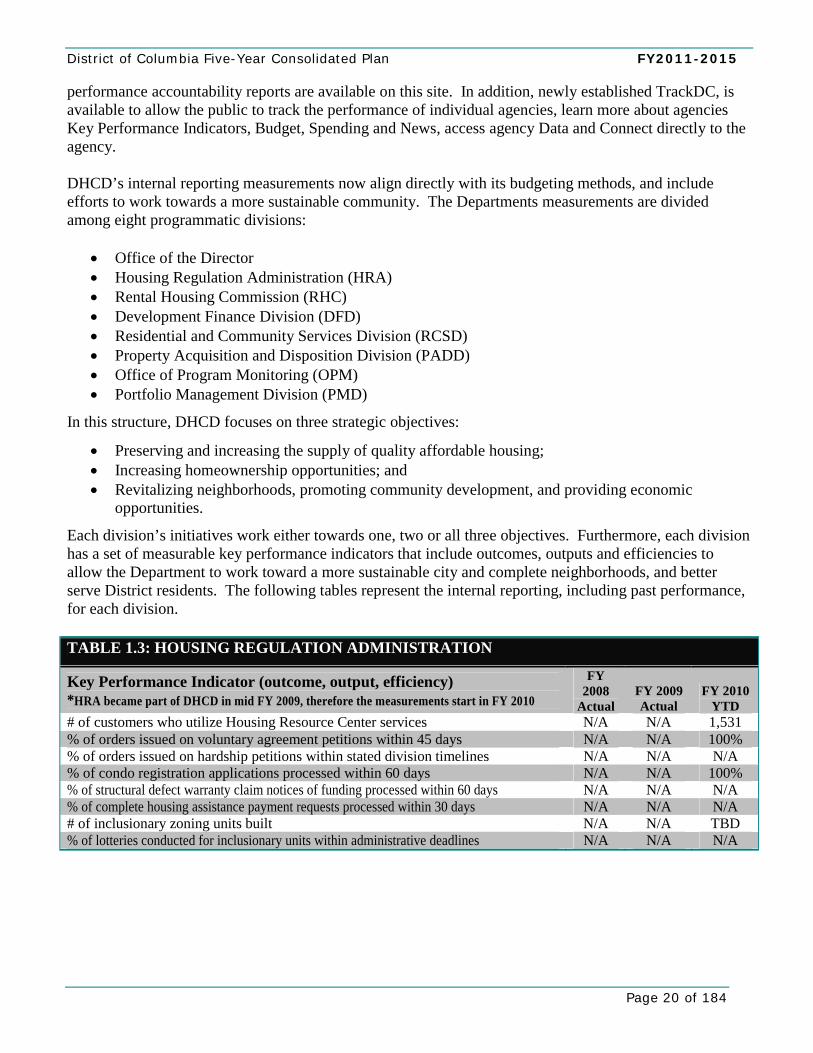
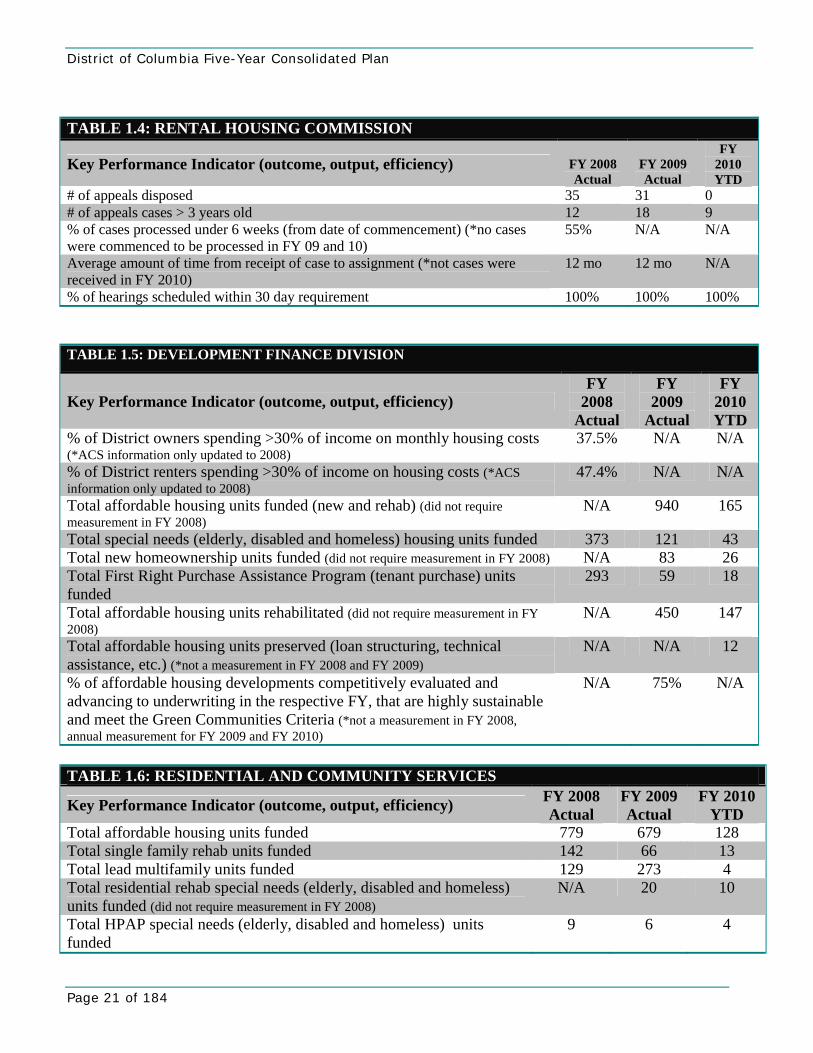
Each division’s initiatives work either towards one, two or all three objectives. Furthermore, each division has a set of measurable key performance indicators that include outcomes, outputs and efficiencies to allow the Department to work toward a more sustainable city and complete neighborhoods, and better serve District residents. The following tables represent the internal reporting, including past performance, for each division. TABLE 1.3: HOUSING REGULATION ADMINISTRATION
Key Performance Indicator (outcome, output, efficiency) *HRA became part of DHCD in mid FY 2009, therefore the measurements start in FY 2010
FY 2008
Actual FY 2009 Actual
FY 2010 YTD
# of customers who utilize Housing Resource Center services N/A N/A 1,531 % of orders issued on voluntary agreement petitions within 45 days N/A N/A 100% % of orders issued on hardship petitions within stated division timelines N/A N/A N/A % of condo registration applications processed within 60 days N/A N/A 100% % of structural defect warranty claim notices of funding processed within 60 days N/A N/A N/A % of complete housing assistance payment requests processed within 30 days N/A N/A N/A # of inclusionary zoning units built N/A N/A TBD % of lotteries conducted for inclusionary units within administrative deadlines N/A N/A N/A
District of Columbia Five-Year Consolidated Plan
Page 21 of 184
TABLE 1.4: RENTAL HOUSING COMMISSION
Key Performance Indicator (outcome, output, efficiency) FY 2008 Actual
FY 2009 Actual
FY 2010 YTD
# of appeals disposed 35 31 0 # of appeals cases > 3 years old 12 18 9 % of cases processed under 6 weeks (from date of commencement) (*no cases were commenced to be processed in FY 09 and 10)
55% N/A N/A
Average amount of time from receipt of case to assignment (*not cases were received in FY 2010)
12 mo 12 mo N/A
% of hearings scheduled within 30 day requirement 100% 100% 100% TABLE 1.5: DEVELOPMENT FINANCE DIVISION
Key Performance Indicator (outcome, output, efficiency) FY
2008 Actual
FY 2009
Actual
FY 2010 YTD
% of District owners spending >30% of income on monthly housing costs (*ACS information only updated to 2008)
37.5% N/A N/A
% of District renters spending >30% of income on housing costs (*ACS information only updated to 2008)
47.4% N/A N/A
Total affordable housing units funded (new and rehab) (did not require measurement in FY 2008)
N/A 940 165
Total special needs (elderly, disabled and homeless) housing units funded 373 121 43 Total new homeownership units funded (did not require measurement in FY 2008) N/A 83 26 Total First Right Purchase Assistance Program (tenant purchase) units funded
293 59 18
Total affordable housing units rehabilitated (did not require measurement in FY 2008)
N/A 450 147
Total affordable housing units preserved (loan structuring, technical assistance, etc.) (*not a measurement in FY 2008 and FY 2009)
N/A N/A 12
% of affordable housing developments competitively evaluated and advancing to underwriting in the respective FY, that are highly sustainable and meet the Green Communities Criteria (*not a measurement in FY 2008, annual measurement for FY 2009 and FY 2010)
N/A 75% N/A
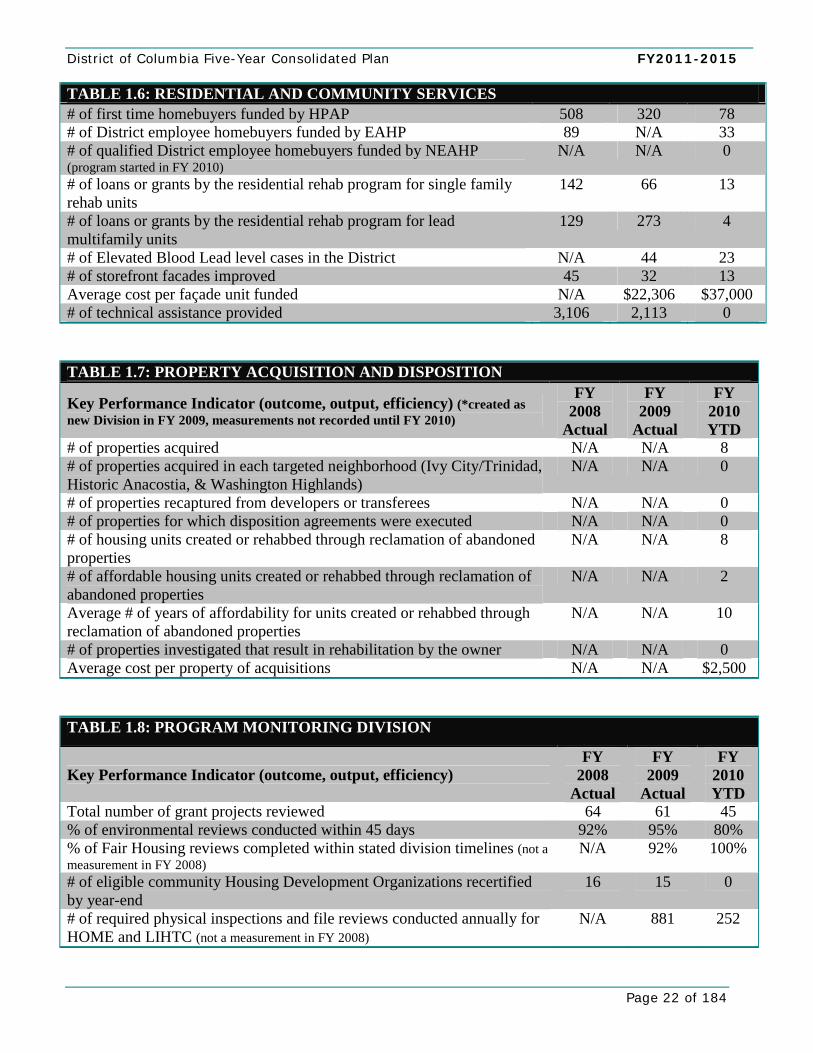
TABLE 1.6: RESIDENTIAL AND COMMUNITY SERVICES
Key Performance Indicator (outcome, output, efficiency) FY 2008 Actual
FY 2009 Actual
FY 2010 YTD
Total affordable housing units funded 779 679 128 Total single family rehab units funded 142 66 13 Total lead multifamily units funded 129 273 4 Total residential rehab special needs (elderly, disabled and homeless) units funded (did not require measurement in FY 2008)
N/A 20 10
Total HPAP special needs (elderly, disabled and homeless) units funded
9 6 4
District of Columbia Five-Year Consolidated Plan FY2011-2015
Page 22 of 184
TABLE 1.6: RESIDENTIAL AND COMMUNITY SERVICES # of first time homebuyers funded by HPAP 508 320 78 # of District employee homebuyers funded by EAHP 89 N/A 33 # of qualified District employee homebuyers funded by NEAHP (program started in FY 2010)
N/A N/A 0
# of loans or grants by the residential rehab program for single family rehab units
142 66 13
# of loans or grants by the residential rehab program for lead multifamily units
129 273 4
# of Elevated Blood Lead level cases in the District N/A 44 23 # of storefront facades improved 45 32 13 Average cost per façade unit funded N/A $22,306 $37,000 # of technical assistance provided 3,106 2,113 0 TABLE 1.7: PROPERTY ACQUISITION AND DISPOSITION
Key Performance Indicator (outcome, output, efficiency) (*created as new Division in FY 2009, measurements not recorded until FY 2010)
FY 2008
Actual
FY 2009
Actual
FY 2010 YTD
# of properties acquired N/A N/A 8 # of properties acquired in each targeted neighborhood (Ivy City/Trinidad, Historic Anacostia, & Washington Highlands)
N/A N/A 0
# of properties recaptured from developers or transferees N/A N/A 0 # of properties for which disposition agreements were executed N/A N/A 0 # of housing units created or rehabbed through reclamation of abandoned properties
N/A N/A 8
# of affordable housing units created or rehabbed through reclamation of abandoned properties
N/A N/A 2
Average # of years of affordability for units created or rehabbed through reclamation of abandoned properties
N/A N/A 10
# of properties investigated that result in rehabilitation by the owner N/A N/A 0 Average cost per property of acquisitions N/A N/A $2,500 TABLE 1.8: PROGRAM MONITORING DIVISION
Key Performance Indicator (outcome, output, efficiency) FY
2008 Actual
FY 2009
Actual
FY 2010 YTD
Total number of grant projects reviewed 64 61 45 % of environmental reviews conducted within 45 days 92% 95% 80% % of Fair Housing reviews completed within stated division timelines (not a measurement in FY 2008)
N/A 92% 100%
# of eligible community Housing Development Organizations recertified by year-end
16 15 0
# of required physical inspections and file reviews conducted annually for HOME and LIHTC (not a measurement in FY 2008)
N/A 881 252
District of Columbia Five-Year Consolidated Plan
Page 23 of 184
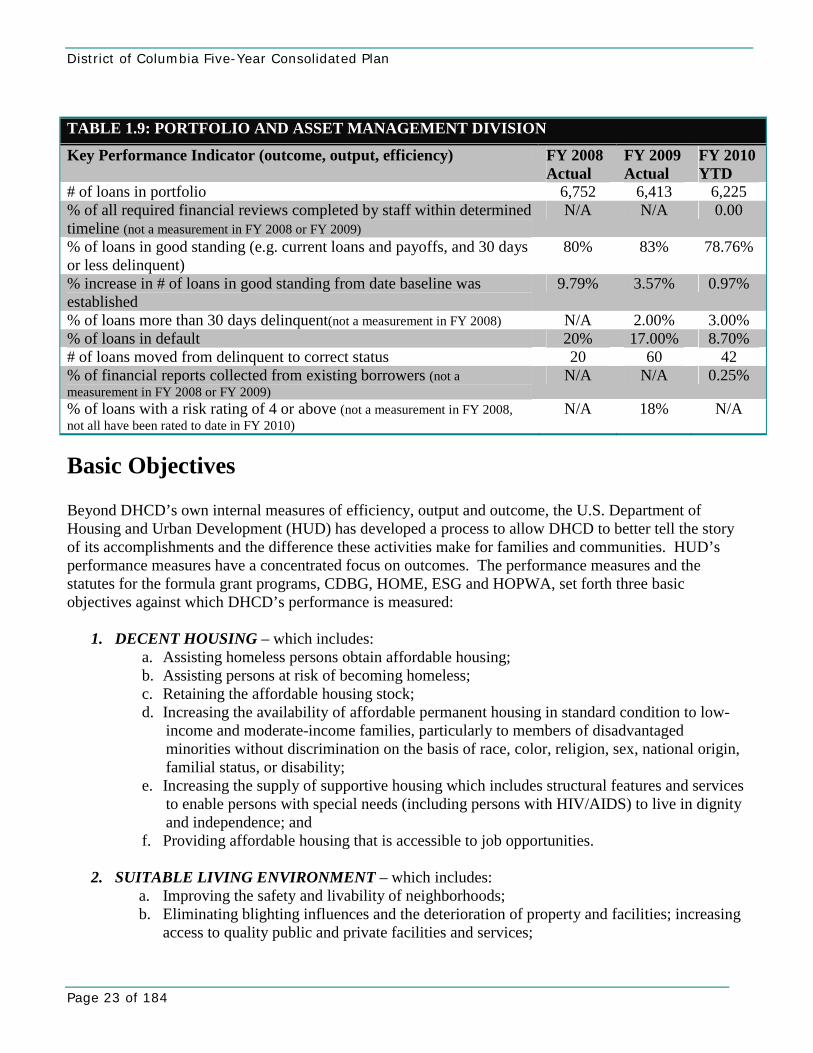
TABLE 1.9: PORTFOLIO AND ASSET MANAGEMENT DIVISION
Key Performance Indicator (outcome, output, efficiency) FY 2008 Actual
FY 2009 Actual
FY 2010 YTD
# of loans in portfolio 6,752 6,413 6,225 % of all required financial reviews completed by staff within determined timeline (not a measurement in FY 2008 or FY 2009)
N/A N/A 0.00
% of loans in good standing (e.g. current loans and payoffs, and 30 days or less delinquent)
80% 83% 78.76%
% increase in # of loans in good standing from date baseline was established
9.79% 3.57% 0.97%
% of loans more than 30 days delinquent(not a measurement in FY 2008) N/A 2.00% 3.00% % of loans in default 20% 17.00% 8.70% # of loans moved from delinquent to correct status 20 60 42 % of financial reports collected from existing borrowers (not a measurement in FY 2008 or FY 2009)
N/A N/A 0.25%
% of loans with a risk rating of 4 or above (not a measurement in FY 2008, not all have been rated to date in FY 2010)
N/A 18% N/A
Basic Objectives Beyond DHCD’s own internal measures of efficiency, output and outcome, the U.S. Department of Housing and Urban Development (HUD) has developed a process to allow DHCD to better tell the story of its accomplishments and the difference these activities make for families and communities. HUD’s performance measures have a concentrated focus on outcomes. The performance measures and the statutes for the formula grant programs, CDBG, HOME, ESG and HOPWA, set forth three basic objectives against which DHCD’s performance is measured:
1. DECENT HOUSING – which includes: a. Assisting homeless persons obtain affordable housing; b. Assisting persons at risk of becoming homeless; c. Retaining the affordable housing stock; d. Increasing the availability of affordable permanent housing in standard condition to low-
income and moderate-income families, particularly to members of disadvantaged minorities without discrimination on the basis of race, color, religion, sex, national origin, familial status, or disability;
e. Increasing the supply of supportive housing which includes structural features and services to enable persons with special needs (including persons with HIV/AIDS) to live in dignity and independence; and
f. Providing affordable housing that is accessible to job opportunities.
2. SUITABLE LIVING ENVIRONMENT – which includes: a. Improving the safety and livability of neighborhoods; b. Eliminating blighting influences and the deterioration of property and facilities; increasing
access to quality public and private facilities and services;
District of Columbia Five-Year Consolidated Plan FY2011-2015
Page 24 of 184
c. Reducing the isolation of income groups within areas through spatial deconcentration of housing opportunities for lower income persons and the revitalization of deteriorating neighborhoods;
d. Restoring and preserving properties of special historic, architectural, or aesthetic value; and e. Conserving energy resources and use of renewable energy sources.
3. CREATING ECONOMIC OPPORTUNITIES – which includes:
a. Job creation and retention; b. Establishment, stabilization and expansion of small businesses (including micro-
businesses); c. The provision of public services concerned with employment; d. The provision of jobs to low-income persons living in areas affected by those programs and
activities, or jobs resulting from carrying out activities under programs covered by the plan; e. Availability of mortgage financing for low-income persons at reasonable rates using non-
discriminatory lending practices; f. Access to capital and credit for development activities that promote the long term economic
and social viability of the community; and g. Empowerment and self-sufficiency for low-income persons to reduce generational poverty
in federally assisted housing and public housing.
Outcome Categories
After deciding upon the objective, to better reflect what DHCD is seeking through funding, one of three outcome categories will then be chosen. The three outcome categories are:
1. AVAILABILITY/ACCESSIBILITY – applies to activities that make services, infrastructure,
public services, public facilities, housing, or shelter available or accessible to low and moderate-income people, including persons with disabilities. In this category, accessibility does not refer only to physical barriers, but also to making the affordable basics of daily living available and accessible to low and moderate income people where they live.
2. AFFORDABILITY – applies to activities that provide affordability in a variety of ways in the lives of low- and moderate-income people. It can include the creation or maintenance of affordable housing, basic infrastructure hook-ups, or services such as transportation or day care.
3. SUSTAINABILITY – applies to projects where the activity or activities are aimed at improving
communities or neighborhoods, helping to make them livable or viable by providing benefit to persons of low- and moderate-income or by removing or eliminating slums or blighted areas, through multiple activities or services that sustain communities or neighborhoods.
Specific Objectives (Outcome/Objectives) Each outcome category can be connected to each of the overarching objectives, resulting in a total of nine groups of outcome/objective statements.

District of Columbia Five-Year Consolidated Plan
Page 25 of 184
Objective EO Economic
Opportunity
Objective SL Suitable Living
Objective DH Decent
Housing
DHCD has consolidated its outcome performance indicators to directly correlate with HUD’s matrix. The following are the specific objectives identified by DHCD to provide new or improved availability/accessibility, affordability, or sustainability of decent housing, a suitable living environment, and economic opportunity. DECENT HOUSING-AVAILABILITY (DH-1)
1. Number of customers who utilize the Housing Resource Center.
In July of 2009, DHCD opened the Housing Resource Center in Ward 8 of Southeast Washington, DC. The Housing Resource Center serves as DHCD’s central source of services, programs, and information that help the District’s low and moderate-income families and individuals purchase and rehabilitate homes and prevent mortgage default and foreclosure. In addition to quality one-on-one services, the center offers computer stations for customers to access the District’s affordable housing locator dchousingsearch.org. An onsite housing provider ombudsman provides technical assistance to small housing providers of property located in the District of Columbia, and an information area offers a variety of literature about DHCD programs and those offered by other housing agencies including Fannie Mae and HUD. Furthermore, University Legal Services (ULS), a community-based organization of in-take specialists with an expertise in DHCD’s housing programs, is located at the center and provides rental counseling to assist DC residents with locating affordable and accessible housing. Finally, the center also houses the Housing Regulation Administration (HRA), which administers the District’s rental housing and condominium laws. FUNDS TO BE USED: CDBG, HOME, HPTF, Local, Other
2. Total special needs housing units funded through development. DHCD’s Development Finance Division (DFD) provides funding for the development of rental, homeownership and community facility developments that serve District of Columbia
Table 1.10: Outcomes and Objectives Outcome #1 Availability /Accessibility
Outcome #2 Affordability
Outcome #3 Sustainability
Create Decent Housing with Improved/New Availability (DH-1)
Create Decent Housing with Improved/New Affordability
(DH-2)
Create Decent Housing with Improved/New
Sustainability (DH-3)Enhance Suitable Living Environment Through Improved/New Accessibility (SL-1)
Enhance Suitable Living Environment through
Improved/New Affordability (SL-2)
Enhance Suitable Living Environment Through
Improved/New Sustainability (SL-3)
Create Economic Opportunity Through Improved/New Accessibility (EO-1)
Create Economic Opportunity Through Improved/New Affordability (EO-2)
Create Economic Opportunity Through
Improved/New Sustainability
(EO-3)
District of Columbia Five-Year Consolidated Plan FY2011-2015
Page 26 of 184
neighborhoods. Funding for development to provide availability of decent housing for elderly, disabled and homeless individuals is a priority of this division. FUNDS TO BE USED: CDBG, HOME, Stimulus, Other
3. Total new homeownership units funded through development. DHCD provides assistance for a variety of construction and site development activities that support the availability of decent residential housing or community facilities. The financing is used to leverage private investment in the development of new, affordable units for homeownership. FUNDS TO BE USED: CDBG, HOME, Stimulus, Other
4. Total First Right Purchase Assistance Program units funded-new and rehab.
DHCD’s First Right Purchase Assistance Program provides seed money, earnest money deposits, and acquisition assistance to tenant groups that are threatened with displacement due to the sale of their apartment building. With DHCD’s assistance, the tenant groups are able to purchase the building and preserve the availability of decent affordable housing. More than 1,000 units have been preserved as affordable housing since FY 2002, with the goal of assisting many more with additional funding. FUNDS TO BE USED: CDBG, HOME, Stimulus, Other
5. Total affordable housing units preserved, via loan structuring, technical assistance, etc.
DHCD’s DFD focuses on the preservation of affordable housing by providing specialized organizational and development services to District residents who may need technical assistance. FUNDS TO BE USED: CDBG, HOME, Stimulus, Other
DECENT HOUSING-AFFORDABILITY (DH-2)
1. Total number of inclusionary zoning units built in the District. In June of 2009, the District implemented the District’s Inclusionary Zoning program, which affords private sector development companies the right to additional density for their projects in exchange for making at least 8 percent of the units in the project affordable. As new construction progresses, this will allow the District to preserve the affordability of decent housing around the region. FUNDS TO BE USED: Local, Capital
District of Columbia Five-Year Consolidated Plan
Page 27 of 184
2. Total number of affordable housing units funded through development-new and rehab.
As both the creation and preservation of affordable housing units are important to DHCD, DFD plays a prominent role in helping the agency achieve its annual multifamily housing production goals. FUNDS TO BE USED: CDBG, HOME, Stimulus, Other
3. Percent of District owners spending greater than 30% of income on monthly housing costs.
DHCD’s mission is to create and preserve opportunities for affordable housing and economic development and to revitalize underserved communities in the District of Columbia. Through its mission, it is a goal of DHCD to maintain affordability for home owners across the District. This measurement allows DHCD to see if the effect of their work is making a difference in the region. FUNDS TO BE USED: CDBG, HOME, Stimulus, Other
4. Percent of District renters spending greater than 30% of income on housing costs. Through DHCD’s mission, it is a goal to maintain affordability for renters across the District. This measurement allows DHCD to see if the effect of their work is making a difference in the region. FUNDS TO BE USED: CDBG, HOME, Stimulus, Other
DECENT HOUSING-SUSTAINABILITY (DH-3)
1. Total number of District employee homebuyers funded by the Employee Housing Assistance Program (EHAP).
DHCD’s EAHP provides assistance to employees of the District of Columbia Government who are first-time homebuyers in the District. This program allows DHCD to provide affordable housing to employees in order to live near their work, benefiting the employee and the sustainability of District communities and neighborhoods. FUNDS TO BE USED: CDBG, HOME, Local, Other
2. Total number of qualified District employee homebuyers funded by the Negotiated Employee Assistance Housing Program.
DHCD’s NEAHP provides assistance to qualified employees of the District of Columbia Government who are first-time homebuyers in the District. This program allows DHCD to provide affordable housing to qualified employees in order to live near their work, benefiting the employee and the sustainability of District communities and neighborhoods. FUNDS TO BE USED: Local
District of Columbia Five-Year Consolidated Plan FY2011-2015
Page 28 of 184
SUITABLE LIVING ENVIRONMENT-AVAILABILITY/ACCESSIBILITY (SL-1)
1. Total affordable housing units rehabilitated through development.
DFD provides low-cost gap financing for the rehabilitation of residential properties containing five or more units. The principal objective of this program is to stimulate and leverage private investment and financing in the rehabilitation of multi-family housing that is affordable to lower-income residents. The programs assistance allows the District to restore and improve the safety and livability of properties, making them more available and accessible to residents. FUNDS TO BE USED: CDBG, HOME, Stimulus, Other
2. Total single family rehabilitation units funded.
Residential and Community Services (RCSD) Single Family Residential Rehabilitation Program is designed to help households finance home repairs. Funding may be used for activities that include repairing walls and floors; replacing windows; and repairing plumbing, electrical, and heating systems, allowing accessibility of a safer living environment for residents. FUNDS TO BE USED: CDBG, HPTF
3. Total lead multi-family units funded. DHCD’s Lead Safe Washington program offers assistance for the abatement of lead based paint in multi-family housing. The removal of this poisonous material affords District residents the access to live in a safe and suitable environment. FUNDS TO BE USED: HPTF, Stimulus
4. Total residential rehabilitation special needs units funded.
DHCD’s residential rehabilitation programs improve the conditions of existing units. Funding to make a suitable living environment accessible for elderly, disabled and homeless individuals, is a priority of these programs.
FUNDS TO BE USED: CDBG, HPTF
SUITABLE LIVING ENVIRONMENT-AFFORDABILITY (SL-2)
1. Total number of affordable housing units created or rehabilitated through reclamation of abandoned properties.
DHCD’s Property Acquisition and Disposition Division (PADD) stabilizes neighborhoods by decreasing the number of vacant and abandoned residential properties in the District, and by transforming vacant and/or abandoned residential properties into homeownership opportunities for
District of Columbia Five-Year Consolidated Plan
Page 29 of 184
District of Columbia residents. The reclamation of abandoned properties decreases blighted areas and increases the number of affordable units in the District, for a more suitable living environment. FUNDS TO BE USED: Capital, Other
2. Average number of years of affordability for units created or rehabbed through reclamation of abandoned properties.
PADD’s reclamation of abandoned properties and transformation into affordable units, allows for the units to remain affordable for a specified amount of time. PADD’s goal is to maintain affordability for District residents. FUNDS TO BE USED: Capital, Other
SUITABLE LIVING ENVIRONMENT-SUSTAINABILITY (SL-3)
1. Percent of affordable housing developments competitively evaluated and advancing to underwriting in the respective fiscal year, that are highly sustainable and meet the Green Communities Criteria.
With the passage of The Green Building Act of 2006, Washington, DC joined states and cities across the country in requiring green building design and construction. DHCD requires that all residential projects submitted for financing consideration conduct an integrated design charrette to explore the most cost-effective ways to incorporate green building standards. The integrated design charrette is a mandatory element of the Green Communities Criteria, the new standard which residential projects will be required to meet. DHCD’s ultimate goal, that 100% of the affordable housing developments are highly sustainable, will help make the District a more livable and viable city. FUNDS TO BE USED: CDBG, HOME, Stimulus, Other
2. Total number of Elevated Blood Lead (EBL) level cases in the District.
DHCD’s work towards the removal of lead based paint from housing units in the District, improves community and neighborhood sustainability. This measurement will allow DHCD to see if its efforts of decreasing units with lead based paint are decreasing the number of children that are being poisoned. FUNDS TO BE USED: HPTF, Stimulus
3. Total number of properties acquired.
PADD’s objective to acquire vacant, abandoned and deteriorated properties through negotiated friendly sale, eminent domain, donation or tax sale foreclosure when owners are unwilling or unable to maintain their properties, reduces blighted areas, stabilizes neighborhoods and maintains sustainability for a suitable living environment. FUNDS TO BE USED: Capital, Other
District of Columbia Five-Year Consolidated Plan FY2011-2015
Page 30 of 184
4. Total number of properties recaptured from developers or transferees.
PADD’s objective to recapture vacant and deteriorated properties from developers and transferees, who have not performed under their contracts and declaration of covenants, is done through a re-entry provision in the covenant or through a negotiated sale. This process reduces blighted areas, stabilizes neighborhoods and maintains sustainability for a suitable living environment. FUNDS TO BE USED: Capital, Other
5. Total number of properties for which disposition agreements were executed.
One of PADD’s main functions is to dispose of properties in its inventory by selling the properties to individuals or developers to be rehabilitated into high quality affordable and market-rate single-family and/ or multifamily for-sale housing in District neighborhoods. This process allows properties and neighborhoods to remain a viable and sustainable place to live. FUNDS TO BE USED: Capital, Other
6. Total number of properties investigated that result in rehabilitation by the owner.
PADD encourages property owners to rehabilitate and/or occupy their vacant and abandoned residential property, revitalizing neighborhoods and making them a more viable and sustainable place to live. FUNDS TO BE USED: Capital, Other
ECONOMIC OPPORTUNITY-AVAILABILITY/ACCESSIBILITY (EO-1)
1. Total number of first time homebuyers funded by HPAP.
DHCD’s Home Purchase Assistance Program (HPAP) provides interest-free loans to qualified residents, which enables them to purchase houses, condominiums, or cooperative units. This program allows for the availability of empowerment and self-sufficiency for low-income persons, to assist in the creation of generational wealth, through homeownership. FUNDS TO BE USED: CDBG, HOME, Local, Other
2. Total HPAP special needs units funded. Funding for the economic opportunity of homeownership for elderly, disabled and homeless individuals is a priority of DHCD. FUNDS TO BE USED: CDBG, HOME, Local, Other
ECONOMIC OPPORTUNITY-AFFORDABILITY (EO-2)
Not Applicable for this specific outcome category.
District of Columbia Five-Year Consolidated Plan
Page 31 of 184
ECONOMIC OPPORTUNITY-SUSTAINABILITY (EO-3)
1. Total number of storefront facades improved. DHCD’s neighborhood-based activities include a broad range of programmatic initiatives carried out through neighborhood community development organizations working in their local service areas. The Façade Improvement program provides funding for for storefront improvements in commercial corridors. This program provides for long term economic and social viability of a neighborhood, and specific commercial opportunity and sustainability for small business owners. FUNDS TO BE USED: CDBG, Stimulus
2. Total number of technical assistance provided to small business. DHCD’s neighborhood-based activities provide operating assistance to Community Based Organizations (CBO). Through its CBOs, DHCD provides technical assistance to small businesses, including (but not limited to) business planning, marketing, loan financing, tax preparation, and micro-lending. FUNDS TO BE USED: CDBG, Stimulus
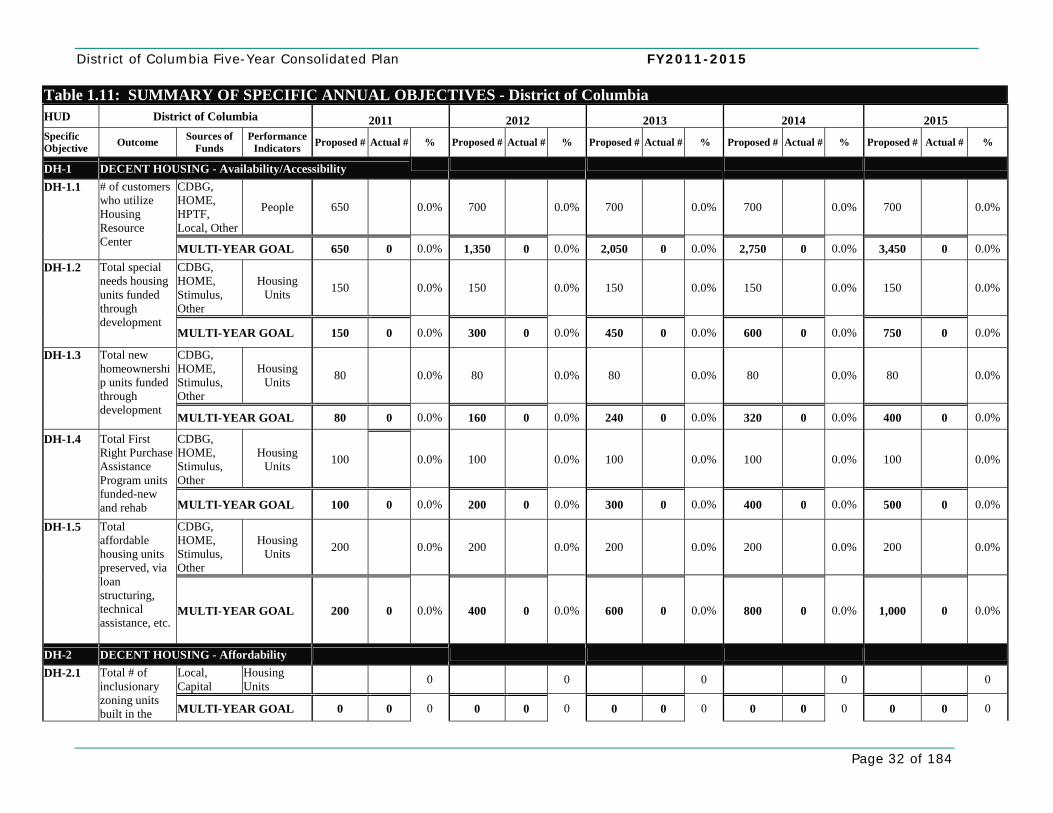
District of Columbia Five-Year Consolidated Plan FY2011-2015
Page 32 of 184
Table 1.11: SUMMARY OF SPECIFIC ANNUAL OBJECTIVES - District of Columbia HUD District of Columbia 2011 2012 2013 2014 2015 Specific Objective Outcome Sources of
Funds Performance
Indicators Proposed # Actual # % Proposed # Actual # % Proposed # Actual # % Proposed # Actual # % Proposed # Actual # %
DH-1 DECENT HOUSING - Availability/Accessibility
CDBG, HOME, HPTF, Local, Other
People 650 0.0% 700 0.0% 700 0.0% 700 0.0% 700 0.0%
DH-1.1 # of customers who utilize Housing Resource Center MULTI-YEAR GOAL 650 0 0.0% 1,350 0 0.0% 2,050 0 0.0% 2,750 0 0.0% 3,450 0 0.0%
CDBG, HOME, Stimulus, Other
Housing Units 150 0.0% 150 0.0% 150 0.0% 150 0.0% 150 0.0%
DH-1.2 Total special needs housing units funded through development
MULTI-YEAR GOAL 150 0 0.0% 300 0 0.0% 450 0 0.0% 600 0 0.0% 750 0 0.0%
CDBG, HOME, Stimulus, Other
Housing Units 80 0.0% 80 0.0% 80 0.0% 80 0.0% 80 0.0%
DH-1.3 Total new homeownership units funded through development
MULTI-YEAR GOAL 80 0 0.0% 160 0 0.0% 240 0 0.0% 320 0 0.0% 400 0 0.0%
CDBG, HOME, Stimulus, Other
Housing Units 100 0.0% 100 0.0% 100 0.0% 100 0.0% 100 0.0%
DH-1.4 Total First Right Purchase Assistance Program units funded-new and rehab MULTI-YEAR GOAL 100 0 0.0% 200 0 0.0% 300 0 0.0% 400 0 0.0% 500 0 0.0%
CDBG, HOME, Stimulus, Other
Housing Units 200 0.0% 200 0.0% 200 0.0% 200 0.0% 200 0.0%
DH-1.5 Total affordable housing units preserved, via loan structuring, technical assistance, etc.
MULTI-YEAR GOAL 200 0 0.0% 400 0 0.0% 600 0 0.0% 800 0 0.0% 1,000 0 0.0%
DH-2 DECENT HOUSING - Affordability
Local, Capital
Housing Units 0 0 0 0 0 DH-2.1 Total # of
inclusionary zoning units built in the MULTI-YEAR GOAL 0 0 0 0 0 0 0 0 0 0 0 0 0 0 0
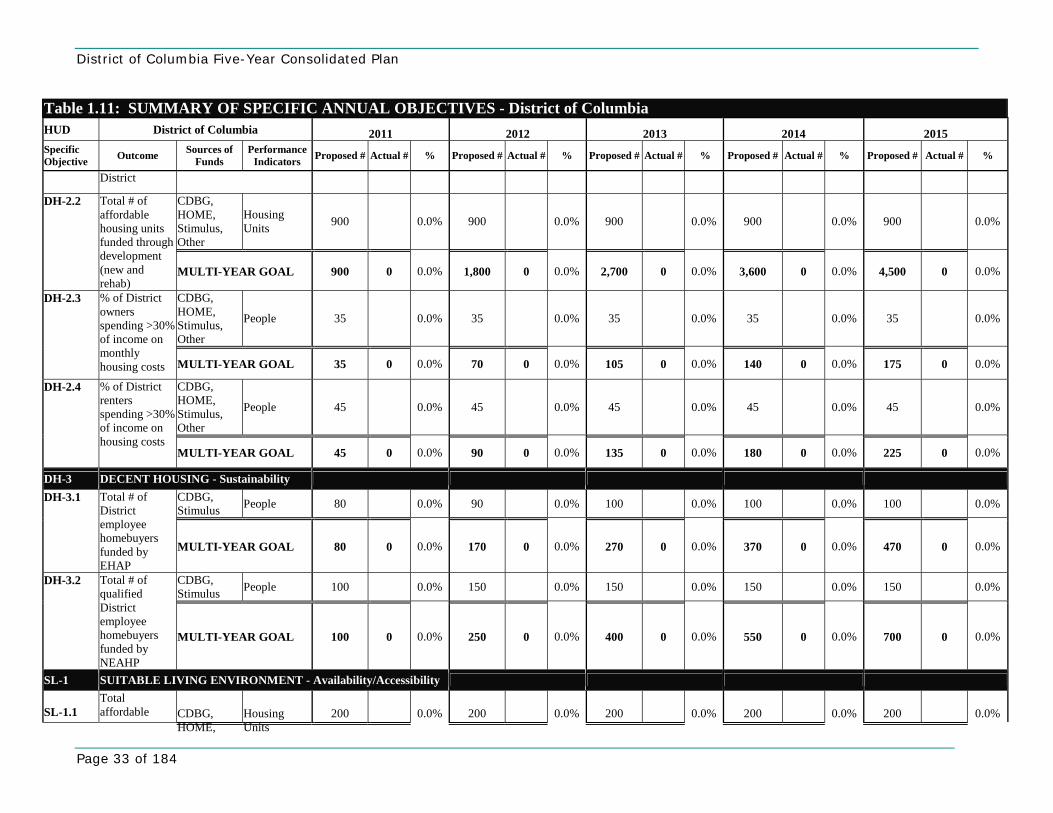
District of Columbia Five-Year Consolidated Plan
Page 33 of 184
Table 1.11: SUMMARY OF SPECIFIC ANNUAL OBJECTIVES - District of Columbia HUD District of Columbia 2011 2012 2013 2014 2015 Specific Objective Outcome Sources of
Funds Performance
Indicators Proposed # Actual # % Proposed # Actual # % Proposed # Actual # % Proposed # Actual # % Proposed # Actual # %
District
CDBG, HOME, Stimulus, Other
Housing Units 900 0.0% 900 0.0% 900 0.0% 900 0.0% 900 0.0%
DH-2.2 Total # of affordable housing units funded through development (new and rehab)
MULTI-YEAR GOAL 900 0 0.0% 1,800 0 0.0% 2,700 0 0.0% 3,600 0 0.0% 4,500 0 0.0%
CDBG, HOME, Stimulus, Other
People 35 0.0% 35 0.0% 35 0.0% 35 0.0% 35 0.0%
DH-2.3 % of District owners spending >30% of income on monthly housing costs MULTI-YEAR GOAL 35 0 0.0% 70 0 0.0% 105 0 0.0% 140 0 0.0% 175 0 0.0%
CDBG, HOME, Stimulus, Other
People 45 0.0% 45 0.0% 45 0.0% 45 0.0% 45 0.0%
DH-2.4 % of District renters spending >30% of income on housing costs
MULTI-YEAR GOAL 45 0 0.0% 90 0 0.0% 135 0 0.0% 180 0 0.0% 225 0 0.0%
DH-3 DECENT HOUSING - Sustainability CDBG, Stimulus People 80 0.0% 90 0.0% 100 0.0% 100 0.0% 100 0.0% DH-3.1 Total # of
District employee homebuyers funded by EHAP
MULTI-YEAR GOAL 80 0 0.0% 170 0 0.0% 270 0 0.0% 370 0 0.0% 470 0 0.0%
CDBG, Stimulus People 100 0.0% 150 0.0% 150 0.0% 150 0.0% 150 0.0% DH-3.2 Total # of
qualified District employee homebuyers funded by NEAHP
MULTI-YEAR GOAL 100 0 0.0% 250 0 0.0% 400 0 0.0% 550 0 0.0% 700 0 0.0%
SL-1 SUITABLE LIVING ENVIRONMENT - Availability/Accessibility
SL-1.1
Total affordable CDBG,
HOME, Housing Units
200 0.0% 200 0.0% 200 0.0% 200 0.0% 200 0.0%
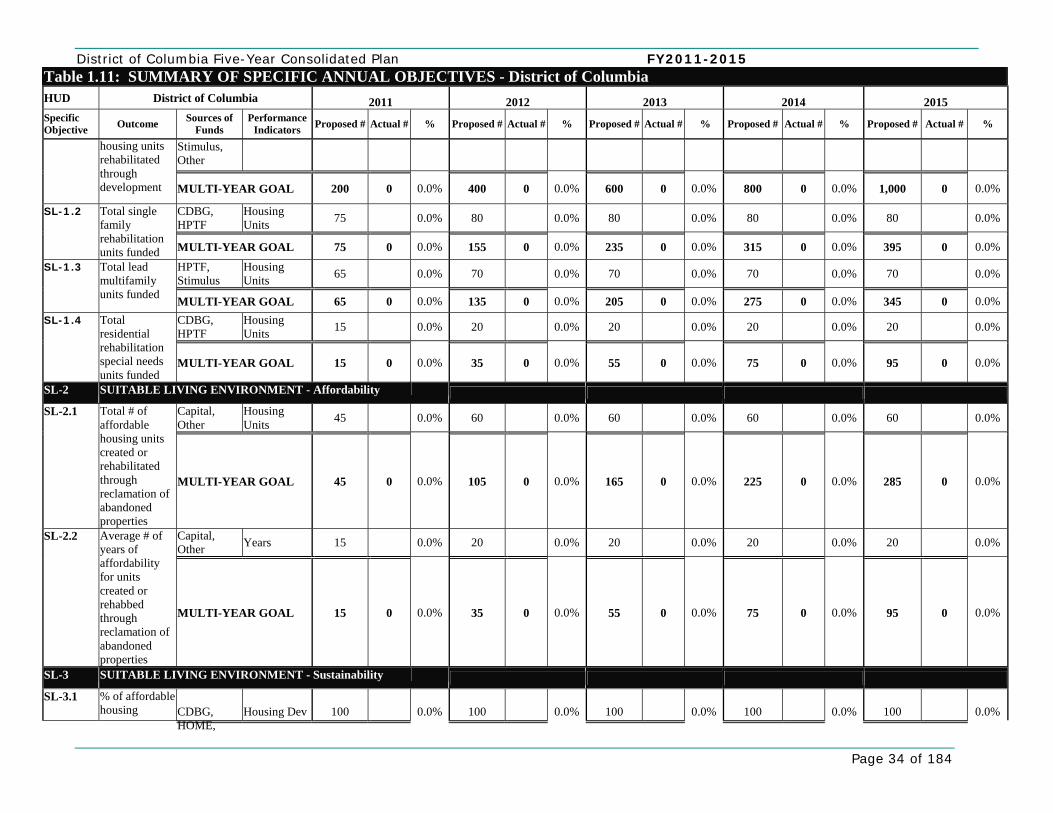
District of Columbia Five-Year Consolidated Plan FY2011-2015
Page 34 of 184
Table 1.11: SUMMARY OF SPECIFIC ANNUAL OBJECTIVES - District of Columbia HUD District of Columbia 2011 2012 2013 2014 2015 Specific Objective Outcome Sources of
Funds Performance
Indicators Proposed # Actual # % Proposed # Actual # % Proposed # Actual # % Proposed # Actual # % Proposed # Actual # %
Stimulus, Other
housing units rehabilitated through development MULTI-YEAR GOAL 200 0 0.0% 400 0 0.0% 600 0 0.0% 800 0 0.0% 1,000 0 0.0%
CDBG, HPTF
Housing Units 75 0.0% 80 0.0% 80 0.0% 80 0.0% 80 0.0% SL-1.2 Total single
family rehabilitation units funded MULTI-YEAR GOAL 75 0 0.0% 155 0 0.0% 235 0 0.0% 315 0 0.0% 395 0 0.0%
HPTF, Stimulus
Housing Units 65 0.0% 70 0.0% 70 0.0% 70 0.0% 70 0.0% SL-1.3 Total lead
multifamily units funded MULTI-YEAR GOAL 65 0 0.0% 135 0 0.0% 205 0 0.0% 275 0 0.0% 345 0 0.0%
CDBG, HPTF
Housing Units 15 0.0% 20 0.0% 20 0.0% 20 0.0% 20 0.0% SL-1.4 Total
residential rehabilitation special needs units funded
MULTI-YEAR GOAL 15 0 0.0% 35 0 0.0% 55 0 0.0% 75 0 0.0% 95 0 0.0%
SL-2 SUITABLE LIVING ENVIRONMENT - Affordability
Capital, Other
Housing Units 45 0.0% 60 0.0% 60 0.0% 60 0.0% 60 0.0% SL-2.1 Total # of
affordable housing units created or rehabilitated through reclamation of abandoned properties
MULTI-YEAR GOAL 45 0 0.0% 105 0 0.0% 165 0 0.0% 225 0 0.0% 285 0 0.0%
Capital, Other Years 15 0.0% 20 0.0% 20 0.0% 20 0.0% 20 0.0% SL-2.2 Average # of
years of affordability for units created or rehabbed through reclamation of abandoned properties
MULTI-YEAR GOAL 15 0 0.0% 35 0 0.0% 55 0 0.0% 75 0 0.0% 95 0 0.0%
SL-3 SUITABLE LIVING ENVIRONMENT - Sustainability SL-3.1 % of affordable
housing CDBG, HOME,
Housing Dev 100 0.0% 100 0.0% 100 0.0% 100 0.0% 100 0.0%
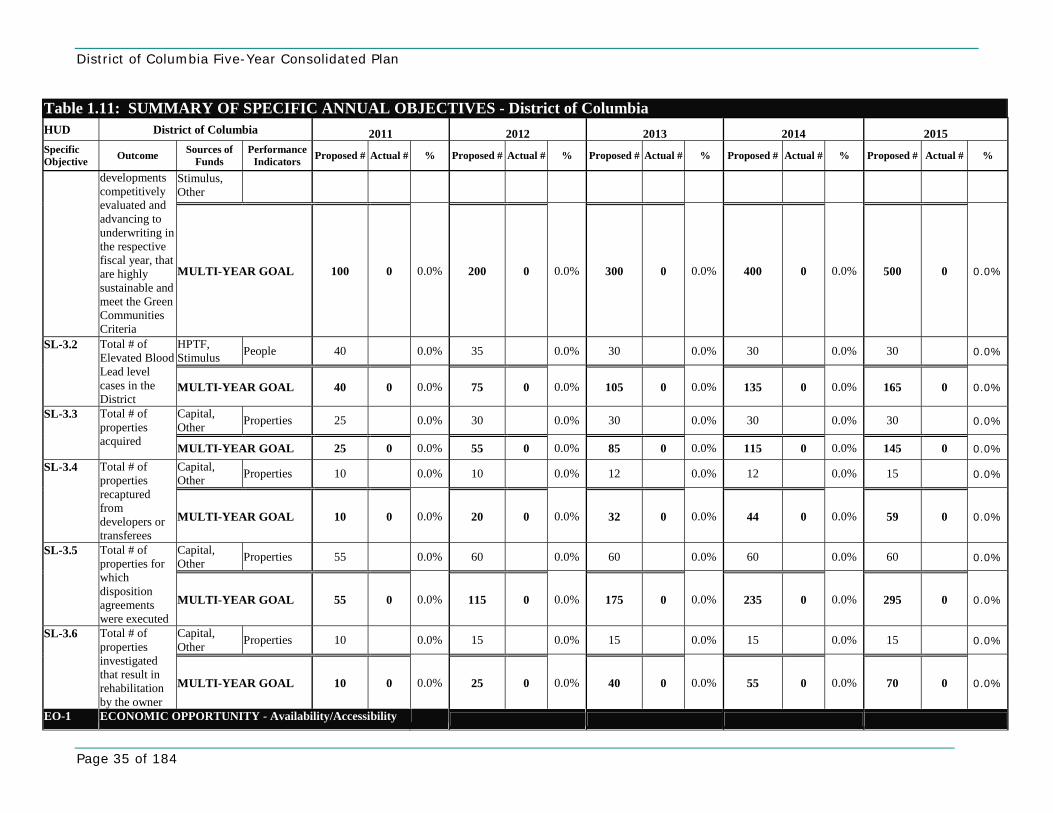
District of Columbia Five-Year Consolidated Plan
Page 35 of 184
Table 1.11: SUMMARY OF SPECIFIC ANNUAL OBJECTIVES - District of Columbia HUD District of Columbia 2011 2012 2013 2014 2015 Specific Objective Outcome Sources of
Funds Performance
Indicators Proposed # Actual # % Proposed # Actual # % Proposed # Actual # % Proposed # Actual # % Proposed # Actual # %
Stimulus, Other
developments competitively evaluated and advancing to underwriting in the respective fiscal year, that are highly sustainable and meet the Green Communities Criteria
MULTI-YEAR GOAL 100 0 0.0% 200 0 0.0% 300 0 0.0% 400 0 0.0% 500 0 0.0%
HPTF, Stimulus People 40 0.0% 35 0.0% 30 0.0% 30 0.0% 30 0.0%
SL-3.2 Total # of Elevated Blood Lead level cases in the District
MULTI-YEAR GOAL 40 0 0.0% 75 0 0.0% 105 0 0.0% 135 0 0.0% 165 0 0.0%
Capital, Other Properties 25 0.0% 30 0.0% 30 0.0% 30 0.0% 30 0.0%
SL-3.3 Total # of properties acquired MULTI-YEAR GOAL 25 0 0.0% 55 0 0.0% 85 0 0.0% 115 0 0.0% 145 0 0.0%
Capital, Other Properties 10 0.0% 10 0.0% 12 0.0% 12 0.0% 15 0.0%
SL-3.4 Total # of properties recaptured from developers or transferees
MULTI-YEAR GOAL 10 0 0.0% 20 0 0.0% 32 0 0.0% 44 0 0.0% 59 0 0.0%
Capital, Other Properties 55 0.0% 60 0.0% 60 0.0% 60 0.0% 60 0.0%
SL-3.5 Total # of properties for which disposition agreements were executed
MULTI-YEAR GOAL 55 0 0.0% 115 0 0.0% 175 0 0.0% 235 0 0.0% 295 0 0.0%
Capital, Other Properties 10 0.0% 15 0.0% 15 0.0% 15 0.0% 15 0.0%
SL-3.6 Total # of properties investigated that result in rehabilitation by the owner
MULTI-YEAR GOAL 10 0 0.0% 25 0 0.0% 40 0 0.0% 55 0 0.0% 70 0 0.0%
EO-1 ECONOMIC OPPORTUNITY - Availability/Accessibility
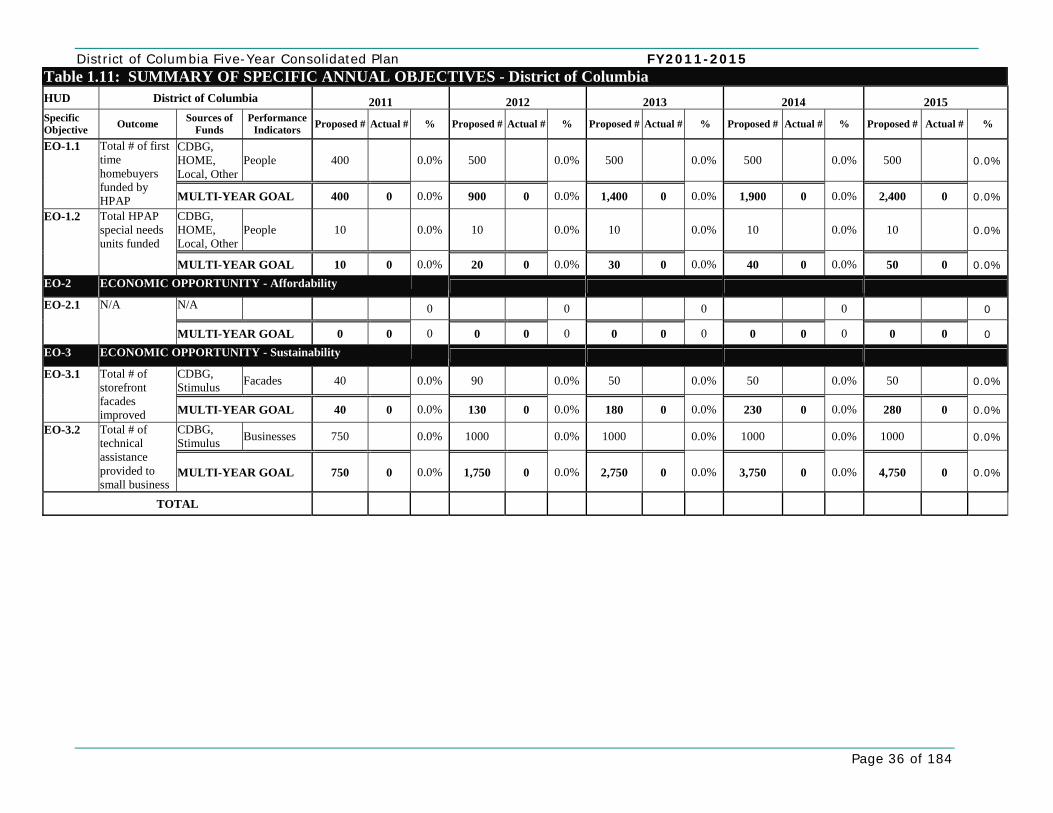
District of Columbia Five-Year Consolidated Plan FY2011-2015
Page 36 of 184
Table 1.11: SUMMARY OF SPECIFIC ANNUAL OBJECTIVES - District of Columbia HUD District of Columbia 2011 2012 2013 2014 2015 Specific Objective Outcome Sources of
Funds Performance
Indicators Proposed # Actual # % Proposed # Actual # % Proposed # Actual # % Proposed # Actual # % Proposed # Actual # %
CDBG, HOME, Local, Other
People 400 0.0% 500 0.0% 500 0.0% 500 0.0% 500 0.0% EO-1.1 Total # of first
time homebuyers funded by HPAP MULTI-YEAR GOAL 400 0 0.0% 900 0 0.0% 1,400 0 0.0% 1,900 0 0.0% 2,400 0 0.0%
CDBG, HOME, Local, Other
People 10 0.0% 10 0.0% 10 0.0% 10 0.0% 10 0.0% EO-1.2 Total HPAP
special needs units funded
MULTI-YEAR GOAL 10 0 0.0% 20 0 0.0% 30 0 0.0% 40 0 0.0% 50 0 0.0%
EO-2 ECONOMIC OPPORTUNITY - Affordability N/A 0 0 0 0 0 EO-2.1 N/A
MULTI-YEAR GOAL 0 0 0 0 0 0 0 0 0 0 0 0 0 0 0
EO-3 ECONOMIC OPPORTUNITY - Sustainability CDBG, Stimulus Facades 40 0.0% 90 0.0% 50 0.0% 50 0.0% 50 0.0%
EO-3.1 Total # of storefront facades improved MULTI-YEAR GOAL 40 0 0.0% 130 0 0.0% 180 0 0.0% 230 0 0.0% 280 0 0.0%
CDBG, Stimulus Businesses 750 0.0% 1000 0.0% 1000 0.0% 1000 0.0% 1000 0.0%
EO-3.2 Total # of technical assistance provided to small business
MULTI-YEAR GOAL 750 0 0.0% 1,750 0 0.0% 2,750 0 0.0% 3,750 0 0.0% 4,750 0 0.0%
TOTAL

District of Columbia Five-Year Consolidated Plan
Page 37 of 184
General Questions [Demographic Profile section does not correspond to specific question; added for context] 1. Describe the geographic areas of the jurisdiction (including areas of low
income families and/or racial/minority concentration) in which assistance will be directed.
2. Describe the basis for allocating investments geographically within the
jurisdiction (or within the EMSA for HOPWA) (91.215(a)(1)) and the basis for assigning the priority (including the relative priority, where required) given to each category of priority needs (91.215(a)(2)). Where appropriate, the jurisdiction should estimate the percentage of funds the jurisdiction plans to dedicate to target areas.
3. Identify any obstacles to meeting underserved needs (91.215(a)(3)). 3-5 Year Strategic Plan General Questions response:

District of Columbia Five-Year Consolidated Plan FY2011-2015
Page 38 of 184
1 Demographic Profile Like many cities on the East Coast, Washington, DC, experienced a dramatic decline in population over the latter half of the 20th century. Now, in the beginning of the 21st century, those population losses are beginning to reverse and the District is growing again, there has been a 4.8% increase in population between the 2000 Census and July 1, 2009 (U.S. Census Bureau). As new residents discover the attraction of urban living, and as many long term residents see their neighborhoods expand and revitalize, the District has started shedding decades of decline and disinvestment.
Race The 2009 population estimate by the U.S. Census Bureau stated that the District has a total of 599,657 residents, with the following population distribution: 54.4% Black or African-American; 36.1% White; 8.5% Hispanic or Latino; 3.2% Asian; 0.3% American Indian and Alaska Native; 0.0% native Hawaiian and Pacific Islander; 4.2% of some other race; and 1.7% individuals from two or more races.1 AFRICAN-AMERICANS African-Americans are the largest racial group in the District and represent a majority in six of the District’s eight Wards. In 2008, they comprised 54.4% of the total population, down from 61.1% reported in 2000.
1 2006‐2008 American Community Survey Washington, D.C. U.S. Census Bureau. Web. 03 Feb. 2010. <http://factfinder.census.gov/>.
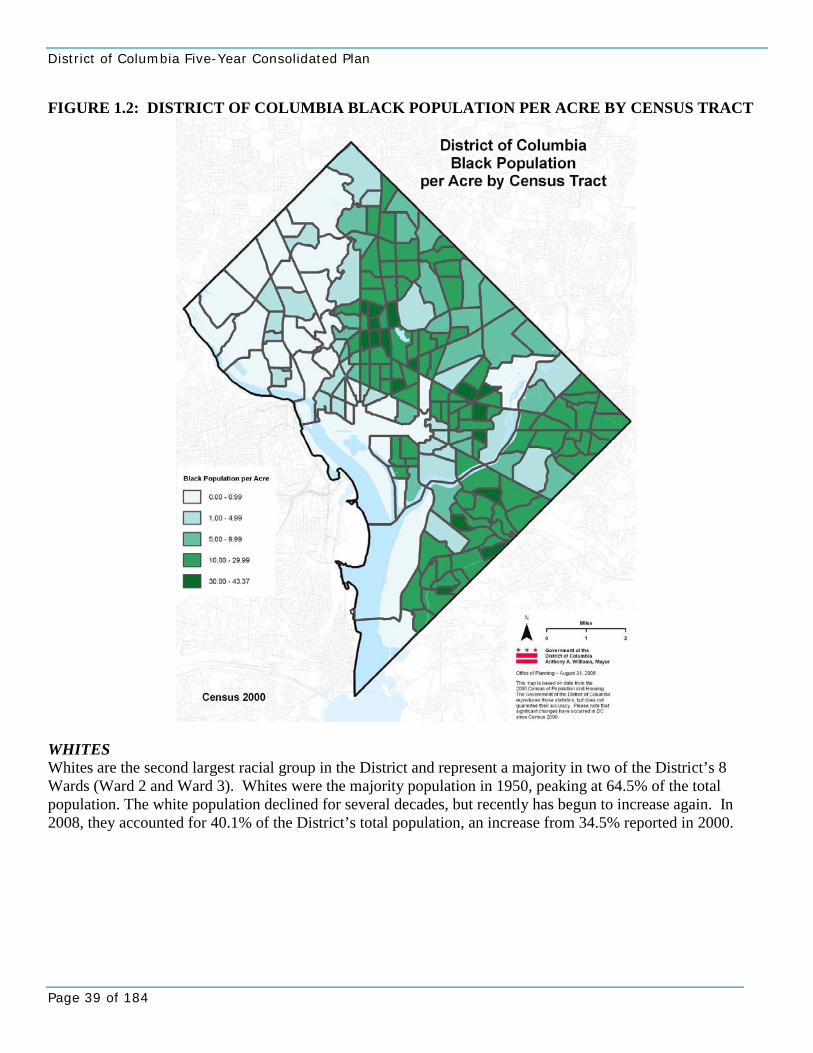
District of Columbia Five-Year Consolidated Plan
Page 39 of 184
FIGURE 1.2: DISTRICT OF COLUMBIA BLACK POPULATION PER ACRE BY CENSUS TRACT
WHITES Whites are the second largest racial group in the District and represent a majority in two of the District’s 8 Wards (Ward 2 and Ward 3). Whites were the majority population in 1950, peaking at 64.5% of the total population. The white population declined for several decades, but recently has begun to increase again. In 2008, they accounted for 40.1% of the District’s total population, an increase from 34.5% reported in 2000.
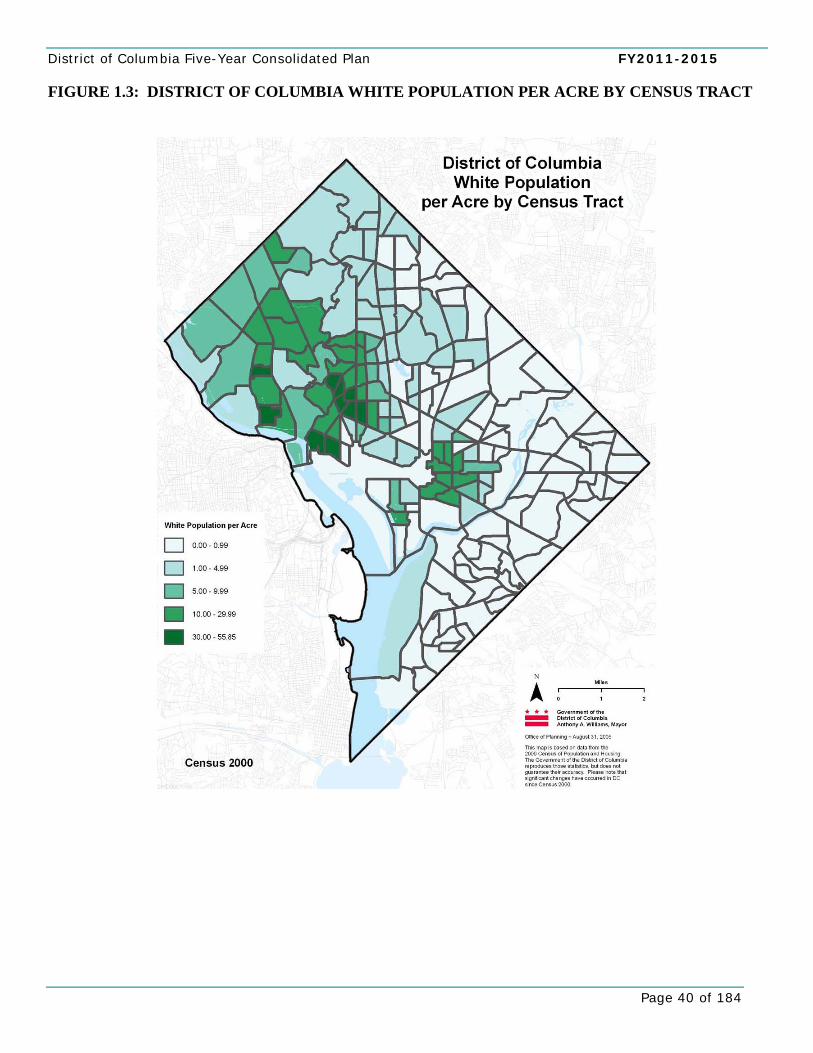
District of Columbia Five-Year Consolidated Plan FY2011-2015
Page 40 of 184
FIGURE 1.3: DISTRICT OF COLUMBIA WHITE POPULATION PER ACRE BY CENSUS TRACT
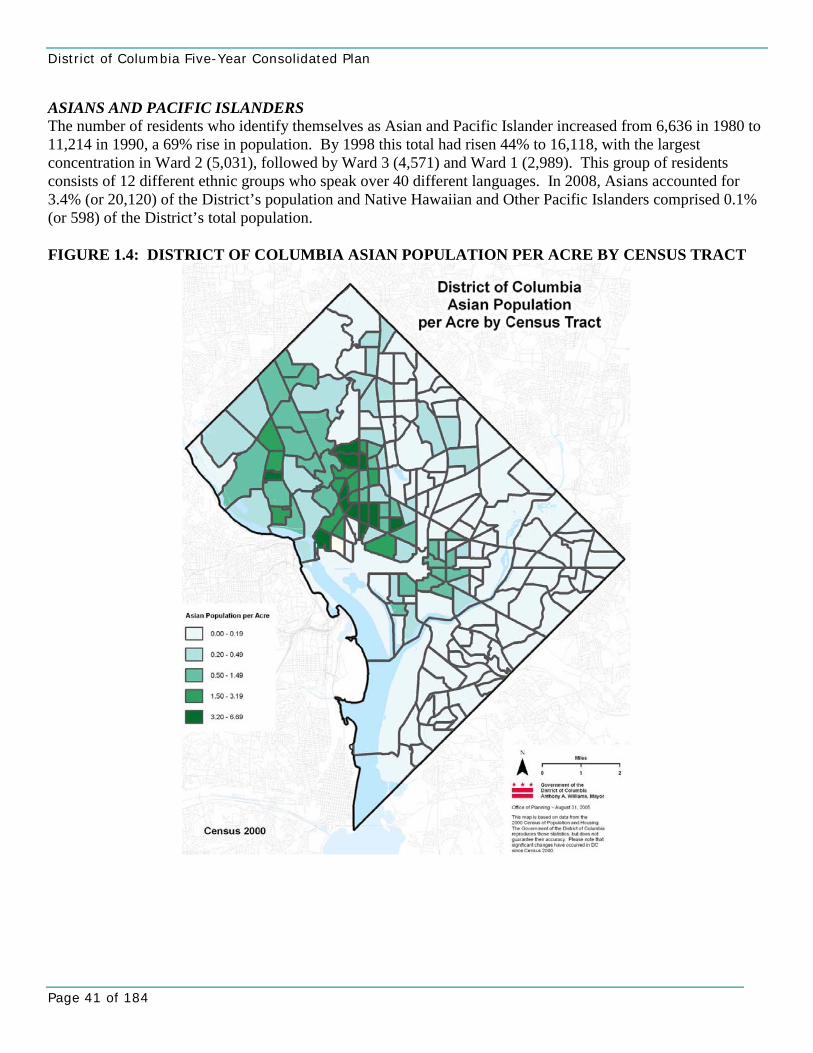
District of Columbia Five-Year Consolidated Plan
Page 41 of 184
ASIANS AND PACIFIC ISLANDERS The number of residents who identify themselves as Asian and Pacific Islander increased from 6,636 in 1980 to 11,214 in 1990, a 69% rise in population. By 1998 this total had risen 44% to 16,118, with the largest concentration in Ward 2 (5,031), followed by Ward 3 (4,571) and Ward 1 (2,989). This group of residents consists of 12 different ethnic groups who speak over 40 different languages. In 2008, Asians accounted for 3.4% (or 20,120) of the District’s population and Native Hawaiian and Other Pacific Islanders comprised 0.1% (or 598) of the District’s total population. FIGURE 1.4: DISTRICT OF COLUMBIA ASIAN POPULATION PER ACRE BY CENSUS TRACT
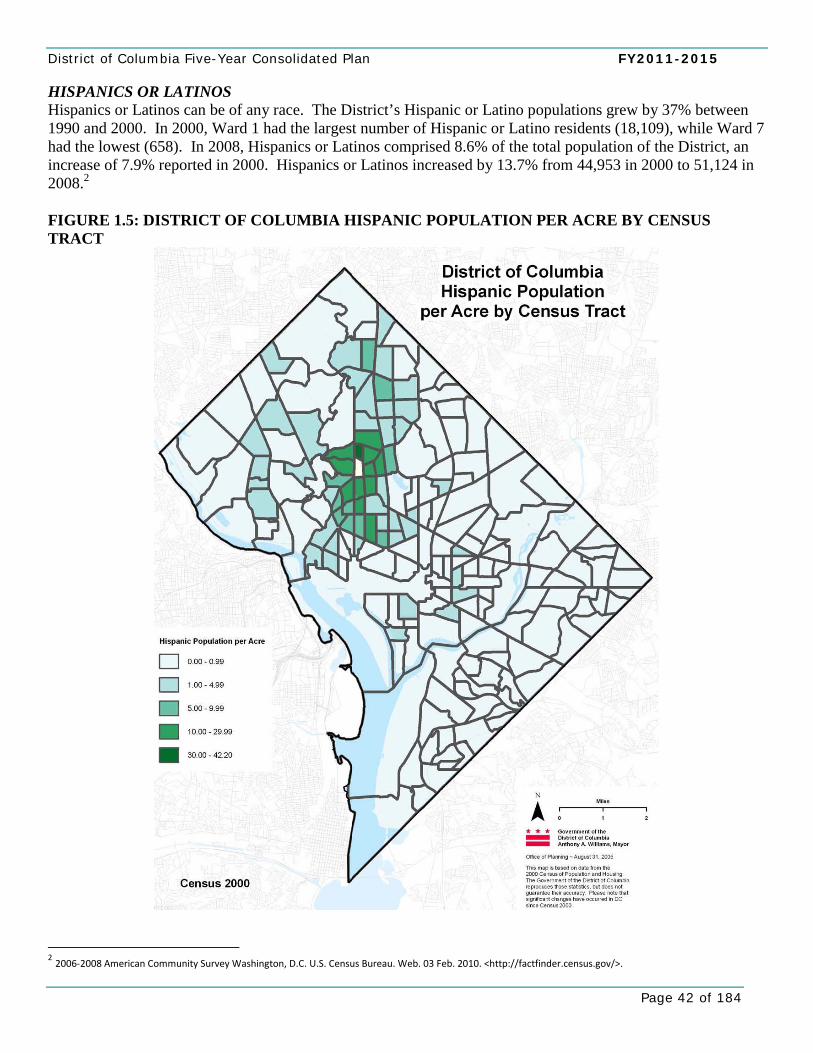
District of Columbia Five-Year Consolidated Plan FY2011-2015
Page 42 of 184
HISPANICS OR LATINOS Hispanics or Latinos can be of any race. The District’s Hispanic or Latino populations grew by 37% between 1990 and 2000. In 2000, Ward 1 had the largest number of Hispanic or Latino residents (18,109), while Ward 7 had the lowest (658). In 2008, Hispanics or Latinos comprised 8.6% of the total population of the District, an increase of 7.9% reported in 2000. Hispanics or Latinos increased by 13.7% from 44,953 in 2000 to 51,124 in 2008.2 FIGURE 1.5: DISTRICT OF COLUMBIA HISPANIC POPULATION PER ACRE BY CENSUS TRACT
2 2006‐2008 American Community Survey Washington, D.C. U.S. Census Bureau. Web. 03 Feb. 2010. <http://factfinder.census.gov/>.
District of Columbia Five-Year Consolidated Plan
Page 43 of 184
Foreign-Born According to Census data, almost 13 percent of the District’s population is foreign-born, slightly above the national average of 12 percent. The biggest difference between the foreign-born population statistics for the District and the U.S. is the origins of the residents. The national statistic for the foreign-born population from Latin American countries is 53 percent versus 48 percent in the District. Twenty-seven percent of the U.S.’s foreign-born population is from Asia versus the 18 percent in the District--almost a 10 percent difference. The national and District statistics for European-born residents are 13 percent and 17 percent, respectively. The largest variation is African-born residents: less than four percent of U.S. residents are from African countries versus 14 percent in the District.3 There were 15,977 African-born residents in the District and 114,000 in the Washington metropolitan area. However, 60 percent of these African immigrants lived in Prince George’s and Montgomery counties in Maryland.
Minority Groups CHILDREN In 2008, there were 102,808 children under 18 years of age in the District of Columbia. In 2008, own children in native families comprised 78.1% and the remaining 21.9% were children in immigrant families. The number of own children in immigrant families in the District increased from 15.8% in 2006 to 21.9% in 2008, while the number of own children in native families declined from 84.2% in 2006 to 78.1% in 2008.4 WOMEN In 2008, 52.7% (or 311,953) of the total 591,833 residents of the District were women. In 2008, about 62.1% of the District’s women were in civilian labor forces.5 ELDERLY In 2008, about 12.0% (70,648) of the District’s population were people 65 years old and over. 6 Households HOUSEHOLD FORMATION The number of households in the District totals 250,423 with 43% (or 107,697) of these households comprised of families. The majority of District households—57% (or 142,726)—are composed of non-family households. Of these non-family households, 47.4% percent (118,812 households) were composed of one person living alone7. Household patterns in the District have shifted due to fewer families with children as well as economic factors that cause more people to share housing. In the District, households with children under 18 decreased from 24.6% to 21.7% between 2000 and 2007.8
3 2006‐2008 American Community Survey Washington, D.C. U.S. Census Bureau. Web. 03 Feb. 2010. <http://factfinder.census.gov 4 2006‐2008 American Community Survey Washington, D.C. U.S. Census Bureau. Web. 03 Feb. 2010. <http://factfinder.census.gov/>. 5 2006‐2008 American Community Survey Washington, D.C. U.S. Census Bureau. Web. 03 Feb. 2010. <http://factfinder.census.gov/>. 6 2006‐2008 American Community Survey Washington, D.C. U.S. Census Bureau. Web. 03 Feb. 2010. <http://factfinder.census.gov/>. 7 2006‐2008 American Community Survey Washington, D.C. U.S. Census Bureau. Web. 03 Feb. 2010. <http://factfinder.census.gov/>. 8 2006‐2008 American Community Survey Washington, D.C. U.S. Census Bureau. Web. 03 Feb. 2010. <http://factfinder.census.gov/>.
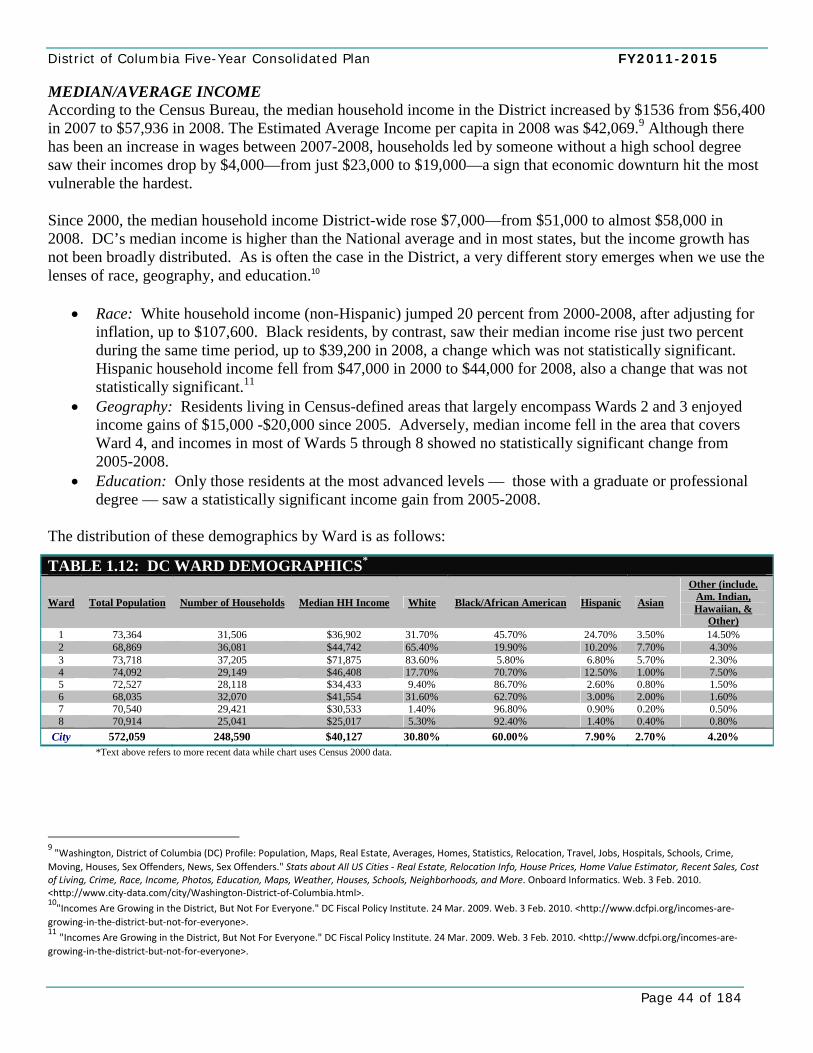
District of Columbia Five-Year Consolidated Plan FY2011-2015
Page 44 of 184
MEDIAN/AVERAGE INCOME According to the Census Bureau, the median household income in the District increased by $1536 from $56,400 in 2007 to $57,936 in 2008. The Estimated Average Income per capita in 2008 was $42,069.9 Although there has been an increase in wages between 2007-2008, households led by someone without a high school degree saw their incomes drop by $4,000—from just $23,000 to $19,000—a sign that economic downturn hit the most vulnerable the hardest.
Since 2000, the median household income District-wide rose $7,000—from $51,000 to almost $58,000 in 2008. DC’s median income is higher than the National average and in most states, but the income growth has not been broadly distributed. As is often the case in the District, a very different story emerges when we use the lenses of race, geography, and education.10
• Race: White household income (non-Hispanic) jumped 20 percent from 2000-2008, after adjusting for inflation, up to $107,600. Black residents, by contrast, saw their median income rise just two percent during the same time period, up to $39,200 in 2008, a change which was not statistically significant. Hispanic household income fell from $47,000 in 2000 to $44,000 for 2008, also a change that was not statistically significant.11
• Geography: Residents living in Census-defined areas that largely encompass Wards 2 and 3 enjoyed income gains of $15,000 -$20,000 since 2005. Adversely, median income fell in the area that covers Ward 4, and incomes in most of Wards 5 through 8 showed no statistically significant change from 2005-2008.
• Education: Only those residents at the most advanced levels — those with a graduate or professional degree — saw a statistically significant income gain from 2005-2008.
The distribution of these demographics by Ward is as follows:
TABLE 1.12: DC WARD DEMOGRAPHICS*
Ward Total Population Number of Households Median HH Income White Black/African American Hispanic Asian
Other (include. Am. Indian, Hawaiian, &
Other) 1 73,364 31,506 $36,902 31.70% 45.70% 24.70% 3.50% 14.50% 2 68,869 36,081 $44,742 65.40% 19.90% 10.20% 7.70% 4.30% 3 73,718 37,205 $71,875 83.60% 5.80% 6.80% 5.70% 2.30% 4 74,092 29,149 $46,408 17.70% 70.70% 12.50% 1.00% 7.50% 5 72,527 28,118 $34,433 9.40% 86.70% 2.60% 0.80% 1.50% 6 68,035 32,070 $41,554 31.60% 62.70% 3.00% 2.00% 1.60% 7 70,540 29,421 $30,533 1.40% 96.80% 0.90% 0.20% 0.50% 8 70,914 25,041 $25,017 5.30% 92.40% 1.40% 0.40% 0.80%
City 572,059 248,590 $40,127 30.80% 60.00% 7.90% 2.70% 4.20% *Text above refers to more recent data while chart uses Census 2000 data.
9 "Washington, District of Columbia (DC) Profile: Population, Maps, Real Estate, Averages, Homes, Statistics, Relocation, Travel, Jobs, Hospitals, Schools, Crime, Moving, Houses, Sex Offenders, News, Sex Offenders." Stats about All US Cities ‐ Real Estate, Relocation Info, House Prices, Home Value Estimator, Recent Sales, Cost of Living, Crime, Race, Income, Photos, Education, Maps, Weather, Houses, Schools, Neighborhoods, and More. Onboard Informatics. Web. 3 Feb. 2010. <http://www.city‐data.com/city/Washington‐District‐of‐Columbia.html>. 10"Incomes Are Growing in the District, But Not For Everyone." DC Fiscal Policy Institute. 24 Mar. 2009. Web. 3 Feb. 2010. <http://www.dcfpi.org/incomes‐are‐
growing‐in‐the‐district‐but‐not‐for‐everyone>. 11 "Incomes Are Growing in the District, But Not For Everyone." DC Fiscal Policy Institute. 24 Mar. 2009. Web. 3 Feb. 2010. <http://www.dcfpi.org/incomes‐are‐growing‐in‐the‐district‐but‐not‐for‐everyone>.

District of Columbia Five-Year Consolidated Plan
Page 45 of 184
UNEMPLOYMENT In 2009, nearly 40,000 DC residents were unemployed, up from 18,000 in 2008, more than doubling the number of people unemployed. Our unemployment rate—now at 12.1% in December 2009, is the highest on record. The national unemployment rate in December was 10 percent, close to its highest level since the Great Depression and dwarfing the rate in much of the Washington region. The District, however, was an exception. The District's 12.1 percent unemployment rate was one of the highest in the country, trailing just a handful of states including Michigan, California and Nevada. The high illiteracy rate and lack of job training among workers are some of the obstacles the District must overcome.13 While Federal employment continues to grow and absorb losses in private high skilled jobs, households holding service sector or other low skilled jobs have been highly impacted by the recession. This has translated to job losses and reduction in tips, overtime, and other payments that households have depended on during the economic boom times to fill gaps. In addition, the recession has also caused a reduction in force of the City government that has impacted working class households. The District’s unemployment rate ranged from a low of 2.5 percent in March in Ward 3 to a high of 23.8 percent in Ward 8. These numbers have changed from a low in 2008 of 1.6 percent in Ward 3 and a high of 16.4 percent in Ward 814. Comparatively, these District communities are faring worse than their Maryland and Virginia neighbors. In March of 2009, the Washington MSA unemployment rate was 6.5 percent, with Northern Virginia15, Prince George’s County, and Montgomery County experiencing rates of 5.1, 6.7 and 4.9 percent, respectively16. POVERTY According to Census Bureau data, one in five District residents lived in poverty, and almost one-fourth of District residents were below 125% of the Federal Poverty Level threshold during the time period from 2005 to 200717. In 2008, 17.2% of District residents lived in poverty; 6.7% for White Non-Hispanic residents, 23.6% for Black residents and 17.6% for Hispanic or Latino residents.18 Poverty levels in the District can be broken down by demographics such as age, race/ethnicity, and education.
• Age: Children under the age of 18 are much more likely to live below the poverty level than adults — 29% vs. 16% respectively.
• Race: Just over 8% of White District residents lived below poverty, compared with 25% of Black or African-American District residents and 16% of Hispanic or Latino District residents.
12 "DOES: Labor Market Information." Department of Employment Services. The District of Columbia Government. Web. <http://does.dc.gov/does/cwp/view.asp?a=1233&Q=538345&doesNav>. 13 "Help Is on the Way for Unemployed DC Workers." DC Fiscal Policy Institute. 3 Dec. 2009. Web. 3 Feb. 2010. <http://www.dcfpi.org/help‐is‐on‐the‐way‐for‐unemployed‐dc‐workers>. 14 "DOES: Latest Monthly Statistics." Department of Employment Services. District of Columbia Government. Web. 26 May 2009. <http://does.dc.gov/does/cwp/view,a,1233,q,538023.asp>. 15 United States. Virginia Employment Commission. Economic Information Services Division. Comp. Ann D. Lang. Common Wealth of Virginia, 16 Apr. 2010. Web. 16 Apr. 2010. <http://www.vec.virginia.gov/pdf/newpres1.pdf>. 16 "Employment, Unemployment and Unemployment Rate by Place of Residence(LAUS) ‐ Division of Workforce Development and Adult Learning." Maryland Department of Labor, Licensing and Regulation. State of Maryland, 26 Apr. 2010. Web. 26 Apr. 2010. <http://www.dllr.state.md.us/lmi/laus/>. 17 DC Poverty Demographics. Rep. DC Fiscal Policy Institute, 28 Mar. 2009. Web. 2 Feb. 2010. <http://dcfpi.org/wp‐content/uploads/2009/03/poverty1.pdf>. 18 DC Poverty Demographics. Rep. DC Fiscal Policy Institute, 28 Mar. 2009. Web. 2 Feb. 2010. <http://dcfpi.org/wp‐content/uploads/2009/03/poverty1.pdf>.
TABLE 1.13: UNEMPLOYMENT BY WARD12
March 2008-2009 Ward 2008 2009
1 5.3% 8.2% 2 3% 4.7% 3 1.6% 2.5% 4 5% 7.7% 5 8.4% 12.7% 6 6.1% 9.3% 7 10.8% 16.1% 8 16.4% 23.8%

District of Columbia Five-Year Consolidated Plan FY2011-2015
Page 46 of 184
• Education: DC residents with less than a high school diploma or equivalent are more likely to be poor than their counterparts with high school or college degrees. Just over 5% of residents with a bachelor’s degree or higher lived below the poverty level, compared to 31.5% who did not have a high school diploma or equivalent.19
2 Geographic Priority Areas The District of Columbia, situated on the northern banks of the Potomac River with a total area of 68.5 square miles, is divided into subdivisions established by the District government for such purposes as taxation, elections, zoning and historic preservation. Other boundaries are established for public service delivery to staff neighborhood service centers, police precincts and fire stations. For the purpose of this 5-year Consolidated Plan, the geographical division of the city consists of four Quadrants and more specifically eight Wards.20 Quadrants The District is divided into four quadrants: Northwest (NW), Northeast (NE), southeast (SE), and Southwest (SW). The dividing lines of those quadrants, North Capitol Street, East Capitol Street, South Capitol Street and the National Mall, radiate out from the Capitol, the geographic hub of Washington.
Wards The Wards are political subdivisions of the District, created for the purpose of voting and representation. Currently, there are eight Wards, with populations in each ranging from about 68,000 to 78,000 residents. DCHD funding priorities are based in each of the eight Wards, for the purpose of developing complete neighborhoods and a more sustainable city. In developing the future geographic funding priorities it is important to look at the overall development that has happened throughout the last planning period. WARD 1 While Ward 1 has been densely populated and “built out” for many decades, the last several years have seen pockets of significant development activity. This has primarily included new multi-family housing and commercial properties (including 3,585 units of housing), but also new schools, areas facilities and other community oriented spaces. Ward 1 has seven historic districts within its boundaries, an impressive amount for a relatively small area. Consequently, much of the Ward will be preserved into the future, with new development focusing on smaller, infill parcels that respect existing neighborhood character. WARD 2 Developments of all kinds, commercial and residential, have boomed in Ward 2 in recent years, specifically before the declining real estate market. In fact, by mid 2008 there was nearly 19.7 million square feet of development planned or under construction in Ward 2, roughly 23 % of the total for the entire city. Much of this activity has occurred and is occurring Downtown and in neighborhoods such as Logan Circle, Foggy Bottom/West End and Shaw.
19 DC Poverty Demographics. Rep. DC Fiscal Policy Institute, 28 Mar. 2009. Web. 2 Feb. 2010. <http://dcfpi.org/wp‐content/uploads/2009/03/poverty1.pdf>. 20 Office of Planning. Web. <http://planning.dc.gov/planning/site/default.asp>.
District of Columbia Five-Year Consolidated Plan
Page 47 of 184
WARD 3 Development in Ward 3 has been low to moderate compared to other Wards. As of March 2010, Ward 3 had one of the least amounts of recently completed, under construction, planned or proposed square feet of development. Of this, over 60% has already been completed since 2001, suggesting even less development ahead in coming years compared to other Wards. Further supporting this is the fact that Ward 3 has fewer new residential units planned or proposed than any other Ward, 642 units. Most new development is expected to be small-scale infill or related to educational and medical facilities. Like Ward 1, Ward 3 also has a large number of historic districts within its boundaries. WARD 4 Development in Ward 4 has been low compared to other Wards. As of March 2010, Ward 4 had the least amount of recently completed, under construction, planned or proposed square feet of development in the city. However, unlike Ward 3 that has very little new construction planned or proposed, over 2/3 of Ward 4’s development is planned or proposed (as opposed to recently built or under construction). Most new development under construction or planned is expected to be concentrated along the Georgia Avenue corridor, in Fort Totten and near the Takoma Metro Station. WARD 5 Development in Ward 5 has been lower than that of other Wards. As of March 2010, Ward 5 has the least amount of completed development in recent years other than Wards 3, 4 and 7. However, Ward 5 has the highest amount of proposed development other than Wards 2, 6 and 8. In addition, Ward 5 has the third highest (behind Wards 6 and 8) residential development in the last two years, 8,575 units. This suggests that interest in Ward 5 is on the rise for the development community, and the next five years may see considerable growth. In the more immediate future, development will be moderate in scale, though some major projects will likely get underway. WARD 6 Development of all kinds, commercial and residential, has boomed in Ward 6 in recent years, including significantly more residential units than any other Ward, 24,706. While the center of the Ward consists of the relatively stable Capitol Hill neighborhood (much of which is a designated Historic District and therefore protected from significant redevelopment), the edges represent some of the highest growth areas of the city. WARD 7 Development in Ward 7 has been lower than that of other Wards. As of March 2010, in recent years Ward 7 had the least amount of completed development other than Ward 4, as well as the lowest amount of planned development. This suggests more development is needed in Ward 7. This development is likely to be spread around various neighborhoods in the Ward, but concentrated on major corridors such as Benning Road, Minnesota Avenue and Pennsylvania Avenue. WARD 8 Ward 8 has experienced a high level of development activity recently. Between 2001 and 2010, developers completed nearly as many projects in Ward 8 as in Wards 2 and 6, which are in the heart of downtown DC’s construction boom. Further, Ward 8 has the third highest number of proposed developments in the last two years, exceeded only by Ward 2 and 6. The face of Ward 8 has changed significantly in the past ten years, and more change is imminent21.
21Washington, DC Economic Partnership. Web. <http://www.wdcep.com>.
District of Columbia Five-Year Consolidated Plan FY2011-2015
Page 48 of 184
Although the Wards provide a concrete visual of how development has occurred, DHCD’s geographic priorities are not based on Ward division. While Ward plans are an effective way to express local priorities, the boundaries changed dramatically in 1990 and 2000, and redistricting will likely occur again after the Census in 2010. Additionally, the city’s Wards are drawn to ensure an equal number of residents in each Council district rather than to provide a coherent rationale for planning the city. According to the 2008 ACS data, the District was home to 107,862 households earning less than 80 percent AMI, and therefore classified as low- or moderate-income by HUD. This represents 43 percent of the District’s overall household population. The following map illustrates the geographic areas with the highest percent of persons below the poverty level. DHCD funding resources will generally be targeted towards these priority low-income and moderate-income communities, and towards activities that improve the quality of life for current and future residents of the District of Columbia. (HOPWA funds serve a larger geographic region and are addressed separately in Appendices A and B.)
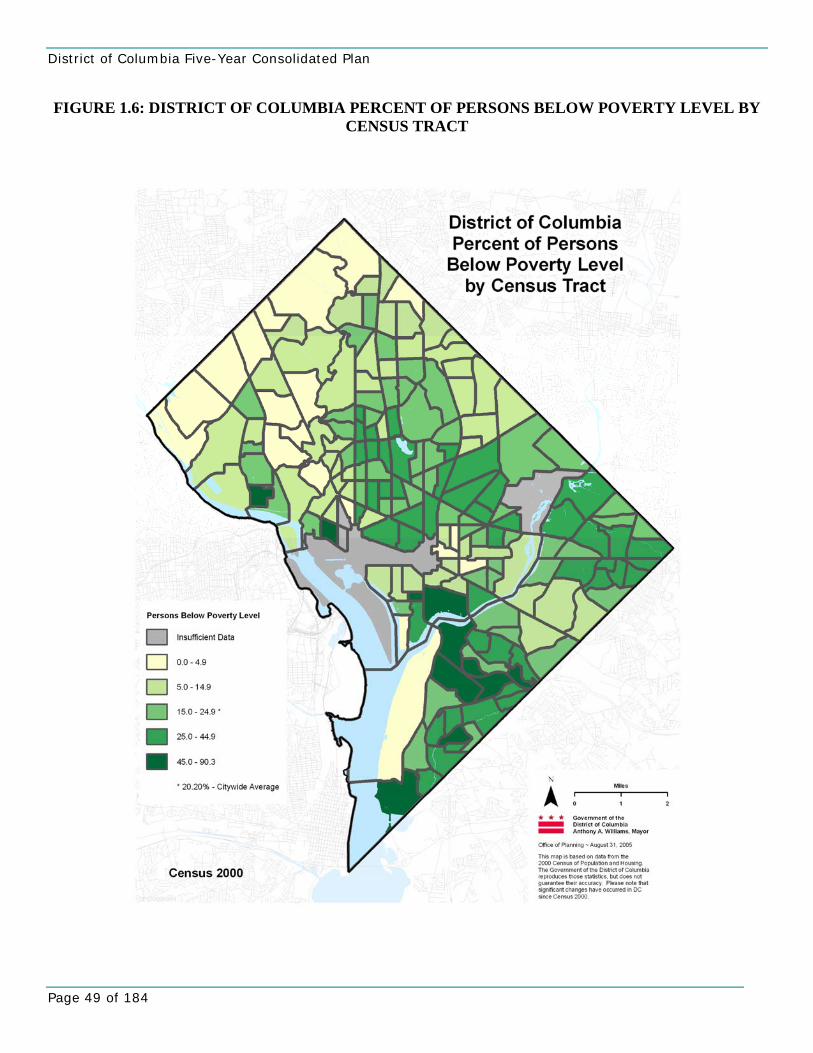
District of Columbia Five-Year Consolidated Plan
Page 49 of 184
FIGURE 1.6: DISTRICT OF COLUMBIA PERCENT OF PERSONS BELOW POVERTY LEVEL BY CENSUS TRACT
District of Columbia Five-Year Consolidated Plan FY2011-2015
Page 50 of 184
3 Basis for Allocation of Funding
Four Tier System As in the past, DHCD will continue to allocate its funding to address the demographic changes and needs identified in the Censuses, in the Mayor’s development priorities, and through DHCD’s Needs Assessment Hearings and the concerns voiced by the community. DHCD’s basis for allocation of resources is prioritized among specific target areas based on a four-tier system: TIER ONE Tier One focuses on projects that are currently in DHCD’s pipeline and that tie into a regional vision of sustainability. These resources are meant to supplement DHCD’s mission of creating complete neighborhoods and a more sustainable city. These resources will be focused primarily in Wards 5, 7, and 8, where development momentum has been or is being established, but where further investment is needed. The resources will extend throughout Ward 5 where focus will be on finishing development and continuing preservation, specifically in the Trinidad/Ivy City. In Wards 7 and 8, the resources will be distributed throughout specific corridors adjacent to Prince George’s County, MD, where unemployment is high and resources are needed, specifically the Benning Road, Deanwood, Minnesota Avenue, Pennsylvania Avenue and Historic Anacostia corridors. TIER TWO Tier Two focuses on projects that are of high priority and develop coordination with other District agencies. These resources will be meant to provide finishing assistance to developing areas, continuing preservation and promoting economic viability through a more integrated approach. This tier will include working with the Deputy Mayors Office for Planning and Economic Development (DMPED) to finish the development of the Georgia Avenue corridor and specific area locations where development has been established, including Park Morton and the Bruce School. This tier will also prioritize resources in the Walter Reed development corridor and work with the Office of Planning (OP) in developing the St. Elizabeth’s corridor. TIER THREE Tier Three focuses on areas of the city that are in general poverty and in need of development and revitalization. These tier resources will provide assistance to areas of the city that are not consistent with specific developing corridors, but will improve the livability of areas with underserved need. TIER FOUR Tier Four focuses on the entire city, to achieve economic integration of subsidized housing by providing mixed-income housing, or by locating affordable housing in neighborhoods that are not poverty impacted, or that are undergoing rapid gentrification. Mixed income housing would focus investment strategies and affordable housing programs to distribute mixed income housing more equitably across the entire city, taking steps to avoid further concentration of poverty within areas of the city that already have substantial affordable housing.
These target areas include several neighborhoods where small area plans were conducted. Small area plans are conducted by the Office of Planning in cooperation with sister agencies to supplement the broad policy statement and public actions of the District’s Comprehensive Plan. These plans are developed through a comprehensive process with the neighborhood residents and the District’s agencies to provide detailed direction for the development of city blocks, corridors and neighborhoods with the goal of achieving complete neighborhoods. These small area plans help guide DHCD investment priorities through the 4 tier system, with each tier having a greater priority.
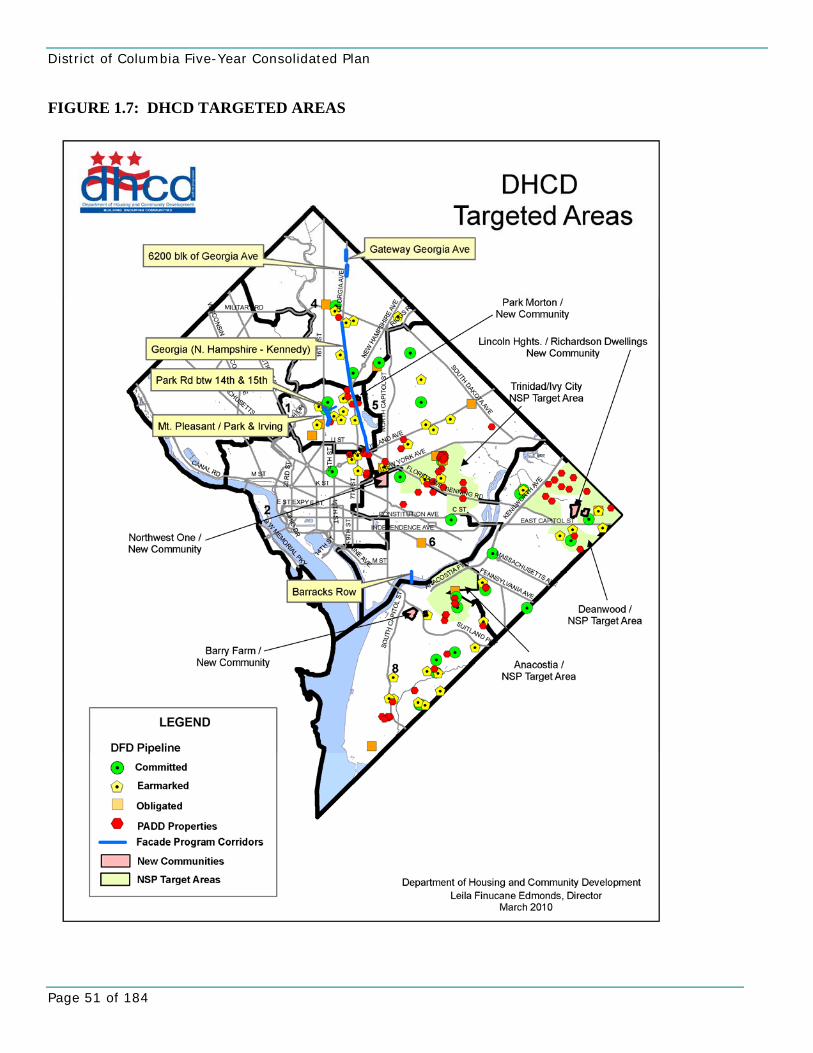
District of Columbia Five-Year Consolidated Plan
Page 51 of 184
FIGURE 1.7: DHCD TARGETED AREAS
District of Columbia Five-Year Consolidated Plan FY2011-2015
Page 52 of 184
Project Level DHCD’s subsidy resources are generally distributed through a competitive funding process; starting with a Notice of Funding Availability (NOFA) and followed by a Request for Proposals (RFP) for development projects and a Request for Applications (RFA) for neighborhood services (in addition, PADD also uses a solicitation of offers or an auction for its properties). Available funding sources may be used for a variety of eligible projects, including mixed income housing; however, DHCD prioritizes allocation of funding at the project level as well. In prioritizing at the project level, DHCD seeks to partner with private owners, including for- and non-profit entities, to protect and increase the supply of affordable housing in the District. Particular prioritization is given:
• For preservation or creation of affordable units in poverty impacted neighborhoods undergoing substantial rehabilitation as part of a comprehensive neighborhood revitalization strategy;
• For preservation or creation of affordable units to reduce displacement as a result of gentrification; • For special needs populations, such as low-income disabled and/or elderly households requiring
supported living environments and persons and families moving from shelters to permanent housing with supportive services;
• For low- to moderate-income households seeking to purchase homes; and/or • For repositioning properties requiring rehabilitation as a result of significant code violations, particularly
in neighborhoods where affordable housing is not readily available. The above prioritization is based, in part, on the housing market analysis summarized in further sections of the plan. The Office of Planning estimates that there is potential housing demand from over 11,600 net new households to the District through 2014. The majority of demand will be from households earning more than 80 percent of AMI and concentrated on those households earning more than 150 percent of AMI. Due to the capital markets, very little new construction has broken ground to meet the additional demand. Without new market rate construction the potential additional demand will seek to purchase or rent existing housing supply. This will increase competition, reduce vacancy and push up the cost of housing for existing housing. Several lower income neighborhoods could be affected and pressure could increase on existing affordable stock to opt out and float to market. The targeting of investment to these areas is anticipated to result in an increase in affordable housing opportunities for households that have experienced the pressure of rising housing costs. It also will leverage private investment to ensure that neighborhood-serving commercial opportunities and community facilities/services are created and maintained. DHCD will also support Administration initiatives to revitalize “New Communities22” and to restore commercial corridors in the “Great Streets23” program. DHCD will continue to leverage its funds with financial vehicles such as the New Markets Tax Credit Program and a range of financial instruments and/or arrangements that help to increase affordable housing, home-ownership opportunities, jobs and economic opportunity, retention and attraction of neighborhood businesses, neighborhood revitalization, community and commercial facilities and improvements to the living environments of our residents. 22 The New Communities Initiative is a comprehensive partnership designed to improve the quality of life for families and individuals living in four neighborhoods in Washington, DC: Barry Farm (Ward 8), Lincoln Heights/Richardson Dwellings (Ward 7), Northwest One (Ward 6) and Park Morton (Ward 1). The New Communities Initiative provides resources so that the community, in partnership with public and private entities, can work to transform highly concentrated low‐income neighborhoods into healthy mixed‐income neighborhoods. 23 The Great Streets Initiative is a multi‐year, multiple‐agency effort to transform nine under‐invested corridors into thriving and inviting neighborhood centers using public actions and tools as needed to leverage private investment. Program investments include new mixed use development projects, storefront improvements, transportation, streetscape, and transit improvements along these corridors.
District of Columbia Five-Year Consolidated Plan
Page 53 of 184
Additionally, DMPED will promote the revitalization of District neighborhoods in order to create job opportunities, affordable housing, and vibrant and safe places to live and work and to improve the general quality of life of District residents. DMPED will continue to carry out activities to support the development and disposition of properties previously acquired with public funds, with the CDBG Program Income, Capital dollars for the Great Streets Initiative projects, New Communities initiatives, Housing Production Trust Fund (New Communities) projects, and Neighborhood Investment Funds (NIF) in targeted areas of the District.
4 Obstacles to Meeting Underserved Needs The major obstacle to meeting underserved needs, and all identified needs throughout the Consolidated Plan, is the general lack of funding resources available, not only to DHCD, but to all public and private agencies which serve the needs of low-income and moderate-income residents. As mentioned previously in the Consolidated Plan, the District’s current revenue forecast suggests the District was significantly affected by the national recession, with continued deterioration in local source revenues. At the date of this draft, for FY 2011, total non-dedicated Local Fund revenues were estimated to be $5,029.1 million, which is $49.4 million less than the previous estimate just two months prior, and $135.3 million less than FY 2010 estimates. Not unlike the rest of the nation, the economic forecasts through 2015 for the District have become slightly more optimistic. However, as is to be expected of a recession marked by severe financial market problems, recovery is forecast to be fairly slow. Funding FEDERAL FUNDING Although the federal entitlement grants have remained steady throughout the previous planning period, and during the economic crisis, they have not kept up with inflation, further limiting the funds available to address the needs in the community. TABLE 1.14: FEDERAL ENTITLEMENT GRANT ALLOCATION Allocation CDBG HOME ESG HOPWA2006 $22,865,000 $9,179,000 $795,000 $10,535,000 2007 $19,274,630 $8,664,762 $819,946 $11,370,000 2008 $18,767,297 $8,731,505 $831,246 $11,118,000 2009 $18,033,221 $8,452,914 $808,603 $11,541,000 2010 $18,179,591 $9,322,221 $802,900 $12,213,518 REDUCED FUNDING FOR HPTF The Housing Production Trust Fund was authorized under the Housing Production Trust Fund Act of 1988, D.C. Law 7-202. The District’s Housing Production Trust Fund is a source of public funds focused on producing and preserving units of affordable housing for low- and moderate-income residents. In addition, at least half of all Trust Fund funds must be used to produce or preserve rental housing. The Housing Production Trust Fund, once a significant source of funding for the DHCD, has seen a sharp decline from the substantial slow down in DC’s real estate market. The Housing Production Trust Fund is made up of deed recordation and transfer taxes and is a projection rather than an allocation. With the housing market downturn, the District has
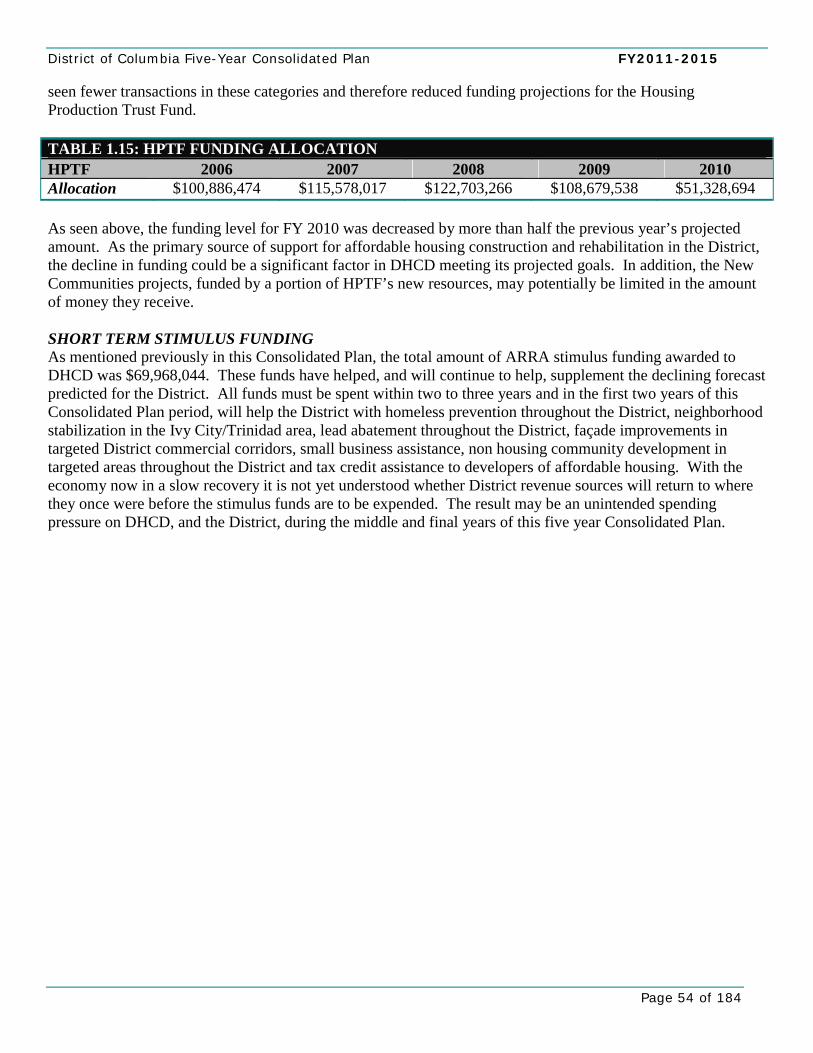
District of Columbia Five-Year Consolidated Plan FY2011-2015
Page 54 of 184
seen fewer transactions in these categories and therefore reduced funding projections for the Housing Production Trust Fund. TABLE 1.15: HPTF FUNDING ALLOCATION HPTF 2006 2007 2008 2009 2010 Allocation $100,886,474 $115,578,017 $122,703,266 $108,679,538 $51,328,694 As seen above, the funding level for FY 2010 was decreased by more than half the previous year’s projected amount. As the primary source of support for affordable housing construction and rehabilitation in the District, the decline in funding could be a significant factor in DHCD meeting its projected goals. In addition, the New Communities projects, funded by a portion of HPTF’s new resources, may potentially be limited in the amount of money they receive. SHORT TERM STIMULUS FUNDING As mentioned previously in this Consolidated Plan, the total amount of ARRA stimulus funding awarded to DHCD was $69,968,044. These funds have helped, and will continue to help, supplement the declining forecast predicted for the District. All funds must be spent within two to three years and in the first two years of this Consolidated Plan period, will help the District with homeless prevention throughout the District, neighborhood stabilization in the Ivy City/Trinidad area, lead abatement throughout the District, façade improvements in targeted District commercial corridors, small business assistance, non housing community development in targeted areas throughout the District and tax credit assistance to developers of affordable housing. With the economy now in a slow recovery it is not yet understood whether District revenue sources will return to where they once were before the stimulus funds are to be expended. The result may be an unintended spending pressure on DHCD, and the District, during the middle and final years of this five year Consolidated Plan.

District of Columbia Five-Year Consolidated Plan
Page 55 of 184
Managing the Process (91.200 (b))
1. Lead Agency. Identify the lead agency or entity for overseeing the
development of the plan and the major public and private agencies responsible for administering programs covered by the consolidated plan.
2. Identify the significant aspects of the process by which the plan was developed, and the agencies, groups, organizations, and others who participated in the process.
3. Describe the jurisdiction's consultations with housing, social service agencies, and other entities, including those focusing on services to children, elderly persons, persons with disabilities, persons with HIV/AIDS and their families, and homeless persons. *Note: HOPWA grantees must consult broadly to develop a metropolitan-wide strategy and other jurisdictions must assist in the preparation of the HOPWA submission.
3-5 Year Strategic Plan Managing the Process response:
District of Columbia Five-Year Consolidated Plan FY2011-2015
Page 56 of 184
1 Lead Agency The District of Columbia Department of Housing and Community Development (DHCD) is the lead agency for overseeing the development of the District’s Consolidated Plan, as well as the five annual action plans. DHCD will also administer the majority of program covered by this plan. Other major public and private agencies responsible for administering programs covered by the plan include the District Department of Health’s HIV/AIDS, Hepatitis, STD, and TB Administration (HOPWA funded activities); the District of Columbia Housing Authority (public housing facilities and services); the Department of Human Services in partnership with the Community Partnership for the Prevention of Homelessness (ESG funded programs and other homeless facilities and services); the District Department of the Environment (lead-based paint assessments). DHCD will continue to work closely with its six contracted housing services-focused Community-Based Organizations (Housing Counseling Services, Latino Economic Development Corporation, Lydia’s House, Marshall Heights Community Development Organization, University Legal Services, and the Central American Resource Center); affordable housing developers (such as Manna Community Development Organization, Mi Casa, Habitat for Humanity, Mission First, the Community Builders, Neighborhood Development Corporation, Washington, Community Preservation and Development Corporation, and Jubilee Enterprise of Greater); as well as other community partners including Anacostia Economic Development Corporation; ARCH, Chamber of Commerce, Latino Chamber of Commerce, Development Corporation of Columbia Heights, East of the River Community Development Corporation, H St Community Development Corporation, Jubilee Enterprise of Greater Washington, and North Capitol Neighborhood Development.
2 Plan Development Process In preparing its consolidated plan, DHCD broadly consulted with government agencies, affordable housing developers, community stakeholders, and residents working in housing, social, fair housing, and homeless services; lead-based paint programs; metropolitan-wide planning; HOPWA activities; and providing public housing. A variety of methods was used to collect input from the community, including a ‘Housing and Community Development’ survey, several stakeholder meetings, public hearings, and focused meetings with specific housing, health, and social service providers. DHCD held five focus groups in which stakeholders from around the community were invited to provide input on the Consolidated Plan. Overall, there was broad participation by each sector of the community. The five stakeholder meetings were:
• Special Needs Housing Stakeholders............. July 22, 2009 • Tenant Advocates and Landlord .................... July 28, 2009 • Non-profits and Faith-based Community ...... August 11, 2009 • HOPWA Advocates ....................................... August 13, 2009 • Housing Developers....................................... September 9, 2009
District of Columbia Five-Year Consolidated Plan
Page 57 of 184
3 Plan Development Consultations In preparing the Five-Year Plan and 2006 Action Plan, DHCD consulted with the following government agencies, non-profit and for-profit housing developers or financers, and advocacy organizations: Government Agencies, Developers/Financers, and Advocacy Organizations HOUSING SERVICES DHCD has strong relationships with private, non-profit and other public and affordable housing service providers. The agency participates on the National Low Income Housing Coalition, Housing Preservation Network, and regularly works with the Coalition for Non-profit Housing and Economic Development (CNHED). DHCD also attends a biweekly meeting of the planning and economic development cluster within District Government, as well as a housing cluster meeting also attended by the District Housing Finance Agency (DCHFA) and the DC Housing Authority (DCHA). DHCD’s Housing Resource Center, now located onsite, is utilized as an additional tool for coordinating with other District agencies (e.g. the Department of Consumer and Regulatory Affairs, the Office of the Tenant Advocate, etc.), along with the agency’s Community-Based Organizations (CBOs). In addition to regularly occurring consultation with partners, DHCD held several focus groups for various housing service providers, including tenant advocates and landlords, non-profit providers, and private developers. More information on this outreach can be found in the ‘Citizen Participation’ section. DHCD also holds a bimonthly meeting of the Interagency Foreclosure Mitigation and Prevention Taskforce with key agencies from across the District (such as the Office on Aging; Office of Planning; DCHA; and the Department of Insurance, Securities, and Banking). Consultations in this area are still in progress. SOCIAL SERVICES Through human services cluster meetings facilitated by the Office of the City Administrator (OCA), and the Interagency Council on Homelessness (ICH), DHCD is in regular communication with local providers of social services. See Homeless Services below for more information on DHCD’s involvement with the ICH. Social Service consultations are still in progress. FAIR HOUSING SERVICES Beginning in March 2010, DHCD Fair Housing Services consulted with three advisory groups on a monthly basis, in preparation of the Analysis of Impediments to Fair Housing Choice in the District of Columbia (AI). The AI is being completed in congruence with the 5-year Consolidated Plan. The roundtable discussion with these key stakeholder groups ensures the analyses reflect a cross-section of individuals and organizations involved in the District housing market, including local government officials, developers, lenders, realtors, community based organizations, community development corporations, housing counseling groups, and both national and local fair housing development corporations. Consultations in this area are still in progress. HEALTH SERVICES DHCD has regular meetings with the District Department of Mental Health, and through the Interagency Council on Homelessness (ICH), the District Department of Human Services. See Homeless Services below for
District of Columbia Five-Year Consolidated Plan FY2011-2015
Page 58 of 184
more information on DHCD’s involvement with the ICH. Additionally, DHCD consulted with the following health service providers. Consultations in this area are still in progress. HOMELESS AND CHRONICALLY HOMELESS SERVICES DHCD participates on the District’s Interagency Council on Homelessness (ICH). ICH is a group of cabinet-level leaders, providers of homeless services, advocates, homeless and formerly homeless leaders that come together to inform and guide the District’s strategies and policies for meeting the needs of individuals and families who are homeless or at imminent risk of becoming homeless in the District of Columbia. The Director and senior staff members sit on the ICH Strategic Planning Committee, as well as the Steering Committee, which is critical in gaining input on needs and ensuring agencies’ work aligns. ICH is currently in the process of creating a citywide strategic plan for homelessness, which includes a substantial component on reducing chronic homelessness in the District. Additionally, DHCD consulted extensively with the Community Partnership for the Prevention of Homelessness, who currently administers the District’s ESG funded facilities and services for the homeless. Consultations in this area are still in progress. LEAD-BASED PAINT DHCD consults with public health and child welfare on mitigating the dangers of lead-based paint mainly through its participation in the Lead Screening Advisory Committee (LSAC). The LSAC includes child health care providers, as well as representatives from the District government (including the Department of Health and Department of the Environment), managed care organizations, Medical Assistance Administration, faith-based organizations, and children’s health advocates. LSAC is the planning vehicle that the Center for Disease Control (CDC) uses to develop and update the Strategic Plan to eliminate Childhood Lead poisoning in the District of Columbia. DHCD’s Lead Safe Washington (LSW) program staff attends the monthly LSAC meetings for coordination and joint planning. DHCD also consulted with the District Department of the Environment (DDOE), the lead agency for lead-based paint hazards, for this section of the consolidated plan. Consultations in this area are still in progress. ADJACENT GOVERNMENT AND METRO PLANNING AGENCIES Representatives of DHCD attend meetings of the Metropolitan Washington Council of Governments (COG) committees to participate in information sharing and initiatives of the committee. Currently, the DHCD Director chairs COG’s Housing Directors Advisory Committee (HDAC), which meets bimonthly. Through COG, DHCD and other Housing Directors, and their counterparts in land use planning, transportation and environment from around the greater Washington area are developed a regional vision plan entitled “Greater Washington 2050 Region Forward.” The document outlines regional goals similar in scope to a regional vision plan recently outlined by the federal Partnership for Sustainable Communities. A major housing goal of the Greater Washington 2050 Region Forward is to target affordable housing toward regional activity centers with high quality transit to provide lower income households not only with affordable housing, but affordable transportation options as well. The plan was adopted by COG in January, 2010 and is now working its way through member governing bodies. DHCD used data and recommendations from this document while creating its Consolidated Plan. HOPWA In the District, HOPWA is administered through the HIV/AIDS, Hepatitis, STD & TB Administration (HAHSTA). HAHSTA submitted all HOPWA funded facilities and services as a free standing appendix to DHCD’s Consolidated Plan.
District of Columbia Five-Year Consolidated Plan
Page 59 of 184
PUBLIC HOUSING AGENCY PLAN The District of Columbia Housing Authority (DCHA) was the principal author of sections of the Consolidated Plan related to public housing. DHCD and DCHA have a strong working relationship and communicate frequently. Both agencies also participate on the Interagency Council on Homelessness described in detail above.
Interagency Coordination In addition to specific outreach regarding the Consolidated Plan, DHCD is fortunate to have considerable access to District agencies with complementary missions. The Government of the District of Columbia is organized into clusters of agencies with allied missions. The City Administrator and the Deputy Mayors use periodic coordination meeting to align resources and activities to match mayoral administration priorities. Additionally, monthly Mayor’s Cabinet Meetings are used to further coordinate among the clusters of agencies. This system provides for continuous consultation and coordination between agencies. As described earlier, DHCD is part of the Planning and Economic Development (DMPED) cluster, and the Health and Human Services cluster. The Planning and Economic Development cluster is led by a Deputy Mayor and consists of the Departments of Housing and Community Development; Planning; Small and Local Business Development; Real Estate Services; Consumer and Regulatory Affairs; Employment Services; Insurance, Securities and Banking; as well as the Office of Motion Picture and TV Development, the Taxicab Commission and the DC Commission on the Arts & Humanities. The Health and Human Services cluster is led by the City Administrator and consists of the Department of Health, Department of Human Services, Child and Family Service Agency, and others. In these periodic cluster meetings, agency needs, upcoming plans, and recent accomplishments are discussed to coordinate efforts. DHCD used these cluster meetings to assist in creating its five-year plan. DHCD also participates in regular Housing Agency cluster meetings. These meetings are led by the DMPED and attended by DHCD, DCHFA and DCHA. The agenda regularly includes coordination of pipeline projects and resources, addressing shared issues and information sharing.
District of Columbia Five-Year Consolidated Plan FY2011-2015
Page 60 of 184
Citizen Participation (91.200 (b)) 1. Provide a summary of the citizen participation process. 2. Provide a summary of citizen comments or views on the plan. 3. Provide a summary of efforts made to broaden public participation in the development
of the consolidated plan, including outreach to minorities and non-English speaking persons, as well as persons with disabilities.
4. Provide a written explanation of comments not accepted and the reasons why these
comments were not accepted.
*Please note that Citizen Comments and Responses may be included as additional files within the CPMP Tool.
3-5 Year Strategic Plan Citizen Participation response:
District of Columbia Five-Year Consolidated Plan
Page 61 of 184
1 Citizen Participation Process As described in Chapter One’s ‘Vision’ section, DHCD’s Consolidated Plan rests on the foundation provided by the District’s 2006 Comprehensive Plan, conducted by the Office of Planning, in which hundreds of District residents took part in small group discussions, workshops, community fairs, town hall meetings, and mayoral hearings. DHCD has continued this citizen participation process into its own consolidated plan development process. DHCD facilitates broad-based participation in its planning process by providing:
• No less than two-week advance publication of a Notice of Public Hearings, • No less than 30 days to review the draft documents, • Two-week periods following hearings for the submission of additional comments, • Direct mailings of Notices to a wide range of interested groups, • Easy access to draft documents (hard copies and on-line) and hearing transcripts, • Accommodation of special needs participation through sign-language interpreters and interpreters
for Spanish-speaking constituents, and • Holding hearings at convenient times and in barrier-free facilities that are easily accessible by public
transportation. The Director and senior DHCD staff members are present at public hearings to take the direct testimony, answer questions on the District’s housing and community development needs, and receive comments on DHCD’s program performance for prior periods as well as for the current year. The submission of written testimony for the record is encouraged, and Public Hearing records are kept open for at least two weeks after the hearing for the receipt of post-hearing written testimony. A court reporter provides written transcripts within two weeks of the date of the Public Hearing, and a record of the Public Hearing, including the written transcript, is made available for public viewing at DHCD. When preparing the final consolidated plan, DHCD will include a summary of the comments and views received from citizens orally and in writing at the Public Hearing, as well as a response to any comments not accepted. Moreover, DHCD will provide citizens, public agencies and other interested parties with reasonable and timely access to information and records relating to the District’s Consolidated Plan and its use of assistance under the programs covered under the Consolidated Plan during the preceding DHCD promotes attendance at the hearings, particularly for low- and moderate-income citizens and citizen groups located in blighted areas of the city in which DHCD entitlement grant program funds are directed. The Public Hearings are announced through the publication of a Public Hearing Notice, containing the date, time, location, and subject matter of the Public Hearing. Advertisement of the Public Notice is placed at least 2 weeks prior to the hearings in the D.C. Register, and in various media outlets that reach different population and interest groups. These media outlets include a daily newspaper in general circulation (such as The Washington Post) and other publications that reach different language groups, neighborhoods, and minority populations (such as the Afro-American, El Tiempo and the Blade.) No fewer than 500 copies of the Public Hearing Notices are distributed by direct mail to various constituent groups and individuals, including all Advisory Neighborhood Commissions, public housing resident councils, civic associations, nonprofit developers, organizations supporting special needs populations, church groups, and community based organizations. Additionally, DHCD has contractual relationships with specific community-based organizations (CBOs) that have a responsibility to distribute information.

District of Columbia Five-Year Consolidated Plan FY2011-2015
Page 62 of 184
2 Citizen Comments Citizens were given multiple opportunities to provide comments or views on the Consolidated Plan. A summary of comments can be found in Appendix E: Citizen Participation- Summary of Hearings and Citizen Comments. Additionally, DHCD administered a survey soliciting comments on the District’s housing and community development needs and priorities. Graphs depicting responses to selected questions can be found in Appendix F: Citizen Participation - Survey Results.
3 Efforts to Broaden Public Participation As mentioned, DHCD’s consolidated plan was based on the District’s 2006 Comprehensive Plan and subsequent updates, which included a remarkable amount of public participation. DHCD has made certain to continue this trend of proactively seeking public participation, particularly from historically underrepresented populations. As testament, DHCD’s Citizen Participation Plan (CPP) is designed to “especially encourage participation by low- and moderate-income persons, minority and non-English speaking persons, residents of public and assisted housing developments, and, in particular, persons living in areas where the federal grant funds are proposed to be used.” The District’s CPP can be found in Appendix E. The District’s CPP explicitly required DHCD to post hearing notices in media outlets publications that reach different language groups, neighborhoods, and minority populations (such as publications with primarily African-American, Spanish speaking, or LGBT audiences). The CPP also requires DHCD give two weeks notice to organizations that focus supporting special needs populations. As written in DHCD’s Citizen Participation Plan, four hearings were held on the Consolidated Plan, and a fifth hearing will be held on the first draft of this document. DHCD encourages participation on special needs populations and provides sign-language interpreters and interpreters for Spanish-speaking constituents. Hearings are held at convenient times (including both daytime and evening) and in barrier-free facilities that are easily accessible by public transportation. Hearings held for the FY2011-2015 Consolidated Plan are as follows:
• Needs Assessment Hearing (Held in Ward 6) ............September 17, 2009 • Needs Assessment Hearing (Held in Ward 8) ............October 14, 2009 • Needs Assessment Hearing (Held in Ward 7) ............October 28, 2009 • Needs Assessment Hearing (Held in Ward 1) ............November 19, 2009
The District also administered a survey soliciting residents’ comments and views on District housing and community development. The survey was posted on DHCD’s main homepage and also sent to community stakeholders. In total, 62 respondents participated in the survey, which while not statistically significant, yielded useful information on the needs and priorities of District residents. Finally, as mentioned in “Managing the Process” earlier, DHCD held five focus groups in which stakeholders from around the community were invited to provide input on the Consolidated Plan. Overall, there was significant participation from all sectors of the community. The five stakeholder meetings were:
• Special Needs Housing Stakeholders .........................July 22, 2009 • Tenant Advocates and Landlord.................................July 28, 2009 • Non-profits and Faith-based Community...................August 11, 2009 • HOPWA Advocates....................................................August 13, 2009 • Housing Developers ...................................................September 9, 2009
District of Columbia Five-Year Consolidated Plan
Page 63 of 184
4 Comments Not Accepted Citizen comments on this draft will be compiled and added to the large amount of comments already received on needs and priorities for housing and community development in the District. DHCD foresees accepting all citizen comments and responding to each.

District of Columbia Five-Year Consolidated Plan FY2011-2015
Page 64 of 184
Institutional Structure (91.215 (i)) 1. Explain the institutional structure through which the jurisdiction will carry out its
consolidated plan, including private industry, non-profit organizations, and public institutions.
2. Assess the strengths and gaps in the delivery system.
3. Assess the strengths and gaps in the delivery system for public housing, including a
description of the organizational relationship between the jurisdiction and the public housing agency, including the appointing authority for the commissioners or board of housing agency, relationship regarding hiring, contracting and procurement; provision of services funded by the jurisdiction; review by the jurisdiction of proposed capital improvements as well as proposed development, demolition or disposition of public housing developments.
3-5 Year Strategic Plan Institutional Structure response:
District of Columbia Five-Year Consolidated Plan
Page 65 of 184
1 Institutional Structure In the District of Columbia, executive functions are organized under the Mayor, City Administrator and Deputy Mayor and two additional Deputy Mayors who supervise clusters of agencies with like missions. The City Administrator and the Deputy Mayors use periodic coordination meeting to align resources and activities to match mayoral administration priorities. Additionally, monthly Mayor’s Cabinet Meetings are used to further coordinate among the clusters of agencies. This system provides for continuous consultation and coordination between agencies. The Office of the City Administrator can call upon an array of government programs to address specific neighborhood needs and to coordinate all agencies around a priority need such as homelessness, youth services, mental health and fair housing. A partial summary of these supportive services appears to support the data captured in the Non-Housing Community Development Needs table in Section 1 of Chapter Four: Community Development. DHCD also works closely with the DC Housing Authority (DCHA) and the DC Housing Finance Agency (DCHFA) to maximize dollars available for housing opportunities for all income levels from extremely low to moderate income. A representative of DHCD attends the meetings of the Metropolitan Washington Council of Governments (COG) Committee of Housing Directors to participate in information sharing and initiatives of the Committee. The Director is also a member of the Comprehensive Housing Policy Task Force, which brings together diverse interest groups and experts to broadly analyze housing needs in the District of Columbia and recommend actions. As part of its unified leveraging strategy, the District will continue to work with its non-profit, for-profit and semi-governmental development partners, and to coordinate DHCD’s investments in the renewal of affordable housing and neighborhood revitalization with government agencies that fund infrastructure improvements and services needed to create self-sustaining neighborhoods.
2 Strengths and Gaps in the Delivery System While there is room for improvement in any system, the District of Columbia is proud of its efficient and effective delivery system. As described above, the cluster arrangement of District agencies, along with strong partnerships with private, non-profit, and public entities, enables DHCD to improve monitoring, coordination, compliance, and partnerships among agencies in its delivery system. As is true with jurisdictions across the country, the biggest challenge in the District’s delivery system is a lack of resources to fund the level of affordable housing, homeless facilities, community development, and programs for special needs populations. The District has seen a dramatic reduction in tax revenue as well as other local revenues that fund the Housing Production Trust Fund. Additionally, private corporations and foundations that frequently partner with District government have seen a drastic reduction in income, which has affected their ability to fund District projects. Other gaps in DHCD’s delivery system include a duplication of services among its Community-Based Organizations and other not-for-profit agencies providing similar public services. DHCD continues to address these gaps by streamlining its community services programs and encouraging collaboration among its providers and roundtable conversations that identify and consolidate duplicate services. A second gap is the ability of DHCD to reach further into communities such as faith-based communities and non-English speaking
District of Columbia Five-Year Consolidated Plan FY2011-2015
Page 66 of 184
communities. While further progress is necessary, DHCD has had several meetings with leaders in these communities to get input how to improve in this area.
3 Strengths and Gaps in Delivery of DCHA DCHA is structured as a “Move to Work” agency, which means it is allowed flexibility with how it uses federal funding. DCHA uses this flexibility to substitute local requirements for any statutory or regulatory barriers to successful partnership both in mixed finance opportunities and in working with supportive service programs of the District of Columbia government, for example, in its execution of the Local Rent Supplement Program. DCHA has submitted to HUD for review and approval a streamline Subsidy-Only Development Protocol that will reduce transaction time and costs in order to negotiate and finalized subsidy-only partnerships. Frequently, these partnerships are derived from the DHCD project pipeline. DCHA responds to DHCD identified development participation opportunities to include new public housing units in DHCD funded projects. This has resulted in the development or proposed development of 85 units in FY09, and an additional 90 units proposed in FY2010. DCHA is an independent Authority whose Board of Directors is comprised of Mayoral nominees confirmed by the District City Council and resident representatives elected by public housing residents. As an independent Authority, DCHA has its own hiring, procurement, and contracting rules, regulations and practices that conform to HUD requirements.
District of Columbia Five-Year Consolidated Plan
Page 67 of 184
Monitoring (91.230) 1. Describe the standards and procedures the jurisdiction will use to monitor its
housing and community development projects and ensure long-term compliance with program requirements and comprehensive planning requirements.
3-5 Year Strategic Plan Monitoring response:
District of Columbia Five-Year Consolidated Plan FY2011-2015
Page 68 of 184
1 Monitoring Standards and Procedure The Program Monitoring Division (OPM) conducts oversight and reviews of DHCD projects and funding recipients. Its core functions include the following types of oversight:
• Contract Compliance: completing various federally required compliance reviews as part of the underwriting and project development process;
• Quality Assurance: monitoring the compliance of DHCD funded sub-recipients with federal HOME Investments Partnership Program (HOME) and Community Development Block Grant Program (CDBG) funding requirements; and
• Compliance Monitoring: ensuring projects developed by DHCD through the Housing Production Trust Fund (HPTF), CDBG, HOME and Low Income Housing Tax Credit (LIHTC) programs remain in compliance with federal and local program requirements throughout the duration of the projects period of affordability.
COMMUNITY DEVELOPMENT BLOCK GRANT (CDBG) Every CDBG grant sub-recipient is monitored several times each year by trained OPM staff. A monitoring report is completed for the following compliance areas:
• Eligibility; • Fair Housing; • Civil Rights and Equal Opportunity; • Financial and Audit; • Federal Labor Standards; • Acquisition and Relocation, Section 104(d); • Interim and Final Audit; and • Final Benefit Count.
. In the event that OPM staff identifies compliance problems, the sub-recipient is notified and a deadline is set for a response and possible corrective actions. Prior to formal close-out of each grant, a final check is made to be sure all monitoring has been completed and any finding is resolved satisfactorily. HOME RENTAL HOUSING LOAN PROGRAM DHCD has developed and implemented compliance monitoring procedures to ensure proper implementation of all HOME regulations. OPM conducts site visits annually for multifamily properties with 26 or more units and biannually for multifamily properties with 25 or fewer units. Properties are inspected for conformance with income and rent restrictions and HUD’s Uniform Physical Conditions Standards. OPM monitors each property for compliance with its written HOME agreement. The Owner of each property is required to complete the HOME Annual Owner Certification each year. By completing the document, the owner is certifying that the subject property has complied with all appropriate Federal and District regulations.
District of Columbia Five-Year Consolidated Plan
Page 69 of 184
Compliance with federal and state requirements is conducted for each project as noted below:
1. Subsidy Layering DHCD will perform subsidy-layering analysis for HOME funded projects prior to the time of preliminary commitment for projects receiving tax credits from the District’s low income housing tax credit allocation.
2. Environmental Review
OPM staff also complete a HUD approved checklist after it independently reviews all of the environmental information collected for each site. Additionally, in accordance with the National Environmental Protection Act (NEPA), OPM has provided public notice and reviewed the environmental effects of proposed housing related activities throughout the District and concluded that a broad range of activities will not have an adverse impact on the environment.
3. Labor Standards
If HOME funds are provided (whether for construction or non-construction expenses) to projects involving the construction of affordable housing consisting of 12 or more HOME units, then the contract relating to the new construction or rehabilitation must comply with the following labor standards: • Davis-Bacon Act, 40 U.S.C. 276(a)-5 • Contract Work Hours and Safety Standards Act, 40 U.S.C. 327-332 • Copeland “Anti Kickback” Act, 40 U.S.C. 276(c) 1982. • All applicable regulations and HUD Handbook #1344.1
Each developer/owner is required to attend a pre-construction conference. During this conference, OPM will distribute applicable forms and instructions relating to labor standards. 4. Affirmative Marketing
Affirmative Marketing is required when HOME-assisted housing contains five or more units. If applicable, owners of HOME-assisted housing must adopt and conduct affirmative marketing procedures and requirements which provide information and otherwise attract eligible persons. OPM will monitor and annually assess the affirmative marketing efforts conducted by owners in compliance with this requirement.
5. Uniform Relocation Act
Uniform Relocation Act information is reviewed by OPM staff at the time of application. Each project’s compliance with relocation requirements is also monitored throughout the construction process and through lease-up by reviewing rent rolls, relocation plans and budgets and by visiting the sites.
6. Fair Housing, Equal Opportunity and Accessibility Laws
HOME recipients must comply with any and all federal and District laws relating to fair housing and equal opportunity, including but not limited to those listed below: • Minority Business Enterprise Executive Orders 11625, 12432, and 12138 • The Federal Fair Housing Act (42 U.S.C. §3601 et seq. (1968)) • Age Discrimination Act of 1975 (42 U.S.C. §6101 et seq.) • Section 504 of the Rehabilitation Act of 1973 (29 U.S.C. §794)
District of Columbia Five-Year Consolidated Plan FY2011-2015
Page 70 of 184
• Americans with Disabilities Act of 1990 (ADA) (42 U.S.C. §12116 et seq.) • Section 3 of the Housing and Urban Development Act of 1968 (12 U.S.C. §171U et seq.) • Executive Order 11063 • Title VI Civil Rights Act - 1964 (42 U.S.C. 2000d)
OPM staff reviews each project for compliance with each of these statutes. Each project is reviewed both during the planning stage and during construction to ensure that all applicable accessibility requirements are met. EMERGENCY SHELTER GRANT (ESG) Generally DHCD contracts with the Community Partnership for the Prevention of Homelessness (TCP) to administer its ESG funds. DHCD will monitor TCP’s participation in the Program to ensure compliance with program regulations promulgated by HUD at 24 CFR part 576 for ESG programs designed to benefit homeless persons. Annually, the monitoring visit reviews such areas as financial record systems, program benefits, and other program rules. After each monitoring visit is complete, OPM sends an exit monitoring report. Project accomplishments, areas of deficiencies and technical assistance needs are highlighted in this report, which serves to confirm issues discussed during the on-site monitoring review process and to give advance notice of deficient areas requiring attention. LOW-INCOME HOUSING TAX CREDITS Once a tax credit allocation is received, DHCD monitors the recipient’s compliance with federal and state regulations and procedures. To ensure compliance with Section 42 of the Internal Revenue Code, OPM schedules a site visit every three years to inspect the conditions of the apartments, randomly select tenant files for review, and interview tenants. In particular, OPM verifies that all sources of tenant income are documented in accordance with program guidelines and monitors rent restrictions under Section 42(g) of the Internal Revenue Code. In FY2011-2015, DHCD will continue its program and sub-recipient monitoring activities which includes:
• Conducting monitoring reviews of its Development Finance Division Project Financing, Neighborhood Based Activities, and Emergency Shelter Grant programs,
• Continuing to perform environmental reviews and project-specific labor standards monitoring; • Conducting long-term monitoring reviews for HOME, Low Income Housing Tax Credit (LIHTC),
HPTF and CDBG funded projects; • Conducting follow-up reviews to ensure that corrective actions for audit report recommendations
have been implemented; and • Monitoring the Department’s spending and commitment requirements in accordance with the
funding sources. The Department will monitor its activities through ongoing communications with sub-grantees and site visits to their programs. Activities will also be monitored through periodic, but systematic, tracking of performance through the Housing Development Software (HDS) and HUD’s Integrated Disbursement and Information System (IDIS). HDS will be improved to provide an automated and integrated mechanism for recording and reporting the results of site visits. IDIS gives the Department the capability to assess progress of individual projects, as well as each major HUD-funded program as a whole. As the HDS software becomes fully operational, by linking budget, performance measures, and program delivery, DHCD will be able to effectively monitor its progress in carrying out the strategic plans contained in this Action Plan for FY2010. HDS is designed to ensure that applicable program requirements are followed for every HUD funded project. A list of
District of Columbia Five-Year Consolidated Plan
Page 71 of 184
all DHCD projects that includes budgets, number of units, contract status, IDIS numbers, and other information is in HDS. The system provides a summary of all projects/major resources in the Department and the spending status. This is critical to ensure adherence to the budget, draw downs, the public service cap, and the planning and administration cap. DHCD will produce a self-evaluation of its annual performance in relation to meeting priorities and specific objectives in the form of a Consolidated Annual Performance and Evaluation Report (CAPER). The CAPER provides a summary of the programmatic accomplishments for projects reported under the IDIS, as well as additional narratives describing program milestones and accomplishments. The CAPER must be filed with HUD within 90 days (December 30) after the close of DHCD’s program year.
District of Columbia Five-Year Consolidated Plan FY2011-2015
Page 72 of 184
Priority Needs Analysis and Strategies (91.215 (a)) 1. Describe the basis for assigning the priority given to each category of priority
needs. 2. Identify any obstacles to meeting underserved needs. 3-5 Year Strategic Plan Priority Needs Analysis and Strategies response:
District of Columbia Five-Year Consolidated Plan
Page 73 of 184
1 Basis for Assigning Priority Please refer to the questions two, “Geographic Priority” and three, “Bases for Allocation of Funding” in the “General Questions” section earlier in this chapter.
2 Obstacles to Meeting Underserved Needs Please refer to the question three, “Obstacles to Meeting Underserved Needs” in the “General Questions” section earlier in this chapter.
District of Columbia Five-Year Consolidated Plan FY2011-2015
Page 74 of 184
Lead-based Paint (91.215 (g)) 1. Estimate the number of housing units that contain lead-based paint hazards, as defined
in section 1004 of the Residential Lead-Based Paint Hazard Reduction Act of 1992, and are occupied by extremely low-income, low-income, and moderate-income families.
2. Outline actions proposed or being taken to evaluate and reduce lead-based paint
hazards and describe how lead based paint hazards will be integrated into housing policies and programs, and how the plan for the reduction of lead-based hazards is related to the extent of lead poisoning and hazards.
3-5 Year Strategic Plan Lead-based Paint response:
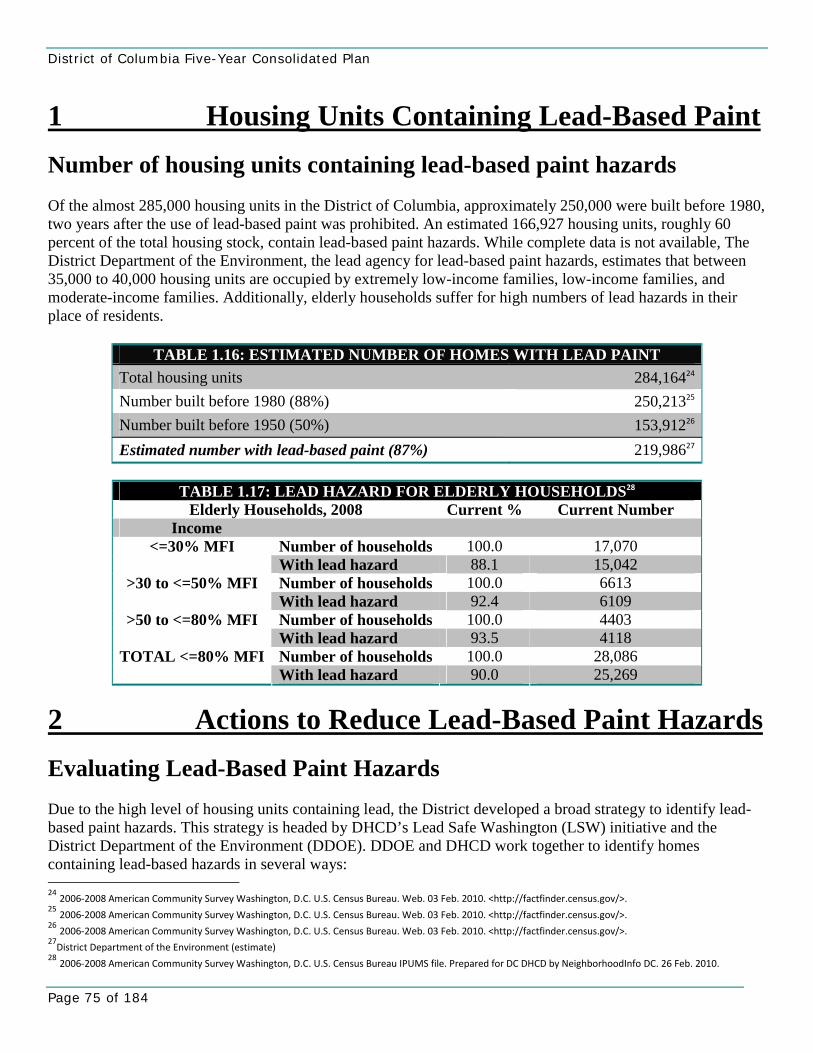
District of Columbia Five-Year Consolidated Plan
Page 75 of 184
1 Housing Units Containing Lead-Based Paint Number of housing units containing lead-based paint hazards Of the almost 285,000 housing units in the District of Columbia, approximately 250,000 were built before 1980, two years after the use of lead-based paint was prohibited. An estimated 166,927 housing units, roughly 60 percent of the total housing stock, contain lead-based paint hazards. While complete data is not available, The District Department of the Environment, the lead agency for lead-based paint hazards, estimates that between 35,000 to 40,000 housing units are occupied by extremely low-income families, low-income families, and moderate-income families. Additionally, elderly households suffer for high numbers of lead hazards in their place of residents.
TABLE 1.16: ESTIMATED NUMBER OF HOMES WITH LEAD PAINT Total housing units 284,16424
Number built before 1980 (88%) 250,21325
Number built before 1950 (50%) 153,91226
Estimated number with lead-based paint (87%) 219,98627
TABLE 1.17: LEAD HAZARD FOR ELDERLY HOUSEHOLDS28
Elderly Households, 2008 Current % Current Number Income
Number of households 100.0 17,070 <=30% MFI With lead hazard 88.1 15,042 Number of households 100.0 6613 >30 to <=50% MFI With lead hazard 92.4 6109 Number of households 100.0 4403 >50 to <=80% MFI With lead hazard 93.5 4118 Number of households 100.0 28,086 TOTAL <=80% MFI With lead hazard 90.0 25,269
2 Actions to Reduce Lead-Based Paint Hazards Evaluating Lead-Based Paint Hazards Due to the high level of housing units containing lead, the District developed a broad strategy to identify lead-based paint hazards. This strategy is headed by DHCD’s Lead Safe Washington (LSW) initiative and the District Department of the Environment (DDOE). DDOE and DHCD work together to identify homes containing lead-based hazards in several ways: 24 2006‐2008 American Community Survey Washington, D.C. U.S. Census Bureau. Web. 03 Feb. 2010. <http://factfinder.census.gov/>. 25 2006‐2008 American Community Survey Washington, D.C. U.S. Census Bureau. Web. 03 Feb. 2010. <http://factfinder.census.gov/>. 26 2006‐2008 American Community Survey Washington, D.C. U.S. Census Bureau. Web. 03 Feb. 2010. <http://factfinder.census.gov/>. 27District Department of the Environment (estimate)
28 2006‐2008 American Community Survey Washington, D.C. U.S. Census Bureau IPUMS file. Prepared for DC DHCD by NeighborhoodInfo DC. 26 Feb. 2010.
District of Columbia Five-Year Consolidated Plan FY2011-2015
Page 76 of 184
• DDOE performs lead risk assessments in the homes of prospective foster care families, on behalf of
the Child and Family Service Agency (CFSA); • DDOE responds to notification of children with elevated blood lead levels by conducting
environmental investigations in the homes of such children as well as in other locations that could be sources of exposure to lead for these children;
• DDOE responds to complaints by tenants and others about the presence of peeling paint in pre-1978 homes;
• DDOE conducts proactive initiatives in geographic hotspots for lead (currently in Wards 1 and 4), resulting in the identification and lead hazard control of lead-based paint hazards in thousands of residential units;
• DHCD works with the University of the District of Columbia (UDC) Architectural Research Institute to conduct lead-based paint inspection and lead-based paint evaluation of eligible properties; and
• DHCD’s Community-Based Organizations work with their respective communities to identify homes likely to contain lead based paint.
• Lead-based hazard removal has also been incorporated into the process for housing units working with DHCD’s Single Family Residential Community Services Division (RCS) ensuring any property enrolled in (RCS) program is also evaluated for the LSW lead program.
DDOE has also launched an initiative seeking voluntary compliance with the District’s lead laws, targeting nuisance properties with lead-based paint hazards that are visible from the public right of way. Finally, DDOE has established a compliance registry for multifamily property owners and managers to access in order to update lead-related information about their properties.
Reducing Lead-Based Hazards DHCD continues to actively engage public agencies and private entities in efforts to address lead-based paint hazards. Outreach actions include:
• Participation in several community fairs where attendees were able to access LSW program information, including visuals of chipping and peeling paint at each event to alert families of what these conditions represent visually;
• Proactive contact with property owners and their tenants who are reported by the Department of Environment as having a child with an Elevated Blood Level residing in the property;
• Quarterly meetings with lead reduction and remediation contractors focusing on lead-based paint hazards and resources available for reducing these hazards;
• Special briefing sessions on the LSW program with five property management firms with large number of rental units under their control, four of which are now working with LSW to address lead-based paint hazards in their properties;
• “D.C. Lead Safe Fair: Healthy Homes-Healthy Children,” which provided information on lead-related health screenings, government programs and services, as well as information on businesses and organizations that provide products or services to populations most affected by the effects of lead-based paint.
• Regular meetings with contractors, community groups, and other interested stakeholders to ensure the ongoing dissemination of lead-safe information.
District of Columbia Five-Year Consolidated Plan
Page 77 of 184
Additionally, LSW also provides grants of up to $17,500 per housing unit to eligible homeowners and investor-owners of pre-1978 housing with deteriorated lead-based paint to make those units lead safe. To be eligible, the homeowner or tenant must be lower-income, with a focus on having a child under years of age (or available to families with children under 6 years of age). Units occupied by pregnant women also may be eligible for assistance. Due to property owners’ access to lead hazard abatement funding, DOH, DDOE, and OAG have had much greater leverage in litigating cases of lead hazards involving a child with an Elevated Blood Level (EBL) for lead. The “carrot and stick”— funding available for mitigating lead-based hazards along with the potential for significant legal consequences for non-compliance—has been a useful approach for ensuring that property owners whose housing units have lead-based paint hazards move swiftly to eradicate those hazards from their properties.
District of Columbia Five-Year Consolidated Plan FY2011-2015
Page 78 of 184
CHAPTER TWO: HOUSING
Housing Needs (91.205) 1. Describe the estimated housing needs projected for the next five year period for the
following categories of persons: extremely low-income, low-income, moderate-income, and middle-income families, renters and owners, elderly persons, persons with disabilities, including persons with HIV/AIDS and their families, single persons, large families, public housing residents, victims of domestic violence, families on the public housing and section 8 tenant-based waiting list, and discuss specific housing problems, including: cost-burden, severe cost- burden, substandard housing, and overcrowding (especially large families).
2. To the extent that any racial or ethnic group has a disproportionately greater need for any income category in comparison to the needs of that category as a whole, the jurisdiction must complete an assessment of that specific need. For this purpose, disproportionately greater need exists when the percentage of persons in a category of need who are members of a particular racial or ethnic group is at least ten percentage points higher than the percentage of persons in the category as a whole.
3-5 Year Strategic Plan Housing Needs response:
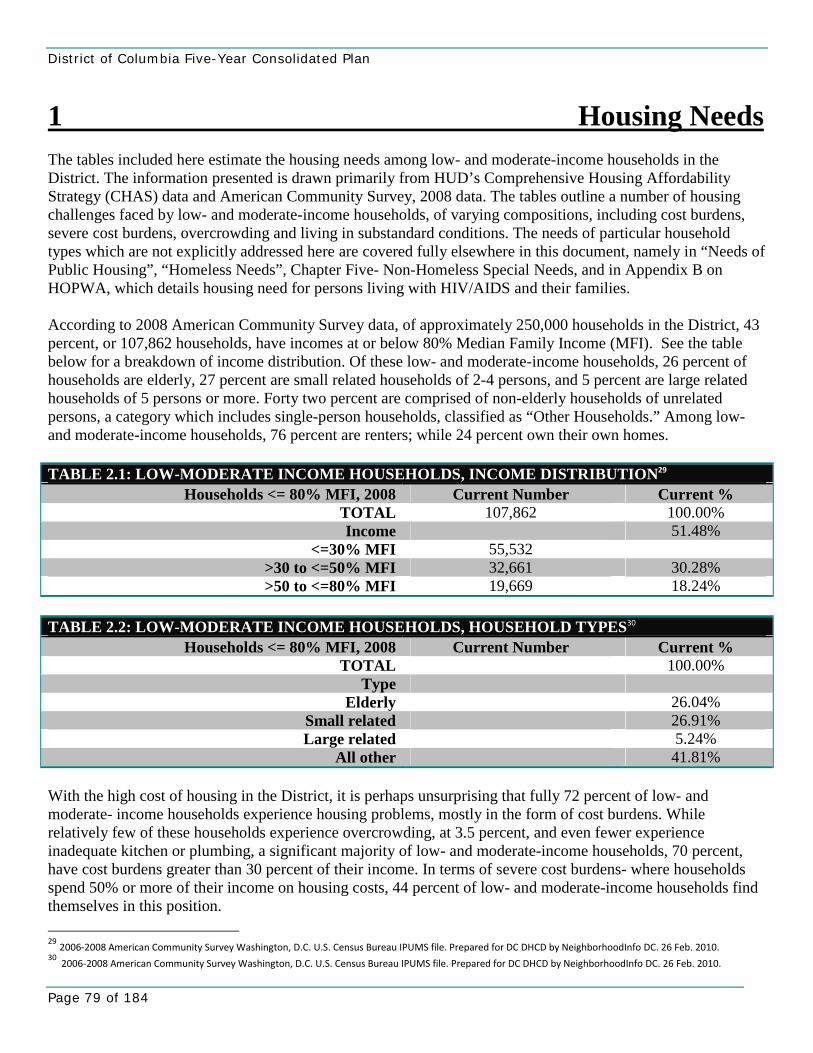
District of Columbia Five-Year Consolidated Plan
Page 79 of 184
1 Housing Needs The tables included here estimate the housing needs among low- and moderate-income households in the District. The information presented is drawn primarily from HUD’s Comprehensive Housing Affordability Strategy (CHAS) data and American Community Survey, 2008 data. The tables outline a number of housing challenges faced by low- and moderate-income households, of varying compositions, including cost burdens, severe cost burdens, overcrowding and living in substandard conditions. The needs of particular household types which are not explicitly addressed here are covered fully elsewhere in this document, namely in “Needs of Public Housing”, “Homeless Needs”, Chapter Five- Non-Homeless Special Needs, and in Appendix B on HOPWA, which details housing need for persons living with HIV/AIDS and their families. According to 2008 American Community Survey data, of approximately 250,000 households in the District, 43 percent, or 107,862 households, have incomes at or below 80% Median Family Income (MFI). See the table below for a breakdown of income distribution. Of these low- and moderate-income households, 26 percent of households are elderly, 27 percent are small related households of 2-4 persons, and 5 percent are large related households of 5 persons or more. Forty two percent are comprised of non-elderly households of unrelated persons, a category which includes single-person households, classified as “Other Households.” Among low- and moderate-income households, 76 percent are renters; while 24 percent own their own homes. TABLE 2.1: LOW-MODERATE INCOME HOUSEHOLDS, INCOME DISTRIBUTION29
Households <= 80% MFI, 2008 Current Number Current % TOTAL 107,862 100.00% Income 51.48%
<=30% MFI 55,532 >30 to <=50% MFI 32,661 30.28% >50 to <=80% MFI 19,669 18.24%
TABLE 2.2: LOW-MODERATE INCOME HOUSEHOLDS, HOUSEHOLD TYPES30
Households <= 80% MFI, 2008 Current Number Current % TOTAL 100.00%
Type Elderly 26.04%
Small related 26.91% Large related 5.24%
All other 41.81% With the high cost of housing in the District, it is perhaps unsurprising that fully 72 percent of low- and moderate- income households experience housing problems, mostly in the form of cost burdens. While relatively few of these households experience overcrowding, at 3.5 percent, and even fewer experience inadequate kitchen or plumbing, a significant majority of low- and moderate-income households, 70 percent, have cost burdens greater than 30 percent of their income. In terms of severe cost burdens- where households spend 50% or more of their income on housing costs, 44 percent of low- and moderate-income households find themselves in this position. 29 2006‐2008 American Community Survey Washington, D.C. U.S. Census Bureau IPUMS file. Prepared for DC DHCD by NeighborhoodInfo DC. 26 Feb. 2010. 30 2006‐2008 American Community Survey Washington, D.C. U.S. Census Bureau IPUMS file. Prepared for DC DHCD by NeighborhoodInfo DC. 26 Feb. 2010.
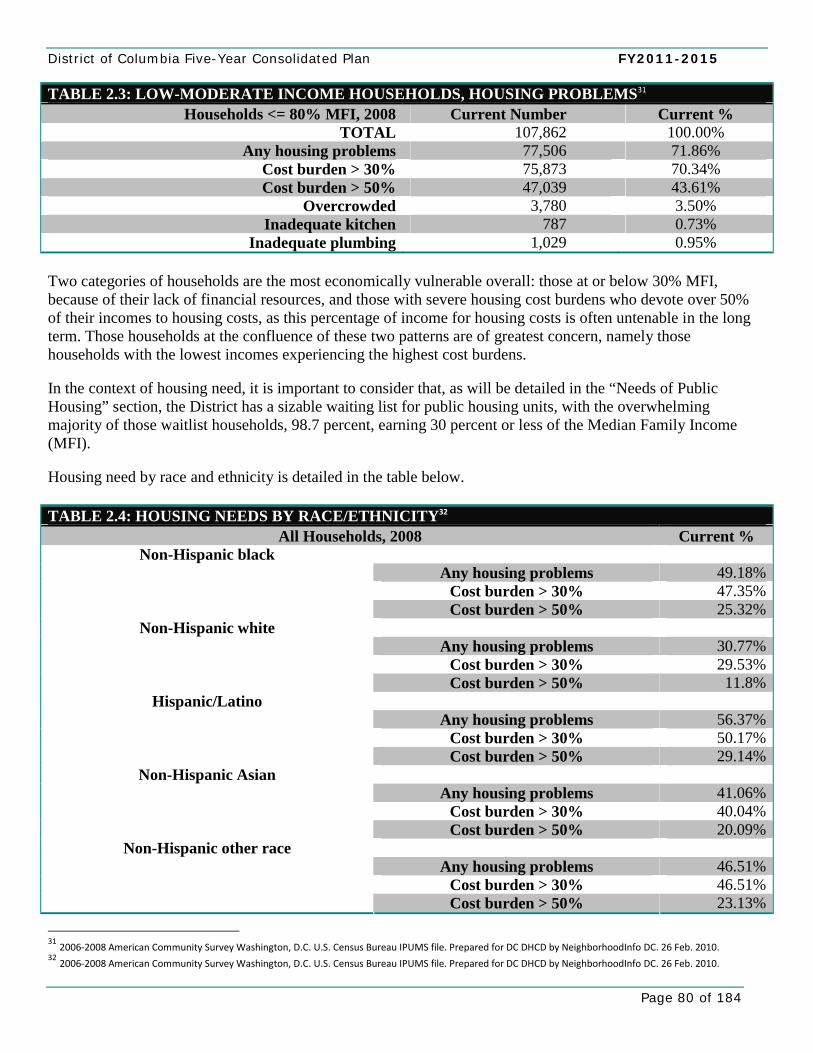
District of Columbia Five-Year Consolidated Plan FY2011-2015
Page 80 of 184
TABLE 2.3: LOW-MODERATE INCOME HOUSEHOLDS, HOUSING PROBLEMS31 Households <= 80% MFI, 2008 Current Number Current %
TOTAL 107,862 100.00% Any housing problems 77,506 71.86%
Cost burden > 30% 75,873 70.34% Cost burden > 50% 47,039 43.61%
Overcrowded 3,780 3.50% Inadequate kitchen 787 0.73%
Inadequate plumbing 1,029 0.95% Two categories of households are the most economically vulnerable overall: those at or below 30% MFI, because of their lack of financial resources, and those with severe housing cost burdens who devote over 50% of their incomes to housing costs, as this percentage of income for housing costs is often untenable in the long term. Those households at the confluence of these two patterns are of greatest concern, namely those households with the lowest incomes experiencing the highest cost burdens. In the context of housing need, it is important to consider that, as will be detailed in the “Needs of Public Housing” section, the District has a sizable waiting list for public housing units, with the overwhelming majority of those waitlist households, 98.7 percent, earning 30 percent or less of the Median Family Income (MFI). Housing need by race and ethnicity is detailed in the table below. TABLE 2.4: HOUSING NEEDS BY RACE/ETHNICITY32
All Households, 2008 Current %
Any housing problems 49.18%Cost burden > 30% 47.35%
Non-Hispanic black
Cost burden > 50% 25.32%
Any housing problems 30.77%Cost burden > 30% 29.53%
Non-Hispanic white
Cost burden > 50% 11.8%
Any housing problems 56.37%Cost burden > 30% 50.17%
Hispanic/Latino
Cost burden > 50% 29.14%
Any housing problems 41.06%Cost burden > 30% 40.04%
Non-Hispanic Asian
Cost burden > 50% 20.09%
Any housing problems 46.51%Cost burden > 30% 46.51%
Non-Hispanic other race
Cost burden > 50% 23.13%
31 2006‐2008 American Community Survey Washington, D.C. U.S. Census Bureau IPUMS file. Prepared for DC DHCD by NeighborhoodInfo DC. 26 Feb. 2010. 32 2006‐2008 American Community Survey Washington, D.C. U.S. Census Bureau IPUMS file. Prepared for DC DHCD by NeighborhoodInfo DC. 26 Feb. 2010.
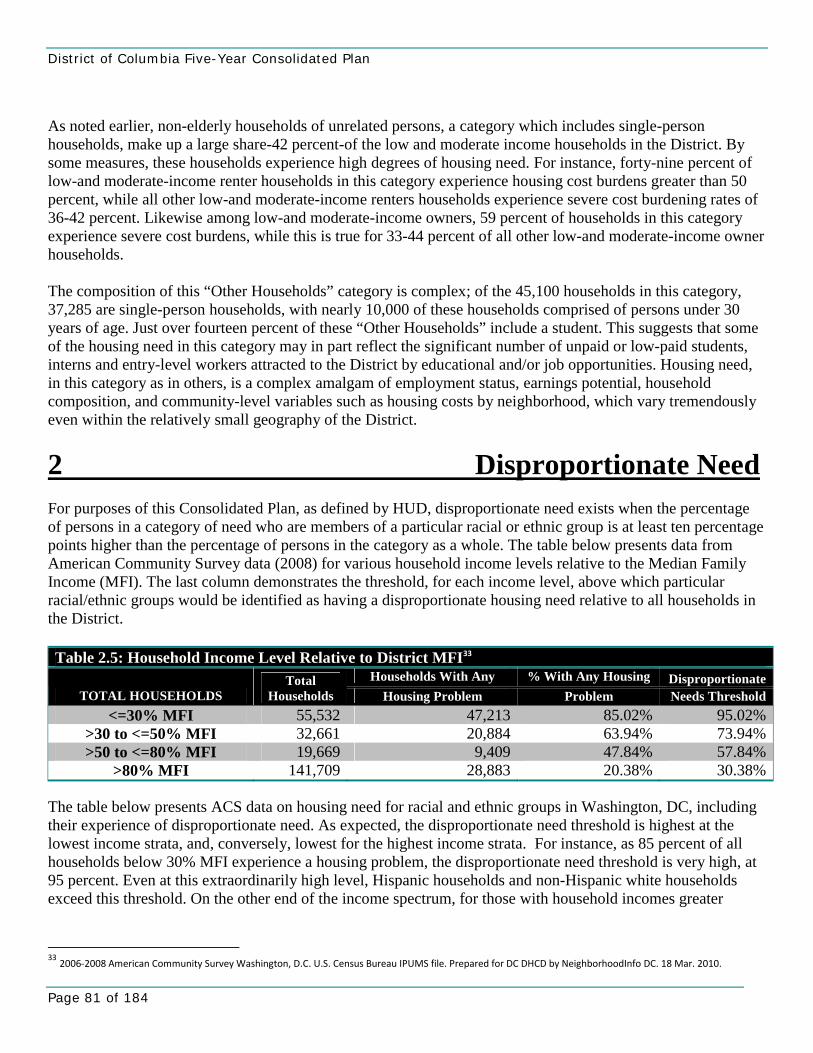
District of Columbia Five-Year Consolidated Plan
Page 81 of 184
As noted earlier, non-elderly households of unrelated persons, a category which includes single-person households, make up a large share-42 percent-of the low and moderate income households in the District. By some measures, these households experience high degrees of housing need. For instance, forty-nine percent of low-and moderate-income renter households in this category experience housing cost burdens greater than 50 percent, while all other low-and moderate-income renters households experience severe cost burdening rates of 36-42 percent. Likewise among low-and moderate-income owners, 59 percent of households in this category experience severe cost burdens, while this is true for 33-44 percent of all other low-and moderate-income owner households. The composition of this “Other Households” category is complex; of the 45,100 households in this category, 37,285 are single-person households, with nearly 10,000 of these households comprised of persons under 30 years of age. Just over fourteen percent of these “Other Households” include a student. This suggests that some of the housing need in this category may in part reflect the significant number of unpaid or low-paid students, interns and entry-level workers attracted to the District by educational and/or job opportunities. Housing need, in this category as in others, is a complex amalgam of employment status, earnings potential, household composition, and community-level variables such as housing costs by neighborhood, which vary tremendously even within the relatively small geography of the District.
2 Disproportionate Need For purposes of this Consolidated Plan, as defined by HUD, disproportionate need exists when the percentage of persons in a category of need who are members of a particular racial or ethnic group is at least ten percentage points higher than the percentage of persons in the category as a whole. The table below presents data from American Community Survey data (2008) for various household income levels relative to the Median Family Income (MFI). The last column demonstrates the threshold, for each income level, above which particular racial/ethnic groups would be identified as having a disproportionate housing need relative to all households in the District. Table 2.5: Household Income Level Relative to District MFI33
Households With Any % With Any Housing Disproportionate TOTAL HOUSEHOLDS
Total Households Housing Problem Problem Needs Threshold
<=30% MFI 55,532 47,213 85.02% 95.02%>30 to <=50% MFI 32,661 20,884 63.94% 73.94%>50 to <=80% MFI 19,669 9,409 47.84% 57.84%
>80% MFI 141,709 28,883 20.38% 30.38% The table below presents ACS data on housing need for racial and ethnic groups in Washington, DC, including their experience of disproportionate need. As expected, the disproportionate need threshold is highest at the lowest income strata, and, conversely, lowest for the highest income strata. For instance, as 85 percent of all households below 30% MFI experience a housing problem, the disproportionate need threshold is very high, at 95 percent. Even at this extraordinarily high level, Hispanic households and non-Hispanic white households exceed this threshold. On the other end of the income spectrum, for those with household incomes greater
33 2006‐2008 American Community Survey Washington, D.C. U.S. Census Bureau IPUMS file. Prepared for DC DHCD by NeighborhoodInfo DC. 18 Mar. 2010.
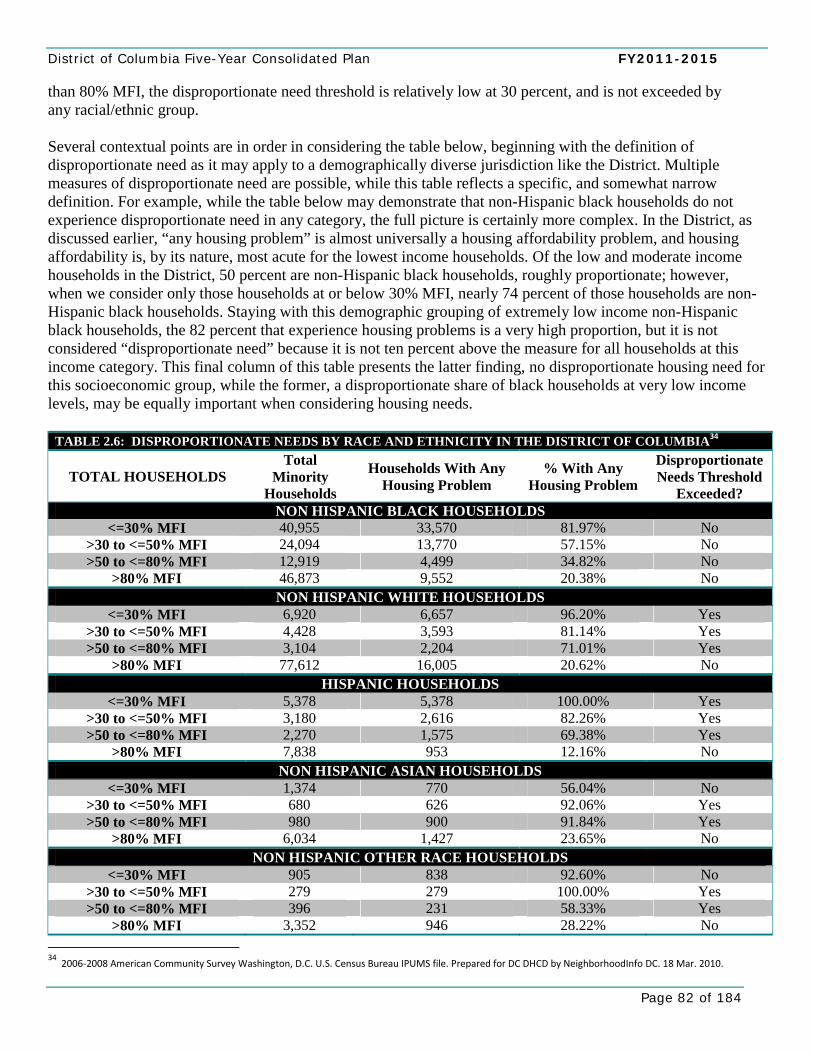
District of Columbia Five-Year Consolidated Plan FY2011-2015
Page 82 of 184
than 80% MFI, the disproportionate need threshold is relatively low at 30 percent, and is not exceeded by any racial/ethnic group. Several contextual points are in order in considering the table below, beginning with the definition of disproportionate need as it may apply to a demographically diverse jurisdiction like the District. Multiple measures of disproportionate need are possible, while this table reflects a specific, and somewhat narrow definition. For example, while the table below may demonstrate that non-Hispanic black households do not experience disproportionate need in any category, the full picture is certainly more complex. In the District, as discussed earlier, “any housing problem” is almost universally a housing affordability problem, and housing affordability is, by its nature, most acute for the lowest income households. Of the low and moderate income households in the District, 50 percent are non-Hispanic black households, roughly proportionate; however, when we consider only those households at or below 30% MFI, nearly 74 percent of those households are non-Hispanic black households. Staying with this demographic grouping of extremely low income non-Hispanic black households, the 82 percent that experience housing problems is a very high proportion, but it is not considered “disproportionate need” because it is not ten percent above the measure for all households at this income category. This final column of this table presents the latter finding, no disproportionate housing need for this socioeconomic group, while the former, a disproportionate share of black households at very low income levels, may be equally important when considering housing needs.
TABLE 2.6: DISPROPORTIONATE NEEDS BY RACE AND ETHNICITY IN THE DISTRICT OF COLUMBIA34
TOTAL HOUSEHOLDS Total
Minority Households
Households With Any Housing Problem
% With Any Housing Problem
Disproportionate Needs Threshold
Exceeded? NON HISPANIC BLACK HOUSEHOLDS
<=30% MFI 40,955 33,570 81.97% No >30 to <=50% MFI 24,094 13,770 57.15% No >50 to <=80% MFI 12,919 4,499 34.82% No
>80% MFI 46,873 9,552 20.38% No NON HISPANIC WHITE HOUSEHOLDS
<=30% MFI 6,920 6,657 96.20% Yes >30 to <=50% MFI 4,428 3,593 81.14% Yes >50 to <=80% MFI 3,104 2,204 71.01% Yes
>80% MFI 77,612 16,005 20.62% No HISPANIC HOUSEHOLDS
<=30% MFI 5,378 5,378 100.00% Yes >30 to <=50% MFI 3,180 2,616 82.26% Yes >50 to <=80% MFI 2,270 1,575 69.38% Yes
>80% MFI 7,838 953 12.16% No NON HISPANIC ASIAN HOUSEHOLDS
<=30% MFI 1,374 770 56.04% No >30 to <=50% MFI 680 626 92.06% Yes >50 to <=80% MFI 980 900 91.84% Yes
>80% MFI 6,034 1,427 23.65% No NON HISPANIC OTHER RACE HOUSEHOLDS
<=30% MFI 905 838 92.60% No >30 to <=50% MFI 279 279 100.00% Yes >50 to <=80% MFI 396 231 58.33% Yes
>80% MFI 3,352 946 28.22% No 34 2006‐2008 American Community Survey Washington, D.C. U.S. Census Bureau IPUMS file. Prepared for DC DHCD by NeighborhoodInfo DC. 18 Mar. 2010.

District of Columbia Five-Year Consolidated Plan
Page 83 of 184
Based on this analysis, a number of racial/ethnic groups experience disproportionate need across income strata. For instance, Hispanic households experience disproportionate need at every income band below 80% MFI. Non-Hispanic Asian households experience disproportionate need in income bands between 30 and 80% of MFI, as do non-Hispanic other race households, i.e. Native American, Pacific Islander, multiple race households and self-defined “other” race households. Fully understanding and addressing disproportionate need is an important goal during the Comprehensive Plan period. During the ongoing process of community consultation for the analysis of impediments to fair housing, DHCD will seek particular input from stakeholders representing communities with disproportionate need. In addition to household level resource constraints, particularly acute in the <30% MFI income category, disproportionate need may result from multiple causes, all of which are important to comprehend to ensure the correct outreach and programming to reach these households.
District of Columbia Five-Year Consolidated Plan FY2011-2015
Page 84 of 184
Priority Housing Needs (91.215 (b)) 1. Identify the priority housing needs and activities in accordance with the categories
specified in the Housing Needs Table (formerly Table 2A). These categories correspond with special tabulations of U.S. census data provided by HUD for the preparation of the Consolidated Plan.
2. Provide an analysis of how the characteristics of the housing market and the severity of housing problems and needs of each category of residents provided the basis for determining the relative priority of each priority housing need category. [Note: Family and income types may be grouped in the case of closely related categories of residents where the analysis would apply to more than one family or income type.]
3. Describe the basis for assigning the priority given to each category of priority needs. 4. Identify any obstacles to meeting underserved needs. 3-5 Year Strategic Plan Priority Housing Needs response:
District of Columbia Five-Year Consolidated Plan
Page 85 of 184
1 Priority Housing Needs In addition to the extensive community participation described elsewhere in this document, the Department of Housing and Community Development (DHCD) reviewed numerous data sources as part of its efforts to determine priority needs for the community. These sources include federal housing and demographic data such as the American Community Survey, studies of the DC housing, labor and financial markets by the Greater Washington Council of Governments (COG), Fannie Mae, Freddie Mac, the Urban Institute, Brookings Institution, the DC Fiscal Policy Institute, the DC Office of Planning (OP), and other regional and local research organizations. As the lead agency for low-to-moderate housing opportunities in the District of Columbia, DHCD has confirmed through its consultation and analysis that its focus over the coming years should remain on supporting low-moderate income residents with:
• the preservation, rehabilitation and production of affordable housing, • incentives to include development of housing for very-low to moderate-income residents; for the
homeless; and for special needs populations; • promoting homeownership opportunities, and • supporting neighborhood commercial and economic revitalization.
In the District of Columbia, given external constraints on revenue generation and on the availability of land for continued growth, housing development and the retention and attraction of tax-paying residents is part of the District’s strategy for economic development. Stabilizing neighborhood housing is combined with DHCD’s support for retention and growth of neighborhood businesses as a source of local jobs, economic opportunity and neighborhood vitality. Particularly for that segment of the population without advanced education and facing high housing prices, DHCD’s focus on neighborhood-level economic opportunity combined with retention of affordable housing will assist our more vulnerable populations. A table detailing housing need by income, tenure and housing type is provided in the following section, “Community Priorities”.
2 Community Priorities In the community hearings, focus groups and meetings (Appendix E) held in preparing the Consolidated Plan, government, non-profit and community representatives overwhelmingly supported expansion of affordable housing opportunities as the number one priority for DHCD over the Five-Year Plan period. Community representatives stressed the need for continued homeownership assistance programs, for affordable housing for persons with special needs, particularly persons living with HIV/AIDS, and for foreclosure prevention and mitigation assistance. The priorities identified in the Needs Table reflect DHCD’s assessment of the housing market, the relative acuity of the needs of residents, and specific identified objectives, including ending homelessness in the District, and continuing to promote homeownership in the city.
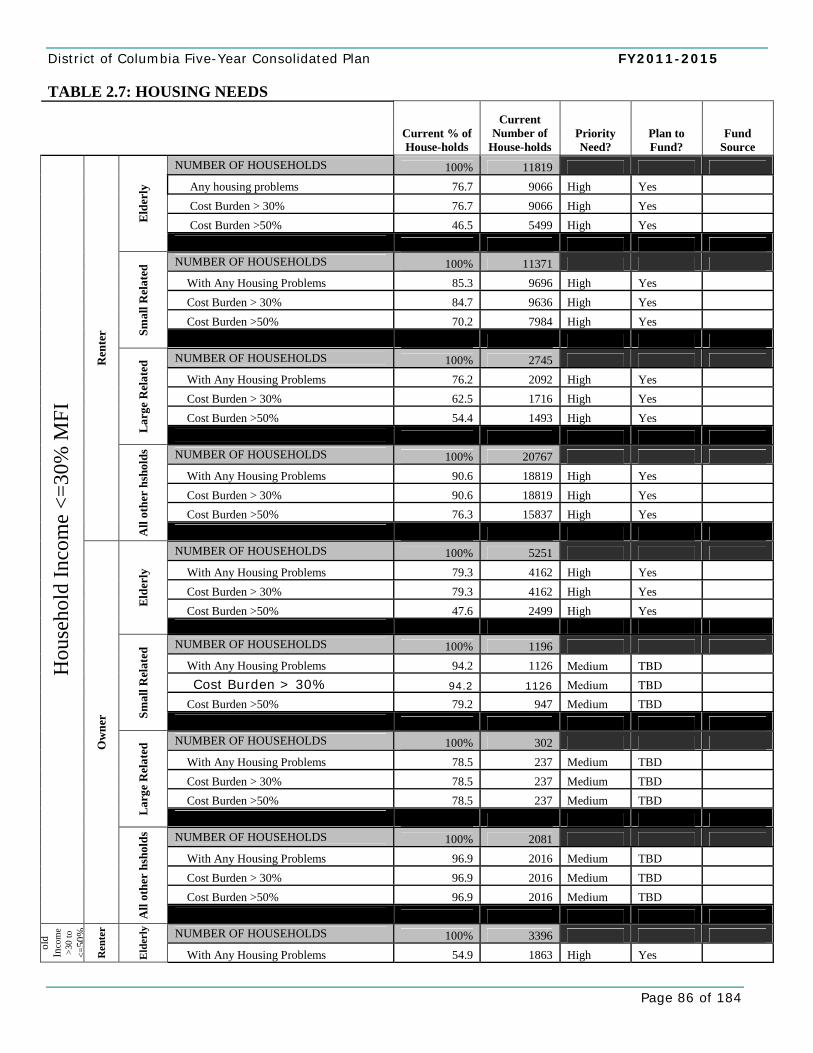
District of Columbia Five-Year Consolidated Plan FY2011-2015
Page 86 of 184
TABLE 2.7: HOUSING NEEDS
Current % of House-holds
Current Number of
House-holds Priority Need?
Plan to Fund?
Fund Source
NUMBER OF HOUSEHOLDS 100% 11819 Any housing problems 76.7 9066 High Yes Cost Burden > 30% 76.7 9066 High Yes Cost Burden >50% 46.5 5499 High Yes E
lder
ly
NUMBER OF HOUSEHOLDS 100% 11371 With Any Housing Problems 85.3 9696 High Yes Cost Burden > 30% 84.7 9636 High Yes Cost Burden >50% 70.2 7984 High Yes
Smal
l Rel
ated
NUMBER OF HOUSEHOLDS 100% 2745 With Any Housing Problems 76.2 2092 High Yes Cost Burden > 30% 62.5 1716 High Yes Cost Burden >50% 54.4 1493 High Yes
Lar
ge R
elat
ed
NUMBER OF HOUSEHOLDS 100% 20767 With Any Housing Problems 90.6 18819 High Yes Cost Burden > 30% 90.6 18819 High Yes Cost Burden >50% 76.3 15837 High Yes
Ren
ter
All
othe
r hs
hold
s
NUMBER OF HOUSEHOLDS 100% 5251 With Any Housing Problems 79.3 4162 High Yes Cost Burden > 30% 79.3 4162 High Yes Cost Burden >50% 47.6 2499 High Yes
Eld
erly
NUMBER OF HOUSEHOLDS 100% 1196 With Any Housing Problems 94.2 1126 Medium TBD Cost Burden > 30% 94.2 1126 Medium TBD
Cost Burden >50% 79.2 947 Medium TBD
Smal
l Rel
ated
NUMBER OF HOUSEHOLDS 100% 302 With Any Housing Problems 78.5 237 Medium TBD Cost Burden > 30% 78.5 237 Medium TBD Cost Burden >50% 78.5 237 Medium TBD
Lar
ge R
elat
ed
NUMBER OF HOUSEHOLDS 100% 2081 With Any Housing Problems 96.9 2016 Medium TBD Cost Burden > 30% 96.9 2016 Medium TBD Cost Burden >50% 96.9 2016 Medium TBD
Hou
seho
ld In
com
e <=
30%
MFI
Ow
ner
All
othe
r hs
hold
s
NUMBER OF HOUSEHOLDS 100% 3396
old
Inco
me
>30
to
<=50
%
Ren
ter
Eld
erly
With Any Housing Problems 54.9 1863 High Yes
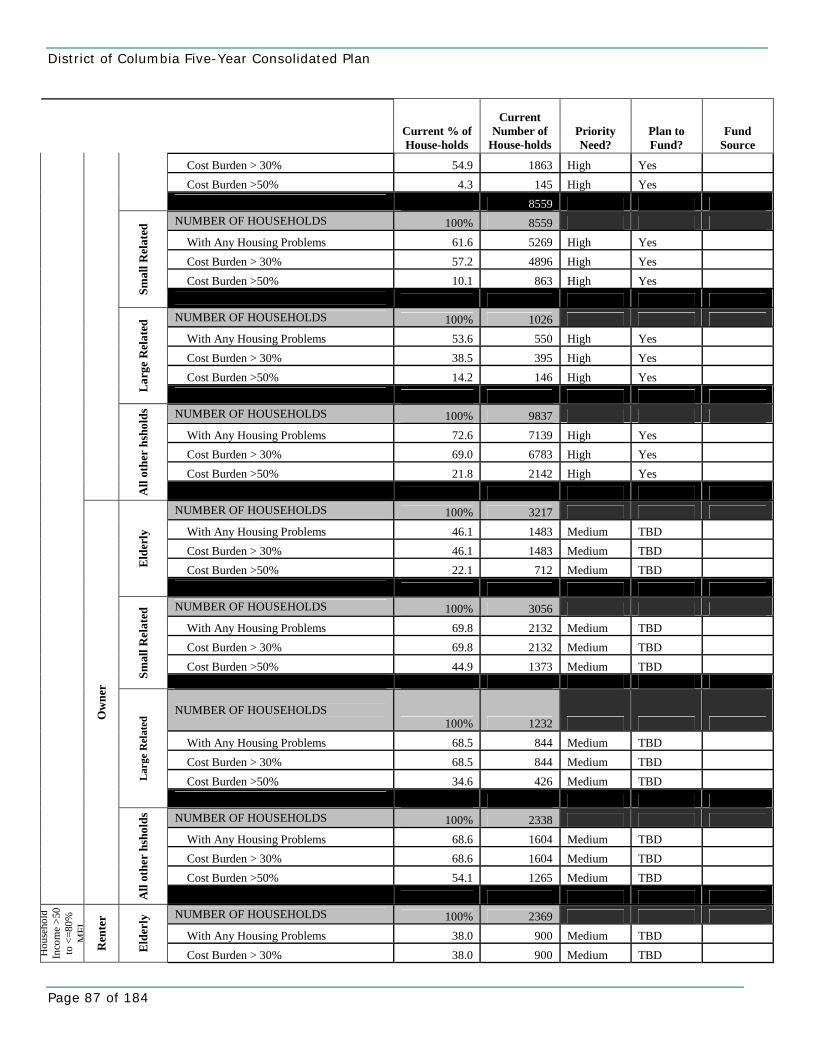
District of Columbia Five-Year Consolidated Plan
Page 87 of 184
Current % of House-holds
Current Number of
House-holds Priority Need?
Plan to Fund?
Fund Source
Cost Burden > 30% 54.9 1863 High Yes Cost Burden >50% 4.3 145 High Yes 8559 NUMBER OF HOUSEHOLDS 100% 8559 With Any Housing Problems 61.6 5269 High Yes Cost Burden > 30% 57.2 4896 High Yes Cost Burden >50% 10.1 863 High Yes
Smal
l Rel
ated
NUMBER OF HOUSEHOLDS 100% 1026 With Any Housing Problems 53.6 550 High Yes Cost Burden > 30% 38.5 395 High Yes Cost Burden >50% 14.2 146 High Yes
Lar
ge R
elat
ed
NUMBER OF HOUSEHOLDS 100% 9837 With Any Housing Problems 72.6 7139 High Yes Cost Burden > 30% 69.0 6783 High Yes Cost Burden >50% 21.8 2142 High Yes
All
othe
r hs
hold
s
NUMBER OF HOUSEHOLDS 100% 3217 With Any Housing Problems 46.1 1483 Medium TBD Cost Burden > 30% 46.1 1483 Medium TBD Cost Burden >50% 22.1 712 Medium TBD E
lder
ly
NUMBER OF HOUSEHOLDS 100% 3056 With Any Housing Problems 69.8 2132 Medium TBD Cost Burden > 30% 69.8 2132 Medium TBD Cost Burden >50% 44.9 1373 Medium TBD
Smal
l Rel
ated
NUMBER OF HOUSEHOLDS 100% 1232
With Any Housing Problems 68.5 844 Medium TBD Cost Burden > 30% 68.5 844 Medium TBD Cost Burden >50% 34.6 426 Medium TBD L
arge
Rel
ated
NUMBER OF HOUSEHOLDS 100% 2338 With Any Housing Problems 68.6 1604 Medium TBD Cost Burden > 30% 68.6 1604 Medium TBD Cost Burden >50% 54.1 1265 Medium TBD
Ow
ner
All
othe
r hs
hold
s
NUMBER OF HOUSEHOLDS 100% 2369 With Any Housing Problems 38.0 900 Medium TBD
Hou
seho
ld
Inco
me
>50
to <
=80%
M
FI
Ren
ter
Eld
erly
Cost Burden > 30% 38.0 900 Medium TBD
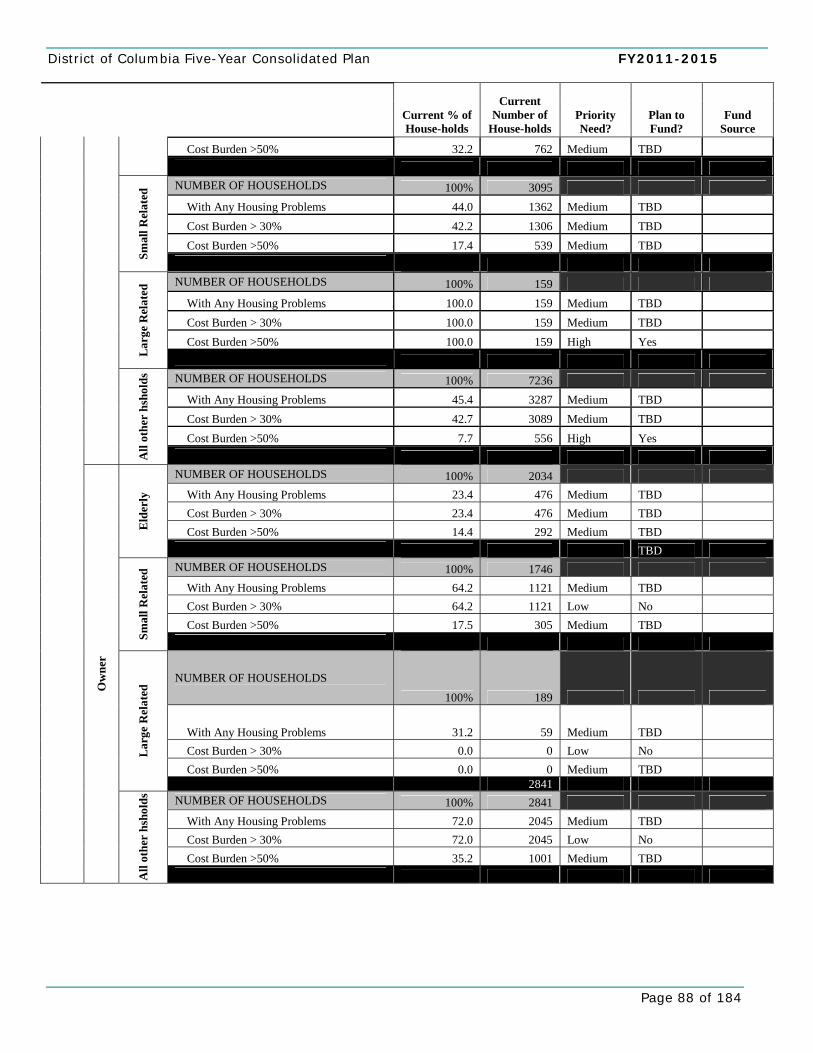
District of Columbia Five-Year Consolidated Plan FY2011-2015
Page 88 of 184
Current % of House-holds
Current Number of
House-holds Priority Need?
Plan to Fund?
Fund Source
Cost Burden >50% 32.2 762 Medium TBD NUMBER OF HOUSEHOLDS 100% 3095 With Any Housing Problems 44.0 1362 Medium TBD Cost Burden > 30% 42.2 1306 Medium TBD Cost Burden >50% 17.4 539 Medium TBD
Smal
l Rel
ated
NUMBER OF HOUSEHOLDS 100% 159 With Any Housing Problems 100.0 159 Medium TBD Cost Burden > 30% 100.0 159 Medium TBD Cost Burden >50% 100.0 159 High Yes
Lar
ge R
elat
ed
NUMBER OF HOUSEHOLDS 100% 7236 With Any Housing Problems 45.4 3287 Medium TBD Cost Burden > 30% 42.7 3089 Medium TBD Cost Burden >50% 7.7 556 High Yes
All
othe
r hs
hold
s
NUMBER OF HOUSEHOLDS 100% 2034 With Any Housing Problems 23.4 476 Medium TBD Cost Burden > 30% 23.4 476 Medium TBD Cost Burden >50% 14.4 292 Medium TBD E
lder
ly
TBD NUMBER OF HOUSEHOLDS 100% 1746 With Any Housing Problems 64.2 1121 Medium TBD Cost Burden > 30% 64.2 1121 Low No Cost Burden >50% 17.5 305 Medium TBD
Smal
l Rel
ated
NUMBER OF HOUSEHOLDS
100% 189
With Any Housing Problems 31.2 59 Medium TBD Cost Burden > 30% 0.0 0 Low No Cost Burden >50% 0.0 0 Medium TBD
Lar
ge R
elat
ed
2841 NUMBER OF HOUSEHOLDS 100% 2841 With Any Housing Problems 72.0 2045 Medium TBD Cost Burden > 30% 72.0 2045 Low No Cost Burden >50% 35.2 1001 Medium TBD
Ow
ner
All
othe
r hs
hold
s
District of Columbia Five-Year Consolidated Plan
Page 89 of 184
3 Basis for Assigning Priority Please refer to the questions two, “Geographic Priority” and three, “Bases for Allocation of Funding” in the “General Questions” section earlier in the Consolidated Plan.
4 Obstacles to Meeting Underserved Needs Please refer to the question three, “Obstacles to Meeting Underserved Needs” in the “General Questions” section earlier in the Consolidated Plan.
District of Columbia Five-Year Consolidated Plan FY2011-2015
Page 90 of 184
Housing Market Analysis (91.210) 1. Based on information available to the jurisdiction, describe the significant
characteristics of the housing market in terms of supply, demand, condition, and the cost of housing; the housing stock available to serve persons with disabilities; and to serve persons with HIV/AIDS and their families. Data on the housing market should include, to the extent information is available, an estimate of the number of vacant or abandoned buildings and whether units in these buildings are suitable for rehabilitation.
2. Describe the number and targeting (income level and type of household served) of
units currently assisted by local, state, or federally funded programs, and an assessment of whether any such units are expected to be lost from the assisted housing inventory for any reason, (i.e. expiration of Section 8 contracts).
3. Indicate how the characteristics of the housing market will influence the use of
funds made available for rental assistance, production of new units, rehabilitation of old units, or acquisition of existing units. Please note, the goal of affordable housing is not met by beds in nursing homes.
3-5 Year Strategic Plan Housing Market Analysis responses:
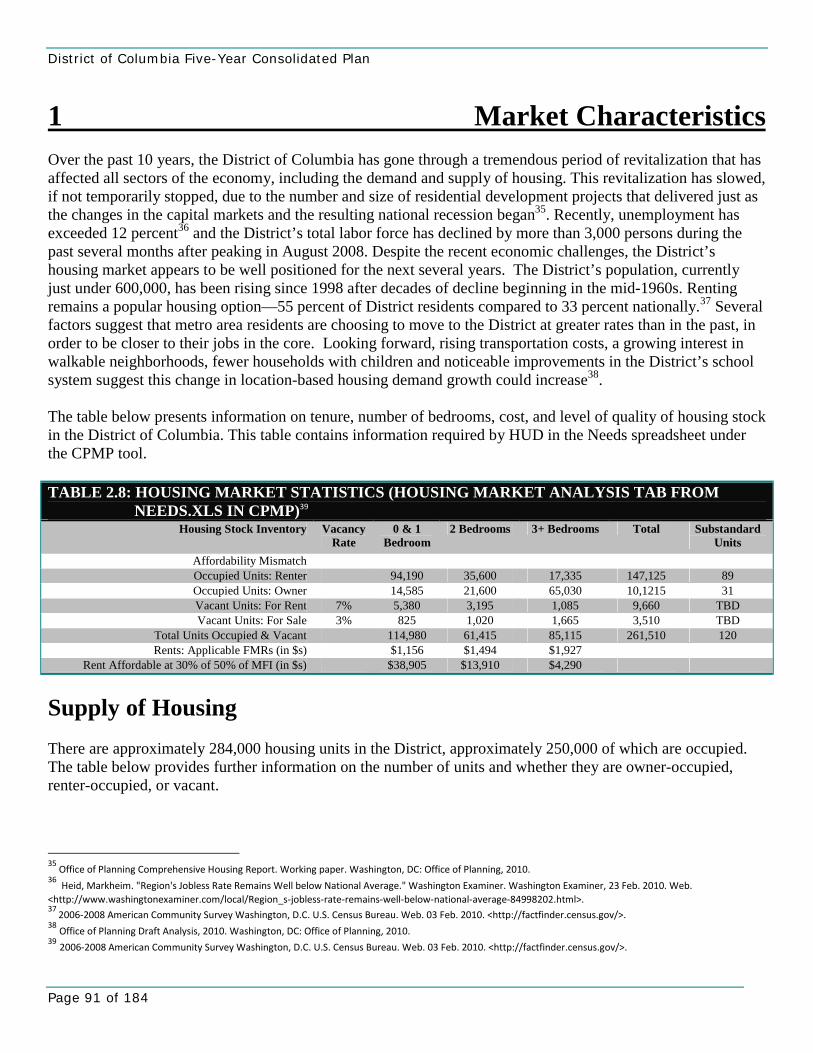
District of Columbia Five-Year Consolidated Plan
Page 91 of 184
1 Market Characteristics Over the past 10 years, the District of Columbia has gone through a tremendous period of revitalization that has affected all sectors of the economy, including the demand and supply of housing. This revitalization has slowed, if not temporarily stopped, due to the number and size of residential development projects that delivered just as the changes in the capital markets and the resulting national recession began35. Recently, unemployment has exceeded 12 percent36 and the District’s total labor force has declined by more than 3,000 persons during the past several months after peaking in August 2008. Despite the recent economic challenges, the District’s housing market appears to be well positioned for the next several years. The District’s population, currently just under 600,000, has been rising since 1998 after decades of decline beginning in the mid-1960s. Renting remains a popular housing option—55 percent of District residents compared to 33 percent nationally.37 Several factors suggest that metro area residents are choosing to move to the District at greater rates than in the past, in order to be closer to their jobs in the core. Looking forward, rising transportation costs, a growing interest in walkable neighborhoods, fewer households with children and noticeable improvements in the District’s school system suggest this change in location-based housing demand growth could increase38. The table below presents information on tenure, number of bedrooms, cost, and level of quality of housing stock in the District of Columbia. This table contains information required by HUD in the Needs spreadsheet under the CPMP tool. TABLE 2.8: HOUSING MARKET STATISTICS (HOUSING MARKET ANALYSIS TAB FROM
NEEDS.XLS IN CPMP)39 Housing Stock Inventory Vacancy
Rate 0 & 1
Bedroom 2 Bedrooms 3+ Bedrooms Total Substandard
Units Affordability Mismatch Occupied Units: Renter 94,190 35,600 17,335 147,125 89 Occupied Units: Owner 14,585 21,600 65,030 10,1215 31 Vacant Units: For Rent 7% 5,380 3,195 1,085 9,660 TBD Vacant Units: For Sale 3% 825 1,020 1,665 3,510 TBD
Total Units Occupied & Vacant 114,980 61,415 85,115 261,510 120 Rents: Applicable FMRs (in $s) $1,156 $1,494 $1,927
Rent Affordable at 30% of 50% of MFI (in $s) $38,905 $13,910 $4,290
Supply of Housing There are approximately 284,000 housing units in the District, approximately 250,000 of which are occupied. The table below provides further information on the number of units and whether they are owner-occupied, renter-occupied, or vacant.
35
Office of Planning Comprehensive Housing Report. Working paper. Washington, DC: Office of Planning, 2010. 36 Heid, Markheim. "Region's Jobless Rate Remains Well below National Average." Washington Examiner. Washington Examiner, 23 Feb. 2010. Web. <http://www.washingtonexaminer.com/local/Region_s‐jobless‐rate‐remains‐well‐below‐national‐average‐84998202.html>. 37 2006‐2008 American Community Survey Washington, D.C. U.S. Census Bureau. Web. 03 Feb. 2010. <http://factfinder.census.gov/>.
38 Office of Planning Draft Analysis, 2010. Washington, DC: Office of Planning, 2010.
39 2006‐2008 American Community Survey Washington, D.C. U.S. Census Bureau. Web. 03 Feb. 2010. <http://factfinder.census.gov/>.
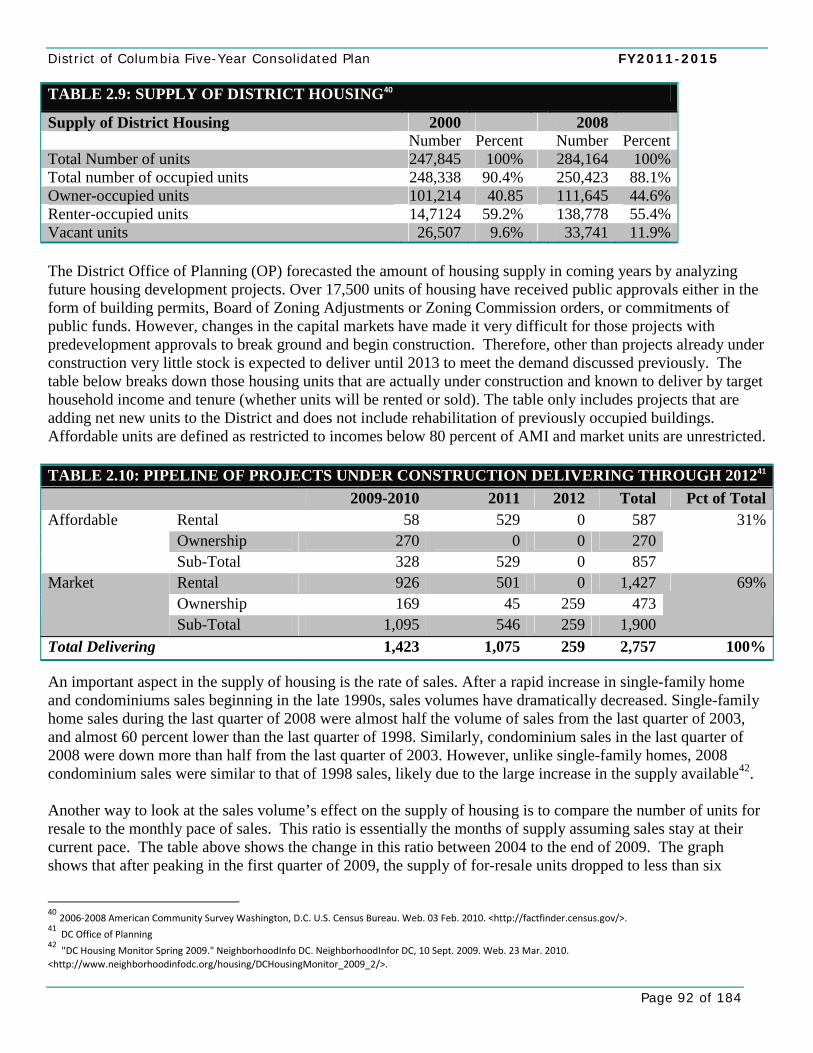
District of Columbia Five-Year Consolidated Plan FY2011-2015
Page 92 of 184
TABLE 2.9: SUPPLY OF DISTRICT HOUSING40
Supply of District Housing 2000 2008 Number Percent Number PercentTotal Number of units 247,845 100% 284,164 100%Total number of occupied units 248,338 90.4% 250,423 88.1%Owner-occupied units 101,214 40.85 111,645 44.6%Renter-occupied units 14,7124 59.2% 138,778 55.4%Vacant units 26,507 9.6% 33,741 11.9% The District Office of Planning (OP) forecasted the amount of housing supply in coming years by analyzing future housing development projects. Over 17,500 units of housing have received public approvals either in the form of building permits, Board of Zoning Adjustments or Zoning Commission orders, or commitments of public funds. However, changes in the capital markets have made it very difficult for those projects with predevelopment approvals to break ground and begin construction. Therefore, other than projects already under construction very little stock is expected to deliver until 2013 to meet the demand discussed previously. The table below breaks down those housing units that are actually under construction and known to deliver by target household income and tenure (whether units will be rented or sold). The table only includes projects that are adding net new units to the District and does not include rehabilitation of previously occupied buildings. Affordable units are defined as restricted to incomes below 80 percent of AMI and market units are unrestricted. TABLE 2.10: PIPELINE OF PROJECTS UNDER CONSTRUCTION DELIVERING THROUGH 201241
2009-2010 2011 2012 Total Pct of TotalRental 58 529 0 587Ownership 270 0 0 270
Affordable
Sub-Total 328 529 0 857
31%
Rental 926 501 0 1,427Ownership 169 45 259 473
Market
Sub-Total 1,095 546 259 1,900
69%
Total Delivering 1,423 1,075 259 2,757 100%
An important aspect in the supply of housing is the rate of sales. After a rapid increase in single-family home and condominiums sales beginning in the late 1990s, sales volumes have dramatically decreased. Single-family home sales during the last quarter of 2008 were almost half the volume of sales from the last quarter of 2003, and almost 60 percent lower than the last quarter of 1998. Similarly, condominium sales in the last quarter of 2008 were down more than half from the last quarter of 2003. However, unlike single-family homes, 2008 condominium sales were similar to that of 1998 sales, likely due to the large increase in the supply available42. Another way to look at the sales volume’s effect on the supply of housing is to compare the number of units for resale to the monthly pace of sales. This ratio is essentially the months of supply assuming sales stay at their current pace. The table above shows the change in this ratio between 2004 to the end of 2009. The graph shows that after peaking in the first quarter of 2009, the supply of for-resale units dropped to less than six
40 2006‐2008 American Community Survey Washington, D.C. U.S. Census Bureau. Web. 03 Feb. 2010. <http://factfinder.census.gov/>. 41 DC Office of Planning 42 "DC Housing Monitor Spring 2009." NeighborhoodInfo DC. NeighborhoodInfor DC, 10 Sept. 2009. Web. 23 Mar. 2010. <http://www.neighborhoodinfodc.org/housing/DCHousingMonitor_2009_2/>.
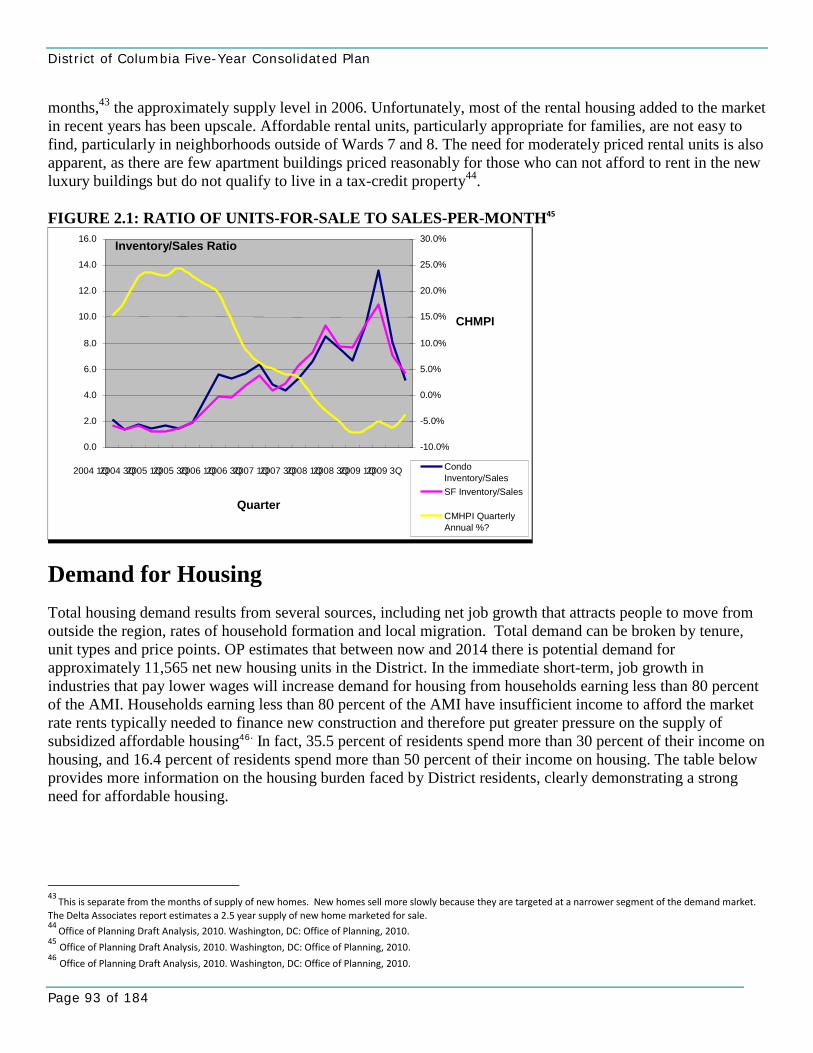
District of Columbia Five-Year Consolidated Plan
Page 93 of 184
months,43 the approximately supply level in 2006. Unfortunately, most of the rental housing added to the market in recent years has been upscale. Affordable rental units, particularly appropriate for families, are not easy to find, particularly in neighborhoods outside of Wards 7 and 8. The need for moderately priced rental units is also apparent, as there are few apartment buildings priced reasonably for those who can not afford to rent in the new luxury buildings but do not qualify to live in a tax-credit property44. FIGURE 2.1: RATIO OF UNITS-FOR-SALE TO SALES-PER-MONTH45
Demand for Housing Total housing demand results from several sources, including net job growth that attracts people to move from outside the region, rates of household formation and local migration. Total demand can be broken by tenure, unit types and price points. OP estimates that between now and 2014 there is potential demand for approximately 11,565 net new housing units in the District. In the immediate short-term, job growth in industries that pay lower wages will increase demand for housing from households earning less than 80 percent of the AMI. Households earning less than 80 percent of the AMI have insufficient income to afford the market rate rents typically needed to finance new construction and therefore put greater pressure on the supply of subsidized affordable housing46. In fact, 35.5 percent of residents spend more than 30 percent of their income on housing, and 16.4 percent of residents spend more than 50 percent of their income on housing. The table below provides more information on the housing burden faced by District residents, clearly demonstrating a strong need for affordable housing.
43 This is separate from the months of supply of new homes. New homes sell more slowly because they are targeted at a narrower segment of the demand market.
The Delta Associates report estimates a 2.5 year supply of new home marketed for sale.
44 Office of Planning Draft Analysis, 2010. Washington, DC: Office of Planning, 2010.
45 Office of Planning Draft Analysis, 2010. Washington, DC: Office of Planning, 2010. 46 Office of Planning Draft Analysis, 2010. Washington, DC: Office of Planning, 2010.
0.0
2.0
4.0
6.0
8.0
10.0
12.0
14.0
16.0
2004 1Q 2004 3Q 2005 1Q 2005 3Q 2006 1Q 2006 3Q 2007 1Q 2007 3Q 2008 1Q 2008 3Q 2009 1Q 2009 3Q
Quarter
Inventory/Sales Ratio
-10.0%
-5.0%
0.0%
5.0%
10.0%
15.0%
20.0%
25.0%
30.0%
CHMPI
Condo Inventory/Sales SF Inventory/Sales
CMHPI Quarterly Annual %?
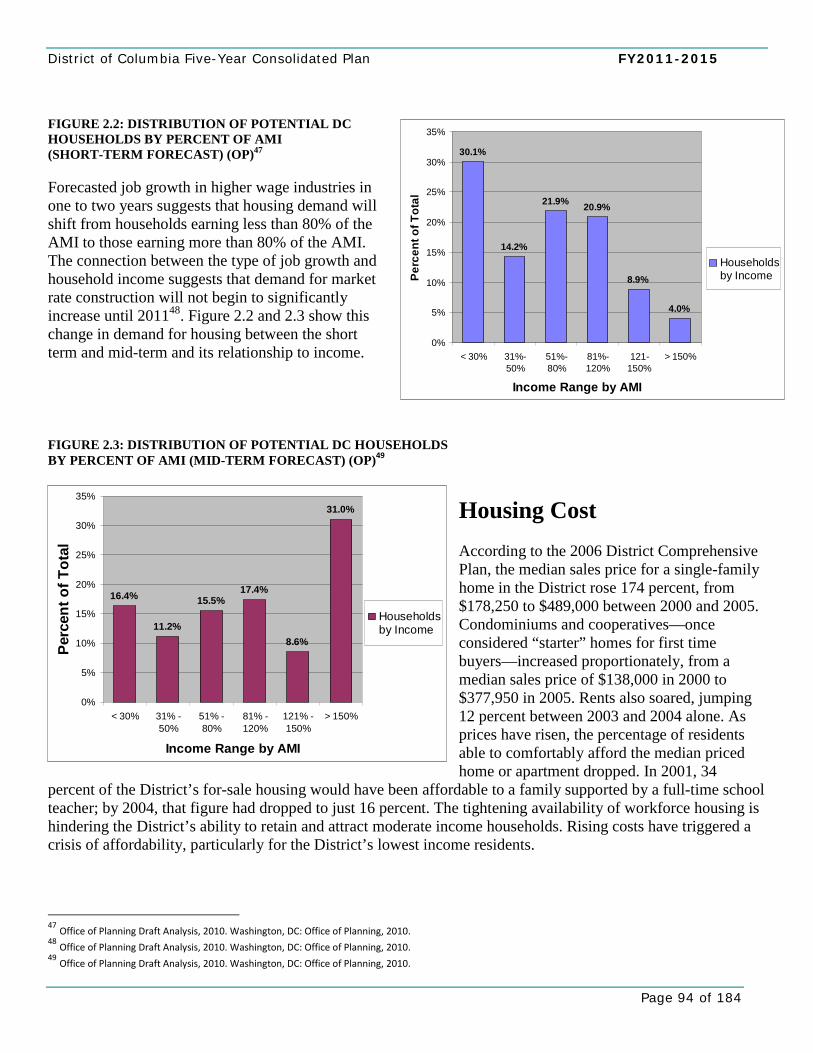
District of Columbia Five-Year Consolidated Plan FY2011-2015
Page 94 of 184
FIGURE 2.2: DISTRIBUTION OF POTENTIAL DC HOUSEHOLDS BY PERCENT OF AMI (SHORT-TERM FORECAST) (OP)47 Forecasted job growth in higher wage industries in one to two years suggests that housing demand will shift from households earning less than 80% of the AMI to those earning more than 80% of the AMI. The connection between the type of job growth and household income suggests that demand for market rate construction will not begin to significantly increase until 201148. Figure 2.2 and 2.3 show this change in demand for housing between the short term and mid-term and its relationship to income. FIGURE 2.3: DISTRIBUTION OF POTENTIAL DC HOUSEHOLDS BY PERCENT OF AMI (MID-TERM FORECAST) (OP)49
Housing Cost According to the 2006 District Comprehensive Plan, the median sales price for a single-family home in the District rose 174 percent, from $178,250 to $489,000 between 2000 and 2005. Condominiums and cooperatives—once considered “starter” homes for first time buyers—increased proportionately, from a median sales price of $138,000 in 2000 to $377,950 in 2005. Rents also soared, jumping 12 percent between 2003 and 2004 alone. As prices have risen, the percentage of residents able to comfortably afford the median priced home or apartment dropped. In 2001, 34
percent of the District’s for-sale housing would have been affordable to a family supported by a full-time school teacher; by 2004, that figure had dropped to just 16 percent. The tightening availability of workforce housing is hindering the District’s ability to retain and attract moderate income households. Rising costs have triggered a crisis of affordability, particularly for the District’s lowest income residents.
47 Office of Planning Draft Analysis, 2010. Washington, DC: Office of Planning, 2010. 48 Office of Planning Draft Analysis, 2010. Washington, DC: Office of Planning, 2010. 49 Office of Planning Draft Analysis, 2010. Washington, DC: Office of Planning, 2010.
30.1%
14.2%
21.9% 20.9%
8.9%
4.0%
0%
5%
10%
15%
20%
25%
30%
35%
< 30% 31%-50%
51%-80%
81%-120%
121-150%
> 150%
Income Range by AMI
Perc
ent o
f Tot
al
Householdsby Income
16.4%
11.2%
15.5%17.4%
8.6%
31.0%
0%
5%
10%
15%
20%
25%
30%
35%
< 30% 31% -50%
51% -80%
81% -120%
121% -150%
> 150%
Income Range by AMI
Perc
ent o
f Tot
al
Householdsby Income
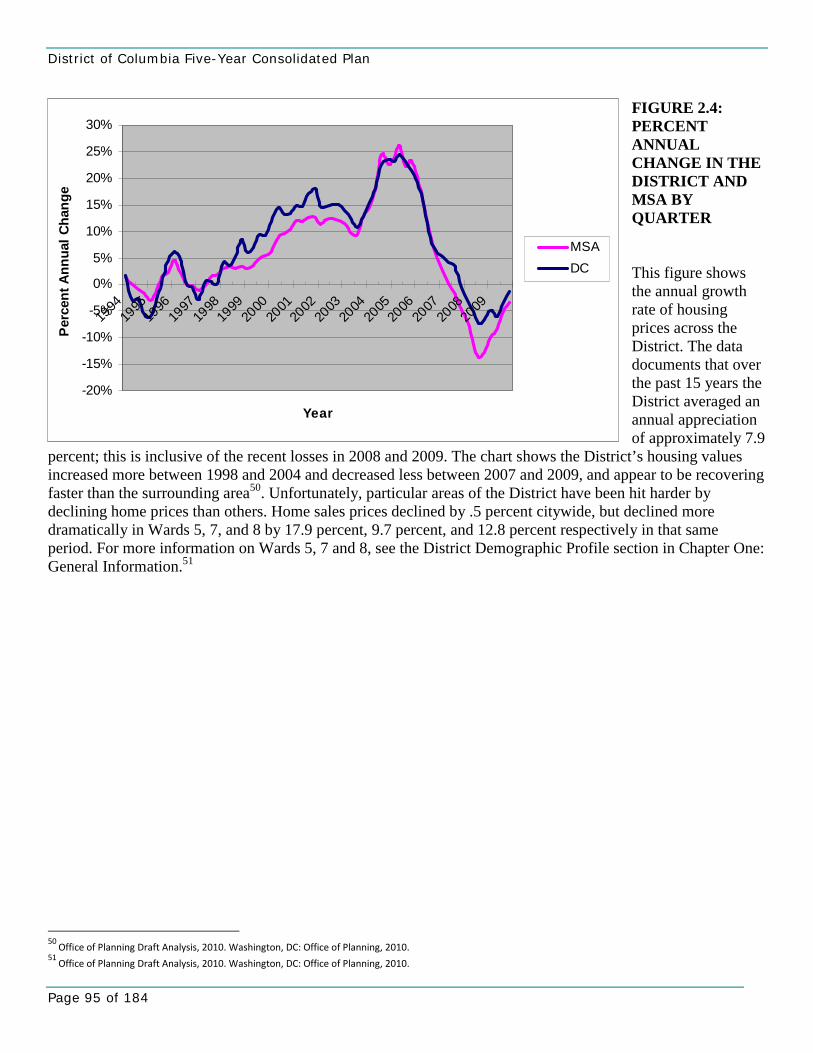
District of Columbia Five-Year Consolidated Plan
Page 95 of 184
-20%
-15%
-10%
-5%
0%
5%
10%
15%
20%
25%
30%
1994
1995
1996
1997
1998
1999
2000
2001
2002
2003
2004
2005
2006
2007
2008
2009
Year
Per
cent
Ann
ual C
hang
e
MSADC
FIGURE 2.4: PERCENT ANNUAL CHANGE IN THE DISTRICT AND MSA BY QUARTER This figure shows the annual growth rate of housing prices across the District. The data documents that over the past 15 years the District averaged an annual appreciation of approximately 7.9
percent; this is inclusive of the recent losses in 2008 and 2009. The chart shows the District’s housing values increased more between 1998 and 2004 and decreased less between 2007 and 2009, and appear to be recovering faster than the surrounding area50. Unfortunately, particular areas of the District have been hit harder by declining home prices than others. Home sales prices declined by .5 percent citywide, but declined more dramatically in Wards 5, 7, and 8 by 17.9 percent, 9.7 percent, and 12.8 percent respectively in that same period. For more information on Wards 5, 7 and 8, see the District Demographic Profile section in Chapter One: General Information.51
50 Office of Planning Draft Analysis, 2010. Washington, DC: Office of Planning, 2010.
51 Office of Planning Draft Analysis, 2010. Washington, DC: Office of Planning, 2010.
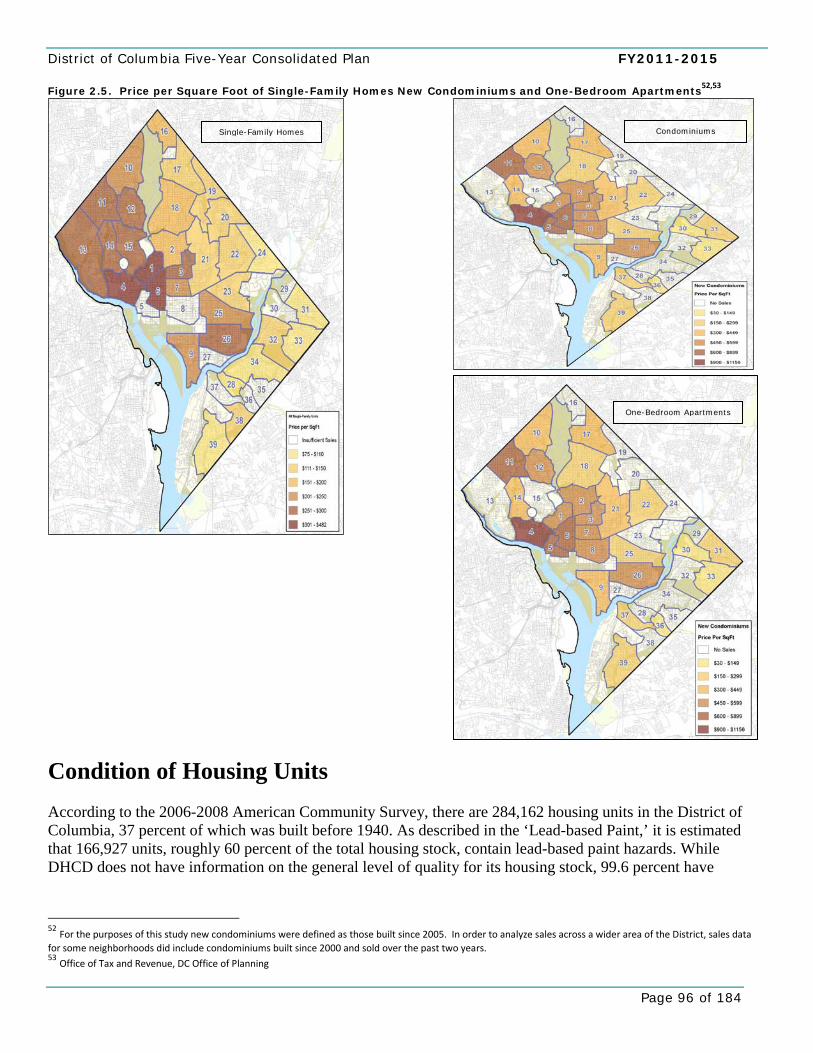
District of Columbia Five-Year Consolidated Plan FY2011-2015
Page 96 of 184
Figure 2.5. Price per Square Foot of Single-Family Homes New Condominiums and One-Bedroom Apartments52,53
Condition of Housing Units According to the 2006-2008 American Community Survey, there are 284,162 housing units in the District of Columbia, 37 percent of which was built before 1940. As described in the ‘Lead-based Paint,’ it is estimated that 166,927 units, roughly 60 percent of the total housing stock, contain lead-based paint hazards. While DHCD does not have information on the general level of quality for its housing stock, 99.6 percent have
52 For the purposes of this study new condominiums were defined as those built since 2005. In order to analyze sales across a wider area of the District, sales data for some neighborhoods did include condominiums built since 2000 and sold over the past two years. 53 Office of Tax and Revenue, DC Office of Planning
Single-Family Homes Condominiums
One-Bedroom Apartments
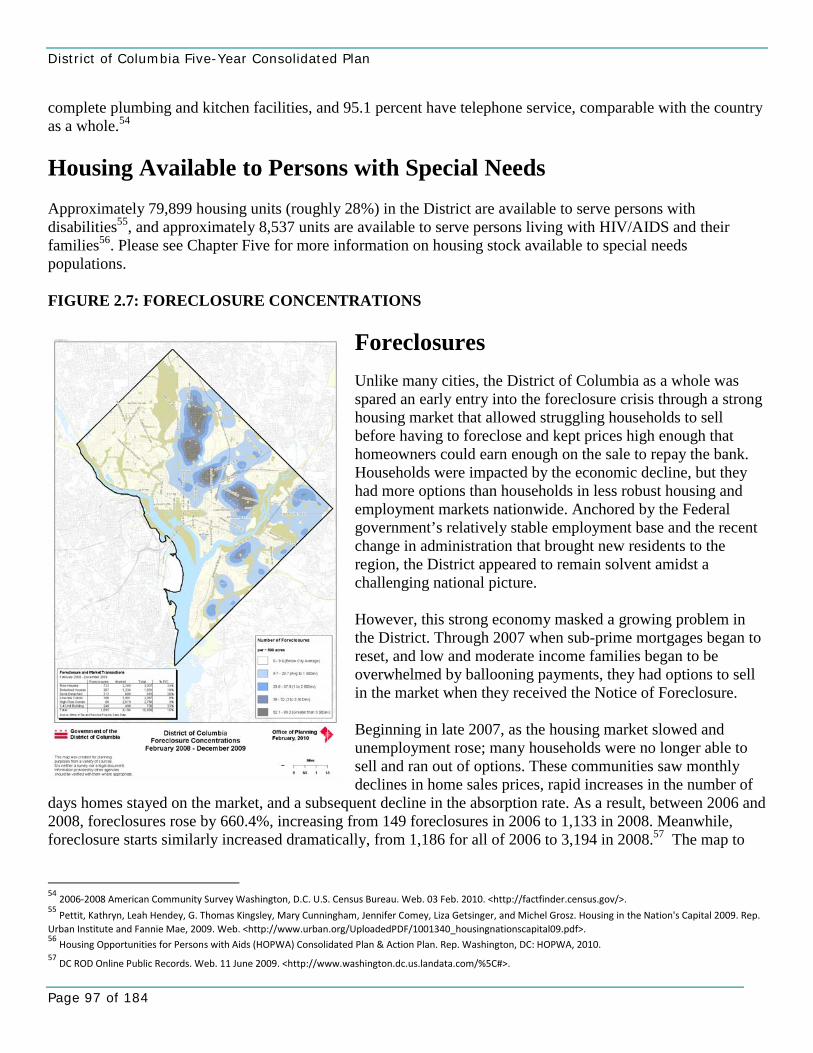
District of Columbia Five-Year Consolidated Plan
Page 97 of 184
complete plumbing and kitchen facilities, and 95.1 percent have telephone service, comparable with the country as a whole.54 Housing Available to Persons with Special Needs Approximately 79,899 housing units (roughly 28%) in the District are available to serve persons with disabilities55, and approximately 8,537 units are available to serve persons living with HIV/AIDS and their families56. Please see Chapter Five for more information on housing stock available to special needs populations. FIGURE 2.7: FORECLOSURE CONCENTRATIONS
Foreclosures Unlike many cities, the District of Columbia as a whole was spared an early entry into the foreclosure crisis through a strong housing market that allowed struggling households to sell before having to foreclose and kept prices high enough that homeowners could earn enough on the sale to repay the bank. Households were impacted by the economic decline, but they had more options than households in less robust housing and employment markets nationwide. Anchored by the Federal government’s relatively stable employment base and the recent change in administration that brought new residents to the region, the District appeared to remain solvent amidst a challenging national picture. However, this strong economy masked a growing problem in the District. Through 2007 when sub-prime mortgages began to reset, and low and moderate income families began to be overwhelmed by ballooning payments, they had options to sell in the market when they received the Notice of Foreclosure. Beginning in late 2007, as the housing market slowed and unemployment rose; many households were no longer able to sell and ran out of options. These communities saw monthly declines in home sales prices, rapid increases in the number of
days homes stayed on the market, and a subsequent decline in the absorption rate. As a result, between 2006 and 2008, foreclosures rose by 660.4%, increasing from 149 foreclosures in 2006 to 1,133 in 2008. Meanwhile, foreclosure starts similarly increased dramatically, from 1,186 for all of 2006 to 3,194 in 2008.57 The map to
54
2006‐2008 American Community Survey Washington, D.C. U.S. Census Bureau. Web. 03 Feb. 2010. <http://factfinder.census.gov/>.
55 Pettit, Kathryn, Leah Hendey, G. Thomas Kingsley, Mary Cunningham, Jennifer Comey, Liza Getsinger, and Michel Grosz. Housing in the Nation's Capital 2009. Rep.
Urban Institute and Fannie Mae, 2009. Web. <http://www.urban.org/UploadedPDF/1001340_housingnationscapital09.pdf>. 56
Housing Opportunities for Persons with Aids (HOPWA) Consolidated Plan & Action Plan. Rep. Washington, DC: HOPWA, 2010. 57
DC ROD Online Public Records. Web. 11 June 2009. <http://www.washington.dc.us.landata.com/%5C#>.
District of Columbia Five-Year Consolidated Plan FY2011-2015
Page 98 of 184
the left shows the concentration of foreclosures in the District from February 2008 to December 2009. Note the breakdown of foreclosures and market transactions by housing type. According to anecdotal evidence from the Department’s community-based organization partners and consistent with national data, trends in foreclosure in the District are changing. In the first wave of foreclosures that began in 2006, when foreclosures rose, the primary reason appears to have been Adjustable Rate Mortgages resets. More recently, there has been a rise in unemployment as a primary reason for foreclosure. The overall number of mortgages in foreclosure in District increased 99% in 2009 according to the National Association of Realtors. By December 2009, one in every 1,648 housing units in the District received a foreclosure filing.58 It is also important to remember that foreclosures do not just affect homeowners. In the first three quarters of 2009, 475 foreclosure proceedings were begun against multifamily rental or cooperative homes in the District. Due to the high cost of housing in the District, overcrowding is a problem. The U.S. Census Bureau defines overcrowding as a household with more than 1.01 persons per room (excluding bathrooms, kitchens, hallways, and porches). Severe overcrowding is defined as more than 1.51 persons per room. In the District, 1.6 percent of occupied housing units are overcrowded, and 1.2 percent is severely overcrowded (for a total of 2.8 percent). In renter-occupied units, 2.3 percent are overcrowded, and 1.9 percent is severely overcrowded (for a total of 4.2 percent). Nationwide, 4.0 percent of renter-occupied housing units are overcrowded, and 1.8 percent are severely overcrowded (for a total of 5.8 percent). Overcrowding has become more prevalent in the District as families “double up” in homes due to the foreclosure crisis and recession.
Vacancies A recent survey of large apartment management companies by the Office of Planning59 found low vacancy rates among stabilized properties (properties with 90 percent or higher occupancy). Among those that chose to report, the average was a low 2.6 percent. Furthermore, a quarter of the properties surveyed reported no vacant units. These properties may have had units “on notice,” but none of them were currently vacant. The buildings with no vacancies were scattered across the District and often of smaller size (less than 25 units). Apartments marketed for senior citizens were among the least likely to have vacancies. Across the District, there are approximately 33,741 vacant or abandoned buildings, 11.9 percent of total housing units in the District. This is comparable to the national vacancy rates, which according to the U.S. Census Bureau, were 10.7 percent for rental housing and 2.7 percent for owner-occupied units in the fourth quarter of 2009.
2 Assisted Housing Within District Government, affordable housing is provided by the Department of Housing and Community Development (DHCD), the Office of the Deputy Mayor for Planning and Economic Development (DMPED), the DC Housing Finance Agency (DCHFA) and the DC Housing Authority (DCHA). Between these four District agencies, approximately 27,151 affordable housing units have been completed or are in development, either through new construction or rehabilitation. Because the units are being developed through a District agency, either local or federal funds are being used to finance part of the project. Of that number, an estimated 10,381 units have been completed and are available for occupancy, leaving 16,770 units that are currently receiving local or federal funds for development through one of these four agencies. DCHA, an autonomous
58
Foreclosure Real Estate Listings | RealtyTrac. Web. 3 Feb. 2010. <http://Realtytrac.com>. 59 Comprehensive Housing Market Study 2009‐2014. Rep. Washington, DC: Office of Planning.
District of Columbia Five-Year Consolidated Plan
Page 99 of 184
entity, also funds 10,500 units currently, through vouchers. Information on how anticipated federal, state, and local funds will be used to address housing needs can be found in Chapter Two: Housing. Unfortunately, despite the District’s efforts, The National Low Income Housing Coalition estimates that 4,831 units of affordable housing could be lost from the assisted housing inventory. Reasons for loss include the expiration of Section 8 contracts, and the expiration of other local and federal subsidies. This number may fluctuate depending on other factors like housing conditions, housing market, and subsidy renewals.
3 Housing Market’s Influence on Use of Funds The state of the housing market as described above strongly influences how DHCD uses available funds. Several characteristics in particular have prompted the creation or continuation of agency programs. These housing market characteristics include:
Housing Market Characteristic One: Demand for complete neighborhoods The District is committed to creating complete neighborhoods. Studies done by the Office of Planning and anecdotal evidence indicate there is strong demand for neighborhoods with a full range of neighborhood services, including affordable housing, public transportation, local retail, open space, and community facilities. Programs and services to further complete the Districts’ neighborhoods include:
• HEALTHY BY DESIGN Healthy by Design is a framework for District government policies and programs that encourage active living and healthy eating by increasing access to healthy food, primary care facilities, walkable destinations and recreational opportunities.
• RETAIL ACTION CORRIDOR STUDY
This study examines ways to strengthen the city’s retail base at both the citywide and local scale, to promote vibrant commercial districts with a broad range of retail businesses in all neighborhoods, and to create expanded opportunities for small and local retailers.
• HOUSING RESOURCE CENTER (HRC)
Opened July 2009, the HRC is a one-stop shop for rental accommodations and conversion services, and information on quality affordable housing services for low and moderate income residents.
Housing Market Characteristic Two: Demand for a Sustainable City The District has made sustainability a huge priority as demonstrated by Mayor Fenty’s Green DC Agenda, launched in 2008. Programs and services that further make the District a leader in citywide sustainability include:
• GREEN BUILDING ACT OF 2006 Beginning in 2007, DHCD has required that all residential projects submitted for financing consideration conduct an integrated design charrette to explore the most cost-effective ways to
District of Columbia Five-Year Consolidated Plan FY2011-2015
Page 100 of 184
incorporate green building standards such as connections to public transportation, sustainable building materials, energy and water conservation, and storm water retention.
• WEATHERIZATION PROGRAM
The District Department of the Environment assists low-income residents make their homes more energy efficient by repairing heating and cooling systems, and installing or repairing weather stripping, insulation, doors, and windows.
• PLASTIC BAG TAX
As of January 2010, District businesses that sell food or alcohol must charge customers five cents for every disposable paper or plastic carryout bag beginning January 1, 2010, with the proceeds going to the new Anacostia River Cleanup and Protection Fund.
• EXPLORATION OF OTHER ENVIRONMENTALLY SUSTAINABLE OPTIONS
Creating complete neighborhoods is a goal of the District along with exploring new sustainable options such as transit-oriented development, walkable/bikeable transportation options, and methods of reducing the amount and energy and water used in construction and maintenance
Housing Market Characteristic Three: High Cost of Housing Due to the high cost of housing, the District will continue to use the majority of its funding to provide affordable housing for low-income households (those below 80 percent Area Median Income (AMI)), with a special focus on very low-income households (those between 30 percent and 50 percent AMI). The District will also continue to focus on providing home-ownership units, particularly for low-income and moderate-income (those between 80 percent and 120 percent AMI). The District prioritizes helping extremely low-income persons, part of which is done through its programming for homeless and chronic homelessness persons. Please refer to Chapter Three: Homeless for detailed information on these programs. Specific programs and services to address the high cost of housing in the District include:
• HOUSING PRODUCTION TRUST FUND Under the Housing Act of 2002, a dedicated funding source was identified for housing production that requires at least 40 percent of the funds benefit households at or below 30 percent of AMI, and at least 40 percent of the funds benefit households at or below 50 percent of AMI, with the remaining 20 percent serving households at or below 80 percent of AMI. During FY 2005 DHCD launched a Trust Fund initiative to facilitate access to acquisition funds for non-profit housing developers. See SAFI below.
• SINGLE FAMILY HOME REHABILITATION
DHCD offers, through its Single-Family Residential Rehabilitation Program, rehabilitation loans/grants to owner-occupants of single-family homes in order to prevent displacement due to market pricing pressures and to ensure that residents continue to live in decent and safe housing that meets the provisions of the District’s housing codes. To meet special needs, up to $10,000 of assistance is automatically deferred for senior citizens, and assistance for handicapped accessibility improvements is provided as a grant.
District of Columbia Five-Year Consolidated Plan
Page 101 of 184
• HOME PURCHASE ASSISTANCE PROGRAM (HPAP) HPAP enables lower-and moderate-income individuals and families to purchase affordable housing in Washington, DC by providing up to $44,000 towards down payment and closing costs.
Housing Market Characteristic Four: Vacant and Blighted Property There remains a high amount of vacant and blighted property in the District. Programs and services to address the large amount of vacant and blighted property in the District include:
• THE SITE ACQUISITION FUND INITIATIVE (SAFI) SAFI combines public funds from the HPTF and private funds from selected lending institutions for non-profit developers to quickly acquire development sites in the competitive real estate market.
• PROPERTY ACQUISITION AND DISPOSITION DIVISION (PADD)
PADD helps transform vacant residential properties into homeownership opportunities by acquiring properties through negotiated friendly sale, eminent domain, donation or tax sale foreclosure and selling the properties to developers to be rehabilitated into high quality housing for residents of all income levels.
Housing Market Characteristic Five: Large Renter population As mentioned above, 55 percent of District residents rent their homes, compared to 33 percent nationally. Programs and services to benefit the high renter population in the District include:
• TENANT PURCHASE TECHNICAL ASSISTANCE PROGRAM To assist in preventing displacement when a tenant’s apartment building is offered for sale, DHCD offers the First Right to Purchase and the Tenant Purchase Technical Assistance programs that provide technical assistance, counseling, and loans and grants to tenant organizations to enable them to exercise their right to purchase their building for homeownership.
• MULTI-FAMILY HOUSING FINANCING
DHCD funds hundreds of multifamily housing units each year.
Housing Market Characteristic Six: Increase in Foreclosures While the District was spared an early entry into the foreclosure crisis, it is now clearly being dramatically affected by it. In order to combat this increase in foreclosures, the District has developed the following programs and services:
• NEIGHBORHOOD STABILIZATION PROGRAM (NSP) ROUNDS ONE AND TWO As part of NSP One, the District will invest $2.8 million in NSP funds toward the development of 58 affordable housing units in the Ivy City/Trinidad neighborhood, one of the areas of the District which has been hardest hit by foreclosures. As part of NSP Two, the District will receive $9.5 million to bolster existing programs that create and preserve affordable housing opportunities for low- and moderate-income residents.
District of Columbia Five-Year Consolidated Plan FY2011-2015
Page 102 of 184
• PROPERTY ACQUISITION AND DISPOSITION DIVISION (PADD)
PADD helps transform vacant residential properties into homeownership opportunities by acquiring properties through negotiated friendly sale, eminent domain, donation or tax sale foreclosure and selling the properties to developers to be rehabilitated into high quality housing for residents of all income levels.
• HOUSING EXPO AND FORECLOSURE CLINIC
In June 2009, the District provided information about foreclosure prevention, homeownership, credit counseling, and neighborhood revitalization. A second annual event is scheduled for June 19, 2010.
Housing Market Characteristic Seven: Large Special Needs Populations The District is home to a high number of persons with special needs, including the elderly, persons with disabilities, and people living with HIV/AIDS. These populations require particular housing and services, the provision of which the District has made a high priority. Programs and services to benefit special needs populations in the District include:
• PARTNERSHIP WITH THE DEPARTMENT OF MENTAL HEALTH (DMH) In recognition of the large demand for special needs housing, DMH and DHCD have partnered to provide 300 units of supportive housing for persons who are eligible to receive mental health services or support from DMH.
District of Columbia Five-Year Consolidated Plan
Page 103 of 184
Specific Housing Objectives (91.215 (b)) 1. Describe the priorities and specific objectives the jurisdiction hopes to achieve over a
specified time period. 2. Describe how Federal, State, and local public and private sector resources that are
reasonably expected to be available will be used to address identified needs for the period covered by the strategic plan.
3-5 Year Strategic Plan Specific Housing Objectives response:
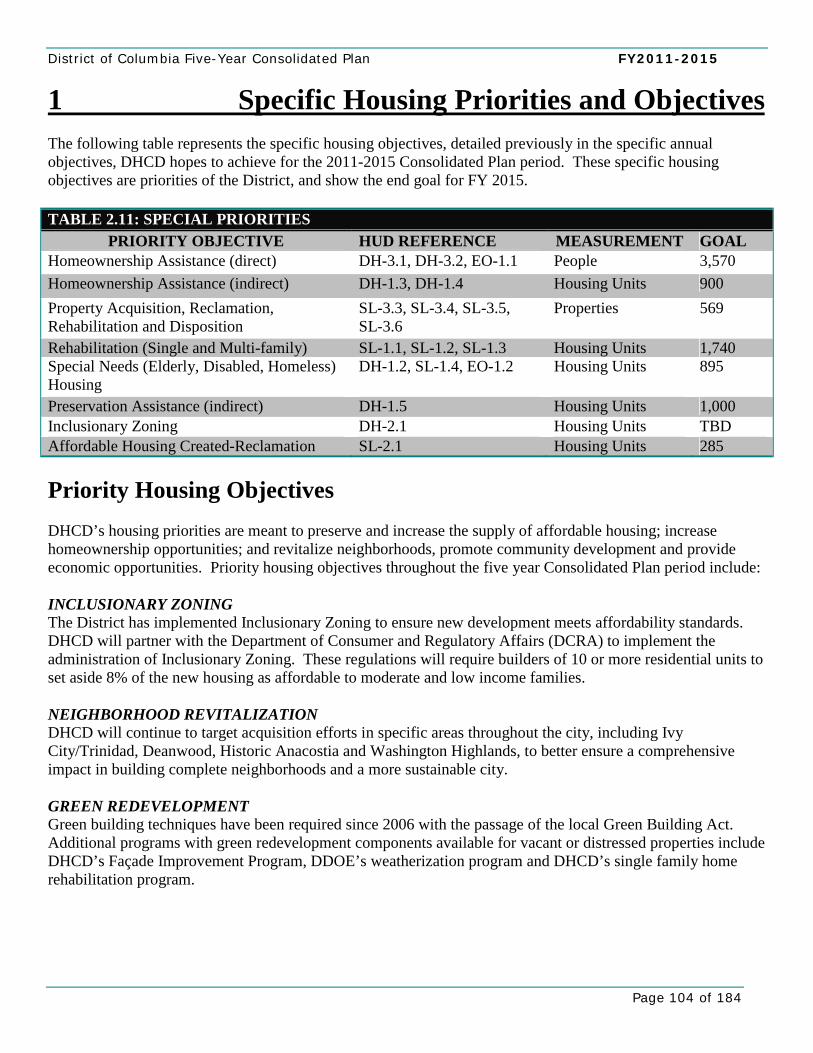
District of Columbia Five-Year Consolidated Plan FY2011-2015
Page 104 of 184
1 Specific Housing Priorities and Objectives The following table represents the specific housing objectives, detailed previously in the specific annual objectives, DHCD hopes to achieve for the 2011-2015 Consolidated Plan period. These specific housing objectives are priorities of the District, and show the end goal for FY 2015. TABLE 2.11: SPECIAL PRIORITIES
PRIORITY OBJECTIVE HUD REFERENCE MEASUREMENT GOAL Homeownership Assistance (direct) DH-3.1, DH-3.2, EO-1.1 People 3,570 Homeownership Assistance (indirect) DH-1.3, DH-1.4 Housing Units 900 Property Acquisition, Reclamation, Rehabilitation and Disposition
SL-3.3, SL-3.4, SL-3.5, SL-3.6
Properties 569
Rehabilitation (Single and Multi-family) SL-1.1, SL-1.2, SL-1.3 Housing Units 1,740 Special Needs (Elderly, Disabled, Homeless) Housing
DH-1.2, SL-1.4, EO-1.2 Housing Units 895
Preservation Assistance (indirect) DH-1.5 Housing Units 1,000 Inclusionary Zoning DH-2.1 Housing Units TBD Affordable Housing Created-Reclamation SL-2.1 Housing Units 285 Priority Housing Objectives DHCD’s housing priorities are meant to preserve and increase the supply of affordable housing; increase homeownership opportunities; and revitalize neighborhoods, promote community development and provide economic opportunities. Priority housing objectives throughout the five year Consolidated Plan period include: INCLUSIONARY ZONING The District has implemented Inclusionary Zoning to ensure new development meets affordability standards. DHCD will partner with the Department of Consumer and Regulatory Affairs (DCRA) to implement the administration of Inclusionary Zoning. These regulations will require builders of 10 or more residential units to set aside 8% of the new housing as affordable to moderate and low income families. NEIGHBORHOOD REVITALIZATION DHCD will continue to target acquisition efforts in specific areas throughout the city, including Ivy City/Trinidad, Deanwood, Historic Anacostia and Washington Highlands, to better ensure a comprehensive impact in building complete neighborhoods and a more sustainable city. GREEN REDEVELOPMENT Green building techniques have been required since 2006 with the passage of the local Green Building Act. Additional programs with green redevelopment components available for vacant or distressed properties include DHCD’s Façade Improvement Program, DDOE’s weatherization program and DHCD’s single family home rehabilitation program.
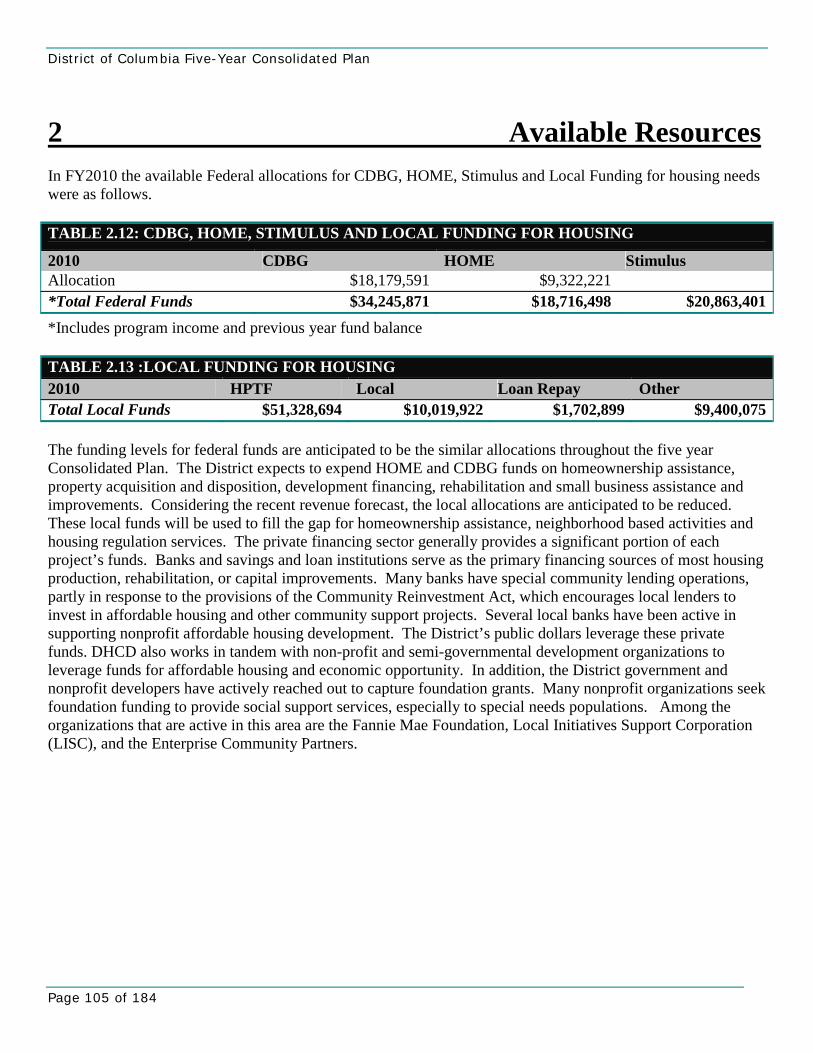
District of Columbia Five-Year Consolidated Plan
Page 105 of 184
2 Available Resources In FY2010 the available Federal allocations for CDBG, HOME, Stimulus and Local Funding for housing needs were as follows. TABLE 2.12: CDBG, HOME, STIMULUS AND LOCAL FUNDING FOR HOUSING
2010 CDBG HOME Stimulus Allocation $18,179,591 $9,322,221 *Total Federal Funds $34,245,871 $18,716,498 $20,863,401
*Includes program income and previous year fund balance TABLE 2.13 :LOCAL FUNDING FOR HOUSING 2010 HPTF Local Loan Repay Other Total Local Funds $51,328,694 $10,019,922 $1,702,899 $9,400,075 The funding levels for federal funds are anticipated to be the similar allocations throughout the five year Consolidated Plan. The District expects to expend HOME and CDBG funds on homeownership assistance, property acquisition and disposition, development financing, rehabilitation and small business assistance and improvements. Considering the recent revenue forecast, the local allocations are anticipated to be reduced. These local funds will be used to fill the gap for homeownership assistance, neighborhood based activities and housing regulation services. The private financing sector generally provides a significant portion of each project’s funds. Banks and savings and loan institutions serve as the primary financing sources of most housing production, rehabilitation, or capital improvements. Many banks have special community lending operations, partly in response to the provisions of the Community Reinvestment Act, which encourages local lenders to invest in affordable housing and other community support projects. Several local banks have been active in supporting nonprofit affordable housing development. The District’s public dollars leverage these private funds. DHCD also works in tandem with non-profit and semi-governmental development organizations to leverage funds for affordable housing and economic opportunity. In addition, the District government and nonprofit developers have actively reached out to capture foundation grants. Many nonprofit organizations seek foundation funding to provide social support services, especially to special needs populations. Among the organizations that are active in this area are the Fannie Mae Foundation, Local Initiatives Support Corporation (LISC), and the Enterprise Community Partners.
District of Columbia Five-Year Consolidated Plan FY2011-2015
Page 106 of 184
Needs of Public Housing (91.210 (b)) In cooperation with the public housing agency or agencies located within its boundaries, describe the needs of public housing, including the number of public housing units in the jurisdiction, the physical condition of such units, the restoration and revitalization needs of public housing projects within the jurisdiction, and other factors, including the number of families on public housing and tenant-based waiting lists and results from the Section 504 needs assessment of public housing projects located within its boundaries (i.e. assessment of needs of tenants and applicants on waiting list for accessible units as required by 24 CFR 8.25). The public housing agency and jurisdiction can use the optional Priority Public Housing Needs Table (formerly Table 4) of the Consolidated Plan to identify priority public housing needs to assist in this process. 3-5 Year Strategic Plan Needs of Public Housing response:
District of Columbia Five-Year Consolidated Plan
Page 107 of 184
1 Public Housing Needs Public Housing Details OCCUPIED HOUSING UNITS DCHA currently has 8,430 public housing units, 1,193 efficiencies, 2,367 one bedroom units, 2,336 two bedroom units, 1,738 three bedroom units, 553 four bedroom units, 202 five bedroom units and 41 six bedroom units. There are 11,092 Housing Choice Vouchers (HCVP) being used by families in the District. Due to the extensive waitlist, the District does not currently have any vacant public housing units according to DCHA. PHYSICAL CONDITION OF PUBLIC HOUSING AND REVITALIZATION NEEDS Based on a physical needs assessment and a preventative maintenance plan, DCHA determined in FY08 that approximately $160 million in projected physical needs would be present over the next four years. Eleven properties were identified as needing priority improvements costing a projected $4.79 million in capital funds. There are five properties slated for redevelopment as part of the District’s New Communities Initiative and four of these properties will be demolished. HOUSEHOLDS ON THE PUBLIC HOUSING AND HCVP WAIT LIST In FY 2008, the number of households on the public housing wait list was 29,756 with 6,868 requesting efficiencies; 8,966 requesting one bedroom units; 7,899 requesting two bedroom units; 4,649 requesting three bedroom units; 1,211 requesting four bedroom units, 67 requesting five bedroom units; and 96 requesting six or more bedrooms. The overwhelming majority of those households, 29,374, earn 30 percent of the area median income (AMI) or less. 334 households earn between 30 and 50 percent of the AMI, 9 earn between 50 and 80 percent AMI, and 39 earn more than 80 percent AMI. The number of households on the HVCP wait list was 48,748 in FY2008, 47,906 of which earned less than 30 percent AMI. Approximately 749 households earned between 30 and 50 percent AMI, 34 earned between 50 and 80 percent AMI, and 69 households earned more than 80 percent AMI. SECTION 504 NEEDS ASSESSMENT DCHA has a transition plan agreed to by HUD for modification or construction of accessible units and common areas to meet needs of persons with disabilities and Uniform Federal Accessibility Standards (UFAS). DCHA has also revised key policies and administrative practices to ensure that persons with physical and mental disabilities are reasonably accommodated, including requiring that 6% of the construction of total new units be UFAS compliant for those with physical disabilities and 3% is accessible to those who are hearing and vision impaired. In 2008, DCHA created 97 new UFAS compliant units, of which 37 are located in mixed income redevelopments.
District of Columbia Five-Year Consolidated Plan FY2011-2015
Page 108 of 184
Public Housing Strategy (91.210) 1. Describe the public housing agency's strategy to serve the needs of extremely low-
income, low-income, and moderate-income families residing in the jurisdiction served by the public housing agency (including families on the public housing and section 8 tenant-based waiting list), the public housing agency’s strategy for addressing the revitalization and restoration needs of public housing projects within the jurisdiction and improving the management and operation of such public housing, and the public housing agency’s strategy for improving the living environment of extremely low-income, low-income, and moderate families residing in public housing.
2. Describe the manner in which the plan of the jurisdiction will help address the
needs of public housing and activities it will undertake to encourage public housing residents to become more involved in management and participate in homeownership. (NAHA Sec. 105 (b)(11) and (91.215 (k))
3. If the public housing agency is designated as "troubled" by HUD or otherwise is
performing poorly, the jurisdiction shall describe the manner in which it will provide financial or other assistance in improving its operations to remove such designation. (NAHA Sec. 105 (g))
3-5 Year Strategic Plan Public Housing Strategy response:
District of Columbia Five-Year Consolidated Plan
Page 109 of 184
1 Housing Agency’s Strategy Strategy to Support Resident Needs The DC Housing Authority plans to continue directly administering the following programs for services to residents of public and assisted housing:
• HOPE VI-funded community and supportive services programs in five communities, namely, Wheeler Creek, Capitol Gateway (formerly East Capitol/Capitol View Dwellings), Henson Ridge (formerly Frederick Douglass/ Stanton), Arthur Capper/Carrollsburg, and Eastgate.
• Family Self Sufficiency programs offered through the Housing Choice Voucher program; • Programs funded by operating subsidy and Capital Fund management improvement funds which
include organizing and overseeing fair and successful resident council elections, resident council and officer training, outreach to local businesses and charitable organizations to provide direct assistance to residents and support of specialized activities to benefit residents; and
• Support of the administration of various Resident Opportunities for Self Sufficiency (ROSS) grants by resident councils.
In addition, DCHA will continue to sponsor the provision of service programs offered by other organizations using DCHA facilities. Supportive or enrichment services are offered at forty-seven of DCHA’s properties and the variety of programs available at these locations is wide-ranging. Government agencies, non-profit, and faith-based organizations are among the entities that currently provide these programs, including: Boys and Girls Clubs of America, Urban Family Institute, and the Alliance of Concerned Men. The DCHA subsidiary, Community Vision, Inc. seeks to be a facilitator and manager of service providers in an increasingly seamless and integrated manner.
Strategy for Improving Operations The Authority’s financial health is sound. The reserve level is such that DCHA can respond to an emergency situation or unusual circumstance without threat to the provision of routine services. In addition, the DCHA has established three primary goals for improving financial management: strengthen financial operations to ensure accuracy of financial data and management control; optimize financial management operations to increase efficiencies and customer satisfaction and decreasing costs; and, improve financial performance reporting to better support management decisions and to ensure compliance with standards issued by the Governmental Accounting Standards Board. DCHA has a comprehensive set of policies and procedures related to the operations and Housing Choice Voucher programs in support of its overall mission to enhance the quality of life for its residents and effectively manage affordable housing in the District of Columbia. DCHA has established operating procedures to sustain an unqualified opinion on the annual independent audit and to aggressively resolve all findings; has implemented internal and external monitoring standards for each major program function; and through direct internal audit activities aimed at increasing efficiency, economy and effectiveness of operations. Furthermore, DCHA is and will continue to assess and modify its regulations governing eligibility, selection and admissions, in concert with stakeholders and residents in accordance with the public notice and documentation requirements of the District of Columbia.
District of Columbia Five-Year Consolidated Plan FY2011-2015
Page 110 of 184
Strategies aimed at decreasing the concentration of families living in poverty include seeking to increase the number of landlords throughout the District of Columbia willing to rent to participants of the Housing Choice Voucher Program; giving preference for 50 percent of available units to working families; and implementation of market-based flat rents, as required by the Quality Housing and Work Responsibility Act of 1998 (QHWRA). DCHA’s Office of Fair Hearings provides a comprehensive grievance procedure for Public Housing applicants and residents. The grievance procedures for the HCVP applicants and residents are governed by the Housing Choice Voucher compliance department.
2 Addressing Resident Needs and Encouraging Involvement
DCHA works closely with the 47 active public housing resident organizations. Additionally, three public housing residents are members of DCHA’s nine-member Board of Commissioners. Residents are frequently called upon to provide input into the DCHA decision-making process, from participating on developer selection panels, candidate interviews and major policy decisions. Beginning with the 2005-2006 DCHA Strategic Plan, the agency has called for providing resident leaders with the training and support to make informed choices and improve their ability to provide meaningful leadership to their constituents. DCHA has incorporated a strong homeownership incentive program through the use of HCVP recipients, targeting and reserving units in its new development projects for those residents, and providing supporting services to ensure financing. During FY 08, DCHA created 10 homeownership units through the redevelopment and acquisition of scattered sites. There will be an additional 18 homeownership units built at the Capitol Gateway HOPE VI redevelopment site, and an additional 98 homeownership units for low and moderate income families at other mixed income redevelopments.
3 HUD Designation DCHA is not designated as "troubled" by HUD or otherwise performing poorly.
District of Columbia Five-Year Consolidated Plan
Page 111 of 184
Barriers to Affordable Housing (91.210 (e) and 91.215 (f)) 1. Explain whether the cost of housing or the incentives to develop, maintain, or improve
affordable housing are affected by public policies, particularly those of the local jurisdiction. Such policies include tax policy affecting land and other property, land use controls, zoning ordinances, building codes, fees and charges, growth limits, and policies that affect the return on residential investment.
2. Describe the strategy to remove or ameliorate negative effects of public policies that
serve as barriers to affordable housing, except that, if a State requires a unit of general local government to submit a regulatory barrier assessment that is substantially equivalent to the information required under this part, as determined by HUD, the unit of general local government may submit that assessment to HUD and it shall be considered to have complied with this requirement.
3-5 Year Strategic Plan Barriers to Affordable Housing response:
District of Columbia Five-Year Consolidated Plan FY2011-2015
Page 112 of 184
1 Barriers to Affordable Housing In the past decade, the District of Columbia housing market has experienced a sharp increase in housing prices making the District one of the least affordable in terms of housing. While home prices have declined since mid-2009, the rents and home prices remain far higher than a decade ago. Affordable rental units continue to be converted into luxury condominiums, although not at the same rate as the peak of the housing market. The lack of affordable housing has been particularly burdensome for low- and moderate- income residents, and is so severe for the District’s lowest-income residents that most in this category now spend half or more of their income on housing. The reasons for the high cost and limited stock of housing are complex, but government officials and policy experts have identified the following policies or lack of policies as major obstacles to affordable housing in the District: .
• A lack of tax incentives in the D.C. Official Code to promote the development of affordable housing and homeownership opportunities;
• A rent control system which allows landlords to increase rents without many rules and regulations. • High rates of rental to condo conversion displacing low-income residents; • The Uniform Height Act of 1910, which effectively limits building height in the District to 13 stories
and requires a Act of Congress to repeal; and There are also non-policy barriers to affordable housing in the District which include limited housing stock and a lack of diversity in the existing housing stock; soaring housing costs for both rental and ownership units; a lack of economic development in some areas of the city resulting in little new housing being built in some neighborhoods; severe budget constraints; rising foreclosure rates and an accompanying tightening of the credit market, and the fact that the District has the lowest home ownership rate in the country60, Additionally, many neighborhoods in the District are home to residents with low educational attainment and job skills levels, which hinders their ability to secure well-paying jobs, thus further limiting their ability to find housing affordable at their incomes. These same neighborhoods also suffer from concentrated levels of poverty and in many cases, poor building quality levels.
2 Efforts to Remove Barriers to Affordable Housing In order to achieve the vision of complete neighborhoods the District continues to take several steps to remove the barriers to affordable housing. Below is a list and description of several programs and steps being taken by the Districts government to address the need for affordable housing. Programs HOUSING PRODUCTION TRUST FUND (HPTF) A DHCD-administered source of public funds focused on producing and preserving units of affordable housing for low- and moderate-income residents, HPTF, is targeted to serve residents with the greatest housing needs. At least 40 percent of all funds must be used to serve households with incomes below 30 percent of the area median income (AMI). At least 40 percent of funds must be used to serve households with incomes between 30

District of Columbia Five-Year Consolidated Plan
Page 113 of 184
percent and 50 percent of AMI, while the remaining 20 percent of funds may be used to serve families with incomes up to 80 percent of AMI. In addition, at least half of all HPTF must be used to produce or preserve rental housing. RENTAL HOUSING CONVERSION AND SALE AMENDMENT ACT OF 2005 (COMMONLY KNOWN AS THE “TENANT OPPORTUNITY TO PURCHASE ACT” OR “TOPA.”) TOPA gives tenant associations in the District the right to purchase their housing units upon sale by the owner. DHCD administers the First Right to Purchase Assistance Program, which effectively aligns the purpose of the law with the Department mission to create and preserve affordable housing opportunities. DHCD offers tenant purchase financing which assists in the preservation of affordable units across the city. THE HOUSING REGULATION ADMINISTRATION (HRA) HRA administers the District’s rental housing regulations and implements the District’s Inclusionary Zoning program. Inclusionary Zoning in the District requires that an exclusive percentage of units in a new development or a substantial rehabilitation that increase the size of an existing building be set aside as affordable units in exchange for a bonus density. The goals of the program are to generate mixed-income neighborhoods; construct affordable housing for a diverse labor force; seek equitable growth of new residents; and augment homeownership opportunities for low and moderate income levels. RESIDENTIAL AND COMMUNITY SERVICES DIVISION (RCSD) RCSD administers the District’s Home Purchase Assistance Program (HPAP) and Employee Assisted Housing Programs which provide financial assistance for low and moderate-income households and District Government employees for the purpose of first-time home purchase. The Division also provides rehabilitation resources, including grants for lead hazard remediation to eligible units, and loans and grants to income-qualified owner-occupant District residencies in order to preserve homeownership in the District. RCSD also oversees the Single Family Residential Rehabilitation Program, which are low-interest loans designed to help households finance home repairs that will address District housing code violations. Funding may be used for activities that include repairing walls and floors; replacing windows; and repairing plumbing, electrical, and heating systems. Up to $75,000 in loan financing is available per eligible household. COMMUNITY-BASED ORGANIZATION PARTNERS DHCD partners with non-profit and private sector housing advocates and practitioners to affirmatively further fair housing and provide greater education coverage of housing and fair housing issues to target communities. This is accomplished by funding community-based organizations to provide outreach and education to District residents who are tenants and homeowners on topics such as purchase programs for first time homeowners, comprehensive homeownership and housing counseling, foreclosure prevention and assistance for relocation, and location of apartments. TARGETED SPENDING OF SCARCE RESOURCES DHCD has partnered with community-based, private sector and nonprofit partners such as Fannie Mae and the Urban Institute to ensure effective analysis and targeting of scare resources to maximize outreach and education to empower residents about their choices. RECOVERY ACT GRANTS DHCD will distribute the funding toward single-family and multi-family redevelopment and preservation through the acquisition and sale of vacant and foreclosed properties; rehabilitation and homeownership
District of Columbia Five-Year Consolidated Plan FY2011-2015
Page 114 of 184
opportunities through a “turnkey” program which will involve partnerships with the D.C. Housing Authority; and down payment assistance to low and moderate income homebuyers.61 TAX ABATEMENT FOR LOWER INCOME HOMEOWNERSHIP Eligible homeowners, including non-profit organizations and shared equity investors, may receive a five-year tax abatement and be exempt from paying recordation and transfer taxes. To qualify, they must meet the following conditions:
• The property must be owner-occupied; • The owner must meet the income level requirement; and • The property must be less than $320,000 in value.
RENTAL CONTROL REFORM ACT OF 2005 This act placed a cap on annual rent increases in rent controlled units, which assists renters by providing them with predictable housing costs. HOUSING WAITLIST ELIMINATION ACT OF 2008 This act requires the Mayor to submit a comprehensive plan that outlines a strategy for eliminating the District of Columbia Housing Authority’s current waiting list of individuals seeking housing choice vouchers and placement in public housing by January 1, 2012; and measures to prevent the waiting list from reaching such high levels in the future. DCHOUSINGSEARCH.ORG DCHousingSearch.org allows residents to quickly find housing that fits their needs and budget by providing up-to-date listings of available for rent and for sale properties. The site also connects people to housing resources through website links and provides helpful tools for renters such as an affordability calculator, rental checklist, and information about renter rights.
61 “Department of Housing and Community Development." DC Government Resource Center. Web. 05 Feb. 2010. <http://newsroom.dc.gov/show.aspx/agency/dhcd/section/2/release/19339/year/2010>.
District of Columbia Five-Year Consolidated Plan
Page 115 of 184
CHAPTER THREE: HOMELESS
According to Point in Time data from the last several years, there are between three- and five hundred men and women are sleeping on the street or in places not meant for human habitation on a given night. This accounts for roughly five percent of literally homeless persons living in the District of Columbia. The number of unsheltered persons is likely much lower in the colder months due to the expansion of the city’s Emergency Shelter system that occurs between November and March each year. Unsheltered persons are typically unaccompanied, single persons as opposed to persons in families. Indeed, the unsheltered persons count done as a part of the annual Point in Time enumeration has not included any persons in families for the past several years. The data suggests that families are far more likely to be living in “doubled up” situations with other family or friends (and, thus, do not meet HUD’s definition of homelessness). The Virginia Williams Family Resource Center maintains a list of families that have made application for Emergency Shelter but whose situation is not so dire that they are in immediate need of placement in such a facility. Families on the “pending list” remain housed, though their situations may be temporary or precarious, and as such they are also not considered homeless. In 2009, the pending list included, on average, 314 families. Not all families who fall into this category ultimately need shelter, due in part to enhance prevention efforts. More information on the characteristics and needs of low-income individuals and children who are currently housed but are at imminent risk of either residing in shelters or becoming unsheltered can be found in the table in the next section, “Priority Homeless Need.”
Homeless Needs (91.205 (b) and 91.215 (c))
Homeless Needs— The jurisdiction must provide a concise summary of the nature and extent of homelessness in the jurisdiction, (including rural homelessness and chronic homelessness where applicable), addressing separately the need for facilities and services for homeless persons and homeless families with children, both sheltered and unsheltered, and homeless subpopulations, in accordance with Table 1A. The summary must include the characteristics and needs of low-income individuals and children, (especially extremely low-income) who are currently housed but are at imminent risk of either residing in shelters or becoming unsheltered. In addition, to the extent information is available; the plan must include a description of the nature and extent of homelessness by racial and ethnic group. A quantitative analysis is not required. If a jurisdiction provides estimates of the at-risk population(s), it should also include a description of the operational definition of the at-risk group and the methodology used to generate the estimates.
3-5 Year Strategic Plan Homeless Needs response:
District of Columbia Five-Year Consolidated Plan FY2011-2015
Page 116 of 184
Priority Homeless Need 1. Using the results of the Continuum of Care planning process, identify the
jurisdiction's homeless and homeless prevention priorities specified in Table 1A, the Homeless and Special Needs Populations Chart. The description of the jurisdiction's choice of priority needs and allocation priorities must be based on reliable data meeting HUD standards and should reflect the required consultation with homeless assistance providers, homeless persons, and other concerned citizens regarding the needs of homeless families with children and individuals. The jurisdiction must provide an analysis of how the needs of each category of residents provided the basis for determining the relative priority of each priority homeless need category. A separate brief narrative should be directed to addressing gaps in services and housing for the sheltered and unsheltered chronic homeless.
2. A community should give a high priority to chronically homeless persons, where the
jurisdiction identifies sheltered and unsheltered chronic homeless persons in its Homeless Needs Table - Homeless Populations and Subpopulations.
3-5 Year Strategic Plan Priority Homeless Needs response:
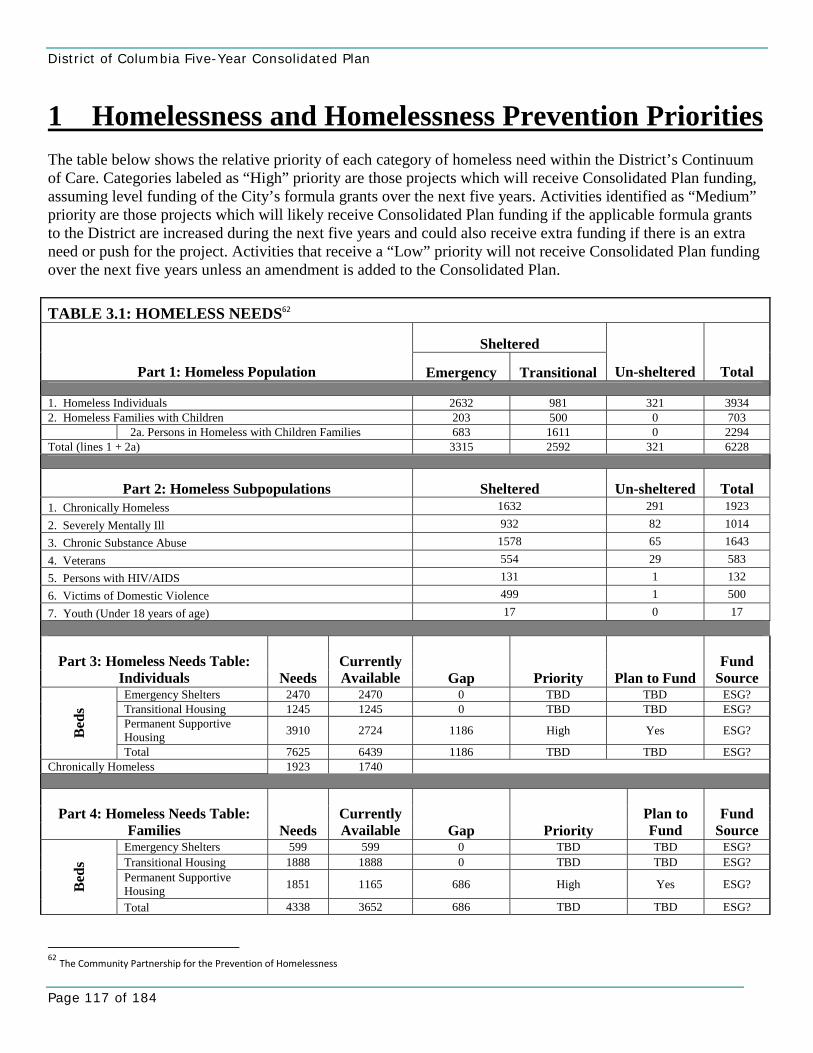
District of Columbia Five-Year Consolidated Plan
Page 117 of 184
1 Homelessness and Homelessness Prevention Priorities The table below shows the relative priority of each category of homeless need within the District’s Continuum of Care. Categories labeled as “High” priority are those projects which will receive Consolidated Plan funding, assuming level funding of the City’s formula grants over the next five years. Activities identified as “Medium” priority are those projects which will likely receive Consolidated Plan funding if the applicable formula grants to the District are increased during the next five years and could also receive extra funding if there is an extra need or push for the project. Activities that receive a “Low” priority will not receive Consolidated Plan funding over the next five years unless an amendment is added to the Consolidated Plan. TABLE 3.1: HOMELESS NEEDS62
Sheltered
Part 1: Homeless Population Emergency Transitional Un-sheltered Total
1. Homeless Individuals 2632 981 321 3934 2. Homeless Families with Children 203 500 0 703 2a. Persons in Homeless with Children Families 683 1611 0 2294 Total (lines 1 + 2a) 3315 2592 321 6228
Part 2: Homeless Subpopulations Sheltered Un-sheltered Total 1. Chronically Homeless 1632 291 1923 2. Severely Mentally Ill 932 82 1014 3. Chronic Substance Abuse 1578 65 1643 4. Veterans 554 29 583 5. Persons with HIV/AIDS 131 1 132 6. Victims of Domestic Violence 499 1 500 7. Youth (Under 18 years of age) 17 0 17
Part 3: Homeless Needs Table: Individuals Needs
Currently Available Gap Priority Plan to Fund
Fund Source
Emergency Shelters 2470 2470 0 TBD TBD ESG? Transitional Housing 1245 1245 0 TBD TBD ESG? Permanent Supportive Housing 3910 2724 1186 High Yes ESG? B
eds
Total 7625 6439 1186 TBD TBD ESG? Chronically Homeless 1923 1740
Part 4: Homeless Needs Table: Families Needs
Currently Available Gap Priority
Plan to Fund
Fund Source
Emergency Shelters 599 599 0 TBD TBD ESG? Transitional Housing 1888 1888 0 TBD TBD ESG? Permanent Supportive Housing 1851 1165 686 High Yes ESG? B
eds
Total 4338 3652 686 TBD TBD ESG?
62 The Community Partnership for the Prevention of Homelessness
District of Columbia Five-Year Consolidated Plan FY2011-2015
Page 118 of 184
2 Chronic Homelessness The District has made ending chronic homelessness a high priority, as reflected above. For more information on the District’s plan to end chronic homelessness in the “Homeless Strategic Plan” section later in this chapter.
District of Columbia Five-Year Consolidated Plan
Page 119 of 184
Homeless Inventory (91.210 (c))
The jurisdiction shall provide a concise summary of the existing facilities and services (including a brief inventory) that assist homeless persons and families with children and subpopulations identified in Table 1A. These include outreach and assessment, emergency shelters and services, transitional housing, permanent supportive housing, access to permanent housing, and activities to prevent low-income individuals and families with children (especially extremely low-income) from becoming homeless. The jurisdiction can use the optional Continuum of Care Housing Activity Chart and Service Activity Chart to meet this requirement. 3-5 Year Strategic Plan Homeless Inventory response:
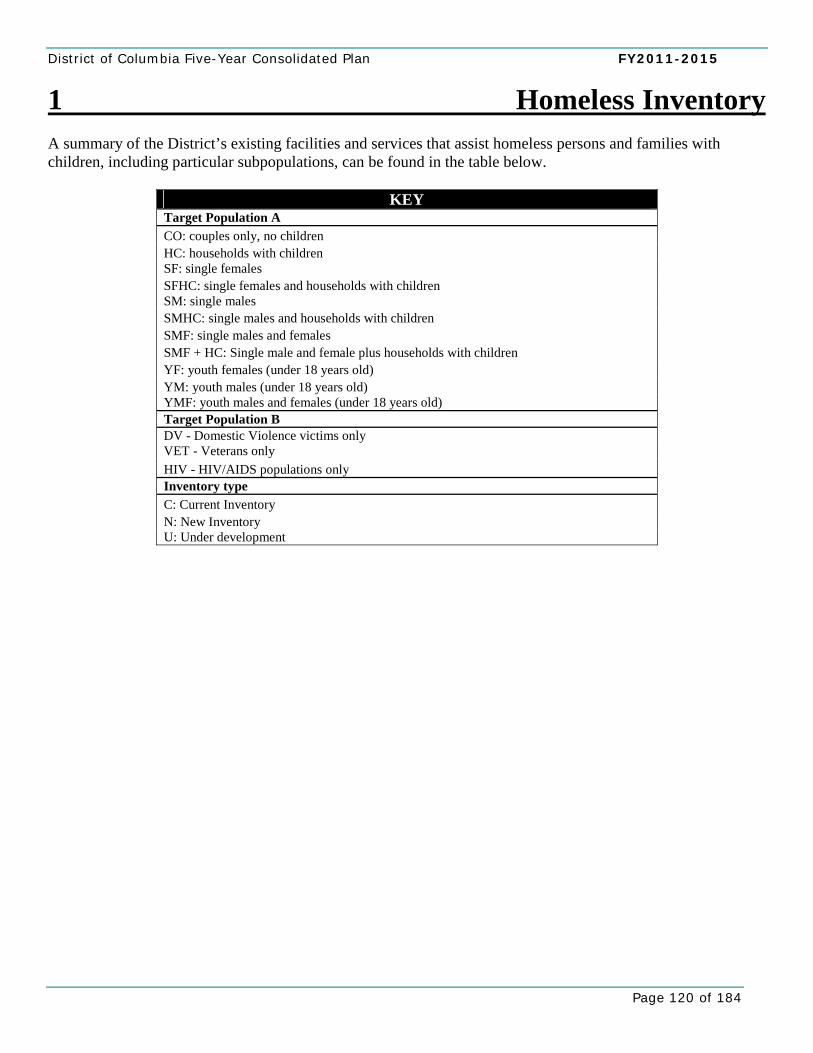
District of Columbia Five-Year Consolidated Plan FY2011-2015
Page 120 of 184
1 Homeless Inventory A summary of the District’s existing facilities and services that assist homeless persons and families with children, including particular subpopulations, can be found in the table below.
KEY Target Population A CO: couples only, no children HC: households with children SF: single females SFHC: single females and households with children SM: single males SMHC: single males and households with children SMF: single males and females SMF + HC: Single male and female plus households with children YF: youth females (under 18 years old) YM: youth males (under 18 years old) YMF: youth males and females (under 18 years old) Target Population B DV - Domestic Violence victims only VET - Veterans only HIV - HIV/AIDS populations only Inventory type C: Current Inventory N: New Inventory U: Under development
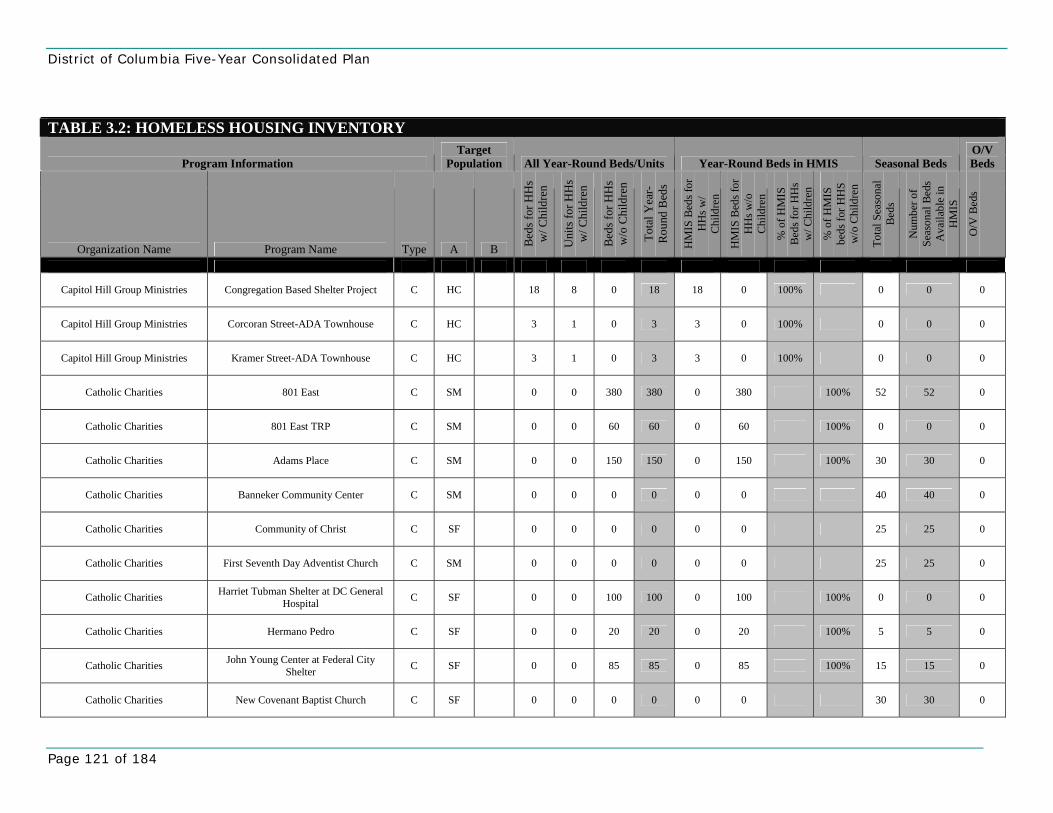
District of Columbia Five-Year Consolidated Plan
Page 121 of 184
TABLE 3.2: HOMELESS HOUSING INVENTORY
Program Information Target
Population All Year-Round Beds/Units Year-Round Beds in HMIS Seasonal Beds O/V Beds
Organization Name Program Name Type A B Bed
s for
HH
s w
/ Chi
ldre
n
Uni
ts fo
r HH
s w
/ Chi
ldre
n
Bed
s for
HH
s w
/o C
hild
ren
Tota
l Yea
r-R
ound
Bed
s
HM
IS B
eds f
or
HH
s w/
Chi
ldre
n
HM
IS B
eds f
or
HH
s w/o
C
hild
ren
% o
f HM
IS
Bed
s for
HH
s w
/ Chi
ldre
n
% o
f HM
IS
beds
for H
HS
w/o
Chi
ldre
n
Tota
l Sea
sona
l B
eds
Num
ber o
f Se
ason
al B
eds
Ava
ilabl
e in
H
MIS
O/V
Bed
s
Capitol Hill Group Ministries Congregation Based Shelter Project C HC 18 8 0 18 18 0 100% 0 0 0
Capitol Hill Group Ministries Corcoran Street-ADA Townhouse C HC 3 1 0 3 3 0 100% 0 0 0
Capitol Hill Group Ministries Kramer Street-ADA Townhouse C HC 3 1 0 3 3 0 100% 0 0 0
Catholic Charities 801 East C SM 0 0 380 380 0 380 100% 52 52 0
Catholic Charities 801 East TRP C SM 0 0 60 60 0 60 100% 0 0 0
Catholic Charities Adams Place C SM 0 0 150 150 0 150 100% 30 30 0
Catholic Charities Banneker Community Center C SM 0 0 0 0 0 0 40 40 0
Catholic Charities Community of Christ C SF 0 0 0 0 0 0 25 25 0
Catholic Charities First Seventh Day Adventist Church C SM 0 0 0 0 0 0 25 25 0
Catholic Charities Harriet Tubman Shelter at DC General Hospital C SF 0 0 100 100 0 100 100% 0 0 0
Catholic Charities Hermano Pedro C SF 0 0 20 20 0 20 100% 5 5 0
Catholic Charities John Young Center at Federal City Shelter C SF 0 0 85 85 0 85 100% 15 15 0
Catholic Charities New Covenant Baptist Church C SF 0 0 0 0 0 0 30 30 0
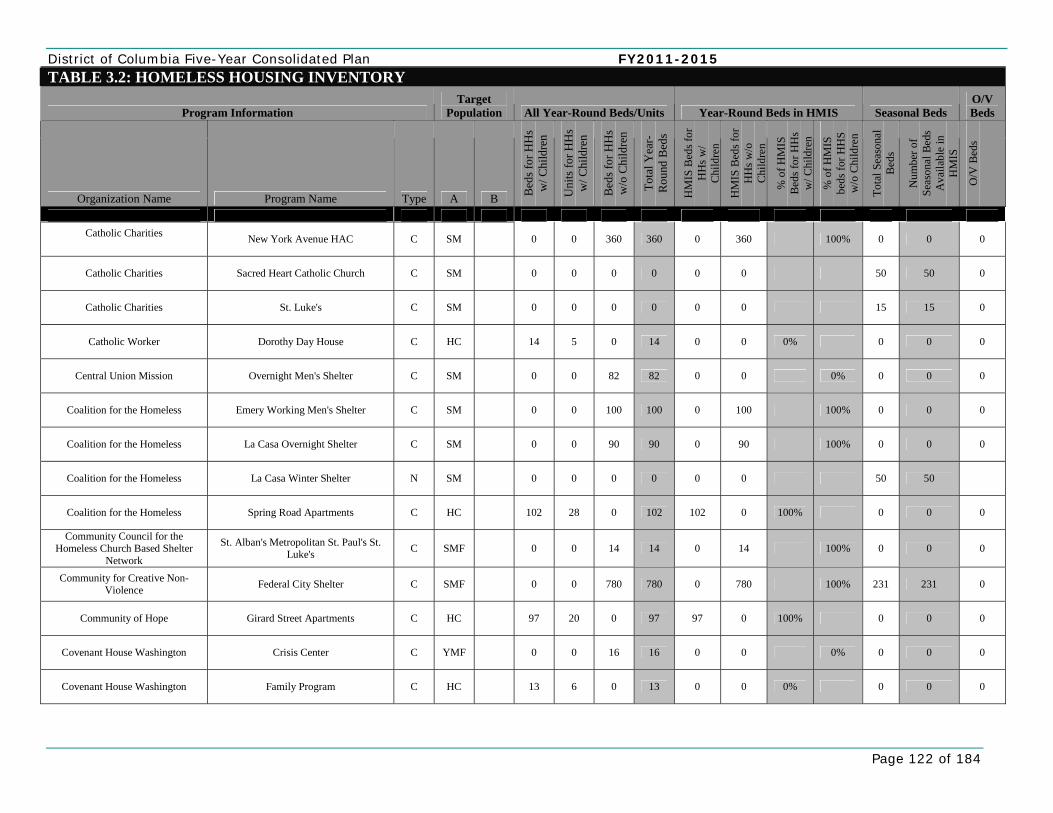
District of Columbia Five-Year Consolidated Plan FY2011-2015
Page 122 of 184
TABLE 3.2: HOMELESS HOUSING INVENTORY
Program Information Target
Population All Year-Round Beds/Units Year-Round Beds in HMIS Seasonal Beds O/V Beds
Organization Name Program Name Type A B Bed
s for
HH
s w
/ Chi
ldre
n
Uni
ts fo
r HH
s w
/ Chi
ldre
n
Bed
s for
HH
s w
/o C
hild
ren
Tota
l Yea
r-R
ound
Bed
s
HM
IS B
eds f
or
HH
s w/
Chi
ldre
n
HM
IS B
eds f
or
HH
s w/o
C
hild
ren
% o
f HM
IS
Bed
s for
HH
s w
/ Chi
ldre
n
% o
f HM
IS
beds
for H
HS
w/o
Chi
ldre
n
Tota
l Sea
sona
l B
eds
Num
ber o
f Se
ason
al B
eds
Ava
ilabl
e in
H
MIS
O/V
Bed
s
Catholic Charities
New York Avenue HAC C SM 0 0 360 360 0 360 100% 0 0 0
Catholic Charities Sacred Heart Catholic Church C SM 0 0 0 0 0 0 50 50 0
Catholic Charities St. Luke's C SM 0 0 0 0 0 0 15 15 0
Catholic Worker Dorothy Day House C HC 14 5 0 14 0 0 0% 0 0 0
Central Union Mission Overnight Men's Shelter C SM 0 0 82 82 0 0 0% 0 0 0
Coalition for the Homeless Emery Working Men's Shelter C SM 0 0 100 100 0 100 100% 0 0 0
Coalition for the Homeless La Casa Overnight Shelter C SM 0 0 90 90 0 90 100% 0 0 0
Coalition for the Homeless La Casa Winter Shelter N SM 0 0 0 0 0 0 50 50
Coalition for the Homeless Spring Road Apartments C HC 102 28 0 102 102 0 100% 0 0 0
Community Council for the Homeless Church Based Shelter
Network
St. Alban's Metropolitan St. Paul's St. Luke's C SMF 0 0 14 14 0 14 100% 0 0 0
Community for Creative Non-Violence Federal City Shelter C SMF 0 0 780 780 0 780 100% 231 231 0
Community of Hope Girard Street Apartments C HC 97 20 0 97 97 0 100% 0 0 0
Covenant House Washington Crisis Center C YMF 0 0 16 16 0 0 0% 0 0 0
Covenant House Washington Family Program C HC 13 6 0 13 0 0 0% 0 0 0
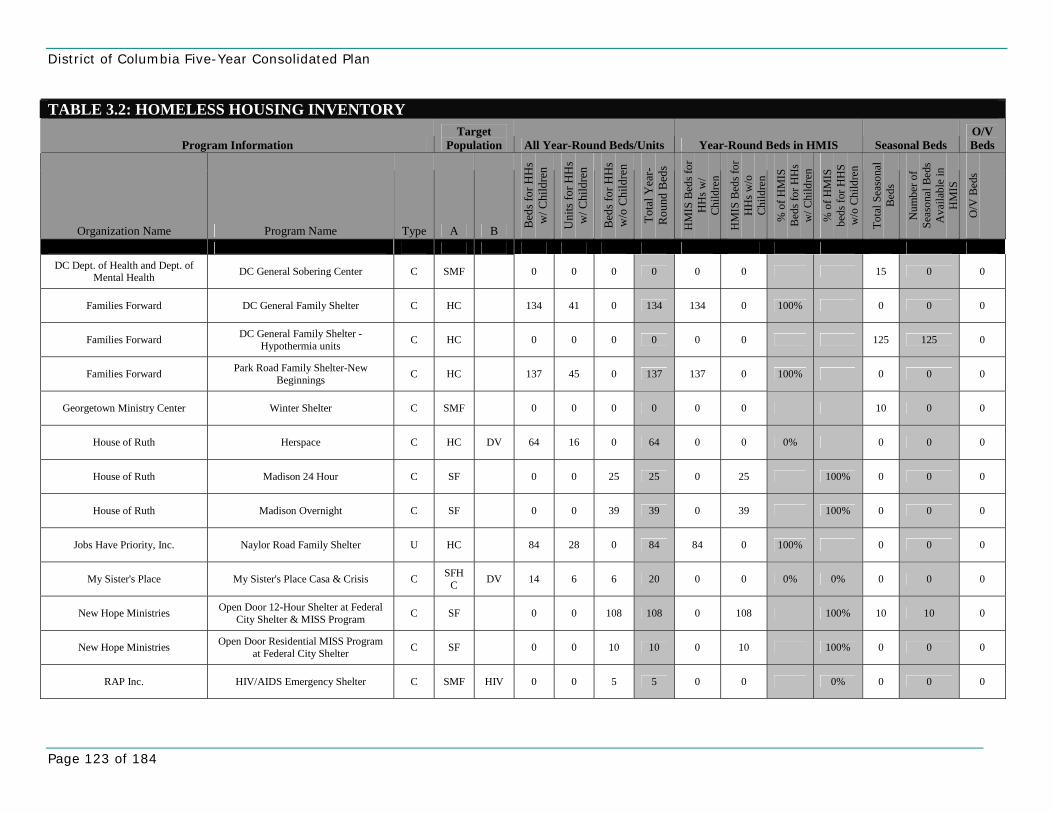
District of Columbia Five-Year Consolidated Plan
Page 123 of 184
TABLE 3.2: HOMELESS HOUSING INVENTORY
Program Information Target
Population All Year-Round Beds/Units Year-Round Beds in HMIS Seasonal Beds O/V Beds
Organization Name Program Name Type A B Bed
s for
HH
s w
/ Chi
ldre
n
Uni
ts fo
r HH
s w
/ Chi
ldre
n
Bed
s for
HH
s w
/o C
hild
ren
Tota
l Yea
r-R
ound
Bed
s
HM
IS B
eds f
or
HH
s w/
Chi
ldre
n
HM
IS B
eds f
or
HH
s w/o
C
hild
ren
% o
f HM
IS
Bed
s for
HH
s w
/ Chi
ldre
n
% o
f HM
IS
beds
for H
HS
w/o
Chi
ldre
n
Tota
l Sea
sona
l B
eds
Num
ber o
f Se
ason
al B
eds
Ava
ilabl
e in
H
MIS
O/V
Bed
s
DC Dept. of Health and Dept. of
Mental Health DC General Sobering Center C SMF 0 0 0 0 0 0 15 0 0
Families Forward DC General Family Shelter C HC 134 41 0 134 134 0 100% 0 0 0
Families Forward DC General Family Shelter - Hypothermia units C HC 0 0 0 0 0 0 125 125 0
Families Forward Park Road Family Shelter-New Beginnings C HC 137 45 0 137 137 0 100% 0 0 0
Georgetown Ministry Center Winter Shelter C SMF 0 0 0 0 0 0 10 0 0
House of Ruth Herspace C HC DV 64 16 0 64 0 0 0% 0 0 0
House of Ruth Madison 24 Hour C SF 0 0 25 25 0 25 100% 0 0 0
House of Ruth Madison Overnight C SF 0 0 39 39 0 39 100% 0 0 0
Jobs Have Priority, Inc. Naylor Road Family Shelter U HC 84 28 0 84 84 0 100% 0 0 0
My Sister's Place My Sister's Place Casa & Crisis C SFHC DV 14 6 6 20 0 0 0% 0% 0 0 0
New Hope Ministries Open Door 12-Hour Shelter at Federal City Shelter & MISS Program C SF 0 0 108 108 0 108 100% 10 10 0
New Hope Ministries Open Door Residential MISS Program at Federal City Shelter C SF 0 0 10 10 0 10 100% 0 0 0
RAP Inc. HIV/AIDS Emergency Shelter C SMF HIV 0 0 5 5 0 0 0% 0 0 0
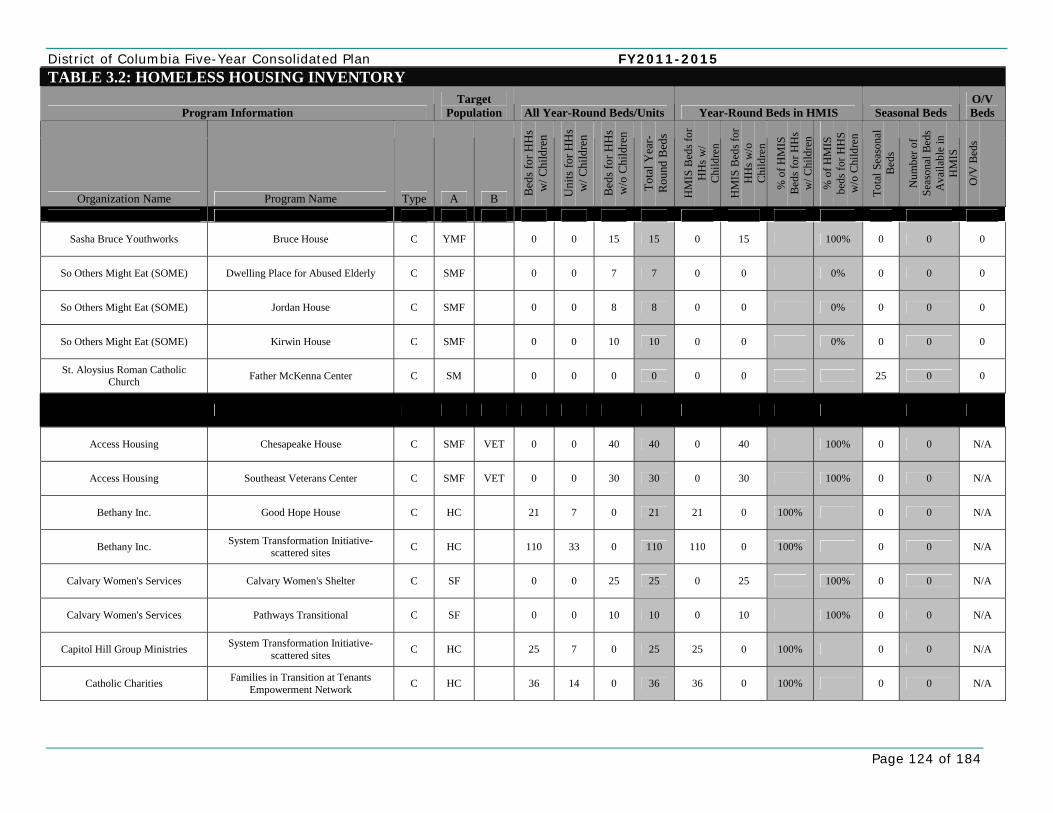
District of Columbia Five-Year Consolidated Plan FY2011-2015
Page 124 of 184
TABLE 3.2: HOMELESS HOUSING INVENTORY
Program Information Target
Population All Year-Round Beds/Units Year-Round Beds in HMIS Seasonal Beds O/V Beds
Organization Name Program Name Type A B Bed
s for
HH
s w
/ Chi
ldre
n
Uni
ts fo
r HH
s w
/ Chi
ldre
n
Bed
s for
HH
s w
/o C
hild
ren
Tota
l Yea
r-R
ound
Bed
s
HM
IS B
eds f
or
HH
s w/
Chi
ldre
n
HM
IS B
eds f
or
HH
s w/o
C
hild
ren
% o
f HM
IS
Bed
s for
HH
s w
/ Chi
ldre
n
% o
f HM
IS
beds
for H
HS
w/o
Chi
ldre
n
Tota
l Sea
sona
l B
eds
Num
ber o
f Se
ason
al B
eds
Ava
ilabl
e in
H
MIS
O/V
Bed
s
Sasha Bruce Youthworks Bruce House C YMF 0 0 15 15 0 15 100% 0 0 0
So Others Might Eat (SOME) Dwelling Place for Abused Elderly C SMF 0 0 7 7 0 0 0% 0 0 0
So Others Might Eat (SOME) Jordan House C SMF 0 0 8 8 0 0 0% 0 0 0
So Others Might Eat (SOME) Kirwin House C SMF 0 0 10 10 0 0 0% 0 0 0
St. Aloysius Roman Catholic Church Father McKenna Center C SM 0 0 0 0 0 0 25 0 0
Access Housing Chesapeake House C SMF VET 0 0 40 40 0 40 100% 0 0 N/A
Access Housing Southeast Veterans Center C SMF VET 0 0 30 30 0 30 100% 0 0 N/A
Bethany Inc. Good Hope House C HC 21 7 0 21 21 0 100% 0 0 N/A
Bethany Inc. System Transformation Initiative-scattered sites C HC 110 33 0 110 110 0 100% 0 0 N/A
Calvary Women's Services Calvary Women's Shelter C SF 0 0 25 25 0 25 100% 0 0 N/A
Calvary Women's Services Pathways Transitional C SF 0 0 10 10 0 10 100% 0 0 N/A
Capitol Hill Group Ministries System Transformation Initiative-scattered sites C HC 25 7 0 25 25 0 100% 0 0 N/A
Catholic Charities Families in Transition at Tenants Empowerment Network C HC 36 14 0 36 36 0 100% 0 0 N/A
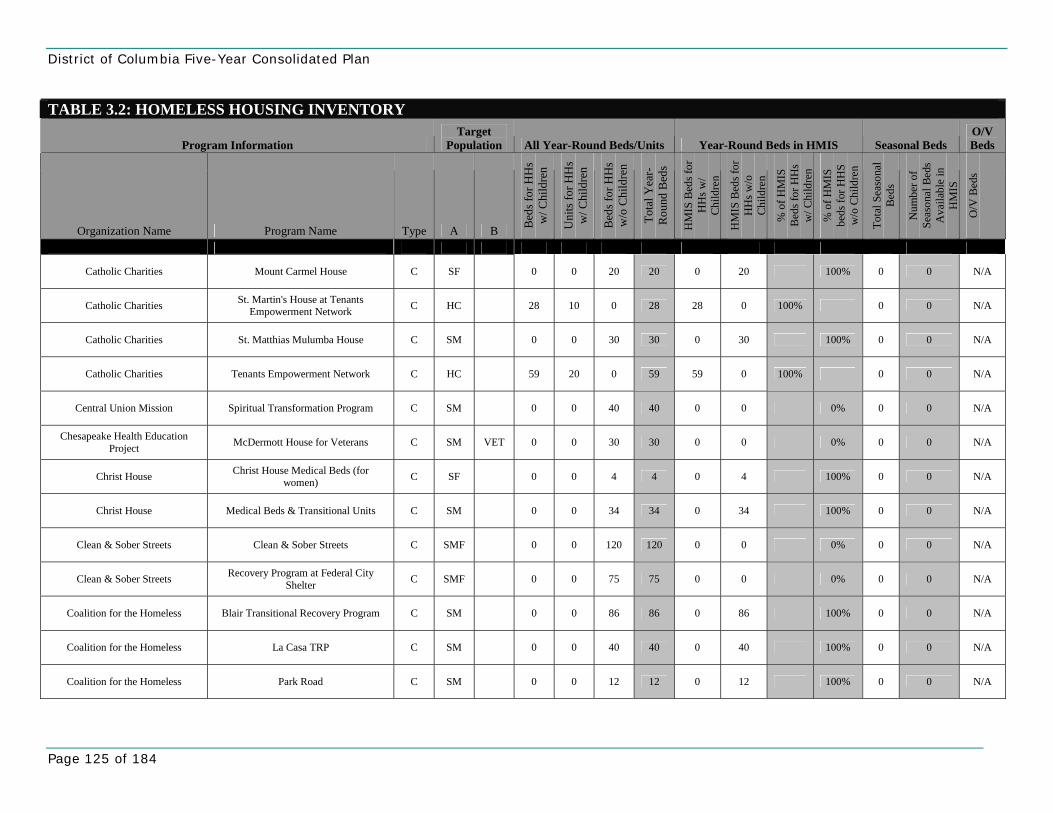
District of Columbia Five-Year Consolidated Plan
Page 125 of 184
TABLE 3.2: HOMELESS HOUSING INVENTORY
Program Information Target
Population All Year-Round Beds/Units Year-Round Beds in HMIS Seasonal Beds O/V Beds
Organization Name Program Name Type A B Bed
s for
HH
s w
/ Chi
ldre
n
Uni
ts fo
r HH
s w
/ Chi
ldre
n
Bed
s for
HH
s w
/o C
hild
ren
Tota
l Yea
r-R
ound
Bed
s
HM
IS B
eds f
or
HH
s w/
Chi
ldre
n
HM
IS B
eds f
or
HH
s w/o
C
hild
ren
% o
f HM
IS
Bed
s for
HH
s w
/ Chi
ldre
n
% o
f HM
IS
beds
for H
HS
w/o
Chi
ldre
n
Tota
l Sea
sona
l B
eds
Num
ber o
f Se
ason
al B
eds
Ava
ilabl
e in
H
MIS
O/V
Bed
s
Catholic Charities Mount Carmel House C SF 0 0 20 20 0 20 100% 0 0 N/A
Catholic Charities St. Martin's House at Tenants Empowerment Network C HC 28 10 0 28 28 0 100% 0 0 N/A
Catholic Charities St. Matthias Mulumba House C SM 0 0 30 30 0 30 100% 0 0 N/A
Catholic Charities Tenants Empowerment Network C HC 59 20 0 59 59 0 100% 0 0 N/A
Central Union Mission Spiritual Transformation Program C SM 0 0 40 40 0 0 0% 0 0 N/A
Chesapeake Health Education Project McDermott House for Veterans C SM VET 0 0 30 30 0 0 0% 0 0 N/A
Christ House Christ House Medical Beds (for women) C SF 0 0 4 4 0 4 100% 0 0 N/A
Christ House Medical Beds & Transitional Units C SM 0 0 34 34 0 34 100% 0 0 N/A
Clean & Sober Streets Clean & Sober Streets C SMF 0 0 120 120 0 0 0% 0 0 N/A
Clean & Sober Streets Recovery Program at Federal City Shelter C SMF 0 0 75 75 0 0 0% 0 0 N/A
Coalition for the Homeless Blair Transitional Recovery Program C SM 0 0 86 86 0 86 100% 0 0 N/A
Coalition for the Homeless La Casa TRP C SM 0 0 40 40 0 40 100% 0 0 N/A
Coalition for the Homeless Park Road C SM 0 0 12 12 0 12 100% 0 0 N/A
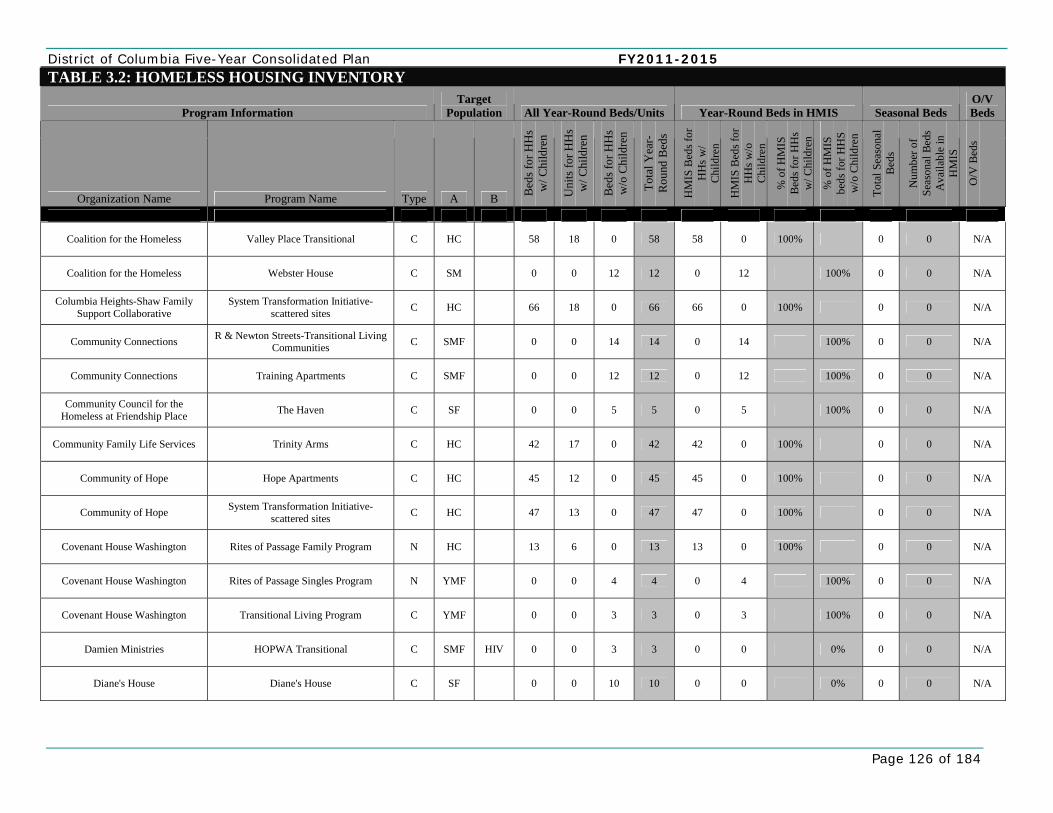
District of Columbia Five-Year Consolidated Plan FY2011-2015
Page 126 of 184
TABLE 3.2: HOMELESS HOUSING INVENTORY
Program Information Target
Population All Year-Round Beds/Units Year-Round Beds in HMIS Seasonal Beds O/V Beds
Organization Name Program Name Type A B Bed
s for
HH
s w
/ Chi
ldre
n
Uni
ts fo
r HH
s w
/ Chi
ldre
n
Bed
s for
HH
s w
/o C
hild
ren
Tota
l Yea
r-R
ound
Bed
s
HM
IS B
eds f
or
HH
s w/
Chi
ldre
n
HM
IS B
eds f
or
HH
s w/o
C
hild
ren
% o
f HM
IS
Bed
s for
HH
s w
/ Chi
ldre
n
% o
f HM
IS
beds
for H
HS
w/o
Chi
ldre
n
Tota
l Sea
sona
l B
eds
Num
ber o
f Se
ason
al B
eds
Ava
ilabl
e in
H
MIS
O/V
Bed
s
Coalition for the Homeless Valley Place Transitional C HC 58 18 0 58 58 0 100% 0 0 N/A
Coalition for the Homeless Webster House C SM 0 0 12 12 0 12 100% 0 0 N/A
Columbia Heights-Shaw Family Support Collaborative
System Transformation Initiative-scattered sites C HC 66 18 0 66 66 0 100% 0 0 N/A
Community Connections R & Newton Streets-Transitional Living Communities C SMF 0 0 14 14 0 14 100% 0 0 N/A
Community Connections Training Apartments C SMF 0 0 12 12 0 12 100% 0 0 N/A
Community Council for the Homeless at Friendship Place The Haven C SF 0 0 5 5 0 5 100% 0 0 N/A
Community Family Life Services Trinity Arms C HC 42 17 0 42 42 0 100% 0 0 N/A
Community of Hope Hope Apartments C HC 45 12 0 45 45 0 100% 0 0 N/A
Community of Hope System Transformation Initiative-scattered sites C HC 47 13 0 47 47 0 100% 0 0 N/A
Covenant House Washington Rites of Passage Family Program N HC 13 6 0 13 13 0 100% 0 0 N/A
Covenant House Washington Rites of Passage Singles Program N YMF 0 0 4 4 0 4 100% 0 0 N/A
Covenant House Washington Transitional Living Program C YMF 0 0 3 3 0 3 100% 0 0 N/A
Damien Ministries HOPWA Transitional C SMF HIV 0 0 3 3 0 0 0% 0 0 N/A
Diane's House Diane's House C SF 0 0 10 10 0 0 0% 0 0 N/A
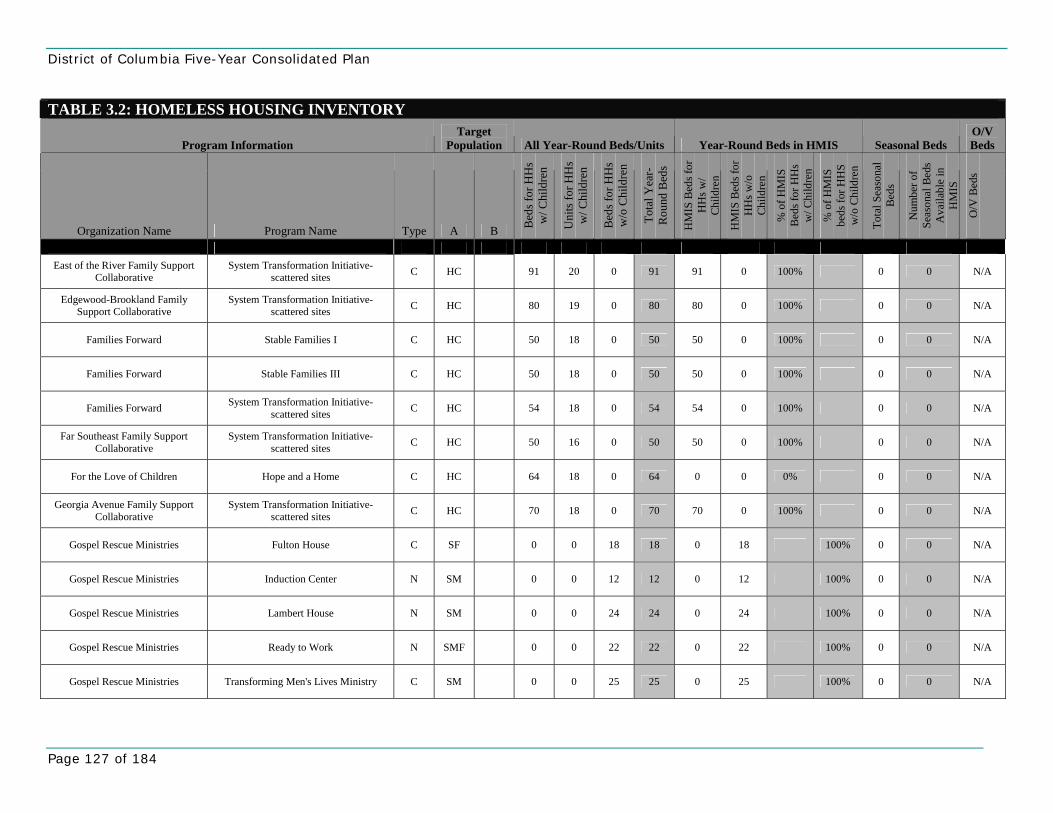
District of Columbia Five-Year Consolidated Plan
Page 127 of 184
TABLE 3.2: HOMELESS HOUSING INVENTORY
Program Information Target
Population All Year-Round Beds/Units Year-Round Beds in HMIS Seasonal Beds O/V Beds
Organization Name Program Name Type A B Bed
s for
HH
s w
/ Chi
ldre
n
Uni
ts fo
r HH
s w
/ Chi
ldre
n
Bed
s for
HH
s w
/o C
hild
ren
Tota
l Yea
r-R
ound
Bed
s
HM
IS B
eds f
or
HH
s w/
Chi
ldre
n
HM
IS B
eds f
or
HH
s w/o
C
hild
ren
% o
f HM
IS
Bed
s for
HH
s w
/ Chi
ldre
n
% o
f HM
IS
beds
for H
HS
w/o
Chi
ldre
n
Tota
l Sea
sona
l B
eds
Num
ber o
f Se
ason
al B
eds
Ava
ilabl
e in
H
MIS
O/V
Bed
s
East of the River Family Support
Collaborative System Transformation Initiative-
scattered sites C HC 91 20 0 91 91 0 100% 0 0 N/A
Edgewood-Brookland Family Support Collaborative
System Transformation Initiative-scattered sites C HC 80 19 0 80 80 0 100% 0 0 N/A
Families Forward Stable Families I C HC 50 18 0 50 50 0 100% 0 0 N/A
Families Forward Stable Families III C HC 50 18 0 50 50 0 100% 0 0 N/A
Families Forward System Transformation Initiative-scattered sites C HC 54 18 0 54 54 0 100% 0 0 N/A
Far Southeast Family Support Collaborative
System Transformation Initiative-scattered sites C HC 50 16 0 50 50 0 100% 0 0 N/A
For the Love of Children Hope and a Home C HC 64 18 0 64 0 0 0% 0 0 N/A
Georgia Avenue Family Support Collaborative
System Transformation Initiative-scattered sites C HC 70 18 0 70 70 0 100% 0 0 N/A
Gospel Rescue Ministries Fulton House C SF 0 0 18 18 0 18 100% 0 0 N/A
Gospel Rescue Ministries Induction Center N SM 0 0 12 12 0 12 100% 0 0 N/A
Gospel Rescue Ministries Lambert House N SM 0 0 24 24 0 24 100% 0 0 N/A
Gospel Rescue Ministries Ready to Work N SMF 0 0 22 22 0 22 100% 0 0 N/A
Gospel Rescue Ministries Transforming Men's Lives Ministry C SM 0 0 25 25 0 25 100% 0 0 N/A
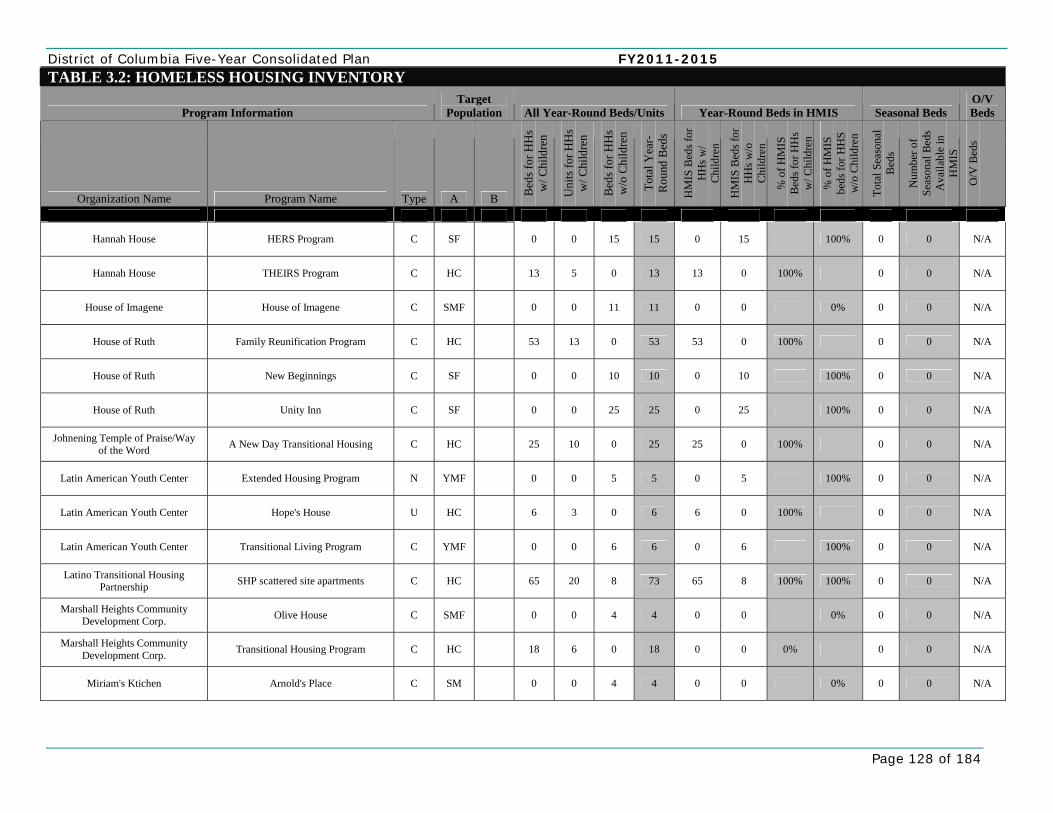
District of Columbia Five-Year Consolidated Plan FY2011-2015
Page 128 of 184
TABLE 3.2: HOMELESS HOUSING INVENTORY
Program Information Target
Population All Year-Round Beds/Units Year-Round Beds in HMIS Seasonal Beds O/V Beds
Organization Name Program Name Type A B Bed
s for
HH
s w
/ Chi
ldre
n
Uni
ts fo
r HH
s w
/ Chi
ldre
n
Bed
s for
HH
s w
/o C
hild
ren
Tota
l Yea
r-R
ound
Bed
s
HM
IS B
eds f
or
HH
s w/
Chi
ldre
n
HM
IS B
eds f
or
HH
s w/o
C
hild
ren
% o
f HM
IS
Bed
s for
HH
s w
/ Chi
ldre
n
% o
f HM
IS
beds
for H
HS
w/o
Chi
ldre
n
Tota
l Sea
sona
l B
eds
Num
ber o
f Se
ason
al B
eds
Ava
ilabl
e in
H
MIS
O/V
Bed
s
Hannah House HERS Program C SF 0 0 15 15 0 15 100% 0 0 N/A
Hannah House THEIRS Program C HC 13 5 0 13 13 0 100% 0 0 N/A
House of Imagene House of Imagene C SMF 0 0 11 11 0 0 0% 0 0 N/A
House of Ruth Family Reunification Program C HC 53 13 0 53 53 0 100% 0 0 N/A
House of Ruth New Beginnings C SF 0 0 10 10 0 10 100% 0 0 N/A
House of Ruth Unity Inn C SF 0 0 25 25 0 25 100% 0 0 N/A
Johnening Temple of Praise/Way of the Word A New Day Transitional Housing C HC 25 10 0 25 25 0 100% 0 0 N/A
Latin American Youth Center Extended Housing Program N YMF 0 0 5 5 0 5 100% 0 0 N/A
Latin American Youth Center Hope's House U HC 6 3 0 6 6 0 100% 0 0 N/A
Latin American Youth Center Transitional Living Program C YMF 0 0 6 6 0 6 100% 0 0 N/A
Latino Transitional Housing Partnership SHP scattered site apartments C HC 65 20 8 73 65 8 100% 100% 0 0 N/A
Marshall Heights Community Development Corp. Olive House C SMF 0 0 4 4 0 0 0% 0 0 N/A
Marshall Heights Community Development Corp. Transitional Housing Program C HC 18 6 0 18 0 0 0% 0 0 N/A
Miriam's Ktichen Arnold's Place C SM 0 0 4 4 0 0 0% 0 0 N/A
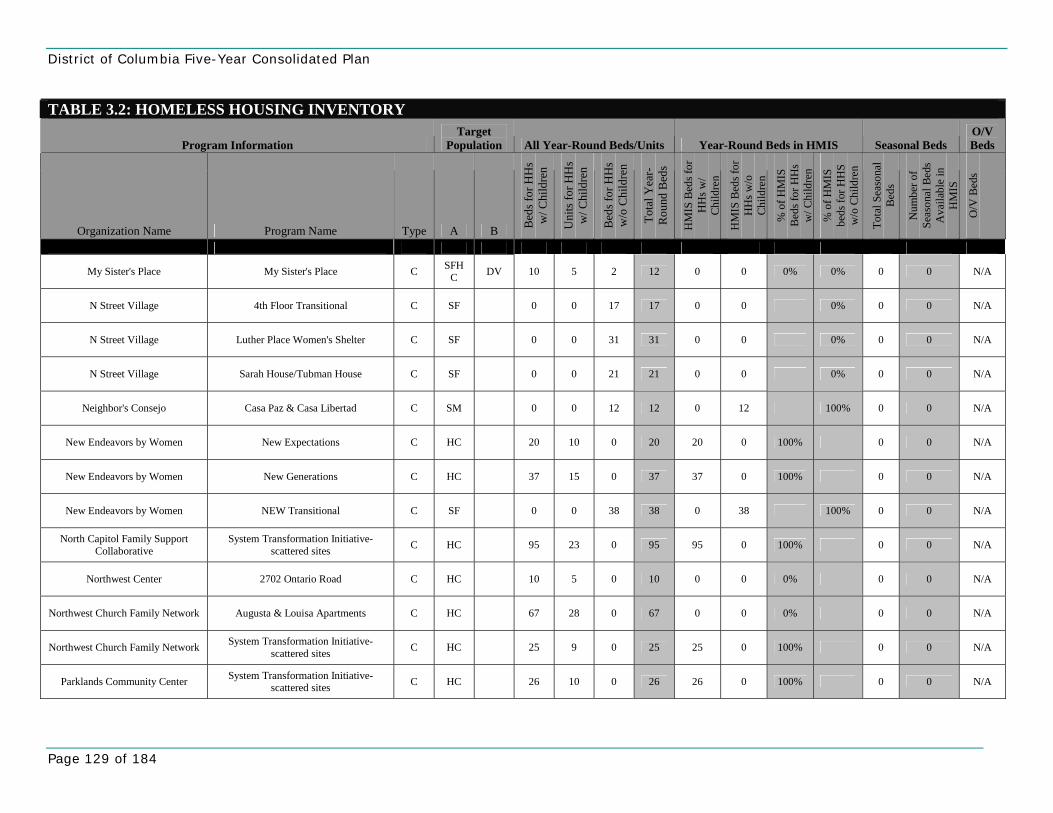
District of Columbia Five-Year Consolidated Plan
Page 129 of 184
TABLE 3.2: HOMELESS HOUSING INVENTORY
Program Information Target
Population All Year-Round Beds/Units Year-Round Beds in HMIS Seasonal Beds O/V Beds
Organization Name Program Name Type A B Bed
s for
HH
s w
/ Chi
ldre
n
Uni
ts fo
r HH
s w
/ Chi
ldre
n
Bed
s for
HH
s w
/o C
hild
ren
Tota
l Yea
r-R
ound
Bed
s
HM
IS B
eds f
or
HH
s w/
Chi
ldre
n
HM
IS B
eds f
or
HH
s w/o
C
hild
ren
% o
f HM
IS
Bed
s for
HH
s w
/ Chi
ldre
n
% o
f HM
IS
beds
for H
HS
w/o
Chi
ldre
n
Tota
l Sea
sona
l B
eds
Num
ber o
f Se
ason
al B
eds
Ava
ilabl
e in
H
MIS
O/V
Bed
s
My Sister's Place My Sister's Place C SFHC DV 10 5 2 12 0 0 0% 0% 0 0 N/A
N Street Village 4th Floor Transitional C SF 0 0 17 17 0 0 0% 0 0 N/A
N Street Village Luther Place Women's Shelter C SF 0 0 31 31 0 0 0% 0 0 N/A
N Street Village Sarah House/Tubman House C SF 0 0 21 21 0 0 0% 0 0 N/A
Neighbor's Consejo Casa Paz & Casa Libertad C SM 0 0 12 12 0 12 100% 0 0 N/A
New Endeavors by Women New Expectations C HC 20 10 0 20 20 0 100% 0 0 N/A
New Endeavors by Women New Generations C HC 37 15 0 37 37 0 100% 0 0 N/A
New Endeavors by Women NEW Transitional C SF 0 0 38 38 0 38 100% 0 0 N/A
North Capitol Family Support Collaborative
System Transformation Initiative-scattered sites C HC 95 23 0 95 95 0 100% 0 0 N/A
Northwest Center 2702 Ontario Road C HC 10 5 0 10 0 0 0% 0 0 N/A
Northwest Church Family Network Augusta & Louisa Apartments C HC 67 28 0 67 0 0 0% 0 0 N/A
Northwest Church Family Network System Transformation Initiative-scattered sites C HC 25 9 0 25 25 0 100% 0 0 N/A
Parklands Community Center System Transformation Initiative-scattered sites C HC 26 10 0 26 26 0 100% 0 0 N/A

District of Columbia Five-Year Consolidated Plan FY2011-2015
Page 130 of 184
TABLE 3.2: HOMELESS HOUSING INVENTORY
Program Information Target
Population All Year-Round Beds/Units Year-Round Beds in HMIS Seasonal Beds O/V Beds
Organization Name Program Name Type A B Bed
s for
HH
s w
/ Chi
ldre
n
Uni
ts fo
r HH
s w
/ Chi
ldre
n
Bed
s for
HH
s w
/o C
hild
ren
Tota
l Yea
r-R
ound
Bed
s
HM
IS B
eds f
or
HH
s w/
Chi
ldre
n
HM
IS B
eds f
or
HH
s w/o
C
hild
ren
% o
f HM
IS
Bed
s for
HH
s w
/ Chi
ldre
n
% o
f HM
IS
beds
for H
HS
w/o
Chi
ldre
n
Tota
l Sea
sona
l B
eds
Num
ber o
f Se
ason
al B
eds
Ava
ilabl
e in
H
MIS
O/V
Bed
s
Safe Haven Outreach Sibley Plaza C SMF 0 0 60 60 0 0 0% 0 0 N/A
Salvation Army Harbor Light C SMF 0 0 33 33 0 33 100% 0 0 N/A
Salvation Army Turning Point C HC 85 28 0 85 0 0 0% 0 0 N/A
Samaritan Inns Intensive Recovery Program C SMF 0 0 16 16 0 0 0% 0 0 N/A
Samaritan Inns Trans. Living Program (men) C SM 0 0 8 8 0 0 0% 0 0 N/A
Samaritan Inns Trans. Living Program (women) C SF 0 0 16 16 0 0 0% 0 0 N/A
Sasha Bruce Youthworks Independent Living Program C YMF 0 0 12 12 0 12 100% 0 0 N/A
Sasha Bruce Youthworks Olaiya's Cradle (teen mothers) C HC 10 5 0 10 10 0 100% 0 0 N/A
Sasha Bruce Youthworks Transitional Living Program C YMF 0 0 10 10 0 10 100% 0 0 N/A
So Others Might Eat (SOME) Exodus House C SM 0 0 18 18 0 18 100% 0 0 N/A
So Others Might Eat (SOME) Kuehner House N SF 0 0 6 6 0 0 0% 0 0 N/A
So Others Might Eat (SOME) Leland Place C SM 0 0 15 15 0 15 100% 0 0 N/A
So Others Might Eat (SOME) Mary Claire House C SMF 0 0 10 10 0 0 0% 0 0 N/A
So Others Might Eat (SOME) Maya Angelou/Harvest House C SF 0 0 27 27 0 27 100% 0 0 N/A
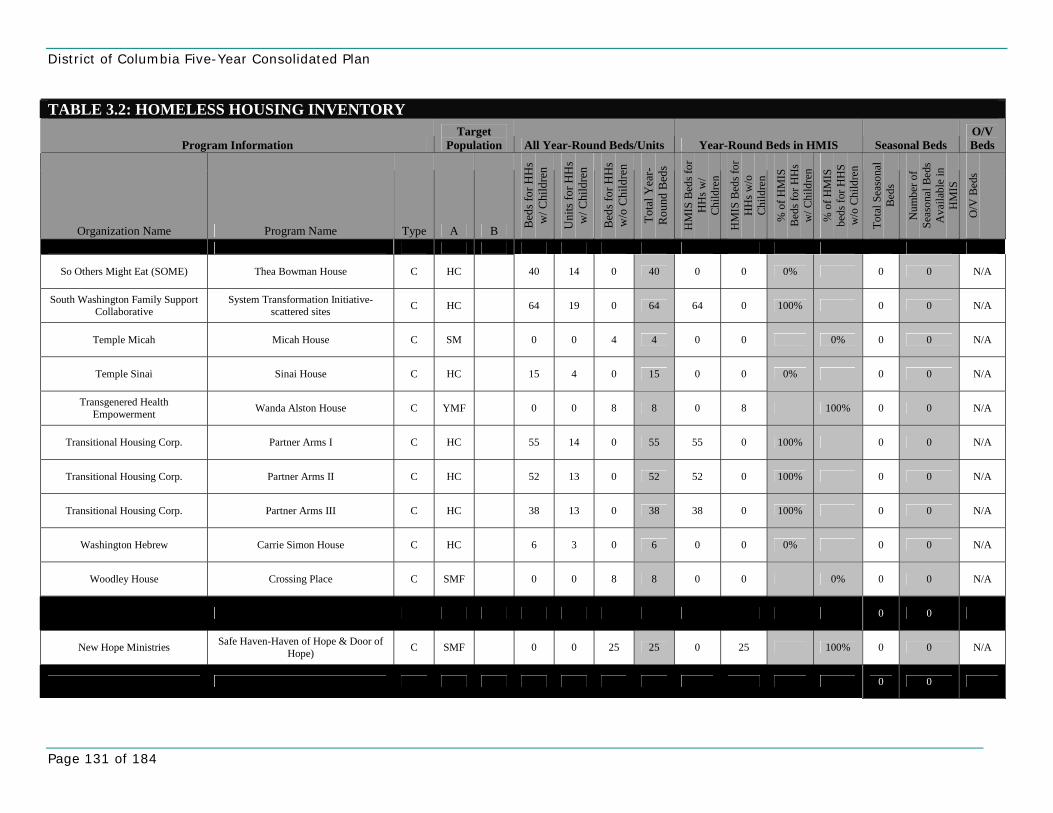
District of Columbia Five-Year Consolidated Plan
Page 131 of 184
TABLE 3.2: HOMELESS HOUSING INVENTORY
Program Information Target
Population All Year-Round Beds/Units Year-Round Beds in HMIS Seasonal Beds O/V Beds
Organization Name Program Name Type A B Bed
s for
HH
s w
/ Chi
ldre
n
Uni
ts fo
r HH
s w
/ Chi
ldre
n
Bed
s for
HH
s w
/o C
hild
ren
Tota
l Yea
r-R
ound
Bed
s
HM
IS B
eds f
or
HH
s w/
Chi
ldre
n
HM
IS B
eds f
or
HH
s w/o
C
hild
ren
% o
f HM
IS
Bed
s for
HH
s w
/ Chi
ldre
n
% o
f HM
IS
beds
for H
HS
w/o
Chi
ldre
n
Tota
l Sea
sona
l B
eds
Num
ber o
f Se
ason
al B
eds
Ava
ilabl
e in
H
MIS
O/V
Bed
s
So Others Might Eat (SOME) Thea Bowman House C HC 40 14 0 40 0 0 0% 0 0 N/A
South Washington Family Support Collaborative
System Transformation Initiative-scattered sites C HC 64 19 0 64 64 0 100% 0 0 N/A
Temple Micah Micah House C SM 0 0 4 4 0 0 0% 0 0 N/A
Temple Sinai Sinai House C HC 15 4 0 15 0 0 0% 0 0 N/A
Transgenered Health Empowerment Wanda Alston House C YMF 0 0 8 8 0 8 100% 0 0 N/A
Transitional Housing Corp. Partner Arms I C HC 55 14 0 55 55 0 100% 0 0 N/A
Transitional Housing Corp. Partner Arms II C HC 52 13 0 52 52 0 100% 0 0 N/A
Transitional Housing Corp. Partner Arms III C HC 38 13 0 38 38 0 100% 0 0 N/A
Washington Hebrew Carrie Simon House C HC 6 3 0 6 0 0 0% 0 0 N/A
Woodley House Crossing Place C SMF 0 0 8 8 0 0 0% 0 0 N/A
0 0
New Hope Ministries Safe Haven-Haven of Hope & Door of Hope) C SMF 0 0 25 25 0 25 100% 0 0 N/A
0 0
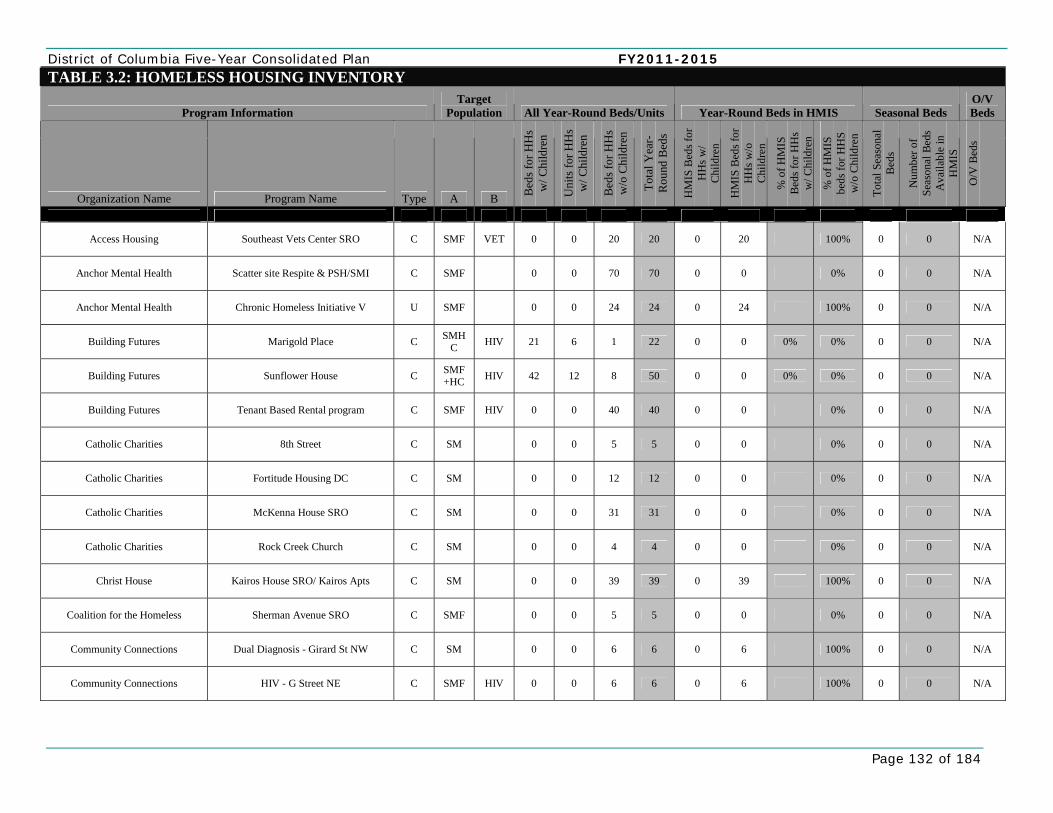
District of Columbia Five-Year Consolidated Plan FY2011-2015
Page 132 of 184
TABLE 3.2: HOMELESS HOUSING INVENTORY
Program Information Target
Population All Year-Round Beds/Units Year-Round Beds in HMIS Seasonal Beds O/V Beds
Organization Name Program Name Type A B Bed
s for
HH
s w
/ Chi
ldre
n
Uni
ts fo
r HH
s w
/ Chi
ldre
n
Bed
s for
HH
s w
/o C
hild
ren
Tota
l Yea
r-R
ound
Bed
s
HM
IS B
eds f
or
HH
s w/
Chi
ldre
n
HM
IS B
eds f
or
HH
s w/o
C
hild
ren
% o
f HM
IS
Bed
s for
HH
s w
/ Chi
ldre
n
% o
f HM
IS
beds
for H
HS
w/o
Chi
ldre
n
Tota
l Sea
sona
l B
eds
Num
ber o
f Se
ason
al B
eds
Ava
ilabl
e in
H
MIS
O/V
Bed
s
Access Housing Southeast Vets Center SRO C SMF VET 0 0 20 20 0 20 100% 0 0 N/A
Anchor Mental Health Scatter site Respite & PSH/SMI C SMF 0 0 70 70 0 0 0% 0 0 N/A
Anchor Mental Health Chronic Homeless Initiative V U SMF 0 0 24 24 0 24 100% 0 0 N/A
Building Futures Marigold Place C SMHC HIV 21 6 1 22 0 0 0% 0% 0 0 N/A
Building Futures Sunflower House C SMF+HC HIV 42 12 8 50 0 0 0% 0% 0 0 N/A
Building Futures Tenant Based Rental program C SMF HIV 0 0 40 40 0 0 0% 0 0 N/A
Catholic Charities 8th Street C SM 0 0 5 5 0 0 0% 0 0 N/A
Catholic Charities Fortitude Housing DC C SM 0 0 12 12 0 0 0% 0 0 N/A
Catholic Charities McKenna House SRO C SM 0 0 31 31 0 0 0% 0 0 N/A
Catholic Charities Rock Creek Church C SM 0 0 4 4 0 0 0% 0 0 N/A
Christ House Kairos House SRO/ Kairos Apts C SM 0 0 39 39 0 39 100% 0 0 N/A
Coalition for the Homeless Sherman Avenue SRO C SMF 0 0 5 5 0 0 0% 0 0 N/A
Community Connections Dual Diagnosis - Girard St NW C SM 0 0 6 6 0 6 100% 0 0 N/A
Community Connections HIV - G Street NE C SMF HIV 0 0 6 6 0 6 100% 0 0 N/A
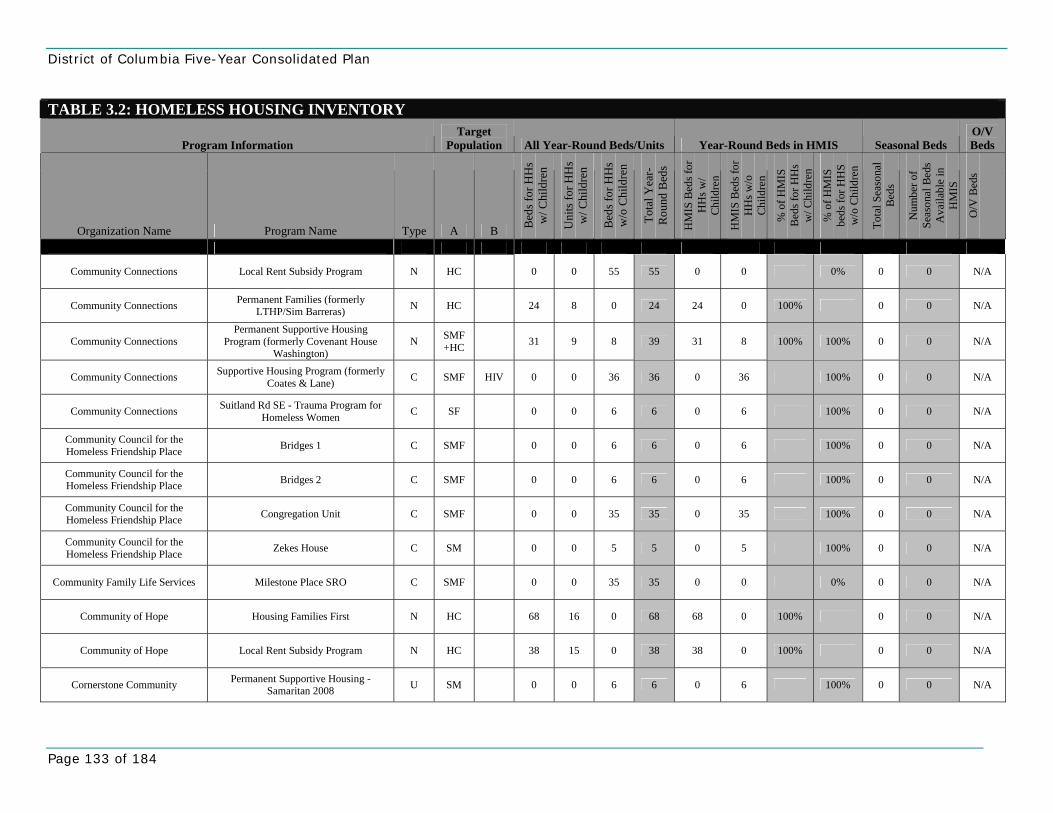
District of Columbia Five-Year Consolidated Plan
Page 133 of 184
TABLE 3.2: HOMELESS HOUSING INVENTORY
Program Information Target
Population All Year-Round Beds/Units Year-Round Beds in HMIS Seasonal Beds O/V Beds
Organization Name Program Name Type A B Bed
s for
HH
s w
/ Chi
ldre
n
Uni
ts fo
r HH
s w
/ Chi
ldre
n
Bed
s for
HH
s w
/o C
hild
ren
Tota
l Yea
r-R
ound
Bed
s
HM
IS B
eds f
or
HH
s w/
Chi
ldre
n
HM
IS B
eds f
or
HH
s w/o
C
hild
ren
% o
f HM
IS
Bed
s for
HH
s w
/ Chi
ldre
n
% o
f HM
IS
beds
for H
HS
w/o
Chi
ldre
n
Tota
l Sea
sona
l B
eds
Num
ber o
f Se
ason
al B
eds
Ava
ilabl
e in
H
MIS
O/V
Bed
s
Community Connections Local Rent Subsidy Program N HC 0 0 55 55 0 0 0% 0 0 N/A
Community Connections Permanent Families (formerly LTHP/Sim Barreras) N HC 24 8 0 24 24 0 100% 0 0 N/A
Community Connections Permanent Supportive Housing
Program (formerly Covenant House Washington)
N SMF+HC 31 9 8 39 31 8 100% 100% 0 0 N/A
Community Connections Supportive Housing Program (formerly Coates & Lane) C SMF HIV 0 0 36 36 0 36 100% 0 0 N/A
Community Connections Suitland Rd SE - Trauma Program for Homeless Women C SF 0 0 6 6 0 6 100% 0 0 N/A
Community Council for the Homeless Friendship Place Bridges 1 C SMF 0 0 6 6 0 6 100% 0 0 N/A
Community Council for the Homeless Friendship Place Bridges 2 C SMF 0 0 6 6 0 6 100% 0 0 N/A
Community Council for the Homeless Friendship Place Congregation Unit C SMF 0 0 35 35 0 35 100% 0 0 N/A
Community Council for the Homeless Friendship Place Zekes House C SM 0 0 5 5 0 5 100% 0 0 N/A
Community Family Life Services Milestone Place SRO C SMF 0 0 35 35 0 0 0% 0 0 N/A
Community of Hope Housing Families First N HC 68 16 0 68 68 0 100% 0 0 N/A
Community of Hope Local Rent Subsidy Program N HC 38 15 0 38 38 0 100% 0 0 N/A
Cornerstone Community Permanent Supportive Housing - Samaritan 2008 U SM 0 0 6 6 0 6 100% 0 0 N/A
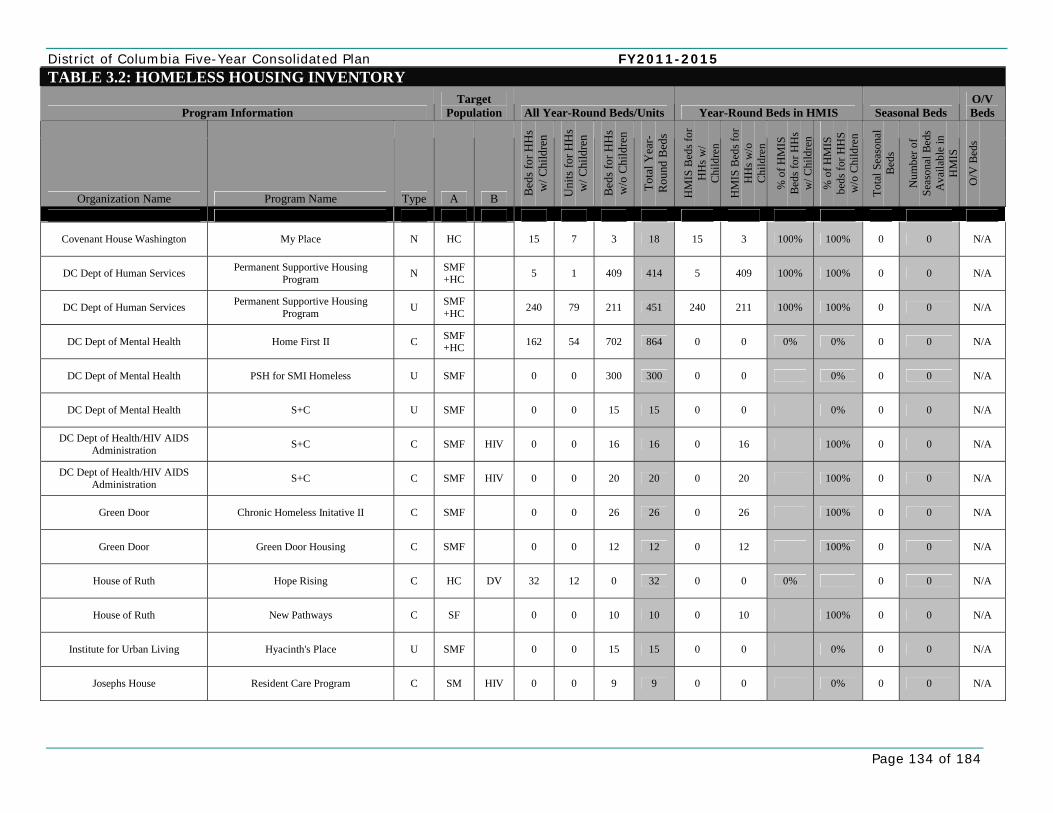
District of Columbia Five-Year Consolidated Plan FY2011-2015
Page 134 of 184
TABLE 3.2: HOMELESS HOUSING INVENTORY
Program Information Target
Population All Year-Round Beds/Units Year-Round Beds in HMIS Seasonal Beds O/V Beds
Organization Name Program Name Type A B Bed
s for
HH
s w
/ Chi
ldre
n
Uni
ts fo
r HH
s w
/ Chi
ldre
n
Bed
s for
HH
s w
/o C
hild
ren
Tota
l Yea
r-R
ound
Bed
s
HM
IS B
eds f
or
HH
s w/
Chi
ldre
n
HM
IS B
eds f
or
HH
s w/o
C
hild
ren
% o
f HM
IS
Bed
s for
HH
s w
/ Chi
ldre
n
% o
f HM
IS
beds
for H
HS
w/o
Chi
ldre
n
Tota
l Sea
sona
l B
eds
Num
ber o
f Se
ason
al B
eds
Ava
ilabl
e in
H
MIS
O/V
Bed
s
Covenant House Washington My Place N HC 15 7 3 18 15 3 100% 100% 0 0 N/A
DC Dept of Human Services Permanent Supportive Housing Program N SMF
+HC 5 1 409 414 5 409 100% 100% 0 0 N/A
DC Dept of Human Services Permanent Supportive Housing Program U SMF
+HC 240 79 211 451 240 211 100% 100% 0 0 N/A
DC Dept of Mental Health Home First II C SMF+HC 162 54 702 864 0 0 0% 0% 0 0 N/A
DC Dept of Mental Health PSH for SMI Homeless U SMF 0 0 300 300 0 0 0% 0 0 N/A
DC Dept of Mental Health S+C U SMF 0 0 15 15 0 0 0% 0 0 N/A
DC Dept of Health/HIV AIDS Administration S+C C SMF HIV 0 0 16 16 0 16 100% 0 0 N/A
DC Dept of Health/HIV AIDS Administration S+C C SMF HIV 0 0 20 20 0 20 100% 0 0 N/A
Green Door Chronic Homeless Initative II C SMF 0 0 26 26 0 26 100% 0 0 N/A
Green Door Green Door Housing C SMF 0 0 12 12 0 12 100% 0 0 N/A
House of Ruth Hope Rising C HC DV 32 12 0 32 0 0 0% 0 0 N/A
House of Ruth New Pathways C SF 0 0 10 10 0 10 100% 0 0 N/A
Institute for Urban Living Hyacinth's Place U SMF 0 0 15 15 0 0 0% 0 0 N/A
Josephs House Resident Care Program C SM HIV 0 0 9 9 0 0 0% 0 0 N/A
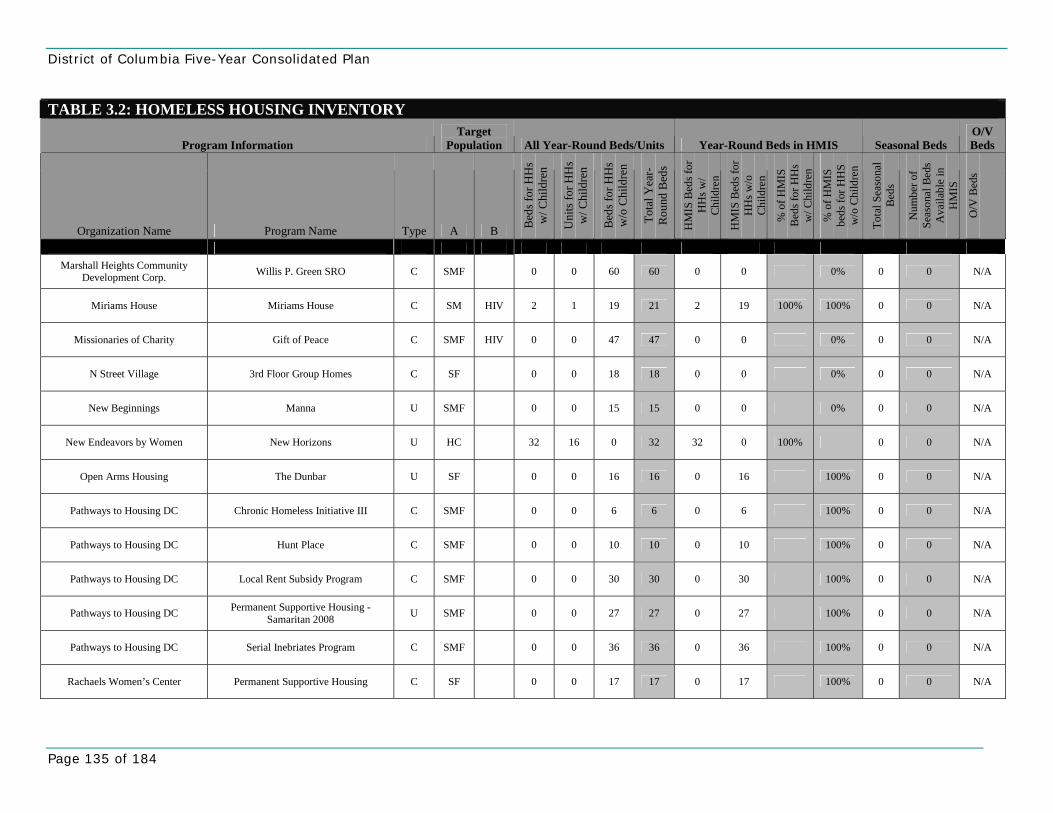
District of Columbia Five-Year Consolidated Plan
Page 135 of 184
TABLE 3.2: HOMELESS HOUSING INVENTORY
Program Information Target
Population All Year-Round Beds/Units Year-Round Beds in HMIS Seasonal Beds O/V Beds
Organization Name Program Name Type A B Bed
s for
HH
s w
/ Chi
ldre
n
Uni
ts fo
r HH
s w
/ Chi
ldre
n
Bed
s for
HH
s w
/o C
hild
ren
Tota
l Yea
r-R
ound
Bed
s
HM
IS B
eds f
or
HH
s w/
Chi
ldre
n
HM
IS B
eds f
or
HH
s w/o
C
hild
ren
% o
f HM
IS
Bed
s for
HH
s w
/ Chi
ldre
n
% o
f HM
IS
beds
for H
HS
w/o
Chi
ldre
n
Tota
l Sea
sona
l B
eds
Num
ber o
f Se
ason
al B
eds
Ava
ilabl
e in
H
MIS
O/V
Bed
s
Marshall Heights Community
Development Corp. Willis P. Green SRO C SMF 0 0 60 60 0 0 0% 0 0 N/A
Miriams House Miriams House C SM HIV 2 1 19 21 2 19 100% 100% 0 0 N/A
Missionaries of Charity Gift of Peace C SMF HIV 0 0 47 47 0 0 0% 0 0 N/A
N Street Village 3rd Floor Group Homes C SF 0 0 18 18 0 0 0% 0 0 N/A
New Beginnings Manna U SMF 0 0 15 15 0 0 0% 0 0 N/A
New Endeavors by Women New Horizons U HC 32 16 0 32 32 0 100% 0 0 N/A
Open Arms Housing The Dunbar U SF 0 0 16 16 0 16 100% 0 0 N/A
Pathways to Housing DC Chronic Homeless Initiative III C SMF 0 0 6 6 0 6 100% 0 0 N/A
Pathways to Housing DC Hunt Place C SMF 0 0 10 10 0 10 100% 0 0 N/A
Pathways to Housing DC Local Rent Subsidy Program C SMF 0 0 30 30 0 30 100% 0 0 N/A
Pathways to Housing DC Permanent Supportive Housing - Samaritan 2008 U SMF 0 0 27 27 0 27 100% 0 0 N/A
Pathways to Housing DC Serial Inebriates Program C SMF 0 0 36 36 0 36 100% 0 0 N/A
Rachaels Women’s Center Permanent Supportive Housing C SF 0 0 17 17 0 17 100% 0 0 N/A
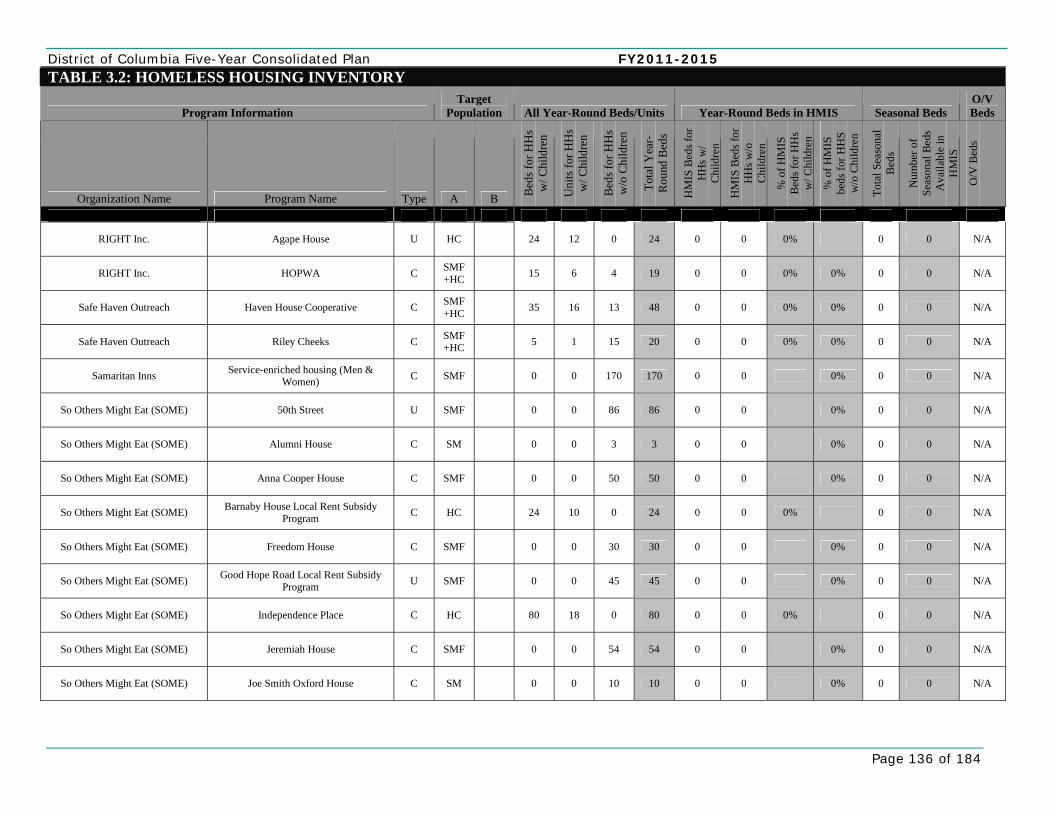
District of Columbia Five-Year Consolidated Plan FY2011-2015
Page 136 of 184
TABLE 3.2: HOMELESS HOUSING INVENTORY
Program Information Target
Population All Year-Round Beds/Units Year-Round Beds in HMIS Seasonal Beds O/V Beds
Organization Name Program Name Type A B Bed
s for
HH
s w
/ Chi
ldre
n
Uni
ts fo
r HH
s w
/ Chi
ldre
n
Bed
s for
HH
s w
/o C
hild
ren
Tota
l Yea
r-R
ound
Bed
s
HM
IS B
eds f
or
HH
s w/
Chi
ldre
n
HM
IS B
eds f
or
HH
s w/o
C
hild
ren
% o
f HM
IS
Bed
s for
HH
s w
/ Chi
ldre
n
% o
f HM
IS
beds
for H
HS
w/o
Chi
ldre
n
Tota
l Sea
sona
l B
eds
Num
ber o
f Se
ason
al B
eds
Ava
ilabl
e in
H
MIS
O/V
Bed
s
RIGHT Inc. Agape House U HC 24 12 0 24 0 0 0% 0 0 N/A
RIGHT Inc. HOPWA C SMF+HC 15 6 4 19 0 0 0% 0% 0 0 N/A
Safe Haven Outreach Haven House Cooperative C SMF+HC 35 16 13 48 0 0 0% 0% 0 0 N/A
Safe Haven Outreach Riley Cheeks C SMF+HC 5 1 15 20 0 0 0% 0% 0 0 N/A
Samaritan Inns Service-enriched housing (Men & Women) C SMF 0 0 170 170 0 0 0% 0 0 N/A
So Others Might Eat (SOME) 50th Street U SMF 0 0 86 86 0 0 0% 0 0 N/A
So Others Might Eat (SOME) Alumni House C SM 0 0 3 3 0 0 0% 0 0 N/A
So Others Might Eat (SOME) Anna Cooper House C SMF 0 0 50 50 0 0 0% 0 0 N/A
So Others Might Eat (SOME) Barnaby House Local Rent Subsidy Program C HC 24 10 0 24 0 0 0% 0 0 N/A
So Others Might Eat (SOME) Freedom House C SMF 0 0 30 30 0 0 0% 0 0 N/A
So Others Might Eat (SOME) Good Hope Road Local Rent Subsidy Program U SMF 0 0 45 45 0 0 0% 0 0 N/A
So Others Might Eat (SOME) Independence Place C HC 80 18 0 80 0 0 0% 0 0 N/A
So Others Might Eat (SOME) Jeremiah House C SMF 0 0 54 54 0 0 0% 0 0 N/A
So Others Might Eat (SOME) Joe Smith Oxford House C SM 0 0 10 10 0 0 0% 0 0 N/A
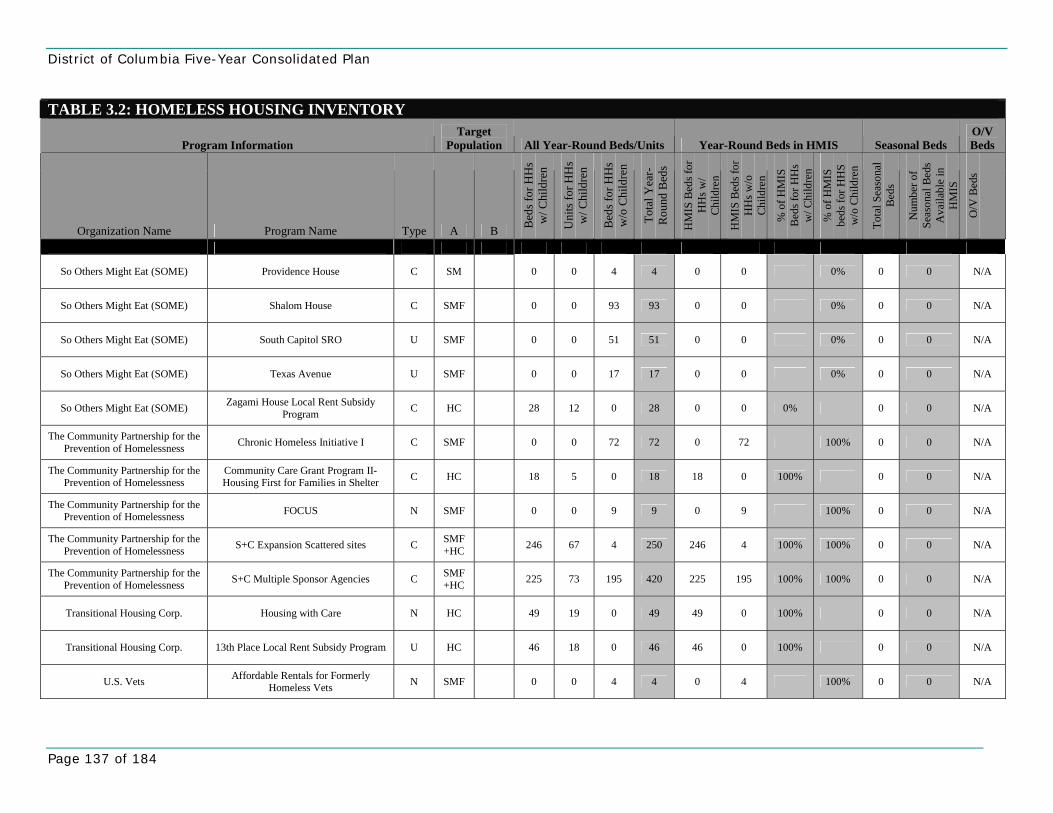
District of Columbia Five-Year Consolidated Plan
Page 137 of 184
TABLE 3.2: HOMELESS HOUSING INVENTORY
Program Information Target
Population All Year-Round Beds/Units Year-Round Beds in HMIS Seasonal Beds O/V Beds
Organization Name Program Name Type A B Bed
s for
HH
s w
/ Chi
ldre
n
Uni
ts fo
r HH
s w
/ Chi
ldre
n
Bed
s for
HH
s w
/o C
hild
ren
Tota
l Yea
r-R
ound
Bed
s
HM
IS B
eds f
or
HH
s w/
Chi
ldre
n
HM
IS B
eds f
or
HH
s w/o
C
hild
ren
% o
f HM
IS
Bed
s for
HH
s w
/ Chi
ldre
n
% o
f HM
IS
beds
for H
HS
w/o
Chi
ldre
n
Tota
l Sea
sona
l B
eds
Num
ber o
f Se
ason
al B
eds
Ava
ilabl
e in
H
MIS
O/V
Bed
s
So Others Might Eat (SOME) Providence House C SM 0 0 4 4 0 0 0% 0 0 N/A
So Others Might Eat (SOME) Shalom House C SMF 0 0 93 93 0 0 0% 0 0 N/A
So Others Might Eat (SOME) South Capitol SRO U SMF 0 0 51 51 0 0 0% 0 0 N/A
So Others Might Eat (SOME) Texas Avenue U SMF 0 0 17 17 0 0 0% 0 0 N/A
So Others Might Eat (SOME) Zagami House Local Rent Subsidy Program C HC 28 12 0 28 0 0 0% 0 0 N/A
The Community Partnership for the Prevention of Homelessness Chronic Homeless Initiative I C SMF 0 0 72 72 0 72 100% 0 0 N/A
The Community Partnership for the Prevention of Homelessness
Community Care Grant Program II-Housing First for Families in Shelter C HC 18 5 0 18 18 0 100% 0 0 N/A
The Community Partnership for the Prevention of Homelessness FOCUS N SMF 0 0 9 9 0 9 100% 0 0 N/A
The Community Partnership for the Prevention of Homelessness S+C Expansion Scattered sites C SMF
+HC 246 67 4 250 246 4 100% 100% 0 0 N/A
The Community Partnership for the Prevention of Homelessness S+C Multiple Sponsor Agencies C SMF
+HC 225 73 195 420 225 195 100% 100% 0 0 N/A
Transitional Housing Corp. Housing with Care N HC 49 19 0 49 49 0 100% 0 0 N/A
Transitional Housing Corp. 13th Place Local Rent Subsidy Program U HC 46 18 0 46 46 0 100% 0 0 N/A
U.S. Vets Affordable Rentals for Formerly Homeless Vets N SMF 0 0 4 4 0 4 100% 0 0 N/A
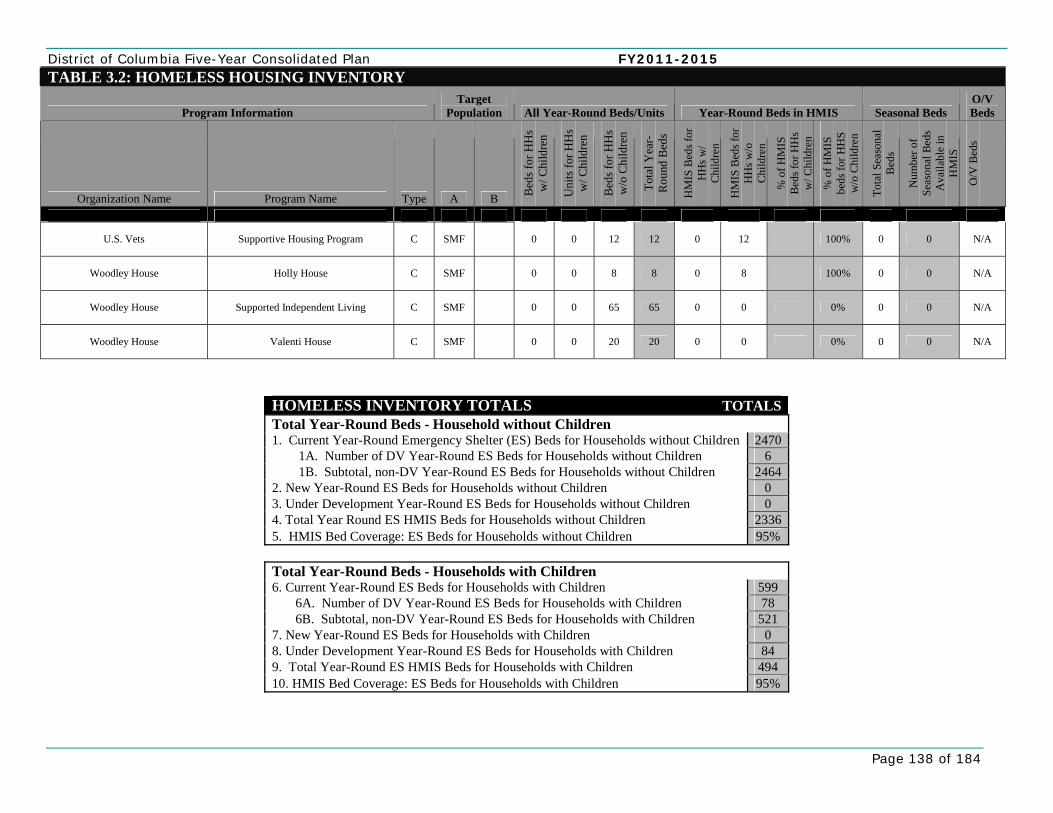
District of Columbia Five-Year Consolidated Plan FY2011-2015
Page 138 of 184
TABLE 3.2: HOMELESS HOUSING INVENTORY
Program Information Target
Population All Year-Round Beds/Units Year-Round Beds in HMIS Seasonal Beds O/V Beds
Organization Name Program Name Type A B Bed
s for
HH
s w
/ Chi
ldre
n
Uni
ts fo
r HH
s w
/ Chi
ldre
n
Bed
s for
HH
s w
/o C
hild
ren
Tota
l Yea
r-R
ound
Bed
s
HM
IS B
eds f
or
HH
s w/
Chi
ldre
n
HM
IS B
eds f
or
HH
s w/o
C
hild
ren
% o
f HM
IS
Bed
s for
HH
s w
/ Chi
ldre
n
% o
f HM
IS
beds
for H
HS
w/o
Chi
ldre
n
Tota
l Sea
sona
l B
eds
Num
ber o
f Se
ason
al B
eds
Ava
ilabl
e in
H
MIS
O/V
Bed
s
U.S. Vets Supportive Housing Program C SMF 0 0 12 12 0 12 100% 0 0 N/A
Woodley House Holly House C SMF 0 0 8 8 0 8 100% 0 0 N/A
Woodley House Supported Independent Living C SMF 0 0 65 65 0 0 0% 0 0 N/A
Woodley House Valenti House C SMF 0 0 20 20 0 0 0% 0 0 N/A
HOMELESS INVENTORY TOTALS TOTALSTotal Year-Round Beds - Household without Children 1. Current Year-Round Emergency Shelter (ES) Beds for Households without Children 2470 1A. Number of DV Year-Round ES Beds for Households without Children 6 1B. Subtotal, non-DV Year-Round ES Beds for Households without Children 2464 2. New Year-Round ES Beds for Households without Children 0 3. Under Development Year-Round ES Beds for Households without Children 0 4. Total Year Round ES HMIS Beds for Households without Children 2336 5. HMIS Bed Coverage: ES Beds for Households without Children 95%
Total Year-Round Beds - Households with Children 6. Current Year-Round ES Beds for Households with Children 599 6A. Number of DV Year-Round ES Beds for Households with Children 78 6B. Subtotal, non-DV Year-Round ES Beds for Households with Children 521 7. New Year-Round ES Beds for Households with Children 0 8. Under Development Year-Round ES Beds for Households with Children 84 9. Total Year-Round ES HMIS Beds for Households with Children 494 10. HMIS Bed Coverage: ES Beds for Households with Children 95%
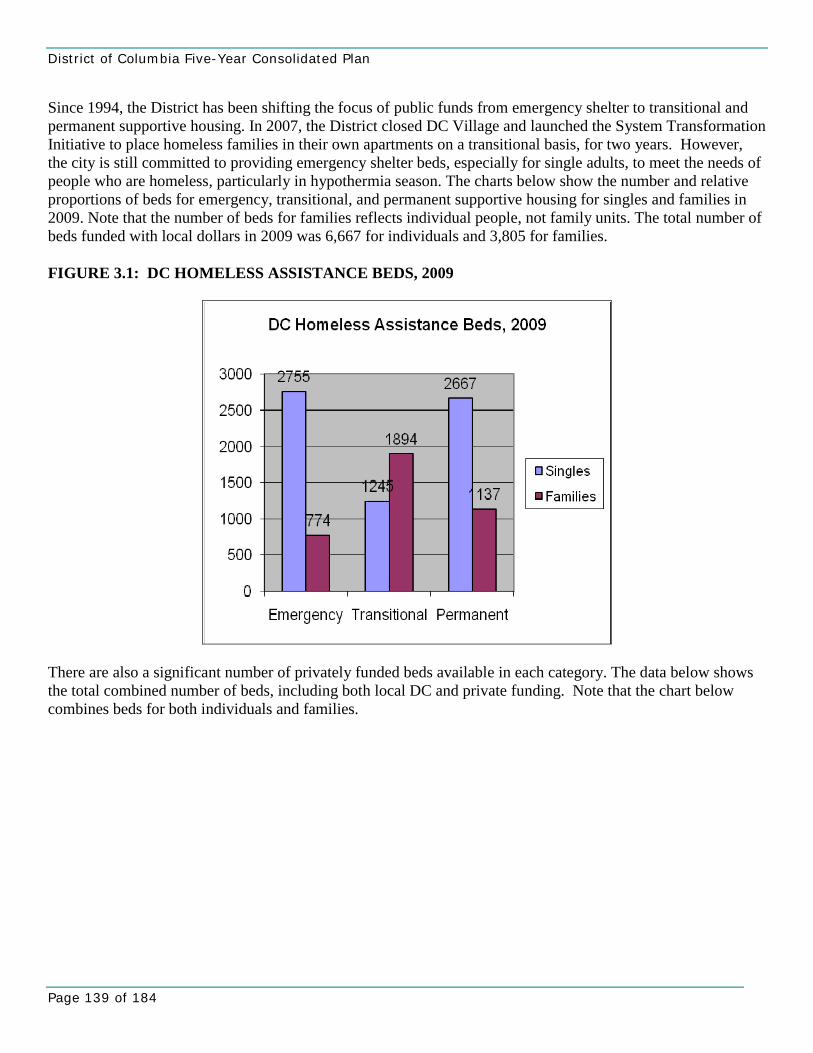
District of Columbia Five-Year Consolidated Plan
Page 139 of 184
Since 1994, the District has been shifting the focus of public funds from emergency shelter to transitional and permanent supportive housing. In 2007, the District closed DC Village and launched the System Transformation Initiative to place homeless families in their own apartments on a transitional basis, for two years. However, the city is still committed to providing emergency shelter beds, especially for single adults, to meet the needs of people who are homeless, particularly in hypothermia season. The charts below show the number and relative proportions of beds for emergency, transitional, and permanent supportive housing for singles and families in 2009. Note that the number of beds for families reflects individual people, not family units. The total number of beds funded with local dollars in 2009 was 6,667 for individuals and 3,805 for families. FIGURE 3.1: DC HOMELESS ASSISTANCE BEDS, 2009
There are also a significant number of privately funded beds available in each category. The data below shows the total combined number of beds, including both local DC and private funding. Note that the chart below combines beds for both individuals and families.

District of Columbia Five-Year Consolidated Plan FY2011-2015
Page 140 of 184
FIGURE 3.2: PUBLIC AND PRIVATE BEDS BY SHELTER TYPE, 2009
Constructed and Rehabilitated Developments In April 2008, the District committed to creating a total of 2,240 net new units of permanent supportive housing by 2014. This included 1,835 units for individuals (a combination of efficiencies, studio and one-bedroom units) and 405 units for families (a combination of two-bedroom and three-bedroom units). The Permanent Supportive Housing for the Chronically Homeless in the District of Columbia: Unit Generation Report (“the Report”) outlines the production schedule as well as the strategies the District will employ in creating PSH capacity. The Report recommended generating 65% of the units through scattered site/leasing and 35% through rehabilitation and new construction of units. While the District has been very successful in creating scattered site/leased housing, it recognizes the importance of generating new units through production as well. Advantages of newly constructed and rehabilitated developments include, but are not limited to, the following:
• CONSUMER CHOICE: A large range of populations can be supported through permanent supportive housing including individuals and families with dual diagnoses, HIV/AIDS, mental illness, and substance abuse. Such a large range in the population requires consumer choice in housing options to meet not only the consumer preferences and empowerment but the consumer recovery goals as well. Consequently, some consumers may prefer a single site option versus scattered site or clustered units in the community, depending on their specific circumstances and recovery plan.
• DESIGNATED UNITS: New production creates the existence of units with long term use
agreements that ensure the dedication of the units for the targeted population for up to 40 years, depending on the financing. Such dedication of the units provides a significant stability element in the District’s supportive housing program and affordable housing stream.
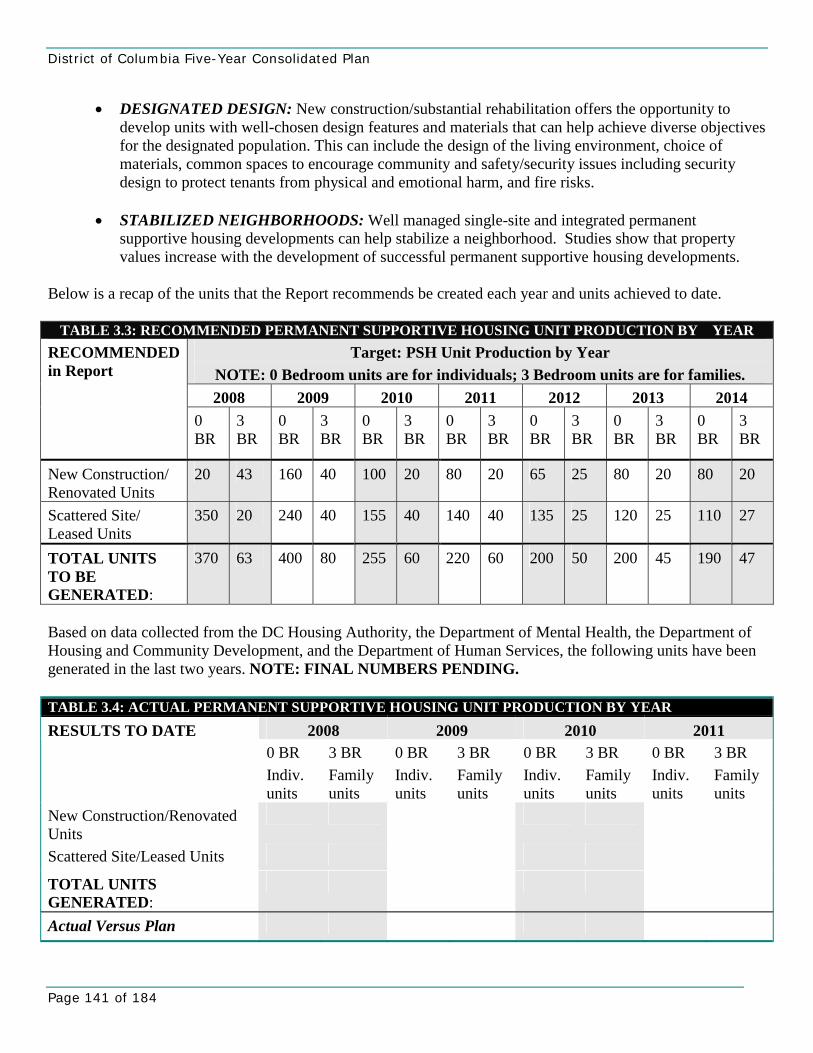
District of Columbia Five-Year Consolidated Plan
Page 141 of 184
• DESIGNATED DESIGN: New construction/substantial rehabilitation offers the opportunity to develop units with well-chosen design features and materials that can help achieve diverse objectives for the designated population. This can include the design of the living environment, choice of materials, common spaces to encourage community and safety/security issues including security design to protect tenants from physical and emotional harm, and fire risks.
• STABILIZED NEIGHBORHOODS: Well managed single-site and integrated permanent
supportive housing developments can help stabilize a neighborhood. Studies show that property values increase with the development of successful permanent supportive housing developments.
Below is a recap of the units that the Report recommends be created each year and units achieved to date.
TABLE 3.3: RECOMMENDED PERMANENT SUPPORTIVE HOUSING UNIT PRODUCTION BY YEAR Target: PSH Unit Production by Year
NOTE: 0 Bedroom units are for individuals; 3 Bedroom units are for families. 2008 2009 2010 2011 2012 2013 2014
RECOMMENDED in Report
0 BR
3 BR
0 BR
3 BR
0 BR
3 BR
0 BR
3 BR
0 BR
3 BR
0 BR
3 BR
0 BR
3 BR
New Construction/ Renovated Units
20 43 160 40 100 20 80 20 65 25 80 20 80 20
Scattered Site/ Leased Units
350 20 240 40 155 40 140 40 135 25 120 25 110 27
TOTAL UNITS TO BE GENERATED:
370 63 400 80 255 60 220 60 200 50 200 45 190 47
Based on data collected from the DC Housing Authority, the Department of Mental Health, the Department of Housing and Community Development, and the Department of Human Services, the following units have been generated in the last two years. NOTE: FINAL NUMBERS PENDING. TABLE 3.4: ACTUAL PERMANENT SUPPORTIVE HOUSING UNIT PRODUCTION BY YEAR
2008 2009 2010 2011 RESULTS TO DATE 0 BR Indiv. units
3 BR Family units
0 BR Indiv. units
3 BR Family units
0 BR Indiv. units
3 BR Family units
0 BR Indiv. units
3 BR Family units
New Construction/Renovated Units
Scattered Site/Leased Units
TOTAL UNITS GENERATED:
Actual Versus Plan
District of Columbia Five-Year Consolidated Plan FY2011-2015
Page 142 of 184
Homeless Strategic Plan (91.215 (c)) 1. Homelessness— Describe the jurisdiction's strategy for developing a system to address
homelessness and the priority needs of homeless persons and families (including the subpopulations identified in the needs section). The jurisdiction's strategy must consider the housing and supportive services needed in each stage of the process which includes preventing homelessness, outreach/assessment, emergency shelters and services, transitional housing, and helping homeless persons (especially any persons that are chronically homeless) make the transition to permanent housing and independent living. The jurisdiction must also describe its strategy for helping extremely low- and low-income individuals and families who are at imminent risk of becoming homeless.
2. Chronic homelessness—Describe the jurisdiction’s strategy for eliminating chronic homelessness by 2012. This should include the strategy for helping homeless persons make the transition to permanent housing and independent living. This strategy should, to the maximum extent feasible, be coordinated with the strategy presented Exhibit 1 of the Continuum of Care (CoC) application and any other strategy or plan to eliminate chronic homelessness. Also describe, in a narrative, relationships and efforts to coordinate the Con plan, CoC, and any other strategy or plan to address chronic homelessness.
3. Homelessness Prevention—Describe the jurisdiction’s strategy to help prevent homelessness for individuals and families with children who are at imminent risk of becoming homeless.
4. Institutional Structure—briefly describes the institutional structure, including private industry, non-profit organizations, and public institutions, through which the jurisdiction will carry out its homelessness strategy.
5. Discharge Coordination Policy—every jurisdiction receiving McKinney-Vento Homeless Assistance Act Emergency Shelter Grant (ESG), Supportive Housing, Shelter Plus Care, or Section 8 SRO Program funds must develop and implement a Discharge Coordination Policy, to the maximum extent practicable. Such a policy should include “policies and protocols for the discharge of persons from publicly funded institutions or systems of care (such as health care facilities, foster care or other youth facilities, or correction programs and institutions) in order to prevent such discharge from immediately resulting in homelessness for such persons.” The jurisdiction should describe its planned activities to implement a cohesive, community-wide Discharge Coordination Policy, and how the community will move toward such a policy.
3-5 Year Homeless Strategic Plan response:
District of Columbia Five-Year Consolidated Plan
Page 143 of 184
1 Homelessness Strategy for Developing a System to Address Homelessness The District of Columbia is committed to being a national model in its approach to homelessness by preventing homelessness whenever possible and addressing the needs of our homeless neighbors by creating an individualized approach that improves well-being while moving people out of homelessness as rapidly as possible. The District will develop strategies that will allow it to be successful in federal funding competitions and that incorporate HEARTH Act requirements. It will be critical to align all possible resources, including local, federal, and private funds to be successful in achieving the goals. The Plan outlines the following three policy objectives:
• Reduce the overall number of homeless individuals and families. • Redesign the Continuum of Care to develop an appropriate mix of services and interim and
permanent housing options. • Design an evaluation strategy and mechanism to track the District’s progress in preventing and
reducing homelessness. The Plan includes ten outcome measures that the District will track to evaluate the extent to which we have been successful in preventing homelessness as well as helping people move out of homelessness more quickly through the implementation of this strategic plan. The plan includes an initial Work Plan which will be updated annually. Key elements of the plan are defined as follows: PREVENTION AND DIVERSION Related to preventing people from becoming homeless by addressing their needs before they have to leave their current housing and/or diverting them as they apply for shelter. People may be able to maintain their current housing if they can get short-term financial assistance or assistance with mediation with landlords or family members. Some may need to relocate to housing that they can afford or maintain on a long-term basis. The goal is to prevent people from entering the shelter system, which can have negative impact on mental health, can be hard to leave, and is often costly. INTERIM HOUSING Interim housing is used as a larger category to define housing that is time-limited. In this area, there are several subsets of housing:
• Low-barrier shelter is usually primarily short-term shelter for individuals. Low-barrier shelter is designed to keep people safe, is often open only 12 hours a day, and is often in a congregate setting. This type of program is provided, on a first come, first served basis, to any adult presenting as homeless. It is sometimes also referred to as emergency shelter.
• Temporary shelter is also short-term shelter and is open 24 hours a day. Temporary shelter often has
more services located on site than in low barrier shelter. This type of shelter applies to both families and individuals. It is sometimes also referred to as emergency shelter.
District of Columbia Five-Year Consolidated Plan FY2011-2015
Page 144 of 184
• Transitional housing is longer-term housing, usually for less than two years, that provides intensive support services, geared toward increasing a household’s self-sufficiency and helping it move towards permanency, often specializing in particular areas of client needs.
AFFORDABLE HOUSING Affordable housing differs from interim housing in that it is not time-limited. It should also be affordable over the long-term. The Homeless No More Plan describes this as “housing, either ownership or rental, for which a household will pay no more than 30% of its gross annual income.” There is a large need in the District of Columbia for generally affordable housing for all levels of income. Agencies such as the DC Department of Housing and Community Development are mandated to help produce this type of housing. For purposes of this plan, the focus, however, is on housing that meets the need of people who have such low incomes that they are vulnerable to becoming homeless. In the larger category of permanent affordable housing, therefore, the focus is on the following two subsets:
• Permanent supportive housing is long-term, permanent housing for people with disabilities that also comes with long-term supportive services. Permanent supportive housing can either be scattered sites, based at a single site or at multiple sites. In either case, clients have leases in their own names.
• Permanent housing is long-term housing where people can stay as long as they wish and which they
can afford. There may or may not be short-term supportive services, depending on the need of the individual or family. For purposes of this plan, the focus is on for people with incomes who are eligible for public benefits, usually from 0 to 200% of the federal poverty level, or who are vulnerable to becoming homeless, from about 200% to 300% of the federal poverty level.
Mayor Adrian Fenty and the community are committed to achieving the following three goals in the next five years, each of which has three key initiatives. 1. Reduce the overall number of individuals and families who are homeless, including significant efforts at
prevention and rapid re-housing. a. End homelessness for those already homeless, as quickly as possible, and assure that people remain
housed. b. Prevent homelessness for as many people as possible who are at imminent risk, and assure that people
remain housed. c. Improve the odds that people can remain housed by increasing income and other resources, through
employment or benefits receipt.
2. Redesign the Continuum of Care to develop an appropriate mix of services, interim housing, and permanent housing options in order to help people move out of homelessness as rapidly as possible. a. Ensure there is sufficient low-barrier shelter to keep people safe. b. Ensure that there are sufficient, appropriate interim housing options (temporary and transitional) that
address specific needs. c. Develop and/or subsidize units to reach the goal of at least 2,500 units of permanent supportive housing.
3. Develop a mechanism and an evaluation strategy to track the District’s progress in preventing and reducing
homelessness. a. Develop benchmarks for key client outcomes based on national data and data from local providers. b. Develop a system of performance-based contracts that rewards providers for successful outcomes and
ensures accountability.
District of Columbia Five-Year Consolidated Plan
Page 145 of 184
c. Track and analyze outcomes annually to assess improvement, areas of needed resources, areas for better interagency coordination, etc.
Annual Work Plans will lay out concrete steps to be taken annually, given budget realities and changing circumstances, to meet these key initiatives. The outcomes identified in this document are also tied to ensuring that these goals and initiatives are achieved. Critical Success Factors In order for these redesigned systems to be successful in meeting client needs, three factors are critical and need to be tracked regularly. 1. SUPPLY OF PERMANENT HOUSING AND PERMANENT SUPPORTIVE HOUSING
In both systems of care, it is critical that families and individuals have permanent housing to move into. Success will rely both on creating rental subsidies as well as producing units that are affordable. The Permanent Supportive Housing Program Unit Generation Report, the implementation roadmap for the permanent supportive housing section of the District’s Homeless No More Plan, recommended a mix of approximately 65% scattered site/leased units and 35% newly constructed and/or renovated units. Key partners include the DC Department of Human Services (DHS), the Housing Authority (DCHA), and the DC Housing Finance Agency (DCHFA). The Department of Mental Health has also made funds available to DHCD, as well as the Office of Aging. Strategies to ensure the supply will include:
• Continue to develop memorandums of understanding between District agencies to provide frameworks
for production. • DHCD will continue to monitor and report on funding for housing that meets the needs of this
population, using existing key performance indicators and HUD’s Consolidated Annual Plan Evaluation Report (CAPER) process.
• Build upon a pilot Consolidated Request for Proposal process to help projects reach completion more quickly.
• Work closely with DCHA and HUD to make sure housing vouchers are available for people who are homeless.
• Collaborate with the Office of the Deputy Mayor for Planning and Economic Development (DMPED) to ensure the inclusion of a substantial number of extremely affordable and accessible housing units in the development at the Walter Reed Army Base.
• Ensure coordination and collaboration between all relevant agencies. Examples include DHCD and DCHA continuing to work together on each other’s review boards, having regular conversations, and coordinating efforts with DHS, DMH, Office on Aging and DOH. The Interagency Council on Homelessness (ICH) can also play a role in ensuring that there is communication in these areas.
In order to monitor progress in this area, the ICH will create a Permanent Supportive Housing Production Committee to include representatives of both public and private service and housing agencies that will report at least annually and preferably quarterly to the ICH on progress made. Tasks will include developing an annual strategy to include recommended set-aside resources for production, developing a consolidated application process and monitoring progress on past consolidated applications awarded, and monitoring PSH production accomplishments. The committee should review information on what is in the DHCD pipeline for approved and pending projects as well track the Local Rent Supplement Program (LRSP) under the DC Housing
District of Columbia Five-Year Consolidated Plan FY2011-2015
Page 146 of 184
Authority, both of which will be critical to ensure sufficient permanent supportive housing and permanent housing units. 2. FINANCIAL RESOURCES AVAILABLE AND STRATEGICALLY LEVERAGED
Redesigning these systems will require the District to leverage funding in the local budget, from federal funding opportunities, and from private philanthropy. Some local resources will need to be re-allocated. The District will also be aggressive in applying for HUD funding and other federal funding for subpopulations. It appears that additional funding will be available for housing vouchers through HUD. DC will also make it a priority to incorporate HEARTH Act requirements into its activities. The District also has a wide range of private funders that are invested in ending homelessness and would like to create structures that would encourage partnership as well as an alignment of goals and outcomes.
In order to monitor progress in this area and per the Homeless Services Reform Act (HSRA), District agencies will report annually on their budgets at ICH meetings. ICH will also convene a subcommittee to work on creating funding vehicles for a public-private partnership and to encourage investment by private philanthropy. 3. TRACK OUTCOMES REGULARLY
As the systems are redesigned, it will be critical to monitor progress and, if something is not working, to make adjustments. A long-term data collection strategy will need to be developed. Key areas to look at will include the number of people prevented from becoming homeless as well as the length of stay in various parts of the system. Mechanisms need to be in place to ensure that everyone is tracking the same data and a software system where data can be easily collected and evaluated. There also needs to be a universal assessment strategy and instrument that enables the system to capture necessary data. Performance based contracting will require setting baseline numbers as well as appropriate benchmarks and targets.
Outcomes In order to track the effective use of resources, the District is proposing to track the outcomes identified below to ensure effective, quality services for clients. For each area, it will be important to identify baseline numbers so that progress can be measured, as well as benchmarks that are appropriate for various types of programs and clients. As discussed in Critical Success Factors above, it is critical that data collection and evaluation systems are in place for impact of the proposed redesigns to be measured. Note that nine of these goals measure how well the system of care helps those who interact with it. That last goal is more system focused, to analyze the effectiveness of interventions in reducing the cost burden on the public and emergency service systems. This Plan envisions that these goals will be monitored and reported on to the Interagency Council on Homelessness at least annually, but preferably quarterly. Significant improvements in outcomes will take time, but data will allow all stakeholders to be on top of trends, things that are working, and areas for improvement.
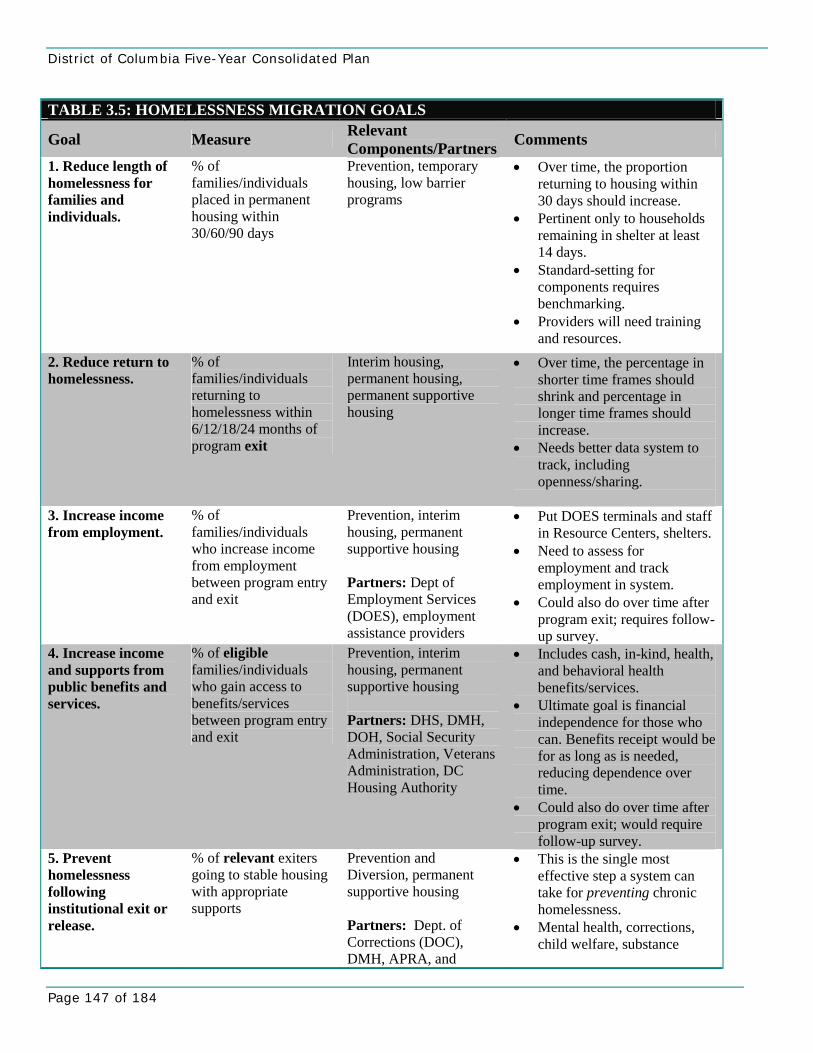
District of Columbia Five-Year Consolidated Plan
Page 147 of 184
TABLE 3.5: HOMELESSNESS MIGRATION GOALS
Goal Measure Relevant Components/Partners Comments
1. Reduce length of homelessness for families and individuals.
% of families/individuals placed in permanent housing within 30/60/90 days
Prevention, temporary housing, low barrier programs
• Over time, the proportion returning to housing within 30 days should increase.
• Pertinent only to households remaining in shelter at least 14 days.
• Standard-setting for components requires benchmarking.
• Providers will need training and resources.
2. Reduce return to homelessness.
% of families/individuals returning to homelessness within 6/12/18/24 months of program exit
Interim housing, permanent housing, permanent supportive housing
• Over time, the percentage in shorter time frames should shrink and percentage in longer time frames should increase.
• Needs better data system to track, including openness/sharing.
3. Increase income from employment.
% of families/individuals who increase income from employment between program entry and exit
Prevention, interim housing, permanent supportive housing Partners: Dept of Employment Services (DOES), employment assistance providers
• Put DOES terminals and staff in Resource Centers, shelters.
• Need to assess for employment and track employment in system.
• Could also do over time after program exit; requires follow-up survey.
4. Increase income and supports from public benefits and services.
% of eligible families/individuals who gain access to benefits/services between program entry and exit
Prevention, interim housing, permanent supportive housing Partners: DHS, DMH, DOH, Social Security Administration, Veterans Administration, DC Housing Authority
• Includes cash, in-kind, health, and behavioral health benefits/services.
• Ultimate goal is financial independence for those who can. Benefits receipt would be for as long as is needed, reducing dependence over time.
• Could also do over time after program exit; would require follow-up survey.
5. Prevent homelessness following institutional exit or release.
% of relevant exiters going to stable housing with appropriate supports
Prevention and Diversion, permanent supportive housing Partners: Dept. of Corrections (DOC), DMH, APRA, and
• This is the single most effective step a system can take for preventing chronic homelessness.
• Mental health, corrections, child welfare, substance
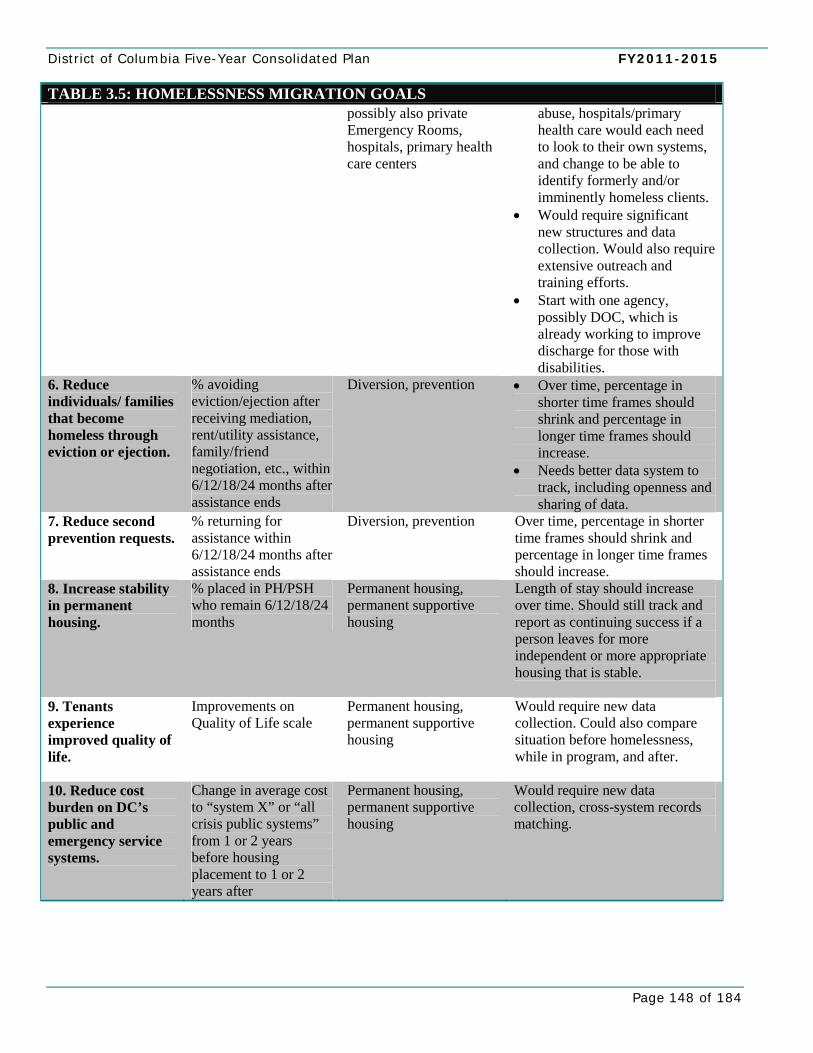
District of Columbia Five-Year Consolidated Plan FY2011-2015
Page 148 of 184
TABLE 3.5: HOMELESSNESS MIGRATION GOALS possibly also private Emergency Rooms, hospitals, primary health care centers
abuse, hospitals/primary health care would each need to look to their own systems, and change to be able to identify formerly and/or imminently homeless clients.
• Would require significant new structures and data collection. Would also require extensive outreach and training efforts.
• Start with one agency, possibly DOC, which is already working to improve discharge for those with disabilities.
6. Reduce individuals/ families that become homeless through eviction or ejection.
% avoiding eviction/ejection after receiving mediation, rent/utility assistance, family/friend negotiation, etc., within 6/12/18/24 months after assistance ends
Diversion, prevention • Over time, percentage in shorter time frames should shrink and percentage in longer time frames should increase.
• Needs better data system to track, including openness and sharing of data.
7. Reduce second prevention requests.
% returning for assistance within 6/12/18/24 months after assistance ends
Diversion, prevention Over time, percentage in shorter time frames should shrink and percentage in longer time frames should increase.
8. Increase stability in permanent housing.
% placed in PH/PSH who remain 6/12/18/24 months
Permanent housing, permanent supportive housing
Length of stay should increase over time. Should still track and report as continuing success if a person leaves for more independent or more appropriate housing that is stable.
9. Tenants experience improved quality of life.
Improvements on Quality of Life scale
Permanent housing, permanent supportive housing
Would require new data collection. Could also compare situation before homelessness, while in program, and after.
10. Reduce cost burden on DC’s public and emergency service systems.
Change in average cost to “system X” or “all crisis public systems” from 1 or 2 years before housing placement to 1 or 2 years after
Permanent housing, permanent supportive housing
Would require new data collection, cross-system records matching.
District of Columbia Five-Year Consolidated Plan
Page 149 of 184
2 Chronic Homelessness Ending chronic homelessness was the major impetus for the development of the District of Columbia’s ten year plan to end homelessness. Data for shelter users in the District mirrored the national trends which motivated HUD to call for the development of such plans. A relative small proportion of the overall homeless population consumed a significant portion of resources because of the chronic use of homeless shelters and other publicly funded services. For the past five years since the development of the ten year plan, the primary focus of the District’s Continuum of Care has been shifted from shelter to housing. Permanent supportive housing now makes up the largest share of the resources in the District of Columbia’s continuum of Care. In fiscal year 2008, permanent supportive housing represented 36% of the total resources spent in the District for homeless housing and services. As of January 2010, the District’s Permanent Supportive Housing Program has provided housing and supportive services to 638 individuals and families who are extremely vulnerable and have experienced long episodes of homelessness. This focus on the chronically homeless has resulted in a significant decrease in the number of chronically homeless living in shelters or on the streets. President Obama has expressed his commitment to supporting programs in the District of Columbia. $17 million has been allocated to provide additional permanent supportive housing for approximately 150 homeless families and 350 homeless individuals. This will allow even more of the chronically homeless population to be housed.
3 Homelessness Prevention Homeless Programs New federal resources available under the American Recovery and Reinvestment Act (ARRA) for the prevention of homelessness and for helping people move out of homelessness quickly will be used in conjunction with the Emergency Shelter Grant’s (ESG) prevention resources. Most recently, the District has received $7.5 million in funds through the Homelessness Prevention and Rapid Re-Housing Program (HPRP). Under this Presidential Administration, the US Department of Housing and Urban Development is continuing its trend of putting more funds into prevention and rapid re-housing. The following is a description of the HPRP as implemented in the District of Columbia by DHCD and DHS. Coordination of prevention efforts across agencies and sub-recipients is ongoing to prevent gaps in service and to eliminate duplicative service provision. Likewise, targeting resources is critical across the spectrum of prevention, re-housing, and more intensive permanent supportive housing options to ensure that the needs of individuals and families are met in the most cost effective way. HOMELESS PREVENTION AND RAPID RE-HOUSING PROGRAM (HPRP) HPRP is aimed at preventing families or individuals from becoming homeless and helping people who have become homeless regain housing, through one-time supports or short-term subsidies.
District of Columbia Five-Year Consolidated Plan FY2011-2015
Page 150 of 184
Homelessness prevention: • One-time payment of rent arrearages • One-time payment of utility arrearages • Case management services • Legal services (landlord / tenant issues)
Rapid re-housing:
• Security deposit and first month’s rent • Short term rent subsidy (3 months extendable up to 18 months if necessary) • Housing counseling and location assistance • Case management services
Homelessness prevention resources provide short term assistance to those who are currently housed and at risk of losing housing: Prevention assistance is available to District of Columbia residents who meet the following criteria:
• Household income is at or below 50% of the area median income (AMI); • The household lacks the financial resources and support networks needed to obtain immediate housing
or remain in existing housing; • Household is at imminent risk of homelessness and would become homeless without this assistance; • No appropriate subsequent housing options have been identified; AND • Households demonstrates the ability to obtain and/or maintain stable housing through supportive
services and direct financial assistance offered by the program, and be able to independently maintain housing at the conclusion of HPRP assistance.
Rapid Re-housing: Rapid re-housing provides temporary assistance to those who are homeless to obtain housing. Re-housing assistance is available for District of Columbia residents who meet the following criteria:
• Household income is at or below 50% of AMI; • Currently homeless (coming from street, shelter, or Transitional Housing/Treatment Programs); AND • Demonstrated ability to obtain stable housing through supportive services and direct financial assistance
offered by the program, and independently maintain housing at the conclusion of HPRP assistance.
Organizations providing HPRP assistance are the Community Partnership, the Community of Hope, Housing Counseling Services, and Catholic Charities. Emergency assistance programs operated by the Community Partnership are co-located at the Virginia Williams Family Resource Center (the point of intake for homeless families) to maximize the opportunities to prevent homelessness. EMERGENCY SHELTER GRANT (ESG) ESG funds are used in conjunction with ARRA funds and locally appropriated funds to provide a robust array of prevention services. The Community Partnership for the Prevention of Homelessness administers ESG funds under the direction of and pursuant to a grant agreement from the Department of Housing and Community Development. Funds are distributed through a network of community-based organizations for which the Foundation for the National Capital region serves as fiduciary agent. ESG funds are used to leverage funding from Fannie Mae through the annual Help the Homeless Walkathon. ESG prevention funds are used to cover eligible rental assistance for past due rent and utility assistance for utility bills that are significantly overdue and which are often an early warning sign of risk of homelessness.
District of Columbia Five-Year Consolidated Plan
Page 151 of 184
EMERGENCY RENTAL ASSISTANCE PROGRAM (ERAP) ERAP helps low-income District residents facing housing emergencies. The program provides funding for overdue rent if a qualified household is facing eviction (including late costs and court fees). The program also supports security deposits and first month’s rent for residents moving to new homes. ERAP serves low-income DC households with children, elderly households (age 60 or older), and people with disabilities. The amount paid on behalf of eligible families depends on a household’s income and available resources, and is subject to certain limitations. ERAP payments can only be used once per year for each eligible household. There are four ERAP Providers: The Community Partnership for the Prevention of Homelessness, Housing Counseling Services, Catholic Charities and the Salvation Army. Chronic Homelessness Priorities: Please see above for further detail on the priority to assist chronically homeless individuals and families.
3 Institutional Structure DHCD collaborates closely with the Department of Human Services (DHS), the District government entity with overall responsibility for policy and programming on homelessness. DHCD and DHS together administer Homelessness Prevention and Rapid Re-Housing Program (HPRP) for the District, and work in concert with numerous other agencies and stakeholders through the Interagency Council on Homelessness. Interagency Council on Homelessness The Interagency Council on Homelessness (ICH) is a group of cabinet-level leaders, providers of homeless services, advocates, homeless and formerly homeless leaders that come together to inform and guide the District’s strategies and policies for meeting the needs of individuals and families who are homeless or at imminent risk of becoming homeless in the District of Columbia. This body will be used to carry out the District’s homeless strategy and is responsible for the implementation of the strategic plan. The ICH was established by the Homeless Service Reform Act of 2005 for the purpose of facilitating interagency, cabinet-level leadership in planning, policymaking, program development, provider monitoring, and budgeting for the Continuum of Care of homeless services. AGENCY DIRECTORS AND DISTRICT OFFICIALS
• Neil O. Albert, Office of the City Administrator (OCA) • Leila F. Edmonds, Department of Housing and Community Development (DHCD) • Roque R. Gerald, Child and Family Services Agency (CFSA) • Stephen T. Baron, Department of Mental Health (DMH) • Devon Brown, Department of Corrections • Millicent Williams, Homeland Security and Emergency Management Agency (HSEMA) • Joseph P. Walsh, Jr., Department of Employment Services (DOES) • Kerri L. Briggs, Office of the State Superintendent of Education (OSSE) • Adrianne Todman, DC Housing Authority (DCHA) • Robin-Eve Jasper, Office of Property Management (OPM) • Dr. Pierre Vigilance, Department of Health (DOH)
District of Columbia Five-Year Consolidated Plan FY2011-2015
Page 152 of 184
• Cathy L. Lanier, Metropolitan Police Department (MPD) COMMUNITY MEMBERS
• Cheryl K. Barnes, Homeless Advocate • Darryl A Belcher, Representative of the Homeless Community • Jackie Chandler, Representative of the Homeless Community • Judith Dobbins, Covenant House • Michael Ferrell, Coalition for the Homeless • Sue Marshall, The Community Partnership to End Homelessness • Scott McNeilly, Washington Legal Clinic for the Homeless • Kelly Sweeney McShane, Community of Hope • Nan Roman, National Alliance to End Homelessness • E. Schroeder Stribling, N Street Village • Chapman Todd, Catholic Charities
NON-VOTING MEMBERS
• Vincent Gray, Chairman of Council of the District of Columbia (Non-Voting Member) • Tommy Wells, Committee on Human Services (Non-Voting Member)
4 Discharge Coordination Policy The District of Columbia has a comprehensive Discharge Coordination Policy that comprised of policies and protocols for the discharge of persons from publicly funded institutions and systems of care, including foster care, health care, mental health, and corrections.
Institutions FOSTER CARE The foster care system is managed by the Child and Family Services Agency (CFSA). Twelve months prior to exiting the foster care system, an individual emancipation plan is written for each child. The emancipation plan includes: 1) a reason for discharge, 2) a summary of services that were provided during care, 3) a summary of the youth’s education and medical history, 4) the estimated date of discharge, 5) anticipated living arrangements-including expected address and telephone number, 6) estimated personal budget, 7) sources of income and debts/assets, 8) aftercare services arranged and 9) youth specific plans to facilitate a successful and stable discharge. This emancipation plan is reviewed at a quarterly conference that includes the youth, their social worker, an adolescent coordinator, foster parent/caregiver/biological parent (as applicable), community based after care representative and any other significant individuals requested by the youth. The objective of the emancipation conference is to address any concerns the youth has about their imminent discharge, difficulties with transitioning to independence, expectations regarding the continuation with any services within the system, public benefits and additional aftercare services that may be needed to prepare for a successful discharge. If youth exiting the foster care system have not found an independent housing option through the emancipation planning process, they are automatically referred to the CFSA funded Rapid Exit program. Through the assistance of eight Neighborhood Based Collaboratives located throughout the city, youth receive housing search assistance, supportive services and a short term flexible financial subsidy in the amount of $4,000 to assist the youth in obtaining and maintaining their housing. Together with a Collaborative Case Manager, the
District of Columbia Five-Year Consolidated Plan
Page 153 of 184
youth creates a spending plan that determines the best way to allocate these funds and an action plan for maintaining their housing once the short term subsidy ends. In addition, the youth is encouraged to continue to engage the Collaborative after the subsidy ends to ensure that he/she is able to maintain housing stability. Through this coordinated and comprehensive discharge process that assists youth in preparing for independent living before and after discharge, CFSA in collaboration with Neighborhood Based Collaboratives ensure that youth do not enter the homeless Continuum of Care. The CFSA Rapid Exit program is modeled after the nationally recognized Community Care Grant program operated by the Community Partnership that is designed to prevent families at risk of becoming homeless from entering the Continuum of Care. In 2009, the CFSA Rapid Exit Program assisted approximately 150 youth with obtaining housing. Through this program these youth were diverted from entering the Continuum of Care for shelter and housing services. HEALTH CARE The Department of Health (DOH) has begun preliminary discussions on effective discharge planning for the homeless population. The agency does have some strategies in place to assist homeless persons exiting the hospital system who are deemed eligible for Medicaid. Hospitals serving homeless persons who are eligible for Medicaid are required to provide health related case management and create a discharge plan for the individual by a case manager. Physicians are not allowed to discharge a homeless person from a hospital without a discharge plan. Even if a discharge plan has been developed, physicians are not allowed to discharge homeless persons if in the physician’s opinion, discharge would pose an unreasonable risk to the treatment or safety of the individual. Additionally, if a homeless person is in need of a Recuperative Care Facility they are to be transferred to one immediately. If a Recuperative Care Facility is not immediately available, a homeless person cannot be discharged until a space in the facility is made available. The Department of Health has expressed challenges in developing a comprehensive discharge plan as hospitals can only bill limited case management services for homeless individuals and families. If homeless persons for whom case management needs may be more intensive than discharge planning. The Department of Health has indicated that a community-based model of case management involving the coordination of health and social services would be more beneficial for homeless clients who often suffer from chronic health problems. These needs will continue to be assessed as a formal and expansive protocol is developed. Since so many clients are shared, DOH plans to work closely with the Department of Mental Health (DMH), the hospital system and Medicaid to develop a formal discharge planning protocol. In the interim, the Community Partnership has trained providers at Contractors’ Meetings and during site visits on HUD’s policy of preventing individuals discharged from institutions from participating in McKinney-Vento homeless programs. MENTAL HEALTH The Department of Mental Health’s (DMH) discharge protocol focuses on a close partnership with its contracted private, nonprofit Core Services Agencies (CSAs). Every consumer of the Department of Mental Health is connected to a CSA as their “clinical home” for DMH services. The CSA enters into a Human Care Agreement to provide treatment and rehabilitative services within the community. Before a patient is released from the city’s mental health care hospital, St. Elizabeth’s, they are evaluated by their doctor and connected to a CSA. At such time, a conference is scheduled with the consumer’s CSA community support specialist and appropriate treatment and follow-up are arranged. Consumers must be discharged with enough medication until their next scheduled CSA appointment. A consumer may only be discharged from a CSA if: 1) they have relocated out of state; 2) they are deceased; 3) they have refused all mental health services and the consumer’s refusal has been documented in their clinical
District of Columbia Five-Year Consolidated Plan FY2011-2015
Page 154 of 184
record that is verified by a psychiatrist; 4) they have been incarcerated or sentenced for incarceration more than one year; 5) they do not have a mental health diagnosis verified by a psychiatrist; and if they have not been located for ninety (90) days following numerous documented outreach efforts to locate them. DMH also has a policy that any enrolled consumer that receives hospitalized care is able to apply for housing through their CSA. This means that any patient discharged from the city’s public mental health facility has the opportunity to obtain housing and avoid entry into the shelter system. Housing services available to DMH include transitional beds, bridge rental subsidies and limited bridge loan funding. To expedite the housing process it is critical for each benefit application for consumers who want housing to be completed while the consumer is still in the hospital. While DMH housing options are available, homeless clients’ access to these housing solutions has not always been consistent. Therefore, the DMH Housing Division aims to approve completed housing applications for patients in the hospital within 48 hours. To improve patient access of these housing options in the future, the DMH Housing Division also plans to provide a bi-weekly vacancy list of available housing resources including CRFs and supported independent housing options to community providers. DMH also plans on creating more housing for its population over the next five years, and under its MOU with DHCD, 181 net new units are under development as of March 2010. CORRECTIONS The management of the District of Columbia’s corrections system is one of the most unique collaborations in the country. The city, which is defined as a federal district, has no state corrections system. Under the National Capitol Revitalization Act of 1997, the responsibilities of managing the D.C. Criminal Justice system were formally split between the Federal and District government. Offenders convicted of a felony are sent to distant prisons across the country. This prisoner distribution system is managed by the Federal Bureau of Prisons. The Federal Bureau of Prisons makes the sole determination as to whether a prisoner is returned to DC after serving their sentence. Like other states in the country, the DC municipal government has no authority or representation in the policy determinations of the Federal Bureau of Prisons. According to the Federal Bureau of Prisons Discharge Assistance document produced in April 2002, Corrections social workers are encouraged to direct prisoners exiting the Federal Prison System to HUD funded shelters (See p.3 Federal Bureau of Prisons Discharge Assistance Community Assistance). Possible changes to the Federal Bureau of Prisons discharge planning process would assist in ensuring that felony ex-offenders are not discharged from federal prisons to shelters. Offenders that have not committed felonies are incarcerated through the District Department of Corrections. Locally, the DC Department of Corrections works closely with the Court Services and Offender Supervision Agency (CSOSA), the federal agency that supervises men and women on probation, parole, and supervised release in the city. One of CSOSA’s major policy priorities is to operate a comprehensive re-entry strategy to ensure public safety and reduce recidivism for prisoners returned to DC from Federal Prisons and offenders exiting the District Department of Corrections. The city’s Discharge Planning Committee and CSOSA acknowledge that both unmet mental health needs and homelessness are two major causes for recidivism. Therefore, CSOSA developed the Transitional Intervention for Parole Supervision unit (TIPS). This office is dedicated to ensuring the successful return of ex-offenders to the community. Preparation for discharge begins with pre-release planning managed by a TIPS case manager. Each offender’s discharge plan addresses critical areas of need from incarceration, through community supervision, to independent living in the community. The plan focuses on 1) Housing, 2) Education/Employment, 3) Substance Abuse, 4) Mental Health, 5) Identification and Benefits, 6) Life Skills and 7) Family/Community Support. TIPS staff attempt to ensure that Ex-offenders have a stable housing placement prior to exiting the halfway house. According to CSOSA about 25% of ex-
District of Columbia Five-Year Consolidated Plan
Page 155 of 184
offenders exiting the halfway houses return to family/friends. Those that do not return to family and friends often stay at halfway houses. One of the hallmarks of the Reentry Strategy is the Offender Reentry and Sanctions Center known as the RRC. This 102-bed halfway house, located on Massachusetts Avenue SE opened in September 2006. It is a 28 day residential program designed to serve persons that do not have a housing option in place at discharge. Residents without a place to stay after 28 days can request an extended length of stay at any half-way house facility of up to 120 days. According to CSOSA about 50% of all ex-offenders transition through RRC and five other halfway houses located throughout the city. In addition to providing initial housing stability, the halfway houses provide crisis intervention, referrals, counseling, employment and substance abuse intervention. Since affordable housing options have become increasingly more difficult to access, TIPS has formed relationships with faith-based organizations. These faith-based organizations provide mentoring, employment assistance and occasional housing options to ex-offenders residing in halfway houses without support systems. According to CSOSA, hundreds of ex-offenders have taken advantage of faith-based partnerships to access ongoing supportive services. In addition the Department of Corrections has entered into a number of Memorandums of Agreement with Supportive Services Agencies throughout the city to provide medical care, pharmaceutical entitlements and housing search assistance to ex-offenders that have exited halfway houses. However, because funding is limited one of these Supportive Service Agencies, Unity Healthcare has applied for additional discharge planning assistance from the Robert Wood Johnson Foundation to provide among other things, housing options for ex-offenders with special medical needs. The Discharge Planning Committee, a subcommittee of the Interagency Council is working with CSOSA to find reliable housing options to avoid homelessness for these ex-offenders. The subcommittee produced A Comprehensive Public Sector Discharge Planning Policy to Prevent Homelessness in the District of Columbia, which includes a zero tolerance policy on discharging offenders to the homeless system. However, dedicated funding for affordable housing options for ex-offenders has not been identified. In the interim, the Community Partnership has trained providers at Contractors’ Meetings and during site visits on HUD’s policy of preventing individuals discharged from institutions from participating in McKinney-Vento homeless programs.

District of Columbia Five-Year Consolidated Plan FY2011-2015
Page 156 of 184
Emergency Shelter Grant (ESG) funds are used in conjunction with ARRA funds and locally appropriated funds to provide a robust array of prevention services. The Community Partnership for the Prevention of Homelessness administers ESG funds under the direction of and pursuant to a grant agreement from the Department of Housing and Community Development. Funds are distributed through a network of community-based organizations for which the Foundation for the National Capital region serves as fiduciary agent. ESG funds are used to leverage funding from Fannie Mae through the annual Help the Homeless Walkathon. ESG prevention funds are used to cover eligible rental assistance for past due rent and utility assistance for utility bills that are significantly overdue and which are often an early warning sign of risk of homelessness. ESG resources will be aligned with the prevention and permanent housing goals articulated in the District’s ICH 5 Year Plan, detailed within the Homeless chapter.
Emergency Shelter Grants (ESG) (States only) Describe the process for awarding grants to State recipients, and a description of how the allocation will be made available to units of local government. 3-5 Year Strategic Plan ESG response:
District of Columbia Five-Year Consolidated Plan
Page 157 of 184
CHAPTER FOUR: COMMUNITY DEVELOPMENT
Community Development (91.215 (e)) *Please also refer to the Community Development Table in the Needs.xls workbook 1. Identify the jurisdiction's priority non-housing community development needs
eligible for assistance by CDBG eligibility category specified in the Community Development Needs Table (formerly Table 2B), − i.e., public facilities, public improvements, public services and economic development.
2. Describe the basis for assigning the priority given to each category of priority
needs. 3. Identify any obstacles to meeting underserved needs. 4. Identify specific long-term and short-term community development objectives
(including economic development activities that create jobs), developed in accordance with the statutory goals described in section 24 CFR 91.1 and the primary objective of the CDBG program to provide decent housing and a suitable living environment and expand economic opportunities, principally for low- and moderate-income persons. NOTE: Each specific objective developed to address a priority need, must be identified by number and contain proposed accomplishments, the time period (i.e., one, two, three, or more years), and annual program year numeric goals the jurisdiction hopes to achieve in quantitative terms, or in other measurable terms as identified and defined by the jurisdiction.
3-5 Year Strategic Plan Community Development response:
District of Columbia Five-Year Consolidated Plan FY2011-2015
Page 158 of 184
1 Priority Community Development Needs The District’s core community development needs are those activities which help improve the quality of life of residents through neighborhood revitalization and employment, promote economic opportunities for residents and business owners, residential empowerment, and support the District’s overarching objective in creating complete sustainable neighborhoods. With these conceptual goals in mind, the District anticipates using Community Development Block Grant (CDBG) funding to support programs to: 1. Help ensure the District can include complete sustainable neighborhoods, especially for those who have limited resources available to them. CDBG and other funds will be used to support acquisition, disposition, construction, rehabilitation, and de-leading of housing and property. Additionally, funds will be used toward fair housing activities, rental housing subsidies, homeownership assistance, and energy efficiency improvements. Funds will be used toward physical improvement to encourage sustainable neighborhoods within the District. 2. Bring federal, nonprofit and private partners together to expand the District's tax base, attract and retain businesses of all sizes, strengthen the business climate, and bring good-paying jobs to residents, particularly those residents who are low to moderate incomes. Additionally, the District wants to lead the charge to create jobs for residents by growing and supporting businesses currently in the District and attracting new businesses. Lastly, the District will emphasize resident job training for those of low to moderate incomes in order for them to successfully obtain the new higher level jobs being brought into the District. 3. Create vibrant and stable neighborhoods, rebuild retail corridors and ensure every District investment yields real benefits for residents and local businesses. The District hopes these funds help preserve, enhance, and strengthen the physical character and quality of District neighborhoods. Priorities will be placed on projects that strengthen neighborhood identity, create more housing choices, guide growth, and improve environmental health. Finally, homeownership programs will be supported to help improve community stability by increasing homeownership rates in the District. 4. Continue to build the capacity of residents to empower themselves to help strengthen their community, address problems, and develop pride in their City and neighborhood. Public service activities that strengthen neighborhood organizations, provide employment, skills, and homebuyer training, and offer leadership opportunities to youth will be emphasized. Section 108 Loan Activities Section 108 loan guarantees remain a tool in the economic development toolkit of DHCD. However, it is more likely that projects in the Deputy Mayor for Planning and Economic Development (DMPED) pipeline would utilize this program, as that office takes the lead in promoting larger scale economic development projects in the city. However, in view of the fact that entitlements are shrinking while affordable housing need continues unabated, and the need for community facilities is strong, DHCD is reluctant to use the Section 108 program as future entitlements could be put at risk.
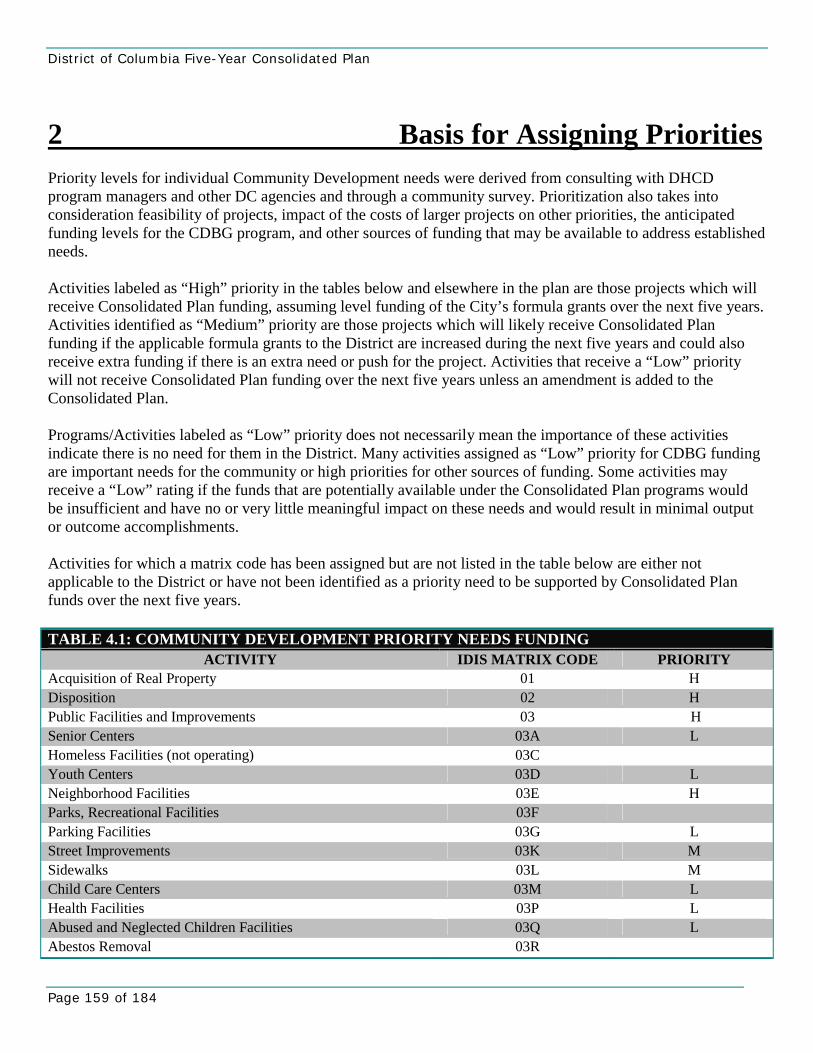
District of Columbia Five-Year Consolidated Plan
Page 159 of 184
2 Basis for Assigning Priorities Priority levels for individual Community Development needs were derived from consulting with DHCD program managers and other DC agencies and through a community survey. Prioritization also takes into consideration feasibility of projects, impact of the costs of larger projects on other priorities, the anticipated funding levels for the CDBG program, and other sources of funding that may be available to address established needs. Activities labeled as “High” priority in the tables below and elsewhere in the plan are those projects which will receive Consolidated Plan funding, assuming level funding of the City’s formula grants over the next five years. Activities identified as “Medium” priority are those projects which will likely receive Consolidated Plan funding if the applicable formula grants to the District are increased during the next five years and could also receive extra funding if there is an extra need or push for the project. Activities that receive a “Low” priority will not receive Consolidated Plan funding over the next five years unless an amendment is added to the Consolidated Plan. Programs/Activities labeled as “Low” priority does not necessarily mean the importance of these activities indicate there is no need for them in the District. Many activities assigned as “Low” priority for CDBG funding are important needs for the community or high priorities for other sources of funding. Some activities may receive a “Low” rating if the funds that are potentially available under the Consolidated Plan programs would be insufficient and have no or very little meaningful impact on these needs and would result in minimal output or outcome accomplishments. Activities for which a matrix code has been assigned but are not listed in the table below are either not applicable to the District or have not been identified as a priority need to be supported by Consolidated Plan funds over the next five years. TABLE 4.1: COMMUNITY DEVELOPMENT PRIORITY NEEDS FUNDING
ACTIVITY IDIS MATRIX CODE PRIORITY Acquisition of Real Property 01 H Disposition 02 H Public Facilities and Improvements 03 H Senior Centers 03A L Homeless Facilities (not operating) 03C Youth Centers 03D L Neighborhood Facilities 03E H Parks, Recreational Facilities 03F Parking Facilities 03G L Street Improvements 03K M Sidewalks 03L M Child Care Centers 03M L Health Facilities 03P L Abused and Neglected Children Facilities 03Q L Abestos Removal 03R
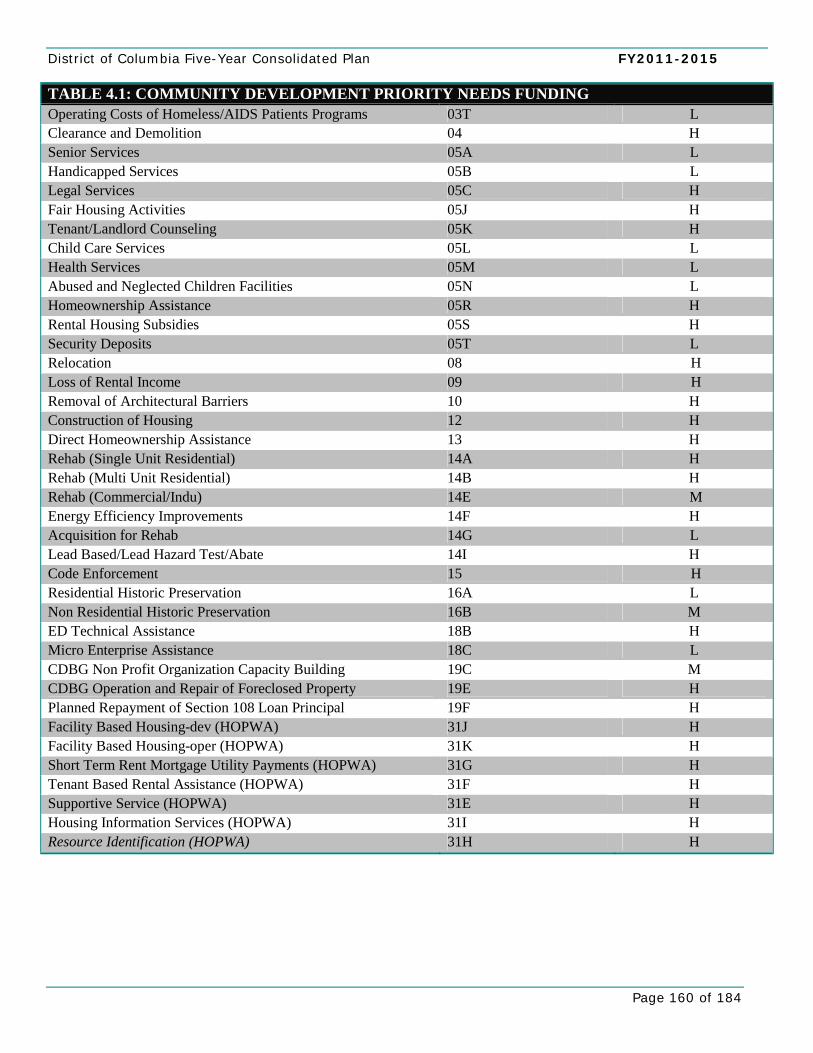
District of Columbia Five-Year Consolidated Plan FY2011-2015
Page 160 of 184
TABLE 4.1: COMMUNITY DEVELOPMENT PRIORITY NEEDS FUNDING Operating Costs of Homeless/AIDS Patients Programs 03T L Clearance and Demolition 04 H Senior Services 05A L Handicapped Services 05B L Legal Services 05C H Fair Housing Activities 05J H Tenant/Landlord Counseling 05K H Child Care Services 05L L Health Services 05M L Abused and Neglected Children Facilities 05N L Homeownership Assistance 05R H Rental Housing Subsidies 05S H Security Deposits 05T L Relocation 08 H Loss of Rental Income 09 H Removal of Architectural Barriers 10 H Construction of Housing 12 H Direct Homeownership Assistance 13 H Rehab (Single Unit Residential) 14A H Rehab (Multi Unit Residential) 14B H Rehab (Commercial/Indu) 14E M Energy Efficiency Improvements 14F H Acquisition for Rehab 14G L Lead Based/Lead Hazard Test/Abate 14I H Code Enforcement 15 H Residential Historic Preservation 16A L Non Residential Historic Preservation 16B M ED Technical Assistance 18B H Micro Enterprise Assistance 18C L CDBG Non Profit Organization Capacity Building 19C M CDBG Operation and Repair of Foreclosed Property 19E H Planned Repayment of Section 108 Loan Principal 19F H Facility Based Housing-dev (HOPWA) 31J H Facility Based Housing-oper (HOPWA) 31K H Short Term Rent Mortgage Utility Payments (HOPWA) 31G H Tenant Based Rental Assistance (HOPWA) 31F H Supportive Service (HOPWA) 31E H Housing Information Services (HOPWA) 31I H Resource Identification (HOPWA) 31H H

District of Columbia Five-Year Consolidated Plan
Page 161 of 184
3 Obstacles to Meeting Underserved Needs The primary obstacle to meeting underserved needs is funding. The lack of available funds which has been discussed elsewhere in this plan constrains activities and, in many cases, forces the District to among competing priorities, addressing only those that can be successfully accomplished using the available funds. As discussed previously, while the District has ample federal employment opportunities, many jobs are held by non-residents, and the District has a high overall unemployment rate. Economic Development activities are often measured in terms of job creation, which in the District is meeting the needs of non-residents but not the needs of many lower-skilled residents. Meeting all of the employment needs in any community including the District can be compromised by factors and trends in the global, national, and regional economies that are beyond the control of the local jurisdiction. This is especially the case in today’s economic downturn. Not only have economic institutions suffered through this recession, but public service activities have been particularly hard hit due to funding cuts at the federal and state government levels. When combining this phenomenon with regulatory mandates that restrict program activities, these can pose obstacles to the success of public service and capacity building activities. Overall, the District understands the current federal budget restrictions, as well as limitations on local funding, and therefore is strategic in prioritizing programs and activities that make a significant impact on communities with demonstrated need.
4 Specific Community Development Objectives The following table represents the specific community development objectives of the CDBG program. These objectives are funded specifically with CDBG resources, in congruence with other allocated resources, in order to create complete neighborhoods and a more sustainable city. The goals established are through the five year Consolidated Planning period FY 2011-2015. TABLE 4.2: COMMUNITY DEVELOPMENT OBJECTIVES OF CDBG PROGRAM PRIORITY OBJECTIVE HUD
REFERENCE MEASUREMENT GOAL
Homeownership Assistance (direct) DH-3.1, DH-3.2, EO-1.1
People 3,570
Homeownership Assistance (indirect) DH-1.3, DH-1.4 Housing Units 900 Property Acquisition, Reclamation, Rehabilitation and Disposition
SL-3.3, SL-3.4, SL-3.5, SL-3.6
Properties 569
Rehabilitation (Single and Multi-family) SL-1.1, SL-1.2, SL-1.3
Housing Units 1,740
Special Needs (Elderly, Disabled, Homeless) Housing
DH-1.2, SL-1.4, EO-1.2
Housing Units 895
Preservation Assistance (indirect) DH-1.5 Housing Units 1,000 Inclusionary Zoning DH-2.1 Housing Units TBD Affordable Housing Created-Reclamation SL-2.1 Housing Units 285
District of Columbia Five-Year Consolidated Plan FY2011-2015
Page 162 of 184
Priority Community Development Projects DHCD’s community development primary objective is focused on implementing a community development plan that enhances the sustainability of the District within the regional context and holistically completes the fabric of the neighborhoods. Priority community development projects throughout the five year Consolidated Plan includes: HOUSING RESOURCE CENTER To build a more inclusive neighborhood and increase the number of District Residents who utilize DHCD services, DHCD opened a Housing Resource Center in 2009. This center serves the community as a one-stop shop for housing services and referrals, including providing access to DHCD’s searchable affordable housing database, dchousingsearch.org. Community access to the facility’s services will continue throughout the five year plan. INTERAGENCY COORDINATION Through a recent partnership with the Department of Mental Health (DMH), DHCD is responsible for meeting a goal of financing the development of 300 affordable housing units for the exclusive use of DMH consumers. Through an additional partnership with the Department of Human Services (DHS), DHCD is responsible for meeting its goal of providing 45 units of permanent supportive housing to serve the District’s homeless population. HOUSING COOPERATIVES Access to homeownership opportunities has become more difficult due to the national economic downturn. DHCD will leverage investments already made into housing cooperatives, by coordinating with financial institutions in order to structure housing cooperative pools. These pools will enable tenant association members that have already purchased their buildings within a cooperative structure to reduce their cost of housing preservation, obtain new rehabilitated housing units and preserve their ability to reside within the District. FORECLOSURE TECHNICAL ASSISTANCE DHCD will provide technical assistance to borrowers who face financial difficulty or are nearing foreclosure due to current market conditions and require DHCD loan restructuring in order to preserve the affordable housing units. COMMUNITY FACILITIES Neighborhoods across the District rely on the development of community facilities for services such as childcare, healthcare, food provisions, job training, etc. Such facilities can be difficult to develop in the current economic climate, since many private lenders will not make loans for such projects, since loan repayment can be uncertain. As a result, DHCD will coordinate with local financial institutions that have been awarded New Market Tax Credit allocations, so that a modest investment from DHCD can catalyze a larger investment from equity providers – all with the goal of financing the development of much needed community facilities in specific District neighborhoods. HOUSING ASSISTANCE DHCD will continue to develop housing assistance programs throughout the five year plan. Recently, in an effort to assist and encourage employees to live and work in the District of Columbia, DHCD added a non-traditional affordable housing assistance incentive program, the Negotiated Employee Housing Assistance Program (NEAHP), to its two existing programs, HPAP and EAHP. It is a long-term goal of DHCD to partner
District of Columbia Five-Year Consolidated Plan
Page 163 of 184
with other District agencies to establish homeownership for employees to live near their place of work in the District. SMALL BUSINESS ASSISTANCE It is the goal of DHCD to improve small business development in the District. Through community-based, non-profit organizations, project goals will help to support and strengthen existing businesses, broaden the commercial mix of stores, restaurants, and services; provide technical assistance to small businesses, and provide greater access to capital for small, neighborhood-based businesses. COMMERCIAL IMPROVEMENTS DHCD will continue its efforts to provide grants, through community-based non-profit partners, to retail and commercial property owners for the enhancement of retail and commercial facades in targeted commercial corridors of the District.
District of Columbia Five-Year Consolidated Plan FY2011-2015
Page 164 of 184
Antipoverty Strategy (91.215 (h)) 1. Describe the jurisdiction's goals, programs, and policies for reducing the number of
poverty level families (as defined by the Office of Management and Budget and revised annually). In consultation with other appropriate public and private agencies, (i.e. TANF agency) state how the jurisdiction's goals, programs, and policies for producing and preserving affordable housing set forth in the housing component of the consolidated plan will be coordinated with other programs and services for which the jurisdiction is responsible.
2. Identify the extent to which this strategy will reduce (or assist in reducing) the number
of poverty level families, taking into consideration factors over which the jurisdiction has control.
3-5 Year Strategic Plan Antipoverty Strategy response:
District of Columbia Five-Year Consolidated Plan
Page 165 of 184
1 Antipoverty Programs and Policies DHCD provides affordable housing in the District by subsidizing the financing of housing projects in order to designate a portion of units as affordable. Additionally, DHCD funds housing for extremely low, very-low and low-income residents, providing a stable home, as well as a means to build equity for the future, in the case of homeownership. DHCD also works with its network of Community-Based Organizations (CBOs) to provide housing counseling services such as home management and maintenance, improving credit, and household budgeting. These classes are geared toward improving residents’ opportunities to obtain and retain decent housing with the prospect of moving toward ownership and the development of equity. Residents of buildings with expiring Section 8 protections are provided targeted assistance in locating housing options, and are introduced to the DHCD-sponsored Tenant First Right to Purchase Program to move toward ownership. The Tenant First Right to Purchase Program provides technical assistance, seed funds and earnest money to tenant groups to assist them in organizing so that they are prepared to take advantage of their first right of refusal when a building is for sale. The program also provides new tenant owner groups with management/technical assistance. Converted buildings are also eligible to apply to DHCD for rehabilitation funding. During FY2009, DHCD provided 1,248 tenant households with these services through technical service contracts with University Legal Services. DHCD provides education and outreach to ensure that Fair Housing Laws are understood and that all residents are provided with information on their rights of access to housing in the District of Columbia. Assistance is provided in several languages. In addition, DHCD also contributes to the District’s anti-poverty strategy by requiring developers to meet Section 3, providing funding for crime prevention, supporting youth counseling, and funding job training, as well as training, employment and contracting opportunities for low and very-low income residents, particularly residents of public housing.
District Coordination DHCD also partners with other agencies to further assist in the reduction of poverty. The Department of Human Services (DHS) administers income support, welfare to work and a range of programs to support families and individuals. The Office of Tenant Advocacy (OTA) advocates for, educates, and provides outreach for tenants in the District of Columbia. The Community Partnership for the Prevention of Homelessness provides emergency support from ESG funds to prevent eviction. The Office on Aging provides support services to seniors and partners with DHCD in the development of senior housing. The Department of Employment Services (DOES) provides extensive job training opportunities through its city-wide “One Stop Service Centers.” The Workforce Investment Council (WIC) brings together private and public sector stakeholders to develop strategies to increase employment opportunities for DC residents and to support and to assist DOES in its employment mission. The DC Public School Administration has created career-oriented high schools in a number of specialized areas, including the Technology and Hospitality Industries to facilitate students progressing from school to real jobs in the District. Additionally, DMPED manages the New Communities and Great Streets initiatives that address both physical and socio-economic-educational needs of targeted areas by combining government resources with those of private and non-profit developers or organizations to bring long-term and comprehensive revitalization to the designated area. “New Communities” is a comprehensive partnership to improve the quality of life for families and individuals living in distressed neighborhoods. DHCD administers one of the key resources for New
District of Columbia Five-Year Consolidated Plan FY2011-2015
Page 166 of 184
Communities--the Housing Production Trust Fund. The companion program to New Communities is “Great Streets.” Great Streets is a strategy to revive the local commercial corridors bordering the new communities so that the balance of services that neighborhoods need are restored along with the housing and social fabric.
2 Strategy for Reducing Poverty Due to high poverties levels and limited resources, the District’s anti-poverty strategy is targeted at specific communities. To combat the underlying conditions that contribute to poverty and crime, the District will refocus its resources in “New Communities” and “Great Streets” initiatives. The initiatives are aimed at interrupting cycles of joblessness, crime, and physical deterioration by re-building the physical, educational, social and economic underpinnings of an entire geographic area, with the participation of the local residents. The goal is to retain current residents while bringing in new residents in a mixed-income environment. These initiatives are initially funded through securitization of $6 million from the District Housing Production Trust Fund.
District of Columbia Five-Year Consolidated Plan
Page 167 of 184
Low Income Housing Tax Credit (LIHTC) Coordination (91.315 (k)) 1. (States only) Describe the strategy to coordinate the Low-income Housing Tax Credit
(LIHTC) with the development of housing that is affordable to low- and moderate-income families.
3-5 Year Strategic Plan LIHTC Coordination response:
District of Columbia Five-Year Consolidated Plan FY2011-2015
Page 168 of 184
1 Low Income Housing Tax Credit The District of Columbia Department of Housing and Community Development (‘DHCD”) is the Agency assigned the authority and responsibility of administering Low Income Housing Tax Credits in the District of Columbia (“District”) by Mayor’s Order #87-72. The Portfolio Management Division of DHCD has the primary responsibility for managing LIHTC within DHCD. The Division allocates 9% Tax Credit to Developers for production of affordable rental Housing in the District. DC Housing Finance Agency, through delegated underwriting authority from DHCD, oversees the Tax Exempt Bond 4% tax credits. The allocation of the Low Income Housing Tax Credit (LIHTC) is done in accordance with the Internal Revenue Code Section 42, Treasury Regulation 1.42 and the District’s Qualified Allocation Plan (QAP). Federal law requires the District to adopt a plan to allocate the LIHTC to projects based on federally mandated requirements and priority needs determined by the District. The District’s QAP ensures that only those projects that comply with Federal law and address, on a priority basis, the housing needs of the District. The LIHTC program was enacted by Congress in 1986 to provide Owners of Qualified properties, Federal tax incentives through the Internal Revenue Code for providing rental housing at affordable rents for households at low or moderate income levels. The income limits and rent restrictions for LIHTC properties are based on the Area Median Income for the District of Columbia published by the United States Department of Housing and Urban Development. Owners of Tax Credit developments have the responsibility to ensure that residents comply with the income restrictions and that the rents charged are within tax credit limits. All Projects receiving allocation of tax credits after December 31, 1989, are required to enter into a Restrictive Covenant with the agency. The Restrictive Covenant adds an additional 15 years to the 15 year tax credit compliance period. DHCD monitors the ongoing compliance of LIHTC properties in the District by conducting physical inspections of tax credit buildings, as well as reviewing of the tenant files to determine compliance with the rules and regulations of the LIHTC program.
District of Columbia Five-Year Consolidated Plan
Page 169 of 184
CHAPTER FIVE: NON-HOMELESS SPECIAL NEEDS
Specific Special Needs Objectives (91.215) 1. Describe the priorities and specific objectives the jurisdiction hopes to achieve over a
specified time period. 2. Describe how Federal, State, and local public and private sector resources that are
reasonably expected to be available will be used to address identified needs for the period covered by the strategic plan.
3-5 Year Non-homeless Special Needs Analysis response:
District of Columbia Five-Year Consolidated Plan FY2011-2015
Page 170 of 184
1 Priorities and Specific Objectives Priorities and Specific Objectives for Special Needs Populations DHCD’s role in serving the needs of special needs populations is mainly financing housing for older individuals and persons with other special needs, and financing physical modifications that make single family homes accessible to persons with mobility impairments. DHCD also collaborates with other District agencies to ensure the full spectrum of special needs populations’ requirements are addressed. In the District, five percent of all new housing units developed must be accessible to persons with mobility impairments, and another two percent must be accessible to persons with visual or hearing limitations. DHCD enforces of this requirement in all projects it finances. Adding accessible housing is particularly needed in the District because the vast majority of its housing stock was built before the Americans with Disabilities Act went into effect, and is not accessible to disabled individuals. Additionally, DHCD has partnered with the Department of Mental Health (DMH) to develop 300 units of housing for DMH consumers, which includes individuals with severe mental illness, mentally and developmentally developed individuals, formerly homeless persons, and graduates of the District foster care system. In Fiscal Years 2011 to 2015, DHCD will fund the development of 150 units of housing for special needs population each year for a total of 750 units. Additionally, DHCD will continue to administer the following programs that aid in the development of special needs housing:
• Single Family Residential Rehabilitation Program; • Multi-Family Housing Construction and Rehabilitation Program; • First Right Purchase Program; and • Handicapped Accessibility Improvement Program.
2 Use of Available Resources DHCD anticipates a similar level of HUD funding as in recent years; therefore, plans to spend approximately $XX,000,000 of HOME and CDBG funding on affordable housing for special needs populations in Fiscal Years 2011-2015. As with its other housing and community development needs, the District’s special needs housing programs require, whenever possible, maximum use of private financial resources. Because DHCD uses its funds to “close the gap” of needed financing for its selected projects, the private financing sector provides the bulk of each project’s funds. Banks and other financial institutions serve as the private financing sources of all housing production, rehabilitation, or capital improvements and ongoing operations. Many banks have special community lending operations, partly in response to the provisions of the Community Reinvestment Act, which encourages local lenders to invest in affordable housing and other community support projects. Several local banks have been active in supporting nonprofit affordable housing development. The District’s public dollars leverage these private funds. DHCD also works in tandem with non-profit and semi-governmental development organizations to leverage funds for affordable housing and economic opportunity. In addition, the District government and nonprofit developers have actively reached out to capture foundation grants. Many nonprofit organizations seek foundation funding to provide social support services, especially to special needs populations. Among the organizations that are active in this area are the Fannie Mae Foundation, Meyer Foundation, Local Initiatives Support Corporation, and Enterprise Community Partners.
District of Columbia Five-Year Consolidated Plan
Page 171 of 184
Non-homeless Special Needs (91.205 (d) and 91.210 (d)) Analysis (including
HOPWA) 1. Estimate, to the extent practicable, the number of persons in various subpopulations
that are not homeless but may require housing or supportive services, including the elderly, frail elderly, persons with disabilities (mental, physical, developmental, persons with HIV/AIDS and their families), persons with alcohol or other drug addiction, victims of domestic violence, and any other categories the jurisdiction may specify and describe their supportive housing needs. The jurisdiction can use the Non-Homeless Special Needs Table (formerly Table 1B) of their Consolidated Plan to help identify these needs. *Note: HOPWA recipients must identify the size and characteristics of the population with HIV/AIDS and their families that will be served in the metropolitan area.
2. Identify the priority housing and supportive service needs of persons who are not
homeless but may or may not require supportive housing, i.e., elderly, frail elderly, persons with disabilities (mental, physical, developmental, persons with HIV/AIDS and their families), persons with alcohol or other drug addiction by using the Non-homeless Special Needs Table.
3. Describe the basis for assigning the priority given to each category of priority needs. 4. Identify any obstacles to meeting underserved needs. 5. To the extent information is available, describe the facilities and services that assist
persons who are not homeless but require supportive housing, and programs for ensuring that persons returning from mental and physical health institutions receive appropriate supportive housing.
6. If the jurisdiction plans to use HOME or other tenant based rental assistance to assist
one or more of these subpopulations, it must justify the need for such assistance in the plan.
3-5 Year Non-homeless Special Needs Analysis response:
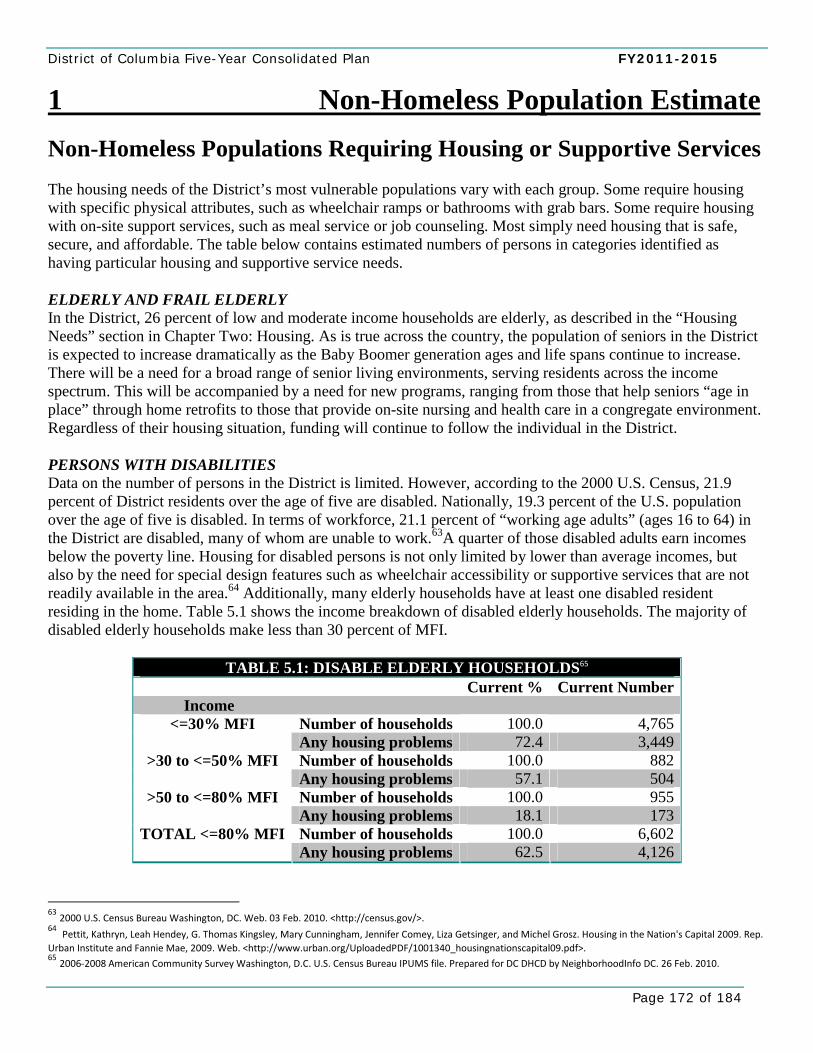
District of Columbia Five-Year Consolidated Plan FY2011-2015
Page 172 of 184
1 Non-Homeless Population Estimate Non-Homeless Populations Requiring Housing or Supportive Services The housing needs of the District’s most vulnerable populations vary with each group. Some require housing with specific physical attributes, such as wheelchair ramps or bathrooms with grab bars. Some require housing with on-site support services, such as meal service or job counseling. Most simply need housing that is safe, secure, and affordable. The table below contains estimated numbers of persons in categories identified as having particular housing and supportive service needs. ELDERLY AND FRAIL ELDERLY In the District, 26 percent of low and moderate income households are elderly, as described in the “Housing Needs” section in Chapter Two: Housing. As is true across the country, the population of seniors in the District is expected to increase dramatically as the Baby Boomer generation ages and life spans continue to increase. There will be a need for a broad range of senior living environments, serving residents across the income spectrum. This will be accompanied by a need for new programs, ranging from those that help seniors “age in place” through home retrofits to those that provide on-site nursing and health care in a congregate environment. Regardless of their housing situation, funding will continue to follow the individual in the District. PERSONS WITH DISABILITIES Data on the number of persons in the District is limited. However, according to the 2000 U.S. Census, 21.9 percent of District residents over the age of five are disabled. Nationally, 19.3 percent of the U.S. population over the age of five is disabled. In terms of workforce, 21.1 percent of “working age adults” (ages 16 to 64) in the District are disabled, many of whom are unable to work.63A quarter of those disabled adults earn incomes below the poverty line. Housing for disabled persons is not only limited by lower than average incomes, but also by the need for special design features such as wheelchair accessibility or supportive services that are not readily available in the area.64 Additionally, many elderly households have at least one disabled resident residing in the home. Table 5.1 shows the income breakdown of disabled elderly households. The majority of disabled elderly households make less than 30 percent of MFI.
TABLE 5.1: DISABLE ELDERLY HOUSEHOLDS65 Current % Current Number
Income Number of households 100.0 4,765<=30% MFI Any housing problems 72.4 3,449Number of households 100.0 882>30 to <=50% MFI Any housing problems 57.1 504Number of households 100.0 955>50 to <=80% MFI Any housing problems 18.1 173Number of households 100.0 6,602TOTAL <=80% MFI Any housing problems 62.5 4,126
63 2000 U.S. Census Bureau Washington, DC. Web. 03 Feb. 2010. <http://census.gov/>. 64 Pettit, Kathryn, Leah Hendey, G. Thomas Kingsley, Mary Cunningham, Jennifer Comey, Liza Getsinger, and Michel Grosz. Housing in the Nation's Capital 2009. Rep. Urban Institute and Fannie Mae, 2009. Web. <http://www.urban.org/UploadedPDF/1001340_housingnationscapital09.pdf>. 65 2006‐2008 American Community Survey Washington, D.C. U.S. Census Bureau IPUMS file. Prepared for DC DHCD by NeighborhoodInfo DC. 26 Feb. 2010.
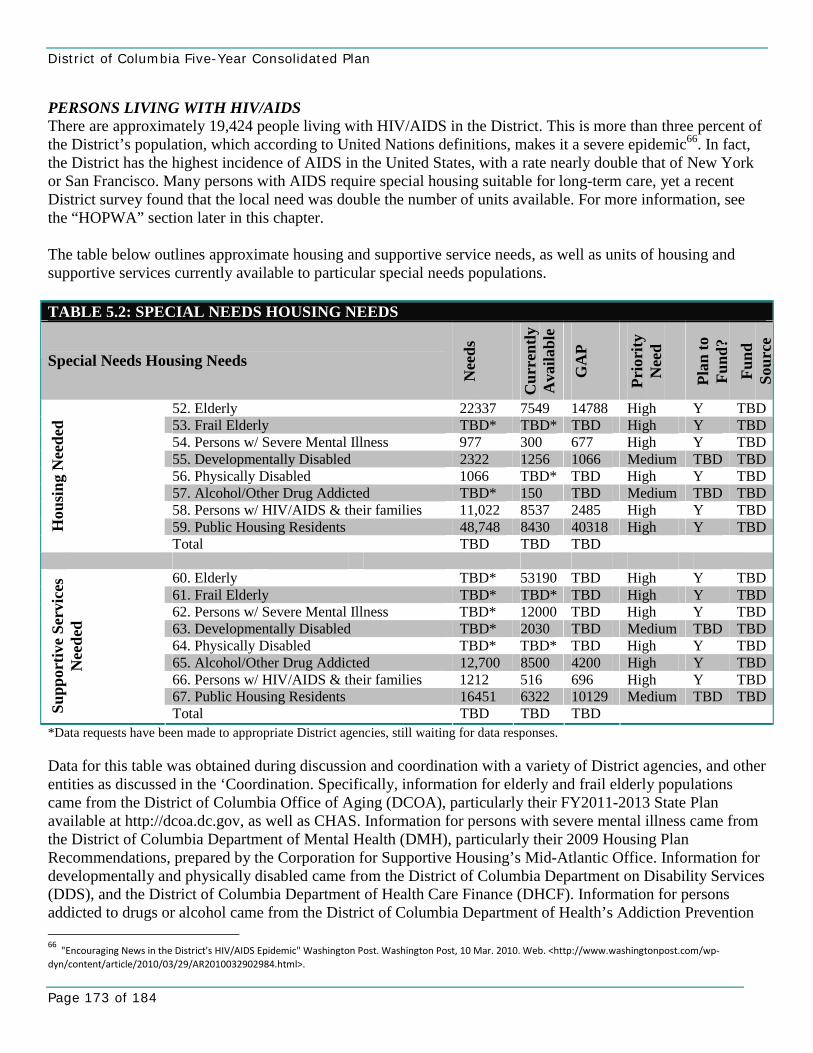
District of Columbia Five-Year Consolidated Plan
Page 173 of 184
PERSONS LIVING WITH HIV/AIDS There are approximately 19,424 people living with HIV/AIDS in the District. This is more than three percent of the District’s population, which according to United Nations definitions, makes it a severe epidemic66. In fact, the District has the highest incidence of AIDS in the United States, with a rate nearly double that of New York or San Francisco. Many persons with AIDS require special housing suitable for long-term care, yet a recent District survey found that the local need was double the number of units available. For more information, see the “HOPWA” section later in this chapter. The table below outlines approximate housing and supportive service needs, as well as units of housing and supportive services currently available to particular special needs populations. TABLE 5.2: SPECIAL NEEDS HOUSING NEEDS
Special Needs Housing Needs
Nee
ds
Cur
rent
ly
Ava
ilabl
e
GA
P
Prio
rity
N
eed
Plan
to
Fund
? Fu
nd
Sour
ce
52. Elderly 22337 7549 14788 High Y TBD53. Frail Elderly TBD* TBD* TBD High Y TBD54. Persons w/ Severe Mental Illness 977 300 677 High Y TBD55. Developmentally Disabled 2322 1256 1066 Medium TBD TBD56. Physically Disabled 1066 TBD* TBD High Y TBD57. Alcohol/Other Drug Addicted TBD* 150 TBD Medium TBD TBD58. Persons w/ HIV/AIDS & their families 11,022 8537 2485 High Y TBD59. Public Housing Residents 48,748 8430 40318 High Y TBDH
ousi
ng N
eede
d
Total TBD TBD TBD
60. Elderly TBD* 53190 TBD High Y TBD61. Frail Elderly TBD* TBD* TBD High Y TBD62. Persons w/ Severe Mental Illness TBD* 12000 TBD High Y TBD63. Developmentally Disabled TBD* 2030 TBD Medium TBD TBD64. Physically Disabled TBD* TBD* TBD High Y TBD65. Alcohol/Other Drug Addicted 12,700 8500 4200 High Y TBD66. Persons w/ HIV/AIDS & their families 1212 516 696 High Y TBD67. Public Housing Residents 16451 6322 10129 Medium TBD TBD
Supp
ortiv
e Se
rvic
es
Nee
ded
Total TBD TBD TBD *Data requests have been made to appropriate District agencies, still waiting for data responses. Data for this table was obtained during discussion and coordination with a variety of District agencies, and other entities as discussed in the ‘Coordination. Specifically, information for elderly and frail elderly populations came from the District of Columbia Office of Aging (DCOA), particularly their FY2011-2013 State Plan available at http://dcoa.dc.gov, as well as CHAS. Information for persons with severe mental illness came from the District of Columbia Department of Mental Health (DMH), particularly their 2009 Housing Plan Recommendations, prepared by the Corporation for Supportive Housing’s Mid-Atlantic Office. Information for developmentally and physically disabled came from the District of Columbia Department on Disability Services (DDS), and the District of Columbia Department of Health Care Finance (DHCF). Information for persons addicted to drugs or alcohol came from the District of Columbia Department of Health’s Addiction Prevention 66 "Encouraging News in the District's HIV/AIDS Epidemic" Washington Post. Washington Post, 10 Mar. 2010. Web. <http://www.washingtonpost.com/wp‐dyn/content/article/2010/03/29/AR2010032902984.html>.
District of Columbia Five-Year Consolidated Plan FY2011-2015
Page 174 of 184
and Recovery Administration. Information for persons living with HIV/AIDS and their families came from the District of Columbia HIV/AIDS, Hepatitis, STD, and TB Administration (HAHSTA), who collected in from each jurisdiction within the Washington, DC EMSA (Eligible Metropolitan Statistical Area), as required by HUD. Finally, information on public housing residents came from the District of Columbia Housing Agency.
2 Priority Housing and Supportive Service Needs Priority Housing and Supportive Service Needs for Non-Homeless Populations The table above indicates DHCD’s identified relative housing and supportive services priorities for particular special needs populations. DHCD’s reasoning for level of priority can be found in Section 3 below.
3 Level of Priority Special Needs Justification Ideally, each of the above categories would receive enough funding to fully meet their unique and important needs. DCHD recognizes the critical importance of each category and that many District of Columbia residents rely on each type of housing and supportive service provision. DCHD also recognizes that there exists much overlap between categories and in many cases, these services are interdependent. However, resource limitations exist and therefore require tough financial decision-making. In determining priorities for special needs housing and supportive services, DHCD consulted broadly with District residents, advocates, non-profit organizations, and other District agencies as discussed further in the “Managing the Process” and “Citizen Participation” sections in Chapter One. Other factors that went into determining priority include other known resources available to each population, dependency on DHCD for well-being, and linkages to related District priorities.
4 Obstacles to Meeting Underserved Special Needs The largest obstacle to meeting underserved special needs in the District of Columbia is of course limited resources. Beyond limited funds, distributing special needs facilities across the District in an equitable manner constitutes a challenge due to high land costs in more affluent geographic areas. According to the District’s Comprehensive Plan, one of the basic premises of the city’s Vision is that special needs housing should be accommodated in all neighborhoods of the city and not concentrated in a handful of areas. While it would be unrealistic to propose that each neighborhood should have an identical number of such facilities, more can be done to avoid over-concentration. Steps can also be taken to reduce the stigma associated with special needs housing, and to improve its compatibility with the surrounding community. This will become even more important in the future, as displacement pressures Downtown and elsewhere threaten some of the city’s emergency shelters and special needs service providers. Given limited budgets, the rising cost of land tends to drive special needs housing to the most affordable areas of the city; the very places where these uses already are concentrated. Additional obstacles include the high cost of construction, a lack of land available for building new housing facilities, and the fact that the majority of the housing stock in the District was built before 1950 and is not accessible to physically disabled residents. For more information on obstacles to meeting underserved housing needs in the District, please refer to ‘Barriers to Affordable Housing’ section in Chapter Two: Housing.
District of Columbia Five-Year Consolidated Plan
Page 175 of 184
5 Existing Facilities and Services The table above describes existing housing and supportive services available and appropriate for special needs populations. Data for this table was obtained during discussion and coordination with a variety of District agencies, and other entities as discussed in the “Managing the Process” section in Chapter One: General Information.”
6 Tenant-Based Rental Assistance Need Justification As stated in Appendix B: HOPWA Consolidated Plan for the Washington, DC EMSA, federal funding has not kept pace with the HIV epidemic in the greater Washington, DC area. While the number of people living with HIV/AIDS continues to rise, reduced funding in other federally and locally funded housing programs has decreased. Additionally, the area has experienced a lack of affordable housing, a decrease in employment, along with a related prolonged client usage in long-term programming and decreased client movement into other federally funded long-term housing programs. These factors have resulted in exceptionally long waiting lists. The use of HOPWA funded tenant based rental assistance has been critical in maintaining the health of this vulnerable population, the Washington EMSA would like to continue to use HOPWA funds to reduce homelessness in this population by supporting the tenant-based rental assistance program.
District of Columbia Five-Year Consolidated Plan FY2011-2015
Page 176 of 184
All HOPWA funded facilities and services are directly administered by the District HIV/AIDS, Hepatitis, STD, and TB Administration (HAHSTA). Please refer to Appendix B for detailed information on this topic.
Housing Opportunities for People with AIDS (HOPWA) 1. The Plan includes a description of the activities to be undertaken with its HOPWA Program funds to address priority unmet
housing needs for the eligible population. Activities will assist persons who are not homeless but require supportive housing, such as efforts to prevent low-income individuals and families from becoming homeless and may address the housing needs of persons who are homeless in order to help homeless persons make the transition to permanent housing and independent living. The plan would identify any obstacles to meeting underserved needs and summarize the priorities and specific objectives, describing how funds made available will be used to address identified needs.
2. The Plan must establish annual HOPWA output goals for the planned number of households to be assisted during the year in:
(1) short-term rent, mortgage and utility payments to avoid homelessness; (2) rental assistance programs; and (3) in housing facilities, such as community residences and SRO dwellings, where funds are used to develop and/or operate these facilities. The plan can also describe the special features or needs being addressed, such as support for persons who are homeless or chronically homeless. These outputs are to be used in connection with an assessment of client outcomes for achieving housing stability, reduced risks of homelessness and improved access to care.
3. For housing facility projects being developed, a target date for the completion of each development activity must be included
and information on the continued use of these units for the eligible population based on their stewardship requirements (e.g. within the ten-year use periods for projects involving acquisition, new construction or substantial rehabilitation).
4. The Plan includes an explanation of how the funds will be allocated including a description of the geographic area in which
assistance will be directed and the rationale for these geographic allocations and priorities. Include the name of each project sponsor, the zip code for the primary area(s) of planned activities, amounts committed to that sponsor, and whether the sponsor is a faith-based and/or grassroots organization.
5. The Plan describes the role of the lead jurisdiction in the eligible metropolitan statistical area (EMSA), involving (a)
consultation to develop a metropolitan-wide strategy for addressing the needs of persons with HIV/AIDS and their families living throughout the EMSA with the other jurisdictions within the EMSA; (b) the standards and procedures to be used to monitor HOPWA Program activities in order to ensure compliance by project sponsors of the requirements of the program.
6. The Plan includes the certifications relevant to the HOPWA Program. 3-5 Year Strategic Plan HOPWA response:
District of Columbia Five-Year Consolidated Plan
Page 177 of 184
All HOPWA funded facilities and services are directly administered by the District HIV/AIDS, Hepatitis, STD, and TB Administration (HAHSTA). Please refer to Appendix B for detailed information on this topic.
Specific HOPWA Objectives 1. Describe how Federal, State, and local public and private sector resources that are reasonably expected
to be available will be used to address identified needs for the period covered by the strategic plan. 3-5 Year Specific HOPWA Objectives response:
District of Columbia Five-Year Consolidated Plan FY2011-2015
Page 178 of 184
CHAPTER SIX: OTHER NARRATIVE
Other Narrative
Include any Strategic Plan information that was not covered by a narrative in any other section. *DHCD has included a discussion on its Fair Housing Program in this chapter.
District of Columbia Five-Year Consolidated Plan
Page 179 of 184
1 Other Narrative Fair Housing DHCD’s Fair Housing program, launched in February 2001, addresses the growing need for fair housing education among the city's stakeholders and the need for agency policy and procedure to ensure agency programs are compliant with all civil rights regulations pertaining to fair housing and accessibility. Stakeholders include DHCD’s Residential and Community Services and Development Finance Division grant sub-recipients, the non-profit and for-profit sector partners, the various components of the housing industry, and District residents in general. The program promotes fair housing and equal opportunity in housing and ensures compliance with federal and local fair housing and equal opportunity laws, rules, and regulations by community non-profit organizations, housing developers, other government agencies and individual residents who receive program and project funding through DHCD. The Fair Housing program achieves these goals through: EDUCATION AND OUTREACH The Fair Housing program aims to educate city residents—particularly underserved populations such as immigrant communities, people with disabilities, and the elderly—about their fair housing rights in rental, sales, financing or home insurance transactions. PARTNERSHIPS The Fair Housing Program partners with other governmental agencies, non-profit and private sector housing advocates and practitioners to affirmatively further fair housing and provide greater education coverage of housing and fair housing issues to a diverse community. AFFIRMATIVE MARKETING As a recipient of HUD funding, DHCD follows HUD’s regulations for the Affirmative Fair Housing Marketing Plan (AFHMP). DHCD has instituted and continues to enforce a certification process for all of its housing projects (new construction and rehabilitation) as well as acquisition. The certification process ensures compliance with federal and local laws and regulations and ensures that housing construction projects and programs are affirmatively marketed and accessible to all protected populations. The process of certifying projects and programs is educational for the sub-recipient, as their knowledge of fair housing compliance is enhanced thereby affirmatively furthering fair housing. Through the AFHMP, DHCD aims to (1) bring greater diversity to areas that have been subjected to housing discrimination based on the residents’ protected class; and (2) provide information about the availability of housing to persons not likely to apply for the housing without special outreach efforts due to (a) self or forced segregation, (b) linguistic isolation, (c) neighborhood racial or ethnic composition and patterns, (d) location, and (e) price of housing. DHCD has also instituted a certification process for all its program and service grants. The certification process for programs, singular in the metropolitan area, ensures that non-housing activities associated with new construction and rehabilitation projects, and programs providing services also abide by the affirmative marketing principle. As such, DHCD requires completion of an ‘Affirmative Marketing Plan (AMP)’ certification form for those types of projects. For housing projects, the AFHMP certification is submitted with accompanying information on residential housing projects of five units or more, whether these are located in one parcel or a scattered multi-family project.
District of Columbia Five-Year Consolidated Plan FY2011-2015
Page 180 of 184
LANGUAGE ACCESS ACT The Language Access Act of 2004 (LAA) is designed to provide greater access and participation by Limited or No-English Proficiency (LEP/NEP) persons to public services, programs, and activities. The District’s implementation and monitoring of the LAC supports the Fair Housing Act’s requirement of affirmatively furthering fair housing by ensuring equal opportunity and accessibility of program and services to all District residents. Since 2001, DHCD has partnered with both the Mayor’s Office on Latino Affairs and the Mayor’s Office on Asian and Pacific Islander Affairs, and subsequently with the Mayor’s Office of African Affairs to ensure the agency’s programs of concern to these communities were available in the appropriate languages. The agency implemented the current Biannual Language Access Action Plan (BLAP) for 2009-2010 by adhering to the LAC’s five action objectives: (1) a thorough review of each agency’s mechanisms for data collection in order to design better outreach programs for target LEP communities; (2) the use of oral language (interpretation) services to ensure the agency’s message on how to access programs and services reaches and is understood by these communities; (3) the translation of vital documents in the appropriate language of the community targeted which depicts agency information on how services are acquired or vital information which could have a direct impact to health or safety; (4) the training of staff on cultural competency, awareness and sensitivity; and (5) the creation of targeted (LEP/NEP) community educational outreach material to ensure language barriers do not impede District residents from accessing programs and services. Each District agency reports on its LAC advances to the Office of Human Rights (OHR) on a quarterly basis. These results are analyzed yearly and are the basis for the agency’s bi-annual plans and changes as recommended by OHR. The next BLAP is currently being planned and will be produced for 2011-2012. DHCD holds an annual diversity training to ensure its public contact personnel is well apprised of the law and compliance measures. For the past two years, the Agency has partnered with the Office of Human Rights to offer this training to its combined staff, and is expected to further training throughout this planning period. Currently, DHCD ensures that all LEP communities have the agency’s information through its sub-recipients and directly through the agency’s website where a fact sheet about the pertinent programs can be found for easy download. The program information is available in Amharic, Chinese, Spanish, and Vietnamese. DHCD has also ensured that a bilingual interpreter is available at its public hearings, when needed. The Housing Regulation Administration formerly located within the District Department of Consumer Regulatory Affairs (DCRA) joined DHCD in Fiscal Year 2008. This addition has brought new opportunities to further engage and outreach to the LEP community on DHCD programs and housing services. DHCD aims to ensure that prospective buyers or tenants in the housing market area, regardless of their protected category—racial or ethnic groups—are given an opportunity to be informed about prospective housing development(s) across the city and feel welcome to apply. For example, DHCD’s bilingual housing locator tool, DCHousingSearch.org is available free of charge online and over the phone. SECTION 3 Section 3 of the Housing and Urban Development Act of 1968 (Section 3) provides training, employment and contracting opportunities for low and very-low income residents in jurisdictions receiving housing and community development program funding from the Department of Housing and Urban Development (HUD). DHCD is the District’s point agency for applying and enforcing this regulation. DHCD implements this policy through: (1) projects funded by and through DHCD which awards funding grants to developers and its contractors; (2) partnerships with government agencies and community based organizations to facilitate or
District of Columbia Five-Year Consolidated Plan
Page 181 of 184
create training opportunities; and (3) the creation of employment and business opportunities for residents of and other qualified low- and very low-income persons residing in the District. DHCD fully implemented its Section 3 program in Fiscal Year 2009 and the agency continues to expand the awareness of the Section 3 program through outreach and monitoring of all applicable projects. In 2009, all applicable Section 3 projects were monitored for Section 3 compliance. Implementation of the Section 3 policy included compliance monitoring of projects, data collection and developing awareness of the program. Additionally, implementation of the Section 3 Business Concern certification continued in order to facilitate compliance with the program. DHCD continued to partner with the DC Housing Authority, the Office of Small and Local Business Development, and the Department of Employment Services to create greater awareness of Section 3 among residents and businesses. DHCD continued to provide an annual training to all of its sub-recipients to ensure full compliance. The Section 3 program within DHCD is aimed at creating greater opportunities for recruitment and employment of low- and very low-income residents and business interests by DHCD funded developers working on contracts partially or wholly funded through HUD. To further support the intent and letter of the Section 3 regulations, DHCD has extended the Section 3 provisions to its locally funded projects; all projects funded through the agency must abide by the Section 3 policy. DHCD is also creating a data bank of all Section 3 Business Concerns registered and certified through DHCD. Before being awarded a DHCD grant, all contractors and businesses seeking Section 3 preference must complete a Section 3 Opportunities Plan as acknowledgement of the contracting and employment provisions required by Section 3. Affirmatively Furthering Fair Housing As an entitlement jurisdiction, the District must adhere to Section 808(e)(5) of the Fair Housing Act which requires DHCD to Affirmatively Further Fair Housing (AFFH) in the administration of its programs and activities. As part of this requirement, and in addition to this five year Consolidated Plan, DHCD must conduct an Analysis of Impediments to Fair Housing Choice (AI) in five-year intervals as mandated by the regulation. According to the HUD Fair Housing Planning Guide, an AI should include a comprehensive review of the District’s “rules, regulations, business practices, administrative policies practices, and procedures, laws, legislation, and other factors created by the private and government sectors” which could directly or indirectly affect or create an impediment to “fair housing choice” in the District of Columbia. In addition, Section 104 of the Housing and Community Development Act of 1974 (24CFR Part 570.496(a) requires that each state to certify that it will affirmatively further fair housing. ANALYSIS OF IMPEDIMENTS (AI) To Affirmatively Further Fair Housing, the District is required to: (1) Conduct an analysis to identify impediments to fair housing choice within the jurisdiction; (2) take appropriate actions to overcome the adverse effects of any impediments identified through the analysis; and (3) maintain records reflecting the analysis and actions taken in this regard. In December 2005, DHCD completed the most recent AI. This analysis looked at private and government sectors’ actions, omissions, or decisions that may have an ultimate effect of restricting housing choice. The District continues to address the four (4) major areas of impediments to fair housing choice found in the 2005 AI. These were:

District of Columbia Five-Year Consolidated Plan FY2011-2015
Page 182 of 184
• A lack of compliance of fair housing laws by the real estate and housing industry (real estate,
lending/mortgaging, insurance/appraisals, etc); • Decreasing number of affordable housing units for low and moderate-income households and special
needs residents in target neighborhoods; • Information on full range of housing available across many District neighborhoods offering affordable
housing is not made available to individuals and families seeking homes due to segregated residential patterns; and
• Low levels of home buying literacy among particular protected classes and high levels of home seekers with no or poor credit history.
In 2007, DHCD added a supplement to the 2005 AI by providing further guidance on the implementations of recommendations, thus assisting DHCD to increase fair housing choice among the city’s residents. DHCD is in the process of completing the next five year AI, for FY 2011-2015. As part of this process, DHCD is conducting a series of roundtable discussions with selected advisory group participants. The advisory group(s), composed of key stakeholders, will ensure that the analysis reflects a cross-section of constituent views. In addition to these advisory group meetings, DHCD is conducting an investigative report that will provide a comprehensive analysis of the District’s fair housing impediments. It is the goal of DHCD to have the AI completed by December of 2010; it will focus on addressing the impediments to fair housing choice found in the upcoming Consolidated Plan period FY 2011-2015.
Efforts to Remove Barriers to Affordable Housing The District maintains support of measures to remove potential barriers to fair housing choice. Throughout the last five year planning period, the District worked to remove these barriers, some of which are identified below. Throughout this Consolidated Planning period, DHCD will continue to work toward these goals, and any newly identified goals, to remove barriers to affordable housing. RENTAL HOUSING CONVERSION AND SALE AMENDMENT ACT OF 2005 The city continues to enforce the “Rental Housing Conversion and Sale Amendment Act of 2005” (Bill 16-050). This Act narrowed the 95 percent/5 percent loophole in the Rental Sale Conversion Act of 1980 which allowed rental property owners to circumvent the First Right of Refusal law thereby bypassing the tenant right to purchase their building once it was advertised for sale. INCLUSIONARY ZONING (IZ) Inclusionary Zoning (IZ) is a land use technique for developing diverse mixed-income communities by requiring each new residential development make a percentage of the new units affordable to targeted incomes. IZ in the District began with a set of public hearings held by the Zoning Commission starting in 2005. The Zoning Commission divided the hearing process into three parts covering 1) the design of program, 2) where it would apply in the District, and 3) how IZ requirements would interact with existing zoning overlays. At roughly the same time, the Council of the District of Columbia passed both the Comprehensive Plan for the National Capital and the Inclusionary Zoning Act of 2006, which gave policy guidance and empowered the Mayor to administer the program. In August of 2009, the District implemented the District’s Inclusionary Zoning program, which affords private sector development companies the right to additional density for their projects in exchange for making at least 8 percent of the units in the project affordable.
District of Columbia Five-Year Consolidated Plan
Page 183 of 184
OFFICE OF THE TENANT ADVOCATE (OTA) Tenants often don’t know their legal rights as renters, frequently can’t pay for legal representation and usually don’t know how to use lower cost court mediation and adjudication services. The OTA was started to respond to these concerns about District tenants. For its first two years, OTA was housed within the Department of Consumer and Regulatory Affairs (DCRA). As of October 2007, the OTA is fully independent. The Chief Tenant Advocate advocates for, educates, and provides outreach for tenants in the District of Columbia. HOUSING REGULATION ADMINISTRATION In 2008, the Housing Regulation Administration which includes the Rental Accommodations Division, the Rental Conversion and Sale Division and the Rental Housing Commission—moved from the Department of Consumer and Regulatory Affairs (DCRA) to DHCD. This was, in part, an effort by the District to reduce barriers to fair housing by providing quicker response to apartment building conversion concerns which can affect low income and disenfranchised tenants. NEIGHBORHOOD BASED ACTIVITIES DHCD has improved processes in its Neighborhood Based Activities programs to effectively address the needs of the underserved. It also continues to provide an annual training program for staff and funding recipients on fair housing and accessibility compliance for construction projects. DHCD continues to monitor all its sub-recipients to ensure compliance with fair housing and equal opportunity laws and regulations. Fair Housing staff is also available as a resource for constituents and service providers. FAIR HOUSING SYMPOSIUM In April of 2009, DHCD partnered with the DC Office of Human Rights and the Equal Rights Center to hold its Eighth Annual Fair Housing Symposium. The theme for the symposium was “Yes We Can! Prevent Housing Discrimination.”, the symposium brought together experts from various housing arenas to discuss the most prevalent housing issues and their effect on District residents. The Symposium, a one-day free event for District residents, community based organizations, local government service providers, and industry professionals, was divided into three main panels as well as a presentation by a Keynote Speaker. The Ninth Annual Symposium is scheduled to take place on April 6, 2010. REQUEST FOR PROPOSALS (RFPS) DHCD’s biannual RFPs solicit proposals from community development corporations (CDCs) and private sector firms interested in creating affordable housing or community development projects. During this process, DHCD holds several community meetings to educate developers about providing equal access opportunity to housing and building housing that is accessible to persons with mobility disabilities. EDUCATION AND OUTREACH The Department partners with non-profit and private sector housing advocates and practitioners to affirmatively further fair housing and to provide greater education coverage of housing and fair housing issues to a diverse community. One method is to fund community based organizations (CBOs) to provide outreach and education for tenants on purchase programs, comprehensive homeownership and housing counseling, and assistance for relocation and location of apartments. DHCD has contracted with University Legal Services, Latino Economic Development Corporation, Lydia’s House, and Housing Counseling Services, among others, to provide housing to provide these services.
District of Columbia Five-Year Consolidated Plan FY2011-2015
Page 184 of 184
ACCESSIBILITY EDUCATION AND ENFORCEMENT DHCD continues to hold an annual mandatory Section 504 accessibility compliance training program for all sub-recipients. The training covers practical and regulatory actions concerning accessible housing according to local building codes and its parallels to federal regulations and laws, multifamily projects compliance with the Sec. 504 accessibility rules and regulations of the Rehabilitation Act of 1973 and the Fair Housing Act as Amended. OFFICE OF HUMAN RIGHTS The DC Office of Human Rights is an agency of the District of Columbia government that seeks to eradicate discrimination, increase equal opportunity, and protect human rights in the city. The Office enforces the DC Human Rights Act of 1977 and other laws and policies on nondiscrimination and fair housing. The Office is also the advocate for the practice of good human relations and mutual understanding among the various racial ethnic and religious groups in the District of Columbia. DEPARTMENT OF INSURANCE SECURITIES AND BANKING (DISB) Part of DISB’s mission is to protect District residents from financial fraud and abuse by providing fair and efficient supervision of financial-service entities. Through education, training and outreach, DISB works to protect the interests of District consumers from unfair and abusive practices, including predatory lending practices. FORECLOSURE PREVENTION The District provides funding to the non-profit sector to provide outreach and education to residents victimized or at risk of a home foreclosure. Foreclosure prevention is intended to help educate borrowers and used as mitigation tool between the lender and borrower. The CBOs funded through DHCD provide foreclosure prevention training to residents in need. The training, provided in English and Spanish by some CBOs, seeks to provide individualized counseling, access delinquency status, and provide options and a work plan to prevent foreclosure. To further foreclosure prevention, DHCD convened an interagency alliance on foreclosure to ensure that all relevant District agencies are aware of current trends and can work together to develop appropriate outreach. HOMEOWNERSHIP ASSISTANCE Likewise, other housing agencies and non-profit community development corporations also offer tools for assisting first time homebuyers and persons in crisis. The D.C. Housing Finance Agency has a Home Resource Center dedicated to education and training to first time homebuyers on homeownership opportunities. Manna, Inc. a non-profit housing corporation which builds affordable housing also has its own first time home buyer training program and mortgage assistance program, through a sister organization, for low-income residents citywide.