Embed Size (px)
Citation preview

Cover Page

Legal PageConfidentiality Agreement
The undersigned reader acknowledges that the information provided by _______________ in this business plan is confidential; therefore, reader agrees not to disclose it without the express written permission of _______________.
It is acknowledged by reader that information to be furnished in this business plan is in all respects confidential in nature, other than information which is in the public domain through other means and that any disclosure or use of same by reader, may cause serious harm or damage to _______________.
Upon request, this document is to be immediately returned to _______________.
___________________ Signature
___________________Name (typed or printed)
___________________Date
This is a business plan. It does not imply an offering of securities.

Table of Contents
1.0 Executive Summary......................................................................................................................1Chart: Highlights............................................................................................................................1
1.1 Objectives.....................................................................................................................................11.2 Mission...........................................................................................................................................11.3 Keys to Success..........................................................................................................................1
2.0 Company Summary......................................................................................................................12.1 Company Ownership................................................................................................................12.2 Start-up Summary.....................................................................................................................1
Table: Start-up...............................................................................................................................2Chart: Start-up...............................................................................................................................2
3.0 Products and Services.................................................................................................................24.0 Market Analysis Summary.........................................................................................................2
4.1 Market Segmentation..............................................................................................................3Table: Market Analysis................................................................................................................3Chart: Market Analysis (Pie)......................................................................................................3
4.2 Target Market Segment Strategy........................................................................................34.3 Service Business Analysis......................................................................................................3
4.3.1 Competition and Buying Patterns................................................................................35.0 Web Plan Summary......................................................................................................................4
5.1 Website Marketing Strategy..................................................................................................45.2 Development Requirements.................................................................................................4
6.0 Strategy and Implementation Summary..............................................................................46.1 SWOT Analysis............................................................................................................................4
6.1.1 Strengths..............................................................................................................................46.1.2 Weaknesses.........................................................................................................................46.1.3 Opportunities.......................................................................................................................46.1.4 Threats...................................................................................................................................4
6.2 Competitive Edge......................................................................................................................46.3 Marketing Strategy...................................................................................................................46.4 Sales Strategy.............................................................................................................................4
6.4.1 Sales Forecast.....................................................................................................................5Table: Sales Forecast...............................................................................................................5Chart: Sales Monthly................................................................................................................5Chart: Sales by Year.................................................................................................................6
Page

Table of Contents
6.5 Milestones....................................................................................................................................6Table: Milestones..........................................................................................................................6Chart: Milestones..........................................................................................................................7
7.0 Management Summary...............................................................................................................77.1 Personnel Plan............................................................................................................................7
Table: Personnel............................................................................................................................78.0 Financial Plan..................................................................................................................................7
8.1 Start-up Funding........................................................................................................................7Table: Start-up Funding..............................................................................................................8
8.2 Important Assumptions...........................................................................................................88.3 Break-even Analysis.................................................................................................................8
Table: Break-even Analysis.......................................................................................................8Chart: Break-even Analysis.......................................................................................................9
8.4 Projected Profit and Loss........................................................................................................9Table: Profit and Loss..................................................................................................................9Chart: Profit Monthly..................................................................................................................10Chart: Profit Yearly.....................................................................................................................10Chart: Gross Margin Monthly..................................................................................................11Chart: Gross Margin Yearly......................................................................................................11
8.5 Projected Cash Flow...............................................................................................................11Table: Cash Flow.........................................................................................................................12Chart: Cash....................................................................................................................................13
8.6 Projected Balance Sheet.......................................................................................................13Table: Balance Sheet.................................................................................................................13
8.7 Business Ratios........................................................................................................................14Table: Ratios.................................................................................................................................14
8.8 Long-term Plan.........................................................................................................................15Table: Sales Forecast...........................................................................................................................1Table: Personnel....................................................................................................................................2Table: Profit and Loss..........................................................................................................................3Table: Cash Flow...................................................................................................................................4Table: Balance Sheet...........................................................................................................................6
Page

Table of Contents
Page

Stars Club
1.0 Executive Summary
Chart: Highlights
1.1 Objectives
1.2 Mission
1.3 Keys to Success
2.0 Company Summary
2.1 Company Ownership
Page 1
Sales
Gross Margin
Net Profit
FY 2017 FY 2018 FY 2019 FY 2020 FY 2021
Highlights

Stars Club
2.2 Start-up Summary
Table: Start-up
Start-up
Requirements
Start-up ExpensesLegal $0Stationery etc. $0Insurance $0Rent $0Computer $0Other $0Total Start-up Expenses $0
Start-up AssetsCash Required $0Other Current Assets $0Long-term Assets $0Total Assets $0
Total Requirements $0
Chart: Start-up
3.0 Products and Services
Page 2
Expenses Assets Investment Loans
Start-up

Stars Club
4.0 Market Analysis Summary
4.1 Market Segmentation
Table: Market Analysis
Market Analysis
2016 2017 2018 2019 2020Potential Customers Growth CAGRSegment Name 0% 0 0 0 0 0 0.00%Segment Name 0% 0 0 0 0 0 0.00%Other 0% 0 0 0 0 0 0.00%Total 0.00% 0 0 0 0 0 0.00%
Chart: Market Analysis (Pie)
4.2 Target Market Segment Strategy
4.3 Service Business Analysis
Page 3
Segment Name
Segment Name
Other
Market Analysis (Pie)

Stars Club
4.3.1 Competition and Buying Patterns
5.0 Web Plan Summary
5.1 Website Marketing Strategy
5.2 Development Requirements
6.0 Strategy and Implementation Summary
6.1 SWOT Analysis
6.1.1 Strengths
6.1.2 Weaknesses
6.1.3 Opportunities
6.1.4 Threats
6.2 Competitive Edge
6.3 Marketing Strategy
6.4 Sales Strategy
Page 4

Stars Club
6.4.1 Sales Forecast
Table: Sales Forecast
Sales Forecast
FY 2017 FY 2018 FY 2019 FY 2020 FY 2021SalesRow 1 $0 $0 $0 $0 $0Row 2 $0 $0 $0 $0 $0Row 3 $0 $0 $0 $0 $0Total Sales $0 $0 $0 $0 $0
Direct Cost of Sales FY 2017 FY 2018 FY 2019 FY 2020 FY 2021Row 1 $0 $0 $0 $0 $0Row 2 $0 $0 $0 $0 $0Row 3 $0 $0 $0 $0 $0Subtotal Direct Cost of Sales $0 $0 $0 $0 $0
Chart: Sales Monthly
Page 5
Row 1
Row 2
Row 3
May Jun Jul Aug Sep Oct Nov Dec Jan Feb Mar Apr
Sales Monthly

Stars Club
Chart: Sales by Year
6.5 Milestones
Table: Milestones
Milestones
Milestone Start Date End Date Budget Manager DepartmentName me 5/7/2016 6/6/2016 $0 ABC DepartmentName me 5/7/2016 6/6/2016 $0 ABC DepartmentName me 5/7/2016 6/6/2016 $0 ABC DepartmentName me 5/7/2016 6/6/2016 $0 ABC DepartmentName me 5/7/2016 6/6/2016 $0 ABC DepartmentName me 5/7/2016 6/6/2016 $0 ABC DepartmentName me 5/7/2016 6/6/2016 $0 ABC DepartmentName me 5/7/2016 6/6/2016 $0 ABC DepartmentName me 5/7/2016 6/6/2016 $0 ABC DepartmentName me 5/7/2016 6/6/2016 $0 ABC DepartmentTotals $0
Page 6
Row 1
Row 2
Row 3
FY 2017 FY 2018 FY 2019 FY 2020 FY 2021
Sales by Year

Stars Club
Chart: Milestones
7.0 Management Summary
7.1 Personnel Plan
Table: Personnel
Personnel Plan
FY 2017 FY 2018 FY 2019 FY 2020 FY 2021Name or Title or Group $0 $0 $0 $0 $0Name or Title or Group $0 $0 $0 $0 $0Name or Title or Group $0 $0 $0 $0 $0Total People 0 0 0 0 0
Total Payroll $0 $0 $0 $0 $0
8.0 Financial Plan
8.1 Start-up Funding
Page 7
May `16 Jun
Name me
Name me
Name me
Name me
Name me
Name me
Name me
Name me
Name me
Name me
Milestones

Stars Club
Table: Start-up Funding
Start-up Funding
Start-up Expenses to Fund $0Start-up Assets to Fund $0Total Funding Required $0
AssetsNon-cash Assets from Start-up $0Cash Requirements from Start-up $0Additional Cash Raised $0Cash Balance on Starting Date $0Total Assets $0
Liabilities and Capital
LiabilitiesCurrent Borrowing $0Long-term Liabilities $0Accounts Payable (Outstanding Bills) $0Other Current Liabilities (interest-free) $0Total Liabilities $0
Capital
Planned InvestmentOwner $0Investor $0Additional Investment Requirement $0Total Planned Investment $0
Loss at Start-up (Start-up Expenses) $0Total Capital $0
Total Capital and Liabilities $0
Total Funding $0
8.2 Important Assumptions
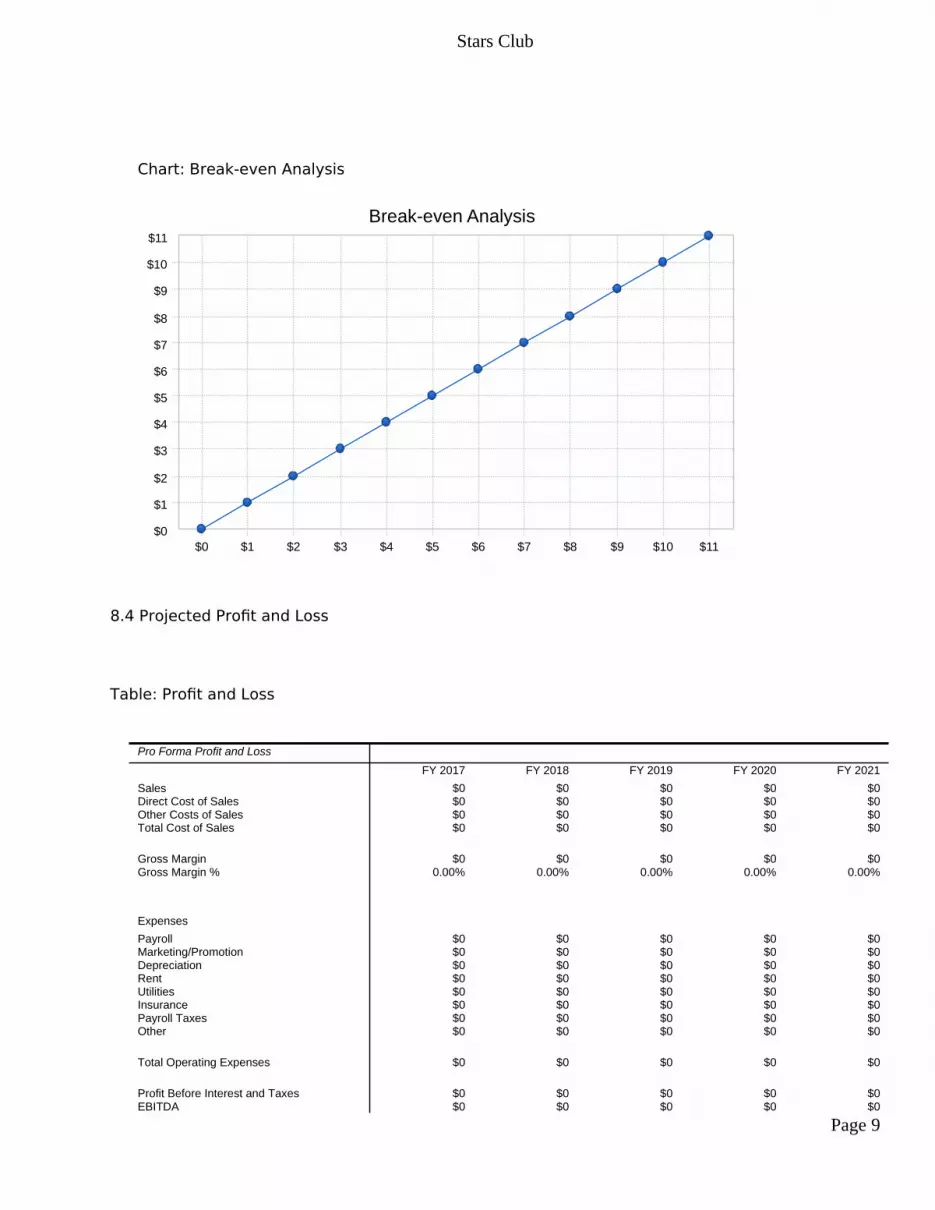
8.3 Break-even Analysis
Table: Break-even Analysis
Break-even Analysis
Monthly Revenue Break-even $0
Assumptions:Average Percent Variable Cost 0%Estimated Monthly Fixed Cost $0
Page 8
Stars Club
Chart: Break-even Analysis
8.4 Projected Profit and Loss
Table: Profit and Loss
Pro Forma Profit and Loss
FY 2017 FY 2018 FY 2019 FY 2020 FY 2021Sales $0 $0 $0 $0 $0Direct Cost of Sales $0 $0 $0 $0 $0Other Costs of Sales $0 $0 $0 $0 $0Total Cost of Sales $0 $0 $0 $0 $0
Gross Margin $0 $0 $0 $0 $0Gross Margin % 0.00% 0.00% 0.00% 0.00% 0.00%
ExpensesPayroll $0 $0 $0 $0 $0Marketing/Promotion $0 $0 $0 $0 $0Depreciation $0 $0 $0 $0 $0Rent $0 $0 $0 $0 $0Utilities $0 $0 $0 $0 $0Insurance $0 $0 $0 $0 $0Payroll Taxes $0 $0 $0 $0 $0Other $0 $0 $0 $0 $0
Total Operating Expenses $0 $0 $0 $0 $0
Profit Before Interest and Taxes $0 $0 $0 $0 $0EBITDA $0 $0 $0 $0 $0
Page 9
$0
$1
$2
$3
$4
$5
$6
$7
$8
$9
$10
$11
$0 $1 $2 $3 $4 $5 $6 $7 $8 $9 $10 $11
Break-even Analysis
Stars Club
Interest Expense $0 $0 $0 $0 $0 Taxes Incurred $0 $0 $0 $0 $0
Net Profit $0 $0 $0 $0 $0Net Profit/Sales 0.00% 0.00% 0.00% 0.00% 0.00%
Chart: Profit Monthly
Page 10
May Jun Jul Aug Sep Oct Nov Dec Jan Feb Mar Apr
Profit Monthly

Stars Club
Chart: Profit Yearly
Chart: Gross Margin Monthly
Page 11
FY 2017 FY 2018 FY 2019 FY 2020 FY 2021
Profit Yearly
May Jun Jul Aug Sep Oct Nov Dec Jan Feb Mar Apr
Gross Margin Monthly

Stars Club
Chart: Gross Margin Yearly
8.5 Projected Cash Flow
Table: Cash Flow
Pro Forma Cash Flow
FY 2017 FY 2018 FY 2019 FY 2020 FY 2021Cash Received
Cash from OperationsCash Sales $0 $0 $0 $0 $0Subtotal Cash from Operations $0 $0 $0 $0 $0
Additional Cash ReceivedSales Tax, VAT, HST/GST Received $0 $0 $0 $0 $0New Current Borrowing $0 $0 $0 $0 $0New Other Liabilities (interest-free) $0 $0 $0 $0 $0New Long-term Liabilities $0 $0 $0 $0 $0Sales of Other Current Assets $0 $0 $0 $0 $0Sales of Long-term Assets $0 $0 $0 $0 $0New Investment Received $0 $0 $0 $0 $0Subtotal Cash Received $0 $0 $0 $0 $0
Expenditures FY 2017 FY 2018 FY 2019 FY 2020 FY 2021
Expenditures from OperationsCash Spending $0 $0 $0 $0 $0Bill Payments $0 $0 $0 $0 $0Subtotal Spent on Operations $0 $0 $0 $0 $0
Additional Cash SpentSales Tax, VAT, HST/GST Paid Out $0 $0 $0 $0 $0
Page 12
FY 2017 FY 2018 FY 2019 FY 2020 FY 2021
Gross Margin Yearly

Stars Club
Principal Repayment of Current Borrowing $0 $0 $0 $0 $0Other Liabilities Principal Repayment $0 $0 $0 $0 $0Long-term Liabilities Principal Repayment $0 $0 $0 $0 $0Purchase Other Current Assets $0 $0 $0 $0 $0Purchase Long-term Assets $0 $0 $0 $0 $0Dividends $0 $0 $0 $0 $0Subtotal Cash Spent $0 $0 $0 $0 $0
Net Cash Flow $0 $0 $0 $0 $0Cash Balance $0 $0 $0 $0 $0
Chart: Cash
8.6 Projected Balance Sheet
Table: Balance Sheet
Pro Forma Balance Sheet
FY 2017 FY 2018 FY 2019 FY 2020 FY 2021Assets
Current AssetsCash $0 $0 $0 $0 $0Other Current Assets $0 $0 $0 $0 $0Total Current Assets $0 $0 $0 $0 $0
Long-term AssetsLong-term Assets $0 $0 $0 $0 $0Accumulated Depreciation $0 $0 $0 $0 $0Total Long-term Assets $0 $0 $0 $0 $0Total Assets $0 $0 $0 $0 $0
Page 13
Net Cash Flow
Cash Balance
MayJun
JulAug
SepOct
NovDec
JanFeb
MarApr
Cash

Stars Club
Liabilities and Capital FY 2017 FY 2018 FY 2019 FY 2020 FY 2021
Current LiabilitiesAccounts Payable $0 $0 $0 $0 $0Current Borrowing $0 $0 $0 $0 $0Other Current Liabilities $0 $0 $0 $0 $0Subtotal Current Liabilities $0 $0 $0 $0 $0
Long-term Liabilities $0 $0 $0 $0 $0Total Liabilities $0 $0 $0 $0 $0
Paid-in Capital $0 $0 $0 $0 $0Retained Earnings $0 $0 $0 $0 $0Earnings $0 $0 $0 $0 $0Total Capital $0 $0 $0 $0 $0Total Liabilities and Capital $0 $0 $0 $0 $0
Net Worth $0 $0 $0 $0 $0
8.7 Business Ratios
Table: Ratios
Ratio Analysis
FY 2017 FY 2018 FY 2019 FY 2020 FY 2021 Industry ProfileSales Growth n.a. n.a. n.a. n.a. n.a. 0.00%
Percent of Total AssetsOther Current Assets 0.00% 0.00% 0.00% 0.00% 0.00% 100.00%Total Current Assets 0.00% 0.00% 0.00% 0.00% 0.00% 100.00%Long-term Assets 0.00% 0.00% 0.00% 0.00% 0.00% 0.00%Total Assets 100.00% 100.00% 100.00% 100.00% 100.00% 100.00%
Current Liabilities 0.00% 0.00% 0.00% 0.00% 0.00% 0.00%Long-term Liabilities 0.00% 0.00% 0.00% 0.00% 0.00% 0.00%Total Liabilities 0.00% 0.00% 0.00% 0.00% 0.00% 0.00%Net Worth 100.00% 100.00% 100.00% 100.00% 100.00% 100.00%
Percent of SalesSales 100.00% 100.00% 100.00% 100.00% 100.00% 100.00%Gross Margin 0.00% 0.00% 0.00% 0.00% 0.00% 0.00%Selling, General & Administrative Expenses
0.00% 0.00% 0.00% 0.00% 0.00% 0.00%
Advertising Expenses 0.00% 0.00% 0.00% 0.00% 0.00% 0.00%Profit Before Interest and Taxes 0.00% 0.00% 0.00% 0.00% 0.00% 0.00%
Main RatiosCurrent 0.00 0.00 0.00 0.00 0.00 0.00Quick 0.00 0.00 0.00 0.00 0.00 0.00Total Debt to Total Assets 0.00% 0.00% 0.00% 0.00% 0.00% 0.00%Pre-tax Return on Net Worth 0.00% 0.00% 0.00% 0.00% 0.00% 0.00%Pre-tax Return on Assets 0.00% 0.00% 0.00% 0.00% 0.00% 0.00%
Additional Ratios FY 2017 FY 2018 FY 2019 FY 2020 FY 2021Net Profit Margin 0.00% 0.00% 0.00% 0.00% 0.00% n.aReturn on Equity 0.00% 0.00% 0.00% 0.00% 0.00% n.a
Activity RatiosAccounts Payable Turnover 0.00 0.00 0.00 0.00 0.00 n.a
Page 14

Stars Club
Payment Days 0 0 0 0 0 n.aTotal Asset Turnover 0.00 0.00 0.00 0.00 0.00 n.a
Debt RatiosDebt to Net Worth 0.00 0.00 0.00 0.00 0.00 n.aCurrent Liab. to Liab. 0.00 0.00 0.00 0.00 0.00 n.a
Liquidity RatiosNet Working Capital $0 $0 $0 $0 $0 n.aInterest Coverage 0.00 0.00 0.00 0.00 0.00 n.a
Additional RatiosAssets to Sales n.a. n.a. n.a. n.a. n.a. n.aCurrent Debt/Total Assets 0% 0% 0% 0% 0% n.aAcid Test 0.00 0.00 0.00 0.00 0.00 n.aSales/Net Worth 0.00 0.00 0.00 0.00 0.00 n.aDividend Payout 0.00 0.00 0.00 0.00 0.00 n.a
8.8 Long-term Plan
Page 15

Appendix
Table: Sales Forecast
Sales Forecast
May Jun Jul Aug Sep Oct Nov Dec Jan Feb Mar Apr
Sales
Row 1 $0 $0 $0 $0 $0 $0 $0 $0 $0 $0 $0 $0
Row 2 $0 $0 $0 $0 $0 $0 $0 $0 $0 $0 $0 $0
Row 3 $0 $0 $0 $0 $0 $0 $0 $0 $0 $0 $0 $0
Total Sales $0 $0 $0 $0 $0 $0 $0 $0 $0 $0 $0 $0
Direct Cost of Sales May Jun Jul Aug Sep Oct Nov Dec Jan Feb Mar Apr
Row 1 $0 $0 $0 $0 $0 $0 $0 $0 $0 $0 $0 $0
Row 2 $0 $0 $0 $0 $0 $0 $0 $0 $0 $0 $0 $0
Row 3 $0 $0 $0 $0 $0 $0 $0 $0 $0 $0 $0 $0
Subtotal Direct Cost of Sales $0 $0 $0 $0 $0 $0 $0 $0 $0 $0 $0 $0
Page 1

Appendix
Table: Personnel
Personnel Plan
May Jun Jul Aug Sep Oct Nov Dec Jan Feb Mar Apr
Name or Title or Group $0 $0 $0 $0 $0 $0 $0 $0 $0 $0 $0 $0
Name or Title or Group $0 $0 $0 $0 $0 $0 $0 $0 $0 $0 $0 $0
Name or Title or Group $0 $0 $0 $0 $0 $0 $0 $0 $0 $0 $0 $0
Total People 0 0 0 0 0 0 0 0 0 0 0 0
Total Payroll $0 $0 $0 $0 $0 $0 $0 $0 $0 $0 $0 $0
Page 2
Appendix
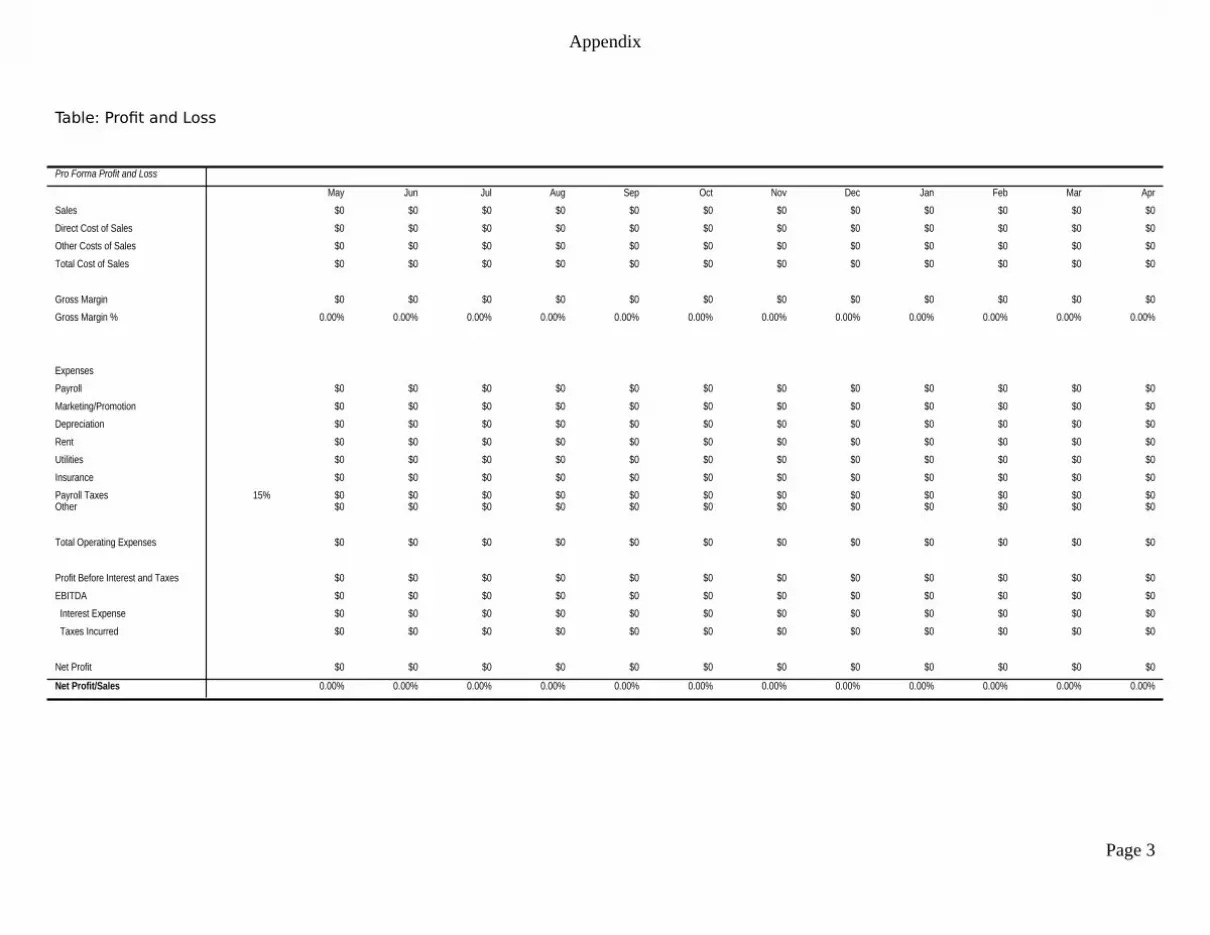
Table: Profit and Loss
Pro Forma Profit and Loss
May Jun Jul Aug Sep Oct Nov Dec Jan Feb Mar Apr
Sales $0 $0 $0 $0 $0 $0 $0 $0 $0 $0 $0 $0
Direct Cost of Sales $0 $0 $0 $0 $0 $0 $0 $0 $0 $0 $0 $0
Other Costs of Sales $0 $0 $0 $0 $0 $0 $0 $0 $0 $0 $0 $0
Total Cost of Sales $0 $0 $0 $0 $0 $0 $0 $0 $0 $0 $0 $0
Gross Margin $0 $0 $0 $0 $0 $0 $0 $0 $0 $0 $0 $0
Gross Margin % 0.00% 0.00% 0.00% 0.00% 0.00% 0.00% 0.00% 0.00% 0.00% 0.00% 0.00% 0.00%
Expenses
Payroll $0 $0 $0 $0 $0 $0 $0 $0 $0 $0 $0 $0
Marketing/Promotion $0 $0 $0 $0 $0 $0 $0 $0 $0 $0 $0 $0
Depreciation $0 $0 $0 $0 $0 $0 $0 $0 $0 $0 $0 $0
Rent $0 $0 $0 $0 $0 $0 $0 $0 $0 $0 $0 $0
Utilities $0 $0 $0 $0 $0 $0 $0 $0 $0 $0 $0 $0
Insurance $0 $0 $0 $0 $0 $0 $0 $0 $0 $0 $0 $0
Payroll Taxes 15% $0 $0 $0 $0 $0 $0 $0 $0 $0 $0 $0 $0Other $0 $0 $0 $0 $0 $0 $0 $0 $0 $0 $0 $0
Total Operating Expenses $0 $0 $0 $0 $0 $0 $0 $0 $0 $0 $0 $0
Profit Before Interest and Taxes $0 $0 $0 $0 $0 $0 $0 $0 $0 $0 $0 $0
EBITDA $0 $0 $0 $0 $0 $0 $0 $0 $0 $0 $0 $0
Interest Expense $0 $0 $0 $0 $0 $0 $0 $0 $0 $0 $0 $0
Taxes Incurred $0 $0 $0 $0 $0 $0 $0 $0 $0 $0 $0 $0
Net Profit $0 $0 $0 $0 $0 $0 $0 $0 $0 $0 $0 $0
Net Profit/Sales 0.00% 0.00% 0.00% 0.00% 0.00% 0.00% 0.00% 0.00% 0.00% 0.00% 0.00% 0.00%
Page 3

Appendix
Table: Cash Flow
Pro Forma Cash Flow
May Jun Jul Aug Sep Oct Nov Dec Jan Feb Mar Apr
Cash Received
Cash from Operations
Cash Sales $0 $0 $0 $0 $0 $0 $0 $0 $0 $0 $0 $0
Subtotal Cash from Operations $0 $0 $0 $0 $0 $0 $0 $0 $0 $0 $0 $0
Additional Cash Received
Sales Tax, VAT, HST/GST Received 0.00% $0 $0 $0 $0 $0 $0 $0 $0 $0 $0 $0 $0New Current Borrowing $0 $0 $0 $0 $0 $0 $0 $0 $0 $0 $0 $0
New Other Liabilities (interest-free) $0 $0 $0 $0 $0 $0 $0 $0 $0 $0 $0 $0
New Long-term Liabilities $0 $0 $0 $0 $0 $0 $0 $0 $0 $0 $0 $0
Sales of Other Current Assets $0 $0 $0 $0 $0 $0 $0 $0 $0 $0 $0 $0
Sales of Long-term Assets $0 $0 $0 $0 $0 $0 $0 $0 $0 $0 $0 $0
New Investment Received $0 $0 $0 $0 $0 $0 $0 $0 $0 $0 $0 $0
Subtotal Cash Received $0 $0 $0 $0 $0 $0 $0 $0 $0 $0 $0 $0
Expenditures May Jun Jul Aug Sep Oct Nov Dec Jan Feb Mar Apr
Expenditures from Operations
Cash Spending $0 $0 $0 $0 $0 $0 $0 $0 $0 $0 $0 $0
Bill Payments $0 $0 $0 $0 $0 $0 $0 $0 $0 $0 $0 $0
Subtotal Spent on Operations $0 $0 $0 $0 $0 $0 $0 $0 $0 $0 $0 $0
Additional Cash Spent
Sales Tax, VAT, HST/GST Paid Out $0 $0 $0 $0 $0 $0 $0 $0 $0 $0 $0 $0
Principal Repayment of Current Borrowing $0 $0 $0 $0 $0 $0 $0 $0 $0 $0 $0 $0
Other Liabilities Principal Repayment $0 $0 $0 $0 $0 $0 $0 $0 $0 $0 $0 $0
Long-term Liabilities Principal Repayment $0 $0 $0 $0 $0 $0 $0 $0 $0 $0 $0 $0
Purchase Other Current Assets $0 $0 $0 $0 $0 $0 $0 $0 $0 $0 $0 $0
Purchase Long-term Assets $0 $0 $0 $0 $0 $0 $0 $0 $0 $0 $0 $0
Dividends $0 $0 $0 $0 $0 $0 $0 $0 $0 $0 $0 $0
Subtotal Cash Spent $0 $0 $0 $0 $0 $0 $0 $0 $0 $0 $0 $0
Net Cash Flow $0 $0 $0 $0 $0 $0 $0 $0 $0 $0 $0 $0
Cash Balance $0 $0 $0 $0 $0 $0 $0 $0 $0 $0 $0 $0
Page 4

Appendix
Table: Balance Sheet
Pro Forma Balance Sheet
May Jun Jul Aug Sep Oct Nov Dec Jan Feb Mar Apr
Assets Starting Balances
Current Assets
Cash $0 $0 $0 $0 $0 $0 $0 $0 $0 $0 $0 $0 $0Other Current Assets $0 $0 $0 $0 $0 $0 $0 $0 $0 $0 $0 $0 $0Total Current Assets $0 $0 $0 $0 $0 $0 $0 $0 $0 $0 $0 $0 $0
Long-term Assets
Long-term Assets $0 $0 $0 $0 $0 $0 $0 $0 $0 $0 $0 $0 $0Accumulated Depreciation $0 $0 $0 $0 $0 $0 $0 $0 $0 $0 $0 $0 $0Total Long-term Assets $0 $0 $0 $0 $0 $0 $0 $0 $0 $0 $0 $0 $0Total Assets $0 $0 $0 $0 $0 $0 $0 $0 $0 $0 $0 $0 $0
Liabilities and Capital May Jun Jul Aug Sep Oct Nov Dec Jan Feb Mar Apr
Current Liabilities
Accounts Payable $0 $0 $0 $0 $0 $0 $0 $0 $0 $0 $0 $0 $0Current Borrowing $0 $0 $0 $0 $0 $0 $0 $0 $0 $0 $0 $0 $0Other Current Liabilities $0 $0 $0 $0 $0 $0 $0 $0 $0 $0 $0 $0 $0Subtotal Current Liabilities $0 $0 $0 $0 $0 $0 $0 $0 $0 $0 $0 $0 $0
Long-term Liabilities $0 $0 $0 $0 $0 $0 $0 $0 $0 $0 $0 $0 $0Total Liabilities $0 $0 $0 $0 $0 $0 $0 $0 $0 $0 $0 $0 $0
Paid-in Capital $0 $0 $0 $0 $0 $0 $0 $0 $0 $0 $0 $0 $0Retained Earnings $0 $0 $0 $0 $0 $0 $0 $0 $0 $0 $0 $0 $0Earnings $0 $0 $0 $0 $0 $0 $0 $0 $0 $0 $0 $0 $0Total Capital $0 $0 $0 $0 $0 $0 $0 $0 $0 $0 $0 $0 $0Total Liabilities and Capital $0 $0 $0 $0 $0 $0 $0 $0 $0 $0 $0 $0 $0
Net Worth $0 $0 $0 $0 $0 $0 $0 $0 $0 $0 $0 $0 $0
Page 5


![[COVER PAGE] - Africa Portal](https://img.dokumen.tips/doc/110x75/6334de0eb9085e0bf5093904/cover-page-africa-portal.jpg)