Embed Size (px)
Citation preview


25thAFAInt’l.FertilizerTechnologyConference&Exhibition Dubai‐July9‐11,2012
Registration & Help Desk :
Sunday: July 8 th, 2012 : 09 hr:30 - 16 hr:00
Monday: July 9 th, 2012: 08 hr:30 - 14 hr:00
Tuesday: July 10 th, 2012: 09 hr:30 - 14 hr:00
Committees Meeting: Restricted to members only
Sunday: July 8 th, 2012
10 hr:00 AFA Technical Committee Meeting
11 hr:00 AFA Economic Committee Meeting
12 hr:00 AFA HSE Committee Meeting
14 hr:00 - 15hr:30 Lunch (Restricted to Committees Member) Hosted by: AFA General Secretariat
DAY 1: Monday: July 9 th, 2012
10:00 Opening Ceremony
Welcome addresses : Mr. Mohamed Rashid AL-Rashid, AFA Chairman Dr. Shafik Ashkar, AFA Secretary General
10:30 Session I Chairperson: Eng. Hussain A. AL-Hajari - Engineering Manager – SABIC- S. Arabia
1- From flaring to environmental friendly ammonia firing and that even done in an economical way Joey Dobrée, Licensing Manager, Stamicarbon, Netherlands
2- Energy efficient cooling of fertilizer with the Coperion bulk solids heat exchanger BULK-X-CHANGE®.\ Harald Nigsch - Sales Manager Thermal Processes, Coperion, Germany
3- “GPIC Sustainability Reporting Approach in line with the Global Reporting Initiatives (GRI) Framework” Hussam Al Asadi, Planning Engineer, GPIC, Bahrain
4- Qatar Fertilizer Company Commitment to Health & Safety and Environmental Stewardship
Iftikhar Hussain Turi, HOS A2/ AHOS Urea-2-, QAFCO, Qatar
12:00 Networking Coffee / Tea
12:30 Session II
Chairperson: Dr. Julian Hilton - Chairman, Aleff Group- UK 1- How Automation Improves Operational Efficiency of Nitrogen-based Fertilizer Plants
Brendan Sheehan, Chemical Marketing Manager, Honeywell Process Solutions, Turkey
2- Energy Conservation Study for Ammonia Urea Complex Anthony Conning – Business Unit Manager, ABB - UK
Magdy Mohamed Ali - Senior Process Engineer - Projects Division, FERTIL – UAE 3- Catalysing profit margin with LK-853 FENCE™ : A new generation of Topsøe low methanol LTS
catalyst Kristina Svennerberg, General Manager, Marketing Synthesis, Haldor Topsøe, Denmark
4- Elimination of radioactive sources in Ruwais Fertilizer Industries Co. Ahmed Al-Awadhi – Sr. Instrument Engineer, FERTIL, UAE
14:00 Networking Lunch
17:00 Dubai City Tour
DAY 2 Tuesday: July 10 th, 2012
10:00 Session III Chairperson: Dr.Nadim Fuleihan - Presindent, Senior Consulting - Ardaman & Association- USA
1- Safe, Sustainable Phosphate Production
Julian Hilton – Chairman, ALEFF GROUP, UK
2- Phosphogypsum Management and Use: Opportunities and Issues Julian Hilton – Chairman, ALEFF GROUP, UK
3- Utilization of Low grade rocks by optimizing operation parameters in manufacturing Phosphoric acid with Better Efficiency G M Patel,Technical Director, CFIC, India
4- Smart fertilizers for sustainable agriculture: The state of the art and the recent developments Youssef ZEROUAL, Research & Development Direction Industrial Pole, OCP Group, Morocco
5- Enhancement of Hot leach plant Operational Sustainability Ala'a Al Omari, Senior Process Engineer, APC, Jordan
12:00 Networking Coffee / Tea
12:30 Session IV Chairperson: Eng. Faisal Dodun - General Manager - I C – Jordan
1- KBR PURIFIERTM Technology and Project Execution Options for Ammonia Plants
Avinash Malhotra - Director, Technology Fertilizers & Synthesis Gas, KBR, USA
2- Application of ALSTOM´s Chilled Ammonia Process in the Fertilizer Industry Gianluca Di Federico - Director Sales, ALSTOM , Germany
3- Sustainable ammonia plant operations: The impact of shift operation Yaqoob Kamal, Johnson Matthey, UK
4- Online Installation of New Exchanger for Sustained Production Faisal F. Al-Shahrani , SF4 Operation Manager, SAFCO, S. Arabia
5- Economics of synthesis gas generation concepts for substantial capacity enlargements of ammonia plants
Joachim Johanning , Head of Product Development Group Ammonia & Urea Division Uhde GmbH - Germany
14:00 Networking Lunch
17:00 Dubai City Tour
DAY 3: Wednesday, July 11 th, 2012
10:00 Session V
Chairperson: Dr. Abdelhak Kabbabi - Head of Department Environment - OCP - Morocco
1- The Way to achieve Zero Liquid Discharge at Abu Qir Fertilizers Co. Fatma Badawy - Utilities Sectors Head, Abu Qir, Egypt
2- Challenges Experienced in Phasing out Radioactive Source Level Measurement in Urea Reactor at Albayroni Hassan Al-Khulaif - Process Engineer, Bayroni, S. Arabia
3- “GPIC Initiative to obtain Responsible Care® Certification as full member of GPCA” Mohamed Al Hashemi, GPIC, Bahrain
4- Composite fertilizers including Urea+ and NPK production in High Speed Drum Granulator
Danil Safonov, International Affairs Manager, R&D Institute of Urea (NIIK) – Russia
12:00 Closing Session
13:00 Networking Lunch

1. From flaring to environmental friendly ammonia firing and that even done in an economical way
Joey Dobrée, Licensing Manager, Stamicarbon, Netherlands
2. Energy efficient cooling of fertilizer with the Coperion bulk solids heat exchanger BULK‐X‐CHANGE®.
Harald Nigsch ‐ Sales Manager Thermal Processes, Coperion, Germany
3. “GPIC Sustainability Reporting Approach in line with the Global
Reporting Initiatives (GRI) Framework”
Hussam Al Asadi, Planning Engineer, GPIC, Bahrain
4. Qatar Fertilizer Company Commitment to Health & Safety and Environmental Stewardship
Iftikhar Hussain Turi, HOS A2/ AHOS Urea‐2‐, QAFCO, Qatar


From flaring to environmental friendly ammonia firing and that even done in an economical way
Author: Jan Mennen, Principal Engineer, Stamicarbon BV, the Netherlands Joey Dobrée, Licensing Manager, Stamicarbon BV, the Netherlands
Barbara Cucchiella, Process Engineer, Processi Innovativi, Italy
Table of contents Page 1. Abstract ........................................................................................................ 1 2. Introduction ................................................................................................... 2 3. Continuous ammonia emission sources in a CO2 stripping plant ............................. 3 4. Existing commercial available treatment possibilities to eliminate the ammonia in tail gases ................................................................................................................ 4
4.1 Flaring ...................................................................................................... 4 4.2 Acidic scrubbing ......................................................................................... 4 4.3 Heating with flare ...................................................................................... 5
5. Description of the Stamicarbon environmental friendly and economical alternative ... 6 6. Environmental considerations ........................................................................... 9 7. Principle of combustion and DeNOX system ....................................................... 11 8. Lay out options ............................................................................................. 15 9. Safety and nuisance consideration ................................................................... 17
9.1 Safety consideration ................................................................................ 17 9.2 Nuisance consideration ............................................................................ 17
10. Example case: World scale urea melt plant ..................................................... 19 10.1 Treatment of continuous off-gasses .......................................................... 19 10.2 Replacement of flare system by thermal treatment ..................................... 21 10.3 Environmental relief ............................................................................... 21 10.4 Capital investment analysis ..................................................................... 22 10.5 Utility requirements ............................................................................... 23 10.6 Steam generation ................................................................................... 24 10.7 Recap of the example case ...................................................................... 24
11. Conclusion ................................................................................................. 26 All technical and other information contained herein is based on general Stamicarbon experience and within this limit is accurate to the best of our knowledge. However, no liability is accepted therefore and no warranty or guarantee is to be inferred. Copyright Stamicarbon BV. All rights reserved. No part of this publication may be reproduced in any form or by any means without the permission of Stamicarbon BV. You will access its contents solely for your own private use and will comply with all applicable laws and regulatory requirements relating to your use of this information.

1.
1. Abstract The reduction of ammonia emission from urea plants has always been an important qualifier for technology licensors in order to comply with World Bank or derivative standards and our own responsibility to strive for a sustainable future. Technology development does provide solutions to design urea plants in such way that ammonia venting is made absent, but economical feasibility and environmental sensibility remain a hurdle to take. In the meanwhile tightening local emission regulations and the avoidance of ammonia smell to the plant surroundings require solutions to bridge the gap to the future. One of the options for the bridging is the flaring of ammonia containing off-gasses. But is it an actual solution or just a poor man’s solution? This paper focuses specifically on the environmental consideration to use an off-gas treatment system for the elimination of ammonia emissions in the urea melt plant. It explains how ammonia venting to the atmosphere can environmentally wise be benchmarked against the alternatives of incineration, heating and combustion technologies. The paper explains Stamicarbon’s objections regarding the use of flare systems as environmental mitigation strategy in the urea melt plant and clarifies the most environmental and economical sensible solution available in Stamicarbon’s technology portfolio: the thermal treatment and catalytic DeNOX. An example case of a world scale urea plant is used for quantification and the outcome of the paper reveals Stamicarbon’s bridge that connects today to tomorrow.

2.
2. Introduction The reduction of the ammonia emission from urea plants is an important qualifier for licensors to comply with international and local standards. Still there is a heavy tendency to tighten the emission regulations and the avoidance of ammonia smell to the plant surroundings requires solutions to completely eliminate the ammonia in the tail gases from the urea plant. This paper focuses on a new developed opportunity to eliminate the ammonia emission from continuous emission sources in urea plants except from the finishing sections. It explains how to eliminate the ammonia in an environmental and economical friendly way. The developed alternative is explained by considering the CO2 stripping process as an example but the application of this alternative vent gas treatment system is not only limited to this process design.

3.
3. Continuous ammonia emission sources in a CO2 stripping plant In urea plants inert from the feed stocks ammonia and carbon dioxide, air injection for passivation of the materials in the synthesis to prevent corrosion and air ingress in vacuum systems like the evaporation sections have to be vented. To minimize the ammonia in these vapours, the stream is treated in absorbers before to be released into the atmosphere. Still, even after the absorption treatment, the vented vapour contains a limited although minimum amount of ammonia. The breathing system of atmospheric storage tanks is another emission source to be considered since the out breathing air contains ammonia and is usually discharged via the main stack into the atmosphere. In general the continuous ammonia emission sources in a modern CO2 stripping process are limited to: Vent gases from the low-pressure absorber. Vent gases from the atmospheric absorber. Breathing system of the atmospheric storage tanks.
4.
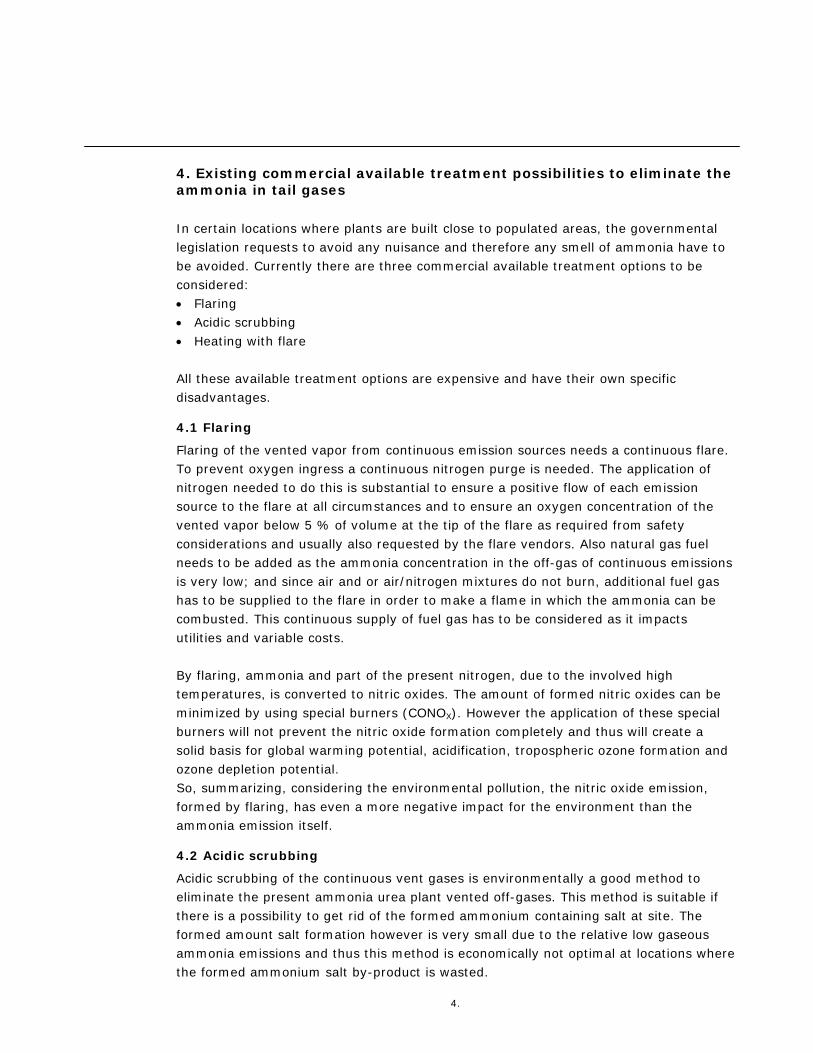
4. Existing commercial available treatment possibilities to eliminate the ammonia in tail gases In certain locations where plants are built close to populated areas, the governmental legislation requests to avoid any nuisance and therefore any smell of ammonia have to be avoided. Currently there are three commercial available treatment options to be considered: Flaring Acidic scrubbing Heating with flare All these available treatment options are expensive and have their own specific disadvantages.
4.1 Flaring
Flaring of the vented vapor from continuous emission sources needs a continuous flare. To prevent oxygen ingress a continuous nitrogen purge is needed. The application of nitrogen needed to do this is substantial to ensure a positive flow of each emission source to the flare at all circumstances and to ensure an oxygen concentration of the vented vapor below 5 % of volume at the tip of the flare as required from safety considerations and usually also requested by the flare vendors. Also natural gas fuel needs to be added as the ammonia concentration in the off-gas of continuous emissions is very low; and since air and or air/nitrogen mixtures do not burn, additional fuel gas has to be supplied to the flare in order to make a flame in which the ammonia can be combusted. This continuous supply of fuel gas has to be considered as it impacts utilities and variable costs. By flaring, ammonia and part of the present nitrogen, due to the involved high temperatures, is converted to nitric oxides. The amount of formed nitric oxides can be minimized by using special burners (CONOX). However the application of these special burners will not prevent the nitric oxide formation completely and thus will create a solid basis for global warming potential, acidification, tropospheric ozone formation and ozone depletion potential. So, summarizing, considering the environmental pollution, the nitric oxide emission, formed by flaring, has even a more negative impact for the environment than the ammonia emission itself.
4.2 Acidic scrubbing
Acidic scrubbing of the continuous vent gases is environmentally a good method to eliminate the present ammonia urea plant vented off-gases. This method is suitable if there is a possibility to get rid of the formed ammonium containing salt at site. The formed amount salt formation however is very small due to the relative low gaseous ammonia emissions and thus this method is economically not optimal at locations where the formed ammonium salt by-product is wasted.

5.
4.3 Heating with flare
The use of a flare system to heat the ammonia containing off-gasses to ensure that the ammonia is transported to higher layers in the atmosphere is applied in some urea plants. The heating with a flare will only reduce the nuisance of ammonia in the direct vicinity of the plant. This approach does not eliminate the ammonia emission and increases the environmental load of the continuous emissions by the NOX formation. Additionally it requires the capital investment for the installation of a flare and operational costs to ensure the heating. This option is therefore considered as relatively useless as it does not contribute to sustainable plant management and can be made redundant with proper design of the vents.
6.
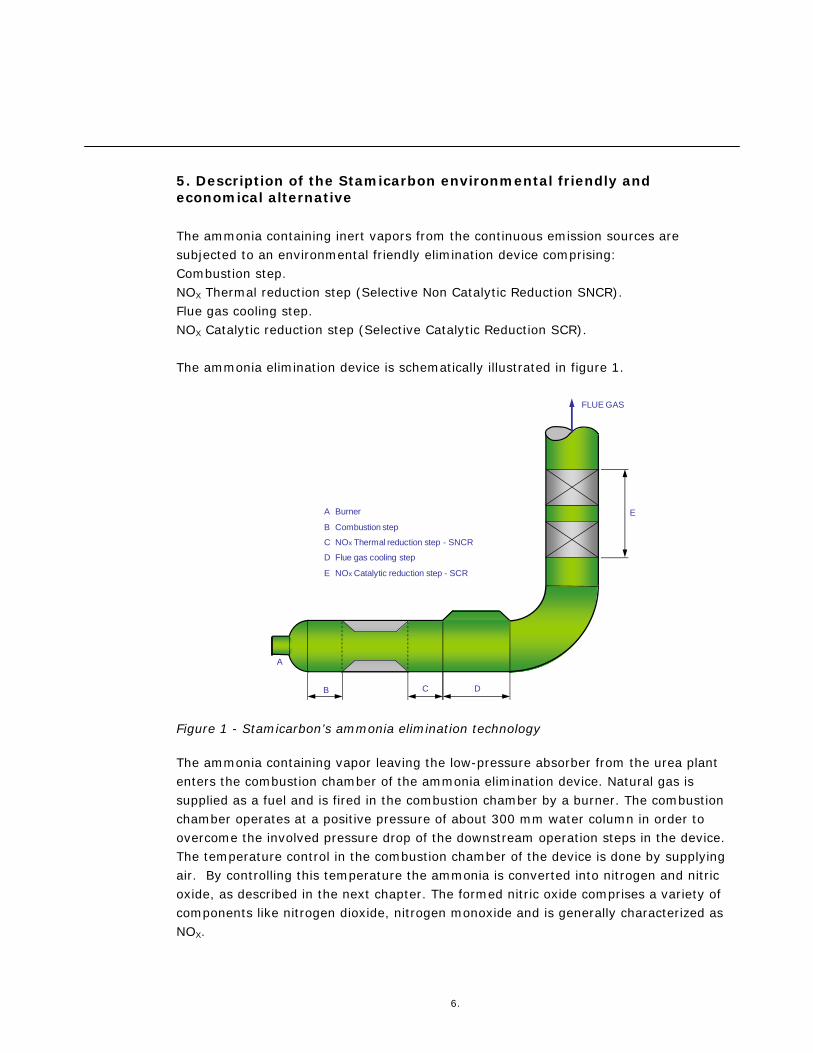
5. Description of the Stamicarbon environmental friendly and economical alternative The ammonia containing inert vapors from the continuous emission sources are subjected to an environmental friendly elimination device comprising: Combustion step. NOX Thermal reduction step (Selective Non Catalytic Reduction SNCR). Flue gas cooling step. NOX Catalytic reduction step (Selective Catalytic Reduction SCR). The ammonia elimination device is schematically illustrated in figure 1.
E
FLUE GAS
DCB
A
A Burner
B Combustion step
C NOx Thermal reduction step - SNCR
D Flue gas cooling step
E NOx Catalytic reduction step - SCR
Figure 1 - Stamicarbon’s ammonia elimination technology The ammonia containing vapor leaving the low-pressure absorber from the urea plant enters the combustion chamber of the ammonia elimination device. Natural gas is supplied as a fuel and is fired in the combustion chamber by a burner. The combustion chamber operates at a positive pressure of about 300 mm water column in order to overcome the involved pressure drop of the downstream operation steps in the device. The temperature control in the combustion chamber of the device is done by supplying air. By controlling this temperature the ammonia is converted into nitrogen and nitric oxide, as described in the next chapter. The formed nitric oxide comprises a variety of components like nitrogen dioxide, nitrogen monoxide and is generally characterized as NOX.
7.
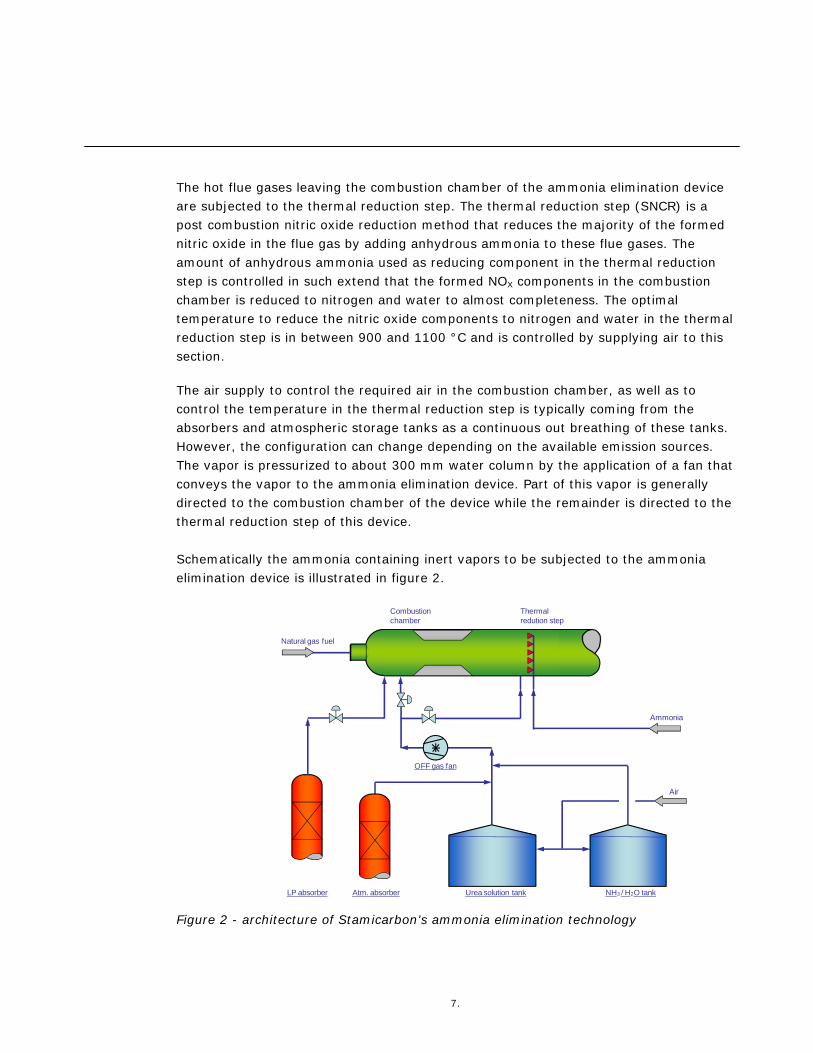
The hot flue gases leaving the combustion chamber of the ammonia elimination device are subjected to the thermal reduction step. The thermal reduction step (SNCR) is a post combustion nitric oxide reduction method that reduces the majority of the formed nitric oxide in the flue gas by adding anhydrous ammonia to these flue gases. The amount of anhydrous ammonia used as reducing component in the thermal reduction step is controlled in such extend that the formed NOX components in the combustion chamber is reduced to nitrogen and water to almost completeness. The optimal temperature to reduce the nitric oxide components to nitrogen and water in the thermal reduction step is in between 900 and 1100 °C and is controlled by supplying air to this section. The air supply to control the required air in the combustion chamber, as well as to control the temperature in the thermal reduction step is typically coming from the absorbers and atmospheric storage tanks as a continuous out breathing of these tanks. However, the configuration can change depending on the available emission sources. The vapor is pressurized to about 300 mm water column by the application of a fan that conveys the vapor to the ammonia elimination device. Part of this vapor is generally directed to the combustion chamber of the device while the remainder is directed to the thermal reduction step of this device. Schematically the ammonia containing inert vapors to be subjected to the ammonia elimination device is illustrated in figure 2. Figure 2 - architecture of Stamicarbon’s ammonia elimination technology
Thermal redution step
Ammonia
Air
NH3 / H2O tankUrea solution tankAtm. absorberLP absorber
OFF gas fan
Natural gas fuel
Combustionchamber
8.
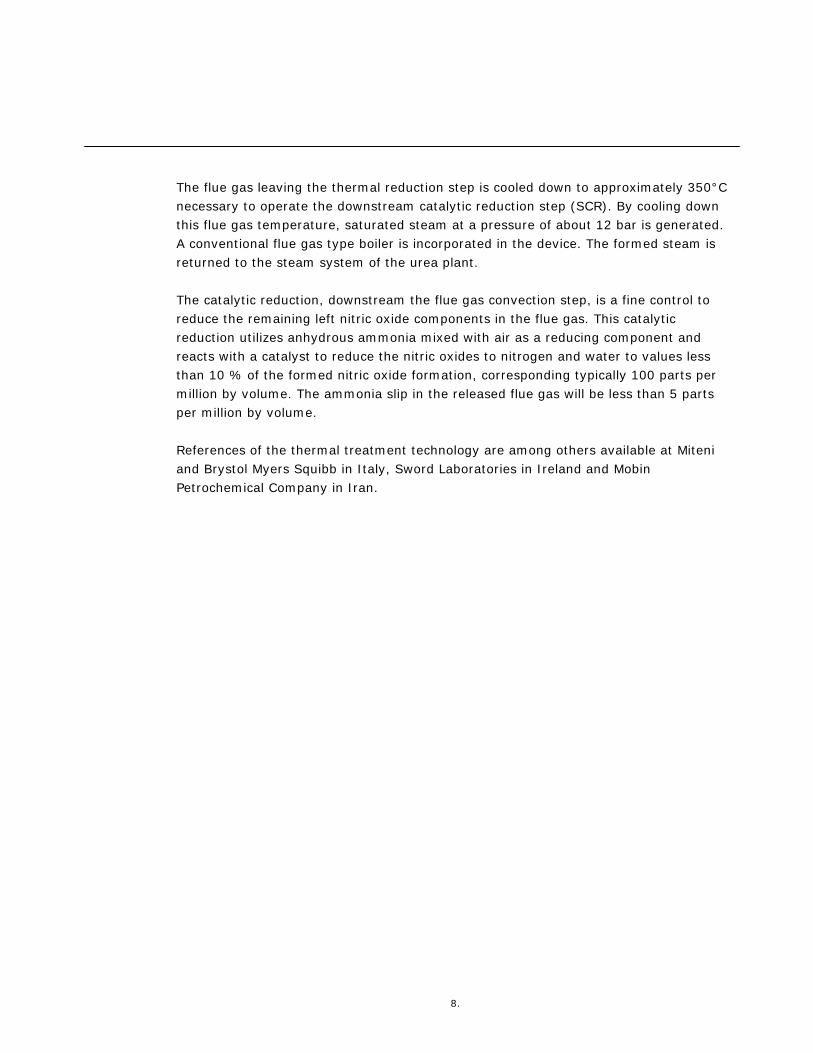
The flue gas leaving the thermal reduction step is cooled down to approximately 350°C necessary to operate the downstream catalytic reduction step (SCR). By cooling down this flue gas temperature, saturated steam at a pressure of about 12 bar is generated. A conventional flue gas type boiler is incorporated in the device. The formed steam is returned to the steam system of the urea plant. The catalytic reduction, downstream the flue gas convection step, is a fine control to reduce the remaining left nitric oxide components in the flue gas. This catalytic reduction utilizes anhydrous ammonia mixed with air as a reducing component and reacts with a catalyst to reduce the nitric oxides to nitrogen and water to values less than 10 % of the formed nitric oxide formation, corresponding typically 100 parts per million by volume. The ammonia slip in the released flue gas will be less than 5 parts per million by volume. References of the thermal treatment technology are among others available at Miteni and Brystol Myers Squibb in Italy, Sword Laboratories in Ireland and Mobin Petrochemical Company in Iran.
9.
6. Environmental considerations From environmental point of view four independent international standards, applied to the energy and industry sector to assess emissions, are considered to quantify and benchmark the emission of a urea melt plant. The benchmark is focused on emission of ammonia into the atmosphere by the incineration of ammonia by thermal treatment, combustion via flaring, heating via flaring and acidic scrubbing of vent gases. Benchmark indicators The benchmark provides insights on the impact of ammonia and NOX emission and creates a solid basis to make a well considered decision on the most suitable solution. Considered are the global warming potential, acidification, tropospheric ozone formation potential and ozone depletion potential of gasses: The global warming potential (GWP)1 indicates the contribution of a specified gas mass to global warming by comparison with reference gas carbon dioxide. The GWP has been defined as the ratio of the time integrated warming effect from the instantaneous release of a kilogram of a specified gas, compared to that of a kilogram of reference gas carbon dioxide. The GWP value represents the global warming potential of the gas over one hundred years. Acidification is used to describe the loss of nutrient bases in ground or water through the process of leaching and their replacement by acidic elements. The acidification is indicated by the acid equivalent2. The acid equivalent is a measure to determine the environmental impact of the acidifying substances, which are mainly caused by sulfur and nitrogen based molecules. The equivalent determines the degree of acidity of a substance per mole. The tropospheric ozone forming potential (TOFP)3 equivalent indicates the formation of ozone in the troposphere, causing radiative forcing. The troposphere is defined as the lowest part of the atmosphere from the surface to about ten kilometer in altitude in mid-latitudes where clouds and “weather” phenomena occur. Ozone is formed by two preceding pollutants in the presence of ultraviolet sunlight: volatile organic compounds and nitrogen oxides. TOFP uses ratios to convert emission masses to masses of the TOFP equivalent.
1 Intergovernmental Panel on Climate Change, 2007: Forster, P., Ramaswamy V., et al., Fourth Assessment Report, Changes in atmospheric constituents and in radiative forcing, Ch 2 2 MIRA/VMM, 2009: Brouwers. J., Milieurapport Vlaanderen 3 Intergovernmental Panel on Climate Change, 2001: Houghton, J.T., et al., Climate Change 2001: The Scientific Basis, Ch 6
10.
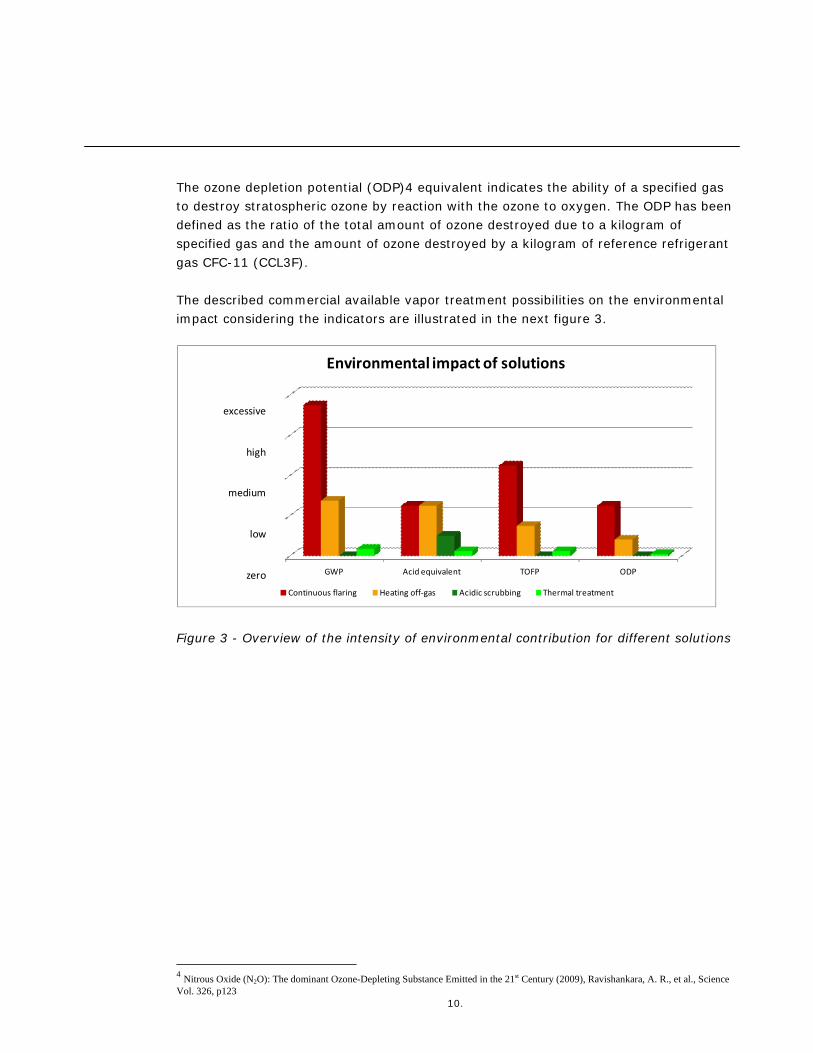
The ozone depletion potential (ODP)4 equivalent indicates the ability of a specified gas to destroy stratospheric ozone by reaction with the ozone to oxygen. The ODP has been defined as the ratio of the total amount of ozone destroyed due to a kilogram of specified gas and the amount of ozone destroyed by a kilogram of reference refrigerant gas CFC-11 (CCL3F). The described commercial available vapor treatment possibilities on the environmental impact considering the indicators are illustrated in the next figure 3.
GWP Acid equivalent TOFP ODP
Environmental impact of solutions
Continuous flaring Heating off‐gas Acidic scrubbing Thermal treatment
excessive
high
medium
low
zero
Figure 3 - Overview of the intensity of environmental contribution for different solutions
4 Nitrous Oxide (N2O): The dominant Ozone-Depleting Substance Emitted in the 21st Century (2009), Ravishankara, A. R., et al., Science Vol. 326, p123
11.
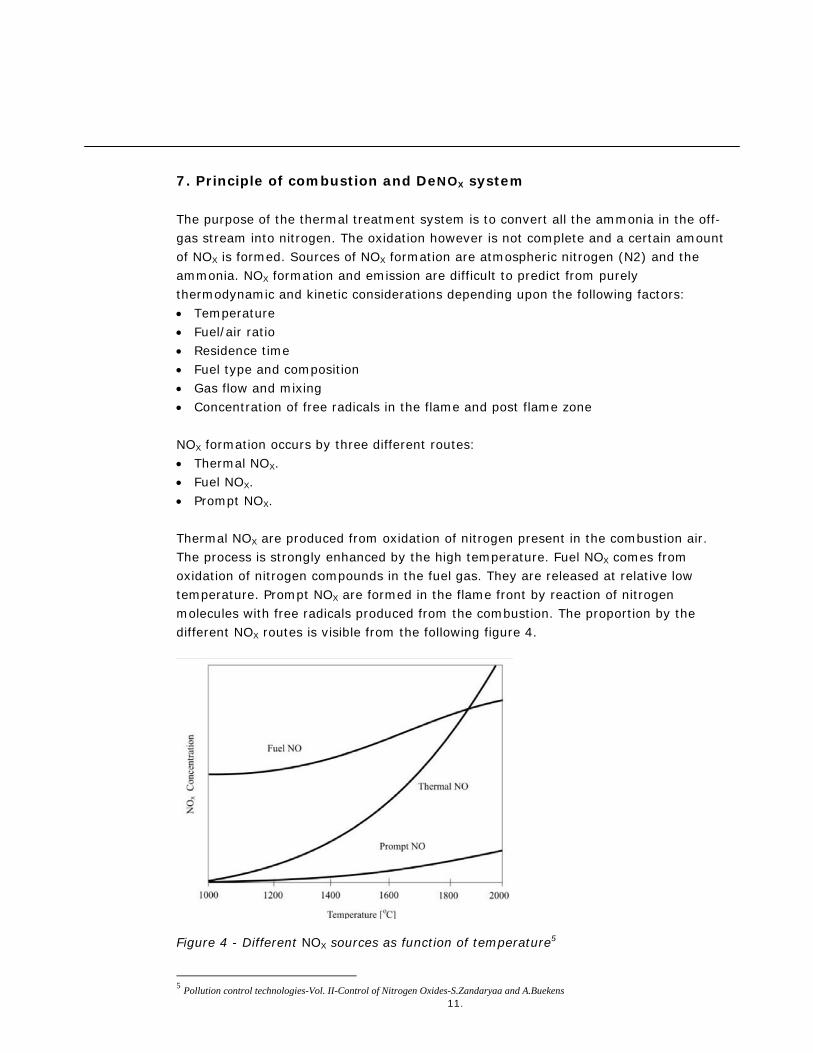
7. Principle of combustion and DeNOX system The purpose of the thermal treatment system is to convert all the ammonia in the off-gas stream into nitrogen. The oxidation however is not complete and a certain amount of NOX is formed. Sources of NOX formation are atmospheric nitrogen (N2) and the ammonia. NOX formation and emission are difficult to predict from purely thermodynamic and kinetic considerations depending upon the following factors: Temperature Fuel/air ratio Residence time Fuel type and composition Gas flow and mixing Concentration of free radicals in the flame and post flame zone NOX formation occurs by three different routes: Thermal NOX. Fuel NOX. Prompt NOX. Thermal NOX are produced from oxidation of nitrogen present in the combustion air. The process is strongly enhanced by the high temperature. Fuel NOX comes from oxidation of nitrogen compounds in the fuel gas. They are released at relative low temperature. Prompt NOX are formed in the flame front by reaction of nitrogen molecules with free radicals produced from the combustion. The proportion by the different NOX routes is visible from the following figure 4.
Figure 4 - Different NOX sources as function of temperature5 5 Pollution control technologies-Vol. II-Control of Nitrogen Oxides-S.Zandaryaa and A.Buekens
12.
Fuel and thermal NOX are dominant, where thermal NOX are prevalent at very high temperature and when burning a fuel with low nitrogen. Fuel NOX is only dominant when combustibles contains significant amount of organic nitrogen which is not the case in the considered case. The reactions that take place are the following:
NOON 222
222
1NOONO
OHNONH 2223 6234
OHNOONH 223 6454
OHNOONH 2223 6474 Nitrogen oxides formed during combustion contain typically 5-10% of NO2. A part of nitrogen that was converted into NOX has to be removed since NO2, formed in contact to the atmosphere from the oxidation of NO, may give rise to the formation of nitric acid that contributes at the formation of acidification and ozone formation. A reduction of NOX could be done either by reducing them at the source during the combustion by CONOX burners and/or reducing downstream the burner source. Two different ways to control NOX emission downstream the combustion chamber could be applied: Thermal DeNOX or Selective Non Catalytic Reduction, SNCR. Catalytic DeNOX or Selective Catalytic Reduction, SCR. Each one could be used as standalone, but a combination of both implies a higher efficiency than SNCR and uses less catalyst than SCR, respectively alone. Both require a reducing component from outside typically ammonia (NH3) or urea ((NH2)2CO). The choice is moving towards ammonia as it is more selective. The reactions that take place are:
OHNONHNO 2223 6444
OHNNHNO 223 6546
OHNONHNO 22232 6342
OHNNHNO 2232 12786 In addition also side reactions take place, which require an additional consumption of ammonia. For this reason, the reduction system works with an excess of ammonia.
13.
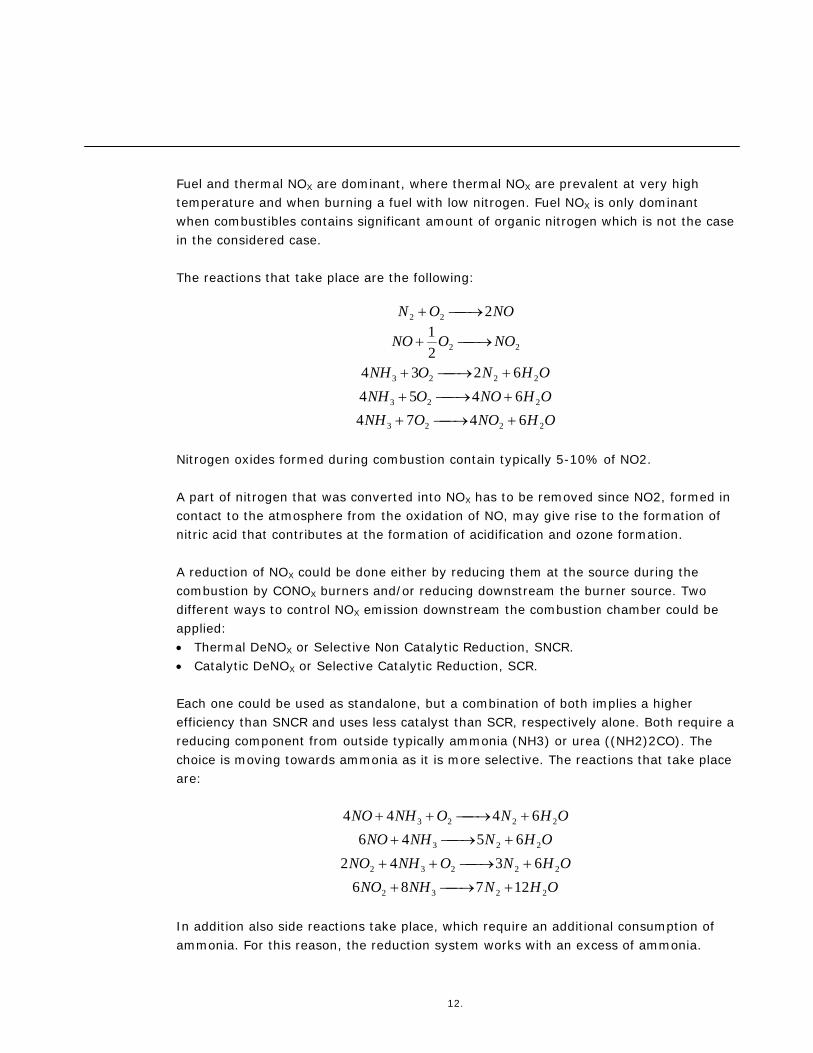
This process is effective within a specified temperature range of 900 – 1100°C that is specific for each application, but depends also from reagents mass ratio, mixing and contact time. For these reasons, in the plant different points of reducing agent injection are provided in order to have ammonia at the optimal point as indicated in figure 5. Figure 5 - SCNR Process6 This thermal DeNOX solution has the following advantages: Simple design based on available experience and know-how. No catalyst or specific reagent required. No space required to introduce catalyst. Is applicable in a wide range of temperatures. In the Catalytic DeNOX the reactions that take place are the same as for Thermal DeNOX, but at lower temperature range of 250 – 350°C due to the presence of catalyst that reduces activation energy. A SCR catalyst is fabricated into a monolithic with the shape of flat-plate or honeycomb characterized by low pressure drops and by high specific surface. It is made by vanadium pentoxide (V2O5) or tungsten trioxide (WO3) active sites impregnated into porous titanium dioxide (TiO2) carriers. The life time is generally around 2-5 years.
6 Selective Non Catalytic Reduction(SNCR) for controlling NOx emissions- SNCR COMMITTEE INSTITUTE OF CLEAN AIR COMPANIES, INC-May 2000
900 – 1100 °C

14.
Contrary to thermal treatment, heating flares and flare systems are not suitable for the use of NOX removing systems, as it combusts the off-gas in an open air environment, which consequently makes the excess NOX emission unavoidable and thus an uncontrolled emission source.
15.
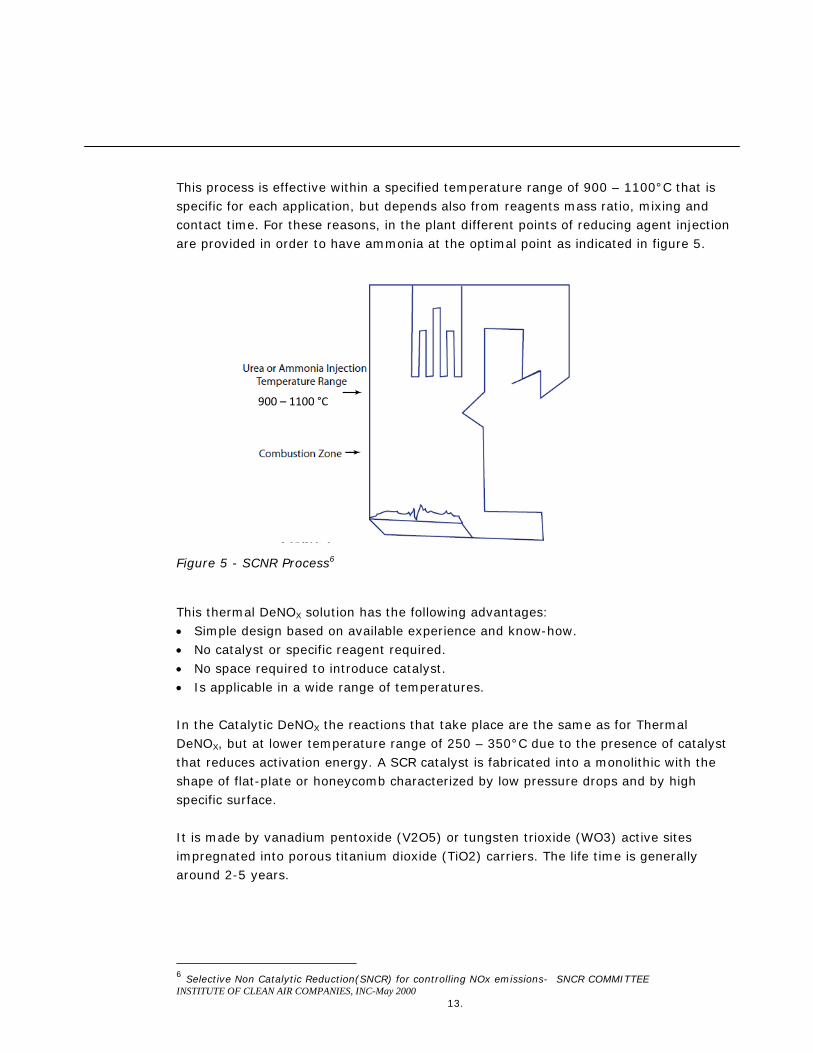
8. Lay out options The ammonia elimination device comprises the following modules: The combustion chamber and thermal reduction step. The flue gas cooling and heat recovery systems. The catalytic reduction step. The stack. Usually these modules are horizontally built to keep the pressure drop in the system minimal and to avoid structures necessary for operation and maintenance. These modules can be positioned in such a way that fits in any available plot area of the plant. An example is schematically shown in the top view figure 6 and the side view of the ammonia elimination device is schematically illustrated in figure 7.
Figure 6 - Top view of installed equipment
16.
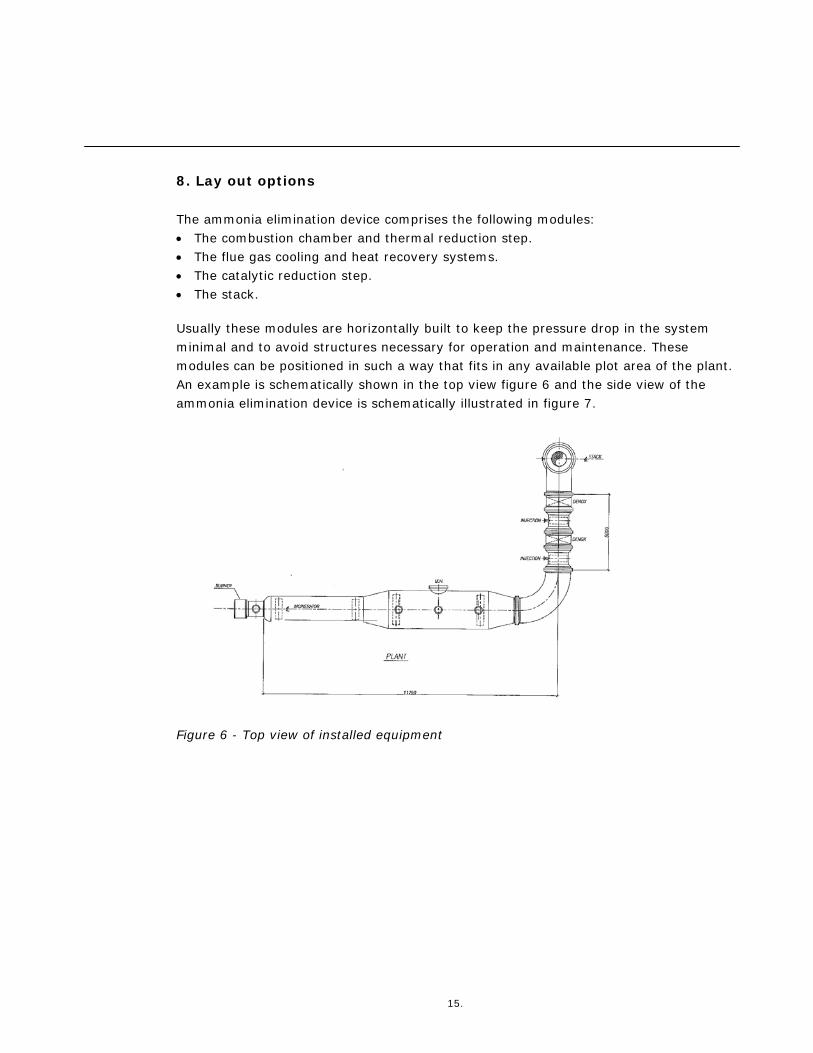
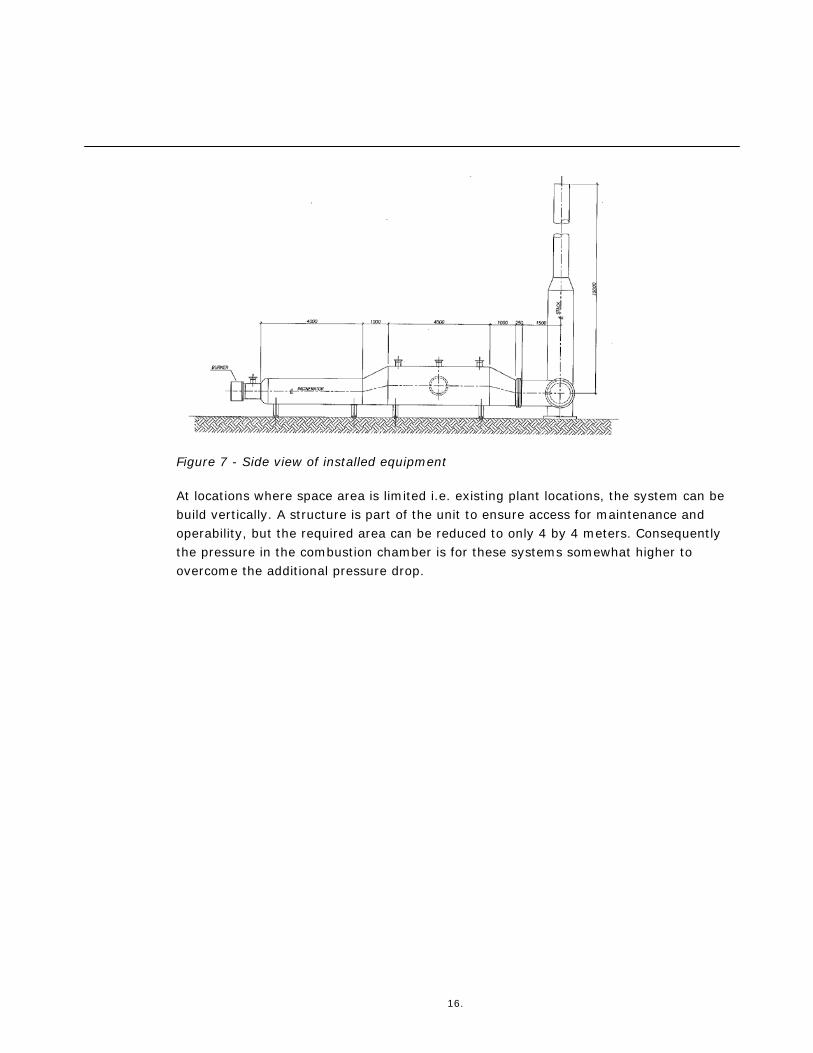
Figure 7 - Side view of installed equipment At locations where space area is limited i.e. existing plant locations, the system can be build vertically. A structure is part of the unit to ensure access for maintenance and operability, but the required area can be reduced to only 4 by 4 meters. Consequently the pressure in the combustion chamber is for these systems somewhat higher to overcome the additional pressure drop.
17.
9. Safety and nuisance consideration
9.1 Safety consideration
By definition a plant has to be designed safe always. The difference between the off-gas treatment alternatives to achieve a safe design lies in the difference of the safety principle that is applied. An overview of the principles used for safe design for the off-gas treatment systems is available in table 1. Table 1: Applied principles for safe design
Type of treatment Principle for safe design
Venting (standard design) Pressure delta, dispersion, elevated stack
Flaring Complex process design, separation of pressure
regimes, high elevated stack, shielding, safe guarding Heating with flare Dispersion, elevated stack, safe guarding
Thermal treatment Smart process design, low stack, safe guarding It is important to realize that the addition of a thermal treatment or flare system does not make a urea plant safer or unsafer, because all emission treatment systems require their own specific safety approach in order to achieve an intrinsically safe plant design. The choice to vent, heat, incinerate or combust can therefore never be a safety issue, but only a pollution and nuisance prevention philosophy or authority requirement. The choice does give the opportunity to choose the best suitable option for the plant and local circumstances.
9.2 Nuisance consideration
The nuisance consideration is based on specific local requirements, which are present due to the physical location of the plant, the neighbourhood and local governmental regulations. Off-gas treatment systems in urea melt plants are in most cases installed for this reason, because the ammonia smell is detectable by human nose at concentrations higher than 5 parts per million. However, this consideration is mostly applicable to discontinuous emissions, which may be associated with substantial volumes and high ammonia concentrations. In case of continuous emissions, the nuisance consideration is hardly required as the ammonia concentrations from continuous sources by far do not reach the limit of 5 parts per million on ground level outside the fence. It is for this reason that none of Stamicarbon urea plants currently apply thermal treatment or flare systems for continuous emission of ammonia containing off-gasses for the solely purpose of nuisance control.

18.
A solution that is occasionally known to be provided is the application of a flare to heat the ammonia containing continuous off-gasses. However, this approach increases the environmental load of the continuous emission. It can therefore only be considered from nuisance point of view as it is more harmful for the environment than venting and thermal treatment, as it emits additional NOX without reducing ammonia emissions.
19.
10. Example case: World scale urea melt plant
10.1 Treatment of continuous off-gasses
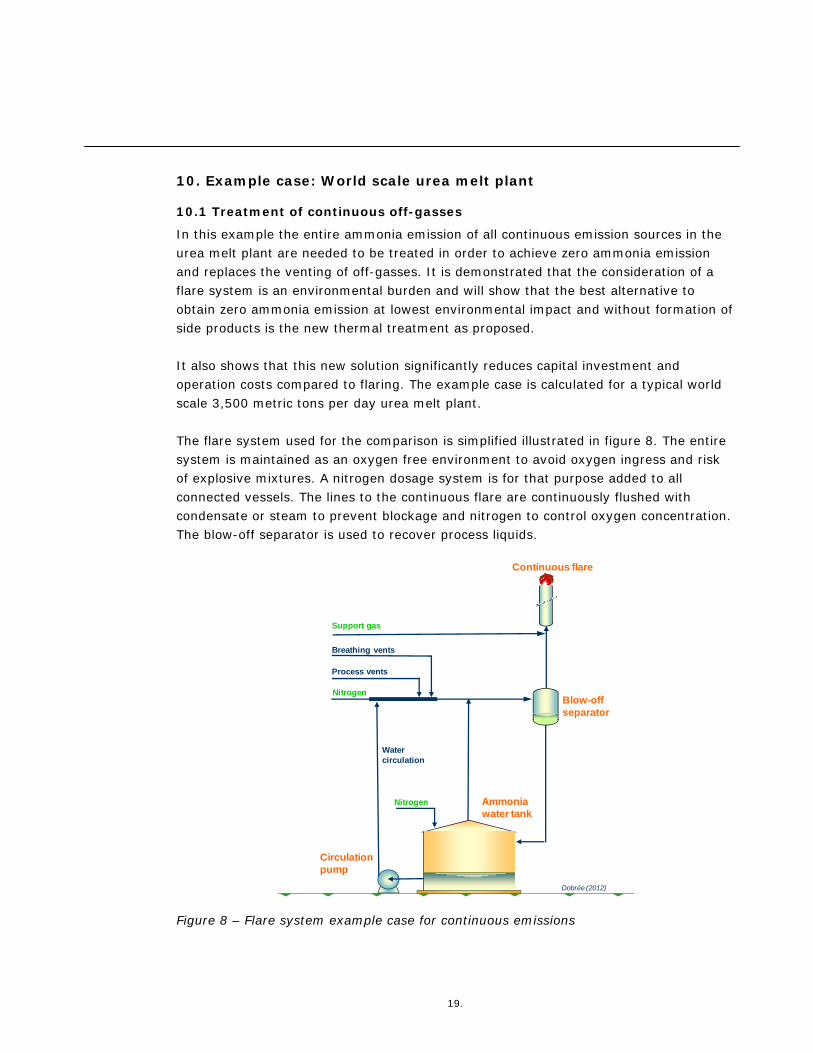
In this example the entire ammonia emission of all continuous emission sources in the urea melt plant are needed to be treated in order to achieve zero ammonia emission and replaces the venting of off-gasses. It is demonstrated that the consideration of a flare system is an environmental burden and will show that the best alternative to obtain zero ammonia emission at lowest environmental impact and without formation of side products is the new thermal treatment as proposed. It also shows that this new solution significantly reduces capital investment and operation costs compared to flaring. The example case is calculated for a typical world scale 3,500 metric tons per day urea melt plant. The flare system used for the comparison is simplified illustrated in figure 8. The entire system is maintained as an oxygen free environment to avoid oxygen ingress and risk of explosive mixtures. A nitrogen dosage system is for that purpose added to all connected vessels. The lines to the continuous flare are continuously flushed with condensate or steam to prevent blockage and nitrogen to control oxygen concentration. The blow-off separator is used to recover process liquids.
Process vents
Ammonia water tank
levelCirculation pump
Nitrogen
Continuous flare
Support gas
Breathing vents
Water circulation
Blow-off separator
Dobrée (2012)
Nitrogen
Figure 8 – Flare system example case for continuous emissions
20.
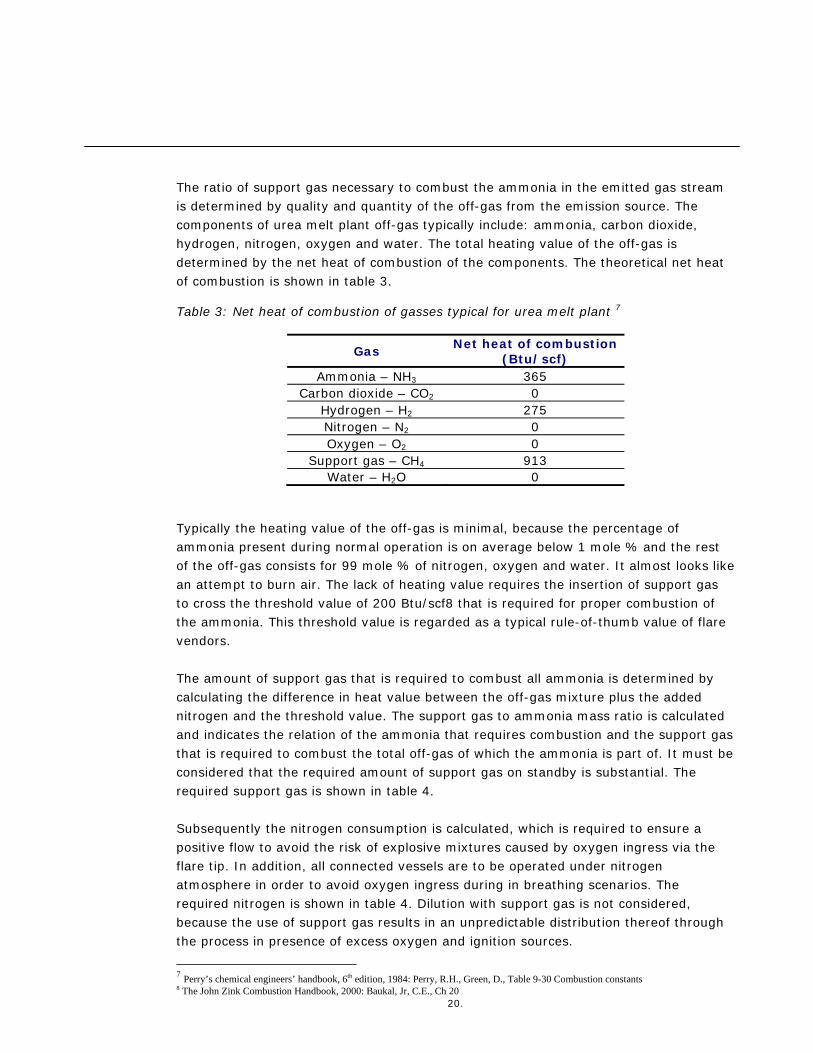
The ratio of support gas necessary to combust the ammonia in the emitted gas stream is determined by quality and quantity of the off-gas from the emission source. The components of urea melt plant off-gas typically include: ammonia, carbon dioxide, hydrogen, nitrogen, oxygen and water. The total heating value of the off-gas is determined by the net heat of combustion of the components. The theoretical net heat of combustion is shown in table 3. Table 3: Net heat of combustion of gasses typical for urea melt plant 7
Gas Net heat of combustion (Btu/scf)
Ammonia – NH3 365 Carbon dioxide – CO2 0
Hydrogen – H2 275 Nitrogen – N2 0 Oxygen – O2 0
Support gas – CH4 913 Water – H2O 0
Typically the heating value of the off-gas is minimal, because the percentage of ammonia present during normal operation is on average below 1 mole % and the rest of the off-gas consists for 99 mole % of nitrogen, oxygen and water. It almost looks like an attempt to burn air. The lack of heating value requires the insertion of support gas to cross the threshold value of 200 Btu/scf8 that is required for proper combustion of the ammonia. This threshold value is regarded as a typical rule-of-thumb value of flare vendors. The amount of support gas that is required to combust all ammonia is determined by calculating the difference in heat value between the off-gas mixture plus the added nitrogen and the threshold value. The support gas to ammonia mass ratio is calculated and indicates the relation of the ammonia that requires combustion and the support gas that is required to combust the total off-gas of which the ammonia is part of. It must be considered that the required amount of support gas on standby is substantial. The required support gas is shown in table 4. Subsequently the nitrogen consumption is calculated, which is required to ensure a positive flow to avoid the risk of explosive mixtures caused by oxygen ingress via the flare tip. In addition, all connected vessels are to be operated under nitrogen atmosphere in order to avoid oxygen ingress during in breathing scenarios. The required nitrogen is shown in table 4. Dilution with support gas is not considered, because the use of support gas results in an unpredictable distribution thereof through the process in presence of excess oxygen and ignition sources.
7 Perry’s chemical engineers’ handbook, 6th edition, 1984: Perry, R.H., Green, D., Table 9-30 Combustion constants 8 The John Zink Combustion Handbook, 2000: Baukal, Jr, C.E., Ch 20
21.
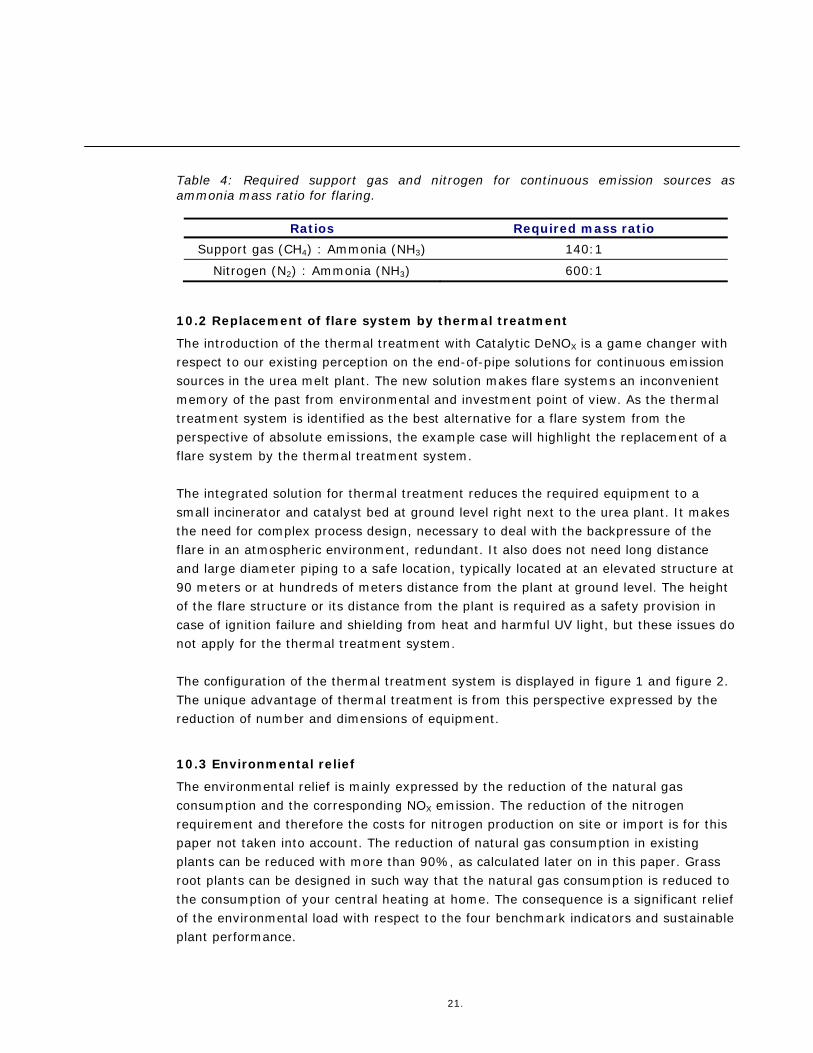
Table 4: Required support gas and nitrogen for continuous emission sources as ammonia mass ratio for flaring.
Ratios Required mass ratio Support gas (CH4) : Ammonia (NH3) 140:1
Nitrogen (N2) : Ammonia (NH3) 600:1
10.2 Replacement of flare system by thermal treatment
The introduction of the thermal treatment with Catalytic DeNOX is a game changer with respect to our existing perception on the end-of-pipe solutions for continuous emission sources in the urea melt plant. The new solution makes flare systems an inconvenient memory of the past from environmental and investment point of view. As the thermal treatment system is identified as the best alternative for a flare system from the perspective of absolute emissions, the example case will highlight the replacement of a flare system by the thermal treatment system. The integrated solution for thermal treatment reduces the required equipment to a small incinerator and catalyst bed at ground level right next to the urea plant. It makes the need for complex process design, necessary to deal with the backpressure of the flare in an atmospheric environment, redundant. It also does not need long distance and large diameter piping to a safe location, typically located at an elevated structure at 90 meters or at hundreds of meters distance from the plant at ground level. The height of the flare structure or its distance from the plant is required as a safety provision in case of ignition failure and shielding from heat and harmful UV light, but these issues do not apply for the thermal treatment system. The configuration of the thermal treatment system is displayed in figure 1 and figure 2. The unique advantage of thermal treatment is from this perspective expressed by the reduction of number and dimensions of equipment.
10.3 Environmental relief
The environmental relief is mainly expressed by the reduction of the natural gas consumption and the corresponding NOX emission. The reduction of the nitrogen requirement and therefore the costs for nitrogen production on site or import is for this paper not taken into account. The reduction of natural gas consumption in existing plants can be reduced with more than 90%, as calculated later on in this paper. Grass root plants can be designed in such way that the natural gas consumption is reduced to the consumption of your central heating at home. The consequence is a significant relief of the environmental load with respect to the four benchmark indicators and sustainable plant performance.
22.
10.4 Capital investment analysis
The main differentiator between a flare system and a thermal treatment system is the efficiency of combustion between incineration and flaring, and the possibility to catch the NOX emission. Other main differentiators are the capital investment and operational costs. The impact of the investment costs related to flare systems is in practice often underestimated. An important reason behind the underestimation is the use of petrochemical expertise to handle low or zero emission standards for ammonia containing off-gasses. The common practice of flaring seems, from the perception of the petrochemical expertise, an easy and cheap solution for urea plants facing emission issues with local governments. These petrochemical originated assumptions has proven not to be applicable to the urea melt plant, as it has the potential to cause major headache during design and engineering phase as well as complications during operations. The reason why flare systems are difficult to implement is related to the type of emission sources that need to be treated. The continuous emission sources from the urea melt plant come from low or atmospheric pressure with ambient oxygen concentrations and only traces of unwanted ammonia. The origin of these sources results in four major issues: 1. Safety provisions are required to separate pressure regimes, as the backpressure of
the flare can cause fatal equipment failure in atmospheric or low pressure sections of the plant and storage vessels.
2. Ambient oxygen concentration in the off-gas require insertion of nitrogen in order to: a. Avoid the possibility of an explosive mixture in the flare system by
guaranteeing positive flow to avoid oxygen ingress via the flare tip. b. Guarantee the lifetime of the flare tip and avoid unscheduled plant shutdown
due to flare tip failure at high altitude in the plant. 3. Continuous availability of large quantities of natural gas and nitrogen to facilitate full
combustion of the ammonia traces, which has proven to be an expensive utility and loss of natural gas that could also have been utilized for the production of urea.
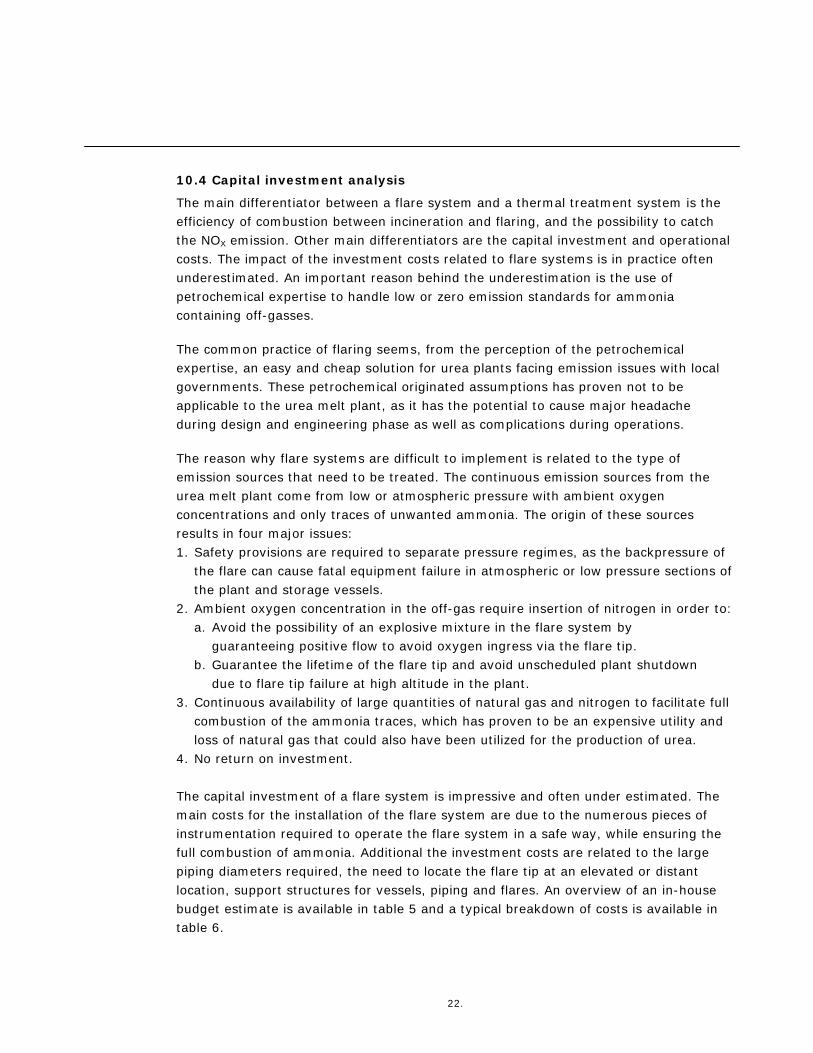
4. No return on investment. The capital investment of a flare system is impressive and often under estimated. The main costs for the installation of the flare system are due to the numerous pieces of instrumentation required to operate the flare system in a safe way, while ensuring the full combustion of ammonia. Additional the investment costs are related to the large piping diameters required, the need to locate the flare tip at an elevated or distant location, support structures for vessels, piping and flares. An overview of an in-house budget estimate is available in table 5 and a typical breakdown of costs is available in table 6.
23.
Table 5: Capital budget cost comparison
Type of treatment
CAPEX ±40%) [Million US$]
Flaring 15 Thermal treatment 3
Table 6: Breakdown of investment costs for flare system
Type of investment
Breakdown CAPEX
Flare system [%]
Breakdown CAPEX Thermal
treatment [%]
Equipment costs 15 65 Structure, pipe racks, shielding, fencing 45 5
Instrumentation, piping 40 30 The budget estimate shows that the installation of a flare system is approximately eight times as expensive from capital investment point of view, which is a significant saving as the investment in a flare system shows no return on investment. The breakdown of the costs shows the effect of the secondary requirements of a flare system. The consequence is that the bulk of the investment costs are given by items like instrumentation, piping and support structures. In the case of the thermal treatment option the majority of the investment costs solely come from the unit itself.
10.5 Utility requirements
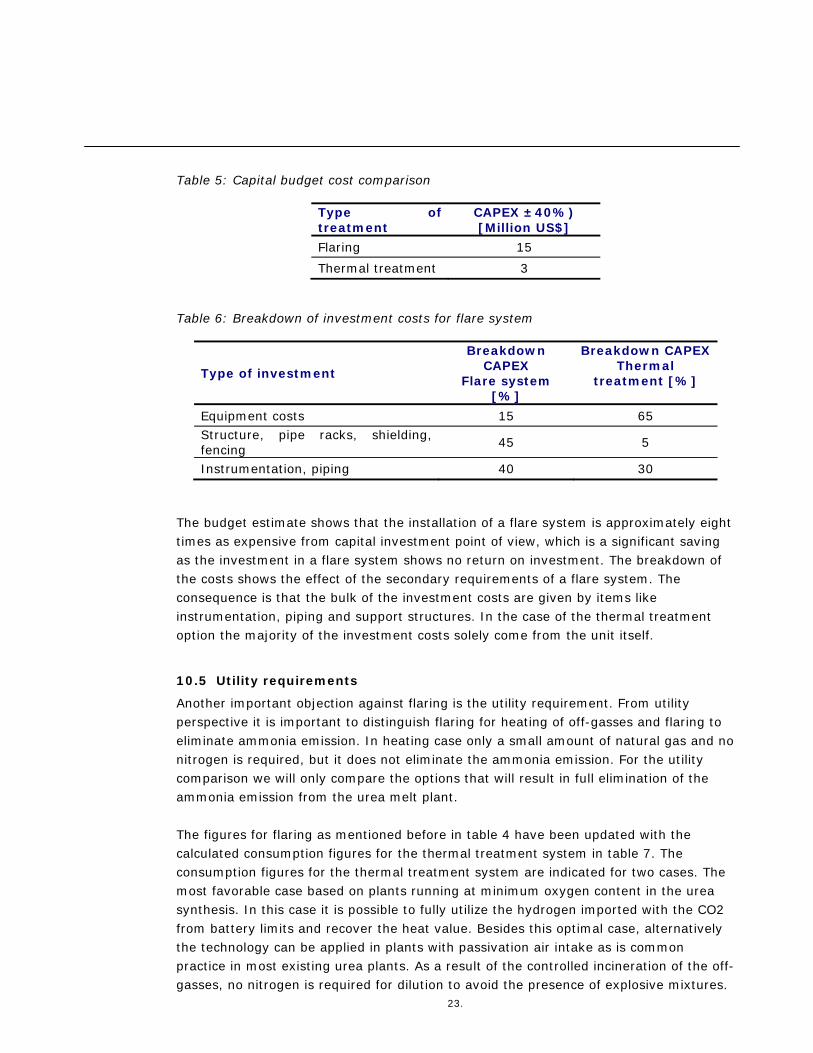
Another important objection against flaring is the utility requirement. From utility perspective it is important to distinguish flaring for heating of off-gasses and flaring to eliminate ammonia emission. In heating case only a small amount of natural gas and no nitrogen is required, but it does not eliminate the ammonia emission. For the utility comparison we will only compare the options that will result in full elimination of the ammonia emission from the urea melt plant. The figures for flaring as mentioned before in table 4 have been updated with the calculated consumption figures for the thermal treatment system in table 7. The consumption figures for the thermal treatment system are indicated for two cases. The most favorable case based on plants running at minimum oxygen content in the urea synthesis. In this case it is possible to fully utilize the hydrogen imported with the CO2 from battery limits and recover the heat value. Besides this optimal case, alternatively the technology can be applied in plants with passivation air intake as is common practice in most existing urea plants. As a result of the controlled incineration of the off-gasses, no nitrogen is required for dilution to avoid the presence of explosive mixtures.
24.
Table 7: Required support gas and nitrogen for continuous emission sources as ammonia mass ratio for thermal treatment.
Ratios Required mass ratios for the options
Flaring Thermal
treatment <0.1 vol% O2
9
Thermal treatment
0.3 vol% O2
Support gas (CH4) : Ammonia (NH3) 140:1 0.01 : 1 15 : 1
Nitrogen (N2) : Ammonia (NH3) 600:1 - - The utility consumption overview shows that the optimal performance is achieved at operating conditions where the hydrogen is utilized as feedstock for the thermal treatment. As a consequence the hydrogen convertor is to be removed, which can only be the case for low air dosage to the synthesis.
10.6 Steam generation
Another positive side effect of the thermal treatment system is also allows to recover the heat value of the hydrogen and methane used to incinerate the ammonia. In the example case it can be calculated that around 1500 kilogram of medium pressure steam at 12 bars is generated per hour. The generated medium pressure steam can be utilized in the urea melt plant to consumers as the second stage evaporator, ejectors and tracing. These medium pressure steam consumers are normally served by depressurizing high pressure steam imported from the ammonia plant. Therefore it reduces the required high pressure steam import and the energy consumption of the urea plant. At an average production cost of EUR 30,- per ton of high pressure steam, the benefit can be quantified as a cost saving of approximately EUR 400.000,- per year. This unique benefit results in a payback period for capital investment of around 5 years. This is remarkable good for an investment with the main purpose to meet environmental regulation requirements.
10.7 Recap of the example case
Earlier in this paper it has been proven that flaring in general has a negative consequence with respect to global warming, tropospheric ozone formation and ozone depletion. The remaining acidification motivation can be justified when ammonia is replaced by NOX in a mass ratio up to 1:3. The outcome of the example case shows that for continuous emission sources the ratio requirements of 140 kilogram support gas per kilogram of emitted ammonia tremendously exceeds the justifiable ratio. 9 Plant operating at low oxygen contents with no hydrogen convertor.

25.
The replacement of ammonia by nitrogen dioxide results in a higher environmental load and can therefore not be justified from acidification and thus environmental point of view. In case the elimination of ammonia containing off-gasses is considered, the option of thermal treatment is a clear improvement with respect to the environmental load. The thermal treatment system is even creating an attractive return on investment by the generation of medium pressure steam, which is pleasantly unusual for an end-of-pipe solution. This feature allows for a justification not only from environmental, but also from capital investment and operational cost point of view and can be integrated in any urea melt plant.
26.
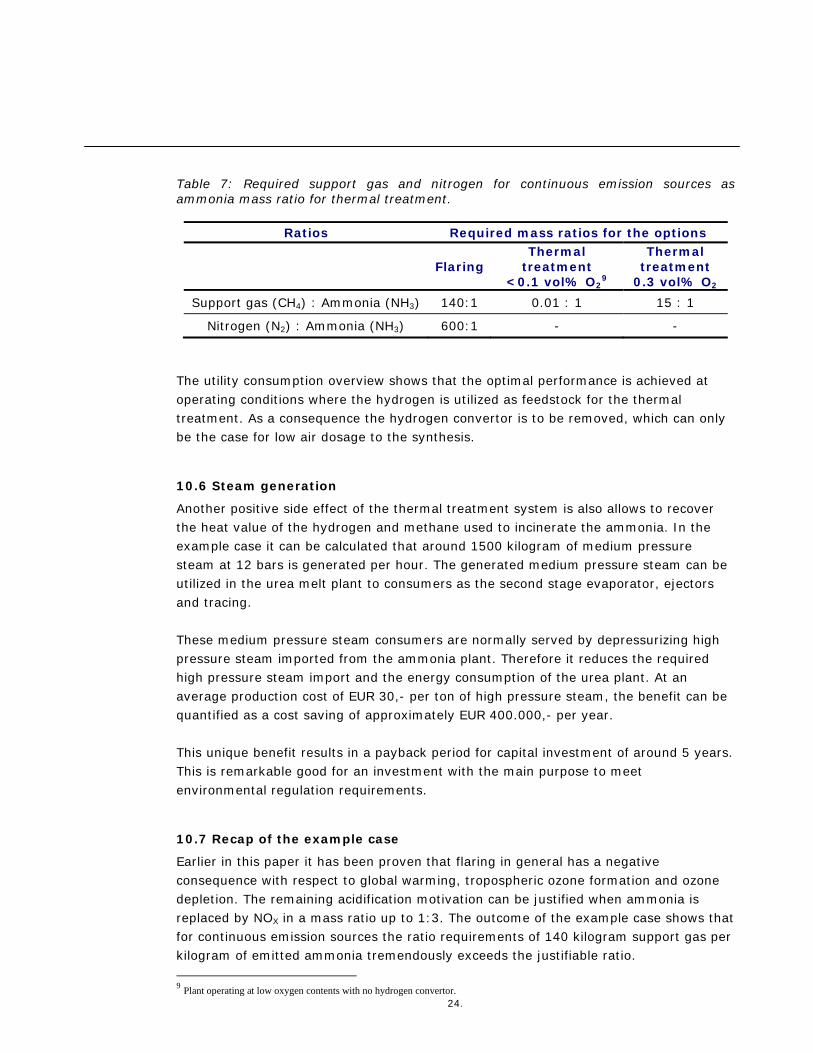
11. Conclusion Based on the safety, nuisance and environmental considerations, and the example case the following can be concluded: 1. Safety is not a consideration for the choice of off-gas treatment. 2. Flaring of continuous emission sources can eliminate ammonia emission, but cannot
be justified from environmental point of view. 3. Heating the off-gas is suitable to avoid ammonia nuisance in the vicinity of the urea
melt plant, but it is not preferred as it does not eliminate the ammonia emission and increases the environmental load.
4. The thermal treatment in combination with Catalytic DeNOX is the best practice, in
case all ammonia is to be eliminated, with respect to the environmental impact, capital investment and operational costs. By the application of this proposed system no undesired side products as ammonia salts are formed.
Energy efficient cooling of fertilizer with the Coperion Bulk Solids Heat Exchanger BULK-X-CHANGE®
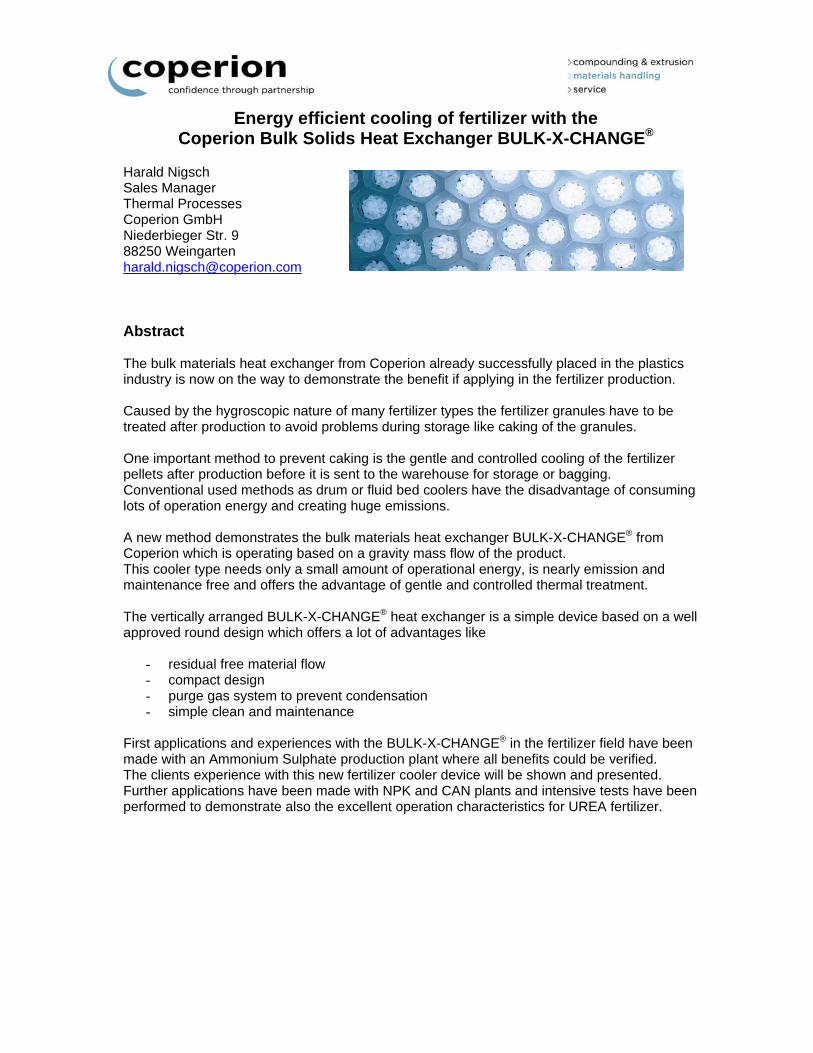
Harald Nigsch Sales Manager Thermal Processes Coperion GmbH Niederbieger Str. 9 88250 Weingarten [email protected] Abstract The bulk materials heat exchanger from Coperion already successfully placed in the plastics industry is now on the way to demonstrate the benefit if applying in the fertilizer production. Caused by the hygroscopic nature of many fertilizer types the fertilizer granules have to be treated after production to avoid problems during storage like caking of the granules. One important method to prevent caking is the gentle and controlled cooling of the fertilizer pellets after production before it is sent to the warehouse for storage or bagging. Conventional used methods as drum or fluid bed coolers have the disadvantage of consuming lots of operation energy and creating huge emissions. A new method demonstrates the bulk materials heat exchanger BULK-X-CHANGE® from Coperion which is operating based on a gravity mass flow of the product. This cooler type needs only a small amount of operational energy, is nearly emission and maintenance free and offers the advantage of gentle and controlled thermal treatment. The vertically arranged BULK-X-CHANGE® heat exchanger is a simple device based on a well approved round design which offers a lot of advantages like
- residual free material flow - compact design - purge gas system to prevent condensation - simple clean and maintenance
First applications and experiences with the BULK-X-CHANGE® in the fertilizer field have been made with an Ammonium Sulphate production plant where all benefits could be verified. The clients experience with this new fertilizer cooler device will be shown and presented. Further applications have been made with NPK and CAN plants and intensive tests have been performed to demonstrate also the excellent operation characteristics for UREA fertilizer.
Seite 2
Contents 1) Coperion company profile and products 2) Bulk-X-Change ® bulk solids heat exchanger 3) Bulk cooling in the Fertilizer industry 4) Benefits of using bulk cooler technology 5) Investigations ® and tests with fertilizer 6) Bulk-X-Change ® features for fertilizer cooling 7) Bulk-X-Change ® applications for fertilizer cooling 8) Bulk-X-Change ® manufacturing
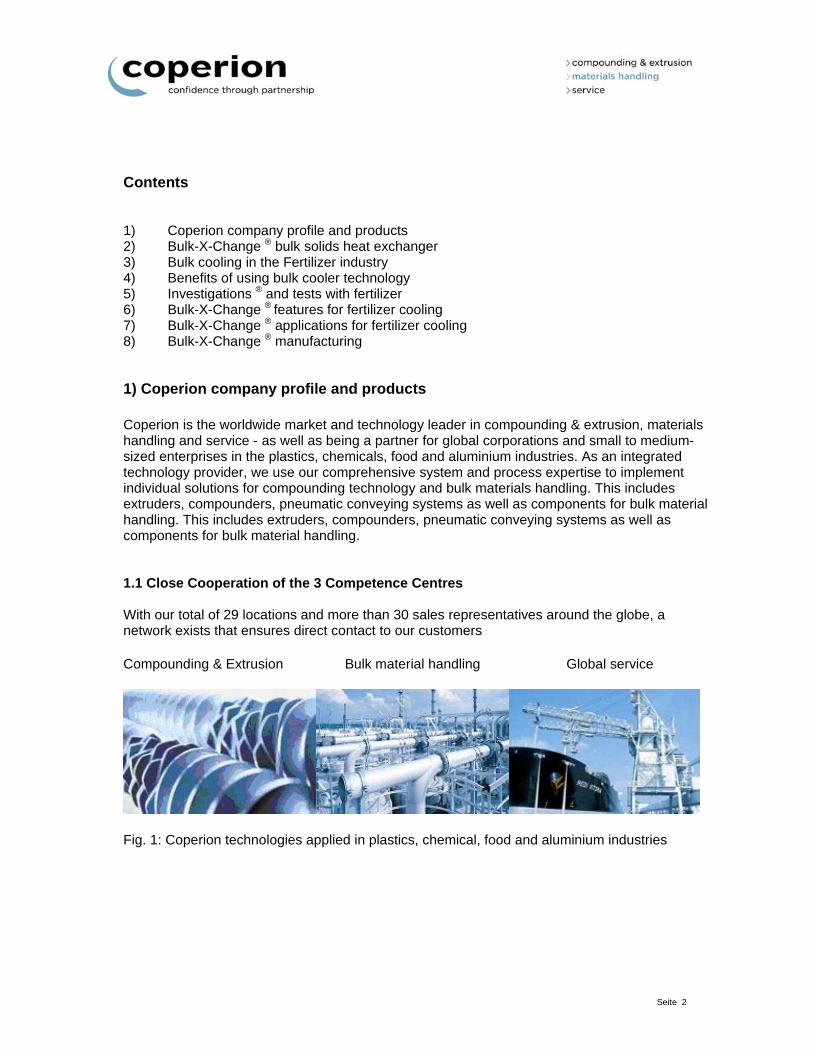
1) Coperion company profile and products Coperion is the worldwide market and technology leader in compounding & extrusion, materials handling and service - as well as being a partner for global corporations and small to medium-sized enterprises in the plastics, chemicals, food and aluminium industries. As an integrated technology provider, we use our comprehensive system and process expertise to implement individual solutions for compounding technology and bulk materials handling. This includes extruders, compounders, pneumatic conveying systems as well as components for bulk material handling. This includes extruders, compounders, pneumatic conveying systems as well as components for bulk material handling. 1.1 Close Cooperation of the 3 Competence Centres With our total of 29 locations and more than 30 sales representatives around the globe, a network exists that ensures direct contact to our customers
Compounding & Extrusion Bulk material handling Global service
Fig. 1: Coperion technologies applied in plastics, chemical, food and aluminium industries
Seite 3
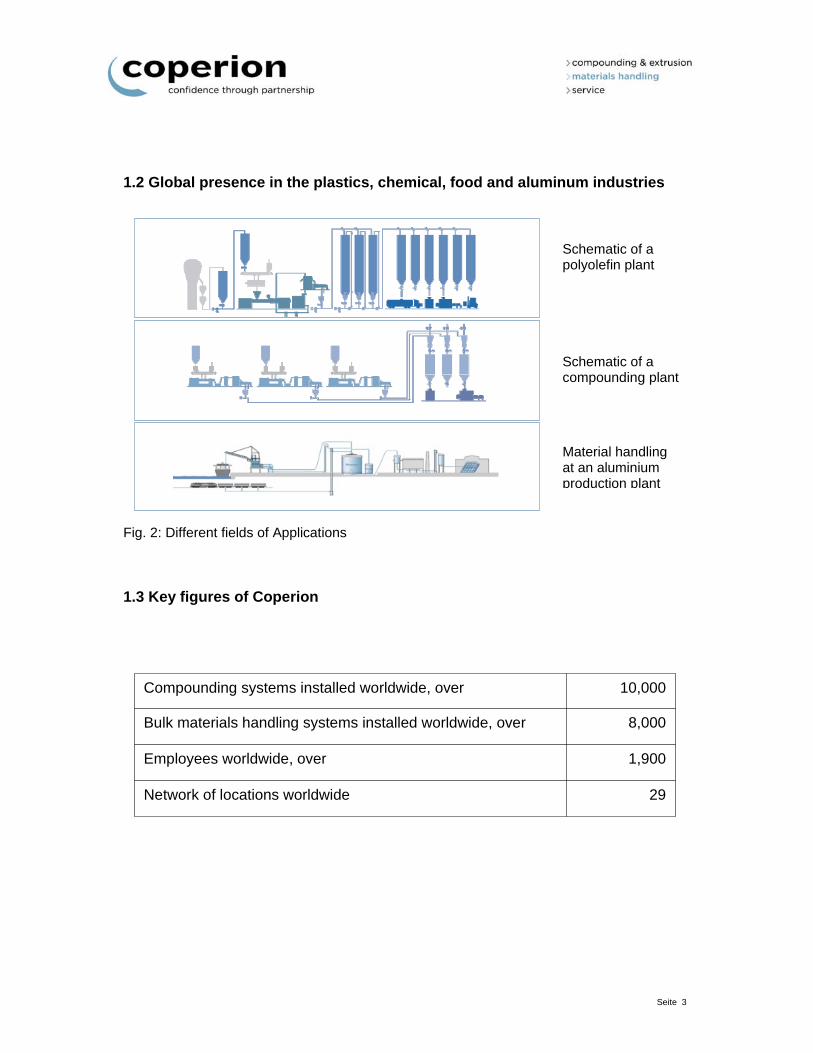
1.2 Global presence in the plastics, chemical, food and aluminum industries Fig. 2: Different fields of Applications 1.3 Key figures of Coperion
Schematic of a polyolefin plant
Schematic of a compounding plant
Material handling at an aluminium production plant
29 Network of locations worldwide
1,900 Employees worldwide, over
8,000 Bulk materials handling systems installed worldwide, over
10,000 Compounding systems installed worldwide, over
Seite 4
2) Coperion Bulk-X-Change ® bulk solids heat exchanger 2.1 Different Concepts of the Coperion Bulk-X-Change ®
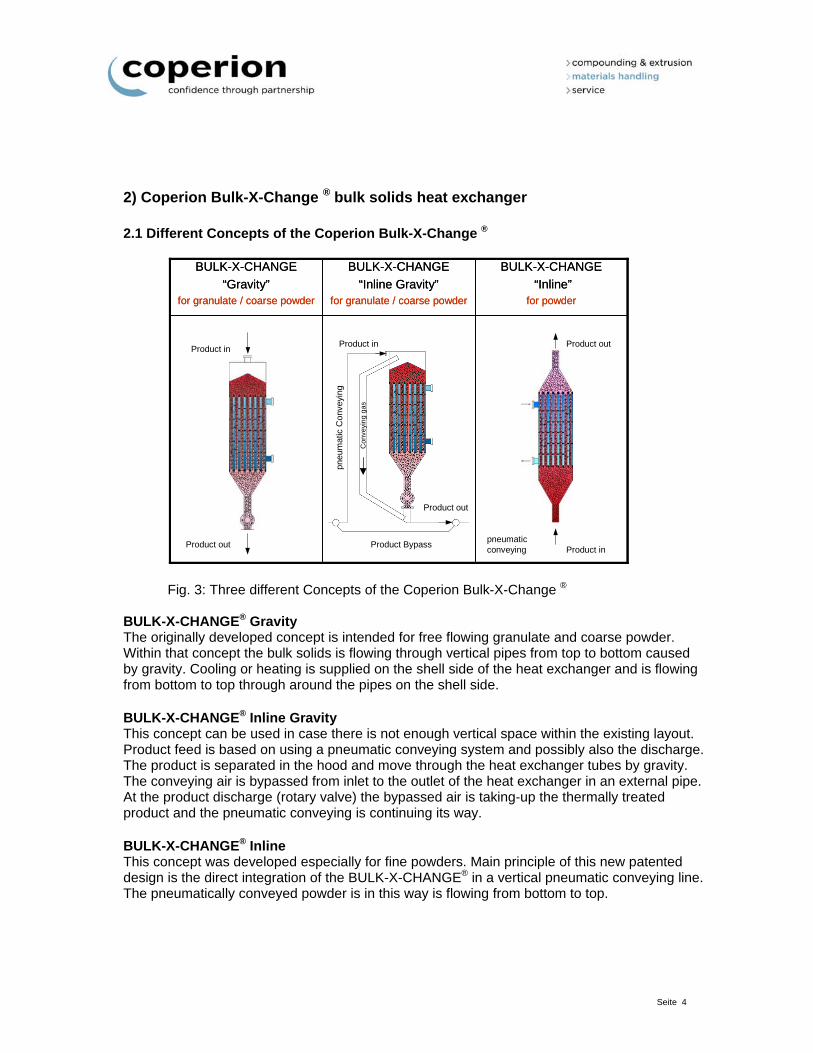
Fig. 3: Three different Concepts of the Coperion Bulk-X-Change ®
BULK-X-CHANGE® Gravity The originally developed concept is intended for free flowing granulate and coarse powder. Within that concept the bulk solids is flowing through vertical pipes from top to bottom caused by gravity. Cooling or heating is supplied on the shell side of the heat exchanger and is flowing from bottom to top through around the pipes on the shell side. BULK-X-CHANGE® Inline Gravity This concept can be used in case there is not enough vertical space within the existing layout. Product feed is based on using a pneumatic conveying system and possibly also the discharge. The product is separated in the hood and move through the heat exchanger tubes by gravity. The conveying air is bypassed from inlet to the outlet of the heat exchanger in an external pipe. At the product discharge (rotary valve) the bypassed air is taking-up the thermally treated product and the pneumatic conveying is continuing its way. BULK-X-CHANGE® Inline This concept was developed especially for fine powders. Main principle of this new patented design is the direct integration of the BULK-X-CHANGE® in a vertical pneumatic conveying line. The pneumatically conveyed powder is in this way is flowing from bottom to top.
BULK-X-CHANGE
“Inline”for powder
BULK-X-CHANGE
“Inline Gravity”for granulate / coarse powder
BULK-X-CHANGE
“Gravity”for granulate / coarse powder
BULK-X-CHANGE
“Inline”for powder
BULK-X-CHANGE
“Inline Gravity”for granulate / coarse powder
BULK-X-CHANGE
“Gravity”for granulate / coarse powder
Product in
Product inProduct out
Product out
pneumaticconveying
Product in
Product out
Product Bypass
pneu
mat
ic C
onve
ying
Con
veyi
ng
ga
s
Seite 5
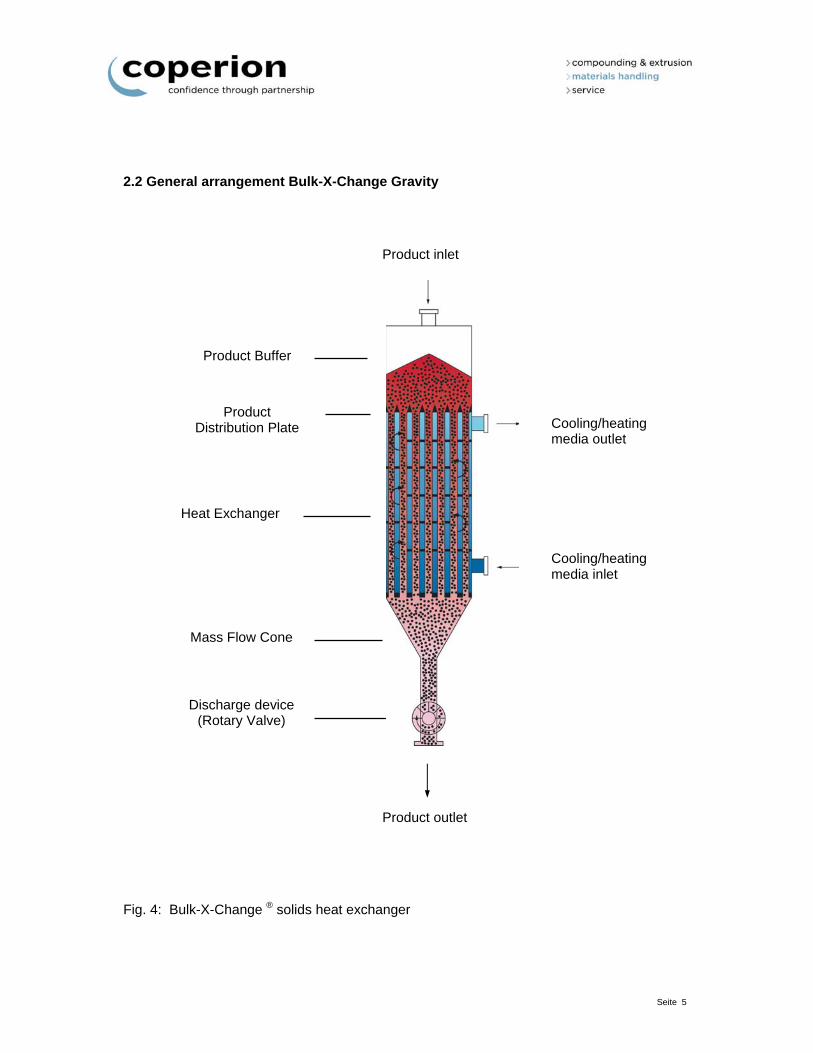
2.2 General arrangement Bulk-X-Change Gravity Fig. 4: Bulk-X-Change ® solids heat exchanger
Product outlet
Product Buffer
Heat Exchanger
Mass Flow Cone
Product Distribution Plate
Discharge device (Rotary Valve)
Product inlet
Cooling/heating media outlet
Cooling/heating media inlet
Seite 6
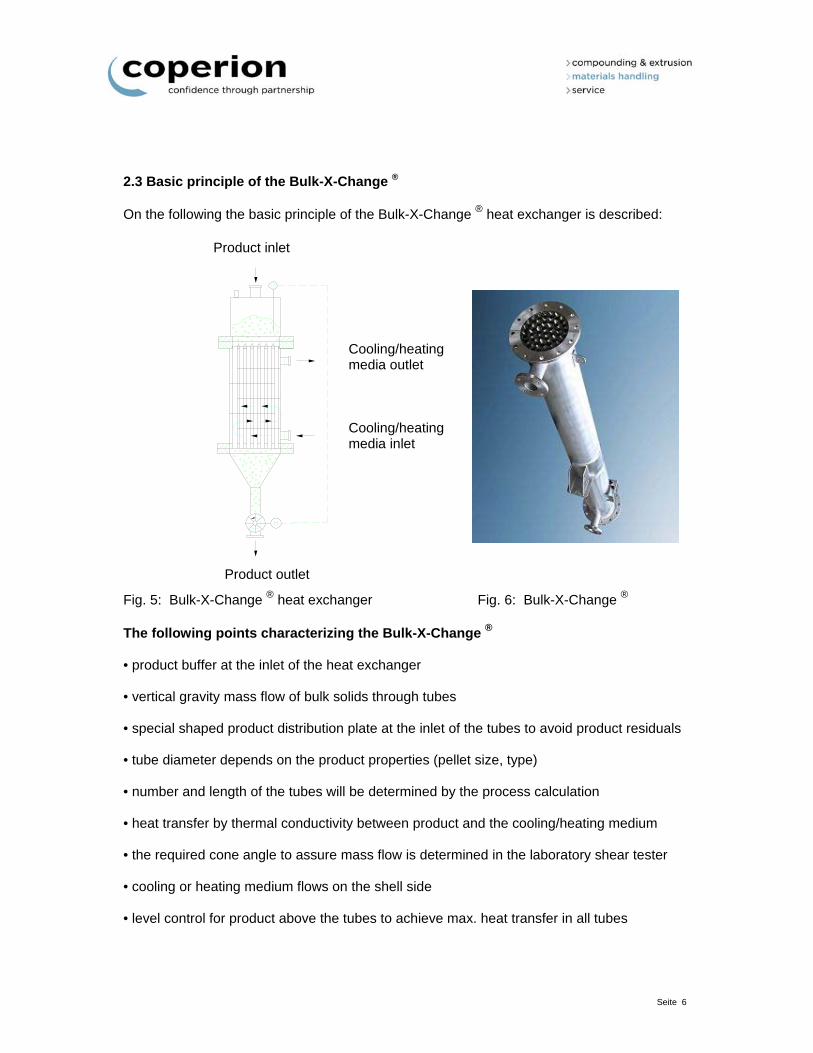
2.3 Basic principle of the Bulk-X-Change ® On the following the basic principle of the Bulk-X-Change ® heat exchanger is described:
Fig. 5: Bulk-X-Change ® heat exchanger Fig. 6: Bulk-X-Change ® The following points characterizing the Bulk-X-Change ® • product buffer at the inlet of the heat exchanger • vertical gravity mass flow of bulk solids through tubes • special shaped product distribution plate at the inlet of the tubes to avoid product residuals • tube diameter depends on the product properties (pellet size, type) • number and length of the tubes will be determined by the process calculation • heat transfer by thermal conductivity between product and the cooling/heating medium • the required cone angle to assure mass flow is determined in the laboratory shear tester • cooling or heating medium flows on the shell side • level control for product above the tubes to achieve max. heat transfer in all tubes
Product inlet
Product outlet
Cooling/heating media outlet
Cooling/heating media inlet
Seite 7
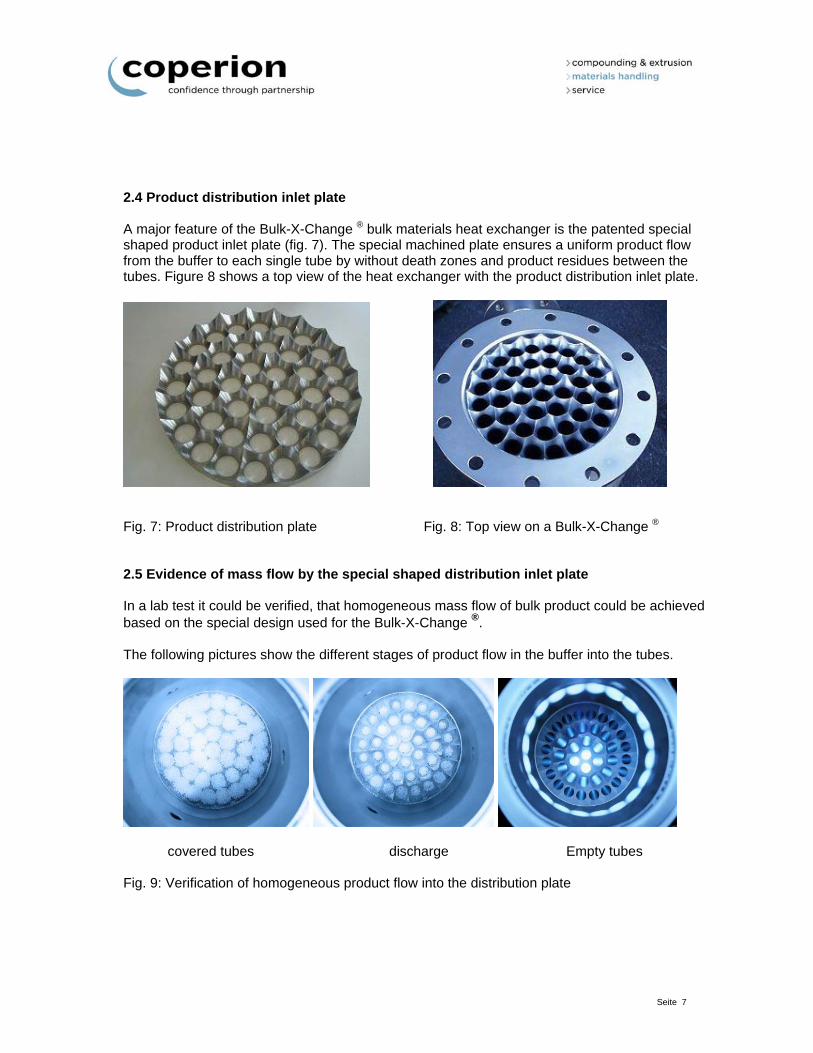
2.4 Product distribution inlet plate A major feature of the Bulk-X-Change ® bulk materials heat exchanger is the patented special shaped product inlet plate (fig. 7). The special machined plate ensures a uniform product flow from the buffer to each single tube by without death zones and product residues between the tubes. Figure 8 shows a top view of the heat exchanger with the product distribution inlet plate.
Fig. 7: Product distribution plate Fig. 8: Top view on a Bulk-X-Change ® 2.5 Evidence of mass flow by the special shaped distribution inlet plate In a lab test it could be verified, that homogeneous mass flow of bulk product could be achieved based on the special design used for the Bulk-X-Change ®. The following pictures show the different stages of product flow in the buffer into the tubes.
covered tubes discharge Empty tubes Fig. 9: Verification of homogeneous product flow into the distribution plate
Seite 8
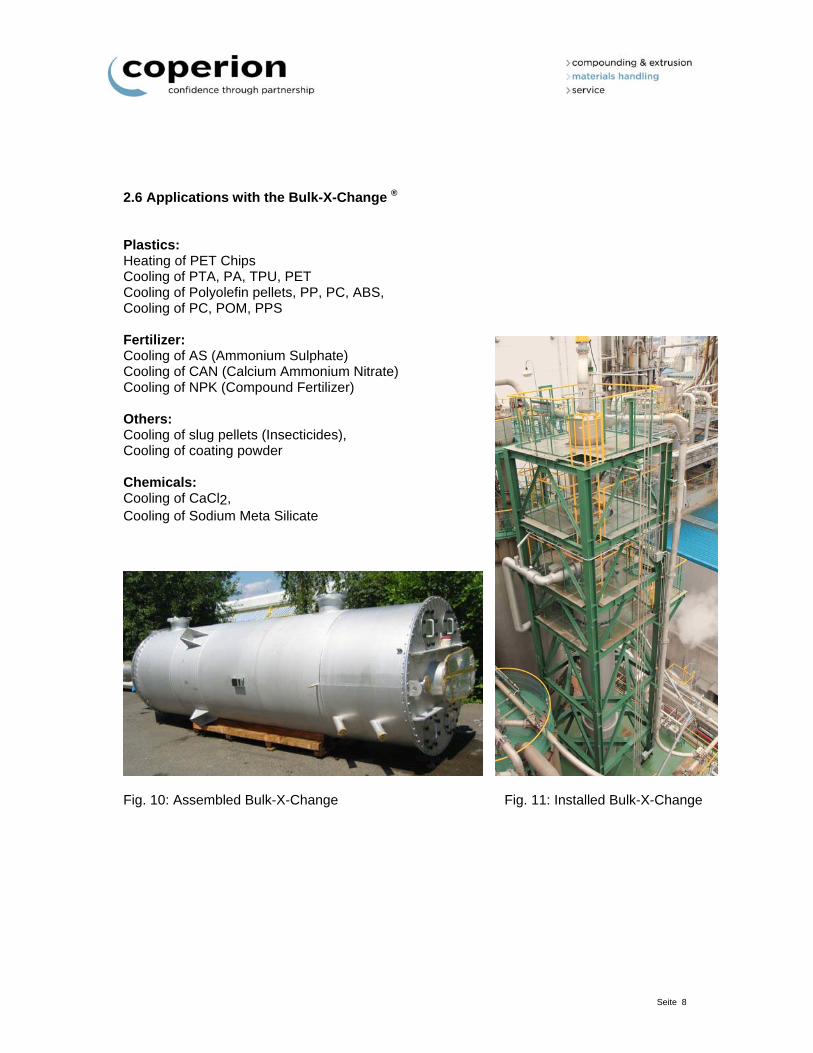
2.6 Applications with the Bulk-X-Change ® Plastics: Heating of PET Chips Cooling of PTA, PA, TPU, PET Cooling of Polyolefin pellets, PP, PC, ABS, Cooling of PC, POM, PPS Fertilizer: Cooling of AS (Ammonium Sulphate) Cooling of CAN (Calcium Ammonium Nitrate) Cooling of NPK (Compound Fertilizer) Others: Cooling of slug pellets (Insecticides), Cooling of coating powder Chemicals: Cooling of CaCl2, Cooling of Sodium Meta Silicate
Fig. 10: Assembled Bulk-X-Change Fig. 11: Installed Bulk-X-Change
Seite 9
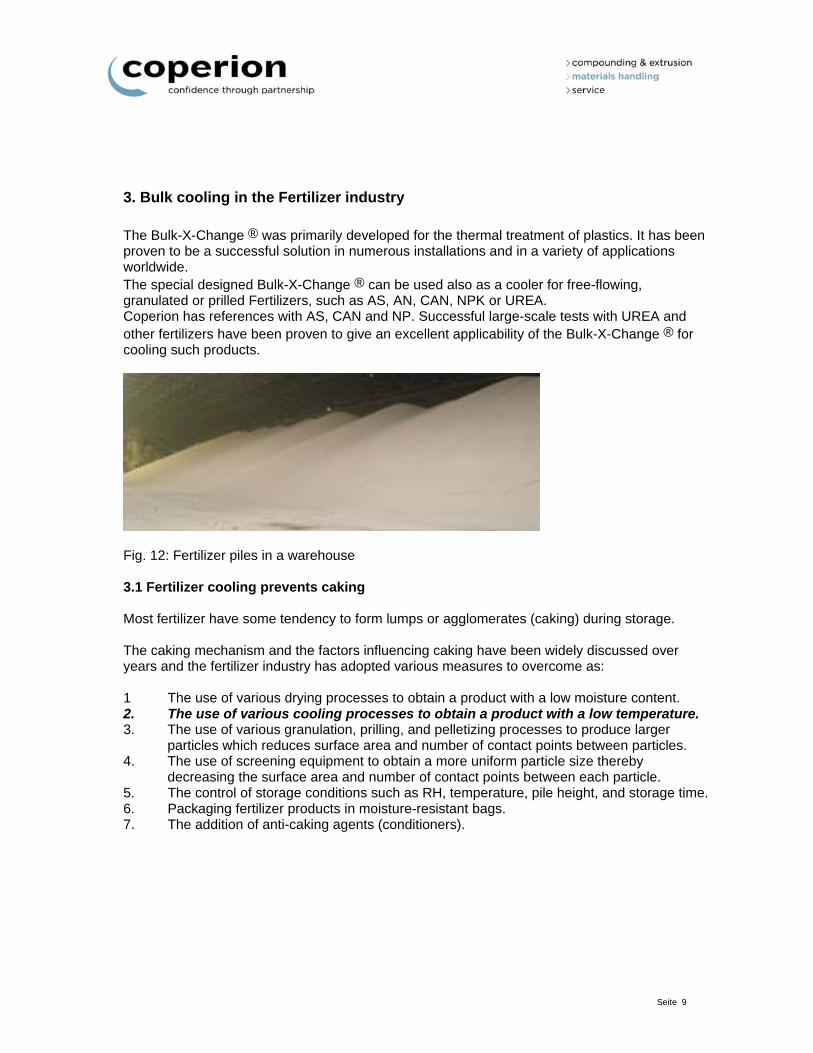
3. Bulk cooling in the Fertilizer industry The Bulk-X-Change ® was primarily developed for the thermal treatment of plastics. It has been proven to be a successful solution in numerous installations and in a variety of applications worldwide. The special designed Bulk-X-Change ® can be used also as a cooler for free-flowing, granulated or prilled Fertilizers, such as AS, AN, CAN, NPK or UREA. Coperion has references with AS, CAN and NP. Successful large-scale tests with UREA and other fertilizers have been proven to give an excellent applicability of the Bulk-X-Change ® for cooling such products.
Fig. 12: Fertilizer piles in a warehouse 3.1 Fertilizer cooling prevents caking Most fertilizer have some tendency to form lumps or agglomerates (caking) during storage. The caking mechanism and the factors influencing caking have been widely discussed over years and the fertilizer industry has adopted various measures to overcome as: 1 The use of various drying processes to obtain a product with a low moisture content. 2. The use of various cooling processes to obtain a product with a low temperature. 3. The use of various granulation, prilling, and pelletizing processes to produce larger
particles which reduces surface area and number of contact points between particles. 4. The use of screening equipment to obtain a more uniform particle size thereby
decreasing the surface area and number of contact points between each particle. 5. The control of storage conditions such as RH, temperature, pile height, and storage time. 6. Packaging fertilizer products in moisture-resistant bags. 7. The addition of anti-caking agents (conditioners).
Seite 10
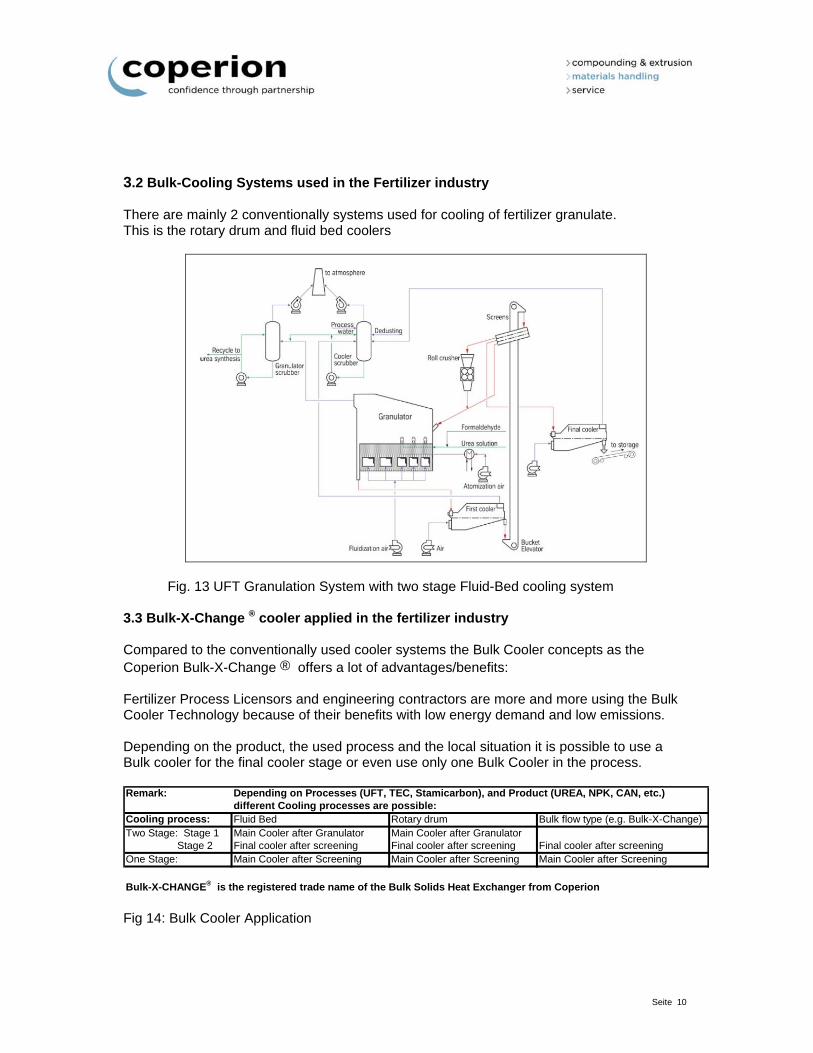
3.2 Bulk-Cooling Systems used in the Fertilizer industry There are mainly 2 conventionally systems used for cooling of fertilizer granulate. This is the rotary drum and fluid bed coolers
Fig. 13 UFT Granulation System with two stage Fluid-Bed cooling system 3.3 Bulk-X-Change ® cooler applied in the fertilizer industry Compared to the conventionally used cooler systems the Bulk Cooler concepts as the Coperion Bulk-X-Change ® offers a lot of advantages/benefits: Fertilizer Process Licensors and engineering contractors are more and more using the Bulk Cooler Technology because of their benefits with low energy demand and low emissions. Depending on the product, the used process and the local situation it is possible to use a Bulk cooler for the final cooler stage or even use only one Bulk Cooler in the process.
Fig 14: Bulk Cooler Application
Remark: Depending on Processes (UFT, TEC, Stamicarbon), and Product (UREA, NPK, CAN, etc.)different Cooling processes are possible:
Cooling process: Fluid Bed Rotary drum Bulk flow type (e.g. Bulk-X-Change)Two Stage: Stage 1 Main Cooler after Granulator Main Cooler after Granulator Stage 2 Final cooler after screening Final cooler after screening Final cooler after screeningOne Stage: Main Cooler after Screening Main Cooler after Screening Main Cooler after Screening
Bulk-X-CHANGE® is the registered trade name of the Bulk Solids Heat Exchanger from Coperion
Seite 11
4. Benefits of using bulk cooler technology 4.4 Bulk-X-Change ® comparison to conventional cooling Systems On the following the advantages of Bulk-X-Change ® in comparison with conventional solutions like rotary drums or fluid beds have been listed: Lower investment and operating costs due to:
- Compact design less required installation footprint
- Smaller apparatus less insulation
- Easy installation low erection costs
- No blower or other drive reduced energy consumption
- Easy control low operating effort
- No moving parts nearly maintenance free
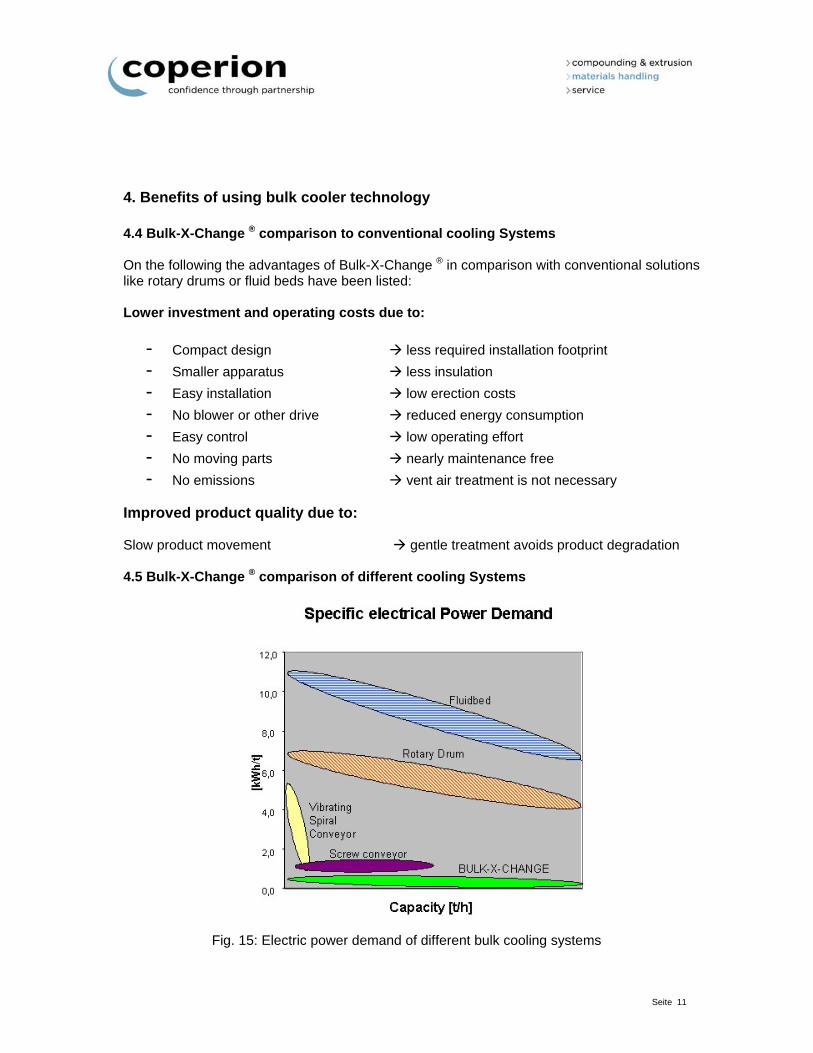
- No emissions vent air treatment is not necessary Improved product quality due to: Slow product movement gentle treatment avoids product degradation 4.5 Bulk-X-Change ® comparison of different cooling Systems
Fig. 15: Electric power demand of different bulk cooling systems
Seite 12
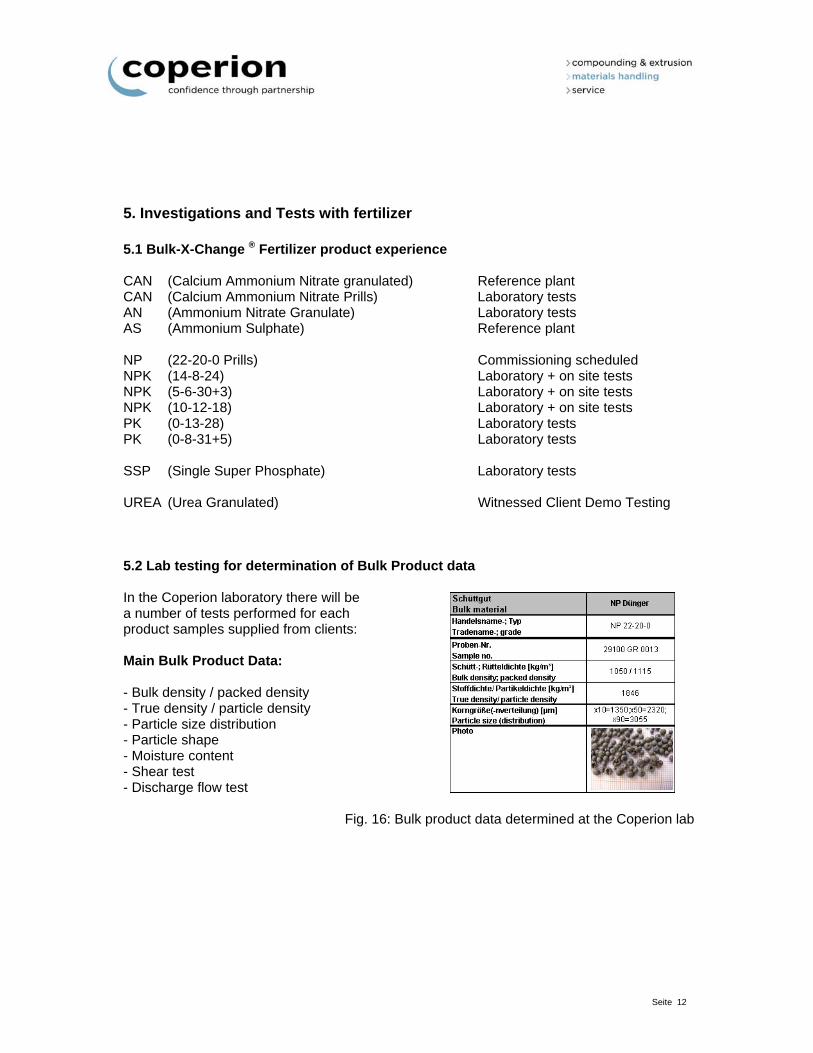
5. Investigations and Tests with fertilizer 5.1 Bulk-X-Change ® Fertilizer product experience CAN (Calcium Ammonium Nitrate granulated) Reference plant CAN (Calcium Ammonium Nitrate Prills) Laboratory tests AN (Ammonium Nitrate Granulate) Laboratory tests AS (Ammonium Sulphate) Reference plant NP (22-20-0 Prills) Commissioning scheduled NPK (14-8-24) Laboratory + on site tests NPK (5-6-30+3) Laboratory + on site tests NPK (10-12-18) Laboratory + on site tests PK (0-13-28) Laboratory tests PK (0-8-31+5) Laboratory tests SSP (Single Super Phosphate) Laboratory tests UREA (Urea Granulated) Witnessed Client Demo Testing 5.2 Lab testing for determination of Bulk Product data In the Coperion laboratory there will be a number of tests performed for each product samples supplied from clients: Main Bulk Product Data: - Bulk density / packed density - True density / particle density - Particle size distribution - Particle shape - Moisture content - Shear test - Discharge flow test
Fig. 16: Bulk product data determined at the Coperion lab
Seite 13
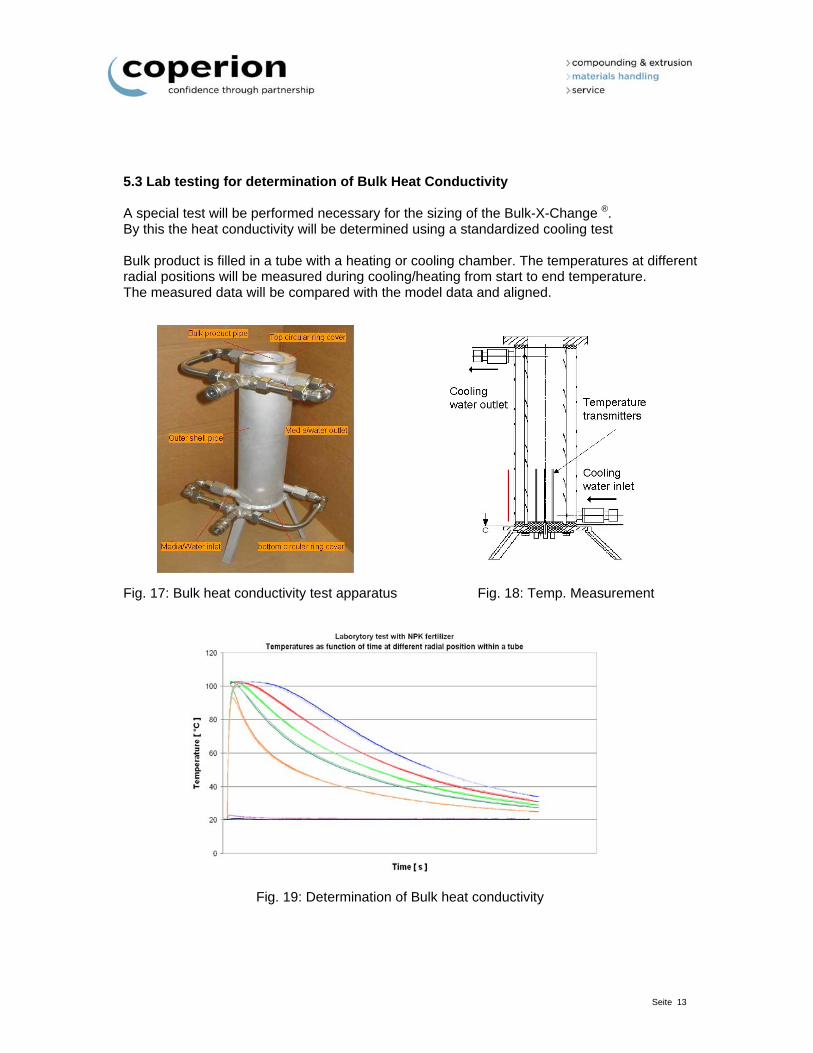
5.3 Lab testing for determination of Bulk Heat Conductivity A special test will be performed necessary for the sizing of the Bulk-X-Change ®. By this the heat conductivity will be determined using a standardized cooling test Bulk product is filled in a tube with a heating or cooling chamber. The temperatures at different radial positions will be measured during cooling/heating from start to end temperature. The measured data will be compared with the model data and aligned. Fig. 17: Bulk heat conductivity test apparatus Fig. 18: Temp. Measurement
Fig. 19: Determination of Bulk heat conductivity
Seite 14
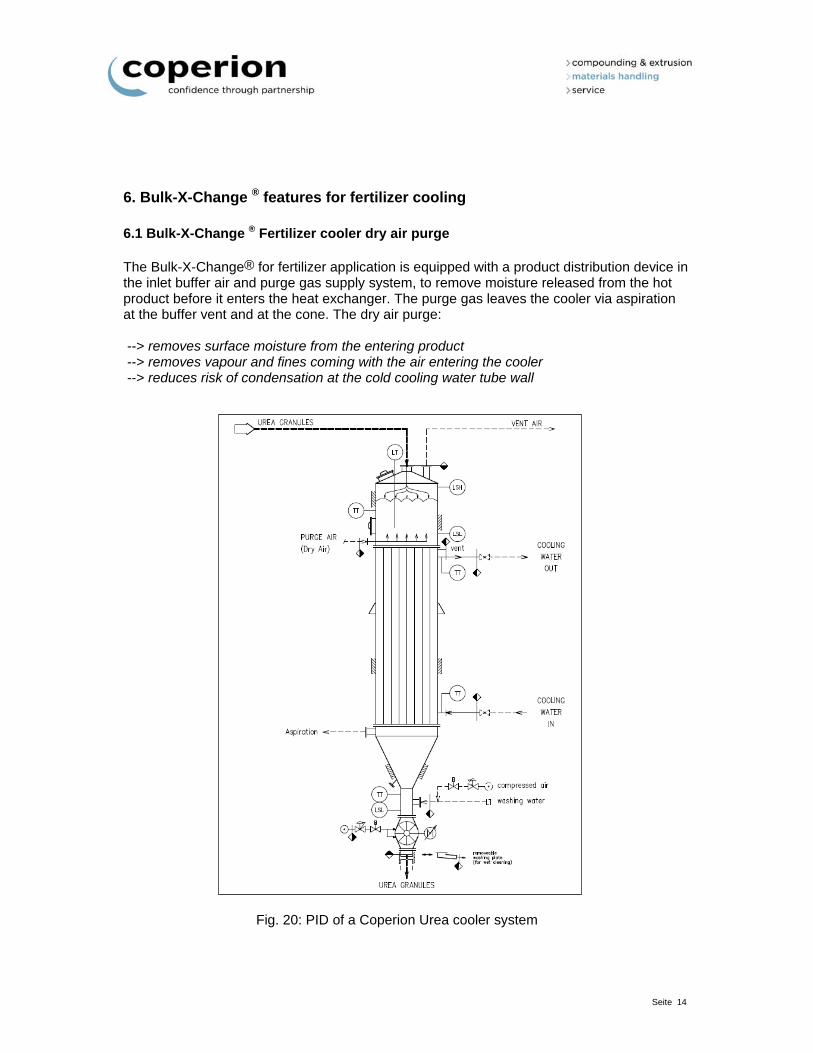
6. Bulk-X-Change ® features for fertilizer cooling 6.1 Bulk-X-Change ® Fertilizer cooler dry air purge The Bulk-X-Change® for fertilizer application is equipped with a product distribution device in the inlet buffer air and purge gas supply system, to remove moisture released from the hot product before it enters the heat exchanger. The purge gas leaves the cooler via aspiration at the buffer vent and at the cone. The dry air purge: --> removes surface moisture from the entering product --> removes vapour and fines coming with the air entering the cooler --> reduces risk of condensation at the cold cooling water tube wall
Fig. 20: PID of a Coperion Urea cooler system
Seite 15
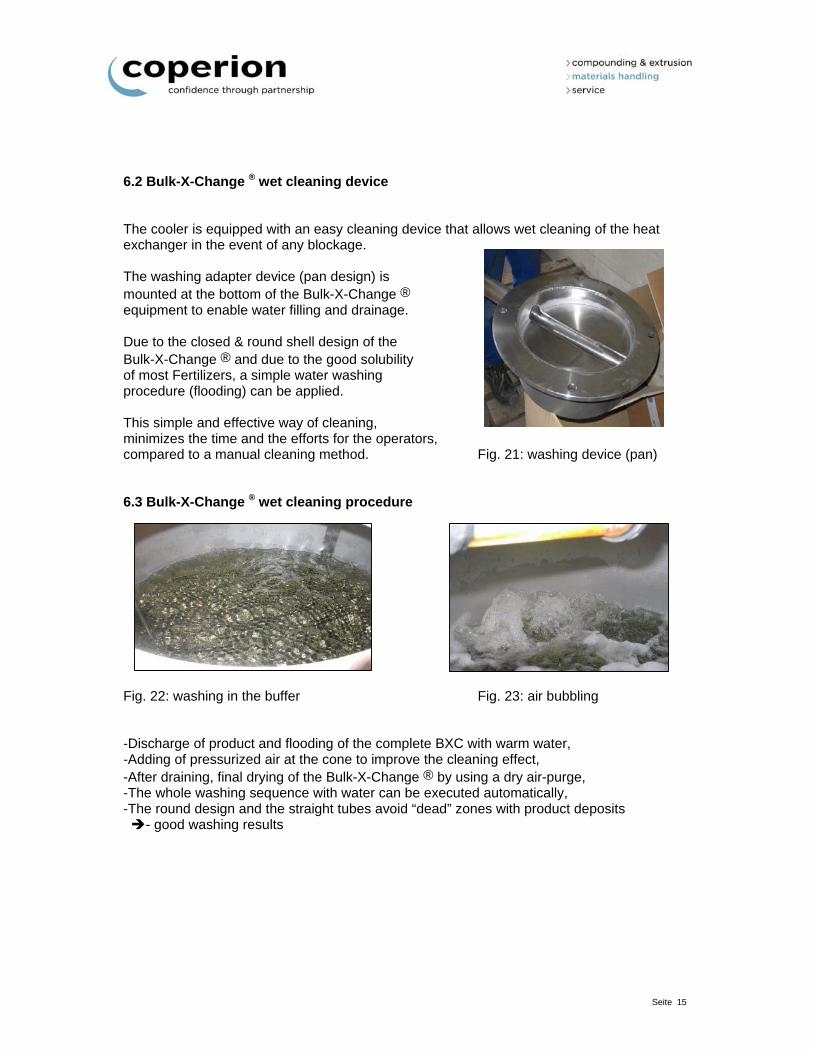
6.2 Bulk-X-Change ® wet cleaning device The cooler is equipped with an easy cleaning device that allows wet cleaning of the heat exchanger in the event of any blockage. The washing adapter device (pan design) is mounted at the bottom of the Bulk-X-Change ® equipment to enable water filling and drainage. Due to the closed & round shell design of the Bulk-X-Change ® and due to the good solubility of most Fertilizers, a simple water washing procedure (flooding) can be applied. This simple and effective way of cleaning, minimizes the time and the efforts for the operators, compared to a manual cleaning method. Fig. 21: washing device (pan) 6.3 Bulk-X-Change ® wet cleaning procedure
Fig. 22: washing in the buffer Fig. 23: air bubbling -Discharge of product and flooding of the complete BXC with warm water, -Adding of pressurized air at the cone to improve the cleaning effect, -After draining, final drying of the Bulk-X-Change ® by using a dry air-purge, -The whole washing sequence with water can be executed automatically, -The round design and the straight tubes avoid “dead” zones with product deposits - good washing results
Seite 16
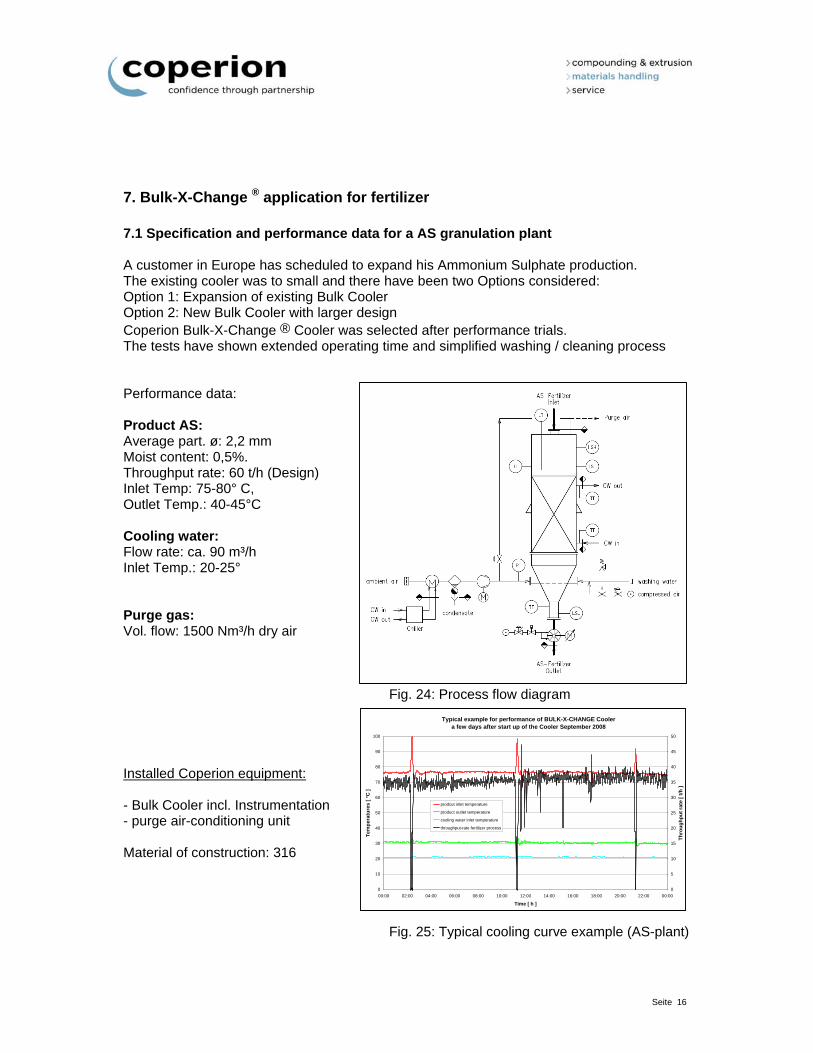
7. Bulk-X-Change ® application for fertilizer 7.1 Specification and performance data for a AS granulation plant A customer in Europe has scheduled to expand his Ammonium Sulphate production. The existing cooler was to small and there have been two Options considered: Option 1: Expansion of existing Bulk Cooler Option 2: New Bulk Cooler with larger design Coperion Bulk-X-Change ® Cooler was selected after performance trials. The tests have shown extended operating time and simplified washing / cleaning process Performance data: Product AS: Average part. ø: 2,2 mm Moist content: 0,5%. Throughput rate: 60 t/h (Design) Inlet Temp: 75-80° C, Outlet Temp.: 40-45°C Cooling water: Flow rate: ca. 90 m³/h Inlet Temp.: 20-25° Purge gas: Vol. flow: 1500 Nm³/h dry air Fig. 24: Process flow diagram Installed Coperion equipment: - Bulk Cooler incl. Instrumentation - purge air-conditioning unit Material of construction: 316
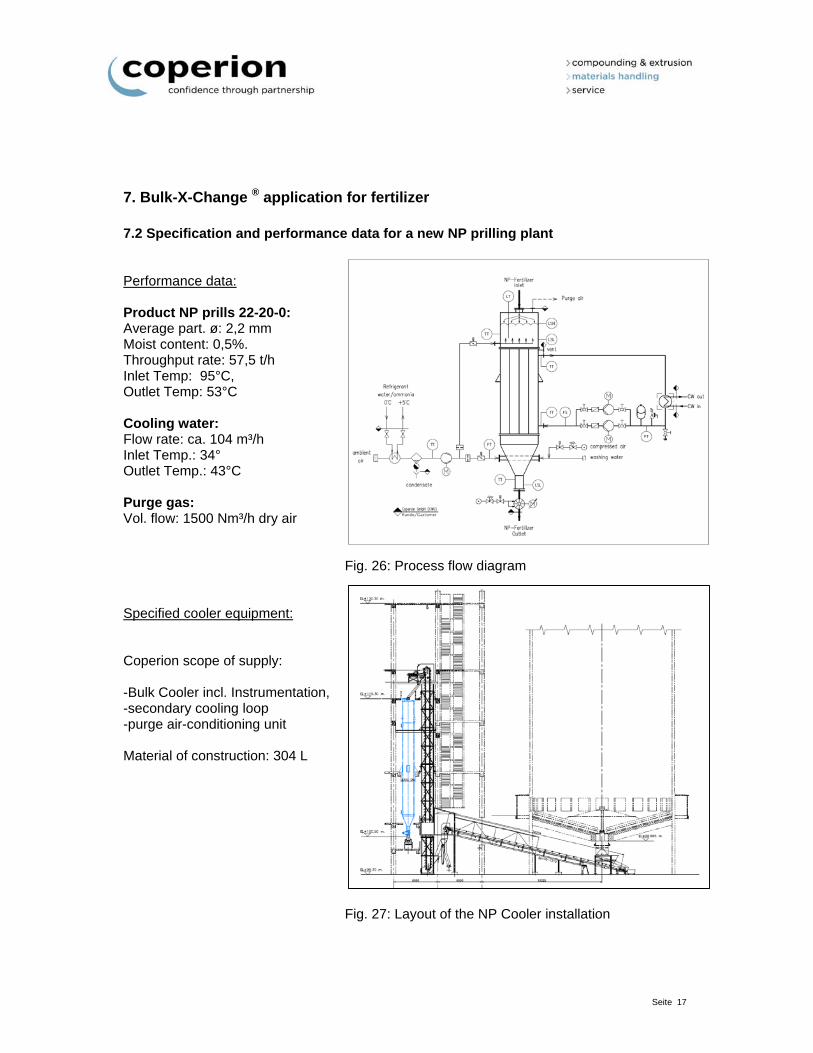
Fig. 25: Typical cooling curve example (AS-plant)
Typical example for performance of BULK-X-CHANGE Coolera few days after start up of the Cooler September 2008
0
10
20
30
40
50
60
70
80
90
100
00:00 02:00 04:00 06:00 08:00 10:00 12:00 14:00 16:00 18:00 20:00 22:00 00:00
Time [ h ]
Tem
per
atu
res
[ °C
]
0
5
10
15
20
25
30
35
40
45
50
Th
rou
gh
pu
t ra
te [
t/h
]
prodcut inlet temperature
product outlet temperature
cooling water inlet temperature
throughput-rate fertilizer process
Seite 17
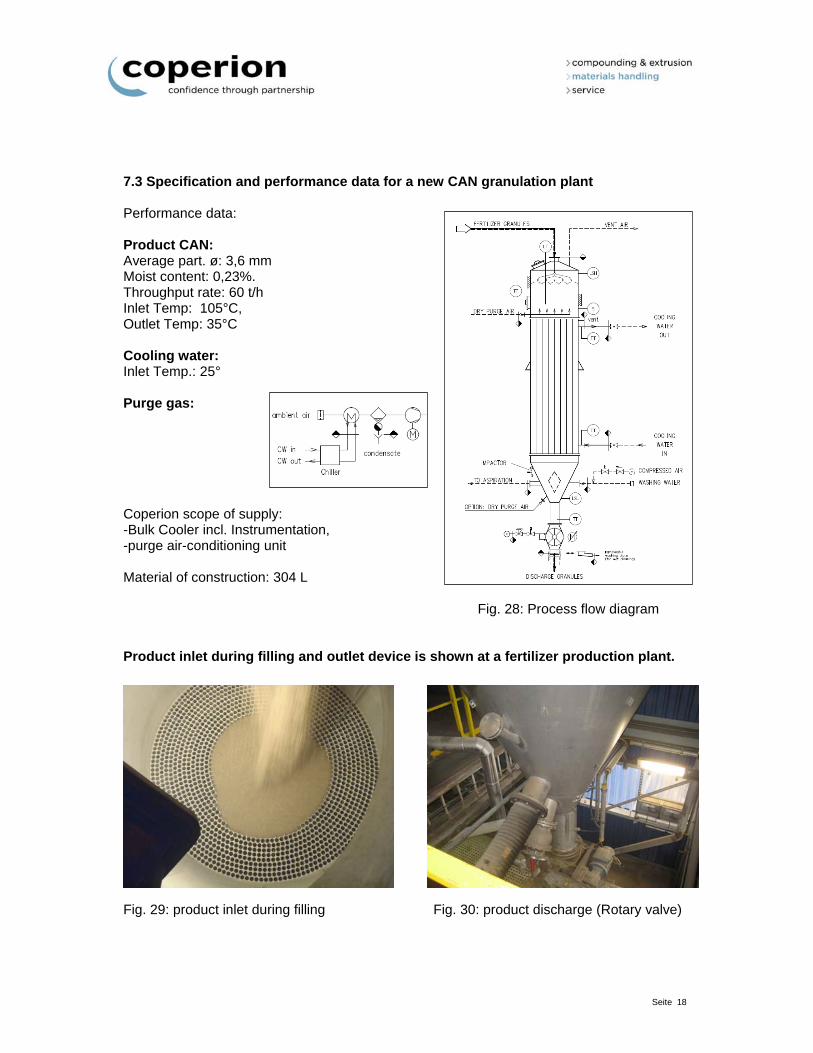
7. Bulk-X-Change ® application for fertilizer 7.2 Specification and performance data for a new NP prilling plant Performance data: Product NP prills 22-20-0: Average part. ø: 2,2 mm Moist content: 0,5%. Throughput rate: 57,5 t/h Inlet Temp: 95°C, Outlet Temp: 53°C Cooling water: Flow rate: ca. 104 m³/h Inlet Temp.: 34° Outlet Temp.: 43°C Purge gas: Vol. flow: 1500 Nm³/h dry air Fig. 26: Process flow diagram Specified cooler equipment: Coperion scope of supply: -Bulk Cooler incl. Instrumentation, -secondary cooling loop -purge air-conditioning unit Material of construction: 304 L Fig. 27: Layout of the NP Cooler installation
Seite 18
7.3 Specification and performance data for a new CAN granulation plant Performance data: Product CAN: Average part. ø: 3,6 mm Moist content: 0,23%. Throughput rate: 60 t/h Inlet Temp: 105°C, Outlet Temp: 35°C Cooling water: Inlet Temp.: 25° Purge gas: Coperion scope of supply: -Bulk Cooler incl. Instrumentation, -purge air-conditioning unit Material of construction: 304 L Fig. 28: Process flow diagram Product inlet during filling and outlet device is shown at a fertilizer production plant. Fig. 29: product inlet during filling Fig. 30: product discharge (Rotary valve)
Seite 19
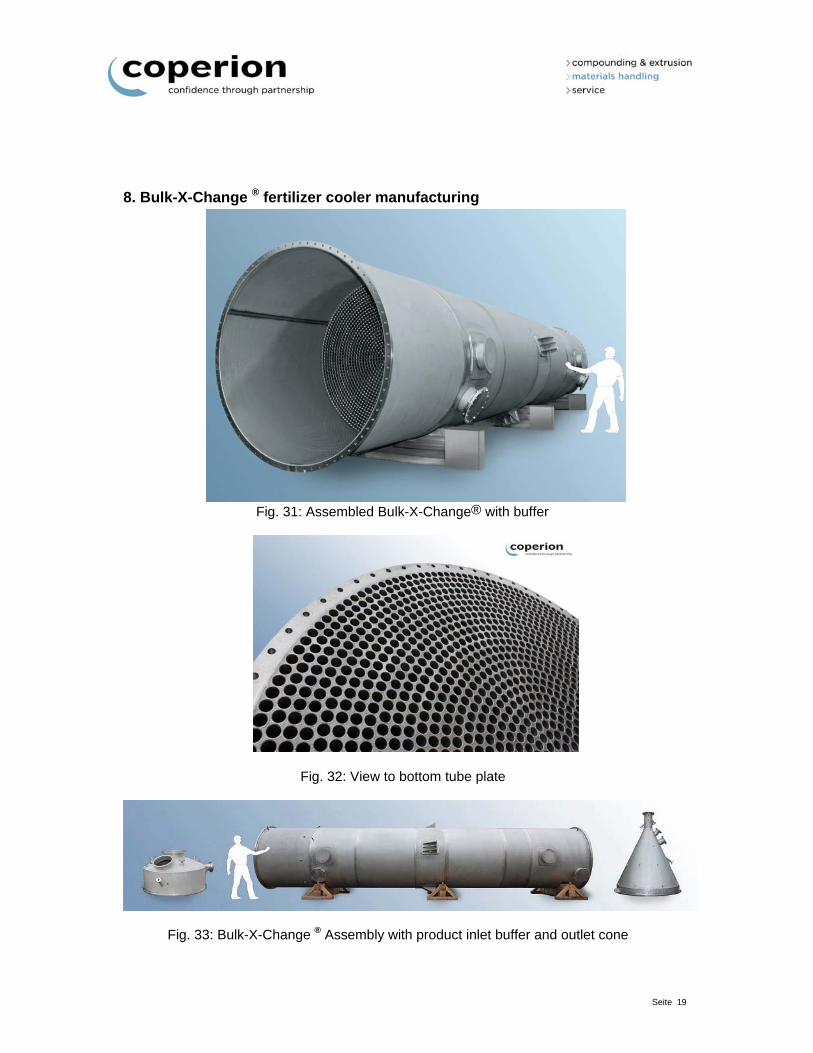
8. Bulk-X-Change ® fertilizer cooler manufacturing
Fig. 31: Assembled Bulk-X-Change® with buffer
Fig. 32: View to bottom tube plate
Fig. 33: Bulk-X-Change ® Assembly with product inlet buffer and outlet cone

G
GRI Su“G
ustainaGPIC E
abilityExperi
y Reporience”
By:H2
rting
Hussam Al A25.06.2012
Asadi
1
2
Contents
Introduction 3
GPIC Role towards Sustainability 5
Sustainability Model at GPIC 6 The Global Reporting Initiative (GRI) 17 GPIC Sustainability Report in line with GRI 21
3
Gulf Petrochemical Industries Company – Bahrain
Company Profile Headquarters based: Manama, Kingdom of Bahrain Year of establishment: 1979 Number of staff: Medium (Less than 500 employees) Industry: Oil & Gas Website: http://www.gpic.com/
Introduction:
Established in December 1979 as a joint venture between the Government of Bahrain,
(SABIC) Saudi Arabia & (PIC) Kuwait, GPIC Bahrain utilizes natural gas as raw
material.
GPIC complex is consisting of three production plants. GPIC operates Ammonia,
Methanol and Urea. Ammonia and Methanol plants were commissioned in May 1985 at
Sitra Island on an area of 60 hectares with a capacity of production 1200tonnes/day for
each plant .In 1998 a Urea Plant was commissioned with a capacity of 1700tonnes/day
with full marine export facilities.
In 1995 GPIC attained ISO 9002 which was the most important achievement since it
was formed. It was the Quality Assurance Standard Certification in its operation for both
plants Ammonia and Methanol. In 1996 GPIC was selected as the best operating
operation in the Arabian Gulf Region regarding its high levels of production,
environmental standard and safety procedure.
In December 1999 GPIC received certification to the ISO 14001 standard for its
environmental management system from Lloyds Register ,London which gave the
company a strong value in the market that it was the first industrial company in the Gulf
Region hold both ISO 9002 and ISO 14001.
In just o
Venture
environm
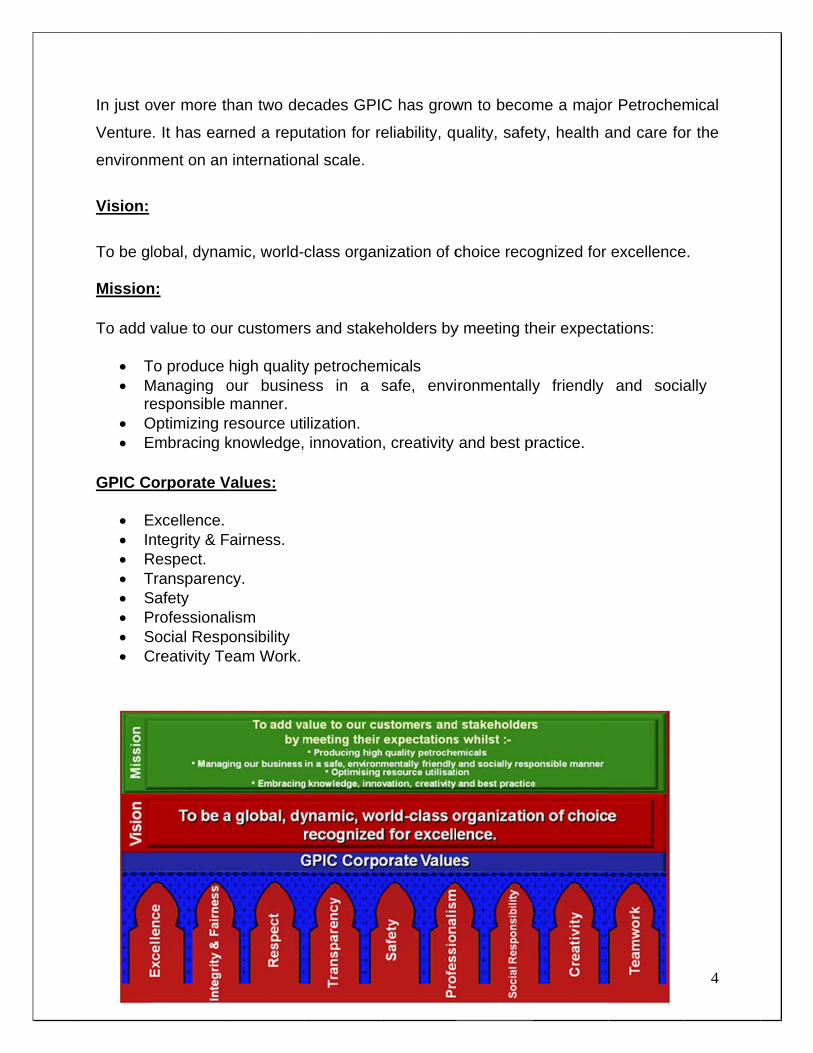
Vision:
To be gl Mission To add v
T M
re O E
GPIC Co
E In R T S P S C
over more th
. It has ear
ment on an
lobal, dynam
n:
value to ou
To produce Managing oesponsible
Optimizing rEmbracing k
orporate V
Excellence. ntegrity & F
Respect. TransparencSafety ProfessionaSocial RespCreativity Te
han two de
rned a repu
internation
mic, world-
r customers
high qualityour businemanner.
resource utiknowledge,
Values:
Fairness.
cy.
lism onsibility
eam Work.
ecades GPI
utation for r
nal scale.
class organ
s and stake
y petrochemess in a
ilization. innovation
C has grow
reliability, q
nization of c
eholders by
micals safe, envi
n, creativity
wn to becom
uality, safe
choice reco
y meeting th
ronmentally
and best p
me a major
ety, health a
ognized for
heir expecta
y friendly
practice.
r Petrochem
and care fo
excellence
ations:
and socia
4
mical
or the
e.
ally
5
GPIC Role towards Sustainability:
According to the top message by GPIC President, "At GPIC we dedicated ourselves
and our business practices to suitability- the betterment of society, the
environment and the economy", President, Abdulrahman Jawahery
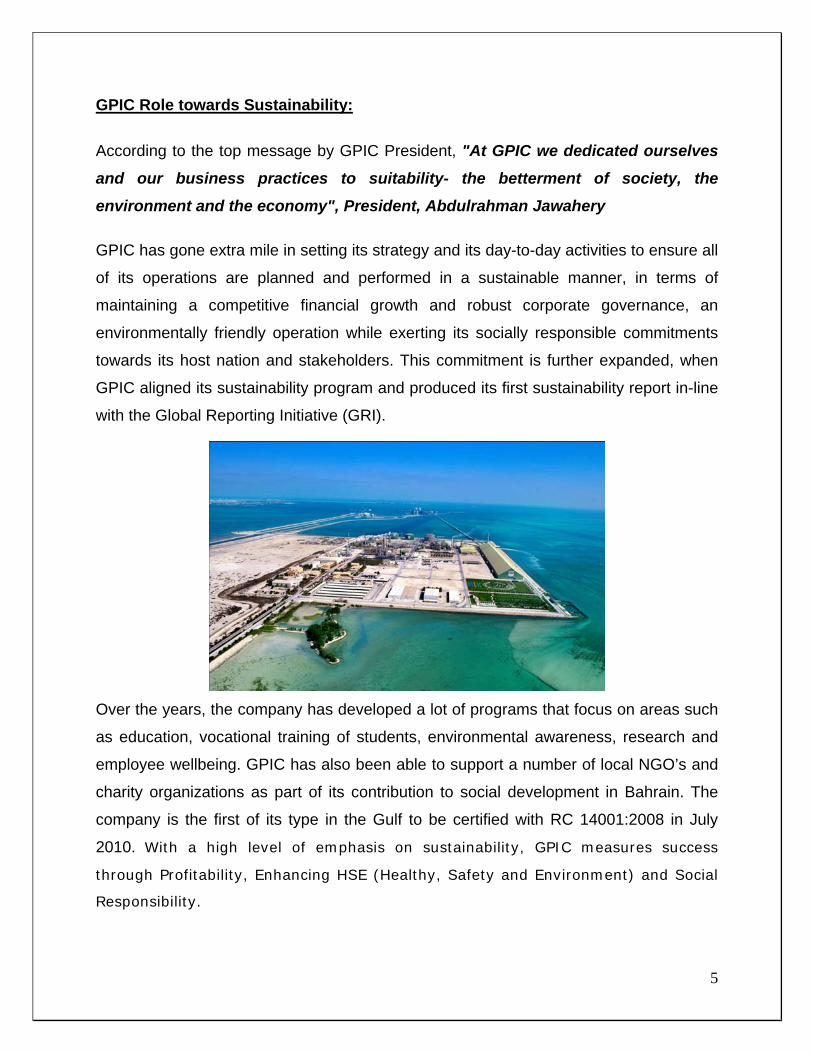
GPIC has gone extra mile in setting its strategy and its day-to-day activities to ensure all
of its operations are planned and performed in a sustainable manner, in terms of
maintaining a competitive financial growth and robust corporate governance, an
environmentally friendly operation while exerting its socially responsible commitments
towards its host nation and stakeholders. This commitment is further expanded, when
GPIC aligned its sustainability program and produced its first sustainability report in-line
with the Global Reporting Initiative (GRI).
Over the years, the company has developed a lot of programs that focus on areas such
as education, vocational training of students, environmental awareness, research and
employee wellbeing. GPIC has also been able to support a number of local NGO’s and
charity organizations as part of its contribution to social development in Bahrain. The
company is the first of its type in the Gulf to be certified with RC 14001:2008 in July
2010. With a high level of emphasis on sustainability, GPIC measures success
through Profitability, Enhancing HSE (Healthy, Safety and Environment) and Social
Responsibility.
6
Sustainability Model at GPIC:
1) Socially Responsible Business/Investment
GPIC believes that in investing capital to make the process plants at GPIC safe and
reliable is only one side of the coin; investing in the welfare of the society and needy
sectors of the society in particular being the other side.
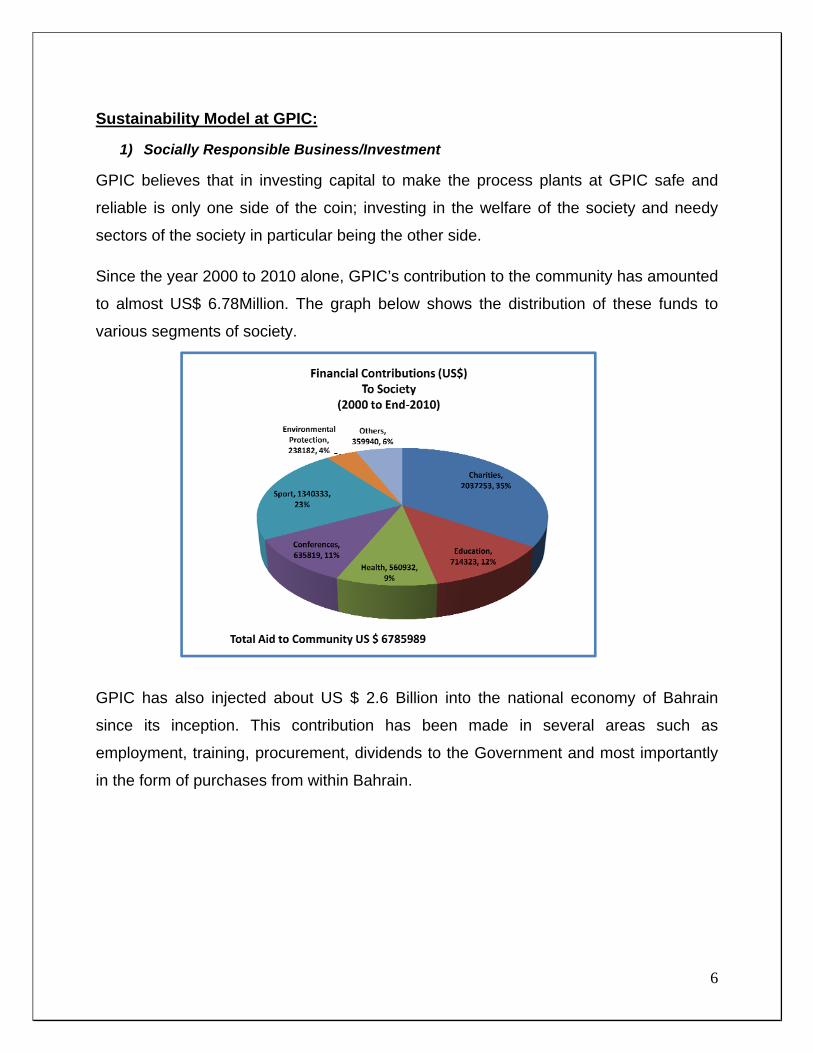
Since the year 2000 to 2010 alone, GPIC’s contribution to the community has amounted
to almost US$ 6.78Million. The graph below shows the distribution of these funds to
various segments of society.
GPIC has also injected about US $ 2.6 Billion into the national economy of Bahrain
since its inception. This contribution has been made in several areas such as
employment, training, procurement, dividends to the Government and most importantly
in the form of purchases from within Bahrain.
2) C
Commu
importan
year. GP
inside a
Polytech
Preventi
Petroche
Fertilize
Support
to organ
health s
school a
for the y
Community
nity involv
ntly, GPIC’s
PIC is repre
and outside
hnic, Bahra
ion of Ac
emical and
rs Associat
ing the wel
nizations su
sector and
and univers
young.
Involvemen
vement is
s active pa
esented on
e Bahrain:
ain’s Natio
ccidents (
d Chemica
tion; to nam
fare of the
uch as spor
charities. I
sity graduat
nt
embedded
articipation
the Board
University
onal Comm
(RoSPA, U
l Associati
me but few.
community
rt clubs and
In the past
tes and pro
d in the
in various
s and comm
of Bahrain
mittee for
UK), Natio
ion, Interna
y is also rea
d associatio
t few years
ovided mat
fabric of
institutions
mittees of s
, Bahrain T
safety, the
onal Safet
ational Fer
alized throu
ons, librarie
s, GPIC ha
terial suppo
GPIC’s b
has been
several org
Training In
e Royal S
ty Counci
rtilizers As
ugh generou
s, professio
as trained
ort to organ
business.
growing by
ganizations
stitute, Bah
Society for
l (USA),
sociation,
us contribu
onal bodies
more than
nizations ca
7
Most
y the
both
hrain
r the
Gulf
Arab
tions
s, the
900
aring

The edu
they sup
Moreove
Finance
Busines
To enco
the emp
generou
employe
The co
Achieve
of Direct
The com
society
employe
ucational pr
pport the C
er, GPIC al
(BIBF) Ex
s (USA).
ourage goo
ployees’ ch
usly contrib
ees for furth
ompany al
ments) for
tors and pro
mpany’s To
spreading
ees’ childre
rojects spon
Crown Princ
lso support
xecutive De
d education
hildren as w
utes to the
her studies
lso partici
secondary
oviding 30
oastmaste
the art of
n and emp
nsored by G
ce’s Interna
ts and parti
evelopment
nal skills, G
well as chi
e employee
inside and
pates in
school stud
volunteers
ers Club is
f public sp
loyees them
GPIC carry
ational Spo
cipates in t
program i
GPIC also r
ldren from
s’ children’
outside Ba
inJAz Ba
dents supp
annually to
s also very
peaking an
mselves.
y significant
nsorship p
the Bahrain
n associati
rewards be
neighborin
’s educatio
ahrain.
ahrainprog
porting it fin
o teach its s
y active in
nd leadersh
t prestige in
rogram for
n Institute f
on with Da
est students
ng schools
on and finan
gramme (P
ancially, ch
subjects.
providing
hip to sch
n the count
higher stu
for Banking
arden Scho
s from amo
. The com
ncially supp
Part of Ju
hairing its B
support to
ools, socie
8
ry as
dies.
g and
ool of
ongst
pany
ports
unior
Board
o the
eties,
3) C
GPIC is
strict w
protectin
and prog
Environ
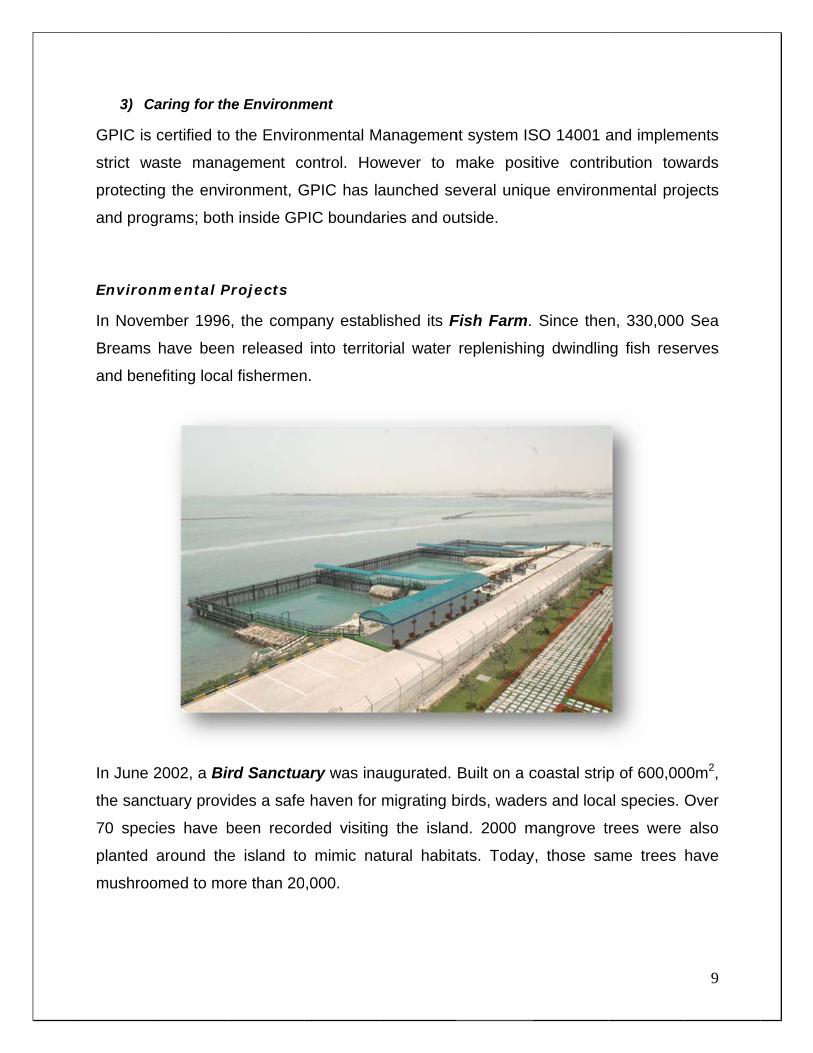
In Nove
Breams
and ben
In June
the sanc
70 spec
planted
mushroo
Caring for th
certified to
aste mana
ng the envi
grams; both
nmental P
mber 1996
have been
nefiting loca
2002, a Bir
ctuary prov
cies have b
around the
omed to mo
he Environm
o the Enviro
agement co
ronment, G
h inside GP
Projects
6, the comp
n released
al fishermen
rd Sanctua
ides a safe
been recor
e island to
ore than 20
ment
onmental M
ontrol. How
GPIC has la
PIC bounda
pany establ
into territo
n.
ary was ina
e haven for
rded visiting
o mimic na
,000.
Managemen
wever to m
aunched se
aries and ou
lished its F
orial water
augurated.
migrating b
g the islan
atural habita
nt system IS
make posi
everal uniq
utside.
Fish Farm.
replenishin
Built on a c
birds, wade
nd. 2000 m
ats. Today
SO 14001 a
itive contri
ue environ
Since then
ng dwindlin
coastal strip
ers and loca
mangrove t
y, those sa
and implem
bution tow
mental pro
n, 330,000
ng fish rese
p of 600,00
al species.
rees were
ame trees
9
ments
wards
ojects
Sea
erves
00m2,
Over
also
have

To prese
Garden
arid plan
erve local h
was officia
nts garden w
herbs that w
ally opened
with an ove
were once u
d on 9th Ma
erall area of
used for tre
ay 2005. It w
f more than
eatment by
was expan
n 26,800m2
our ancest
nded later to2.
tors, the He
o include a
10
erbal
a rare
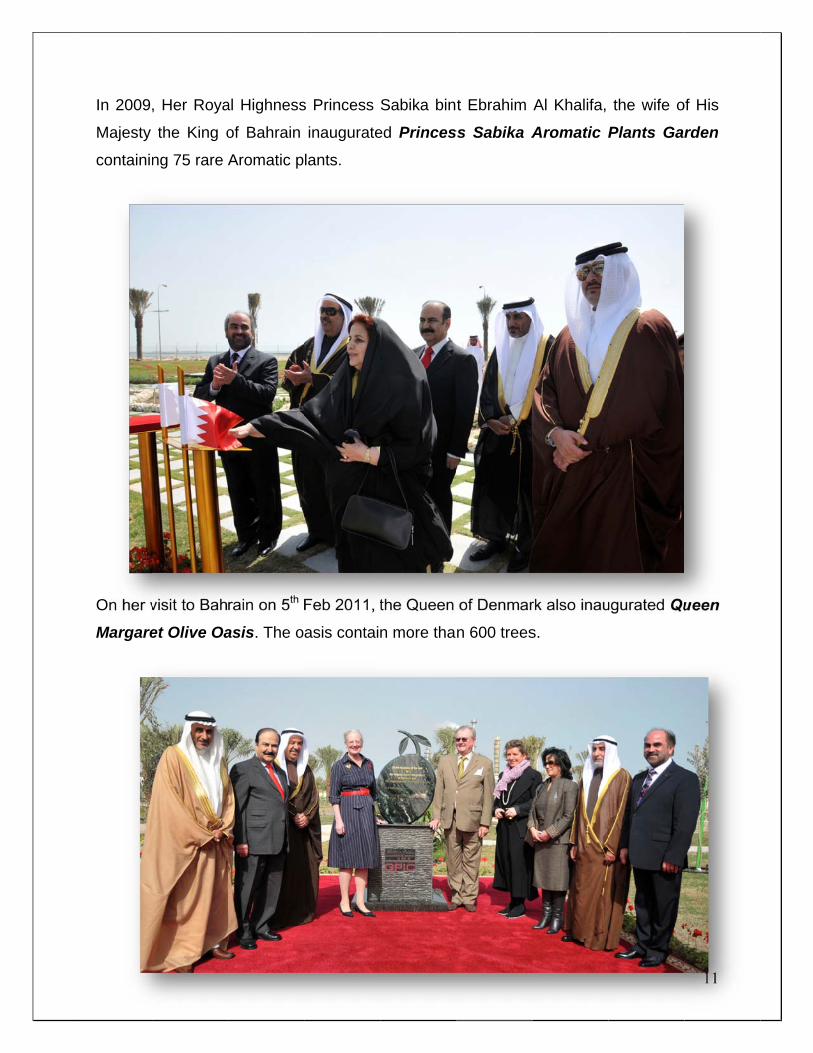
In 2009
Majesty
containin
On her v
Margare
, Her Roya
the King o
ng 75 rare A
visit to Bah
et Olive Oa
al Highness
of Bahrain
Aromatic p
rain on 5th
asis. The o
s Princess
inaugurate
lants.
Feb 2011, t
asis contai
Sabika bin
ed Princes
the Queen
n more tha
t Ebrahim
ss Sabika A
of Denmar
n 600 trees
Al Khalifa,
Aromatic
rk also inau
s.
the wife o
Plants Ga
ugurated Qu
11
of His
rden
ueen
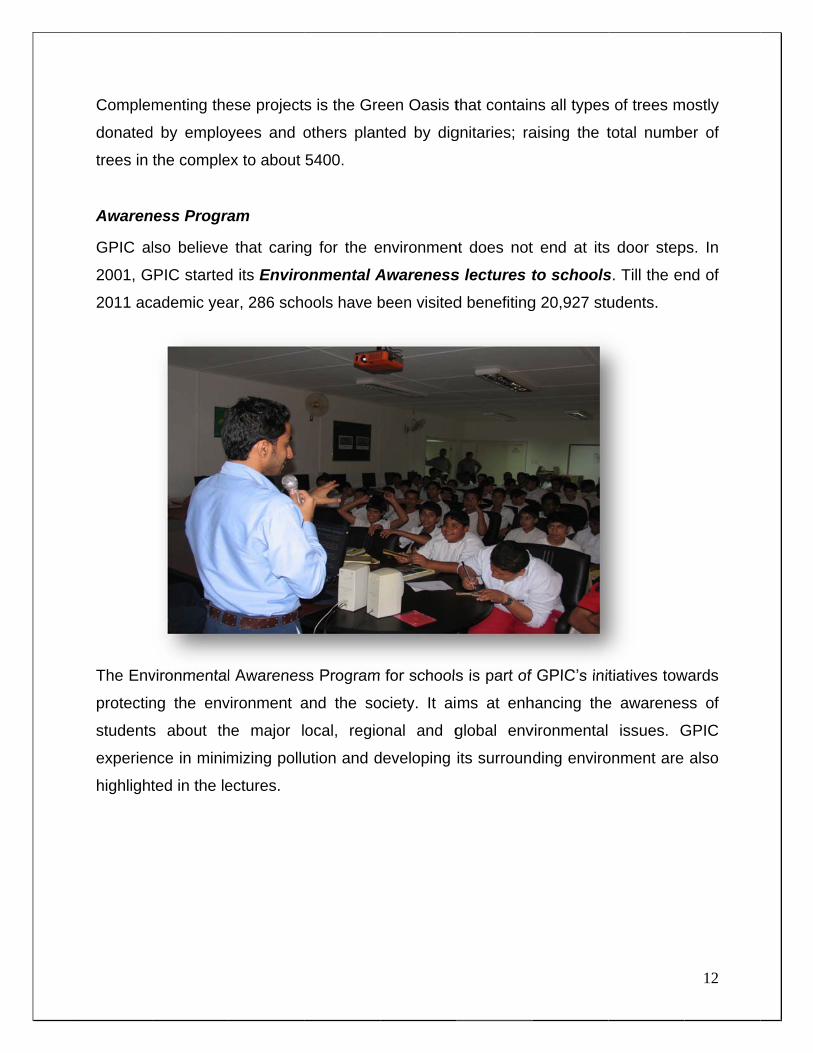
Complem
donated
trees in
Awaren
GPIC al
2001, G
2011 ac
The Env
protectin
students
experien
highlight
menting the
d by emplo
the comple
ness Progra
lso believe
PIC started
cademic yea
vironmental
ng the env
s about th
nce in minim
ted in the le
ese project
yees and o
ex to about
ram
that caring
d its Enviro
ar, 286 sch
l Awarenes
vironment a
he major l
mizing pollu
ectures.
s is the Gre
others plan
5400.
g for the e
onmental A
ools have b
ss Program
and the so
ocal, regio
ution and d
een Oasis t
nted by dig
environmen
Awareness
been visited
for schools
ociety. It ai
onal and g
developing
that contain
gnitaries; ra
nt does not
s lectures t
d benefiting
s is part of
ms at enh
global env
its surroun
ns all types
aising the t
t end at its
to schools
g 20,927 stu
GPIC’s init
hancing the
vironmental
ding enviro
s of trees m
total numb
s door step
s. Till the en
udents.
tiatives tow
e awarenes
issues. G
onment are
12
mostly
er of
ps. In
nd of
wards
ss of
GPIC
also
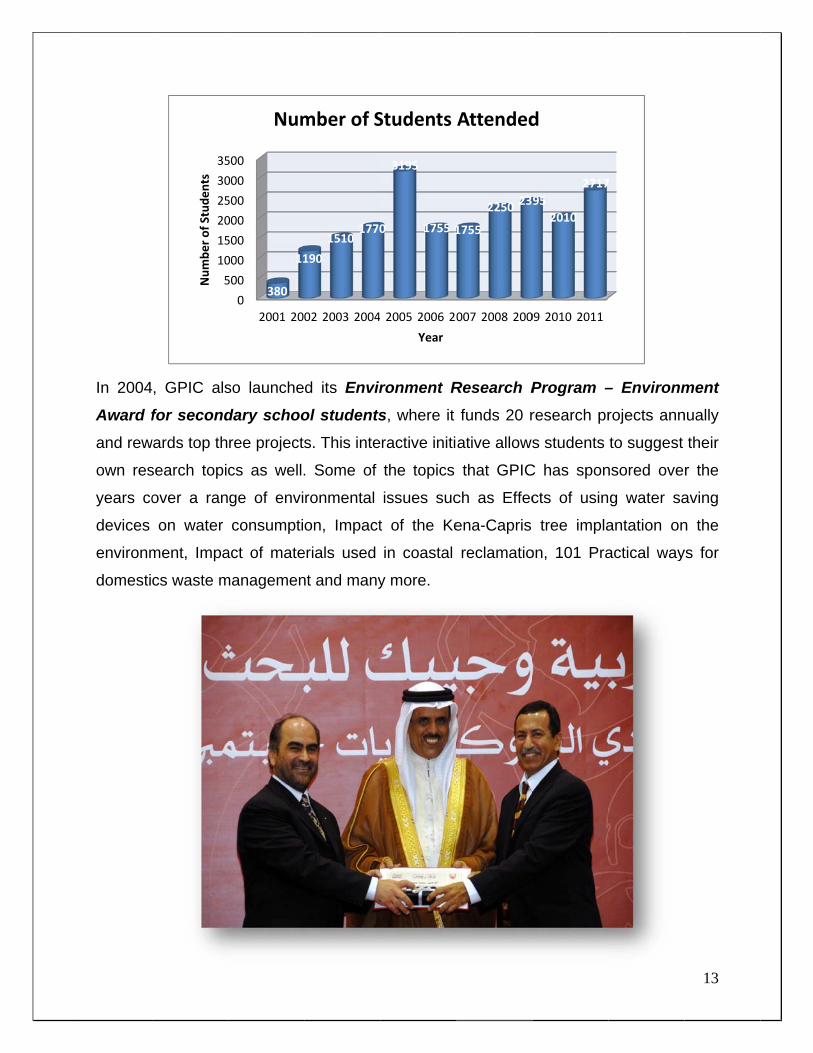
In 2004
Award f
and rew
own res
years co
devices
environm
domesti
, GPIC als
for second
wards top th
search topic
over a ran
on water
ment, Impa
cs waste m
5
10
15
20
25
30
35
Number of Students
so launche
dary schoo
ree project
cs as well.
ge of envi
consumpti
act of mate
managemen
0
500
000
500
000
500
000
500
2001 20
380
11
Num
d its Envir
ol students
s. This inte
. Some of
ronmental
on, Impact
erials used
nt and many
02 2003 2004
190
15101770
mber of S
ronment R
s, where it
ractive initi
the topics
issues suc
t of the Ke
in coastal
y more.
4 2005 2006 20
0
3195
1755 1
Year
Students
Research P
funds 20 r
ative allows
that GPIC
ch as Effec
ena-Capris
reclamatio
007 2008 200
1755
2250 23
Attended
Program –
research pr
s students
C has spon
cts of usin
tree impla
on, 101 Pra
09 2010 2011
95
2010
2717
d
– Environm
rojects ann
to suggest
nsored ove
g water sa
antation on
actical way
7
13
ment
nually
their
r the
aving
n the
ys for
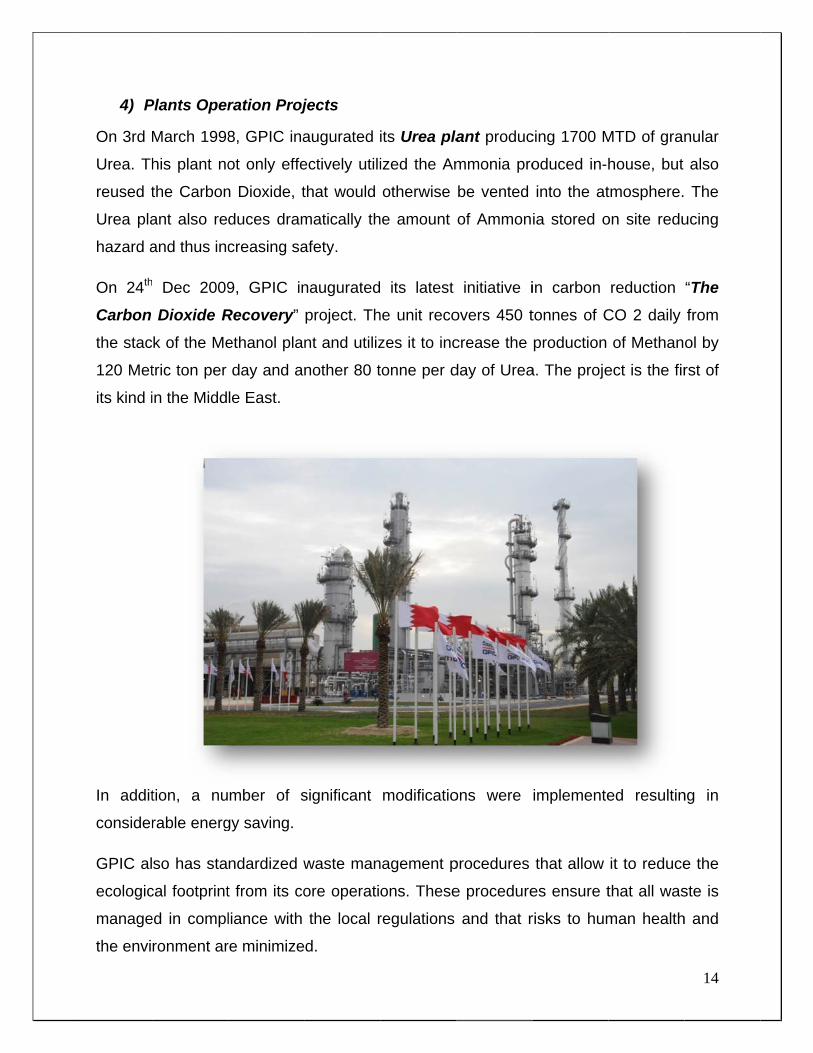
4) P
On 3rd M
Urea. Th
reused t
Urea pla
hazard a
On 24th
Carbon
the stac
120 Met
its kind i
In addit
consider
GPIC al
ecologic
manage
the envi
Plants Oper
March 1998
his plant no
the Carbon
ant also re
and thus inc
Dec 2009
Dioxide R
ck of the Me
tric ton per
in the Midd
tion, a nu
rable energ
so has sta
cal footprint
ed in compl
ronment ar
ration Proj
8, GPIC ina
ot only effe
n Dioxide, t
duces dram
creasing sa
9, GPIC in
Recovery”
ethanol pla
day and a
le East.
mber of s
gy saving.
ndardized w
t from its co
liance with
re minimize
jects
augurated i
ectively utili
that would
matically th
afety.
naugurated
project. Th
nt and utiliz
nother 80 t
significant
waste man
ore operati
the local r
d.
its Urea pla
ized the Am
otherwise
he amount
its latest
he unit reco
zes it to inc
tonne per d
modificatio
nagement p
ons. These
regulations
lant produc
mmonia pro
be vented
of Ammon
initiative i
overs 450 t
crease the
day of Urea
ons were
procedures
e procedure
and that r
cing 1700 M
oduced in-h
into the at
ia stored o
in carbon
tonnes of C
production
a. The proje
implemente
that allow
es ensure t
risks to hum
MTD of gran
house, but
tmosphere.
on site redu
reduction
CO 2 daily
of Methan
ect is the fir
ed resultin
it to reduce
that all was
man health
14
nular
also
The
ucing
“The
from
ol by
rst of
ng in
e the
ste is
h and
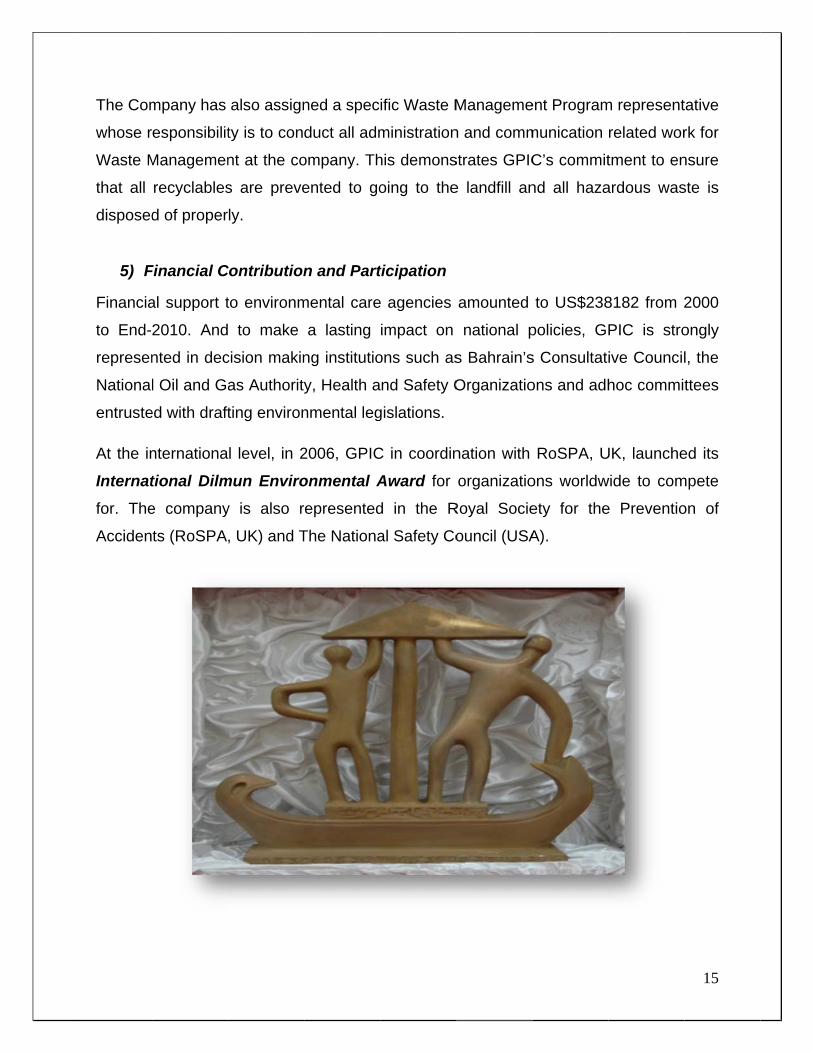
The Com
whose r
Waste M
that all
disposed
5) F
Financia
to End-
represen
National
entruste
At the in
Internat
for. The
Acciden
mpany has
responsibilit
Managemen
recyclables
d of proper
Financial C
al support t
2010. And
nted in dec
l Oil and Ga
ed with draft
nternationa
tional Dilm
e company
ts (RoSPA
also assign
ty is to con
nt at the co
s are preve
ly.
Contribution
to environm
to make
cision makin
as Authority
ting environ
l level, in 2
mun Enviro
y is also r
, UK) and T
ned a spec
duct all adm
ompany. Th
ented to go
n and Part
mental care
a lasting
ng institutio
y, Health a
nmental leg
2006, GPIC
onmental A
represented
The Nationa
ific Waste M
ministration
his demons
oing to the
ticipation
e agencies
impact on
ons such as
nd Safety O
gislations.
C in coordin
Award for
d in the R
al Safety Co
Manageme
n and comm
strates GPIC
e landfill an
amounted
national p
s Bahrain’s
Organizatio
nation with
organizatio
Royal Socie
ouncil (USA
ent Program
munication
C’s commit
nd all haza
to US$238
policies, GP
s Consultat
ons and adh
RoSPA, U
ons worldw
ety for the
A).
m represent
related wor
tment to en
ardous was
8182 from 2
PIC is stro
ive Council
hoc commi
UK, launche
wide to com
e Preventio
15
tative
rk for
nsure
ste is
2000
ongly
l, the
ttees
ed its
mpete
on of
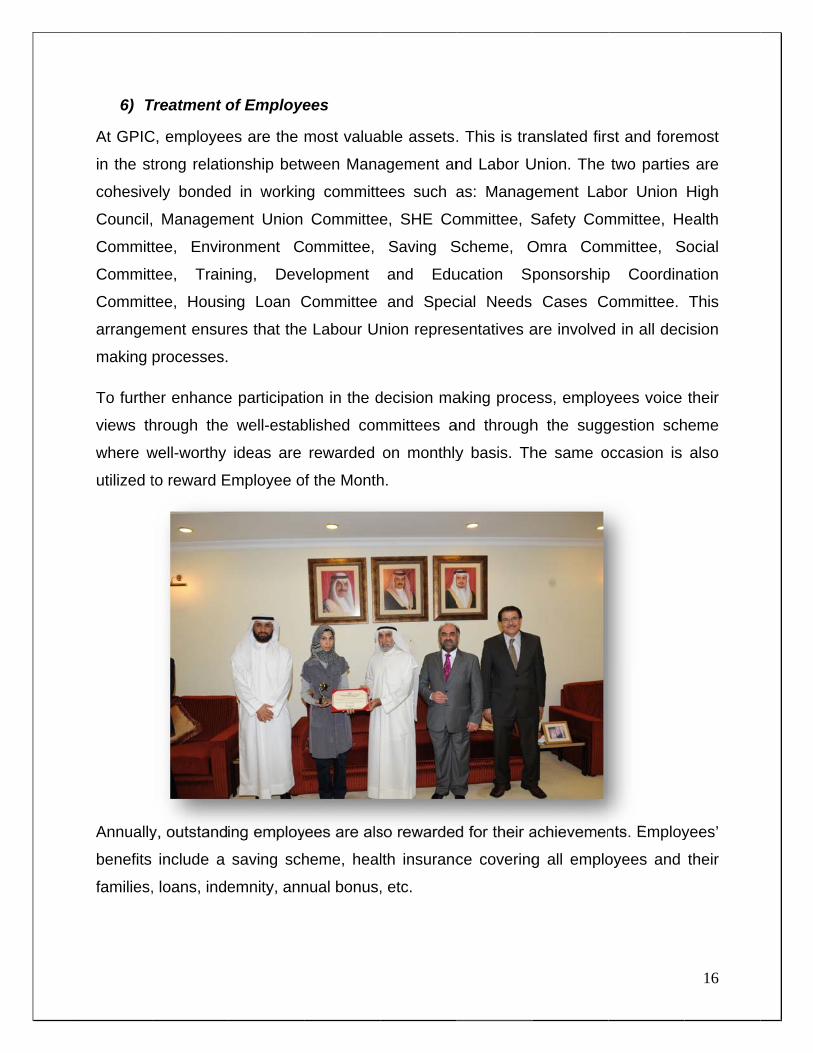
6) T
At GPIC
in the st
cohesive
Council,
Committ
Committ
Committ
arrangem
making
To furth
views th
where w
utilized t
Annually
benefits
families,
Treatment o
C, employee
trong relatio
ely bonded
Managem
tee, Enviro
tee, Train
tee, Housi
ment ensur
processes.
er enhance
hrough the
well-worthy
to reward E
y, outstand
include a
, loans, inde
of Employe
es are the
onship betw
d in workin
ment Union
onment C
ning, Deve
ng Loan C
res that the
e participati
well-estab
ideas are
Employee o
ing employ
saving sch
emnity, ann
ees
most valua
ween Mana
ng committe
Committee
ommittee,
elopment
Committee
e Labour Un
ion in the d
blished com
rewarded
f the Month
yees are als
heme, heal
nual bonus,
able assets.
agement an
ees such a
e, SHE Co
Saving S
and Edu
and Spec
nion repres
decision ma
mmittees a
on monthly
h.
so rewarded
lth insuranc
, etc.
. This is tra
nd Labor U
as: Manag
ommittee, S
Scheme, O
ucation S
cial Needs
sentatives a
aking proce
and through
y basis. Th
d for their a
ce covering
anslated firs
Union. The
gement Lab
Safety Com
Omra Com
ponsorship
Cases C
are involved
ess, employ
h the sugg
he same o
achievemen
g all emplo
st and fore
two parties
bor Union
mmittee, H
mmittee, S
p Coordin
ommittee.
d in all dec
yees voice
gestion sch
occasion is
nts. Employ
oyees and
16
most
s are
High
ealth
Social
ation
This
cision
their
heme
also
yees’
their

17
An incentivized scheme is to reward employees during the Annual Awards Ceremony.
Some of the Awards include Employee of the Year for Sustained Performance,
Employee of the Year for Outstanding Performance, Department of the Year, Quality
Auditor of the Year, Early Bird Award and the like.
Employees are taken into account before making all major decisions at GPIC.
Employees are offered housing loans, health insurance and end of service
compensation schemes.
The Global Reporting Initiative (GRI): The Global Reporting Initiative (GRI) is one of the world’s comprehensive sustainability
reporting framework for organizations of any sizes and sector. The GRI mission is to
make sustainability reporting standard practice by providing guidance and support to
organizations.
Sustainability reports based on the GRI Framework can be used to demonstrate
organizational commitment to sustainable development, to compare organizational
performance over time, and to measure organizational performance with respect to
laws, norms, standards and voluntary initiatives.
Currently, thousands of organizations worldwide are already benefiting from the
sustainability reporting which have a number of rewards:
Providing a clear picture of main economic, social and environmental impacts of
the organization
Identifying risks and opportunities for current activities and areas for
improvements
Increasing stakeholders engagement and attraction
Enhancing reputation and increasing customer of client loyalty and community
respect
Achieving a competitive advantage
18
The process of preparing the GRI sustainability reporting is developed while
progressing through five phases as summarized below:
1. Prepare the GRI sustainability reporting plan
As this phase, the organization GRI sustainability reporting to be planned according to
the organizational goals mission and vision. It should be aligned with the three core
aspects of organizational success which are economic, social and environmental
aspects in terms of approaches and performance indicators.
Following that, a timeline plan should be created that identifies each step of the process
starting from preparation, connect with stakeholders, Define the objectives, monitor the
process, report and finally lunching the report. This process should be supported by a
team consisting of process coordinator, decision maker and supporters.
2. Stakeholder’s engagement.
Stakeholder input is key component for defining the content of the report and aspects to
be focused on. Therefore at this stage, identifying and prioritizing stakeholders and
initiation of discussion topics on economic, social and environmental should be
materialized. The benefit of engagement is to strengthen the trust between the
organization and its stakeholders. This covers both internal stakeholders such as
employees and external stakeholders such as customers, shareholders, suppliers, etc.
The common aspects that should be discussed should all falls into the three main
categories which are economic, social and environmental. The social aspect has further
four sub-categories: Labor Practices, Decent Work, Human Rights, Society and Product
Responsibility.
This process is considered to be the core subject of the sustainability reporting at which,
it should have a humble time frame and resources to interact and create dialogue
channel with the stakeholders based on those who are identified and prioritized. The
organization chooses different method of interaction with their stakeholders depends on
each stockholder such as surveys, meetings, letters, etc.
19
3. Define the actions and indicators
At this stage, the list of aspects should be defined based on the engagement process
described above.
The selection of aspects can be narrowed down by applying materiality test which is
recommended by GRI protocol. Based on the aspects selected, the indicators should be
developed in line with GRI 3.1 version guidelines which are related to the selected
aspects.
It is recommended by GRI to report all performance indicators found to be material by
either providing the information, or explaining the reason of its omission. This is a
requirement of level A GRI report.
The ultimate decision makers within an organization should be involved to make the
final decision on the aspects and indicators to report on.
4. Monitor and build the report.
The sustainability reporting is more than just producing a sustainability report, it is also
about improvements and changes to the organizations that can be initiated as a result
towards a sustainable activities.
It is important to collect data regularly and systematically to ensure balance,
comparatively accurate, clarity and reliability of the report. The performance can be
measured in two ways: quantitatively and qualitatively.
5. Check and Communicate
At this stage , all the information required for the report are gathered and should be
ready for checking, writing, finalizing, and then lunching the report. Following that is
the preparation phase for starting next reporting cycle.
Choosing the best communication tool or method to reach stakeholders internally
and externally is important part of the sustainability reporting. The organization
should provide access channel to the complete set of the report either in the form of
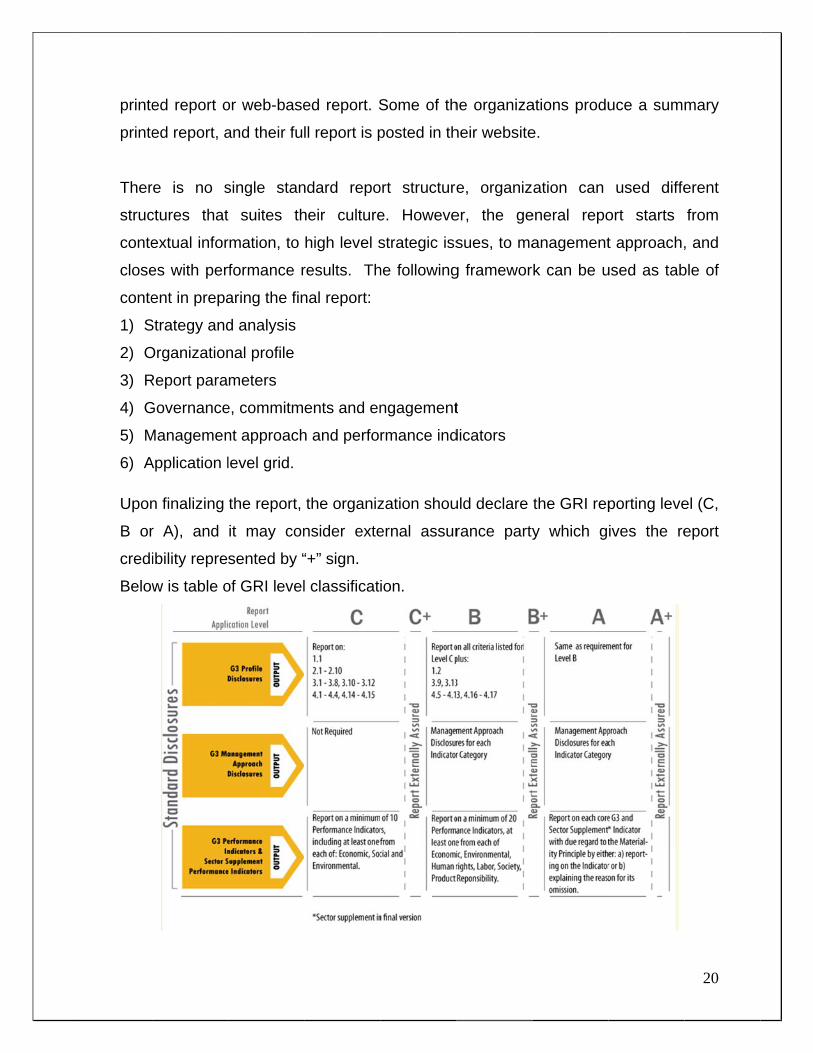
printe
printe
Ther
struc
conte
close
conte
1) S
2) O
3) R
4) G
5) M
6) A
Upon
B or
credi
Below
ed report o
ed report, a
re is no s
ctures that
extual infor
es with per
ent in prepa
Strategy and
Organization
Report para
Governance
Managemen
Application l
n finalizing
r A), and
ibility repre
w is table o
or web-base
and their fu
single stan
t suites th
rmation, to
rformance r
aring the fin
d analysis
nal profile
meters
e, commitm
nt approach
level grid.
the report,
it may con
sented by “
of GRI level
ed report. S
ll report is p
ndard repo
heir culture
high level s
results. Th
nal report:
ents and en
h and perfo
the organiz
nsider exte
“+” sign.
l classificat
Some of th
posted in th
ort structure
e. Howeve
strategic iss
he following
ngagement
rmance ind
zation shou
ernal assur
ion.
he organiza
heir website
e, organiz
er, the ge
sues, to ma
g framewor
t
dicators
uld declare
rance party
ations produ
e.
zation can
eneral repo
anagement
rk can be u
the GRI rep
y which g
uce a sum
used diffe
ort starts
t approach,
used as tab
porting leve
ives the re
20
mary
erent
from
, and
ble of
el (C,
eport
21
GPIC Sustainability Report in line with GRI: (2010-2011)
Our initial sustainability report “30 years of excellence,” published in 2009, was issued
to commemorate our 30th anniversary since inception. As a way to further enhance our
transparency and diligence in our approach to monitor measure and report on our
economic, environmental and social performance, we have taken an initiative to align
our sustainability reporting with the Global Reporting Initiative (GRI) G3.1 sustainability
reporting guidelines.
This report also includes information on the various corporate social responsibility and
sustainability initiatives we have invested in the financial years 2010 and 2011 (period
ending December 31, 2011).
This report is aimed at our shareholders, employees, governmental and non-
governmental organization and other parties or individuals with a working interest in
GPIC.
In preparing the report we have gone through the following cycles:
GRI Reporting team leader attended a workshop on Sustainability GRI reporting.
A working team was formed to prepare the sustainability report for 2010-2011.
All relevant section heads were briefed about GRI reporting requirements in a
kick-off meeting.
A brainstorming session was conducted by relevant sections heads to identify
and agree on our key stakeholders.
Information was collated from relevant sections related to the GRI 3.1
Performance indicators.
KPMG Consultancy was engaged to assist us in preparing the report, including
the review of draft write ups.
In parallel with the report preparation, a professional designer and publisher was
also engaged.
Diverse materiality processes were observed to ensure we only reported on
those indicators (GRI3.1) that are relevant to our business.
The boundaries were well defined as all our business facilities are in Bahrain and
our product marketing is done by SABIC and PIC. The report boundary covers
our facilities and operations covering our manufacturing and export facilities. As
22
the marketing of products is done by our shareholders, therefore we do not have
a direct link with our customers.
Data collection for the relevant GRI3.1 indicators was provided by the concerned
sections of our business. The information was verified by the concerned
professionals during the review phase of the report. Most of the data was already
available within the company as part of our regular data collection, monitoring
and reporting process for our day to day business.
This is the first year that GPIC Sustainability Report 2010-2011 has been prepared,
assessed and reporting against the GRI G3.1 guidelines. We will continue to refine
our sustainability reporting and will work to further enhance our commitment,
targeting full compliance with GRI report “A” level in future years.
Materiality Process:
We observed divers materiality processes to ensure our reported indicators are
having significant impact on the economic, environmental and social aspects and
are mostly relevant to our business.
This covers both: the importance of our organizations impacts and the priorities of
stakeholders. We have tried to provide a balanced representation of material issues
based on internal and external feedback and factors concerning GPICs sustainability
performance. Therefore, GPIC business principles are based on the triple bottom
line approach and hence forms the basis of our sustainability reporting.


25th AFA International Technical Conference and Exhibition HSC Summit Topic: Sustainability and Social Responsibility Title: Qatar Fertilizer Company Commitment to Health & Safety and Environmental Stewardship Iftikhar Hussain Turi Qatar Fertilizer Company, Mesaieed QATAR
Introduction Located in state of Qatar, Qatar Fertilizer Company now a multi product facility is a world class producer of urea and ammonia since 1973. At present, QAFCO operates five ammonia and five urea plants and one ammonia and urea plant are in the final stages of commissioning and start up. Beside Urea and ammonia it also produces Melamine, Urea formaldehyde and Aqueous ammonia. Being a responsible organization, QAFCO considers the safety, health and wellbeing of its employees a core value and the protection of the environment its prime responsibility. Keeping focus on safety and environmental protection, and maintaining the organization growth, QAFCO management is successfully fostering a strong safety vision at all levels of organization by showing its commitment towards continues improvement, risk mitigation, employee’s engagement and implementing, adopting industry best practices and available technologies to reduce its environmental footprint and improve process and personal safety. On a social level QAFCO is reaching out to the communities by sponsoring events and shows, sponsoring environmental and marine protection projects. QAFCO is actively involved in improvement of marine habitat by installing artificial coral reef near Sea line beach. QAFCO is also looking after the improvement of Al-Besheriya Island and is the main sponsor of Sahara environmental project to utilize green technology to produce fresh water utilizing solar energy.
Background Founded in 1969 as a joint venture was the first step towards the industrial diversification in Qatar to utilize the available natural gas resources. With the startup of its first 900MT anhydrous ammonia and 1000MT of prill urea plant, QAFCO joined the list of the world nitrogenous fertilizer producers in 1973. Over the years, responding to the world fertilizer demand, QAFCO has gradually increased its production from 1000 MTPD urea and 900 MTPD ammonia to 11550 MTPD and 8550 MTPD respectively by adding more production trains and by revamping the existing plants to increase production capacity. All the plants in QAFCO are operating well above the rated capacity. Beside the two main products (prilled and granular) QAFCO is also producing UFC-85, Melamine and Aqueous ammonia. The aqueous ammonia is utilized in the DeNOx system to reduce NOx emission. At present, QAFCO average annual production is about 2 million tons of ammonia and 3 million ton of urea. After completion of the two new projects its average annual production capacity will rise up to 3.8 million ton of ammonia and 4.8 million ton of urea making QAFCO world’s largest single site producer of ammonia and urea. With the increase in plant throughput, its on site anhydrous ammonia storage capacity has also increased gradually from 20,000 MT to165000 MT by adding two world’s largest anhydrous ammonia storage tanks.
Improving safety and reducing environmental footprint while expanding After putting its product in the world market to support the world grain production, QAFCO started to get voluntary certification for Safety, Quality and Environment management system to get aligned with the international producers and suppliers of the global market and also to improve its safety, quality, reliability and to reduce the environmental footprint to comply with state environmental laws and regulations. Being a responsible member of the Mesaieed industrial community, QAFCO is diligently working to comply with local environmental laws by adopting new technologies and conducting the required modification to bring down its emissions.
QAFCO holds the following certifications: ISO 9001: 2008 (Quality Management System) ISO 14001: 2004 (Environment Management System) BS OHSAS 18001:2007 Occupational Health and Safety Management System Responsible care RS-14001:2008 Technical Specification Product stewardship
Challenges for QAFCO QAFCO a multi cultural and multi product company is located in Mesaieed industrial city of QATAR surrounded by chemical and petrochemical plants, handling a very high volume of hazardous, toxic chemicals and highly explosive gases. QAFCO considers the safety and health of its employees and the contractors working in QAFCO a core value and the protection of the environment its prime responsibility. While working on safety improvement, QAFCO has to take into consideration not only the internal risks and hazards into consideration but also the external risks to QAFCO employees and at the same time to ensure the safety of the people working in the neighboring plants in case of any accidental release from QAFCO plants. As per the nature of the business, QAFCO faces a unique set of challenges to implement its OH&S program and keep check on the releases from the plants. Due to ongoing expansion and modification activates and much needed yearly plant turnarounds a series of simultaneous activities takes place in an environment where other plants are live and fully functional. Plant personnel and contractors works to get the job done within a very tight time frame and some time in a very extreme weather conditions.
Hazard Identification and Mitigation With the passage of time QAFCO has not only increased its production capacity but has also diligently worked on improving its safety performance by adopting continuous improvement strategies, implementing and adopting industry best practices, conducting risk assessment, mitigation, engaging and challenging employees at all levels, adopting best available technologies, learning from others and sharing information with the industry on a local as well as on a global level by attending seminars and workshops around the world.
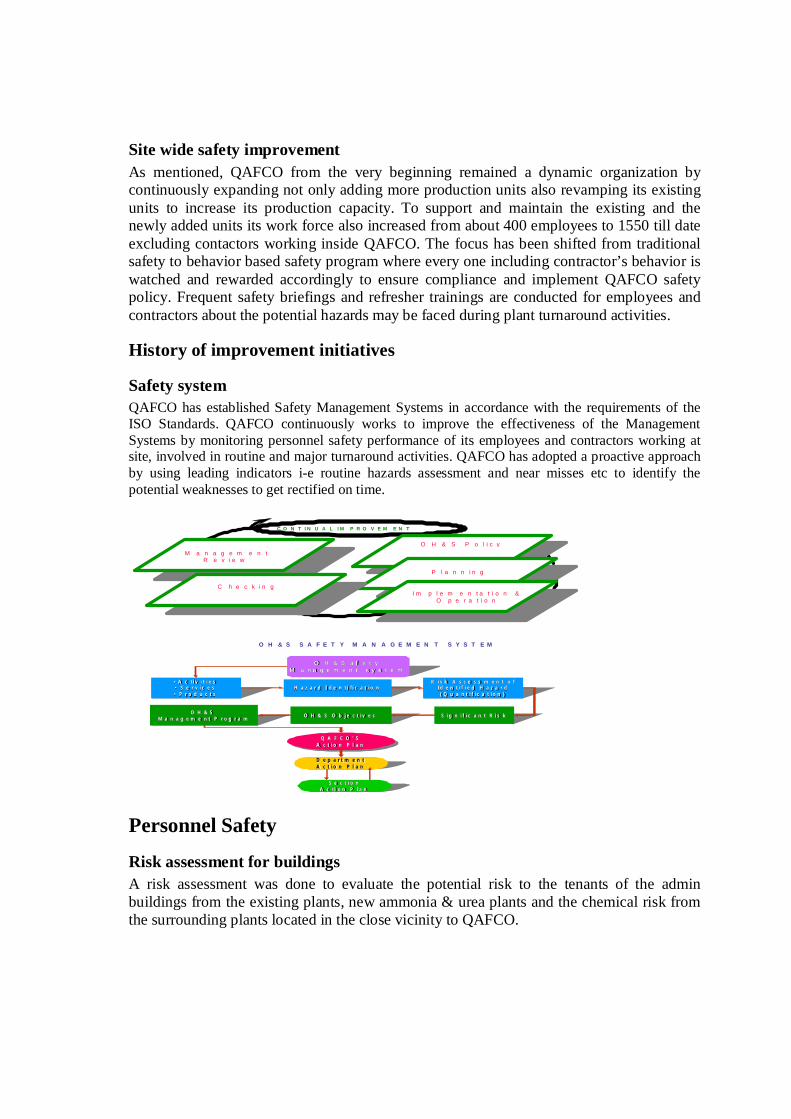
Site wide safety improvement As mentioned, QAFCO from the very beginning remained a dynamic organization by continuously expanding not only adding more production units also revamping its existing units to increase its production capacity. To support and maintain the existing and the newly added units its work force also increased from about 400 employees to 1550 till date excluding contactors working inside QAFCO. The focus has been shifted from traditional safety to behavior based safety program where every one including contractor’s behavior is watched and rewarded accordingly to ensure compliance and implement QAFCO safety policy. Frequent safety briefings and refresher trainings are conducted for employees and contractors about the potential hazards may be faced during plant turnaround activities.
History of improvement initiatives
Safety system QAFCO has established Safety Management Systems in accordance with the requirements of the ISO Standards. QAFCO continuously works to improve the effectiveness of the Management Systems by monitoring personnel safety performance of its employees and contractors working at site, involved in routine and major turnaround activities. QAFCO has adopted a proactive approach by using leading indicators i-e routine hazards assessment and near misses etc to identify the potential weaknesses to get rectified on time.
M a n a g e m e n t R e v i e w
C h e c k i n g I m p l e m e n t a t i o n &
O p e r a t i o n
P l a n n i n g
O H & S P o l i c y
C O N T I N U A L I M P R O V E M E N T
O H & S a f e t yO H & S a f e t yM a n a g e m e n t s y s t e mM a n a g e m e n t s y s t e m
•• A c t i v i t i e sA c t i v i t i e s•• S e r v i c e sS e r v i c e s•• P r o d u c t sP r o d u c t s
H a z a r d I d e n t i f i c a t i o nH a z a r d I d e n t i f i c a t i o nR i s k A s s e s s m e n t o fR i s k A s s e s s m e n t o f
I d e n t i f i e d H a z a r dI d e n t i f i e d H a z a r d( Q u a n t i f i c a t i o n )( Q u a n t i f i c a t i o n )
S i g n i f i c a n t R i s kS i g n i f i c a n t R i s kO H & S O b j e c t i v e sO H & S O b j e c t i v e sO H & S O H & S M a n a g e m e n t P r o g r a mM a n a g e m e n t P r o g r a m
Q A F C O ’ SA c t i o n P l a nQ A F C OQ A F C O ’’ SS
A c t i o n P l a nA c t i o n P l a n
D e p a r t m e n tD e p a r t m e n tA c t i o n P l a nA c t i o n P l a n
S e c t i o nS e c t i o nA c t i o n P l a nA c t i o n P l a n
O H & S S A F E T Y M A N A G E M E N T S Y S T E M
Personnel Safety
Risk assessment for buildings A risk assessment was done to evaluate the potential risk to the tenants of the admin buildings from the existing plants, new ammonia & urea plants and the chemical risk from the surrounding plants located in the close vicinity to QAFCO.
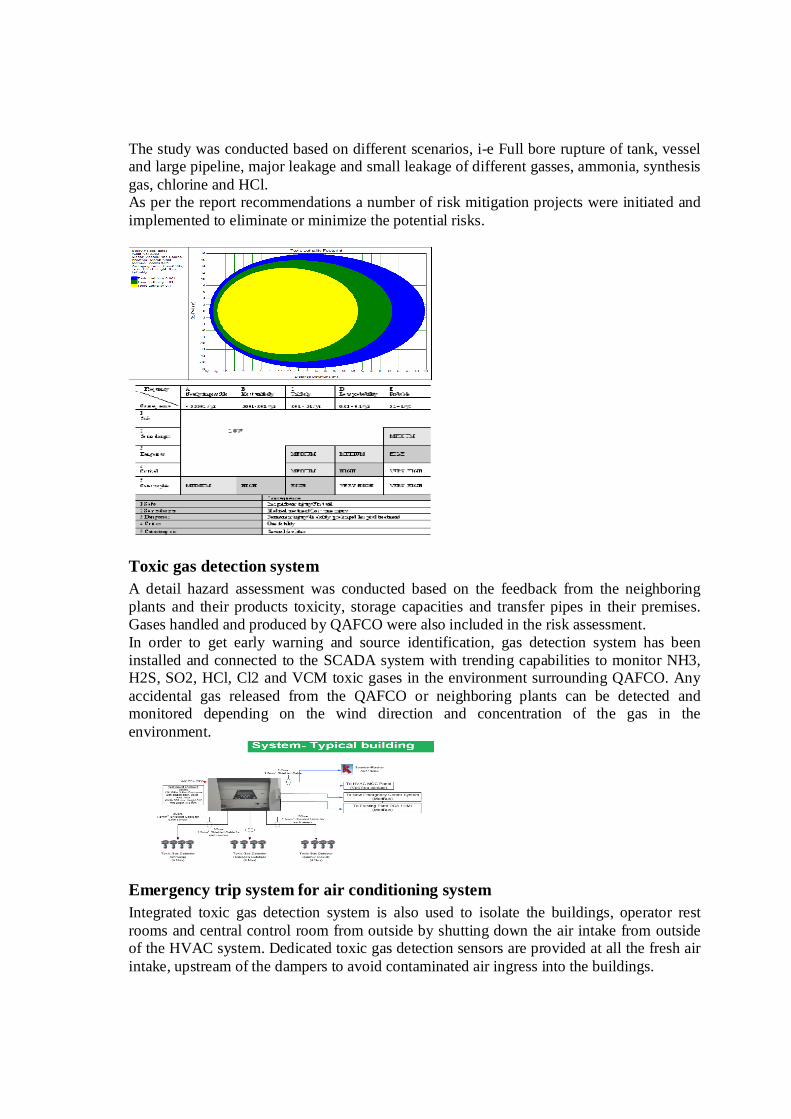
The study was conducted based on different scenarios, i-e Full bore rupture of tank, vessel and large pipeline, major leakage and small leakage of different gasses, ammonia, synthesis gas, chlorine and HCl. As per the report recommendations a number of risk mitigation projects were initiated and implemented to eliminate or minimize the potential risks.
Toxic gas detection system A detail hazard assessment was conducted based on the feedback from the neighboring plants and their products toxicity, storage capacities and transfer pipes in their premises. Gases handled and produced by QAFCO were also included in the risk assessment. In order to get early warning and source identification, gas detection system has been installed and connected to the SCADA system with trending capabilities to monitor NH3, H2S, SO2, HCl, Cl2 and VCM toxic gases in the environment surrounding QAFCO. Any accidental gas released from the QAFCO or neighboring plants can be detected and monitored depending on the wind direction and concentration of the gas in the environment.
Emergency trip system for air conditioning system Integrated toxic gas detection system is also used to isolate the buildings, operator rest rooms and central control room from outside by shutting down the air intake from outside of the HVAC system. Dedicated toxic gas detection sensors are provided at all the fresh air intake, upstream of the dampers to avoid contaminated air ingress into the buildings.
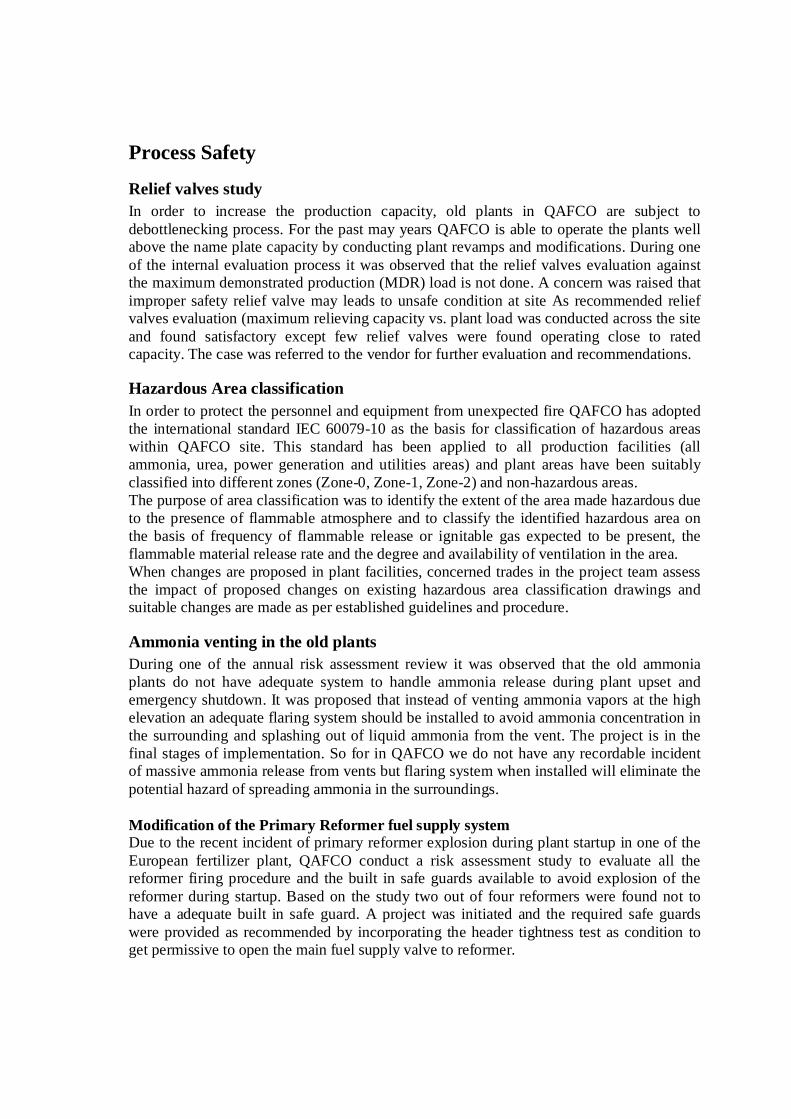
Process Safety
Relief valves study In order to increase the production capacity, old plants in QAFCO are subject to debottlenecking process. For the past may years QAFCO is able to operate the plants well above the name plate capacity by conducting plant revamps and modifications. During one of the internal evaluation process it was observed that the relief valves evaluation against the maximum demonstrated production (MDR) load is not done. A concern was raised that improper safety relief valve may leads to unsafe condition at site As recommended relief valves evaluation (maximum relieving capacity vs. plant load was conducted across the site and found satisfactory except few relief valves were found operating close to rated capacity. The case was referred to the vendor for further evaluation and recommendations.
Hazardous Area classification In order to protect the personnel and equipment from unexpected fire QAFCO has adopted the international standard IEC 60079-10 as the basis for classification of hazardous areas within QAFCO site. This standard has been applied to all production facilities (all ammonia, urea, power generation and utilities areas) and plant areas have been suitably classified into different zones (Zone-0, Zone-1, Zone-2) and non-hazardous areas. The purpose of area classification was to identify the extent of the area made hazardous due to the presence of flammable atmosphere and to classify the identified hazardous area on the basis of frequency of flammable release or ignitable gas expected to be present, the flammable material release rate and the degree and availability of ventilation in the area. When changes are proposed in plant facilities, concerned trades in the project team assess the impact of proposed changes on existing hazardous area classification drawings and suitable changes are made as per established guidelines and procedure.
Ammonia venting in the old plants During one of the annual risk assessment review it was observed that the old ammonia plants do not have adequate system to handle ammonia release during plant upset and emergency shutdown. It was proposed that instead of venting ammonia vapors at the high elevation an adequate flaring system should be installed to avoid ammonia concentration in the surrounding and splashing out of liquid ammonia from the vent. The project is in the final stages of implementation. So for in QAFCO we do not have any recordable incident of massive ammonia release from vents but flaring system when installed will eliminate the potential hazard of spreading ammonia in the surroundings. Modification of the Primary Reformer fuel supply system Due to the recent incident of primary reformer explosion during plant startup in one of the European fertilizer plant, QAFCO conduct a risk assessment study to evaluate all the reformer firing procedure and the built in safe guards available to avoid explosion of the reformer during startup. Based on the study two out of four reformers were found not to have a adequate built in safe guard. A project was initiated and the required safe guards were provided as recommended by incorporating the header tightness test as condition to get permissive to open the main fuel supply valve to reformer.
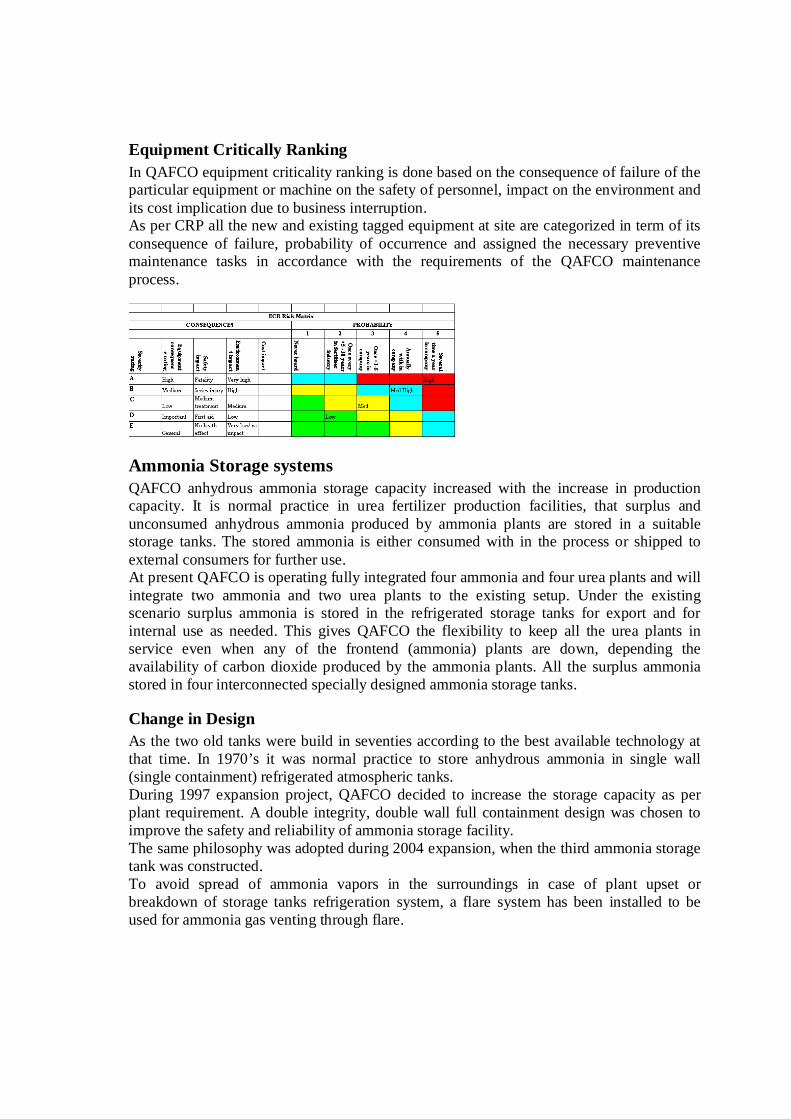
Equipment Critically Ranking In QAFCO equipment criticality ranking is done based on the consequence of failure of the particular equipment or machine on the safety of personnel, impact on the environment and its cost implication due to business interruption. As per CRP all the new and existing tagged equipment at site are categorized in term of its consequence of failure, probability of occurrence and assigned the necessary preventive maintenance tasks in accordance with the requirements of the QAFCO maintenance process.
Ammonia Storage systems QAFCO anhydrous ammonia storage capacity increased with the increase in production capacity. It is normal practice in urea fertilizer production facilities, that surplus and unconsumed anhydrous ammonia produced by ammonia plants are stored in a suitable storage tanks. The stored ammonia is either consumed with in the process or shipped to external consumers for further use. At present QAFCO is operating fully integrated four ammonia and four urea plants and will integrate two ammonia and two urea plants to the existing setup. Under the existing scenario surplus ammonia is stored in the refrigerated storage tanks for export and for internal use as needed. This gives QAFCO the flexibility to keep all the urea plants in service even when any of the frontend (ammonia) plants are down, depending the availability of carbon dioxide produced by the ammonia plants. All the surplus ammonia stored in four interconnected specially designed ammonia storage tanks.
Change in Design As the two old tanks were build in seventies according to the best available technology at that time. In 1970’s it was normal practice to store anhydrous ammonia in single wall (single containment) refrigerated atmospheric tanks. During 1997 expansion project, QAFCO decided to increase the storage capacity as per plant requirement. A double integrity, double wall full containment design was chosen to improve the safety and reliability of ammonia storage facility. The same philosophy was adopted during 2004 expansion, when the third ammonia storage tank was constructed. To avoid spread of ammonia vapors in the surroundings in case of plant upset or breakdown of storage tanks refrigeration system, a flare system has been installed to be used for ammonia gas venting through flare.
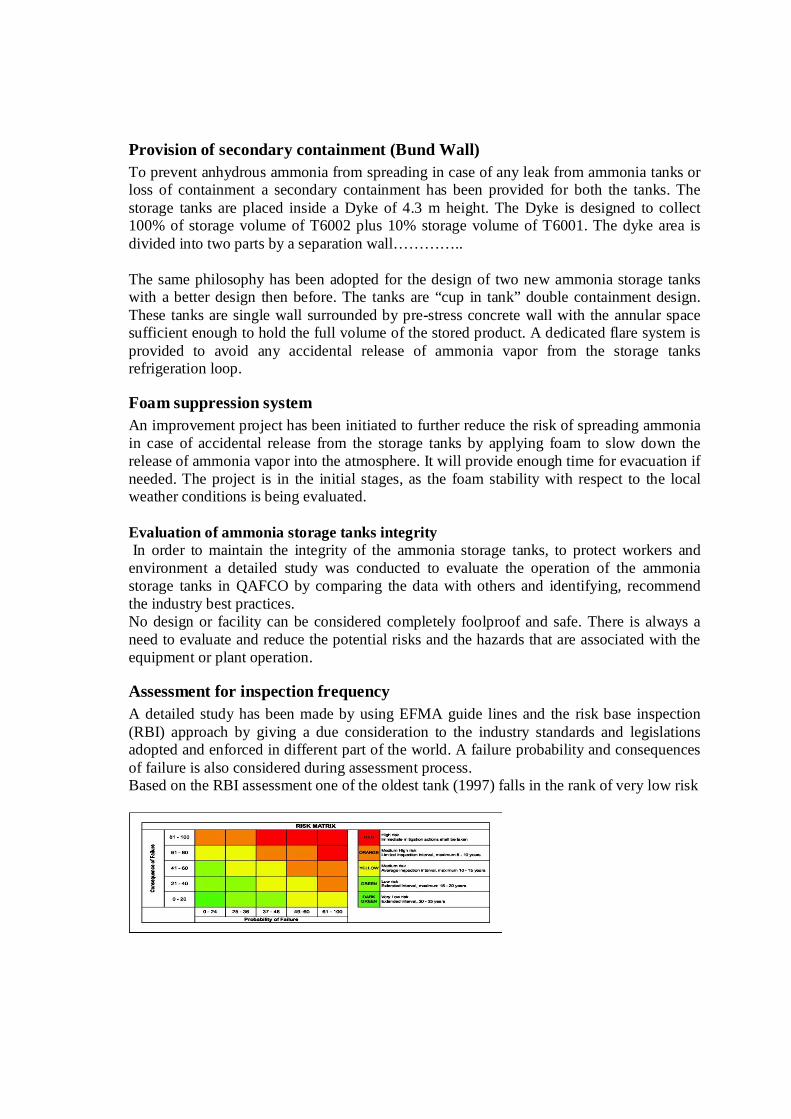
Provision of secondary containment (Bund Wall) To prevent anhydrous ammonia from spreading in case of any leak from ammonia tanks or loss of containment a secondary containment has been provided for both the tanks. The storage tanks are placed inside a Dyke of 4.3 m height. The Dyke is designed to collect 100% of storage volume of T6002 plus 10% storage volume of T6001. The dyke area is divided into two parts by a separation wall………….. The same philosophy has been adopted for the design of two new ammonia storage tanks with a better design then before. The tanks are “cup in tank” double containment design. These tanks are single wall surrounded by pre-stress concrete wall with the annular space sufficient enough to hold the full volume of the stored product. A dedicated flare system is provided to avoid any accidental release of ammonia vapor from the storage tanks refrigeration loop.
Foam suppression system An improvement project has been initiated to further reduce the risk of spreading ammonia in case of accidental release from the storage tanks by applying foam to slow down the release of ammonia vapor into the atmosphere. It will provide enough time for evacuation if needed. The project is in the initial stages, as the foam stability with respect to the local weather conditions is being evaluated. Evaluation of ammonia storage tanks integrity In order to maintain the integrity of the ammonia storage tanks, to protect workers and environment a detailed study was conducted to evaluate the operation of the ammonia storage tanks in QAFCO by comparing the data with others and identifying, recommend the industry best practices. No design or facility can be considered completely foolproof and safe. There is always a need to evaluate and reduce the potential risks and the hazards that are associated with the equipment or plant operation.
Assessment for inspection frequency A detailed study has been made by using EFMA guide lines and the risk base inspection (RBI) approach by giving a due consideration to the industry standards and legislations adopted and enforced in different part of the world. A failure probability and consequences of failure is also considered during assessment process. Based on the RBI assessment one of the oldest tank (1997) falls in the rank of very low risk
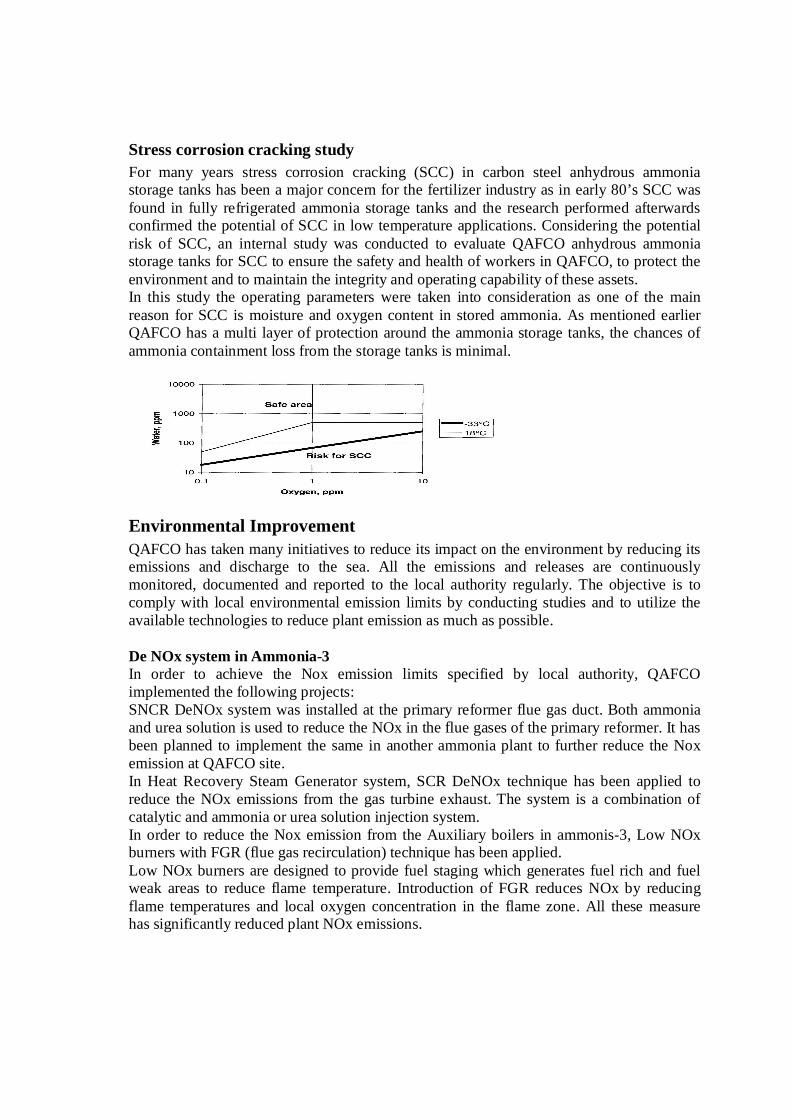
Stress corrosion cracking study For many years stress corrosion cracking (SCC) in carbon steel anhydrous ammonia storage tanks has been a major concern for the fertilizer industry as in early 80’s SCC was found in fully refrigerated ammonia storage tanks and the research performed afterwards confirmed the potential of SCC in low temperature applications. Considering the potential risk of SCC, an internal study was conducted to evaluate QAFCO anhydrous ammonia storage tanks for SCC to ensure the safety and health of workers in QAFCO, to protect the environment and to maintain the integrity and operating capability of these assets. In this study the operating parameters were taken into consideration as one of the main reason for SCC is moisture and oxygen content in stored ammonia. As mentioned earlier QAFCO has a multi layer of protection around the ammonia storage tanks, the chances of ammonia containment loss from the storage tanks is minimal.
Environmental Improvement QAFCO has taken many initiatives to reduce its impact on the environment by reducing its emissions and discharge to the sea. All the emissions and releases are continuously monitored, documented and reported to the local authority regularly. The objective is to comply with local environmental emission limits by conducting studies and to utilize the available technologies to reduce plant emission as much as possible. De NOx system in Ammonia-3 In order to achieve the Nox emission limits specified by local authority, QAFCO implemented the following projects: SNCR DeNOx system was installed at the primary reformer flue gas duct. Both ammonia and urea solution is used to reduce the NOx in the flue gases of the primary reformer. It has been planned to implement the same in another ammonia plant to further reduce the Nox emission at QAFCO site. In Heat Recovery Steam Generator system, SCR DeNOx technique has been applied to reduce the NOx emissions from the gas turbine exhaust. The system is a combination of catalytic and ammonia or urea solution injection system. In order to reduce the Nox emission from the Auxiliary boilers in ammonis-3, Low NOx burners with FGR (flue gas recirculation) technique has been applied. Low NOx burners are designed to provide fuel staging which generates fuel rich and fuel weak areas to reduce flame temperature. Introduction of FGR reduces NOx by reducing flame temperatures and local oxygen concentration in the flame zone. All these measure has significantly reduced plant NOx emissions.
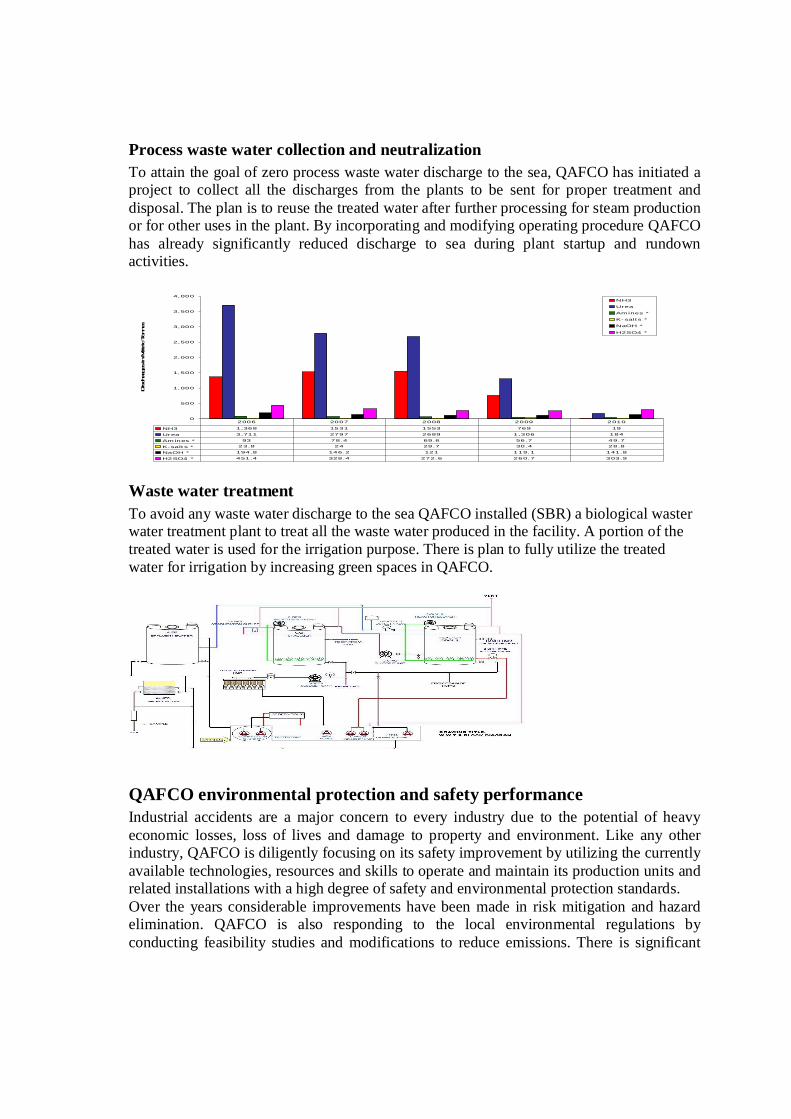
Process waste water collection and neutralization To attain the goal of zero process waste water discharge to the sea, QAFCO has initiated a project to collect all the discharges from the plants to be sent for proper treatment and disposal. The plan is to reuse the treated water after further processing for steam production or for other uses in the plant. By incorporating and modifying operating procedure QAFCO has already significantly reduced discharge to sea during plant startup and rundown activities.
0
500
1,000
1,500
2,000
2,500
3,000
3,500
4,000
Discharges in Metric Tonnes
NH3
Urea
Amines *
K-salts *
NaOH *
H2SO4 *
NH3 1,368 1531 1553 769 19
Urea 3,711 2797 2689 1,306 184
Amines * 93 78.4 69.6 56.7 49.7
K-salts * 23.8 24 29.7 30.4 28.8
NaOH * 194.8 146.2 121 119.1 141.8
H2SO4 * 451.4 328.4 272.6 260.7 303.9
2006 2007 2008 2009 2010
Waste water treatment To avoid any waste water discharge to the sea QAFCO installed (SBR) a biological waster water treatment plant to treat all the waste water produced in the facility. A portion of the treated water is used for the irrigation purpose. There is plan to fully utilize the treated water for irrigation by increasing green spaces in QAFCO.
QAFCO environmental protection and safety performance Industrial accidents are a major concern to every industry due to the potential of heavy economic losses, loss of lives and damage to property and environment. Like any other industry, QAFCO is diligently focusing on its safety improvement by utilizing the currently available technologies, resources and skills to operate and maintain its production units and related installations with a high degree of safety and environmental protection standards. Over the years considerable improvements have been made in risk mitigation and hazard elimination. QAFCO is also responding to the local environmental regulations by conducting feasibility studies and modifications to reduce emissions. There is significant
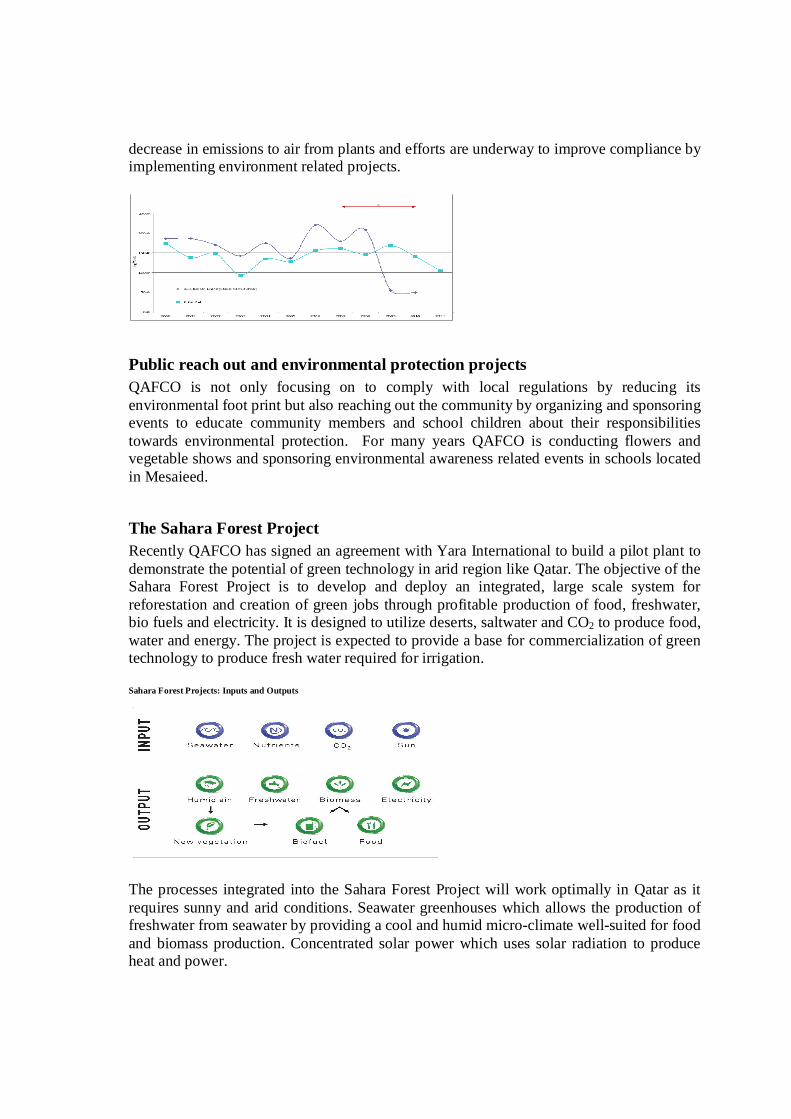
decrease in emissions to air from plants and efforts are underway to improve compliance by implementing environment related projects.
Public reach out and environmental protection projects QAFCO is not only focusing on to comply with local regulations by reducing its environmental foot print but also reaching out the community by organizing and sponsoring events to educate community members and school children about their responsibilities towards environmental protection. For many years QAFCO is conducting flowers and vegetable shows and sponsoring environmental awareness related events in schools located in Mesaieed.
The Sahara Forest Project Recently QAFCO has signed an agreement with Yara International to build a pilot plant to demonstrate the potential of green technology in arid region like Qatar. The objective of the Sahara Forest Project is to develop and deploy an integrated, large scale system for reforestation and creation of green jobs through profitable production of food, freshwater, bio fuels and electricity. It is designed to utilize deserts, saltwater and CO2 to produce food, water and energy. The project is expected to provide a base for commercialization of green technology to produce fresh water required for irrigation. Sahara Forest Projects: Inputs and Outputs
The processes integrated into the Sahara Forest Project will work optimally in Qatar as it requires sunny and arid conditions. Seawater greenhouses which allows the production of freshwater from seawater by providing a cool and humid micro-climate well-suited for food and biomass production. Concentrated solar power which uses solar radiation to produce heat and power.
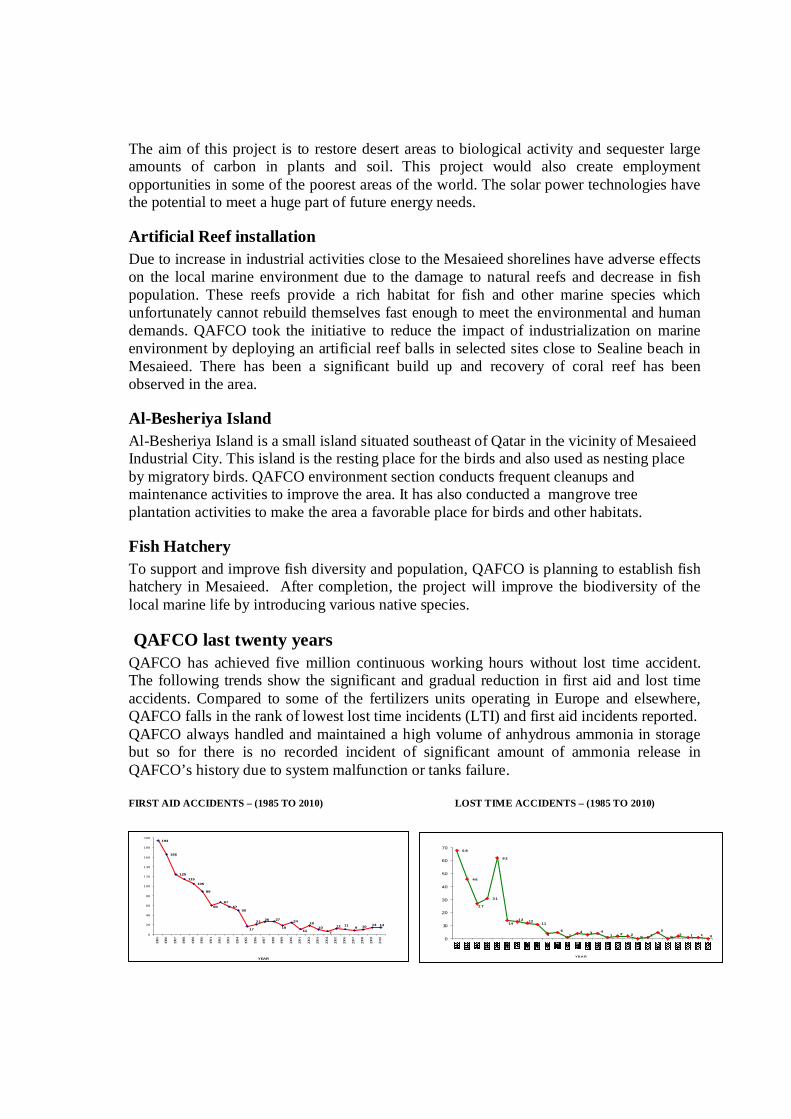
The aim of this project is to restore desert areas to biological activity and sequester large amounts of carbon in plants and soil. This project would also create employment opportunities in some of the poorest areas of the world. The solar power technologies have the potential to meet a huge part of future energy needs.
Artificial Reef installation Due to increase in industrial activities close to the Mesaieed shorelines have adverse effects on the local marine environment due to the damage to natural reefs and decrease in fish population. These reefs provide a rich habitat for fish and other marine species which unfortunately cannot rebuild themselves fast enough to meet the environmental and human demands. QAFCO took the initiative to reduce the impact of industrialization on marine environment by deploying an artificial reef balls in selected sites close to Sealine beach in Mesaieed. There has been a significant build up and recovery of coral reef has been observed in the area.
Al-Besheriya Island Al-Besheriya Island is a small island situated southeast of Qatar in the vicinity of Mesaieed Industrial City. This island is the resting place for the birds and also used as nesting place by migratory birds. QAFCO environment section conducts frequent cleanups and maintenance activities to improve the area. It has also conducted a mangrove tree plantation activities to make the area a favorable place for birds and other habitats.
Fish Hatchery To support and improve fish diversity and population, QAFCO is planning to establish fish hatchery in Mesaieed. After completion, the project will improve the biodiversity of the local marine life by introducing various native species.
QAFCO last twenty years QAFCO has achieved five million continuous working hours without lost time accident. The following trends show the significant and gradual reduction in first aid and lost time accidents. Compared to some of the fertilizers units operating in Europe and elsewhere, QAFCO falls in the rank of lowest lost time incidents (LTI) and first aid incidents reported. QAFCO always handled and maintained a high volume of anhydrous ammonia in storage but so for there is no recorded incident of significant amount of ammonia release in QAFCO’s history due to system malfunction or tanks failure. FIRST AID ACCIDENTS – (1985 TO 2010) LOST TIME ACCIDENTS – (1985 TO 2010) LOST TIME ACCIDENTS – (1985 TO 2010)
194
166
125115
105
89
6757
50
14141091112
710
18
11
24
18
272621
17
60
0
20
40
60
80
100
120
140
160
180
200
1985
1986
1987
1988
1989
1990
1991
1992
1993
1994
1995
1996
1997
1998
1999
2000
2001
2002
2003
2004
2005
2006
2007
2008
2009
2010
YEAR
6 8
46
31
62
2 1 1 0
5
010221
4341
54
111213
14
2 7
0
10
20
30
40
50
60
70
Y E A R

Summary QAFCO believe that by placing a right safety enabling system, supported by the organization management can create a truly safe working environment, where safety is every one responsibility and where employees at all levels are actively engaged in identifying the hazards to be eliminated and controlled. By creating a safety culture and providing the required resources will keep the working interface safe for workers. As a Responsible Care certified company, QAFCO is committed to environmental, health, safety and security excellence in all our business activities. QAFCO does this voluntarily, and we consider this commitment as a core value of our business. Our commitment to excellence in environmental, health, safety and security performance is a continual improvement process. QAFCO is committed to support social and environmental related activities and projects and will continue to work towards sustainability by further reducing its environmental footprint and maintain its good safety record.

1. How Automation Improves Operational Efficiency of Nitrogen‐based Fertilizer Plants
Brendan Sheehan, Chemical Marketing Manager. Honeywell Process Solutions, Turkey
2. Energy Conservation Study for Ammonia Urea Complex
Anthony Conning – Business Unit Manager,ABB, UKMagdy Mohamed Ali ‐ Senior Process Engineer ‐ Projects Division, FERTIL – UAE
3. Catalysing profit margin with LK‐853 FENCE™ : A new generation of Topsøe low methanol LTS catalyst
Kristina Svennerberg, General Manager, Marketing Synthesis, Haldor Topsøe, Denmark
4. Elimination of radioactive sources in Ruwais Fertilizer Industries Co.
Ahmed Al‐Awadhi – Sr. Instrument Engineer, FERTIL, UAE
Howof N
May 2
w AutoNitroge
012
omationen-base
H
Ch
n Improed Ferti
Brend
Honeywell
hemicalsM
oves Opilizer Pl
danSheeha
ProcessSo
MarketingM
perationlants
an
olutions
Manager
nal Efficiency
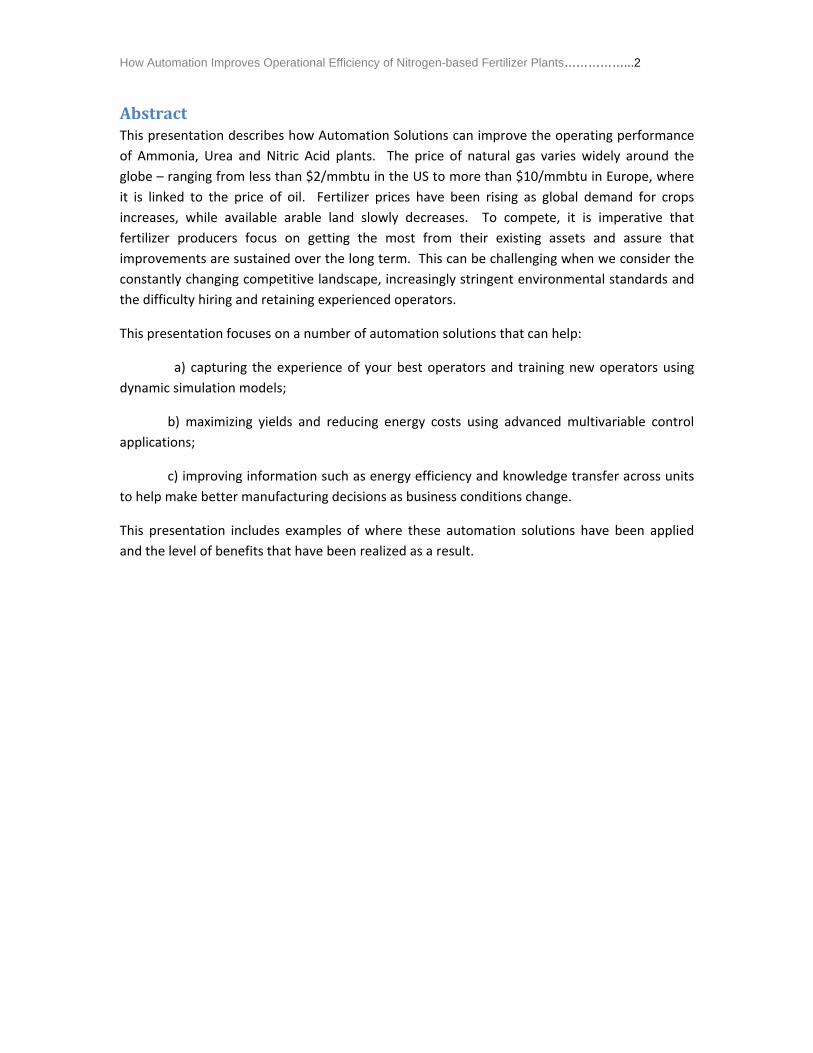
How Automation Improves Operational Efficiency of Nitrogen-based Fertilizer Plants……………...2
AbstractThis presentation describes how Automation Solutions can improve the operating performance
of Ammonia, Urea and Nitric Acid plants. The price of natural gas varies widely around the
globe – ranging from less than $2/mmbtu in the US to more than $10/mmbtu in Europe, where
it is linked to the price of oil. Fertilizer prices have been rising as global demand for crops
increases, while available arable land slowly decreases. To compete, it is imperative that
fertilizer producers focus on getting the most from their existing assets and assure that
improvements are sustained over the long term. This can be challenging when we consider the
constantly changing competitive landscape, increasingly stringent environmental standards and
the difficulty hiring and retaining experienced operators.
This presentation focuses on a number of automation solutions that can help:
a) capturing the experience of your best operators and training new operators using
dynamic simulation models;
b) maximizing yields and reducing energy costs using advanced multivariable control
applications;
c) improving information such as energy efficiency and knowledge transfer across units
to help make better manufacturing decisions as business conditions change.
This presentation includes examples of where these automation solutions have been applied
and the level of benefits that have been realized as a result.
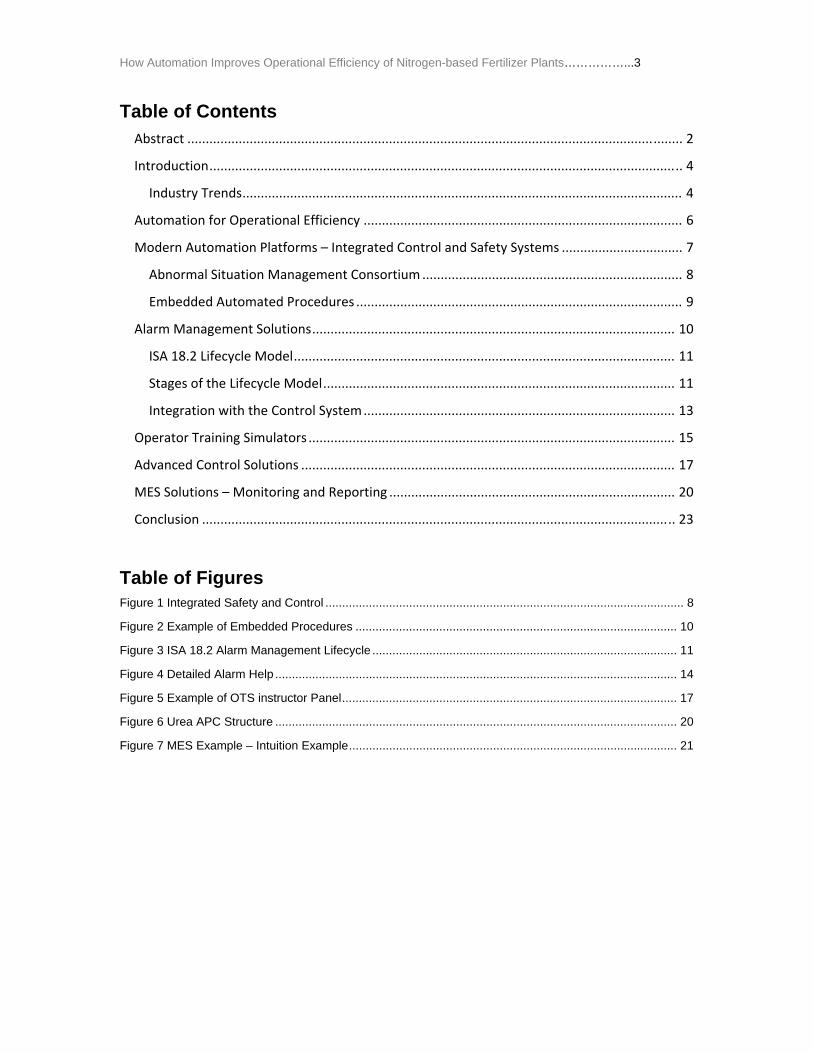
How Automation Improves Operational Efficiency of Nitrogen-based Fertilizer Plants……………...3
Table of Contents
Abstract ....................................................................................................................................... 2
Introduction ................................................................................................................................. 4
Industry Trends ........................................................................................................................ 4
Automation for Operational Efficiency ....................................................................................... 6
Modern Automation Platforms – Integrated Control and Safety Systems ................................. 7
Abnormal Situation Management Consortium ....................................................................... 8
Embedded Automated Procedures ......................................................................................... 9
Alarm Management Solutions ................................................................................................... 10
ISA 18.2 Lifecycle Model ........................................................................................................ 11
Stages of the Lifecycle Model ................................................................................................ 11
Integration with the Control System ..................................................................................... 13
Operator Training Simulators .................................................................................................... 15
Advanced Control Solutions ...................................................................................................... 17
MES Solutions – Monitoring and Reporting .............................................................................. 20
Conclusion ................................................................................................................................. 23
Table of Figures Figure 1 Integrated Safety and Control ........................................................................................................... 8
Figure 2 Example of Embedded Procedures ................................................................................................ 10
Figure 3 ISA 18.2 Alarm Management Lifecycle ........................................................................................... 11
Figure 4 Detailed Alarm Help ........................................................................................................................ 14
Figure 5 Example of OTS instructor Panel .................................................................................................... 17
Figure 6 Urea APC Structure ........................................................................................................................ 20
Figure 7 MES Example – Intuition Example .................................................................................................. 21

How Automation Improves Operational Efficiency of Nitrogen-based Fertilizer Plants……………...4
IntroductionAs many people are aware, the fertilizer industry and in particular the price of nitrogen‐based
fertilizers have had a very good run in recent years –climbing rapidly before the global financial
crisis, falling pretty hard right after before recovering strongly over the past few years.
Much of this is due to higher crop prices ‐ particularly corn prices here in the US – which have
encouraged farmers to use more fertilizer.
At the same time, the production cost of ammonia and urea is closely linked to the cost of
natural gas. So in a scenario of increasing ammonia prices driven by higher crop prices, the
regions with consistently low natural gas prices are positioned to make excellent margins. The
Middle East, Russia and Trinidad are regions with abundant natural gas resources and have
enjoyed solid profits producing and exporting nitrogen‐based fertilizers to Europe and the
Americas. More recently, the US has joined the low‐cost natural gas regions due to the recent
rise in production of shale and tight gas. This is particularly advantageous for the US which has
been a major importer; as local production can now compete with imports from Eastern
Europe,the ME and elsewhere.
However, it should be noted that not all regions are experiencing low natural gas prices. In the
US, natural gas prices are decoupled from the price of oil and hence while oil prices have been
between $90‐100/bbl, natural gas prices have fallen as low as $2/mmbtu. In Europe, however,
natural gas prices are tied to oil prices with prices closer to $10/mmbtu.
Regions with low natural gas prices are now enjoying very good margins on fertilizer production,
but fertilizer prices recently have been so high that even with high natural gas prices in Europe,
good margins are possible. For the ME, export markets remain strong as transportation costs
are not so high that they damage overall margins.
Fertilizer demand tends to rise at a rate somewhat close to global GDP rates and is expected to
increase at around 2.3%/year un l 2019 which is a little below GDP rates. Of the total, about
three‐quarters of demand will come from China, ME, Africa, South America and India.
At the same time, capacity will increase faster than demand, growing almost 50 million
tonnes/year by 2019 – with most of this increase in China, ME and Africa.
With capacity growth outpacing demand growth over the next few years, one could expect
utilization rates to fall while some less efficient plants shut down. This means fertilizer
producers need to maintain their competitive position in the face of continuing challenges from
the market, the environment and changing demographics.
IndustryTrendsThe fertilizer industry shows similar trends to those found across a range of process
manufacturing industries. These can be broadly divided into four categories ‐ safety, reliability,
efficiency and sustainability.

How Automation Improves Operational Efficiency of Nitrogen-based Fertilizer Plants……………...5
SafetyAt the top of the list is the increased attention to safety and process security. Plant managers
consider safety their highest priority because safety‐related incidents can injure personnel,
damage equipment, harm the environment and interrupt production.
To mitigate these risks, it is important to consider safety from all aspects of a plant’s operation.
Plant safety today requires a comprehensive approach, including managing operator
effectiveness, the constant monitoring of distress indicators, personnel tracking and mustering
applications and ongoing asset monitoring and maintenance.
Ideally, a safety system should incorporate multiple layers of protection that can first help avoid
the incident, then, if that fails help mitigate the impact and in the final event help protect
people and assets.
Besides the inherent risk associated with operating fertilizer facilities, in today’s challenging
times, many have been identified as potential targets for terrorist activity. Security has always
been an issue for the fertilizer industry given that nitrates, for example, are commonly used in
explosives. It is necessary to anticipate and respond to threats both against the physical plant
and the process control network. In terms of physical security, this means being able to monitor
the plant perimeter and all access points, including waterways – and be able to respond quickly
to an intrusion. It means knowing where everyone is, including any visitors, at any time, and
being able to quickly get them to a mustering point in the event of an emergency.
ReliabilityIn mature regions like the US and Western Europe, companies are facing the loss of experienced
people, while in developing regions like China, India and the Former Soviet Union, experienced
staff may be hard to find. In all regions this makes it more difficult to achieve consistent,
reliable, safe production. As a result, it is critical to capture best practices that provide a
foundation for future operations. Moreover, making sure operators are well trained and know
how to react during upsets or abnormal situations is imperative in improving the reliability of
the plant.
As plants become more integrated in terms of heat and material balances, an upset in one area
can quickly spill over to others. Therefore, consistent execution of infrequent tasks such as a
compressor start‐up is vital to maintaining operational excellence.
To maximize profitability in a competitive environment, it is necessary to maximize and maintain
process and equipment availability. However, it is impossible to implement a quickly changing
production plan if the changes in production rate in the reformer result in an upset in the syngas
quality to the converter. Plant personnel must know how hard they can push the unit without
compromising the integrity of key pieces of equipment and be able to plan for equipment
turnarounds as needed. This requires a tight connection between process data and equipment
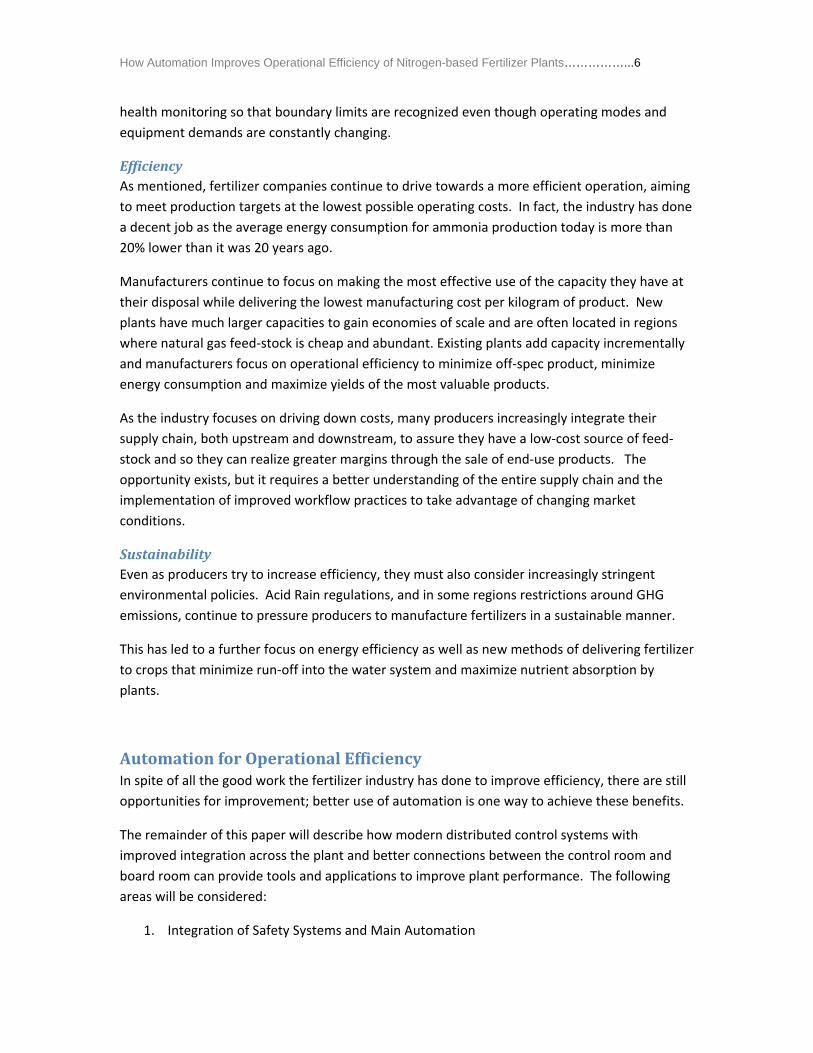
How Automation Improves Operational Efficiency of Nitrogen-based Fertilizer Plants……………...6
health monitoring so that boundary limits are recognized even though operating modes and
equipment demands are constantly changing.
EfficiencyAs mentioned, fertilizer companies continue to drive towards a more efficient operation, aiming
to meet production targets at the lowest possible operating costs. In fact, the industry has done
a decent job as the average energy consumption for ammonia production today is more than
20% lower than it was 20 years ago.
Manufacturers continue to focus on making the most effective use of the capacity they have at
their disposal while delivering the lowest manufacturing cost per kilogram of product. New
plants have much larger capacities to gain economies of scale and are often located in regions
where natural gas feed‐stock is cheap and abundant. Existing plants add capacity incrementally
and manufacturers focus on operational efficiency to minimize off‐spec product, minimize
energy consumption and maximize yields of the most valuable products.
As the industry focuses on driving down costs, many producers increasingly integrate their
supply chain, both upstream and downstream, to assure they have a low‐cost source of feed‐
stock and so they can realize greater margins through the sale of end‐use products. The
opportunity exists, but it requires a better understanding of the entire supply chain and the
implementation of improved workflow practices to take advantage of changing market
conditions.
SustainabilityEven as producers try to increase efficiency, they must also consider increasingly stringent
environmental policies. Acid Rain regulations, and in some regions restrictions around GHG
emissions, continue to pressure producers to manufacture fertilizers in a sustainable manner.
This has led to a further focus on energy efficiency as well as new methods of delivering fertilizer
to crops that minimize run‐off into the water system and maximize nutrient absorption by
plants.
AutomationforOperationalEfficiencyIn spite of all the good work the fertilizer industry has done to improve efficiency, there are still
opportunities for improvement; better use of automation is one way to achieve these benefits.
The remainder of this paper will describe how modern distributed control systems with
improved integration across the plant and better connections between the control room and
board room can provide tools and applications to improve plant performance. The following
areas will be considered:
1. Integration of Safety Systems and Main Automation
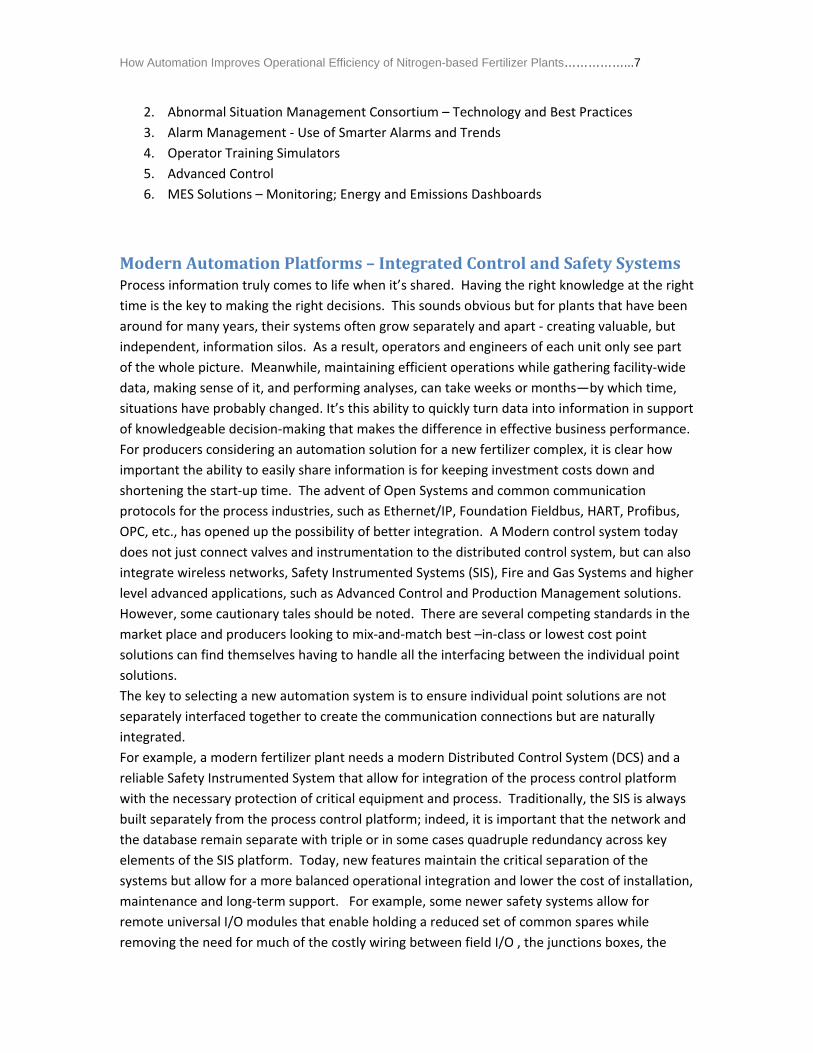
How Automation Improves Operational Efficiency of Nitrogen-based Fertilizer Plants……………...7
2. Abnormal Situation Management Consortium – Technology and Best Practices
3. Alarm Management ‐ Use of Smarter Alarms and Trends
4. Operator Training Simulators
5. Advanced Control
6. MES Solutions – Monitoring; Energy and Emissions Dashboards
ModernAutomationPlatforms–IntegratedControlandSafetySystemsProcess information truly comes to life when it’s shared. Having the right knowledge at the right
time is the key to making the right decisions. This sounds obvious but for plants that have been
around for many years, their systems often grow separately and apart ‐ creating valuable, but
independent, information silos. As a result, operators and engineers of each unit only see part
of the whole picture. Meanwhile, maintaining efficient operations while gathering facility‐wide
data, making sense of it, and performing analyses, can take weeks or months—by which time,
situations have probably changed. It’s this ability to quickly turn data into information in support
of knowledgeable decision‐making that makes the difference in effective business performance.
For producers considering an automation solution for a new fertilizer complex, it is clear how
important the ability to easily share information is for keeping investment costs down and
shortening the start‐up time. The advent of Open Systems and common communication
protocols for the process industries, such as Ethernet/IP, Foundation Fieldbus, HART, Profibus,
OPC, etc., has opened up the possibility of better integration. A Modern control system today
does not just connect valves and instrumentation to the distributed control system, but can also
integrate wireless networks, Safety Instrumented Systems (SIS), Fire and Gas Systems and higher
level advanced applications, such as Advanced Control and Production Management solutions.
However, some cautionary tales should be noted. There are several competing standards in the
market place and producers looking to mix‐and‐match best –in‐class or lowest cost point
solutions can find themselves having to handle all the interfacing between the individual point
solutions.
The key to selecting a new automation system is to ensure individual point solutions are not
separately interfaced together to create the communication connections but are naturally
integrated.
For example, a modern fertilizer plant needs a modern Distributed Control System (DCS) and a
reliable Safety Instrumented System that allow for integration of the process control platform
with the necessary protection of critical equipment and process. Traditionally, the SIS is always
built separately from the process control platform; indeed, it is important that the network and
the database remain separate with triple or in some cases quadruple redundancy across key
elements of the SIS platform. Today, new features maintain the critical separation of the
systems but allow for a more balanced operational integration and lower the cost of installation,
maintenance and long‐term support. For example, some newer safety systems allow for
remote universal I/O modules that enable holding a reduced set of common spares while
removing the need for much of the costly wiring between field I/O , the junctions boxes, the
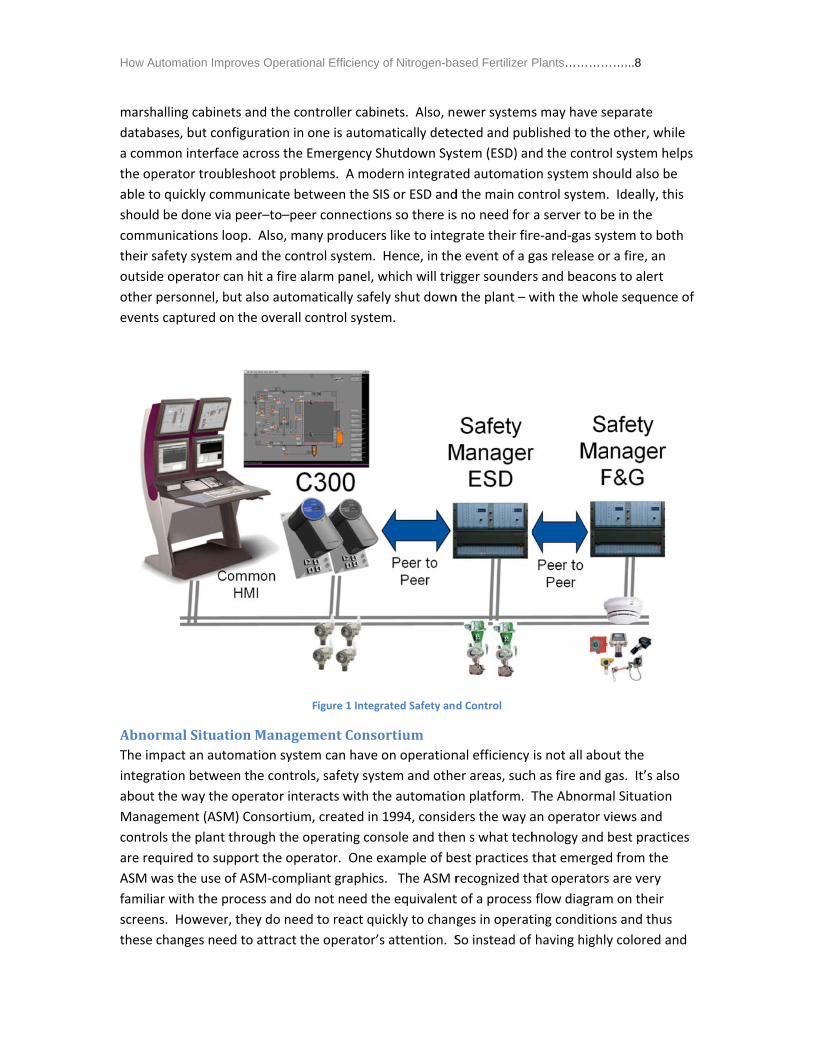
How A
marsh
datab
a com
the op
able t
shoul
comm
their s
outsid
other
event
AbnoThe im
integr
about
Mana
contro
are re
ASM w
famili
scree
these
Automation Imp
halling cabine
bases, but con
mmon interfac
perator troub
to quickly com
d be done via
munications lo
safety system
de operator c
personnel, b
ts captured on
ormalSituatmpact an auto
ration betwee
t the way the
agement (ASM
ols the plant
equired to sup
was the use o
ar with the p
ns. However
changes nee
proves Operatio
ets and the co
nfiguration in
ce across the
bleshoot prob
mmunicate be
a peer–to–pe
oop. Also, ma
m and the con
can hit a fire a
but also autom
n the overall
tionManageomation syste
en the contro
operator inte
M) Consortium
through the o
pport the ope
of ASM‐comp
rocess and do
, they do nee
ed to attract t
onal Efficiency
ontroller cabi
one is autom
Emergency S
blems. A mod
etween the S
er connection
any producer
ntrol system.
alarm panel, w
matically safe
control syste
Figure 1 Integ
ementConsoem can have
ols, safety sys
eracts with th
m, created in
operating con
erator. One e
pliant graphics
o not need th
ed to react qu
the operator’s
of Nitrogen-ba
nets. Also, ne
matically dete
Shutdown Sys
dern integrate
IS or ESD and
ns so there is
rs like to integ
Hence, in the
which will trig
ely shut down
m.
rated Safety and
ortiumon operation
tem and othe
he automatio
1994, consid
nsole and the
example of be
s. The ASM r
he equivalent
uickly to chang
s attention. S
ased Fertilizer P
ewer systems
ected and pub
stem (ESD) an
ed automatio
d the main co
s no need for
grate their fir
e event of a g
gger sounder
n the plant – w
d Control
nal efficiency
er areas, such
on platform. T
ers the way a
en s what tech
est practices t
recognized th
t of a process
ges in operat
So instead of
Plants…………
s may have se
blished to the
nd the contro
on system sho
ntrol system.
a server to be
re‐and‐gas sys
gas release or
s and beacon
with the who
is not all abo
h as fire and g
The Abnorma
an operator v
hnology and b
that emerged
hat operators
flow diagram
ting condition
having highly
……...8
eparate
e other, while
ol system help
ould also be
. Ideally, this
e in the
stem to both
r a fire, an
ns to alert
le sequence o
ut the
gas. It’s also
al Situation
views and
best practices
d from the
s are very
m on their
ns and thus
y colored and
e
ps
of
s
d
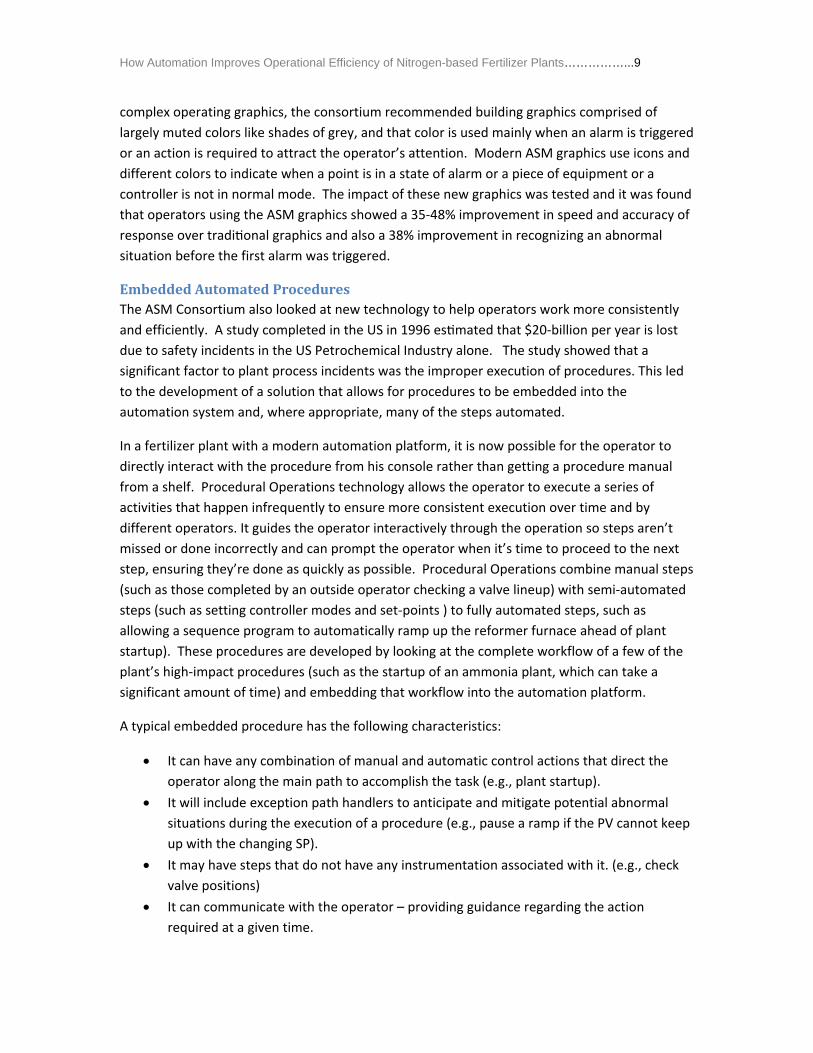
How Automation Improves Operational Efficiency of Nitrogen-based Fertilizer Plants……………...9
complex operating graphics, the consortium recommended building graphics comprised of
largely muted colors like shades of grey, and that color is used mainly when an alarm is triggered
or an action is required to attract the operator’s attention. Modern ASM graphics use icons and
different colors to indicate when a point is in a state of alarm or a piece of equipment or a
controller is not in normal mode. The impact of these new graphics was tested and it was found
that operators using the ASM graphics showed a 35‐48% improvement in speed and accuracy of
response over tradi onal graphics and also a 38% improvement in recognizing an abnormal
situation before the first alarm was triggered.
EmbeddedAutomatedProceduresThe ASM Consortium also looked at new technology to help operators work more consistently
and efficiently. A study completed in the US in 1996 es mated that $20‐billion per year is lost
due to safety incidents in the US Petrochemical Industry alone. The study showed that a
significant factor to plant process incidents was the improper execution of procedures. This led
to the development of a solution that allows for procedures to be embedded into the
automation system and, where appropriate, many of the steps automated.
In a fertilizer plant with a modern automation platform, it is now possible for the operator to
directly interact with the procedure from his console rather than getting a procedure manual
from a shelf. Procedural Operations technology allows the operator to execute a series of
activities that happen infrequently to ensure more consistent execution over time and by
different operators. It guides the operator interactively through the operation so steps aren’t
missed or done incorrectly and can prompt the operator when it’s time to proceed to the next
step, ensuring they’re done as quickly as possible. Procedural Operations combine manual steps
(such as those completed by an outside operator checking a valve lineup) with semi‐automated
steps (such as setting controller modes and set‐points ) to fully automated steps, such as
allowing a sequence program to automatically ramp up the reformer furnace ahead of plant
startup). These procedures are developed by looking at the complete workflow of a few of the
plant’s high‐impact procedures (such as the startup of an ammonia plant, which can take a
significant amount of time) and embedding that workflow into the automation platform.
A typical embedded procedure has the following characteristics:
It can have any combination of manual and automatic control actions that direct the
operator along the main path to accomplish the task (e.g., plant startup).
It will include exception path handlers to anticipate and mitigate potential abnormal
situations during the execution of a procedure (e.g., pause a ramp if the PV cannot keep
up with the changing SP).
It may have steps that do not have any instrumentation associated with it. (e.g., check
valve positions)
It can communicate with the operator – providing guidance regarding the action
required at a given time.
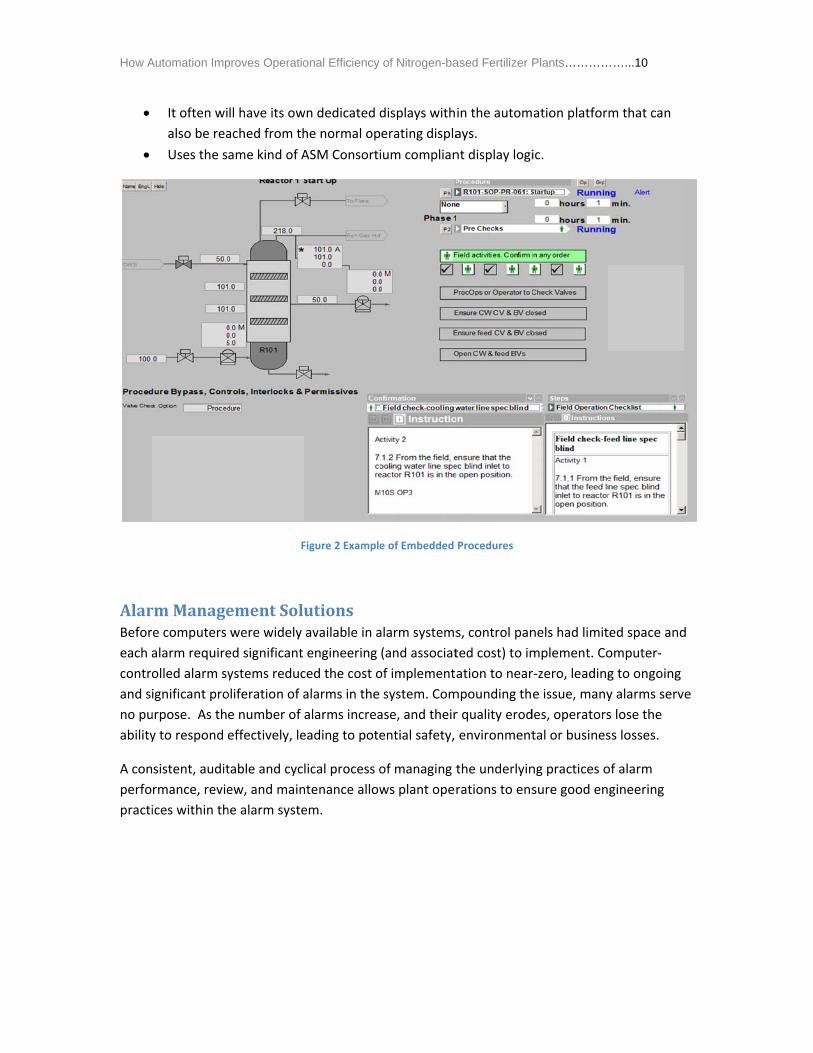
How A
AlarBefor
each a
contro
and s
no pu
ability
A con
perfo
practi
Automation Imp
It often wi
also be rea
Uses the s
rmManagee computers
alarm require
olled alarm sy
ignificant pro
urpose. As th
y to respond e
sistent, audit
rmance, revie
ices within th
proves Operatio
ll have its ow
ached from th
ame kind of A
F
ementSoluwere widely
ed significant
ystems reduc
oliferation of a
e number of
effectively, le
table and cyc
ew, and main
he alarm syste
onal Efficiency
wn dedicated d
he normal op
ASM Consorti
Figure 2 Example
utionsavailable in a
engineering
ced the cost o
alarms in the
alarms increa
eading to pote
lical process o
ntenance allow
em.
of Nitrogen-ba
displays with
erating displa
ium complian
e of Embedded
alarm systems
(and associat
of implementa
system. Com
ase, and their
ential safety,
of managing t
ws plant oper
ased Fertilizer P
in the autom
ays.
nt display logi
Procedures
s, control pan
ted cost) to im
ation to near
mpounding th
r quality erod
environment
the underlyin
rations to ens
Plants…………
ation platfor
ic.
nels had limit
mplement. Co
r‐zero, leading
e issue, many
des, operators
tal or busines
ng practices o
sure good en
……...10
m that can
ted space and
omputer‐
g to ongoing
y alarms serv
s lose the
ss losses.
of alarm
gineering
d
e
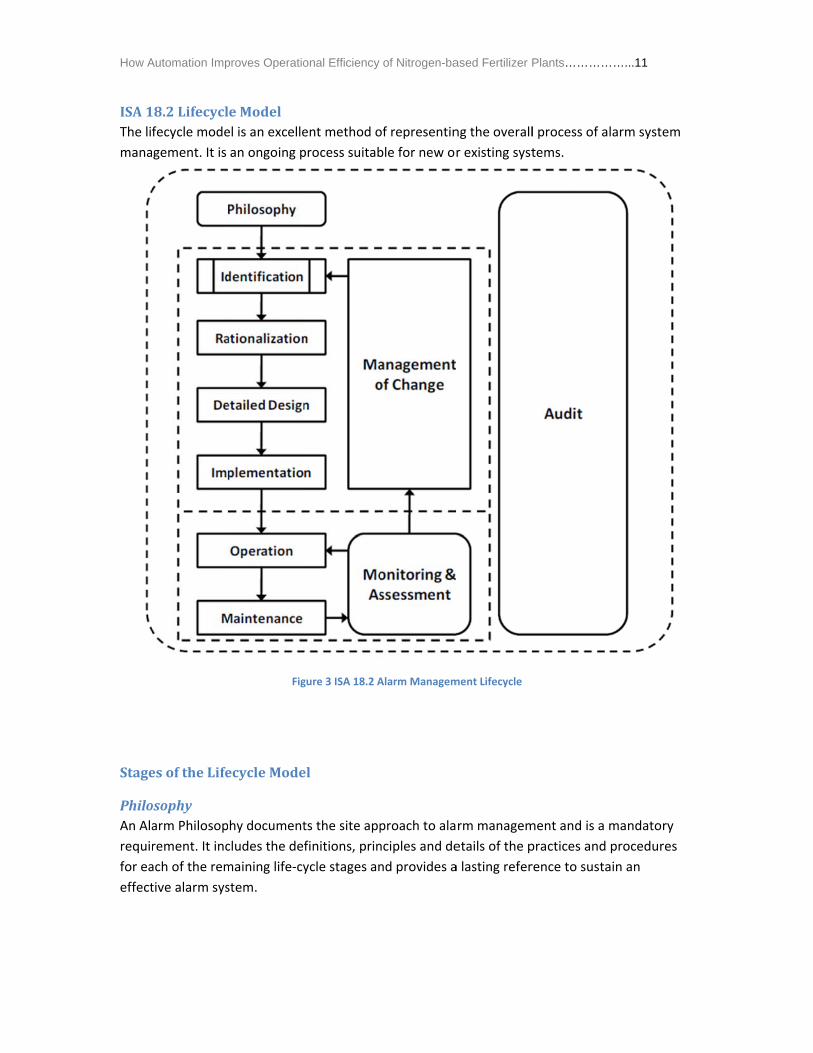
How A
ISA1The li
mana
Stage
PhiloAn Ala
requir
for ea
effect
Automation Imp
18.2Lifecyclfecycle mode
gement. It is
esoftheLife
osophyarm Philosop
rement. It inc
ach of the rem
tive alarm sys
proves Operatio
eModelel is an excelle
an ongoing p
Fig
ecycleMode
hy document
cludes the def
maining life‐cy
stem.
onal Efficiency
ent method o
process suitab
gure 3 ISA 18.2 A
el
ts the site app
finitions, prin
ycle stages an
of Nitrogen-ba
of representin
ble for new or
Alarm Managem
proach to ala
nciples and de
nd provides a
ased Fertilizer P
ng the overall
r existing syst
ment Lifecycle
rm managem
etails of the p
a lasting refer
Plants…………
l process of a
tems.
ment and is a
practices and
rence to susta
……...11
larm system
mandatory
procedures
ain an

How Automation Improves Operational Efficiency of Nitrogen-based Fertilizer Plants……………...12
IdentificationMany methods are available to determine if an alarm is required. They include Process Hazard
Analysis (PHA), incident investigations, HAZOPS/CHAZOPS and alarm design/rationalization
workshops. The outcome of a HAZOP might be requiring an alarm to warn the operator of an
abnormal situation (e.g., high pressure). Typically, a HAZOP exercise does not consider the
following: which tag is the most suitable to alarm, the ideal setting and configuration details, the
potential operator workload, etc.
RationalizationAlarm rationalization is about reconciling each individual alarm with the principles and
requirements of the alarm philosophy. It is important that relevant data for each alarm is
documented to support the other stages of the life cycle. This includes the alarm description,
settings, causes of an alarm, the consequence of no action, the required operator action,
response time, consequence rating, etc. Alarm priority is determined from a matrix of the
consequence severity and response time. This matrix is defined by the alarm philosophy.
DesignThe design phase includes the alarm’s basic DCS/PLC configuration, Human Machine Interface
(HMI) and any advanced methods of alarm management.
Implementation&TrainingThis stage involves other activities required to put the alarm into service. It includes testing
alarm system functions and relevant training for the operator and other personnel.
OperationIn this stage the alarm is in service and reporting abnormal conditions to the operator.
MaintenanceProcess measurement instruments, final control elements and control systems all require
periodic/predictive maintenance to ensure their reliable operation. This is critical to ensure the
alarm system’s ongoing performance.
Monitoring&AssessmentThis stage includes the periodic collection and analysis of data from alarms. Without monitoring
it is virtually impossible to maintain an effective alarm system. Assessments should be done
frequently (daily or weekly) and is the primary method for determining problems such as
nuisance alarms, stale alarms and alarm floods.
ManagementofChangeManagement of change is a critical stage that helps ensure the alarm system’s ongoing integrity.
It needs to be a structured process of approval and authorization for any additions, modification
and deletions of system alarms.
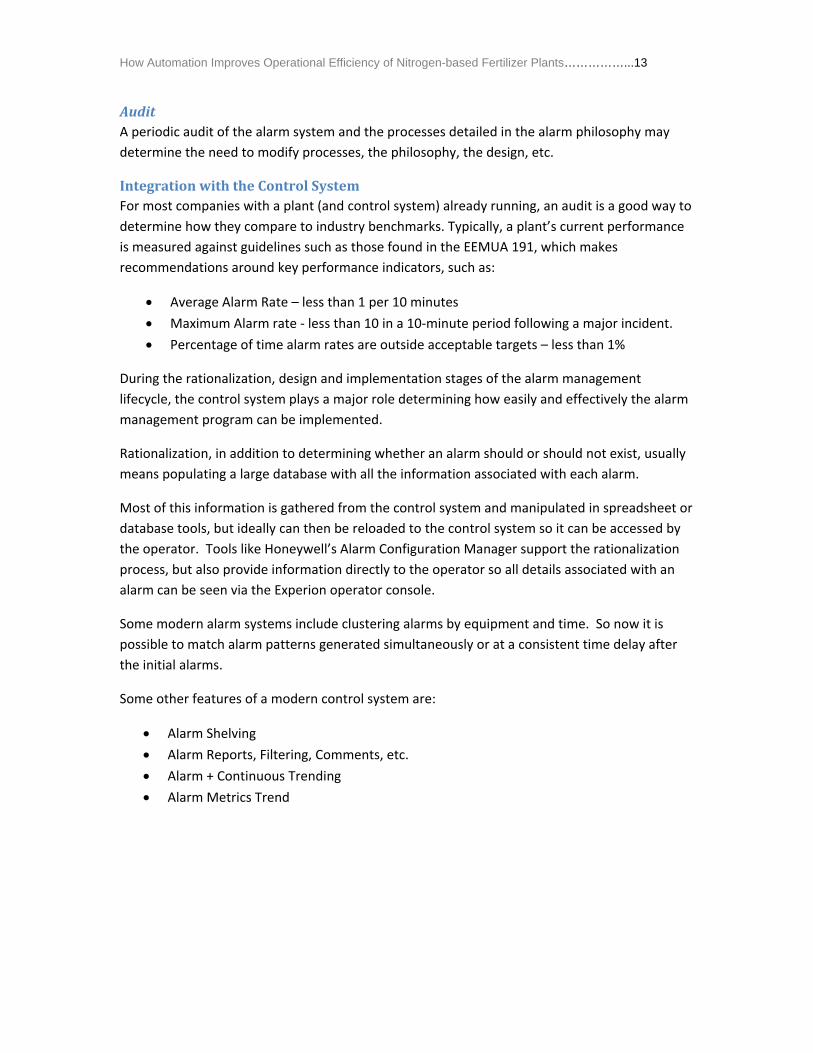
How Automation Improves Operational Efficiency of Nitrogen-based Fertilizer Plants……………...13
AuditA periodic audit of the alarm system and the processes detailed in the alarm philosophy may
determine the need to modify processes, the philosophy, the design, etc.
IntegrationwiththeControlSystemFor most companies with a plant (and control system) already running, an audit is a good way to
determine how they compare to industry benchmarks. Typically, a plant’s current performance
is measured against guidelines such as those found in the EEMUA 191, which makes
recommendations around key performance indicators, such as:
Average Alarm Rate – less than 1 per 10 minutes
Maximum Alarm rate ‐ less than 10 in a 10‐minute period following a major incident.
Percentage of time alarm rates are outside acceptable targets – less than 1%
During the rationalization, design and implementation stages of the alarm management
lifecycle, the control system plays a major role determining how easily and effectively the alarm
management program can be implemented.
Rationalization, in addition to determining whether an alarm should or should not exist, usually
means populating a large database with all the information associated with each alarm.
Most of this information is gathered from the control system and manipulated in spreadsheet or
database tools, but ideally can then be reloaded to the control system so it can be accessed by
the operator. Tools like Honeywell’s Alarm Configuration Manager support the rationalization
process, but also provide information directly to the operator so all details associated with an
alarm can be seen via the Experion operator console.
Some modern alarm systems include clustering alarms by equipment and time. So now it is
possible to match alarm patterns generated simultaneously or at a consistent time delay after
the initial alarms.
Some other features of a modern control system are:
Alarm Shelving
Alarm Reports, Filtering, Comments, etc.
Alarm + Continuous Trending
Alarm Metrics Trend
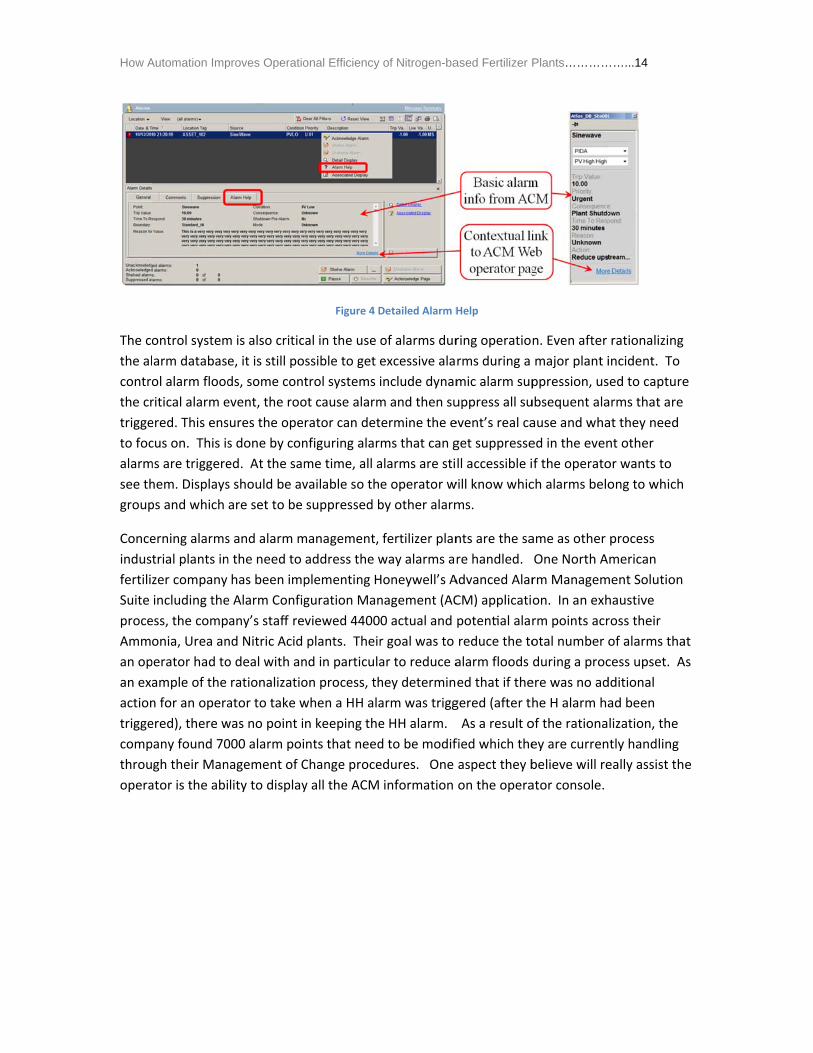
How A
The co
the al
contro
the cr
trigge
to foc
alarm
see th
group
Conce
indus
fertili
Suite
proce
Amm
an op
an exa
action
trigge
comp
throu
opera
Automation Imp
ontrol system
arm database
ol alarm flood
ritical alarm e
ered. This ens
cus on. This is
ms are triggere
hem. Displays
ps and which
erning alarms
trial plants in
zer company
including the
ess, the comp
onia, Urea an
perator had to
ample of the
n for an opera
ered), there w
pany found 70
gh their Man
ator is the abi
proves Operatio
m is also critic
e, it is still po
ds, some cont
event, the roo
sures the ope
s done by con
ed. At the sam
s should be av
are set to be
s and alarm m
n the need to
has been imp
e Alarm Config
any’s staff re
nd Nitric Acid
o deal with an
rationalizatio
ator to take w
was no point i
000 alarm poi
nagement of C
lity to display
onal Efficiency
Figure 4 D
al in the use
ssible to get e
trol systems i
ot cause alarm
rator can det
nfiguring alar
me time, all a
vailable so th
suppressed b
management,
address the w
plementing H
guration Man
viewed 4400
plants. Their
nd in particula
on process, th
when a HH ala
n keeping the
nts that need
Change proce
y all the ACM
of Nitrogen-ba
Detailed Alarm H
of alarms dur
excessive ala
include dynam
m and then su
termine the e
ms that can g
alarms are sti
e operator w
by other alarm
fertilizer plan
way alarms ar
Honeywell’s A
nagement (AC
0 actual and
r goal was to
ar to reduce a
hey determin
arm was trigg
e HH alarm.
d to be modif
edures. One
information
ased Fertilizer P
Help
ring operatio
rms during a
mic alarm sup
uppress all su
event’s real ca
get suppresse
ll accessible i
will know whic
ms.
nts are the sa
re handled.
Advanced Alar
CM) applicati
poten al alar
reduce the to
alarm floods
ed that if the
gered (after th
As a result o
fied which the
aspect they b
on the opera
Plants…………
n. Even after
major plant i
ppression, us
ubsequent ala
ause and wha
ed in the even
f the operato
ch alarms belo
ame as other
One North A
rm Managem
on. In an exh
rm points acr
otal number o
during a proc
ere was no ad
he H alarm ha
of the rationa
ey are curren
believe will re
ator console.
……...14
rationalizing
incident. To
sed to capture
arms that are
at they need
nt other
or wants to
ong to which
process
merican
ment Solution
haustive
ross their
of alarms tha
cess upset. A
dditional
ad been
lization, the
tly handling
eally assist th
e
at
As
e
How Automation Improves Operational Efficiency of Nitrogen-based Fertilizer Plants……………...15
OperatorTrainingSimulatorsAs mentioned, a 1996 study es mated that over $20‐billion per year is lost in the process
industry due to abnormal situations, and of these losses, about 40% are a ributable to human
error. Most commonly, the human errors were due to inadequate procedures, a procedure(s)
not being followed or an incorrect action taken. Given this, it is critical that in the event of an
incident, the operator can quickly identify the problem, knows what the correct response is and
can execute it in a timely manner.
Operator training simulators have been around for almost 30 years and are most commonly
used in association with a Greenfield commissioning project. Justifying the purchase of an
operator training simulator is a risk management decision based on the idea that avoiding a few
days’ delay in the startup of a new plant will easily pay for the simulator.
However, for existing plants, training simulators have not been so widely adopted on the basis
that these plants have experienced operators who don’t need a simulator. Recently, due a
number of factors, companies are rethinking that approach. In mature regions, older, more
experienced operators are retiring and new personnel are not getting adequate training, while
in regions with high growth, companies are seeing high turnover with staff moving on to new
plants that may be offering higher pay.
There are a number of different types of training simulators available, but the one that best
supports improved operator efficiency is the high‐fidelity custom dynamic training simulator. A
high‐fidelity custom simulator is built to most closely match the plant that it represents and can
be connected to the actual DCS that is being used (or will be used) with identical graphics and
control strategies. Key features of a best‐in‐class training simulator include:
A model‐based simulation of the plant that incorporates all major equipment in the
plant and has first‐principle reaction models that accurately respond dynamically to
input changes.
Correctly models the plant behavior during startup and shutdown.
Incorporation of all regulatory control schemes, sequence logic, graphics and alarms to
be found on the live system.
Incorporation of specific training scenarios that allow the instructor to test the response
of operators to critical, abnormal situations that have been seen or are anticipated as
potential upsets.
Allowing for the instructor to trigger equipment malfunctions to occur both during
normal operation and startup and shutdown.
Include testing and scoring so operators and instructors can track performance and
satisfy requirements for operator certification.
In fact, a good training simulator can be used for more than just training operators. Coupled
with the automation platform, it can be used to test new control strategies, try out new
procedures on the plant or even examine the impact of process modifications.
How Automation Improves Operational Efficiency of Nitrogen-based Fertilizer Plants……………...16
In the case of fertilizer plants, it might be said that there are many ammonia and urea plants
around the world, and the production process is pretty well understood – so maybe a training
simulator is not necessary. However, not only are there always new operators to train, some
features of nitrogen‐based fertilizer plants make them ideal for training simulators. For
example, ammonia and urea plants typically run for 2‐to‐4 years between planned shutdowns,
so operators may be unfamiliar with some startup and shutdown activities. In the case of
ammonia plants, the integrated heat recovery and process recirculation makes startup long and
complicated. A typical startup can take between 36 and 48 hours and requires multiple process
sections to start in parallel. The operator must monitor the status of many variables, and
downstream process conditions affect upstream operations. Furthermore, an integrated
ammonia/urea/utility plant is even more complicated since there is dynamic interaction
between the units and the utilities (e.g., CO2 and ammonia from the ammonia plant to the urea
plant). In these cases, multiple integrated training simulators allow operators of different units
to simultaneously train during a combined startup, sharing utilities and intermediates.
The ammonia training simulator incorporates reaction kinetics for the reformer and secondary
reformer as well as the ammonia converter. It also includes typical scenarios to test operators,
such as:
Shutdown
Startup
Loss of Feed
Agrium in Canada looked at purchasing an operator training simulator for one of their existing
Ammonia plants in the early 2000’s and began considering how to justify such an investment.
The company recognized that incident avoidance is sometimes considered a soft benefit which
makes it hard to attract real investment funding. So they looked at 10 years of data and, in
particular, all of the incidents and outage information during that period. They found that the
plant performance generally improved following a turnaround and then gradually declined year‐
over‐year until the next turnaround. Further analysis showed that one reason for this was that
operators were experiencing multiple difficulties and incidents restarting the unit following a
turnaround and became more familiar with how to respond during startups/shutdowns and
incidents immediately after a turnaround. However, as time progressed, operators became less
familiar and began making more mistakes until the next turnaround began. Conclusion: The
cause in both cases was the lack of practice around startups/shutdowns and incidents.
Agrium justified the training simulator project by anticipating that it would cut in half incidents
directly caused by operators and that typical startup time would fall by 10%.
Agrium embarked on a complete structured training program and assigned a dedicated Training
Simulator owner to roll‐out and train the operators. They tailored the program to
accommodate not only existing operators but also to train new operators.
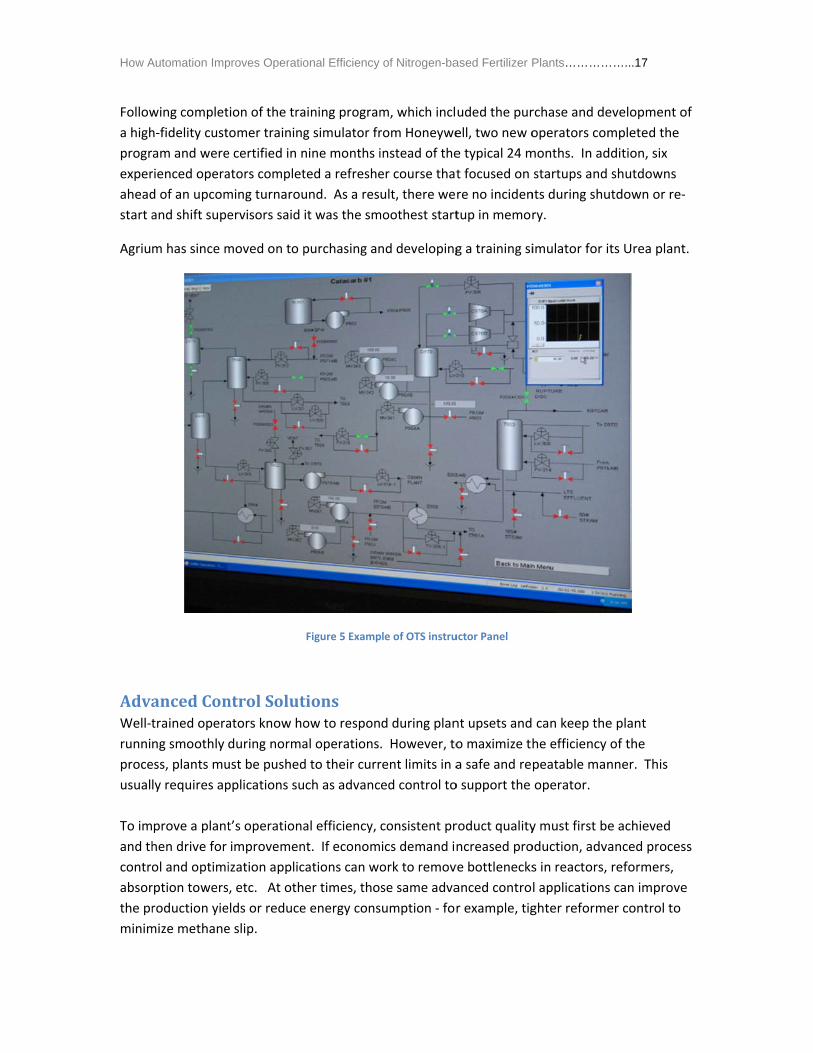
How A
Follow
a high
progr
exper
ahead
start a
Agriu
AdvaWell‐t
runni
proce
usual
To im
and th
contro
absor
the pr
minim
Automation Imp
wing complet
h‐fidelity cust
am and were
rienced opera
d of an upcom
and shift supe
m has since m
ancedContrained opera
ng smoothly
ess, plants mu
ly requires ap
prove a plant
hen drive for
ol and optimi
rption towers
roduction yie
mize methane
proves Operatio
tion of the tra
tomer training
e certified in n
ators complet
ming turnarou
ervisors said
moved on to p
ntrolSolutators know ho
during norma
ust be pushed
pplications su
t’s operationa
improvemen
ization applic
, etc. At oth
elds or reduce
e slip.
onal Efficiency
aining program
g simulator fr
nine months i
ted a refreshe
und. As a res
it was the sm
purchasing an
Figure 5 Examp
tionsow to respon
al operations
d to their curr
ch as advanc
al efficiency,
nt. If econom
cations can wo
er times, tho
e energy cons
of Nitrogen-ba
m, which incl
rom Honeywe
instead of the
er course that
ult, there we
moothest start
nd developing
ple of OTS instru
d during plan
. However, to
rent limits in a
ed control to
consistent pr
ics demand in
ork to remov
se same adva
sumption ‐ for
ased Fertilizer P
uded the pur
ell, two new o
e typical 24 m
t focused on
re no inciden
tup in memor
g a training si
uctor Panel
nt upsets and
o maximize th
a safe and re
o support the
roduct quality
ncreased pro
ve bottlenecks
anced contro
r example, tig
Plants…………
rchase and de
operators com
months. In ad
startups and
nts during shu
ry.
imulator for i
can keep the
he efficiency
peatable man
operator.
y must first be
oduction, adva
s in reactors,
l applications
ghter reforme
……...17
evelopment o
mpleted the
ddition, six
shutdowns
utdown or re‐
ts Urea plant
e plant
of the
nner. This
e achieved
anced proces
reformers,
s can improve
er control to
of
‐
t.
ss
e

How Automation Improves Operational Efficiency of Nitrogen-based Fertilizer Plants……………...18
Advanced Process Control (APC) and Optimization solutions are typically implemented over the
top of the base DCS and rely on the underlying regulatory controls to be stable, robust and
repeatable. Hence, a layered approach that provides a solid regulatory control platform where
base controls are well tuned, valves respond without stickiness or hysteresis is the best way to
implement a scalable optimization solution matching plant needs.
Multivariable model predictive control strategies, such as Honeywell’s Profit Controller, are
well‐suited for unit‐based solutions such as steam reforming control or quality control around
the ammonia converter. Above this, optimization solutions can link several multivariable
controllers to cover a broader process area stretching across multiple units, like the ammonia
and urea plants. Combined with a first principles process model, this optimization level can
provide non‐linear dynamic optimization for large fertilizer plants.
These types of advanced control and optimization solutions have been widely used in fertilizer
plants as they can be adjusted using economic factors to switch from maximizing production to
minimizing energy while meeting a fixed production target.
In ammonia plants, advanced control strategies are divided into a couple of integrated
controllers: one around the feed and reformer, the other around the synthesis loop and
recovery section.
The objective of the reformer controller is to:
Stabilize reformer firing
Maintain the steam‐to‐carbon ratio
Control methane slip from the reformer
Minimize excess O2 in the reformer outlet
Control CO shift converter reaction
Respect limits such as furnace firing limits, air compressor limits, and feed limits
The objective of the synthesis loop controller is to:
Stabilize H2 to N2 ratio to the synthesis loop
Maintain the inerts’ concentration level in the synthesis loop
Control the converter temperature and pressure
Maintain quality at ammonia recovery column
Respect limits of refrigeration circuit, steam turbines, etc.
BASF in Germany was looking to increase process efficiency and increase production rates at its
Braun designed ammonia plant and chose to implement a multivariable control strategy using
Honeywell’s Profit Controller technology. They used the advanced controls to increase
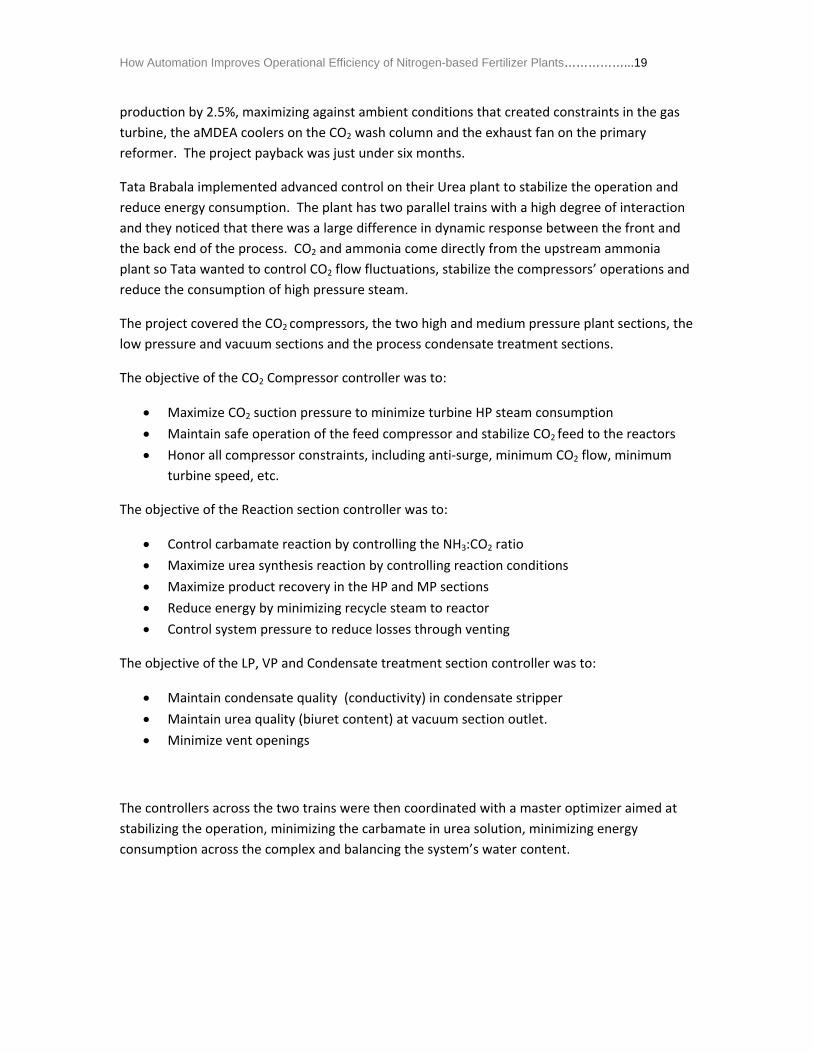
How Automation Improves Operational Efficiency of Nitrogen-based Fertilizer Plants……………...19
produc on by 2.5%, maximizing against ambient conditions that created constraints in the gas
turbine, the aMDEA coolers on the CO2 wash column and the exhaust fan on the primary
reformer. The project payback was just under six months.
Tata Brabala implemented advanced control on their Urea plant to stabilize the operation and
reduce energy consumption. The plant has two parallel trains with a high degree of interaction
and they noticed that there was a large difference in dynamic response between the front and
the back end of the process. CO2 and ammonia come directly from the upstream ammonia
plant so Tata wanted to control CO2 flow fluctuations, stabilize the compressors’ operations and
reduce the consumption of high pressure steam.
The project covered the CO2 compressors, the two high and medium pressure plant sections, the
low pressure and vacuum sections and the process condensate treatment sections.
The objective of the CO2 Compressor controller was to:
Maximize CO2 suction pressure to minimize turbine HP steam consumption
Maintain safe operation of the feed compressor and stabilize CO2 feed to the reactors
Honor all compressor constraints, including anti‐surge, minimum CO2 flow, minimum
turbine speed, etc.
The objective of the Reaction section controller was to:
Control carbamate reaction by controlling the NH3:CO2 ratio
Maximize urea synthesis reaction by controlling reaction conditions
Maximize product recovery in the HP and MP sections
Reduce energy by minimizing recycle steam to reactor
Control system pressure to reduce losses through venting
The objective of the LP, VP and Condensate treatment section controller was to:
Maintain condensate quality (conductivity) in condensate stripper
Maintain urea quality (biuret content) at vacuum section outlet.
Minimize vent openings
The controllers across the two trains were then coordinated with a master optimizer aimed at
stabilizing the operation, minimizing the carbamate in urea solution, minimizing energy
consumption across the complex and balancing the system’s water content.
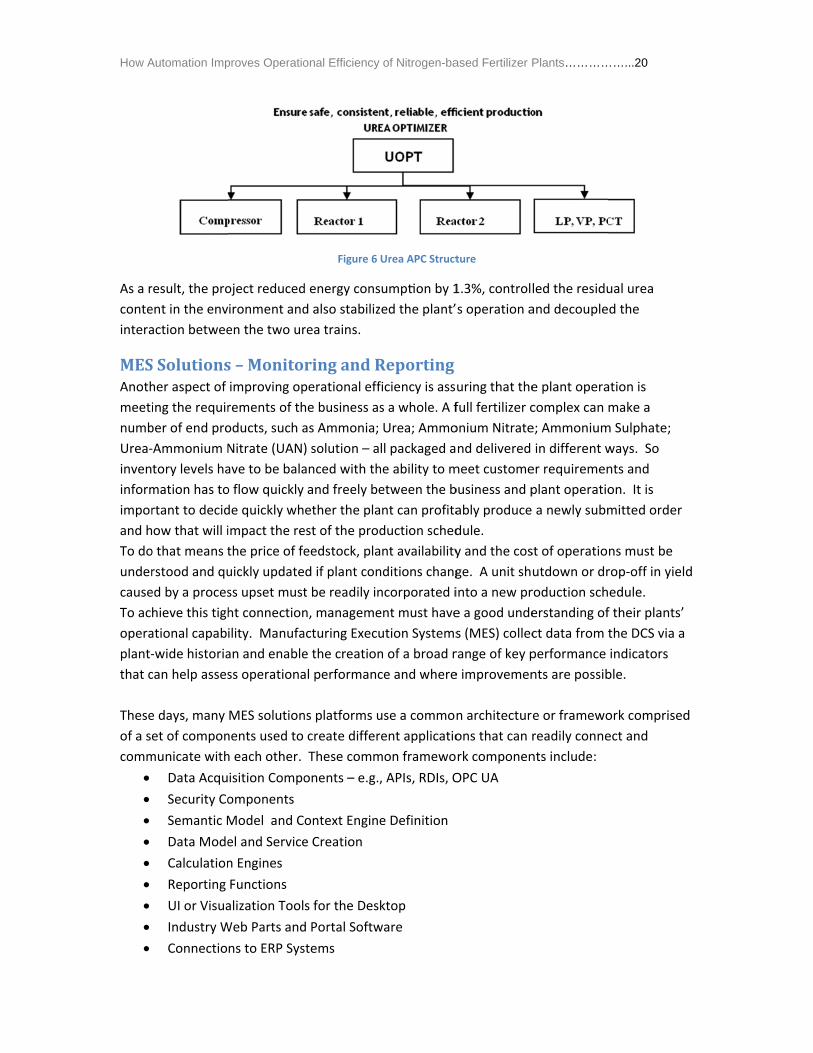
How A
As a r
conte
intera
MESAnoth
meeti
numb
Urea‐
inven
inform
impor
and h
To do
under
cause
To ac
opera
plant‐
that c
These
of a se
comm
Automation Imp
result, the pro
ent in the env
action betwee
SSolutionsher aspect of
ing the requir
ber of end pro
‐Ammonium N
tory levels ha
mation has to
rtant to decid
ow that will i
o that means t
rstood and qu
ed by a proces
hieve this tigh
ational capab
‐wide historia
can help asses
e days, many
et of compon
municate with
Data Acqu
Security Co
Semantic M
Data Mode
Calculation
Reporting
UI or Visua
Industry W
Connectio
proves Operatio
oject reduced
ironment and
en the two ur
s–Monitoimproving op
rements of th
oducts, such a
Nitrate (UAN)
ave to be bala
o flow quickly
de quickly wh
impact the re
the price of fe
uickly update
ss upset must
ht connection
ility. Manufa
an and enable
ss operationa
MES solution
nents used to
h each other.
isition Compo
omponents
Model and C
el and Service
n Engines
Functions
alization Tool
Web Parts and
ns to ERP Sys
onal Efficiency
Figure 6
d energy cons
d also stabiliz
rea trains.
ringandRperational eff
he business as
as Ammonia;
) solution – a
anced with th
and freely be
ether the pla
est of the prod
eedstock, pla
d if plant con
t be readily in
n, manageme
acturing Execu
e the creation
al performanc
ns platforms u
create differ
These comm
onents – e.g.,
ontext Engine
e Creation
s for the Desk
d Portal Softw
stems
of Nitrogen-ba
Urea APC Struct
ump on by 1
ed the plant’
Reportingficiency is ass
s a whole. A f
Urea; Ammo
ll packaged a
he ability to m
etween the b
nt can profita
duction sched
nt availability
nditions chang
ncorporated i
ent must have
ution Systems
n of a broad r
ce and where
use a common
ent applicatio
mon framewo
, APIs, RDIs, O
e Definition
ktop
ware
ased Fertilizer P
ture
1.3%, control
s operation a
uring that the
full fertilizer c
onium Nitrate
nd delivered
meet custome
business and p
ably produce
dule.
y and the cos
ge. A unit sh
into a new pr
e a good unde
s (MES) collec
range of key p
e improvemen
n architectur
ons that can r
rk componen
OPC UA
Plants…………
led the residu
and decouple
e plant opera
complex can
e; Ammonium
in different w
er requiremen
plant operatio
a newly subm
st of operatio
utdown or dr
roduction sch
erstanding of
ct data from t
performance
nts are possib
e or framewo
readily conne
nts include:
……...20
ual urea
d the
ation is
make a
m Sulphate;
ways. So
nts and
on. It is
mitted order
ns must be
rop‐off in yiel
edule.
f their plants’
the DCS via a
indicators
ble.
ork comprised
ect and
d
d
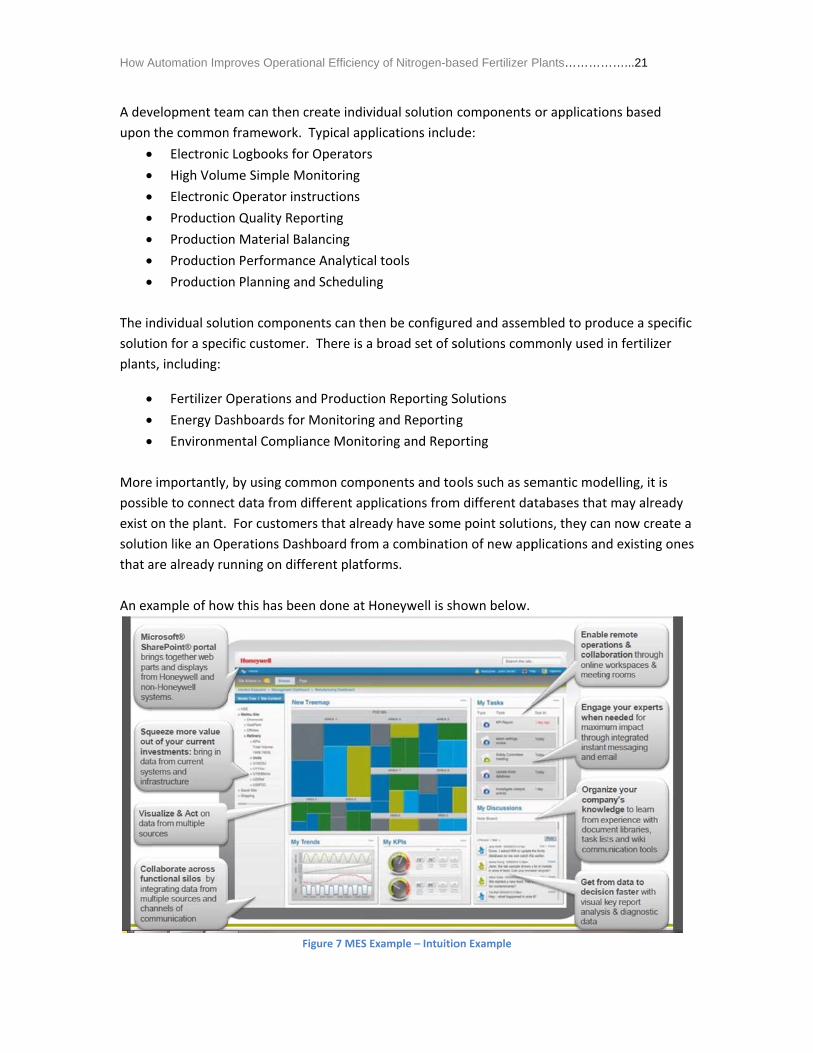
How A
A dev
upon
The in
soluti
plants
More
possib
exist o
soluti
that a
An ex
Automation Imp
velopment tea
the common
Electronic
High Volu
Electronic
Productio
Productio
Productio
Productio
ndividual solu
on for a spec
s, including:
Fertilizer O
Energy Da
Environme
importantly,
ble to connec
on the plant.
on like an Op
are already ru
xample of how
proves Operatio
am can then c
n framework.
c Logbooks fo
me Simple M
c Operator ins
n Quality Rep
n Material Ba
n Performanc
n Planning an
ution compon
cific customer
Operations an
ashboards for
ental Complia
by using com
ct data from d
For custome
perations Das
unning on diff
w this has bee
F
onal Efficiency
create individ
Typical appli
r Operators
Monitoring
structions
porting
alancing
ce Analytical
nd Scheduling
nents can then
r. There is a b
nd Production
r Monitoring a
ance Monitor
mmon compo
different appl
ers that alread
hboard from
ferent platfor
en done at Ho
Figure 7 MES Ex
of Nitrogen-ba
dual solution
ications inclu
tools
g
n be configur
broad set of s
n Reporting S
and Reporting
ring and Repo
onents and to
lications from
dy have some
a combinatio
rms.
oneywell is sh
xample – Intuitio
ased Fertilizer P
components
de:
red and assem
solutions com
Solutions
g
orting
ols such as se
m different da
e point soluti
on of new app
hown below.
on Example
Plants…………
or applicatio
mbled to prod
mmonly used i
emantic mod
atabases that
ons, they can
plications and
……...21
ons based
duce a specifi
in fertilizer
elling, it is
may already
n now create
d existing one
ic
a
es
How Automation Improves Operational Efficiency of Nitrogen-based Fertilizer Plants……………...22
Honeywell’s Intui on Execu ve pla orm which was released in May 2012 is designed for
enterprise‐wide information integration and real‐time visualization. It moves beyond simple
data access and display to providing context. It is capable of harnessing data from everywhere
and delivering it to everyone to enable collaboration across business units and operational
efficiency.
Intuition Executive can connect many data sources (including DCS, historians, applications, MES
and ERP systems), while establishing context using tools to describe how the data from the
different sources relates to each other. Using various calculation and event solution
components, it analyzes & monitors the process, and triggers the right actions in the right
circumstances.
The Intuition Executive user interface uses common web parts in a Microsoft® SharePoint®
portal to display graphics, trends, tree maps, lists and discussion boards.
Qatar Fertilizer Company (QAFCO) needed to keep up with its rapid growth and update its
business manufacturing systems to stay ahead of the times in a challenging and competitive
environment. The existing systems developed in‐house were no longer viable and the volume of
manual data input was enormous, compromising both time and quality of data collected.
QAFCO turned to Honeywell and its integrated Manufacturing Execution Solution (MES) to help
eliminate manual procedures, thus ensuring accuracy and enabling better decision making.
The solution was built to span five of QAFCO’s Ammonia and Urea plants and was integrated
with both the Experion automation platform and other third‐party software. The infrastructure
components used for the solution were:
Historian – Uniformance PHD
Plant Reference Model and Data Processing Platform
Visualization – Workcenter
The solution components implemented were:
Electrical Energy Balance
Natural Gas Balance
Plant Production Balance
Emissions Monitoring and Reporting
Production Loss Reporting
Plant Performance Analysis
Production Costing
As a result, QAFCO realized the following benefits:
More I
For mo
solutio
www.h
Honey
AutomProcesHoney 1250 WHousto HoneyBrackn ShangShang
How A
nformation
ore information
ns, visit our we
honeywellproce
well account m
mation & Contrss Solutions well
West Sam Houon, TX 77042
well House, Arnell, Berkshire,
hai City Centrehai, China 200
ConcMode
of the
dashb
with o
platfo
opera
plant
autom
room
capac
Automation Imp
on Honeywell
ebsite at
ess.com or con
manager.
rol Solutions
ston Parkway S
rlington BusineEngland RG12
e, 100 Junyi Ro051
Easy acces
Automated
for manua
Readily av
cost or inv
Common p
PIMS/LIMS
manufactu
clusionern automatio
e process plan
board capabil
other systems
orm can captu
ator tasks by a
to operation
mation platfo
and the boar
city, to allow f
proves Operatio
’s Fertilizer
tact your
South
ss Park, 2 1EB UK
oad
ss to unified d
d work proce
l effort
ailable report
ventory inform
plant model t
S solution, pr
uring compet
on systems ar
nt. They act a
ity that not o
s, such as the
ure the exper
automating p
al limits, max
rms also prov
rdroom, impr
for better ma
onal Efficiency
data, enabling
ess and collate
ts loaded wit
mation
that ensured d
oviding a stro
itiveness
re now capab
as the operat
only enable co
e ESD and the
rience of your
previously ma
ximizing yields
vide a two‐wa
roving the flo
anufacturing d
WP-XX-X
May 2012
of Nitrogen-ba
g quicker ope
ed and integr
h quality data
data consiste
ong foundatio
ble of much m
or’s window
ontrol of the u
e Fire‐and‐Gas
r best operato
anual procedu
s and minimiz
ay communic
w of informa
decisions as b
XX-ENG
2
ased Fertilizer P
erational and
rated quality
a, such as Key
ency and accu
on to build an
more than just
into the plan
unit, but also
s or Security s
ors and offloa
ures. At the s
zing cost of p
cation channe
tion, such as
business cond
Plants…………
business dec
data, elimina
y Performanc
uracy
nd sustain its
t basic regula
t and have m
o how the pla
systems. The
ad some trad
same time, it
production. M
el between th
plant availab
ditions chang
……...23
isions
ting the need
ce Indicators,
atory control
more of a
nt connects
e automation
itional
can push the
Modern
he control
bility and
e.
d
e
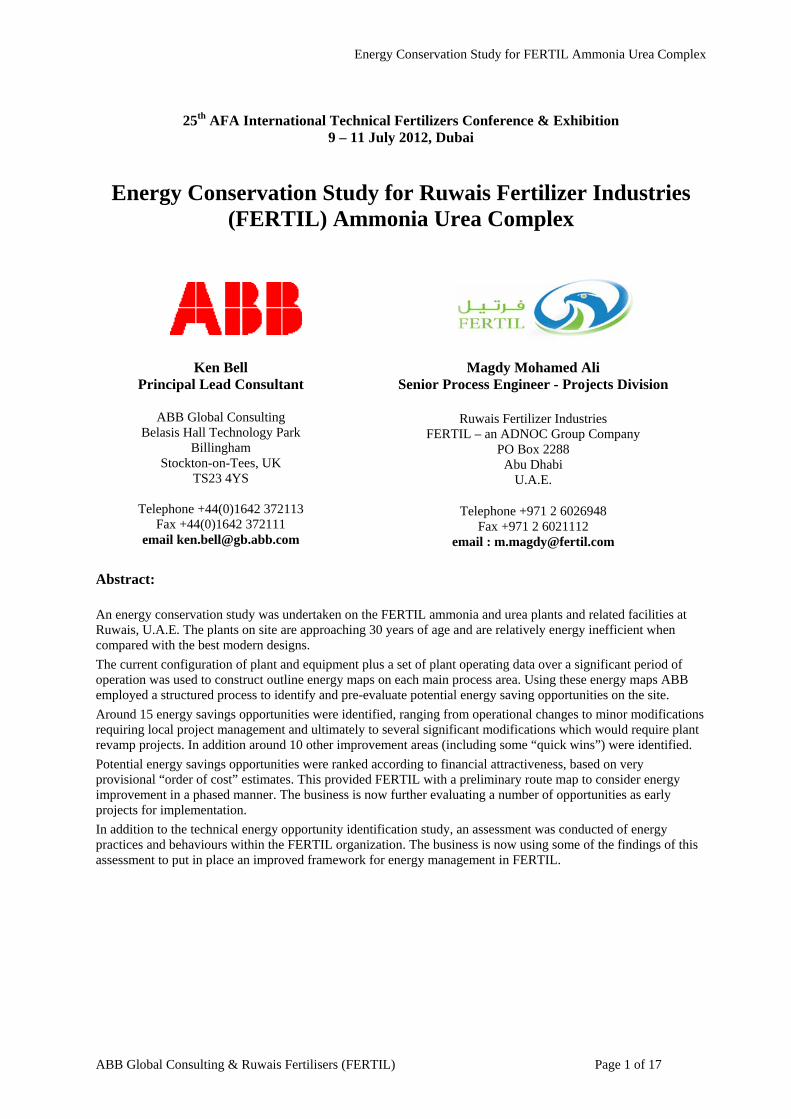
Energy Conservation Study for FERTIL Ammonia Urea Complex
ABB Global Consulting & Ruwais Fertilisers (FERTIL) Page 1 of 17
25th AFA International Technical Fertilizers Conference & Exhibition
9 – 11 July 2012, Dubai
Energy Conservation Study for Ruwais Fertilizer Industries (FERTIL) Ammonia Urea Complex
Ken Bell Principal Lead Consultant
ABB Global Consulting
Belasis Hall Technology Park Billingham
Stockton-on-Tees, UK TS23 4YS
Telephone +44(0)1642 372113
Fax +44(0)1642 372111 email [email protected]
Magdy Mohamed Ali Senior Process Engineer - Projects Division
Ruwais Fertilizer Industries
FERTIL – an ADNOC Group Company PO Box 2288
Abu Dhabi U.A.E.
Telephone +971 2 6026948
Fax +971 2 6021112 email : [email protected]
Abstract:
An energy conservation study was undertaken on the FERTIL ammonia and urea plants and related facilities at Ruwais, U.A.E. The plants on site are approaching 30 years of age and are relatively energy inefficient when compared with the best modern designs.
The current configuration of plant and equipment plus a set of plant operating data over a significant period of operation was used to construct outline energy maps on each main process area. Using these energy maps ABB employed a structured process to identify and pre-evaluate potential energy saving opportunities on the site.
Around 15 energy savings opportunities were identified, ranging from operational changes to minor modifications requiring local project management and ultimately to several significant modifications which would require plant revamp projects. In addition around 10 other improvement areas (including some “quick wins”) were identified.
Potential energy savings opportunities were ranked according to financial attractiveness, based on very provisional “order of cost” estimates. This provided FERTIL with a preliminary route map to consider energy improvement in a phased manner. The business is now further evaluating a number of opportunities as early projects for implementation.
In addition to the technical energy opportunity identification study, an assessment was conducted of energy practices and behaviours within the FERTIL organization. The business is now using some of the findings of this assessment to put in place an improved framework for energy management in FERTIL.
Energy Conservation Study for FERTIL Ammonia Urea Complex
ABB Global Consulting & Ruwais Fertilisers (FERTIL) Page 2 of 17
CONTENTS
1. Background on FERTIL plants at Ruwais ........................................................................................................ 3
2. Objective of the energy conservation study ...................................................................................................... 3
3. ABB Model for Assessment of Industrial Energy Efficiency ........................................................................... 3
3.1. Industrial Energy Efficiency Model as applied to the FERTIL study .......................................................... 4
3.2. Energy Maps ................................................................................................................................................. 4
4. Energy maps developed for FERTIL complex at Ruwais ................................................................................. 4
4.1. High Level Energy Map - Overall Ruwais Site Operations.......................................................................... 4
4.2. Energy maps for Ammonia Plant and Urea Plant ......................................................................................... 5
4.3. Energy comparison for old and new NH3 technologies ............................................................................... 5
4.4. Overview of steam system on FERTIL 1 ..................................................................................................... 5
5. Range of potential energy improvements identified ......................................................................................... 6
5.1. Early opportunities being progressed ........................................................................................................... 7
6. Energy Practices & Behaviours Assessment ..................................................................................................... 7
7. Potential Future benchmarked energy position for FERTIL1 plant .................................................................. 8
8. Main Findings from Study ................................................................................................................................ 8
9. Conclusions and Way Forward ......................................................................................................................... 9
10. References .................................................................................................................................................. 10
Figures ..................................................................................................................................................................... 10
Energy Conservation Study for FERTIL Ammonia Urea Complex
ABB Global Consulting & Ruwais Fertilisers (FERTIL) Page 3 of 17
1. Background on FERTIL plants at Ruwais
Ruwais Fertilizer Industries (FERTIL) was established in 1980, as a joint venture between Abu Dhabi National Oil Company (ADNOC) and Total Fina Elf. The Complex comprises Ammonia and Urea plants, plus related Utilities & Product Handling / Shipping & Storage facilities. Construction of the plant began in November 1980 and first production was in early 1984. The location of the complex is shown in Fig 1.
The main raw material is associated dry gas, piped from onshore oil fields 150 Km from the plant. Desalinated water, electricity and seawater are supplied by the adjacent Ruwais Utility Plant, supplemented by FERTIL's own emergency power generators and water tanks.
The Ammonia plant process technology is that of Haldor Topsoe. The original name plate capacity of 1,000 MTPD has been progressively increased to 1,300 MTPD. The Urea plant is a Stamicarbon unit of original capacity 1,500 MTPD which was progressively debottlenecked to 1800 MTPD and more recently has been revamped by conversion from prilled to granulated product and further uprated via the Urea Casale process to 2500 MTPD. A CO2 recovery Unit of 400 MTPD unit, using ammonia plant flue gas as feedstock was installed to supply the additional CO2 required for extra capacity of Urea.
No formal debottlenecking of the Ammonia plant has been carried out - the improvements in output are the result of a progressive series of in-house studies/projects implemented from time to time through the years.
FERTIL has a commitment to develop and use energy resources more efficiently in providing products and services and has identified energy management as cornerstone in maximizing operation efficiency, optimizing cost and minimizing harmful impact on the environment. The business therefore commissioned ABB to conduct a comprehensive Energy Conservation study, with the objective of identifying ways to improve the use of energy resources. The facilities covered by the study are shown in Fig 2.
2. Objective of the energy conservation study The prime objective of the Energy Management Strategic Study was to identify practical ways to improve energy efficiency. The remit and methodology for the study included initial assessment to identify the magnitude of energy flows and transformations within the on-site process systems. This would be done by
i) Conducting a review of documents and existing data on energy usage & producing an interim report, ii) Completing a site survey at Ruwais to confirm / develop interim findings, and iii) Developing an Energy Balance and establishing an Energy Baseline for the site and main plants.
The above phases were then to be used to explore potential energy savings and these would then be presented to the business. Additionally FERTIL required a high-level assessment of the organization’s capability for energy management and reduction. This part of the study would comprise
iv) Making recommendations relating to long term corporate energy objectives, strategy and energy KPIs. v) Establishing a unified methodology and related criteria for monitoring and reporting energy
performance. 3. ABB Model for Assessment of Industrial Energy Efficiency
The ABB Global Consulting Industrial Energy Efficiency methodology normally comprises three stages, Opportunity Identification, Energy Management Master Plan and Implementation. This is illustrated in Fig 3. The aim of the assessment process as a whole is to identify, develop and implement a programme of energy efficiency improvements which deliver real savings, with the first two steps of the methodology delivering precisely the information needed to enable a successful implementation of the final step.
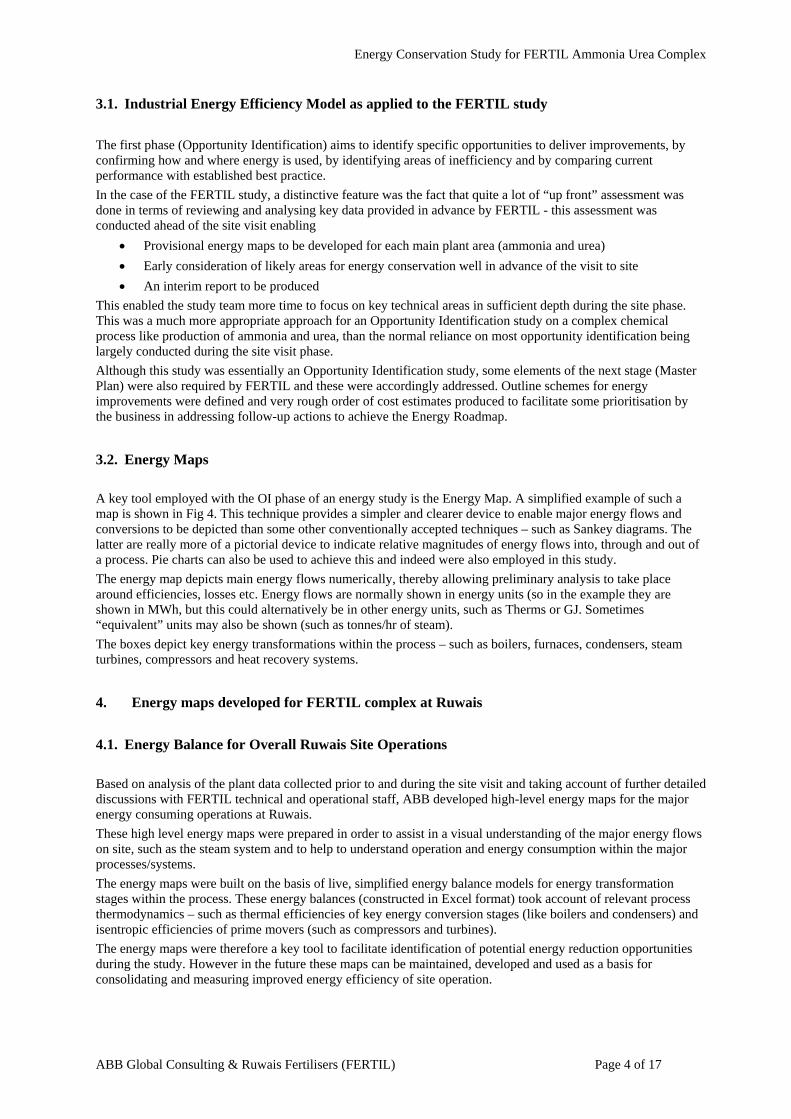
Energy Conservation Study for FERTIL Ammonia Urea Complex
ABB Global Consulting & Ruwais Fertilisers (FERTIL) Page 4 of 17
3.1. Industrial Energy Efficiency Model as applied to the FERTIL study
The first phase (Opportunity Identification) aims to identify specific opportunities to deliver improvements, by confirming how and where energy is used, by identifying areas of inefficiency and by comparing current performance with established best practice.
In the case of the FERTIL study, a distinctive feature was the fact that quite a lot of “up front” assessment was done in terms of reviewing and analysing key data provided in advance by FERTIL - this assessment was conducted ahead of the site visit enabling
• Provisional energy maps to be developed for each main plant area (ammonia and urea)
• Early consideration of likely areas for energy conservation well in advance of the visit to site
• An interim report to be produced
This enabled the study team more time to focus on key technical areas in sufficient depth during the site phase. This was a much more appropriate approach for an Opportunity Identification study on a complex chemical process like production of ammonia and urea, than the normal reliance on most opportunity identification being largely conducted during the site visit phase.
Although this study was essentially an Opportunity Identification study, some elements of the next stage (Master Plan) were also required by FERTIL and these were accordingly addressed. Outline schemes for energy improvements were defined and very rough order of cost estimates produced to facilitate some prioritisation by the business in addressing follow-up actions to achieve the Energy Roadmap.
3.2. Energy Maps
A key tool employed with the OI phase of an energy study is the Energy Map. A simplified example of such a map is shown in Fig 4. This technique provides a simpler and clearer device to enable major energy flows and conversions to be depicted than some other conventionally accepted techniques – such as Sankey diagrams. The latter are really more of a pictorial device to indicate relative magnitudes of energy flows into, through and out of a process. Pie charts can also be used to achieve this and indeed were also employed in this study.
The energy map depicts main energy flows numerically, thereby allowing preliminary analysis to take place around efficiencies, losses etc. Energy flows are normally shown in energy units (so in the example they are shown in MWh, but this could alternatively be in other energy units, such as Therms or GJ. Sometimes “equivalent” units may also be shown (such as tonnes/hr of steam).
The boxes depict key energy transformations within the process – such as boilers, furnaces, condensers, steam turbines, compressors and heat recovery systems.
4. Energy maps developed for FERTIL complex at Ruwais
4.1. Energy Balance for Overall Ruwais Site Operations
Based on analysis of the plant data collected prior to and during the site visit and taking account of further detailed discussions with FERTIL technical and operational staff, ABB developed high-level energy maps for the major energy consuming operations at Ruwais.
These high level energy maps were prepared in order to assist in a visual understanding of the major energy flows on site, such as the steam system and to help to understand operation and energy consumption within the major processes/systems.
The energy maps were built on the basis of live, simplified energy balance models for energy transformation stages within the process. These energy balances (constructed in Excel format) took account of relevant process thermodynamics – such as thermal efficiencies of key energy conversion stages (like boilers and condensers) and isentropic efficiencies of prime movers (such as compressors and turbines).
The energy maps were therefore a key tool to facilitate identification of potential energy reduction opportunities during the study. However in the future these maps can be maintained, developed and used as a basis for consolidating and measuring improved energy efficiency of site operation.
Energy Conservation Study for FERTIL Ammonia Urea Complex
ABB Global Consulting & Ruwais Fertilisers (FERTIL) Page 5 of 17
4.2. Energy maps for Ammonia Plant and Urea Plant
The energy maps developed for the FERTIL1 Ammonia and Urea plants are illustrated in Figs 5 and 6. It should be noted that considerable adjustment and reconciliation was required to “balance” these maps, due to the relative absence of energy metering on site.
4.3. Energy comparison for old and new NH3 technologies
The diagram in Fig 7 illustrates the relative energy usages of the original ammonia plant at Ruwais (FERTIL1, described as “Old Technology”) and the order of energy consumption to be expected from a modern state-of-the-art ammonia plant with a high degree of process integration (shown as “New Technology”, likely to be representative of the new plant currently under construction at Ruwais (FERTIL2).
As can be seen by inspection of these diagrams, the main areas of energy inefficiency on FERTIL 1 plant can be attributed to the fact that the plant contains numerous relatively inefficient drives (including many pass-out steam turbines) and also has generally lower combustion efficiencies in fired equipment. The basic structure of the site steam system also contributes to the lower thermodynamic efficiency (see below).
Hence the “fuel” element of gas consumption is very much higher in the older FERTIL ammonia plant at Ruwais. The “feed” element of gas consumption is very similar to modern day plants (BAT basis).
4.4. Overview of steam system on FERTIL 1
A simplified representation of the site steam system is illustrated in Fig 8. A number of inherent thermodynamic inefficiencies exist as a result of the basic structure of the steam system as originally designed and there are also additional adverse energy impacts which have resulted from progressive plant de-bottlenecking phases.
The basic structure of the installed steam system places limitations on the ultimate thermodynamic efficiency which can be achieved, for example:
• Fundamentally the 100 barg cycle (HP steam level) is more thermodynamically efficient than the 40barg cycle (MP steam level). However many of the steam turbine drives are based on the latter.
• Many of the installed steam turbines on small or medium-sized drives are of pass-out design and oversized for the duty, hence inherently inefficient. This was less of an issue at the time of original plant design.
• The overall system lacks sufficient flexibility (to enable optimization at site level) via a suitable balancing mechanism.
The overall ammonia and urea processes are currently being run very successfully for output and reliability. However this has resulted in inevitable inefficiencies in terms of energy. So, for example, as the plant has been progressively de-bottlenecked process changes have been made which have given rise to inefficiencies, such as:
• MP steam is now being imported by a number of pass-out steam turbines on the Ammonia plant most probably due to turbines moving away from the original optimum duty point and operating now at lower machine efficiencies.
• Surplus LP steam is generated from pass-out turbines (ammonia & STG).
• On fairly frequent occasions surplus LP steam is being vented.
• Recent installation of a refrigeration turbine (serving the urea granulation chiller) results in significant new intermittent quantities of LP steam pass-out when this unit is operating.
As previously mentioned, there is at present insufficient steam metering to fully validate the site steam balance, far less optimise it. In addition the existing operational management structure means that in general production decisions and inputs are made locally within three separate plant areas (ammonia, urea and utilities). This naturally makes overall site optimisation difficult since there is no overview (which would be most appropriate for optimisation of overall site energy performance).
Energy Conservation Study for FERTIL Ammonia Urea Complex
ABB Global Consulting & Ruwais Fertilisers (FERTIL) Page 6 of 17
5. Range of potential energy improvements identified
The cascade diagram shown in Fig 9 illustrates the cumulative energy impact of the range of energy reduction opportunities identified during the study. In broad terms an ultimate energy reduction of around 5 GJ/tonne appears to be feasible if most of these ideas were implemented. It was concluded that at least another 0.5 GJ per tonne should be available from other subsequent energy savings initiatives, not yet fully defined.
Not all ideas are likely to be eventually supported by the business, given the associated payback for each opportunity (which will require more detailed analysis). The energy reduction opportunities could be grouped into separate types:
• Energy improvements achievable via relatively minor alterations in local process operation (such as optimization of boilers)
• Improvements which will require modifications which can be achieved via relatively small, locally managed works projects
• Improvements requiring major capital expenditure and large-scale plant revamps
The cumulative potential energy savings identified are shown in another way in Fig 10. This shows the range of opportunities as a road map based on representation of relative financial attractiveness of the various schemes.
Only the major and medium scale opportunities which were identified are shown in this diagram. Based on a preliminary view of energy savings and rough “order of costs” around 10 of the opportunities yielded paybacks of potential interest (using criteria agreed with FERTIL for evaluating natural gas savings). Due to the preliminary nature of this assessment there is of course an error band around the savings (depicted in this diagram). As can be seen there are several relatively low cost projects which could enable “early wins” at relatively modest cost (items 1 to 6). No major or extended plant turnarounds would be required to implement these changes.
Examples of opportunities identified, with comments on ease of implementation, are summarised in the table below:
Opportunity Comments Reduce Steam:Carbon ratio in Primary Reformer Operational change with little capital cost. Would require further
detailed modeling and accurate monitoring of reformer maximum tube temperature before being pursued.
Improve efficiencies of MP Boilers B-5501A/B Operational change with little capital cost. Preheat Fuel gas using surplus LP steam Works project – see below. Recycle urea process condensate as BFW make-up in MP boilers
Works project – see below.
Fire HRU off-gas as a fuel in the MP Boilers Works project requiring further engineering definition particularly around detailed burner design and location of combustion.
Modify selected machine internals to improve efficiency
Works project requiring further engineering definition. Selective replacement of machine internals to restore operation to optimum duty point.
Stop using the front-end DEA desulphurisation system
Major revamp which could be accommodated within normal timescale for major planned TA. Further technical investigation would be required prior to implementation.
Purify Make up Gas using molecular sieves or ammonia washing
Major revamp. Established modification to synthesis gas loop proven elsewhere. See Ref 1. Would require extended major plant TA.
Preheat reformer combustion air via heat recovery from the reformer flue gas duct
Major revamp. Not trivial for side-fired reformer, but has been successfully implemented elsewhere. See Ref. 2. Would required extended major plant TA.
Convert CO2 removal to aMDEA based system Major revamp. Benfield process would be converted to amine based process employing aMDEA solvent together with vacuum flash. Already considered in a previous study conducted by plant licensors.
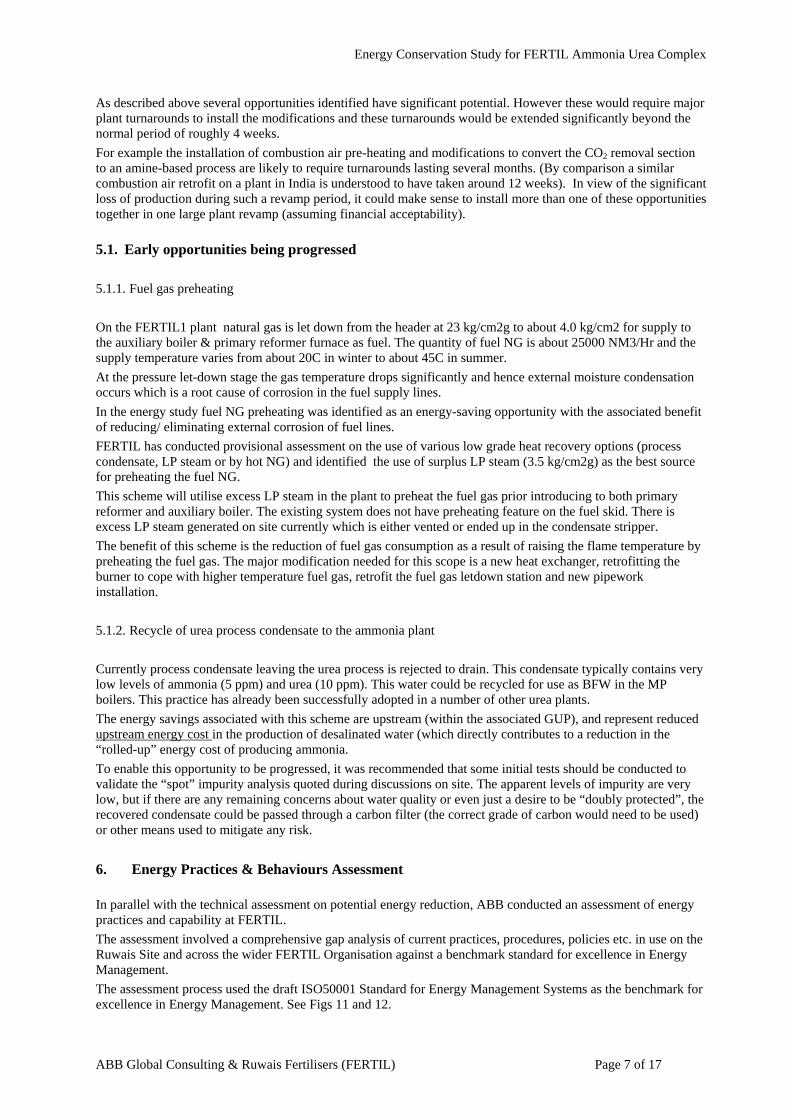
Energy Conservation Study for FERTIL Ammonia Urea Complex
ABB Global Consulting & Ruwais Fertilisers (FERTIL) Page 7 of 17
As described above several opportunities identified have significant potential. However these would require major plant turnarounds to install the modifications and these turnarounds would be extended significantly beyond the normal period of roughly 4 weeks.
For example the installation of combustion air pre-heating and modifications to convert the CO2 removal section to an amine-based process are likely to require turnarounds lasting several months. (By comparison a similar combustion air retrofit on a plant in India is understood to have taken around 12 weeks). In view of the significant loss of production during such a revamp period, it could make sense to install more than one of these opportunities together in one large plant revamp (assuming financial acceptability).
5.1. Early opportunities being progressed
5.1.1. Fuel gas preheating
On the FERTIL1 plant natural gas is let down from the header at 23 kg/cm2g to about 4.0 kg/cm2 for supply to the auxiliary boiler & primary reformer furnace as fuel. The quantity of fuel NG is about 25000 NM3/Hr and the supply temperature varies from about 20C in winter to about 45C in summer.
At the pressure let-down stage the gas temperature drops significantly and hence external moisture condensation occurs which is a root cause of corrosion in the fuel supply lines.
In the energy study fuel NG preheating was identified as an energy-saving opportunity with the associated benefit of reducing/ eliminating external corrosion of fuel lines.
FERTIL has conducted provisional assessment on the use of various low grade heat recovery options (process condensate, LP steam or by hot NG) and identified the use of surplus LP steam (3.5 kg/cm2g) as the best source for preheating the fuel NG.
This scheme will utilise excess LP steam in the plant to preheat the fuel gas prior introducing to both primary reformer and auxiliary boiler. The existing system does not have preheating feature on the fuel skid. There is excess LP steam generated on site currently which is either vented or ended up in the condensate stripper.
The benefit of this scheme is the reduction of fuel gas consumption as a result of raising the flame temperature by preheating the fuel gas. The major modification needed for this scope is a new heat exchanger, retrofitting the burner to cope with higher temperature fuel gas, retrofit the fuel gas letdown station and new pipework installation.
5.1.2. Recycle of urea process condensate to the ammonia plant
Currently process condensate leaving the urea process is rejected to drain. This condensate typically contains very low levels of ammonia (5 ppm) and urea (10 ppm). This water could be recycled for use as BFW in the MP boilers. This practice has already been successfully adopted in a number of other urea plants.
The energy savings associated with this scheme are upstream (within the associated GUP), and represent reduced upstream energy cost in the production of desalinated water (which directly contributes to a reduction in the “rolled-up” energy cost of producing ammonia.
To enable this opportunity to be progressed, it was recommended that some initial tests should be conducted to validate the “spot” impurity analysis quoted during discussions on site. The apparent levels of impurity are very low, but if there are any remaining concerns about water quality or even just a desire to be “doubly protected”, the recovered condensate could be passed through a carbon filter (the correct grade of carbon would need to be used) or other means used to mitigate any risk.
6. Energy Practices & Behaviours Assessment
In parallel with the technical assessment on potential energy reduction, ABB conducted an assessment of energy practices and capability at FERTIL.
The assessment involved a comprehensive gap analysis of current practices, procedures, policies etc. in use on the Ruwais Site and across the wider FERTIL Organisation against a benchmark standard for excellence in Energy Management.
The assessment process used the draft ISO50001 Standard for Energy Management Systems as the benchmark for excellence in Energy Management. See Figs 11 and 12.
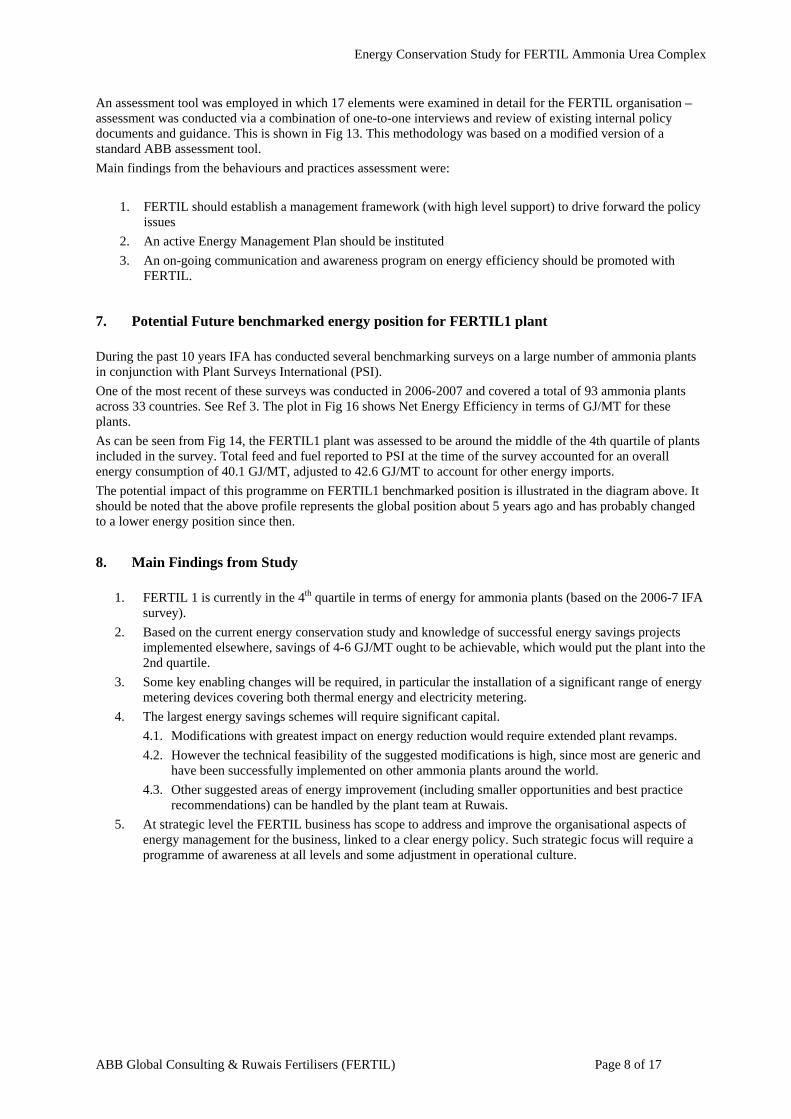
Energy Conservation Study for FERTIL Ammonia Urea Complex
ABB Global Consulting & Ruwais Fertilisers (FERTIL) Page 8 of 17
An assessment tool was employed in which 17 elements were examined in detail for the FERTIL organisation – assessment was conducted via a combination of one-to-one interviews and review of existing internal policy documents and guidance. This is shown in Fig 13. This methodology was based on a modified version of a standard ABB assessment tool.
Main findings from the behaviours and practices assessment were:
1. FERTIL should establish a management framework (with high level support) to drive forward the policy issues
2. An active Energy Management Plan should be instituted
3. An on-going communication and awareness program on energy efficiency should be promoted with FERTIL.
7. Potential Future benchmarked energy position for FERTIL1 plant
During the past 10 years IFA has conducted several benchmarking surveys on a large number of ammonia plants in conjunction with Plant Surveys International (PSI).
One of the most recent of these surveys was conducted in 2006-2007 and covered a total of 93 ammonia plants across 33 countries. See Ref 3. The plot in Fig 16 shows Net Energy Efficiency in terms of GJ/MT for these plants.
As can be seen from Fig 14, the FERTIL1 plant was assessed to be around the middle of the 4th quartile of plants included in the survey. Total feed and fuel reported to PSI at the time of the survey accounted for an overall energy consumption of 40.1 GJ/MT, adjusted to 42.6 GJ/MT to account for other energy imports.
The potential impact of this programme on FERTIL1 benchmarked position is illustrated in the diagram above. It should be noted that the above profile represents the global position about 5 years ago and has probably changed to a lower energy position since then.
8. Main Findings from Study
1. FERTIL 1 is currently in the 4th quartile in terms of energy for ammonia plants (based on the 2006-7 IFA survey).
2. Based on the current energy conservation study and knowledge of successful energy savings projects implemented elsewhere, savings of 4-6 GJ/MT ought to be achievable, which would put the plant into the 2nd quartile.
3. Some key enabling changes will be required, in particular the installation of a significant range of energy metering devices covering both thermal energy and electricity metering.
4. The largest energy savings schemes will require significant capital.
4.1. Modifications with greatest impact on energy reduction would require extended plant revamps.
4.2. However the technical feasibility of the suggested modifications is high, since most are generic and have been successfully implemented on other ammonia plants around the world.
4.3. Other suggested areas of energy improvement (including smaller opportunities and best practice recommendations) can be handled by the plant team at Ruwais.
5. At strategic level the FERTIL business has scope to address and improve the organisational aspects of energy management for the business, linked to a clear energy policy. Such strategic focus will require a programme of awareness at all levels and some adjustment in operational culture.
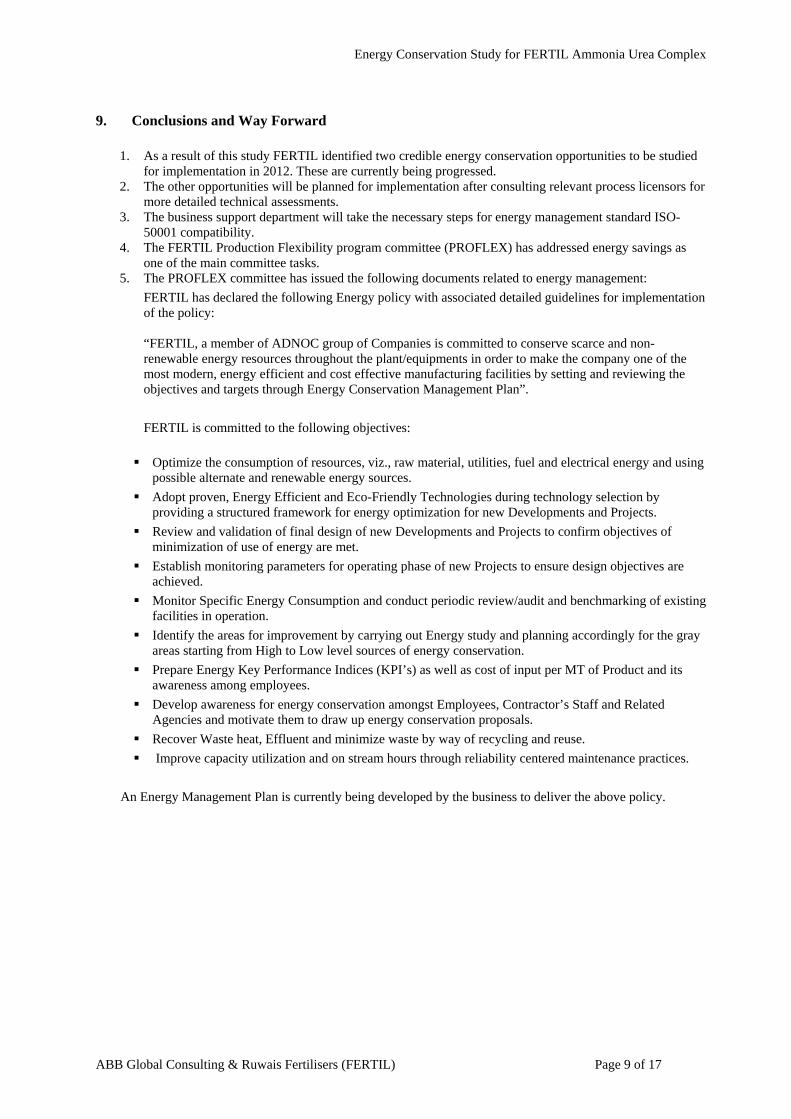
Energy Conservation Study for FERTIL Ammonia Urea Complex
ABB Global Consulting & Ruwais Fertilisers (FERTIL) Page 9 of 17
9. Conclusions and Way Forward
1. As a result of this study FERTIL identified two credible energy conservation opportunities to be studied for implementation in 2012. These are currently being progressed.
2. The other opportunities will be planned for implementation after consulting relevant process licensors for more detailed technical assessments.
3. The business support department will take the necessary steps for energy management standard ISO-50001 compatibility.
4. The FERTIL Production Flexibility program committee (PROFLEX) has addressed energy savings as one of the main committee tasks.
5. The PROFLEX committee has issued the following documents related to energy management:
FERTIL has declared the following Energy policy with associated detailed guidelines for implementation of the policy: “FERTIL, a member of ADNOC group of Companies is committed to conserve scarce and non-renewable energy resources throughout the plant/equipments in order to make the company one of the most modern, energy efficient and cost effective manufacturing facilities by setting and reviewing the objectives and targets through Energy Conservation Management Plan”.
FERTIL is committed to the following objectives:
Optimize the consumption of resources, viz., raw material, utilities, fuel and electrical energy and using possible alternate and renewable energy sources.
Adopt proven, Energy Efficient and Eco-Friendly Technologies during technology selection by providing a structured framework for energy optimization for new Developments and Projects.
Review and validation of final design of new Developments and Projects to confirm objectives of minimization of use of energy are met.
Establish monitoring parameters for operating phase of new Projects to ensure design objectives are achieved.
Monitor Specific Energy Consumption and conduct periodic review/audit and benchmarking of existing facilities in operation.
Identify the areas for improvement by carrying out Energy study and planning accordingly for the gray areas starting from High to Low level sources of energy conservation.
Prepare Energy Key Performance Indices (KPI’s) as well as cost of input per MT of Product and its awareness among employees.
Develop awareness for energy conservation amongst Employees, Contractor’s Staff and Related Agencies and motivate them to draw up energy conservation proposals.
Recover Waste heat, Effluent and minimize waste by way of recycling and reuse.
Improve capacity utilization and on stream hours through reliability centered maintenance practices.
An Energy Management Plan is currently being developed by the business to deliver the above policy.
Energy Conservation Study for FERTIL Ammonia Urea Complex
ABB Global Consulting & Ruwais Fertilisers (FERTIL) Page 10 of 17
10. References
1 Success Story of Implementation of Energy Saving Project at IFFCO Phulpur Unit, M. Rajashekharaiah,
Y. Narula, I.C.Jha, R. Maiti http://www.iffco.nic.in/applications/Brihaspat.nsf/0/f8a54bb1c677ff576525723a0043f184/$FILE/IFFCO-PhulpurEnergy%20Saving%20Project-%20Success%20Story.pdf
2 Improving Efficiency and Reliability of RCF Trombay Plants, H.S. Karangle, Indian Journal of Fertilisers, Vol. 2 (9), December 2006
3 Energy Efficiency and CO2 Emissions Benchmarking, IFA Ammonia Plants, 2006-2007 Operating Period, PSI Report – December 2008
Figures
Fig 1 – FERTIL Ruwais site location
Fig 2 – FERTIL Assets within scope of energy study
Fig 3 – ABB Industrial Energy Efficiency Model as applied to FERTIL
Fig 4 – Example of Simplified Energy Map
Fig 5 – Energy map for Ammonia Plant
Fig 6 – Energy map for Urea Plant
Fig 7 – Energy comparison for old and new NH3 technologies
Fig 8 – Overview of steam system on FERTIL 1
Fig 9 – Range of potential energy improvements identified
Fig 10 – Cumulative energy savings identified
Fig 11 – Framework for Continuous Improvement in Energy Management (ISO 50,001)
Fig 12 – Assessed Position for FERTIL
Fig 13 – Energy Behaviours and Practices Assessment
Fig 14 – Energy Benchmarked Position for FERTIL 1 Plant
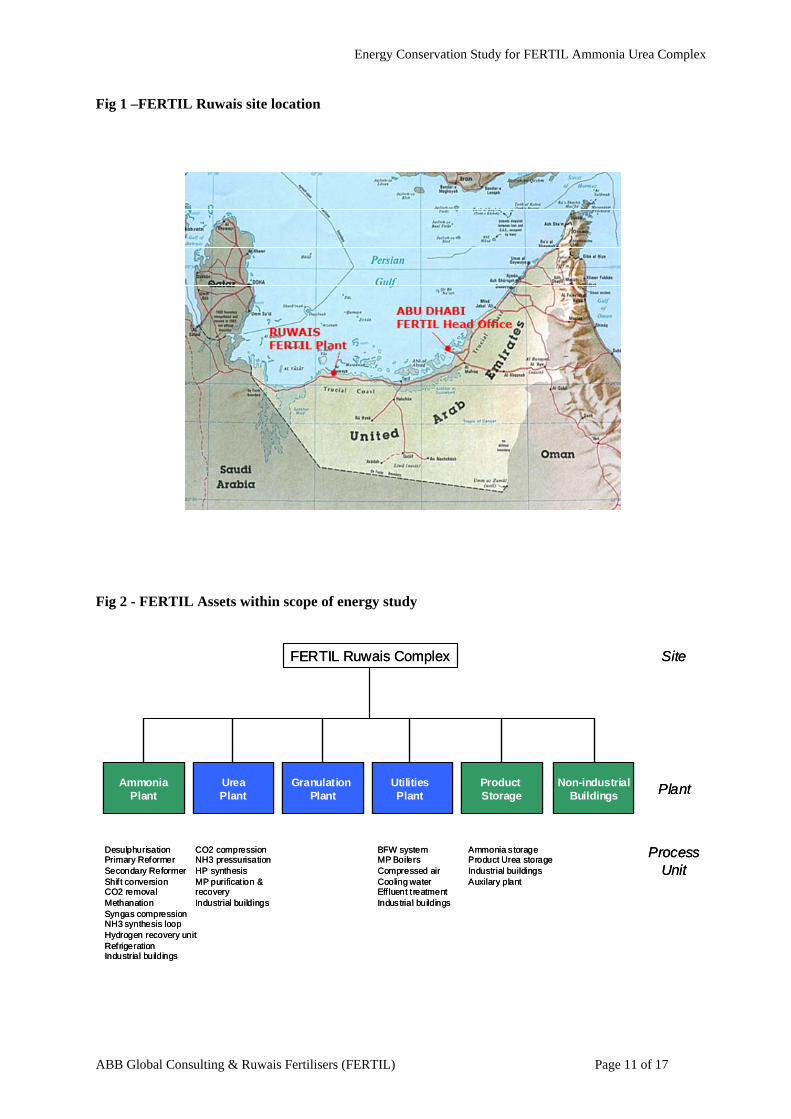
Energy Conservation Study for FERTIL Ammonia Urea Complex
ABB Global Consulting & Ruwais Fertilisers (FERTIL) Page 11 of 17
Fig 1 –FERTIL Ruwais site location
Fig 2 - FERTIL Assets within scope of energy study
FERTIL Ruwais Complex Site
Plant
DesulphurisationPrimary ReformerSecondary ReformerShif t conversionCO2 removalMethanationSyngas compressionNH3 synthesis loopHydrogen recovery unitRefrigerationIndustrial buildings
CO2 compressionNH3 pressurisationHP synthesisMP purificat ion & recoveryIndustrial buildings
BFW systemMP BoilersCompressed airCooling waterEff luent t reatmentIndus trial buildings
ProcessUnit
Ammonia s torageProduct Urea storageIndustrial buildingsAuxilary plant
AmmoniaPlant
UreaPlant
UtilitiesPlant
Granulation Plant
Product Storage
Non-industrialBuildings
AmmoniaPlant
AmmoniaPlant
UreaPlantUreaPlant
UtilitiesPlant
UtilitiesPlant
Granulation Plant
Granulation Plant
Product StorageProduct Storage
Non-industrialBuildings
Non-industrialBuildings
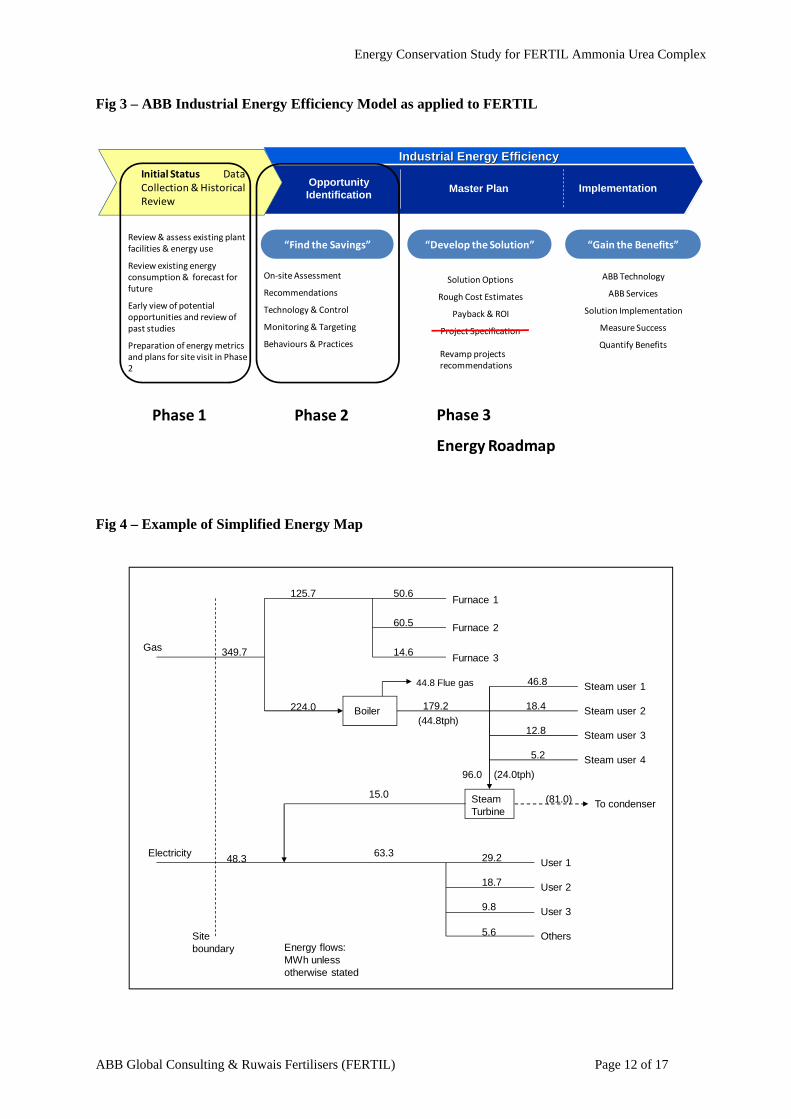
Energy Conservation Study for FERTIL Ammonia Urea Complex
ABB Global Consulting & Ruwais Fertilisers (FERTIL) Page 12 of 17
Fig 3 – ABB Industrial Energy Efficiency Model as applied to FERTIL
Fig 4 – Example of Simplified Energy Map
“Find the Savings” “Develop the Solution” “Gain the Benefits”
On‐site Assessment
Recommendations
Technology & Control
Monitoring & Targeting
Behaviours & Practices
Solution Options
Rough Cost Estimates
Payback & ROI
Project Specification
ABB Technology
ABB Services
Solution Implementation
Measure Success
Quantify Benefits
Industrial Energy EfficiencyIndustrial Energy Efficiency
Opportunity Identification
ImplementationMaster PlanInitial Status Data Collection & Historical Review
Review & assess existing plant facilities & energy use
Review existing energy consumption & forecast for future
Early view of potential opportunities and review of past studies
Preparation of energy metrics and plans for site visit in Phase 2
Phase 2Phase 1 Phase 3
Energy Roadmap
Revamp projects recommendations
Furnace 1
Furnace 2
Furnace 3
50.6
60.5
14.6
125.7
Gas 349.7
Electricity48.3
224.0 Boiler 179.2
(44.8tph)
SteamTurbine
Steam user 1
Steam user 2
Steam user 3
Steam user 4
46.8
18.4
12.8
5.2
96.0 (24.0tph)
(81.0) To condenser15.0
63.3 29.2
18.7
9.8
5.6
User 1
User 2
User 3
OthersSiteboundary Energy flows:
MWh unlessotherwise stated
44.8 Flue gas
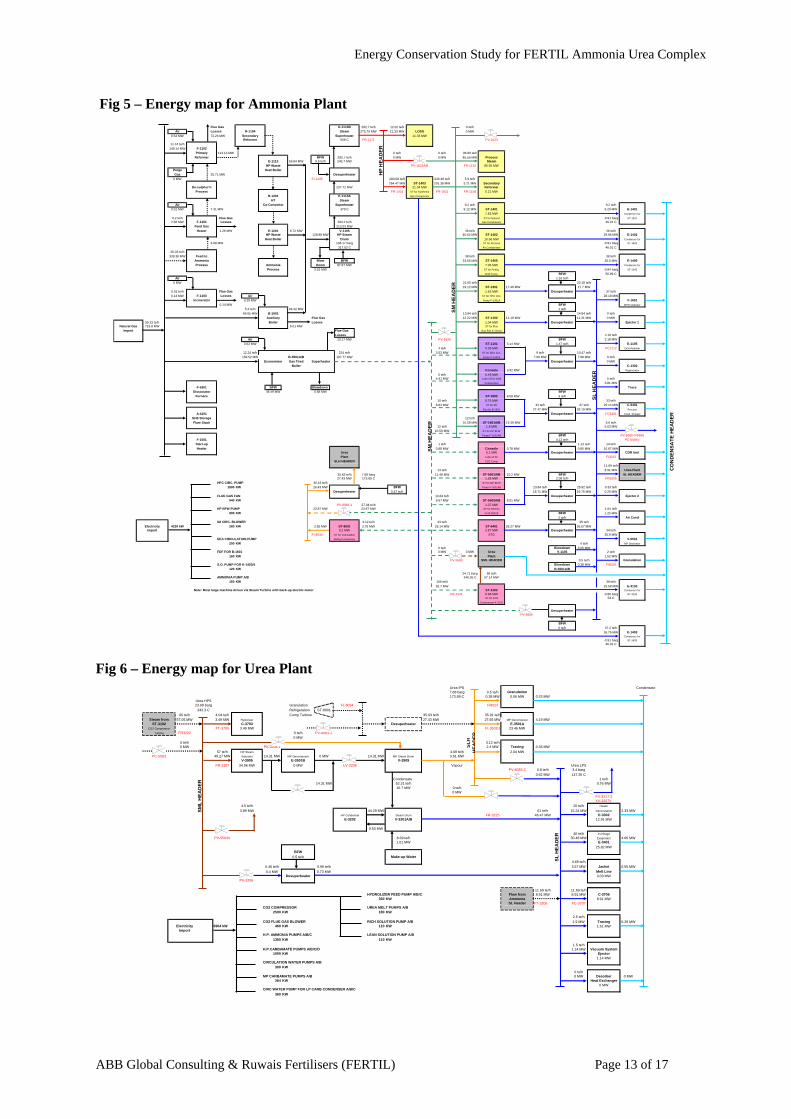
Energy Conservation Study for FERTIL Ammonia Urea Complex
ABB Global Consulting & Ruwais Fertilisers (FERTIL) Page 13 of 17
Fig 5 – Energy map for Ammonia Plant
Fig 6 – Energy map for Urea Plant
Flue Gas E-1110B 292.7 te/h 12.02 te/h 0 te/hAir Losses R-1104 Steam 275.79 MW 11.33 MW LOSS 0 MW
0.54 MW 72.26 MW Secondary Superheater 11.33 MWReformer 508 C FR-1171 PV-1623
11.44 te/h
149.14 MW F-1102Primary 113.13 MW 0 te/h 0 te/h 96.89 te/h
Reformer BFW 292.7 te/h 0 MW 0 MW 85.55 MW ProcessE-1113 55.84 MW 9.5 te/h 245.7 MW Steam
HP Waste PV-1622A/B FR-1152 85.55 MWPurge Heat BoilerGas 35.71 MW Desuperheater
0 MW FI-1135 280.68 te/h 243.48 te/h 5.9 te/h
264.47 MW ST-1403 216.38 MW 5.21 MW SecondaryDe-sulphur'n 237.72 MW 21.34 MW Reformer
Process FR-1431 ST for Synthesis FR-1621 FR-1158 5.21 MWR-1201 E-1110A Gas Compressor
HT SteamAir Co-Convertor Superheater 9.2 te/h 9.2 te/h
0.01 MW 7.41 MW 379 C 8.12 MW ST-1401 6.29 MW E-14011.83 MW Condenser for
0.2 te/h Flue Gas ST for Natural -0.91 barg ST-1401
2.58 MW F-1101 Losses 283.2 te/h Gas Compressor 46.01 CFeed Gas 213.03 MW
Heater 1.26 MW E-1201 8.72 MW V-1105 46 te/h 46 te/hHP Waste 128.88 MW HP Steam 40.62 MW ST-1402 29.96 MW E-1402
Heat Boiler Drum 10.66 MW Condenser for
6.08 MW 108.17 barg ST for Process -0.91 barg ST-1402
317.52 C Air Compressor 46.01 C26.03 te/h
339.38 MW Feed to 38 te/h 38 te/hAmmonia Blow BFW 33.55 MW ST-1405 26.5 MW E-1405Process Ammonia Down 87.67 MW 7.06 MW Condenser for
Process 3.52 MW ST for Refrig. -0.84 barg ST-1405
NH3 Comp. BFW 56.99 CAir 1.53 te/h
0 MW 21.65 te/h 23.18 te/h19.12 MW ST-1301 17.49 MW 17.7 MW
0.01 te/h Flue Gas 1.63 MW Desuperheater 37 te/h0.14 MW F-1103 Losses Air ST for HPC Circ. 28.19 MW
Incinerator 0.29 MW Pump P-1301A V-1601
0.14 MW BFW BFW Dearator
5.3 te/h 64.32 MW 1 te/h69.05 MW B-1601 13.84 te/h 14.84 te/h 0 te/h
Auxiliary Flue Gas 12.22 MW ST-1102 11.18 MW 11.31 MW 0 MW
55.22 te/h Boiler Losses 1.04 MW Desuperheater Ejector 1Natural Gas 719.8 MW 5.01 MW ST for Flue
Import Flue Gas Gas Fan K-1101A
Losses 4.18 te/hAir 10.17 MW PV-1626 BFW 3.18 MW
0.62 MW ST-1101 3.14 MW 1.47 te/h E-1105
4 te/h 0.39 MW FC1112 DEA Reboiler
12.24 te/h 224 te/h 3.53 MW ST for DEA Circ. 9 te/h 10.47 te/h159.52 MW B-5501A/B 197.77 MW Pump P-1101A 7.06 MW 7.98 MW 0 te/h
Economiser Gas Fired Superheater Desuperheater 0 MWBoiler C-1302
Console 3.92 MW Regenerator
5 te/h 0.49 MW4.41 MW Lube Oil for NH3 5 te/h
Compressor 3.81 MWF-5301 BFW Blowdown Trace
Dissociator 48.49 MW 0.68 MW BFWFurnace ST-1602 8.08 MW 3 te/h
10 te/h 0.75 MW 33 te/h8.83 MW ST for FD 34 te/h 37 te/h 25.14 MW C-5401
Fan for B-1601 27.47 MW 28.19 MW Process
A-4101 Desuperheater FC5401 Cond. Stripper
NH3 Storage 12 te/h
Flare Stack 10.59 MW ST-1601A/B 19.39 MW 6.6 te/h12 te/h 1.8 MW 5.03 MW
10.59 MW ST for HP BFW
Pump P-1601AB BFW PV-5565-V/5569F-1501 0.12 te/h PC-5565V
Start-up 1 te/h 1.12 te/h 14 te/h
Heater 0.88 MW Console 0.78 MW 0.85 MW 10.67 MWUrea 0.1 MW Desuperheater CDR UnitPlant Lube oil for FI3023
SLH HEADER CO2 Comp
11.69 te/h
13 te/h 8.91 MW Urea Plant
35.63 te/h 7.68 barg 11.48 MW ST-5501A/B 10.2 MW BFW SL HEADER27.43 MW 173.89 C 1.28 MW 2.08 te/h FR3205
HPC CIRC. PUMP 30.16 te/h ST for MP BFW
1500 KW 26.43 MW BFW Pump P-5501AB 23.84 te/h 25.92 te/h 0.33 te/hDesuperheater 5.47 te/h 18.71 MW 19.75 MW 0.25 MW
FLUE GAS FAN 10.84 te/h Desuperheater Ejector 2940 KW 9.57 MW ST-5502A/B 8.51 MW
PV-8083-1 27.04 te/h 1.07 MWHP BFW PUMP 23.87 MW 23.87 MW ST for FD Fan 1.64 te/h
900 KW for B-5501B BFW 1.25 MW2 te/h Air Cond
N2 CIRC. BLOWER 3.12 te/h 33 te/h 35 te/hElectricity 4230 kW 260 KW 2.56 MW ST-8001 2.76 MW 29.14 MW ST-6401 26.27 MW 26.67 MW
Import 0.2 MW 2.87 MW Desuperheater 34 te/hFI-8034 ST for Granulation STG 25.9 MW
DEA CIRCULATION PUMP Refrig Compressor V-5501200 KW 4 te/h MP Deaerator
0 te/h Blowdown 3.05 MWFDF FOR B-1601 0 MW 0 MW Urea V-1105 2 te/h
160 KW Plant 1.52 MWPV-5563 SML HEADER 0.5 te/h Granulation
S.O. PUMP FOR K-1403/4 Blowdown 0.38 MW FI8029120 KW B-5501A/B
24.71 barg 66 te/hAMMONIA PUMP A/B 346.26 C 57.14 MW
150 KW 105 te/h 39 te/h
92.7 MW 25.58 MW E-3103Note: Most large machine driven via Steam Turbine with back-up electric motor ST-3102 Condenser for
FR-3141 9.98 MW -0.86 barg ST-3102
ST for CO2 54 CCompressor K-3102
DesuperheaterPV-5565
BFW
0 te/h 37.2 te/h
26.75 MW E-1403Condenser for
-0.91 barg ST-1403
46.01 C
CO
ND
EN
SA
TE
HE
AD
ER
SL
HE
AD
ER
SM
HE
AD
ER
SM
HE
AD
ER
HP
HE
AD
ER
Urea IPS Condensate7.68 barg 0.5 te/h Granulation173.89 C 0.38 MW 0.06 MW 0.33 MW
Urea HPS23.99 barg Granulation FI-8034 FI8023
343.3 C Refrigeration ST-8001
66 te/h 4.04 te/h Comp Turbine 35.63 te/h 35.91 te/hSteam from 57.05 MW 3.49 MW Hydrolizer 27.43 MW 27.65 MW MP Decomposer 4.19 MW
ST-3102 C-3703 Desuperheater E-3501ACO2 Compressor FT-3705 3.49 MW FI-3502U 23.46 MW
Turbine FR3202 0 te/h PV-8083-10 MW
0 te/h 3.12 te/h0 MW PIC3208.1 2.4 MW Tracing 0.36 MW
57 te/h HP Steam 4.69 te/h 2.04 MWPC-5563 49.27 MW Saturator 14.31 MW MP Decomposer 0 MW 14.31 MW MP Steam Drum 3.61 MW
V-3905 E-3501B V-3909
FR-3207 34.96 MW 0 MW LV-3208 Vapour Urea LPSPV-8083-2 0.8 te/h 3.4 barg
0.62 MW 147.35 CCondensate 1 te/h
14.31 MW 52.31 te/h 0.76 MW10.7 MW 0 te/h
0 MWPV-3217-2XV-3207V
4.5 te/h 20 te/h Heater
3.89 MW 44.29 MW 61 te/h 15.24 MW Recirculation 2.33 MWHP Condenser Steam Drum FR-3225 46.47 MW E-3302
E-3202 V-3201A/B 12.91 MW
9.53 MW
40 te/h 1st Stage
PV-5564V 8.69 te/h 30.48 MW Evaporator 4.66 MW1.01 MW E-3401
25.82 MWBFW
0.5 te/h Make-up Water
4.69 te/h0.46 te/h 0.96 te/h 3.57 MW Jacket 0.55 MW
0.4 MW 0.73 MW Melt LineDesuperheater 3.03 MW
PV-3206
11.69 te/h 11.69 te/hHYDROLIZER FEED PUMP A/B/C Flow from 8.91 MW 8.91 MW C-3706
330 KW Ammonia 8.91 MWSL Header FT-3205 FC-3707
CO2 COMPRESSOR UREA MELT PUMPS A/B2500 KW 180 KW
2.5 te/hCO2 FLUE GAS BLOWER RICH SOLUTION PUMP A/B 1.9 MW Tracing 0.29 MW
Electricity 6964 kW 460 KW 110 KW 1.61 MWImport
H.P. AMMONIA PUMPS A/B/C LEAN SOLUTION PUMP A/B1350 KW 110 KW
1.5 te/hH.P.CARBAMATE PUMPS A/B/C/D 1.14 MW Vacuum System
1000 KW Ejector1.14 MW
CIRCULATION WATER PUMPS A/B300 KW
0 te/hMP CARBAMATE PUMPS A/B 0 MW Desorber 0 MW
264 KW Heat Exchanger0 MW
CIRC WATER PUMP FOR LP CARB CONDENSER A/B/C
360 KW
SM
L H
EA
DE
R
SL
H
HE
AD
ER
SL
HE
AD
ER
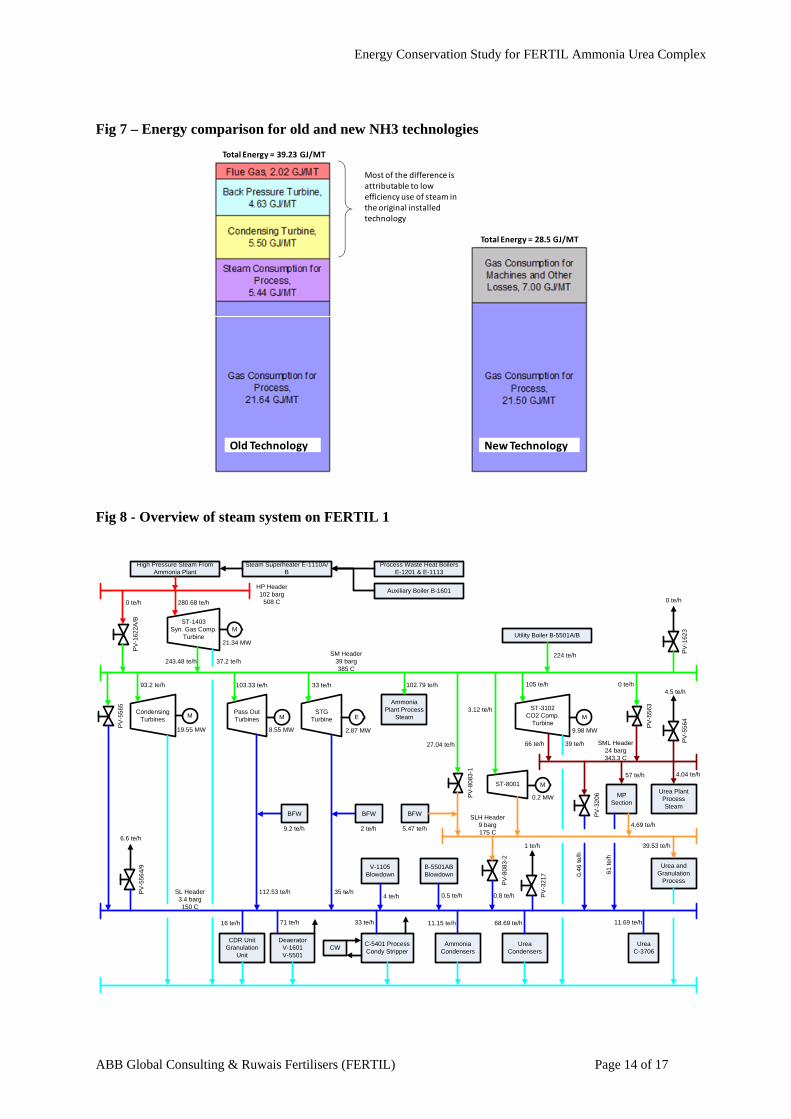
Energy Conservation Study for FERTIL Ammonia Urea Complex
ABB Global Consulting & Ruwais Fertilisers (FERTIL) Page 14 of 17
Fig 7 – Energy comparison for old and new NH3 technologies
Fig 8 - Overview of steam system on FERTIL 1
Total Energy = 39.23 GJ/MT
Old Technology New Technology
Total Energy = 28.5 GJ/MT
Most of the difference is attributable to low efficiency use of steam in the original installed technology
High Pressure Steam From Ammonia Plant
Process Waste Heat Boilers E-1201 & E-1113
Auxiliary Boiler B-1601
Steam Superheater E-1110A/B
ST-1403Syn. Gas Comp.
Turbine
PV
-16
22
A/B
Condensing Turbines
Pass Out Turbines
M
PV
-55
65 STG Turbine
Utility Boiler B-5501A/B
PV
-55
63
Ammonia Plant Process
Steam
ST-3102CO2 Comp.
Turbine
PV
-556
4
Urea Plant Process Steam
M E
M
MP Section
M
Urea and Granulation
Process
ST-8001 M
PV
-808
3-1
PV
-16
23
PV
-320
6
PV
-808
3-2
UreaC-3706
Urea Condensers
Ammonia Condensers
C-5401 Process Condy Stripper
CWDeaerator
V-1601V-5501
HP Header102 barg
508 C
SM Header39 barg385 C
SML Header24 barg343.3 C
SLH Header9 barg175 C
SL Header3.4 barg150 C
PV
-556
4/9
PV
-321
7
280.68 te/h0 te/h
243.48 te/h
21.34 MW
102.79 te/h33 te/h
2.87 MW
93.2 te/h
37.2 te/h
103.33 te/h
27.04 te/h
3.12 te/h
224 te/h
19.55 MW 8.55 MW
105 te/h 0 te/h
66 te/h 39 te/h
9.98 MW
0 te/h
112.53 te/h 35 te/h
V-1105 Blowdown
B-5501AB Blowdown
4 te/h 0.5 te/h
71 te/h 33 te/h
6.6 te/h
BFW BFW
9.2 te/h 2 te/h
11.15 te/h
0.46
te/
h
61 t
e/h
4.69 te/h
57 te/h 4.04 te/h
4.5 te/h
39.53 te/h
11.69 te/h68.69 te/h
1 te/h
0.8 te/h
0.2 MW
BFW
5.47 te/h
CDR UnitGranulation
Unit
16 te/h
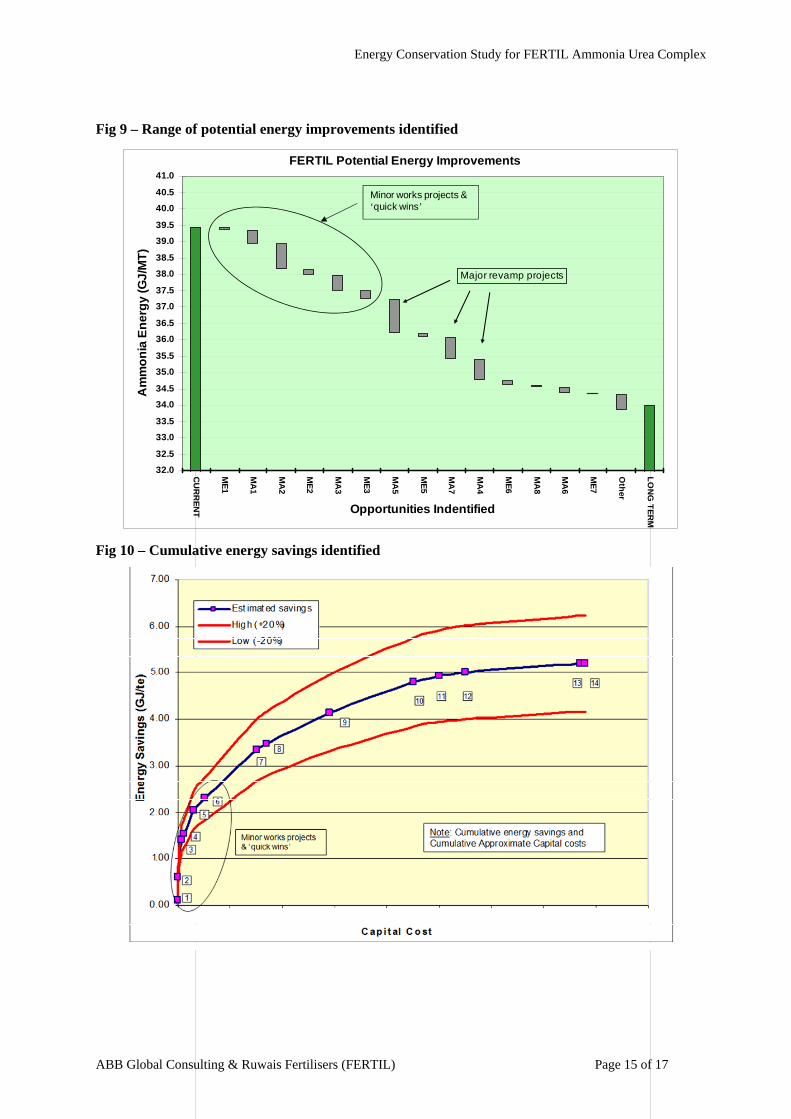
Energy Conservation Study for FERTIL Ammonia Urea Complex
ABB Global Consulting & Ruwais Fertilisers (FERTIL) Page 15 of 17
Fig 9 – Range of potential energy improvements identified
Fig 10 – Cumulative energy savings identified
FERTIL Potential Energy Improvements
32.0
32.5
33.0
33.5
34.0
34.5
35.0
35.5
36.0
36.5
37.0
37.5
38.0
38.5
39.0
39.5
40.0
40.5
41.0
CU
RR
EN
T
ME
1
MA
1
MA
2
ME
2
MA
3
ME
3
MA
5
ME
5
MA
7
MA
4
ME
6
MA
8
MA
6
ME
7
Oth
er
LO
NG
TE
RM
Opportunities Indentified
Am
mo
nia
En
erg
y (G
J/M
T)
Major revamp projects
Minor works projects & ‘quick wins’
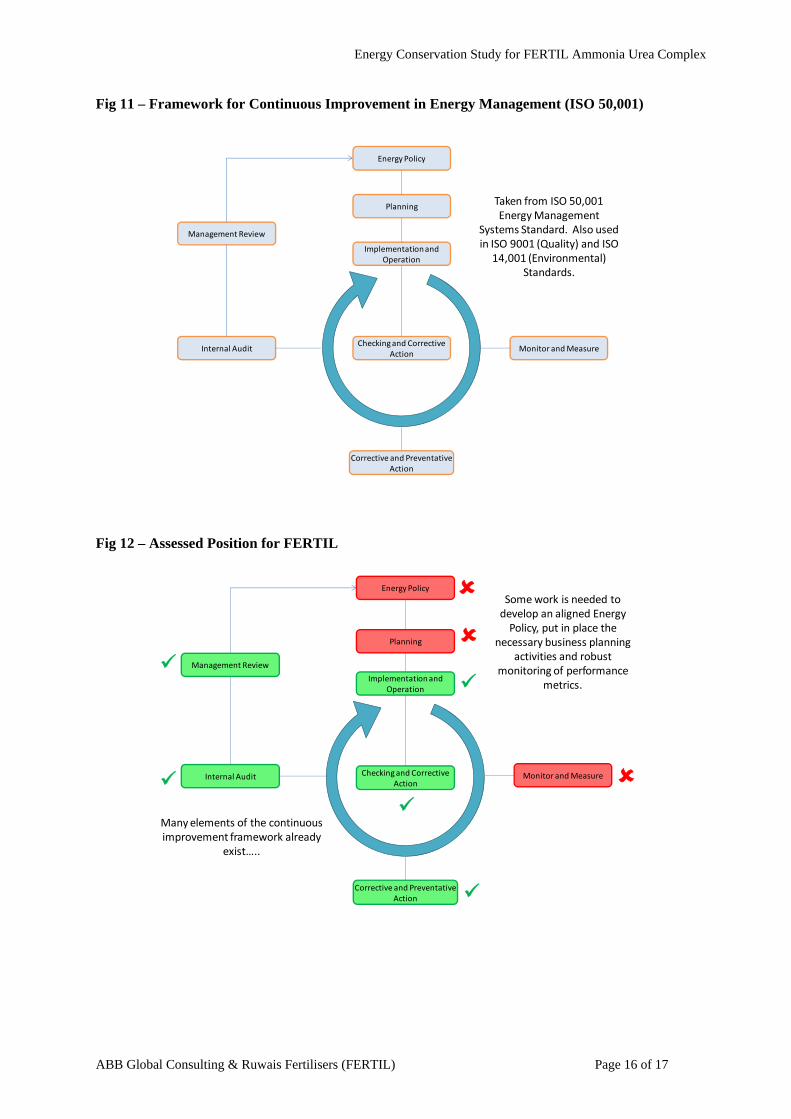
Energy Conservation Study for FERTIL Ammonia Urea Complex
ABB Global Consulting & Ruwais Fertilisers (FERTIL) Page 16 of 17
Fig 11 – Framework for Continuous Improvement in Energy Management (ISO 50,001)
Fig 12 – Assessed Position for FERTIL
Energy Policy
Planning
Implementation and Operation
Corrective and Preventative Action
Monitor and MeasureChecking and Corrective
Action
Management Review
Internal Audit
Taken from ISO 50,001 Energy Management
Systems Standard. Also used in ISO 9001 (Quality) and ISO
14,001 (Environmental) Standards.
Energy Policy
Planning
Implementation and Operation
Corrective and Preventative Action
Monitor and MeasureChecking and Corrective Action
Management Review
Internal Audit
Many elements of the continuous improvement framework already
exist…..
Some work is needed to develop an aligned Energy Policy, put in place the
necessary business planning activities and robust
monitoring of performance metrics.
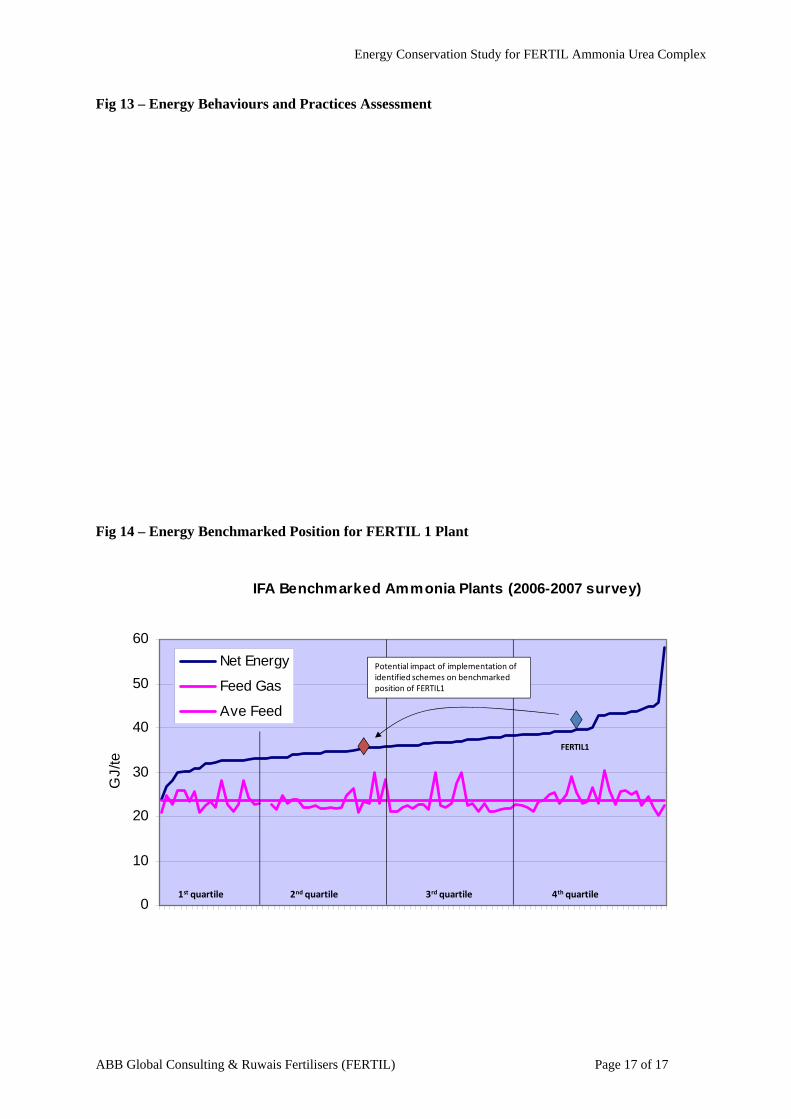
Energy Conservation Study for FERTIL Ammonia Urea Complex
ABB Global Consulting & Ruwais Fertilisers (FERTIL) Page 17 of 17
Fig 13 – Energy Behaviours and Practices Assessment
Fig 14 – Energy Benchmarked Position for FERTIL 1 Plant
IFA Benchmarked Ammonia Plants (2006-2007 survey)
0
10
20
30
40
50
60
GJ/
te
Net Energy
Feed Gas
Ave Feed
1st quartile 2nd quartile 3rd quartile 4th quartile
Potential impact of implementation of identified schemes on benchmarked position of FERTIL1
FERTIL1
Haldor Topsøe A/S – Nymøllevej 55 2800 Kgs. Lyngby - Denmark
Catalysing profit margin with LK-853 FENCE™ 1 / 11
2012
Information contained herein is confidential; it may not be used for anypurpose other than for which it has been issued, and may not be used byor disclosed to third parties without written approval of Haldor Topsøe A/S.
Catalysing profit margin with LK-853 FENCE™
A new generation of Topsøe low methanol LTS catalyst Kristina Svennerberg (krsv@topsøe.dk)
Haldor Topsøe A/S, Denmark
Presented at the 25th AFA Int’l. Technical Fertilizers Conference & Exhibition 26–28 June 2012, Beirut, Lebanon
Abstract
In an increasingly competitive market, catalyst selection is of significant importance when it comes to optimising performance in ammonia and hydrogen plants. By installing high performance catalysts, it is possible to improve the overall plant efficiency and en-sure optimal feedstock utilisation, thereby increasing profit margin. Ground-breaking research within the area of catalysts for ammonia and hydrogen production has resulted in a new low methanol LTS catalyst, LK-853 FENCE™, which has now been commer-cialised. This paper will highlight the developmental work, the unique catalyst features and discuss how ammonia and hydrogen producers can benefit from Topsøe’s new developments.
Introduction
Industrial plants using catalytic processes depend on outside sources to provide fun-damental and applied research, technical know-how and to produce and supply cata-lysts. Internationally, many companies have competencies in one or two of these areas, but Topsøe is active in all the above mentioned fields. For almost half a century, Topsøe has been one of the main suppliers of catalysts and technology for the ammonia and hydrogen industry. Through introduction of new cata-lysts, new equipment design and extensive process optimisation studies, Topsøe has contributed significantly to the development of efficient ammonia production technology. The unique combination of catalyst know-how and extensive experience within licensing of technology makes Topsøe a valuable business partner. In the last decades, 50% of all new ammonia plants have been constructed using Topsøe technology and catalysts.
Haldor Topsøe A/S – Nymøllevej 55 2800 Kgs. Lyngby - Denmark
Catalysing profit margin with LK-853 FENCE™ 2 / 11
2012
Information contained herein is confidential; it may not be used for anypurpose other than for which it has been issued, and may not be used byor disclosed to third parties without written approval of Haldor Topsøe A/S.
In traditional ammonia plants, the final conversion of carbon monoxide to the hydrogen required for ammonia synthesis takes place across the low temperature shift (LTS) catalyst. This makes the LTS catalyst one of the most important catalysts in the plant and even small changes in its performance will have a significant impact on operational costs. By choosing a high performance LTS catalyst, the overall plant efficiency can be greatly boosted, leading to significant production gains. Topsøe’s well-known LK series, LK-821-2 and the low methanol LK-823, is the result of a close cooperation between the industry, Topsøe’s Research and Development de-partment and Topsøe’s catalyst manufacturing facilities. These catalysts meet all the requirements of ammonia and hydrogen manufacturing plants and are well-known in the industry for their outstanding performance. Currently, more than 180 Topsøe LTS charges are in operation globally, making Top-søe the world-leading supplier of LTS catalysts. The unique qualities of Topsøe’s low methanol LTS catalyst are widely recognised within the industry, and approximately 40% of Topsøe’s LTS references are LK-823 charges, making Topsøe the preferred supplier of low methanol LTS catalyst. Topsøe’s efforts to continuously optimise the product portfolio in order to meet the in-dustry’s needs have resulted in a new generation of low methanol LTS catalyst, the LK-853 FENCE™. LK-853 FENCE™ is the latest state-of-the-art catalyst from Topsøe for ammonia and hydrogen production, offering extraordinary advantages for our clients. Since the late 1990s, the predecessor, LK-823, has been recognised as the most active, commer-cially available low methanol LTS catalyst. During the development of LK-853 FENCE™, LK-823 has been used as the benchmark catalyst. The benefits of LK-853 FENCE™ include consistently higher conversion rates, increased poison resistance, low methanol formation and prolonged catalyst lifetimes.
Haldor Topsøe A/S – Nymøllevej 55 2800 Kgs. Lyngby - Denmark
Catalysing profit margin with LK-853 FENCE™ 3 / 11
2012
Information contained herein is confidential; it may not be used for anypurpose other than for which it has been issued, and may not be used byor disclosed to third parties without written approval of Haldor Topsøe A/S.
Background
A fundamental understanding is the key to all new developments, and therefore also the key to providing the best products and service to our clients. Consequently, a significant part of Topsøe’s research activities are focused on long-term and fundamental re-search. The objective for Topsøe’s research efforts within the area of LTS conversion is at all times to provide our clients with state-of-the-art products that meet the requirements for cost-effective ammonia and hydrogen production. When it comes to obtaining optimal performance, a high performance LTS catalyst must be optimised with regard to key parameters such as activity, stability, selectivity and poison resistance. The focus for the extensive research activities behind LK-853 FENCE™ has been to develop a cata-lyst superior in all aspects for efficient low temperature shift conversion. In the following, results obtained by Topsøe’s research team and the FENCE™ technology will be pre-sented.
FENCE™ technology
The significant research efforts focused on continuously optimising Topsøe’s catalysts for low temperature shift conversion have resulted in a unique fundamental knowledge concerning the three-dimensional structural arrangements and deactivation mecha-nisms of the LTS catalyst. The knowledge gathered throughout the years has been combined and constitutes the foundation of the FENCE™ technology, which is the basis for Topsøe’s new generation of low methanol LTS catalyst, the LK-853 FENCE™. The scientific background for the FENCE™ technology will be outlined below. As all heterogeneous catalysts, the LTS catalyst is known to deactivate with time. The main deactivation mechanism is sintering of the active crystals constituting the catalyst. In the case of LTS catalysts, crystals of copper, zinc oxide and alumina are present and the size of the crystals will all increase with time.
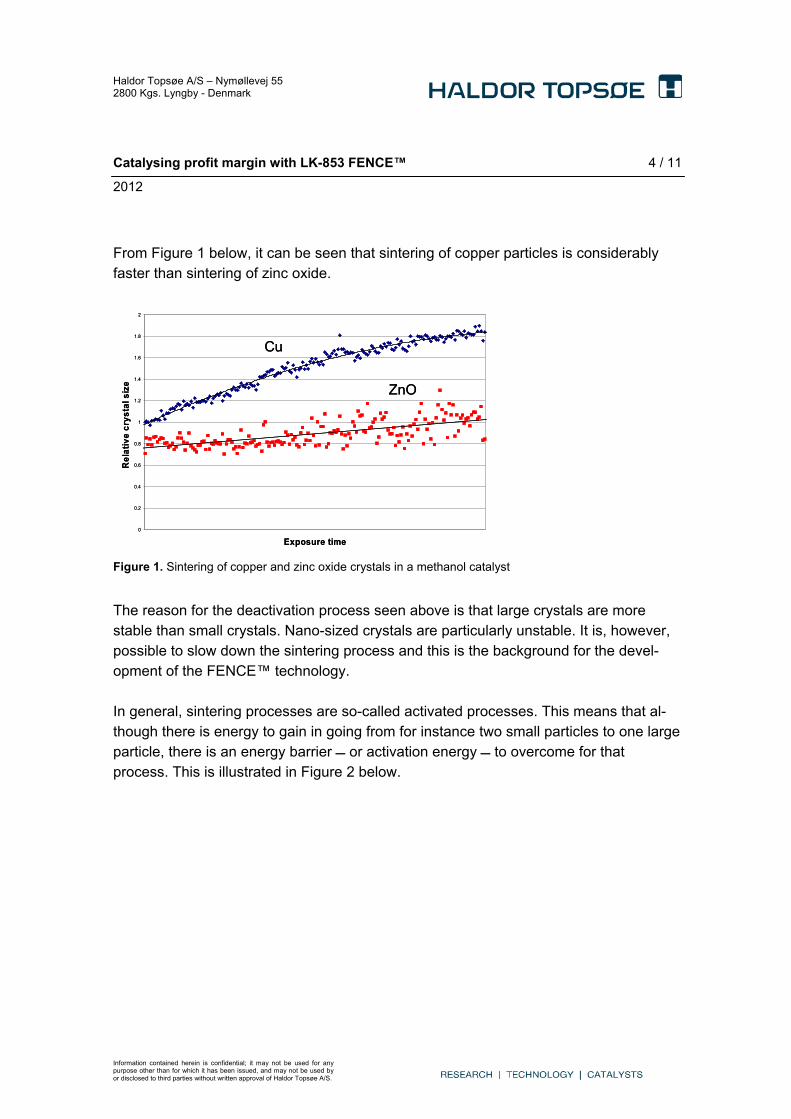
Haldor Topsøe A/S – Nymøllevej 55 2800 Kgs. Lyngby - Denmark
Catalysing profit margin with LK-853 FENCE™ 4 / 11
2012
Information contained herein is confidential; it may not be used for anypurpose other than for which it has been issued, and may not be used byor disclosed to third parties without written approval of Haldor Topsøe A/S.
From Figure 1 below, it can be seen that sintering of copper particles is considerably faster than sintering of zinc oxide.
Figure 1. Sintering of copper and zinc oxide crystals in a methanol catalyst
The reason for the deactivation process seen above is that large crystals are more stable than small crystals. Nano-sized crystals are particularly unstable. It is, however, possible to slow down the sintering process and this is the background for the devel-opment of the FENCE™ technology. In general, sintering processes are so-called activated processes. This means that al-though there is energy to gain in going from for instance two small particles to one large particle, there is an energy barrier or activation energy to overcome for that process. This is illustrated in Figure 2 below.
Cu
ZnO
0
0.2
0.4
0.6
0.8
1
1.2
1.4
1.6
1.8
2
Exposure time
Re
lati
ve
cry
sta
l siz
e
Cu
ZnO
0
0.2
0.4
0.6
0.8
1
1.2
1.4
1.6
1.8
2
Exposure time
Re
lati
ve
cry
sta
l siz
e
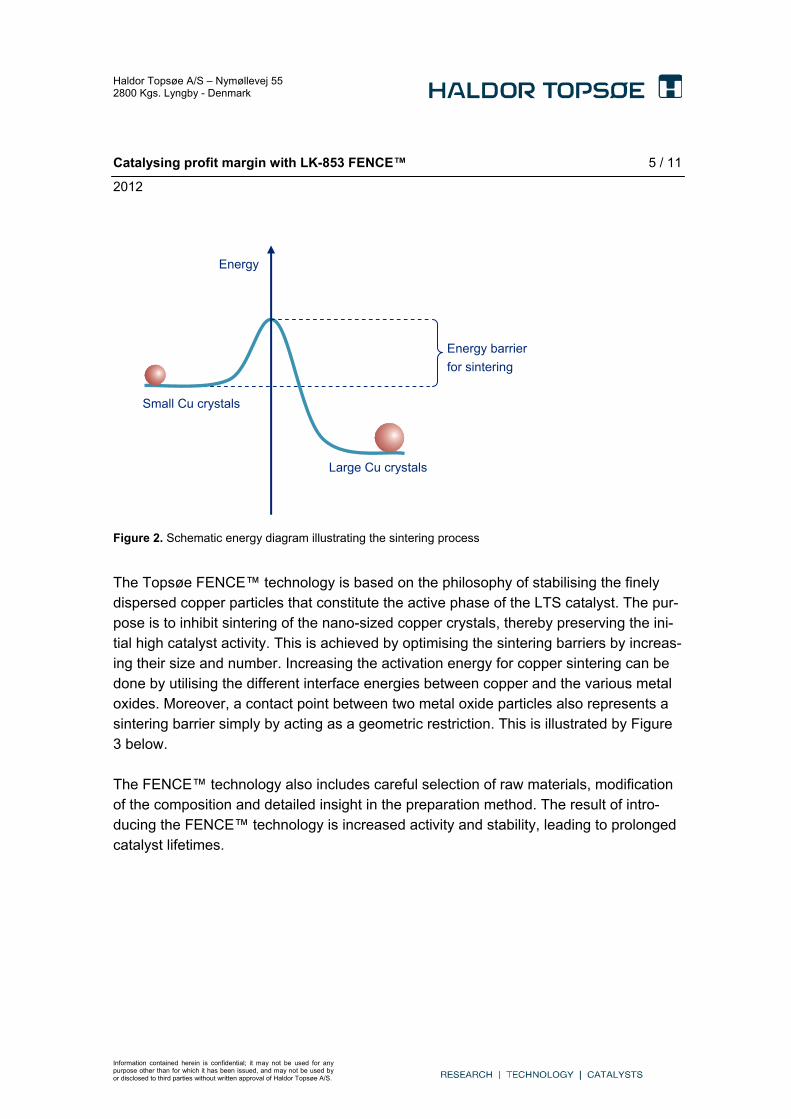
Haldor Topsøe A/S – Nymøllevej 55 2800 Kgs. Lyngby - Denmark
Catalysing profit margin with LK-853 FENCE™ 5 / 11
2012
Information contained herein is confidential; it may not be used for anypurpose other than for which it has been issued, and may not be used byor disclosed to third parties without written approval of Haldor Topsøe A/S.
Figure 2. Schematic energy diagram illustrating the sintering process
The Topsøe FENCE™ technology is based on the philosophy of stabilising the finely dispersed copper particles that constitute the active phase of the LTS catalyst. The pur-pose is to inhibit sintering of the nano-sized copper crystals, thereby preserving the ini-tial high catalyst activity. This is achieved by optimising the sintering barriers by increas-ing their size and number. Increasing the activation energy for copper sintering can be done by utilising the different interface energies between copper and the various metal oxides. Moreover, a contact point between two metal oxide particles also represents a sintering barrier simply by acting as a geometric restriction. This is illustrated by Figure 3 below. The FENCE™ technology also includes careful selection of raw materials, modification of the composition and detailed insight in the preparation method. The result of intro-ducing the FENCE™ technology is increased activity and stability, leading to prolonged catalyst lifetimes.
Energy
Small Cu crystals
Energy barrier
for sintering
Large Cu crystals
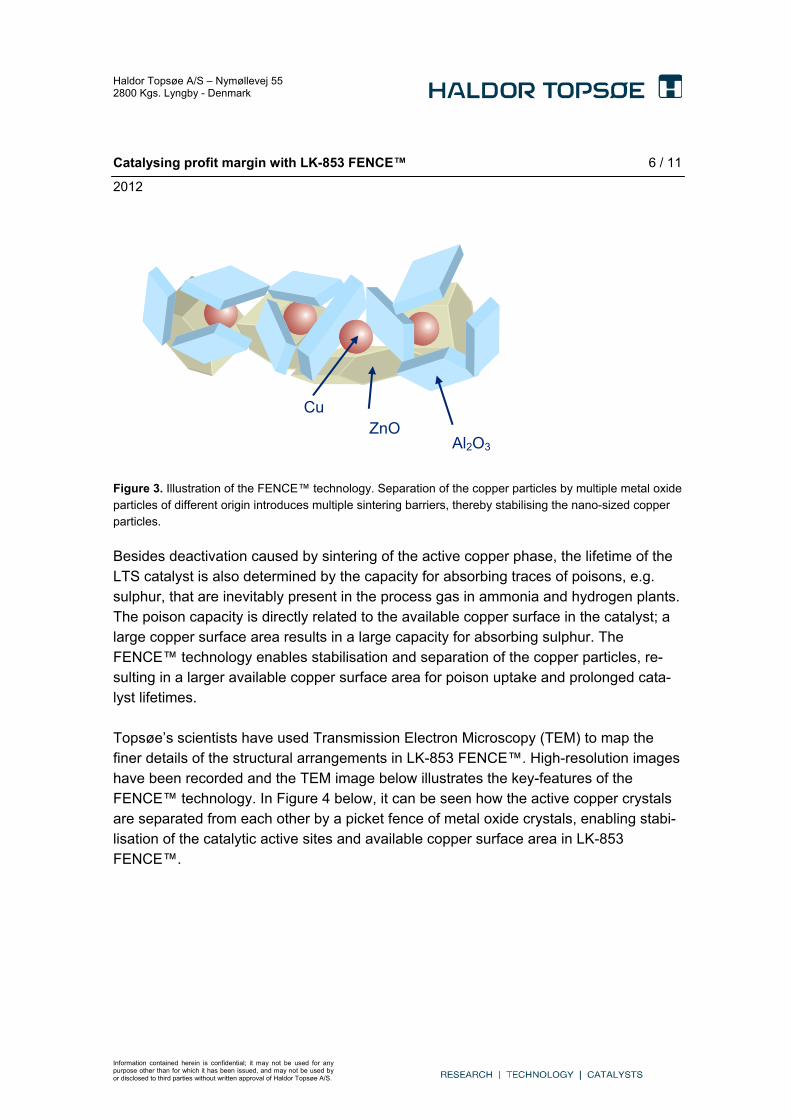
Haldor Topsøe A/S – Nymøllevej 55 2800 Kgs. Lyngby - Denmark
Catalysing profit margin with LK-853 FENCE™ 6 / 11
2012
Information contained herein is confidential; it may not be used for anypurpose other than for which it has been issued, and may not be used byor disclosed to third parties without written approval of Haldor Topsøe A/S.
Figure 3. Illustration of the FENCE™ technology. Separation of the copper particles by multiple metal oxide particles of different origin introduces multiple sintering barriers, thereby stabilising the nano-sized copper particles.
Besides deactivation caused by sintering of the active copper phase, the lifetime of the LTS catalyst is also determined by the capacity for absorbing traces of poisons, e.g. sulphur, that are inevitably present in the process gas in ammonia and hydrogen plants. The poison capacity is directly related to the available copper surface in the catalyst; a large copper surface area results in a large capacity for absorbing sulphur. The FENCE™ technology enables stabilisation and separation of the copper particles, re-sulting in a larger available copper surface area for poison uptake and prolonged cata-lyst lifetimes. Topsøe’s scientists have used Transmission Electron Microscopy (TEM) to map the finer details of the structural arrangements in LK-853 FENCE™. High-resolution images have been recorded and the TEM image below illustrates the key-features of the FENCE™ technology. In Figure 4 below, it can be seen how the active copper crystals are separated from each other by a picket fence of metal oxide crystals, enabling stabi-lisation of the catalytic active sites and available copper surface area in LK-853 FENCE™.
Cu ZnO
Al2O3
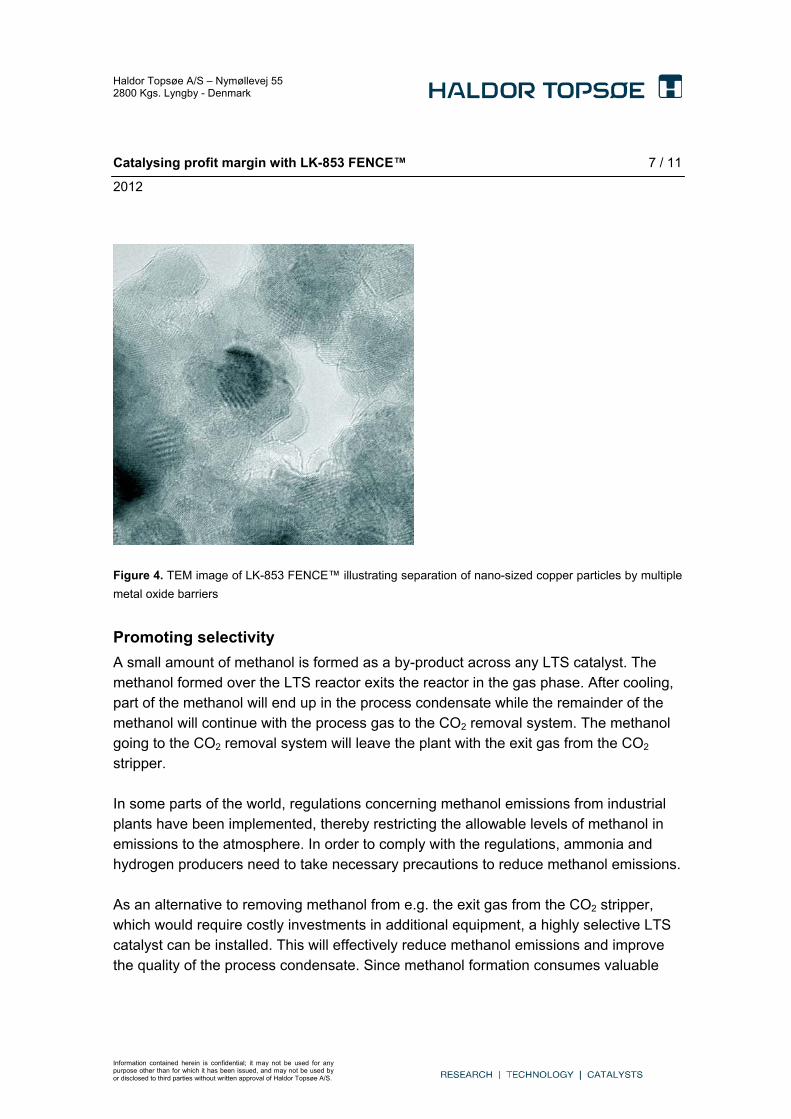
Haldor Topsøe A/S – Nymøllevej 55 2800 Kgs. Lyngby - Denmark
Catalysing profit margin with LK-853 FENCE™ 7 / 11
2012
Information contained herein is confidential; it may not be used for anypurpose other than for which it has been issued, and may not be used byor disclosed to third parties without written approval of Haldor Topsøe A/S.
Figure 4. TEM image of LK-853 FENCE™ illustrating separation of nano-sized copper particles by multiple
metal oxide barriers
Promoting selectivity
A small amount of methanol is formed as a by-product across any LTS catalyst. The methanol formed over the LTS reactor exits the reactor in the gas phase. After cooling, part of the methanol will end up in the process condensate while the remainder of the methanol will continue with the process gas to the CO2 removal system. The methanol going to the CO2 removal system will leave the plant with the exit gas from the CO2 stripper. In some parts of the world, regulations concerning methanol emissions from industrial plants have been implemented, thereby restricting the allowable levels of methanol in emissions to the atmosphere. In order to comply with the regulations, ammonia and hydrogen producers need to take necessary precautions to reduce methanol emissions. As an alternative to removing methanol from e.g. the exit gas from the CO2 stripper, which would require costly investments in additional equipment, a highly selective LTS catalyst can be installed. This will effectively reduce methanol emissions and improve the quality of the process condensate. Since methanol formation consumes valuable
Haldor Topsøe A/S – Nymøllevej 55 2800 Kgs. Lyngby - Denmark
Catalysing profit margin with LK-853 FENCE™ 8 / 11
2012
Information contained herein is confidential; it may not be used for anypurpose other than for which it has been issued, and may not be used byor disclosed to third parties without written approval of Haldor Topsøe A/S.
hydrogen, a low methanol LTS catalyst also offers additional benefits such as increased daily ammonia and hydrogen production. The research within the area of low methanol LTS catalysts has thus gained increased importance and focus.
During the development of LK-823, which was the first generation of low methanol LTS catalyst from Topsøe, extensive research efforts were carried out to uncover the critical parameters for methanol formation in low temperature shift. The development work in-cluded a fundamental study elucidating the effect of alkali metals on methanol forma-tion. The study demonstrated that the promoting of LK-823 with a carefully optimised level of alkali metals resulted in decreased methanol formation while still maintaining a high shift activity and poison resistance. Since the introduction in 1997, the LK-823 has been the world-leading low methanol LTS catalyst. It has therefore been the benchmark catalyst with regard to both activity and selectivity. It is a significant challenge to increase low temperature shift activity and at the same time suppress activity for methanol by-product formation. However, based on the knowledge gathered from more than a decade of industrial experience with LK-823 and continuous research efforts within the area of low methanol LTS catalysts, Topsøe has succeeded in developing a state-of-the-art catalyst where low temperature shift activity has been significantly increased. At the same time, by optimising the type and amount of promoters in the LK-853 FENCE™, the methanol formation is main-tained at the same level as for the predecessor, resulting in significant benefits.
LK-853 FENCE™ taking Topsøe’s world-leading position one step further
Almost 50 years of industrial experience as a world-leading supplier of LTS catalysts provides an invaluable basis for new catalyst developments. The predecessor and benchmark catalyst, LK-823, is currently the world-leading low methanol LTS catalyst recognised globally for its unique characteristics and outstanding performance. During testing and development of a new catalyst, numerous measurements are carried out to determine the activity and stability of the catalyst. In order to simulate real indus-trial operating conditions, the catalyst is subjected to long-term testing at typical low temperature shift operating conditions. The key features of LK-853 FENCE™, which are outlined below, have been confirmed by both extensive laboratory testing and industrial experience.
Haldor Topsøe A/S – Nymøllevej 55 2800 Kgs. Lyngby - Denmark
Catalysing profit margin with LK-853 FENCE™ 9 / 11
2012
Information contained herein is confidential; it may not be used for anypurpose other than for which it has been issued, and may not be used byor disclosed to third parties without written approval of Haldor Topsøe A/S.
Superior high and stable activity
From long-term testing and benchmarking against its predecessor, it is evident that LK-853 FENCE™ offers a considerably higher activity in comparison to LK-823. More-over, the results demonstrate that the stability of this new catalyst is highly satisfactory. As described above, the FENCE™ technology enables separation of the nano-sized copper particles by multiple metal oxide barriers, thereby stabilising the catalytic active sites and preserving the initial superior high activity. The outstanding stable activity of LK-853 FENCETM results in consistently higher CO conversion rates and significantly prolonged lifetimes compared to the benchmark cata-lyst.
Outstanding poison resistance
The poison capacity of a LTS catalyst is directly related to the copper surface area in the catalyst. The FENCE™ technology not only results in increased activity and stability of the LK-853 FENCE™ catalyst, but also a larger copper surface area available for poison uptake. Consequently, LK-853 FENCE™ has an outstanding poison resistance, resulting in prolonged catalysts lifetimes.
Excellent selectivity
As mentioned earlier on, it is a significant challenge to increase low temperature shift activity and at the same time maintain a high selectivity for the shift reaction. In order to obtain a superior selectivity, promoters are added to the LTS catalyst, thereby sup-pressing the activity for methanol formation. The remarkable selectivity of LK-853 FENCE™ has been achieved by carefully optimising the type and amounts of promot-ers that inhibit by-product formation. LK-853 FENCE™ minimises undesirable methanol formation across the LTS reactor, leading to increased daily production rates, reduced methanol emissions and better quality of the process condensate.
Catalysing profit margin with LK-853 FENCE™
With the use of Topsøe’s new high performance LTS catalyst, the LK-853 FENCE™, numerous benefits can be achieved. The characteristics described above makes it pos-sible to reduce operating costs and increase process efficiency. In the below, it will be illustrated how LK-853 FENCE™ can be used to increase profit margin in ammonia plants.
Haldor Topsøe A/S – Nymøllevej 55 2800 Kgs. Lyngby - Denmark
Catalysing profit margin with LK-853 FENCE™ 10 / 11
2012
Information contained herein is confidential; it may not be used for anypurpose other than for which it has been issued, and may not be used byor disclosed to third parties without written approval of Haldor Topsøe A/S.
The high and stable activity of LK-853 FENCE™ will allow operation at lower tempera-tures for an extended period of time, leading to more favourable equilibrium conditions and consistently low CO leakage from the LTS reactor. At first glance, it seems straight-forward to quantify the impact of a higher CO conversion on the production rate, but several factors should be taken into consideration in order to see the full effect:
Higher conversion results in less CO and more hydrogen at the outlet of the LTS reactor.
In the methanator, less hydrogen will therefore be consumed and less methane will be formed.
In the ammonia loop, a lower purge rate is required due to less methane in the make-up gas.
In the secondary reformer, more air has to be added in order to maintain the same H/N ratio.
Looking only at the front-end, the above contributions add up to a net gain of 3.4 mole of hydrogen per mole of extra CO converted in the LTS reactor. Thus, even a small re-duction in the CO leakage will lead to significant production gains. In order to illustrate the benefits of LK-853 FENCE™, a 1,500 MTPD ammonia plant will be used as an example. The higher activity, stability and sulphur capacity of LK-853 FENCE™ will result in an increased ammonia production compared to the benchmark catalyst. For an operating period of 5 years, which would be a typical lifetime for LK-823, this would add up to a total production gain of up around 7,000 metric tonnes of ammonia. When calculating the actual gain, the plant design should be taken into con-sideration, e.g. if it is equipped with a purge gas recovery unit in the ammonia loop. The production gain of 7,000 metric tonnes corresponds to a value of around 2,800,000 USD. In addition, it is an often overlooked fact that the formation of methanol consumes valu-able hydrogen and therefore inevitably leads to a lower ammonia production. Hence, significant benefits can be obtained by installing a low methanol LTS catalyst compared to a standard LTS catalyst. Below, the synthesis reaction from carbon dioxide to methanol is given:
CO2 + 3H2 CH3OH + H2O
Haldor Topsøe A/S – Nymøllevej 55 2800 Kgs. Lyngby - Denmark
Catalysing profit margin with LK-853 FENCE™ 11 / 11
2012
Information contained herein is confidential; it may not be used for anypurpose other than for which it has been issued, and may not be used byor disclosed to third parties without written approval of Haldor Topsøe A/S.
As seen in the above reaction, it takes 3 mole of hydrogen to form 1 mole of methanol, so even a small reduction of the methanol formation will have a large impact on the amount of hydrogen available for ammonia production. When considering the overall impact of the reduced methanol formation on the ammo-nia production, it should be taken into account that most plants will normally recycle some of the methanol back to the reforming section as a part of the process conden-sate. The actual amount of methanol recycled will depend on the temperature in the
separator downstream the LTS. In the following, it is assumed that 25-50% of the
methanol stays in the gas phase. For a 1,500 MTPD ammonia plant, the reduced amount of methanol formed by using
LK-853 FENCE™ would correspond to a daily production gain of 1.0-1.9 metric tonnes
of ammonia. Over a 5-year period, this would add up to a total production gain of 1,500–3,150 metric tonnes of ammonia, corresponding to a value of 600,000–1,300,000 USD. In addition to the above, the use of the LK-853 FENCE™ catalyst will lead to reduced methanol emissions and better quality of the process condensate.
Industrial experience with LK-853 FENCE™
LK-853 FENCE™ was commercialised recently and offered to a North American am-monia producer. Two charges have been installed in this plant and commissioned in October 2011. Another charge for installation in spring 2012 has already been ordered by the same client. Feedback from these first references confirms the expectations of superior activity and low methanol formation of LK-853 FENCE™.

6/26/2012
1
TOPIC: ELIMINATION OF RADIOACTIVE SOURCES IN RUWAIS FERTILIZER INDUSTRIES
1
2
Scope Of Presentation
Introduction of Ruwais Fertilizer Industries
Introduction of the presentation
An overview of radioactive level measurements
An overview of radar level measurements
FERTIL Effort-1: Replacement of radioactive device fromradar technology in high pressure Urea reactor levelmeasurements
FERTIL Effort-2: Replacement of radioactive device fromtuning fork device in ammonium carbamate servicedensity measurements
FERTIL Effort-3:Removal of radioactive device for dustlevel from main product conveyor
Conclusion 2
6/26/2012
2
3
A. Introduction Of the Company
Ruwais Fertilizer Industries (herein referred to as FERTIL) wasestablished in October 1980 and the commercial production ofprilled urea commenced in December 1983. The initial capacity wasaimed at 1000MTPD of ammonia and 1500MTPD of Urea based onHaldor Topsoe and Stamicarbon technologies. Today afterdebottlenecking and other modifications the name plate capacitieshave increased to 1300 MTPD of ammonia and 2300 MTPD ofgranulated Urea.
In October 2009, FERTIL signed a contract with Samsung andUHDE to execute expansion project of the company which shallexpand production capacity to 2 million MTPY of granulated urea byfirst quarter of 2013.
3
B. Introduction of the presentation
Despite being reliable, the radioactive source basedinstruments always pose potential radiation hazards duringhandling / maintenance / replacement / storage andtransportation. Guided by the problem statement FERTILhas made sustainable efforts in near past to eliminateradioactive devices from the site. This technical paper shalldiscuss the on going efforts made by FERTIL to eliminateradioactive sources from its site
4
6/26/2012
3
28
27
26
C. An Overview of Radioactive technology for level measurements
Two critical levels which require sensitive control in Urea synthesisare reactor level and stripper level
A low level in reactor can cause strip gases bypassing the stripper.A high reactor level causes urea/ carbamate solution to overflow tothe scrubber. Hence the importance of correct reactor levelmeasurements
A high stripper level at bottom causes urea/ carbamate solution toreach lower tube sheet. A low stripper level causes CO2 slippage.Hence the importance of correct stripper level measurements
Contact type level measurements failed due to crystallization,corrosion and strong requirements of high pressure flushing water
5
Contd.
From mid seventies the radioactive level measurement devicescame into picture in the fertilizer industry and are still being widelyemployed even in new generation plants
Radioactive radiations provide reliable non contact type levelmeasurement devices
The level measurement principle is based on absorption of gammarays by the medium it passes through
A typical radioactive type level measurement system comprises of asource(transmitter), detector and microcomputer
The source emits gamma rays which pass thru the medium and arereceived at the detector. The percentage of gamma rays beingreceived at the detector is inversely proportional to the level of fluid.As the level of fluid increases there is more absorption of gammyrays and the balance is received by the detector. This forms thebasis of radioactive source level instrument calibration
6
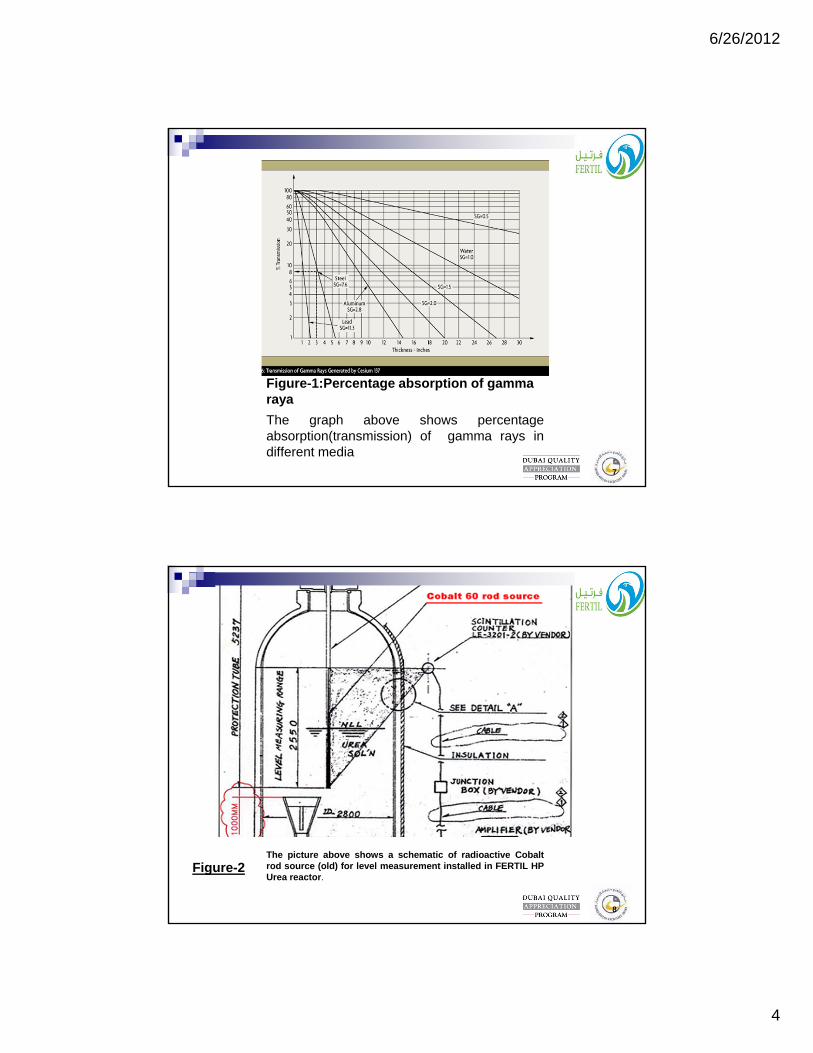
6/26/2012
4
View through fiber scope
Figure-1:Percentage absorption of gamma raya
The graph above shows percentageabsorption(transmission) of gamma rays indifferent media
7
The picture above shows a schematic of radioactive Cobaltrod source (old) for level measurement installed in FERTIL HPUrea reactor.
Figure-2
8
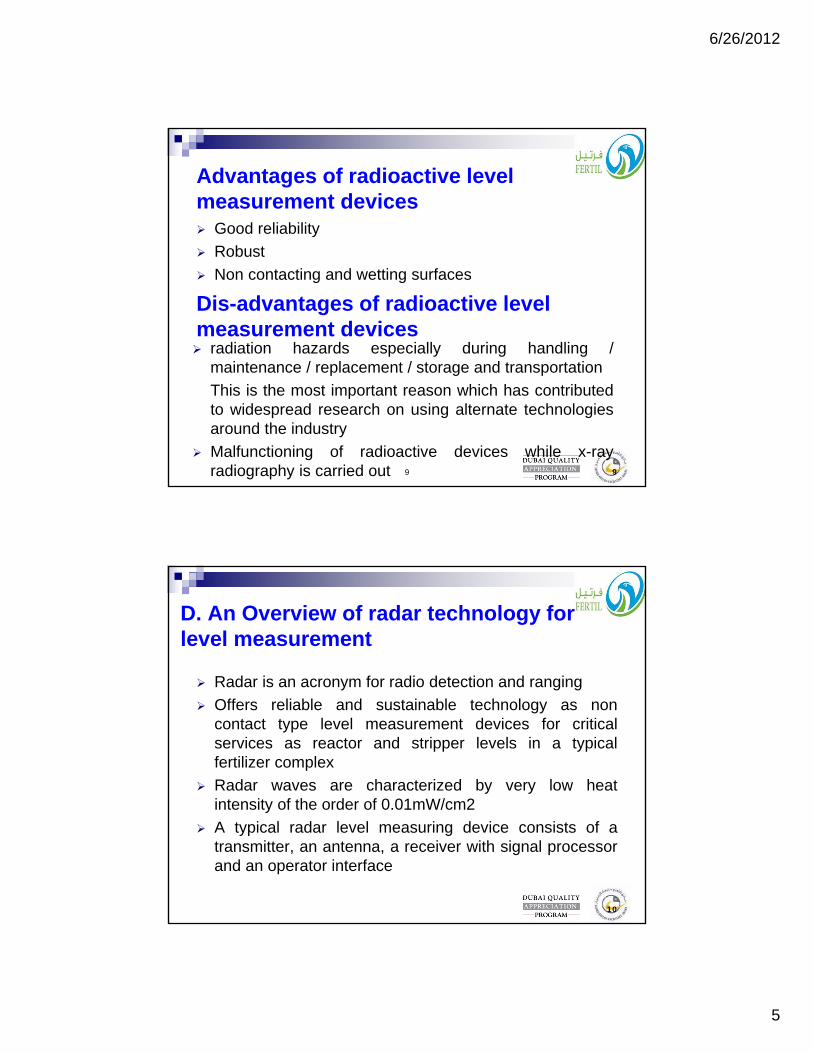
6/26/2012
5
9
Advantages of radioactive level measurement devices Good reliability
Robust
Non contacting and wetting surfaces
Dis-advantages of radioactive level measurement devices radiation hazards especially during handling /
maintenance / replacement / storage and transportation
This is the most important reason which has contributedto widespread research on using alternate technologiesaround the industry
Malfunctioning of radioactive devices while x-rayradiography is carried out 9
D. An Overview of radar technology for level measurement
Radar is an acronym for radio detection and ranging
Offers reliable and sustainable technology as noncontact type level measurement devices for criticalservices as reactor and stripper levels in a typicalfertilizer complex
Radar waves are characterized by very low heatintensity of the order of 0.01mW/cm2
A typical radar level measuring device consists of atransmitter, an antenna, a receiver with signal processorand an operator interface
10
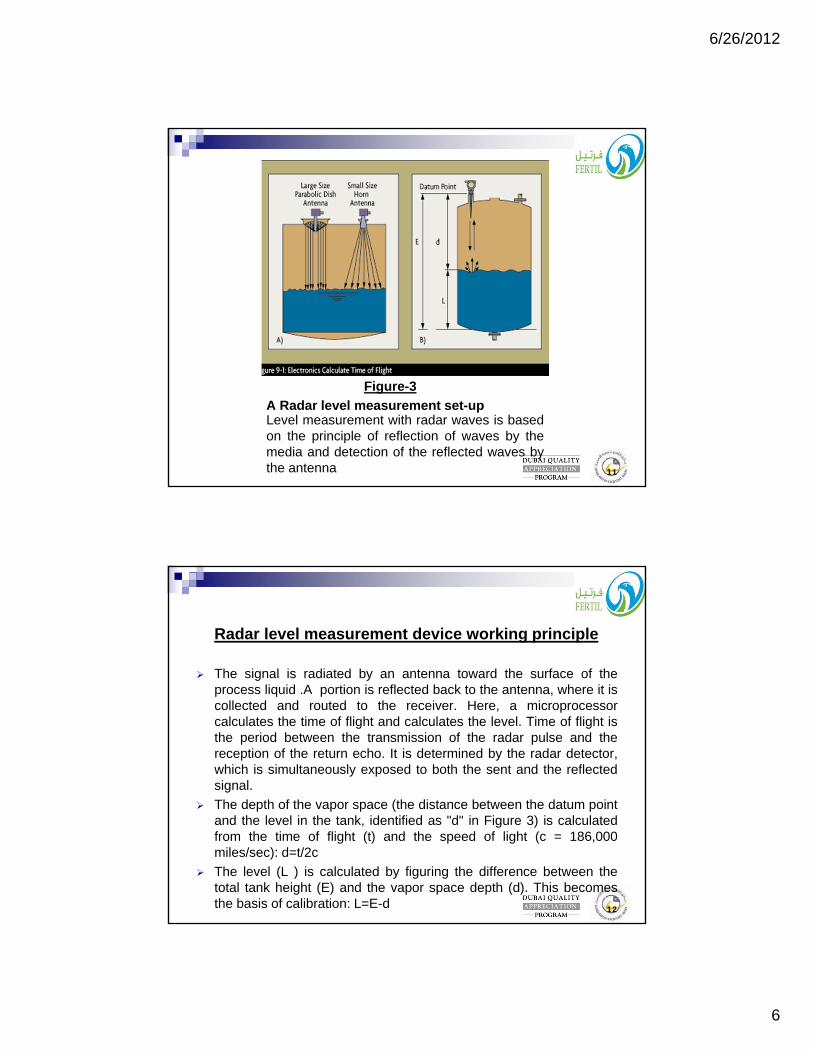
6/26/2012
6
A Radar level measurement set-upLevel measurement with radar waves is basedon the principle of reflection of waves by themedia and detection of the reflected waves bythe antenna
Figure-3
11
Radar level measurement device working principle
The signal is radiated by an antenna toward the surface of theprocess liquid .A portion is reflected back to the antenna, where it iscollected and routed to the receiver. Here, a microprocessorcalculates the time of flight and calculates the level. Time of flight isthe period between the transmission of the radar pulse and thereception of the return echo. It is determined by the radar detector,which is simultaneously exposed to both the sent and the reflectedsignal.
The depth of the vapor space (the distance between the datum pointand the level in the tank, identified as "d" in Figure 3) is calculatedfrom the time of flight (t) and the speed of light (c = 186,000miles/sec): d=t/2c
The level (L ) is calculated by figuring the difference between thetotal tank height (E) and the vapor space depth (d). This becomesthe basis of calibration: L=E-d 12
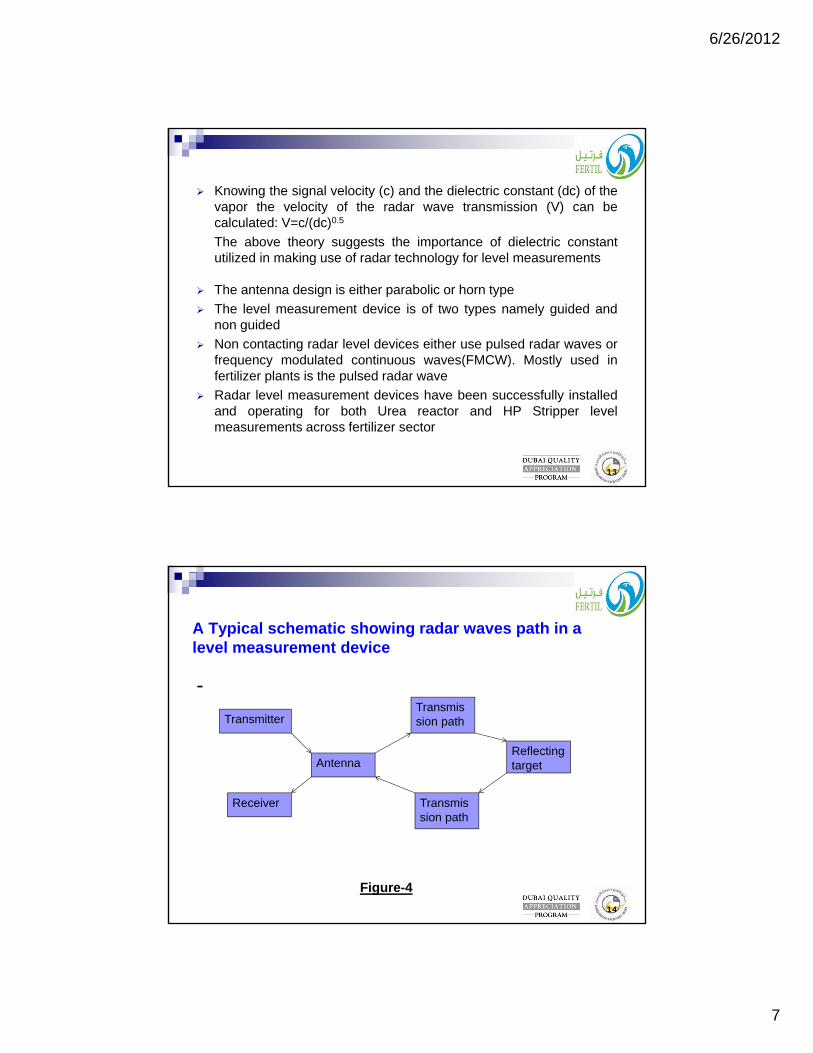
6/26/2012
7
Knowing the signal velocity (c) and the dielectric constant (dc) of thevapor the velocity of the radar wave transmission (V) can becalculated: V=c/(dc)0.5
The above theory suggests the importance of dielectric constantutilized in making use of radar technology for level measurements
The antenna design is either parabolic or horn type
The level measurement device is of two types namely guided andnon guided
Non contacting radar level devices either use pulsed radar waves orfrequency modulated continuous waves(FMCW). Mostly used infertilizer plants is the pulsed radar wave
Radar level measurement devices have been successfully installedand operating for both Urea reactor and HP Stripper levelmeasurements across fertilizer sector
13
A Typical schematic showing radar waves path in a level measurement device
-
Transmitter
Receiver
Antenna
Transmission path
Reflecting target
Transmission path
Figure-4
14
6/26/2012
8
Dis-advantages of radar technology in level measurements
Safe radiations
Very low heat intensity
Advantages of radar technology in level measurements
Measurements affected by deposits on transmitter andantenna
15
E. FERTIL Effort-1: Replacement of radioactivelevel measurement device from radar levelmeasurement device in high pressure UreaReactor
A Cobalt 60 radioactive source (A rod source of about2.5m long) was utilized until the year 2011 for measuringthe liquid Level in Urea Reactor
16
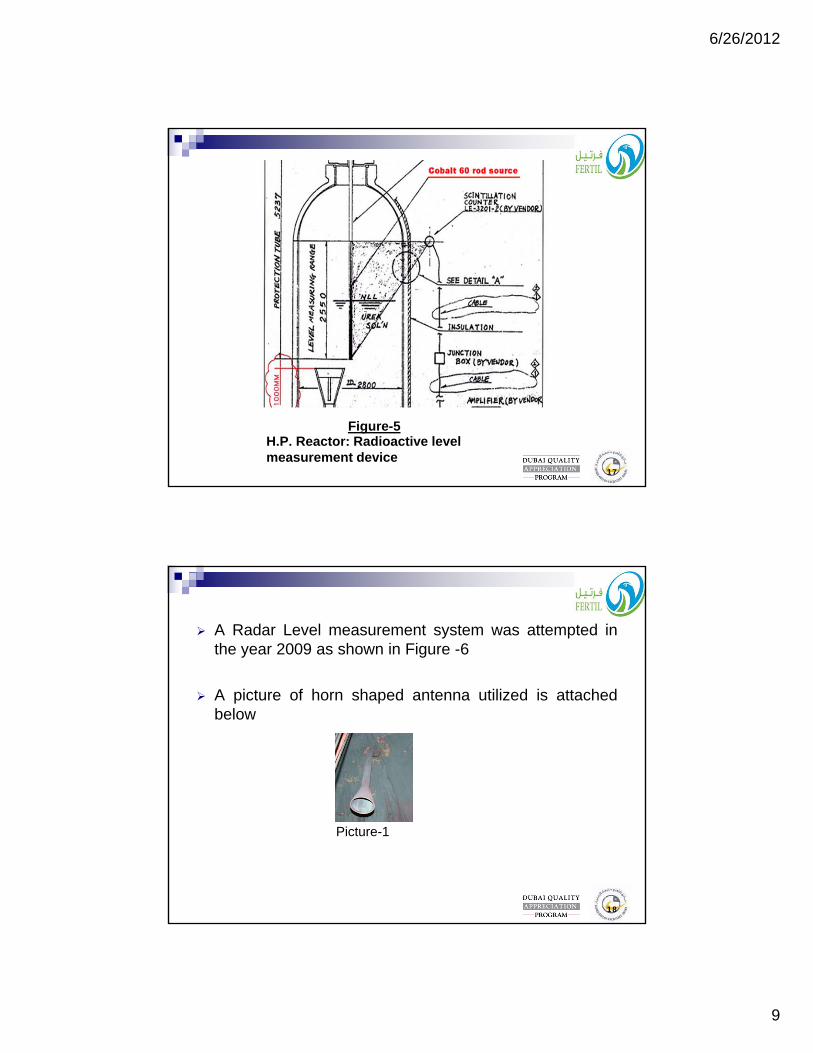
6/26/2012
9
H.P. Reactor: Radioactive level measurement device
Figure-5
17
A Radar Level measurement system was attempted inthe year 2009 as shown in Figure -6
A picture of horn shaped antenna utilized is attachedbelow
Picture-1
18
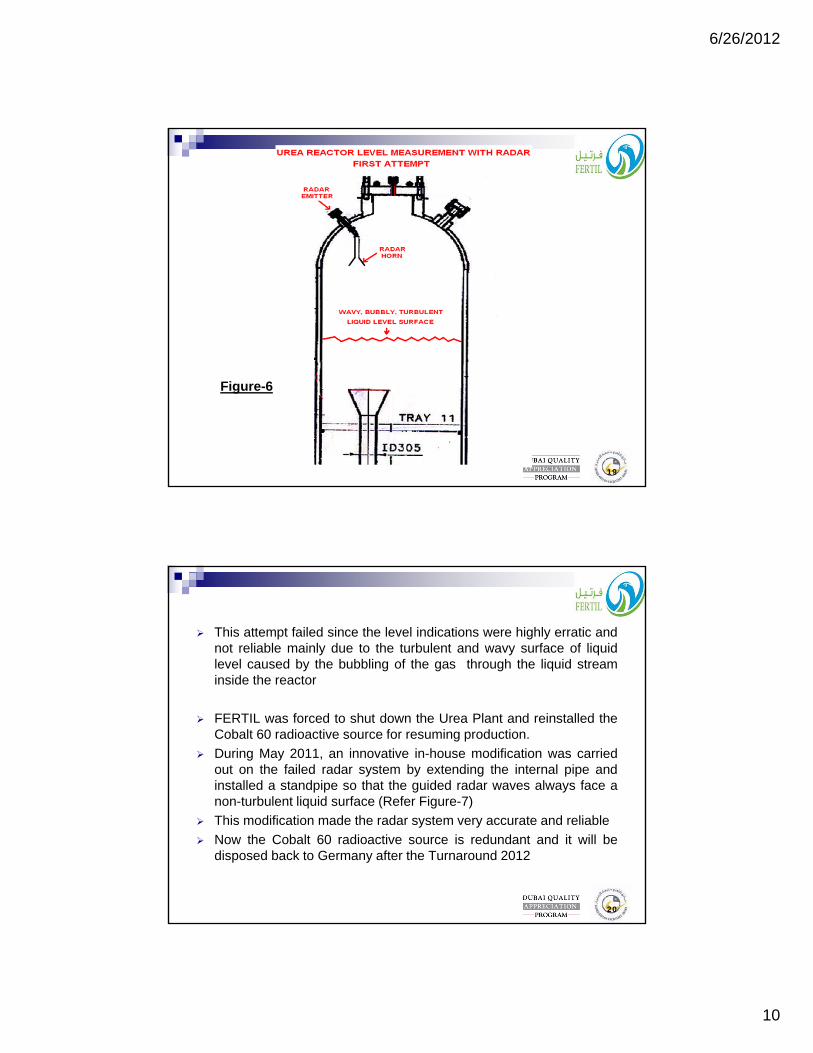
6/26/2012
10
Figure-6
19
This attempt failed since the level indications were highly erratic andnot reliable mainly due to the turbulent and wavy surface of liquidlevel caused by the bubbling of the gas through the liquid streaminside the reactor
FERTIL was forced to shut down the Urea Plant and reinstalled theCobalt 60 radioactive source for resuming production.
During May 2011, an innovative in-house modification was carriedout on the failed radar system by extending the internal pipe andinstalled a standpipe so that the guided radar waves always face anon-turbulent liquid surface (Refer Figure-7)
This modification made the radar system very accurate and reliable
Now the Cobalt 60 radioactive source is redundant and it will bedisposed back to Germany after the Turnaround 2012
20
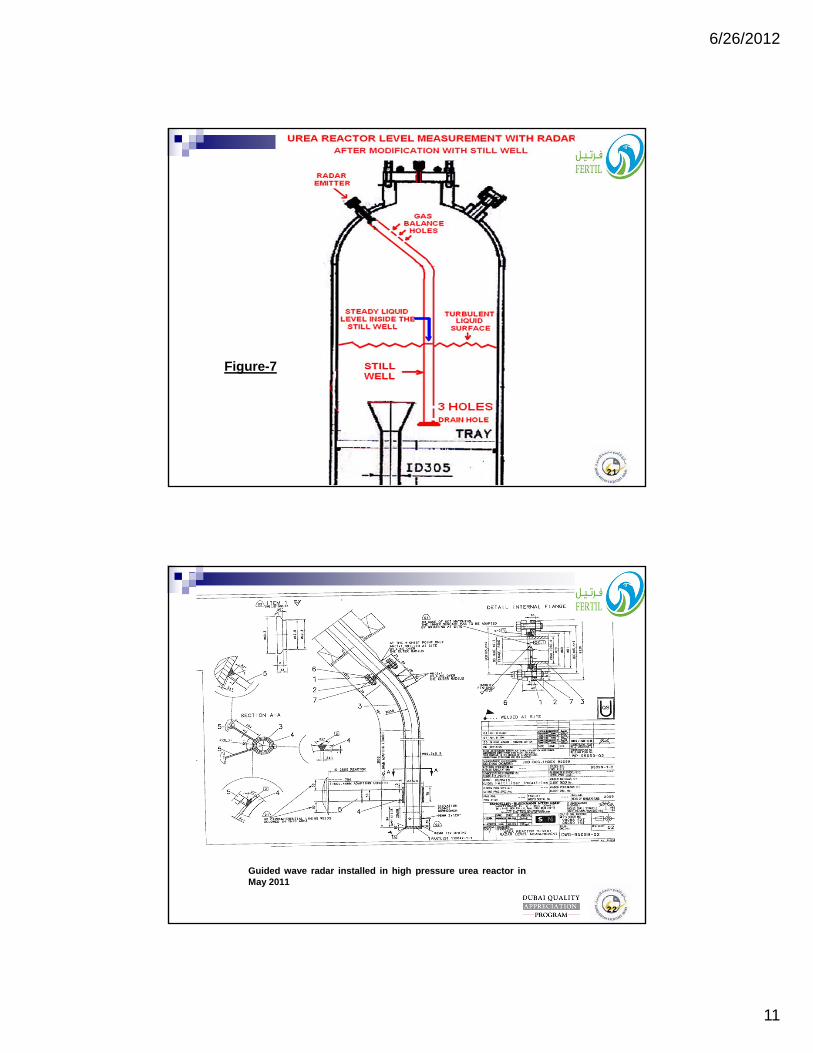
6/26/2012
11
Figure-7
21
Guided wave radar installed in high pressure urea reactor inMay 2011
22
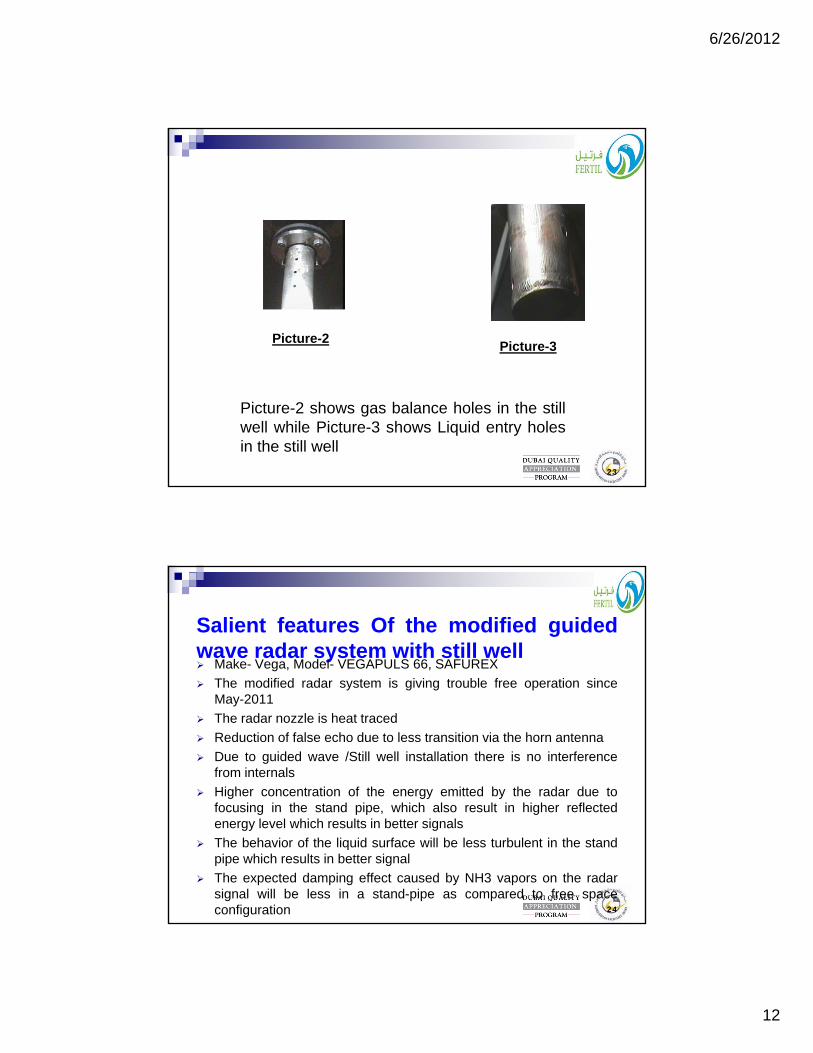
6/26/2012
12
Picture-2Picture-3
Picture-2 shows gas balance holes in the stillwell while Picture-3 shows Liquid entry holesin the still well
23
Salient features Of the modified guidedwave radar system with still well Make- Vega, Model- VEGAPULS 66, SAFUREX
The modified radar system is giving trouble free operation sinceMay-2011
The radar nozzle is heat traced
Reduction of false echo due to less transition via the horn antenna
Due to guided wave /Still well installation there is no interferencefrom internals
Higher concentration of the energy emitted by the radar due tofocusing in the stand pipe, which also result in higher reflectedenergy level which results in better signals
The behavior of the liquid surface will be less turbulent in the standpipe which results in better signal
The expected damping effect caused by NH3 vapors on the radarsignal will be less in a stand-pipe as compared to free spaceconfiguration 24
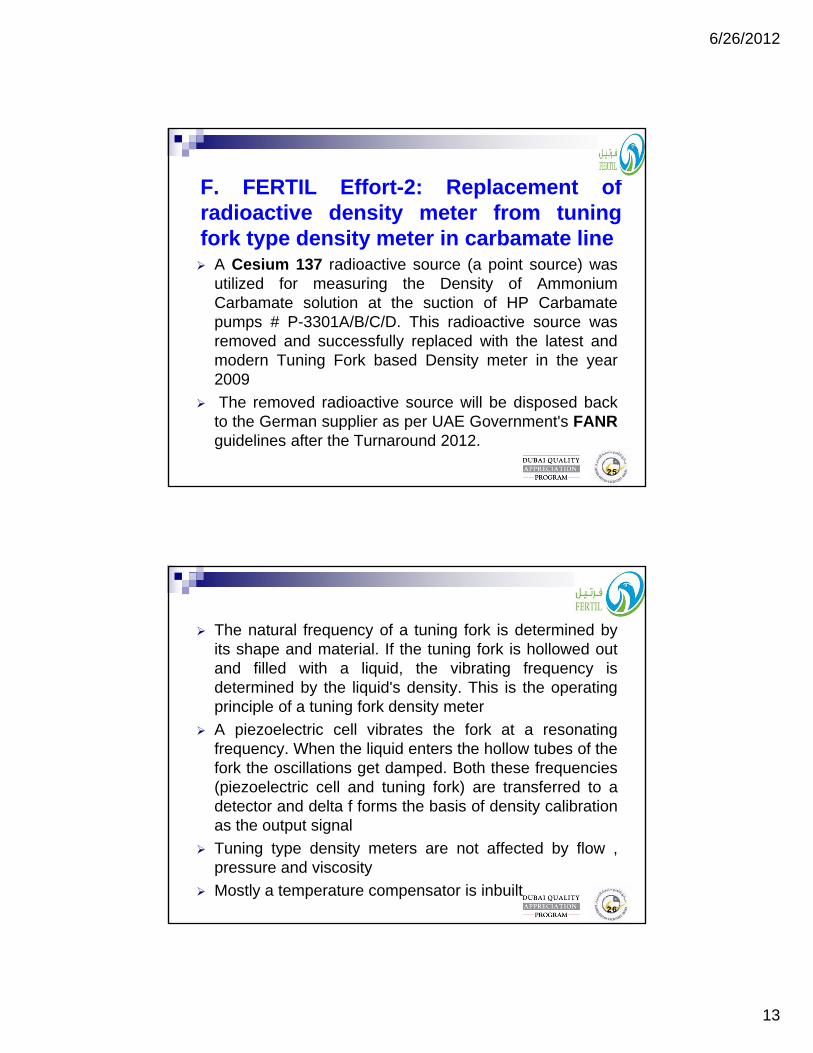
6/26/2012
13
F. FERTIL Effort-2: Replacement ofradioactive density meter from tuningfork type density meter in carbamate line A Cesium 137 radioactive source (a point source) was
utilized for measuring the Density of AmmoniumCarbamate solution at the suction of HP Carbamatepumps # P-3301A/B/C/D. This radioactive source wasremoved and successfully replaced with the latest andmodern Tuning Fork based Density meter in the year2009
The removed radioactive source will be disposed backto the German supplier as per UAE Government's FANRguidelines after the Turnaround 2012.
25
The natural frequency of a tuning fork is determined byits shape and material. If the tuning fork is hollowed outand filled with a liquid, the vibrating frequency isdetermined by the liquid's density. This is the operatingprinciple of a tuning fork density meter
A piezoelectric cell vibrates the fork at a resonatingfrequency. When the liquid enters the hollow tubes of thefork the oscillations get damped. Both these frequencies(piezoelectric cell and tuning fork) are transferred to adetector and delta f forms the basis of density calibrationas the output signal
Tuning type density meters are not affected by flow ,pressure and viscosity
Mostly a temperature compensator is inbuilt26
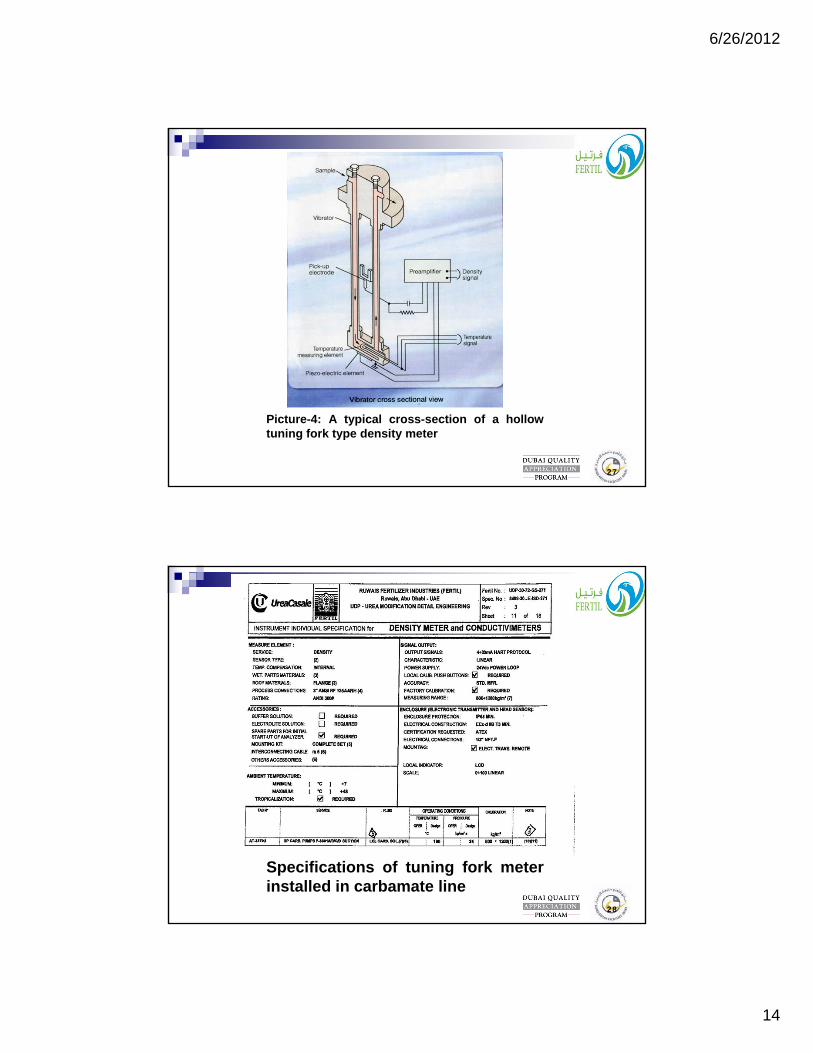
6/26/2012
14
Picture-4: A typical cross-section of a hollowtuning fork type density meter
27
Specifications of tuning fork meterinstalled in carbamate line
28
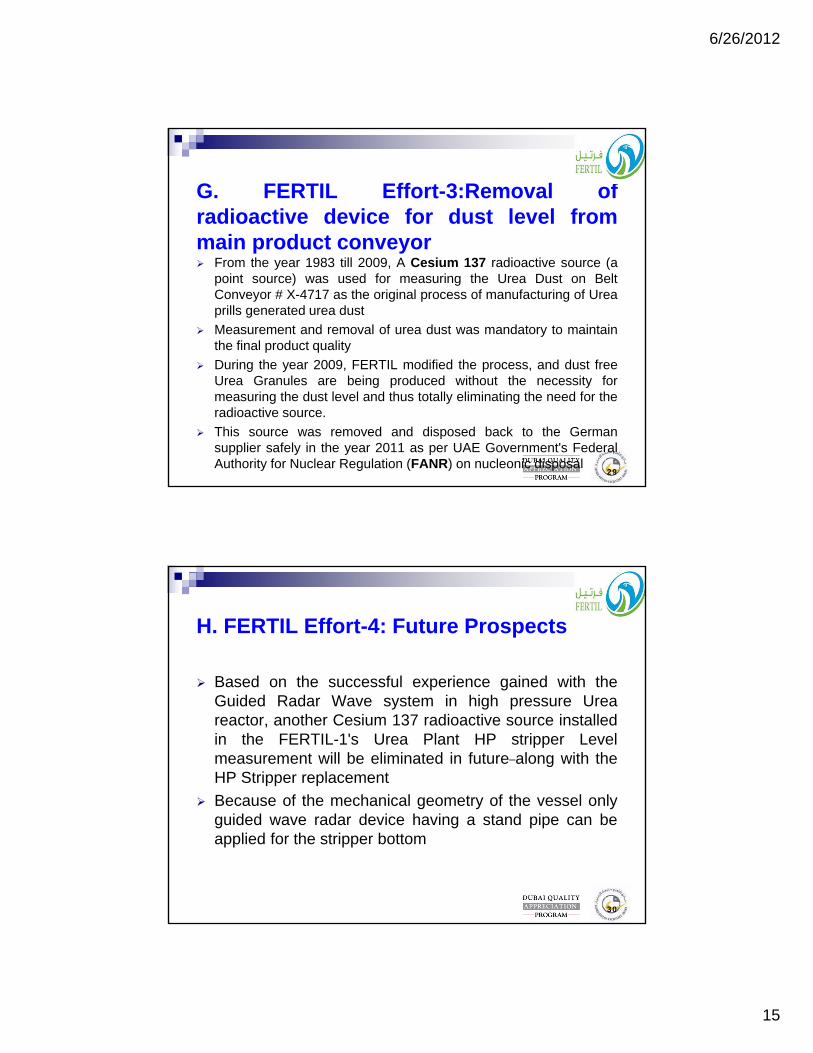
6/26/2012
15
G. FERTIL Effort-3:Removal ofradioactive device for dust level frommain product conveyor From the year 1983 till 2009, A Cesium 137 radioactive source (a
point source) was used for measuring the Urea Dust on BeltConveyor # X-4717 as the original process of manufacturing of Ureaprills generated urea dust
Measurement and removal of urea dust was mandatory to maintainthe final product quality
During the year 2009, FERTIL modified the process, and dust freeUrea Granules are being produced without the necessity formeasuring the dust level and thus totally eliminating the need for theradioactive source.
This source was removed and disposed back to the Germansupplier safely in the year 2011 as per UAE Government's FederalAuthority for Nuclear Regulation (FANR) on nucleonic disposal
29
H. FERTIL Effort-4: Future Prospects
Based on the successful experience gained with theGuided Radar Wave system in high pressure Ureareactor, another Cesium 137 radioactive source installedin the FERTIL-1's Urea Plant HP stripper Levelmeasurement will be eliminated in future along with theHP Stripper replacement
Because of the mechanical geometry of the vessel onlyguided wave radar device having a stand pipe can beapplied for the stripper bottom
30
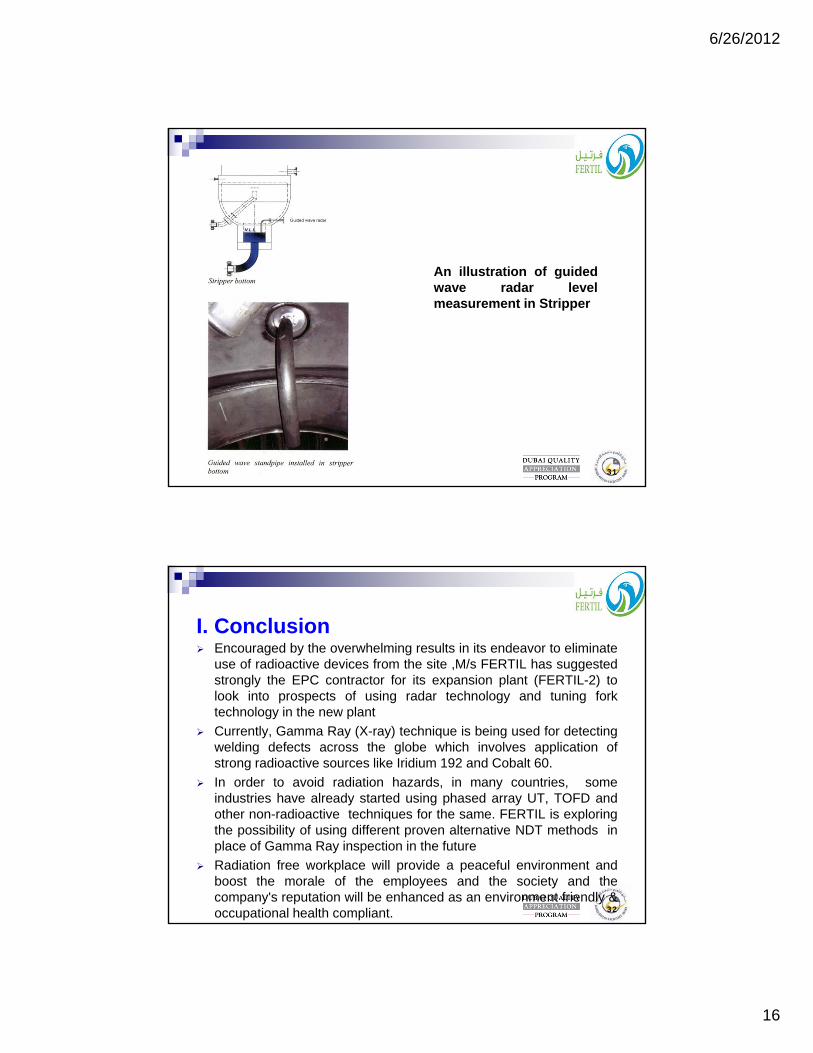
6/26/2012
16
An illustration of guidedwave radar levelmeasurement in Stripper
31
I. Conclusion Encouraged by the overwhelming results in its endeavor to eliminate
use of radioactive devices from the site ,M/s FERTIL has suggestedstrongly the EPC contractor for its expansion plant (FERTIL-2) tolook into prospects of using radar technology and tuning forktechnology in the new plant
Currently, Gamma Ray (X-ray) technique is being used for detectingwelding defects across the globe which involves application ofstrong radioactive sources like Iridium 192 and Cobalt 60.
In order to avoid radiation hazards, in many countries, someindustries have already started using phased array UT, TOFD andother non-radioactive techniques for the same. FERTIL is exploringthe possibility of using different proven alternative NDT methods inplace of Gamma Ray inspection in the future
Radiation free workplace will provide a peaceful environment andboost the morale of the employees and the society and thecompany's reputation will be enhanced as an environment friendly &occupational health compliant. 32

6/26/2012
17
THANKS
33

1. Safe, Sustainable Phosphate Production
Julian Hilton – Chairman, ALEFF GROUP, UK
2. PhosphogypsumManagement and Use: Opportunities and Issues
Julian Hilton – Chairman, ALEFF GROUP, UK
3. Utilization of Low grade rocks by optimizing operation parameters in manufacturing Phosphoric acid with Better Efficiency
G M Patel,Technical Director, CFIC, India
4. Smart fertilizers for sustainable agriculture: The state of the art and the recent developments
Youssef ZEROUAL, Research & Development Direction Industrial Pole, OCP, Morocco
5. Enhancement of Hot leach plant Operational Sustainability
Ala'a Al Omari, Senior Process Engineer, APC, Jordan
1
Utilisation of Low grade rocks by optimising operation parameters in manufacturing Phosphoric acid with Better Efficiency Abstract: G M Patel Technical Director CIFC (P) Ltd India Phosphoric Acid producers are increasingly confronted with the continuous and regular fall in P2O5 grade of Rock Phosphate and at the same time with the increase of their impurities content. Thus the search of new solution becomes necessary in order to adopt existing facilities to development of basic raw material that is Rock phosphate. The use of low grade rock phosphate normally means an important decrease in (a) extraction of P2O5 from Rock Phosphate and (b) P2O5 concentration of manufactured Phosphoric Acid. Many of impurities present in Rock Phosphate affect PA plant performance in some way but degree of influence varies with other impurities’ interactions amongst each other in process. The effects of some impurities are well known and understood while for others’ effects particularly involving in minor levels are less clear and this applies to change in the crystal growth most important factor for better extraction efficiency of P2O5.Therefore phosphoric acid manufacturers who process low grade rock phosphate have to accept lower standard or improve over poor performance by modifying operating conditions and/or plant design and possibly consider use of additives. A better understanding of Phosphoric Acid manufacturers for effects of impurities in Rock Phosphate to select Rock Phosphate on economic implications applied to their own plants. These effects of impurities need not necessarily same for different manufacturers. *********************************************************************************************************** Executive Summary All phosphate rocks contain impurities. By its very nature, rock phosphate exists in natural deposits alongside other minerals, and even wrapped up as complexes with a variety of other mineral species. “Bone phosphate of l ime” – the BPL in phosphate rock – is otherwise known as tr icalcium phosphate. I f you want i t pure you must go to the laboratory supplier, because it never exists as such in nature, but as more complex minerals known as apatite. A 100% BPL phosphate rock is, therefore, quite unknown. A French expert Mr. J Frochen has described “Rock Phosphate as living ore” and this is what makes phosphate technology so diverse and viable according to the phosphate ore origin. . Each Rock has i ts own behavior when ground, attacked, crystall ized, and f i l tered. The resulting phosphatic acid wil l have its own colour viscosity and impurities. The impurities contained in the rock phosphate are the main responsible factors for the individual behaviour of each rock. It should be also noted that part icular ore wil l also behave differently in different plant even though having same dihydrate route. It is, therefore, necessary to consider all the above aspects while accepting the rock for phosphoric acid plant in a most techno-economical manner, which can lead to better extraction eff iciency on sustainable basis.
2
Phosphoric Acid is an important intermediate, both for the production of fert i l izer and for other products. The first commercial product of wet process Phosphoric Acid, with separation of calcium sulphate probably occurred about in 1850 in France and England. At that time the main use of Phosphoric Acid produced was for production of elemental phosphorus for matches. In 1870 a plant was erected in Germany to produce Phosphoric Acid from rock phosphate, which was too low grade (16% P2O5) and too high in Iron and Alumina to make Super Phosphate which by then had become a popular ferti l izer. Again, i t is interesting to know that this rock would now be recorded as a hopelessly unsuitable for Phosphoric Acid production. However, by 1900 about 12 companies were producing Phosphoric Acid in Europe to use in Triple Super Phosphate, which was used in the sugar refining, or for ferti l izer. Starting in 1935 electrical furnace process began to compete with the wet process and by 1955 production of electrical furnace acid was nearly equal to that of wet process acid in United States. Really after 1955 the soaring demand for concentrated ferti l izer had dramatically increased the production of wet process acid by various process routes. Chemistry of Process: The main chemical reaction in the wet (sulfuric acid) process may be represented by the fol lowing equation using pure f luorapatite to represent phosphate rock. Ca10F2 (PO4)6 + 10H2SO + 10 nH2O 10CaSO4nH2O + 6H3PO4 + 2HF Where n=0, ½ or 2, depending on the hydrate form in which the calcium sulfate crystal l izes. The reaction represents the net result of two stages. In the first stage, phosphoric acid reacts with the apatite forming monocalcium phosphate, and in the second stage monocalcium phosphate reacts with sulfuric acid to form phosphoric acid and calcium sulfate. These two stages do not necessarily require two reaction vessels; they usually take place simultaneously in a single reactor. Phosphate rock contains many impurities both in the apatite i tself and in accessory minerals. These impurities participate in numerous side reactions. Most phosphate rocks have a higher CaO: P2O5 ratio than pure fluorapatite. The addit ional CaO consumes more sulfuric acid and forms more calcium sulfate. The HF formed by the reaction reacts with sil ica and other impurit ies (Na, K, Mg, and Al) to form fluosil icates and other more complex compounds. A variable amount of the fluorine is volati l ized as SiF4, HF, or both. (The amount volati l ized and the form depends on phosphate rock composit ion and process conditions). As a result of side reactions, numerous impurity compounds (some of them very complex) are formed. Type of Process: Commercial wet process may be classif ied according to the hydrate form in which the calcium sulfate crystal l izes:
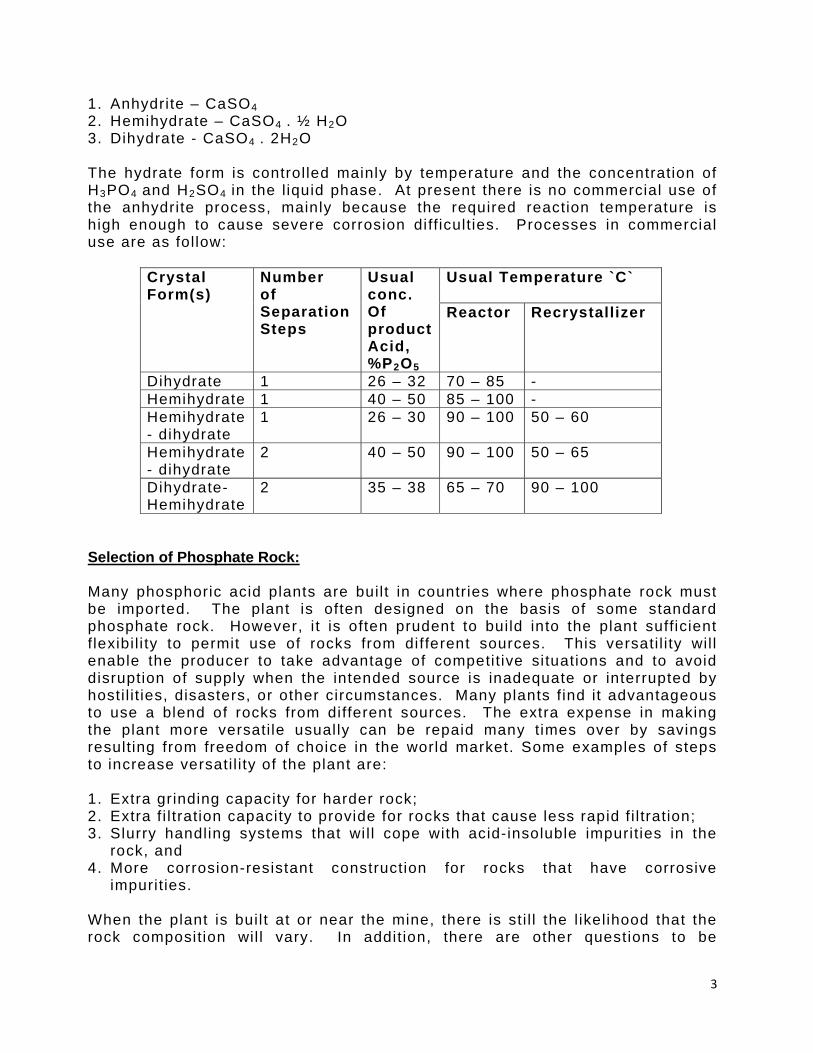
3
1. Anhydrite – CaSO4 2. Hemihydrate – CaSO4 . ½ H2O 3. Dihydrate - CaSO4 . 2H2O The hydrate form is controlled mainly by temperature and the concentration of H3PO4 and H2SO4 in the l iquid phase. At present there is no commercial use of the anhydrite process, mainly because the required reaction temperature is high enough to cause severe corrosion diff iculties. Processes in commercial use are as follow:
Crystal Form(s)
Number of Separation Steps
Usual conc. Of product Acid, %P2O5
Usual Temperature `C` Reactor Recrystallizer
Dihydrate 1 26 – 32 70 – 85 - Hemihydrate 1 40 – 50 85 – 100 - Hemihydrate- dihydrate
1 26 – 30 90 – 100 50 – 60
Hemihydrate- dihydrate
2 40 – 50 90 – 100 50 – 65
Dihydrate- Hemihydrate
2 35 – 38 65 – 70 90 – 100
Selection of Phosphate Rock: Many phosphoric acid plants are buil t in countries where phosphate rock must be imported. The plant is often designed on the basis of some standard phosphate rock. However, i t is often prudent to build into the plant sufficient f lexibil i ty to permit use of rocks from different sources. This versati l i ty wil l enable the producer to take advantage of competitive si tuations and to avoid disruption of supply when the intended source is inadequate or interrupted by hosti l i t ies, disasters, or other circumstances. Many plants f ind it advantageous to use a blend of rocks from different sources. The extra expense in making the plant more versati le usually can be repaid many times over by savings resulting from freedom of choice in the world market. Some examples of steps to increase versati l i ty of the plant are: 1. Extra grinding capacity for harder rock; 2. Extra f i l tration capacity to provide for rocks that cause less rapid f i l tration; 3. Slurry handling systems that wi l l cope with acid-insoluble impurities in the
rock, and 4. More corrosion-resistant construction for rocks that have corrosive
impurities. When the plant is buil t at or near the mine, there is st i l l the l ikelihood that the rock composition wil l vary. In addition, there are other questions to be
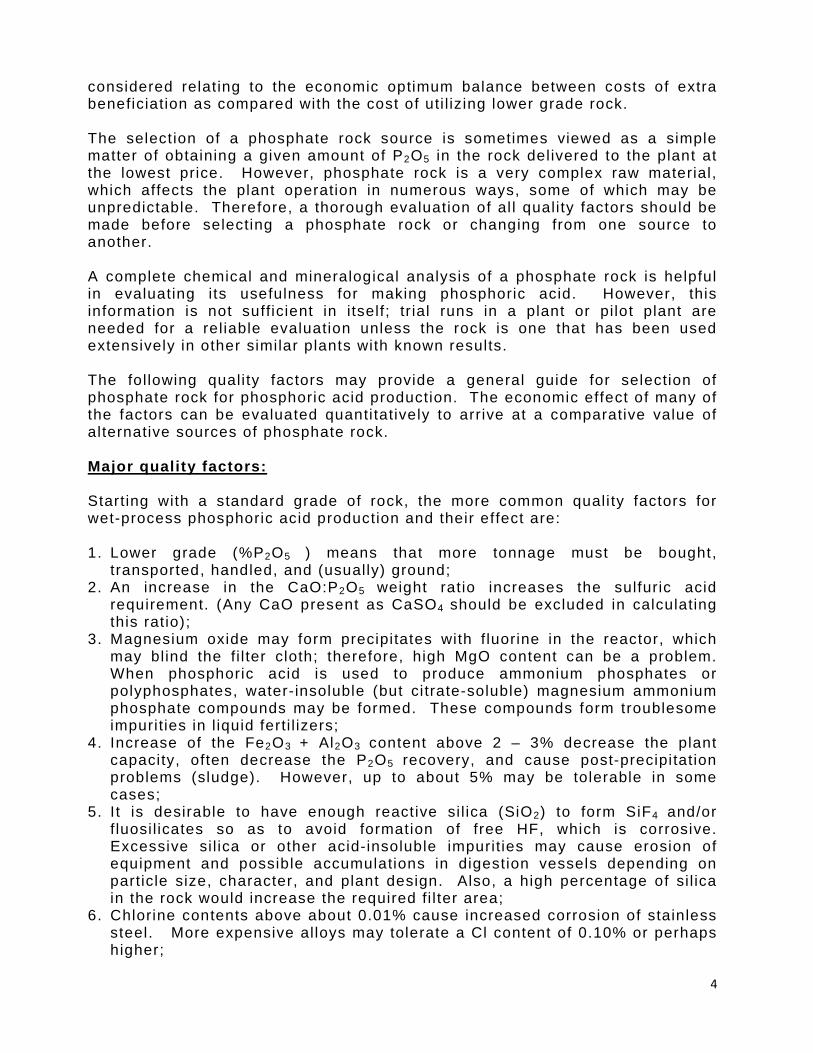
4
considered relating to the economic optimum balance between costs of extra beneficiation as compared with the cost of uti l izing lower grade rock. The selection of a phosphate rock source is sometimes viewed as a simple matter of obtaining a given amount of P2O5 in the rock delivered to the plant at the lowest price. However, phosphate rock is a very complex raw material, which affects the plant operation in numerous ways, some of which may be unpredictable. Therefore, a thorough evaluation of al l quality factors should be made before selecting a phosphate rock or changing from one source to another. A complete chemical and mineralogical analysis of a phosphate rock is helpful in evaluating its usefulness for making phosphoric acid. However, this information is not sufficient in itself; tr ial runs in a plant or pilot plant are needed for a reliable evaluation unless the rock is one that has been used extensively in other similar plants with known results. The following quality factors may provide a general guide for selection of phosphate rock for phosphoric acid production. The economic effect of many of the factors can be evaluated quanti tatively to arrive at a comparative value of alternative sources of phosphate rock. Major quality factors: Starting with a standard grade of rock, the more common quali ty factors for wet-process phosphoric acid production and their effect are: 1. Lower grade (%P2O5 ) means that more tonnage must be bought,
transported, handled, and (usually) ground; 2. An increase in the CaO:P2O5 weight ratio increases the sulfuric acid
requirement. (Any CaO present as CaSO4 should be excluded in calculating this ratio);
3. Magnesium oxide may form precipitates with f luorine in the reactor, which may blind the fi l ter cloth; therefore, high MgO content can be a problem. When phosphoric acid is used to produce ammonium phosphates or polyphosphates, water-insoluble (but ci trate-soluble) magnesium ammonium phosphate compounds may be formed. These compounds form troublesome impurities in l iquid ferti l izers;
4. Increase of the Fe2O3 + Al2O3 content above 2 – 3% decrease the plant capacity, often decrease the P2O5 recovery, and cause post-precipitation problems (sludge). However, up to about 5% may be tolerable in some cases;
5. I t is desirable to have enough reactive si l ica (SiO2) to form SiF4 and/or f luosil icates so as to avoid formation of free HF, which is corrosive. Excessive si l ica or other acid-insoluble impurities may cause erosion of equipment and possible accumulations in digestion vessels depending on particle size, character, and plant design. Also, a high percentage of si l ica in the rock would increase the required fi l ter area;
6. Chlorine contents above about 0.01% cause increased corrosion of stainless steel. More expensive alloys may tolerate a Cl content of 0.10% or perhaps higher;
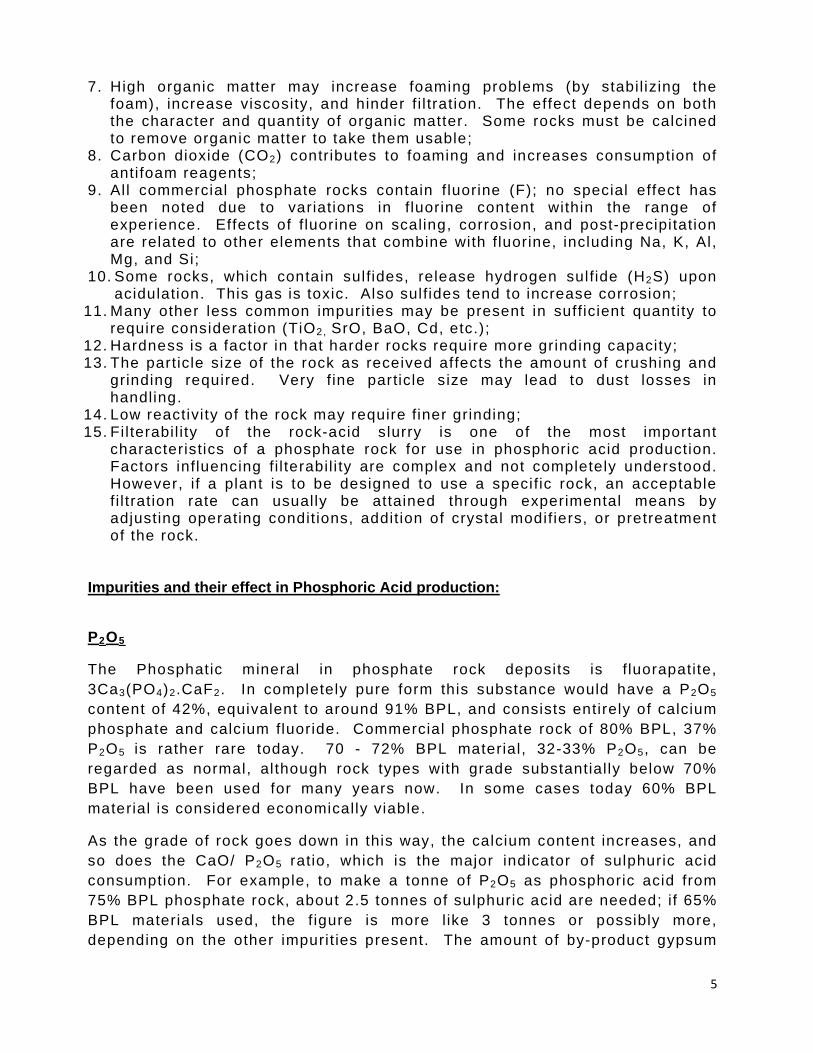
5
7. High organic matter may increase foaming problems (by stabil izing the foam), increase viscosity, and hinder f i l tration. The effect depends on both the character and quantity of organic matter. Some rocks must be calcined to remove organic matter to take them usable;
8. Carbon dioxide (CO2) contributes to foaming and increases consumption of antifoam reagents;
9. All commercial phosphate rocks contain f luorine (F); no special effect has been noted due to variations in fluorine content within the range of experience. Effects of f luorine on scaling, corrosion, and post-precipitation are related to other elements that combine with fluorine, including Na, K, Al, Mg, and Si;
10. Some rocks, which contain sulfides, release hydrogen sulfide (H2S) upon acidulation. This gas is toxic. Also sulfides tend to increase corrosion;
11. Many other less common impurit ies may be present in sufficient quantity to require consideration (TiO2, SrO, BaO, Cd, etc.);
12. Hardness is a factor in that harder rocks require more grinding capacity; 13. The particle size of the rock as received affects the amount of crushing and
grinding required. Very fine particle size may lead to dust losses in handling.
14. Low reactivity of the rock may require finer grinding; 15. Fi l terabil i ty of the rock-acid slurry is one of the most important
characteristics of a phosphate rock for use in phosphoric acid production. Factors influencing fi l terabil i ty are complex and not completely understood. However, i f a plant is to be designed to use a specific rock, an acceptable f i l tration rate can usually be attained through experimental means by adjusting operating conditions, addition of crystal modifiers, or pretreatment of the rock.
Impurities and their effect in Phosphoric Acid production:
P2O5
The Phosphatic mineral in phosphate rock deposits is f luorapatite, 3Ca3(PO4)2.CaF2. In completely pure form this substance would have a P2O5 content of 42%, equivalent to around 91% BPL, and consists entirely of calcium phosphate and calcium fluoride. Commercial phosphate rock of 80% BPL, 37% P2O5 is rather rare today. 70 - 72% BPL material, 32-33% P2O5, can be regarded as normal, al though rock types with grade substantially below 70% BPL have been used for many years now. In some cases today 60% BPL material is considered economically viable.
As the grade of rock goes down in this way, the calcium content increases, and so does the CaO/ P2O5 ratio, which is the major indicator of sulphuric acid consumption. For example, to make a tonne of P2O5 as phosphoric acid from 75% BPL phosphate rock, about 2.5 tonnes of sulphuric acid are needed; if 65% BPL materials used, the f igure is more l ike 3 tonnes or possibly more, depending on the other impurit ies present. The amount of by-product gypsum
6
is correspondingly larger, which signif icantly increases the required active fi l ter area. So, although calcium is a natural constituent of apatite minerals, the extra calcium associated with lower-grade phosphate rocks may reasonably be considered an impurity, since it has a profound effect on the economics of processing them.
Fluorine is present in almost al l phosphate rocks because of the calcium fluoride content of f luorapatite. Depending on the type and origin of the rock, f luorine may represent 2-4% of the total weight. Sulphuric acid reacts with f luorides in the attack section of the phosphoric acid plant, l iberating hydrogen fluoride , HF. This is a highly corrosive vapour at the prevail ing temperatures, but i f sufficient sil ica is present in the phosphate rock – and it usually is – the much less corrosive f luosil icic acid is formed instead. Indeed, where the phosphate rock has an unusually low sil ica content, reactive sil ica may be added, in the form of clay or other convenient material , to ensure that al l f luorine in the rock is converted to fluosil icic acid.
Depending on the reaction conditions, part of the fluosil icic acid is evolved as vapour and the rest remains in the l iquid phase, forming f luosil icates with other species in the reaction medium. Some of these fluosil icates go on to form sludges in the product acid, while most of the remaining free fluosil icic acid appears as vapour in the evaporator exhausts when the acid is concentrated. Air pollution regulations in many countries do not permit free discharge of any f luorine-containing vapours, and some form of scrubbing device is usually instal led to control emissions.
Silica -Though beneficial in suppressing hydrogen fluoride generation, si l ica in larger quanti t ies can be a nuisance during processing. I t passes through the phosphoric acid process largely unchanged, not only adding to the fi l ter duty but also eroding agitators, pumps and pipes.
Carbonate is also a common impurity in phosphate rock. It can be present as carbonate apatite, l imestone, dolomite or calcite, and in other forms on occasion. Rock from sedimentary deposits often contains carbonate in a form which imparts reactivity, whereas rocks of igneous origin, even in association with calcite as carbonatite, are usually rather unreactive. Often, very reactive carbonate-containing rock is used for direct application ferti l izer, since it wil l quickly solubil ise in the presence of soil acids. On reaction with sulphuric acid, carbonate tends to effervesce, creating foams which are stabil ized by the presence of organic matter in the rock. This can cause severe diff icult ies in a phosphoric acid plant, since output may have to be restricted to prevent the reactor from overflowing, which would result in product loss, would be a danger to personnel and would expose parts of the plant not designed for i t to an unacceptable Corrosion risk. For this reason, rock phosphate with a high organic content is
7
often calcined after beneficiation to eliminate the organic material; but that also reduces reactivity because the carbonate is destroyed as well.
Various additives have been successful in controll ing foam stabil ization, including oi ls, long-chain alcohols and more esoteric preparations. Organic materials can also lead to discoloration of the f i l ter acid (“black acid”) and may “blind” the fi l ter.
The most common cationic impurities in phosphate rock are iron, aluminium, magnesium, sodium and potassium. Iron and aluminium are usually present in similar amounts, a l i t ter more aluminium than iron. In moderate quantit ies they have l i tt le impact, apart from affecting the sulphuric acid requirement in a relatively small way. Indeed, the presence of some aluminium in phosphoric acid is generally held to be beneficial to crystal formation and therefore to f i l terabil i ty, and it also has a tendency to reduce corrosion. But at higher concentrations both iron and aluminium form insoluble gels of complexes with phosphates and fluosil icates, which increase the viscosity of the acid and “blind” the fi l ter cloth during acid manufacture and may later settle as sludge during storage.
Magnesium, sodium and potassium all tend to form complex phosphates and f luosil icates, which either impair crystall ization of calcium sulphate or increase the viscosity of the acid; their effect is therefore mainly felt at the fi l ter and in subsequent operations on the acid, such as concentration and handling of the concentrated acid. Magnesium, in particular, has a marked effect on viscosity if present in appreciable quantit ies. Many other impurities in the rock which come through in the acid also give rise to sludges and secondary precipitation when the acid is concentrated to merchant grade or super phosphoric acid.
Other cationic impurit ies tend to be specific to particular types of rock. For example, igneous phosphates often contain rare earth elements (lanthanides), as well as strontium and barium, which tend to inhibit recrystal l ization of calcium sulphate. These elements therefore affect the type of crystal l ization technology, which is suitable for phosphoric acid production. Igneous rocks from specific origins often contain unique impurit ies, such as ti tanium dioxide in Tapira rock (Brazil) and copper in Phalaborwa rock (South Africa).
Of the other anionic impurit ies besides fluorine, chlorine is undesirable at levels above 300 ppm (0.03%) and is extremely undesirable above 1,000 ppm because it is too corrosive, especially in association with hydrogen fluoride and sulphuric acid. Special materials are required in the reaction sections of phosphoric acid plants designed to use high-chlorine rocks.
Impurities and their effect on fertilizer production:
8
Impurit ies in phosphate rock involve extra costs in processing it to acid and many stay in the acid in some form once it is made, to go on to affect subsequent processing and the manufacture of derivative products.
Feed phosphate production requires acid of high purity, since fluorine and other impurities in run-of-plant acid can render the product unsuitable for animal consumption.
Although phosphoric acid required for fert i l izer manufacture need by no means be pure, impurit ies derived from the rock can have a major effect on the nature and properties of the products, particularly when ammoniation is involved. In tr iple superphosphate, for example, iron and aluminium can increase the caking tendency, although this problem is more usually associated with the impurit ies in the rock feed (i .e. the secondary rock) rather than impurit ies in the acid. All the cationic impurit ies implicated in sludge formation in phosphoric acid, as well as some that are not, tend to form water-insoluble complex phosphates when the acid is ammoniated, which lowers the water-soluble P2O5 content of the product. Magnesium forms ammonium magnesium phosphate, MgNH4PO4, as an insoluble precipitate.
Influence of F, Al2O3 and SiO2 contents:
The inorganic elements in sedimentary rock that are well known to affect considerably the crystal habit and size of CaSO4 are F, Al2O3, SiO2 and to a certain extent MgO.
The presence of free fluorine ions leads to the formation of long thin needle crystals, which are diff icult to f i l ter. Al2O3 and SiO2 are beneficial to crystal l ization because they reduce the free f luorine ions concentration and improve the form of CaSO4 crystal. Moreover, i t has been reported that the presence of active si l ica has a positive effect on the reduction of corrosion and crystal l ization of CaSO4. By changing F/ SiO2 ratio, needle – type crystals can be modified to agglomerates. The best crystals look l ike balls, because of their surface to volume ratio is at minimum.
Furthermore, important fundamental information about the effect of these impurities on the corrosion rates, crystall ization of the precipitated CaSO4 and the calculation method of Fluoride Complexing Ratio (FCR) can be found in the l i terature by M. Schorr.
F
FCR = -------------------------------------------- < 1 1.12 Al2O3 + 1.27 SiO2 + 0.94 MgO
On the basis of this, FCR is calculated from the phosphates analysis data obtained taking into account the solubil i ty factors of these impurities in PA.
9
When the ratio of FCR higher than one:
It results in poor slurry f i l tration characteristics, low fi l tration capacity and washing efficiency. When increasing the Specific Fil tration Rate (SFR) higher than 4.6 t/m2 pd P2O5 and after hours of retention time, the quality of slurry f i l tration deteriorates, completely uncontrol lable, and consequently the attack. On account of bad fi l tration, the water – soluble P2O5 losses in gypsum increase asymptotically to higher than 5.0%. Microscopic examination discloses that the gypsum consists of long thin needle shaped crystals: (length 250 – 300; width 30 – 50 and thickness 2 – 3 microns). Beside it is in dark colour, very sticky with 33 – 37% of free water content and high thyrotrophic properties. Surface area of cake is about 3400 cm2/g.
The maximum P2O5 content attainable of the f i l trate acid is between 25.5 to 26% of P2O5 (higher than 26% P2O5 increases slurry viscosity).
Reduction of FCR to 0.83 in the phosphate used:
This causes some improvements with plant performance:
Increase the SFR from 4.6 to 5.5 t/m2 pd P2O5. Increase acid concentration of the f i l trate acid to 27% P2O5. Improve marginally the f i l terabil i ty and washabil i ty of gypsum. Washing
efficiency can be maintained at the level of 98.5%. Produce gypsum containing big rhombic shaped crystals with 15 – 20%
free water content. Moreover, it has been observed that, when Al2O3 content in slurry l iquid phase is less than about 0.08%, the gypsum becomes waxy, soft and white in colour consists of needle shaped crystals. Further increases in the content to higher 0.1% changes crystals habits from needle to rhombic shape.
Minor Element Ratio (MER)
Fe2O3 + Al2O3 + MgO + MnO4 all in %
MER= -----------------------------------------------------
P2O5
A rock’s MER is indicative of i ts suitabil i ty for use in production of wet process phosphoric acid and subsequent conversion to ferti l izer l ike DAP. If MER for phosphoric acid is below 0.10, and the suspended solids into composite acid is 2% or less then it is possible to manufacture 18:46:0 DAP grade. At slightly higher MER, a form of high nitrogen analysis l ike urea can be added to maintain grade. However, when MER value reaches the range of 0.135 to 0.155 the DAP product becomes off grade i.e. 16:48:0.
Impurities in Phosphoric Acid – their effects in manufacture of fertilizers:
10
1. Calcium – When fluorine is in excess of that required by aluminum, iron, chromium and vanadium, it can precipitate as CaF2, provided that the soluble sil ica also has been satisfied. Investigation at several phosphoric acid plants showed that the acids contain higher calcium contents; two possible sources of this are: (1) the phosphoric acid unit was operated at high extraction temperatures, which caused an unusually large amount of calcium to be dissolved in the product acid from the plant; and (2) the amount of gypsum in the acid also was high because of the type of f i l ter used or maintenance of the fi l ter.
2. Magnesium – Like calcium, the magnesium ammonium phosphate was too poorly crystall ized to be observed directly in the ferti l izer. MgNH4HFPO4 could precipitate in the preneutralizer (lower pH), and MgNH4PO4, H2O could be formed in the granulator where the pH is high. This compound can lose ammonia and water during drying of the product to produce an amorphous material. If the magnesium concentration in the DAP grade acid (~ 40% P2O5) is too high to make grade (14:46:0), i t can be removed effectively from the acid by adding by-product H2SiF6 to precipitate MgSiF6 to reduce the magnesium concentration to an acceptable level.
3. Iron and Aluminium – Chemical analyses of the water insoluble components from commercial diammonium phosphate ferti l izers show that the Fe and Al precipitate is much more complex than the (Al, Fe) PO4, nH2O formula indicates. Iron and Aluminium also can precipitate as (Fe, Al) NH4 (HPO4)2 when there is insufficient fluorine in the phosphoric acid to precipitate (Al,Fe)NH4HPO4F2.x H2O. The Al end member precipitates first, the Fe end member precipitates if sufficient fluorine is present. If insufficient f luorine is present, the Fe end member of the compound (Fe, Al) NH4 (HPO4) 2 precipitates f irst with the Al end member precipitating next. When (Fe, Al)NH4HPO4)2 precipitates in the preneutral izer, i t occurs as an amorphous gel which could contribute towards viscosity problems in the preneutralizer. This condition quickly dissipates with the temperature and retention t imes encountered in 18:46:0 production to produce large euhedral crystals of (Fe, Al) NH4 (HPO4)2. In the preneutralizer, conditions of sl ightly higher temperatures and longer retention times have resulted in citrate-insoluble phosphate. The citrate-insoluble phosphate problem in 18:46:0 ferti l izer was found to be related to the FeNH4 (HPO4) 2. Excessive quantit ies of iron and aluminium can be decreased in the phosphoric acid by better clarif ication of the insoluble sludge components from merchant-grade acids. Iron and aluminium are decreased to 0.2 to 0.3% Fe2O3 and 1.6 to 1.8% Al2O3 in wet process acid containing 54% P2O5 by addition of a soluble source of potassium.
4. Zinc, Cadmium, Nickel, Manganese and Uranium – Although each divalent trace element is relatively insignificant in quantity, their collective effect, particularly in western acids, is to neutralize a significant quanti ty of phosphoric acid as a low nitrogen content compound.
5. Chromium, Vanadium – Stabil i ty constants for complex ion formation of f luorine with chromium and vanadium are similar to those for f luorine and iron.
6. Silica – The sil ica content was associated with the water soluble fluorine and was calculated as (NH4)2SiF6. At f irst, the water soluble f luorine was suspected to be (NH4) 3 AlF6; however, the absence of a signif icant water soluble aluminium component eliminated this possibil i ty.
11
7. Sulphate – Only two sulphate containing compounds have been detected, viz; (NH4) 2 SO4 and Ca4SiAlSO4F13 12H2O, which is an insoluble component carried over in the wet process phosphoric acid. (NH4)2SO4 is the stable sulphate in equil ibrium with the ammonium phosphates.
8. Fluorine – Other than ammonia and phosphate, f luorine is the most widely distributed element in 18:46:0 ferti l izers. Fluorine occurs as Ca4SiAlSO4 – F13 12H2O, CaF2, (Al, Fe)NH4HPO4F2 x H2O, (V,Cr)NH4HPO4F2 x H2O, and (NH4) 2 SiF6. Precipitation of the complex metal ammonium fluoro-phosphates presents a potential method for converting residual f luorine derived from wet process phosphoric acid to an insoluble form in the 18:46:0 grade product rather than scrubbing the f luorine by expensive pollution abatement processes. Some commercial 18:46:0 producers are using their ammonia scrubbers for f luorine scrubbing by operating at a low mole ratio N: P; which is effectively the same as a preneutralizer slurry, only a l i tt le lower in pH. Usually about one-third of the acid used in the process is added to the scrubbers and the remaining acid is added directly to the preneutralizer. When all of the acid was added to the scrubbers and the mole ratio N:P was something less than 0.6; there was a significant loss of f luorine from the scrubbers. For this reason the amount of acid added to the scrubbers was l imited.
9. Phosphate – The N:P adjustment can be used to augment either the nitrogen or phosphate level in the 18:46:0 product at the expense of the other component by precipitating NH4H2PO4 (low N, high P2O5) or (NH4)3PO4 (high N, low P2O5).
10. Water – Free water, which decreases both ferti l izer components, is decreased by slightly higher temperatures and much longer retention t imes in the preneutral izer. Moisture can be decreased before complete ammoniation (f irst stage preneutralizer) if the fluorine concentration is low or in the preneutralizer i f the fluorine is sufficiently high to prevent the precipitation of FeNH4 (HPO4) 2.
IDEAL PHOSPHATE ROCK 1 . High P2O5/CaO rat io . 2 . Low Organic Mat ter 3 . Low Carbonate 4 . SiO2/F ra t io to avo id excess o f F luor ide in Phosphor ic ac id –
min imiz ing corros ion/avoid ing in ter ference of crysta l growth. 5 . Low Alkal i meta l contact (Less scal ing) 6 . Low leve l o f cat ion ic impur i t ies ( less s ludge) – low water insolub le
P2O5 in fer t i l izer . 7 . Suf f ic ient cat ion ic impur i t ies to produce rhombic shaped d ihydrate
crysta ls – not requ i red for hemihydrate . 8 . High react iv i ty . 9 . Be re la t ive ly sof t . 10. Cl < 0 .03%
MgO - - - - - - = 0.095 for main ly 18:46:0 DAP P2O5
12
11. Hydra ted s i l ica te in the rock g ives h igh f i l t ra t ion rate in Flor ida rock than calc inated rock.
12. MgO -does not precip i ta te dur ing acidula t ion and a lso concentra t ion.
- A l lowable MgO should be @ 0.016% of P2O5 content . 0 .576 = 0 .6
13. SA requirement = 1 .706 X CaO - - - - - Wt. a t 100% P2O5
Or 97 .5% of s t iochiometr ic CaO/ H2SO4 ra t io .
Growing Dependence on Low Quality Rock Phosphates
Developing process to accommodate the changes taking place in world raw material sources and supplies is a problem which applies in the field of natural phosphate processing for fertilizer manufacture as much as any. It is now becoming necessary to press into commercial use raw materials of lower quality than the minimum for which the traditional processes in current use were designed.
The concentration of presently exploitable phosphate reserves in a few countries; unforeseeable rises in export prices; the long distance of some importing countries from these sources and high transport costs resulting from the continuing rise in crude oil prices; the policy of the developing countries to utilize their own natural resources; and the vital importance of the fertilizer industry in providing essential food supplies – all these are factors which encourage the exploitation of new sources, even if their quality is lower.
Thus it is that there are on the market today phosphates with P2O5 content below 30% or with chlorine contents exceeding the limits permissible in “classical” wet-process phosphoric acid or nitro phosphate plants. Examples are some grades of Israel phosphate, Tunisian 65/68 BPL, Egyptian Hamrawein phosphate and Syrian phosphates. There are also now projects for commercializing some phosphates containing undesirable substances which are not suited to “classical” processes such as MgO-rich phosphates or sulphide-containing phosphates such as Egyptian Abu Tartur rock.
The problems of impurities in low-quality phosphates
Low quality phosphates raise problems as regards processes and engineering, which have to be solved either by adapting existing processing technology to their peculiar features or by developing suitable new technology.
Not only are rocks quarried from various deposits different but also rocks from the same deposit which have almost similar analyses may differ very much in their behaviour when processed. All phosphate rocks contain various impurities in differing ratios which have notable
13
effects on certain process stages in the manufacture of phosphoric acid. The main impurities are: iron, aluminium, magnesium, fluorine, chlorine, carbonate, sulphides, alkalis and organic matter.
Iron, aluminium and potassium tend to lead to the formation of precipitates consisting mainly of Fe3KH14 (PO4)8,4H2O and Al3KH14(PO4)8.4H2O, which diminish P2O5 efficiency. Aluminium and magnesium increase the viscosity of the product phosphoric acid. Apart from the problems caused by gaseous and liquid effluents, fluorine increases corrosion of metallic materials in the plant – a property it shares with residual sulphuric acid in the product – although this is normally less serious than the effect of chlorine, while the carbonates cause a much higher consumption of sulphuric acid and, together with organic matter, give rise to stable foams.
A number of properties should be considered besides the chemical analysis of phosphatic rocks when selecting them for the manufacture of the phosphoric acid, such as hardness, porosity and characteristics related to granulometry – particle size range and specific surface, for example.
Until recently, phosphate rocks of lower grade than 66% BPL (30.2% P2O5) have been considered economically unprocessable for phosphoric acid manufacture.
The new industrial processes may – indeed must – be flexible enough to overcome the problems caused by phosphate rocks of various qualities for the least possible increase in investment and operating costs.
Chlorine as a damaging impurity
From the economic point of view, high chlorine contents exceeding the limit acceptable for conventional phosphoric acid plants is most important, since high-chlorine rocks are quite abundant but can only be used in existing plants if they are partially rebuilt, which is very expensive.
The problem of the chlorine in phosphates is exacerbated by the fact that some principal deposits are located in areas where fresh water is scarce and consequently sea water or water from salt lakes is used in upgrading them, which increases their chlorine content.
The problem which disqualifies chlorine-containing phosphates from use in most phosphoric acid and nitro phosphates plants is, in fact, the great corrosiveness of the high-chlorine phosphoric acid towards the steels currently used in building such plants.
Corrosiveness of wet-process phosphoric acid to stainless steels
Passivation by phosphating
The corrosion resistance of austenitic Cr/Ni and Cr/Ni/Mo stainless steels to phosphoric acid is basically due to phosphating – the formation of an even film of phosphates on the surfaces exposed to the acid. The stability of this passive film (which consists usually of a layer of phosphate overlying a layer of oxide) depends on the degree of oxygenation of the chemical medium and on the chemical impurities, such as chloride, that it contains.
14
It may be considered that as long as the passivation layer is continuous the materials are resistant to corrosive attach by the medium. Some generalized corrosion of the whole surface may still occur as a result of dissolution and reforming of the oxide layer, which takes place as a continuous process of reduction-oxidation.
Around 100oC, even the AISI 316 Cr/Ni/Mo steels reach corrosion rates of 0.7-0.8 mm per year, which is about the highest permissible corrosion rate for most industrial purposes. Above 100oC, only high-alloy steels (Uranus type and others) are satisfactory, as will be explained further on.
As during the phosphoric acid manufacturing process the medium is not always the same, and since it unavoidably contains a number of impurities such as H2SO4, H2SiF6 and HF, the actual corrosion rates may be higher at a particular combination of temperature and concentration.
Table I Corrosivity of Acids from Different Phosphates
Group Corrosiveness Phosphate I Low South Africa (Phalaborwa) Nauru Senegal (Taiba) Florida (Tanysa, Pebble) Brazil (Araxa) II Medium North Carolina Kola Morocco (Khourighba, Usufie) Turisia (Gafsa) Togo III High Sahara (BuCraa) Syria* Jordan* Israel* Mexico* *High-Chlorine Phosphates
Effects of individual impurities and alloy constituents
Corrosive attack is worsened by high fluoride and chloride contents but is lessened by the presence of silica and alumina, which form complexes with fluoride. From also has a beneficial effect, as it increases the cathodic reaction and promotes the active-passive transition.
Chromium is the most favourable steel additive, as it diminishes the degree of passive corrosion and increases the possibility of active-passive transition. Molybdenum and, to a lesser extent, copper also have a positive effect on the active-passive transition. The main function of nickel as an alloying element is to form the austenitic structure.
Because there is such a multitude of factors affecting the corrosion performance of steels in wet-process phosphoric acid and also because of the variation in the specific conditions
15
between processes, particularly the nature of the reaction medium, acid concentration and temperature, a wide range of alloy steels has been developed for phosphoric acid plant duty.
Effects of reaction conditions
The corrosion effect of phosphoric acid on special steels is strongly influenced by other factors besides impurities present, such as temperature, acid concentration, oxygen present in the acid as oxidizing compounds, Fe3+, Cr6+, and especially by the composition of the steel and metallurgical factors (for example, the sensitization which occurs when a stainless steel is heated in connection with welding).
Process Systems and Calculations
The phosphate rock user lives in a permanent state of doubt and suspicion about phosphate rock composition and analysis. Whatever will happen in a plant or with the quality of a commercial product, the user’s first reaction often is: “Hasn’t the rock changed?” In fact, the rock is sometimes a welcome scapegoat – without a defender.
Once the phosphate ore is sent into the phosphoric acid plant, things do not improve; they get even worse. The components of the phosphate ore split into a three-phase system, each component having its own splitting coefficient. Solids, liquids, and gases leaving the phosphoric acid reaction system are not pure substances; they are complex mixtures.
Some of the phosphate rock remains unattacked within the calcium sulphate. The calcium sulphate produced is not pure but a mixed crystal containing dicalcium phosphate, and these crystals are mixed with a number of other crystallized substances, such as sodium silicofluorides.
The liquid phase, the product acid, contains, besides phosphoric acid, most of the impurities that originate from the phosphate rock and the process water, plus some of the sulphuric acid. However, these impurities are subject to further precipitation, called sludge, while the product acid is cooling an aging in the storage tanks.
The physical and chemical properties of phosphoric acid depend in large part on the impurities remaining with the acid. In heavily loaded acids the sum of impurities can amount to some 30 wt % compared to the P2O5 content of the acid. During concentration by evaporation, further changes occur. Fluorides and chlorides escape partially into the gas phase and other complex compounds precipitate as sludge, this time including complex phosphate compounds.
Preparation of the Data
The first step is to have at hand the information on which the material balance calculation will be based, as follows:
1 Production capacity in tons per day of P2O5 This capacity is a function of process design and feed phosphate rock characteristics. The two are inseparable. An
16
existing installation with a proven capacity based on a specific rock need not necessarily produce at the same capacity with a different rock.
2 Phosphate rock composition: This information should be as complete as possible. As a minimum, P2O5, CaO, and SO3 content must be known.
3 Rector slurry solid content and P2O5 content (in the liquid phase): If no actual information is available, use 25% solids and 28% P2O5 in the liquid phase.
4 Gypsum quantity (better still, total solids) produced per ton of feed rock: It is best to
determine this value through bench-scale testing because theoretical calculations are not always representative of reality. Nevertheless, a calculation procedure will not be presented in the following section. The water content of the gypsum cake at filter discharge should be known or assumed (from 20% to 40%).
5 P2O5 losses : If not already known, these losses will be estimated with an empirical
equation.
Recycle Acid System
Recycle acid, also called return acid, is the liquid phase resulting from washing filter cake with process water. Thus the recycle acid contains the process water plus the amount of product acid that was retained within the filter cake before washing.
1. Process water going into the system satisfies the total water requirements for: 2. Product acid water content (or dilution water – about 50% by weight in 30% P2O5
acid) 3. Gypsum crystal water 4. Vaporization cooling of the reaction slurry
To have a smoothly operating phosphoric acid unit means having a smoothly operating return (or recycle) acid system. The problem is how to do this, because the recycle acid system is subject to destabilizing factors and consequently is difficult to control.
Recycle acid is transferred directly from the operating filter; there is no surge capacity, and it is subject to fluctuations both in flow rate and P2O5 composition, due to the following: (1) cake filterability variations, (2) residual cake moisture variations, and (3) operating inaccuracies such as filter slurry load, slurry composition, wash water load, filter speed, positioning of the wash rows.
These three factors also interact. If the operator controls wash water flow, he or she knows the water loading on the filter but does not know the amount of water that will go into the system, because the filter cake carries some of it away as residual cake moisture. The latter is dependent on crystal qualities, cake thickness, temperature, filter speed (drying time) and vacuum.
Also, at the end of the first filtration section (product acid section) the amount of phosphoric acid remaining in the cake is variable, which in turn causes variability in the volume of
17
filtrate available for transfer as product acid and as recycle acid. This amount of acid held up in the cake at the end of the first filtration section depends on:
1 Crystal or cake quality 2 Viscosity of the phosphoric acid (dependent on concentration and impurities) 3 Temperature of the slurry 4 Filter load or cake thickness 5 Solid content of the slurry 6 Filter speed 7 Vacuum of the filter system
Heat Balance
Heat balance for wet process phosphoric acid processes is difficult to calculate with sufficient accuracy from thermodynamic tables. The composition of the raw materials and the heavy impurity load of the phosphoric acid make evaluation inaccurate. We have consequently chosen a more pragmatic approach by taking the basic data for heat release from plant experience. By comparing a great number of heat balances from operating plants, we evolved a simple method for the determination of heat balance with sufficient accuracy, both for engineering design and for the operating of a wet process unit. Most of the heat released from the reaction medium originals from sulphuric acid dilution, and the reaction heat itself are, again, directly tied to the amount of consumed sulphuric acid. It is obvious subsequently that the heat / H2SO4 ratio will be more consistent than the heat / P2O5 ratio. Consequently, the heat equations we shall propose here will be based on that assumption.
P2O5 Losses
Definition of P2O5 Losses
Before dealing with the problems of P2O5 losses, we must first define what various groups of people understand by the term “losses.”
When one buys a phosphoric acid plant, the engineering contractors, in the heat of competition, guarantee a certain maximum level of P2O5 losses. These losses are measured, by means of certain procedures laid down in the contract, during the days where the test run occurs. During the test run, monitoring is, of course, at its most efficient level; there are usually no start-ups and shutdowns, and consequently the resulting value for the yield of recovery will be higher than under normal operating conditions. However, when it comes to normal production conditions, many factors intervene, such as start-ups, breakdowns, shutdowns, technical hitches, spills, cleaning, and so on, and thus the overall losses measured throughout the year will be quite a bit higher.
Finally, when the plant accountant balances the books with respect of purchases and sales of P2O5 he or she will find even more losses. If the plant is well managed, the increase in losses compared with the chemically measured losses will be only 0.5 – 1% of the total P2O5.. Nevertheless, cases of losses in this category have been reported as high as 4% above measured losses (frequently during the initial production year). In general, however, once the
18
plant has formed its normal operating rhythm, these losses stabilize around the 1% mark and when measuring losses, it is a common practice to add this percentage to the measured losses. This added percentage is called “mechanical loss.
It is thus imperative that we resort to the accountant’s figures for a true picture of the actual losses. It is this type of losses that we will consider throughout this section of P2O5 losses.
Fluorine
Phosphate rock always contains fluorine. For F/ P2O5 ratios, the fluorine content in rock of sedimentary origin ranges in general from 0.10 to 0.14. Rock of igneous origin shows lower ratios, from 0.04 to 0.06.
Calculating with fluorides or establishing the fluorine balance of a phosphoric acid plant is a very difficult matter, for the following reasons:
1 Analyses of fluorine and fluorides are tedious and often inaccurate.
2 Fluorides, once they have entered the reaction system, become volatile compounds partially escaping the phosphoric acid slurry in various proportions.
3 Fluorides enter into many complex compounds, such as A1F63+ and SiF6
2+.
4 Fluorides build many compounds with limited solubility in phosphoric acid, varying with temperature and phosphoric acid concentration, so that fluorides are permanently found in gas, liquid, and solid phases (2).
Scaling
How to Predict the Scaling Tendencies of Rocks
Usually, there is much more sodium than potassium in phosphate rock and Na2SiF6 is the dominant precipitating fluoride compound during the reaction and filtration stage of phosphoric acid production. Every acid producer is familiar with the large, white, scaling plates of Na2SiF6 which occur along reactor walls, agitator shafts, and especially in the 30% product acid pipes, which have to be washed about once a week (speed of dissolution about 1 mm/hr with 30oC open cycle water)..
With hemihydrate systems operating at higher P2O5 product acid levels the Na2SiF6 scaling still affects the 30% P2O5 level, but in this case it is the return acid section (the first wash after the product acid section on the filter). Steam heating and dilution have to be used to cope with that scaling case. Usually, there is very little potassium content in phosphate rock and K2SiF6 is therefore less common.
Occasionally, phosphate rock might be contaminated due to shipping or handling in storage (e.g., with KCl) and this can change the picture. In this case, the water wash sector pipe of the filter usually plugs completely, once a day, with K2SiF6 and NaKSiF6.
19
Sodium is contained in most of phosphate rocks but may be increased by the use of process water containing sodium. This happens frequently in North Africa and in the Middle East, where the locally mined rock is converted into phosphoric acid and the local water currently contains more or less sodium chloride. This can bring great changes into the fluorine distribution ratio between the liquid and the solid phase in the slurry. 6F- precipitate with 2Na+, so, small sodium values cause greater fluorine variations.
COMPARING PROCESSES Selection of the optimum process requires careful evaluation of capital and operating costs, requirements for raw materials and reagents, quality of products and by-products, utility situation, opportunities to recover valuable raw materials, and a variety of other issues. Every project has its own set of needs, costs and opportunities, so a detailed evaluation is necessary to pick the process. Factors which often vary so greatly that they have overwhelming influence on process selection include: · Performance of phosphate rock in the various processes · Phosphate rock cost, delivered · Sulfur cost, delivered · Value of exported electric power · Gypsum utilization or disposal situation · Opportunity to recover uranium The main issues are discussed below in a qualitative manner, based on typical or average situations. Any project that is being seriously considered should involve a comprehensive evaluation of each of these issues, including cost information that is specifically tailored to the site. To help provide an overview of issues to consider, the three processes are rated in the attached “Di, Hemi, and Hemi-Di Processes Comparison Table. This table relates to average situations, but one must recognize that any individual project may have circumstances that are far from typical.
CAPITAL COST – REACTOR/FILTER SYSTEM A Di process will usually have the least expensive main reactor. Experience with dihydrate reactors over several decades has demonstrated that many plants are operating at capacities that are more than double original design capacity. Such experience is utilized to confirm that new reactors can be much smaller than those of a few decades ago. Hemi reactor size requirement has also tended to decrease as plant experience is gained, but the Hemi process has a shorter track record to draw from. Filter size requirement varies greatly with the type of phosphate rock that is utilized. Pilot plant testing of the phosphate rock can predict filtration rate before the plant is designed. It has been my observation that filtration rate tends to average somewhat higher with a Di process than with a Hemi process. However, there are many exceptions, so a valid comparison between the two processes must consider experience in real plants and pilot plant testing. Since the Hemi process operates at hotter temperatures, metals tend to corrode somewhat faster than in the Di process. Consequently, metals in agitators, pumps, and filter wetted parts will usually be somewhat more expensive in a Hemi plant. Flash coolers in Hemi reactors can be significantly smaller and require less circulation rate than those in Di plants. However, Hemi plants require more fume collection capacity and efficiency than Di plants. The entire reactor/filter system for a dihydrate process will usually be smaller and less expensive than for a Hemi process. A Hemi-Di process requires a Hemi reactor/filter system
20
followed by a simpler and smaller dihydrate reactor/filter system. Consequently, reactor/filter capital cost is very high in a Hemi-Di plant.
CAPITAL COST OF OTHER PLANT SECTIONS The Hemi process has advantages outside of the reaction and filtration sections that tend to allow the total plant capital cost to be significantly less than with a Di process. The first advantage is that the Hemi reaction does not require the phosphate rock to be ground as finely as does the Di process. The popular Yara (Hydro) Hemi process can use rock particles as large as 2 mm (9 mesh), compared to a typical 35 mesh requirement with the Di process. This means that a Hemi plant can use phosphate concentrate and other phosphate up to 2 mm in size without any processing. In contrast, a Di process usually requires rock to be finely ground in a ball mill, requiring major expense for capital, operation, maintenance, and energy. A Di plant makes filter product acid at around 27% P2O5 concentration, compared to about 42% P2O5 acid from Hemi filters. Consequently it requires additional evaporators to concentrate this acid, along with substantial investment for additional cooling water and acid storage facility. A Hemi plant normally has lowest capital cost for a new plant, because it usually avoids rock grinding (except with pebble-sized rock), it requires much less (if any) evaporation of acid, cooling water is minimized, there is no 27% P2O5
acid to handle, and product acid clarification is usually unnecessary. Although a Di process might have a less expensive reactor and filter section, it would require all of those extra plant sections and expanded capacities. Consequently, the whole plant containing the Di process would normally cost around 20-25% more than a Hemi process plant. A Hemi-Di process shares Hemi’s advantages of eliminating or down-sizing of those plant sections. However, Hemi-Di requires a second (but simpler) set of reaction and filtration facilities, which roughly offset savings in other sections. I would guess that the whole Hemi-Di plant would cost no more than a whole Di plant, when cost of rock grinding, evaporators, acid handling, and cooling are considered.
PHOSPHATE ROCK & SULFURIC ACID REQUIREMENT
Most loss of product in a phosphoric acid is in the filter cake, so filter recovery has the largest influence on how much raw materials are required. This must be evaluated on a case by case basis. Licensors guarantee performance including recovery at the filter cake for the specific plant and conditions. Di and Hemi plants typically achieve filter recovery in the mid-90% range, with Di plants averaging perhaps a percent or so higher than Hemi plants. Hemi-Di recovery (based on filter cake) is typically 98-99%. There will be considerable additional losses beyond filter cake losses. Phosphoric acid is lost by entrainment from flash coolers and evaporators, leakage from seals, filter mechanical losses, dumping of acid during maintenance and cleaning, and accidental spills. The total of such losses may amount to a percent or two of product in a typical plant. Hemi & Hemi-Di plants have much less evaporator entrainment losses, because very little evaporation of acid is required. Only Di plants are exposed to losses from handling 27% P2O5 acid because Hemi & Hemi-Di don’t produce the weak acid. Hemi-Di plants have additional exposure to general material handling losses around reactors and filters, because they have more reactors and filters. There can be opportunities to recover what had been lost. Many plants recirculate the acidic water from the gypsum stacks and/or cooling water systems. Some of this acidic water is used to wash the filter cake. Most cake wash water proceeds through the filter and ends up in product acid. Thereby, over half of all phosphoric acid which had been lost into this acidic water is eventually recovered from the recirculated water. Any plant that recirculates acidic water from the gypsum stack will recover most of the water soluble losses in the filter cake. However, water insoluble losses from a Di plant (or the Di filter in a Hemi-Di plant) remain locked in the dihydrate gypsum crystals, so it cannot get
21
recovered. This refers to losses that are reported as CI losses (citrate insoluble – un-dissolved rock) and CS losses (citrate soluble – co-precipitated dicalcium phosphate in gypsum crystals – the majority of filter losses). A Hemi plant that recalculates acidic water from the gypsum stack has an added recovery benefit. This is because the hemihydrate gypsum crystals will release co precipitated dicalcium phosphate out of the crystals and into the surrounding water which recover most of the water soluble losses from the filter cake. For example, a typical Hemi filter cake contains co-precipitated dicalcium phosphate (citrate soluble P2O5 ) equivalent to 3.5% of the feed. After discharging from the filter the hemihydrates crystals gradually dissolve while forming dihydrate crystals. The co-precipitated dicalcium phosphate dissolves in the acidic water and very little re-precipitates into the dihydrate crystals. Thus about half of that 3.5% loss (1.75%) gets recovered when recirculated water is used to wash the filter cake. P2O5
Recovery Rankings for the three processes are typically as follows. High recovery means low phosphate rock requirement.
1st: HEMI-DI
High recovery 98-99% is the reason for this fancy process 2nd: HEMI with Recirculation of Water from Gypsum Stack
Recovery of an extra couple percent of lost P205 gives Hemi the advantage over Di. 3rd: TIE: HEMI & DI
Di usually has a slight edge with recovery based on filter cake, but Hemi avoids evaporator entrainment and weak acid handling losses. A Hemi reactor needs significantly less sulphuric acid than a Di reactor, primarily because of the reduced ratio of sulphate to phosphate in the reactor acid. Acid from Hemi reactors typically contain 2% free SO4 and 43% P2O5 (a ratio of 0.46), whereas Di reactor acid is typically 2% free SO4 and 27% P2O5 (a ratio of 0.74). Another small advantage with Hemi is that slightly less sulphuric acid reacts with aluminium impurities. In the Hemi process these effects amount to needing about 2.5% less sulphuric acid than with a Di process with similar recovery. Sulphuric acid consumption will track with P2O5 recovery, except that Hemi & Hemi-Di have about 2.5% advantage – due primarily to low-sulphate product. The processes typically rank in this order regarding sulphuric acid consumption: Hemi-Di, Hemi, and Di.
ACID CONCENTRATION Most dihydrate phos acid plants make 25-29% P2O5 product. Higher product concentration is impractical, because it would involve pushing operating conditions into the unstable hemi/di transition boundary. Hemi plants produce phosphoric acid directly from filtration at concentrations between 38% and 46% P2O5 . Optimum concentration has been around 43% P2O5 which is near the “sweet spot” where a Hemi plant performs best. Rapidly increasing energy value may entice anyone who operates or designs a Hemi plant to raise product concentration to further enhance energy efficiency. Higher product concentration would require somewhat larger reactor and filters, and recovery might decline. However, these tradeoffs may be wise, considering the energy benefits to be gained. Hemi-Di plants benefit from water balance and cake washing situations that make it practical to make even higher concentrations of phosphoric acid – ranging from 40% to 50% P2O5.
ENERGY EFFICIENCY
Energy efficiency is essential in dealing with global warming. The Hemi process’ forte is efficient use of energy. Its high product acid concentration avoids the need for the huge
22
quantity of evaporator steam that would otherwise be required to make product concentration suitable for further processing. Ongoing trends of soaring energy costs and need to conserve energy will further magnify this advantage in coming years. The biggest source of energy for a typical phosphate chemical complex is sulphuric acid production. Surplus heat from burning of sulphur is absorbed by steam, which is used to generate all electric power required by the complex plus an export of power. Energy efficiency of a phosphate complex is greatly enhanced by use of the Hemi phosphoric acid process. A 1,500 T/D P2O5 phosphoric acid plant will save about 2500 T/D in evaporator steam by making filtered acid at 42% P2O5 compared to dehydrate process acid at 26% P2O5. This surplus steam would typically be used to generate electric power. Total electric power production is near 60 megawatts for a 1500 metric T/D P2O5 phosphate complex. The surplus electric power could be exported to the power grid for sale, or it could be wheeled to the owner’s mine or other nearby facilities. Future electric power values are likely to increase substantially as other sources of energy become increasingly expensive. A 1500 T/D Hemi or Hemi-Di plant would typically save another 3 MWs of electric power by not having to grind rock, and by having much smaller acid evaporation requirement. Hemi & Hemi Di plants also save the electric motor power that Di plants need to operate additional evaporators, cooling water pumping, and acid handling facilities. Hemi-Di plants do require substantial power for the second reactor and filters, thus offsetting part of the motor power savings. It is important to note that any utilization of energy from waste heat is environmentally friendly. This electric power is produced with incremental net results of no pollution, no greenhouse gas, no solid waste, and no consumption of fuel. No other source of energy can top this for ecological responsibility - whether it uses coal, oil, gas, nuclear fuel, wind, or solar energy. Energy Efficiency rankings for the three processes would be:
1st: HEMI needs little or no evaporator steam Avoids rock grinding (usually) Less power for evaporation, acid handling, and cooling water
2nd: HEMI-DI same advantages as Hemi However, the second reactor and filters need more power.
3rd: DI A distant last place. AVOIDING ROCK GRINDING
The Hemi phosphoric acid process can use rock which is much coarser than that required for conventional dihydrate processes, so grinding is not required for most of the world’s phosphate rock sources. Particle size requirement for Hemi is typically -9 mesh (-2 mm), versus -35 mesh (0.42 mm) for typical dihydrate processes. The Hemi process can handle damp rock with up to about 15-20% moisture. Most commercial phosphate rock sources worldwide are suitable in particle size and moisture content for feeding directly to a Hemi plant without drying or grinding. This includes coarse concentrate and some screened phosphate rocks. An important exception is that the pebble rock which makes up a significant portion of central Florida phosphate is much too coarse to feed directly to any phos acid plant. Pebble rock could be ground to -2 mm size in relatively low energy roller, impact, or hammer, mills with closed circuit screening. This pebble rock is available dripping wet with about 10% moisture, and drying would be quite expensive. Consequently, the recommended method would be to grind the damp rock without drying, followed by wet screening and recycle of damp +2 mm material to the mill. Such milling requires only a fraction of the power and capital cost that a ball mill requires.
23
OPERATOR, MAINTENANCE, AND CLEANING COST Both Hemi and Hemi-Di benefit from elimination of rock mills and evaporators, and have smaller acid handling and cooling water sections than a Di plant. Hemi reactors and flash coolers stay cleaner than those in Di plants. Di filters stay cleaner than Hemi filters. A Hemi-Di process has a second reaction and filtration second to operate and maintain. A Hemi plant should have a significant advantage over either Di or Hemi-Di, because there is much less equipment to operate and maintain. Hemi reactors have a major stability advantage, because they operate in a stable zone, well above the hemi/di transition boundary. Substantial changes in temperature and concentration can be tolerated without approaching the transition. Operating control is less critical, and the reactor is more forgiving to upset conditions or sudden changes in rock feed characteristics. This accounts for praise by those that operate the plants that they are easier to operate, more stable, and more forgiving than dihydrate plants. There is relatively little scale formation in the reactors and flash coolers, because of operating in the stable zone, and because there is lower solubility of calcium sulphate. Hotter conditions in Hemi reactors and filters cause faster corrosion to agitators, filter metal surfaces, etc. Optimum metals for Hemi service are typically one step up from metals that would be optimum for dihydrate service. Hemi reactor agitators are typically in the 904L or Ferallium 255 class, although existing 317L agitators have lasted fairly well in plants that were retrofitted from di to hemi. Upper agitator shafts in either hemi or di reactors require rubber coating. Filter pans are normally 317L or either process, but Hemi plants with highly corrosive acids should use 904L. Belt filter vacuum boxes are typically 904L.
OPERATING STABILITY Either a hemihydrate or dihydrate process can operate stably if the conditions are clearly in either the hemihydrate or dihydrate zone. Dihydrate plants must limit reactor concentration in order to keep below a transition zone between hemihydrate and dihydrate. When concentration or temperature gets a little too high, the gypsum crystals form as a mixture of dihydrate and hemihydrates crystals. These crystals are small, which reduces filtration rate. Wherever the slurry cools, scale forms inside the reactor, pumps and piping. For economic reasons dihydrate plants must push slightly into the transition zone, but good control can minimize problems. If a dihydrate reactor is allowed to get seriously over optimum temperature or concentration, filtration becomes extremely slow, and equipment scaling is severe. Crystals in a typical dihydrate plant are a mixture of some hemihydrates among mostly dihydrate crystals. Dihydrate plants tend to have far more scale formation in reaction and flash cooling systems than hemi plants. Hemi reactors have a major advantage, because they operate in a stable zone, well above the hemi/di transition zone. Substantial changes in temperature and concentration can be tolerated without getting into the transition zone. Operating control is less critical, and the reactor is more forgiving to upset conditions or sudden changes in rock feed characteristics. This accounts for praise by those that operate the plants that they are easier to operate, more stable, and more forgiving than dehydrate plants. There is relatively little scale formation in the reactors and flash coolers, because of operating in the stable zone, and because there is lower solubility of calcium sulfate. The “Calcium Sulfate Crystallization Graph” shows a hemi/anhydrite transition above the hemi zone. In actual practice this transition is so high that it is rarely a problem, except occasionally in some hemi-di plants which push reactor acid concentration to 48- 50% P2O5. In a Hemi plant conditions in filtration pass through the Hemihydrate/Dihydrate transition line. Crossing this transition caused problems for early Hemi plants. However, technology has been developed which allows this transition to be crossed with minimal scaling in the
24
filter system. Part of this technology has been use of an anti-scaling reagent that greatly slows the conversion of hemihydrate crystals to dihydrate crystals, thus reducing scaling.
COOLING WATER REQUIREMENT
Hemi & Hemi-Di plants have less need for the huge flow of cooling water normally required by phos acid evaporator condensers - perhaps none at all. A relatively small flow of cooling water is required for flash cooler condensers, fume scrubbing, equipment washing, etc. This water does not need to be as cool as the 33-350C (92-950F) required for 52-54% P2O5
evaporators in a dihydrate phos acid plant. Water at around 380C (1000F) will be adequate for scrubber water, equipment wash, etc., and more than adequate for flash cooler condenser water. Hemi & Hemi-Di plant cooling pond and associated pumps and piping are a fraction the size of comparable equipment in a Di plant.
ACID STORAGE AND CLARIFICATION Phosphoric acid storage and clarification facilities in a Hemi or Hemi-Di plant are about one third that required for a dihydrate plant. There will be agitated storage tanks for 42% acid (and possibly some 30% acid for DAP scrubber feed). Clarification is not necessary because the 30% and 42% phosphoric acids have both come from filtration, and because the high purity of Hemi acid makes further clarification unnecessary for product analysis purposes. Di plant would typically require storage and clarification for 26% and 42% acid, plus agitated storage (and often clarification) for 52-54% acid.
PHOSPHORIC ACID PURITY & BENEFITS TO FERTILIZER ANALYSIS Phosphoric acid from a Hemi or Hemi-Di plant is purer than that from a Di process, with lower sulfate, aluminum, fluoride, and solids content. DAP, MAP, and TSP produced from this acid will be about 2 percentage points higher in P2O5 than that from a dihydrate plant. This facilitates production of on-grade DAP and TSP from phosphate with high impurity levels. MAP grade would rise, thus reducing shipping cost. Effect of acid purity on DAP nitrogen content is more difficult to predict, because %N is affected not only by product purity, but also by efficiency of ammonia absorption. Calculated DAP grade benefit is over 0.5 percentage points in N, but this assumes adequate ammonia absorption. Effect of Hemi acid purity on DAP grade was demonstrated at the Belledune plant, which was converted to Hemi in 1986, using 66-67 BPL central Florida rock. Before the Hemi conversion is was difficult to meet 18-46-0 DAP grade, using settled 40% P2O5acid. Upon Hemi start-up, grade jumped to about 47.5% P2O5 and easily exceeded the 18% N requirement, using un-settled 40% acid. A simple modification was employed to prevent over-formulation of DAP.
REAGENT REQUIREMENTS Nearly all phosphoric acid reactors require defoamer. Hemi and Hemi-Di plants sometimes add clay to the hemi reactor to modify crystal shape and/or absorb corrosive free HF. Hemi-Di plants sometimes add clay to the second reactor to facilitate transformation of hemi gypsum crystals to dihydrate form.
WATER CONSUMPTION INTO THE PROCESS A Di process must consume much more water into the process than a Hemi or Hemi-Di process, largely due to the effect on water balance for producing 27% versus 42% P2O5 product. Water consumption can be good, bad, or of little consequence, depending on the circumstance. A plant receiving ground rock slurry from a wet ball mill would have to have a Di process. That much water would drown a Hemi reactor. However, a Hemi reactor does
25
not need finely ground rock, so a wet ball mill should not be involved anyway. There may be other reasons to want to consume extra water into a reactor. For example, one client expressed interest in a Hemi conversion, but the plant received 70% sulphuric acid at very low cost. There was too much water in 70% H2SO4 for the Hemi process to work, so the plant kept its Di process. The Di process could have an advantage where phosphate rock is received as slurry by pipeline, because it might be able to consume the entire slurry without de-watering. Such rock slurry would have to be partly de-watered to feed a Hemi plant. For plants in a desert or other location where water is very expensive, the Hemi reactor’s lesser need for water is an advantage. The Hemi plant also has an advantage at the gypsum discharge end. Free moisture in filter cake is about the same for a Di or Hemi filter. However, Hemi filter cake contains far less water of hydration, because of the difference between calcium sulphate hemihydrate versus calcium sulphate dihydrate. Plants in deserts often discharge gypsum to the gypsum stack as filter cake, rather than as slurry. In such plants the difference in total water content in the gypsum is important. Hemi gypsum cake is “self drying” because hemi gypsum absorbs most of the free water from the filter cake as gypsum converts from hemi form to dihydrate form. In desert conditions, this leads to another advantage of discharging Hemi filter cake. This “self drying” gypsum will never seep free water downward. Thus there is no real need for using an expensive water-proof liner under a hemi gypsum stack. In some situations it might be necessary for the plant owner to convince regulatory authorities not to mandate a multi-million dollar expense for a useless liner. The same self drying gypsum advantage is achieved with a Di-Hemi or Hemi-Di-Hemi process. It is not achieved with a Hemi-Di process, because Hemi-Di discharges dihydrate gypsum from the Di filters.
PROCESSING IMPURE ROCK There is increasing evidence that the Hemi process performs well with some types of Phosphate rocks those are impractical to process with conventional dihydrate processes. This includes rock with very low P2O5 concentrations and unusually high levels of iron, aluminium, and magnesium impurities. Such rock is either left in the ground, blended with higher grade rock, or processed for further purification. A company that has both Hemi and Di plants routinely routes the lowest grade rock to the Hemi plant, because it processes it more easily. At the Di plant is unable to make on grade DAP from clarified acid; when the plant was converted to Hemi, it immediately exceeded DAP grade by a wide margin.
GYPSUM UTILIZATION Gypsum from phosphoric acid plants can be utilized to produce a variety of products. Such phospho-gypsum has been used for road-bed material, cement ingredient, sulphate fertilizer, agricultural soil conditioner, or gypsum wall board. Further processing of the gypsum can produce limestone, ammonium sulfate, sulfuric acid, glass, and ceramics. Suitable high purity phospho-gypsum can be produced from either a Hemi-Di process or a Di-Hemi process. Gypsum of moderate purity is obtained by re-washing gypsum cake from phosphoric acid filters. Hemi, Di-Hemi, and Hemi-Di-Hemi processes produce gypsum filter cake that is self drying, which can be a major advantage for drying requirements when gypsum is utilized. This self-drying occurs because hemihydrate gypsum absorbs most of the free water from filter cake when it converts to dihydrate gypsum.
CONCLUSION Developing process to accommodate the changes taking place in world raw material sources and supplies is a problem which applies in the field of natural phosphate processing

26
for fertilizer manufacture as much as any. It is now becoming necessary to press into commercial use raw materials of lower quality than the minimum for which the traditional processes in current use were designed. The concentration of presently exploitable phosphate reserves in a few countries; unforeseeable rises in export prices; the long distance of some importing countries from these sources and high transport costs resulting from the continuing rise in crude oil prices; the policy of the developing countries to utilize their own natural resources; and the vital importance of the fertilizer industry in providing essential food supplies – all these are factors which encourage the exploitation of new sources, even if their quality is lower. Thus it is that there are on the market today phosphates with P2O5 content below 30% or with chlorine contents exceeding the limits permissible in “classical” wet-process phosphoric acid or nitro phosphate plants. Low quality phosphates raise problems as regards processes and engineering, which have to be solved either by adapting existing processing technology to their peculiar features or by developing suitable new technology. Not only are rocks quarried from various deposits different but also rocks from the same deposit which have almost similar analysis may differ very much in their behaviour when processed. All phosphate rocks contain various impurities in differing ratios which have notable effects on certain process stages in the manufacture of phosphoric acid. The main impurities are: iron, aluminium, magnesium, fluorine, chlorine, carbonate, sulphides, alkalis and organic matter. Therefore phosphoric acid manufacturers who process low grade rock phosphate have to accept lower standard or improve over poor performance by modifying operating conditions and/or plant design and possibly consider use of additives. A better understanding of Phosphoric Acid manufacturers for effects of impurities in Rock Phosphate to select Rock Phosphate on economic implications applied to their own plants. These effects of impurities need not necessarily same for different manufacturers.
******************************************
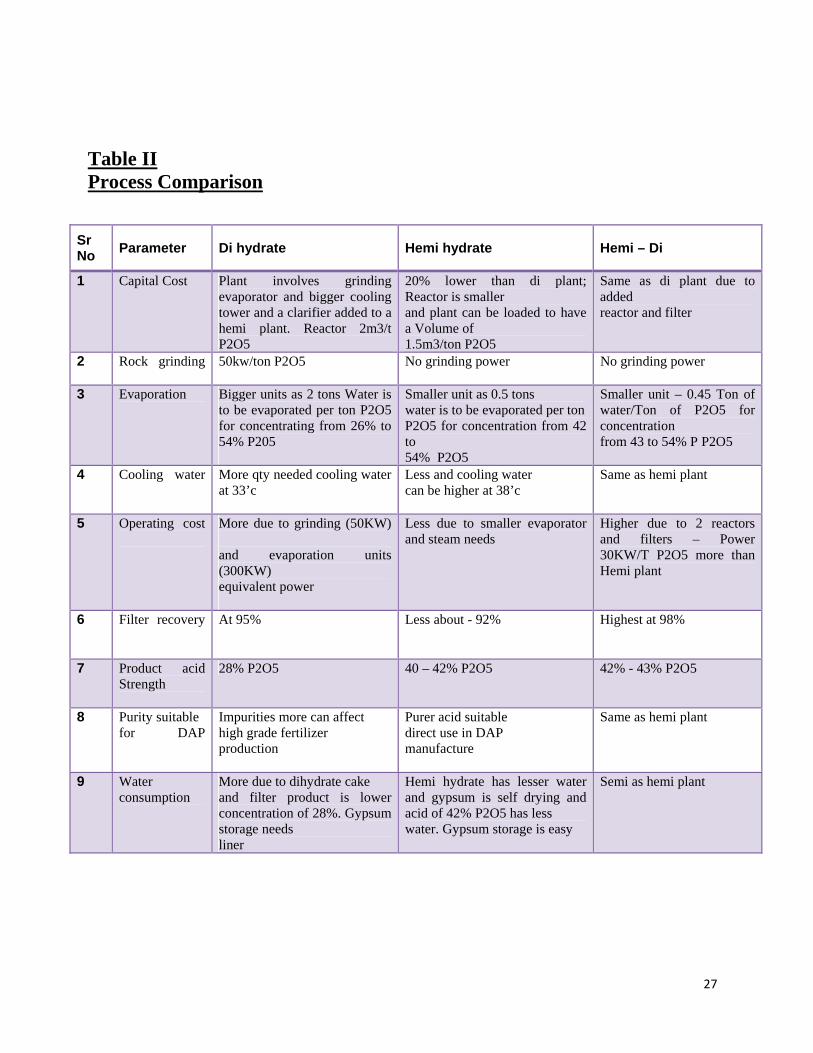
27
Table II Process Comparison
Sr No
Parameter Di hydrate Hemi hydrate Hemi – Di
1 Capital Cost Plant involves grinding evaporator and bigger cooling tower and a clarifier added to a hemi plant. Reactor 2m3/t P2O5
20% lower than di plant; Reactor is smaller and plant can be loaded to have a Volume of 1.5m3/ton P2O5
Same as di plant due to added reactor and filter
2 Rock grinding
50kw/ton P2O5 No grinding power No grinding power
3 Evaporation
Bigger units as 2 tons Water is to be evaporated per ton P2O5 for concentrating from 26% to 54% P205
Smaller unit as 0.5 tons water is to be evaporated per ton P2O5 for concentration from 42 to 54% P2O5
Smaller unit – 0.45 Ton of water/Ton of P2O5 for concentration from 43 to 54% P P2O5
4 Cooling water
More qty needed cooling water at 33’c
Less and cooling water can be higher at 38’c
Same as hemi plant
5 Operating cost
More due to grinding (50KW) and evaporation units (300KW) equivalent power
Less due to smaller evaporator and steam needs
Higher due to 2 reactors and filters – Power 30KW/T P2O5 more than Hemi plant
6 Filter recovery
At 95% Less about - 92% Highest at 98%
7 Product acid Strength
28% P2O5 40 – 42% P2O5 42% - 43% P2O5
8 Purity suitable for DAP
Impurities more can affect high grade fertilizer production
Purer acid suitable direct use in DAP manufacture
Same as hemi plant
9 Water consumption
More due to dihydrate cake and filter product is lower concentration of 28%. Gypsum storage needs liner
Hemi hydrate has lesser water and gypsum is self drying and acid of 42% P2O5 has less water. Gypsum storage is easy
Semi as hemi plant
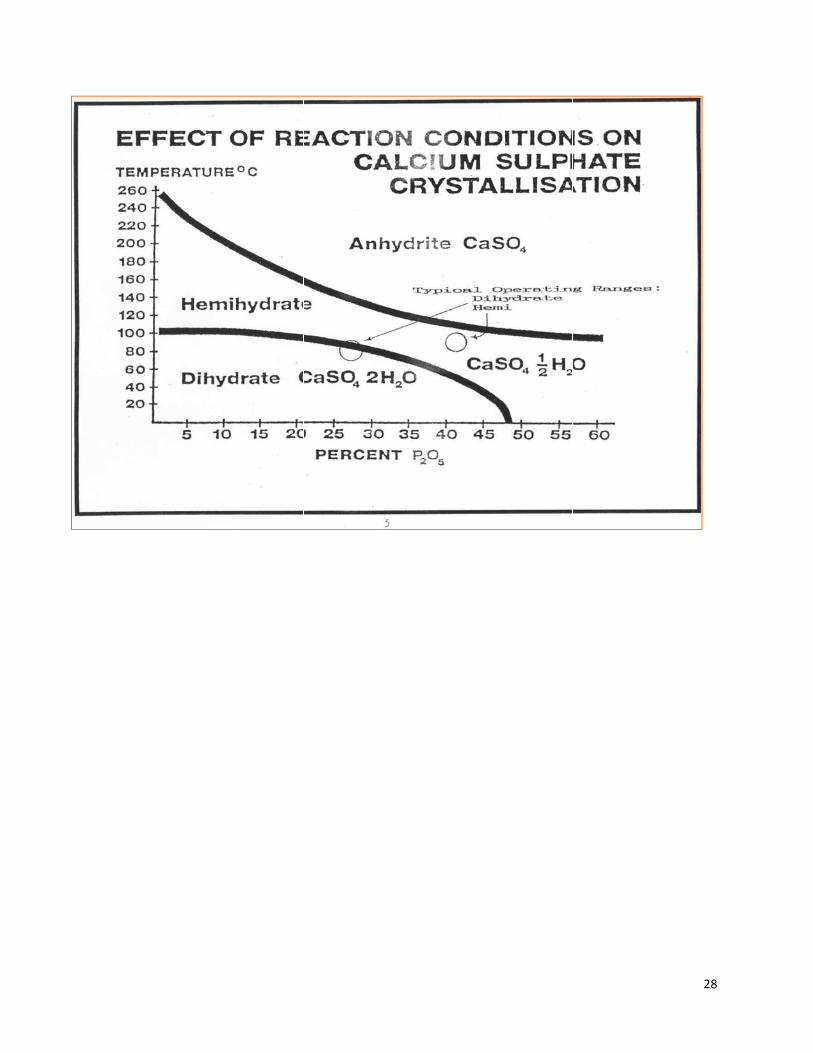
2
28
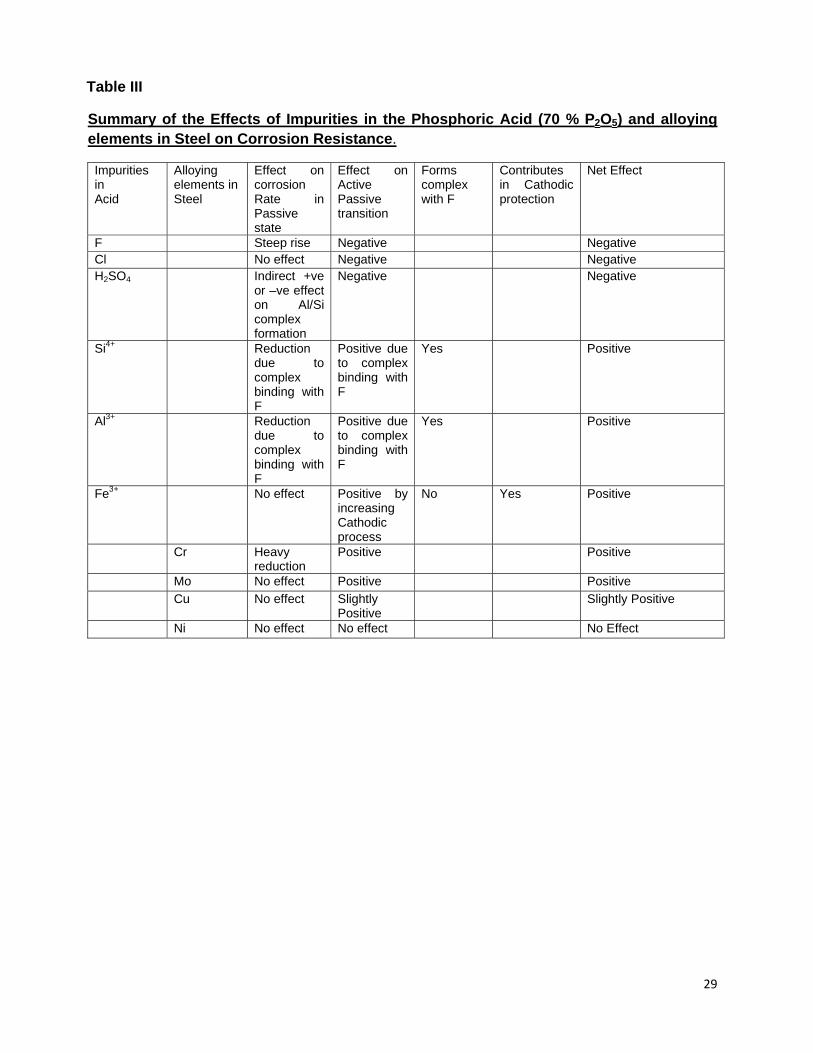
29
Table III
Summary of the Effects of Impurities in the Phosphoric Acid (70 % P2O5) and alloying elements in Steel on Corrosion Resistance.
Impurities in Acid
Alloying elements in Steel
Effect on corrosion Rate in Passive state
Effect on Active Passive transition
Forms complex with F
Contributes in Cathodic protection
Net Effect
F Steep rise Negative Negative Cl No effect Negative Negative H2SO4 Indirect +ve
or –ve effect on Al/Si complex formation
Negative Negative
Si4+ Reduction due to complex binding with F
Positive due to complex binding with F
Yes Positive
Al3+ Reduction due to complex binding with F
Positive due to complex binding with F
Yes Positive
Fe3+ No effect Positive by increasing Cathodic process
No Yes Positive
Cr Heavy reduction
Positive Positive
Mo No effect Positive Positive
Cu No effect Slightly Positive
Slightly Positive
Ni No effect No effect No Effect

Smart fertilizers for sustainable agriculture: The state of the art and the recent developments
Youssef ZEROUAL, Abdelaâli KOSSIR, Direction Recherche et Développement
Pôle Industriel, Groupe OCP Morocco
, Abstract:
Fertilizers are the vital input materials for the sustainable development of crop production.
They play an important role in food security. The main goal of applying fertilizers is to
provide nutrients, mainly P and N, to plants to increase and sustain optimal crop yield.
However, fertilizers, if misused, could be lost in the environment or become non available to
plants. To improve fertilizer nutrient use efficiency, new generation of fertilizers, so-called
smart fertilizers, has been developed and applied in the modern agricultural production
practice. Among this kind of fertilizers we meet low release/controlled release fertilizers,
nitrification and urease inhibitors stabilized fertilizers, water-soluble polymer coated
fertilizers and biosmart fertilizers. Recent developments on smart fertilizers and the role that
they could play in sustainable agriculture are reviewed in this paper.
Introduction:
Global agricultural production needs to grow accordingly to population growth. It needs to
face the great challenge of food supply with limited arable lands and with less resources. So,
ways must be found to grow crops more sustainably.
Fertilizers, whether from inorganic or organic sources, will be continuously used to
increase and sustain crop production. They play an important role in food security. However
fertilizers, if misused, could be lost in the environment or become non available to plants.
It is vital to further develop techniques that continue to increase crop yield, improve
fertilizer use efficiency and mitigate the pressure on environment to guarantee food supply,
and environment protection.
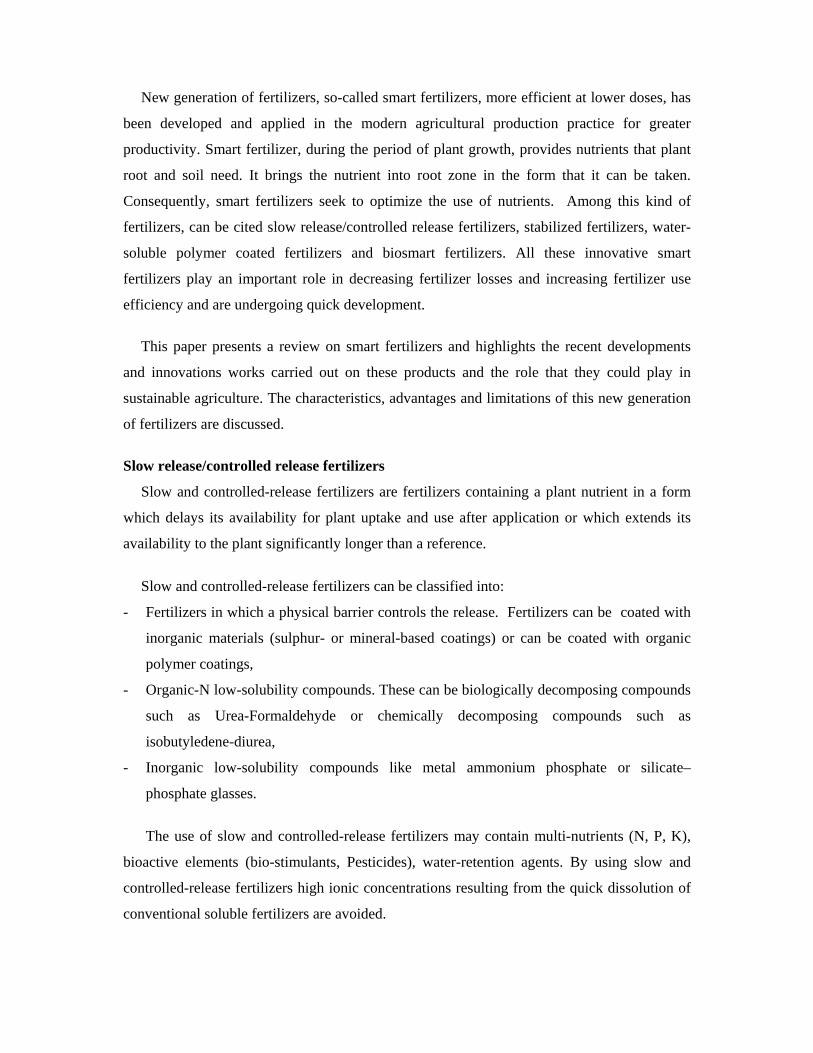
New generation of fertilizers, so-called smart fertilizers, more efficient at lower doses, has
been developed and applied in the modern agricultural production practice for greater
productivity. Smart fertilizer, during the period of plant growth, provides nutrients that plant
root and soil need. It brings the nutrient into root zone in the form that it can be taken.
Consequently, smart fertilizers seek to optimize the use of nutrients. Among this kind of
fertilizers, can be cited slow release/controlled release fertilizers, stabilized fertilizers, water-
soluble polymer coated fertilizers and biosmart fertilizers. All these innovative smart
fertilizers play an important role in decreasing fertilizer losses and increasing fertilizer use
efficiency and are undergoing quick development.
This paper presents a review on smart fertilizers and highlights the recent developments
and innovations works carried out on these products and the role that they could play in
sustainable agriculture. The characteristics, advantages and limitations of this new generation
of fertilizers are discussed.
Slow release/controlled release fertilizers
Slow and controlled-release fertilizers are fertilizers containing a plant nutrient in a form
which delays its availability for plant uptake and use after application or which extends its
availability to the plant significantly longer than a reference.
Slow and controlled-release fertilizers can be classified into:
- Fertilizers in which a physical barrier controls the release. Fertilizers can be coated with
inorganic materials (sulphur- or mineral-based coatings) or can be coated with organic
polymer coatings,
- Organic-N low-solubility compounds. These can be biologically decomposing compounds
such as Urea-Formaldehyde or chemically decomposing compounds such as
isobutyledene-diurea,
- Inorganic low-solubility compounds like metal ammonium phosphate or silicate–
phosphate glasses.
The use of slow and controlled-release fertilizers may contain multi-nutrients (N, P, K),
bioactive elements (bio-stimulants, Pesticides), water-retention agents. By using slow and
controlled-release fertilizers high ionic concentrations resulting from the quick dissolution of
conventional soluble fertilizers are avoided.
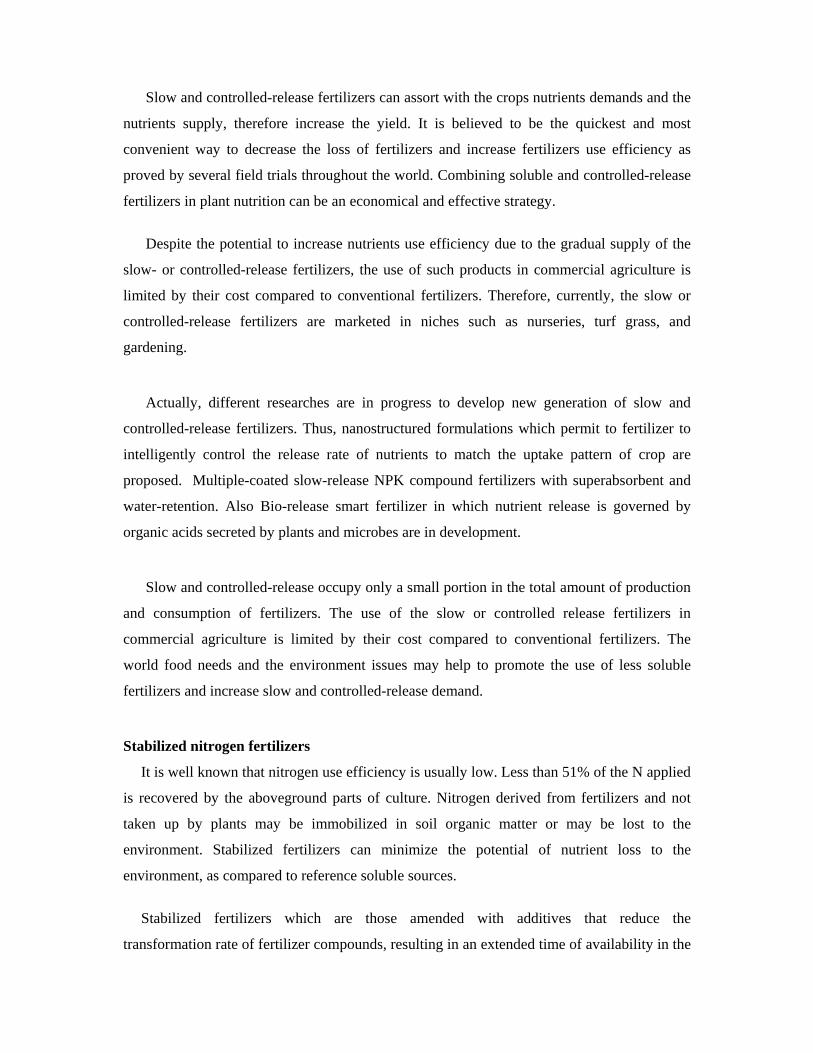
Slow and controlled-release fertilizers can assort with the crops nutrients demands and the
nutrients supply, therefore increase the yield. It is believed to be the quickest and most
convenient way to decrease the loss of fertilizers and increase fertilizers use efficiency as
proved by several field trials throughout the world. Combining soluble and controlled-release
fertilizers in plant nutrition can be an economical and effective strategy.
Despite the potential to increase nutrients use efficiency due to the gradual supply of the
slow- or controlled-release fertilizers, the use of such products in commercial agriculture is
limited by their cost compared to conventional fertilizers. Therefore, currently, the slow or
controlled-release fertilizers are marketed in niches such as nurseries, turf grass, and
gardening.
Actually, different researches are in progress to develop new generation of slow and
controlled-release fertilizers. Thus, nanostructured formulations which permit to fertilizer to
intelligently control the release rate of nutrients to match the uptake pattern of crop are
proposed. Multiple-coated slow-release NPK compound fertilizers with superabsorbent and
water-retention. Also Bio-release smart fertilizer in which nutrient release is governed by
organic acids secreted by plants and microbes are in development.
Slow and controlled-release occupy only a small portion in the total amount of production
and consumption of fertilizers. The use of the slow or controlled release fertilizers in
commercial agriculture is limited by their cost compared to conventional fertilizers. The
world food needs and the environment issues may help to promote the use of less soluble
fertilizers and increase slow and controlled-release demand.
Stabilized nitrogen fertilizers
It is well known that nitrogen use efficiency is usually low. Less than 51% of the N applied
is recovered by the aboveground parts of culture. Nitrogen derived from fertilizers and not
taken up by plants may be immobilized in soil organic matter or may be lost to the
environment. Stabilized fertilizers can minimize the potential of nutrient loss to the
environment, as compared to reference soluble sources.
Stabilized fertilizers which are those amended with additives that reduce the
transformation rate of fertilizer compounds, resulting in an extended time of availability in the
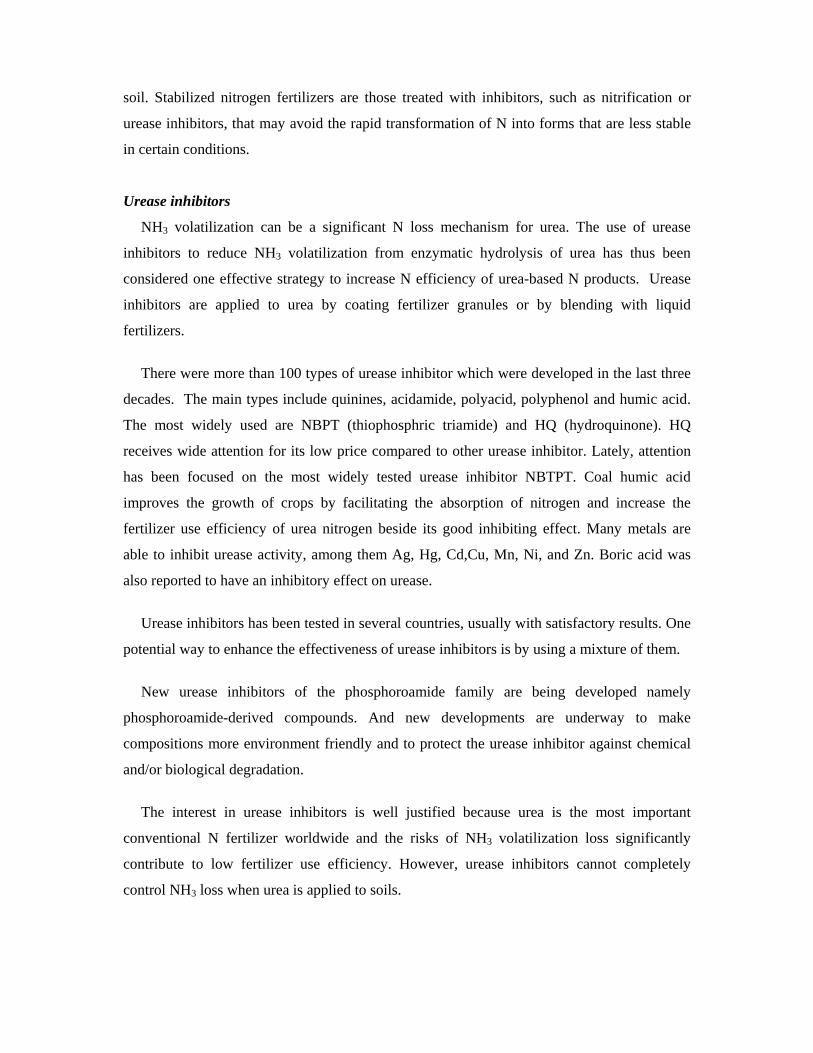
soil. Stabilized nitrogen fertilizers are those treated with inhibitors, such as nitrification or
urease inhibitors, that may avoid the rapid transformation of N into forms that are less stable
in certain conditions.
Urease inhibitors
NH3 volatilization can be a significant N loss mechanism for urea. The use of urease
inhibitors to reduce NH3 volatilization from enzymatic hydrolysis of urea has thus been
considered one effective strategy to increase N efficiency of urea-based N products. Urease
inhibitors are applied to urea by coating fertilizer granules or by blending with liquid
fertilizers.
There were more than 100 types of urease inhibitor which were developed in the last three
decades. The main types include quinines, acidamide, polyacid, polyphenol and humic acid.
The most widely used are NBPT (thiophosphric triamide) and HQ (hydroquinone). HQ
receives wide attention for its low price compared to other urease inhibitor. Lately, attention
has been focused on the most widely tested urease inhibitor NBTPT. Coal humic acid
improves the growth of crops by facilitating the absorption of nitrogen and increase the
fertilizer use efficiency of urea nitrogen beside its good inhibiting effect. Many metals are
able to inhibit urease activity, among them Ag, Hg, Cd,Cu, Mn, Ni, and Zn. Boric acid was
also reported to have an inhibitory effect on urease.
Urease inhibitors has been tested in several countries, usually with satisfactory results. One
potential way to enhance the effectiveness of urease inhibitors is by using a mixture of them.
New urease inhibitors of the phosphoroamide family are being developed namely
phosphoroamide-derived compounds. And new developments are underway to make
compositions more environment friendly and to protect the urease inhibitor against chemical
and/or biological degradation.
The interest in urease inhibitors is well justified because urea is the most important
conventional N fertilizer worldwide and the risks of NH3 volatilization loss significantly
contribute to low fertilizer use efficiency. However, urease inhibitors cannot completely
control NH3 loss when urea is applied to soils.
Nitrification inhibitors (NI)
Nitrification inhibitors are chemicals that reduce the rate at which ammonium is converted
to nitrate by interfering with the metabolism of Nitrosomonas bacteria, slowing the
nitrification process. This leaves more N in ammoniacal form, thus reducing the chance of
leaching.
Several products were developed and used as NI. The main types include DCD
(dicyandiamide) and nitrapyrin (2-chlorine-6-(trichloromethyl)-pyridine).
Nitrification inhibitors have been tested in several countries, with satisfactory results. The
use of such products enhances quality and yield of cultures. New nitrification inhibitors
highly effective, cheap and innocuous nitrification inhibitors are being developed.
Researchers are conducted to develop compositions more environment friendly and to protect
the nitrification inhibitors against chemical and/or biological degradation.
A joint application of urease and nitrification inhibitors can control the overall process so
as to decrease the loss of NH3 by volatilization and the loss of NO3 by leaching. However, the
combined use of NI, UI is, in practice, not economical.
Despite that they have taken some effect in agricultural production, inhibitors have not
been widely applied throughout the world. Inhibitors are still under testing and research and
most of them are expensive, have some toxic effects on crops, and can cause an
environmental pollution. So more researches are needed to develop highly effective, safe,
cheap, and innocuous urease/nitrification inhibitors.
Water-soluble polymers for coating P fertilizers
It is known that water-soluble P can be converted to water insoluble P after reaction with
soil minerals, which can result in a decrease of P availability. Coating fertilizer with some
water-soluble polymers which have a high surface charge density can inhibit P precipitation
by acting as a platform for sequestration of P-fixing cations, such as Ca and Mg in high pH
soils and Fe and Al in low pH soils. Some studies showed that fertilizers coated with these
polymers performed significantly better than uncoated fertilizers.
The polymer can be used as a coating on granular phosphates or blended into fluid P
fertilizers. The use of this technology seems to present several advantages such as to improve
phosphate efficiency and crop maturity, to reduce some cations toxicity and to enhance
agronomic yield and quality. However, there is little information on the soil chemistry of
these polymers-coated P fertilizers published in the peer-reviewed scientific journals and
questions remain unanswered regarding the mechanisms of reducing P fixation by the
polymer as reported by Chien et al. (Chien et al. 2009).
Smart biofertilizers
Smart biofertilizers are fertilizers (liquid or solid) composed by an organic and /or mineral
fraction enriched by some bioproducts that can stimulate and activate plant growth or
inoculated by micro-organisms (bacteria fungi and algae) that are considered as beneficial for
agriculture and used as biofertilizers.
The use of this kind of products allows enhancing agricultural yields by improving mass
balances of organic and mineral fertilization. Organic fraction contributes to improve soil
texture, pH, and other physical properties of soil. Microbial action may be multiple and
involve a number of mechanisms including diazotrophy, antagonism, production of growth
factors, dissolution of certain organic and inorganic compounds in order to make them more
available to the plant.
Indeed, certain soil microorganisms have inherent capacity to dissolve part of the fixed
phosphorus in soil and make it available to the crop by secreting certain organic acids. With
the increase in available P2O5 level, overall plant growth can be increased. Some of them also
exhibit anti-fungal activities and thereby fungal diseases may be controlled indirectly.
Inoculation of phosphate solubilizing microorganisms can increase crop yield by 5-10 % .
Other microorganisms manage to fix atmospheric nitrogen in the soil and root nodules of
legume crops and make it available to the plant. Certain growth promoting substances
released by these cultures are useful for increasing the seed germination, plant growth and
ultimately the yield.
Mycorrhizae, that are obligate symbiots but not host-specific, form an extension of the
effective root area of the plant, which increases the absorption and translocation of immobile
nutrients. Several elements (e.g., P, S, Zn, Cu, Ca, N, K, Sr, and Cl) can be taken up by
mycorrhizal hyphae and transported to the root. The potential for increasing plant growth and
yield by inoculation depends on the selection of the correct fungal isolate for the crop host,
inoculum type (e.g., spores, infected root pieces) and formulation.
However many challenges remain to be overcome for the application of smart
biofertilizers. Among them are:
- the selection of appropriate strains considering host plant specificity, colonization
efficiency, adaptation to climatic and edaphic conditions.
- the determination of optimal concentration of inoculants.
- the scale up and production of the organism under commercial fermentation (maintaining
quality, stability, efficacy).
- the development of better formulations to ensure survival and activity in the field and
compatibility with chemical and biological treatment.
Conclusion:
Fertilizers will be continuously used to increase and sustain crop production. However, the
potential losses of fertilizers in the environment due to inappropriate application should be
addressed.
It is vital to develop techniques that continue to increase crop yield, improve fertilizer
efficiency use and mitigate the pressure on environment to guarantee the food supply, and
environment protection. The agronomic performances of smart fertilizers have been proved,
and they can be used to achieve this goal which aims to sustain crop production and to
minimize nutrient losses and environmental impacts.
Research and development shall be performed to improve the efficiency of these non
conventional fertilizers and to insure new alternative innovative technology in terms of
fertilizer production and use.
References:
Bashan Y., 1998 , Inoculants of plant growth-promoting bacteria for use in agriculture.
Biotechnol. Adv. 16: 729-770.
Chien S. H., Prochnow L. I.,and Cantarella H. (2009) Recent developments of Fertilizer
production and use to improve nutrient efficiency and minimize environmental impacts.
Advances in Agronomy. 8: 267-322.
Gaur, A.C. 1990. Phosphorus solubilising microorganisms as biofertilisers. New Delhi,
Omega Scientific Publ.
Gérard Catroux, Alain Hartmann and Cécile Revellin (2001) Trends in rhizobial inoculant
production and use. 230: 21-30.
Gioacchini, P., Marzadori, A. C., Antisari, L. V., and Gessa, C. (2002). Influence of urease
and nitrification inhibitors on N losses from soils fertilized with urea. Biol. Fertil. Soils 36:
129-135.
Gordon, B., and Tindall, T. (2006). Fluid P performance improved with polymers. Fluid J.
14 : 12-13.
Ruairidh J.H. S., Gutjahr C., Paszkowski U. (2008) Cereal mycorrhiza: an ancient symbiosis
in modern agriculture Trends in plant science.13: 93–97.
Shaviv, A. 2000. Advances in controlled release of fertilizers. Advances in Agronomy. 71:1-
49.
Shoji S., Delgado J., Mosier A., and Miura Y. (2001). Use of controlled release fertilizers and
nitrification inhibitors to increase nitrogen use efficiency and to conserve air and water
quality. Commun. Soil Sci. Plant Anal. 32, 1051–1070.
Trenkel, M. E. (1997). Controlled-Release and Stabilized Fertilizers in Agriculture.
International Fertilizer Industry Association (IFA), Paris, France.

Trenkel, M. E. (2010). Slow and controlled release and stabilized Fertilizers: An option for
enhancing nutrient use efficiency in agriculture.’’ International Fertilizer Industry
Association (IFA), Paris, France.
Yan Xiang, JIN Ji-yun, HE Ping and Liang Ming-Zao (2008) Recent advances on the
technologies to increase fertilizer use efficiency. Agricultural Sciences in China 7: 469-
479.
26-06-12 1
Enhancement of Hot leach plant Operational Sustainability
SUBMITTED BY
Eng. Ala’a Omari Senior Process Engineer/ Technical Department
The Arab Potash Company
SUBMITTED TO
The Arab Fertilizer Association
SESSION
'Current developments and driving issues in Sustainability in fertilizer industry'.
26-06-12 2
Paper Content
Introduction 3 About APC 3 Potash Production Process 4 Methodology 6 Falling Film Heat Exchanger 6 HLP Screening Revamp Project 11
26-06-12 3
Introduction About APC The idea of the Potash project was based on the Potash Plant located on the north-western shores of the Dead Sea during the British Mandate. The old plant was destroyed but the idea remained alive and a Pan Arab company was formed in 1956 to implement a project for the production of Potash using the minerals of the Dead Sea. The site is located 110 kilometers south of Amman and 200 kilometers north of Aqaba. The site is a Solar Evaporation Pond System of an area of 150 square kilometers and processing plants for the ore. The investment in the original project, including substantial infrastructure was nearly 480 Million USD. Financing was obtained through loans from international finance institutions and aid agencies as well as Arab development funds. The project began in 1976 with tests and experiments to determine the parameters of various technologies and ideas in a very hostile environment. Construction began in 1979 and was completed in 1982. At the end of construction, about (117) kilometers of seepage proof dykes were built (other dykes built later on). These were more than 8 meters wide at the top and were an engineering challenge to be built on top of a non- stable sea bed. The excavation carried out during the construction period was of a colossal magnitude, 16 million cubic meters of earth material was displaced. Potash production began in 1983 and has since progressed with various schemes aimed at optimizing and expanding this production. The initial plant was built to a capacity of 1.2 million tones of product. This was expanded in the late eighties to handle 1.4 million tones and key modifications were undertaken with the Solar System to enhance the production of the ore accordingly. A second plant based on different technology and of a capacity of 0.4 million tones was built in 1994 and this brought the total production capacity to 1.8 million tones. Then another cold crystallization plant of 0.45 million tones was built in 2010 and this brought the total production capacity to 2.45 million tones. Further expansion is currently under evaluation to bring the total potash capacity to 3.2 MMTP. The capital of the Arab Potash Company is 83.318 million Jordanian Dinars. It has a concession from the Jordanian Government to exploit, manufacture, and market the mineral resources of the Dead Sea, until 2058. The Arab Potash Company employs over 2000 personnel and has offices in Amman, Safi and Aqaba. It owns extensive housing and recreational facilities near its plants, and in addition, it provides the surrounding region with assistance in social, medical, economic and vocational development.
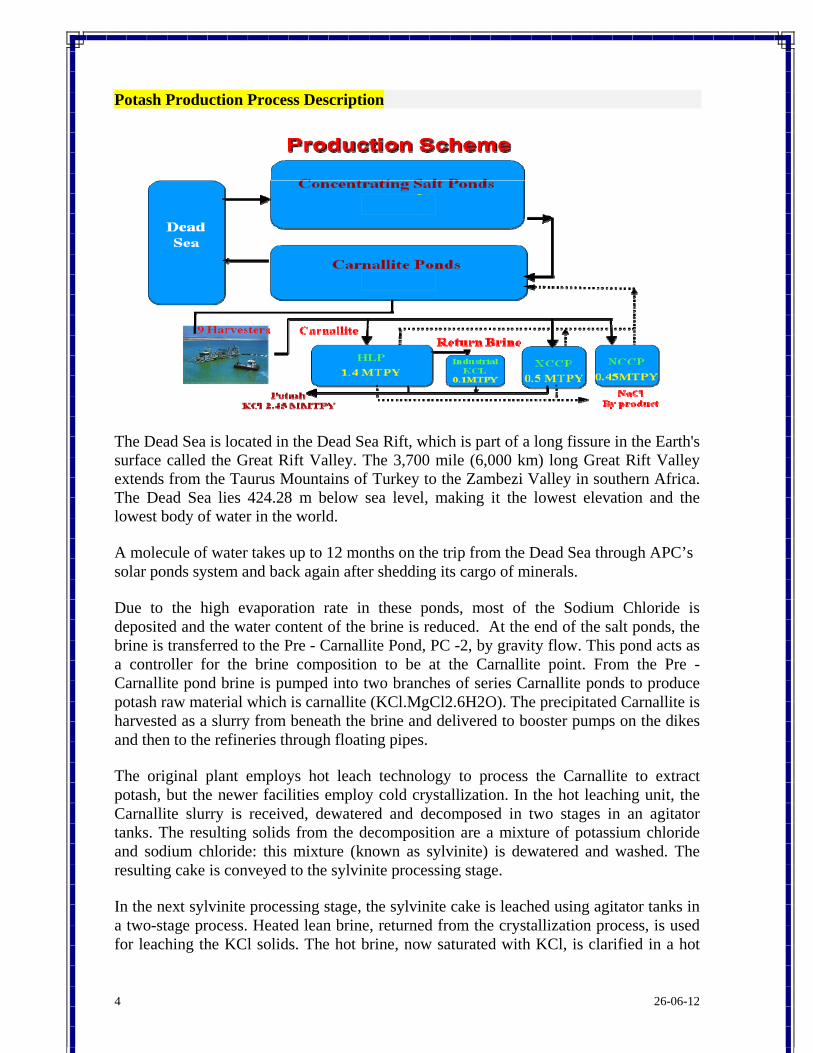
26-06-12 4
Potash Production Process Description
The Dead Sea is located in the Dead Sea Rift, which is part of a long fissure in the Earth's surface called the Great Rift Valley. The 3,700 mile (6,000 km) long Great Rift Valley extends from the Taurus Mountains of Turkey to the Zambezi Valley in southern Africa. The Dead Sea lies 424.28 m below sea level, making it the lowest elevation and the lowest body of water in the world.
A molecule of water takes up to 12 months on the trip from the Dead Sea through APC’s solar ponds system and back again after shedding its cargo of minerals.
Due to the high evaporation rate in these ponds, most of the Sodium Chloride is deposited and the water content of the brine is reduced. At the end of the salt ponds, the brine is transferred to the Pre - Carnallite Pond, PC -2, by gravity flow. This pond acts as a controller for the brine composition to be at the Carnallite point. From the Pre - Carnallite pond brine is pumped into two branches of series Carnallite ponds to produce potash raw material which is carnallite (KCl.MgCl2.6H2O). The precipitated Carnallite is harvested as a slurry from beneath the brine and delivered to booster pumps on the dikes and then to the refineries through floating pipes.
The original plant employs hot leach technology to process the Carnallite to extract potash, but the newer facilities employ cold crystallization. In the hot leaching unit, the Carnallite slurry is received, dewatered and decomposed in two stages in an agitator tanks. The resulting solids from the decomposition are a mixture of potassium chloride and sodium chloride: this mixture (known as sylvinite) is dewatered and washed. The resulting cake is conveyed to the sylvinite processing stage.
In the next sylvinite processing stage, the sylvinite cake is leached using agitator tanks in a two-stage process. Heated lean brine, returned from the crystallization process, is used for leaching the KCl solids. The hot brine, now saturated with KCl, is clarified in a hot
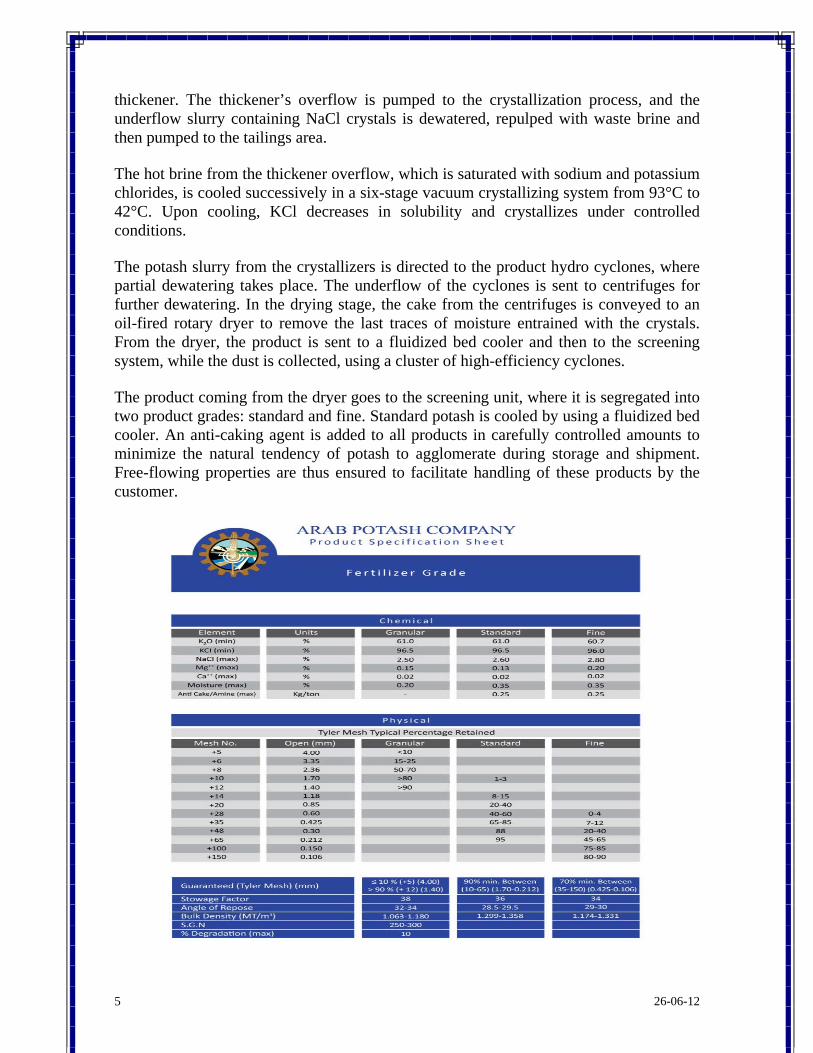
26-06-12 5
thickener. The thickener’s overflow is pumped to the crystallization process, and the underflow slurry containing NaCl crystals is dewatered, repulped with waste brine and then pumped to the tailings area.
The hot brine from the thickener overflow, which is saturated with sodium and potassium chlorides, is cooled successively in a six-stage vacuum crystallizing system from 93°C to 42°C. Upon cooling, KCl decreases in solubility and crystallizes under controlled conditions.
The potash slurry from the crystallizers is directed to the product hydro cyclones, where partial dewatering takes place. The underflow of the cyclones is sent to centrifuges for further dewatering. In the drying stage, the cake from the centrifuges is conveyed to an oil-fired rotary dryer to remove the last traces of moisture entrained with the crystals. From the dryer, the product is sent to a fluidized bed cooler and then to the screening system, while the dust is collected, using a cluster of high-efficiency cyclones.
The product coming from the dryer goes to the screening unit, where it is segregated into two product grades: standard and fine. Standard potash is cooled by using a fluidized bed cooler. An anti-caking agent is added to all products in carefully controlled amounts to minimize the natural tendency of potash to agglomerate during storage and shipment. Free-flowing properties are thus ensured to facilitate handling of these products by the customer.
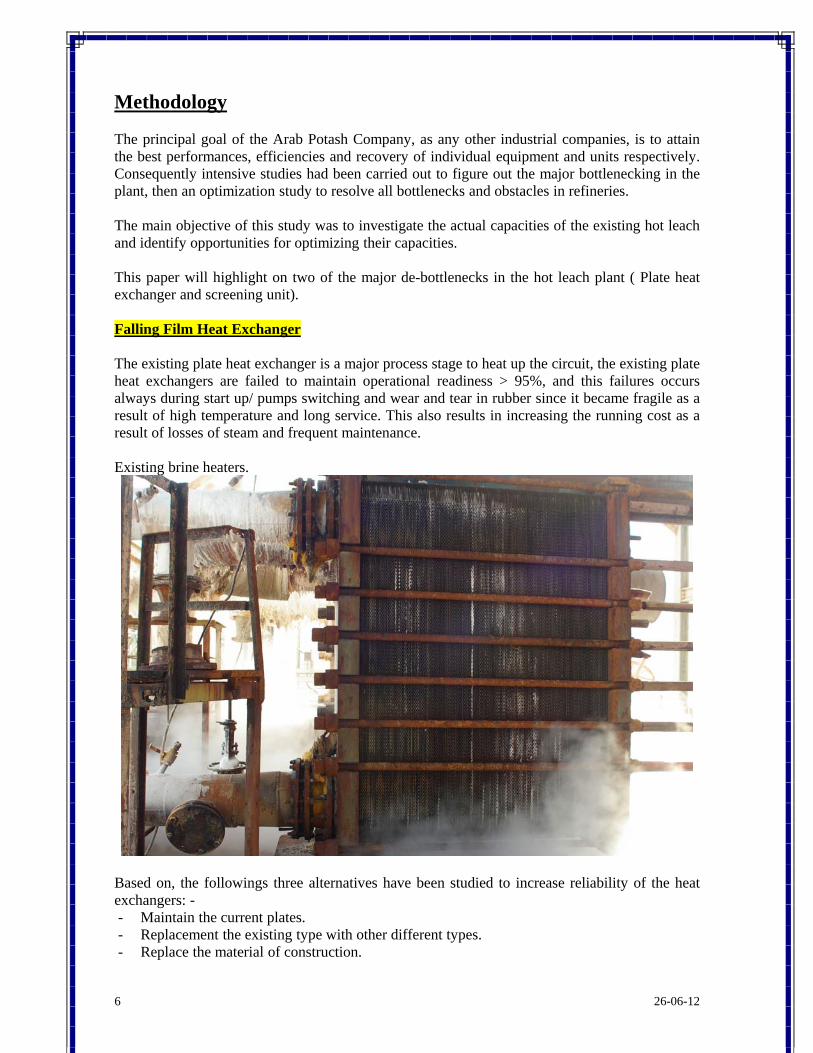
26-06-12 6
Methodology The principal goal of the Arab Potash Company, as any other industrial companies, is to attain the best performances, efficiencies and recovery of individual equipment and units respectively. Consequently intensive studies had been carried out to figure out the major bottlenecking in the plant, then an optimization study to resolve all bottlenecks and obstacles in refineries. The main objective of this study was to investigate the actual capacities of the existing hot leach and identify opportunities for optimizing their capacities. This paper will highlight on two of the major de-bottlenecks in the hot leach plant ( Plate heat exchanger and screening unit). Falling Film Heat Exchanger The existing plate heat exchanger is a major process stage to heat up the circuit, the existing plate heat exchangers are failed to maintain operational readiness > 95%, and this failures occurs always during start up/ pumps switching and wear and tear in rubber since it became fragile as a result of high temperature and long service. This also results in increasing the running cost as a result of losses of steam and frequent maintenance. Existing brine heaters.
Based on, the followings three alternatives have been studied to increase reliability of the heat exchangers: - - Maintain the current plates. - Replacement the existing type with other different types. - Replace the material of construction.
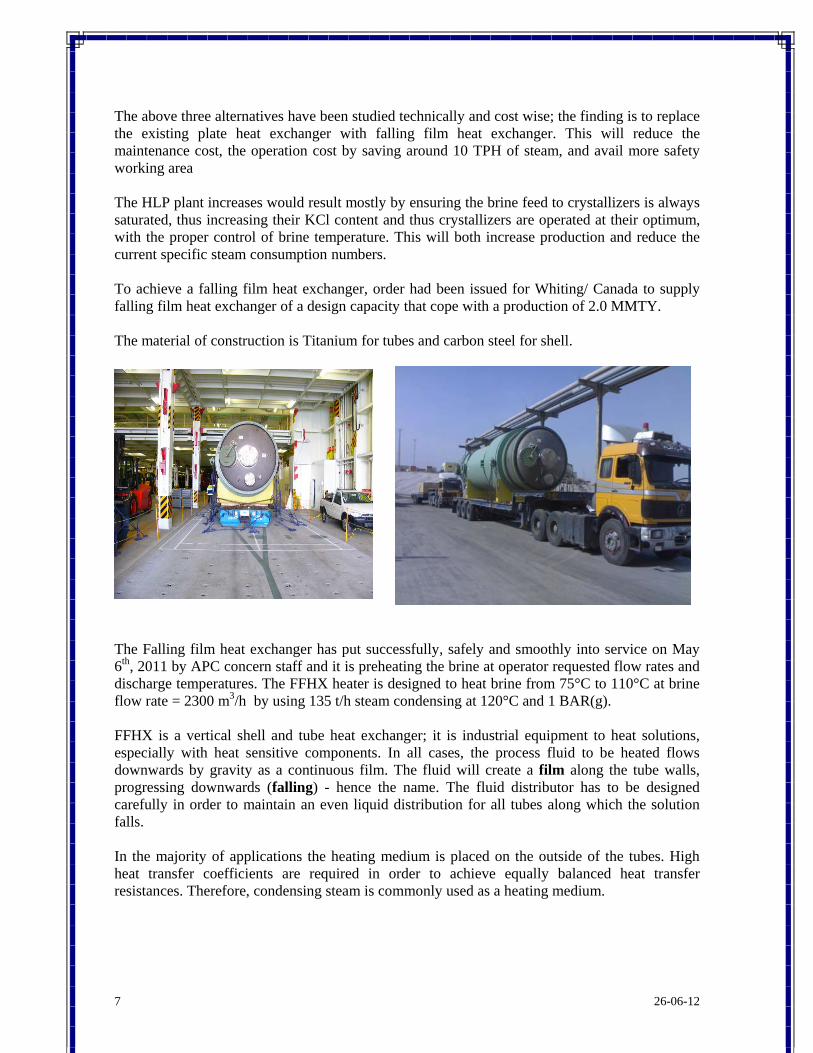
26-06-12 7
The above three alternatives have been studied technically and cost wise; the finding is to replace the existing plate heat exchanger with falling film heat exchanger. This will reduce the maintenance cost, the operation cost by saving around 10 TPH of steam, and avail more safety working area The HLP plant increases would result mostly by ensuring the brine feed to crystallizers is always saturated, thus increasing their KCl content and thus crystallizers are operated at their optimum, with the proper control of brine temperature. This will both increase production and reduce the current specific steam consumption numbers. To achieve a falling film heat exchanger, order had been issued for Whiting/ Canada to supply falling film heat exchanger of a design capacity that cope with a production of 2.0 MMTY. The material of construction is Titanium for tubes and carbon steel for shell.
The Falling film heat exchanger has put successfully, safely and smoothly into service on May 6th, 2011 by APC concern staff and it is preheating the brine at operator requested flow rates and discharge temperatures. The FFHX heater is designed to heat brine from 75°C to 110°C at brine flow rate = 2300 m3/h by using 135 t/h steam condensing at 120°C and 1 BAR(g). FFHX is a vertical shell and tube heat exchanger; it is industrial equipment to heat solutions, especially with heat sensitive components. In all cases, the process fluid to be heated flows downwards by gravity as a continuous film. The fluid will create a film along the tube walls, progressing downwards (falling) - hence the name. The fluid distributor has to be designed carefully in order to maintain an even liquid distribution for all tubes along which the solution falls. In the majority of applications the heating medium is placed on the outside of the tubes. High heat transfer coefficients are required in order to achieve equally balanced heat transfer resistances. Therefore, condensing steam is commonly used as a heating medium.
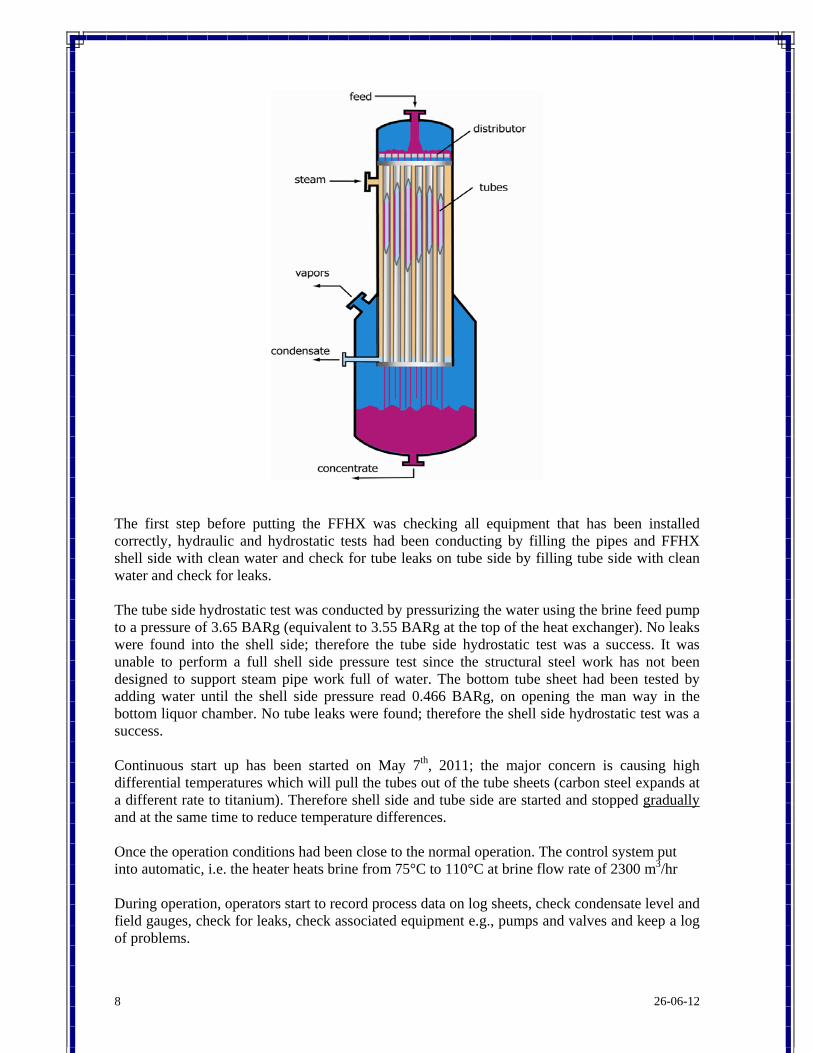
26-06-12 8
The first step before putting the FFHX was checking all equipment that has been installed correctly, hydraulic and hydrostatic tests had been conducting by filling the pipes and FFHX shell side with clean water and check for tube leaks on tube side by filling tube side with clean water and check for leaks. The tube side hydrostatic test was conducted by pressurizing the water using the brine feed pump to a pressure of 3.65 BARg (equivalent to 3.55 BARg at the top of the heat exchanger). No leaks were found into the shell side; therefore the tube side hydrostatic test was a success. It was unable to perform a full shell side pressure test since the structural steel work has not been designed to support steam pipe work full of water. The bottom tube sheet had been tested by adding water until the shell side pressure read 0.466 BARg, on opening the man way in the bottom liquor chamber. No tube leaks were found; therefore the shell side hydrostatic test was a success. Continuous start up has been started on May 7th, 2011; the major concern is causing high differential temperatures which will pull the tubes out of the tube sheets (carbon steel expands at a different rate to titanium). Therefore shell side and tube side are started and stopped gradually and at the same time to reduce temperature differences. Once the operation conditions had been close to the normal operation. The control system put into automatic, i.e. the heater heats brine from 75°C to 110°C at brine flow rate of 2300 m3/hr During operation, operators start to record process data on log sheets, check condensate level and field gauges, check for leaks, check associated equipment e.g., pumps and valves and keep a log of problems.
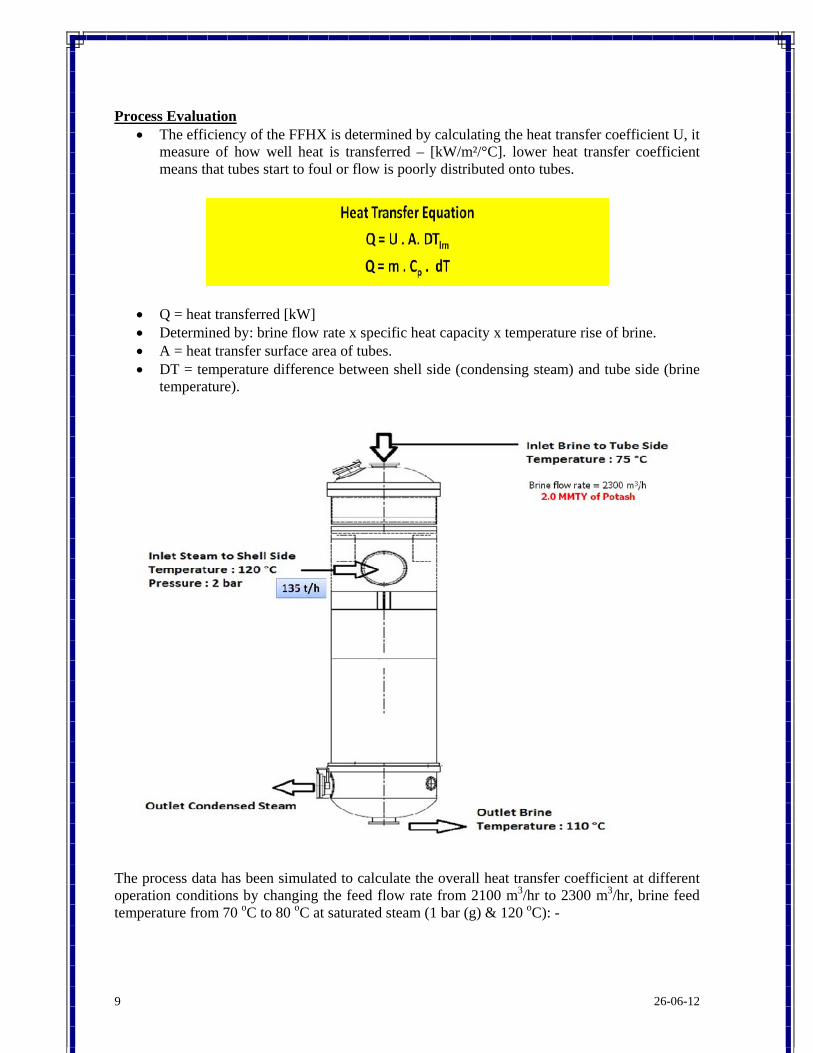
26-06-12 9
Process Evaluation
The efficiency of the FFHX is determined by calculating the heat transfer coefficient U, it measure of how well heat is transferred – [kW/m²/°C]. lower heat transfer coefficient means that tubes start to foul or flow is poorly distributed onto tubes.
Q = heat transferred [kW] Determined by: brine flow rate x specific heat capacity x temperature rise of brine. A = heat transfer surface area of tubes. DT = temperature difference between shell side (condensing steam) and tube side (brine
temperature).
The process data has been simulated to calculate the overall heat transfer coefficient at different operation conditions by changing the feed flow rate from 2100 m3/hr to 2300 m3/hr, brine feed temperature from 70 oC to 80 oC at saturated steam (1 bar (g) & 120 oC): -
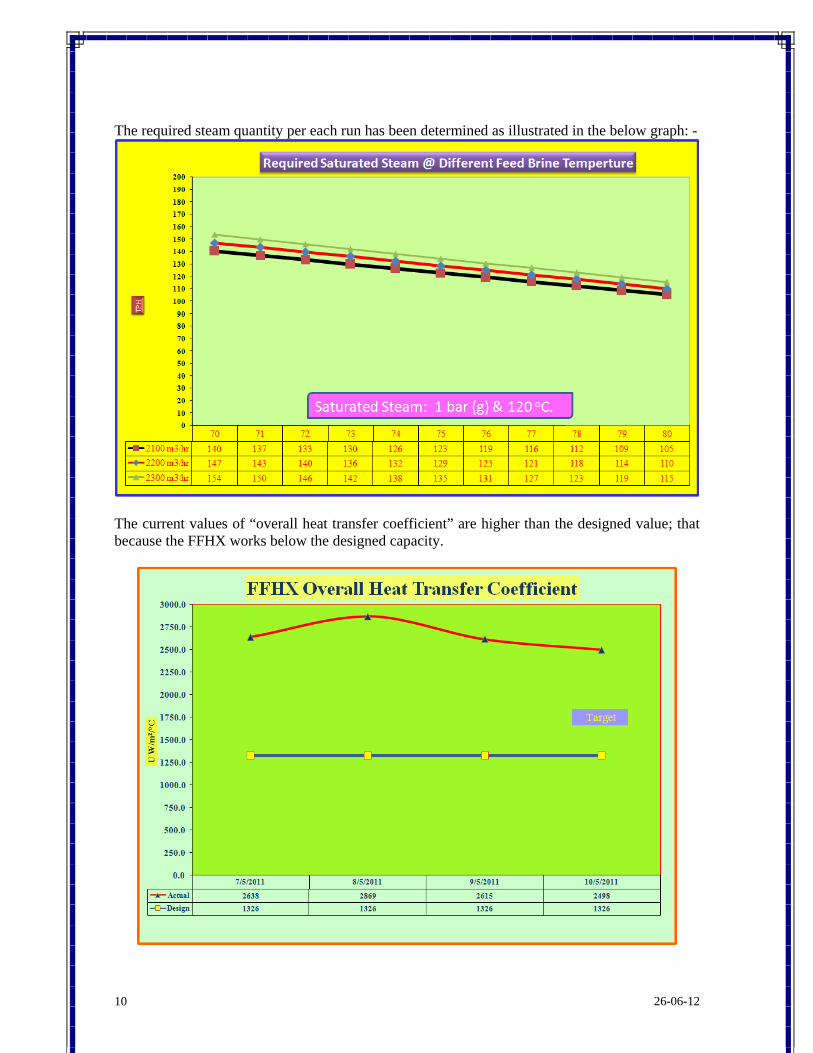
26-06-12 10
The required steam quantity per each run has been determined as illustrated in the below graph: -
The current values of “overall heat transfer coefficient” are higher than the designed value; that because the FFHX works below the designed capacity.
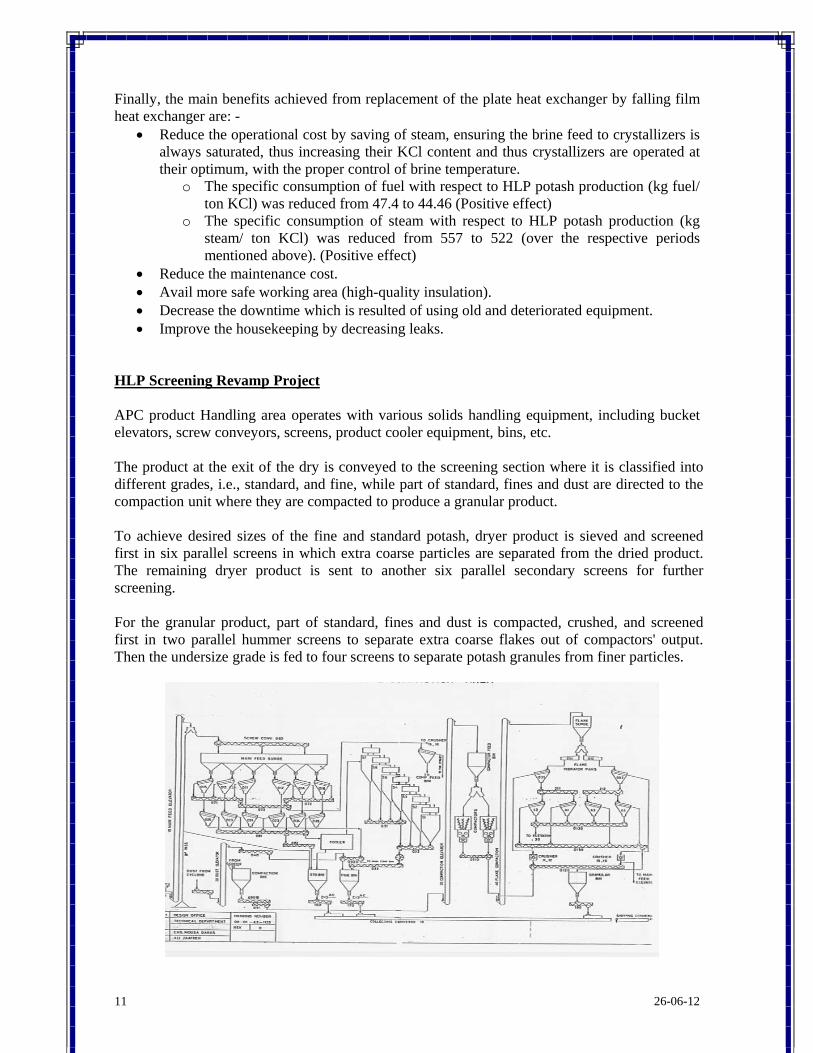
26-06-12 11
Finally, the main benefits achieved from replacement of the plate heat exchanger by falling film heat exchanger are: -
Reduce the operational cost by saving of steam, ensuring the brine feed to crystallizers is always saturated, thus increasing their KCl content and thus crystallizers are operated at their optimum, with the proper control of brine temperature.
o The specific consumption of fuel with respect to HLP potash production (kg fuel/ ton KCl) was reduced from 47.4 to 44.46 (Positive effect)
o The specific consumption of steam with respect to HLP potash production (kg steam/ ton KCl) was reduced from 557 to 522 (over the respective periods mentioned above). (Positive effect)
Reduce the maintenance cost. Avail more safe working area (high-quality insulation). Decrease the downtime which is resulted of using old and deteriorated equipment. Improve the housekeeping by decreasing leaks.
HLP Screening Revamp Project APC product Handling area operates with various solids handling equipment, including bucket elevators, screw conveyors, screens, product cooler equipment, bins, etc. The product at the exit of the dry is conveyed to the screening section where it is classified into different grades, i.e., standard, and fine, while part of standard, fines and dust are directed to the compaction unit where they are compacted to produce a granular product. To achieve desired sizes of the fine and standard potash, dryer product is sieved and screened first in six parallel screens in which extra coarse particles are separated from the dried product. The remaining dryer product is sent to another six parallel secondary screens for further screening. For the granular product, part of standard, fines and dust is compacted, crushed, and screened first in two parallel hummer screens to separate extra coarse flakes out of compactors' output. Then the undersize grade is fed to four screens to separate potash granules from finer particles.
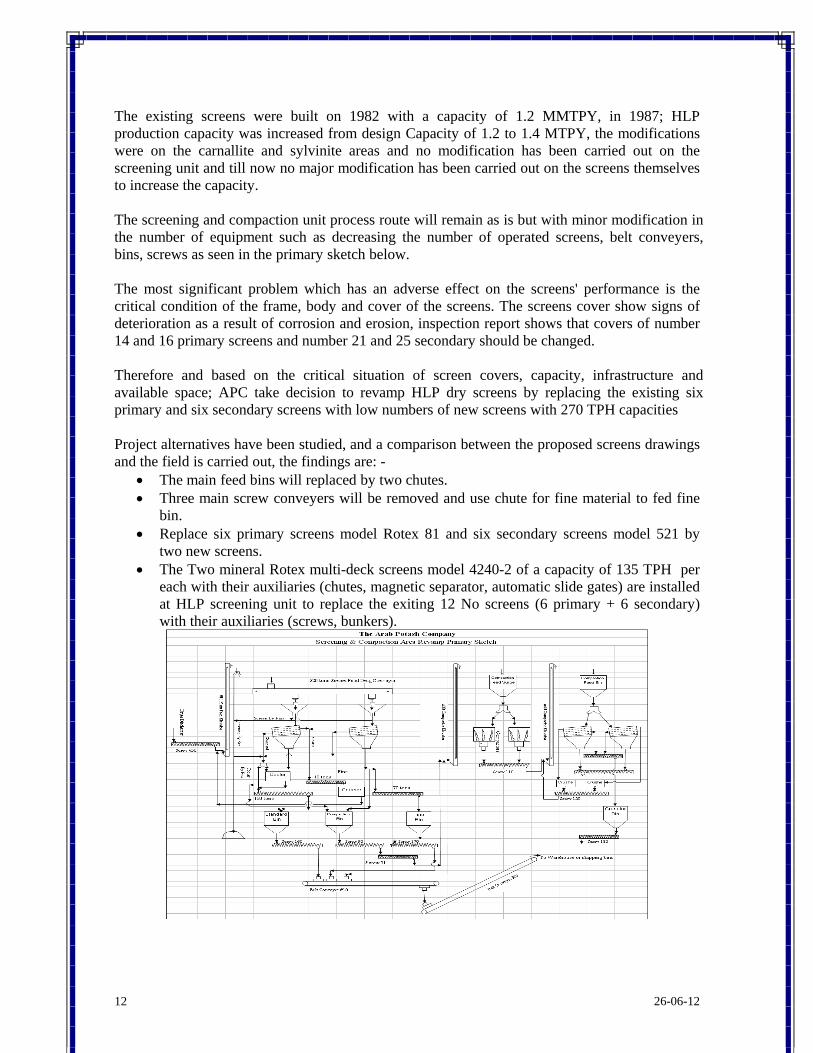
26-06-12 12
The existing screens were built on 1982 with a capacity of 1.2 MMTPY, in 1987; HLP production capacity was increased from design Capacity of 1.2 to 1.4 MTPY, the modifications were on the carnallite and sylvinite areas and no modification has been carried out on the screening unit and till now no major modification has been carried out on the screens themselves to increase the capacity. The screening and compaction unit process route will remain as is but with minor modification in the number of equipment such as decreasing the number of operated screens, belt conveyers, bins, screws as seen in the primary sketch below. The most significant problem which has an adverse effect on the screens' performance is the critical condition of the frame, body and cover of the screens. The screens cover show signs of deterioration as a result of corrosion and erosion, inspection report shows that covers of number 14 and 16 primary screens and number 21 and 25 secondary should be changed. Therefore and based on the critical situation of screen covers, capacity, infrastructure and available space; APC take decision to revamp HLP dry screens by replacing the existing six primary and six secondary screens with low numbers of new screens with 270 TPH capacities Project alternatives have been studied, and a comparison between the proposed screens drawings and the field is carried out, the findings are: -
The main feed bins will replaced by two chutes. Three main screw conveyers will be removed and use chute for fine material to fed fine
bin. Replace six primary screens model Rotex 81 and six secondary screens model 521 by
two new screens. The Two mineral Rotex multi-deck screens model 4240-2 of a capacity of 135 TPH per
each with their auxiliaries (chutes, magnetic separator, automatic slide gates) are installed at HLP screening unit to replace the exiting 12 No screens (6 primary + 6 secondary) with their auxiliaries (screws, bunkers).
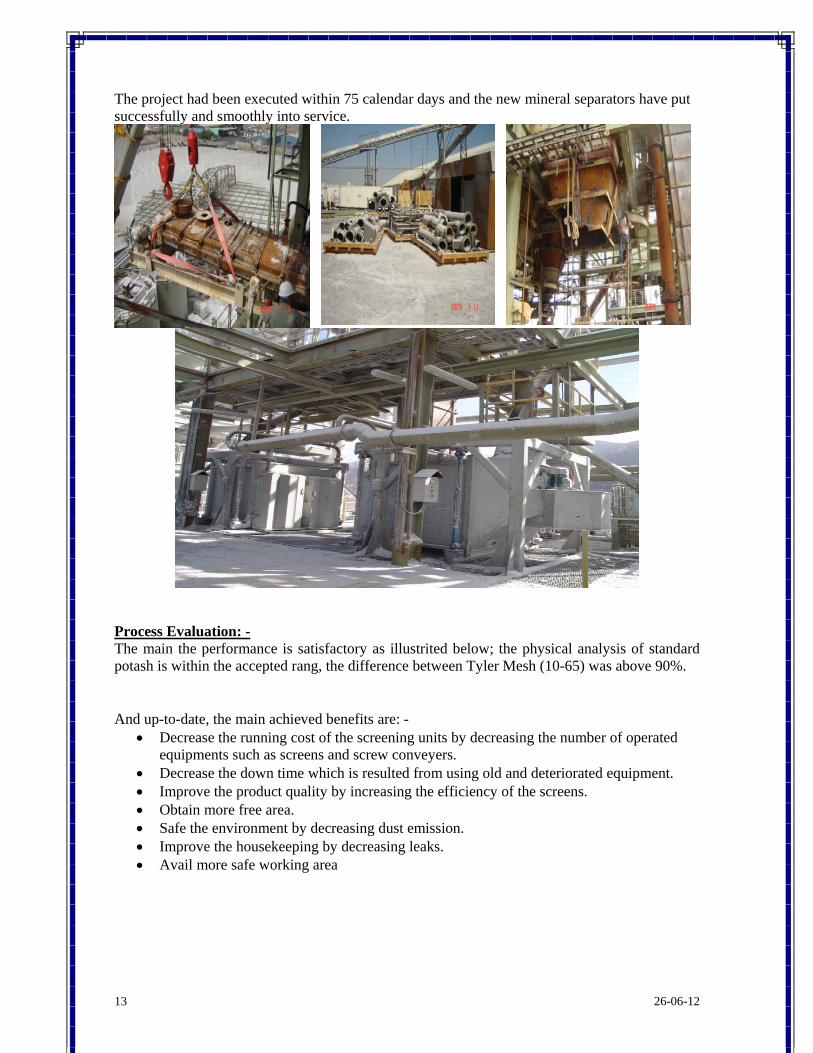
26-06-12 13
The project had been executed within 75 calendar days and the new mineral separators have put successfully and smoothly into service.
Process Evaluation: - The main the performance is satisfactory as illustrited below; the physical analysis of standard potash is within the accepted rang, the difference between Tyler Mesh (10-65) was above 90%. And up-to-date, the main achieved benefits are: -
Decrease the running cost of the screening units by decreasing the number of operated equipments such as screens and screw conveyers.
Decrease the down time which is resulted from using old and deteriorated equipment. Improve the product quality by increasing the efficiency of the screens. Obtain more free area. Safe the environment by decreasing dust emission. Improve the housekeeping by decreasing leaks. Avail more safe working area

1. KBR PURIFIERTM Technology and Project Execution Options for Ammonia Plants
Avinash Malhotra ‐ Director, Technology Fertilizers & Synthesis Gas, KBR, USA
2. Application of ALSTOM´s Chilled Ammonia Process in the Fertilizer Industry
Peter Erich Arnold ‐ Director Sales, ALSTOM , Germany
3. Sustainable ammonia plant operations: The impact of shift operation
Yaqoob Kamal, Johnson Matthey, UK
4. Online Installation of New Exchanger for Sustained Production
Faisal F. Al‐Shahrani , SF4 Operation Manager, SAFCO, S. Arabia
5. Economics of synthesis gas generation concepts for substantial capacity enlargements of ammonia plants
Joachim Johanning , Head of Product Development Group Ammonia & Urea Division Uhde GmbH ‐ Germany
KBR PURIFIERTM Technology and Project Execution Options for Ammonia
Plants
Avinash Malhotra & Jim Gosnell KBR
601 Jefferson Street Houston, Texas 77002
Prepared for presentation at the 25Th AFA Int’l Fertilizer Technology Conference & Exhibition
Dubai July 9 – 11, 2012
KBR Paper #
Copyright KBR, July 2012
Unpublished
KBR PURIFIERTM Technology and Project Execution Options for Ammonia Plants
ABSTRACT Synthetic ammonia has been in commercial production for about 100 years. As late as 50 years ago the plants were small and inefficient – typically about 100 tons/day and consuming as much as 12 GCal/t of energy. Given that the theoretical minimum energy input is about 5 GCal/t, combined with the tremendous growth in ammonia demand during the mid-twentieth century, the history of the development of ammonia technology is one of increased plant capacities and reduced energy consumption. This development continues today. In this paper we present how KBR Purifier technology has helped to advance this historical trend. As ammonia plants became larger and more efficient, projects became more expensive and complex, so in parallel with technology developments there have been developments in project execution. This paper presents several options that KBR uses in delivering ammonia projects to its licensee.
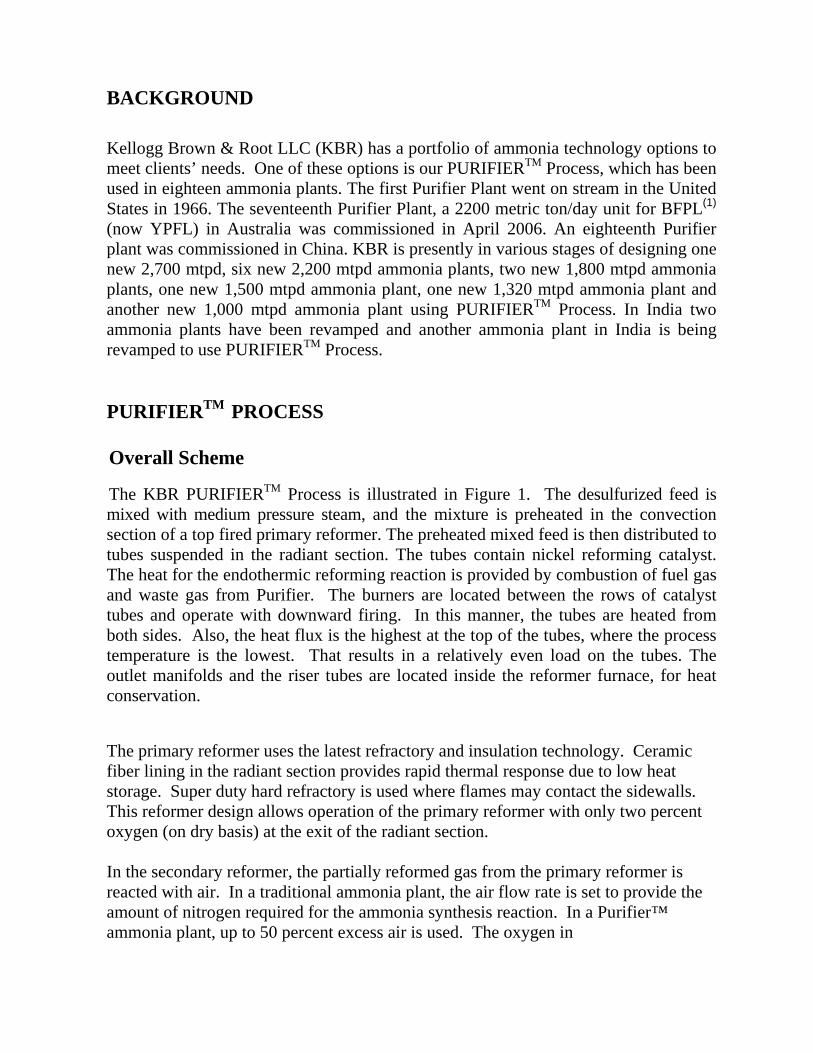
BACKGROUND
Kellogg Brown & Root LLC (KBR) has a portfolio of ammonia technology options to meet clients’ needs. One of these options is our PURIFIERTM Process, which has been used in eighteen ammonia plants. The first Purifier Plant went on stream in the United States in 1966. The seventeenth Purifier Plant, a 2200 metric ton/day unit for BFPL(1) (now YPFL) in Australia was commissioned in April 2006. An eighteenth Purifier plant was commissioned in China. KBR is presently in various stages of designing one new 2,700 mtpd, six new 2,200 mtpd ammonia plants, two new 1,800 mtpd ammonia plants, one new 1,500 mtpd ammonia plant, one new 1,320 mtpd ammonia plant and another new 1,000 mtpd ammonia plant using PURIFIERTM Process. In India two ammonia plants have been revamped and another ammonia plant in India is being revamped to use PURIFIERTM Process. PURIFIERTM
PROCESS Overall Scheme
The KBR PURIFIERTM Process is illustrated in Figure 1. The desulfurized feed is mixed with medium pressure steam, and the mixture is preheated in the convection section of a top fired primary reformer. The preheated mixed feed is then distributed to tubes suspended in the radiant section. The tubes contain nickel reforming catalyst. The heat for the endothermic reforming reaction is provided by combustion of fuel gas and waste gas from Purifier. The burners are located between the rows of catalyst tubes and operate with downward firing. In this manner, the tubes are heated from both sides. Also, the heat flux is the highest at the top of the tubes, where the process temperature is the lowest. That results in a relatively even load on the tubes. The outlet manifolds and the riser tubes are located inside the reformer furnace, for heat conservation.
The primary reformer uses the latest refractory and insulation technology. Ceramic fiber lining in the radiant section provides rapid thermal response due to low heat storage. Super duty hard refractory is used where flames may contact the sidewalls. This reformer design allows operation of the primary reformer with only two percent oxygen (on dry basis) at the exit of the radiant section. In the secondary reformer, the partially reformed gas from the primary reformer is reacted with air. In a traditional ammonia plant, the air flow rate is set to provide the amount of nitrogen required for the ammonia synthesis reaction. In a Purifier™ ammonia plant, up to 50 percent excess air is used. The oxygen in
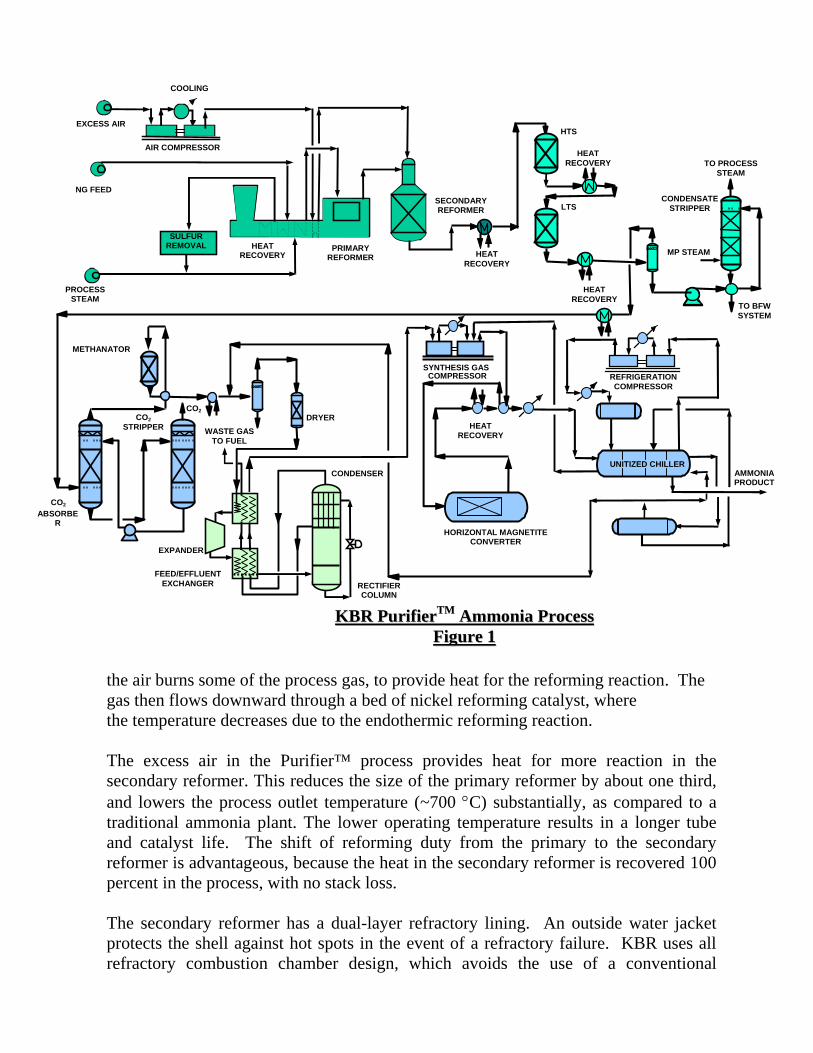
the air burns some of the process gas, to provide heat for the reforming reaction. The gas then flows downward through a bed of nickel reforming catalyst, where the temperature decreases due to the endothermic reforming reaction. The excess air in the Purifier™ process provides heat for more reaction in the secondary reformer. This reduces the size of the primary reformer by about one third, and lowers the process outlet temperature (~700 °C) substantially, as compared to a traditional ammonia plant. The lower operating temperature results in a longer tube and catalyst life. The shift of reforming duty from the primary to the secondary reformer is advantageous, because the heat in the secondary reformer is recovered 100 percent in the process, with no stack loss. The secondary reformer has a dual-layer refractory lining. An outside water jacket protects the shell against hot spots in the event of a refractory failure. KBR uses all refractory combustion chamber design, which avoids the use of a conventional
METHANATOR
CO2
ABSORBER
SYNTHESIS GASCOMPRESSOR
DRYERCO2 STRIPPER
TO BFWSYSTEM
TO PROCESSSTEAM
CONDENSATESTRIPPER
HTS
LTS
REFRIGERATIONCOMPRESSOR
AMMONIAPRODUCT
WASTE GAS TO FUEL
FEED/EFFLUENTEXCHANGER
EXPANDER
CONDENSER
RECTIFIERCOLUMN
MP STEAM
KKBBRR PPuurriiffiieerrTTMM AAmmmmoonniiaa PPrroocceessss FFiigguurree 11
HEAT RECOVERY
HEAT RECOVERY
HEAT RECOVERY
HORIZONTAL MAGNETITE CONVERTER
HEAT RECOVERY
CO2
UNITIZED CHILLER
HEAT RECOVERY
PRIMARY REFORMER
SECONDARY REFORMER
PROCESS STEAM
NG FEED
EXCESS AIR
AIR COMPRESSOR
SULFUR REMOVAL
COOLING
metallic burner, which requires routine inspection and maintenance. The effluent from the secondary reformer containing about 2.0% (dry basis) methane is cooled by generating and superheating high pressure steam prior to shift conversion.
Radiant duty of the primary reformer furnace in the Purifier Process is only about 60% whereas power requirement of the process air compressor is about 1.5 times more than that in a conventional ammonia plant. Due to this unique combination, the oxygen content of the gas turbine exhaust provides a good match with the requirement of combustion air for the primary reformer furnace burners. The exhaust of the gas turbine driver of the process air compressor is thus integrated with the primary reformer furnace.
No forced draft (FD) fan and combustion air preheater is required in Purifier process. The gas turbine driven air compressor is started-up standalone without requiring imported steam thus required capacity of the OSBL package boiler is significantly less. Not only installed cost is reduced this way but energy efficiency of the ammonia plant is significantly increased with such integration commercially proven in numerous Purifier plants.
Shift conversion uses the traditional two-stage high and low temperature reactors. Carbon dioxide is removed by proven processes licensed from third parties such as UOP or BASF. Process condensate is recovered, stripped with medium pressure steam in the Condensate Stripper, and recycled as process steam to the reforming section. The synthesis gas from the CO2 absorber overhead is heated in a feed/effluent exchanger and then passed over methanation catalyst to convert residual carbon oxides to methane. In preparation for drying, the methanator effluent is cooled by heat exchange with methanator feed and cooling water. The methanator effluent, then combines with recycle synthesis loop purge gas and are further cooled with ammonia refrigerant to about 4°C. The chilled gas from the condensate separator drum goes to the syngas dryers. Two dryers are provided. They contain mol sieve desiccant and operate on a 24-hour cycle. Exiting these driers the total of water, CO2 and NH3 content is reduced to less than 1.0 ppmv. The regeneration of the molecular sieve dryers is done with the waste gas from the Purifier. The cryogenic Purifier does the final purification of the raw synthesis gas. It consists of three pieces of equipment, a feed/effluent exchanger, a low speed expander and a rectifying column with an integral overhead condenser. The dried feed to the Purifier with H/N ratio of about 2.0 is first cooled in the top part of the feed/effluent exchanger by exchange with the purified gas and waste gas. It then flows through a turbo-expander where feed is expanded and energy is recovered to develop the net refrigeration required for the cryogenic unit. The expander effluent is further cooled and partially condensed in the bottom of the exchanger and then enters the rectifier
column. All of the methane, about 60% of the argon and all the excess nitrogen coming to the Purifier are removed as rectifier “bottoms”. Liquid from the bottom of the rectifier is partially evaporated at reduced pressure in the shell side of the rectifier overhead condenser to provide reflux for the column. It is further reheated by exchange with Purifier feed gas and then leaves as a waste gas to regenerate the molecular sieve dryers. The waste gas is then used as fuel in the primary reformer. The synthesis gas containing about 0.25 percent argon and an H/N ratio of three is reheated by exchange with Purifier feed and then goes to the suction of the synthesis gas compressor. The purified gas is compressed to about 150 bars while combining with unreacted recycle gas. Compressor discharge is heated by feed/effluent exchange, and enters the horizontal converter. In the converter ammonia conversion is raised from about two percent to nineteen percent while passing over three beds of magnetite catalyst. Converter effluent is cooled by generating high pressure steam, by feed/effluent exchange, with cooling water, and finally in KBR’s proprietary “Unitized Chiller”. A conventional refrigeration system provides the necessary chilling. A small purge stream is recycled to upstream of the dryers in order to recover the hydrogen and nitrogen. Cold ammonia product is exported from the synthesis loop to storage.
TECHNOLOGY FEATURES There are several technology features of the KBR PURIFIERTM Process, which results in very efficient, reliable and lower TIC ammonia plant. These are as discussed below. • Process air compressor driven by a gas turbine with exhaust of gas turbine used as
combustion air to primary reformer. • 30% smaller primary reformer compared to non-purifier ammonia plants. Mild
operating conditions for primary reforming. KBR can provide single primary reformer for 3,500 mtpd ammonia plant. No need of pre-reformer or reforming exchanger
• Excess air to the secondary reformer – milder temperature (~700°C) condition • Non metallic mixing chamber – no metallic mixer/burner in the secondary reformer • Removable tube bundle natural circulation type of reformed gas waste heat boiler. • More CO2 production in the reforming section due to excess air. Consequently it is
possible to produce the CO2 required to convert all ammonia to urea in the CO2 removal unit, even with lean natural gas feed stock. No need to recover CO2 from flue gases.
• KBR’s cryogenic Purifier to remove inerts from the raw synthesis gas resulting in 10% smaller synthesis loop equipment.
• Three beds with two exchangers cold wall horizontal magnetite converter. KBR can provide single horizontal converter for 3,500 mtpd ammonia plants. No need to provide hot wall synthesis converters
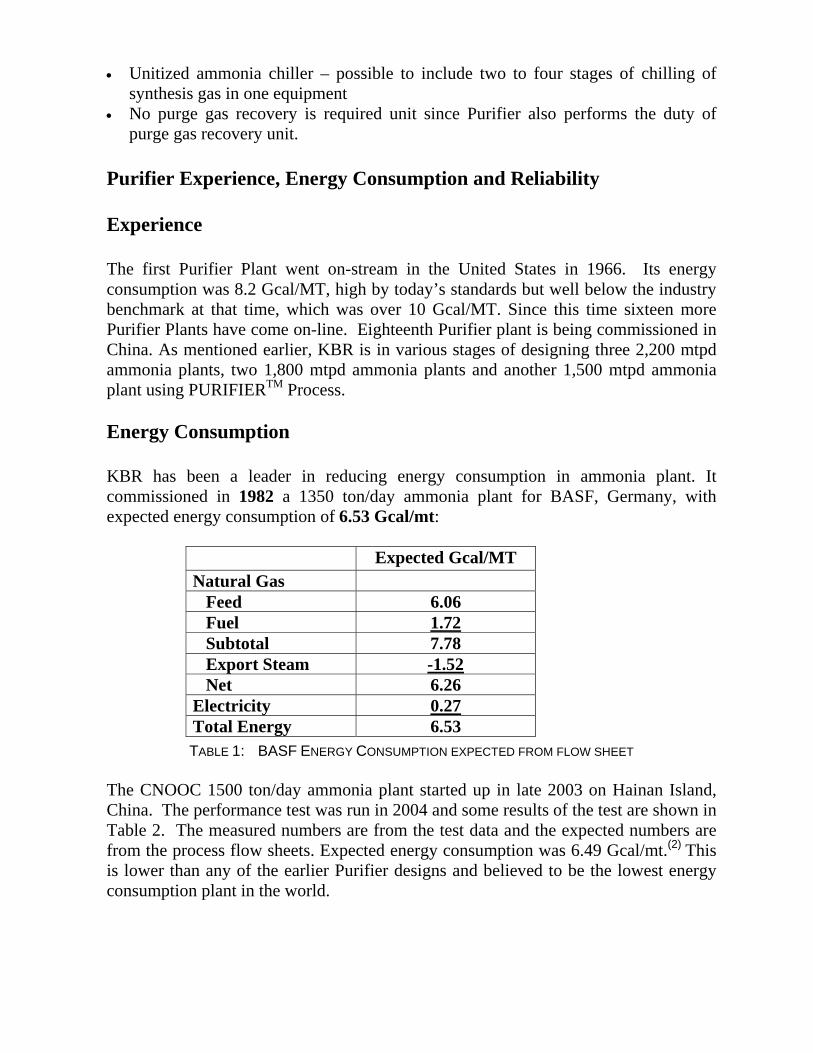
• Unitized ammonia chiller – possible to include two to four stages of chilling of synthesis gas in one equipment
• No purge gas recovery is required unit since Purifier also performs the duty of purge gas recovery unit.
Purifier Experience, Energy Consumption and Reliability Experience The first Purifier Plant went on-stream in the United States in 1966. Its energy consumption was 8.2 Gcal/MT, high by today’s standards but well below the industry benchmark at that time, which was over 10 Gcal/MT. Since this time sixteen more Purifier Plants have come on-line. Eighteenth Purifier plant is being commissioned in China. As mentioned earlier, KBR is in various stages of designing three 2,200 mtpd ammonia plants, two 1,800 mtpd ammonia plants and another 1,500 mtpd ammonia plant using PURIFIERTM Process. Energy Consumption KBR has been a leader in reducing energy consumption in ammonia plant. It commissioned in 1982 a 1350 ton/day ammonia plant for BASF, Germany, with expected energy consumption of 6.53 Gcal/mt:
TABLE 1: BASF ENERGY CONSUMPTION EXPECTED FROM FLOW SHEET
The CNOOC 1500 ton/day ammonia plant started up in late 2003 on Hainan Island, China. The performance test was run in 2004 and some results of the test are shown in Table 2. The measured numbers are from the test data and the expected numbers are from the process flow sheets. Expected energy consumption was 6.49 Gcal/mt.(2) This is lower than any of the earlier Purifier designs and believed to be the lowest energy consumption plant in the world.
Expected Gcal/MT Natural Gas Feed 6.06 Fuel 1.72 Subtotal 7.78 Export Steam -1.52 Net 6.26 Electricity 0.27 Total Energy 6.53
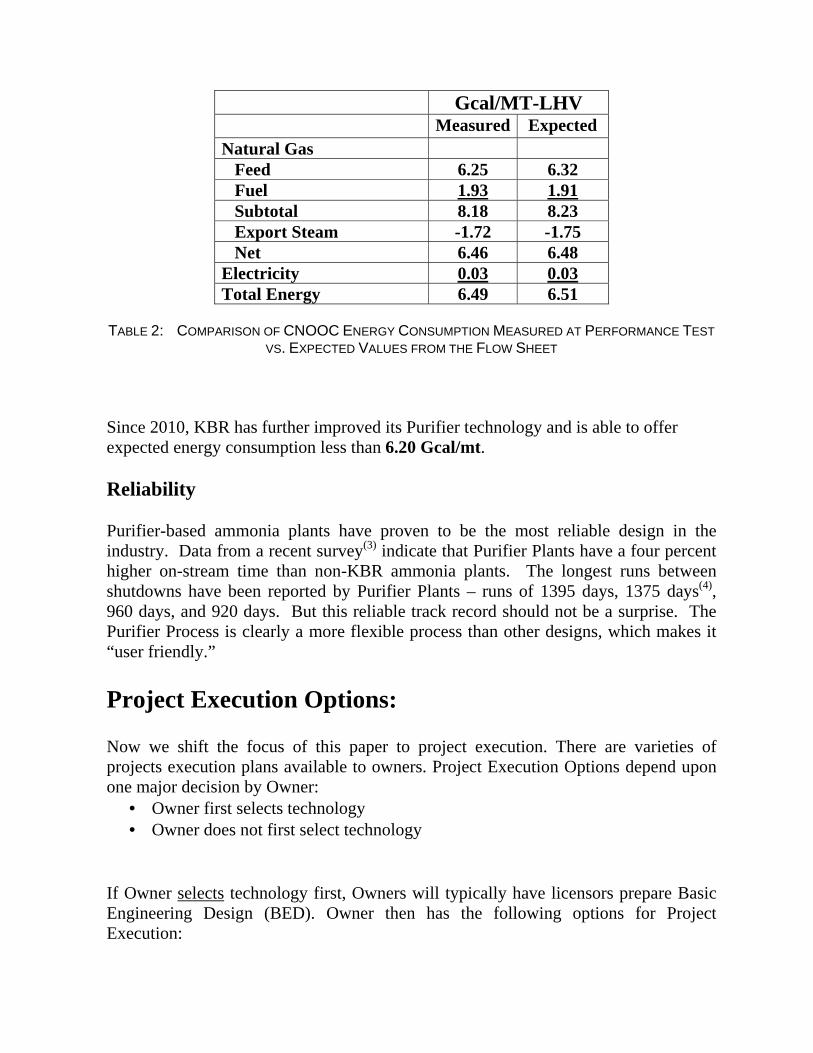
TABLE 2: COMPARISON OF CNOOC ENERGY CONSUMPTION MEASURED AT PERFORMANCE TEST
VS. EXPECTED VALUES FROM THE FLOW SHEET Since 2010, KBR has further improved its Purifier technology and is able to offer expected energy consumption less than 6.20 Gcal/mt. Reliability Purifier-based ammonia plants have proven to be the most reliable design in the industry. Data from a recent survey(3) indicate that Purifier Plants have a four percent higher on-stream time than non-KBR ammonia plants. The longest runs between shutdowns have been reported by Purifier Plants – runs of 1395 days, 1375 days(4), 960 days, and 920 days. But this reliable track record should not be a surprise. The Purifier Process is clearly a more flexible process than other designs, which makes it “user friendly.”
Project Execution Options: Now we shift the focus of this paper to project execution. There are varieties of projects execution plans available to owners. Project Execution Options depend upon one major decision by Owner:
• Owner first selects technology • Owner does not first select technology
If Owner selects technology first, Owners will typically have licensors prepare Basic Engineering Design (BED). Owner then has the following options for Project Execution:
Gcal/MT-LHV Measured Expected Natural Gas Feed 6.25 6.32 Fuel 1.93 1.91 Subtotal 8.18 8.23 Export Steam -1.72 -1.75 Net 6.46 6.48 Electricity 0.03 0.03 Total Energy 6.49 6.51
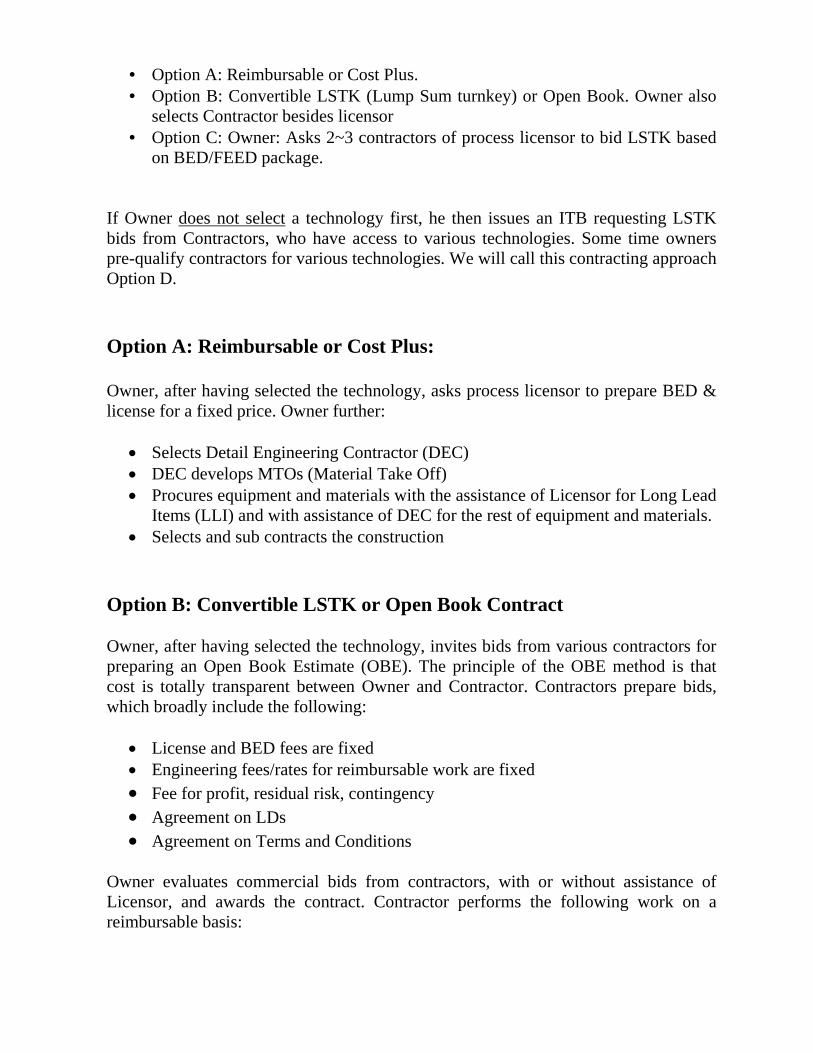
• Option A: Reimbursable or Cost Plus. • Option B: Convertible LSTK (Lump Sum turnkey) or Open Book. Owner also
selects Contractor besides licensor • Option C: Owner: Asks 2~3 contractors of process licensor to bid LSTK based
on BED/FEED package. If Owner does not select a technology first, he then issues an ITB requesting LSTK bids from Contractors, who have access to various technologies. Some time owners pre-qualify contractors for various technologies. We will call this contracting approach Option D. Option A: Reimbursable or Cost Plus: Owner, after having selected the technology, asks process licensor to prepare BED & license for a fixed price. Owner further:
• Selects Detail Engineering Contractor (DEC) • DEC develops MTOs (Material Take Off) • Procures equipment and materials with the assistance of Licensor for Long Lead
Items (LLI) and with assistance of DEC for the rest of equipment and materials. • Selects and sub contracts the construction
Option B: Convertible LSTK or Open Book Contract Owner, after having selected the technology, invites bids from various contractors for preparing an Open Book Estimate (OBE). The principle of the OBE method is that cost is totally transparent between Owner and Contractor. Contractors prepare bids, which broadly include the following:
• License and BED fees are fixed • Engineering fees/rates for reimbursable work are fixed • Fee for profit, residual risk, contingency • Agreement on LDs • Agreement on Terms and Conditions
Owner evaluates commercial bids from contractors, with or without assistance of Licensor, and awards the contract. Contractor performs the following work on a reimbursable basis:
• Front End Engineering Design (FEED) or sufficient basic and detail engineering for OBE
• Prepares technical and commercial requisition for LLI and gets quotes. Owner and Contractor select the best vendor/technical offer for LLI equipment, and negotiate price/commercial terms.
• Contractor develops MTO and gets prices for bulk material • Contractor prepares bids for construction sub-contractors and gets quotes • Vendors for equipment and materials, and sub-contractors for construction are
selected. • OBE is prepared and agreed between Owner and Contractor
OBE is then converted to LSTK price after incorporating previously agreed fee for profit, residual risk, and contingency. Owner thus awards a LSTK contract after phase 1. In this option Owner is able to purchase equipment and systems of his choice (owners) and quality, and select construction contractor or sub contractors, who meet owner’s quality standards. Option B is also illustrated in the following:
Lump SumLump Sum
Option B: CONVERTIBLE LSTK or OPEN BOOK CONTRACT
TENDER PERIOD
ANALYSE/ANALYSE/NEGOTIATE/NEGOTIATE/
AWARDAWARD
OWNEROWNER
LICENSOR/EPC LICENSOR/EPC CONTRACTORCONTRACTOR
At At TendererTenderer’’ss CostCost
MANAGE AND CONTROLMANAGE AND CONTROL
ENGINEERING
PROCUREMENT
CONSTRUCTION
PROCUREMENT(IF REQUIRED))
OPEN BOOK ESTIMATE
CONVERT TO CONVERT TO LUMP SUMLUMP SUM
ANALYSE/ANALYSE/NEGOTIATE/NEGOTIATE/
COMMITCOMMIT
ReimbursableReimbursable
- License Feed Fixed Engineering services reimbursable rates
- Agreed-to Fee for Profit, Residual Risk and Contingency
- Agreement on LD’s - Agreement on Terms
and Conditions (T&C) for Phase 1 & 2
Fix price
ENGINEERINGENGINEERING
COMMISSIONING
PHASE 2 EXECUTION PERIOD
PHASE 1 EXECUTION PERIOD
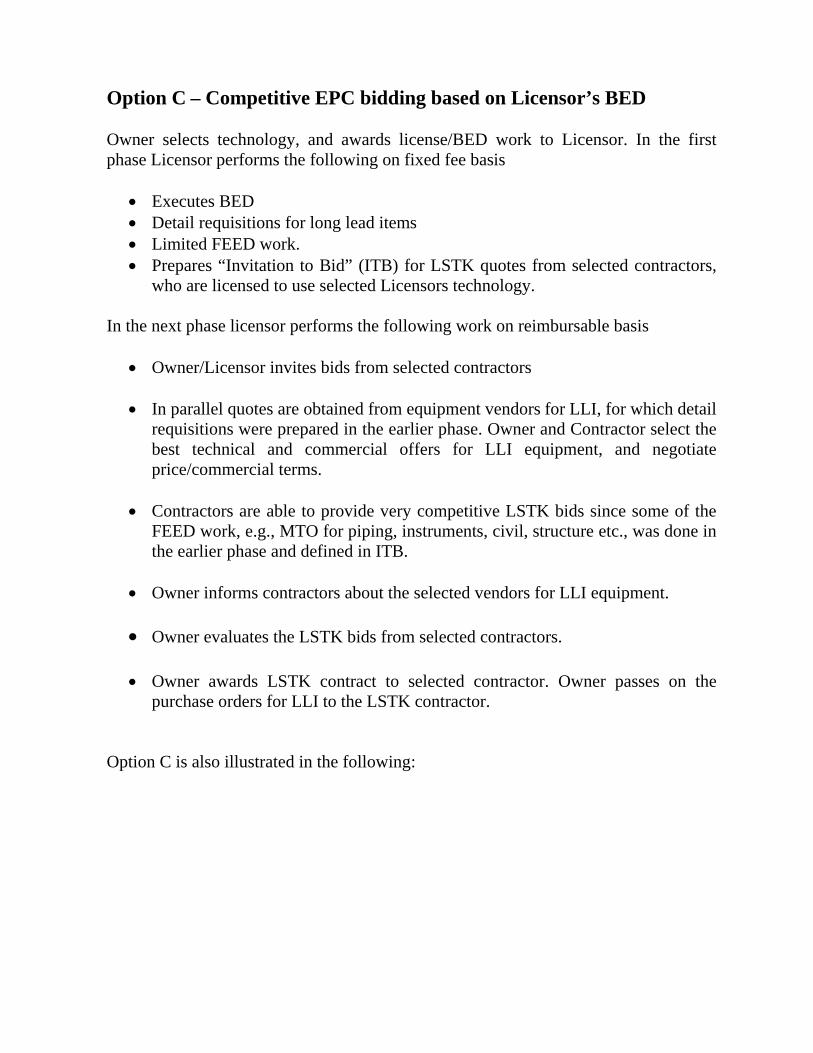
Option C – Competitive EPC bidding based on Licensor’s BED Owner selects technology, and awards license/BED work to Licensor. In the first phase Licensor performs the following on fixed fee basis
• Executes BED • Detail requisitions for long lead items • Limited FEED work. • Prepares “Invitation to Bid” (ITB) for LSTK quotes from selected contractors,
who are licensed to use selected Licensors technology. In the next phase licensor performs the following work on reimbursable basis
• Owner/Licensor invites bids from selected contractors • In parallel quotes are obtained from equipment vendors for LLI, for which detail
requisitions were prepared in the earlier phase. Owner and Contractor select the best technical and commercial offers for LLI equipment, and negotiate price/commercial terms.
• Contractors are able to provide very competitive LSTK bids since some of the
FEED work, e.g., MTO for piping, instruments, civil, structure etc., was done in the earlier phase and defined in ITB.
• Owner informs contractors about the selected vendors for LLI equipment. • Owner evaluates the LSTK bids from selected contractors.
• Owner awards LSTK contract to selected contractor. Owner passes on the
purchase orders for LLI to the LSTK contractor. Option C is also illustrated in the following:
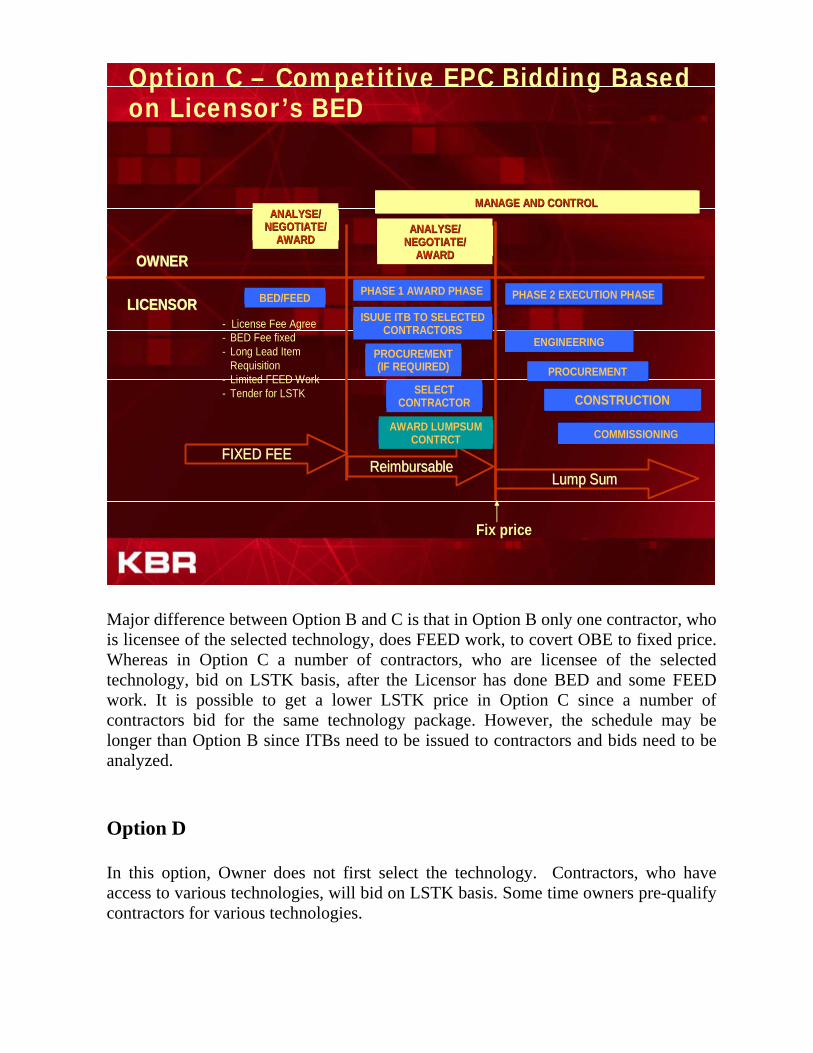
Lump SumLump Sum
Option C – Competitive EPC Bidding Based on Licensor’s BED
BED/FEED
ANALYSE/ANALYSE/NEGOTIATE/NEGOTIATE/
AWARDAWARD
OWNEROWNER
LICENSORLICENSOR
FIXED FEEFIXED FEE
MANAGE AND CONTROLMANAGE AND CONTROL
ENGINEERING
PROCUREMENT
CONSTRUCTION
PROCUREMENT(IF REQUIRED)
ANALYSE/ANALYSE/NEGOTIATE/NEGOTIATE/
AWARDAWARD
ReimbursableReimbursable
- License Fee Agree- BED Fee fixed- Long Lead Item
Requisition- Limited FEED Work - Tender for LSTK
Fix price
ISUUE ITB TO SELECTED CONTRACTORS
COMMISSIONING
PHASE 2 EXECUTION PHASEPHASE 1 AWARD PHASE
AWARD LUMPSUM CONTRCT
SELECT CONTRACTOR
Major difference between Option B and C is that in Option B only one contractor, who is licensee of the selected technology, does FEED work, to covert OBE to fixed price. Whereas in Option C a number of contractors, who are licensee of the selected technology, bid on LSTK basis, after the Licensor has done BED and some FEED work. It is possible to get a lower LSTK price in Option C since a number of contractors bid for the same technology package. However, the schedule may be longer than Option B since ITBs need to be issued to contractors and bids need to be analyzed. Option D In this option, Owner does not first select the technology. Contractors, who have access to various technologies, will bid on LSTK basis. Some time owners pre-qualify contractors for various technologies.
This option of Project Execution is exhaustive requiring much longer schedule because:
• Owner pre-qualify contractors for various technologies 4~6 months. • Owner prepares or appoints a consultant to prepare a detail ITB (Invitation to
bid). This effort usually requires 4~6 six months. • Contractors submits bids in 4~6 months • Owner conducts technical & commercial clarifications lasting 2~3 months. • Based on above Contractors then submit final commercial bids in 2~3 months • Owner selects contractor – Total time 12 ~ 18 months • Contractor executes project in 30~36 months • Total time required to complete project is 46~60 months after decision to go for
LSTK type of project execution mode. Comparison of Options: Option A
Cost Plus or Reimbursable
Option B Convertible LSTK or Open Book
Option C Option D LSTK
TIC Lowest Medium Medium (-) Highest Schedule Shortest
30~32 months
Medium 32~34 months
Medium (+) 34~36 months
Longest +48 months
Quality of Equipment, Material & Construction
Highest Highest (-) Medium Medium
Owners Risk Highest Medium Medium Lowest In Option A, TIC will be generally lowest since the client is serving as managing contractor, and therefore, there is no profit element for this activity. Owner also has option to buy equipment and material of highest quality and also maintain quality during construction. However Owner takes the highest risk in this option. To mitigate the risk, owner requires a very competent technical, commercial, project, and construction management team. This risk can also be reduced by appointing a program management contractor for the project. Option D is other extreme, where the Owner takes minimum project management and TIC risk. However TIC will generally be highest unless contractors are in a situation where they hungry for work. Contractor will need to put in his price the risk money for forward escalation & contingency. In times of rising equipment and material costs this
can be a substantial number. Overall time required in this option is highest of all options. Options B and C are very viable options, which optimize TIC, risk, schedule and quality of equipment and material. These options are very well tested in industry. SUMMARY KBR’s PurifierTM technology is a well proven technology. This process offers the following benefits to ammonia producers: • Low operating cost
Very low energy consumption Reduced maintenance costs
• High reliability
Well-proven commercial designs Greater operational flexibility Ease of handling process upsets
• Lower capital cost
Smaller primary reformer Eliminates the purge gas recovery unit Has smaller synthesis loop and refrigeration system due to high purity make-up
gas in PurifierTM Four Project Execution Options have been explained.
• Option A - Reimbursable or Cost Plus Lower TIC Shorter schedule Higher owner’s risk
• Option B Convertible LSTK or Open Book or Option C
Very viable options Optimize TIC, owner’s risk, and schedule Better quality of equipment and materials
• Option D LSTK Basis
Higher TIC Overall longer schedule from concept to mechanical completion
Lower owner’s risk
REFERENCES 1 Jovanovic, Wolfgang & Avinash Malhotra: “Construction and Commissioning of
BFPL’s 2200 mtpd – World’s Largest PURIFIERTM Ammonia Plant” AIChE Ammonia Safety Symposium, Vancouver, British Columbia, Canada, September 2006.
2 Yang Yexin & Jim Gosnell: “CNOOC Chemical Ltd. New Fertilizer Plant,”
AIChE Ammonia Safety Symposium, Denver, Colorado USA, September 2004.
3 Plant Surveys International, Inc., “Worldwide Ammonia Plant Benchmarking
Study.” Unpublished Report. 4 de Letter, Jacky “Over 3 years of continuous operation of unit D in Sluiskil, all
time record” AIChE Ammonia Safety Symposium, Henderson, Nevada, USA, September 2007.
ALS
TOM Carbon Capture GmbH
25th AFA Int'l. Fertilizer Technology Conference & Exhibition
Introduction to Alstom’s
CO2Capture Systems Organ
isation
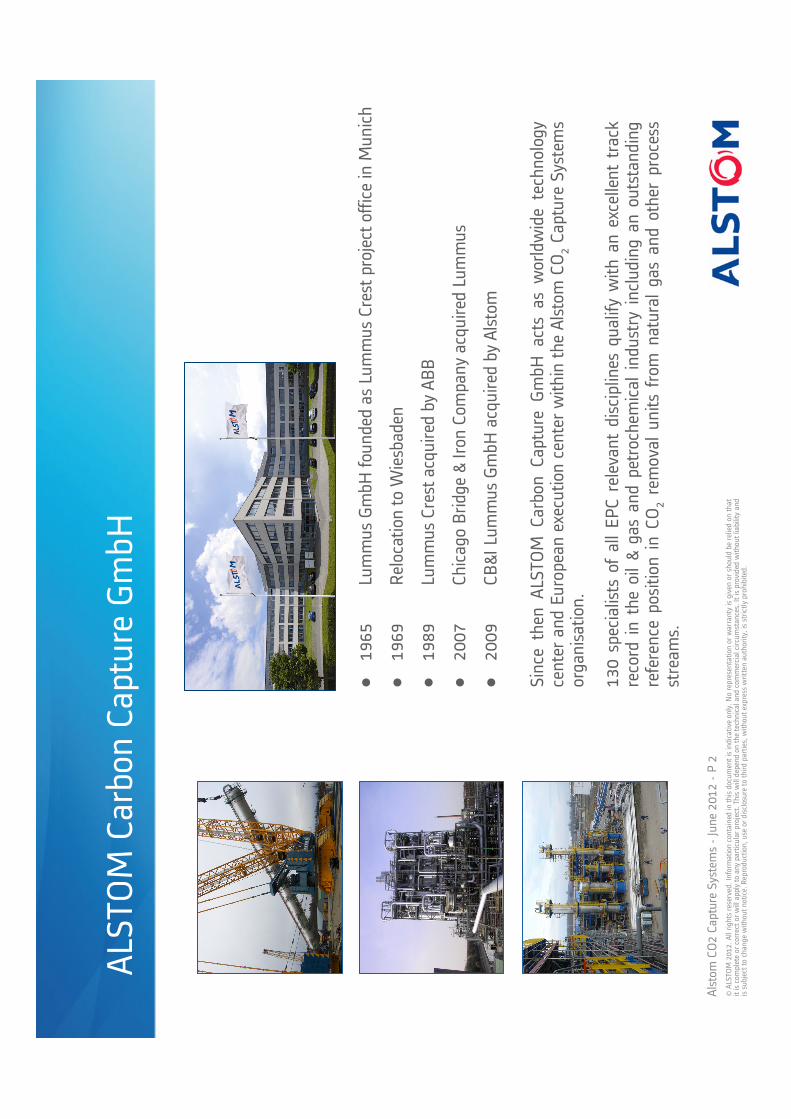
Alstom CO2 Capture Systems-June 2012-P 2
©ALS
TOM 2012. All rights reserved. Inform
ation con
tained in
this document isindicative only. No representation or warranty is given or should be relied on that
it is complete or correct or will apply to any particular project. Th
is w
ill depend on the technical and commercial circumstances.It is provided w
ithout liability and
is subject to change without notice. Reproduction, use or disclosure to third parties, w
ithout express w
ritten authority, is strictly prohibited.
ALS
TOM Carbon Capture GmbH
Since
then
ALS
TOM C
arbon C
apture GmbH acts
as worldwidetechnology
centeran
d European execution
centerwithin
theAlstom CO2Capture Systems
organ
isation.
130 specialists
of all EPC relevan
t disciplines
qualifywithan
excellenttrack
record
in theoil& gas and petrochem
ical
industry
includingan
outstanding
reference
positionin CO
2removal units from
natural gas and other process
stream
s.
●1965
Lummus GmbH fou
nded
as Lummus Crestprojectofficein M
unich
●1969
Relocation
to W
iesbaden
●1989
Lummus Crestacquired
byABB
●2007
Chicago Bridge & Iron Com
pan
y acquired
Lummus
●2009
CB&I Lummus GmbH acquired
byAlstom
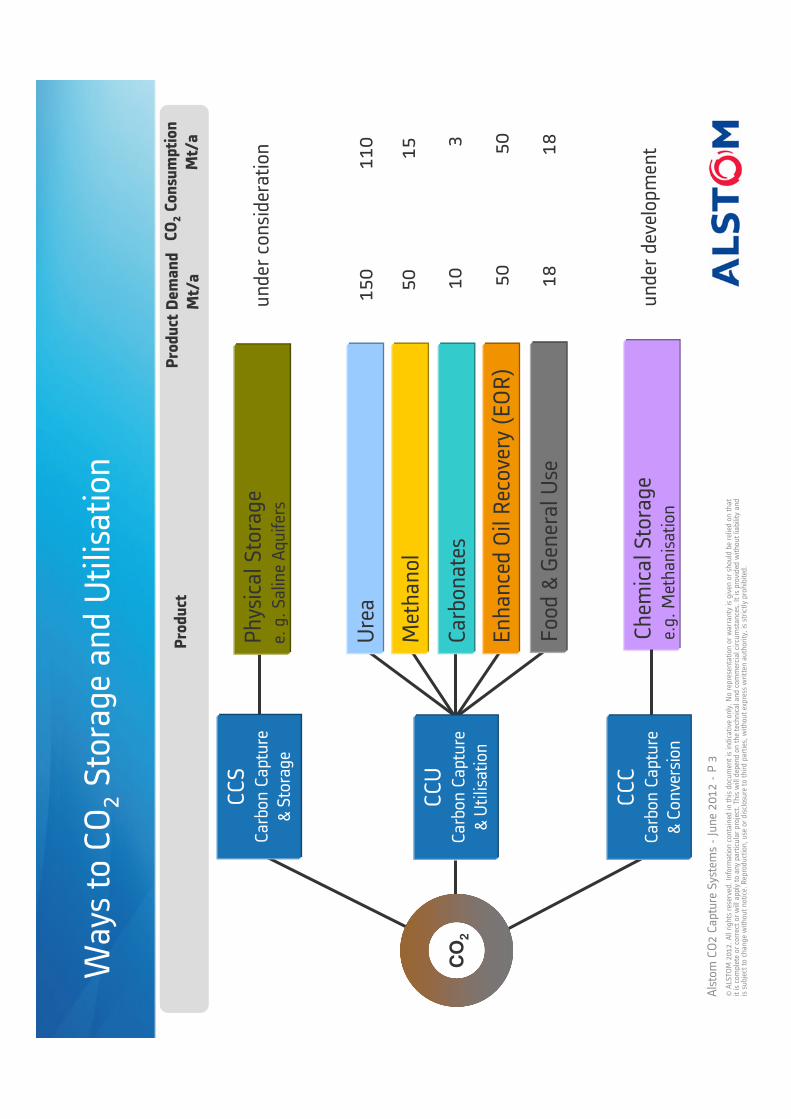
Alstom CO2 Capture Systems-June 2012-P 3
©ALS
TOM 2012. All rights reserved. Inform
ation con
tained in
this document isindicative only. No representation or warranty is given or should be relied on that
it is complete or correct or will apply to any particular project. Th
is w
ill depend on the technical and commercial circumstances.It is provided w
ithout liability and
is subject to change without notice. Reproduction, use or disclosure to third parties, w
ithout express w
ritten authority, is strictly prohibited.
Waysto CO2Storagean
d Utilisation
CO2Consumption
Mt/a
Enhanced Oil Recovery (EOR)
Methanol
Chem
ical S
torage
e.g. Methan
isation
150
110
50
15
10
3
50
50
18
18
under
development
under
consideration
Product
ProductDemand
Mt/a
CO
2
Food & General Use
Urea
CCS
Carbon Capture
& Storage
Physical S
torage
e. g. Saline Aquifers
CCU
Carbon Capture
& Utilisation
Carbonates
CCC
Carbon Capture
& Conversion
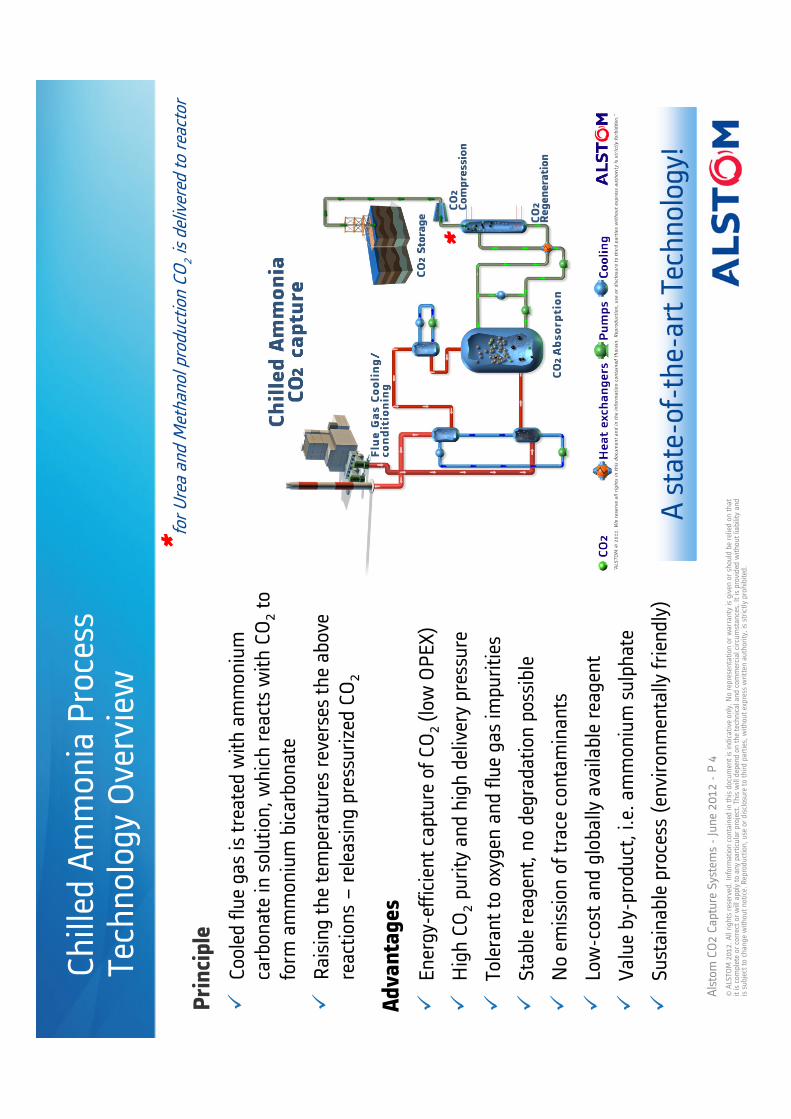
Alstom CO2 Capture Systems-June 2012-P 4
©ALS
TOM 2012. All rights reserved. Inform
ation con
tained in
this document isindicative only. No representation or warranty is given or should be relied on that
it is complete or correct or will apply to any particular project. Th
is w
ill depend on the technical and commercial circumstances.It is provided w
ithout liability and
is subject to change without notice. Reproduction, use or disclosure to third parties, w
ithout express w
ritten authority, is strictly prohibited.
Chilled Ammonia Process
Technology Overview
*for Urea an
d Methanol produ
ction CO
2is delivered to reactor
A state-of-the-art Technology!
Principle
�Cooled flue gas is treated w
ith ammonium
carbonate in solution, which reacts with CO2to
form
ammonium bicarbonate
�Raising the temperatures reverses the above
reactions –releasing pressurized CO2
Advantages
�Energy-efficient capture of CO2 (low OPEX)
�High CO2purity and high delivery pressure
�Tolerant to oxygen and flue gas im
purities
�Stable reagent, no degradation possible
�No emission of trace contaminants
�Low-cost and globally available reagent
�Value by-product, i.e. ammonium sulphate
�Sustainable process (environmentally friendly)
*
Alstom CO2 Capture Systems-June 2012-P 5
©ALS
TOM 2012. All rights reserved. Inform
ation con
tained in
this document isindicative only. No representation or warranty is given or should be relied on that
it is complete or correct or will apply to any particular project. Th
is w
ill depend on the technical and commercial circumstances.It is provided w
ithout liability and
is subject to change without notice. Reproduction, use or disclosure to third parties, w
ithout express w
ritten authority, is strictly prohibited.
Recovery of CO2for Urea Process
�Urea is produced from ammonia and carbon dioxide. W
hen urea is synthesized w
ith natural gas
as a raw m
aterial the available CO2may be insufficient in view of the balance between ammonia
and off-gas CO2. In such cases, CO2is recovered from the exhaust gas of the reform
er, to supply
it for urea synthesis to adjust the ammonia/CO2balance, thereby enabling urea to be produced
in large quantities.
�A number of ammonia and urea complexes of recent date has been designed to export part of
ammonia produced w
ithout being converted to urea. Such ammonia-urea complexes exporting
ammonia have potential to produce additional urea by capturing CO2from flue gas of reform
er,
boilers or furnaces.
�Th
e Chilled Ammonia Process recovers CO2from flue gas em
itted during the urea production
process and provides the captured CO2as feedstock for urea synthesis. CO2contained in the flue
gas em
itted from the reform
er during the ammonia production process is absorbed into the
solvent, w
hich is a largely used commodity chem
ical. The technology can be designed to recover
90% of the CO2in flue gas.
�Introducing CO2capture drastically reduces CO2em
ission w
hile increasing urea production, i.e.
sustainable growth.
�Main applications: fuel switch (from naphta
to natural gas), grass roots and capacity expansion.
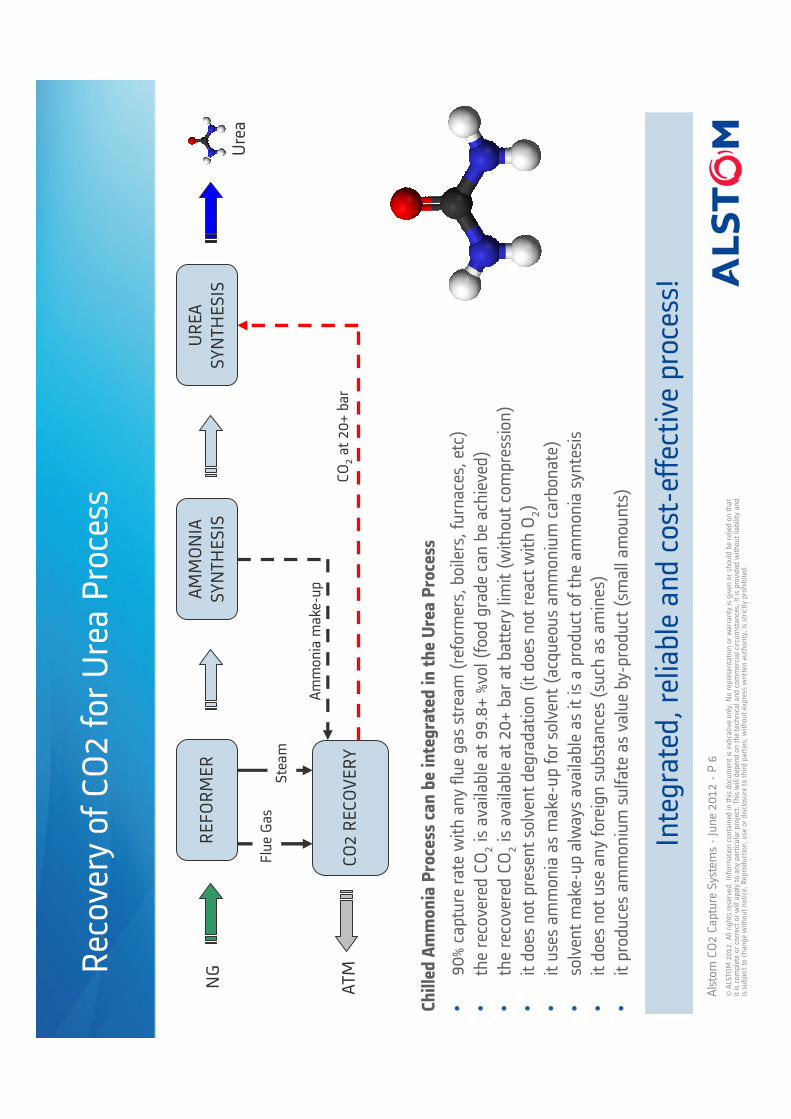
Alstom CO2 Capture Systems-June 2012-P 6
©ALS
TOM 2012. All rights reserved. Inform
ation con
tained in
this document isindicative only. No representation or warranty is given or should be relied on that
it is complete or correct or will apply to any particular project. Th
is w
ill depend on the technical and commercial circumstances.It is provided w
ithout liability and
is subject to change without notice. Reproduction, use or disclosure to third parties, w
ithout express w
ritten authority, is strictly prohibited.
Recovery of CO2 for Urea Process
ChilledAmmoniaProcess
canbeintegratedin theUrea Process
•90% capture
rate withan
yfluegas stream
(reform
ers, boilers, furnaces, etc)
•therecoveredCO2isavailableat 99.8+ %vol (foodgrade canbeachieved)
•therecoveredCO2isavailableat 20+ bar at battery
limit(w
ithoutcompression)
•itdoes
notpresentsolvent degradation(itdoes
not
reactwithO
2)
•itusesam
mon
iaas m
ake-upforsolvent (acqueousam
monium
carbon
ate)
•solvent make-upalwaysavailableas it
isa productof theam
mon
iasyntesis
•itdoes
notuse
anyforeignsubstan
ces(such as am
ines)
•itproducesam
monium
sulfateas valueby-product(smallamou
nts)
Integrated, reliableand cost-effective
process!
REFORMER
AMMONIA
SYNTH
ESIS
UREA
SYNTH
ESIS
CO2 RECOVERY
FlueGas
Steam
Ammoniamake-up
CO2at 20+ bar
ATMNG
Urea
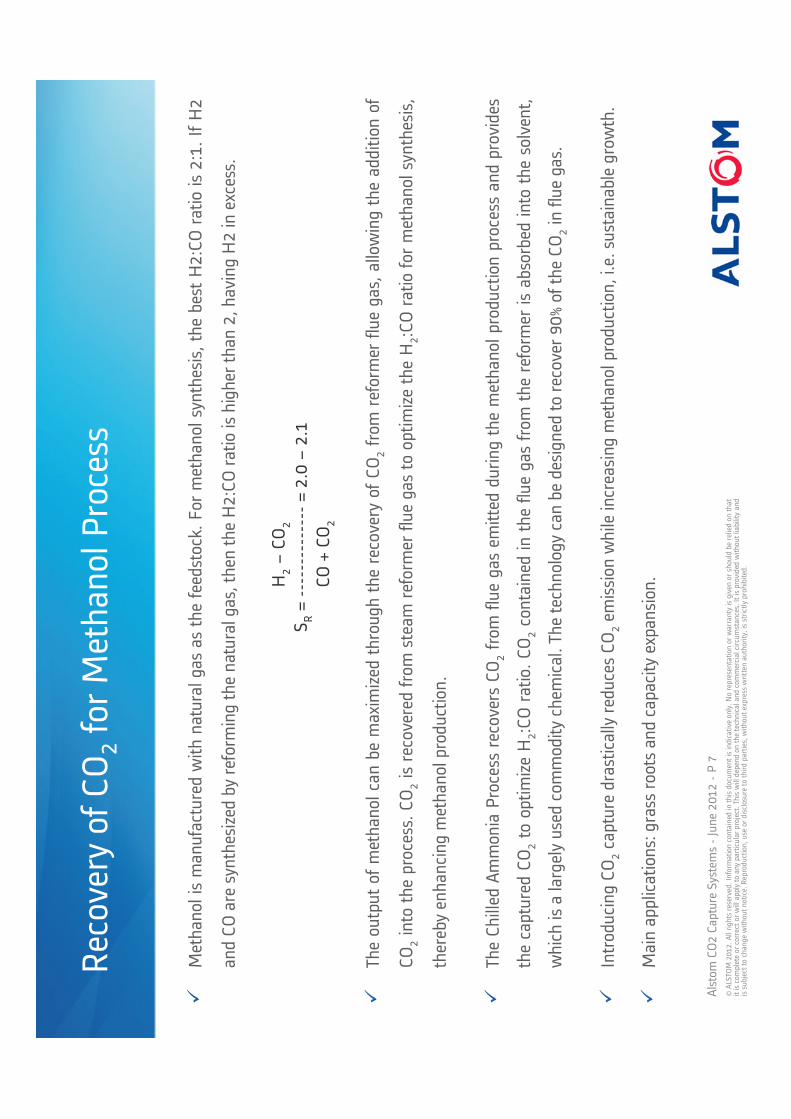
Alstom CO2 Capture Systems-June 2012-P 7
©ALS
TOM 2012. All rights reserved. Inform
ation con
tained in
this document isindicative only. No representation or warranty is given or should be relied on that
it is complete or correct or will apply to any particular project. Th
is w
ill depend on the technical and commercial circumstances.It is provided w
ithout liability and
is subject to change without notice. Reproduction, use or disclosure to third parties, w
ithout express w
ritten authority, is strictly prohibited.
Recovery of CO2for Methan
ol P
rocess
�Methan
ol is man
ufactured w
ith natural gas as the feedstock. For m
ethan
ol synthesis, the best H2:CO ratio is 2:1. If H2
and CO are synthesized by reform
ing the natural gas, then the H2:CO ratio is higher than
2, having H2 in
excess.
�Th
e output of methan
ol can
be maxim
ized through the recovery of CO2from
reformer flue gas, allowing the addition of
CO
2into the process. CO
2is recovered from steam
reform
er flue gas to optimize the H
2:CO ratio for m
ethan
ol synthesis,
thereby enhan
cing m
ethan
ol production.
�Th
e Chilled Ammon
ia Process recovers CO2from flue gas emitted during the methan
ol production process and provides
the captured CO2to optimize H
2:CO ratio. CO
2contained in the flue gas from the reform
er is absorbed into the solvent,
which is a largely used commodity chem
ical. Th
e technology can be designed to recover 90% of the CO2in flue gas.
�Introducing CO
2capture drastically reduces CO
2em
ission while increasing m
ethan
ol production, i.e. sustainablegrowth.
�Main applications: grass roots an
d capacity expan
sion
.H2–CO
2
SR= --------------= 2.0 –
2.1
CO + CO2
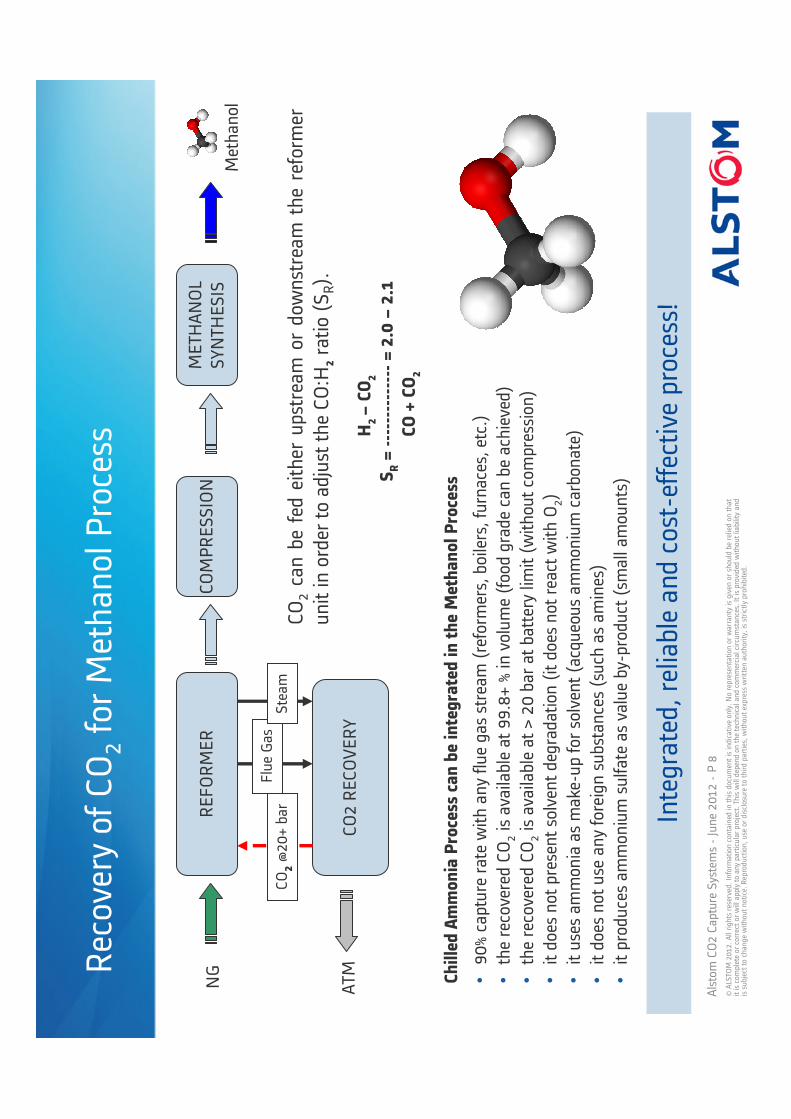
Alstom CO2 Capture Systems-June 2012-P 8
©ALS
TOM 2012. All rights reserved. Inform
ation con
tained in
this document isindicative only. No representation or warranty is given or should be relied on that
it is complete or correct or will apply to any particular project. Th
is w
ill depend on the technical and commercial circumstances.It is provided w
ithout liability and
is subject to change without notice. Reproduction, use or disclosure to third parties, w
ithout express w
ritten authority, is strictly prohibited.
Recovery of CO2for Methan
ol P
rocess
Integrated, reliableand cost-effective
process!
ChilledAmmoniaProcess
canbeintegratedin theMethanol Process
•90% capture
rate withan
yfluegas stream
(reform
ers, boilers, furnaces, etc.)
•therecoveredCO2isavailableat 99.8+ % in
volume(food grade canbeachieved)
•therecoveredCO2isavailableat > 20 bar at battery
limit(w
ithoutcompression)
•itdoes
notpresentsolvent degradation(itdoes
not
reactwithO
2)
•itusesam
mon
iaas m
ake-upforsolvent (acqueousam
monium
carbon
ate)
•itdoes
notuse
anyforeignsubstan
ces(such as am
ines)
•itproducesam
monium
sulfateas valueby-product(smallamou
nts)
REFORMER
COMPRESSION
METH
ANOL
SYNTH
ESIS
CO2 RECOVERY
FlueGas
Steam
ATMNG
CO2@20+ bar
CO2canbefedeither
upstream
ordownstream
thereform
er
unitin order to adjusttheCO:H
2ratio (SR).
H2 –CO2
SR= --------------= 2.0 –2.1
CO + CO2
Methan
ol
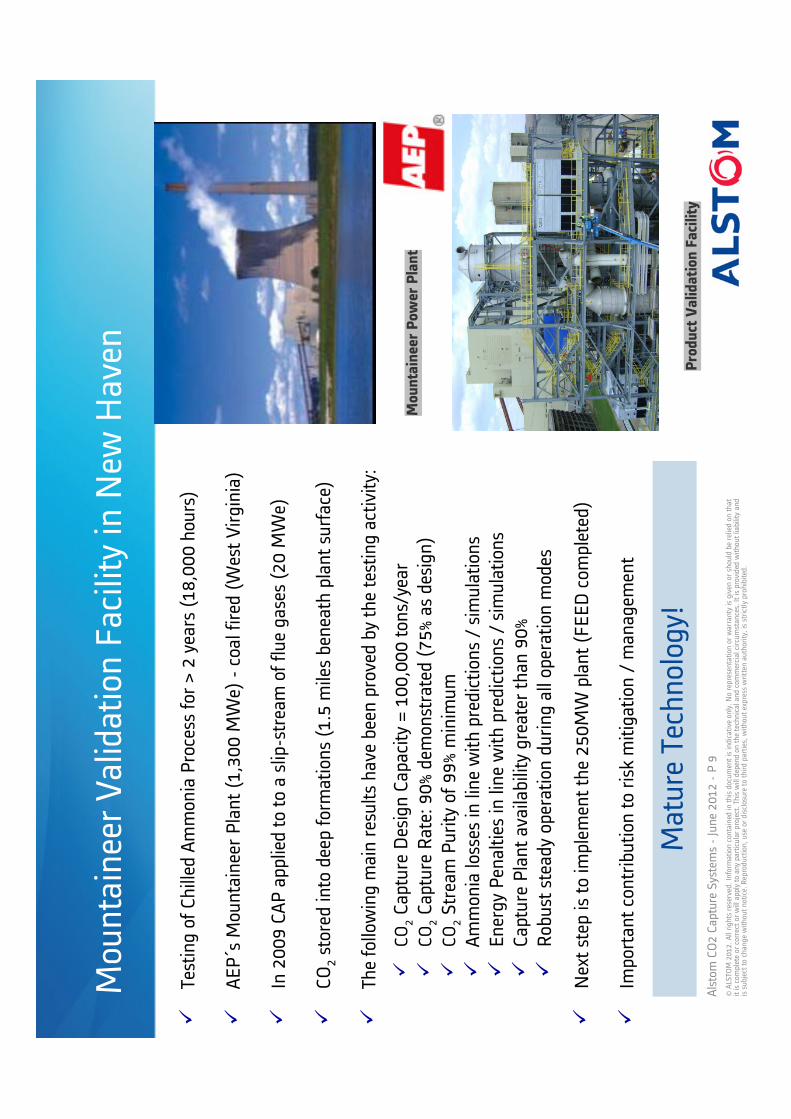
Alstom CO2 Capture Systems-June 2012-P 9
©ALS
TOM 2012. All rights reserved. Inform
ation con
tained in
this document isindicative only. No representation or warranty is given or should be relied on that
it is complete or correct or will apply to any particular project. Th
is w
ill depend on the technical and commercial circumstances.It is provided w
ithout liability and
is subject to change without notice. Reproduction, use or disclosure to third parties, w
ithout express w
ritten authority, is strictly prohibited.
Mountaineer Validation Facility in
New
Haven
�Testingof Chilled
Ammon
iaProcess
for> 2 years
(18,000 hou
rs)
�AEP´s
Mou
ntaineerPlant (1,300 M
We) -coalfired(W
est Virginia)
�In 2009 CAP appliedto to a slip-stream
of fluegases
(20 M
We)
�CO2stored
into
deepform
ations(1.5 m
ilesbeneath
plant surface)
�Th
e followingmainresultshavebeenprovedbythetestingactivity:
�CO
2Capture
Design Capacity= 100,000 ton
s/year
�CO
2Capture
Rate: 90% dem
onstrated(75% as design)
�CO
2Stream
Purity
of 99% m
inim
um
�Ammon
ialosses
in linewithprediction
s/ simulation
s
�Energy Penalties
in linewithprediction
s/ simulation
s
�Capture
Plant availability
greater
than
90%
�Robust steadyoperationduringall operationmodes
�Nextstep
isto im
plementthe250MW plant (FEED com
pleted)
�Im
portantcontribution
to riskmitigation/ man
agem
ent
Product Validation Facility
Mountaineer Power Plant
Mature Technology!
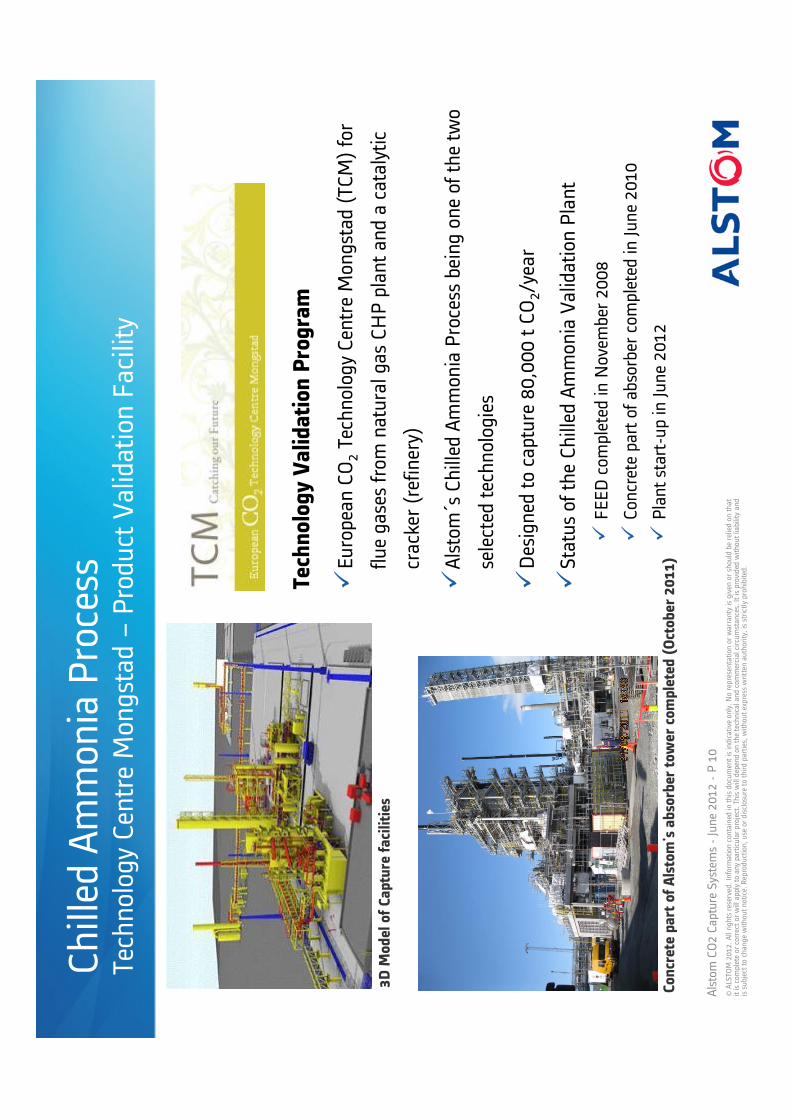
Alstom CO2 Capture Systems-June 2012-P 10
©ALS
TOM 2012. All rights reserved. Inform
ation con
tained in
this document isindicative only. No representation or warranty is given or should be relied on that
it is complete or correct or will apply to any particular project. Th
is w
ill depend on the technical and commercial circumstances.It is provided w
ithout liability and
is subject to change without notice. Reproduction, use or disclosure to third parties, w
ithout express w
ritten authority, is strictly prohibited.
3D M
odel of Capture facilities
Concretepart of Alstom's absorber towercompleted(October2011)
Technology Validation Program
�European CO2Technology Centre Mongstad (TC
M) for
flue gases from natural gas CHP plant and a catalytic
cracker (refinery)
�Alstom
´sChilled Ammonia Process being one of the tw
o
selected technologies
�Designed to capture 80,000 t CO2/year
�Status of the Chilled Ammonia Validation Plant
�FEED completed in Novem
ber 2008
�Con
crete part of absorber completed in
June 2010
�Plant start-up in
June 2012
Chilled Ammonia Process
Technology Centre Mon
gstad –
Product Validation Facility

www.alstom.com
26/06/2012
1
Sustainable ammonia plant operationsThe impact of shift operation
Overview
• What defines a “sustainable” shift operation?
• The impact of catalyst choice on LTS operation
• Additional options for improving shift operation and efficiency
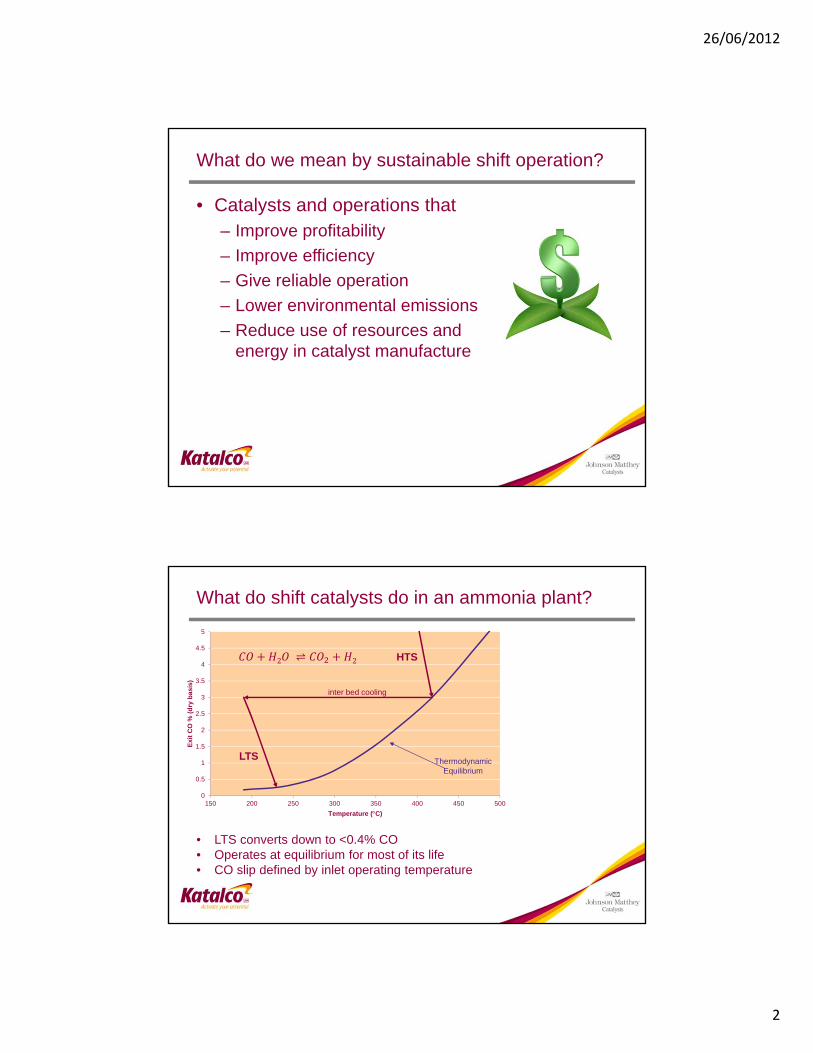
26/06/2012
2
What do we mean by sustainable shift operation?
• Catalysts and operations that– Improve profitability
– Improve efficiency
– Give reliable operation
– Lower environmental emissions
– Reduce use of resources and energy in catalyst manufacture
0
0.5
1
1.5
2
2.5
3
3.5
4
4.5
5
150 200 250 300 350 400 450 500
Exi
t C
O %
(d
ry b
asis
)
Temperature (C)
ThermodynamicEquilibrium
HTS
LTS
inter bed cooling
What do shift catalysts do in an ammonia plant?
• LTS converts down to <0.4% CO• Operates at equilibrium for most of its life• CO slip defined by inlet operating temperature
2 ⇌ 2
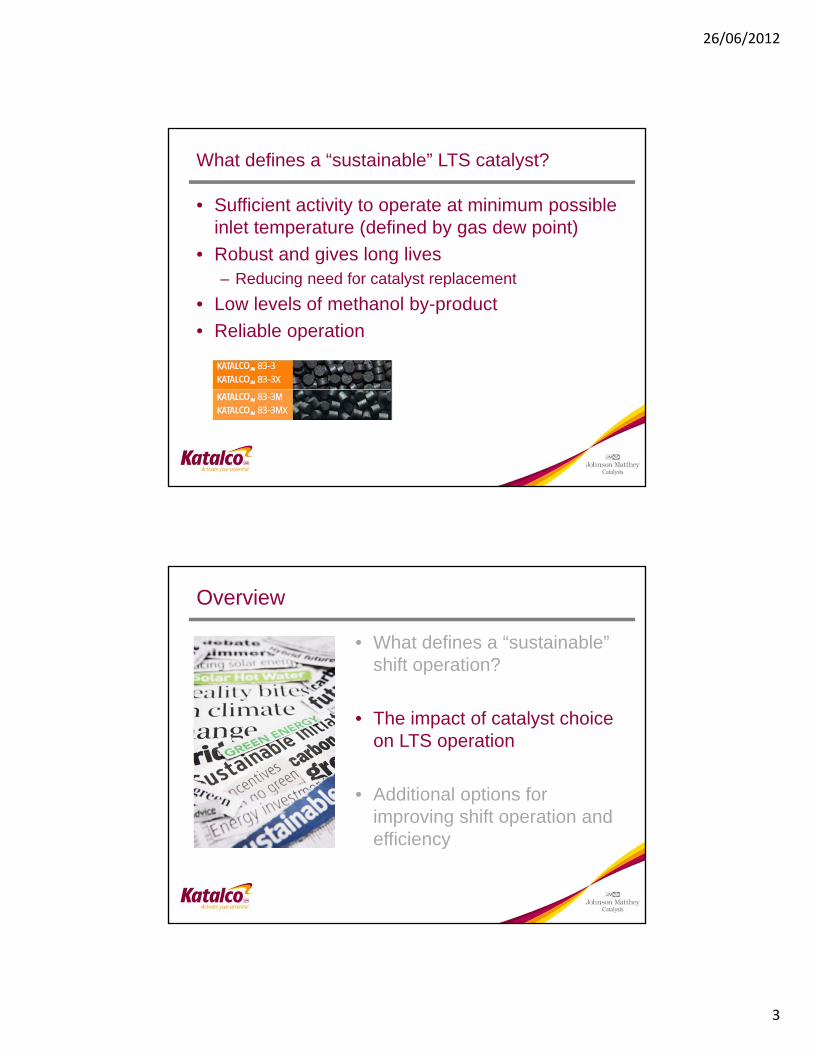
26/06/2012
3
What defines a “sustainable” LTS catalyst?
• Sufficient activity to operate at minimum possible inlet temperature (defined by gas dew point)
• Robust and gives long lives– Reducing need for catalyst replacement
• Low levels of methanol by-product
• Reliable operation
Overview
• What defines a “sustainable” shift operation?
• The impact of catalyst choice on LTS operation
• Additional options for improving shift operation and efficiency
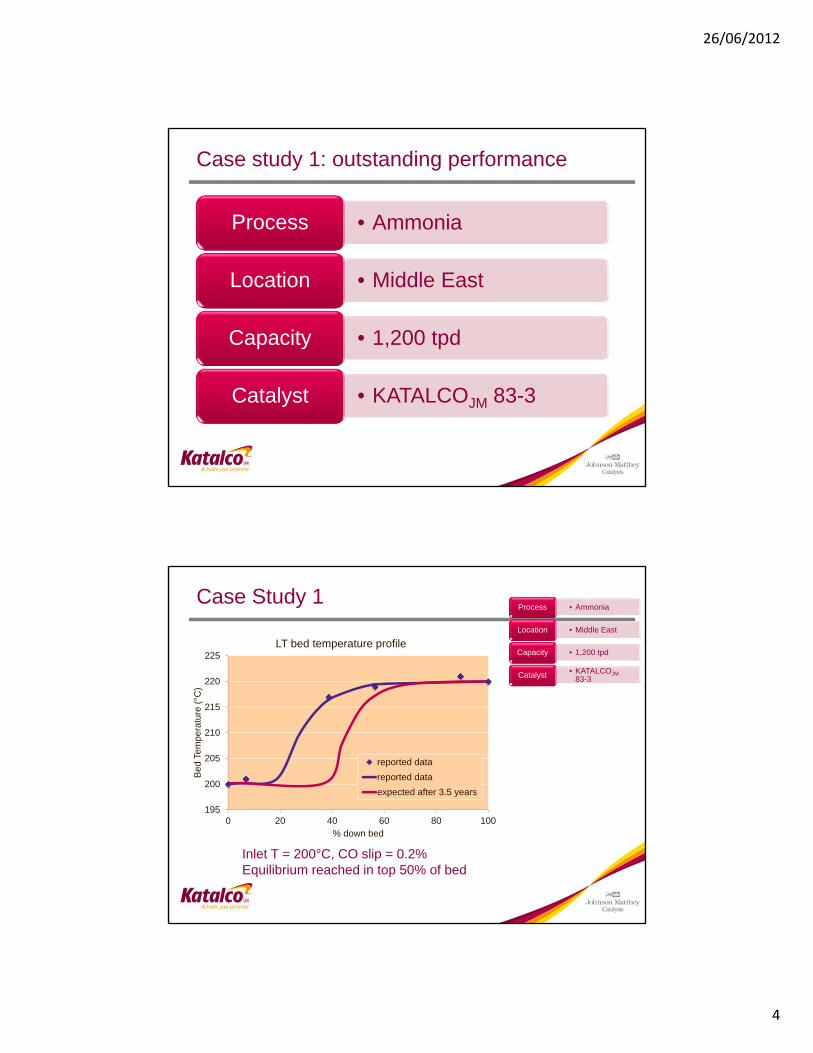
26/06/2012
4
Case study 1: outstanding performance
• AmmoniaProcess
• Middle EastLocation
• 1,200 tpdCapacity
• KATALCOJM 83-3Catalyst
Case Study 1• AmmoniaProcess
• Middle EastLocation
• 1,200 tpdCapacity
• KATALCOJM83-3Catalyst
Inlet T = 200°C, CO slip = 0.2% Equilibrium reached in top 50% of bed
195
200
205
210
215
220
225
0 20 40 60 80 100
Bed
Tem
pera
ture
(°C
)
% down bed
LT bed temperature profile
reported data
reported data
expected after 3.5 years

26/06/2012
5
Case study 2: low by-product methanol
• AmmoniaProcess
• EuropeLocation
• 1,500 tpdCapacity
• KATALCOJM 83-3XCatalyst
Case study 2
KATALCOJM 83-3X is proven to reduce methanol make by 85%
0
200
400
600
800
1000
0.0 0.2 0.4 0.6 0.8 1.0 1.2 1.4
Me
tha
nol
in c
on
de
nsat
e(p
pm
w) KATALCO JM 83 -3X Standard Catalyst
0
200
400
600
800
1000
0.0 0.2 0.4 0.6 0.8 1.0 1.2 1.4
time (years)
KATALCO JM 83 -3X Standard Catalyst
• AmmoniaProcess
• EuropeLocation
• 1,500 tpdCapacity
• KATALCOJM83-3XCatalyst
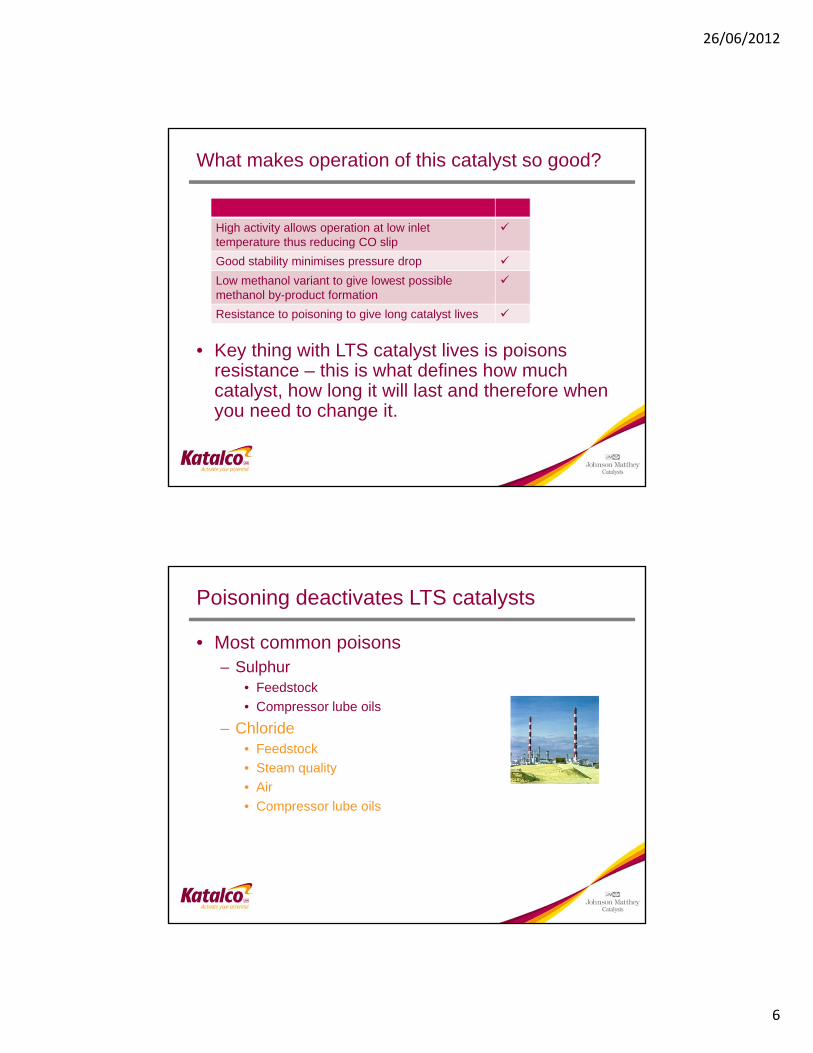
26/06/2012
6
What makes operation of this catalyst so good?
• Key thing with LTS catalyst lives is poisons resistance – this is what defines how much catalyst, how long it will last and therefore when you need to change it.
High activity allows operation at low inlet temperature thus reducing CO slip
Good stability minimises pressure drop
Low methanol variant to give lowest possible methanol by-product formation
Resistance to poisoning to give long catalyst lives
Poisoning deactivates LTS catalysts
• Most common poisons– Sulphur
• Feedstock
• Compressor lube oils
– Chloride• Feedstock
• Steam quality
• Air
• Compressor lube oils
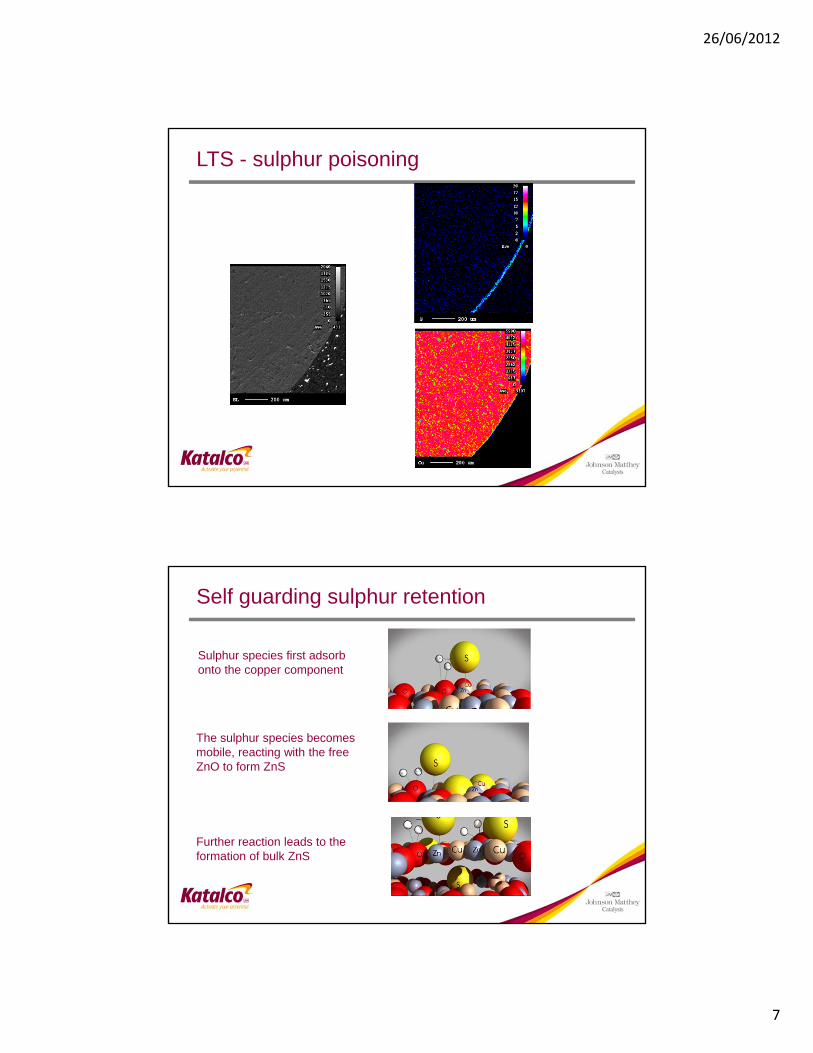
26/06/2012
7
LTS - sulphur poisoning
Self guarding sulphur retention
Sulphur species first adsorb onto the copper component
The sulphur species becomes mobile, reacting with the free ZnO to form ZnS
Further reaction leads to the formation of bulk ZnS
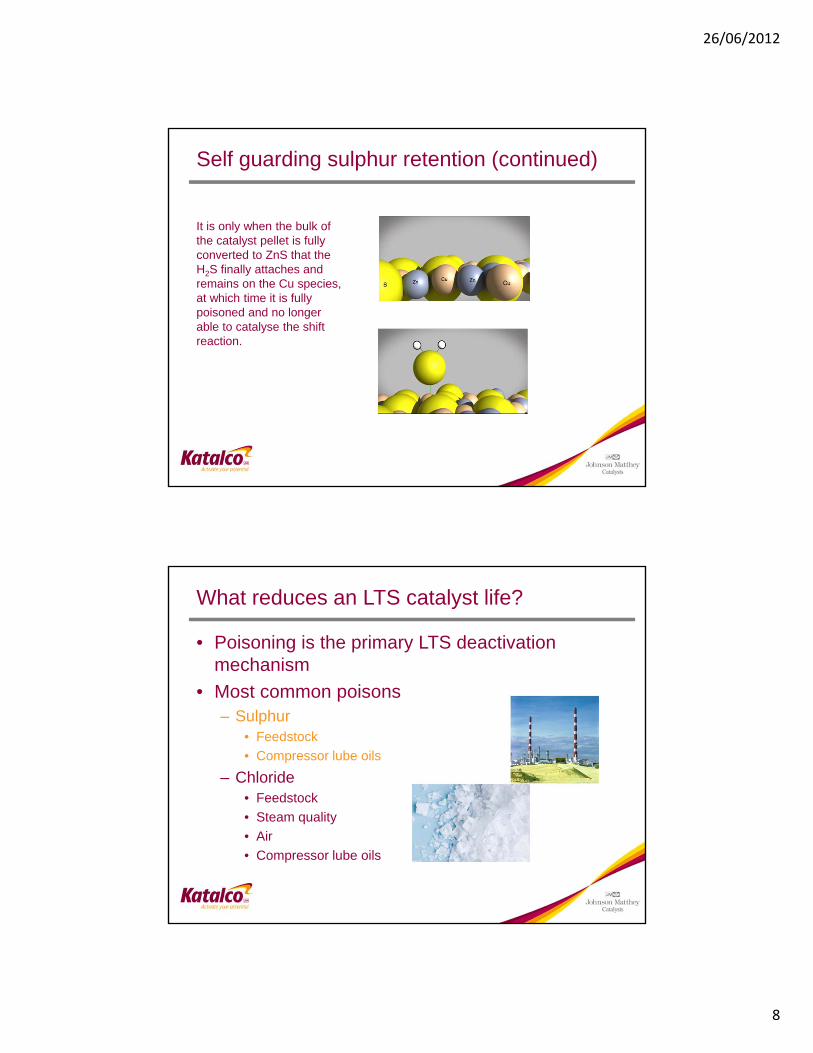
26/06/2012
8
Self guarding sulphur retention (continued)
It is only when the bulk of the catalyst pellet is fully converted to ZnS that the H2S finally attaches and remains on the Cu species, at which time it is fully poisoned and no longer able to catalyse the shift reaction.
What reduces an LTS catalyst life?
• Poisoning is the primary LTS deactivation mechanism
• Most common poisons– Sulphur
• Feedstock
• Compressor lube oils
– Chloride• Feedstock
• Steam quality
• Air
• Compressor lube oils
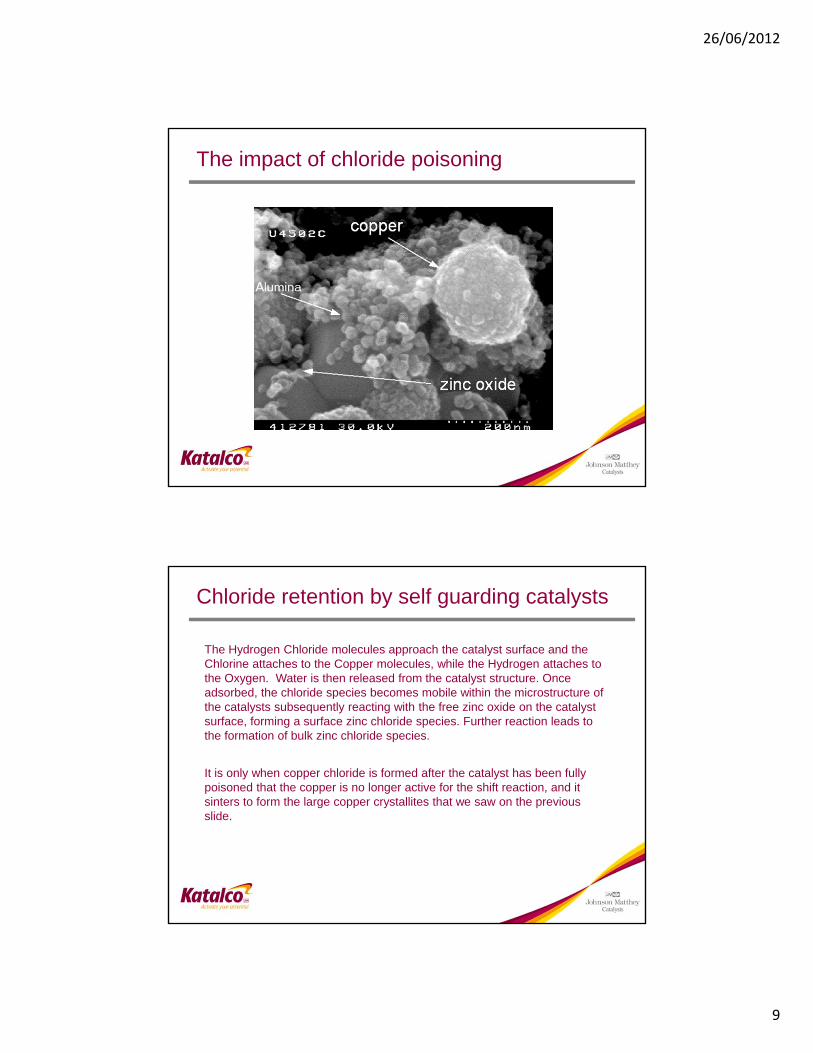
26/06/2012
9
The impact of chloride poisoning
Chloride retention by self guarding catalysts
The Hydrogen Chloride molecules approach the catalyst surface and the Chlorine attaches to the Copper molecules, while the Hydrogen attaches to the Oxygen. Water is then released from the catalyst structure. Once adsorbed, the chloride species becomes mobile within the microstructure of the catalysts subsequently reacting with the free zinc oxide on the catalyst surface, forming a surface zinc chloride species. Further reaction leads to the formation of bulk zinc chloride species.
It is only when copper chloride is formed after the catalyst has been fully poisoned that the copper is no longer active for the shift reaction, and it sinters to form the large copper crystallites that we saw on the previous slide.
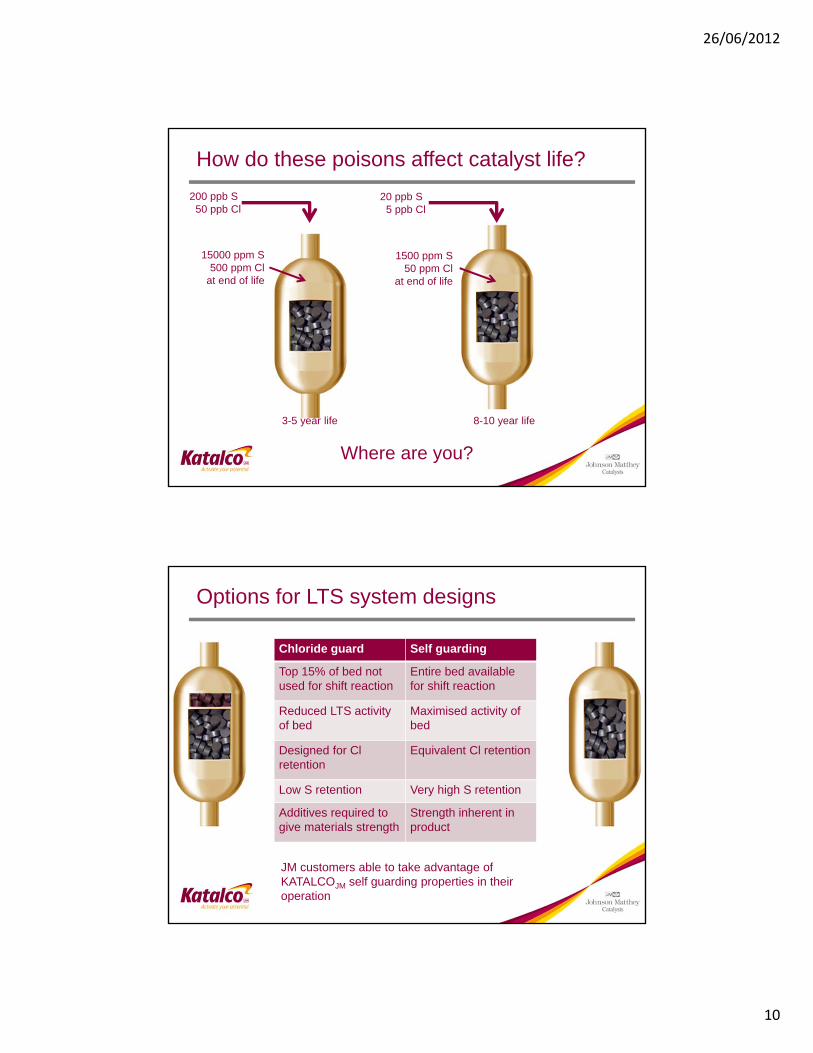
26/06/2012
10
How do these poisons affect catalyst life?
Where are you?
3-5 year life 8-10 year life
200 ppb S50 ppb Cl
20 ppb S5 ppb Cl
15000 ppm S500 ppm Cl
at end of life
1500 ppm S50 ppm Cl
at end of life
Options for LTS system designs
Chloride guard Self guarding
Top 15% of bed not used for shift reaction
Entire bed available for shift reaction
Reduced LTS activity of bed
Maximised activity of bed
Designed for Clretention
Equivalent Cl retention
Low S retention Very high S retention
Additives required to give materials strength
Strength inherent in product
JM customers able to take advantage of KATALCOJM self guarding properties in their operation
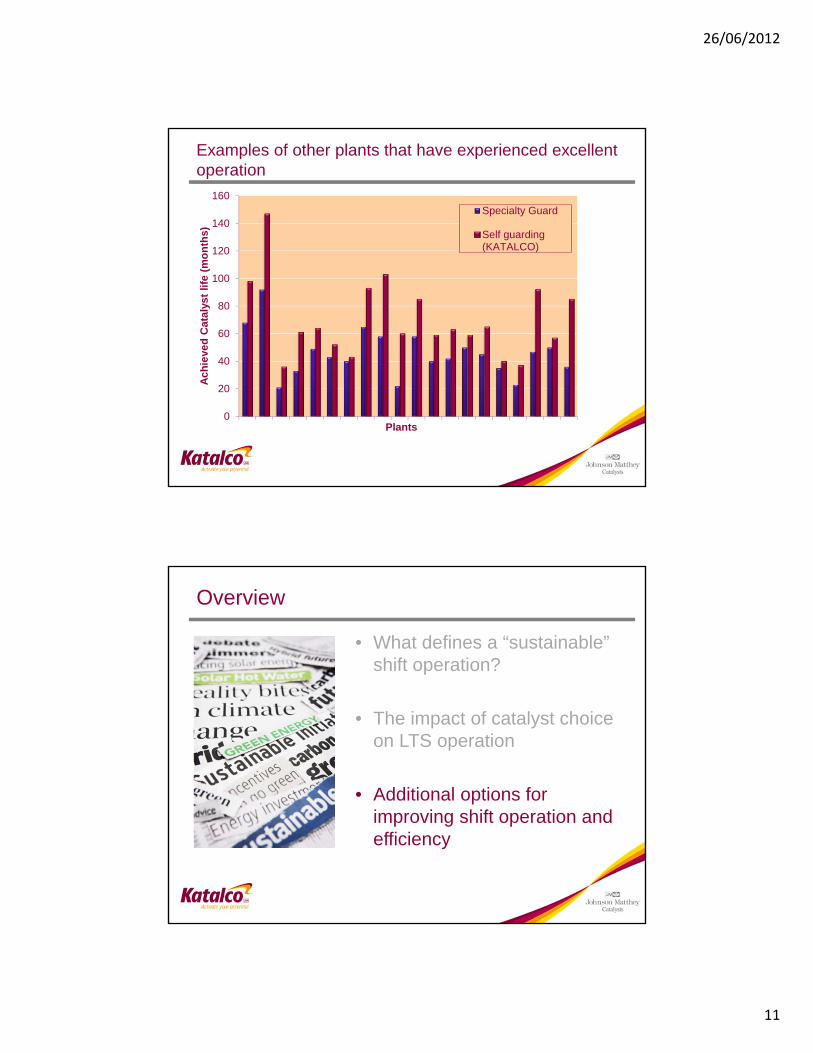
26/06/2012
11
Examples of other plants that have experienced excellent operation
0
20
40
60
80
100
120
140
160A
chie
ved
Cat
alys
t lif
e (m
on
ths)
Plants
Specialty Guard
Self guarding(KATALCO)
Overview
• What defines a “sustainable” shift operation?
• The impact of catalyst choice on LTS operation
• Additional options for improving shift operation and efficiency
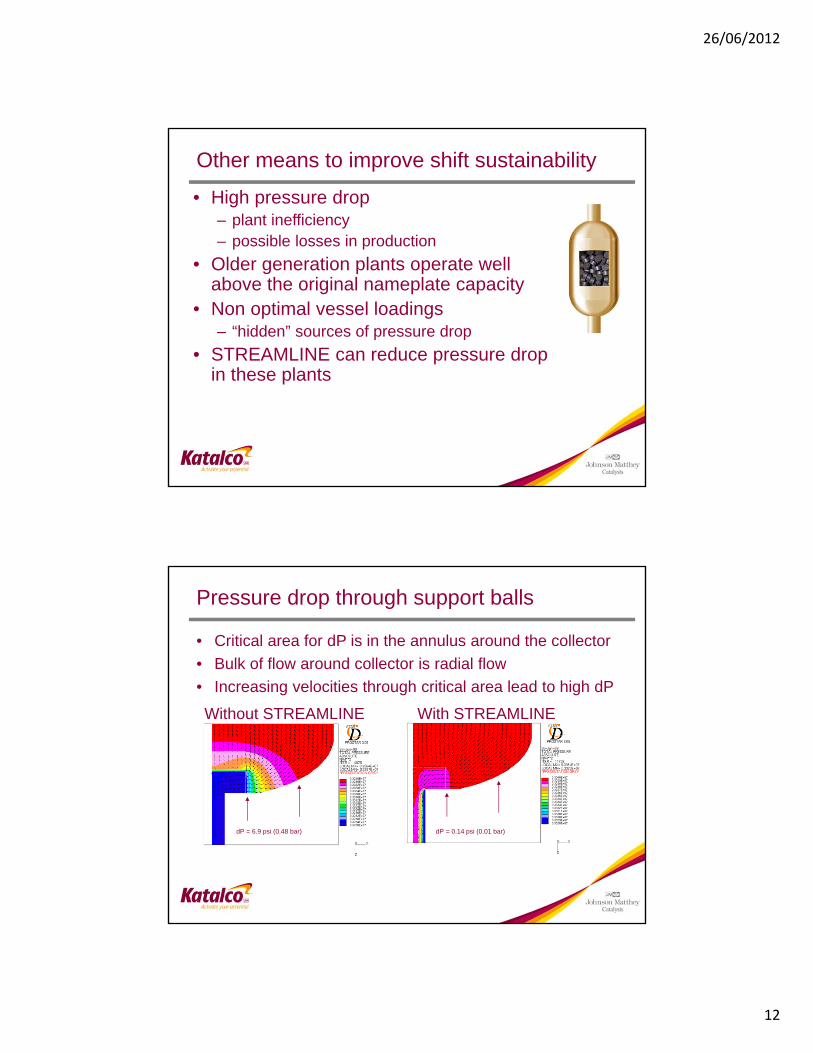
26/06/2012
12
• High pressure drop – plant inefficiency – possible losses in production
• Older generation plants operate well above the original nameplate capacity
• Non optimal vessel loadings – “hidden” sources of pressure drop
• STREAMLINE can reduce pressure drop in these plants
Other means to improve shift sustainability
Without STREAMLINE With STREAMLINE
dP = 6.9 psi (0.48 bar) dP = 0.14 psi (0.01 bar)
Pressure drop through support balls
• Critical area for dP is in the annulus around the collector
• Bulk of flow around collector is radial flow
• Increasing velocities through critical area lead to high dP
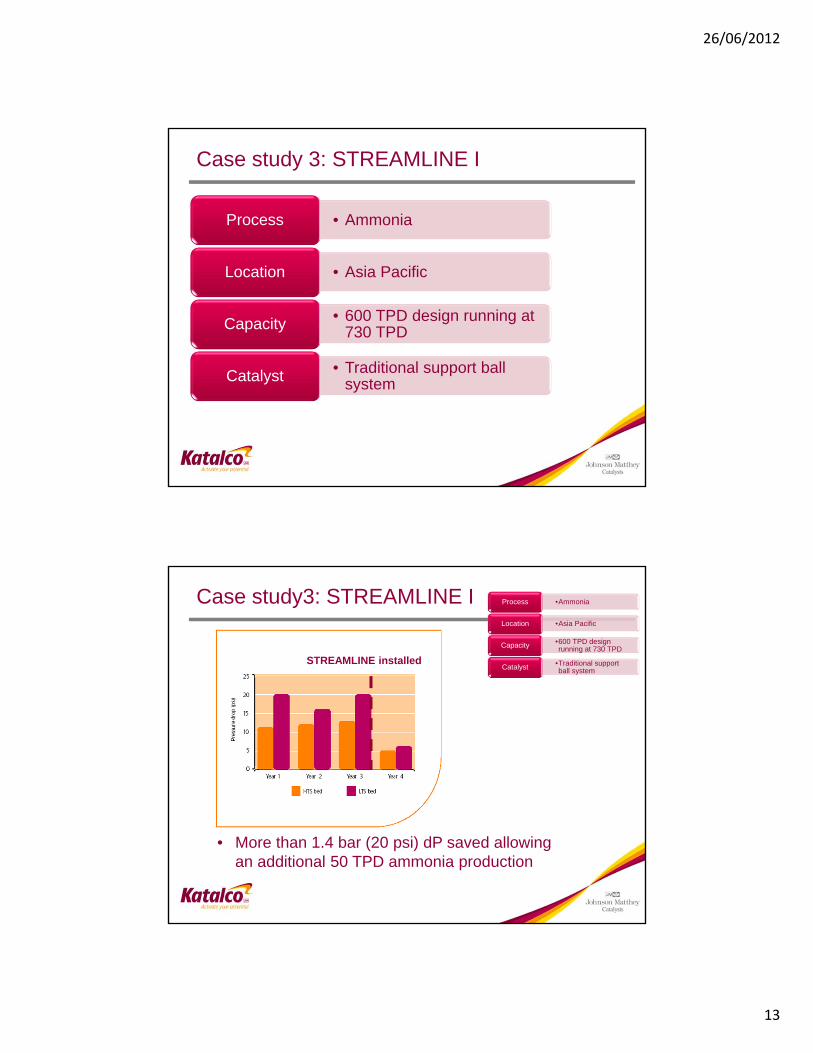
26/06/2012
13
Case study 3: STREAMLINE I
• AmmoniaProcess
• Asia PacificLocation
• 600 TPD design running at 730 TPDCapacity
• Traditional support ball systemCatalyst
• More than 1.4 bar (20 psi) dP saved allowing an additional 50 TPD ammonia production
STREAMLINE installed
Case study3: STREAMLINE I •AmmoniaProcess
•Asia PacificLocation
•600 TPD design running at 730 TPDCapacity
•Traditional support ball systemCatalyst
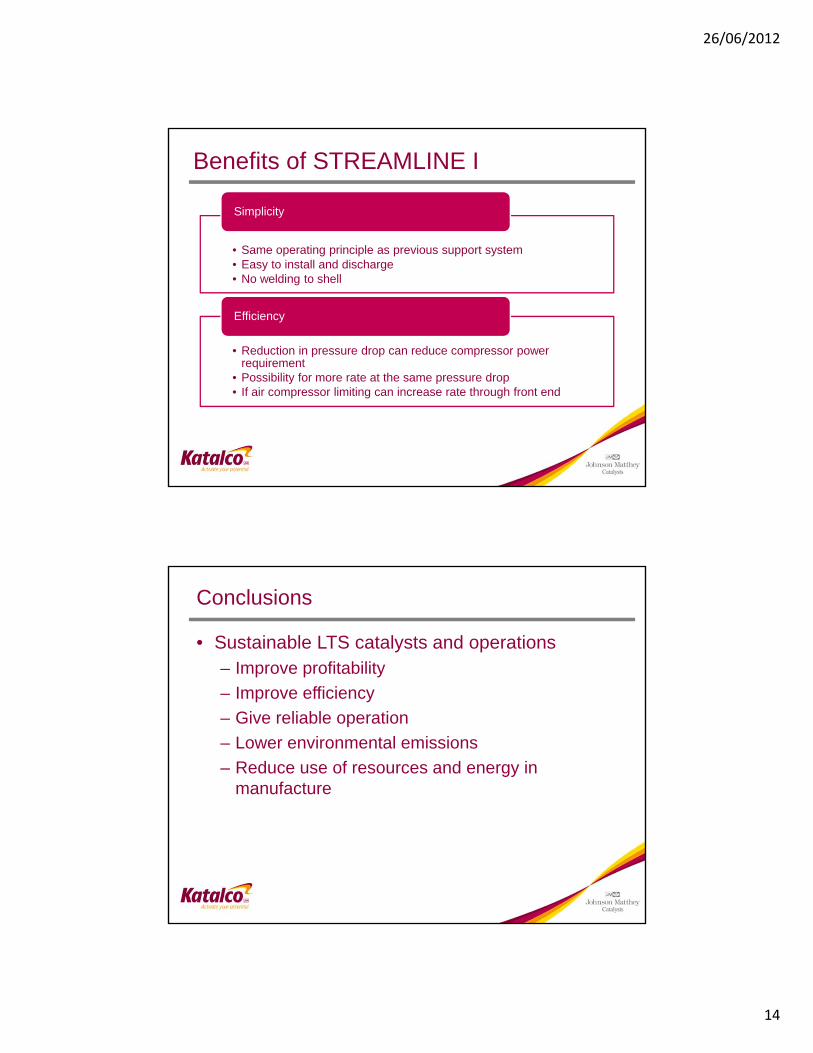
26/06/2012
14
Benefits of STREAMLINE I
• Same operating principle as previous support system• Easy to install and discharge• No welding to shell
Simplicity
• Reduction in pressure drop can reduce compressor power requirement
• Possibility for more rate at the same pressure drop• If air compressor limiting can increase rate through front end
Efficiency
Conclusions
• Sustainable LTS catalysts and operations– Improve profitability
– Improve efficiency
– Give reliable operation
– Lower environmental emissions
– Reduce use of resources and energy in manufacture
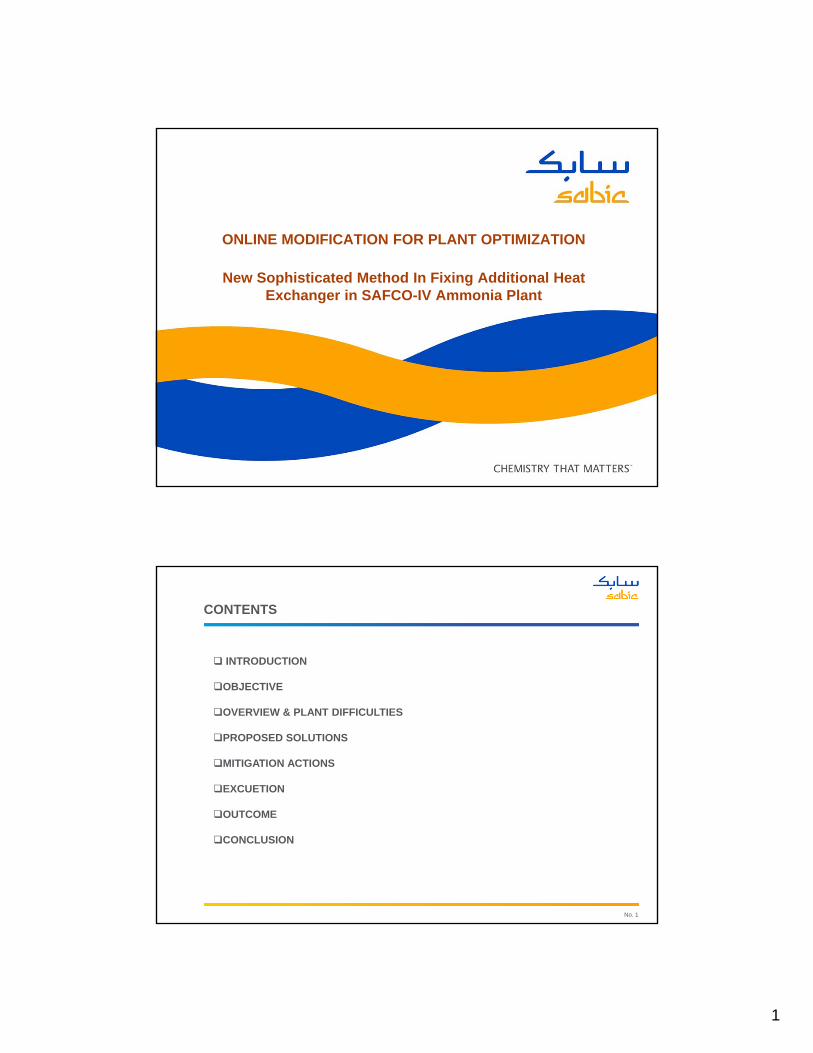
1
ONLINE MODIFICATION FOR PLANT OPTIMIZATION
New Sophisticated Method In Fixing Additional Heat Exchanger in SAFCO-IV Ammonia Plant
No. 1
CONTENTS
INTRODUCTION
OBJECTIVE
OVERVIEW & PLANT DIFFICULTIES
PROPOSED SOLUTIONS
MITIGATION ACTIONS
EXCUETION
OUTCOME
CONCLUSION
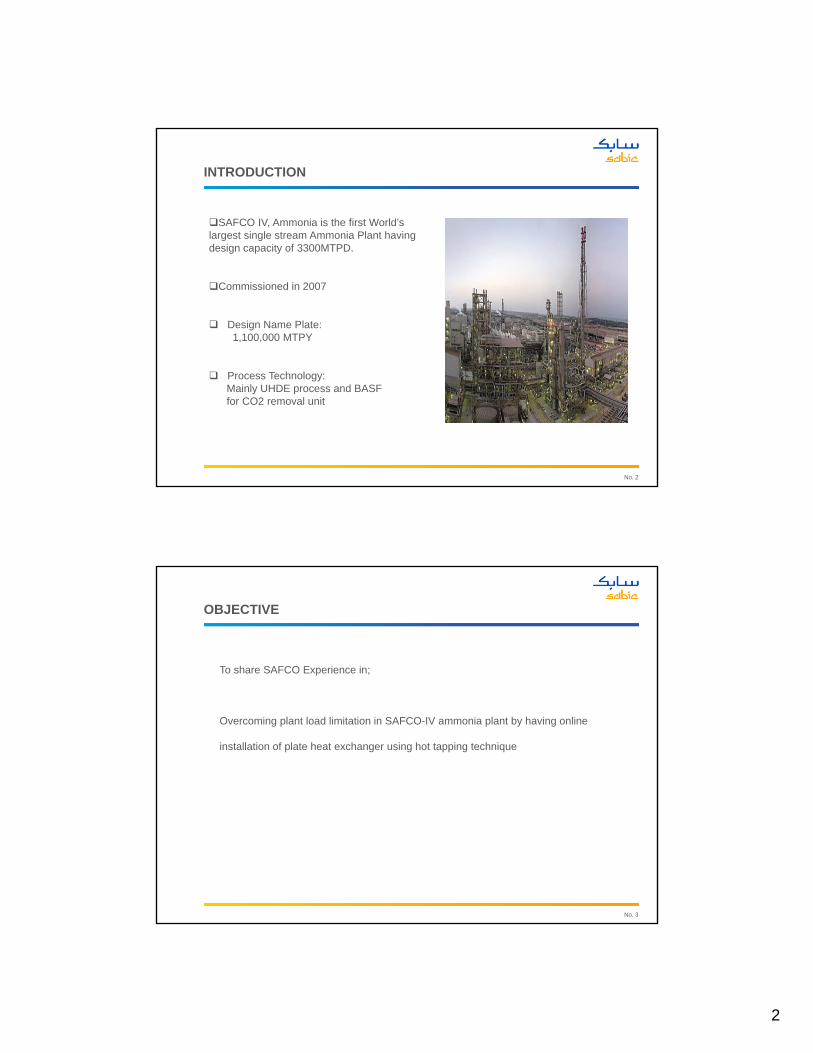
2
No. 2
SAFCO IV, Ammonia is the first World’s largest single stream Ammonia Plant having design capacity of 3300MTPD.
Commissioned in 2007
Design Name Plate: 1,100,000 MTPY
Process Technology:Mainly UHDE process and BASF for CO2 removal unit
INTRODUCTION
No. 3
OBJECTIVE
To share SAFCO Experience in;
Overcoming plant load limitation in SAFCO-IV ammonia plant by having online
installation of plate heat exchanger using hot tapping technique
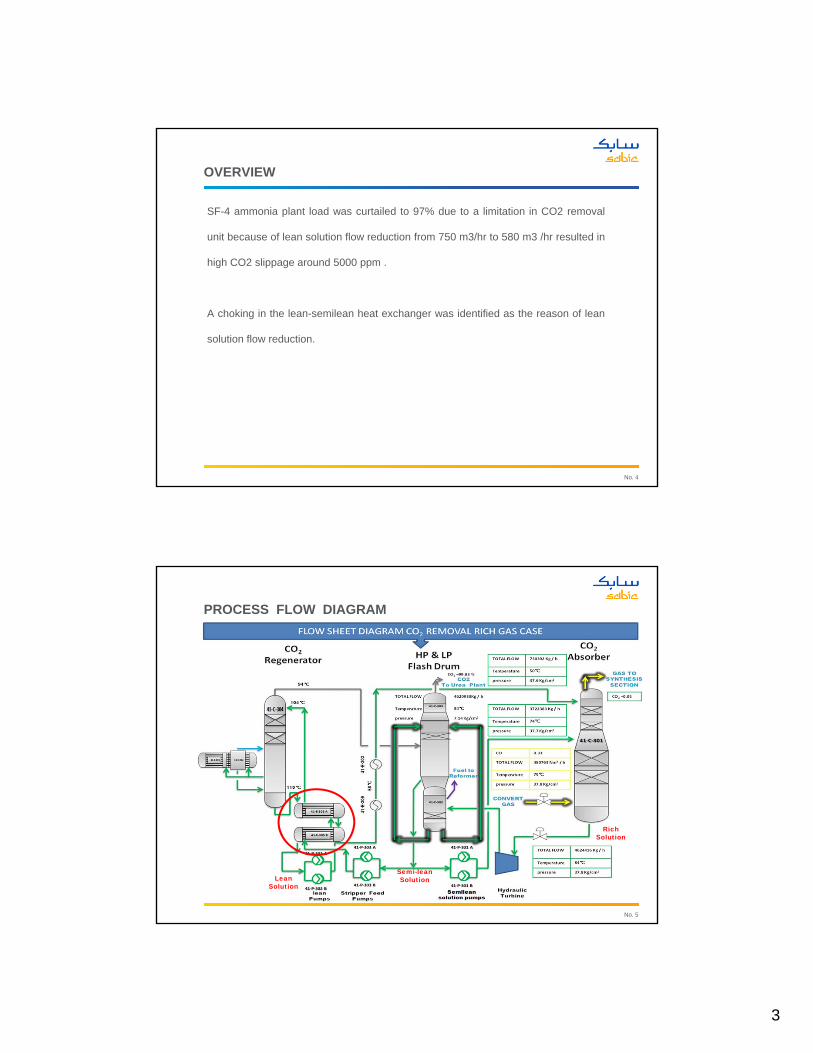
3
No. 4
OVERVIEW
SF-4 ammonia plant load was curtailed to 97% due to a limitation in CO2 removal
unit because of lean solution flow reduction from 750 m3/hr to 580 m3 /hr resulted in
high CO2 slippage around 5000 ppm .
A choking in the lean-semilean heat exchanger was identified as the reason of lean
solution flow reduction.
No. 5
PROCESS FLOW DIAGRAM
Semi-lean Solution Lean
Solution
RichSolution
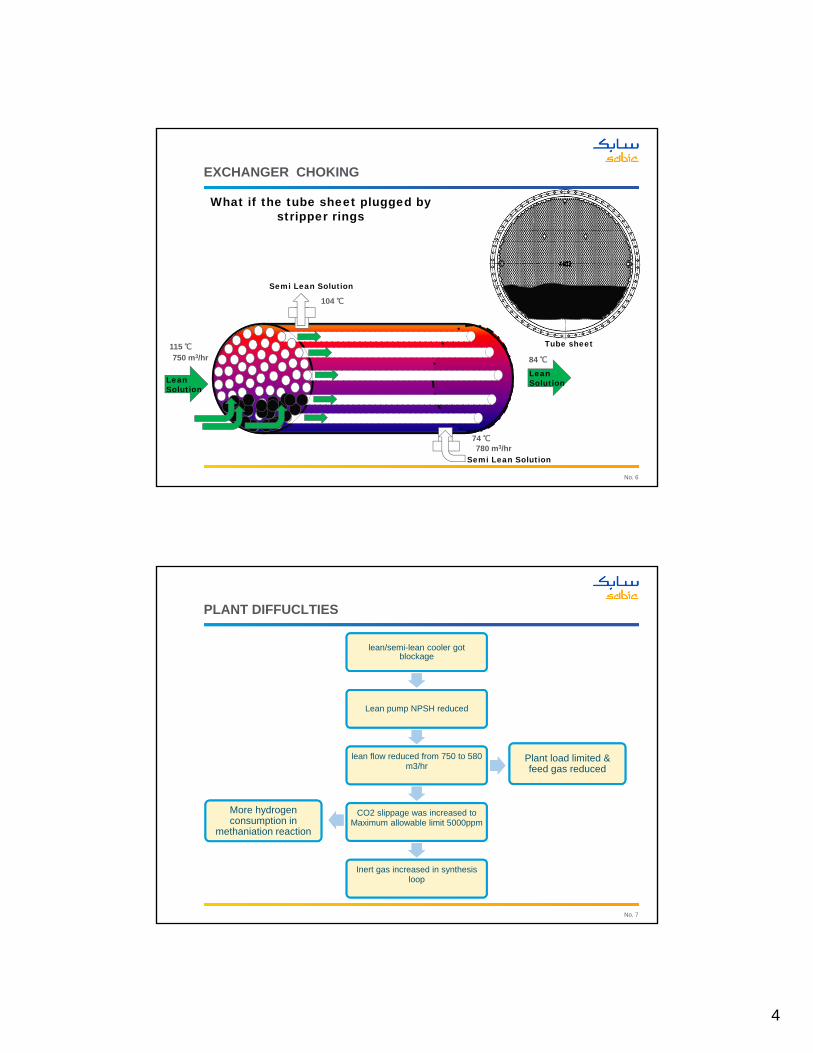
4
No. 6
EXCHANGER CHOKING
Tube sheet
Semi Lean Solution
Semi Lean Solution
Lean Solution
Lean Solution
104 ℃
115 ℃
74 ℃780 m3/hr
750 m3/hr 84 ℃
Normal OperationWhat if the tube sheet plugged by stripper rings
No. 7
PLANT DIFFUCLTIES
lean/semi-lean cooler got blockage
Lean pump NPSH reduced
lean flow reduced from 750 to 580 m3/hr
CO2 slippage was increased to Maximum allowable limit 5000ppm
Inert gas increased in synthesis loop
Plant load limited & feed gas reduced
More hydrogen consumption in
methaniation reaction
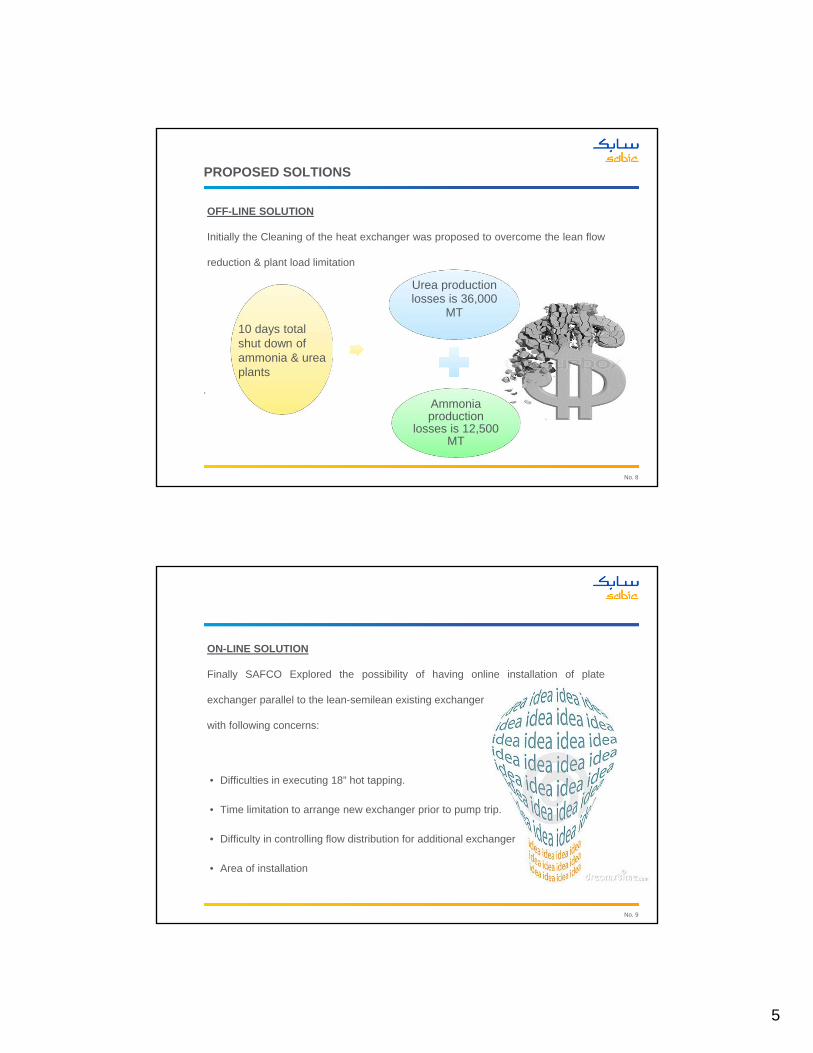
5
No. 8
PROPOSED SOLTIONS
OFF-LINE SOLUTION
Initially the Cleaning of the heat exchanger was proposed to overcome the lean flow
reduction & plant load limitation
.
Urea production losses is 36,000
MT
Ammonia production
losses is 12,500 MT
10 days total shut down of ammonia & urea plants
No. 9
ON-LINE SOLUTION
Finally SAFCO Explored the possibility of having online installation of plate
exchanger parallel to the lean-semilean existing exchanger
with following concerns:
• Difficulties in executing 18” hot tapping.
• Time limitation to arrange new exchanger prior to pump trip.
• Difficulty in controlling flow distribution for additional exchanger
• Area of installation
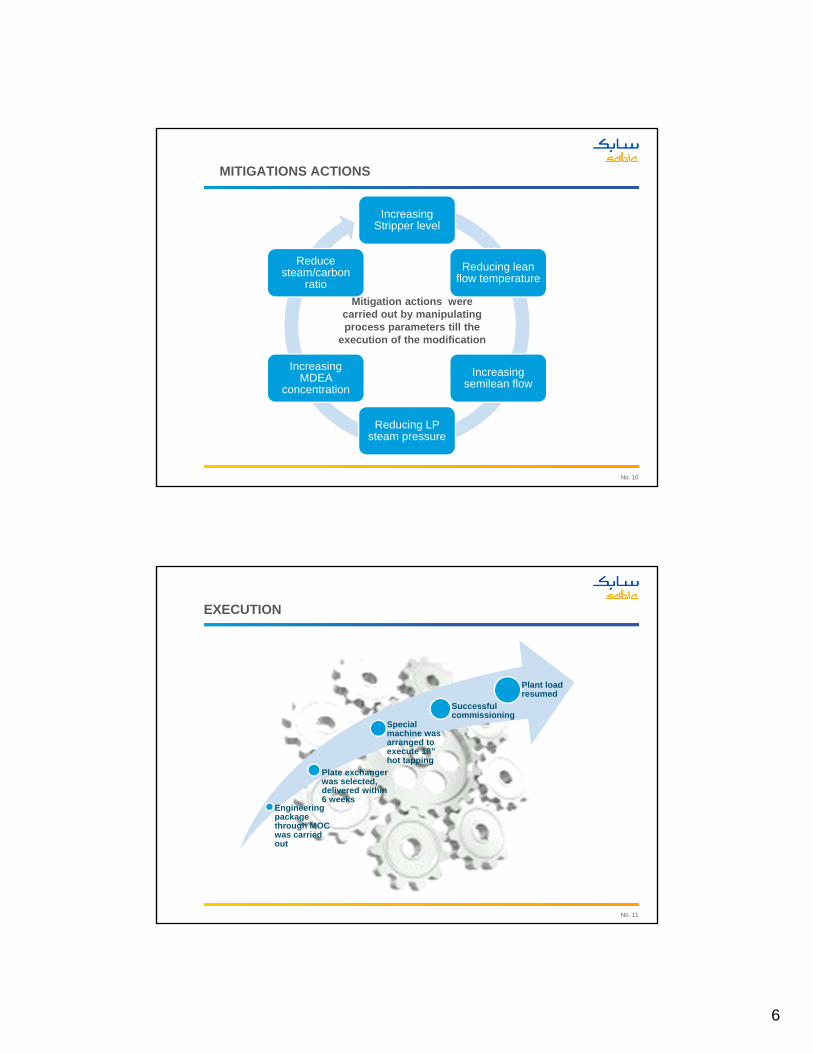
6
No. 10
MITIGATIONS ACTIONS
Increasing Stripper level
Reducing lean flow temperature
Increasing semilean flow
Reducing LP steam pressure
Increasing MDEA
concentration
Reduce steam/carbon
ratio
Mitigation actions were carried out by manipulating process parameters till the
execution of the modification
No. 11
Engineering package through MOC was carried out
Plate exchanger was selected, delivered within 6 weeks
Special machine was arranged to execute 18” hot tapping
Successful commissioning
Plant load resumed
EXECUTION
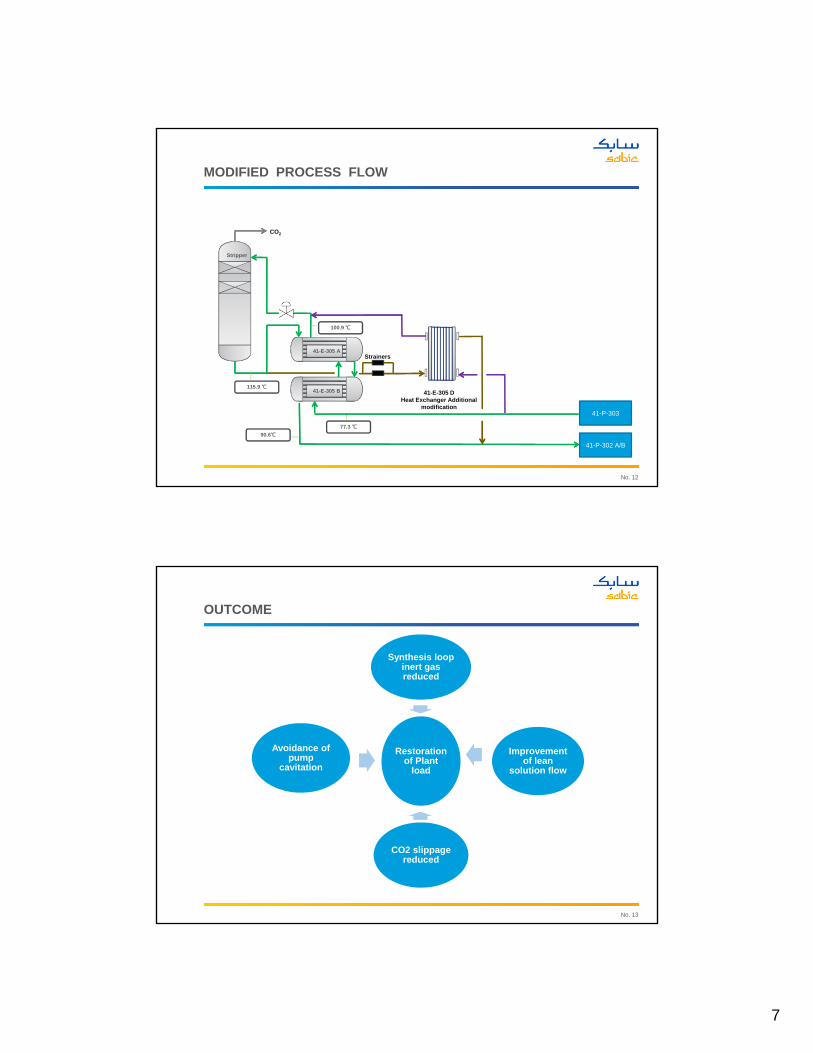
7
No. 12
41-E-305 DHeat Exchanger Additional
modification
Strainers
41-P-303
41-P-302 A/B
41-E-305 A
41-E-305 B
Stripper
115.9 ℃
100.9 ℃
77.3 ℃90.6℃
CO2
MODIFIED PROCESS FLOW
No. 13
OUTCOME
Restoration of Plant
load
Synthesis loop inert gas reduced
Improvement of lean
solution flow
CO2 slippage reduced
Avoidance of pump
cavitation
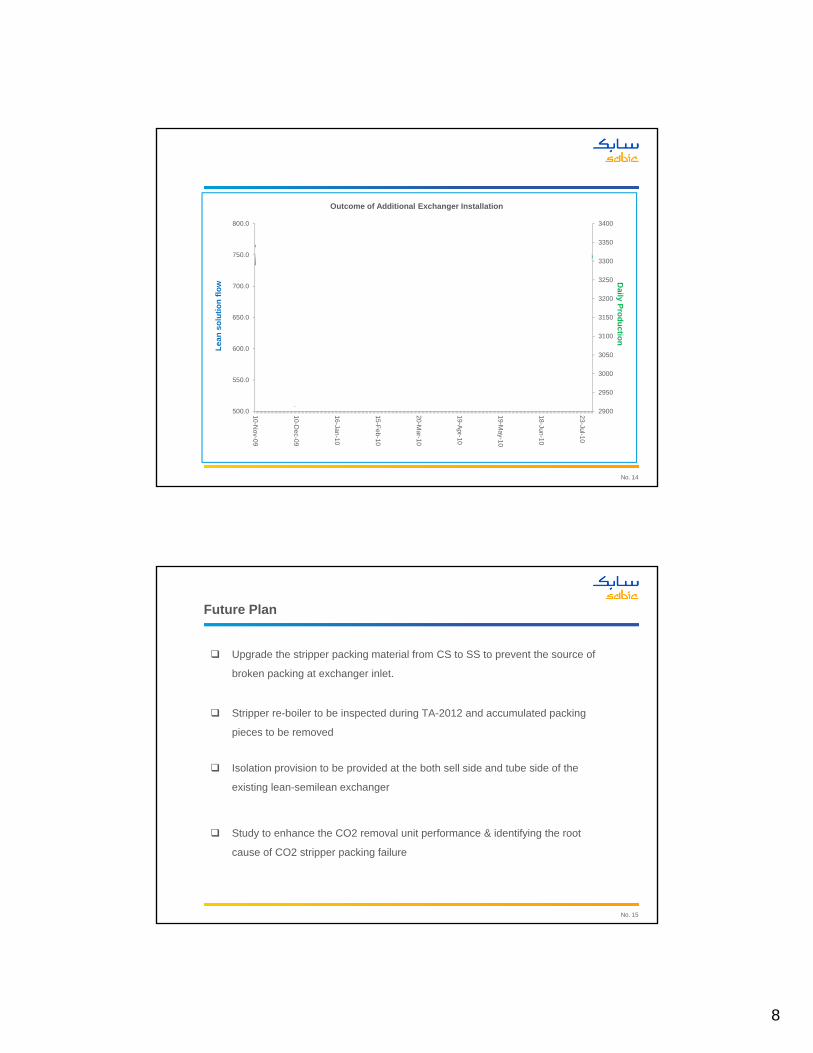
8
No. 14
2900
2950
3000
3050
3100
3150
3200
3250
3300
3350
3400
500.0
550.0
600.0
650.0
700.0
750.0
800.0
10-N
ov-09
10-D
ec-09
16-Jan
-10
15-F
eb-10
20-M
ar-10
19-A
pr-10
19-M
ay-10
18-Jun
-10
23-Jul-10
Lean solution flow
Daily Production
Outcome of Additional Exchanger Installation
Lea
n s
olu
tio
n f
low
Daily P
rod
uctio
n
Plate type heat exchanger of full capacity
installed at the bypass of
41-E-305A/B
No. 15
Future Plan
Upgrade the stripper packing material from CS to SS to prevent the source of
broken packing at exchanger inlet.
Stripper re-boiler to be inspected during TA-2012 and accumulated packing
pieces to be removed
Isolation provision to be provided at the both sell side and tube side of the
existing lean-semilean exchanger
Study to enhance the CO2 removal unit performance & identifying the root
cause of CO2 stripper packing failure
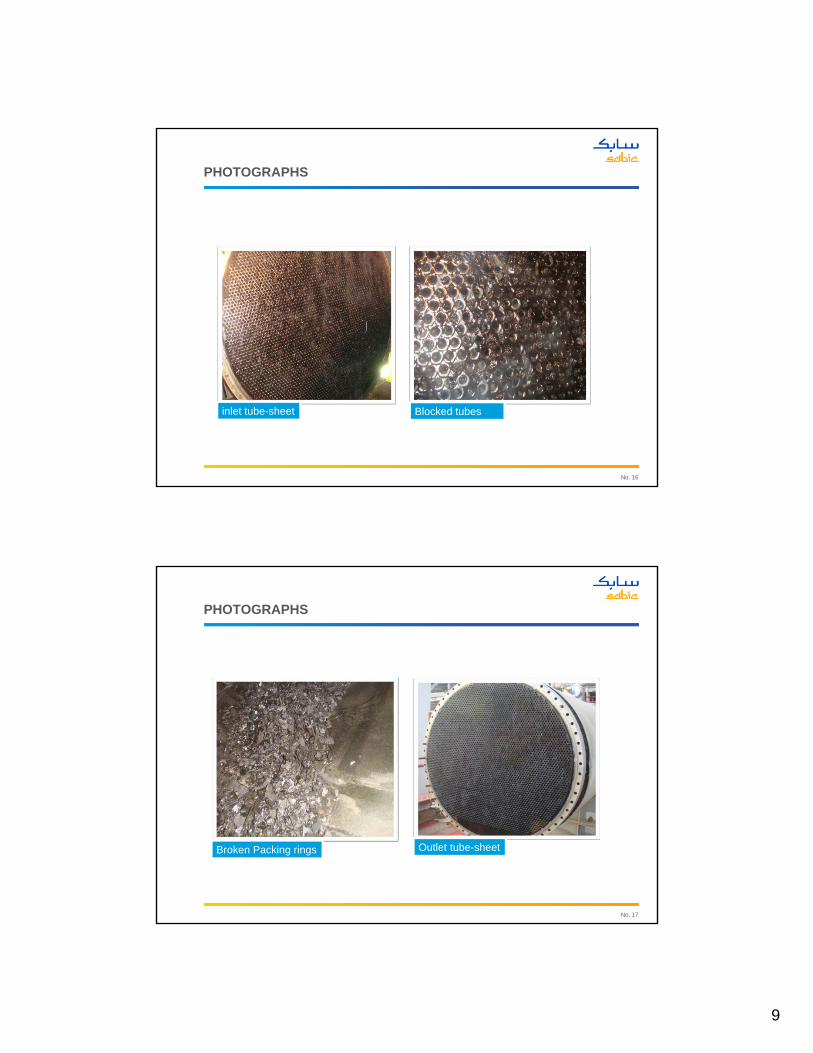
9
No. 16
Blocked tubesinlet tube-sheet
PHOTOGRAPHS
No. 17
Broken Packing rings Outlet tube-sheet
PHOTOGRAPHS

10
No. 18
Conclusion
Daily Ammonia production restored back from 3180 MTPD to normal 3345 MTPD.
Ten days estimated shut down to clean existing heat exchanger was averted.
Total financial benefit from this idea execution was 19.85 million USD.
No. 19
-
-
Economics of synthesis gas generation concepts
for substantial capacity enlargements of ammonia plants
by
Dr. Joachim Johanning
ThyssenKrupp Uhde GmbH
Dortmund, Germany
Prepared for Presentation at
25th AFA International Fertilizer Conference and Exhibition
Dubai
July 9 - 11, 2012
– 2 –
ABSTRACT
Capacity enlargements of production facilities such as ammonia plants offer their owners the opportunity to increase turnover and revenue in moderate steps. In principal, capacity expansions involve considerably smaller risks than the erection of a new plant. The overall investments are much smaller, project implementations take less time and the amounts of extra product for which customers have to be found are limited. In many cases, capacity enlargements are economical and therefore attractive to plant operators.
For newly commissioned ammonia plants capacity expansions up to about 15% above nameplate capacity can usually be realized with fairly moderate costs. Only a few equip-ment items within the entire plants usually constitute bottlenecks and require more signi-ficant measures.
Further capacity increases are feasible and in many cases still economical but usually re-quire substantial upgrading of growing numbers of the process units. Such capacity expan-sions are therefore considerably more expensive in relative terms, i.e. related to the addi-tional amount of product. Hence, it is ever more important to select the most cost effective solution.
The presentations looks at the economics of alternative concepts for an additional 30% capacity increase of an existing ammonia plant which had already been subjected to ex-pansions. The investigation concentrates on the syngas generation section and compares alternatives such as enlargement of the existing steam reformer and an autothermal re-former (ATR) in parallel to the existing syngas generation. The results show that - even in this capacity range - oxygen-based syngas generation concepts are competitive if all fac-tors contributing to overall revamp costs are accounted for.
Contents:
Introduction
Target of the investigation
Basics of capacity enlargements
Compared process concepts
Results of the economical comparison
Operating costs
Capital costs
CAPEX / OPEX comparison
Summary
– 3 –
INTRODUCTION
The paper presents the results of an extensive investigation carried out by ThyssenKrupp Uhde to establish an economic ranking for several different process concepts applicable to achieve significant capacity expansions in natural gas based ammonia production plants.
In general, capacity enlargements can be an attractive option to plant owners to generate increased revenue with considerable less risk compared to the erection of new plants. The required investments are significantly smaller, the project implementation times are much shorter and – since the extra capacity is limited – there is less danger that the markets will not absorb the additional product when the new capacity comes on-stream.
The investigation was based on the scenario that the plant to be upgraded has already un-dergone capacity expansions which used up the reserves in the existing process equip-ment as well as all options to achieve larger capacities of the process units which consti-tute the bottlenecks with limited modifications. In such cases considerably larger number of process units have to be upgraded to increase plant capacity further. As will be shown, on-ly significant capacity enlargements such as the 30% increase targeted in this investigation can be economically justified.
TARGET OF THE INVESTIGATION
The investigation was carried out to generate reliable data about the economic viability of oxygen based reforming in ammonia plants, especially in the situation of capacity expan-sions of existing plants.
So far fully autothermal reforming is seldom applied in natural gas based ammonia plants. Most of these plants use an autothermal reforming step in their secondary reformers usual-ly operated with plain air. The split of reforming duties between the externally heated pri-mary reformer and the autothermal secondary reformer is dictated by the oxygen content of the ambient air.
Process schemes using larger shares of autothermal reforming such as the Purifier and KRES concepts from KBR or the GHR / secondary reformer concept by Johnson Matthey have so far not really established themselves in the market. This is also valid for process concepts entirely based on autothermal reforming such as the Megammonia Process from Lurgi / Casale.
ThyssenKrupp Uhde has investigated this subject with respect to newly built plants and reported the conclusions at the Nitrogen & Syngas Conference 2010 in Bahrain. The main result of our analysis was that fully ATR-based ammonia plants can be expected to have investment cost advantages compared to plants based on the conventional steam reformer / secondary reformer concept at very large capacities.
Given the natural uncertainty inherent in such investigations it can be said that the capacity range with similar capital costs for both process schemes is likely to extend from 3500 to 4500 mtpd, i.e. little above the capacities of the SAFCO IV and Ma’aden ammonia plants.
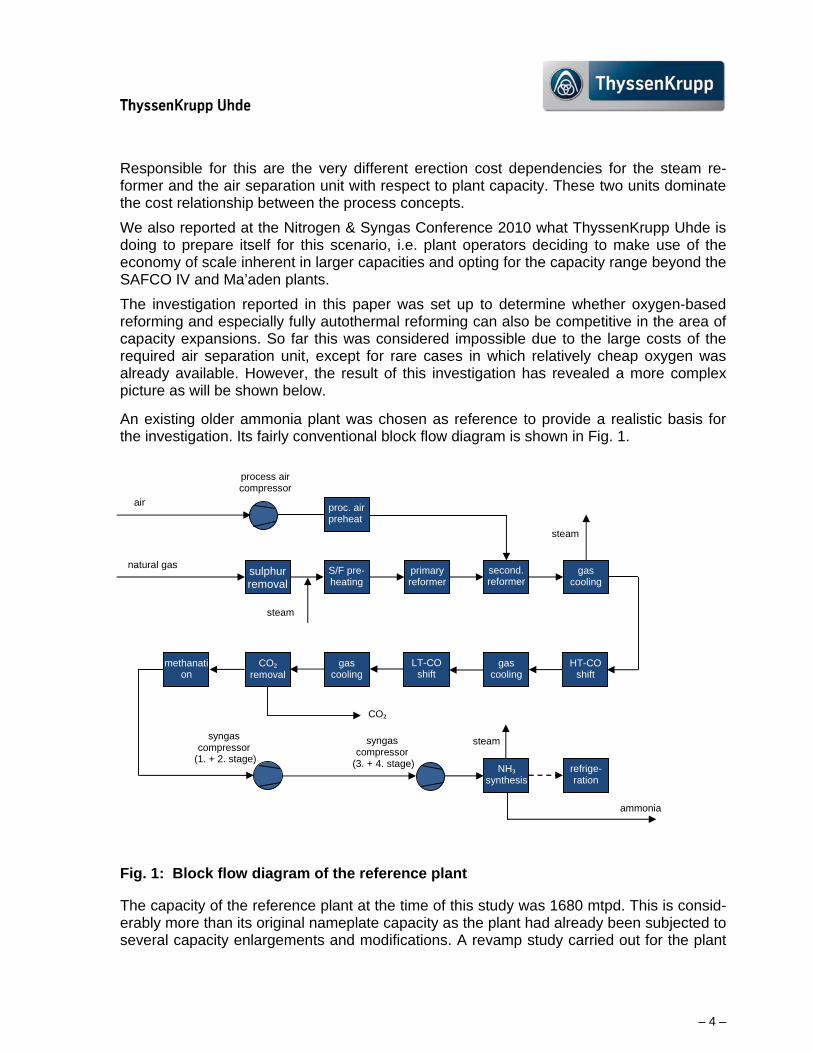
– 4 –
Responsible for this are the very different erection cost dependencies for the steam re-former and the air separation unit with respect to plant capacity. These two units dominate the cost relationship between the process concepts.
We also reported at the Nitrogen & Syngas Conference 2010 what ThyssenKrupp Uhde is doing to prepare itself for this scenario, i.e. plant operators deciding to make use of the economy of scale inherent in larger capacities and opting for the capacity range beyond the SAFCO IV and Ma’aden plants.
The investigation reported in this paper was set up to determine whether oxygen-based reforming and especially fully autothermal reforming can also be competitive in the area of capacity expansions. So far this was considered impossible due to the large costs of the required air separation unit, except for rare cases in which relatively cheap oxygen was already available. However, the result of this investigation has revealed a more complex picture as will be shown below.
An existing older ammonia plant was chosen as reference to provide a realistic basis for the investigation. Its fairly conventional block flow diagram is shown in Fig. 1.
Fig. 1: Block flow diagram of the reference plant
The capacity of the reference plant at the time of this study was 1680 mtpd. This is consid-erably more than its original nameplate capacity as the plant had already been subjected to several capacity enlargements and modifications. A revamp study carried out for the plant
sulphur removal
S/F pre-heating
primary reformer
second. reformer
gas cooling
air
ammonia
steam
methanation
CO2 removal
gas cooling
LT-CO shift
gas cooling
HT-CO shift
refrige-ration
NH3 synthesis
natural gas
steam
steam
process air compressor
syngas compressor
(1. + 2. stage)
syngas compressor
(3. + 4. stage)
proc. air preheat.
CO2
– 5 –
had shown that only limited potential for additional capacity was available in the existing equipment.
In view of this an expansion target of 30% extra capacity was chosen. The investigation was to show the ranking of the different expansion concepts for the gas generation section. Therefore, only one process concept was applied to extend the capacity of the ammonia synthesis.
BASICS OF CAPACITY ENLARGEMENTS
Extending the capacity of a chemical process plant in general requires a larger throughput of the feedstock(s), resulting in larger flowrates in almost every part of the plant. The larger flowrates have to be treated in the same manner as in the original plant. This requires the following measures:
Larger process gas flowrates
If no measures are taken to increase cross sectional areas along the flowpath the larger flowrates inevitably increase pressure losses. Higher pressure drop means higher loads on compressors and drivers. A 30% increase in volume flowrates associated with the envisaged capacity expansion would result in an almost 70 % higher pressure drop across the synthesis gas generation section. Hence, it is worthwhile to look at options to mitigate the effect of higher flowrates on pressure losses.
In principal, a higher natural gas inlet pressure could compensate the additional pres-sure drop in the gas generation section. However, in most cases the potential for this will be rather limited as the equipment design pressures are usually directly related to their original operating pressure levels.
With respect to pressure drop the arrangement of additional equipment parallel to exist-ing equipment is obviously preferable compared to sequential arrangement. Parallel ar-rangements require more elaborate piping and additional flow control devices to assure the desired flow distribution. Hence, the superior solution is usually more costly.
In some cases changes of reactor concepts from axial to radial flow of the process gas through the catalyst beds may still be an option.
Transfer of the larger amounts of heat
The larger heat duties which have to be transfered to or extracted from the process gas can be met via expansions of the heat transfer surfaces, improved heat transfer coeffi-cients or larger temperature differences. In certain areas a change in outlet tempera-tures caused by larger temperature differences can be tolerated, e.g. if the associated effects are simply moderate drops in plant energy consumption.
Analyses of the various reaction steps
Every catalyst deteriorates and looses activity with time. Larger flowrates speed up this ageing process. Hence, if no further measures are taken, reductions in service life of the catalyst charges are to be expected after revamp implementation.
– 6 –
This effect can be compensated for via a more active catalyst or larger catalyst vol-umes. Obviously, what can be done and what is economical to do depends on the indi-vidual state of each reactor. In many cases – as in the one reported in this paper – it may be appropriate to leave the CO conversion and the methanation reactors as they are and accept the reduction catalyst service life.
Since the increased flowrates inflict higher fluid forces to the catalyst particles in the beds it should be checked for each reactor that this effect does not lead to significant movement of the top layer of the catalyst bed or even fluidization and the associated grinding effect, generating dust and mechanical deterioration.
Separation of species down to required levels
In several process steps of an ammonia plant separation of undesired species from the process gas takes place. The most critical area is the CO2 removal. However, there are several other unit operations such as the desulphurization as well as the removal of wa-ter in the process air compression, downstream of the CO conversion or during synthe-sis gas compression and last but not least the separation of the produced ammonia from the recycle gas in the ammonia synthesis.
All these process steps have been designed for certain volume flowrates. Once their capacities are exceeded, they usually respond with fast drops in performance, i.e. with sharp rises in outlet concentration of the species to be removed. Also, some undesired effects may be observed such as entrainment of liquid into the process gas.
COMPARED PROCESS CONCEPTS
AMMONIA SYNTHESIS
Since the main focus of this work is to look explicitly on concepts for the syngas generation section, only one process concept has been employed to rise the capacity of the ammonia synthesis. The basis of this approach is TK Uhde’s Dual-Pressure-Concept. Its main fea-ture is an additional once-through (OT) synthesis converter at an intermediate pressure level between synthesis generation and ammonia synthesis.
Fig. 2 contains a block flow diagram of the upgraded plant's back-end. The dark symbols represent the existing equipment, the brighter symbols with broken edges indicate the re-quired new items.
For the envisaged relatively large capacity expansion it can be assumed that the synthesis compressor will not be able to cope with the significantly larger flowrate. Hence, an auxilia-ry compressor parallel to the first and second stage of the existing syngas compressor has been selected, essentially taking the additonal gas up to the intermediate pressure level.
The additional syngas is then mixed with the gas coming from the second stage of the ex-isting syngas compressor and the combined gas is then passed through the OT synthesis. This process unit comprises of a gas/gas heat exchanger to provide the elevated converter inlet temperature, the actual OT synthesis converter, a steam generator / boiler feed water preheater and a final cooling train. This sequence of coolers takes the process gas tem-
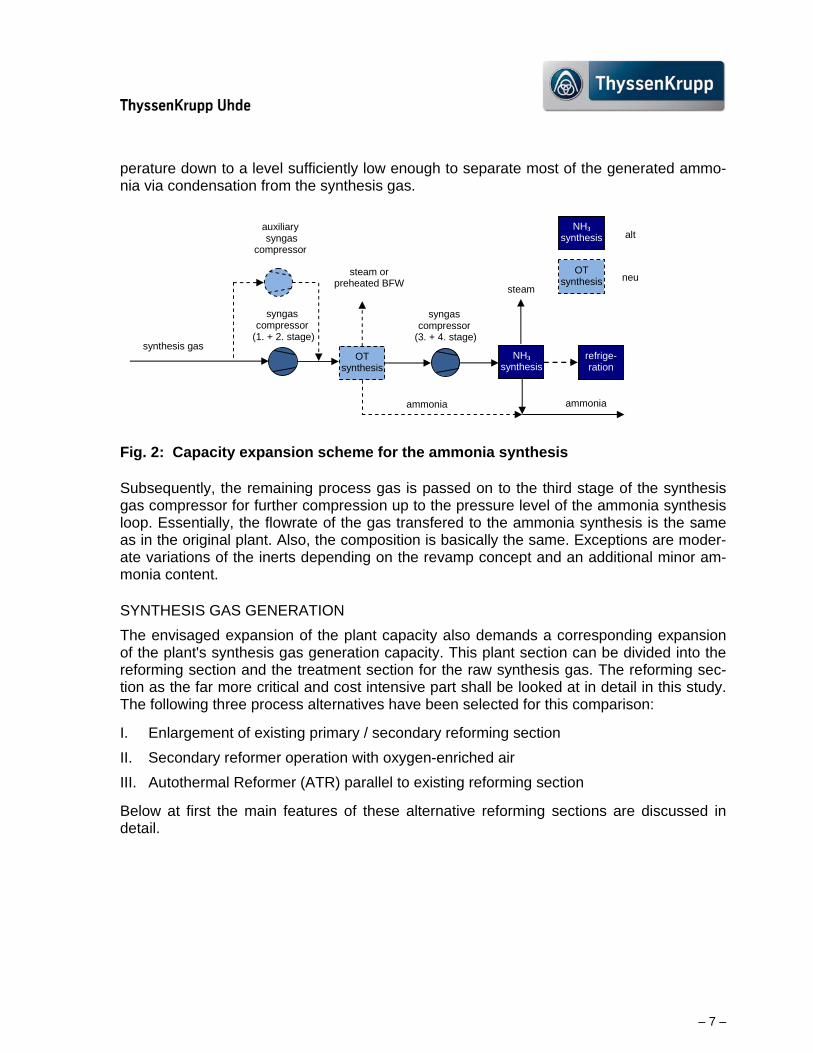
– 7 –
perature down to a level sufficiently low enough to separate most of the generated ammo-nia via condensation from the synthesis gas.
Fig. 2: Capacity expansion scheme for the ammonia synthesis
Subsequently, the remaining process gas is passed on to the third stage of the synthesis gas compressor for further compression up to the pressure level of the ammonia synthesis loop. Essentially, the flowrate of the gas transfered to the ammonia synthesis is the same as in the original plant. Also, the composition is basically the same. Exceptions are moder-ate variations of the inerts depending on the revamp concept and an additional minor am-monia content.
SYNTHESIS GAS GENERATION
The envisaged expansion of the plant capacity also demands a corresponding expansion of the plant's synthesis gas generation capacity. This plant section can be divided into the reforming section and the treatment section for the raw synthesis gas. The reforming sec-tion as the far more critical and cost intensive part shall be looked at in detail in this study. The following three process alternatives have been selected for this comparison:
I. Enlargement of existing primary / secondary reforming section
II. Secondary reformer operation with oxygen-enriched air
III. Autothermal Reformer (ATR) parallel to existing reforming section
Below at first the main features of these alternative reforming sections are discussed in detail.
synthesis gas
ammonia
steam or preheated BFW
refrige-ration
NH3 synthesis
steam
auxiliary syngas
compressor
syngas compressor
(1. + 2. stage)
syngas compressor
(3. + 4. stage)
OT synthesis
ammonia
OT synthesis
NH3 synthesis alt
neu
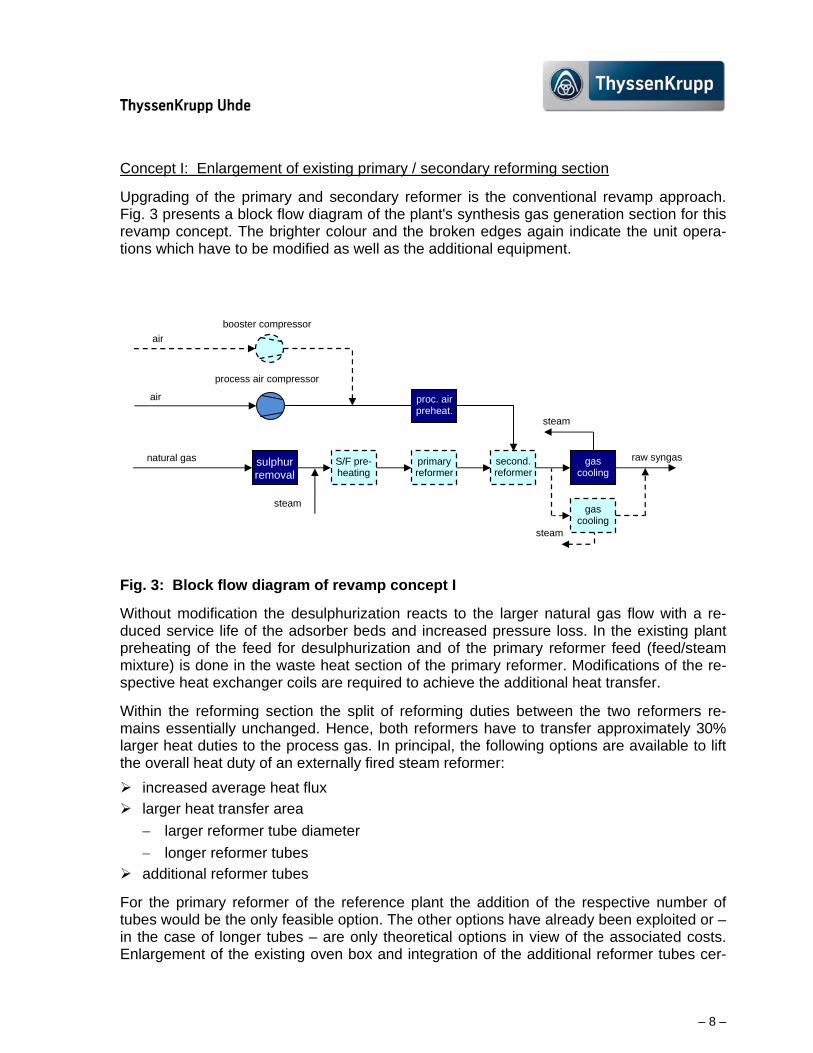
– 8 –
Concept I: Enlargement of existing primary / secondary reforming section
Upgrading of the primary and secondary reformer is the conventional revamp approach. Fig. 3 presents a block flow diagram of the plant's synthesis gas generation section for this revamp concept. The brighter colour and the broken edges again indicate the unit opera-tions which have to be modified as well as the additional equipment.
Fig. 3: Block flow diagram of revamp concept I
Without modification the desulphurization reacts to the larger natural gas flow with a re-duced service life of the adsorber beds and increased pressure loss. In the existing plant preheating of the feed for desulphurization and of the primary reformer feed (feed/steam mixture) is done in the waste heat section of the primary reformer. Modifications of the re-spective heat exchanger coils are required to achieve the additional heat transfer.
Within the reforming section the split of reforming duties between the two reformers re-mains essentially unchanged. Hence, both reformers have to transfer approximately 30% larger heat duties to the process gas. In principal, the following options are available to lift the overall heat duty of an externally fired steam reformer:
increased average heat flux
larger heat transfer area
larger reformer tube diameter
longer reformer tubes additional reformer tubes
For the primary reformer of the reference plant the addition of the respective number of tubes would be the only feasible option. The other options have already been exploited or – in the case of longer tubes – are only theoretical options in view of the associated costs. Enlargement of the existing oven box and integration of the additional reformer tubes cer-
sulphur removal
S/F pre-heating
primary reformer
second. reformer
gas cooling
air
steam
steam
process air compressor
air
proc. air preheat.
natural gas
gas cooling
booster compressor
steam
raw syngas
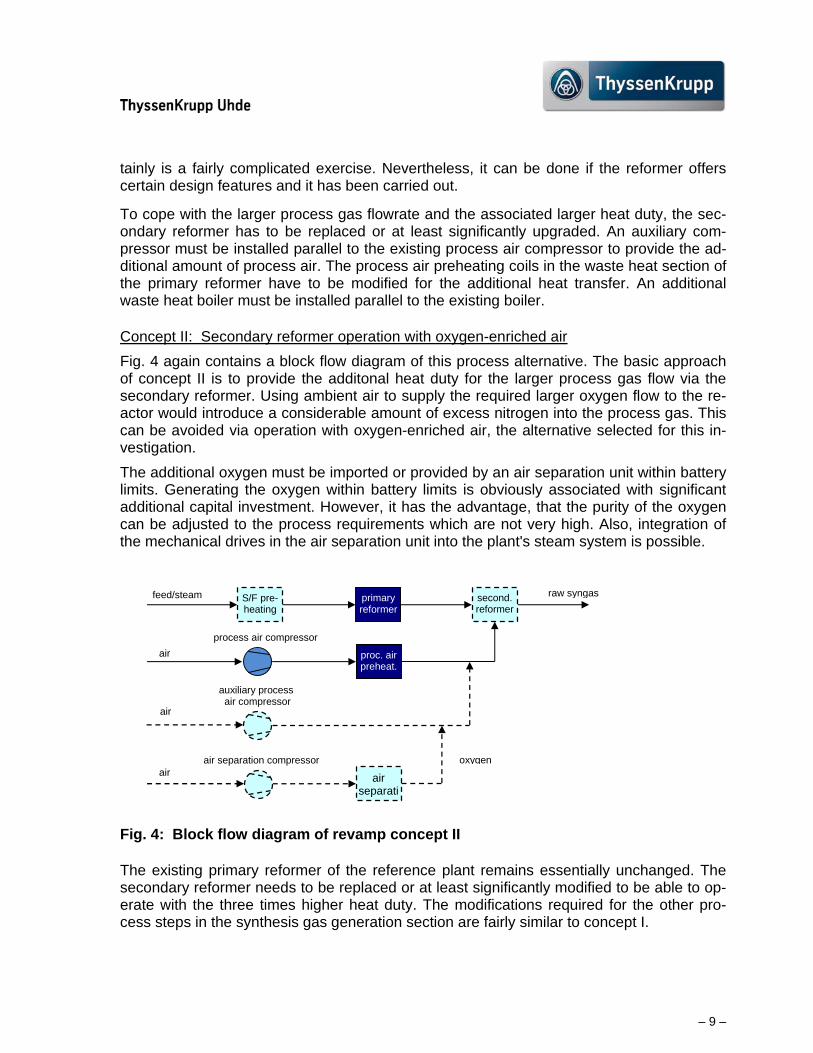
– 9 –
tainly is a fairly complicated exercise. Nevertheless, it can be done if the reformer offers certain design features and it has been carried out.
To cope with the larger process gas flowrate and the associated larger heat duty, the sec-ondary reformer has to be replaced or at least significantly upgraded. An auxiliary com-pressor must be installed parallel to the existing process air compressor to provide the ad-ditional amount of process air. The process air preheating coils in the waste heat section of the primary reformer have to be modified for the additional heat transfer. An additional waste heat boiler must be installed parallel to the existing boiler.
Concept II: Secondary reformer operation with oxygen-enriched air
Fig. 4 again contains a block flow diagram of this process alternative. The basic approach of concept II is to provide the additonal heat duty for the larger process gas flow via the secondary reformer. Using ambient air to supply the required larger oxygen flow to the re-actor would introduce a considerable amount of excess nitrogen into the process gas. This can be avoided via operation with oxygen-enriched air, the alternative selected for this in-vestigation.
The additional oxygen must be imported or provided by an air separation unit within battery limits. Generating the oxygen within battery limits is obviously associated with significant additional capital investment. However, it has the advantage, that the purity of the oxygen can be adjusted to the process requirements which are not very high. Also, integration of the mechanical drives in the air separation unit into the plant's steam system is possible.
Fig. 4: Block flow diagram of revamp concept II
The existing primary reformer of the reference plant remains essentially unchanged. The secondary reformer needs to be replaced or at least significantly modified to be able to op-erate with the three times higher heat duty. The modifications required for the other pro-cess steps in the synthesis gas generation section are fairly similar to concept I.
air separati
S/F pre-heating
primary reformer
second. reformer
air
raw syngas
oxygen
auxiliary process air compressor
proc. air preheat.
feed/steam
air
air
air separation compressor
process air compressor
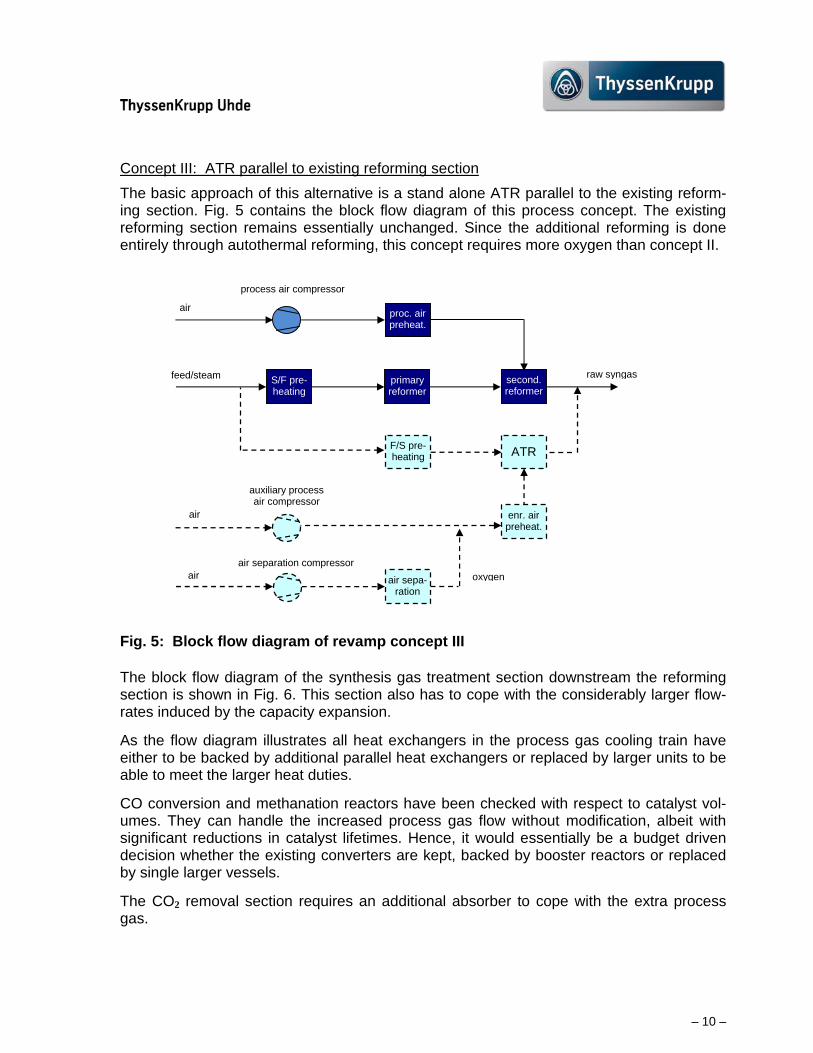
– 10 –
Concept III: ATR parallel to existing reforming section
The basic approach of this alternative is a stand alone ATR parallel to the existing reform-ing section. Fig. 5 contains the block flow diagram of this process concept. The existing reforming section remains essentially unchanged. Since the additional reforming is done entirely through autothermal reforming, this concept requires more oxygen than concept II.
Fig. 5: Block flow diagram of revamp concept III
The block flow diagram of the synthesis gas treatment section downstream the reforming section is shown in Fig. 6. This section also has to cope with the considerably larger flow-rates induced by the capacity expansion.
As the flow diagram illustrates all heat exchangers in the process gas cooling train have either to be backed by additional parallel heat exchangers or replaced by larger units to be able to meet the larger heat duties.
CO conversion and methanation reactors have been checked with respect to catalyst vol-umes. They can handle the increased process gas flow without modification, albeit with significant reductions in catalyst lifetimes. Hence, it would essentially be a budget driven decision whether the existing converters are kept, backed by booster reactors or replaced by single larger vessels.
The CO2 removal section requires an additional absorber to cope with the extra process gas.
air sepa-ration
S/F pre-heating
primary reformer
second. reformer
air
raw syngas
oxygen
auxiliary process air compressor
proc. air preheat.
feed/steam
air
air
F/S pre-heating ATR
air separation compressor
enr. air preheat.
process air compressor
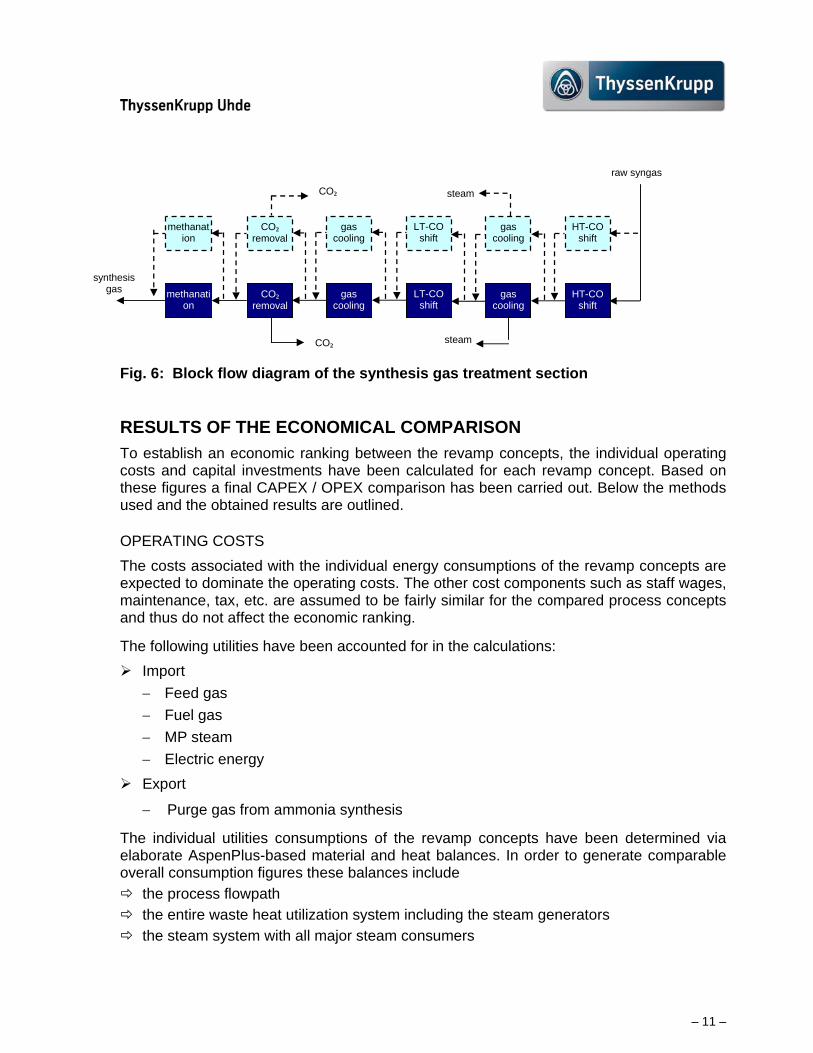
– 11 –
Fig. 6: Block flow diagram of the synthesis gas treatment section
RESULTS OF THE ECONOMICAL COMPARISON
To establish an economic ranking between the revamp concepts, the individual operating costs and capital investments have been calculated for each revamp concept. Based on these figures a final CAPEX / OPEX comparison has been carried out. Below the methods used and the obtained results are outlined.
OPERATING COSTS
The costs associated with the individual energy consumptions of the revamp concepts are expected to dominate the operating costs. The other cost components such as staff wages, maintenance, tax, etc. are assumed to be fairly similar for the compared process concepts and thus do not affect the economic ranking.
The following utilities have been accounted for in the calculations:
Import
Feed gas
Fuel gas
MP steam
Electric energy
Export
Purge gas from ammonia synthesis
The individual utilities consumptions of the revamp concepts have been determined via elaborate AspenPlus-based material and heat balances. In order to generate comparable overall consumption figures these balances include
the process flowpath
the entire waste heat utilization system including the steam generators
the steam system with all major steam consumers
methanation
CO2 removal
gas cooling
LT-CO shift
gas cooling
HT-CO shift
methanation
CO2 removal
gas cooling
LT-CO shift
gas cooling
HT-CO shift
synthesis gas
CO2
CO2steam
steam
raw syngas
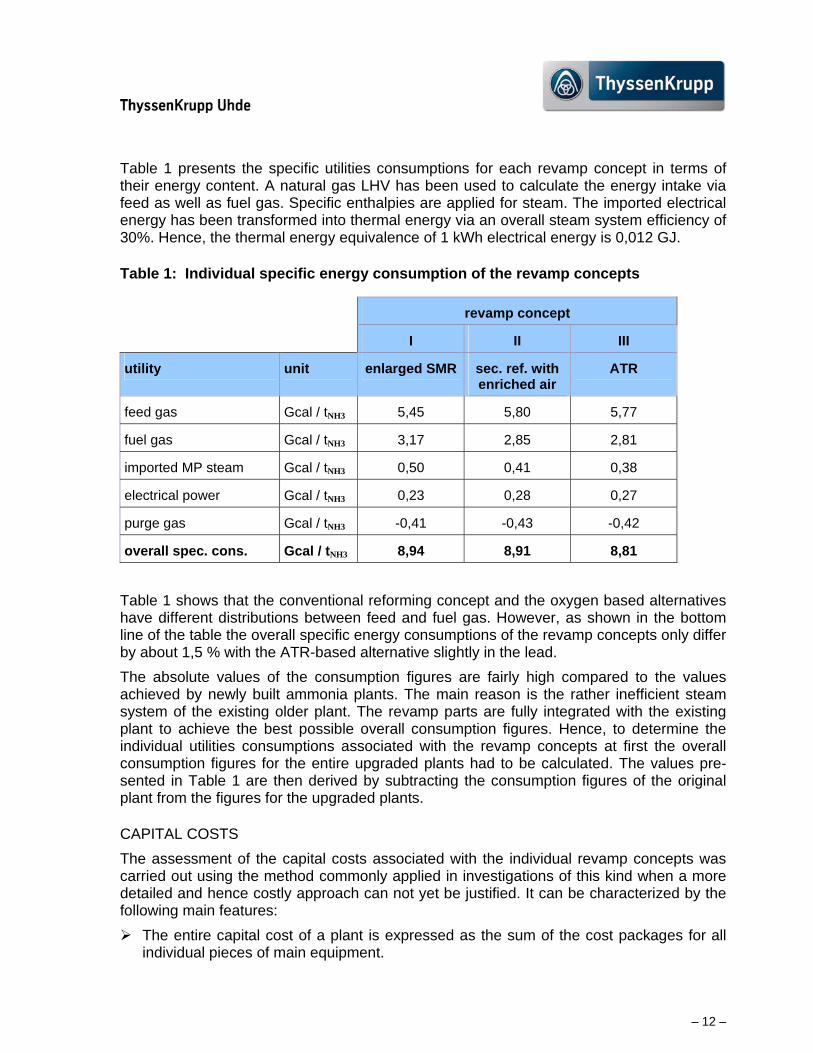
– 12 –
Table 1 presents the specific utilities consumptions for each revamp concept in terms of their energy content. A natural gas LHV has been used to calculate the energy intake via feed as well as fuel gas. Specific enthalpies are applied for steam. The imported electrical energy has been transformed into thermal energy via an overall steam system efficiency of 30%. Hence, the thermal energy equivalence of 1 kWh electrical energy is 0,012 GJ.
Table 1: Individual specific energy consumption of the revamp concepts
revamp concept
I II III
utility unit enlarged SMR sec. ref. with enriched air
ATR
feed gas Gcal / tNH3 5,45 5,80 5,77
fuel gas Gcal / tNH3 3,17 2,85 2,81
imported MP steam Gcal / tNH3 0,50 0,41 0,38
electrical power Gcal / tNH3 0,23 0,28 0,27
purge gas Gcal / tNH3 -0,41 -0,43 -0,42
overall spec. cons. Gcal / tNH3 8,94 8,91 8,81
Table 1 shows that the conventional reforming concept and the oxygen based alternatives have different distributions between feed and fuel gas. However, as shown in the bottom line of the table the overall specific energy consumptions of the revamp concepts only differ by about 1,5 % with the ATR-based alternative slightly in the lead.
The absolute values of the consumption figures are fairly high compared to the values achieved by newly built ammonia plants. The main reason is the rather inefficient steam system of the existing older plant. The revamp parts are fully integrated with the existing plant to achieve the best possible overall consumption figures. Hence, to determine the individual utilities consumptions associated with the revamp concepts at first the overall consumption figures for the entire upgraded plants had to be calculated. The values pre-sented in Table 1 are then derived by subtracting the consumption figures of the original plant from the figures for the upgraded plants.
CAPITAL COSTS
The assessment of the capital costs associated with the individual revamp concepts was carried out using the method commonly applied in investigations of this kind when a more detailed and hence costly approach can not yet be justified. It can be characterized by the following main features:
The entire capital cost of a plant is expressed as the sum of the cost packages for all individual pieces of main equipment.
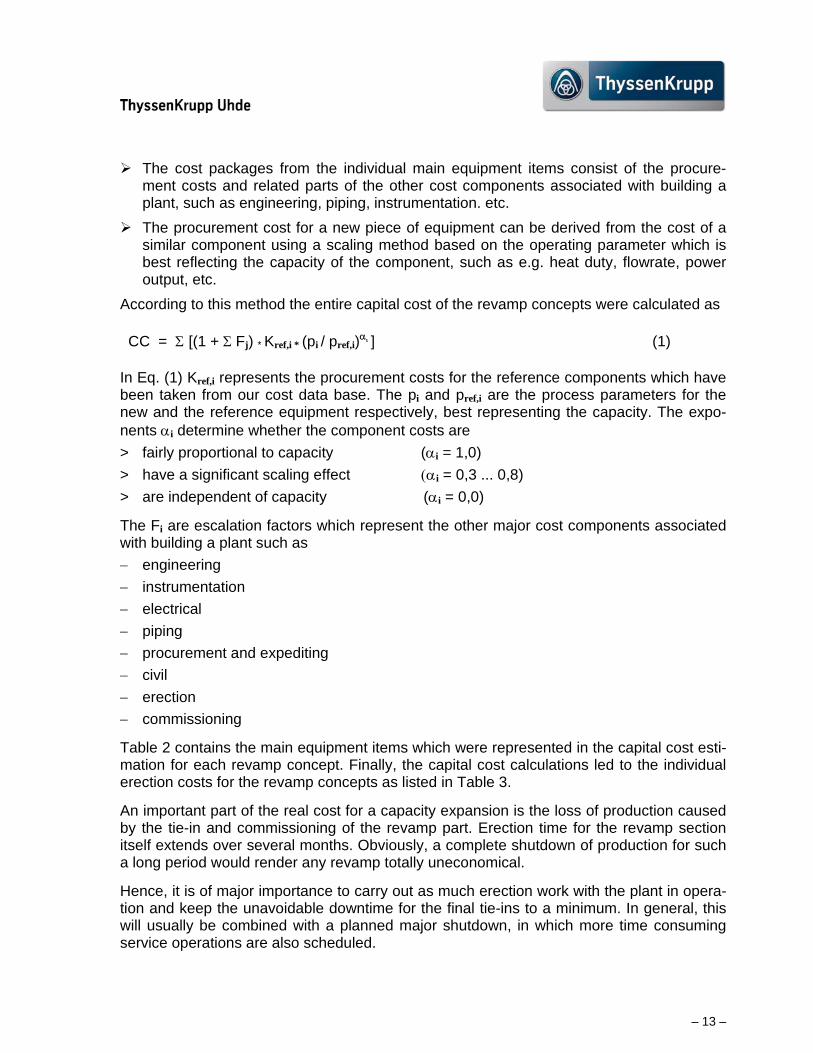
– 13 –
The cost packages from the individual main equipment items consist of the procure-ment costs and related parts of the other cost components associated with building a plant, such as engineering, piping, instrumentation. etc.
The procurement cost for a new piece of equipment can be derived from the cost of a similar component using a scaling method based on the operating parameter which is best reflecting the capacity of the component, such as e.g. heat duty, flowrate, power output, etc.
According to this method the entire capital cost of the revamp concepts were calculated as
CC = [(1 + Fj) * Kref,i * (pi / pref,i)] (1)
In Eq. (1) Kref,i represents the procurement costs for the reference components which have been taken from our cost data base. The pi and pref,i are the process parameters for the new and the reference equipment respectively, best representing the capacity. The expo-nents i determine whether the component costs are
> fairly proportional to capacity (i = 1,0)
> have a significant scaling effecti = 0,3 ... 0,8)
> are independent of capacity (i = 0,0)
The Fi are escalation factors which represent the other major cost components associated with building a plant such as
engineering
instrumentation
electrical
piping
procurement and expediting
civil
erection
commissioning
Table 2 contains the main equipment items which were represented in the capital cost esti-mation for each revamp concept. Finally, the capital cost calculations led to the individual erection costs for the revamp concepts as listed in Table 3.
An important part of the real cost for a capacity expansion is the loss of production caused by the tie-in and commissioning of the revamp part. Erection time for the revamp section itself extends over several months. Obviously, a complete shutdown of production for such a long period would render any revamp totally uneconomical.
Hence, it is of major importance to carry out as much erection work with the plant in opera-tion and keep the unavoidable downtime for the final tie-ins to a minimum. In general, this will usually be combined with a planned major shutdown, in which more time consuming service operations are also scheduled.
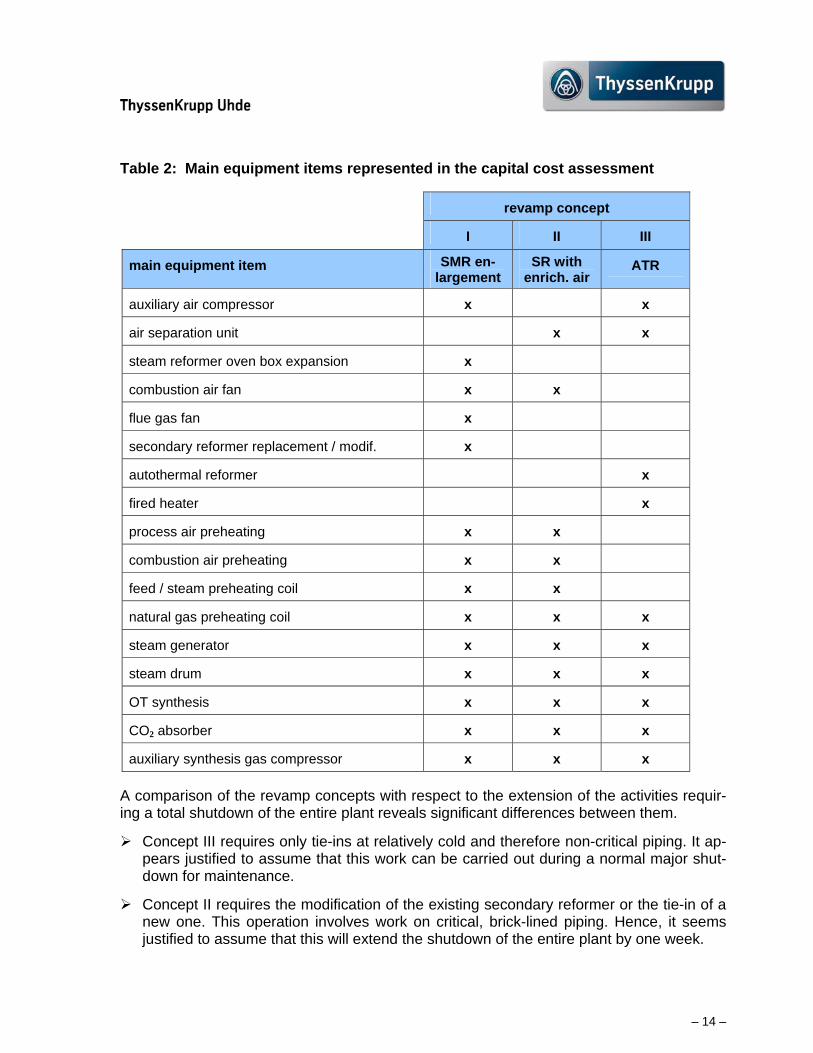
– 14 –
Table 2: Main equipment items represented in the capital cost assessment
revamp concept
I II III
main equipment item SMR en-largement
SR with enrich. air
ATR
auxiliary air compressor x x
air separation unit x x
steam reformer oven box expansion x
combustion air fan x x
flue gas fan x
secondary reformer replacement / modif. x
autothermal reformer x
fired heater x
process air preheating x x
combustion air preheating x x
feed / steam preheating coil x x
natural gas preheating coil x x x
steam generator x x x
steam drum x x x
OT synthesis x x x
CO2 absorber x x x
auxiliary synthesis gas compressor x x x
A comparison of the revamp concepts with respect to the extension of the activities requir-ing a total shutdown of the entire plant reveals significant differences between them.
Concept III requires only tie-ins at relatively cold and therefore non-critical piping. It ap-pears justified to assume that this work can be carried out during a normal major shut-down for maintenance.
Concept II requires the modification of the existing secondary reformer or the tie-in of a new one. This operation involves work on critical, brick-lined piping. Hence, it seems justified to assume that this will extend the shutdown of the entire plant by one week.
– 15 –
Concept I requires difficult structural work to enlarge the oven box of the existing steam reformer. Even with a maximum amount of preassembling it seems likely that this would prolong the scheduled shutdown by at least four additional weeks.
The additional shutdown periods have been turned into capital costs and entered into Ta-ble 3. Based on an ammonia market price of 400 USD/mt and energy cost of 3,0 USD/ MMBTU the daily loss in revenue amounts to 600.000 USD. Adding the tie-in costs to the erection costs finally leads to the individual implementation costs for each revamp concept as shown in the last line of Table 3.
Table 3 illustrates that as long as the production losses for the final tie-ins are neglected, concept I appears to be the most attractive solution for this kind of capacity enlargement. However, taking into account the real cost of implementation this picture is completely re-versed and revamp concept III becomes the most promising one with respect to overall capital costs. Concept I then drops into second position with about 4% higher overall capi-tal costs. Concept II turns out to be the least attractive one with about 7 % higher capital costs compared to concept III.
Table 3: Capital cost of the revamp concepts in USD
Revamp concept
I II III
plant section / cost component enlarged SMR
sec. ref. with enriched air
ATR
synthesis gas generation 80,4 98,4 93,7
OT synthesis 71,2 71,6 69,1
steam system 2,1 2,2 2,1
reformer waste heat section 3,9 2,9 3,1
overall erection cost 157,6 175,1 168,0
implementation cost 16,8 4,2 ---
overall capital cost 174,4 179,3 168,0
CAPEX / OPEX COMPARISON
Finally, a CAPEX / OPEX comparison of the three revamp concepts has been carried out. It is based on the individual production costs per ton of ammonia which can be achieved by the revamp concepts. The individual production costs are calculated as the sum of specific operating and capital costs.
The specific operating costs are basically the specific energy consumptions as listed in Ta-ble 1 multiplied by the specific energy costs. Since the aim of this investigation is primarily
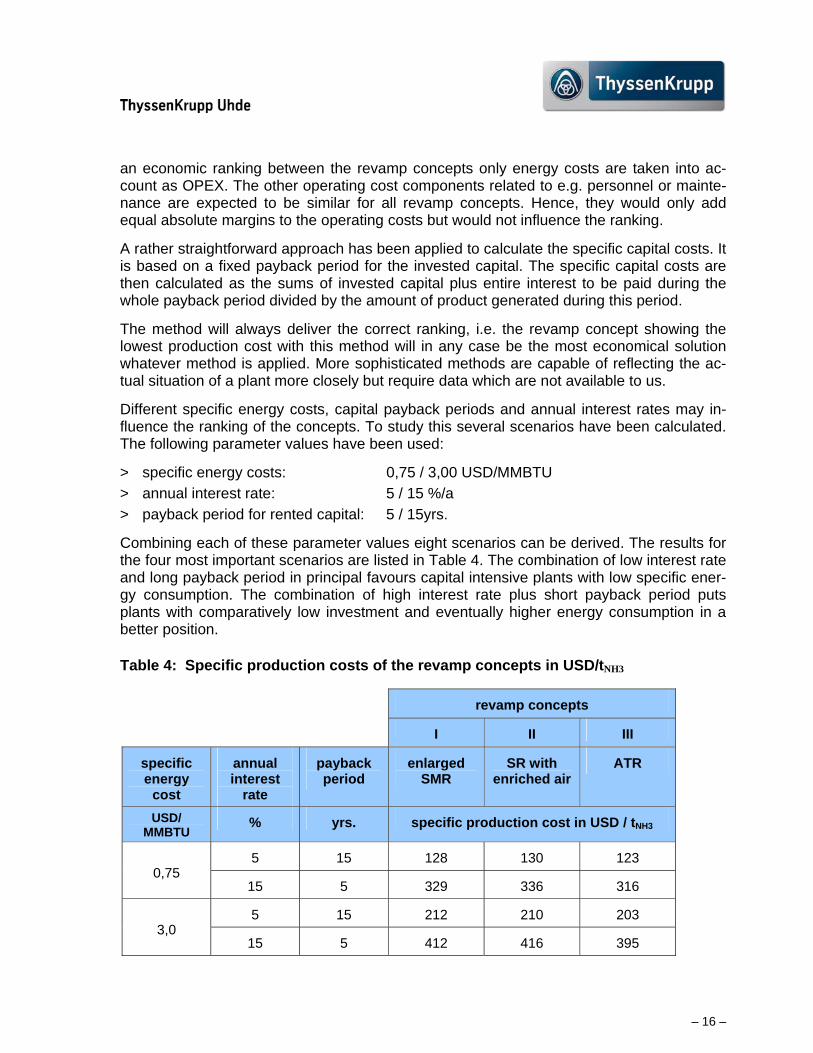
– 16 –
an economic ranking between the revamp concepts only energy costs are taken into ac-count as OPEX. The other operating cost components related to e.g. personnel or mainte-nance are expected to be similar for all revamp concepts. Hence, they would only add equal absolute margins to the operating costs but would not influence the ranking.
A rather straightforward approach has been applied to calculate the specific capital costs. It is based on a fixed payback period for the invested capital. The specific capital costs are then calculated as the sums of invested capital plus entire interest to be paid during the whole payback period divided by the amount of product generated during this period.
The method will always deliver the correct ranking, i.e. the revamp concept showing the lowest production cost with this method will in any case be the most economical solution whatever method is applied. More sophisticated methods are capable of reflecting the ac-tual situation of a plant more closely but require data which are not available to us.
Different specific energy costs, capital payback periods and annual interest rates may in-fluence the ranking of the concepts. To study this several scenarios have been calculated. The following parameter values have been used:
> specific energy costs: 0,75 / 3,00 USD/MMBTU
> annual interest rate: 5 / 15 %/a
> payback period for rented capital: 5 / 15yrs.
Combining each of these parameter values eight scenarios can be derived. The results for the four most important scenarios are listed in Table 4. The combination of low interest rate and long payback period in principal favours capital intensive plants with low specific ener-gy consumption. The combination of high interest rate plus short payback period puts plants with comparatively low investment and eventually higher energy consumption in a better position.
Table 4: Specific production costs of the revamp concepts in USD/tNH3
revamp concepts
I II III
specific energy
cost
annual interest
rate
payback period
enlarged SMR
SR with enriched air
ATR
USD/ MMBTU
% yrs. specific production cost in USD / tNH3
0,75 5 15 128 130 123
15 5 329 336 316
3,0 5 15 212 210 203
15 5 412 416 395
– 17 –
Table 4 illustrates that the ATR-based revamp concept III is likely to have the lowest overall production cost under all scenarios. This is not too surprising since it shows the lowest specific energy consumption and also the lowest capital costs.
SUMMARY
An extensive investigation has been carried out by ThyssenKrupp Uhde to establish an economic ranking between three different concepts for the expansion of the synthesis gas generation capacities of existing ammonia plants. Rather unexpectedly, the ATR-based concept (III) turned out to be the most promising solution. The usually applied enlargement of the existing steam reformer (concept I) only takes the second position.
The investigation revealed only moderate differences in specific energy consumption bet-ween the compared alternatives. Responsible for the final ranking are mainly the ad-vantages of the ATR-based concept in the overall capital costs for the revamp.
This overall capital costs include the actual erection costs for the revamp section but also the substantial costs for the plant owners through loss of production during the tie-in and commissioning of the revamp part. Compared to the ATR-based revamp concept III espe-cially concept I (enlargement of the existing steam reformer) requires considerably more complicated and laborious work which demands a longer plant shutdown.
The capital costs required for a revamp of this kind are significant. Hence, even assuming a lower specific energy consumption, the specific production costs for which the revamp parts can produce ammonia would not be really low. However, at least for plants which have access to relatively cheap natural gas, such a revamp should still be attractive. There are still considerable margins between the specific production costs calculated in this study and the product market value to cover costs which are not accounted for in this investiga-tion but cannot be avoided in plant operation.
Especially if such a revamp is combined with a general rejuvenation of a plant where sev-eral pieces of the main equipment have to be replaced anyway to keep the plant operative, such a revamp still appears attractive and worth a detailed investigation.

1. The Way to achieve Zero Liquid Discharge at Abu Qir Fertilizers Co.
Fatma Badawy ‐ Utilities Sectors Head, Abu Qir, Egypt
2. Challenges Experienced in Phasing out Radioactive Source Level Measurement in Urea Reactor at Albayroni
Hassan Al‐Khulaif ‐ Process Engineer, Bayroni, S. Arabia
3. “GPIC Initiative to obtain Responsible Care® Certification as full member of GPCA”
Mohamed Al Hashemi, GPIC, Bahrain
4. Composite fertilizers including Urea+ and NPK production in High Speed Drum Granulator
Danil Safonov, International Affairs Manager, R&D Institute of Urea (NIIK) – Russia
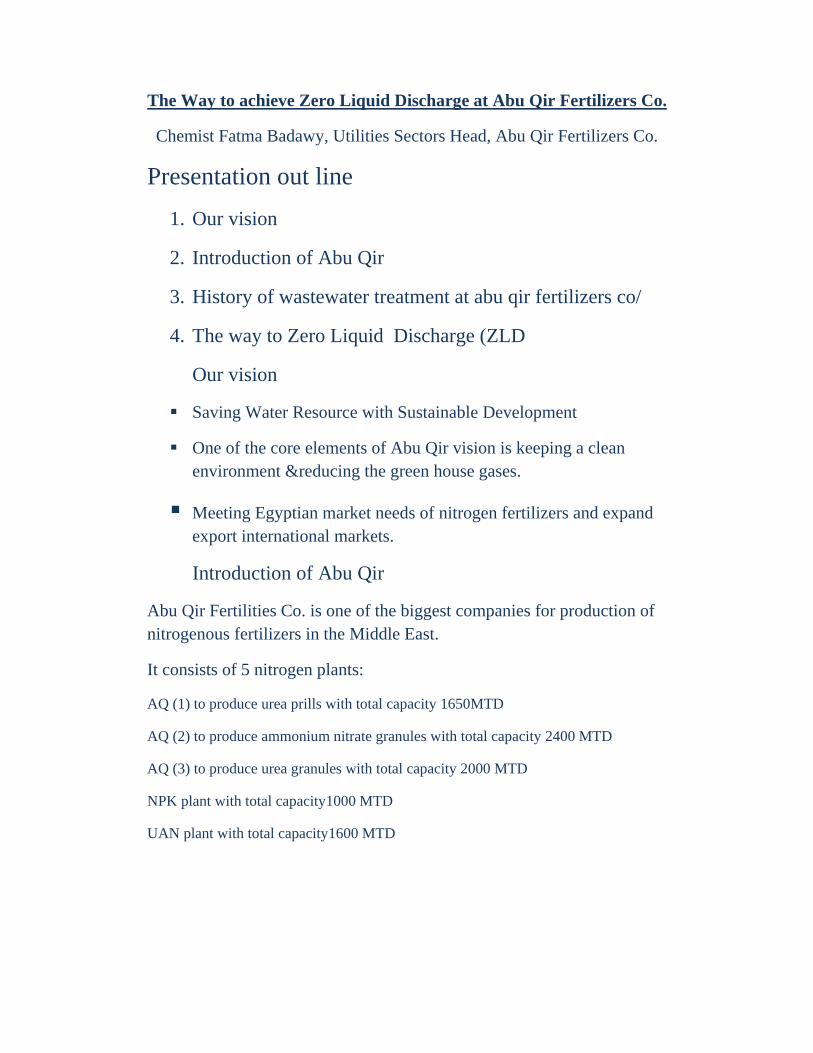
The Way to achieve Zero Liquid Discharge at Abu Qir Fertilizers Co.
Chemist Fatma Badawy, Utilities Sectors Head, Abu Qir Fertilizers Co.
Presentation out line
1. Our vision
2. Introduction of Abu Qir
3. History of wastewater treatment at abu qir fertilizers co/
4. The way to Zero Liquid Discharge (ZLD
Our vision
Saving Water Resource with Sustainable Development
One of the core elements of Abu Qir vision is keeping a clean environment &reducing the green house gases.
Meeting Egyptian market needs of nitrogen fertilizers and expand export international markets.
Introduction of Abu Qir
Abu Qir Fertilities Co. is one of the biggest companies for production of nitrogenous fertilizers in the Middle East.
It consists of 5 nitrogen plants:
AQ (1) to produce urea prills with total capacity 1650MTD
AQ (2) to produce ammonium nitrate granules with total capacity 2400 MTD
AQ (3) to produce urea granules with total capacity 2000 MTD
NPK plant with total capacity1000 MTD
UAN plant with total capacity1600 MTD
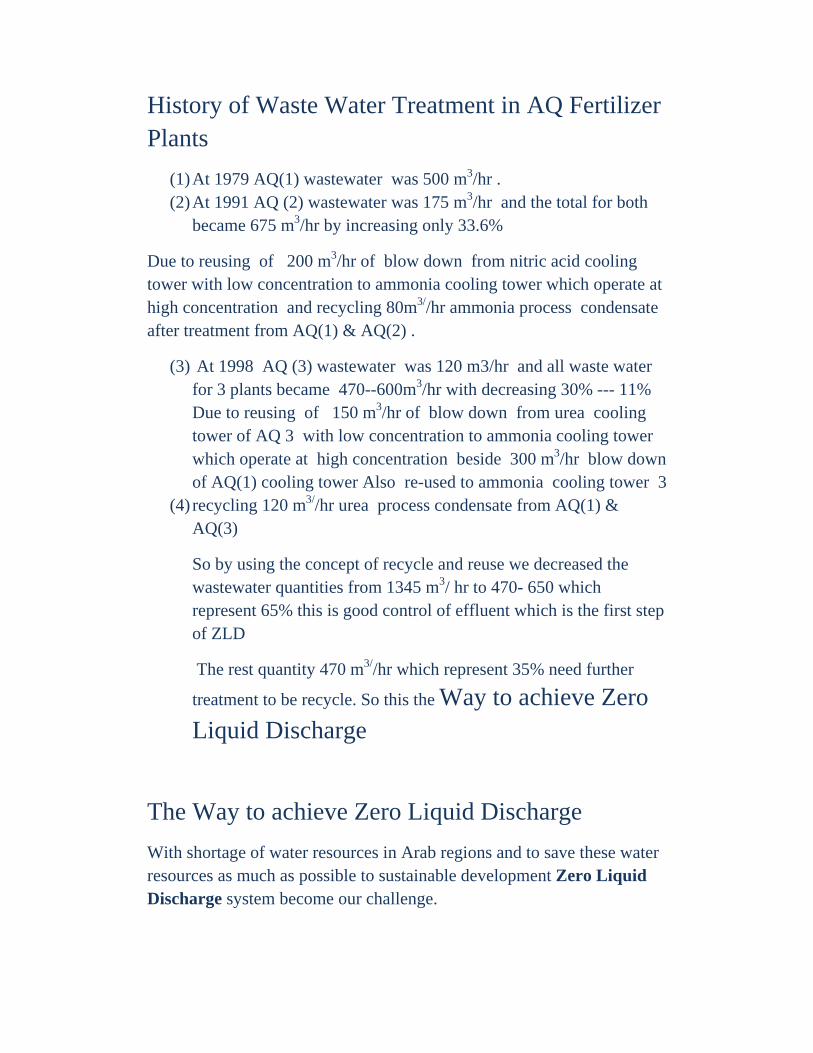
History of Waste Water Treatment in AQ Fertilizer Plants
(1) At 1979 AQ(1) wastewater was 500 m3/hr . (2) At 1991 AQ (2) wastewater was 175 m3/hr and the total for both
became 675 m3/hr by increasing only 33.6%
Due to reusing of 200 m3/hr of blow down from nitric acid cooling tower with low concentration to ammonia cooling tower which operate at high concentration and recycling 80m3//hr ammonia process condensate after treatment from AQ(1) & AQ(2) .
(3) At 1998 AQ (3) wastewater was 120 m3/hr and all waste water for 3 plants became 470--600m3/hr with decreasing 30% --- 11% Due to reusing of 150 m3/hr of blow down from urea cooling tower of AQ 3 with low concentration to ammonia cooling tower which operate at high concentration beside 300 m3/hr blow down of AQ(1) cooling tower Also re-used to ammonia cooling tower 3
(4) recycling 120 m3//hr urea process condensate from AQ(1) & AQ(3)
So by using the concept of recycle and reuse we decreased the wastewater quantities from 1345 m3/ hr to 470- 650 which represent 65% this is good control of effluent which is the first step of ZLD
The rest quantity 470 m3//hr which represent 35% need further
treatment to be recycle. So this the Way to achieve Zero Liquid Discharge
The Way to achieve Zero Liquid Discharge
With shortage of water resources in Arab regions and to save these water resources as much as possible to sustainable development Zero Liquid Discharge system become our challenge.
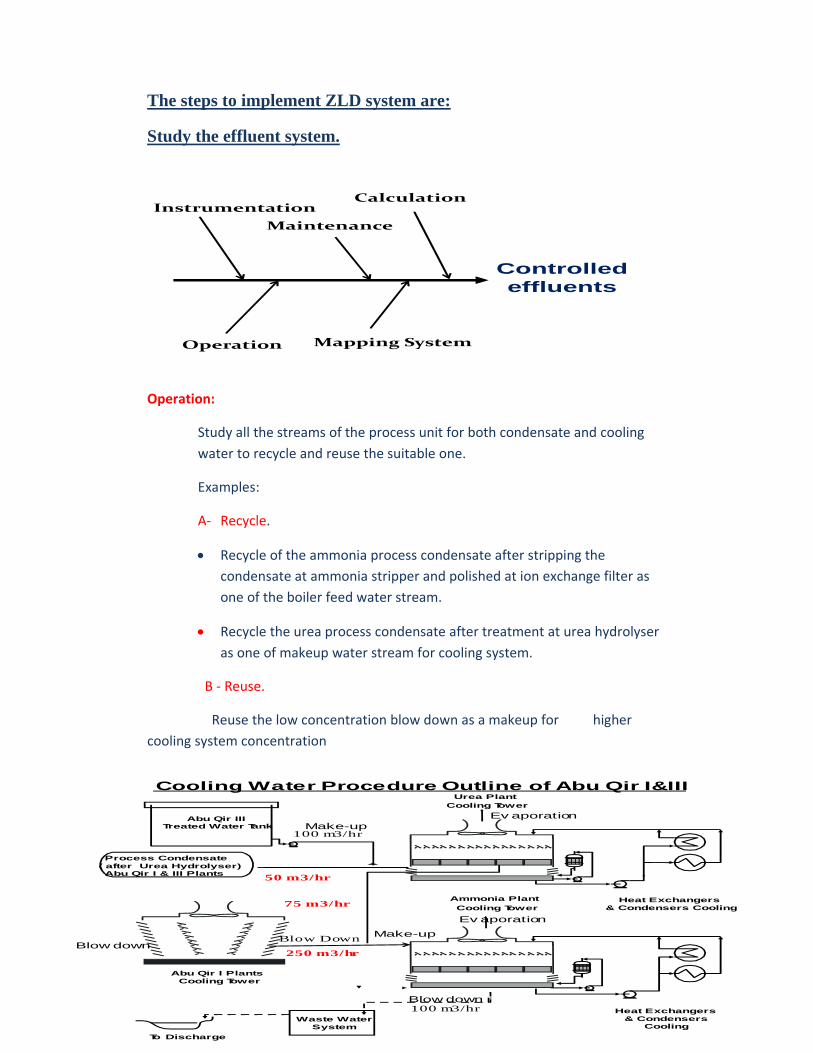
The steps to implement ZLD system are:
Study the effluent system.
Operation
Maintenance
Instrumentation
Mapping System
Controlled effluents
Calculation
Operation:
Study all the streams of the process unit for both condensate and cooling
water to recycle and reuse the suitable one.
Examples:
A‐ Recycle.
Recycle of the ammonia process condensate after stripping the
condensate at ammonia stripper and polished at ion exchange filter as
one of the boiler feed water stream.
Recycle the urea process condensate after treatment at urea hydrolyser
as one of makeup water stream for cooling system.
B ‐ Reuse.
Reuse the low concentration blow down as a makeup for higher
cooling system concentration
Cooling Water Procedure Outline of Abu Qir I&III
Abu Qir IIITreated Water Tank
Ev aporation
Blow down r
Waste WaterSystem
Urea PlantCooling Tower
Heat Exchangers& Condensers Cooling
Ammonia Plant
Cooling Tower
To Discharge
Heat Exchangers& Condensers
Cooling
Ev aporation
Make-up
Process Condensate( after Urea Hydrolyser)Abu Qir I & III Plants
Abu Qir I PlantsCooling Tower
Make-upBlow down
Blow Down
50 m3/hr
100 m3/hr
250 m3/hr
75 m3/hr
100 m3/hr
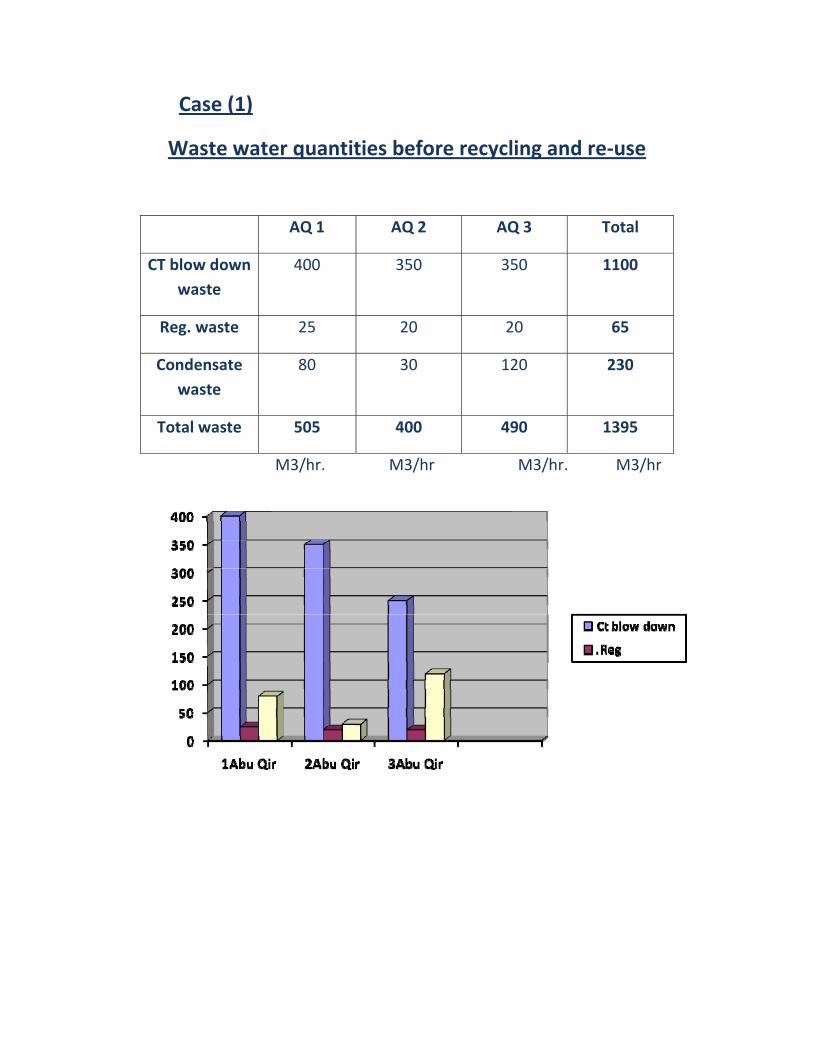
Case (1)
Waste water quantities before recycling and re‐use
AQ 1 AQ 2 AQ 3 Total
CT blow down
waste
400 350 350 1100
Reg. waste 25 20 20 65
Condensate
waste
80 30 120 230
Total waste 505 400 490 1395
M3/hr. M3/hr M3/hr. M3/hr
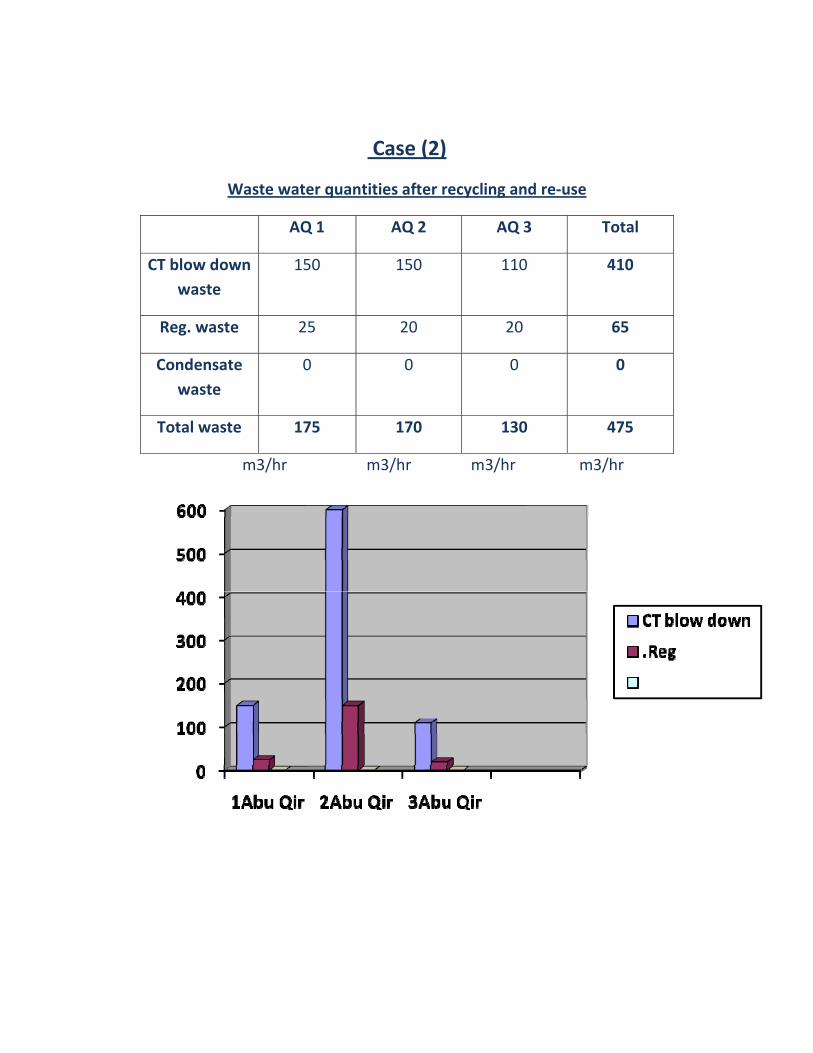
Case (2)
Waste water quantities after recycling and re‐use
AQ 1 AQ 2 AQ 3 Total
CT blow down
waste
150 150 110 410
Reg. waste 25 20 20 65
Condensate
waste
0 0 0 0
Total waste 175 170 130 475
m3/hr m3/hr m3/hr m3/hr
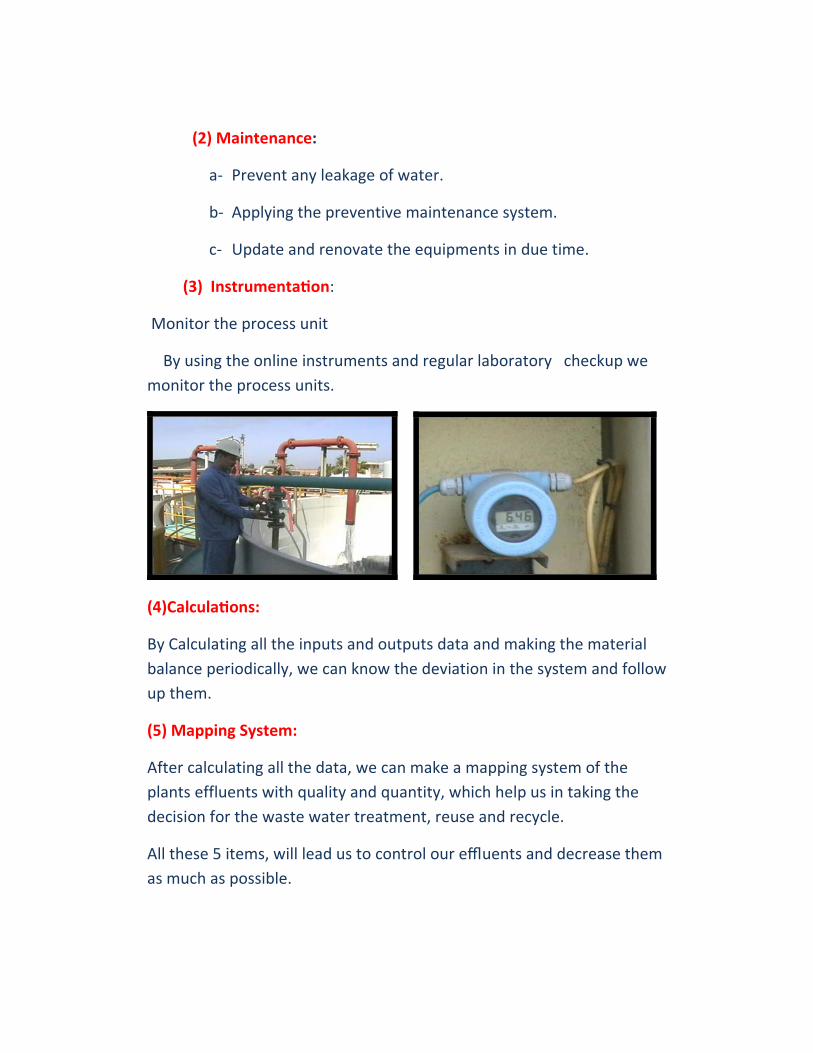
(2) Maintenance:
a‐ Prevent any leakage of water.
b‐ Applying the preventive maintenance system.
c‐ Update and renovate the equipments in due time.
(3) Instrumenta on:
Monitor the process unit
By using the online instruments and regular laboratory checkup we
monitor the process units.
(4)Calcula ons:
By Calculating all the inputs and outputs data and making the material
balance periodically, we can know the deviation in the system and follow
up them.
(5) Mapping System:
After calculating all the data, we can make a mapping system of the
plants effluents with quality and quantity, which help us in taking the
decision for the waste water treatment, reuse and recycle.
All these 5 items, will lead us to control our effluents and decrease them
as much as possible.

Waste Water Streams :Waste Water
Stream
Abu Qir 1
M3/DAY
Abu Qir 1
M3/hr.
Abu Qir 2
M3/DAY
Abu Qir 3
M3/DAY
B.D. from CoolingTower
3600 1200 2400
Sludge offlocculators
48 20 15
B.W. OF gravel filters
816 150 120
Waste of Reg.Demi.lines
EDR Unit
696840
200 200
Waste from process plants
655 175 865
End Pipe Pipe 1 Pipe 2
Measured = 350 – 450 m3/hr. 150 – 200 m3/hr.
Now, no way to save recourses with sustainable development unless
ZERO LIQUID DISCHARGE which will be achieved by:
Mapping for quantity and quality of the effluent at all
conditions of the plants .
Searching for different technologies of waste water treatment
Selection the best available Technology, which has
environmental view, economical view and applicable view.
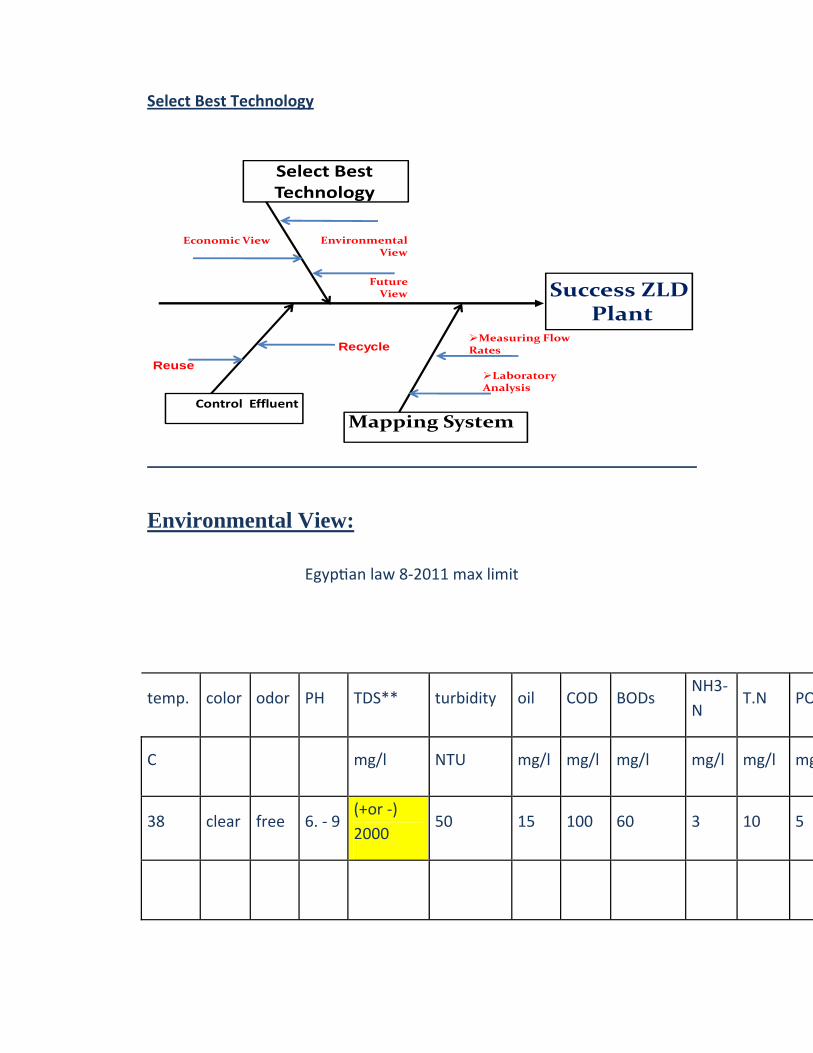
Select Best Technology
Success ZLDPlant
Select Best Technology
Environmental View
Future View
Economic View
Mapping System
Measuring Flow Rates
Laboratory Analysis
Control Effluent
Recycle
Reuse
Environmental View:
Egyp an law 8‐2011 max limit
temp. color odor PH TDS** turbidity oil COD BODs NH3‐
N T.N PO
C mg/l NTU mg/l mg/l mg/l mg/l mg/l mg
38 clear free 6. ‐ 9 (+or ‐)
2000 50 15 100 60 3 10 5
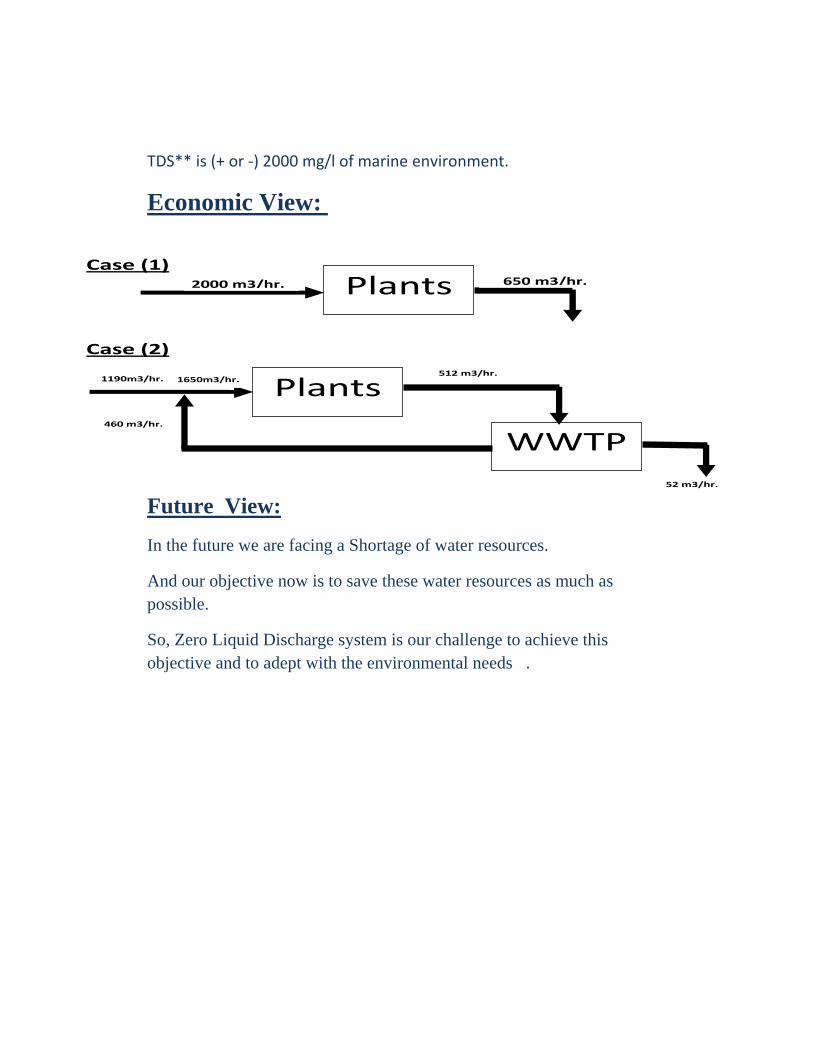
TDS** is (+ or ‐) 2000 mg/l of marine environment.
Economic View:
Future View:
In the future we are facing a Shortage of water resources.
And our objective now is to save these water resources as much as possible.
So, Zero Liquid Discharge system is our challenge to achieve this objective and to adept with the environmental needs .
Case (1)
Case (2)
Plants
Plants
WWTP 460 m3/hr.
1190m3/hr. 1650m3/hr.
650 m3/hr.2000 m3/hr.
52 m3/hr.
512 m3/hr.
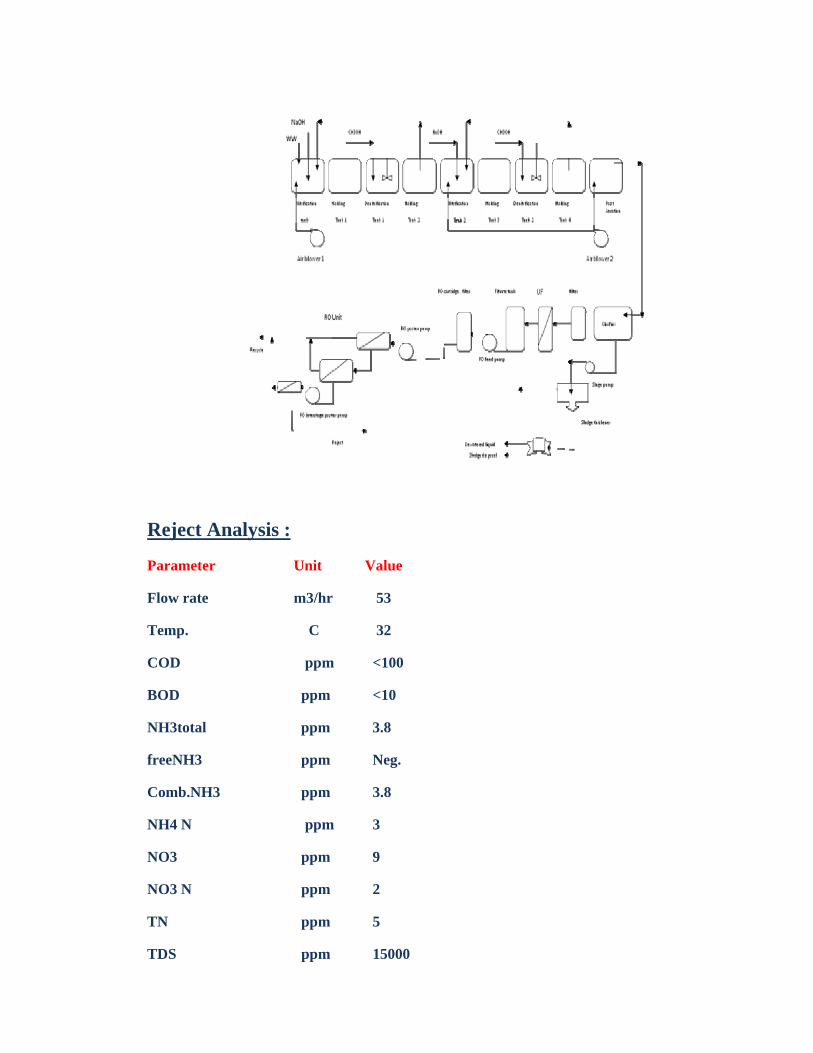
Reject Analysis :
Parameter Unit Value
Flow rate m3/hr 53
Temp. C 32
COD ppm <100
BOD ppm <10
NH3total ppm 3.8
freeNH3 ppm Neg.
Comb.NH3 ppm 3.8
NH4 N ppm 3
NO3 ppm 9
NO3 N ppm 2
TN ppm 5
TDS ppm 15000
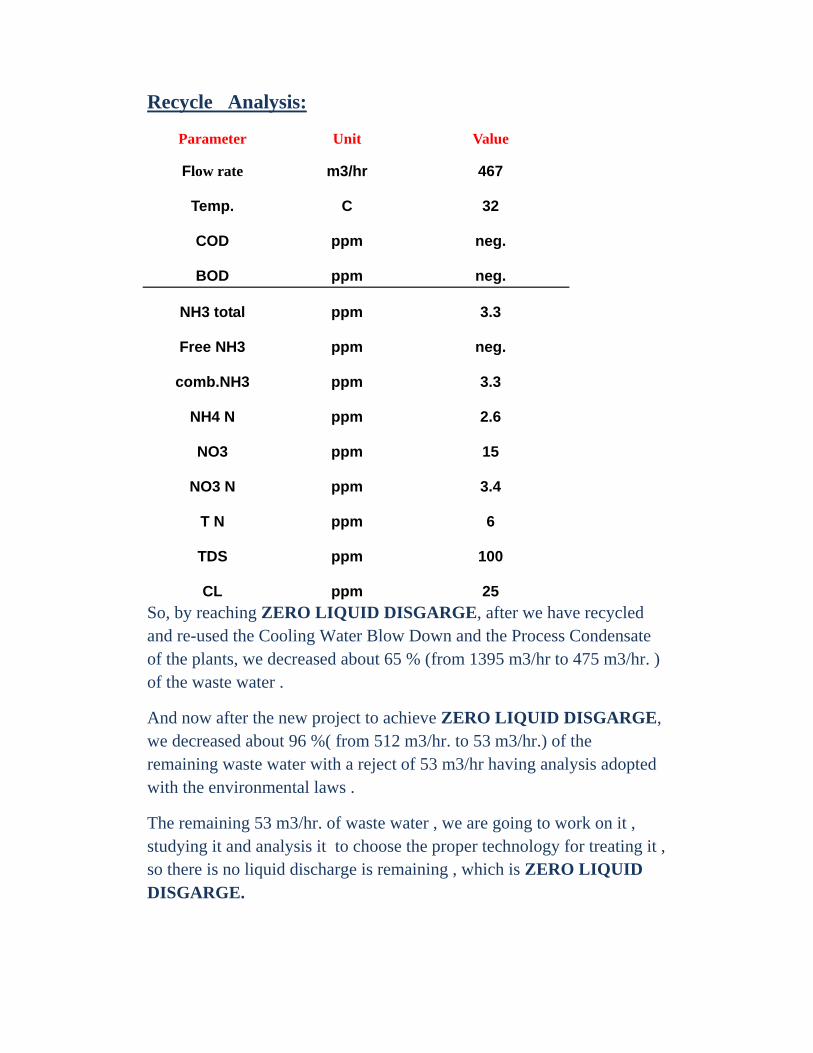
Recycle Analysis:
Parameter Unit Value
Flow rate m3/hr 467
Temp. C 32
COD ppm neg.
BOD ppm neg.
NH3 total ppm 3.3
Free NH3 ppm neg.
comb.NH3 ppm 3.3
NH4 N ppm 2.6
NO3 ppm 15
NO3 N ppm 3.4
T N ppm 6
TDS ppm 100
CL ppm 25
So, by reaching ZERO LIQUID DISGARGE, after we have recycled and re-used the Cooling Water Blow Down and the Process Condensate of the plants, we decreased about 65 % (from 1395 m3/hr to 475 m3/hr. ) of the waste water .
And now after the new project to achieve ZERO LIQUID DISGARGE, we decreased about 96 %( from 512 m3/hr. to 53 m3/hr.) of the remaining waste water with a reject of 53 m3/hr having analysis adopted with the environmental laws .
The remaining 53 m3/hr. of waste water , we are going to work on it , studying it and analysis it to choose the proper technology for treating it , so there is no liquid discharge is remaining , which is ZERO LIQUID DISGARGE.
Conclusion :
Achieving the Zero Liquid Discharge system will fulfill the following requirements:
Saving of fresh water reached about 64 % .
Saving Chemicals for Treatment reached about 50% .
Minimizing waste water quantity reached the saving of waste water about 96%.
Most important requirement is to Adapt with environmental needs.
Finally recycling and reusing the treated industrial waste water will be considered as one of the water resources to cover our company need.

Challenges Experienced in Phasing out Radioactive Source Level Measurement in Urea Reactor at Albayroni
Abstract
In perspective of SABIC commitment towards occupational health and safety and a committed responsible care global company, Albayroni, a SABIC affiliate, studied an alternative for phasing out the radioactive source level measurement in its Urea Reactor. Radar type level measurement technique for this particular application is found to be applicable for measuring of liquid level of Urea solutions under extreme process conditions. The devise is in operation since year 2010 without any operational or technical problems. This paper highlights Albayroni experiences during phasing out the radioactive source with Radar technique, post commissioning difficulties and how those challenges were mitigated. Contents
I. Introduction
II. Urea Plant Process Description
III. Urea Reactor Process Description
IV. Reactor Level Measurement Mechanisms
A. Radioactive Source Level Measurement
1. Measurement Methodology, Concept and Design
2. Health and Safety Concerns
3. Operational Concerns
B. Radar Level Measurement
1. Measurement Methodology, Concept and Design
2. Advantages of Radar Level Measurement over Radioactive Level
Measurement
V. Installation and Operational Challenges of Radar Level Measurement
VI. Conclusion
I. Introduction:
Al-Jubail Fertilizer Co. (Al-Bayroni) is 50:50 joint venture between Saudi Basic Industries Corporation (SABIC) and the Taiwan Fertilizer Company (T.F.C). Al Bayroni was established on December 4th, 1979 to manufacture fertilizers. Commercial production of Ammonia and Urea fertilizer began in early 1983.
Ammonia Plant has a design capacity of 1000 MTPD while urea plant has 1600 MTPD design capacity.
In 1995 Al-Bayroni diversified into the manufacture of petrochemicals and started manufacturing of 2-EH (2-Ethyl Hexanol) in 1995 with a capacity of 470 MTPD and DOP (Di-Octyl Phthalate) in 1996 having 150 MTPD.
Responsible Care, the SABIC way...
Radioactive source phasing out - An example of “Responsible Care”
SABIC is a socially responsible global company and committed towards responsible care requirements, taking utmost care in all its processes, occupational health and safety, emissions control, continual improvement through researches, often revisiting and improving so as to cater the global changing needs and requirements. Al-Bayroni is always looking at ways for enhancing occupational health and safety to its personnel thus striving to be a committed responsible care company. One such illustrative example is the Urea plant reactor radioactive source phasing out taken up in 2008 turnaround with Radar Level Transmitter.
II. Urea Plant Process Description
Urea is produced in Al-Bayroni site according to CO2 stripping process with design capacity of 1600 MTPD.
CO2 enters the bottom of the stripper and heated in counter current with urea solution coming from reactor. Ammonia reacts with stripped gas CO2 from H.P. stripper in the HP carbamate condenser.
Carbamate is formed with large amount of heat generation. This is cooled by generating steam in the shell side of the carbamate condenser. In Urea Reactor, the slow endothermic reaction involving carbamate conversion to urea product is taking place.
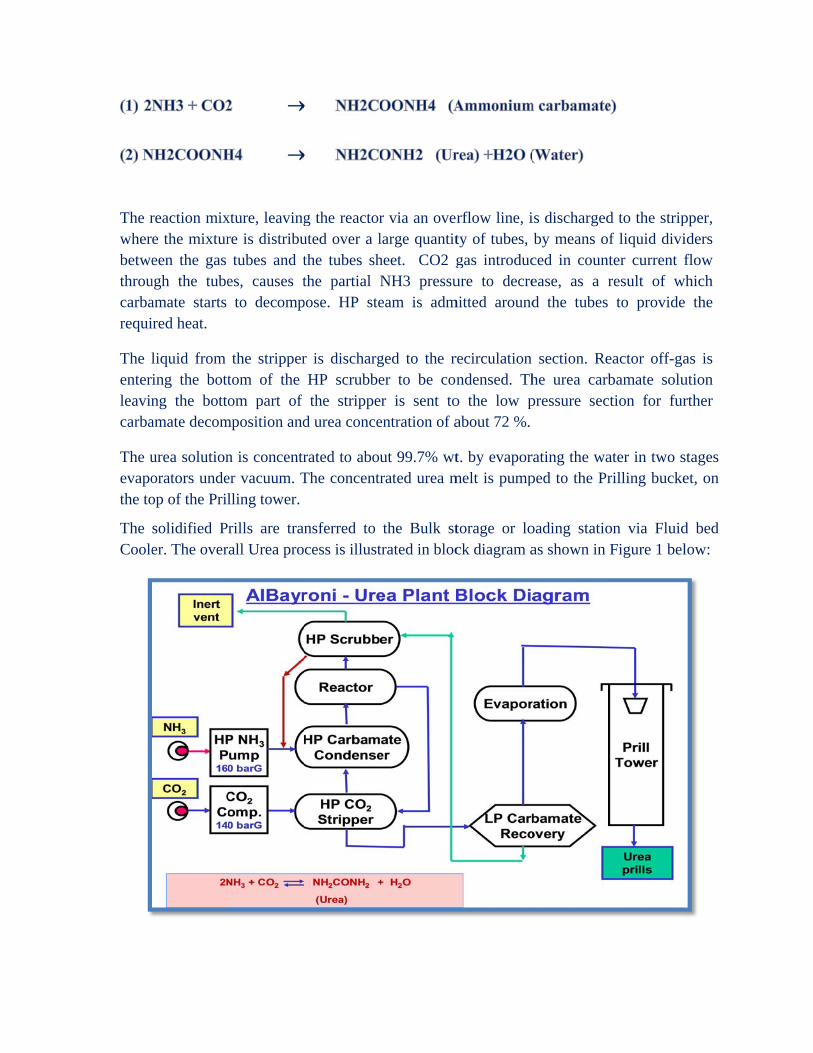
The rwherbetwethroucarbarequi
The lenterleavincarba
The uevapothe to
The Coole
reaction mixe the mixtureen the gas
ugh the tubeamate starts ired heat.
liquid from ing the bottng the bottoamate decom
urea solutionorators undeop of the Pril
solidified Per. The over
xture, leavingre is distributubes and t
es, causes tto decomp
the strippertom of the om part of
mposition and
n is concentrer vacuum. Tlling tower.
rills are tranrall Urea pro
g the reactoruted over a lthe tubes shthe partial N
pose. HP ste
r is dischargHP scrubbethe strippe
d urea conce
rated to abouThe concentr
nsferred to cess is illust
r via an overlarge quantitheet. CO2 gNH3 pressueam is adm
ged to the rer to be con
er is sent toentration of a
ut 99.7% wtrated urea m
the Bulk sttrated in bloc
Figure 1
rflow line, ity of tubes, gas introducure to decre
mitted around
recirculation ndensed. Th
o the low pabout 72 %.
t. by evapormelt is pump
torage or lock diagram a
is dischargedby means oced in counease, as a rd the tubes
section. Rehe urea carbpressure sec
rating the waped to the Pr
oading statioas shown in
d to the stripf liquid divi
nter current fresult of w to provide
eactor off-gabamate solu
ction for fur
ater in two srilling bucke
on via FluidFigure 1 bel
pper, iders flow
which e the
as is ution rther
stages et, on
d bed low:
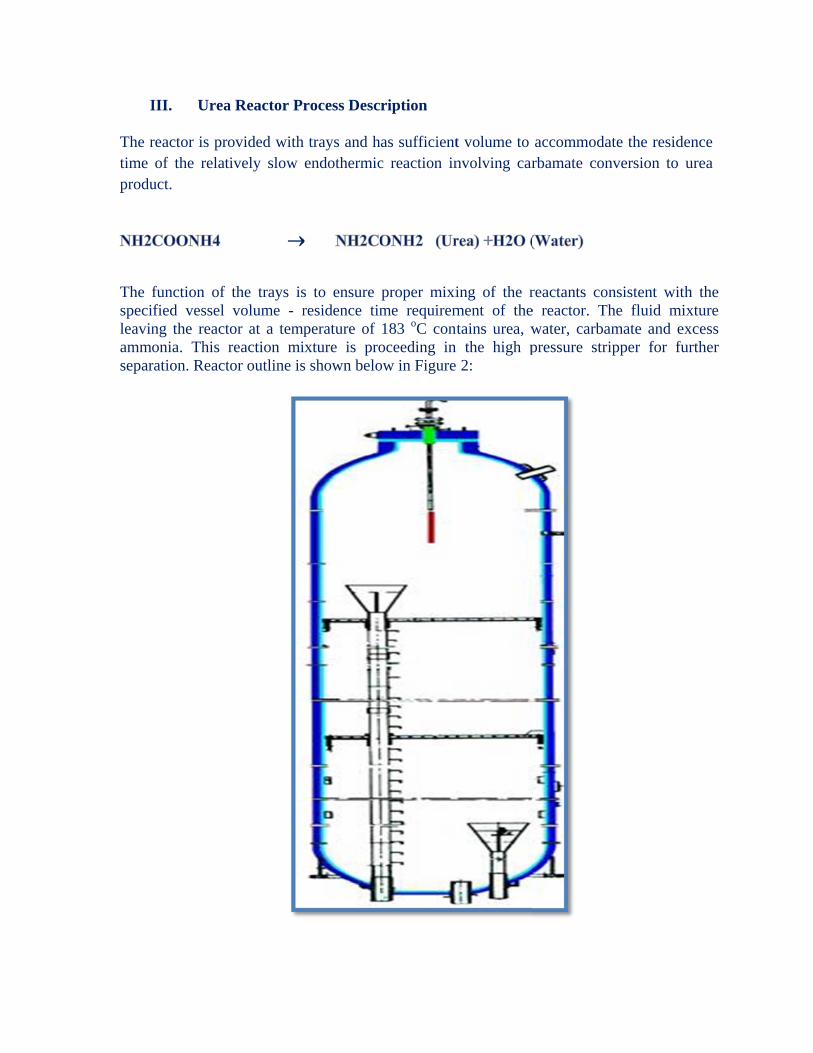
I
The rtime produ
The specileavinammsepar
III. Urea
reactor is proof the relat
uct.
function of ified vessel ng the reactonia. This ration. React
a Reactor Pr
ovided with tively slow
the trays isvolume - r
tor at a tempreaction mitor outline is
rocess Desc
trays and hendothermic
s to ensure residence timperature of xture is pro
s shown belo
ription
as sufficientc reaction in
proper mixime requirem183 oC contoceeding in ow in Figure
Figure 2
t volume to nvolving car
ing of the rment of thentains urea, wn the high p
2:
accommodarbamate con
reactants cone reactor. Thwater, carbapressure stri
ate the residenversion to
nsistent withhe fluid mi
amate and exipper for fu
ence urea
h the ixture xcess urther
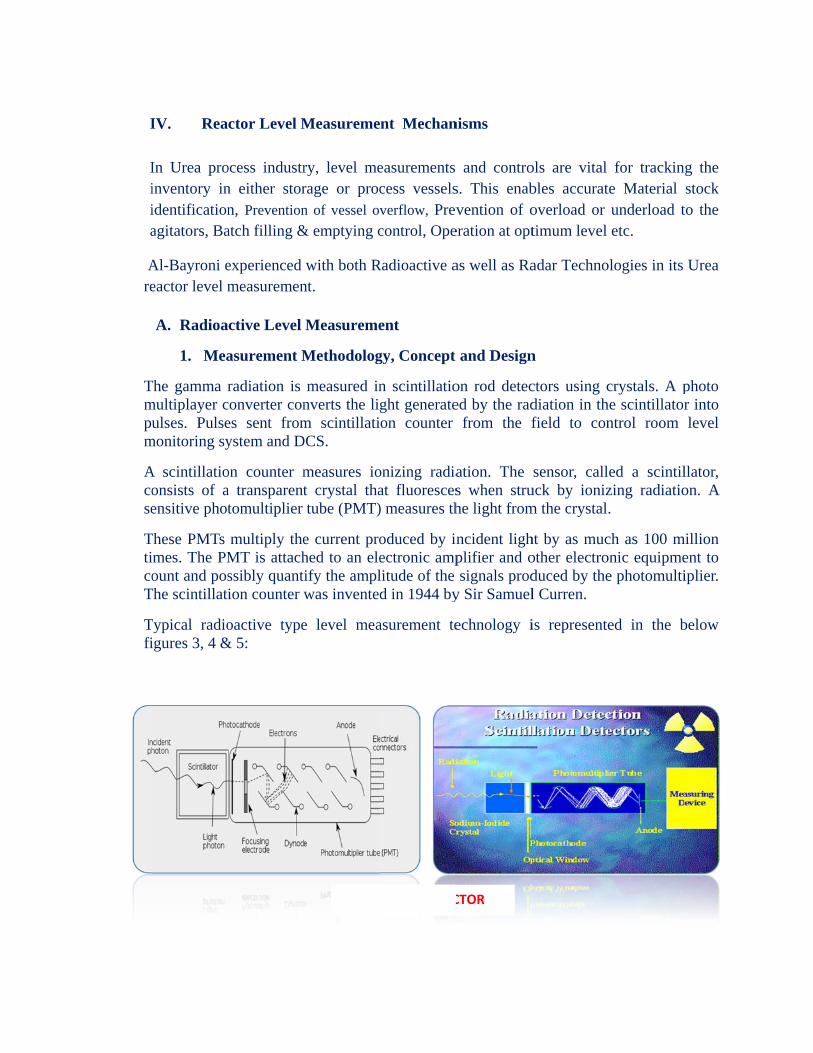
I
Iiia
Are
Tmpum
Acose
TticoT
Tfi
IV. Rea
In Urea proinventory inidentificationagitators, Ba
Al-Bayroni eeactor level m
A. Radioa
1. Mea
The gamma rmultiplayer c
ulses. Pulsemonitoring sy
A scintillatioonsists of aensitive phot
These PMTs imes. The PMount and pos
The scintillati
Typical radioigures 3, 4 &
ctor Level M
ocess industrn either storn, Prevention
atch filling &
experienced measuremen
ctive Level
asurement M
radiation is converter cones sent fromystem and D
on counter ma transparenttomultiplier
multiply theMT is attachssibly quantiion counter w
oactive type& 5:
Measureme
ry, level merage or procn of vessel ov
& emptying c
with both Rnt.
Measureme
Methodolog
measured innverts the ligm scintillati
DCS.
measures iot crystal thatube (PMT)
e current prohed to an eleify the amplwas invented
e level mea
Figu
nt Mechan
easurements cess vesselsverflow, Prevcontrol, Ope
Radioactive a
ent
gy, Concept
n scintillatioght generateon counter
onizing radiaat fluoresces) measures th
oduced by inectronic amplitude of the d in 1944 by
asurement te
ure 3 ‐ DETEC
nisms
and contros. This enabvention of o
eration at opt
as well as Ra
and Design
on rod deteced by the rad
from the f
ation. The s when struhe light from
ncident lighplifier and osignals prod
y Sir Samuel
echnology i
CTOR
ols are vital bles accuratoverload or timum level
adar Techno
n
ctors using cdiation in thfield to con
sensor, calluck by ionizm the crystal
ht by as mucother electroduced by thel Curren.
is represente
for trackinte Material underload tetc.
ologies in its
crystals. A phe scintillatorntrol room
ed a scintilzing radiatio.
ch as 100 monic equipmee photomulti
ed in the b
g the stock
to the
Urea
photo r into level
llator, on. A
million ent to iplier.
below
Nuclear rhandling
2. Hea
radiation expof nuclear m
alth and Saf
posure is cematerials is a
fety Concern
ertainly danga high potent
F
Fi
ns
gerous to thetial concern.
Figure 4 ‐ PMT
igure 5 ‐ INST
RAD
e human hea.
T
TALLATION
DIATIONS
alth and envi
ARE DANG
ironment. H
GEROUS!!
Hence,
!
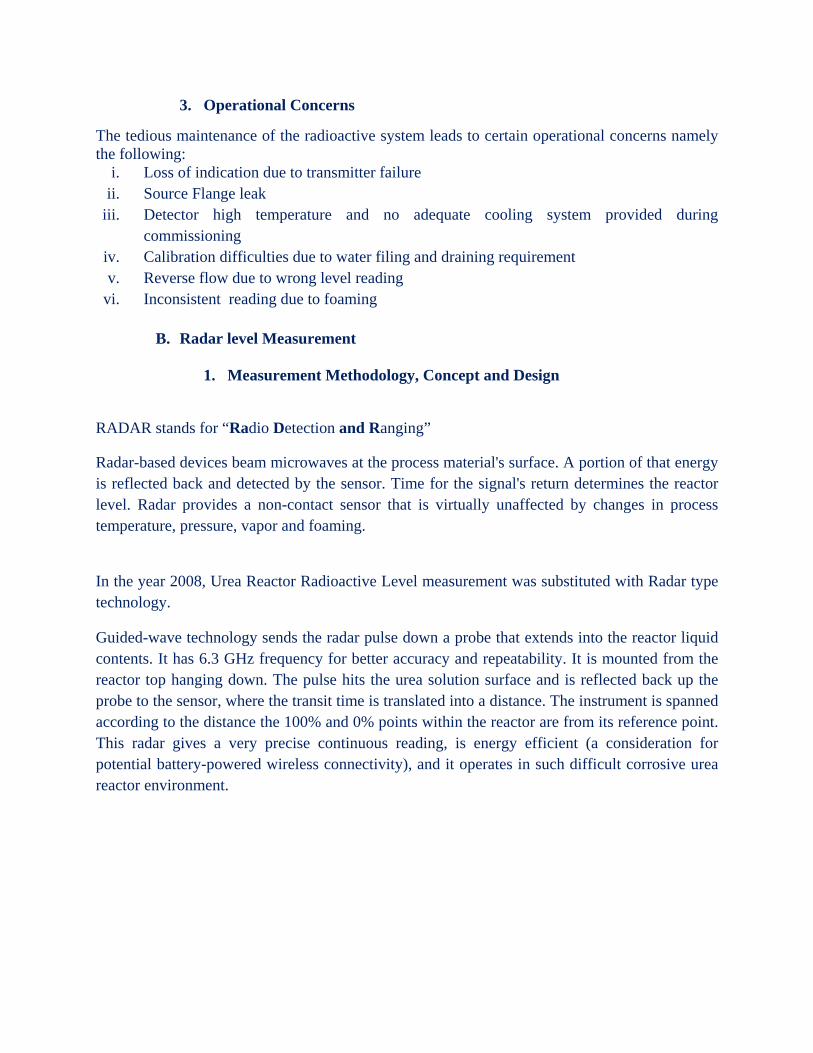
3. Operational Concerns
The tedious maintenance of the radioactive system leads to certain operational concerns namely the following:
i. Loss of indication due to transmitter failure ii. Source Flange leak
iii. Detector high temperature and no adequate cooling system provided during commissioning
iv. Calibration difficulties due to water filing and draining requirement v. Reverse flow due to wrong level reading
vi. Inconsistent reading due to foaming
B. Radar level Measurement
1. Measurement Methodology, Concept and Design
RADAR stands for “Radio Detection and Ranging”
Radar-based devices beam microwaves at the process material's surface. A portion of that energy is reflected back and detected by the sensor. Time for the signal's return determines the reactor level. Radar provides a non-contact sensor that is virtually unaffected by changes in process temperature, pressure, vapor and foaming.
In the year 2008, Urea Reactor Radioactive Level measurement was substituted with Radar type technology.
Guided-wave technology sends the radar pulse down a probe that extends into the reactor liquid contents. It has 6.3 GHz frequency for better accuracy and repeatability. It is mounted from the reactor top hanging down. The pulse hits the urea solution surface and is reflected back up the probe to the sensor, where the transit time is translated into a distance. The instrument is spanned according to the distance the 100% and 0% points within the reactor are from its reference point. This radar gives a very precise continuous reading, is energy efficient (a consideration for potential battery-powered wireless connectivity), and it operates in such difficult corrosive urea reactor environment.
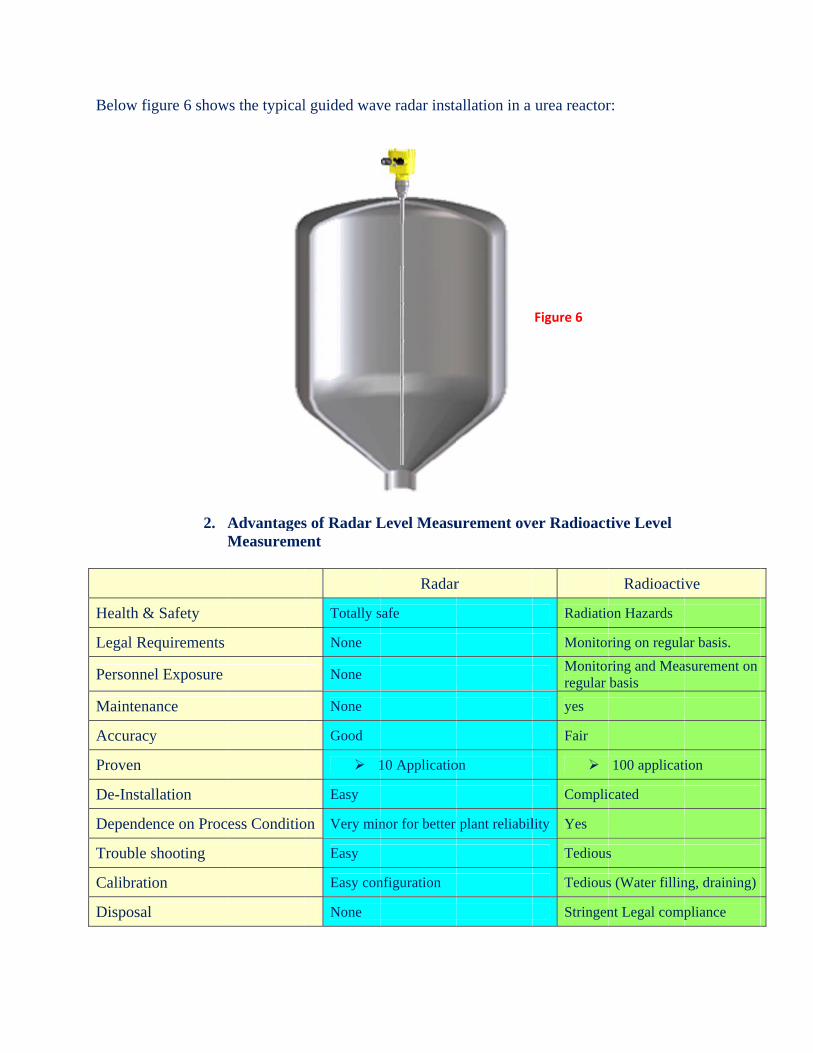
Below fig
Health &
Legal Re
Personne
Maintena
Accuracy
Proven
De-Instal
Depende
Trouble s
Calibrati
Disposal
gure 6 show
2. AM
& Safety
equirements
el Exposure
ance
y
llation
nce on Proc
shooting
on
ws the typical
AdvantagesMeasureme
ess Conditio
l guided wav
s of Radar Lent
Totally s
None
None
None
Good
1
Easy
on Very min
Easy
Easy con
None
ve radar insta
Level Measu
Radar
safe
10 Applicatio
nor for better
nfiguration
allation in a
urement ove
r
on
plant reliabil
urea reactor
er Radioact
Radiatio
Monitor
Monitorregular
yes
Fair
Compli
lity Yes
Tedious
Tedious
Stringen
Figure 6
r:
tive Level
Radioacti
on Hazards
ring on regula
ring and Meabasis
100 applicat
cated
s
s (Water fillin
nt Legal comp
ive
ar basis.
asurement on
ion
ng, draining)
pliance
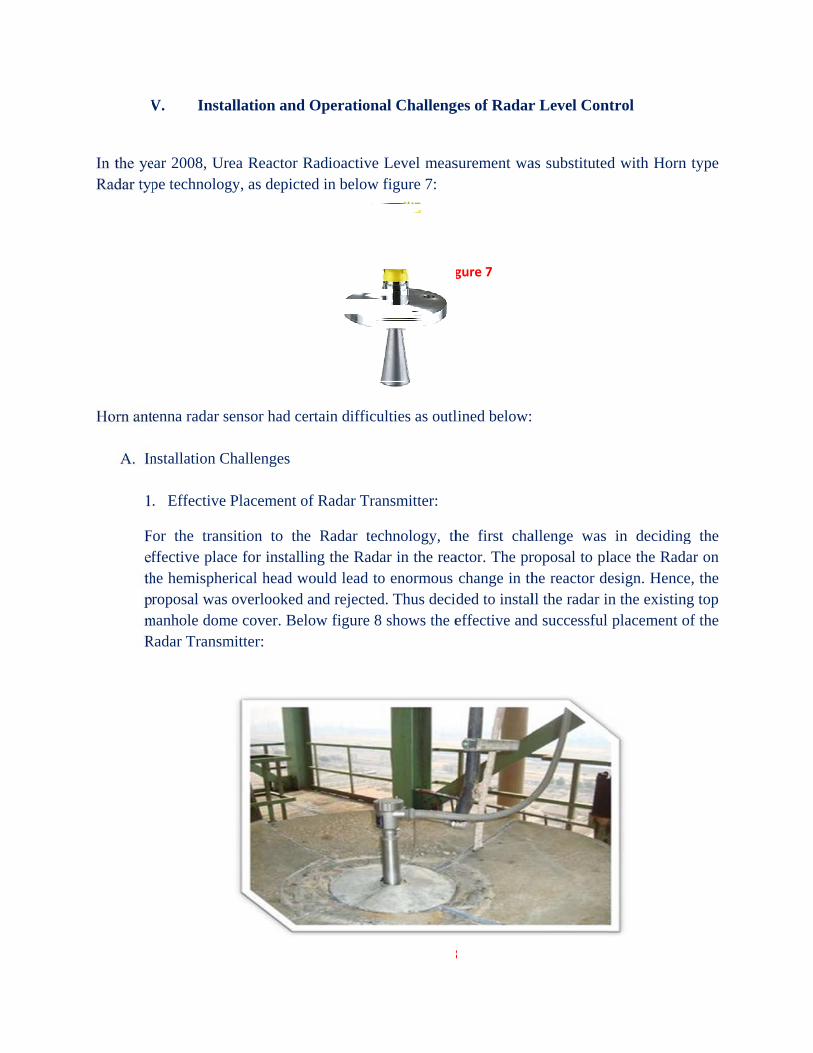
V. Insta
ear 2008, Urpe technolog
enna radar s
nstallation C
. Effective
or the transffective plache hemispheroposal was
manhole domRadar Transm
allation and
rea Reactor Rgy, as depict
sensor had ce
Challenges
Placement o
sition to thce for installerical head w
overlooked me cover. Belmitter:
d Operationa
Radioactive ted in below
ertain difficu
of Radar Tra
e Radar tecing the Rada
would lead toand rejectedlow figure 8
al Challeng
Level measfigure 7:
ulties as outl
ansmitter:
chnology, thar in the reao enormous d. Thus decid8 shows the e
Fig
Figure 8
ges of Radar
surement wa
lined below:
he first chaactor. The prchange in thded to instaleffective and
gure 7
8
r Level Con
as substituted
allenge was roposal to plhe reactor dell the radar ind successful
ntrol
d with Horn
in decidinglace the Radesign. Hencen the existinplacement o
n type
g the dar on e, the
ng top of the
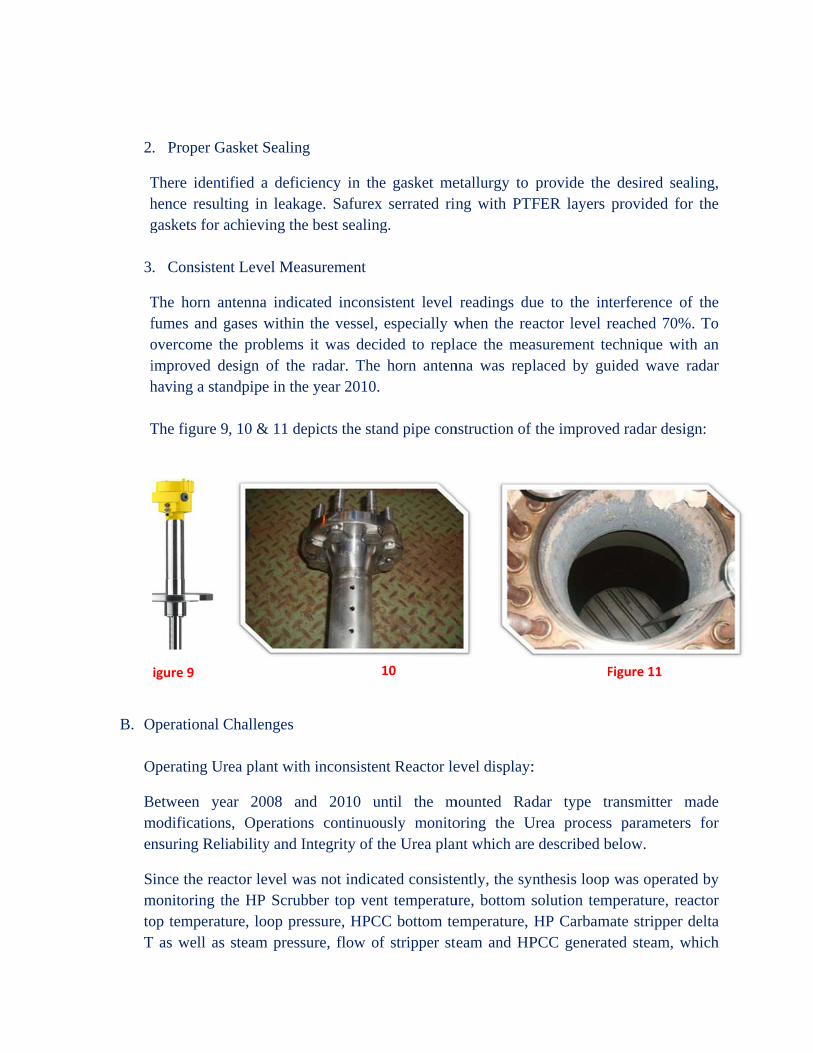
F
2
Thg
3
Tfoih T
B. O O
Bmen SmtoT
igure 9
. Proper Ga
There identihence resultgaskets for a
. Consisten
The horn anfumes and govercome thimproved dehaving a stan
The figure 9
Operational C
Operating Ur
Between yeamodificationsnsuring Reli
ince the reacmonitoring thop temperatu
T as well as
asket Sealing
ified a deficting in leakaachieving the
nt Level Mea
ntenna indicgases withinhe problems esign of thendpipe in the
, 10 & 11 de
Challenges
rea plant with
ar 2008 ans, Operationiability and I
ctor level wahe HP Scrubure, loop presteam press
g
ciency in theage. Safurexe best sealing
asurement
cated incons the vessel, it was deci
e radar. Thee year 2010.
epicts the sta
h inconsisten
nd 2010 uns continuouIntegrity of t
as not indicabber top venessure, HPCsure, flow of
Figure
e gasket mex serrated ring.
istent level especially w
ided to repla horn anten
and pipe con
nt Reactor le
until the musly monitothe Urea plan
ated consistent temperatu
CC bottom tef stripper ste
10
etallurgy to ng with PTF
readings duwhen the reace the mea
nna was repl
nstruction of
evel display:
mounted Radoring the Unt which are
ently, the synure, bottom semperature, eam and HP
provide theFER layers
ue to the inactor level rasurement telaced by gu
f the improve
:
dar type trUrea processe described b
nthesis loopsolution temHP Carbam
PCC generat
F
e desired seaprovided fo
nterference oreached 70%echnique wiuided wave
ed radar desi
ransmitter ms parameterbelow.
p was operatemperature, remate stripper
ted steam, w
Figure 11
aling, or the
of the %. To ith an radar
ign:
made rs for
ed by eactor delta
which
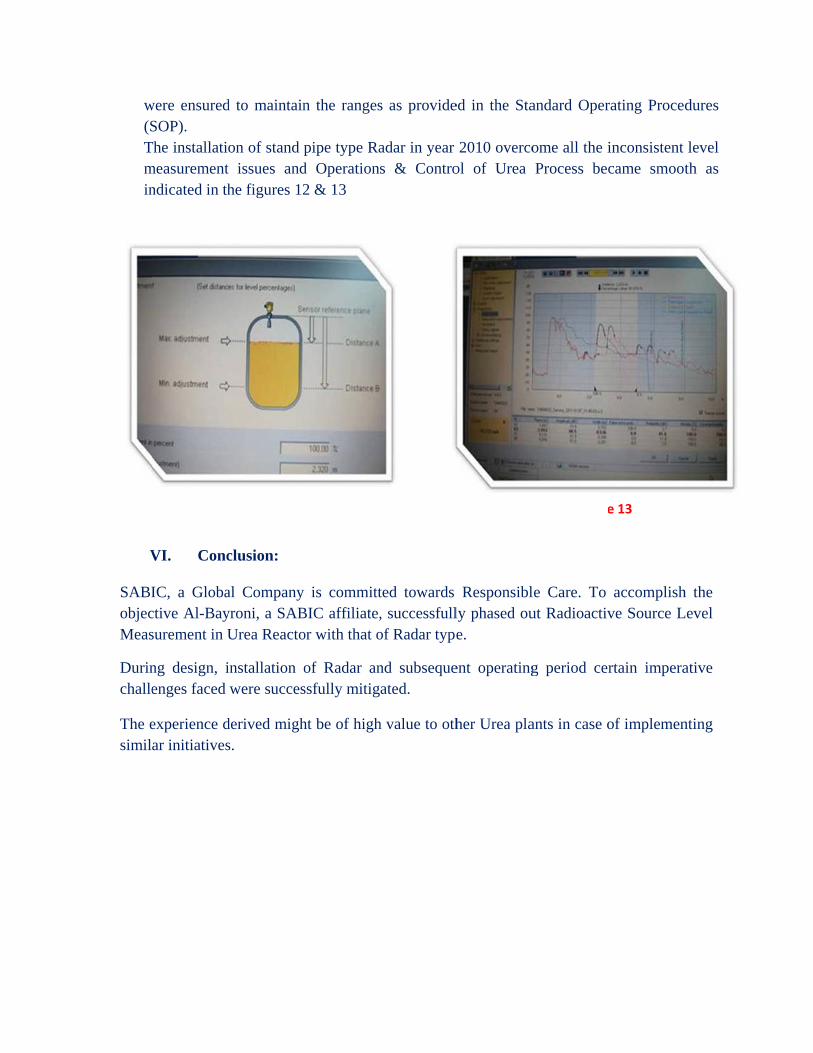
w(STmin
V
SABIobjecMeas
Durinchalle
The esimil
were ensuredSOP).
The installatimeasurementndicated in th
VI. Conc
IC, a Globactive Al-Baysurement in U
ng design, ienges faced
experience dar initiatives
d to maintain
on of stand pt issues andhe figures 12
clusion:
al Company yroni, a SABUrea Reacto
installation owere succes
derived mighs.
Figure 12
n the ranges
pipe type Rad Operations2 & 13
is committBIC affiliate,or with that o
of Radar anssfully mitig
ht be of high
s as provide
adar in year s & Contro
ted towards , successfullof Radar type
nd subsequeated.
h value to oth
ed in the Sta
2010 overcool of Urea
Responsiblly phased oue.
ent operating
her Urea pla
andard Oper
ome all the iProcess bec
le Care. To ut Radioactiv
g period cer
ants in case o
Figure
rating Proce
inconsistent came smoo
accomplishve Source L
rtain impera
of implemen
e 13
dures
level th as
h the Level
ative
nting
G
GPIC I
Initia
ative f
1
for Re
espon
P
M
sible
Prepared By
Mohamed A
Care
y:
l-Hashemi
2
Content:
Introduction………………………………………………………………………Pg. 4
GPIC Initiative for Responsible Care…………………………………………..Pg. 5
Social Responsibility and Enhancing Safety & Health………………………..Pg. 7
Socially responsible………………………………………………………………Pg12
Technology and Methods………………………………………………………..Pg. 15
Responsible Care Certification………………………………………………..Pg. 17
GPIC compliance ………………………………………………………………Pg. 19
3
‘’We are committed and looking forward enthusiastically to further enhancing our safety, security, health and environmental performance by implementing the principles and ethics of responsible care management system at our facilities.’’
Abdulrahman Jawahery – President, GPIC
4
Introduction
Gulf Petrochemical Industries Company (GPIC) was established in 1979 as a nucleus of cooperation among Gulf Cooperation Council Countries for the manufacture of fertilizers and petrochemicals. The joint venture is equally owned by the Government of the Kingdom of Bahrain, Saudi Basic Industries Corporation (SABIC) Kingdom of Saudi Arabia and Petrochemical Industries Company, Kuwait.
GPIC uses natural gas as a feedstock for its petrochemical complex. Built on a 60 hectare reclaimed area at Sitra Island, the project initially consisted of two production plants: Ammonia and Methanol together with their Utilities. The plants were commissioned in May 1985, each with a capacity of 1,000 tonnes per day (330,000 tonnes per annum).
In 1989, their capacities were further increased to 1,200 tonnes per day ( 400,000 tonnes per annum).
The success of these two plants in production and marketing impelled the management to explore other feasible downstream projects. GPIC decided to expand its operations and build a 1,700 tonnes per day (600,000 tonnes per annum) Urea Plant that was commissioned in 1998. Urea plant included its own utilities and comprehensive marine export facilities to export the finest quality granulated Urea, Worldwide.
The drive for the Urea Plant was to safeguard the environment, create further employment opportunities, improve the company’s financial position by both asset and revenue growth, as well as contribute to the fertilizer industries efforts to provide food to the nations of the world.
By 2009, in order to cut down greenhouse gas emission and improve overall efficiency of the resources by generating additional methanol and urea products, GPIC is also constructed a Carbon Dioxide Recovery Project that utilize flue gas from the Methanol reformer for the recovery of 450 tonnes per day (39,600 tonnes per annum) and Urea production by 80 tonnes per day (26,000 tonnes per annum).
5
GPIC’s initiative for Responsible Care
Responsible Care is both an ethic and a commitment that seeks to build confidence and trust in an industry that is essential to improving living standards and the quality of life.
GPIC have been living Responsible Care throughout its existing and now it had confirmed that by obtaining the RC 1400 certification in the 21 June 2010.
GPIC’s achievements are numerous and the company is proud to have won many significant awards. At the local level in 2002 GPIC won H.H. the Prime Minister’s Award for Excellence in Major industries. At regional level, in 2003 GPIC won H.H. Sheikh Mohammed bin Rashid Al Maktoom Award for Outstanding Arab Enterprise and at international level, in 2005 GPIC won the prestigious Sir George Earle Trophy from Royal Society for the prevention of Accidents (ROSPA) UK, which is awarded for the highest performance of Occupational Safety & Health Worldwide. GPIC had become the first organization outside Europe and North America to be awarded with this prestigious trophy. In 2008 GPIC won the Robert W.Campell Award for Excellence in Safety, Health and Environment Management from the National Safety Council, USA.
The company’s Management Systems are certified in accordance with ISO-9001:2000 Quality Standard , ISO-14001 Environmental Standard and the OHSAS – 18001 Occupational Health and Safety Management Systems Standard. The company had recently achieved accreditations to Publicly Available Standard (PAS 99) Integrated Management System from the British Standards Institute (BSI).
In the field of Environment and Environmental Project, GPIC is considered a role model in the protection of the Environment as we are the first regional industrial company to use practical demonstration projects to verify the eco-friendliness of its operations. A fish farm, a bird sanctuary and palm tree plantations have already been established in this regard at the GPIC complex.
The company has achieved another first in the kingdom of Bahrain with the introduction of environmental research grants to secondary schools.
It is the dedication and team work of both the executive management and employees of GPIC that must be singled out as major forces that have brought about these achievements. These unique qualities of the GPIC’s workforce are the pillars on which the future of the company can be built. There is no doubt that the employees of GPIC form the golden key to the companys future success and achievements
6
GPIC loss prevention related management systems, and associated expenditure. In comparison with fertilizer companies worldwide had shown that GPIC’s operations to be world class in a number of operational performance areas.
The Management Systems ensuring loss prevention practices are carried out constantly. quality accreditation includes ISO 9001, ISO 14001 and ISO 27001. Safety and Health utilizes the OSHAS 18001 management systems approach.
Keeping in mind the vintage of the original plant, equipment integrity remains at a very high standard reflecting continuing investment, preventive and predictive maintenance routines with regular complex turnarounds every 2 years.
An effective inspection activity including Risk Based Inspection (RBI), resourced by qualified personnel, ensures repairs, vessel replacement or metallurgy upgrading is exercised continuously.
Safety has a high profile and has been regularly recognized by organizations such as ROSPA, British Safety Council and the National Safety Council culminating in GPIC being awarded the Sir George Earle Trophy in 2005 and the R.W.Campell award in 2008. A Behaviour Based Safety program was started in 2007 and is being further strengthened and reinforced to ensure enhanced performance and control of accidents. Proactive safety measures such as reporting of ‘’Near misses’’ are used to achieve the company’s objectives of Zero Harm.
Fire protection and emergency response facilities are rated well above average by reinsures. There are a well-equipped full time on-site fire brigade, with a mutual aid agreement in place with the neighboring companies. Fire training has been an expanding and developing more and more in recent past years.
We have fire proofing features. Retrofit fireproofing has been applied in a number of different areas all over the plant .
There have been improvements in fire and gas detection and alarm systems in recent years.
Mechanical integrity is addressed via shutdowns, inspection and by recommended replacement of equipment. there are similar programs for process control and protective instrumentation systems, fire detection and alarm.
The GPIC Risk Management system is intended to add value to the company by contributing to the demonstrable achievement of objectives and improvement of, for example, efficiency in operations, environmental protection, health and safety, product quality , legal and regulatory compliance.
7
Within GPIC, risk management is an integral part of the company’s processes. To this end, risk management is part of the responsibilities of management; it is not a stand-alone activity but part of the main activities and processes of the company.
The risk Management system process at GPIC is an interactive process and involves risk identification, risk analysis, risk evaluation and risk treatment. The process risk management strategy addresses fundamental safety, health and environment issues in petrochemical plants.
Process Hazard Assessment (PHA) is applied to modifications/ new construction proposals, capital projects and existing process units to identify and analyze the significance of any potential hazard and or operational constraints that may be involved in the proposed modification, new construction, capital projects etc.
Work Practices, Procedures and Regular training:
At GPIC we have effective procedures related to safe work practices and emergency response. All maintenance jobs are carried out as per an approved permit to work system to ensure safety and controlled work.
Further, we have a comprehensive emergency response procedures to provide all employees with the required information for a swift, effective and fast response to any emergency situation
Additionally, different books/ handbooks being issued such as a chemical handbook has been prepared to provide relevant information on the hazards related to the chemicals used in the complex. these three manual s in booklets form have been provided to all GPIC employees.
Regular emergency response based exercises are carried out internally and with the mutual aid neighboring companies.
‘’GPIC is an example of a perfect balance between industry, environment and caring for human resources’’
Dr.J.Tickel best seller Australian Author
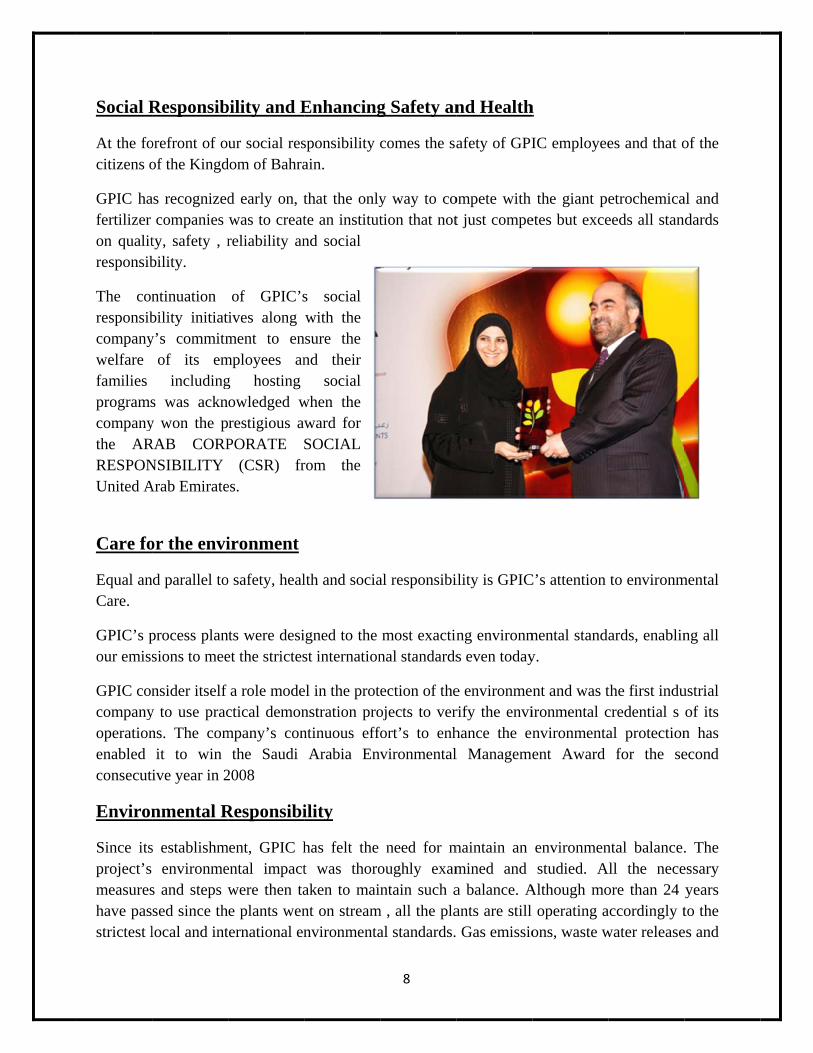
Social R
At the focitizens o
GPIC hafertilizer on qualitresponsib
The conresponsibcompanywelfare families programscompanythe ARRESPONUnited A
Care fo
Equal anCare.
GPIC’s pour emiss
GPIC concompanyoperationenabled consecut
Environ
Since itsproject’s measureshave passtrictest l
Responsib
orefront of ouof the Kingd
as recognizedcompanies
ty, safety , rbility.
ntinuation bility initiaty’s commitm
of its emincluding
s was ackny won the pRAB CORPNSIBILITY Arab Emirate
or the envi
nd parallel to
process plansions to mee
nsider itself y to use pracns. The comit to win
ive year in 2
nmental R
s establishmenvironme
s and steps wsed since thlocal and int
bility and E
ur social resdom of Bahra
d early on, twas to creatreliability an
of GPIC’sives along ment to en
mployees ang hosting owledged wrestigious awPORATE
(CSR) fres.
ironment
o safety, heal
nts were desiet the strictes
a role modectical demonmpany’s con
the Saudi 2008
Responsibi
ment, GPIC hental impactwere then tae plants wen
ternational en
Enhancing
sponsibility cain.
that the onlyte an institutnd social
s social with the
nsure the nd their
social when the ward for SOCIAL rom the
lth and socia
igned to the st internation
el in the protnstration prontinuous effo
Arabia Env
ility
has felt the t was thoroaken to mainnt on streamnvironmenta
8
g Safety an
comes the sa
y way to cotion that not
al responsibi
most exactinnal standards
ection of theojects to verfort’s to enhvironmental
need for moughly examntain such a
m , all the plaal standards.
nd Health
afety of GPI
ompete with t just compe
ility is GPIC
ng environms even today
e environmerify the envihance the enl Manageme
maintain an mined and a balance. Aants are still Gas emissio
h
IC employee
the giant peetes but exce
C’s attention
mental standay.
nt and was tironmental cnvironmentaent Award
environmenstudied. A
Although mooperating a
ons, waste w
es and that o
etrochemicaeeds all stan
to environm
ards, enablin
the first inducredential s al protection
for the se
ntal balance.ll the nece
ore than 24 accordingly twater release
of the
al and dards
mental
ng all
ustrial of its n has econd
. The essary years to the es and
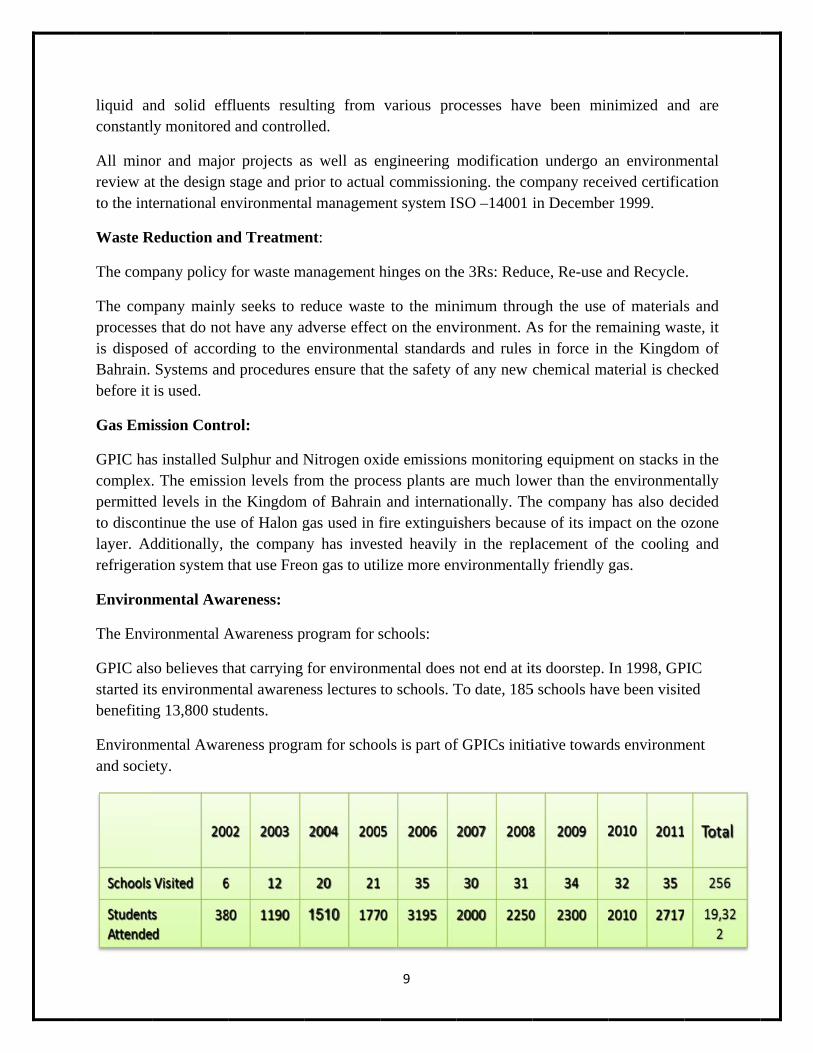
liquid anconstantl
All minoreview atto the int
Waste R
The comp
The comprocessesis disposBahrain. before it
Gas Emi
GPIC hacomplex.permittedto disconlayer. Adrefrigerat
Environ
The Envi
GPIC alsstarted itbenefitin
Environmand socie
nd solid effly monitored
or and majot the design ternational en
Reduction an
pany policy
mpany mainlys that do notsed of accorSystems andis used.
ission Contr
s installed S. The emissid levels in thntinue the usdditionally, tion system t
mental Awa
ironmental A
so believes ths environme
ng 13,800 stu
mental Awarety.
ffluents resud and control
or projects astage and prnvironmenta
nd Treatme
for waste m
y seeks to rt have any arding to the d procedure
rol:
Sulphur and Nion levels frhe Kingdomse of Halon gthe companthat use Freo
areness:
Awareness p
hat carrying ental awareneudents.
reness progra
ulting from lled.
as well as erior to actuaal manageme
nt:
management h
reduce wasteadverse effec
environmens ensure that
Nitrogen oxiom the proc
m of Bahraingas used in fny has inveson gas to uti
program for s
for environmess lectures
am for schoo
9
various pro
engineering al commissioent system IS
hinges on th
e to the minct on the envntal standardt the safety o
ide emissioncess plants an and internafire extinguisted heavilylize more en
schools:
mental does to schools. T
ols is part of
ocesses hav
modificationoning. the coSO –14001
he 3Rs: Redu
nimum throuvironment. Ads and rules of any new
ns monitorinare much lowationally. Thishers becau
y in the replnvironmenta
not end at itTo date, 185
f GPICs initi
ve been min
n undergo aompany recein Decembe
uce, Re-use a
ugh the use As for the rem
in force in chemical ma
ng equipmenwer than thehe company use of its implacement of
ally friendly
ts doorstep. 5 schools hav
iative toward
nimized and
an environmeived certificer 1999.
and Recycle
of materialsmaining wasthe Kingdo
aterial is che
nt on stacks ie environmen
has also depact on the of the coolinggas.
In 1998, GPve been visit
ds environm
d are
mental cation
.
s and ste, it
om of ecked
in the ntally cided ozone g and
PIC ted
ment
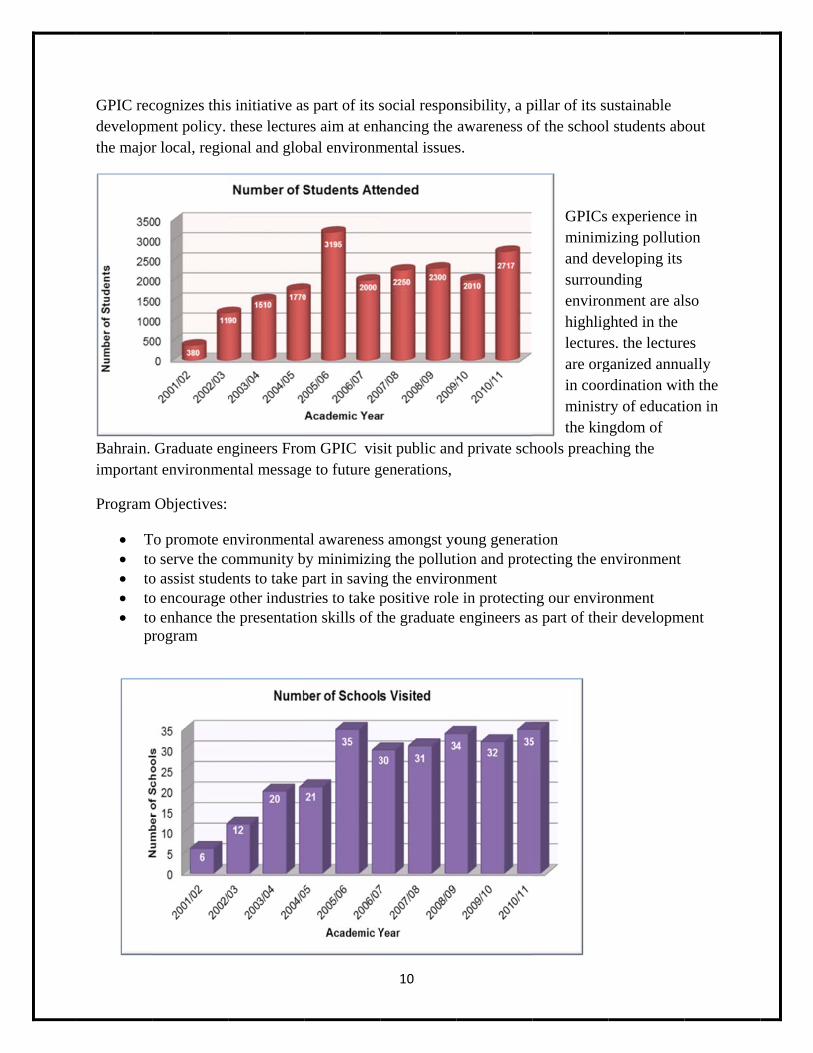
GPIC recdevelopmthe major
Bahrain. importan
Program
T to to to to
pr
cognizes thisment policy. r local, regio
Graduate ennt environme
Objectives:
To promote eo serve the co assist studeo encourage o enhance throgram
s initiative asthese lecture
onal and glob
ngineers Fromental messag
environmentaommunity bents to take pother indust
he presentatio
s part of its ses aim at enhbal environm
m GPIC visge to future g
al awarenessby minimizinpart in savintries to take pon skills of t
10
social responhancing the mental issues
sit public andgenerations,
s amongst yong the polluting the enviropositive rolethe graduate
nsibility, a pawareness os.
d private sch
oung generation and protonment e in protectinengineers as
pillar of its suof the school
GPICs minimiand devsurrounenvironhighliglectureare orgin coorministrthe kin
hools preach
ation tecting the en
ng our enviros part of thei
ustainable l students ab
experience izing pollutiveloping its nding nment are alghted in the s. the lecture
ganized annurdination witry of educatingdom of hing the
nvironment
onment ir developm
out
in on
lso
es ually th the ion in
ent
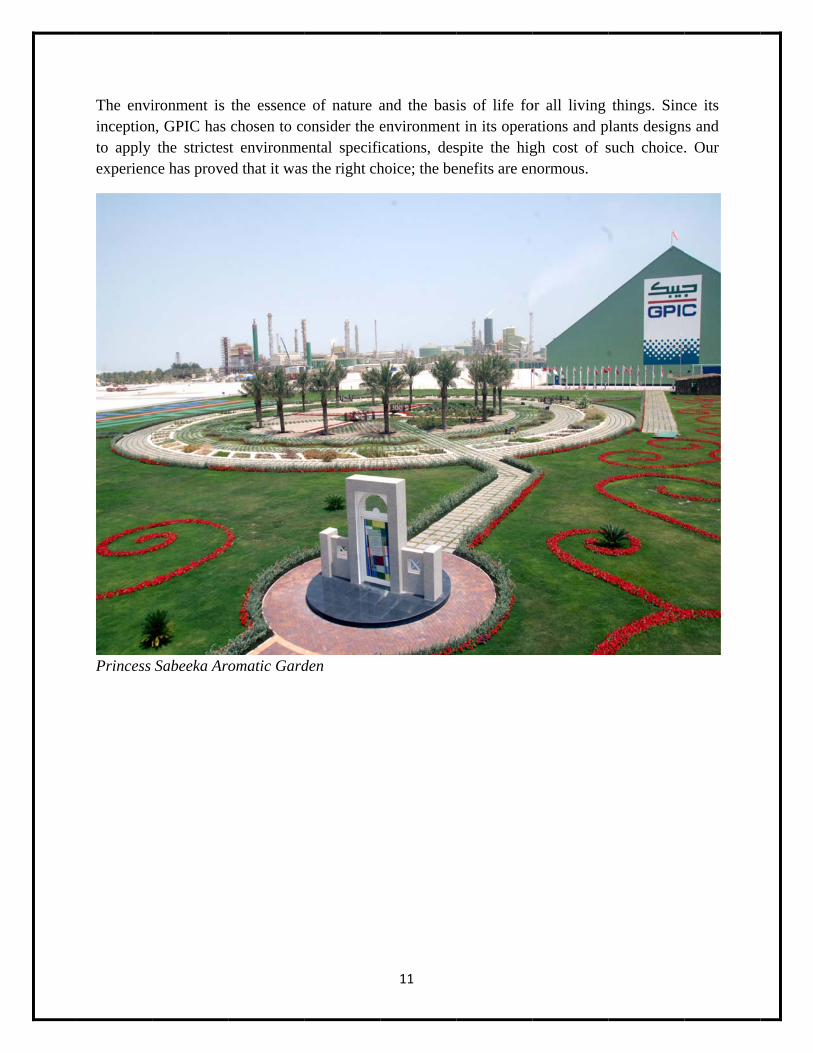
The enviinceptionto apply experienc
Princess
ironment is n, GPIC has
the strictesce has prove
Sabeeka Ar
the essencechosen to co
st environmeed that it was
omatic Gard
e of nature aonsider the eental specifis the right ch
den
11
and the basienvironmentications, deshoice; the be
is of life fot in its operaspite the higenefits are en
or all living ations and pgh cost of snormous.
things. Sinclants designsuch choice.
ce its ns and . Our
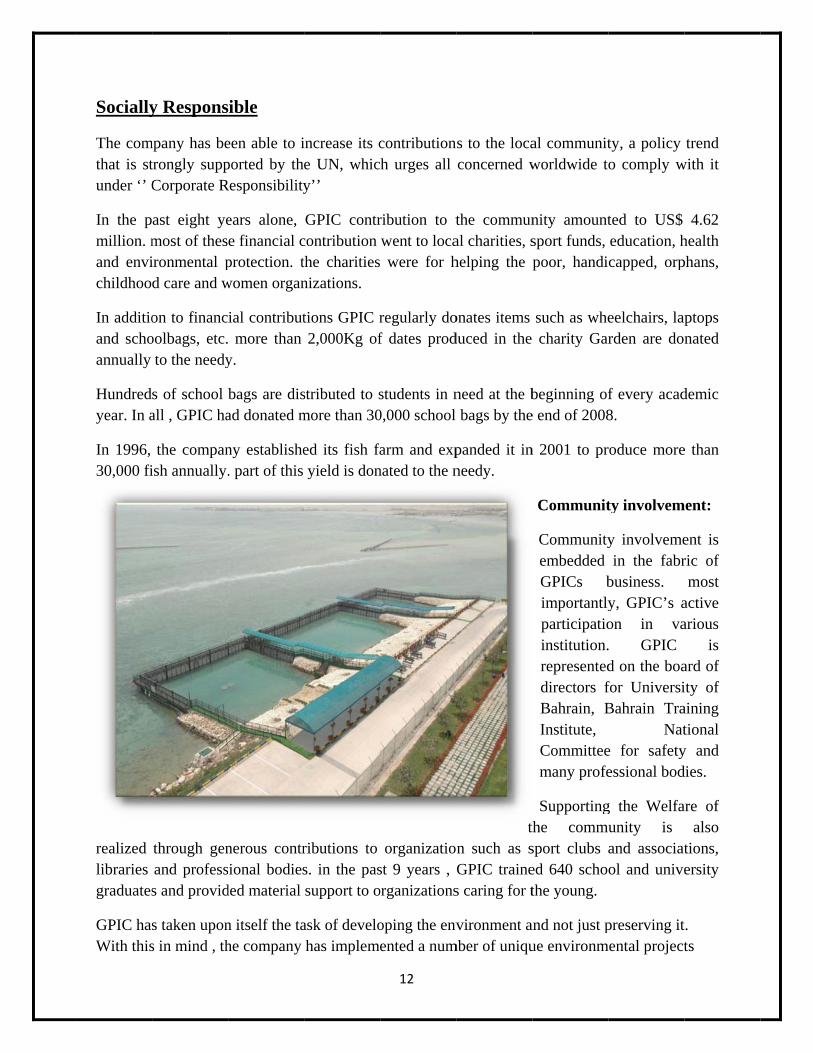
Socially
The comthat is stunder ‘’ C
In the pmillion. mand envichildhoo
In additioand schoannually
Hundredyear. In a
In 1996, 30,000 fi
realized libraries graduates
GPIC hasWith this
y Respons
mpany has betrongly suppCorporate R
ast eight yemost of thesironmental pd care and w
on to financoolbags, etc.
to the needy
s of school all , GPIC ha
the companish annually.
through genand professs and provid
s taken upons in mind , th
ible
een able to iported by the
Responsibility
ears alone, e financial cprotection. twomen organ
ial contribut more than
y.
bags are disad donated m
ny establishe. part of this
nerous contrional bodies
ded material
n itself the tahe company
increase its ce UN, whicy’’
GPIC contrcontribution the charitiesnizations.
tions GPIC r2,000Kg of
stributed to smore than 30
ed its fish fayield is don
ributions to s. in the passupport to o
ask of develohas impleme
12
contributionh urges all
ribution to twent to loca were for h
regularly dof dates prod
students in n0,000 school
farm and expnated to the n
organizatiost 9 years , organizations
oping the envented a num
ns to the locaconcerned w
the communal charities, shelping the p
onates items duced in the
need at the b bags by the
panded it inneedy.
tn such as sGPIC traines caring for t
vironment amber of uniqu
al communitworldwide to
nity amountsport funds, poor, handi
such as whe charity Gar
beginning ofe end of 2008
n 2001 to pr
Communit
Communityembedded GPICs bimportantlyparticipatioinstitution.representeddirectors fBahrain, BInstitute, Committeemany profe
Supportingthe commusport clubs aed 640 schothe young.
and not just pue environm
ty, a policy o comply w
ted to US$ education, hcapped, orp
eelchairs, laprden are don
f every acad8.
roduce more
ty involvem
y involvemein the fabr
business. y, GPIC’s aon in va. GPIC d on the boafor UniversiBahrain Tra
Nate for safetyessional bod
g the Welfaunity is and associatol and unive
preserving itmental project
trend with it
4.62 health phans,
ptops nated
demic
e than
ment:
ent is ric of most
active arious
is ard of ity of aining tional
y and dies.
are of also
tions, ersity
t. ts
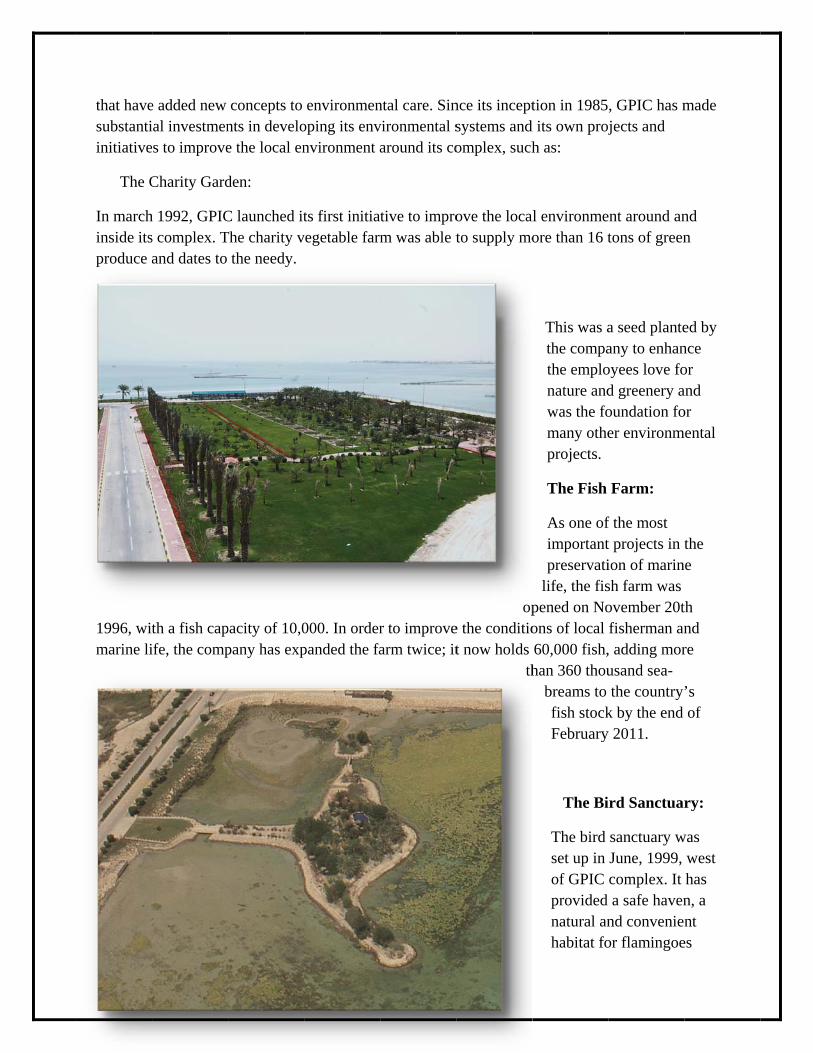
that havesubstantiinitiative
The C
In marchinside itsproduce a
1996, witmarine li
e added new ial investmens to improve
Charity Gard
h 1992, GPICs complex. Tand dates to
th a fish capife, the comp
concepts to nts in develoe the local en
den:
C launched itThe charity v
the needy.
pacity of 10,0pany has exp
environmenoping its envnvironment a
ts first initiavegetable farm
000. In orderpanded the fa
13
ntal care. Sinvironmental saround its co
tive to improm was able t
r to improvearm twice; it
nce its inceptsystems andomplex, such
ove the locato supply mo
ope the conditiot now holds
th
tion in 1985d its own projh as:
al environmeore than 16 t
This was athe compathe emplonature andwas the fomany otheprojects.
The Fish
As one ofimportantpreservati
life, the fispened on Noons of local 60,000 fish,han 360 thou
breams to fish stockFebruary
The Bi
The bird set up in of GPIC provided natural anhabitat fo
, GPIC has mjects and
ent around antons of green
a seed planteany to enhanoyees love fod greenery aoundation foer environm
Farm:
f the most t projects in tion of marinsh farm was ovember 20tfisherman an, adding morusand sea-the country
k by the end y 2011.
ird Sanctuar
sanctuary wJune, 1999, complex. It a safe haven
nd convenienor flamingoe
made
nd n
ed by nce or and or
mental
the e
th nd re
’s of
ry:
was west has n, a nt
es
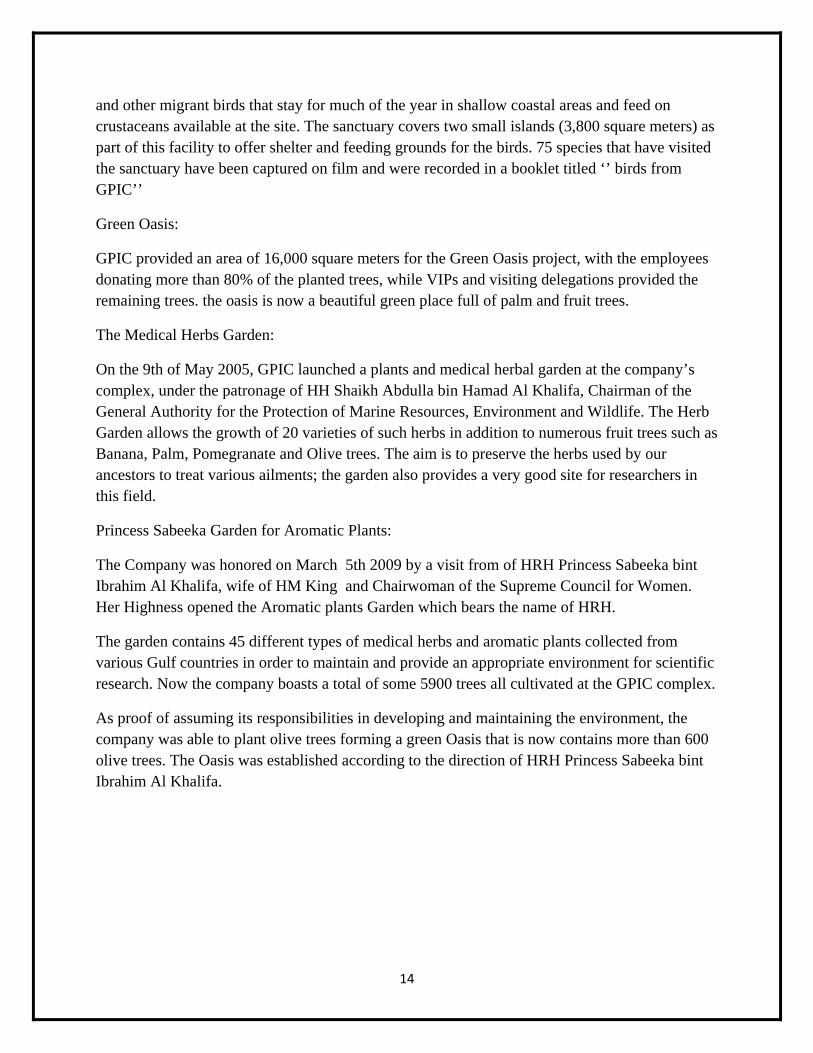
14
and other migrant birds that stay for much of the year in shallow coastal areas and feed on crustaceans available at the site. The sanctuary covers two small islands (3,800 square meters) as part of this facility to offer shelter and feeding grounds for the birds. 75 species that have visited the sanctuary have been captured on film and were recorded in a booklet titled ‘’ birds from GPIC’’
Green Oasis:
GPIC provided an area of 16,000 square meters for the Green Oasis project, with the employees donating more than 80% of the planted trees, while VIPs and visiting delegations provided the remaining trees. the oasis is now a beautiful green place full of palm and fruit trees.
The Medical Herbs Garden:
On the 9th of May 2005, GPIC launched a plants and medical herbal garden at the company’s complex, under the patronage of HH Shaikh Abdulla bin Hamad Al Khalifa, Chairman of the General Authority for the Protection of Marine Resources, Environment and Wildlife. The Herb Garden allows the growth of 20 varieties of such herbs in addition to numerous fruit trees such as Banana, Palm, Pomegranate and Olive trees. The aim is to preserve the herbs used by our ancestors to treat various ailments; the garden also provides a very good site for researchers in this field.
Princess Sabeeka Garden for Aromatic Plants:
The Company was honored on March 5th 2009 by a visit from of HRH Princess Sabeeka bint Ibrahim Al Khalifa, wife of HM King and Chairwoman of the Supreme Council for Women. Her Highness opened the Aromatic plants Garden which bears the name of HRH.
The garden contains 45 different types of medical herbs and aromatic plants collected from various Gulf countries in order to maintain and provide an appropriate environment for scientific research. Now the company boasts a total of some 5900 trees all cultivated at the GPIC complex.
As proof of assuming its responsibilities in developing and maintaining the environment, the company was able to plant olive trees forming a green Oasis that is now contains more than 600 olive trees. The Oasis was established according to the direction of HRH Princess Sabeeka bint Ibrahim Al Khalifa.
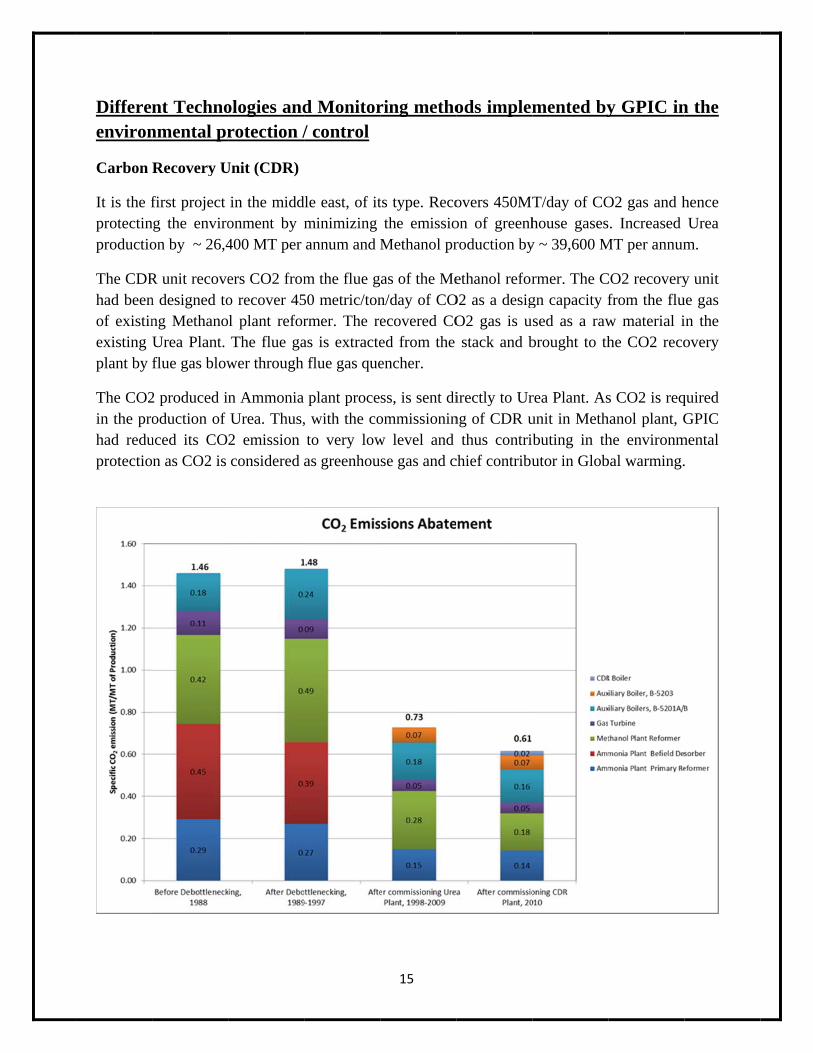
Differeenviron
Carbon
It is the fprotectinproductio
The CDRhad beenof existinexisting plant by
The CO2in the prohad reduprotectio
nt Technonmental pr
Recovery U
first project ng the enviroon by ~ 26,4
R unit recoven designed tong MethanoUrea Plant. flue gas blow
2 produced inoduction of
uced its COn as CO2 is
ologies androtection /
Unit (CDR)
in the middonment by m400 MT per
ers CO2 fromo recover 45l plant reforThe flue ga
wer through
n Ammonia Urea. Thus,2 emission considered a
d Monitor/ control
dle east, of itminimizing annum and M
m the flue g50 metric/tonrmer. The reas is extracteflue gas que
plant proce, with the coto very lowas greenhou
15
ring metho
ts type. Recothe emissio
Methanol pr
as of the Men/day of COecovered COed from the encher.
ss, is sent diommissioninw level and se gas and c
ods implem
overs 450MTon of greenhroduction by
ethanol reforO2 as a desigO2 gas is ustack and b
irectly to Urng of CDR u
thus contribchief contribu
mented by
T/day of COhouse gasesy ~ 39,600 M
rmer. The Cgn capacity fsed as a rawbrought to th
rea Plant. Asunit in Methbuting in thutor in Glob
y GPIC in
O2 gas and h. Increased
MT per annum
CO2 recoveryfrom the fluw material ihe CO2 reco
s CO2 is reqhanol plant, Ghe environmbal warming.
n the
hence Urea
m.
y unit ue gas in the overy
quired GPIC
mental .
16
Monitoring:
Environmental report is prepared quarterly, by which it covers all the air emissions and water effluents to the sea, including all the waste produced in the complex. This report is documented and a copy is sent to the environmental directorate of Bahrain.
A online monitoring system is also installed in all the stacks located in the plant. This online monitoring is directly connected with the environmental directorate of Bahrain also.
To demonstrate GPIC adherence to Bahrain environmental legislation, a Mobile Air Quality monitoring unit has been procured and located near Shaikha Sabika Aromatic Garden at the south west of GPIC complex. The unit is installed on a trailer so it can be moved to other locations when required. The unit is provided with gas analysers to measure the gaseous pollutants concentration at the proximity of the unit in addition to the pollutants source direction (e.g. East, West, etc.).
In addition, the unit can measure wind direction, wind speed, Air temperature and relative humidity.
All the effluent water , which is sent to the sea water outfall is first undergo a complete treatment before introducing it back to the sea
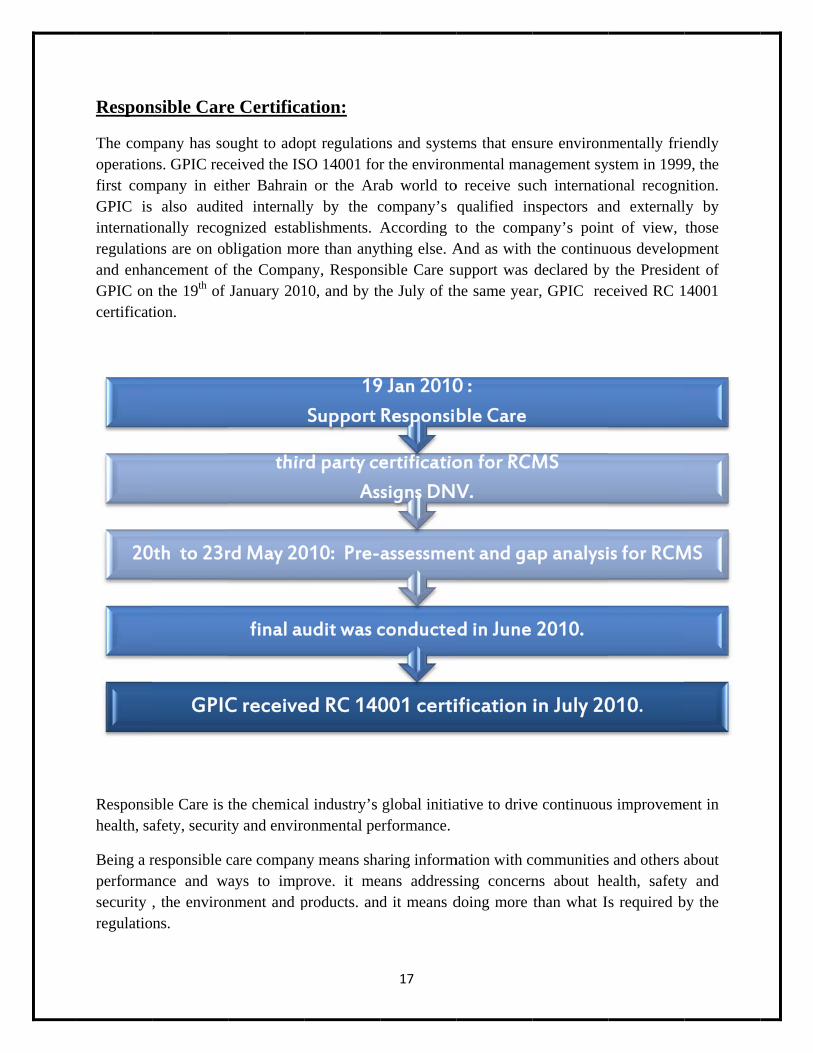
Respon
The comoperationfirst comGPIC isinternatioregulatioand enhaGPIC oncertificat
Responsihealth, sa
Being a rperformasecurity regulatio
20
nsible Care
mpany has sons. GPIC rec
mpany in eit also auditonally recogns are on ob
ancement of n the 19th of tion.
ible Care is tafety, securit
responsible cance and w, the environns.
GPIC
0th to 23r
e Certifica
ought to adopceived the ISther Bahrainted internallgnized estabbligation mof the CompaJanuary 201
the chemicaty and enviro
care companays to imprnment and p
C receive
final au
rd May 20
thir
ation:
pt regulationSO 14001 forn or the Araly by the cblishments. Aore than anytny, Respons
10, and by th
al industry’s onmental pe
ny means sharove. it meproducts. and
ed RC 140
udit was c
010: Pre-
rd party ce
As
19
Support
17
ns and syster the environab world tocompany’s According tthing else. Asible Care suhe July of th
global initiaerformance.
aring informeans addressd it means d
001 certi
conducte
assessme
ertificatio
signs DNV
9 Jan 2010
Responsi
ems that ensnmental mano receive suqualified into the compAnd as with upport washe same yea
ative to drive
mation with csing concerndoing more
ification
d in June
nt and ga
on for RCM
V.
0 :
ble Care
ure environmnagement sych internatio
nspectors anpany’s pointhe continudeclared by
ar, GPIC rec
e continuous
communitiesns about hethan what I
in July 20
2010.
ap analysi
MS
mentally frieystem in 1999onal recognnd externallnt of view, uous developy the Presideceived RC 1
s improveme
s and others aealth, safetys required b
010.
is for RCM
endly 9, the
nition. ly by those
pment ent of 14001
ent in
about y and by the
MS
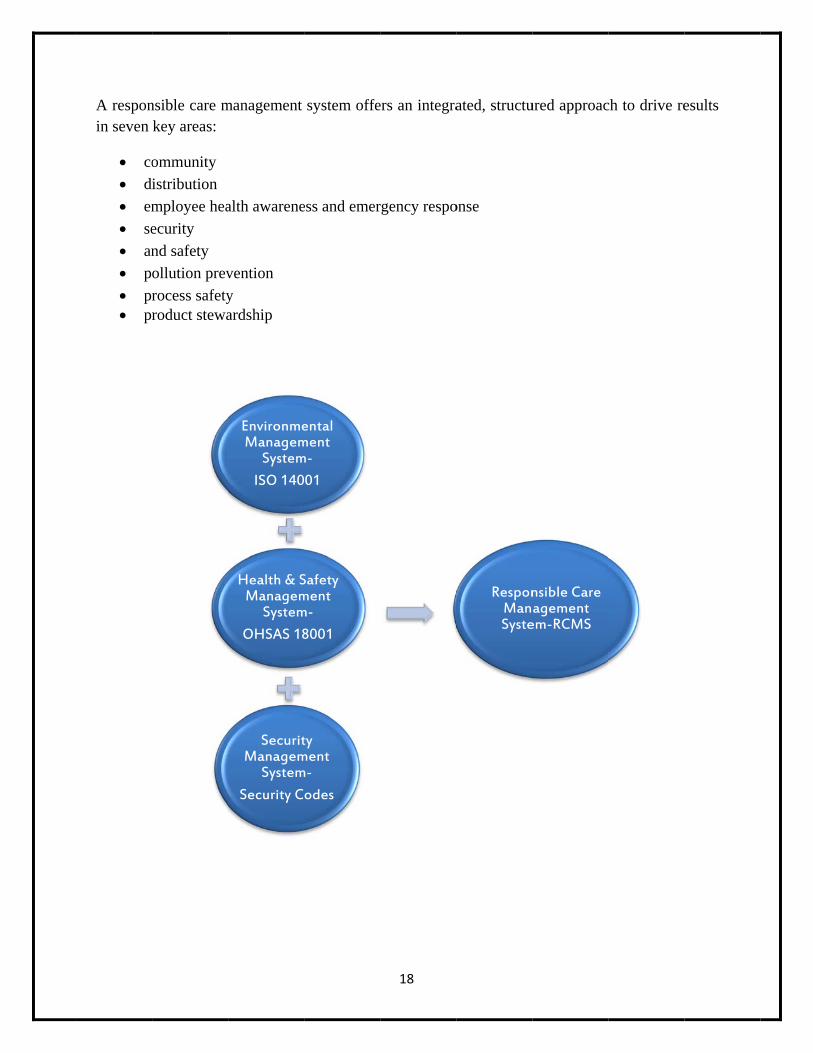
A responin seven
co
d
em
se
an
p
pr pr
nsible care mkey areas:
ommunity
istribution
mployee hea
ecurity
nd safety
ollution prev
rocess safetyroduct stewa
management
alth awarene
vention
y ardship
EnvironmeManagem
SystemISO 140
Health & SManagem
SystemOHSAS 18
SecuritManagem
SystemSecurity C
system offe
ess and emer
ental ment m-
01
Safety ment m-8001
ty ment m-
odes
18
ers an integra
rgency respo
ated, structu
onse
ResponManSyste
ured approac
nsible Care agement
em-RCMS
ch to drive reesults
19
GPIC’s complies with the Responsible Care of Codes of Practice:
7 Responsible Care codes of Practice:
1. Community Awareness and Emergency Code: Being open to the community and respond to the public’s questions and concerns about health and safety and environment. GPIC has a comprehensive emergency response procedures and plans to protect employees and communities by responding rapidly and effectively to any emergency.
2. Security Code: A comprehensive security plan has been set by the GPIC management to protect people, property, products, processes, information and information systems to enhance security, including security against potential terrorist attack.
3. Process safety Code: The plants are designed according to sound engineering practices, built, operated and maintained properly and periodically reviewed for conformance. Dynamic systems established in place to protect from harmful effects stemming from operation, through a comprehensive risk assessment and by reducing and controlling risks through continues emission monitoring, safe operating procedures, training and of our employees, and continuously and systemically audit operation and activities. (PSM)
4. Employee Health and Safety Code: in addition to the compliance of OHSAS 18001 and ISO 14001, the company commits to continually improve work site health and safety, by adapting practices that provides a multidisciplinary means to identify and assess hazards, prevent unsafe acts and conditions, maintain and improve employee health, and foster communication on health and safety issues. this will enable us to protects and promote the health and safety of employees, contractors and the public and protect the environment.
5. Distribution Code: standards, procedures and training for the storage and handling of chemical products are followed to ensure the safe distribution of our product. we are currently working with our partners SABIC & PIC to further improve this aspect.
6. Pollution Code: In addition to adhering to the government emission regulation, the company is continually seeking the best engineering practices to reduce the amount of all contaminants and pollutants released to the air, water, land and wastes generated from company facilities. These reductions are intended to respond to public concerns with the existence of such releases, and to further increase the margin of safety for public health and the environment. Our system in terms of pollution control is governed by ISO 14001.

20
7. Products Stewardship: Health, safety and environmental protection is an integral part of designing, manufacturing, marketing, distributing, using, recycling and disposing of our products.
PRODUCTION OF NP, NPK AND COMPOUND UREA BASED FERTILIZERS (UREA+
FERTILIZERS) IN HIGH SPEED DRUM GRANULATOR
___________________________________________________________________
By the present moment the demand and supply of compound fertilizers has
been showing tremendous growth and it’s expected to steadily increase in the future
outrunning the average demand for other types of fertilizers. Market success of
compound NP and NPK fertilizers which production exceeded the level of 65 million
tons in 2010 is explained by following reasons:
- they contain higher concentration of nutrients, decreasing production,
handling and transportation costs and cost for soil application;
- compound fertilizers have better physical, chemical and mechanical
properties compared to regular fertilizers;
- compound fertilizers offer a wider variety of options and can be adjusted to
satisfy demand in accordance with particular soil composition.
Increased demand in NPK puts fertilizer producers to a challenge where they need to
find the most cost effective solution to diversify the range of products with a
possibility to adjust to changing market trends and requirements of their customers.
They would also want to be the first to give their customers more choices before they
are left behind while the competitors are accumulating additional profits on more
added value products.
The ideal solution would be a single multifunctional unit with low CAPEX and OPEX
indices, moderate energy consumption, occupying a small footprint area so that it can
be installed at existing plant and – most importantly – providing the flexibility to
produce different types of fertilizers depending on market requirements.
R&D Institute of Urea developed a unit that satisfies the aforementioned
requirements.
It’s called High Speed Drum Granulator (HSDG). It’s a unit designed to granulate urea,
Urea+ and compound fertilizers. Depending on the fertilizer type either fertilizer melt
is sprayed over the crystals or granules of nutrient compound (for example urea melt
over ammonium sulfate) or nutrient compound is melted and sprayed over the
fertilizer granules or crystals (for example, sulfur melt over urea granules). The HSDG
has been successfully tested to produce granulated urea, ammonium nitrate, urea
based fertilizers (Urea+ fertilizers), compound and NP and NPK fertilizers.
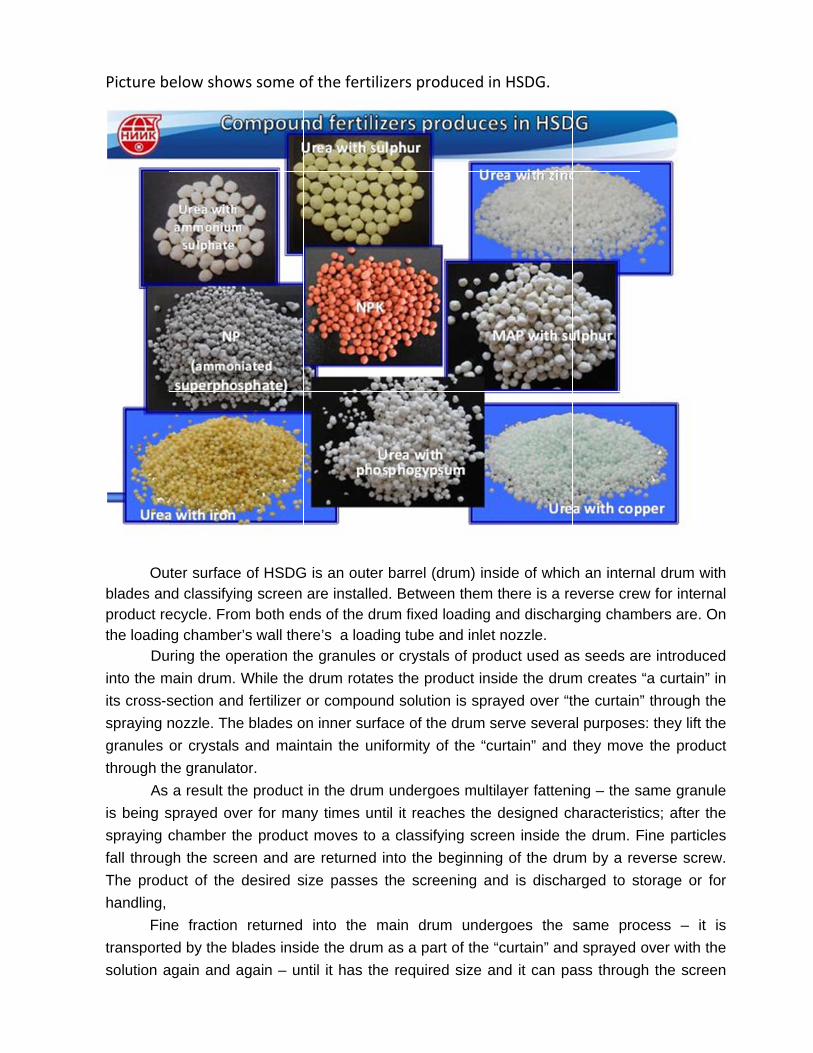
Picture b
Ou
blades anproduct rethe loadin
Du
into the m
its cross-s
spraying n
granules
through th
As
is being s
spraying c
fall throug
The produ
handling,
Fin
transporte
solution a
elow show
ter surfacend classifyiecycle. Frong chambering the op
main drum.
section and
nozzle. Th
or crystals
he granulat
a result th
sprayed ov
chamber t
gh the scre
uct of the
ne fraction
ed by the b
again and a
ws some o
e of HSDGng screen
om both enr’s wall theperation th
While the
d fertilizer
e blades o
s and main
tor.
he product
ver for man
he produc
een and ar
desired s
n returned
blades insid
again – un
of the fert
G is an outeare install
nds of the dere’s a loahe granules
drum rota
or compou
on inner su
ntain the u
in the dru
ny times u
ct moves to
re returned
size passe
into the
de the dru
ntil it has t
ilizers pro
er barrel (ded. Betwedrum fixedading tube s or crysta
ates the pro
und solutio
rface of th
uniformity o
m undergo
until it reac
o a classify
d into the
s the scre
main dru
m as a pa
the require
oduced in
drum) insiden them th loading anand inlet n
als of produ
oduct insid
on is spray
e drum se
of the “cur
oes multila
ches the d
ying scree
beginning
eening and
um underg
rt of the “c
ed size and
HSDG.
de of whichere is a rend discharnozzle. uct used a
de the drum
yed over “t
rve severa
rtain” and
ayer fatteni
esigned ch
en inside th
of the dru
d is discha
goes the
curtain” and
d it can pa
h an interneverse crewrging cham
s seeds ar
m creates
the curtain
al purposes
they move
ing – the s
haracterist
he drum. F
um by a re
arged to st
same pro
d sprayed
ass throug
nal drum ww for intern
mbers are. O
re introduc
“a curtain”
” through t
s: they lift t
e the prod
same granu
tics; after t
Fine partic
everse scre
torage or
cess – it
over with t
h the scre
with nal On
ced
” in
the
the
uct
ule
the
les
ew.
for
is
the
een
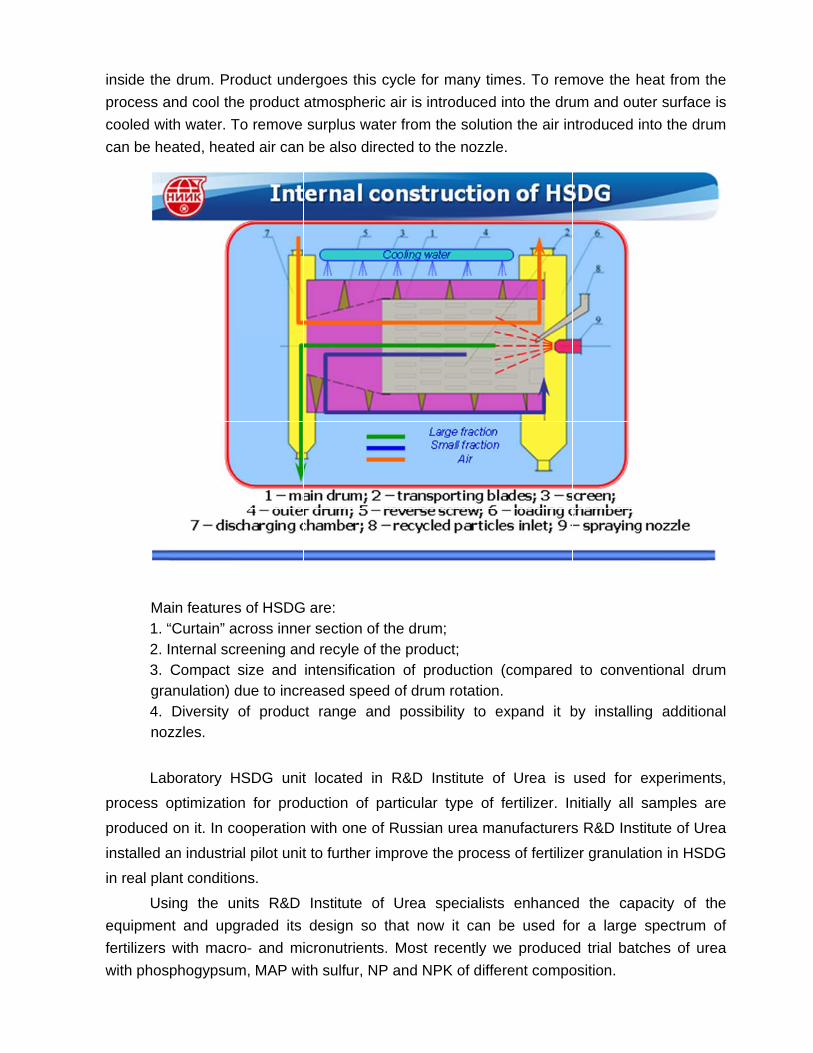
inside the
process a
cooled wit
can be he
Ma1. “2. I3. gra4. noz
Lab
process o
produced
installed a
in real pla
Us
equipmen
fertilizers
with phos
e drum. Pro
and cool th
th water. T
eated, heat
ain features“Curtain” aInternal scCompact
anulation) dDiversity zzles.
boratory H
optimizatio
on it. In co
an industria
ant conditio
ing the u
nt and upg
with macr
phogypsum
oduct unde
e product
To remove
ted air can
s of HSDGacross innereening ansize and due to incrof produc
HSDG unit
on for prod
ooperation
al pilot unit
ons.
nits R&D
graded its
ro- and mi
m, MAP wi
ergoes this
atmospher
surplus w
be also di
G are: er section ond recyle ointensifica
reased spect range a
t located
duction of
n with one
t to further
Institute
design so
icronutrien
ith sulfur, N
s cycle for
ric air is in
ater from t
irected to t
of the drumof the prodution of pro
eed of drumand possib
in R&D In
particular
of Russian
r improve th
of Urea s
o that now
nts. Most r
NP and NP
r many tim
troduced in
the solution
the nozzle.
m; uct; oduction (m rotation. bility to ex
nstitute of
type of f
n urea man
he process
specialists
w it can b
recently we
PK of differ
es. To rem
nto the dru
n the air in
.
compared
xpand it b
Urea is
fertilizer. In
nufacturers
s of fertilize
enhanced
be used fo
e produce
rent compo
move the h
um and ou
ntroduced i
to conve
by installin
used for
nitially all
s R&D Inst
er granulat
d the cap
or a large
d trial batc
osition.
heat from t
ter surface
into the dru
ntional dru
ng addition
experimen
samples a
titute of Ur
tion in HSD
pacity of t
spectrum
ches of ur
the
e is
um
um
nal
nts,
are
rea
DG
the
of
rea
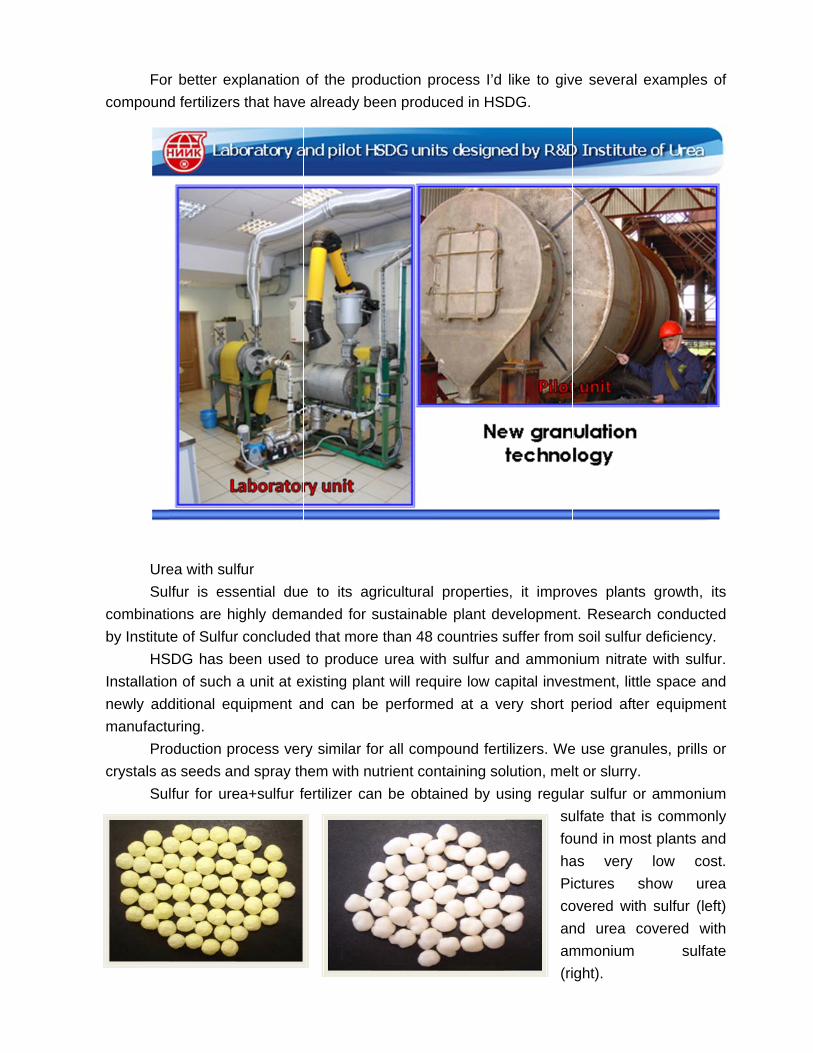
For
compound
Ure
Su
combinati
by Institut
HS
Installatio
newly add
manufactu
Pro
crystals a
Su
r better ex
d fertilizers
ea with sul
lfur is ess
ons are hi
te of Sulfur
SDG has b
n of such
ditional eq
uring.
oduction pr
s seeds an
lfur for ure
xplanation
s that have
fur
sential due
ighly dema
r concluded
been used
a unit at e
quipment a
rocess ver
nd spray th
ea+sulfur f
of the pro
e already b
e to its ag
anded for
d that more
to produce
existing pla
and can be
ry similar fo
hem with n
fertilizer ca
oduction pr
been produ
gricultural
sustainabl
e than 48 c
e urea wit
ant will requ
e performe
or all com
utrient con
an be obta
rocess I’d
uced in HS
properties
e plant de
countries s
th sulfur an
uire low ca
ed at a ve
pound fert
ntaining so
ained by us
like to giv
DG.
s, it impro
evelopmen
suffer from
nd ammon
apital inves
ery short p
tilizers. We
olution, mel
sing regula
su
fo
ha
Pi
co
an
am
(ri
ve several
oves plants
t. Researc
m soil sulfur
nium nitrate
stment, litt
period afte
e use gran
lt or slurry.
ar sulfur o
ulfate that
und in mo
as very
ctures s
overed with
nd urea c
mmonium
ght).
examples
s growth,
ch conduct
r deficiency
e with sulf
le space a
er equipme
ules, prills
or ammoniu
is commo
st plants a
low co
show ur
h sulfur (le
covered w
sulfa
of
its
ted
y.
fur.
and
ent
or
um
nly
and
ost.
rea
eft)
with
ate
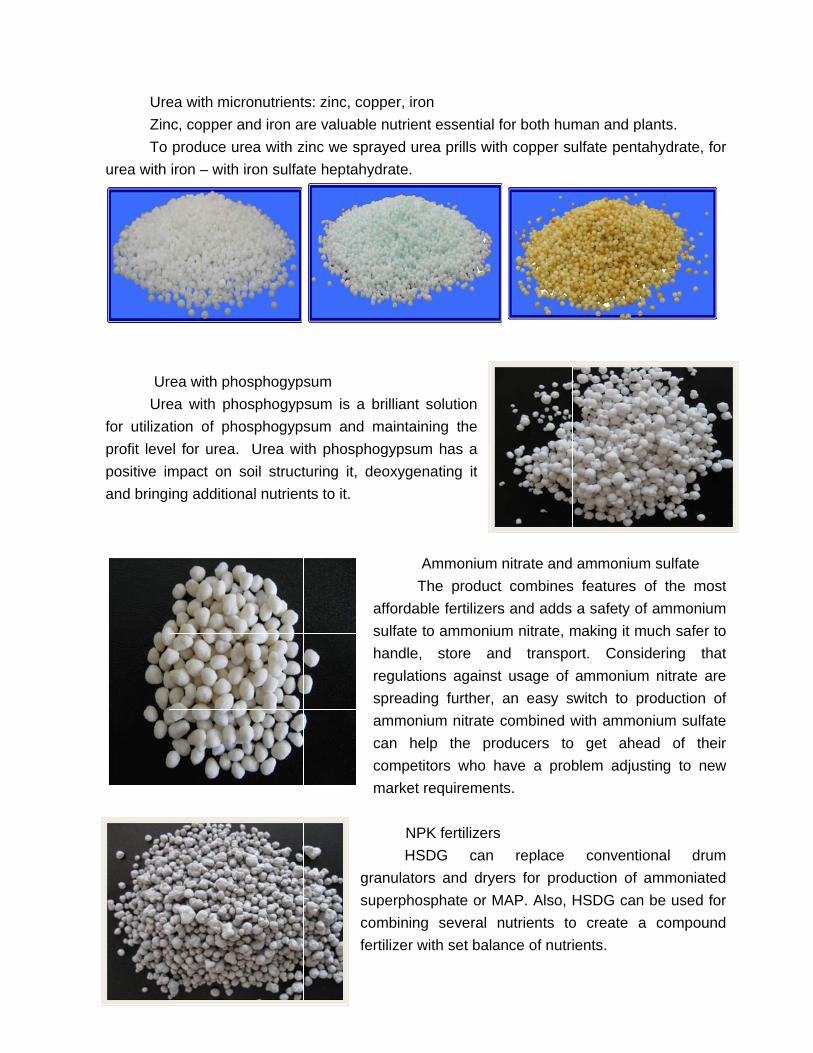
Ure
Zin
To
urea with
Ur
Ure
for utiliza
profit leve
positive im
and bring
ea with mic
nc, copper
produce u
iron – with
rea with ph
ea with ph
tion of ph
el for urea
mpact on
ing additio
cronutrient
and iron a
urea with z
h iron sulfa
hosphogyp
hosphogyp
hosphogyp
. Urea wi
soil struct
nal nutrien
ts: zinc, co
re valuable
zinc we spr
te heptahy
sum
sum is a
sum and
th phosph
turing it, d
nts to it.
gr
su
co
fe
pper, iron
e nutrient e
rayed urea
ydrate.
brilliant so
maintainin
ogypsum
deoxygena
Am
The
affordable
sulfate to
handle,
regulation
spreading
ammonium
can help
competito
market req
NPK
HSDG
ranulators
uperphosp
ombining
ertilizer with
essential fo
a prills with
olution
ng the
has a
ting it
mmonium n
e product
e fertilizers
ammonium
store and
s against
further, a
m nitrate c
the prod
rs who ha
quirements
fertilizers
G can
and dryer
hate or MA
several n
h set balan
or both hum
h copper su
nitrate and
combines
and adds
m nitrate, m
d transpo
usage of
an easy s
combined w
ducers to
ave a prob
s.
replace
rs for prod
AP. Also,
utrients to
nce of nutri
man and p
ulfate pent
ammonium
s features
a safety o
making it m
ort. Cons
ammonium
switch to p
with ammo
o get ahe
blem adjus
conventi
duction of
HSDG can
o create a
ients.
plants.
tahydrate,
m sulfate
of the mo
of ammoniu
much safer
sidering th
m nitrate a
production
onium sulfa
ead of th
sting to n
ional dru
ammoniat
n be used
a compou
for
ost
um
r to
hat
are
of
ate
heir
ew
um
ted
for
und
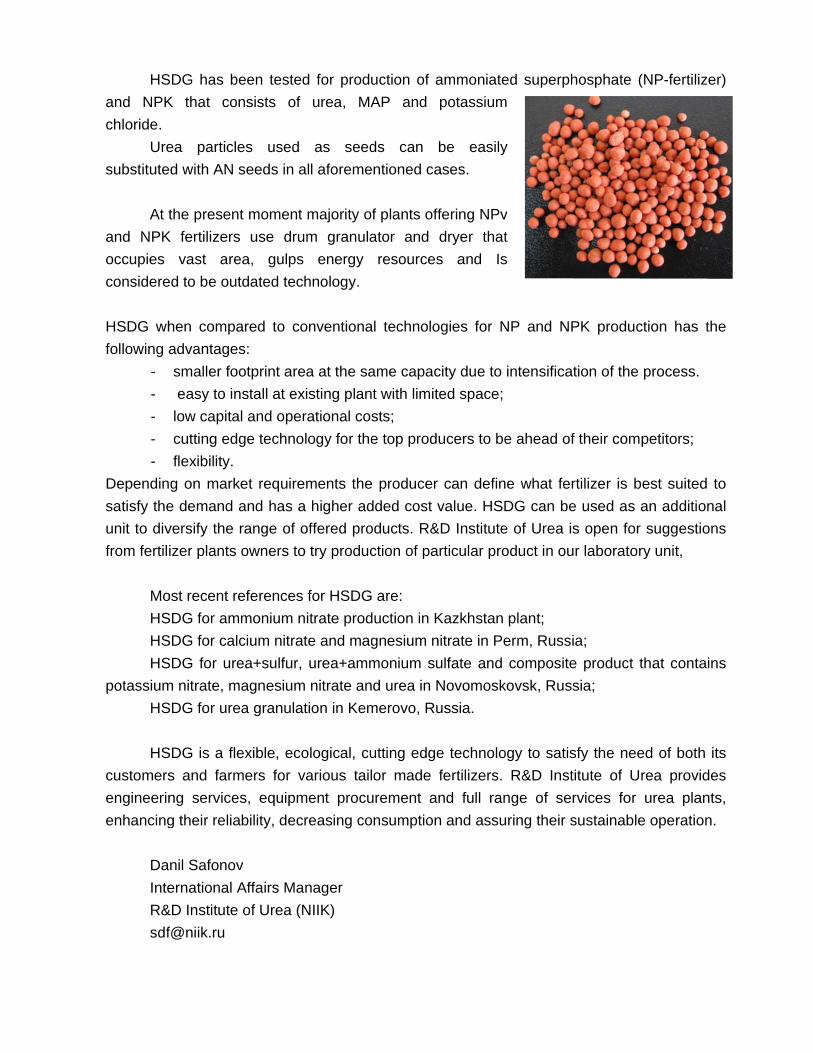
HS
and NPK
chloride.
Ure
substitute
At t
and NPK
occupies
considere
HSDG wh
following a
-
-
-
-
-
Dependin
satisfy the
unit to div
from fertil
Mo
HS
HS
HS
potassium
HS
HS
customers
engineerin
enhancing
Da
Inte
R&
sdf
SDG has b
K that co
ea particl
ed with AN
the presen
K fertilizers
vast are
ed to be ou
hen compa
advantage
smaller fo
easy to in
low capita
cutting ed
flexibility.
g on mark
e demand
versify the
izer plants
ost recent r
SDG for am
SDG for cal
SDG for ur
m nitrate, m
SDG for ure
SDG is a fl
s and farm
ng service
g their relia
nil Safonov
ernational
&D Institute
been tested
onsists of
es used
seeds in a
nt moment
s use dru
ea, gulps
tdated tec
ared to co
es:
ootprint are
nstall at ex
al and oper
dge techno
ket require
and has a
range of o
owners to
references
mmonium n
lcium nitra
rea+sulfur,
magnesium
ea granula
exible, eco
mers for v
es, equipm
ability, dec
v
Affairs Ma
e of Urea (N
d for prod
urea, MA
as seed
all aforeme
majority o
um granula
energy
hnology.
onventiona
ea at the sa
xisting plan
rational co
logy for the
ements the
a higher ad
offered pro
o try produc
for HSDG
nitrate prod
te and mag
urea+amm
m nitrate an
tion in Kem
ological, cu
various tail
ment procu
reasing co
nager
NIIK)
uction of a
AP and
ds can
entioned ca
of plants off
ator and
resources
al technolo
ame capac
nt with limit
sts;
e top prod
e producer
dded cost v
oducts. R&
ction of pa
G are:
duction in K
gnesium n
monium su
nd urea in N
merovo, Ru
utting edge
lor made
urement a
onsumption
ammoniate
potassium
be easily
ases.
fering NPv
dryer that
s and Is
ogies for N
city due to
ted space;
ucers to be
can defin
value. HSD
&D Institute
rticular pro
Kazkhstan
nitrate in Pe
ulfate and
Novomosk
ussia.
e technolo
fertilizers.
nd full ran
n and assu
ed superph
m
y
v
t
s
NP and NP
intensifica
e ahead of
e what fer
DG can be
e of Urea is
oduct in ou
plant;
erm, Russi
composite
kovsk, Russ
ogy to satis
R&D Inst
nge of ser
uring their s
hosphate (
PK produc
tion of the
f their com
rtilizer is b
e used as
s open for
ur laborator
ia;
e product t
sia;
sfy the nee
titute of U
rvices for
sustainable
(NP-fertiliz
ction has t
process.
petitors;
best suited
an addition
r suggestio
ry unit,
that conta
ed of both
rea provid
urea plan
e operation
zer)
the
to
nal
ons
ins
its
des
nts,
n.

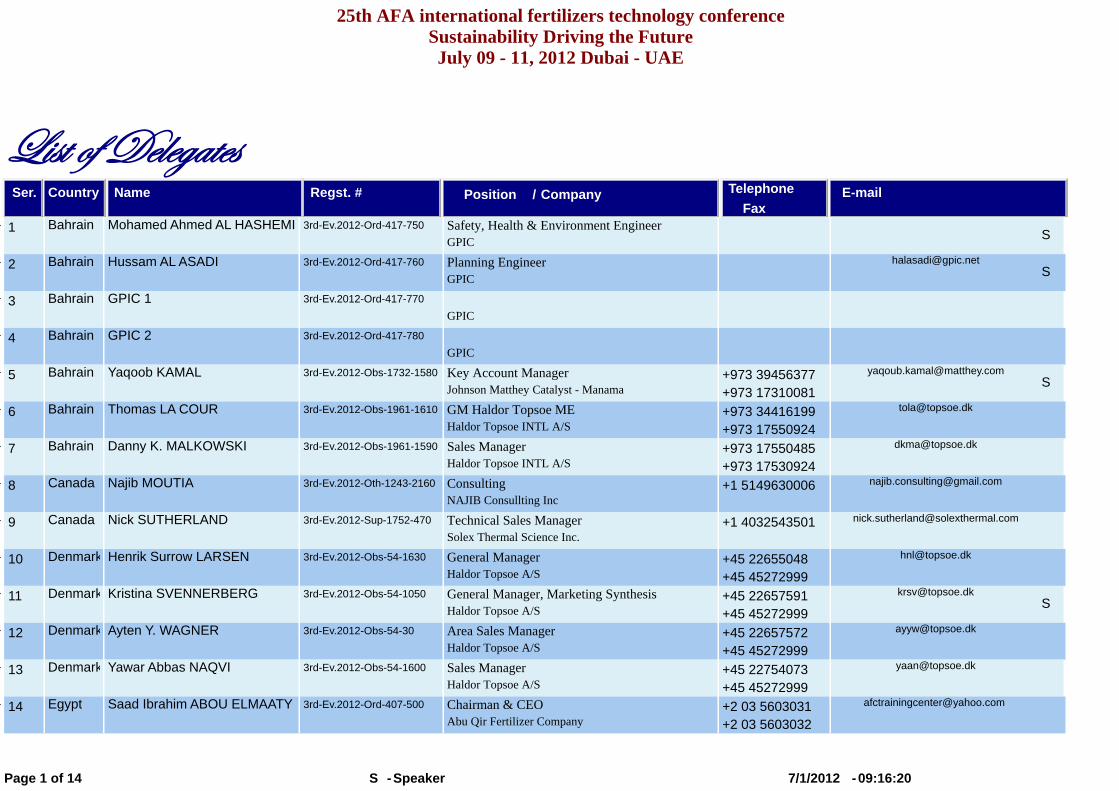
25th AFA international fertilizers technology conferenceSustainability Driving the FutureJuly 09 - 11, 2012 Dubai - UAE
_|áà Éy WxÄxztàxáSer. Company/PositionRegst. #Country Name
Fax
Telephone E-mail
S1 Bahrain Mohamed Ahmed AL HASHEMI 3rd-Ev.2012-Ord-417-750 Safety, Health & Environment Engineer
GPIC
S2 Bahrain Hussam AL ASADI 3rd-Ev.2012-Ord-417-760 Planning Engineer
3 Bahrain GPIC 1 3rd-Ev.2012-Ord-417-770
GPIC
4 Bahrain GPIC 2 3rd-Ev.2012-Ord-417-780
GPIC
S5 Bahrain Yaqoob KAMAL 3rd-Ev.2012-Obs-1732-1580 Key Account Manager
Johnson Matthey Catalyst - Manama+973 39456377+973 17310081
6 Bahrain Thomas LA COUR 3rd-Ev.2012-Obs-1961-1610 GM Haldor Topsoe MEHaldor Topsoe INTL A/S
+973 34416199+973 17550924
7 Bahrain Danny K. MALKOWSKI 3rd-Ev.2012-Obs-1961-1590 Sales ManagerHaldor Topsoe INTL A/S
+973 17550485+973 17530924
8 Canada Najib MOUTIA 3rd-Ev.2012-Oth-1243-2160 Consulting
NAJIB Consullting Inc+1 5149630006 [email protected]
9 Canada Nick SUTHERLAND 3rd-Ev.2012-Sup-1752-470 Technical Sales ManagerSolex Thermal Science Inc.
+1 4032543501 [email protected]
10 Denmark Henrik Surrow LARSEN 3rd-Ev.2012-Obs-54-1630 General ManagerHaldor Topsoe A/S
+45 22655048+45 45272999
S11 Denmark Kristina SVENNERBERG 3rd-Ev.2012-Obs-54-1050 General Manager, Marketing Synthesis
Haldor Topsoe A/S+45 22657591+45 45272999
12 Denmark Ayten Y. WAGNER 3rd-Ev.2012-Obs-54-30 Area Sales ManagerHaldor Topsoe A/S
+45 22657572+45 45272999
13 Denmark Yawar Abbas NAQVI 3rd-Ev.2012-Obs-54-1600 Sales ManagerHaldor Topsoe A/S
+45 22754073+45 45272999
14 Egypt Saad Ibrahim ABOU ELMAATY 3rd-Ev.2012-Ord-407-500 Chairman & CEO Abu Qir Fertilizer Company
+2 03 5603031+2 03 5603032
-SpeakerSPage 1 of 14 09:16:20-7/1/2012
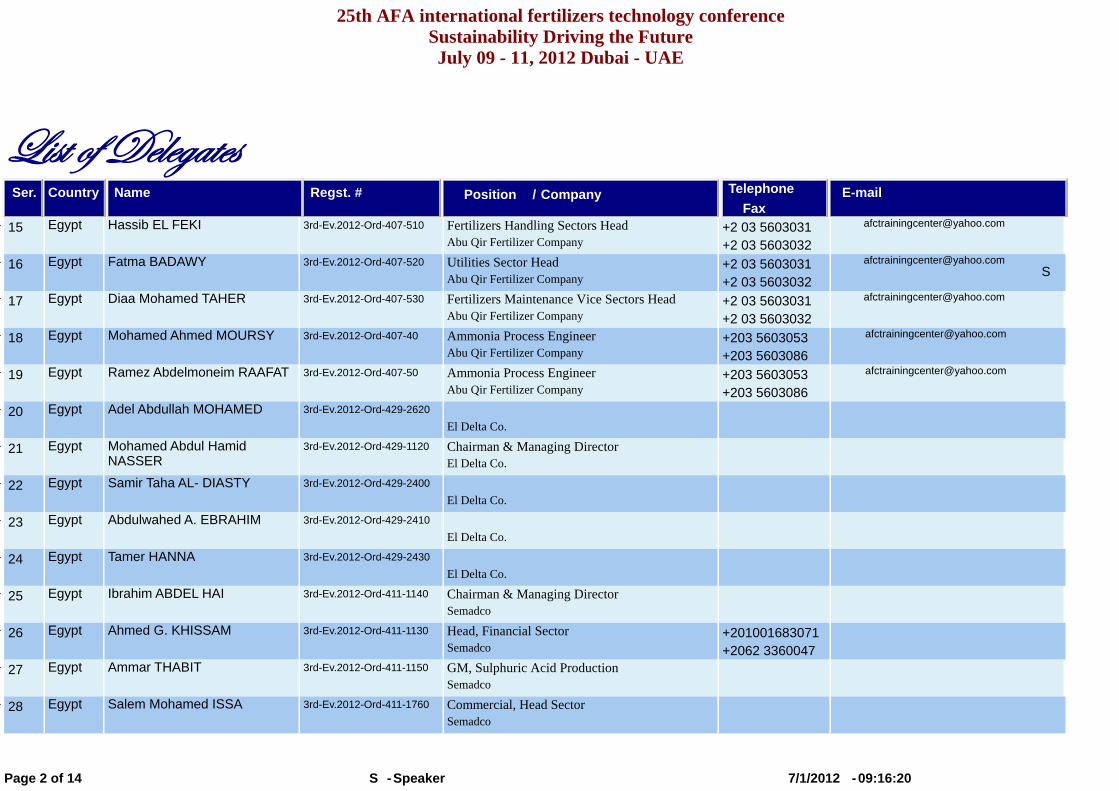
25th AFA international fertilizers technology conferenceSustainability Driving the FutureJuly 09 - 11, 2012 Dubai - UAE
_|áà Éy WxÄxztàxáSer. Company/PositionRegst. #Country Name
Fax
Telephone E-mail
15 Egypt Hassib EL FEKI 3rd-Ev.2012-Ord-407-510 Fertilizers Handling Sectors HeadAbu Qir Fertilizer Company
+2 03 5603031+2 03 5603032
S16 Egypt Fatma BADAWY 3rd-Ev.2012-Ord-407-520 Utilities Sector Head
Abu Qir Fertilizer Company+2 03 5603031+2 03 5603032
17 Egypt Diaa Mohamed TAHER 3rd-Ev.2012-Ord-407-530 Fertilizers Maintenance Vice Sectors Head Abu Qir Fertilizer Company
+2 03 5603031+2 03 5603032
18 Egypt Mohamed Ahmed MOURSY 3rd-Ev.2012-Ord-407-40 Ammonia Process EngineerAbu Qir Fertilizer Company
+203 5603053+203 5603086
19 Egypt Ramez Abdelmoneim RAAFAT 3rd-Ev.2012-Ord-407-50 Ammonia Process EngineerAbu Qir Fertilizer Company
+203 5603053+203 5603086
20 Egypt Adel Abdullah MOHAMED 3rd-Ev.2012-Ord-429-2620
El Delta Co.
21 Egypt Mohamed Abdul Hamid NASSER
3rd-Ev.2012-Ord-429-1120 Chairman & Managing DirectorEl Delta Co.
22 Egypt Samir Taha AL- DIASTY 3rd-Ev.2012-Ord-429-2400 El Delta Co.
23 Egypt Abdulwahed A. EBRAHIM 3rd-Ev.2012-Ord-429-2410 El Delta Co.
24 Egypt Tamer HANNA 3rd-Ev.2012-Ord-429-2430
El Delta Co.
25 Egypt Ibrahim ABDEL HAI 3rd-Ev.2012-Ord-411-1140 Chairman & Managing DirectorSemadco
26 Egypt Ahmed G. KHISSAM 3rd-Ev.2012-Ord-411-1130 Head, Financial SectorSemadco
+201001683071+2062 3360047
27 Egypt Ammar THABIT 3rd-Ev.2012-Ord-411-1150 GM, Sulphuric Acid Production Semadco
28 Egypt Salem Mohamed ISSA 3rd-Ev.2012-Ord-411-1760 Commercial, Head SectorSemadco
-SpeakerSPage 2 of 14 09:16:20-7/1/2012
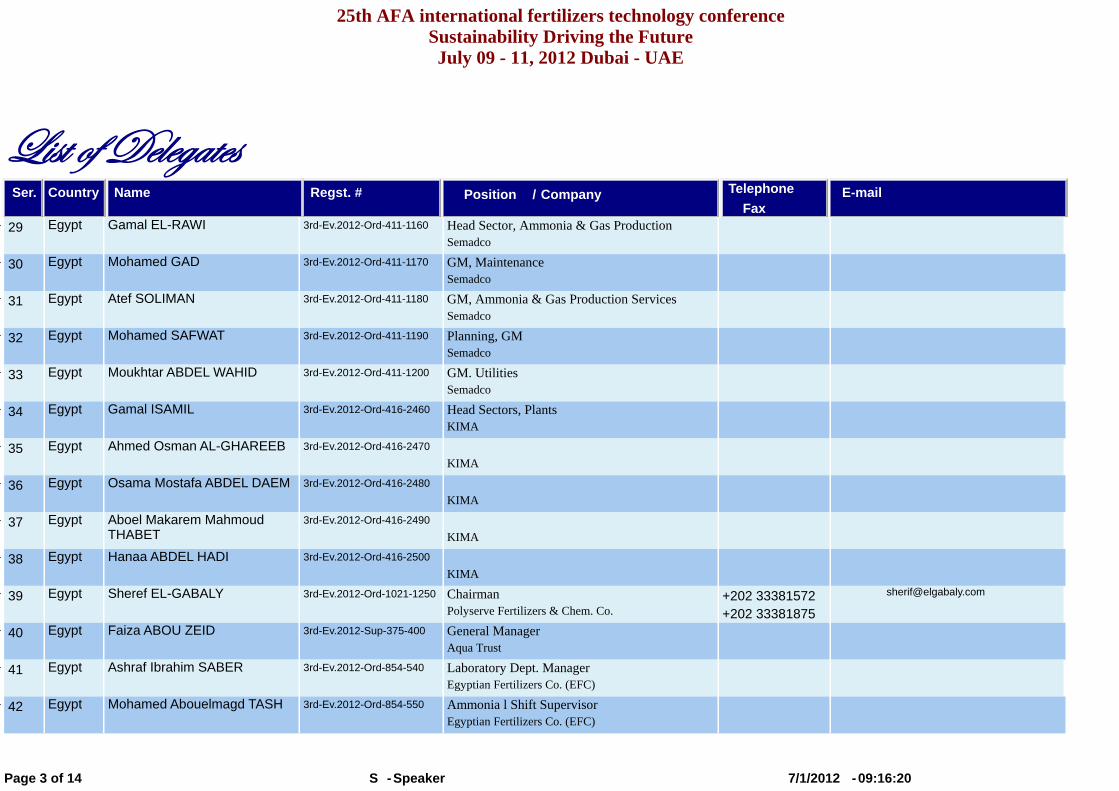
25th AFA international fertilizers technology conferenceSustainability Driving the FutureJuly 09 - 11, 2012 Dubai - UAE
_|áà Éy WxÄxztàxáSer. Company/PositionRegst. #Country Name
Fax
Telephone E-mail
29 Egypt Gamal EL-RAWI 3rd-Ev.2012-Ord-411-1160 Head Sector, Ammonia & Gas ProductionSemadco
30 Egypt Mohamed GAD 3rd-Ev.2012-Ord-411-1170 GM, MaintenanceSemadco
31 Egypt Atef SOLIMAN 3rd-Ev.2012-Ord-411-1180 GM, Ammonia & Gas Production ServicesSemadco
32 Egypt Mohamed SAFWAT 3rd-Ev.2012-Ord-411-1190 Planning, GM Semadco
33 Egypt Moukhtar ABDEL WAHID 3rd-Ev.2012-Ord-411-1200 GM. UtilitiesSemadco
34 Egypt Gamal ISAMIL 3rd-Ev.2012-Ord-416-2460 Head Sectors, PlantsKIMA
35 Egypt Ahmed Osman AL-GHAREEB 3rd-Ev.2012-Ord-416-2470
KIMA
36 Egypt Osama Mostafa ABDEL DAEM 3rd-Ev.2012-Ord-416-2480
KIMA
37 Egypt Aboel Makarem Mahmoud THABET
3rd-Ev.2012-Ord-416-2490
KIMA
38 Egypt Hanaa ABDEL HADI 3rd-Ev.2012-Ord-416-2500
KIMA
39 Egypt Sheref EL-GABALY 3rd-Ev.2012-Ord-1021-1250 ChairmanPolyserve Fertilizers & Chem. Co.
+202 33381572+202 33381875
40 Egypt Faiza ABOU ZEID 3rd-Ev.2012-Sup-375-400 General Manager Aqua Trust
41 Egypt Ashraf Ibrahim SABER 3rd-Ev.2012-Ord-854-540 Laboratory Dept. Manager Egyptian Fertilizers Co. (EFC)
42 Egypt Mohamed Abouelmagd TASH 3rd-Ev.2012-Ord-854-550 Ammonia l Shift Supervisor Egyptian Fertilizers Co. (EFC)
-SpeakerSPage 3 of 14 09:16:20-7/1/2012
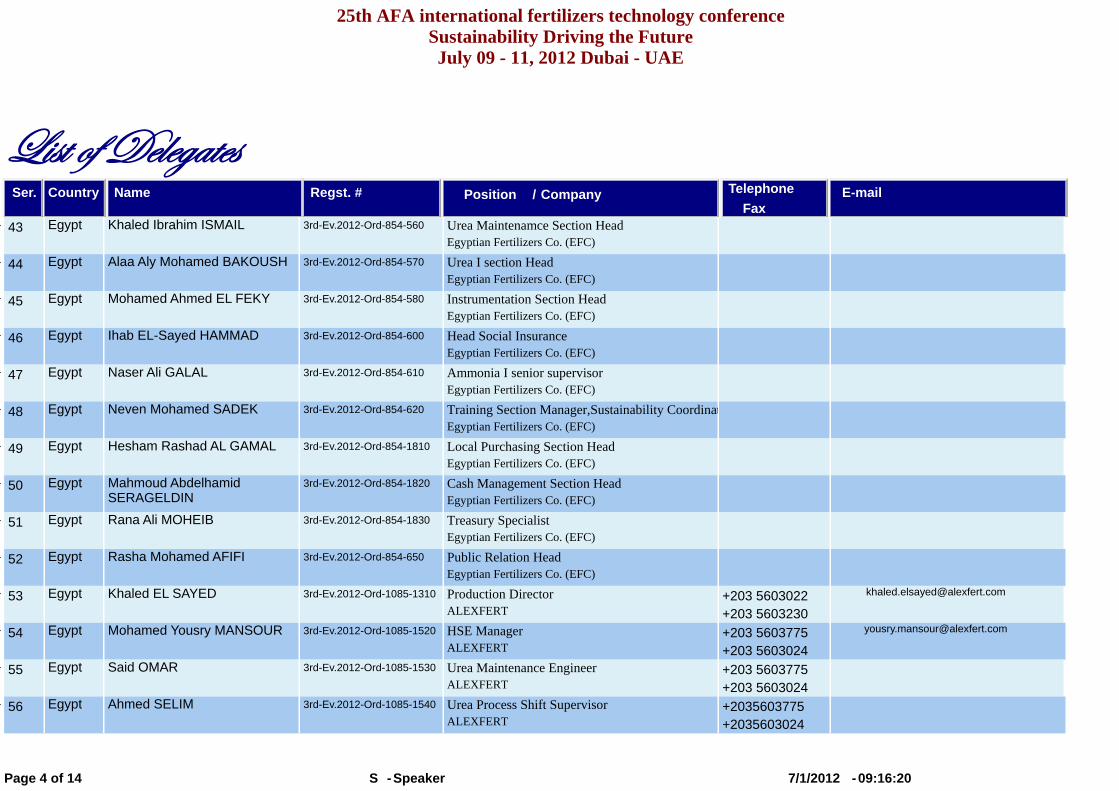
25th AFA international fertilizers technology conferenceSustainability Driving the FutureJuly 09 - 11, 2012 Dubai - UAE
_|áà Éy WxÄxztàxáSer. Company/PositionRegst. #Country Name
Fax
Telephone E-mail
43 Egypt Khaled Ibrahim ISMAIL 3rd-Ev.2012-Ord-854-560 Urea Maintenamce Section Head Egyptian Fertilizers Co. (EFC)
44 Egypt Alaa Aly Mohamed BAKOUSH 3rd-Ev.2012-Ord-854-570 Urea I section Head Egyptian Fertilizers Co. (EFC)
45 Egypt Mohamed Ahmed EL FEKY 3rd-Ev.2012-Ord-854-580 Instrumentation Section Head Egyptian Fertilizers Co. (EFC)
46 Egypt Ihab EL-Sayed HAMMAD 3rd-Ev.2012-Ord-854-600 Head Social Insurance Egyptian Fertilizers Co. (EFC)
47 Egypt Naser Ali GALAL 3rd-Ev.2012-Ord-854-610 Ammonia I senior supervisorEgyptian Fertilizers Co. (EFC)
48 Egypt Neven Mohamed SADEK 3rd-Ev.2012-Ord-854-620 Training Section Manager,Sustainability CoordinatEgyptian Fertilizers Co. (EFC)
49 Egypt Hesham Rashad AL GAMAL 3rd-Ev.2012-Ord-854-1810 Local Purchasing Section HeadEgyptian Fertilizers Co. (EFC)
50 Egypt Mahmoud Abdelhamid SERAGELDIN
3rd-Ev.2012-Ord-854-1820 Cash Management Section HeadEgyptian Fertilizers Co. (EFC)
51 Egypt Rana Ali MOHEIB 3rd-Ev.2012-Ord-854-1830 Treasury SpecialistEgyptian Fertilizers Co. (EFC)
52 Egypt Rasha Mohamed AFIFI 3rd-Ev.2012-Ord-854-650 Public Relation Head
Egyptian Fertilizers Co. (EFC)
53 Egypt Khaled EL SAYED 3rd-Ev.2012-Ord-1085-1310 Production DirectorALEXFERT
+203 5603022+203 5603230
54 Egypt Mohamed Yousry MANSOUR 3rd-Ev.2012-Ord-1085-1520 HSE ManagerALEXFERT
+203 5603775+203 5603024
55 Egypt Said OMAR 3rd-Ev.2012-Ord-1085-1530 Urea Maintenance EngineerALEXFERT
+203 5603775+203 5603024
56 Egypt Ahmed SELIM 3rd-Ev.2012-Ord-1085-1540 Urea Process Shift SupervisorALEXFERT
+2035603775+2035603024
-SpeakerSPage 4 of 14 09:16:20-7/1/2012
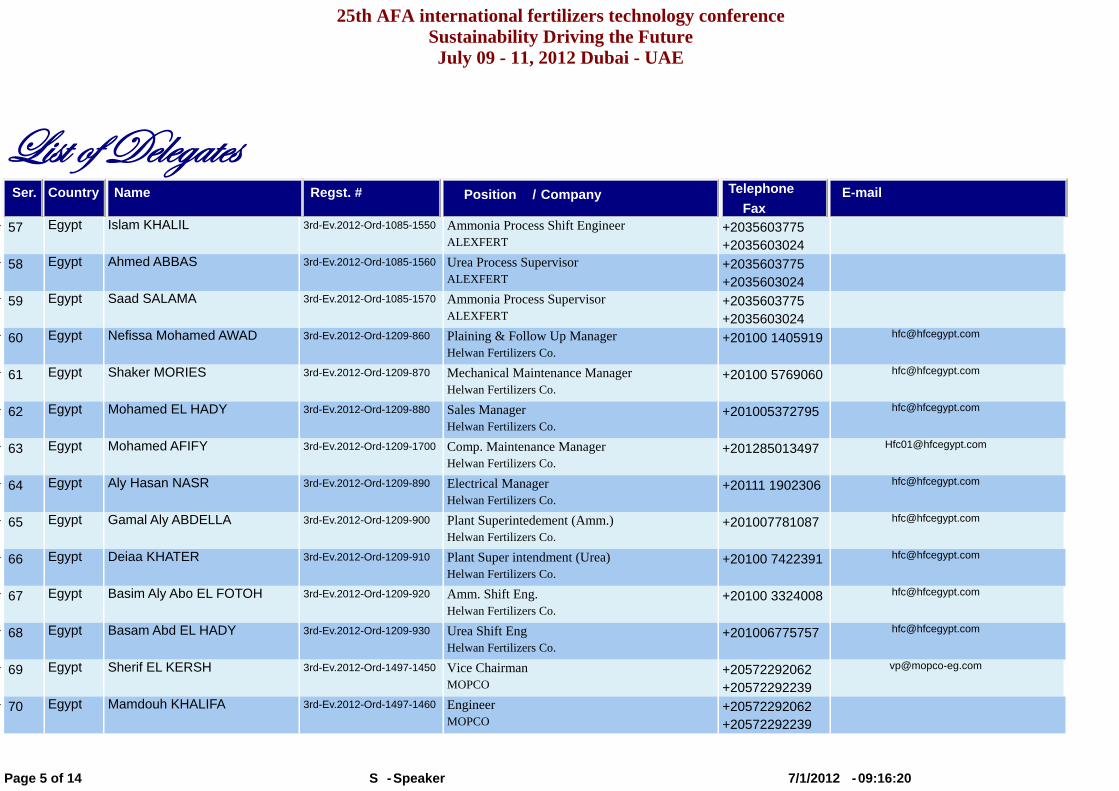
25th AFA international fertilizers technology conferenceSustainability Driving the FutureJuly 09 - 11, 2012 Dubai - UAE
_|áà Éy WxÄxztàxáSer. Company/PositionRegst. #Country Name
Fax
Telephone E-mail
57 Egypt Islam KHALIL 3rd-Ev.2012-Ord-1085-1550 Ammonia Process Shift EngineerALEXFERT
+2035603775+2035603024
58 Egypt Ahmed ABBAS 3rd-Ev.2012-Ord-1085-1560 Urea Process SupervisorALEXFERT
+2035603775+2035603024
59 Egypt Saad SALAMA 3rd-Ev.2012-Ord-1085-1570 Ammonia Process SupervisorALEXFERT
+2035603775+2035603024
60 Egypt Nefissa Mohamed AWAD 3rd-Ev.2012-Ord-1209-860 Plaining & Follow Up Manager Helwan Fertilizers Co.
+20100 1405919 [email protected]
61 Egypt Shaker MORIES 3rd-Ev.2012-Ord-1209-870 Mechanical Maintenance Manager Helwan Fertilizers Co.
+20100 5769060 [email protected]
62 Egypt Mohamed EL HADY 3rd-Ev.2012-Ord-1209-880 Sales Manager Helwan Fertilizers Co.
+201005372795 [email protected]
63 Egypt Mohamed AFIFY 3rd-Ev.2012-Ord-1209-1700 Comp. Maintenance ManagerHelwan Fertilizers Co.
+201285013497 [email protected]
64 Egypt Aly Hasan NASR 3rd-Ev.2012-Ord-1209-890 Electrical Manager Helwan Fertilizers Co.
+20111 1902306 [email protected]
65 Egypt Gamal Aly ABDELLA 3rd-Ev.2012-Ord-1209-900 Plant Superintedement (Amm.)Helwan Fertilizers Co.
+201007781087 [email protected]
66 Egypt Deiaa KHATER 3rd-Ev.2012-Ord-1209-910 Plant Super intendment (Urea) Helwan Fertilizers Co.
+20100 7422391 [email protected]
67 Egypt Basim Aly Abo EL FOTOH 3rd-Ev.2012-Ord-1209-920 Amm. Shift Eng. Helwan Fertilizers Co.
+20100 3324008 [email protected]
68 Egypt Basam Abd EL HADY 3rd-Ev.2012-Ord-1209-930 Urea Shift Eng Helwan Fertilizers Co.
+201006775757 [email protected]
69 Egypt Sherif EL KERSH 3rd-Ev.2012-Ord-1497-1450 Vice ChairmanMOPCO
+20572292062+20572292239
70 Egypt Mamdouh KHALIFA 3rd-Ev.2012-Ord-1497-1460 EngineerMOPCO
+20572292062+20572292239
-SpeakerSPage 5 of 14 09:16:20-7/1/2012
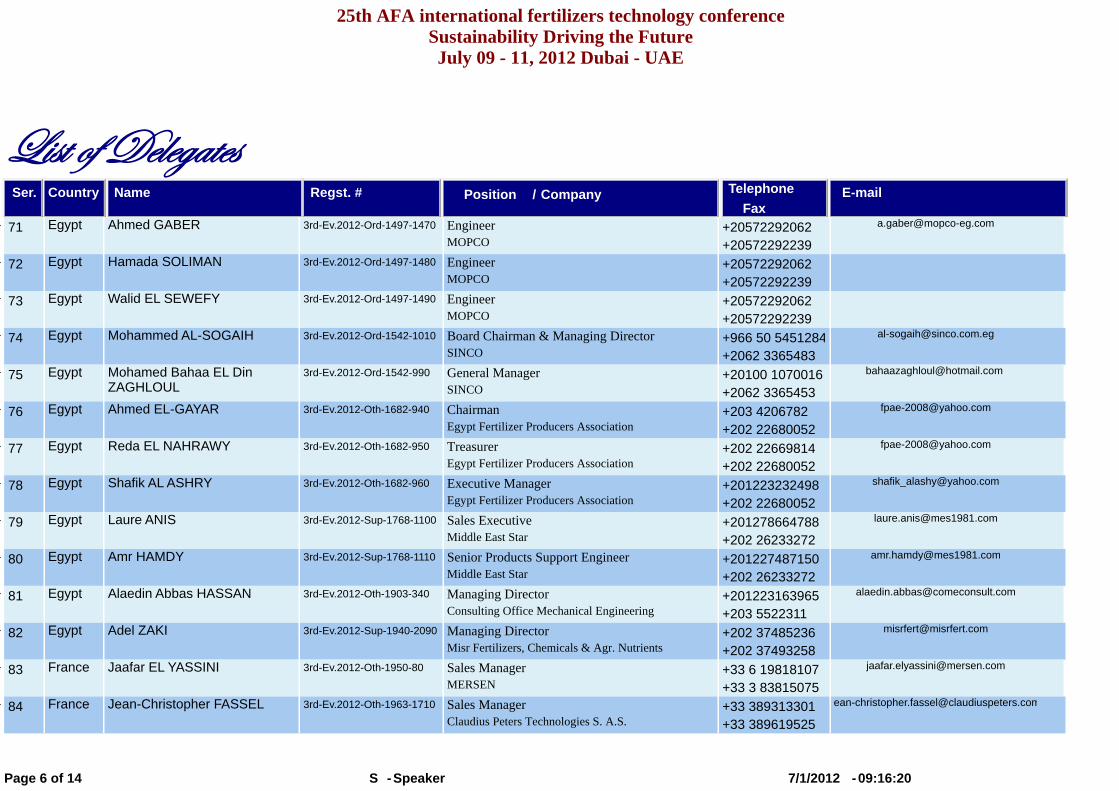
25th AFA international fertilizers technology conferenceSustainability Driving the FutureJuly 09 - 11, 2012 Dubai - UAE
_|áà Éy WxÄxztàxáSer. Company/PositionRegst. #Country Name
Fax
Telephone E-mail
71 Egypt Ahmed GABER 3rd-Ev.2012-Ord-1497-1470 EngineerMOPCO
+20572292062+20572292239
72 Egypt Hamada SOLIMAN 3rd-Ev.2012-Ord-1497-1480 EngineerMOPCO
+20572292062+20572292239
73 Egypt Walid EL SEWEFY 3rd-Ev.2012-Ord-1497-1490 EngineerMOPCO
+20572292062+20572292239
74 Egypt Mohammed AL-SOGAIH 3rd-Ev.2012-Ord-1542-1010 Board Chairman & Managing Director SINCO
+966 50 5451284+2062 3365483
75 Egypt Mohamed Bahaa EL Din
ZAGHLOUL3rd-Ev.2012-Ord-1542-990 General Manager
SINCO+20100 1070016+2062 3365453
76 Egypt Ahmed EL-GAYAR 3rd-Ev.2012-Oth-1682-940 Chairman
Egypt Fertilizer Producers Association+203 4206782+202 22680052
77 Egypt Reda EL NAHRAWY 3rd-Ev.2012-Oth-1682-950 Treasurer
Egypt Fertilizer Producers Association+202 22669814+202 22680052
78 Egypt Shafik AL ASHRY 3rd-Ev.2012-Oth-1682-960 Executive Manager
Egypt Fertilizer Producers Association+201223232498+202 22680052
79 Egypt Laure ANIS 3rd-Ev.2012-Sup-1768-1100 Sales Executive Middle East Star
+201278664788+202 26233272
80 Egypt Amr HAMDY 3rd-Ev.2012-Sup-1768-1110 Senior Products Support Engineer
Middle East Star+201227487150+202 26233272
81 Egypt Alaedin Abbas HASSAN 3rd-Ev.2012-Oth-1903-340 Managing Director
Consulting Office Mechanical Engineering+201223163965+203 5522311
82 Egypt Adel ZAKI 3rd-Ev.2012-Sup-1940-2090 Managing Director
Misr Fertilizers, Chemicals & Agr. Nutrients+202 37485236+202 37493258
83 France Jaafar EL YASSINI 3rd-Ev.2012-Oth-1950-80 Sales ManagerMERSEN
+33 6 19818107+33 3 83815075
84 France Jean-Christopher FASSEL 3rd-Ev.2012-Oth-1963-1710 Sales Manager Claudius Peters Technologies S. A.S.
+33 389313301+33 389619525
-SpeakerSPage 6 of 14 09:16:20-7/1/2012
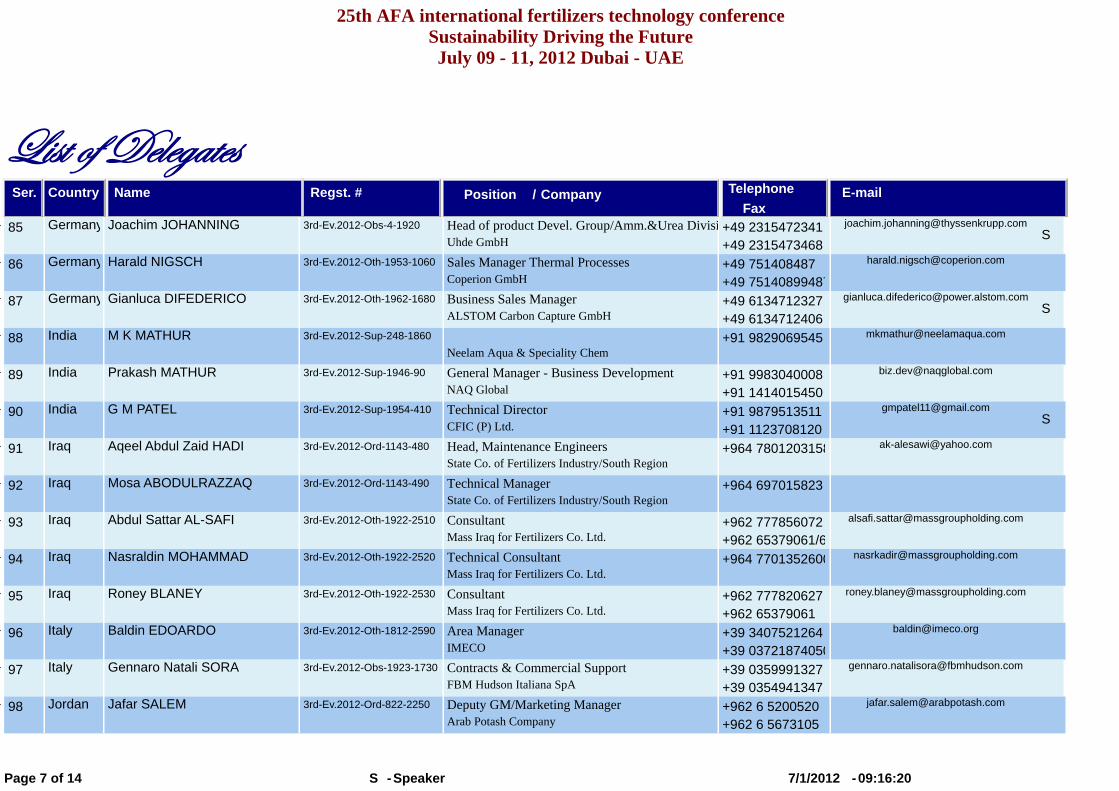
25th AFA international fertilizers technology conferenceSustainability Driving the FutureJuly 09 - 11, 2012 Dubai - UAE
_|áà Éy WxÄxztàxáSer. Company/PositionRegst. #Country Name
Fax
Telephone E-mail
S85 Germany Joachim JOHANNING 3rd-Ev.2012-Obs-4-1920 Head of product Devel. Group/Amm.&Urea Divisi
Uhde GmbH+49 2315472341+49 2315473468
86 Germany Harald NIGSCH 3rd-Ev.2012-Oth-1953-1060 Sales Manager Thermal ProcessesCoperion GmbH
+49 751408487+49 75140899487
S87 Germany Gianluca DIFEDERICO 3rd-Ev.2012-Oth-1962-1680 Business Sales Manager
ALSTOM Carbon Capture GmbH+49 6134712327+49 6134712406
88 India M K MATHUR 3rd-Ev.2012-Sup-248-1860
Neelam Aqua & Speciality Chem+91 9829069545 [email protected]
89 India Prakash MATHUR 3rd-Ev.2012-Sup-1946-90 General Manager - Business DevelopmentNAQ Global
+91 9983040008+91 1414015450
S90 India G M PATEL 3rd-Ev.2012-Sup-1954-410 Technical Director
CFIC (P) Ltd. +91 9879513511+91 1123708120
91 Iraq Aqeel Abdul Zaid HADI 3rd-Ev.2012-Ord-1143-480 Head, Maintenance Engineers State Co. of Fertilizers Industry/South Region
+964 7801203158 [email protected]
92 Iraq Mosa ABODULRAZZAQ 3rd-Ev.2012-Ord-1143-490 Technical Manager State Co. of Fertilizers Industry/South Region
+964 697015823
93 Iraq Abdul Sattar AL-SAFI 3rd-Ev.2012-Oth-1922-2510 ConsultantMass Iraq for Fertilizers Co. Ltd.
+962 777856072+962 65379061/6
94 Iraq Nasraldin MOHAMMAD 3rd-Ev.2012-Oth-1922-2520 Technical ConsultantMass Iraq for Fertilizers Co. Ltd.
+964 7701352600 [email protected]
95 Iraq Roney BLANEY 3rd-Ev.2012-Oth-1922-2530 ConsultantMass Iraq for Fertilizers Co. Ltd.
+962 777820627+962 65379061
96 Italy Baldin EDOARDO 3rd-Ev.2012-Oth-1812-2590 Area ManagerIMECO
+39 3407521264+39 03721874050
97 Italy Gennaro Natali SORA 3rd-Ev.2012-Obs-1923-1730 Contracts & Commercial SupportFBM Hudson Italiana SpA
+39 0359991327+39 0354941347
98 Jordan Jafar SALEM 3rd-Ev.2012-Ord-822-2250 Deputy GM/Marketing ManagerArab Potash Company
+962 6 5200520+962 6 5673105
-SpeakerSPage 7 of 14 09:16:20-7/1/2012
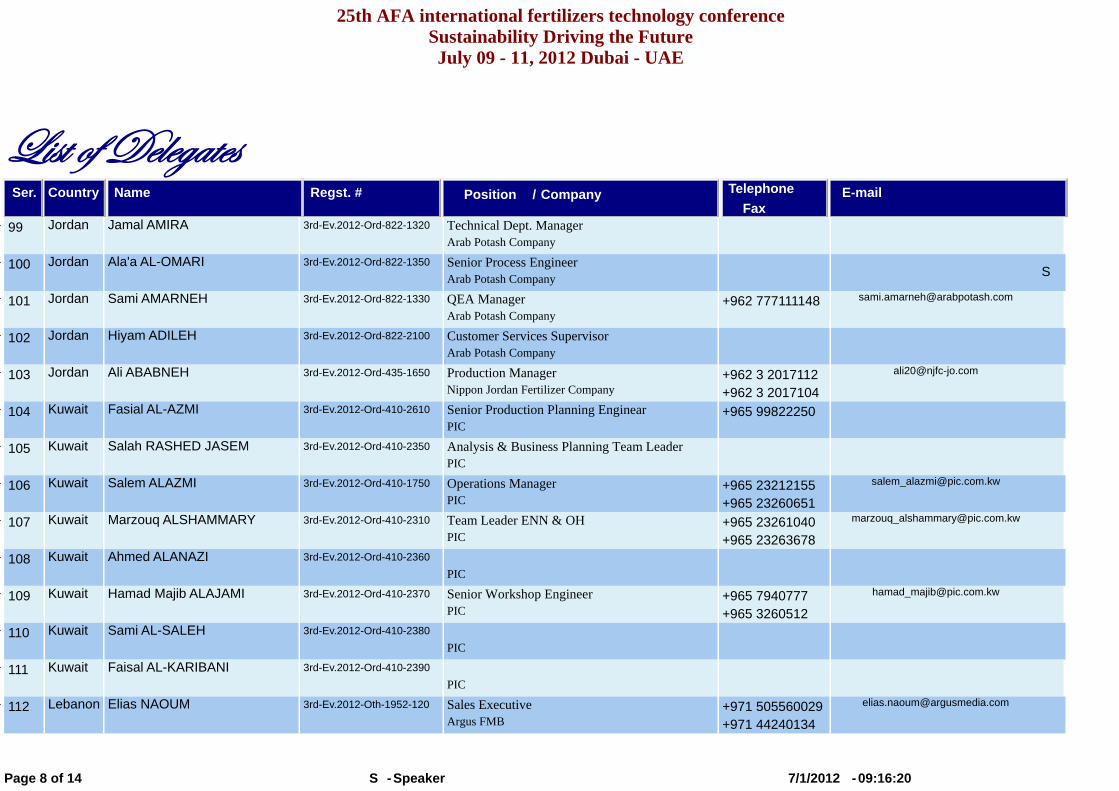
25th AFA international fertilizers technology conferenceSustainability Driving the FutureJuly 09 - 11, 2012 Dubai - UAE
_|áà Éy WxÄxztàxáSer. Company/PositionRegst. #Country Name
Fax
Telephone E-mail
99 Jordan Jamal AMIRA 3rd-Ev.2012-Ord-822-1320 Technical Dept. ManagerArab Potash Company
S100 Jordan Ala'a AL-OMARI 3rd-Ev.2012-Ord-822-1350 Senior Process Engineer
Arab Potash Company
101 Jordan Sami AMARNEH 3rd-Ev.2012-Ord-822-1330 QEA ManagerArab Potash Company
+962 777111148 [email protected]
102 Jordan Hiyam ADILEH 3rd-Ev.2012-Ord-822-2100 Customer Services SupervisorArab Potash Company
103 Jordan Ali ABABNEH 3rd-Ev.2012-Ord-435-1650 Production Manager Nippon Jordan Fertilizer Company
+962 3 2017112+962 3 2017104
104 Kuwait Fasial AL-AZMI 3rd-Ev.2012-Ord-410-2610 Senior Production Planning Enginear PIC
+965 99822250
105 Kuwait Salah RASHED JASEM 3rd-Ev.2012-Ord-410-2350 Analysis & Business Planning Team LeaderPIC
106 Kuwait Salem ALAZMI 3rd-Ev.2012-Ord-410-1750 Operations Manager PIC
+965 23212155+965 23260651
107 Kuwait Marzouq ALSHAMMARY 3rd-Ev.2012-Ord-410-2310 Team Leader ENN & OH PIC
+965 23261040+965 23263678
108 Kuwait Ahmed ALANAZI 3rd-Ev.2012-Ord-410-2360
PIC
109 Kuwait Hamad Majib ALAJAMI 3rd-Ev.2012-Ord-410-2370 Senior Workshop EngineerPIC
+965 7940777+965 3260512
110 Kuwait Sami AL-SALEH 3rd-Ev.2012-Ord-410-2380
PIC
111 Kuwait Faisal AL-KARIBANI 3rd-Ev.2012-Ord-410-2390
PIC
112 Lebanon Elias NAOUM 3rd-Ev.2012-Oth-1952-120 Sales Executive
Argus FMB+971 505560029+971 44240134
-SpeakerSPage 8 of 14 09:16:20-7/1/2012
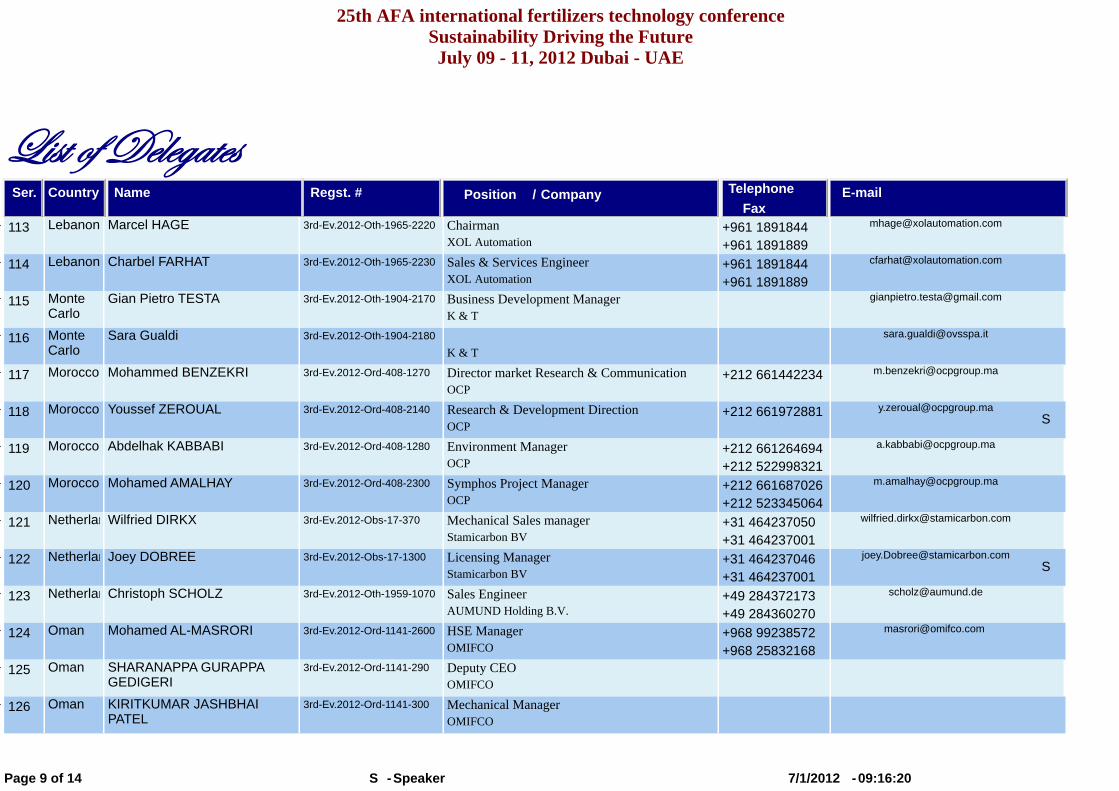
25th AFA international fertilizers technology conferenceSustainability Driving the FutureJuly 09 - 11, 2012 Dubai - UAE
_|áà Éy WxÄxztàxáSer. Company/PositionRegst. #Country Name
Fax
Telephone E-mail
113 Lebanon Marcel HAGE 3rd-Ev.2012-Oth-1965-2220 ChairmanXOL Automation
+961 1891844+961 1891889
114 Lebanon Charbel FARHAT 3rd-Ev.2012-Oth-1965-2230 Sales & Services EngineerXOL Automation
+961 1891844+961 1891889
115 Monte Carlo
Gian Pietro TESTA 3rd-Ev.2012-Oth-1904-2170 Business Development ManagerK & T
116 Monte
CarloSara Gualdi 3rd-Ev.2012-Oth-1904-2180
K & T [email protected]
117 Morocco Mohammed BENZEKRI 3rd-Ev.2012-Ord-408-1270 Director market Research & CommunicationOCP
+212 661442234 [email protected]
S118 Morocco Youssef ZEROUAL 3rd-Ev.2012-Ord-408-2140 Research & Development Direction
OCP+212 661972881 [email protected]
119 Morocco Abdelhak KABBABI 3rd-Ev.2012-Ord-408-1280 Environment ManagerOCP
+212 661264694+212 522998321
120 Morocco Mohamed AMALHAY 3rd-Ev.2012-Ord-408-2300 Symphos Project ManagerOCP
+212 661687026+212 523345064
121 Netherlan Wilfried DIRKX 3rd-Ev.2012-Obs-17-370 Mechanical Sales manager Stamicarbon BV
+31 464237050+31 464237001
S122 Netherlan Joey DOBREE 3rd-Ev.2012-Obs-17-1300 Licensing Manager
Stamicarbon BV+31 464237046+31 464237001
123 Netherlan Christoph SCHOLZ 3rd-Ev.2012-Oth-1959-1070 Sales EngineerAUMUND Holding B.V.
+49 284372173+49 284360270
124 Oman Mohamed AL-MASRORI 3rd-Ev.2012-Ord-1141-2600 HSE Manager OMIFCO
+968 99238572+968 25832168
125 Oman SHARANAPPA GURAPPA GEDIGERI
3rd-Ev.2012-Ord-1141-290 Deputy CEOOMIFCO
126 Oman KIRITKUMAR JASHBHAI PATEL
3rd-Ev.2012-Ord-1141-300 Mechanical Manager OMIFCO
-SpeakerSPage 9 of 14 09:16:20-7/1/2012
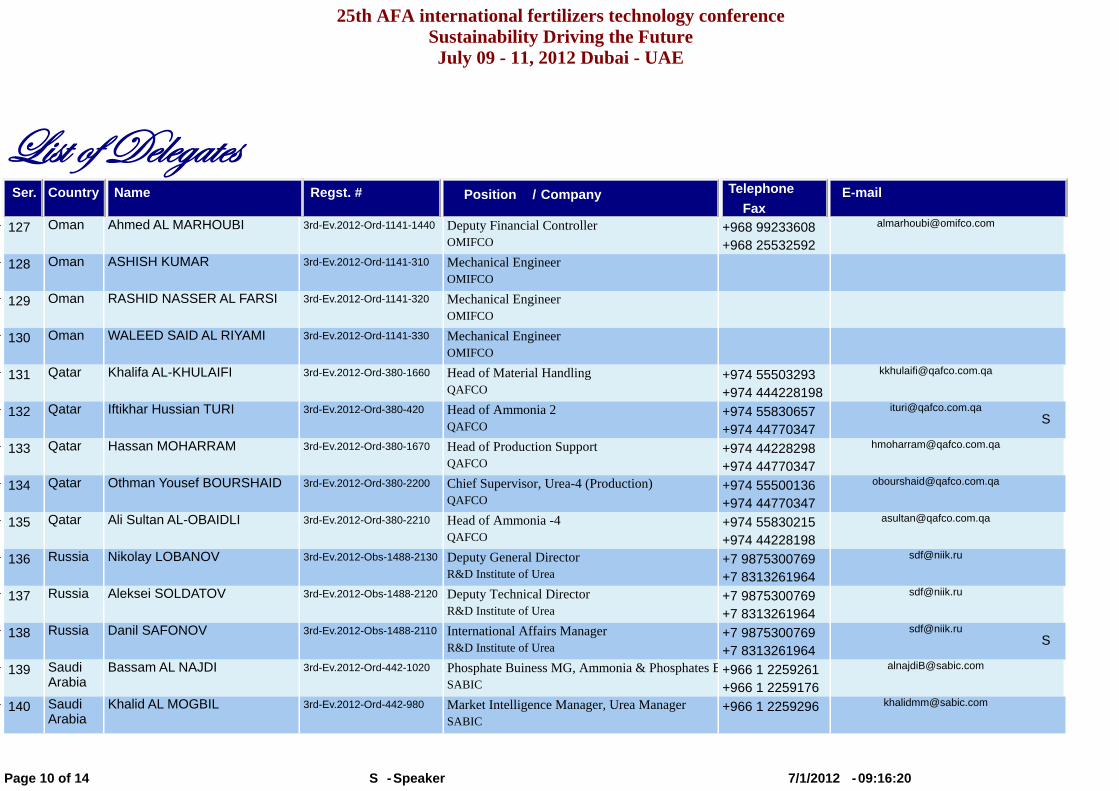
25th AFA international fertilizers technology conferenceSustainability Driving the FutureJuly 09 - 11, 2012 Dubai - UAE
_|áà Éy WxÄxztàxáSer. Company/PositionRegst. #Country Name
Fax
Telephone E-mail
127 Oman Ahmed AL MARHOUBI 3rd-Ev.2012-Ord-1141-1440 Deputy Financial ControllerOMIFCO
+968 99233608+968 25532592
128 Oman ASHISH KUMAR 3rd-Ev.2012-Ord-1141-310 Mechanical EngineerOMIFCO
129 Oman RASHID NASSER AL FARSI 3rd-Ev.2012-Ord-1141-320 Mechanical Engineer OMIFCO
130 Oman WALEED SAID AL RIYAMI
3rd-Ev.2012-Ord-1141-330 Mechanical EngineerOMIFCO
131 Qatar Khalifa AL-KHULAIFI 3rd-Ev.2012-Ord-380-1660 Head of Material HandlingQAFCO
+974 55503293+974 444228198
S132 Qatar Iftikhar Hussian TURI 3rd-Ev.2012-Ord-380-420 Head of Ammonia 2
QAFCO+974 55830657+974 44770347
133 Qatar Hassan MOHARRAM 3rd-Ev.2012-Ord-380-1670 Head of Production Support QAFCO
+974 44228298+974 44770347
134 Qatar Othman Yousef BOURSHAID 3rd-Ev.2012-Ord-380-2200 Chief Supervisor, Urea-4 (Production)QAFCO
+974 55500136+974 44770347
135 Qatar Ali Sultan AL-OBAIDLI 3rd-Ev.2012-Ord-380-2210 Head of Ammonia -4QAFCO
+974 55830215+974 44228198
136 Russia Nikolay LOBANOV 3rd-Ev.2012-Obs-1488-2130 Deputy General DirectorR&D Institute of Urea
+7 9875300769+7 8313261964
137 Russia Aleksei SOLDATOV 3rd-Ev.2012-Obs-1488-2120 Deputy Technical DirectorR&D Institute of Urea
+7 9875300769+7 8313261964
S138 Russia Danil SAFONOV 3rd-Ev.2012-Obs-1488-2110 International Affairs Manager
R&D Institute of Urea +7 9875300769+7 8313261964
139 Saudi Arabia
Bassam AL NAJDI 3rd-Ev.2012-Ord-442-1020 Phosphate Buiness MG, Ammonia & Phosphates BSABIC
+966 1 2259261+966 1 2259176
140 Saudi Arabia
Khalid AL MOGBIL 3rd-Ev.2012-Ord-442-980 Market Intelligence Manager, Urea Manager SABIC
+966 1 2259296 [email protected]
-SpeakerSPage 10 of 14 09:16:20-7/1/2012
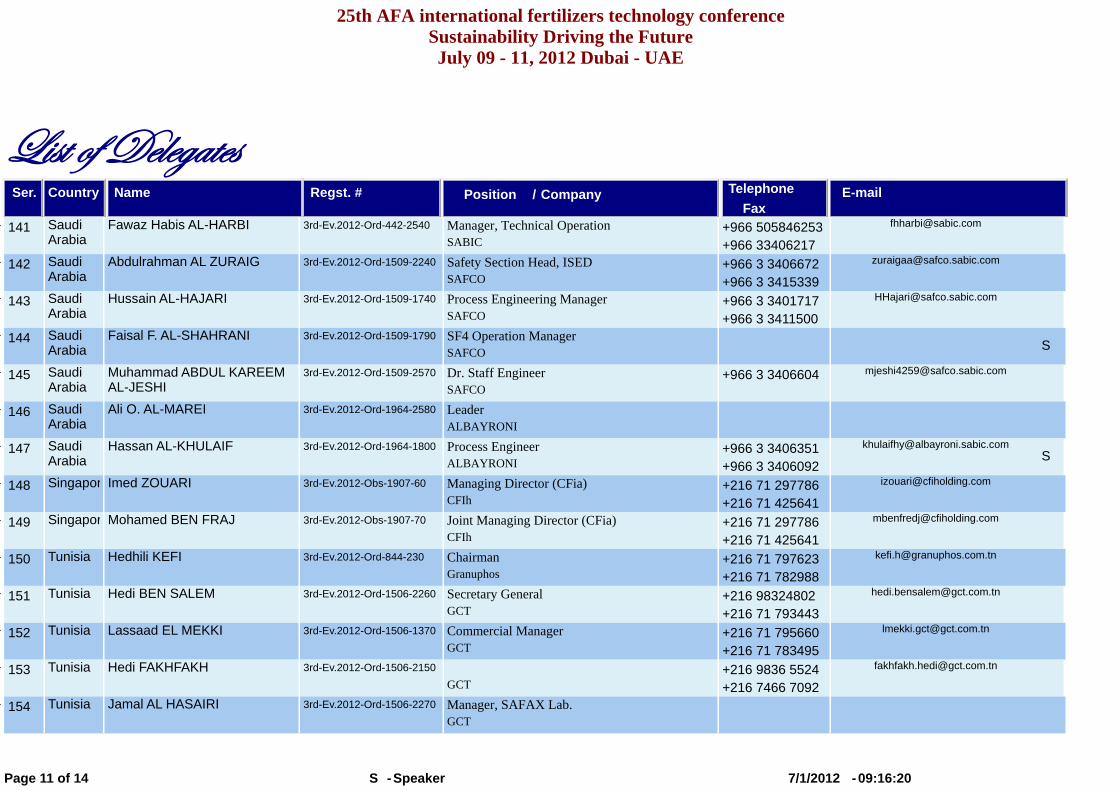
25th AFA international fertilizers technology conferenceSustainability Driving the FutureJuly 09 - 11, 2012 Dubai - UAE
_|áà Éy WxÄxztàxáSer. Company/PositionRegst. #Country Name
Fax
Telephone E-mail
141 Saudi Arabia
Fawaz Habis AL-HARBI 3rd-Ev.2012-Ord-442-2540 Manager, Technical OperationSABIC
+966 505846253+966 33406217
142 Saudi Arabia
Abdulrahman AL ZURAIG 3rd-Ev.2012-Ord-1509-2240 Safety Section Head, ISEDSAFCO
+966 3 3406672+966 3 3415339
143 Saudi Arabia
Hussain AL-HAJARI 3rd-Ev.2012-Ord-1509-1740 Process Engineering ManagerSAFCO
+966 3 3401717+966 3 3411500
S144 Saudi
ArabiaFaisal F. AL-SHAHRANI 3rd-Ev.2012-Ord-1509-1790 SF4 Operation Manager
SAFCO
145 Saudi Arabia
Muhammad ABDUL KAREEM AL-JESHI
3rd-Ev.2012-Ord-1509-2570 Dr. Staff EngineerSAFCO
+966 3 3406604 [email protected]
146 Saudi Arabia
Ali O. AL-MAREI 3rd-Ev.2012-Ord-1964-2580 LeaderALBAYRONI
S147 Saudi
ArabiaHassan AL-KHULAIF 3rd-Ev.2012-Ord-1964-1800 Process Engineer
ALBAYRONI+966 3 3406351+966 3 3406092
148 Singapor Imed ZOUARI 3rd-Ev.2012-Obs-1907-60 Managing Director (CFia)CFIh
+216 71 297786+216 71 425641
149 Singapor Mohamed BEN FRAJ 3rd-Ev.2012-Obs-1907-70 Joint Managing Director (CFia)CFIh
+216 71 297786+216 71 425641
150 Tunisia Hedhili KEFI 3rd-Ev.2012-Ord-844-230 ChairmanGranuphos
+216 71 797623+216 71 782988
151 Tunisia Hedi BEN SALEM 3rd-Ev.2012-Ord-1506-2260 Secretary General GCT
+216 98324802+216 71 793443
152 Tunisia Lassaad EL MEKKI 3rd-Ev.2012-Ord-1506-1370 Commercial ManagerGCT
+216 71 795660+216 71 783495
153 Tunisia Hedi FAKHFAKH 3rd-Ev.2012-Ord-1506-2150 GCT
+216 9836 5524+216 7466 7092
154 Tunisia Jamal AL HASAIRI 3rd-Ev.2012-Ord-1506-2270 Manager, SAFAX Lab.GCT
-SpeakerSPage 11 of 14 09:16:20-7/1/2012
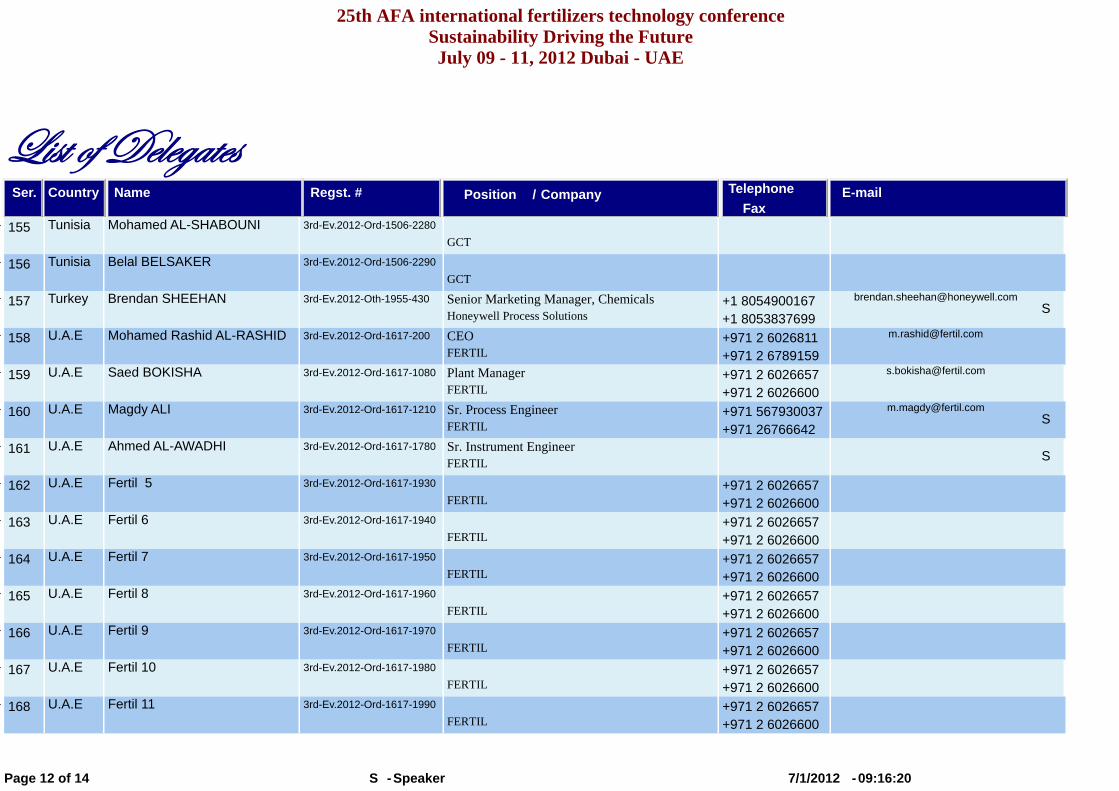
25th AFA international fertilizers technology conferenceSustainability Driving the FutureJuly 09 - 11, 2012 Dubai - UAE
_|áà Éy WxÄxztàxáSer. Company/PositionRegst. #Country Name
Fax
Telephone E-mail
155 Tunisia Mohamed AL-SHABOUNI 3rd-Ev.2012-Ord-1506-2280
GCT
156 Tunisia Belal BELSAKER 3rd-Ev.2012-Ord-1506-2290
GCT
S157 Turkey Brendan SHEEHAN 3rd-Ev.2012-Oth-1955-430 Senior Marketing Manager, Chemicals
Honeywell Process Solutions+1 8054900167+1 8053837699
158 U.A.E Mohamed Rashid AL-RASHID 3rd-Ev.2012-Ord-1617-200 CEO FERTIL
+971 2 6026811 +971 2 6789159
159 U.A.E Saed BOKISHA 3rd-Ev.2012-Ord-1617-1080 Plant ManagerFERTIL
+971 2 6026657+971 2 6026600
S160 U.A.E Magdy ALI 3rd-Ev.2012-Ord-1617-1210 Sr. Process Engineer
FERTIL+971 567930037+971 26766642
S161 U.A.E Ahmed AL-AWADHI 3rd-Ev.2012-Ord-1617-1780 Sr. Instrument Engineer
FERTIL
162 U.A.E Fertil 5 3rd-Ev.2012-Ord-1617-1930
FERTIL+971 2 6026657+971 2 6026600
163 U.A.E Fertil 6 3rd-Ev.2012-Ord-1617-1940
FERTIL+971 2 6026657+971 2 6026600
164 U.A.E Fertil 7 3rd-Ev.2012-Ord-1617-1950
FERTIL+971 2 6026657+971 2 6026600
165 U.A.E Fertil 8 3rd-Ev.2012-Ord-1617-1960
FERTIL+971 2 6026657+971 2 6026600
166 U.A.E Fertil 9 3rd-Ev.2012-Ord-1617-1970
FERTIL+971 2 6026657+971 2 6026600
167 U.A.E Fertil 10 3rd-Ev.2012-Ord-1617-1980
FERTIL+971 2 6026657+971 2 6026600
168 U.A.E Fertil 11 3rd-Ev.2012-Ord-1617-1990
FERTIL+971 2 6026657+971 2 6026600
-SpeakerSPage 12 of 14 09:16:20-7/1/2012
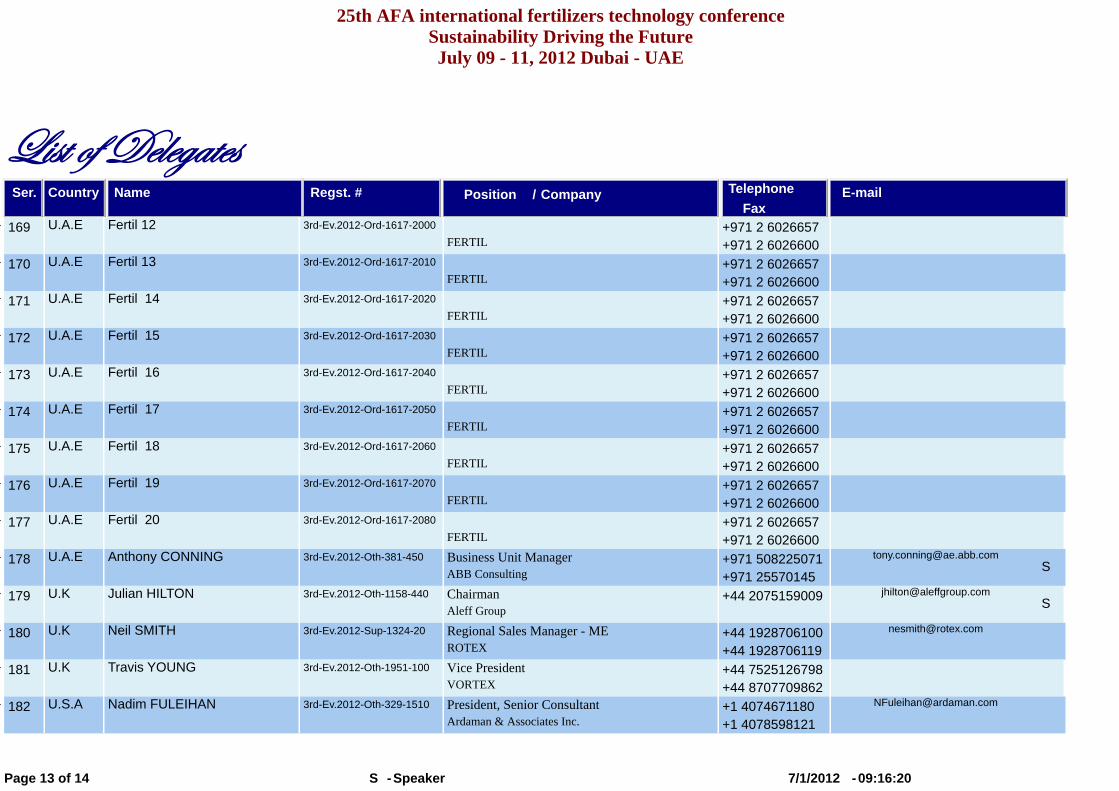
25th AFA international fertilizers technology conferenceSustainability Driving the FutureJuly 09 - 11, 2012 Dubai - UAE
_|áà Éy WxÄxztàxáSer. Company/PositionRegst. #Country Name
Fax
Telephone E-mail
169 U.A.E Fertil 12 3rd-Ev.2012-Ord-1617-2000
FERTIL+971 2 6026657+971 2 6026600
170 U.A.E Fertil 13 3rd-Ev.2012-Ord-1617-2010
FERTIL+971 2 6026657+971 2 6026600
171 U.A.E Fertil 14 3rd-Ev.2012-Ord-1617-2020
FERTIL+971 2 6026657+971 2 6026600
172 U.A.E Fertil 15 3rd-Ev.2012-Ord-1617-2030
FERTIL+971 2 6026657+971 2 6026600
173 U.A.E Fertil 16 3rd-Ev.2012-Ord-1617-2040
FERTIL+971 2 6026657+971 2 6026600
174 U.A.E Fertil 17 3rd-Ev.2012-Ord-1617-2050
FERTIL+971 2 6026657+971 2 6026600
175 U.A.E Fertil 18 3rd-Ev.2012-Ord-1617-2060
FERTIL+971 2 6026657+971 2 6026600
176 U.A.E Fertil 19 3rd-Ev.2012-Ord-1617-2070
FERTIL+971 2 6026657+971 2 6026600
177 U.A.E Fertil 20 3rd-Ev.2012-Ord-1617-2080
FERTIL+971 2 6026657+971 2 6026600
S178 U.A.E Anthony CONNING 3rd-Ev.2012-Oth-381-450 Business Unit Manager
ABB Consulting+971 508225071+971 25570145
S179 U.K Julian HILTON 3rd-Ev.2012-Oth-1158-440 Chairman
Aleff Group+44 2075159009 [email protected]
180 U.K Neil SMITH 3rd-Ev.2012-Sup-1324-20 Regional Sales Manager - MEROTEX
+44 1928706100+44 1928706119
181 U.K Travis YOUNG 3rd-Ev.2012-Oth-1951-100 Vice PresidentVORTEX
+44 7525126798+44 8707709862
182 U.S.A Nadim FULEIHAN 3rd-Ev.2012-Oth-329-1510 President, Senior ConsultantArdaman & Associates Inc.
+1 4074671180+1 4078598121
-SpeakerSPage 13 of 14 09:16:20-7/1/2012
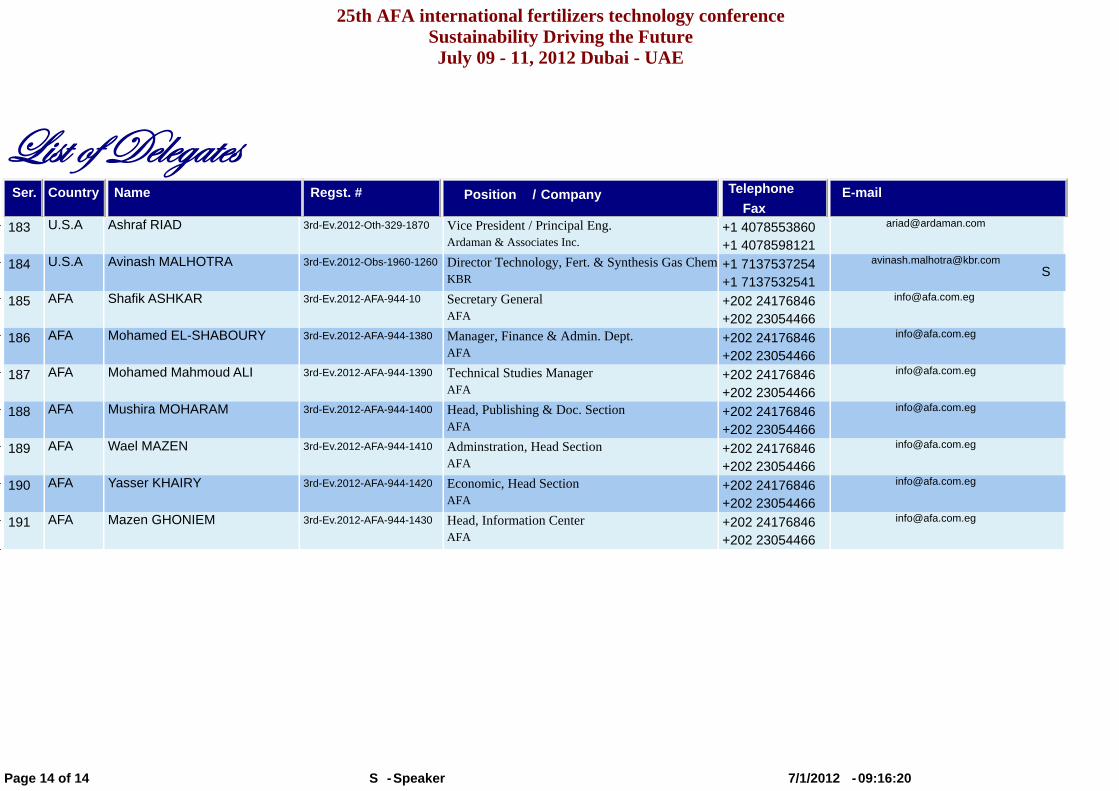
25th AFA international fertilizers technology conferenceSustainability Driving the FutureJuly 09 - 11, 2012 Dubai - UAE
_|áà Éy WxÄxztàxáSer. Company/PositionRegst. #Country Name
Fax
Telephone E-mail
183 U.S.A Ashraf RIAD 3rd-Ev.2012-Oth-329-1870 Vice President / Principal Eng.
Ardaman & Associates Inc.+1 4078553860+1 4078598121
S184 U.S.A Avinash MALHOTRA 3rd-Ev.2012-Obs-1960-1260 Director Technology, Fert. & Synthesis Gas Chem.
KBR+1 7137537254+1 7137532541
185 AFA Shafik ASHKAR 3rd-Ev.2012-AFA-944-10 Secretary General AFA
+202 24176846+202 23054466
186 AFA Mohamed EL-SHABOURY 3rd-Ev.2012-AFA-944-1380 Manager, Finance & Admin. Dept. AFA
+202 24176846+202 23054466
187 AFA Mohamed Mahmoud ALI 3rd-Ev.2012-AFA-944-1390 Technical Studies ManagerAFA
+202 24176846+202 23054466
188 AFA Mushira MOHARAM 3rd-Ev.2012-AFA-944-1400 Head, Publishing & Doc. Section AFA
+202 24176846+202 23054466
189 AFA Wael MAZEN 3rd-Ev.2012-AFA-944-1410 Adminstration, Head SectionAFA
+202 24176846+202 23054466
190 AFA Yasser KHAIRY 3rd-Ev.2012-AFA-944-1420 Economic, Head SectionAFA
+202 24176846+202 23054466
191 AFA Mazen GHONIEM 3rd-Ev.2012-AFA-944-1430 Head, Information CenterAFA
+202 24176846+202 23054466
-SpeakerSPage 14 of 14 09:16:20-7/1/2012


