Embed Size (px)
Citation preview
Gesellschaft fürReaktorsicherheit (GRS) mbH
11
Proceedingsof the OECD/BMU-Workshop on
Special Issues of Level 1 PSA
Held in Cologne, F.R.G.May 27 - 29, 1991
GRS-86
7
Gesellschaft fürReaktorsicherheit (GRS) mbH
Proceedingsof the OECO/BMU-Workshop on
Speciallssues of Level 1 PSA
Held in Cologne, F.R.G.May 27 - 29,1991
Compiled by U. Hauptmanns
GRS-86 (July 1991)ISBN 3 - 923875 - 36 - 3
Contents
Page
List of Participants
INTRODUCTORY SESSION
Opening Address
W. Ullrich, FRG
11
12
The Activities of the OECO/NEA
in Risk Assessment - An Overview -
P.M. Hertrich, FRG
15
Objectives and Status of Work of PWG 5fTask 9,
.State of the Art of Level 1 PSA Methodology.
R. Virolainen, Finland
41
State-of-the-Art of Level 1 PSA
W.F. Werner, FRG50
ANALYSIS OF DEPENDENCIES
Issue Paper on Oependent Failures
U. Hauptmanns, FRG
92
93
Why is the Markov Method not used as a Standard
Technique in PSA?
E. Silvestri, Italy
97
The Conditional Applicabilty of the B-Factor
Method for Structural Redundancies
K. Lützow and L. Fuhrmann, FRG
105
Evaluation Criteria of Safety System
Unavailabilities for Nuclear Power Plants
H. Murakami, S. Oda, T. Sato, M. Matsumoto
and S. Miura,
123
11
Contents
Page
PSA Convoy-Influence and Modellng
of Common Cause Failures
~. Feigel and J. Wenzel, FRG
130
nME DEPENDENT PHENOMENA,
UNCERTAINTIES
Uncertainty Analysis. An Issue Paper
U. Pulkinnen, Finland
142
143
Uncertainty Study in Probabilstic Risk
Assessment for TVO 1/11 Nuclear Power Plant
J. Holmsberg and R. Himanen, Finland
148
Graphical Tools for Detection and Modellng
of Time Dependent Ageing Behaviour in Com.
ponent Data
H. Pamme, FRG
161
Draft Report for Comments: NKS/SIK - 1 Project
Report: Time Dependencies in LPSA Models
G. Johanson, Sweden
184
HUMAN ERROR
Issue Paper
J. Mertens, FRG
201
202
A Slim . Based Approach in Analyzing Operator
Cognitive Actions
L. Reiman
209
An Approach to the Analysis of Operating
Crew Responses Using Simulator Exercises
for use in PSAs
223
111
Contents
GW. Parry, A. Singh, A. Spurgin, P. Moieni and
A. Beare, USA
An Assessment of the Risk Significance of
Human Errors in Selected PSAs and Operating
Events
R.L. Palla, Jr., A. EI-Bassioni and
J. Higgins, USA
Quantification of Human Errors in Level-1
PSA Studies in NUPEC/JINS
M. Hirano, M. Hirose, M. Sugawara and
T. Hashiba, Japan
Improved Main Control Board with a Better
Man-Machine Interface
T. Oshibe, Japan
EXTERNAL EVENTS
Issue paper on "Extemal Events.
C. Zaffiro
Extemal Events Assessment for an LMFBR
Plant
K. Aizawa, R. Nakai and A. Yamaguchi, Japan
Possibilities and Limitations of Probabilstic Fire
Safety Analyses lIustrated by Analyses in the
German Ris~ Study
H. Liemersdorf, FRG
Seismic Assessment for N.P.P. According to
Italian Praetice
S. D'Offizi, L. Magri and F. Muzzi, Italy
Page
242
260
279
292
304
~
318
332
IV
Contents
Page
Experience Gained in Italy on the Probabilistic
Analysis of Accidents Initiated by Seismic Events
A. Pugliese, A. Valeri and C. Zaffiro, Italy
340
SPECIAL TOPICS
Experiences with Oata Collection, Retrieval
and Interpretation for PSA Purposes
H. Pamme and L. Seyfarth, FRG
351
352
Frequencies of Leaks and Breaks in Safety
Related Piping of PWR-Plants as
Initiating Events for LOCAs
S. Beliczey, FRG
364
Evaluation of Low Power and Shutdown
Events in German PWRs
M. Simon, FRG
381
Living PSS Used to Support the Oevelopment
of A New Generation of BWR
V. Cavicchia, E. Traini, L. Matteocci and
A. Valeri, Italy
391
SUMMARY OF DISCUSSION 398

- 1 -
OECD I BMU Workshop on
IISpeciallssues of Level
1 PSAII
List of Participants
- 2-
ABE Mr.Kiyoharo AbeHead of Risk Analysis Lab.Japan Atomic Energy ResearchInsti tute - JAERITokai Research EstablishmentTokai-Mura, Naka-gun,Ibaraki-ken 319-11, Japan
Dr. Kiyoto AizawaPower Reactor and Nuclear FuelDevelopment corporationReactor Engineering Developmentcorporation - RTDDSan-Kai-Doh Bldg.9-13, 1-Chome, AkasakaMINATO-KU, TOKYO-107 - Japan
AIZAWA
BALFANZ HerrnDipl.-Ing. H.-P. BalfanzTUEV Norddeutschland e. V.Grosse Bahnstr. 312000 Hamburg 54
BELICZEY HerrnDipl.-Ing. Stefan BeliczeyGesellschaft fuer Reaktorsicherheit(GRS) mbHSchwertnergasse 15000 Koeln 1
BERG HerrnDr. Heinz-Peter BergBundesamt fuer Strahlenschutzpostfach 10 01 493320 salzgitter
BLAESIG HerrnDr. Helmut BlaesigRWE Energie AGHV - Abt. KK-BSKruppstr. 54300 Essen 1
BREILING HerrnGuenter BreilingABB Reaktor GmbHDudenstrasse 44Postfach 10 05 636800 Mannheim 1
BURCHHDT HerrnDipl . - Ing. Wal ter BurchhardtEnergieversorgung Schwaben AGumspannanlage Scheibenhardtpostfach 37 207500 Karlsruhe 1
- 3-
CAEYMAEX Mister CaeymaexNuclear Process DepartmentTRACTEBELBoulevard du Regent, 8/M7B - 1000 Bruxelles
CALVO Mr.Jose I. Cal voconsejo de SeguridadNuclear (CSN)c/Justo Dorado, No. 11E-28040 MadridSPAIN
CAMPBELL Mr.J. F. CampbellH.M. Nuclear InstallationsinspectorateRoom 601, st. Peter's HouseBootle Merseyside L 20 3LZunited Kingdom
CHAG Mr.Hong L. ChangNuclear Safety DivisionOrganisation for EconomicCo-Operation and Development38, Boulevard SuchetF-75016 Paris
DE GELDER HerrnPieter de GelderSection HeadAlB - Vincotte NuclearAvenue du Roi 157B-1060 Bruxelles
DEUTSCHMNN HerrnHerbert DeutschmannBundesamt fuer EnergiewirtschaftHauptabteilung fuer die Sicherheitder Kernanlagen (HSK)CH-5303 Wuerenlingen
DINSMORE HerrnStephen C. DinsmoreTechnischer SicherheitsberaterHermann-Steinhaeuser-str. 186050 Offenbach
DOODT Herrn DoodtGemeinschaftskernkraftwerkNeckar GmbHPostfach7129 Neckarwestheim
- 4-
EL-BASSIONI Mr.Adel El-Bassionisection Chiefu. S. Nuclear Regulatory COMmissionWashington, D.C. 20555USA
FABIAN HerrnDr. - Ing. Hermann FabianSiemens AGUnternehmensbereich KWU7213Postfach 32 208520 Erlangen
B. Yngwe FlodinSwedish State Power BoardNuclear Power I PSAJaemtflandsgatan 995-16287 vaellingbySweden
FLODlN
GADOLA HerrnAngelo GadolaCentro Progettazione e Construzioneper gli Impipianti NucleariViale Regina Margherita 1371-00100 Roma
GlBSON HerrnIan Kenneth GibsonUKAEA Safety andReliability DirectorateWigshaw Lane, CulchethwarringtonCheshire WA3 4NEUni ted Kingdom
HAGSTOTZ HerrnDipl. - Ing . Gerhard HagstotzHochtemperatur-Reaktorbau GmbHDudenstr. 446800 Mannheim 1
HASHIBA Mr. Takashi HashibaSenior EngineerNuclear Power Engineering Test Ctr.Japan Institute of Nuclear 5afetyFuj ita Kankou Toranomon Bldg 7F3-17-1, ToranomonMinato-Ku, Tokyo 105JAPAN
- 5 -
HAUPTNS HerrnDr. Ulrich HauptmannsGesellschaft fuer Reaktorsicherheit(GRS) mbHSchwertnergasse 15000 Koeln 1
HENNINGS HerrnDipl. -lng. Wilfried HenninqsForschungszentrum Juelich GmbHInsti tut fuer NukleareS icherhei ts forschungPostfach 19 135170 Juelich 1
HERTTRICH Herrn RegierungsdirektorDr. Michael HerttrichBundesministerium fuer Umwelt,Naturschutz und ReaktorsicherheitRS I 2 (G)Husarenstrasse 305300 Bonn 1
HIRAO Mr. Mi tsumasa HiranoHead, Reactor Design Analysis Div.Nuclear Power Enqineering Test ctr.Japan Institute of Nuclear safetyFuj ita Kankou Toranomon Bldg 7F3-17-1, ToranomonMinato-Ku, Tokyo 105JAPAN
HIROSE Mr. Masao HirosePrinciple EngineerNuclear Power Enqineering Test ctr.Japan Institute of Nuclear SafetyFujitaKankou Toranomon Bldg 7F3-17-1, ToranomonMinato-Ku, Tokyo 105JAPAN
HOEMKE HerrnPaul HoemkeGesellschaft fuer Reaktorsicherheit(GRS) niHSchwertnergasse 15000 Koeln 1
HOLMBERG Mr.Jan HolmberqTechnical Research Centre of FinlandLaboratory of Electrical Engineeringand Automation TechnologyOtakaari 7 BSF-01250 Espoo
- 6-
KALFSBEEK HerrnHenk KalfsbeekCommission of theEuropean CommunitiesD.G. XlI/D/1 - ARTS LUX 2/52Rue de la Lei 200B-1049 B r u s s e 1 s
KOJIMA Shigeo Koj imaMitsubishi Atomic PowerIndustries, Inc.4-1 Shibakouen 2-ChomeMinato-ku, Tokyo 105JAPAN
KUNlTZ HerrnDr. Harald Kuni tzGesellschaft fuer Reaktorsicherheit(GRS) mbHSchwertnergasse 15000 Koeln 1
LI EMERS DORF HerrnHeinz LiemersdorfGesellschaft fuer Reaktorsicherheit(GRS) mbHSchwertnergasse 15000 Koelri 1
LIWAAG Mr.Bo LiwaangSwedish Nuclear Power Inspectorate(S K I)Division for Reliability AnalysisSehlstedtsgatan 11Box 27106S-102 52 Stockholm
LUETZOW Herrn ProfessorDr. -Ing. Klaus LuetzowTechnische Hochschule zittauTheodor-Koerner-Allee 160-8800 Zittau
MAGRI HerrnL. MagriISMESVia dei Crociferi 441-00187 RomItalien

- 7-
MERTENS HerrnDr. J. MertensInstitut fuer Sicherheitsforschungund Reaktortechnik ISRForschungszentru Juelich GmbHPostfach 19 135170 Juelich
MOESER HerrnDipl. -Ing. Andreas MoeserBayernwerk AGPostfach 20 03 40Nymphenburqer Str. 398000 Muenchen 2
MUELLER-ECKER HerrnDieter Mueiler~EckerGesellschaft fuer Reaktorsicherheit(GRS) mbHSchwertnergasse 15000 Koeln 1
MURAKAI Mr. Hideaki MurakamiManager Nucl. Power Plant Div.Tokyo Electric Power Company1-3Uchisaiwai-cho, 1-ChomeChiyoda-ku, TokyoZipcode 100Japan
ODA Mr.Shingo OdaSafety Engineering SectionHitachi Engineering Co. Ltd.2-1 Saiwaicho 3-chomeHi tachi -ShiIbaraki-Ken317 Japan
OHLMYER HerrnDipl. - Ing. Hermann ohlmeyerHamburgischeElectrici taets-Werke AGUeberseering 122000 Hamburg 60
OSHIBE Mr.Toshihiro OshibeNuclear Power Engineering SectionThe KASAI Electric Power Co., Inc.3 - 22, 3 -chome, Nakanoshima,Kita-ku, Osaka 530JAPAN
- 8-
PAM HerrnDipl. -Ing. Hartmut PammeRWE Energie AGKK - BSKrppstr. 54300 Essen 1
PARY Mr.Gareth ParrySenior Executive EngineerNUS Corporation910 Clopper RoadGaithersburg, Maryland 20878USA
PUGLIESE Mr.Dr. Antonio PuglieseDirezione Sicurezza Nucleare eProtezione Sanitaria (DISP)EH E AVia vitaliano Brancati 481-00144 Roma
PULKlNEN Mr.Urho PulkkinenTechnical Research Centre of FinlandLaboratory of Electrical Engineeringand Automation TechnologyOtakaari 7 BSF-01250 Espoo
RElMAN Mr.Lasse ReimannDepartment of Nuclear safetyFinnish Centre for Radiationand Nuclear SafetyP. O. Box 268SF-00101 Helsinki 10
R1EHN HerrnDr. Peter RiehnHessisches Ministerium fuer Umwelt,Energie und BundesangelegenheitenMainzer strasse 806200 Wiesbaden
ROEWEKAP FrauDr. Mar ina RoewekampGesellschaft fuer Reaktorsicherheit(GRS) mbHSchwertnergasse 15000 . Koeln 1
SATO Mr. Takashi SatoTOSHlBA Co.1SOGO Engineering Centre8 Shinsugita - Cho1SOGO-KUJ -Jokohama 235Japan
- 9-
SCHNEIDER HerrnPeter SchneiderElektrowatt ingenieur-unternehmung GmbHZweigniederlassung MannheimAlois Senefelderstrasse 1-36800 Mannheim 1
SCHUBERT HerrnDr. Bernd SchubertHamburgische Electricitaets-Werke AGPostfach 60 09 60Ueberseering 122000 Hamburg 60
SEYFFARTH HerrnDipl. - Ing. Lothar SeyffarthRWE Energie AGKruppstr. 54300 Essen 1
SILVESTRI, HerrnDr. Enrico SilvestriAnsaldo S.p.A.corso Perrone 251-16161 GenovaItaly
SIMON HerrnManfred SimonGesellschaft fuer Reaktorsicherheit(GRS) mbHSchwertnergasse 15000 Koeln 1
STUECK HerrnDr. Reinhard StueckGesellschaft fuer Reaktorsicherheit(GRS) mbHschwertnergasse 15000 Koeln 1
TUERSCHM HerrnMichael TuerschmannGesellschaft fuer Reaktorsicherheit(GRS) mbHBuero BerlinKurfuerstendamm 2001000 Berlin 15
VALERl Mr. A. ValeriDirezione Centrale della SicurezzaNucleare e della ProtezioneSanitariaEnte nazionale Energie AlternativeViale Regina Margherita 1251-00198 Rom
- 10-
VERSTEEG Mr. M.F. VersteegThe Nuclear Safety Departmentof the Ministry ofSocial Affairs and EmploymentNuclear Safety DepartmentP.O. Box 908042509 LV Den HaagThe Netherlands
VlROLAINEN Mr. Reino VirolainenFinnish Centre for Radiationand Nuclear SafetyP. o. Box 268SF-00101 Helsinki 10
WEND HerrnWendTUEV Rheinland e. VPostfach 10 17 50500 Koeln 1
WENZEL HerrnJ. WenzelSiemens AktiengesellschaftUnternehmensbereich KWE 422Postfach 32 208520 Erlangen
WERNER HerrnDr. wolfgang WernerGesellschaft fuer Reaktorsicherheit(GRS) mbHForschungsgelaende8046 Garching
ZAFFIRO Mr.Carlo ZaffiroDirezione Sicurezza Nucleare eProtezione Sanitaria (DISP)E N E AVia Vitaliano Brancati 481-00144 Roma
ZIMMR HerrnDr. Hans-Josef ZimmerBadenwerk AGAbteilung MKBadenwerkstr. 2Postfach 16 807500 Karlsrue 1
ZIMMRM HerrnMarkus ZimmermannGesellschaft fuer Reaktorsicherheit(GRS) mbHFQ~sçh~ngsgelaenge8046 Garchinq

- 11 -
Introductory Session
- 12-
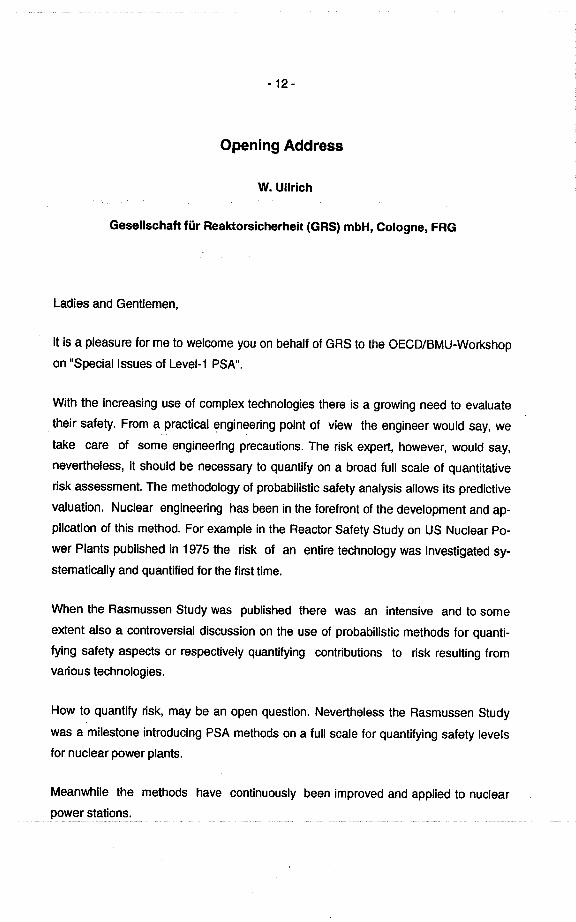
Opening Address
W. Ullrich
Gesellschaft für Reaktorsicherheit (GRS) mbH, Cologne, FRG
Ladies and Gentlemen,
it is a pleasure for me to welcome you on behalf of GRS to the OECDIBMU-Workshop
on "Speciallssues of Level-1 PSA".
With the increasing use of complex technologies there is a growing need to evaluate
their safety. From a practical engineering point of view the engineer would say, we
take care of some engineering precautions. The risk expert, however, would say,
nevertheless, it should be necessary to quantify on a broad full scale of quantiative
risk assessment. The methodology of probabilistic safety analysis allows its predictive
valuation. Nuclear engineering has been in the forefront of the development and ap-
plication of this method. For example in the Reactor Safety Study on US Nuclear Po-
wer Plants published in 1975 the risk of an entire technology was investigated sy-
stematically and quantified for the first time.
When the Rasmussen Study was published there was an intensive and to some
extent also a controversial discussion on the use of probabilistic methods for quanti-
fying safety aspects or respectively quantifying contributions to risk resulting tromvarious technologies.
How to quantify risk, may be an open question. Nevertheless the Rasmussen Study
was a milestone introducing PSA methods on a full scale for quantifying safety levels
for nuclear power plants.
Meanwhile the methods have continuously been improved and applied to nuclear
stations.
- 13-
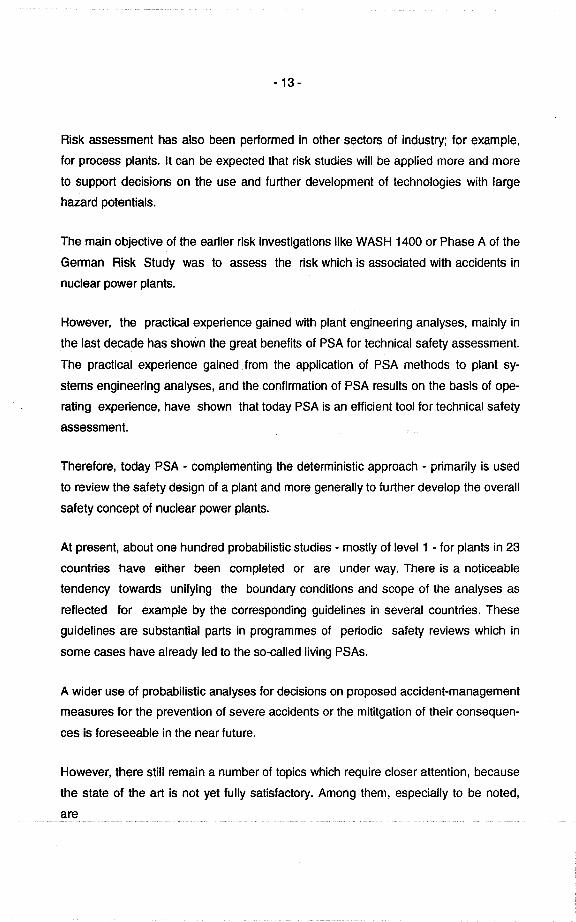
Risk assessment has also been performed in other sectors of industry; for example,
for process plants. It can be expected that risk studies wil be applied more and more
to support decisions on the use and further development of technologies with large
hazard potentials.
The main objective of the earlier risk investigations Iike WASH 1400 or Phase A of the
German Risk Study was to assess the risk which is associated with accidents in
nuclear power plants.
However, the practical experience gained with plant engineering analyses, mainly in
the last decade has shown the great benefits of PSA for technical safety assessment.
The practical experience gained trom the application of PSA methods to plant sy-
stems engineering analyses, and the confirmation of PSA results on the basis of ope-
rating experience, have shown that today PSA is an efficient tool for technical safety
assessment.
Therefore, today PSA - complementing the deterministic approach - primarily is used
to review the safety design of a plant and more generally to further develop the overall
safety concept of nuclear power plants.
At present, about one hundred probabilistic studies - mostly of level 1 - for plants in 23
countries have either been completed or are under way. There is a noticeable
tendency towards unifying the boundary conditions and scope of the analyses as
reflected for example by the corresponding guidelines in several countries. These
guidelines are substantial parts in programmes of periodic safety reviews which in
some cases have al ready led to the so-called Iiving PSAs.
A wider use of probabilistic analyses for decisions on proposed accident-management
measures for the prevention of severe accidents or the mititgation of their consequen-
ces is foreseeable in the near future.
However, there still remain a number of topics which require closer attention, because
the state of the art is not yet fully satisfactory. Among them, especially to be noted,
are

- 14-
common cause tailure analysis
human error
time dependence
treatment of uncertainties.
This workShop is devoted to these issues and we feel that progress may best be
achieved if there is an international approach.
We very much appreciate that the OECO and our ministry have asked ~RS to organi-
ze this meeting. We wish all of you a vidid exchange of opinions and hope that you
will have benetits from this meeting. You may get an overview ot the activities in PSA
in different countries and usetul suggestions tor your own work.
We are grateful to both speakers and participants tor making this event possible and
hope you'ii find the effort ot this workshop worthwhile.
- 15-
OECD / BMU WORKSHOPSpecial Issues of Level 1 PSACologne, May 270 - 29. 1991
The Activities of the OECD / NEAin Risk Assessment
- An Overview -
P .M.HerttrichChairman 01 OECD-NEA Principal
Working Group 5: Risk Assessment
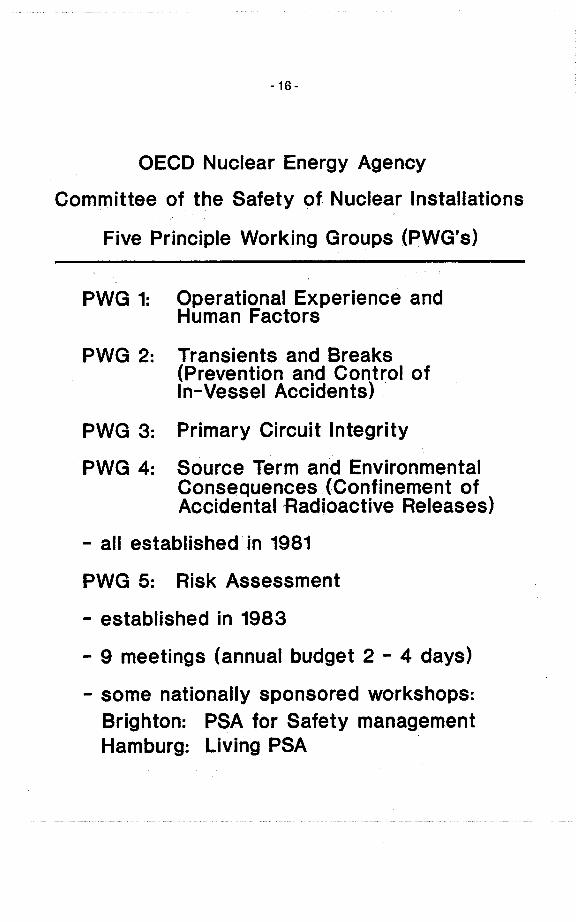
- 16-
OECD Nuclear Energy Agency
Committee of the Safety. of Nuclear Installations
Five Principle Working Groups (PWG's)
PWG 1: Operational Experience andHuman Factors
PWG 2: Transients and Breaks(Prevention and Control ofIn-Vessel Accidents) .
PWG 3: Primary Circuit Integrity
PWG 4: Source Term and EnvironmentalConsequences .(Confinement ofAccidental Hadioactive Releases)
- all established in 1981
PWG 5: Risk Assessment
- established in 1983
- 9 meetings (annual budget 2 - 4 days)
- some nationally sponsored workshops:Brighton: PSA for Safety managementHamburg: Living PSA
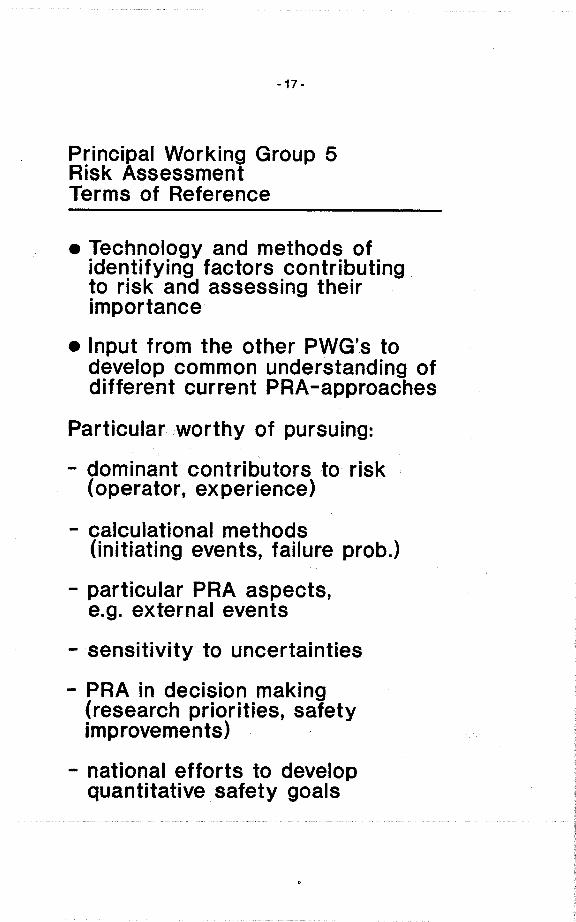
-17 -
Principal Working Group 5Risk AssessmentTerms of Reference
. Technology and methods ofidentifying factors contributingto risk and assessing theirimportance
. Input from the other PWG's todevelop common understanding ofdifferent current PRA-approaches
Particularworthy of pursuing:
- dominant contributors to risk(operator, experience)
- calculational methods(initiating events, failure prob.)
- particular PRA aspects,e.g. external events
- sensitivity to uncertainties
- PRA in decision making(research priorities, safetyimprovements)
- national efforts to developquantitative safety goals
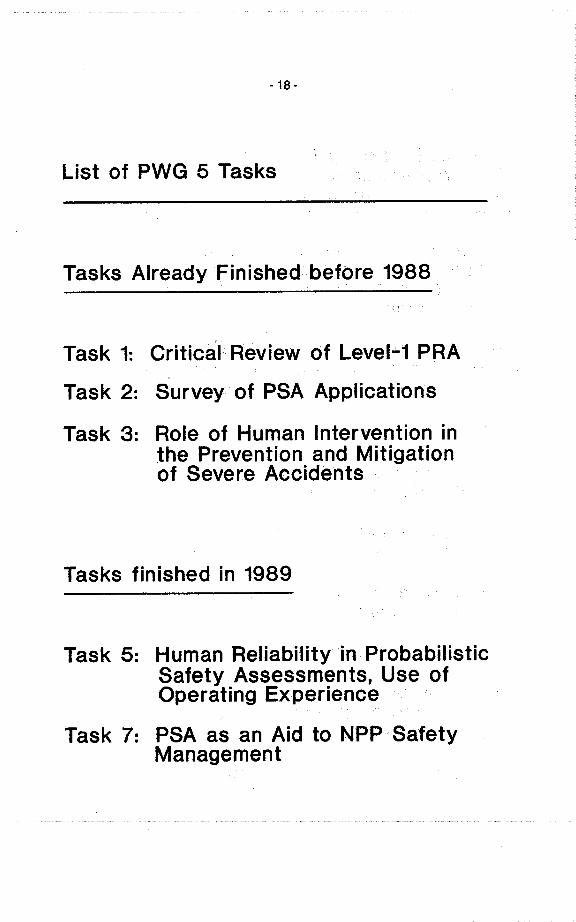
- 18.
List of PWG 5 Tasks
Tasks Already Finished beföre 1988
Task 1: Critical Review of Level"'1 PRA
Task 2: Survey of PSA Applicatiöns
Task 3: Role of Human Intervention inthe Prevention and Mitigationof Severe Accidents
Tasks finished in 1989
Task 5: Human Reliability in ProbabilsticSafety Assessments, Use ofOperating Experience
Task 7: PSA as an Aid to NPP SafetyManagement

-19 -
List 01 PWG 5 Tasks (contd)
Current Tasks
Regular Task:
Current Status of PSAProgrammes in Member Countries
Task 4: Consideration of QuantitativeSafety Guidelines in MemberCountries
Task 8: PSA of LWR-ContainmentSystems Performance
Task 9: State-of-the-Art of Level-1PSA Methodology
Task 10: Fundamental Principles ofLiving PSA for NPP Management

- 20-
List of additional PWG 5 Tasks
Task 11: Technical Specifications
- approach under development
- related to CNRA-activities
Task 12: Oata C ollection and Analysisto Support Living PSA
- detailed task plan,w.orking group
. "
- 21 -
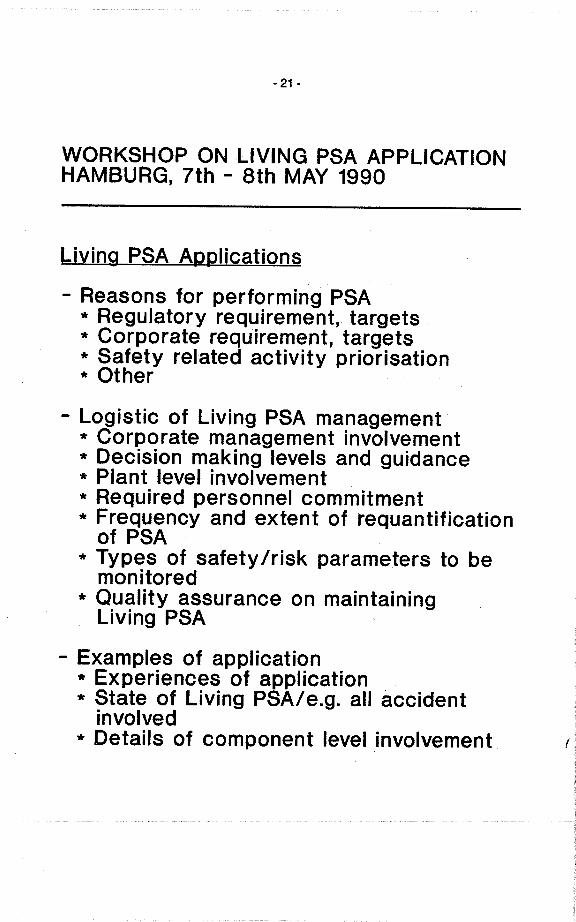
WORKSHOP ONLIVING PSA APPLICATIONHAMBURG, 7th - 8th MAY 1990
Living PSA Applications
- Reasons for performing PSA* Regulatory requirement, targets* Corporate requirement, targets* Safety relatedactivity priorisation* Other
- Logistic of Living PSA management* Corporate management involvement* Decision making levels and guidance* Plant level involvement* Required personnel commitment* Frequency and extent of requantification
of PSA* Types of safety Irisk parameters to be
monitored* Quality assurance on maintaining
Living PSA
- Examples of application* Experiences of application* State of Living PSAI e.g. all accident
involved* Details of component level involvement (
- 22-
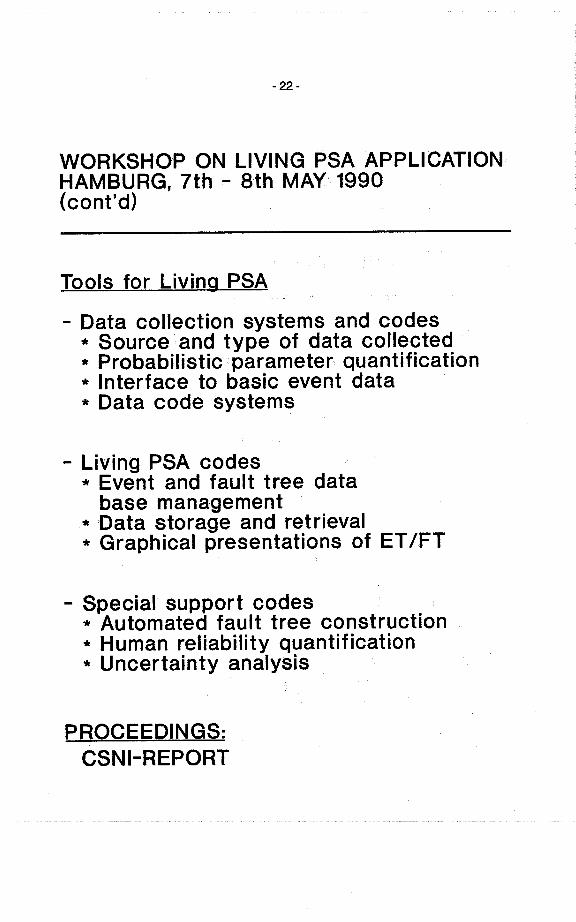
WORKSHOP ON LIVING PSA APPLICATIONHAMBURG, 7th - 8thMAY 1990(contd)
Tools for Living PSA
- Data collection .systems and codes* Source and type of data collected* Probabilistic .parameter quantification* Interface to basic event data* Data code systems
- Living PSA codes* Event and fault tree database management
* Data storage and retrieval* Graphical presentations of ET 1FT
- Special support codes* Automated fault tree construction* Human reliabilty quantification* Uncertainty analysis
PROCEEDINGS:CSNI-REPORT
- 23-
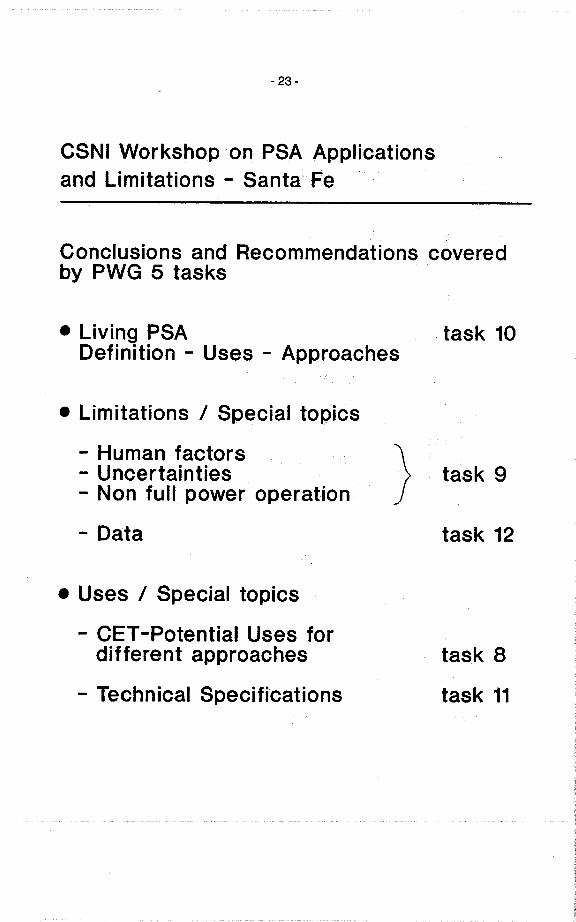
CSNI Workshop onPSA Applicationsand Limitations - Santa Fe
Conclusions and Recommendations coveredby PWG 5 tasks
. Living PSADefinition - Uses - Approaches
task 10
. Limitations / Special topics
- Human factors- Uncertainties- Non full power operation
- Data
) task 9
task 12
. Uses / Special topics
- CET -Potential Uses fordifferent approaches
- Technical Specifications
task 8
task 11

.24-
STATUS OF PSA-PROGRAMMES INMEMBER COUNTRIES
Status of PSA-Programmes in MemberCountries
- CSNI-Report 172
Country by country
- programme development- status and outlook- tables of studies performed
- plant- analysing team, dates- methods used/procedure guide- goal/insights and results/application
Continuously Updated as Reguired:
Current Extensions:
- formal requirements or committmentsas the basis of PSA programmes inMember Count ries
- references how to perform andreview PSA's
- 25-
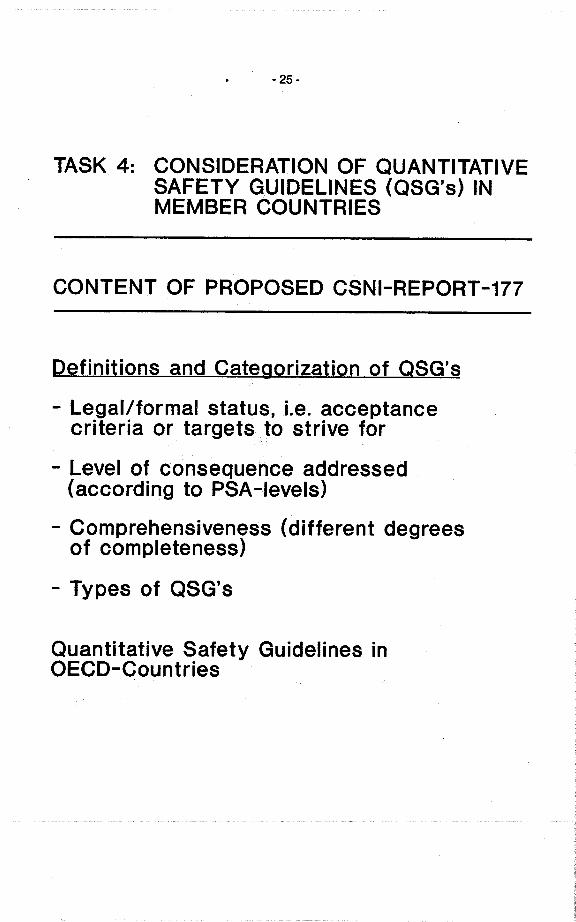
TASK 4: CONSIDERATION OF QUANTITATIVESAFETY GUIDELINES (QSG's) INMEMBER COUNTRIES
CONTENT OF PROPOSED CSNI-REPORT-177
Definitions and Categorization of QSG's
- Legal/formal status, i.e. acceptancecriteria or targets to strive for
- Level of consequence addressed(according to PSA-Ievels)
- Comprehensiveness (different degreesof completeness)
- Types of QSG's
Quantitative Safety Guidelines inOECD-Countries
- 26-
TASK 4: CONSIDERATION OF QUANTITATIVESAFETY GUIDELINES (QSG's) INMEMBER COUNTRIES
(contdJ
References to QSG's currently usedin (deterministic) regulations
Demonstrating Compliance with QSG
- Problem Area: Definition of terms(f.e. core melt/degradation), boundaryconditions e.g. human interventions;state of PSA -methodQlogy, use. ofexpert opinion, cut-off-techniques,uncertainties, level .of detail
Observations
New Item:
DiscussiQn of the role of quantitativePSA -Results in NPP Safety decision making
- 27-
TASK 8
PSA of the Containment System Performance
Purpose
Discussion and comparison of methods:containment
- sufficient complexity to make adequate useof available information on severe accidentphenomena
- how to factor this information ¡nto a PSA
Product
Interim Report availableDraft Report 1991
- 28.
TASK 8 (contd)
PSA of the Containment System Performance
Scope
Specification of typical event sequencesrepresentative for challenges or failuresof the containment system
Examination of recent PSA's, guides,handbooks and review guides
Common technical understanding ofapproaches that can be used tor
- plant specitic containment systemsanalysis
- factoring in phenomenological andsource term knowledge
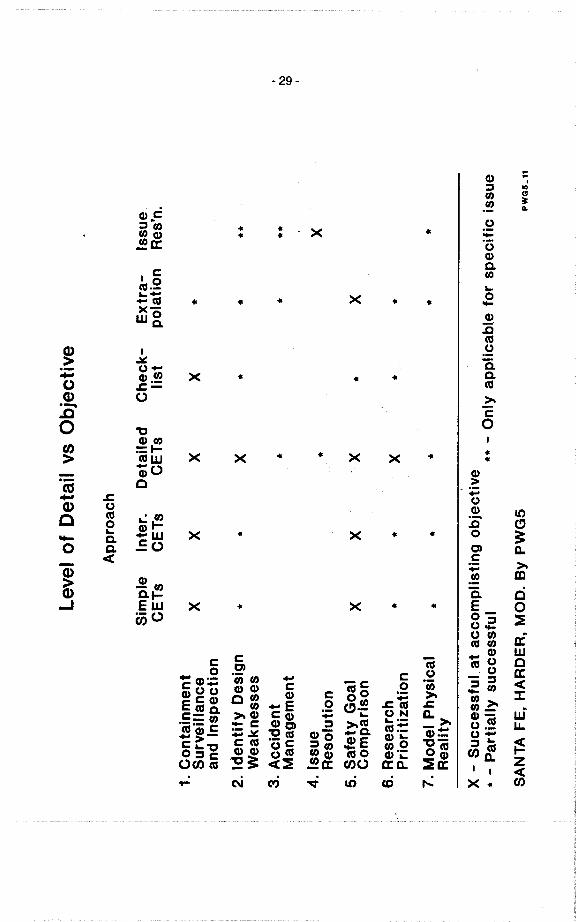
Lev
el o
f D
etai
l vs
Obj
ectiv
e
App
roac
h
Sim
ple
Inte
r.D
etai
led
Che
ck-
Ext
ra-
Issu
eC
ET
sC
ET
sC
ET
slis
tpo
latio
nR
es'n
.
1. C
onta
inm
ent
XX
XX
Surv
eila
nce
*
and
Insp
ectio
n
2. I
dent
ify
Des
ign
..
X.
*..
Wea
knes
ses
3. A
ccid
ent
,.
...
I\M
anag
emen
tco ,
4.ls
sue
.X
Res
olut
ion
5. S
afet
y G
oal
XX
X.
XC
ompa
riso
n6.
Res
earc
h.
.X
.*
Prio
ritiz
atio
n
7. M
odel
Phy
sica
l.
.*
..
Rea
lity
X -
Suc
cess
ful a
t acc
ompl
istin
g ob
ject
ive
.. - Only applicable for specific issue
· - P
artia
lly s
ucce
ssfu
l
SA
NT
A F
E, H
AR
DE
R, M
OD
. By
PW
G5
PWG
lI_"
- 30-
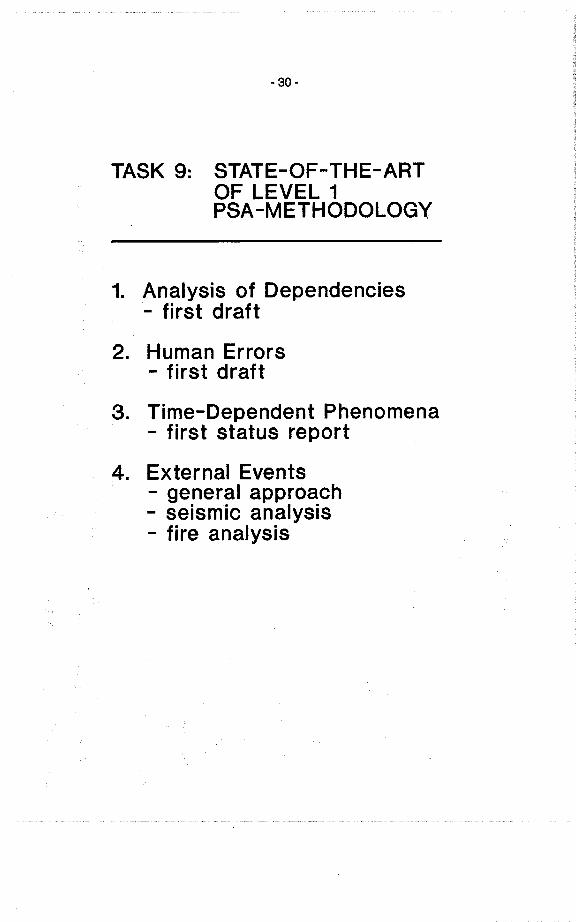
TASK 9: STATE-OF-THE-ARTOF LEVEL 1PSA -METHODOLOGY
1. Analysis of Dependencies- first draft
2. Human Errors- first draft
3. Time-Dependent Phenomena- first status report
4. External Events- general approach- seismic analysis- fire analysis
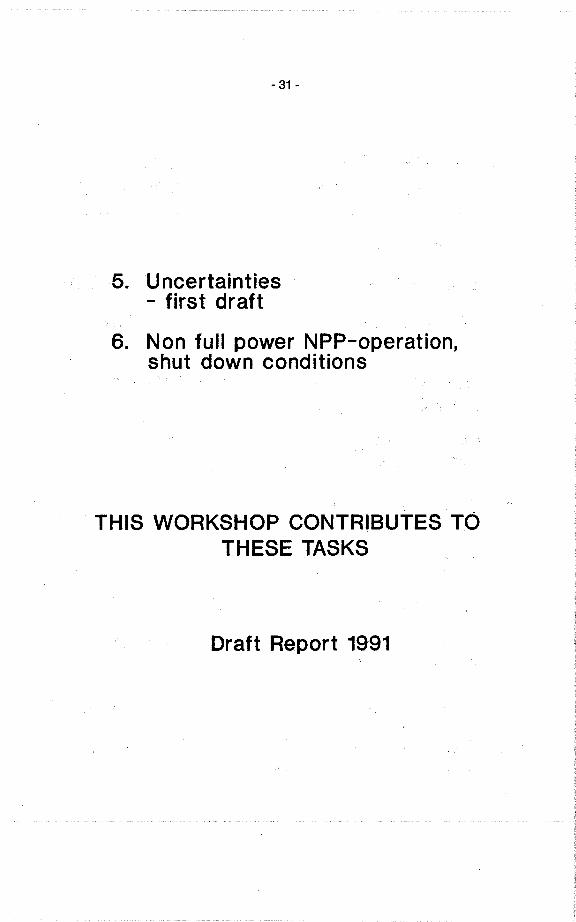
- 31 .
5. U ncertainties- first draft
6. Non full power NPP-operation,shut down conditions
THIS WORKSHOP CONTRIBUTES TUTHESE TASKS
Draft Report 1991

- 32-
Task 10: DRAFT REPORT ON LIVINGPSA FOR SAFETY MANAGEMENT
1. INTRODUCTION
2. ELEMENTS OF A LIVING PSA PROGRAMM
3. REVIEW OF EXAMPLES IN MEMBERCOUNTRIES
4. MOTIVATIONAL FACTORS BEHIND ALIVING PSA PROGRAM
5. PROGRAM CHARACTERISTICSIMPORTANT TO SUCCESS
6. PROGRAM STRUCTURES ANDREQUIREMENTS
7. TOOLS FOR LIVING PSA
8. DATA ACQUISITION AND EVALUATION
9. PSA DOCUMENTATION AND QUALITYASSURANCE
10. CONCLUSIONS AND RECOMMENDATIONS
11. SUMMARY OF RESPONSES TO LIVINGPSA QUESTIONNAIRE
- 33-
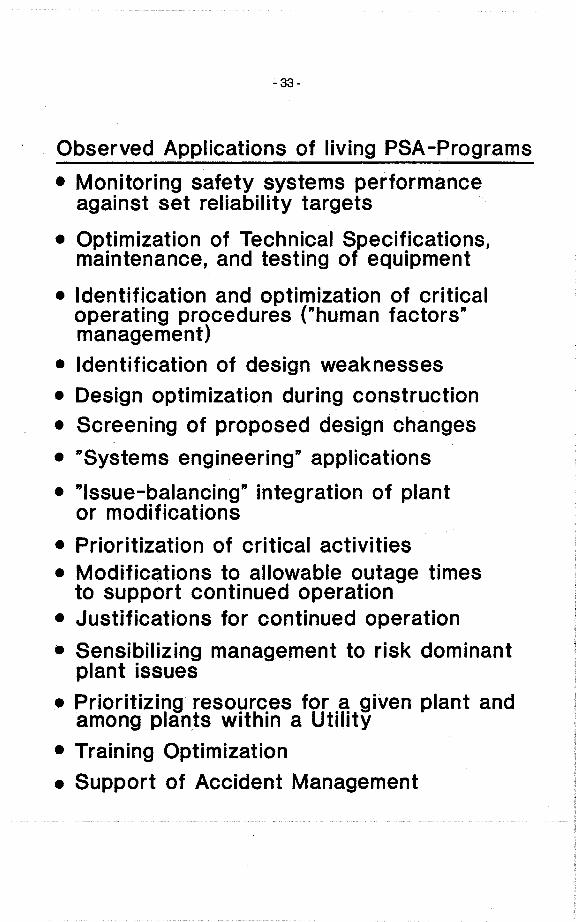
Observed Applications of living PSA -Programs. Monitoring safety systems performance
against set reliabilty targets. Optimization of Technical Specifications,
maintenance, and testing of equipment
. Identification and optimization of criticaloperating procedures ("human factors"management)
· Identification of design weaknesses. Design optimization du ring construction. Screening of proposed design changes
· "Systems engineering" applications
· "Issue-balancing" integration of plantor modifications
· Prioritization of critical activities. Modifications to allowable outage timesto support continued operation
· Justifications for continued operation. Sensibilzing management to risk dominant
plant issues. Prioritizing resources for a given plant and
among plants within a Utilty· Training Optimization
. Support of Accident Management
- 34-
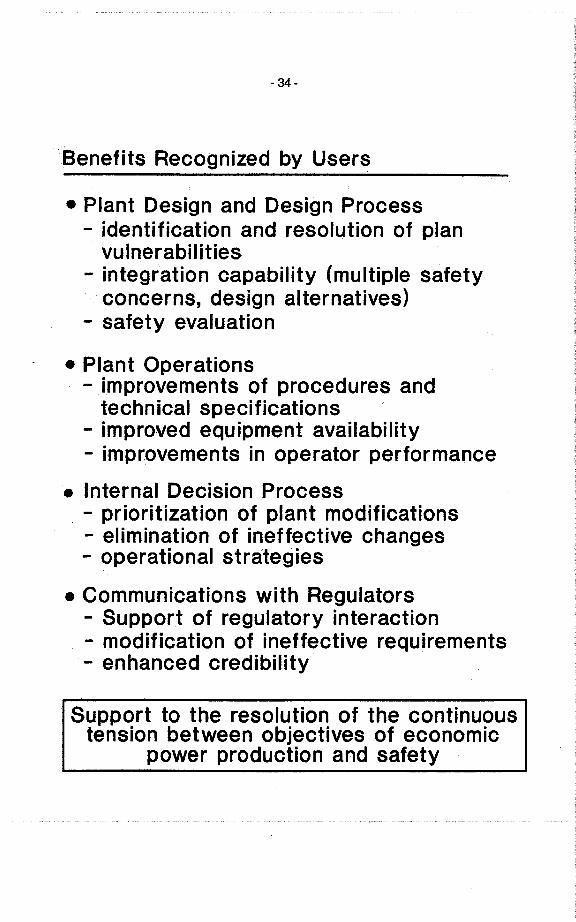
Benefits Recognized by Users
· Plant Design and Design Process- identification and resolution of plan
vulnerabilties- integration capability (multiple safety
concerns, design alternatives)- safety evaluation
. Plant Operations- improvements of procedures andtechnical specifications
- improved equipment availability- improvements in operator performance
. Internal Decision Process- prioritization of plant modifications- elimination of ineffective changes- operational strategies
. Communications with Regulators- Support of regulatory interaction- modification of inef1ective requirements- enhanced credibilty
Support to the resolution of the continuoustension between objectives of economic
power production and safety
- 35-
Program Structure and Requirements
PSA-model requirements
PSA to model:
- plant configuration
- plant response under differentconditions
Level 1, perhaps abbreviated Level -2:
- plant specific
- plant specific data
- 36-
Program Structure and Requirements (contd.)
PSA model maintenance and update program
. Significant plant design impacting event- andfault tree models
. modifications of operating procedures,incorporation in event/fault-trees
. surveillance procedures:modifications of test intervals and test result
. Bayesian update of initiating event s'tatistic
. Bayesian update of component reliabilty data
. Modification of emergency operatingprocedures with impacts on operatoraction models
. PSA-model improvements by more refinedmodels or additional sequences
. PSA model requantification
. PSA summary document update
- 37-
Follow Up activities
Task group reviews comments,prop05als, progress
- applications- tOOl5- documentation- quality assurance
Task 11:
Technical Specifications- Working plan in 1991
Task 12:
Oata Acquisition andEvaluation
- 38-
Task 12: Data Collection and Analysisto Support Living PSA
Objectives: Assistance in
. Establishment ofplant specific failuredata collection systems
. Sharing of failure data
. Analysis and applicationof such data
Task Force
Schedule Report until Oct. 91
- 39-
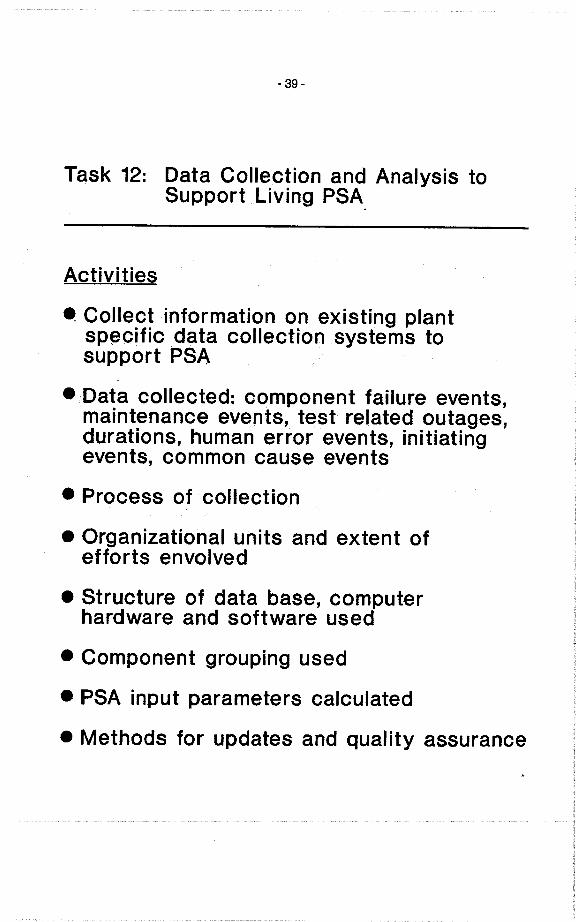
Task 12: Data Colle.ction and Analysis toSupport Living PSA.
Activities
. CoHect information on existing plantsPßcific data collection systems tosupport PSA
· Data collected: cqmponent failure events,maintenance events, test related outages,durations, human error events, initiatingevents, common cause events
. Process of collection
. Organizational units and extent ofefforts envolved
. Structure of data base, computerhardware and software used
. Component grouping used
. PSA input parameters calculated
. Methods for updates and quality assurance
- 40.
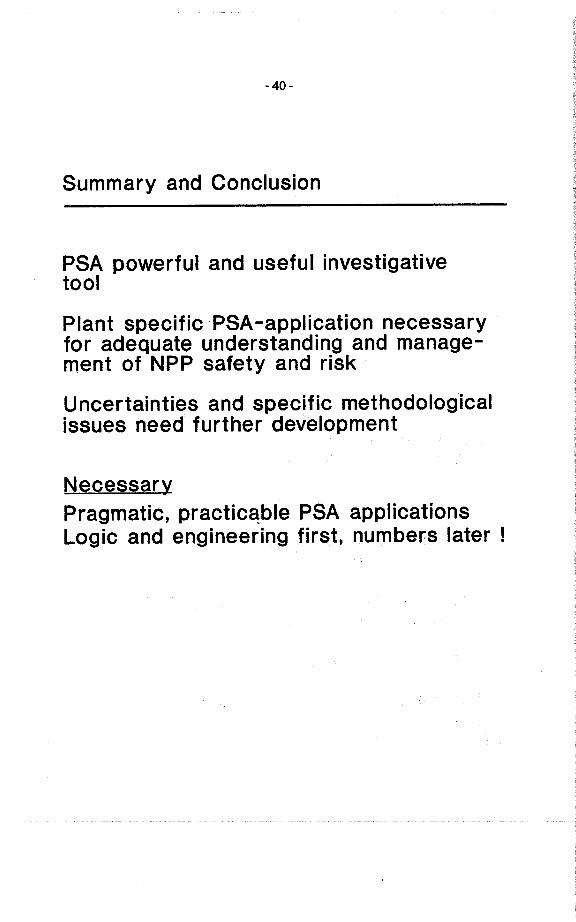
Summary and Conclusion
PSA powerful and useful investigativetool
Plant specific PSA-application necessaryfor adequate understanding and manage-ment of NPP safety and risk
Uncertainties and specific methodologicalissues need further development
NecessaryPragmatic, practicable PSA applicationsLogic and engineering first, numbers later !
- 41 .
SÄTEILYTURVAKESKUS(STUKi - Siròl,akerhei.cenlra1enFinnrsh Ceril re for Rodiolion ondNucleor Safeiy - Hel"nb F,nland
Reino Virolainen
OECD/CSNI Workshopon Special Issuesof Level 1 PSACologne, May 1991
OBJECTlVESAND STATUS OF WORK OF PWG 5/TASK 9, "STATE OF THE ART OF LEVEL1 PSA METHODOLOGY"
1 lntroduction
During the annual meeting 1989, PWG 5 discussed the most
problematic areas of Level-l PSA and outlined the contents
of possible new Task. Several. PSA methods were still
regarded to be at issue such as analysis of dependencies,
human errors, time-dependent phenomena, external events and
analysis of uncertainties. Based on this discussion PWG 5
decided set up Task 9, "State of the-Art of Level 1 PSA
methodology". Be?auSe of the broad expertise needed, the
task was divided in five subgroups according to the afore-
mentioned topics.
As a general objective ea~h subgroup was expected to make
a review of the use and maturi ty of the present methods and
to take a glance into the foreseeable future on the subject
making remarks on challenges of the expected evolution and
on the direction to go. Most of the topics in Task 9 are
al ready "old friends". The analysis of dependent phenomena,
however, is a topic which is not generally applied in
present PSA studies. Therefore this subject is more into
future looking task giving more flexibility to the group
and possibili ties to pilot work.
2 Subtask 1: Analysis of dependencies
This Task is to review the present CCF methods used in PSAs
and evaluate their maturi ty and needs for developments.
- 42-
Present status of dependent failure analysis is amiquous.
Functional and causal dependencies can be analyzed by mature
qualitative and quantitative methods such as walk- and
think-trough analysis, fault trees and computer programs
where attributes can be set for dependency factors e. 9 .common support systems, common rooms, common maintenance,
same types of components, similar environmental circumstan-
ces and so ferth whichever can be recognized causing
dependencies between components.
Instead, the analysis of subtle statistical and probabilis-
ticcorrelations is still in dispute. Statistical and
probabilistic correlations are e. q. hidden shortages in
components inheri ted often from past actions affecting the
components such as design, manufacture, installation,
leading e.q. wrong tolerances, wrong materials, flaws in
materials, different environmental sensitivities and several
others unforeseeable failure causes which need usually harsh
circumstances to be realized as failure. Hidden shertages
(often called trigger event) may expose the components to
failures and if correlation is strong (coupling mechanism
exist) , i t can increase ;the failure rate of components
simul taneously.
This is amental picture of the evolution of CCFs. To
realize this picture, several parametric and few non-
parametric CCF methods have been developed.
A common difficul ty in parametric CCF methods is that the
data is te be interpreted in a semi-deterministic way such
that correlation between failures is zero or uni ty. Thisleads e. q. to an inevi table concl usien that only tiny credi tcan be given for additional redundancies of safety systems.
Parametric CCF methods raise also ether questions such as
how to assign correlation between CCF parameters in uncer-
how to analyse high redundancy structures
(e. g. safety relief systems in BWRs) and how to credi t
- 43-
physical separation of trains. Last but not least problem
is the interpretation of sparse data in distinquishing
between potential and real cCFs.
Non-parametric methods are an option to the parametrie
models but a few existing methods are so far in minor use.
lnteresting non-parametric methods have developed Hartung
(1981) and Dörre (1989).
An inevi table problem in context of CCFs is that those are
highly plant specific and adequate analysis would require
the use of plant specific parameters which is difficul t due
to sparce data base.
Two major schools of thought on how to deal with dependent
and CCFs exist such as
depedent failures are explici tely treated in faulttrees wi thout applying special CCF methods other
than qualitative screening of CCFs (IREP and NREP
PSA procedures Guides and IPE)
dependent failures should be deal t wi th usingcombination of explici te and parametric methods
(IEEE/ANS PRA Procedures Guide NUREG/CR-2300, lAEA
Guidelines for PSA, NUREG-1150).
A simple solution would be to use explici te fault tree
analysis of dependent failures supported byworldwide directCCF estimates for systems as given in report EPRI-NP 3967.
Such kind of procedure is used e.g. in Loviisa PSA.
The major objective of Task 2 is to assess the maturity of
methods frequently used in PSAs for dependent and common
cause failure analyses as well as to give recommendations
for most urgent development needs.
- 44-
3 Task 2, Human errors
Analysis of human errors is still an unesolved issue in
PSA. This is due to sparse data available for Human Reliabi-
li ty Analysis as well as due to difficul ty to cover a11 kind
human errors by existing methods.
According to consensus definition the human errors can be
divided in three categories such as
errors prior to an accident e.g. in maintenance,
calibration, testing
errors causing an accident initiator e. q. human
error resul ts in transient
errors in response to an accident initiator e.g.
misdiagnosis of accident initiator or response
needed, error in response action.
Two first steps can fairly well be analyzed from plant
specific databut human actions during accidents still
provide difficul ties.
An inherent issue in human performance is. i ts ambiqui ty .Human interactions provide both beneficial and detriment alcontributions to safety. Detrimental actions typically
increase the unavailabili ty of plant systems or resul t inan initiating event. The beneficial actions such as corrext
diagnosis of ini tiating event and implementation of recovery
of systems decrease the potential to accidents.
A methodological difficul ty of human error analysis is
inherited from the special nature of human mind. As far as
assumption can be made that human errors are only slips or
errors in following correct procedures, the present methods
cover the possible errors made. If other tys of errors
(errors of commission) are included, less accptable methods
are available.
- 45-
The available PRA Procedures guides recommend the use of
methods as follows
THERP method is recommended by IEEE/ANS Guide,
IREP Guide
SHAP procedure wi th various HRA methods isrecommended by NREP Guide
ASEP HRA method is recommended by NUG-1150SHARP procedure is presented in lAEA guidelines
use of simulator based TRCs for diagnosis and
recovery actions are suggested by lPE Guidelines.
An interesting approach amongst the HRA methods are those
based on expert judgement. SLlM-MAUD is an example of these
methods. lt makes use of both expert judgement and simulator
based time reliabili ty curves (TRC). Expert judgement is
mentioned in brief in context of HRA in NREP, EWAT, lAEA
PRA guidelines and lPE. Expert judgement is mentioned in
SHARP Procedure as well.
The contemporary human error analysis suffers frolJ two main
unresolved issues such as- sparse data base on all human
acti vi ties and shortage of methods for dealing wi th errorsof unplanned tasks. The sparse data on human activities such
as diagnosis errors and other human actions during accident
sequence can to the proper extent be replaced by using full-
scale plant specific simulator. lnstead the treatment of
unplanned operator Oleasures is still at early development
phase.
Task Force 2has prepared a detailed content of the report
but not yet completed the first draft report.
4 Task 3, Time-dependent phenomena
Time dependent phenomena are an evolutionary topic in PSA.
Only a few time dependent phenomena are modeled in PSA
studiese.q. time dependent succes criteria in long term
- 46-
Bccident sequences (French PSAS). Several time dependent
phenomena such as aging of component, time dependent
unavailabili ties (test intervals , latent failures, repair),time dependencies of accident sequencies (time dependent
succes criteria, time dependent operator Bctions, time
dependent physical phenomena) are usually treated in
Bveraged way in PSAs.
In some US PSA studies time dependency of emergency diesel
generator mission unavailabili ty from the recovery ofoffsite poweris considered. In Loviisa PSA study trend
analysis (aging, learning) of failure rates has been made.
Without saying that the examples given above be unique, it
is evident that the contemporary PSA procedures tend rather
to reject time dependent models than to adopt them. This
is evident due to the model complexi ty and time consuming
calculation routines which make the time dependent models
rather less attracti ve.
A major incentive to introduce time dependent models in PSA
studies is the extension of PSA towards Li ving PSA use and
short term decision making. In order to deal wi th increasingor decreasing trends of phenomena e.q. time delays existing
for recoveries and competi tion between degrading system
function and decreasing residual heat production, more
subtle models are needed.
The time dependency issue is, however, not the most burning
problem in PSA but i t can be regarded more as a matter of
mid-term development and is expected to be introduced in
due course with enhanced use of Living PSA.
5 Task 4, External Events
Subgroup, external events, of accident initiators has
frequently given B significant contribution to NPP risk.
Typical external events such as seismic events, fires and
flooding (external, internal) are vital parts of recent PSA
- 47-
studies. All these accident initiators are of clearly
distinct nature as compared wi th internal initiators.
External events are rather predecessor of accident ini-
tiators than initiators themselves. This makesthe analysis
of external hazards different from that of internal events.
The contribution of external events to risk is separately
site and plantspecific. Quite large contributions of
external risks to older plants are plausible and closely
argued because of the vulnerable or non-existing physical
protection and separation in older designs. In new designs,
however, components qualification to stand for harsh
environments, adequate physical separation and risk averse
lay-out are expected to diminish the risk significance of
external events significantly.
An inherent methodological feature of contemporary methods
is large uncertainty. Statistical uncertainties engaged
in the resul ts are in range 100 to 1000, expressed in terms
of error factor. Large uncertainties involved in external
risks make i t difficul t if not impossible to combine these
resul ts wi th those of internal events.
The methodological matur i ty of external event analysis isstill partly poor. Especiallythe fragili ty analysis of
components in seismic analysis need still development as
well as the fire development analysis, too. Especially
concerning the last mentioned methods a vi tal development
trend is underway.
A number of fire development analysis models are available
and development of several new models is underway. Mul ticom-
partment calculation codes are not yet well validated.Therefore, great care should be taken to understand the
underlying fire phenomena when using these models for
systems composing of complicated or big compartments. When
properly used these programs offer even now an invaluable
tool for fire development assessment.
- 48-
The intensive model development associated, e.g. with recent
HDR fire experiment program in Germany, give quite promising
possibilities for future fire simulationof reactor contain-
ment buildings containing real fire loads found in nuclear
reactors, such as pump oils and electrical cables. Al though
much development work is still needed, it is clear that
already in the near future there are available validated
fire simulation models running on personal computers or
workstations, which can be used for quantitative fire risk
estimation and mi tigation of cri tical points of nuclear
installations.
Task Force 4 has submitted the third draft report for review
and only some minor efforts are needed to complete the final
draft.
6 Task 5, Uncertainty analysis
Uncertainty analysis in PSA is to give a realistic picture
of credibili ty of analysis containing usually number of
uncertain features such,,-8s reliability data, modelling
assumptions e. 9 . succes cri teria, systems interactions ,
dependent failures and CCFs and expert judgment. The
uncertainty in reliabili ty data reflects on one hand the
stochastic variabili ty and on the other hand the lack ofknowledge. The modelling uncertainty is usually called
incompleteness, reflecting the inability to deal with all
phenomena or accident possibili ties in the model.
It is often said that technical complexity is the decisive
point for incompleteness issue. To certain extent this is
true. In practice, however, the crucial issue seems to be
not the complexi ty but the lack of design based and physical
protection and isolation between vi tal safety systems,
support systems and redundancies and lack of diversity. If
the design based physical protection of components and
separation between systems and trains are adequately
- 49-
provided, it implies that reasons for dependencies, interac-tions and CcFs are cut down end to large extent systems and
trains are independent of each other. This facili ties themodelling end lessons the exposure of the plant, systems
end component to several external and internal initiators
and complex dependent failures.
Even though statistical uncertainty analysis is well-known
and mature part of PSA, i t still contains some less discus-
sed issues. Problems arise as dependencies are concerned.
Dependencies between minimal cut sets are a problem for
analytical methods (e. 9 . moment propagation and DPD).
Dependencies between components (dependent and CCFs) raise
a question of correlation between parameters of CCF methods.
The reliabili ty data i tself creates dependencies between
otherwise independent components. Pooling of plant specific
data makes underlying correlation between parellel identical
components and extends the uncertainty of systems signifi-
cantly.
Uncertainty analysis is a vi tal part of PSA and i t is used
to ease decision making whether design of new plant,
backfi tting of operating plant, operating strategies orother Li ving PSA uses and compliance of PSA resul ts wi thsafety criteria etc. are concerned.
Task Force 5 has al ready completed the first draft version
for review.
- 50-
State-of-the-Art of Level 1 PSA.
W. F. Werner
Gesellschaft für Reaktorsicherheit (GRS) mbH
Forschungsgelände
D-8046 Garching
OECD/BMU Workshop von
Special Issues of Level 1 PSA,
Cologne, FRG
May 28.30, 1991
I.Introduction
- 51 -
A Levell Probabilistic Safety Assessment (PSA) for Nuclear power plants (NPP)
detemunes frequencies and modes of severe damage to the reactor core. Such resultscannot be derived dictly from statistical observations. Therefore, the analyses arebased on the identication of representative sets of conceivable accident sequences
in the reactor system. For ths purpose models of the technical systems and theireomponents are developed and analysed. Accident sequences in plant systems arerepresented by event trees, which in a simpliied way describe the potential effectsof accident initiating events dependig on the functioning or faiure of the safetysystems required for their contro!. Theprobabilties of faiure of the systems areestîated by fault tree analyses. The use of these probabiltes in the event trees thenpemuts the estiation of the expected frequencies of occurence of eore damage.
Furher investigations are made to detemune the mode of core damage. The analysesprovide
the topoI gy of accident sequenees;
quantitative deseriptions of the event seqriences and estites of their
expected frequencies of oecurence;
the event sequences whieh contrbute signeantly to the risks;
insights into the adequaey of plant design and operational modes bydetemuning those plant components and modes of operation whicheontrbute most to the expected fruencies of the domiatig coredamage event sequenees.
This fonns the basis for judging
the level of safety of a plant;
the safety relevance of new scientië and technologie al results or ofspecifc -incidents durg plant operation;
promising approaches for the irprovement of safety.
The insights gaied £rom level 1 PSA can be used for
eliatig vulerabilties;
identiyig additional possibilties for irproving plant safety;
improving operational procedures;
improving the tring of operators.

- 52-
In recent years numerous PSAs were completed and their results published. All weresuccessful in at least one of the abo,ve listed aspects. The discussions in this paperare mainly based on the methodology used and the results obtaed in the following
studies
· Phase B of the German Risk Study on Nuclear Power Plants (DRS-B)
/1/. The analysed plant is Biblis B, a 1300 MWe pressunzed waterreactor (PWR) with 4 main coolant loops in a large dr contaent,
built by Siemens-KW.
· NUREG-1150 "SevereAccìdent Risks, an assessment for five USNuclear Power Plants" /2-16/. In this study nuclearpower plants ofdierent designs are analysed:
Sur Power Station Block 1, a 788 MWe 3-loop pressunzed waterreactorof We.stinghouse design, in a sUQatmospheric contament.
Zion Nuclear Plant, Block 1, a 1100 MWe 4-loop pressurized waterreactor ofWestinghouse design, in a large dr contanment.
Sequoyah Nuclear Power Plant, Block 1, a 1148 MWe 4-loop pressurizedwater reactor of Westighouse design, in an ICe-condenser contanment.
Peach Bottom Atomic Power Station, Block 2, a 1150 MWe boilgwater reactor (BWR-4) of General Electrc design, in a Mark Icontament.
Grand Gulf Nuclear Station, Block 1, a 1250 MWe boiling water reactor(BWR-6) of General Electrc design, in a Mark II containment.
· "Etude Probabilste de Sûreté des Réacteurs a Eau sans Pression du Paler900 MWe" (EPS 900) /17/. The analysed plant is a-stadadized 900MWe.3-loop pressurzed water reactor ofFraatome design, in a large
dr contament.
· Etude Probabilste de Sûrté dune trche du Centre de Production
Nucléaie de PALUEL (EPS 1300) /18/. The analysed plant is astadarized 1300 MWe 4-loop pressurze water reactor of Framatomedesign, in a large dr contaent.
· "Probabilstic Safety Assesment for Typical Japanese BWR Plant". The
analysed plant is a 1100 MWe boilg water reactor (BWR-5), in a Markn contaent /19/.
· "Probabilstic Safety Assesment for Typical Japanese PWR Plants."
The analysed plant is a 1100 MWe 4-loop pressunzed water reactor in alarge dr contanment /20/.
- 53-
2. Steps of Level 1 . Probabilstic Safety Assessments
2.1. Generaliies
A complete level I PSA comprises thee tasks:
1. Collection of basic plant data2. Identication of initiating events3. Event sequences and reliabilty analyses
In the first step basic information on the plant and on the operational procedures iscollected. The following two steps are concerned with potentialy dagerous eventsequences inside the plant, includig the estimation of expected frequencies ofoccurence of such event sequences The natur of the information and data requidin steps 2 and 3 depends on the scope of the analysis.
2.2 Selection of Accident Initiating Events
Tbe selection of accident initiatig events depends on the scope of the study. The
most importnt distinction to be made is between plant interna! and plant externalevents. Examples of plant interna! events ar mechanica! faiures of active -components, malfunctions or faiures of measurg or control devices, loss of energyand media supply, and humanerrr. A furer importt distiction within thecategory of interna! events has to be made with regard to dierent states of the
investigated plant, for example:
state of power generation, which is investigated in al level 1 PSAs
löw power and shutdowi stites, which are investigated only in theFrenclfstudies EPS:900 and EPS 1300
common cause initiatig events which may simultaeouslycompronúse a number of safety systems, for example:
- interna! floodig, which is considered in DRS-B,
- fire, which is considered in DRS-B and in NURG-I 150 for theplants Sur and Peach Bottom
Among plant externa! accident intiatig events the followig areinvestigated:
earquake, which is considered in DRS-B, in NUREG-1150 for theplants Sur and Pe ach Bottom, and for the Japanese 1100 MWe:sWRsandPW'soflatesidesÍgiî: ......... ......................................................_........ ... ................................................
- 54-
Aircraft impact, which is considered in DRS-B
High wind, which is considered for the Indian Point plant in theUnited States.
The frequencies of accident initiating transients were determned by plant specifcoperating data in all studies discussed in ths paper.
For the accident initiator frequencies of the varous categories of loss of coolantaccidents and for accidents caused by steam generator tube rupture the analyses foral the above mentioned plants rely on generic data. In DRS-B the initiatorfrequencies for large and medium breaks in the main coolant pipes were obtaedfrom a combination of zero events statistics and findigs of probabilstic frcture
mechanics analyses.
The spectrm of initiating events considered in recent Level 1 PSAs and theirfrequencies of occurrnce can be taken from Table 1.
2.3 Event Sequence Analysis
An initiating event can be coped with by varous combinations of functions ofoperating and safety systems. The relevant combinations of operatig systems andsafety systems are determned by the simulation of the plant response to theaccident initiator. This includes the determation of the required mImber ofredundant system trains of the individual safety systems (miimum success criteria).If the minimum success criteria are violated the initiatig event may lead to coredamage.
In an event sequence diagram (event tre) /21/ every possibilty is considered whichmay lead to 'core damage. Event paths areconstrcted by trcing the sequences
from thë initiatig events to specifed end states. Event trees conta branch pointsfor every requied systemfunction. At each branch point a path splits into two paths,one of which corresponds to success, the other to failure of the respective systemfunction. Thus, a large number of paths ar obtaed which either lead to a safe stateor to specified states posing a hazard to the reactor core (hazard states). With theexception of DRS-B, hazard states are indentical with core damage states.
In order to quantify the avaiabilty respectively una vaiabilty of the corrspondigsystem function braching probabilties ar being associated with each branch point
in the event sequence diagrm. The avaiabilties are conditional probabilties (under.the condition caused by the initiatig event and the event sequence). In U1e
development of the event sequence diagr mutual dependencies of systemftiiiCùons àsweIl àsseconaiifiiiieŠiíeconŠiaereêL ... ........ . . .
- 55-
2.4 Reliabilty Analysis
In order to quantify the probabilties at the branch points in the event sequencediagram the failure behaviour of the respectivesystem function has to be estimated.Observations which permt to detemune the failure behaviour of the system functiondiectly from operating experience are often not available due to the high relabilityof operating and safety systems in nuclear power plants. However, the faiurebehaviour of components used in large numbers in the systems can be obtainedfrom the operating experience. Therefore, the failur behaviour of system functionsis reduced to the failur behaviour of its components.In safety analyses for nuclear power plants the customar approach for thisreduction is fault tree analysis /21/. Given an undesired event (for example loss ofcooling) a systematic search is performed for ài possible causes leading to thisevent In general, this results in a large number of failure combinations of varouscomponents or subsystems. The analysis permts a clear representation even of verylarge technical systems. Independent faiurs, dependent failurs, and human eITors
are to be included.
Prctically, the analysis is performed by means of computer progrs. Basicaly,simuiation methods and analytical methods ar to be distiguished. Simulation
methods can be used for diect simulation of system reliabilty pareters or for the
identication of the minial cut sets of the fault tre. Analytcal methods are alsoused for the determnation of the mimal cut stes.
Simulation methods dictly detemune the reliabilty parameters by Mont~ Carlosimulation of the system behaviour. For large systems it may be extremely costly toobtan suffciently accurate results.
Simulation methods are also used to determne the mial cut sets of a system. In
ths way only the system strctue is obtaed which avoids the high computing tie
requiements ofdict calculation of reliabilty pareters. WÚh a practical numberof trals Monte Carlo simulations do not find al mimal cut sets of a system, butonly those which signcantly contrbute to system unavaiabilty. TIs may bedesirble if a system has a largenumber of numericaly signifcant cut sets.
Analytcal methods find al mial cut sets of a system. In contrast to simulationmethods. they do not requie inormation on component faiure behaviour in orderto obta the mial cut sets. Component faiure data are only needed for the
calculation of the failure probabilty of the system, once the mial cut sets aredetenned. For fault trees with a large number of mial cut sets it may benecessar to apply cut-off crteria.
Direct simulation is a flexible method for the analysis of complex systems. Differentmaitenance and repai strategies, or the activation of stadby systems can be easilyaccounted for. They ar easy to use, but may impose a high demand on computingcapacity for analysing highly reliable systems.
- 56-
Methods based on cut sets provide deeper insights into the strctur of the system.However. they ar less flexible than diect simulauon. For systems with a largenumber of cut sets. they may also pose compuung ume problems.
Experience suggests that both methods should be available: simulation methods forlarge. strongly intermeshed fault tres with not to "small" values of the reliabiltyparameters. and analyucal methods for all fault tres with "smal" values of thereliabilty parmeters. where the borderline to Ismal1" depends on compuungcapacity. Presently it is at about 10-5. .
.2.5 Data Base
In all state-of-the-ar studies the data for the frequencies of iniuaung events. forindependent as weIl as for common cause component faiures. and for humanfailurs are described in terms of probabilty distrbutions. The uncertnty rangescharacterized by the distrbutions var in origin. If an estimate is based onplant-specific data. the range shouldbe characterisuc of the staustical uncertainty ofthe data. If an estimate is generic (or non-plant specifc) the range should becharacterisuc of those factors which may affect the faiure propemes of thecomponent in uses and envIroments diferent from which the data for the estiate
have been gathered.
The following probabilty distrbution functions are found in level! PSAs:
lognormal distrbuuon. which is used in al recent studies.
Gama and Weibull distrbutions which are used in DRS-B.
maxum entropy distrbution which is usix. for example. inNUG-1l50.
If in aplant specifc analysis plant specifc data ar of insufficient qualty they aresometies combined with avaiable ge.neric data by means of Bayes' Theorem. Inthiscase a prior distrbutionis detemued by generic data which is combined withthe avaiable plant specifc data in order to obta an aposteriori distrbution to beused for the plant specifc analysis. Ths process is used for examp1e in DRS-B. inNUREG.1150 for the analysis of the Zion plant. and in EPS 900 and EPS 1300.
- 57-
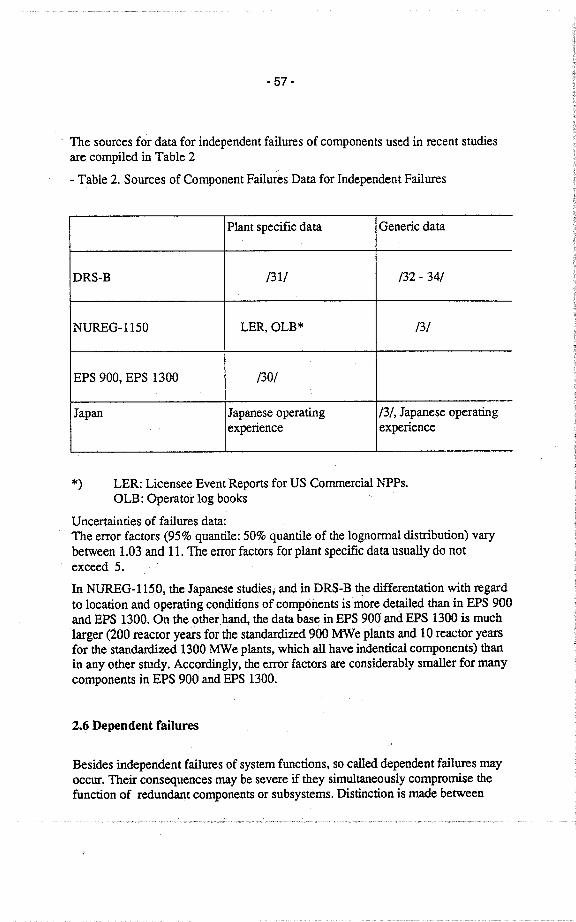
The sources for data for independent failurs of components used in recent studiesare compiled in Table 2
- Table 2. Sources of Component Failures Data for Independent Failures
Plant specific data Genenc data
DRS-B /31/ /32 - 34/
NUREG-1150 LER,OLB* /3/
EPS 900, EPS 1300 /30/
Japan Japanese operatig /3/, Japanese operatigexpenence expenence
*) LER: Licensee Event Reports for US Commercial NPPs.OLB: Operator log books
Uncertaities of failures data:The error factors (95% quantie: 50% quantile of the lognormal distrbution) var
between 1.03 and 11. The error factors for plant specifc data usually do notexceed 5.
In NUREG-1150, the Japanese studies; and in DRS-B the diferentation with regardto location and operatig conditions of compòI1ents ismore detaed than in EPS 900and EPS 1300. On the otherhand, the data base in EPS 900 and EPS 1300 is muchlarger (200 reactor years for the stadardized 900 MWe plants and 10 reactor yearfor the stadarzed 1300 MWe plants. which al have indentical components) thanin any other study. Accordigly, the error factors are considerably smaler for manycomponents in EPS 900 and EPS 1300.
2.6 Dependent faiIures
Besides independent failurs of system functions, so caled dependent faiurs mayoccur. Their consequences may be severe if they simultaeously compronuse thefunction of redundant components or subsystems. Distiction is made between
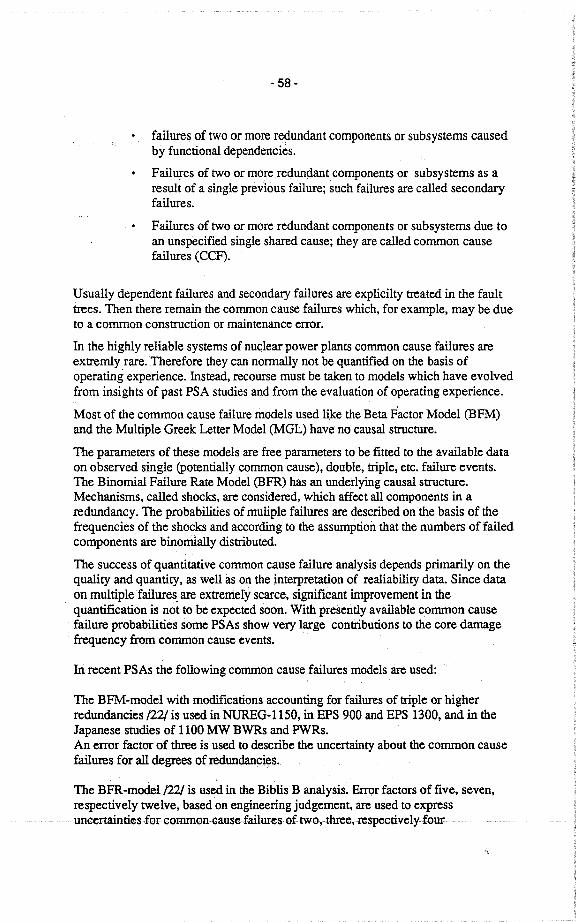
- 58-
failurs of two or more redundant components or subsystems causedby functional dependencies.
Failures of two or more redundant components or subsystems as aresult of a single previous failure; such failurs are called secondarfailurs.
Failures of two or more redundant components or subsystems due toan unspecified single shared cause; they are called common causefaiures (CCF).
Usualy dependent faiures and secondai faiures are explicilty trated in the faulttres. Then there remain the common cause failures which, for example, may be dueto a cornon constrction or maintenance eITor.
In the highly reliable systems ofnuclear power plants common cause failures areextreiiy rare. Therefore they can normaly not be quantied on the basis of
operatig experience. Instead, recoure must be taen to models which have evolvedfrom insights of past PSA studies and from the evaluation of operating experience.
Most of the cornon cause faiure models used like the Beta Factor Model (BFM)and the Multiple Greek Letter Model (MGL) have no causal stTctue.
The pareters of these models are free parameters to be fitted to the avaiable dataon observed single (potentially common cause), double, trple, etc. faiure events.The Binomial Failure Rate Model (BFR) has an underlyig causal strctue.
Mechanisms, caled shocks, are considered, which afect all components in aredundancy. The probabilties of mulipIe failures are described onthe basis of thefrequencies of the shocks and according to the assumption that the numbers of faiedcomponents ar binomlaly distrbuted.
The success of quantitative common cause faiure analysis depends primaryon thequalty and quantity, as weil as on the inteipretation of realabilty data. Since dataon multiple faiures. ar extrmely scarce, signifcant improvement in thequantification is not to be expected soon. With presently avaiable common causefailur probabilties some PSAs show very large contrbutions to the core damage
frquency from common cause events.
In recent PSAs the foilowing common cause faiures models ar used:
The BFM-model with modifications accountig for faiures of trpie or higherredundancies /22/ is used in NUG-1150, in EPS 900 and EPS 1300, and in theJapanese studies of 1100 MW BWR and PWRs.An errr factor of the is used to describe the uncertty about the cornon causefaiurs for al degrees ofredundacies.
The BFR-model /22/ is used in the Biblis Banalysis. Eror factars of five, seven,respectively twelve, based on engineering judgement, are used to expressuncertnties.forcommoncausefailures..oftwo,thre,respectivelyfour
- 59-
redundaneies. For the analysis of eorron eause failures in the seram system of theBiblis B reaetor the uneertnty distrbutions are eonsistently obtained from
uneertainties for single failure, shock rate, and binomial parameter.
The resulting error factor for the mean unavailabilty of the rods required accordingto the minimum sueees criterion (faiure of ~ 7 rods out of 61 rods) is about 500:
To reduee the large influenee of corron cause failure rates on the analysis result, itis desirable to
systematieally inspeet observed single failures for potential eorroneause meehanisms in order to enlarge the eorron eause failure data
base.
to introduee more diversity in the systems design as a defence agaistthe infiuence of common cause faiures on highly redundantcomponents or systems.
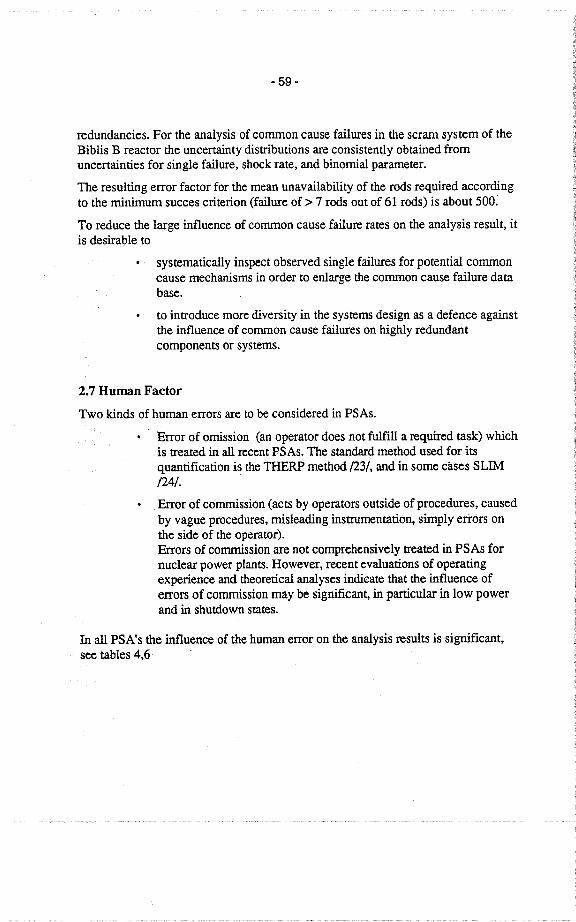
2.7 Human Factor
Two kinds of human errors are to be eonsidered in PSAs.
Eror of omission (an operator does not fulll a required task) whichis treated in al reeent PSAs. The stadard method used for itsquantifieation is the THERP method /23/, and in some cases SLIM/24/.
Error of eommssion (aets by operators outside of proeedurs, eausedby vague procedures, misleadig instrmentation, simply eItors on
the side of the operator).
Errors of eommssionar not eomprehensively treated in PSAs fornuelear power plants. However, reeent evaluations of operatingexperienee and theoretieal analyses indicate that the infiuenee oferrors of eommssion may be signicant, in parcular in low powerand in shutdown states.
In an PSA's the infuence of the human errr on the analysis results is signcant,see tables 4,6
- 60-
3. Uncertainties and.Limitations
Uncertainties and limitations are inherent to all PSAs.
· Quantifiable Uncertnties
Quantifiable uncertnties ar an integrl par of every PSA. They result
frorn the uncertnties about intiatig event frequencies, reliabilty
parameters, the actions of the operatig team (parameter uncertties)and from uncertties related to the physics of the evolution of theaccident (modellng uncertinties). The latter ar sometimes formalyexpressed as parameter uncertties by introducing wheighted sums of
model alternatives.
The standard technique to quantiy parameter uncertties is to perform
Monte Carlo sampling from the probabilty distrbutions descnbing thevanous uncertnties and propagating the sampIes through the steps of
the analysis, thus generating a mapping from the parameter uncerttiesto the uncertnties of the results of the analysis.
Monte Carlo sampling is either done dictly, which permts to quantiy
the sampling error by tolerance limits, or it is done by Latin Hypercubesampling which is someties numencaly more effcient than dict
Monte Carlo sampling, however, at the disadvantage of not providig a
mechanism for quantiing the sampling errr.
The influence of the parameter uncertties on the analsis results is
shown in all studies but EPS 900.
No published Level-1 PSA contans a comprehensive treatment ofmodellng uncertaities
· Limtations of scope
PSA results ar limited to cert classes of issues that can be readiy
included in the strctue of PSA models. The scope of accident
sequences analysis is generay limited to component faiures of specifctyes and operator errors to corrctly perform prescnbed actions. The
consideration of intiatig events is also lite in scope. It is imponatto be aware of the potential implications of such litations.
Today, PSAs exclude a large number of very low probabilty events,because of their anticipated uniponace, or the dificulty of rnodellingthern. For example, errors of conission ar often excluded sirnplybecause there is no generay accepted modellg approach.
Many PSAs produce core damage frequencies between 10-6 and l04perreactor year. In that situation it is reasonable to neglect accidents that
- 61 -
oeeur with frequencies two or thre orders of magnitude below the eoremelt frequeney.
However, the insights from PSAs have served to drastiealy reduee theeontrbution to the eore damage frequeney from those failurs and eventsthat are generally modelIed.
In some reeent PSAs eore damage frequencies lower than 10-6 per yearresult. With the eore damage frequeney being so low the quantitativeresults may be questioned, as there is no teehnìeal basis for eoncludingthat events outside the seope of the PSA would not eontrbute at least atthat leveL.
Uneertty analyses eondueted for reeent PSAs provide realstieeharaeterisations of the quantiable uneertnties. However, issues whoseuneertties ar not quantied, beeause they are outside the seope of a
PSA may become signifieant. Some of these are diseussed below:
· Aecidents oeeurng at low power and shutdown conditions
Unti reeently, viraly all PSAs for nuclear power plants were
perfonned for full power eonditions. This was considered to be aeonservative approach, based on having the maximum amount of energyavailable in the eore, which maxinuzes the system response requirementsand nunimzes the tie avaiable to prevent eore damage. Howeverreeent PSAs and peeursor events indieate that aceidents oeeurng ateonditions other than full power may be signeant eontrbutors to theeore daage frqueney.
Some of the reasons for these findings are:
Major maitenanee aetivities related to safety are often eared outdunng shutdown. Dependig on the pareular shutdown modeteehnical requirements for safety systems may be nuni. Thus theredundaey usualy required at fuU po)Ver may not exist.
.. Süffèient decay heat is still present to lead to eore damage.
The operators' response ean be expected to be less proficient inshutdown eonditions. Emergeney operatig procedurs are lited for
shutdown eonditions; the plants state is often not dear due to thelarge number of maitenanee aetivities under way, and the eontrolroom staf may be less attntive.
The integrty of the. primar coolig system may be eompronused asa result of ongoing operations. With the priar systemdepressur and paraly draied down in some eases, the boil-offtie is redueed and the effeetiveness of retention of radionuelides in
the priar system may be degraded.
- 62-
Containment integrty may be compromised durng shutdown. Thus,the likelihood of radionuclides being held in the contament isreduced and offsite releases may be expected to occur withn minutesafter the onset of core darage.
The analysis of low power and shutdown accidents is dificult. Withindifferent plant operating modes, diferent technícal requirements applyand therefore diferent plant configurations ar possible, requirngseparate analysis. A larger number of usualy more complex humaninterventions may be required. This poses problems of quantication.
· Design and constrcrion eITors
In a PSA it is generally assumed that al components in the plant areproperly constrcted and designed. These assumptions are only
confined in cases where components are corrctly tested under the same.conditons that wil be present durng an accident. Unfortnately, manysafety systems do not fall in ths category along with non-safety systemsthat could be used as alternative coolant injection sources such asfirewater systems.
Curently, the technical basis for comprehensively estimatig theimpoItce of design and constrction eITors is weak. However, sucheITors could dominate results of PSAs which exhibit low core damagefrequencies.
· Operator eITors of commssion
Operator eITors of commssion are acts by operators outside specifedprocedures. They can occur as a result of vague procedures, misleadiginstrmentation, or simply eITors of the operators. Includig such eITorsin PS As is extrmly dificult, because the number of possible actions tobe considered is alost unlted. Even if such actions can be identied,
quantication remais difcult.However,with a few excepJions/ slich eITors are not considered for thepostaccident phase. Yet; iialyses of events observed durng recent yearindicate Ìhat serious eITors of commssion in the control room whichcould brig a plantinto a deteriorated state with regard to safety systemscould have frequencies of occurence comparable to the frquency ofoccurnce of technicaly intiated incidents /25-29/. Therefore, theinvestigations in the studies may not be balanced between the analysis ofaccident sequences caused by techncal faiurs and the analysis of
sequences caused by eITors of commsion.
· Comron cause faiurs affectig multiple systems
All recent PSAs consider common cause faiurs of indential componentswith a system. The effect of some common cause faiures, such as
faulty maitenance is not lited to components with a parcular

- 63-
system. However, such failures between systems are not generallyincluded in PSAs.
· Sabotage
Sabotage difers from an operator error of commssion in that it implieswilful damage to the facilty. Sabotage frequencies are generaly notquantified in PSAs for several reasons
Sabotage Is not an accident and is usually considered to be inherentlydifferent from the events normally included in PSAs.
The frequency and character of the sabotage events are very dificultto detennne. .
- 64-
4. Numerical Results of Level 1 PSAs
The numerical results of level I PSA are obtaed in terms of probabiltydistrbutions, (cf. Fig. 1). In tables exhibiting PSA results, point values
characterizing the distrbution function ar usually shown, e.g. the median or the
mean. Frequently, the lower 5% and upper 95% quantie are also shown.
The results of accident sequence analyses explicitly refer to
core damage and additionally to
intermediate States reached prior to core damage.
Intennediate states prior to core damage are introduced in NUG-1150 and inDRS-B. Their definition, however, is different in the two studies.
In DRS-B the intermediate states are defined by the failure of those functions of theengineered safety systems and actions of the personnel according to the operatigmanual which are needed to cope with the initiating event. Such faiures lead toinsufficient decay heat removal from the core. The conditions are caled "hazardstates" in DRS-B. Without appropriate measures to restore heat removal capabilties,hazd states wil finally lead to core damage. (Tese measures ar caled"anlageninterne Notfallmaßnahmen" which translates as "plant internal accidentmanagement measures" in the DRS-B study). All modfications to hardware andprocedures found appropriate durg the analysis, also futu ones if aIeady decided
upon, are accounted for in the estiation of frequencies of the hazd states.
The hazard states ar furter diferentiated with regard to charcteristics likepressure in the reactor coolant loop, failures on primar side and/or secondar sidesystems, and the time intervals available to perfonn accident management measurs.End points of the systems analysis event trees, respectively, top events for theassociated fault trees are the hazar states (not core damage).
By plant interna! accident management measures the plant can be retued from ahazar state to a safe state. if al plant interna! accident management measuresapplicable to a given hazar state fail, core damage wil result
With regard to hazard states the DRS-B study explicitly presents:
the expected frquencies of occurnce of the varous hazard states
the contrbutions of unavaiabilties of system functions to the
individual hazd states and to the sum of the expected frquencies ofal haz states, (Fig. 2)
the constrbutions of groups of initiatig events to the sum of theexpected frequencies of al hazar states.
- 65-
In NUREG-1150, EPS 900, EPS 1300 and the Japanese studies, the level 1 resultsrefer to core damage. In NUREG-1150, intermediate states analogous in a way tothe hazd states in DRS-B are considered in the analysis. Their frequencies can beobtaied from the study.
Accident management measurs which, in principle correspond to the plant internalaccident management measures considered in DRS-B are incorporated into the eventtres and the fault tres in allother recent studies. In NUREG-1150 they are called"recovery actions". They are not always diectly comparble to the plantintemal
accident management measures accounted for in DRS-B. For example, some of therecovery actions considered in NUREG-1150 for the ternnation of accidentsequences caused by steam ge.nerator tube ruptues are applied in the area of designbasis accidents.
The EPS 900 and EPS 1300 studies consider accident management measures caledH- and U-procedurs.The combined numerical effectivness of accident management measures applicableto event sequence classes is explicitly given for al event sequence groups in DRS-B,and for the majority of event sequence groups in EPS 900and EPS 1300 in terms ofreduction factors between core damage frequencies without and with considerationof accident management measure.s. In NUEG-1150 such figues are not explicitlyshown, but can be deri ved from the quantied event trees.
All studies discussed in this paper present the sum of the relative frquencies of cçredamage eaused by plant intemal initiators, and show how the individual groups ofIntiatig events eontrbute to this sum (Figs. 3-8).
Fig. 9 eompiles the tota eore damage frequencies obtained in recent studiés, and theassociated uncertnty ranges (from 5% to 95% quantiles), if available.
Other tyical results ar the importce, according to one of the comronly usedmeasurs, öf-component faiure rates (single .or common eause), systemsunavaiabilties, and of human faiure rates (Tables 3-6).
- 66-
5. Summary
The strengths of the PSA methodology arse from both the integration of diferenttechniques of analysis and from the integration of the varous aspects of design andoperation of a NPP. Integration of systems analysis, probabilty models, humanreliabilty modellng and models to describe the physical phenomenology ofaccident scenaros into oue coherent framework enables one to manage a muchwider range of accident scenaros in a single analysis than can be handled byalternauve approaches. In doing PSAa this give a pictue of the safety or risk promeof a nuclear power plant that is more comprehensive and balanced than otherapproaches to reactor safety assessment.
A PSA is diferent from a traditional determnistic safety analysis in that it hasbetter chances of being complete in indentifying accident sequences that can occurfrom a broad range of initiating events, and it involves the systemauc determnauonof accident frequencies and consequences.
However, the accuracy and the robustness of the results of a PSA are limited by ouroverall state of knowledge. PSA is only a model for collecung and treaung theavailable body of knowledge. Ths knowledge is expressed in accumulation of dataand in models for system behaviour and for physical and chemical processes. Anyset of PSA results therefore reflects the litations in the database as well as the
limitations and simplications of the modellng approach that result from our stateof knowledge.
Despite such limitations, the principal benefit in using level 1 PSAs to increaseinsights and to support decisions concerning reactor safety is to tae advantage ofthe power of PSAs to give a comprehensive, realstic and balanced pictur of reactorsafety without becomig vulnerable to misconceptions arsing from the manysubstatial uncenaues involved. The fact that PSAs provide a rreçhansm fordisplaying the causes and magÍiitudes of uncenatiés (more so than do conventionaldetermnistic analyses) is actualy the strengt of PSA rather than evidence of a
weakess of the PSA methodology, because it can provide additional qualtative andquantitative perspectives on the overa importce of uncertties.
The most valuable produets of PSA ar the insights gaied and the aetions taen toaddress those insights. Additionaly, the results ar considered to be of importeein assessing the signeance of safety issues, and to support and promote aloeationof resourees to the resolution of these issues.
Ths is ilustrated by the followig list of reportd successful uses of level 1 PSAs.
· Uses for Optimisation of Plant Design and Operation
conceptual or detaed plant design;
supplementa analyses durng lieensing proeedurs;
- 67-
plant-specific evaluation of operational experience or other newinformation;
evaluation of plant modifications from a safety viewpoint;
evaluation and assessment of management and operational policies inshutdown and staup conditions;
evaluation of accident management policies;
evaluation of maintenance and testing activities;
evaluation of precursor events as a measure of performance to desiredgoals;
living PSAs;
prioritization of competing research needs
. Regulatory Uses
guidance to regulatory stadards development;
specific applications of detennstic principles (classification ofdesign basis events according to their expected frequencies);
demand of periodie reassessment of plant safety on a prnbabilsticbasis using plant-specifc "as-operated" data;
supplementa information for licensing puroses;
establishing probabilstic "safety assessment principles" or
quantitative design or safety goals;
aiding in. the detennation of whether or not backfts should berequired;
emergency plang;
demonstrating compliance with safety goals.
- 68-
References
/1/ Deutsche Risikostudie Kernaftwerke, Phase B
Verlag TÜV Rheinland, Köln, 1990
/2/ Severe Accident Risks: An Assessment for Five US Nuclear Power Plants,
Summar Report, 2nd Draft for Peer Review, NUREG-1150, Vol. and 2,June 1989 ./3/ D.M. Ericson, Jr., (Ed.) et al.: Analysis of Core Damage Frequency:
Methodology GuidelineSandia National Laboratories, NUREG/CR-4550, Vol. 1, Rev. 1,SAND86-2084, Jan. 1990
/4/ T.A. Wheeler et al.: Analysis of Core Damage Frequency from Internal
Events: Expert Judgment Elicitation, Sandia National Laboratories,NUREG/CR-4550, Vol. 2, SAND86-2084, April 1989
/5/ RC. Bertuccio and J.A. Julius: Analysis of Core Damage Frequency: Sur
Unit 1, Sandia National Laboratories, NUREG/CR-4550, Vol. 3, Rev. 1,SAND86-2084, April 1990
/6/ A.M. Kolaczkowski et al.: Analysis of Core Damage Frequency: Peach Bott
Unit 2, Sandia National Laboratories, NUREG/CR-4550, Vol. 4, Rev. 1,SAND86-2084,Aug.1989
n / RC. Bertucio and S.R. Brown: Analysis of Core Damage Frequency:
Sequoyah Unit 1, Sandia National Laboratories, NUREG/CR-4550, Vol. 5,Rev. 1, SAND86-2084, Jan. 1990
/8/ M.T. Drouin et al.: Analysis of Core Damage Frequency:.Grad Gul Unit 1,
Sandia National Laboratories, NUREG/CR-4550, Vol. 6, Rev. 1,SAND86-2084, Sept 1989
/9/ M.B. Sattison and K.W. Hal: ~nalysis of Core pamage Frequency: Zion
Unit 1, Idaho NatiQn~ilEngill~ering La:boratory,NUREG/CR-4550, Vol. 7,Rev. 1, EGG-2554, May 1990
/10/ E.D. Gorham-Bergeron et al.: Evaluation of Severe Accident Risks:Methodology for the Accident Progression, Source Tenn, Consequence, RiskIntegration, and Uncertty Analyses, Sandia National Laboratories,
NUEG/CR-4550, Vol. 1, Draft Revision 1, SAND86-1309, to bepublished.
/11/ F.T. Harer et al.: Evaluation of Severe Accident Risks: Quantication of
Major Input Parameters, Sandia National LaboIatories, NURG/CR-4551,Vol. 2, Draft Revision 1, SAN86-1309, to be published.
/12/ RJ. Breedig et al.: Evaluation of Severe Accident Risks: Sur Unit 1,Sandia National Laboratories, NUREG/CR-4551, Vol. 3, Draft Revision 1,SAND86:1309~ tÖbepÜblihed:
- 69-
/13/ A.c. Payne, Jr., et al.: Evaluation of Severe Accident Risks: Peach Bottom
Unit 2, Sandia National Laboratories, NUREG/CR-4551, Vol. 4, DraftRevision I, SAND86-1309, to be published
/14/ J.J. Gregory et al.: Evaluation of Severe Accident Risks: Sequoyah Unit 1,
Sandia National Laboratories, NUREG/CR-4551, Vol. 5, Draft Revision I,SAND86-1309, to be published
/15/ T.D. Brown et al.: Evaluation of Severe Accident Risks: Grand Gulf Unit 1,Sandia National Laboratories, NUREG/CR-4551, Vol. 6, DraftRevision I,SAND86-1309, to be published
/16/ C.K. Parket al.: Evaluation of Severe Accident Risks: Zion Unit I,Brookhaven National Laboratories, NUREG/CR-4551, Vol. 7, DraftRevision I, BNL-NUREG-52029, to be published
/17/ Etude Probabiliste de Surete' des Reacteurs a' Eau sous Pression du Paler
900 MWe, Rapport de Synthese, IPSN, Apri 1990
/18/ Etude Probabilste de Surte'd'une trnche du Centr de Production
Nucleaie de Paluel (1300 MWe), Rapport de Synthese, ESP 1300, Mai 1990
/19/ H. Murakan: Probabilstic Safety Assessment for Typical Japanese BWR
Plants, IAE-R8903, Proceedig of 4th National Symposium on ProbabilsticSafety Assessment, 1989
/20/ Y. Tsujikura: Probabilsnc Safety Assessment for Typical Japanese PWR
Plants, IAE-R8903, Proceeding of 4th National Symposium on ProbabilsticSafety Assessment, 1989
/21/ U. Hauptmanns, W. Wemer: Engieering Risks, Evaluation and Valuation,Spriger Verlag, 1991
/22/ Mos1eh, Flemnng, Pan, Paula, Worledge, Rassmuson: Procedurs for
Treatig Common Cause Failures in.Safety and Reliabilty StudiesNUG/CR-4780, Vol. 1, Jan. 1988
/23/ A.D. Swai and H.E. Guttan: Handbook of Human Reliabilty Analysis
with Emphasis on Nuclear Power Plant Applications, NURG/CR-1278,SAND80-0200, Sandia National Laboratories, Albuquerque, NM, August1983
/24/ E.E. Embrey, et al.: Success lielihood Index Methodology (SLiM-MAUD),An Approach to Assessing Human Emer Probabilties Using Strctued
Expert Judgement, NUREG/CR-3510, Vol1,2, 1984
/25/ J.M. Gandit: Enseignement et actions correctives de' cide 'es apre' s l'incidentsurenu a' Bugey 5,le 14 avr1984: -International Conference on thePerfonnance and Safety of Nuclear Power Plants, Vienna, Austra, 28September-2 October, 1987, IAA-CN-48/122
-70-
/26/ B1ayais 3, indisponibilite' de l'njection de se'cOOte' lors du rede'marage:
Rapport d'activite' 1986, Service Central de SecOOte' des InstallationsNuc1e'aires, p 94, Ministe're de l'ndustre des P' et du ToOOsme
/27/ Violation of Technical Specifications for Operation of the Oskarsham 3NPP on July 24, 1987, Swedish Nuc1ear Power Inspectorate TechnicalReport 87/5 (In Swedish, with English summar)
/28/ Hörter, H.: Zum Nichtschliessen der Erstabsperraratu im Not- und
Nachkühlsystem im Kernaftwerk Biblis, Block A am 17.12.87,Atomwirschaft, Dezember 1989, pp 580-82
/29/ AEOD Concerns Regarding the Power Oscilation Event at LaSalle 2(BWR), NRC AEOD Report AEOD/S803
/30/ J. Dorey, P. Bergeron (EdF: SRDF - Le syste'me de recueil de donne'es de
fiabilte' diE1ectrcite' de France, Second colloque international sur lafiabilte' et la maintenabilte', Perros-Guirec, Septembre 1980
/31/ P. Hömke, H.W. Krause, W. Ropers, C. Verstegen, H. RÜfen, H.V.
Schlenker, P. Dörr, A. Tsekouras: Zuverlässigkeitskenngrößenenntùungim Kernkraftwerk Biblis B, Abschlußbericht, GRS-A-1030IBand I bis VI,Dezember 1984
/32/ RWTÜV, GRS, TÜV-Rheinland: Untersuchung der Zuverlässigkeit vonDruckabsicherungen in Kernaftwerken, Ergebnisse des vomBundesminister des Inneren geförderten Forschungsvorhabens SR214, Berichts-Nr.: 911-258/81, TÜV Theinland, Köln, September 1981
/33/ TÜV-Leitstelle Kerntechnik bei der VdTU: Statistische Untersuchung der
Zuverlässigkeit von Notstromdieselanlagen in deutschen Kernaftwerken,Verlag TÜV Rheinland, Köln, 1983
/34/ GRS, TÜV Rheinland, RWTV: Auswertng der Betrebserfahrngen mitSicherheitsaratuen, Ergebnisse des vom Bundesminister des Inneren
geförderten Vorhabens SR 297, RWT, Essen, Januar 1985
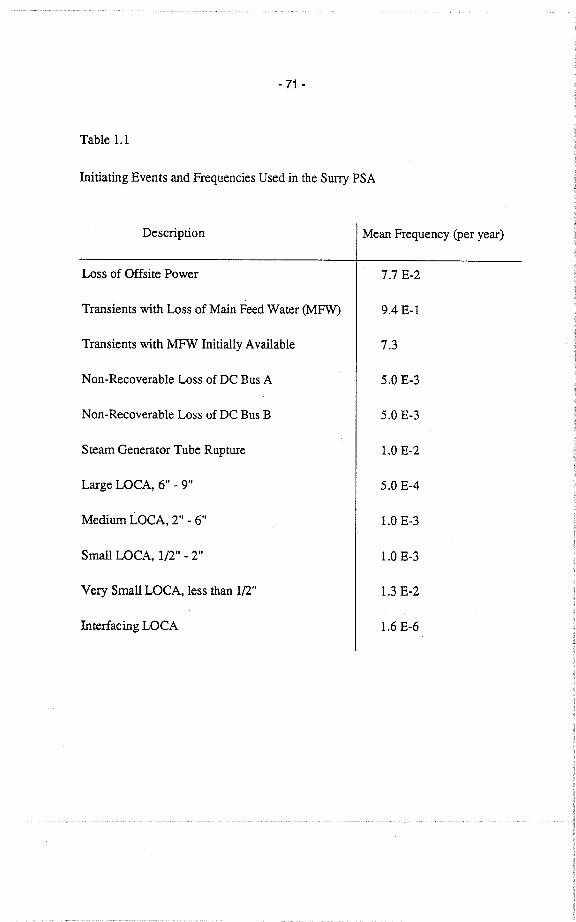
- 71 -
Table 1.
Initiating Events and Frequencies Used in the Sur PSA
Description Mean Frequency (per year)
Loss of Offsite Power 7.7 E-2Transients with Loss ofMain Feed Water (MFW 9.4 E-l
Transients with MFW Initialy Available 7.3
Non-Recoverable Loss ofDC Bus A 5.0 E-3
Non-Recoverable Loss ofDC Bus B 5.0 E-3
Steam Generator Tube Rupture 1.0 E-2
Large LOCA, 6" - 9" 5.0 E-4
Medium LOCA, 2" - 6" 1.0 E-3
Smal LOCA, 1/2" - 2" 1.0 E-3
Very Smal LOCA, less than 1/2" 1. E-2
Interfacing LOCA 1.6 E-6
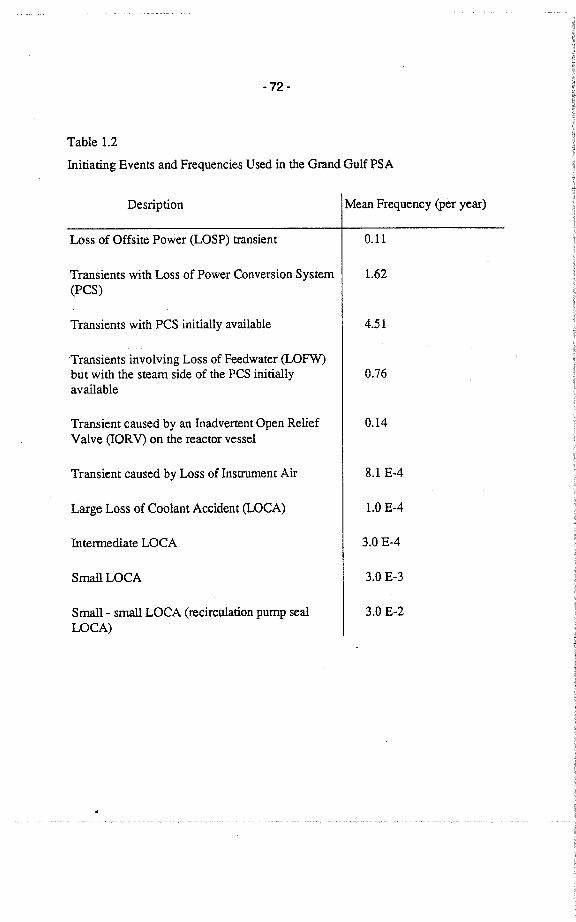
-72 -
Table 1.2
Initiating Events and Frequencies Used in the Grand Gulf PSA
Desription Mean Frequency (per year)
Loss of Offsite Power (LOSP) trnsient 0.11
Transients with Loss ofPower Conversion System 1.62(PCS)
Transients with PCS initialy avaiable 4.51
Transients involving Loss of Feedwater (LOFWbut with the steam side of the PCS initial1y 0.76
avaiable
Transient caused by an Inadvertent Open Relief 0.14
Valve (IORV) on the reactor vessel
Transient caused by Loss of Instrment Air 8.1 E-4
Large Loss of Coolant Accident (LOCA) 1.0 E-4
Intermediate LOCA 3.0 E-4Smal1 LOCA 3.0 E-3Smal1- smal LOCA (recirculation pump seal 3.0 E-2
LOCA)
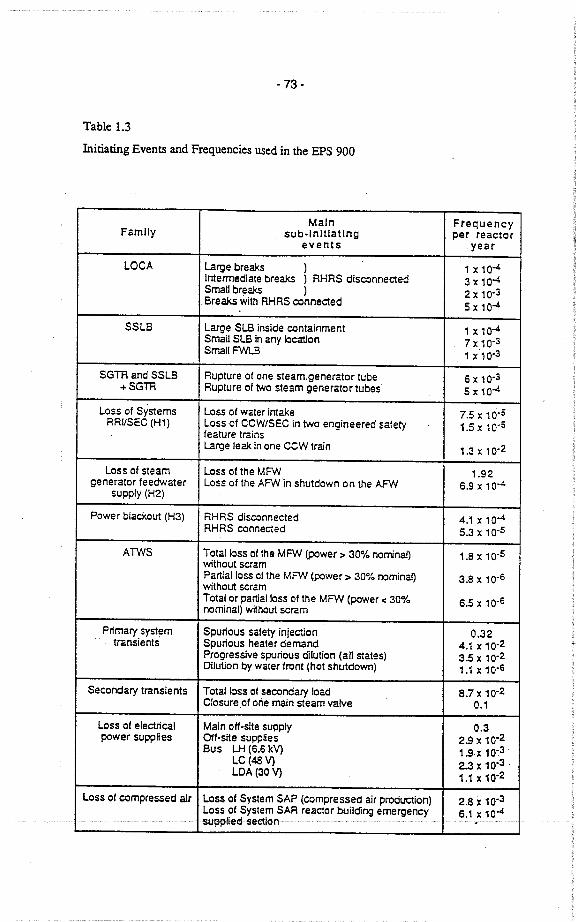
- 73-
Table 1.3
Initiatig Events and Frequencies used in the EPS 900
Maln FrequencyFamlly sub.lnltlatlng per reacter
events year
LOCA Large breaks ) 1 x 10⁻⁴IrTennediate break ) RHRS disconneeted 3 x 10⁻⁴Small break )
2 x 10⁻³Break with RHRS conneeted
5 x 10⁻⁴
SSlB Large SLB inside containment 1 x 10⁻⁴Small SLB in any Iocaten 7 x 10⁻³Srnll F'B
1 x 10⁻³
SGTR and SSLB Rupture of one steam.generater tube 6 x 10⁻³+SGTR Rupture of two steam generator tubes 5 x 10⁻⁴
loss of Systems loss of water intake 7.5 x 10⁻⁵RRVSEC (H1) lossof CCW/SEC in twe engineered safety
1.5 x 10.5feature trainsLarge leak in one CCW train 1.3x10⁻²
Loss of steam Loss of the MFW 1.92generator feedwater loss of the AFW in shutdown on the AFW 6.9 x 10⁻⁴
supply (H2)
Power blackout (H3) RHRS disconnected 4.~ x 10-4RHRS conneeted
5.3 x 10⁻⁵
AT'S Total Joss 01 the MFW (power:: 30% nominal) 1.8 x 10⁻⁵without scramPartial loss of the MFW (power:: 30% nominal)
3.8 x 10⁻⁶without scramTotal or partalloss of the MFW (power c: 30%
6.5 x 10⁻⁶nominal) without scram
Primary syst!,m Spurious safety ¡njeetion 0.32transients Spurious heater demand 4.1 x 10⁻²
Progressive spurious dilution (all states) 3.5 x 10⁻²Dilution by water front (hot shutdown)
1.1 x 10⁻⁶
Secondary transients Totalloss of secondary load 8.7 x 10⁻²Closure.of one main steam valve 0.1
Loss 01 eleetrical Main otf-site supply 0.3power supplies Otf-site suppfies 2.9 x 10⁻²
Bus L. (6.6 kV) 1.9.x10~3'LC (48 V) 2.3 x 10.3 .LDA (30 V)
1.1 x 10⁻²
Loss of compressed air Loss of System SAP (compressed air produeion) 2.8 x 10⁻³Loss of System SAR reaetor building emergency
6.1 x 10⁻⁴.. ........ suppliedseetion
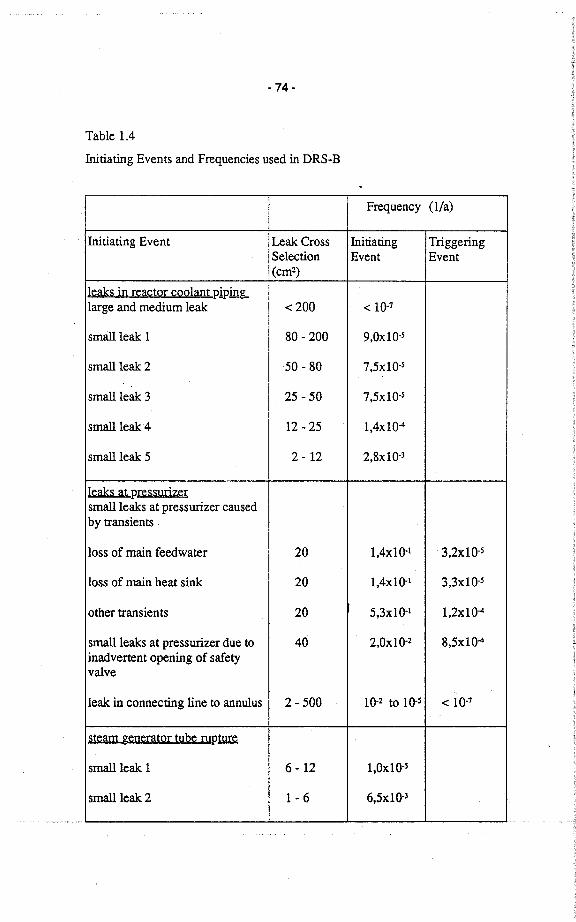
- 74-
Table 1.4
Initiatig Events and Frequencies used in DRS-B
Frequency (1/a)
Initiating Event LeakCross Initiatig TriggeringSelection Event Event(cm2)
leaks in reactor coolant pipinlarge and medium leak .:200 .: 10-7
smallieak 1 80 - 200 9,Oxl0-s
smalileak 2 50 - 80 7,5xl0-s
smalleak 3 25 - 50 7,5x10-s
smalleak4 12 - 25 1,4x10⁻⁴
smalleak 5 2 -12 2,8x 1 0-3
kaks at pressurizersmalleaks at pressurzer causedby transients
1055 of main feedwater 20 l,4xl0-1 3,2xl0-s
1055 of mai heat sink 20 1,4x10⁻¹ 3,3x10-s
other transients 20 5,3x1O-1 1,2x10⁻⁴
smalleaks at pressurzer due to 40 2,Ox10-i 8,5x10⁻⁴inadvertent opening of safetyvalve
leak in connectig line to anulus 2 - 500 .. 10-i to 1O-s .: 10-7
steam generator tube rup~
smaleak 1 6 - 12 1,Ox10-s
smalleak2 1 - 6 6,5x10⁻³
...
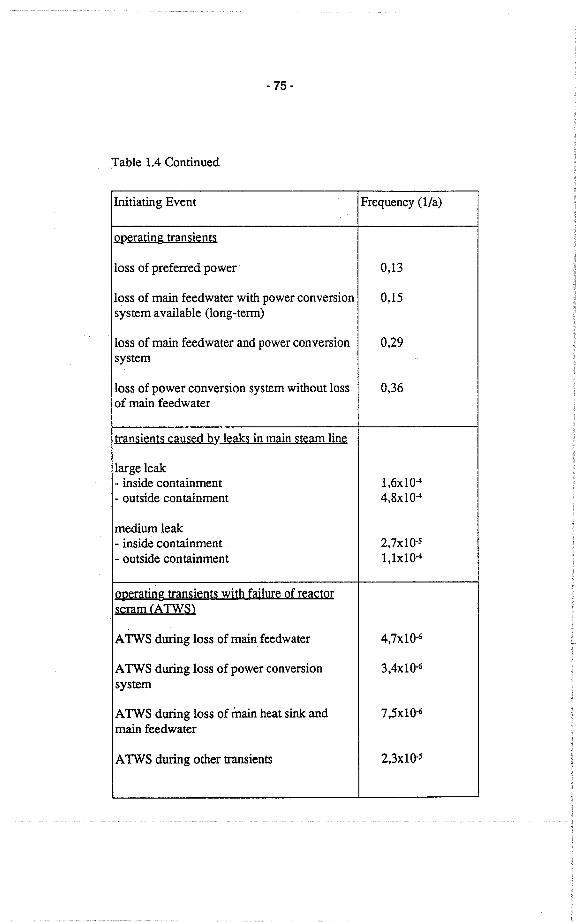
- 75-
Table 1.4 Continued
Initiating Event Frequency (l/a)
2perating transIents
loss of preferred power 0,13
loss of main feedwater with power conversion 0,15system avai1able (long-term)
loss of main feedwater and power conversion 0,29system
loss of power conversion system without loss 0,36of main feedwater
trnsIents caused by leaks in main stear line
large leak- inside containment 1,6xlO-4
- outside contaent 4,8x10⁻⁴
mediumleak- inside contanment 2,7xlO-s- outside containment 1, x 10-4
operating transients with failure of reactorscram (A TWS)
A TWS durng loss of main feedwater 4,7xlO-6
A TWS durg loss of power conversion 3,4xlO-6system
A TWS durng loss of inai heat sink and 7,5x10⁻⁶main feedwater
A TWS during other trsients 2,3x10-s
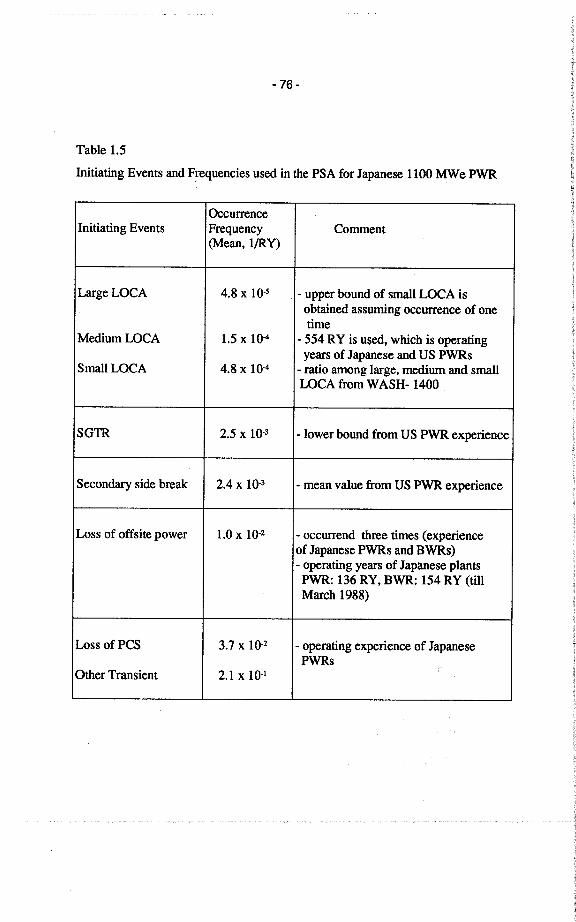
-76 -
Table 1.5
Initiatig Events and Frequencies used in the PSA for Japanese 1100 MWe PWR
OccurenceInitiating Events Frequency Comment
(Mean, I/RY)
LageLOCA 4.8 x 10⁻⁵ - upper bound of small LOCA isobtaned assuming occurence of onetime
Medum LOCA 1.5 x 10⁻⁴ - 554 RY is used, which is operatingyears of Japanese and US PWRs
SmallLOCA 4.8 x 10⁻⁴ - ratio among large, medium and smaLOCA from WASH- 1400
SGTR 2.5 x 10⁻³ - lower bound from US PWR expenence
Secondar side break 2.4 x 10⁻³ - mean value from US PWR expenence
Loss of offsite power 1.0 x 10⁻² - occurend three times (expenence
of Japanese PWRs and BWRs)- operating years of Japanese plantsPWR: 136 RY, BWR: 154 RY (tillMarch 1988)
Loss ofPCS 3.7 x 10⁻² - operating expenence of JapanesePWRs
Other Transient 2.1 x 10⁻¹
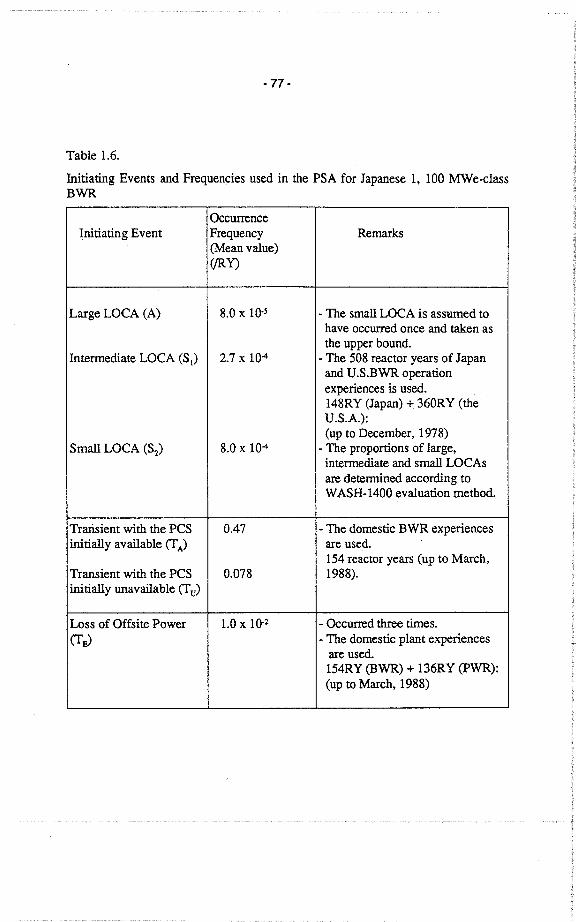
-77 -
Table 1.6.
Initiatig Events and Frequencies used in the PSA for Japanese 1, 100 MWe-classBWR
OccurnceInitiating Event Frequency Remarks
(Mean value)(¡Y)
Large LOCA (A) 8.0 x 10⁻⁵ - The smal LOCA is assi:med tohave occured once and taken asthe upper bound.
Intermediate LOCA (Si) 2.7 x 10⁻⁴ - The 508 reactor years of Japanand U.S.BWR operationexperiences is used.148RY (Japan) + 360RY (theU.S.A.):(up to December, 1978)
Small LOCA (S2) 8.0 x 10⁻⁴ - The proportons of 1arge,intermediate and smal LOCAsar determned according toWASH-1400 evaluation method.
Trarsient with the PCS 0.47 - The domestic BWR experiencesintialy avaiable (TA) are used.
154 reactor years (up to March,Transient with the PCS 0.078 1988).initialy unavaiab1e (Tu)
Loss of Offsite Power 1.0 x 10⁻² - Occurd the ties.(TJ - The domestic plant experiences
are used154RY (BWR) + 136RY (PWR):(up to March, 1988)
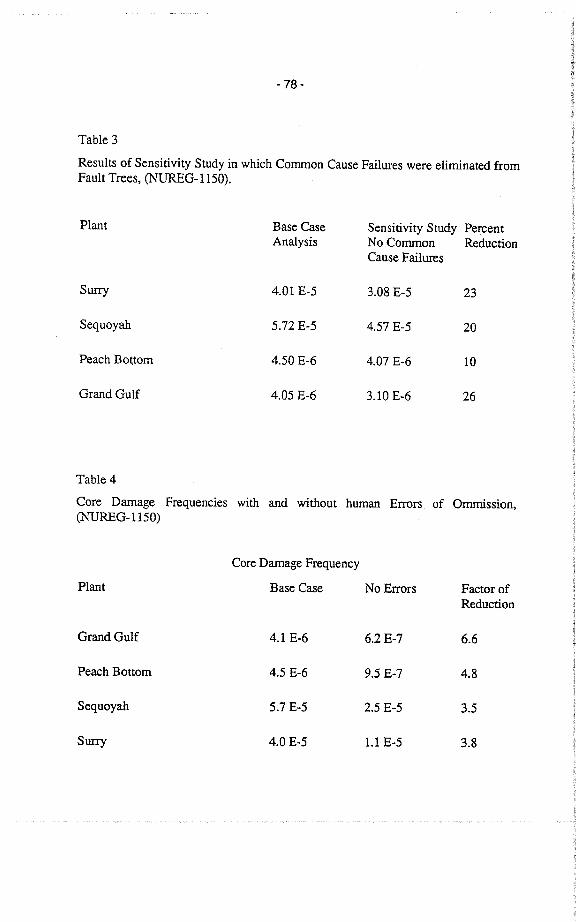
- 78-
Table 3
Results of Sensitivity Study in which Common Cause Faiures were elimínated fromFault Trees, (NUREG-1150).
Plant Base Case Sensitivity Study PercentAnalysis NoCommon Reduction
Cause Failurs
4.01 E-5 3.08 E-5 23
5.72 E-5 4.57 E-5 20
4.50 E-6 4.07 E-6 10
4.05 E-6 3.10 E-6 26
Sur
Sequoyah
Peach Bottom
Grand Gulf
Table 4
Core Damage Frequencies with and without human Errors. of Ommssion,(NUREG-1150)
Core Damage Frequency
Plant Base Case No Errors Factor ofReduction
Grand Gulf 4.1 E-6 6.2 E-7 6.6
Peach Bottom 4.5 E-6 9.5 E-7 4.8
Sequoyah 5.7 E-5 2.5 E-5 3.5
Sur 4.0 E-5 1. E-5 3.8
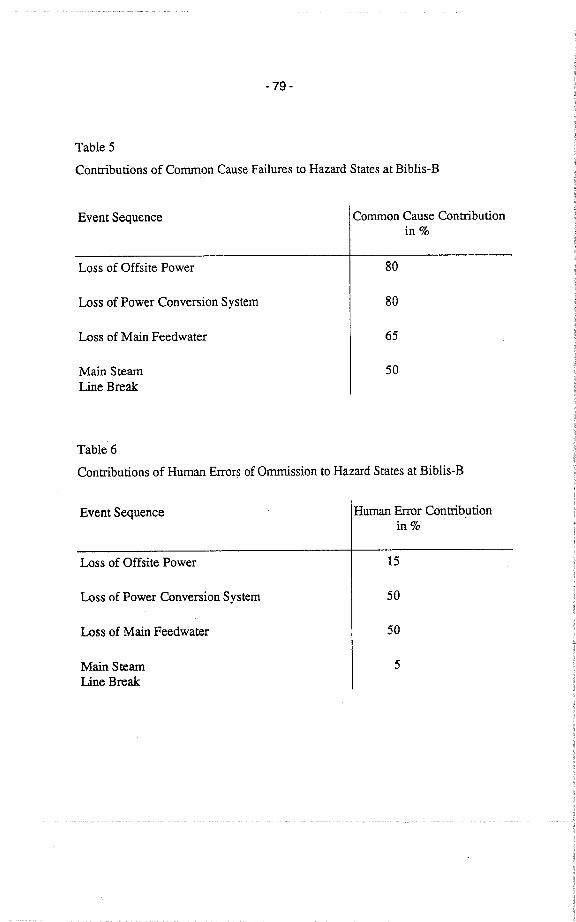
-79 -
Table 5
Contrbutions of Comron Cause Fai1ures to Hazard States at Bib1is-B
Event Sequence Comron Cause Contrbuuonin %
Loss of Offsite Power 80
Loss of Power Conversion System 80
Loss of Mai Feedwater 65
Main SteamLine Break
50
Tab1e 6
Contrbuuons of Human Errors of Ommssion to Hazard States at Biblis-B
Event Sequence Human Error Contrbuuonin %
Loss of Offsite Power 15
Loss of Power Conversion System 50
LosS of Main Feedwater 50
Main SteamLine Break
5
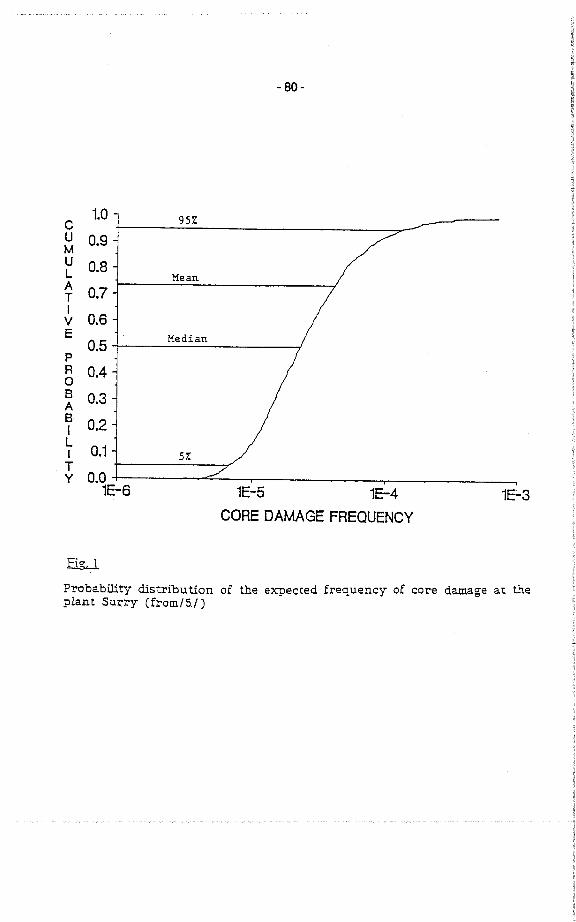
- 80-
1.0cu 0.9Mu 0.8LA 0.7Ti
v 0.6E
0.5pR 0.40B 0.3AB 0.2i
L0.1i
Ty 0.0
1E-6
957.
Mean
Median
57.
1E-5 1E-4CORE DAMAGE FREQUENCY
1E;'3
Fi g. 1
Probabilty àistribution of the expected frequency of core damage at theplant Surry (from/5.1)
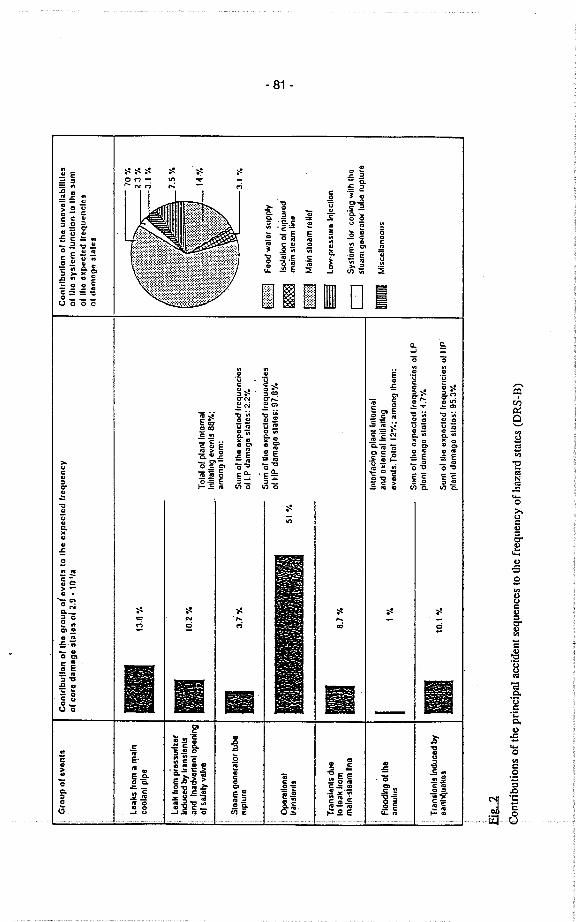
Gia
up 0
1 ev
enl!
Conliibullon ollhe giaup a( aven" 10 Ihe expecled Iiequencv
01 e
aie
dom
oge
isla
lu 0
/2.9
. 10
"/a
10.2
~.
laak
s ',0
m a
. mal
neoolanl pipa .
13.0
%
leak Irom p;essUllier
Indu
eed
by I
ians
leni
san
d In
adve
rten
i ope
nlng
0/ s
alel
y va
lve
Sioa
m o
onei
aloi
tube
rupl
uie
I3.
7 'Y
.
Opi
allo
nal
Iian
slon
ls
:1~
,,'.0
1 JI
'0 ',
~ ',
'::":
,"(
_,I)
;,")
':' ,)
;;~
i'l \1
:lqn'
:;-~
~,\.
IN"il
fj:.
'I' I
''¡ t
i) \.
'f' i
'i'~
,.' 1
:.1 t,
,~ "
, ,1.
-;.1
1 .:
' 'H
\ '('¡
",.,
.: ~(
l:~~i
ll' ,1
,('_
1' ~
i\~.
."~
~: \1
'.\ ~
~ ~"
~ i)
, ~ r
; J.l.
t: 'i
I~~
\ ;"
.1"I
l. j;.
~ ',
~I".
,'I .1
.....'
'. \.
~',I
,' ."
I~f
,).\
' , .'
~ltii
.r.P
T ia
nsle
nls
due
10 le
ak I
rom
maln-sieam Uno.
0.7%
Conlrlbullan ollho unovoll.bllllu
ollh
o 'v
sler
n lu
nello
n 10
Iho
,um
ollho oxpecled liequencl.,
01 domooo ,Ialu
Tol
al 0
1 pl
anlln
iern
alIn
illal
ing
even
ls O
Q%
;"m
ongl
hom
:
70%
.2.
3 ~
.3.
1 %
7.5
~.
Sum
0/ i
ho o
xpoc
iod
Ireq
uonc
ios
01 L
P d
amag
e 51
0105
: 2.2
%
Sum
o/lh
o ex
poei
ed I
requ
oocl
es01
HP
dom
ogo
slai
os: 9
7 .O
~.
3.1 '10
ff ~ - ~ o lI
51 %
Feo
d W
"IO
I sup
plV
Isolio 01 rii,iiurod'
main sleam line
Q) ..
Mal
n sl
oam
iolio
l
iow.pressuio In¡eellon
SVsl
ems
101
eopl
ng w
llh I
hosl
oam
gen
oiai
oi lu
boru
plur
o
Floo
dlng
ollh
oon
nulu
s .
1%
10.1
%T
rans
loni
s in
dueo
d by
oanh
l¡u"
koS
Eig
.
Inlo
rlacl
ng p
lanl
lnlo
rnal
and oxlornallnillallng
ovon
ls. T
Olo
l 12%
; am
ong
Ihom
:/J
isce
ll"no
ous
Sum
01
Iho
oxpo
clod
Iroq
uonc
los
01 L
Ppl"ni dom "
go 5
1"10
5: 4
.7%
Sum 01 Iho oxpoelod Iroquoncios 01 111'
pl"n
i d"m
ogo
slol
os: 9
5.3.
1.
Con
trib
utio
ns o
f th
e pr
inci
pal a
ccid
ent s
eque
nces
to th
e fr
eqiie
ncy
of h
azar
d st
ates
(D
RS-
B)
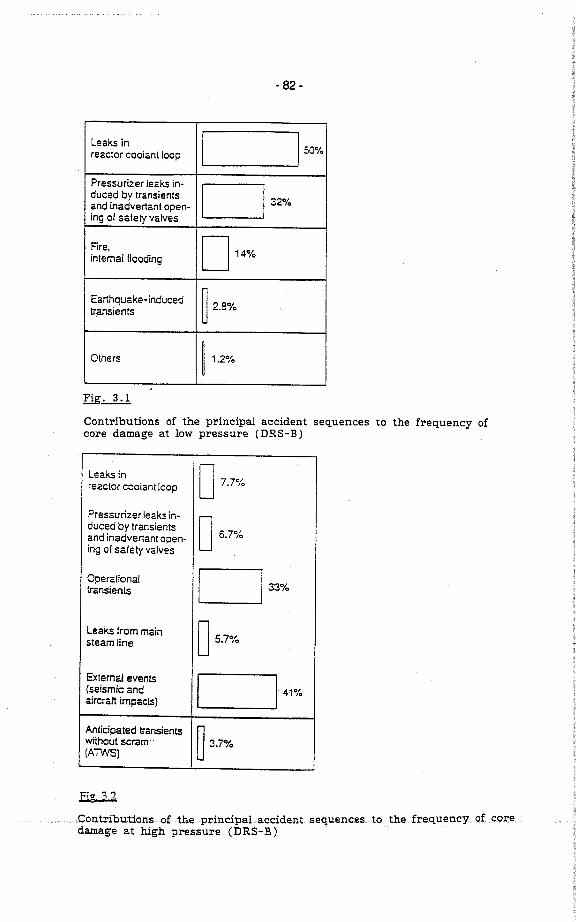
- 82-
Leaks in
I 150%reactor coolant Joop
.
Pressurizer Jeaks in-
c=32%duced by transientsand inadvertant open-ing of safety valves
Fire,
014%intemal f100ding
Earthquake- induced~ 2.8%tiansients
Others ~ 1.2%
ll.:Contributions of the principal accident sequences to the frequency ofcore damage at low press ure (DRS-B)
Leaks in
0 7.7%re ac tor cooiant ¡oop
Pressurizer leaks in-
06.7%duced by transientsand inadvertanl open-ing 01 safety valves
Operalional
c=33%transients
Leaks trom main
05.7%steamline
ExtemaJ events
I 141%(seismic andaircratt impacts)
Anticipated tranients
~ 3.7%without scram. .(ATWS)
lig 32Con tributionsofthe..princi-pal..accident sequences... tothefreq.uency ..of.coredamage at high pressure (DRS- B)
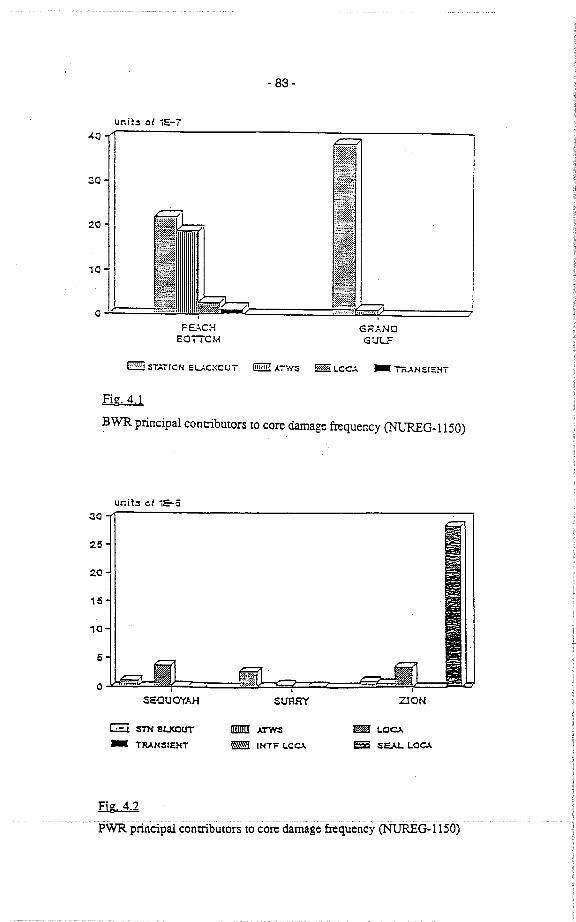
20 i
101
o
- 83-
unH:s of íE-ï40
:;0
PEAC:-EQiTQM
G¡:ANOGULF
!B 'Sï':TICN EUC:(OUi li AiW'S !E Loe.: .. Ir.AN'SIENï
Fig.4.1
BWR principal contrbutors to core daage frquency (NG-1150)
ziON
unit:s of íE-5::o
25 J
20
15
10
5
0SE!lUOYAH SURRY
G srSUCUT ii ATW- TrUN:stENT ~ INT"F LOc.
.. LCc.= :SEA L.oc.
Fig,4.2
PW'pnncipiicoiitrbutors tocore damage frquency (NG-1150)
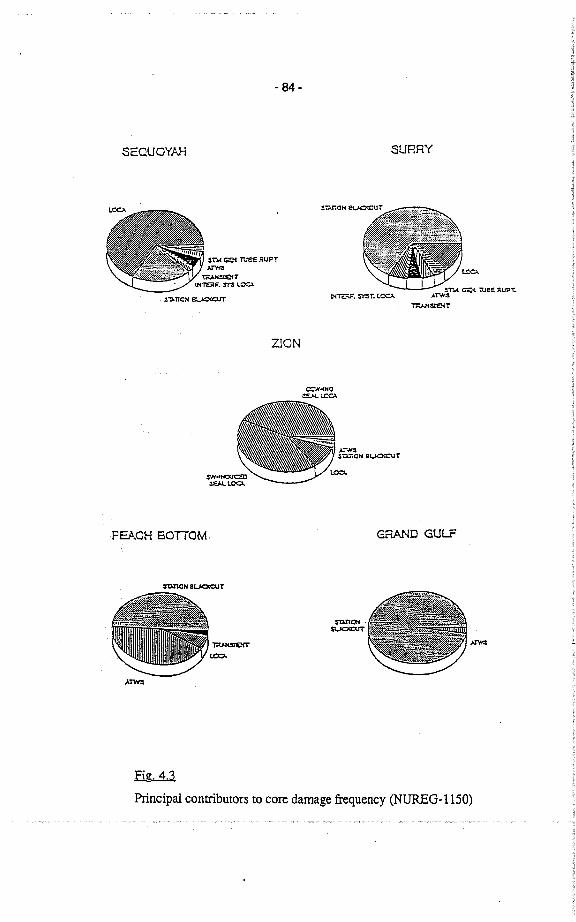
- 84.
SEQUOYAH SURRY
~"tnCN E.
ZION
e:H-fHO~L.a
PEACH SOTTOM.
=HBUOT
~=ATw
tNTEv. S"r. lOC
sia. .St
~n. Ge: tuee. RU'PT..),rw~
~:se4T
JrH::¡'t:i.iiQH 6UQT
GRAD GULF
Jr
Eg.4.3
Prncipal contrbutors to core damage frequency (NUREG.1150)
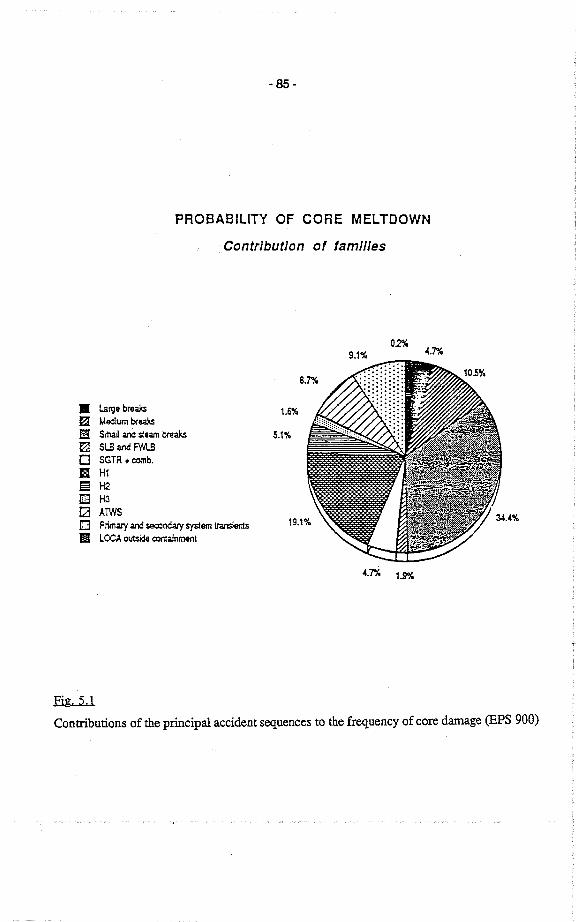
.85 -
PROBA81L1TY OF CORE MELTDOWN
Contrlbutlon ot tamiles
. Large break
r: Medum brea
.E3 SrtD ar sleam brake? SLB and F'o SGTR + cob.
B HlËI H2D H3ca ATWSD Primar ar send syem trim LOCA outsid coainmet
02%-1.7%9.1%
1.6%
5.1%
U% 1.9
Fig. 5,1
Contrbutions of the pnncipal accident sequences to the frequency of core daage (EPS 900)
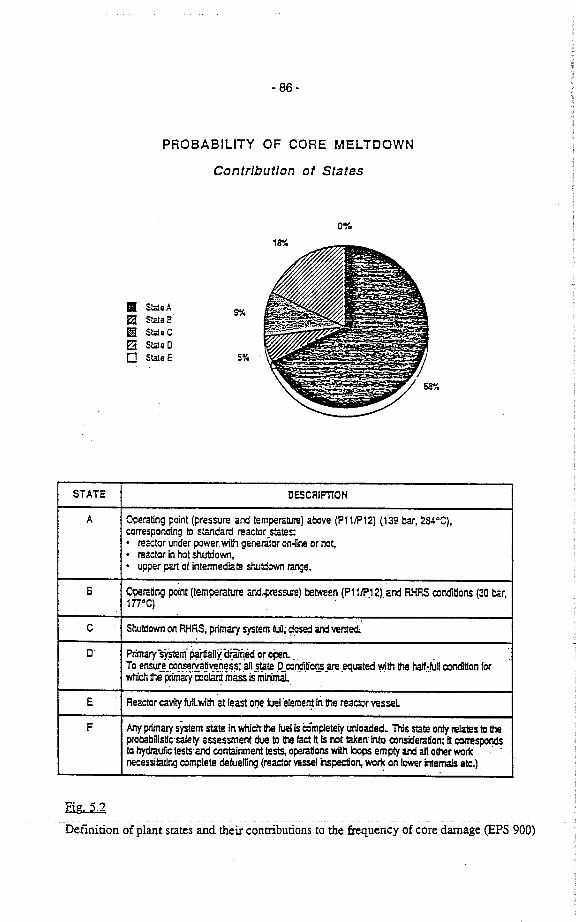
- 86-
PROBABILITY OF CO RE MELTDOWN
Contrlbutlon of States
0%
11 Sl;eA S"æ S~iBEi Sl;eC~ Slae 0
0 S~eE 5%
STATE DESCRIFTON
A Operating point (pressure and temperatu) above (P111P12) (139 ba, 2S4°C),corresponding to stadard reacior.sttes:. reactor under power, wilh generator on.fir or not,
. reactor in hot shutown,
. upper pa 01 intennediaæ s.'iutdow rae.
S Operaririg point (temperatue an..pressue) betwen (?1111.12),arx RHRS condlions (30 t:r,mOC)
C Shutown on RHRS, piimar sytem tu; dos an ventec'
D' Priar~iTf ~ally' ëli:riëdor oPen. . .To ensu~e.co~iy~~ries~;ali _~te aconclíori.ar ,eauated 'Mlh lhti:~11 concfitonforwt lh priar coola mas is min, ..
E Reacor cavity tulwilh at leas olJe fureleme~ in lh reaetr vesseL
F- My piary sYstem stte in Yicl 1t lu is ¿mpletely unoaded. Ths stte onl relaæs to 1tprobabilisöc'salety assessmentdue lD lh Iaet ills not taen'lnto ccnsideralíon; il ccrrspond10 hydiufc tests'an contanment tests, opelions wi lops empty an alt othr wonc d-necessilatig complete deluelfng (reader vess! inpeon, wo~ on lewr inemas ete.)
of plant states and their contrbutions to the frequency core damage (EPS
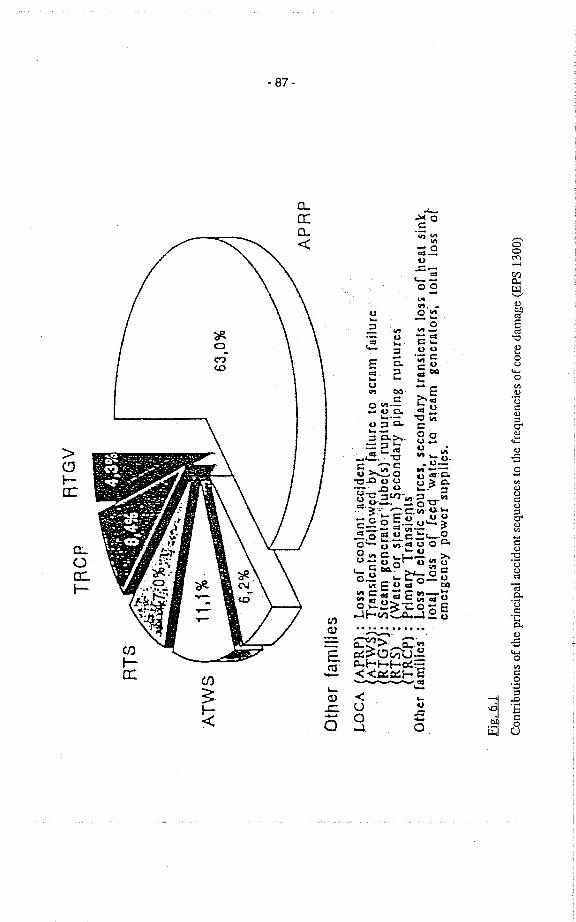
TR
CP
AT
GV
AT
WS
Oth
er fa
rnlli
es
63,0
%
APR
P
LOC
A ¡
AP
RP
l : L
oss
of c
ooln
nt '!
lccj
dent
AT
WS)
: Tra
nsie
nts
follo
~çd'
by
fiiil
ure
to s
cram
fnl
lure
RT
GV
): S
team
Bcn
erat
or"
rubc
(s)"
rup
ture
sR
TS)
': (
Wat
er 'o
r 5l
cari
) Sc
cond
ary
pipi
ng r
uptu
rcs
TRCP) : Primary Transients' .
Other fam'illcs' : l.oss of cleclrlc s.ources, secondary iransieou 1.055 of heat sink1-
. total 1055 of rce~ 'water to stcnm generators, total IOS5 oi
emer
gcnc
y po
wer
sup
pllç
:s.
Fi&
.C
ontr
ibut
ions
of
the
prin
cipa
l acc
iden
t seq
uenc
es to
the
freq
uenc
ies
of c
ore
dan1
age
(EPS
130
0)
co -. ,
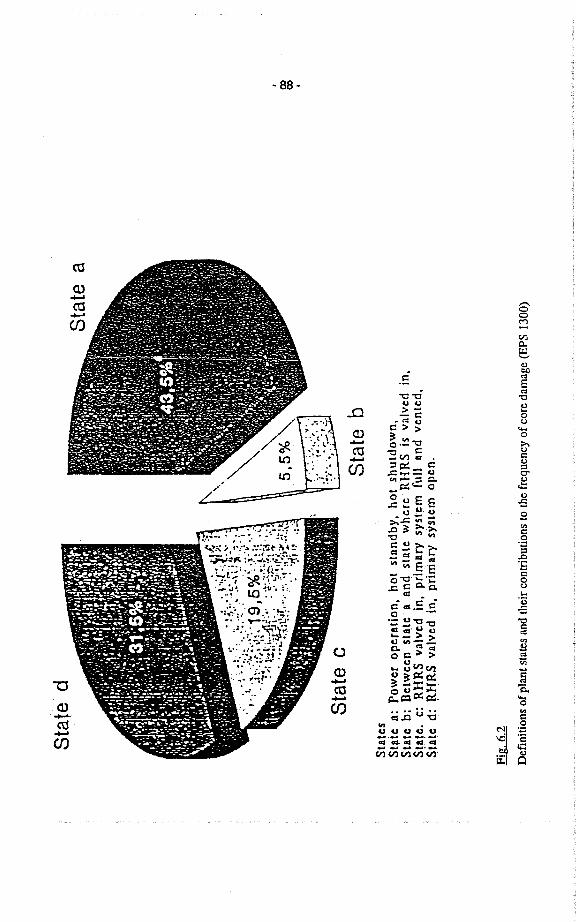
State d
State b
Stat
esStiüe a: Power operation, hot stnndby, hot shutdown,
Sta
te b
: ßet
wee
n st
ate
a an
d st
ate
whc
re. R
HR
S is
viii
ved
in,
Stllt
e. c
: RH
RS
valv
èd in
, pdm
nry
syst
em r
ull a
nd v
ente
d,!i
taL
e d:
ltH
RS
valv
ed in
, pri
rnar
y sy
stem
ope
n.
Fi~
Def
initi
ons
of p
lant
sta
tes
and
thei
r eo
ntri
butio
ns to
the
freq
uene
y of
eor
e di
imiig
e (E
PS 1
300)
00 00
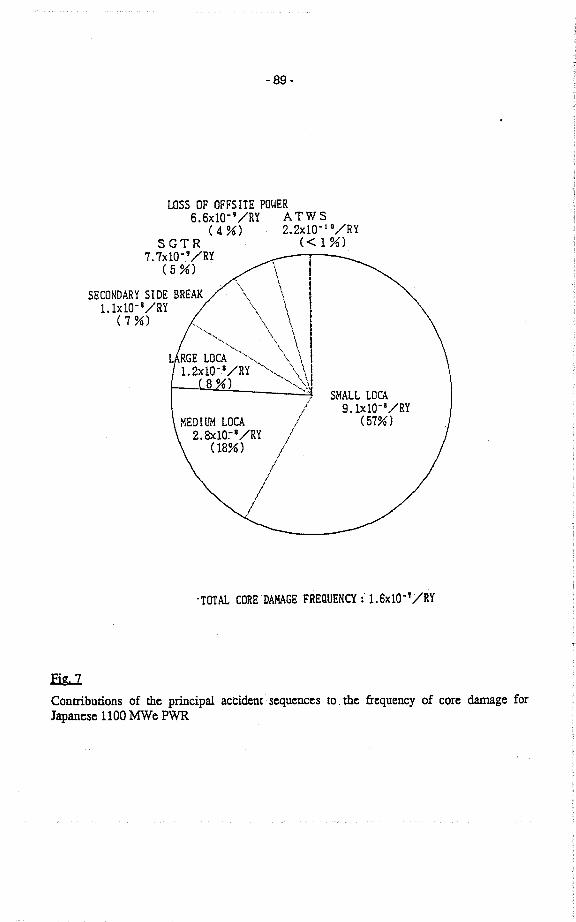
Ei
- 89-
LOSS OF OFFSITE POWER
6.6xlO.' /RY A TW S(4%) 2.2xlO-1o/RYSGTR (~1%)
7. 7xl0.' /RY(5 %) .
SECONDARY SIDE BREAK
. L.lxl0-8/RY(7 %)
../"
L./
//
/SMALL LOCA
9.1xl0-8/RY(57%)
-TOTAL COREDAMAGE FREQUENCY: L.6xl0"/RY
Contrbutions of the pricipal act:dent. sequences to. the frequency of core daage forJapanese 1100 MWe PWR
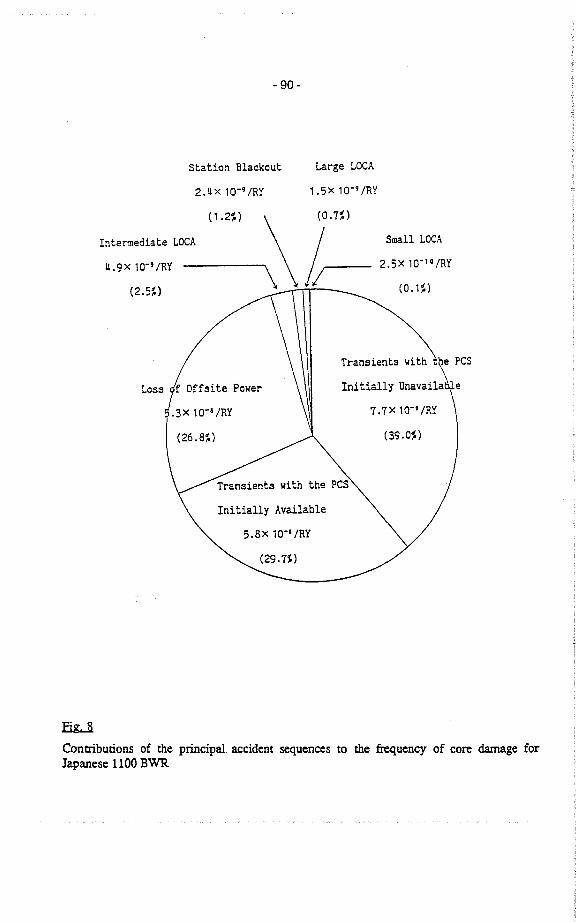
- 90-
Station Blackout Large LOCA
2. !l x 10-9 IRY 1.5x 10⁻⁹ IRY
Loss
Small LOCA
(1.2~)
Intermediate LOCA
!l.9x 10-9/RY
(2.%)
2.5X 10-,o/RY
(0. 1~)
Transients with ~ PCS
Initially Unavailaöle
7. 7X 10⁻¹ IRY
(39.0~)
EiContrbutions of the pricipal. accident sequences to the fruency of core daage forJapanese 1100 BWR
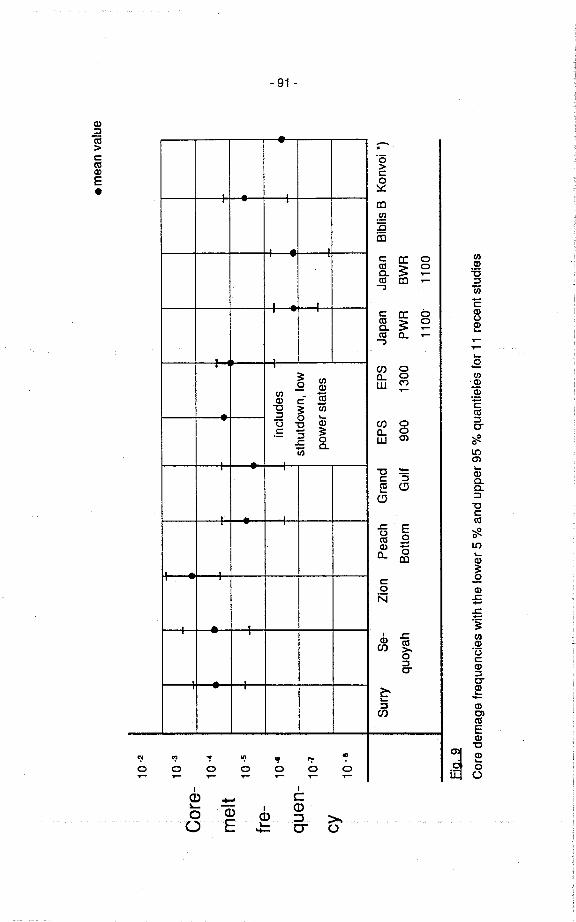
- 91 -
Q)::(¡;:c:CtQ)
E.
-..õ;:c:0~
. a:.21J5ãi
c: a: 0Ct ;: 0a. T"Ct a: ..-:
c: a: bCt ;: 0a. ..Ct 0- ..-:
.
. CI 0;: (f 0- 0
.Q Q) LU ("..(fc:- êiQ)
"C ;: iñ:: 0 ..13 "C Q) CI 0.:: "5 ;: 0- 0
.i 0 u. cn
iñ a... "C -
c: SCt ø..ø
.
. .i E0Ct 0Q) 150- a:
.c:0Ñ
-i .i
Q) CtCI ;:0::c-. ~..::
CI
., " '! ". " ': '?0 0 0 0 0 0 0.. .. .. .. .. .. ..I I
Q) - c:i. i CD0 CD Q) :: ::0 E i,. 0- U-
(fQ)
'ë::iñëQ)0~......
oE(f
. Q)
Æ:'Eca::c-~0l(cn..Q)a.a.::
"Ccca
~0l(..Q)
;:.QQ)
:E:E.¡
(fQ)
'13c:Q)::c-Q)..-Q)ClcaEQ)
~
"C
~00
- 92-
Analysis of Dependencies
Chairman: U. Hauptmanns
- 93-
u. Hauptmanns
Gesellschaft für Reaktorsicherheit (GRS) mbH
Cologne, FRG
ISSUE PAPER on pependent Fallure
Dependent failures are a major concern in the safety analysis of nuclear power
stations because they thwart the benefits accruing from redundant design by leading
to the simultaneous unavailability of more than one of the redundant trains of a
system.
Three classes of dependent failures are generally distinguished: functional
dependencies, secondary or consequential fail u res. and common cause failures.
The first two classes are modelIed direetly in the fault trees. Their probabilities of
occurrence are obtained as folIows:
- functional dependencies (e.g. dependency on a common electricity or instrument
air supply): from the usual reliability data for independent failures
- consequential failures (e.g. rupture of a steam line due to impact from an adjacent
steam line): corresponding physical or chemical models constitute the bases of
the probabilty estimation
80th types of dependent failures can be treated satisfactorily.
This is, however, not the ease for common cause failures, as explained below.
Common Cause failures are due to shared causes such as design, construction or
maintenance errors (e.g. unsuitable lubricants in pump bearings). They generally
make a major contribution to the unavailability of the systems destined to cope with
.....~rl...i':~i~tirl~!~~nt.!or.~)(~riPI~~ th~C3~rri~rli:i~k~tu9Y .~~.~s~..~ r1l .ii:9i~~t~~ .~on~
- 94-
tributions of up to 85 %. For the important sequence triggered by the initiating event
"Failure of the main coolant pumps and failure of the main heat sink" it amounts to
76 %. In NUREG-1150 /2/ contributions between 15 % and 25 % have been found.
Before common cause failures can be introduced into a fault tree their probabilities
of occurrence have to be estimated. This is usually done using parametrie models to
evaluate the data base on multiple failures in nuclear reaetor systems.
The models generally in use are:
- Beta-factor model
- Alpha.factor model
. Multiple-Greek-Letter (MGL) model
- Binomial failure rate (BFR) model
These are discussed in detail in reference /3/.
The Beta-factor model was origjnally developed for systems withtwo redundancies;
in the MGL model it is extended to systems with more redundancies. The Alpha-
factor model is similar to the Beta.factor modeL.
All three models require that simultaneous failures of a number of up to the redun.
daneies to be treated have been observed unless parameter estimation on the basis
of a zero failure statistics is accepted (e.g. upper 95 % centiles).
Unfortunately the number of multiple failures observed is very small so that plant.
specific evaluations of common cause failures must be regarded as impossible. At
most, they may make a small contribution to a data base, which is otherwise drawn
form general experience with nuclear power systems. This dearth of data and the
resultant uncertainty of failure rates is in marked contrast with the aforementioned
importance of common cause failures for many reactor systems. In addition; in ge-
neral the number of observation of simultaneous failures is smaller the higher the
number of redundancies affected. It is for this reason that the BFR model is usually
preferred ..whenhighlyredundantsystemsaretobetreated;lt .allowsonetoconsi"
- 95-
stently extrapolate from the observed failures of fewer redundanciesfor calculating
the failure rate of a greater number of redundancies, if the assumption of an under-
Iying binomial distribution is accepted. However, it is claimed that the pooling of se-
veral observed common cause failures to calculate the failure probabilty parameter,
p, may lead to over or underestimation of the failure rates of higher redundancies.
No matter which model is used for data interpretation, the essential task in common
cause analysis is the acquisition of the required failure data. These must be retrie-
ved from records on abnormal occurrences and collections of reliabilty data.
In this process a considerable amount of engineering judgement has to be exerci-
sed. In order to progress in the field, international co-operation is an imperative be-
cause data form all nuclear power stations should be available for review when com.
mon cause tailure rates are prepared for a PSA study.
In view ot the toregoing exposition the tollowing issues are considered worthy ot dis-
cussion:
- which data bases on abnormal occurrences and reliabilty data are available in
the different countries and do they satisty the common cause intormátion require-
ments (cf. /41)?
- what aspects should be taken into account in judging occurrences of observed
failures as common cause?
- should single tailures be included in common cause analysis?
(this would increase the number ofoccurrences available tor parameter estima-
tion, but require more engineering judgement as an input)
- what are the criteria to be used tor considering NPP systems as comparable for
the purposes of common cause analysis?
- what direction should turther model development take?
- 96-
REEERENCES
111 Deutsche .Risikostudie Kernkraftwerke, Phase B
Köln 1990 (English Summary: German risk study nuclear power plants,
phase B.
GRS-74, Köln 1990)
121 Severe accident risks: An assessment for tive US nuclear power plants.
Summary report-second draft tor peer review.
Vois. 1 and 2.
NUREG-1150, June 1989
131 Mosleh, A. et al.:
Procedure tor Treating Common Cause Failures in Satety and Reliabilty
Studies.
Final Report NUREG/CR - 4870, Vol. 1 (February 1988), Vol. 2 (Decem-
ber 1988),
/41 Parry, G.W. et al.:
Oata Needs tor Common Cause Failure Analysis in:
G. Apostolakis (Ed.):
Probabilstic Satety Assessment and Management, Vol. 2.
New York, Amsterdam, London 1991
- 97-
This paper has been prepared for theCSNI Workshop on Special Issues of Level-l PSA
(C01ogne,27-29 May, 1991)
WHY IS THE MAKOV METHOD NOT USED AS A STANDARDTECHNIQUE IN PSA?
Enrico SilvestriAnsaldo SpA, Nuclear Division, Genoa (Italy)
ABSTRACT
The Markov method is one of the most well-known and mostwidely applied techniques for modelling and quantifyinga variety of problems of stochastic nature. Thismethod, owing to its great flexibility and versatility,performs successfully in the diverse domains of systemmodelling and reliabilitylavailability quantification,easily including common cause failure aspects, oftest/maintenance optimization studies, of stochasticmodelling of many physical processes, also includingoperator actions. Contrasting wi th this versatili ty isthe relatively limited favour that the method finds inPSA applications.
This paper aims at identifying the uses, the perspectiveapplications, the limitations of the method in thecontext of PSA. In particular, it reviews its currentapplications in PSA, and discusses its perspectives inthe various subdomains of PSÁ, like Markov vs. faulttrees in system analysis and Markov vs. event trees inevent sequence quantification, in both of which it isdeemed that combined use of Markov and fault trees orevent trees, respectively, would produce more effective(and also more efficient) modellingi or the capabilityof the method to deal with special topics, Li., humanreliability analysis and modelling of certaintime-dependent phenomena. Finally, the paper attemptsat defining under what specifications can the Markovmethod be made a standard guideline in P8A.
INTRODUCTION
In the course of some years of practice in probabilisticanalysis the specialist has the opportuni ty toappreciate tne versatility and flexibility of the Markovmethod to model and solvethe most diverse stochasticproblems. The method itself is normally the next stepin reliability engineering appenticeship after the mostelementary models that produce the standard textprobability distributions. This contrasts with theobservat.ion that onlyrarely doesone come acr.oss
- 98-
examples of the application of the method' in PSA, asresults from consulting also 'recent literature on thesubject. This br ief note is intended only as adigression to raise some questions related to therelatively scarce use that is made of the Markov model.
The event tree/ fault tree approach has become theestablished framework wi thin which PSA is structured,owing to its numerous advantages, among which:
logical simplicity: ease ofnon-experts wi th limi ted training:
applications by
ability to model systems of high complexity in amanageable way:
good degree of standardization, traceability andver ifiability.
This approach, however, has two basic limitations thatare relevant to PSA, namely:
- the basic events must be essentially independent:
time factors cannot be explicitly modelIed orparametrized.
It is precisely when dependences or stochastic dynamicsare important in the analysis that the Markov method mayrepresent a valid alternative to more conventionalmethods.
One br iefly recalls the assumptions on which the methodis based.
1) The system to be modelIed can be decomposed intoelements ("components"),each one being characterized bya finite number of discrete "states" the element canexperience by undergoing "state transitions".
2) The combinations of all possible states of all systemelements determine the ensemble of syst~m states in anunambiguous way: the possible element state transitionsdefine as many system state transitions. The collectionof all system states and the transitions the system canexperience are a "stochastic process", which isMarkovian by virtue of items 4) and 5) below.
3) the IItransition rates 11 are
probabili ties of transition per uni tthe system has reached the statetransition depends, at a given time.
thetime,
from
conditionalgiven thatwhlch the
- 99-
4) the "transition ratesll between any two connectedstates depend only on the two states themselves and ontime computed from the beginning oftheprocess. It isnot a requirement for a system to be Markovian that thetransition rates between its states be constants, as isoften held. If they do not depend on time, then theprocess that the system undergoes is termedt ime-homogeneous.
5) The probabilities of multiple transitions in a timeincrement tend to zero as the time increment is made totend to zero.
Mathematically, the stochasic evolution of the system intime is described by a set of linear differentialequations .whose solution is the vector of stateprobabi 1 i t ies .
The applicability of the model, given itscharacteristics, must be carefully checked against thereal situation to which i t is adapted. Typically, aprocess for which the transition rates do depend in anyway on the previously visited statesis not Markovian.Asan" example, consider a system made up of componentswhose rates of existence in the IIUpll- and "downll-stateare constants. This is a typical Markovian system. Theimplication of themodel is that each time a failedcomponent is restored to the nonfailed côndition, itsfailure characteristics are returned to the initialcondition. If this was not the case for certaincomponents, then the failure rates for these woulddepend on the number of failurelrepair cycles, andconsequently, the transition from the states describingthe failure of these particular components would dependon which and how many other states have been visitedbefore the state for which the transition is considered.Another example is given by the same system as abovewhen the component restoration times are notexponeritially distr ibuted. In this case, the Markovapproximation may be kept for system unavailabilityquantification, because the fraction of time eachcomponent spends being repaired is small with respect toits "up" state. In any case, an adequate state spacerepresentation can. in principle provide as good anapproximation through a Markov model as is required( see, f. i., refs. 1 and 2).
WHICH TYPES OF PROBLEMS CAN BE MANAGED BY MES OFMAKOV MODELLING AND HOW THEY STAND WITH RESPECT TO PSA
Basically,related toTiid fffereiiE
thetheto
versatili ty of the Markov method isfact that the representation is
the presenceòf deperiderif everi£s~ All
-100 -
forms of dependences can be accounted for by definingthe appropriate state space and transitions.
Typical dependence problems that appear in systemanalysis are:- standby components in redundant systems ¡
maintenance/repair dependences caused by personnelunavailability for multiple parallel repairs¡
test interval/maintenance strategy/ repair proceduresinteractions to determine system unavailabili ty¡
- common cause failures.
By definition, only the last type of dependence can betreated adequately in the fault tree framework. Even inthis case, certain situations where common causefailures do not manifest themselves . in coincidence oftime,this conservative assumption must be made.
As to maintenance crew type of dependence, it can beverified that ifthe repair rate is at least one orderof magnitude greater than the failure rate of thecomponents in a cut set , then the error in theunavailabili ty is also small. For example, in the caseof two redundant parallel components with p ~ 30~, theerror made in the assumption of independent repair isonly -3.2% (in the nonconservative sense). The errorincreases dramatically, however, if the cutset orderincreases. This means that slgnificant errors may bemade in the unavailability evaluation of highlyredundant systems (this is also the typical problem wi thcommon cause failures in the same type of systems).
Test/maintenance schemes cannot at all be quantifiedcorrectly with fault trees, as any event in the processis conditioned to the outcome of another. The Markovmethod can accomodate this case also.
Another case when a different approach from fault treeis necessar¥ in system unavailabili ty /unreliabili tyevaluation 1S when operating (process) systems wi thstandby redundancies and recovery/repair are possiblewith the system in operation. In such case, dependencesexist through the standby/operate interaction eandthrough therecovery processes . Again, as already said,this is a case where the Markov approach is required.In PSA this situation is found basically in two cases:
\Jn.:Y~ll.:1:llt:Y of tçgntlri\l()Ilt;ly C'Plil'.:t:liciJ ...eiuPPSlrtsystems¡
- 101 -
frequency of failure of continuously operated systemsthat determine certain initiating events.
The first case is of particular relevance to PSA, as ispointed out in ref. 3.
The Markov method can model the stochastic behaviour ofother systems than than engineered systems made ofphysical equipment; it serves to model also certainphysicalprocesses. Of particular interest are theapplications to operator/system interactions modelling.An interesting application can be found as an extensionof the Human Cogni tive Reliability (HCR) model in ref.4. In this application, very muçh in the spirit of ref.2, where the method is applied in an entirely differentcontext, the distribution of operator timeto act ismodelled as a discrete-state transition model, whereeach state represents an elementary step in the processof human action. The idea is that .such steps aredefined in a way that allows to obtain reliability datafrom relatively simple experiments. A complete systemanalysis including human errors is developed with theMarkov method in ref. 5.
Of particular relevance to PSA is the problem ofquantifying time-dependent accident sequences. Theevent tree methodology has remained essentiallyunchanged from its initial applications (e. g.,WASH-l400); for each ini tiating event the safety .systemsthat need be operated to -- perform the appropriatefunctions to mitigate the consequences of the events areidentified and used asheadings in the event tree. Thevarious combinations of the states of the systems definethe event sequences generated by the initiating event.The sequence frequency quantification process is done bymultiplying the frequency of the ini tiating event bysystem unavailabilities, usually calculated using faulttree methodology. In this way, system failure andrecovery, or operator actions changing the course of theevents cannot be readily factored in; but it mustrecognized that in major incidents like TM! or Chernobylthis is exactly what happened, so it cannot be concludedthat this contributing factors are of minor importancein determining core damage frequency. Several authorshave pointed out this fact, all basically arriving atthe conclusion that astate space approach with, ingeneral, nonlinear transitions best represents theaccident sequence stochastic timing. At the same time,semi-markovian or Markovian approximations can representacceptable solutions to take account of dynamic factorsin event sequences. One wants to mention ref. 6 for an
~aRPUc~atlQI1_ ...to.~_a_ccjdent~....sequence.s......._..... .w.üh............ .human
- 102-
intervention, ref. 7 for an application to thequantification of the accident sequence of core uncoverycaused by the protracted 10ss of Offsite and OnsitePower event, and refs. 8, 9 and 10 for more generalconsiderations anq methodological approaches.
In a similar way, although in a different application,the Markov approach is being referred to for firegrowth/ fire suppression process modelling inthe firerisk analysis context (e. g., ref 11).
DISCUSSION AND FINAL REMAKS
The Markov modelling technique applied to reliabilityanalysis is an effective tool,whenever the stochasticbehaviour of a system is affected by dependent behaviourin its constituing elements.
What in effect represents an obstacle in its generalizeduse in PSA is then to be found in the algori thmicdifficulties it presents.
Needless to say, a detailed decomposi tion of a system ini ts components causes an exponential growth in thenumber of system states, wi th the associated computingdifficulties in solving the stochastic equations. Thenormal strategy is then to reduce the system to alimited number of aggregate parts, or "supercomponents",characterized by failure and restorati.onrates. Thiscanbe accomplished by a more detailed analysis of theaggregate parts. Several systematic reductiontechniques allow to deal witñ relatively large Markovsystems ( see, f. i., ref. 12) .
It must be conceded that application of such reductionstrategies requires a very thorough understanding ofsystem behaviour and deep knowledge and experience inthe technlque of Markov methode Thus it is not an easytask for system analysts, also considering that usuallythey are introduced to fault tree analysis without muchbasis or experience in formulating and in modellingproblems of a stochastic nature.
As astarting point, referring to the fault tree/ eventtree matrix structure of today PSA, one suggestion is tointroduce the use of Markov methodology at the "bot tomlevel" and at the "top level" of the conceptual faulttree that describes an event sequence. This means thatThe methodcould be used inan integrated structure withfault tree, both to deal with subsystems or componentaggregates at the detail level where certain types ofdependences. exist. .likethose.described. inthe.previoussection, and at the system top event level in the event
- 103-
sequence quantification, where the physically possiblecombinations of system top level states represent plantstates in a (semi )Markov formulation.
The first step, in particular, should not presentunsurmountable obstacles, to integrate Markov modulesalong with elementary event descriptions in a fault treestructure. This step would allow more precise modellingand quantification of support system unavailabilitiesand failure rates.
The fault treel event tree framework represents a verypowerful reference . in PSA, and presents undoubtableadvantages in i ts simpici ty, which is an asset whenconsidering the compex reality of a nuclear power plantthat must be modelIed in PSA. It is also true thatcertain "grey areas" exist in PSA, because of theinability of this framework to deal with certainspecific problems. But is is argued that these problemareas are of no minor importance in today and futurePSA.
Thus it is argued that the limited, non-standard use ofthe Markov method does not represent its inabili ty totreat adequately certain specific problems. Rather , itrepresents the inability to move from procedures thathave become tradition by now.
It is not claimed that the use of Markov methods mayrepresent the panacea to all headaches in PSA, howeverit is held that thinking in terms of this approach inPSA would produce new ideas beneficial to the effect offinding acceptable solutions in areas as those describedabove, even if the algorithm-generating ability of themethod is still really to be tested for PSA.
REFERENCES
1. D. R. Cox, "The AnalysisStochastic Processes by theSupplementary Variables", Camb.(1955), p. 433.
of Non-MarkovianInclusion ofPhilos. 51,3
2. C. Singh, R. Billinton, "Reliability Modellingwith Non-exponential Downtime Distributions", IEEEPES Sumer Meeting, San Francisco, Ca., July 1972.
3. J. B. Bickel, "Impact of Support System FailureLimitations on PSA and Regulatory Decision Making",c;:Nsr .JfQrksllQPCi t . Sclrit cl... .FE!JNE!~ ..foE! :Kl~()1, .....l~!)O!
-104 -
4. Y. O. Lukic, O. H. Worledge, G. W. Hannamah,A. J. Spurgin, "Modeling Framework for CrewOecisions Ouring Accident Sequences", Advances inHuman Factors in Nuclear Power Systems, Knoxville,Tennessee, April 1986.
5. B. S. Ohillon, S. N. Rayapati, "Modeling ofRedundant Systems with Human Errors", ibid.
6. G. Aposto1akis, T. L. Chu, "Time-dependentAccident sequences lncluding Human Actions", Nucl.Tech. (64), Feb. 1984, p. 115.
7. E. Si1vestri, S. Serra, o. F. Paddleford,"AModel for the Probabili ty of Core Uncovery in LOOSPlnduced Accidents, As Applied in the PSS for ENELPWR Standard Power Plant", ANS/ ENS lnt. Topica1Meeting on Probabi1istic Safety Methods andApplications, San Francisco, Calif., Feb. 1985.
8. A. Vi1lemeur, M. Bouissou, A. Oubreuil-chambardel, "Accident Sequences: Methods to ComputeProbabilities", ENS/ ANS/ SNS lnt. Topical Meetingon PSA and Risk Management, Zurich , Aug. -Sept.1987.
9. A. Amendola, "Accident Sequence Oynamic SimulationVersus Event Trees", Reliabili ty Engineering andSystem Safety 22 (1988), p. 3.
10. O. C. Bley, D. R. Buttmer, J. W. Stetkar,"Light Water Reactor "Sequence Timing: ltsSignificance to PSA Mode1ing", ibid., p.. 27.
11. N. Siu, G. Apostolakis, "Modeling the Oetectionand Suppression of Fires in Nuclear Power Plants",ANS/ ENS lnt. Topical Meeting on Probabi1isticSafety Methods and Applications, San Francisco,Calif., Feb. 1985.
12. J. Cantarella, J. Oevooght, C. Smidts,"Methodological Progress in Markovian Availabili tyAnalysis and Applications", ENS/ ANS/ SNS lnt.Topical Meeting on Probabi1istic Safety Assessmentand Risk Management, Zurich, Aug.-Sept. 1987.

- 105 -
OECD/C SNIISSUES WORKSHOP ON SPEZIALOF LEVEL-1 PSACologne. Germany27th-29th May 1991
K. Lützow. C. Fuhrmann
The conditional applicability of the ß-Factor-Method for struc-tural redundancies
Abstract
The ~-Factor-Mtho: allows to irel Cc Caii Failur in fault tre in a relativly sÍJle
Wl .'I ~-Factor-Mthc is baed 00 the siilified asSltion that the ocæ of on CC-Eventleads diretly to the failur of all caents of t;t system.
In genera they thin to be in the "su reon" with ths assmtioo.But thats not tnie in each ca.'I follow Beclk-Exercise shall verify the statemt that the application of the ~-Fac-tor-Methc for stnictural reancies may lead to an indervaluation of the failur probaility .Abve all this coærnsystei in whch the failur of two caents alredy leads to thesystai failur or a hardou situation.'l stnictural ~rtanæ of the DoI~Failur as a miiI cut of first order is very highb& of its high nlÙr.An so it delivers a grt cotrition to the failur probaility of the system notwthstanits SIll freency of ocrenæ.If such system ar treted with the ~-Factor-MthO no the freency of the Dol~Failurewill be added to the freency of the CClete failur of the system Uetbal shæk) the stnictu-ral ÍJrtæ of wich is not so high beuse it ony ocs solely.Ths ca leads to an unervaluation of the failur probaility. of the system.
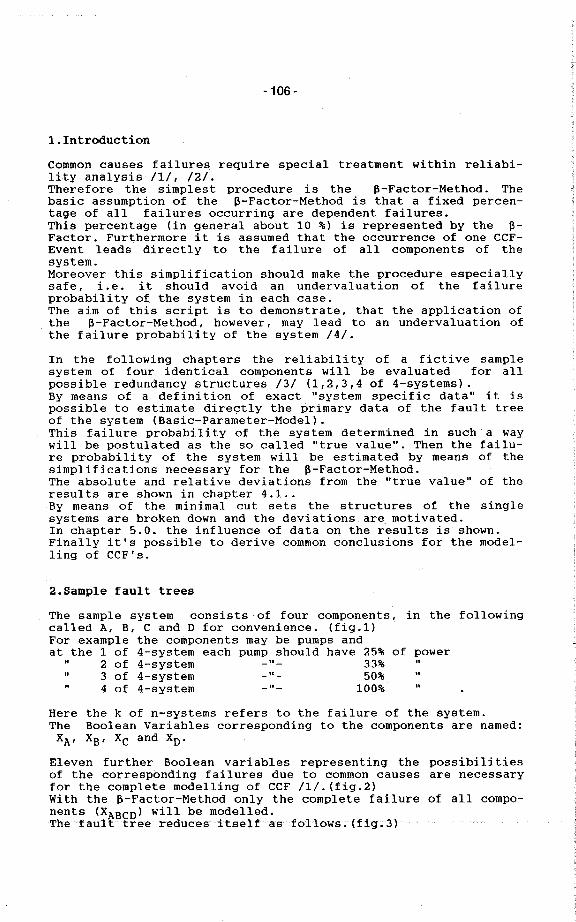
-106 -
1. Introduction
Common causes failures require special treatment within reliabi-li ty analysis /1/, /2/.Therefore the simplest procedure is the ß-Factor-Method. Thebasic assumption of the ß-Factor-Method is that a fixed percen-tage of all failures occurring are dependent failures.This percentage (in general about 10 %) is represented by the ß-Factor. Furthermore i t is assumed that the occurrence of one CCF-Event leads directly to the failure of all components of thesystem.Moreover this simplification should make the procedure especiallysafe, i.e. it should avoid an undervaluation of the failureprobabili ty of the system in each case.The aim of this script is to demonstrate, that the application ofthe ß-Factor-Method, however, may lead to an undervaluation ofthe failure probability of the system /4/.
In the following chapters the reliabili ty of a ficti ve sampIesystem of four identical components will be evaluated for allpossible redundancy structures /3/ (1,2,3,4 of 4-systems).By means of adefinition of exact "system specific data" it ispossible to estimate direçtly the primary data of the fault treeof the system (Basic-Parameter-Model).This failure probability of the system determined in such a waywill be postulated as the so called "true value". Then the failu-re probability of the system will be estimated by means of thesimplifications necessary for the ß-Factor-Method.The absolute and relative deviations from the "true value" of theresul ts are shown in chapter 4.1..By means of the minimal cut sets the structures of the singlesystems are broken down and the deviations are motivated.In chapter 5.0. the influence of da ta on the results is shown.Finally it' s possible to derive common conclusions for the model-ling of CCF's.
2.Sample fault trees
The sample system consists of four components, in the followingcalled A, B, C and D for convenience. (fig.1)For example the components may be pumps andat the 1 of 4-system each pump should have 25% of power2 of 4-system -,,- 33%"
3 of 4-system -,,- 50%4 of 4-system 100%Here the k of n-systems refers to the failure of the system.The Boolean Variables corresponding to the components are named:XA, XB, Xc and XD.
Eleven further Boolean variables representing the possibilitiesof the corresponding failures due to common causes are necessaryfor the complete modelling of CCF /1/. (fig.2)With the ß-Factor-Method only the complete failure of all compo-nents (XABCD) will be modelIed.The faulttreereducesitselfasfollows~ (fig ~3)
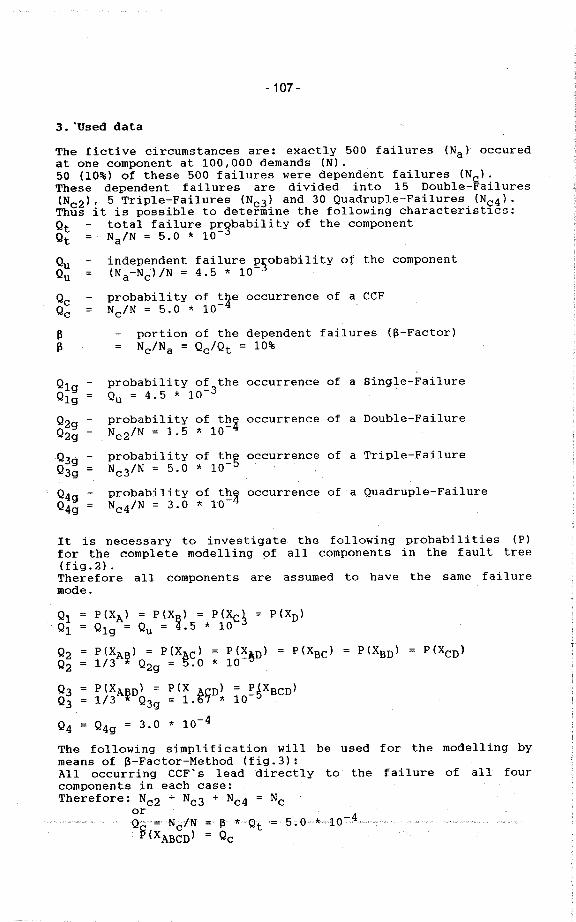
- 107-
3. 'Used da taThe fieti ve eireumstanees are: exaetly 500 failures (Na) oecuredat one eomponent at 100,000 demands (N).50 (10%) of these 500 failures were dependent failures (N ). .These dependent failures are divided into 15 Double-Failures(Ne2), 5 Triple-Failures (Ne3) and 30 Quadruple-Failures (Nç4).Thus i t is possible to determine the following eharaeteristies:Qt total failure pr~bability of the eomponentQt Na/N = 5.0 * 10-
Qu independent failure E50babili ty of the eomponentQu (Na-N~)lN = 4.5 * 10Qe probabili ty of !~e oeeurrenee of a CCFQe NeiN = 5.0 * 10ß portion of the dependent failures (ß-Faetor)ß Ne/Na = Qe/Qt = 10%
Qlg - probability of the oeeurrenee of a Single-FailureQ1g Qu = 4. 5 * 10 - 3
Q2g - probability of th~ oceurrenee of a Double-Fail ureQ2g . Nc2/N = 1. 5 * 10-
Q39 - probability of thg occurrenee of a Triple-FailureQ3g Nc3/N = 5.0 * 10-
Q4g - probability of tÌ1~ oceurrenee of a Quadruple-FailureQ4g Nc4/N = 3.0 * 10-
It is necessary to investigate the following probabilities (P)for the eomplete modelling of all components in the fault tree(fig.2) .Therefore all components are assumed to have the same failuremode.
Q1Q1
Q2Q2
Q3Q3
Q4
P (XA) = P (XB) = P (Xc1 = P (XD)Q1g = Qu = 4.5 * 10
P(XAB) = P(XAC) = P(~~D) = P(XBC)1/3 * Q2g = 5.0 * 10
P (XABD) = P (X ACD) = ~~XBCD)1/3 * Q39 = 1.67 * 10
Q4g 3.0 * 10-4
P(XBD) P (XCD)
The following simplification will be used for the modelling bymeans of ß-Factor-Method (fig. 3) :All oceurring CCF' s lead directly to the failure of all foureomponents in each case:Therefore: Ne2 + Ne3 + Ne4 = Ne
or
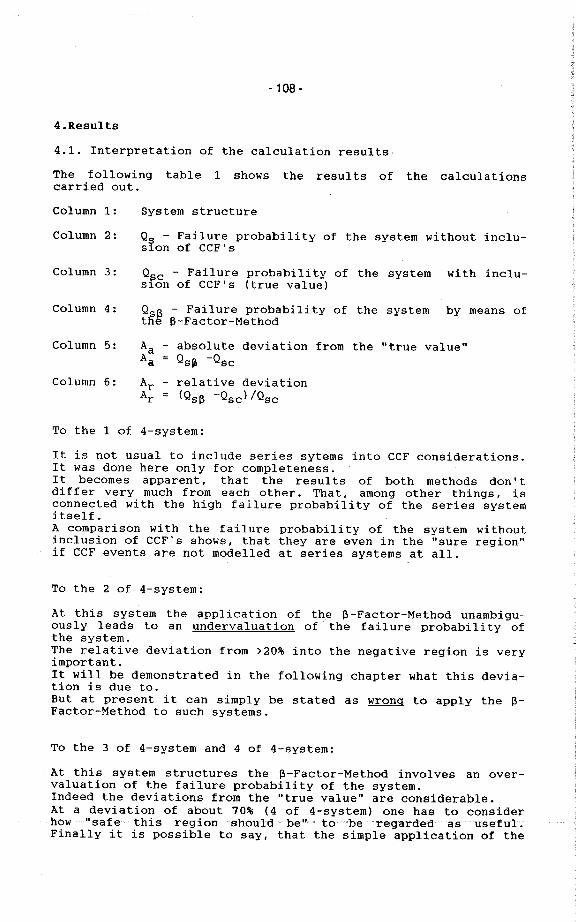
- 108-
4.Results
4. i. Interpretation of the ealculation resul tsThe following table i shows the resul ts of the ealculationscarried out.
Column i: System strueture
Column 2: Qs - Failure probability of the system without inclu-sion of CCF' s
Column 3: Qpc - Failure probability of the systemsion of CCF's (true value)
with inclu-
Column 4: Qßß - Failure probability of the systemthè ß-Faetor-Method
by means of
Column 5: Aa - absolute deviation from the "true value"Aa Qs~ -Qse
Ar - relative deviationAr (Qsß -Qse) IQse
Column 6:
To the i of 4-sys tem:
It is not usual to inelude series sytems into CCF considerations.It was done here only for eompleteness.It beeomes apparent, that the resul ts of both methods don' tdiffer very mueh from eaeh other. That, among other things, isconnected with the high failure probability of the series systemitself .A eomparison wi th the failure probability of the system wi thoutinelusion of CCF' s shows, that they are even in the "sure region"if CCF events are not modelled at series systems at all.
To the 2 of 4-system:
At this system the application of the ß-Factor-Method unambigu-ously leads to an undervaluation of the failure probability ofthe system.The relative deviation from )20% into the negative region is veryimportant.It will be demonstrated in the following ehapter what this devia-tion is due to.But at present i t can simply be stated as wrong to apply the ß-Faetor-Method to such systems.
To the 3 of 4-system and 4 of 4-system:
At this system struetures the ß-Factor-Method invol ves an over-valuation of the failure probability of the system.Indeed the deviations from the "true value" are eonsiderable.At a deviation of about 70% (4 of 4-system) one has to considerhow "safe this region should be"to "be 'regarded as useful;Finally i t is possible to say, that the simple applieation of the
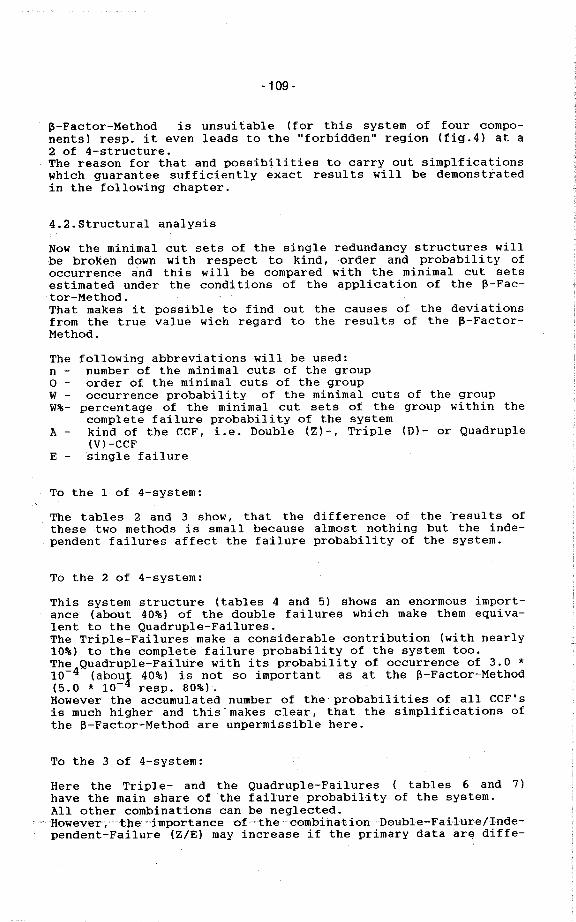
- 109-
ß-Factor-Method is unsui table (for this system of four compo-nents) resp. it even leads to the "forbidden" region (fig.4) at a2 of 4-structure.The reason for that and possibilities to carry out simplficationswhich guarantee sufficiently exact resul ts will be demonstratedin the fol lowing chapter.
4.2. Structural analysisNow the minimal cut sets of the single redundancy structures willbe broken down wi th respect to kind, order and probabili ty ofoccurrence ~nd this will be compared with the minimal cut setsestimated under the conditions of the application of the ß-Fac-tor-Method.That makes i t possible to find out the causes of the deviationsfrom the true value wich regard to the resul ts of the ß-Factor-Method.
The following abbreviations will be used:n - number of the minimal cuts of the groupo - order of the minimal cuts of the groupW - occurrence probability of the minimal cuts of the groupW%- percentage of the minimal cut sets of the group within the
complete failure probability of the systemA - kind of the CCF, i.e. Double (Z)-, Triple (D)- or Quadruple
(V) -CCFE - single failure
To the 1 of 4-system:
The tables 2 and 3 show, that the difference of the -resul ts ofthese two methods is small because almost nothing but the inde-pendent failures affect the failure probability of the system.
To the 2 of 4-system:
This system structure (tables 4 and 5) shows an enormous import-ance (about 40%) of the double failures which make them equiva-lent to the Quadruple-Failures.The Triple-Failures make a considerable contribution (with nearly10%) to the complete failure probability of the system too.The4Quadruple-Faiiure with its probability of occurrence of 3.0 *10- (abOU¡ 40%) is not so important as at the ß-Factor-Method(5.0 * 10- resp. 80%).However the accumulated number of the probabili ties of all CCF' sis much higher and this' makes clear, that the simplifications ofthe ß-Factor-Method are unpermissible here.
To the 3 of 4-system:
Here the Triple- and the Quadruple-Failures ( tables 6 and 7)have the main share of the failure probability of the system.All other combinations can be neglected.
."However;'Uleimportance...'of..the..'combination'Ðouble-Failurellnde-pendent-Failure (Z/E) may increase if the primary data are diffe-
- 110-
rent. The accumulated number of the CCF-Minimal-Cuts doesn"treach the value of the complete failure if the ß-Factor-Hethod isused.The permissibility of the overvaluation of the failure probabili-ty wich regard to the ß-Factor-Method can be discussed_
To the 4 of 4-system:
Regarding this "clear redundancy" (tables 8 and 9) only the CO-plete failure is important of course.The combination Triple-Pailure/lndependent-Pailure (DIE) may makea very small contribution if the primary data are different.The ß-Factor-Method leads to an enormous overvaluation of thefailure probability of the system because it assumes tbe probabi-li ty of occurrence of the complete failure wi th a much too highvalue.
The most important information of the tables 4-9 are sbown gra-phically in figure 5 again.
5. Further regards
5.1.The variation of the total failure probability
The former calculations were carried on only for certain syste~structures and certain data.Now i t is important to recognize whether the given statemien1lsrefer only to the calculated resul ts 01' are matters of principle_To appraise the influence of the data the primary data werevaried.Picture 6 shows the resul ts if the total failure probabllity 01'the components (Qt) increases to the tenfold (Qt=5*10- ) resp.decreases to one tenth (Qt=5*lO-4) of the former value.The percentage of the dependent failures remains .constant in eachcase.
At the relativly high failure probability of tbe components(Qt=5*10-2) the deviations 1T from the "true value" 01'. Uiieresults of the ß-Factor-Method decrease since the independentfailures 01' failure combinations increase inimportance.Strictly speaking, only the calculated importance of the indepen-dent failures increases, whereas the structural importance re-mains constant.The decrease of Qt has opposi te consequences of course.Here the difference between the resul ts of the ß-Factor-MetJiodand the"true value" increases since the importance of the inde-pendent failures goes down.
5.2. The variation of the share of the Common-Causes-Failures inthe total failure probability
Here the probabili ties of occurrence of the CCP' s remain con-stant.
..At..f.irs.t. . the ... value of.the independentfailure probabilitieswasincreased to the fi vefold. Thus the value of the total failuue
- 111 -
probability of the components also increases to Qt=2. 3*10-2.The percentage of the CCF' s decreases to ß = 2.2%.After that, the independent failure probability was r~duced toone fifth and this corresponds to ß=35.7% and Qt=1.4*10- . (fig.7)It could be expected that the increase of the CCF share of thefailure probability of the component (decrease of the independentpart) also causes the increase of the deviations of the resul tsof the two methods from each other, wereas the decrease of theCCF-percentage also decreases the deviations.But on principle the formerly given statements do not vary.
Another possibility to vary the dat.a is to vary the relationsbetween the single kinds of CCF' s (Q2' Q3' Q4). The resul t isforeseeable.The more the probabilities of occurrence of the Double- andTriple-Failures increase in relation to the Quadruple"(complete)-Failure the more the ß-Factor-Method will deviate fromreality.Vice versa the applicability of the ß-Factor-Method increases ifthe probability of occurrence of the Double- and Triple-Failuresis low in relation to the complete failure.
6.Proposal for a simplification concerning the CCF modelling
The realizations of chapter 4 and 5 offer possible simplificati-ons of the CCF-Modelling of k of n-systems.Thus only those kinds of CCF wich are important for the completefailure of the system have to be modelied.That means that only the CCF kinds from k to n occur as basicevents in the fault tree.This essential simplification of the fault tree is obviously(fig. 8 and 9).If the (k-l) -Failure has an unexpectedly high probabili ty ofoccurrence it will also have to be modelied.It forms minimal cuts of second order with the independentfailures.By multiplication of the occurrence probabili ti es of the (k-l)-Failure and the independent failure it is possible to appraisethe influence of this minimal cuts.
7. Conclusions
The resul ts of theß-Factor-Method ishigher redundancies.
calculations carried on have shown, that theunsui table for the modelling of CCF' s at
At redundancy structures in wich small CCF-Combinations occur asminimal cuts of first order, the ß-Factor-Method leads to anundervaluation of the failure probability of the system.
Redundancy structures of this kind resp. structures which due tosystem meshings and subsequent failure connections cannot be di-rectly recognized, should be treated with multiple parametermodels on principle.
Atthe . CCF=Mödellifig öfköfl1=Sytellsit is possibletomakesimplifications.
- 112-
Only those CCF kinds wich are important for the complete failureof the system have to be modelled.That means, that only the kinds of CCF reaching from k to n occuras basic events in the fault tree which leads to an essentialsimplification of the fault tree.
REFERENCES
1. A. MOSLEH, K.M. FLEMING, G.W. PARRY, H.M. PAULA, D.M. WORLED-GE, D .M. RASMUSON. "Procedures for Treating Common Cause Failuresin Safety and Reliability Studies", EPRI NP-5613, NUREG/CR-4780.Vol. 1, Electric Power Research Institute (1988).
2. N. McCORMICK, "Reliability and Risk Analysis", ACADEMIC PRESS(1981) .
3. K. REINSCHKE. 1. A. USAKOV. "Zuverlässigkeitsstrukturen" ,Verlag der Technik, Berlin (1987).
4. C. FUHRMANN, "Untersuchungen -zum Einfluß von Common CauseFehlern in PSA für WWER-440, Typ-213", Technische HochschuleZittau (1990).
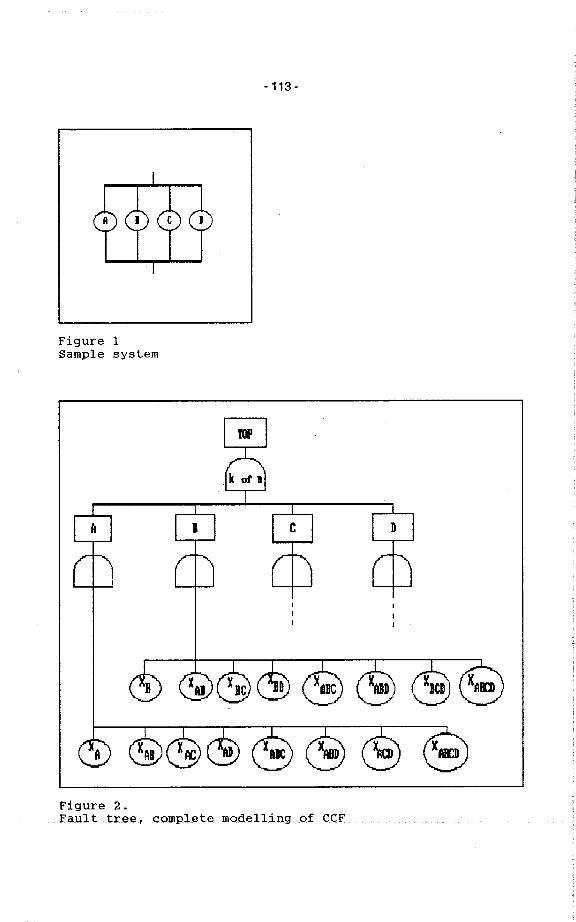
-113 -
Figure 1Sample system
Figure 2.. Faul t....tree, complete.modellingoLCCF
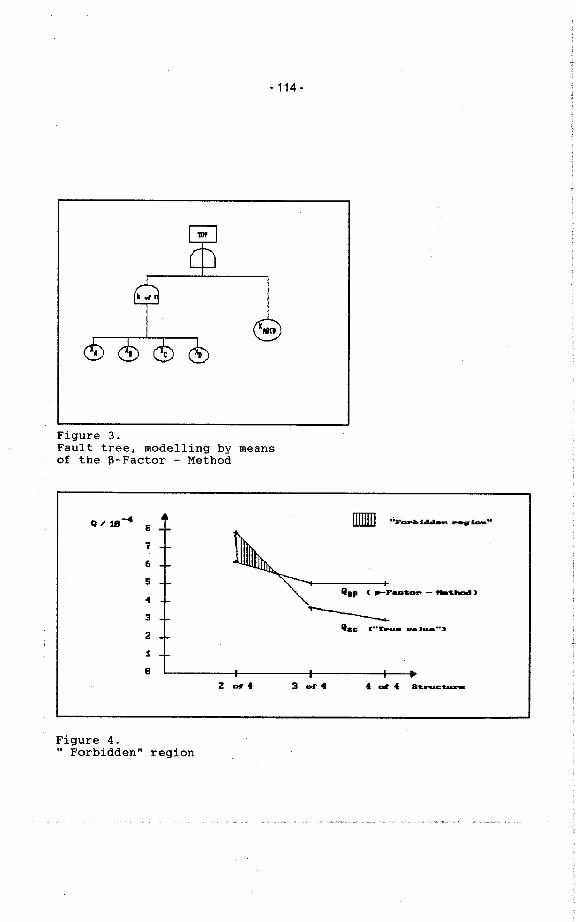
- 114-
Kn
Figure 3.Faul t tree, modelling by meansof the ß-Factor - Method
Q ~ 18-4 i:
?
6
5
..
:3
2
iEI
. ..Foz-bi...n ..l.on..
ll... (..F.cto.. - ..t_)
'I.e (..'Ipu. ua I.....'
Z _4 3 or" l 01 l St..ta
Figure 4." Forbidden" region
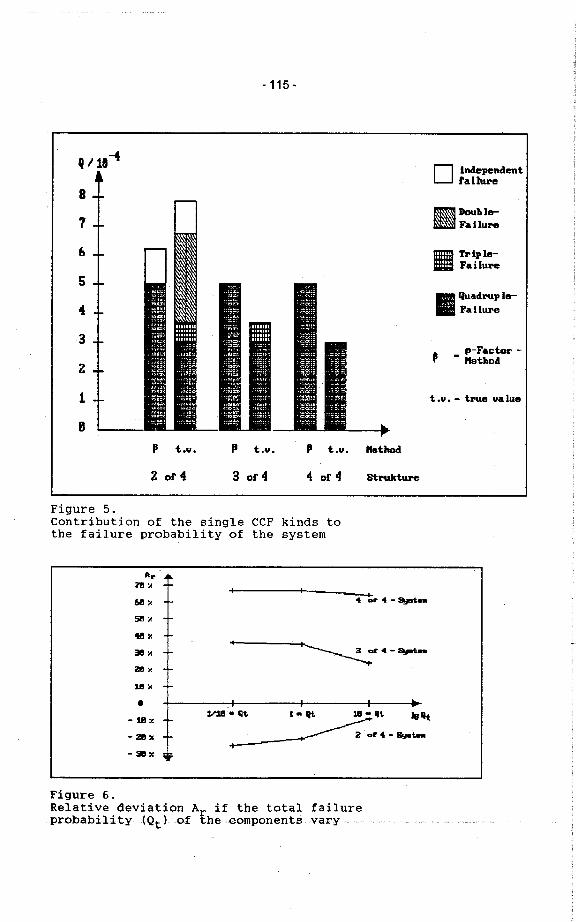
- 115-
q 1111-4
8
7
6
5
4
3
i1
B
ii t.v. 11 t.v. , t.v. "ethod
Z or 4 3 or 4 01 or 4 StrueFigure 5.Contribution of the single CCF kinds tothe failure probability of the system
D Indpendenttallure
mDoubJe-.F&ilul'
ii Triple-R F&Hure
.. Quadrup Je-
. Failure
, p-Factor- -- i.thod
t .11. - trul! VA lua
AI'11 :i
r. :i
5l:l4th
.. ~r .. - Sy..
~....-Sy3Il'2B :I
1.1'
.- 18 x
-31"
1018 . i¡t I. ll 18 · IIt Jill~1'4-8yi--31" 'if
Figure 6.Relative deviation A if the total failureprobability(Qt )of Ehe components vary
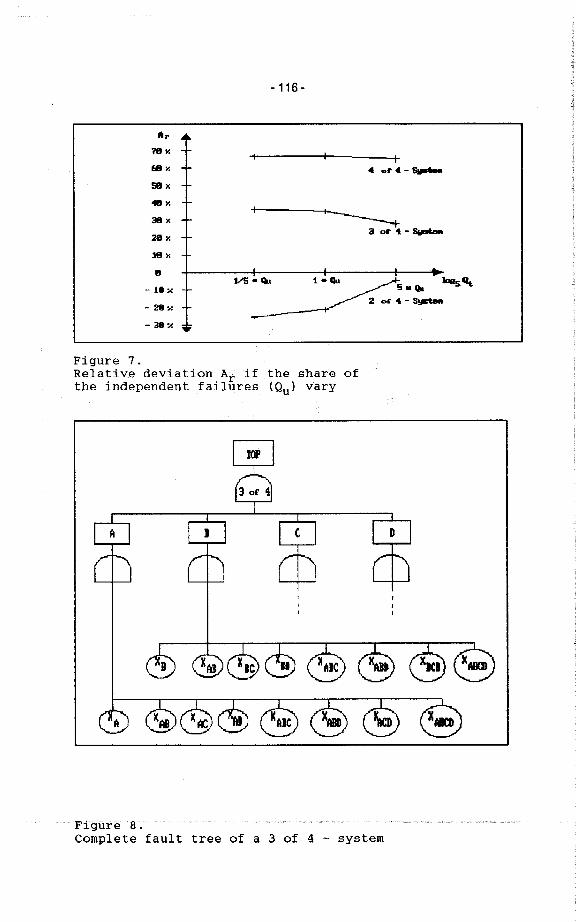
-116 -
Ar .18 y.
li "-
58 K
.. K
æ"28 K
38 y.
ø
- iex- 28y.
- 38 Y. ;;
I
4 04 4 - s.
~ 3 oF ,,- Sw
~VS~Cl i-CI kis"511 Qa
Z _ 4-S__
Figure 7.Relati ve deviation Ar if the share ofthe independent failures (Qu) vary
Complete fault tree of a 3 of 4 - system
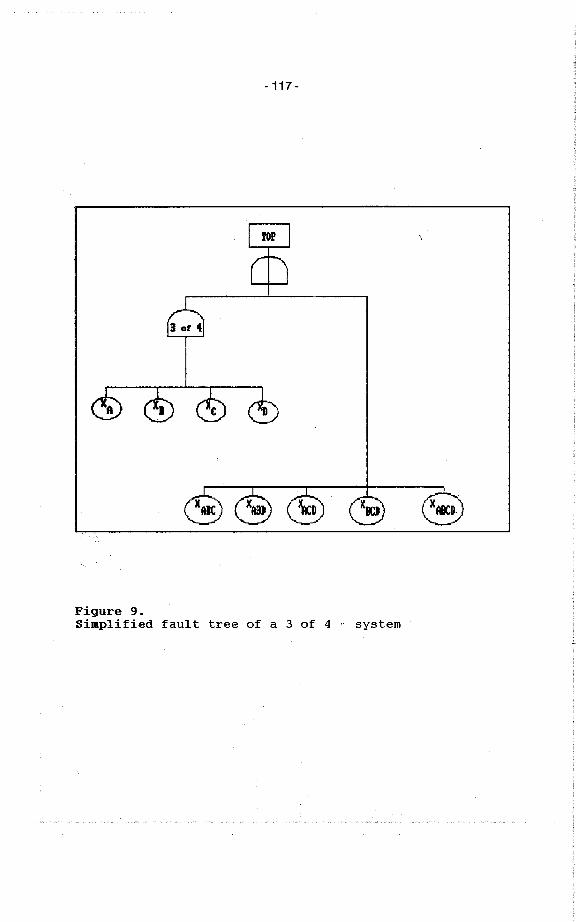
-117 -
ø
Figure 9.Simplified fault tree of a 3 of 4 - system
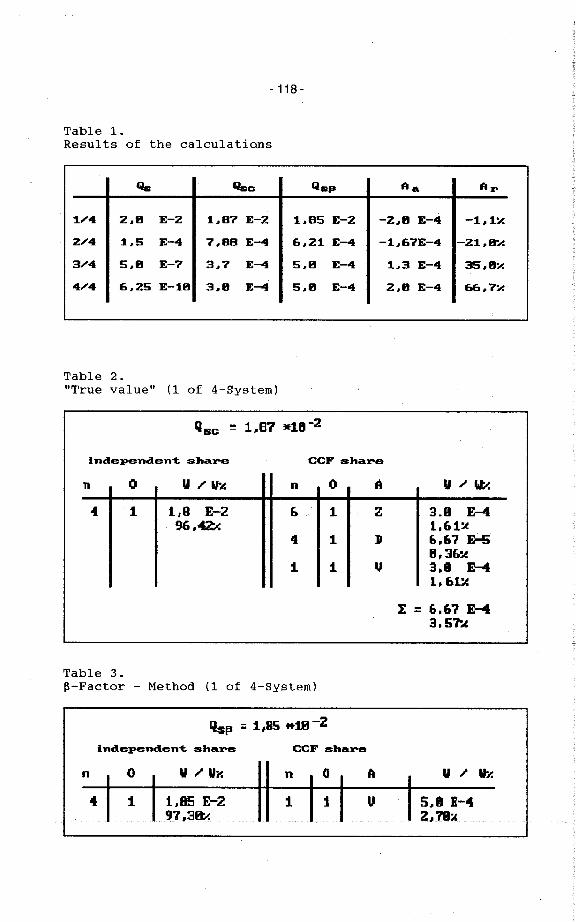
- 118-
Table 1.Resul ts of the calculatians
.. "C Qsp Aa Ar
1..4 2.8 E-2 1.87 E-2 1.85 E-2 -2.8 £-4 -1.1~2..4 1.5 E-4 7.88 E-4 6.21 E-4 -1.67£-4 -21.8".;3..4 5.8 E-7 3.7 E-4 5.8 £-4 1.3 E-4 35.8:.4..4 6.25 E-18 3.8 E-4 5.8 E-4 2.8 £-4 &6.7:.
Table 2."True value" (1 of 4-System)
Qsc ~ 1.B7 *18-2
independent s~are CCF s~are
n 0 U / UY. n 0 Å U " WO/.
4 1 1,9 E-2 b 1 Z 3.8 E-96,42 1.61~
4 1 :J &.67 E-8.362
1 1 V 3.1 ~1.61:(
I = 6.67 E-43.57::
Table 3.ß-Factor - Method (1 of 4-System)
QSfl ;; 1,85 *18-2independent s~a:r CCF s~a:r
n o nu .. Uj' o
1
A u ~ U"/.
4 1 1.85 E-297,38;
1 '" 5.8 1-4~,1Øll
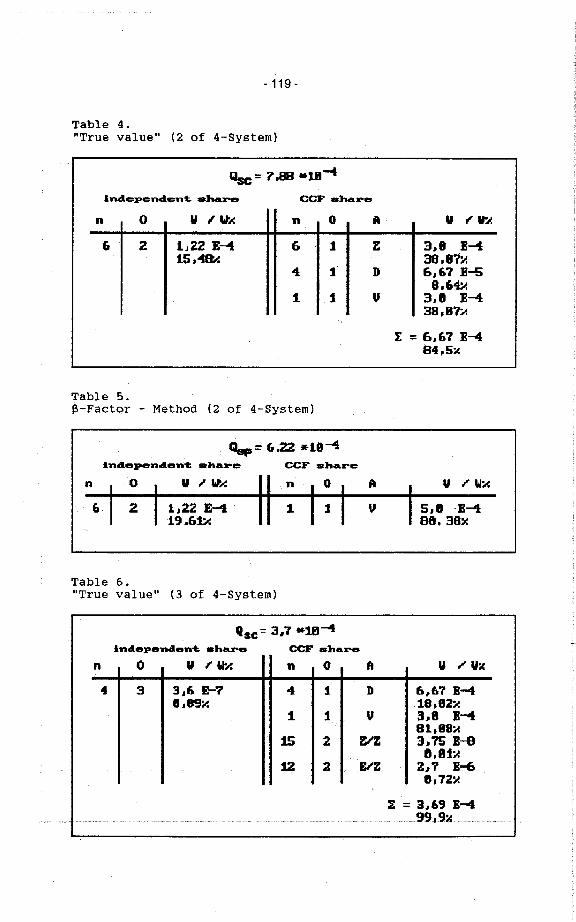
- 119-
Table 4."True value" (2 of 4-System)
-04"sc= 7.88 *18
Independent. _hare CCF .hare
n 0 U l' WO/. n 0 A U ~ u-..
(, 2 1,22 E-- £. 1 Z 3.8 1--15.1~ 38.87"..
4 1 D 6.67 1-58.604
1 1 .. 3.8 1-438,B7:;
I = 6.67 1-484,S",
Table 5.ß-Factor - Method (2 of 4-System)
~"" 6.22 *11-4Independent ehare CCF share
n o
2 5.8 -1--Be. 3B~
u "wo/. o
1
A
l)
n U J' Ux
(, 1,22 E-19~6:b
1
Table 6."True value" (3 of 4-System)
qsc= 3,7 ..18..InAependent. .ha%e CCF .:hare
n 0 " I' Wx n (l A U ; Ulo
4 3 3,6 E-? 4 1 D 6,67 1-41,89x 18.82:1
1 1 .. 3..8 B-IBl.B8;.
15 2 ~Z 3.75 B-Ðf).Ø1~
12 2 ElZ Z..7 B-68,72:1
:E "" 1-4
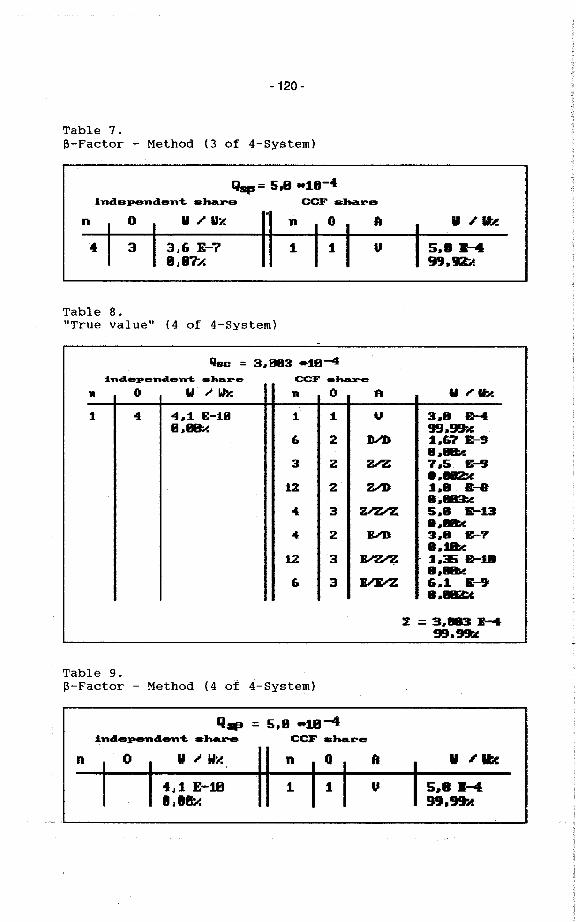
-120 -
Table 7.ß-Factor - Method (3 of 4-System)
~= 5,8 "10-4lndependen1; sha.re CCF shre
n o
::
.. ,. U#! n A
U
o
1
.. .I Ii4 3,6 E-?
B¡Ø7:;5.. .-49J,92
1
Table 8."True value" (4 of 4-System)
lIøc = 3,El3 _18-4lnclepend.en1; .hare CCF sha
. 0 U ;l ii n 0 Å U "'.
i 4 4,1. £-18 1 1. U 3.8 B-8.88:- 99.9!
(, 2 JV 1.67 £-91..BI3 2 3; 7.5 .,..~
1Z "2 z. 1.8 £-8..~4 :3 ~ 5.. &-13..øa4 2 IV 3.8 £-?..iø
12 3 ~ . i.31 ..m..~(, :; JV 6.1 E-...ØI
i: = 3.M3.-49I.9I
Table 9.ß-Factor - Method (4 of 4-System)
Q..independen1; _hare
= 5,8 *18-4CCF share
n o nu , W~ o
1
fl U i" ii
4¡1 E-1Ø1¡88~
1 u 5.. .-499,"",,
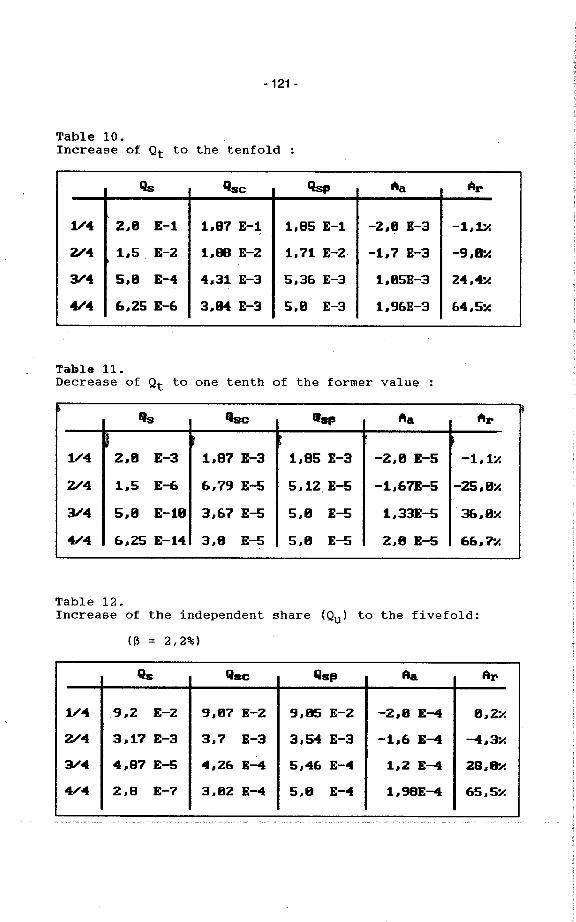
- 121 -
Table 10.Increase of Qt to the tenfold
Qs Qsc Qsp Áa Ar
1/4 288 E-l 1.87 £-1 1.85 £-1 -2.8 £-3 -1.1:2/4 1.5. E-2 1.88 £-2 1,71 £-2 -1.7 £-3 -9.8:.
3/4 5.8 E-4 4.31 £-3 5.36 £-3 1.85£-3 24.4:.
4/4 6,25 £-6 3.84 £-3 5.8 £-3 1,96£-3 64,5:.
Ta.le 11.Decrease of Qt to one tenth of the former value
fl IIc "slS Áa ÁI"
1,14 2.8 E-3 1.87 E-3 1,85 E-3 -288 E-5 -1.1:1
2/4 1.5 E-6 6.79 E-S 5,12 E-5 -1.61£-5 -25.8:1
314 5,8 £-18 3.67 £-5 5,8 E-5 1, 33E-5 36,8:1
4/4 &.25 E-14 3.8 E-5 5.8 E-5 2,8 E-5 6&.7:1
Table 12.Increase of the independent share (Qu) to the fivefold:
(ß 2,2%)
Qs Qac Qsl" Aa AI"
1/4 9,2 E-2 9.87 E-2 9,85 E-2 -2,8 E-4 8,2:1
2/4 3.17 E-3 3.7 E-3 3,54 E-3 -1.6 E-4 -4.3x3/4 4.87 E-5 4,2& E-4 5,46 E-4 1,2 E-4 2888:"
4/4 2,8 E-7 3.82 E-4 5,8 E-4 1,98E-4 65.5:;
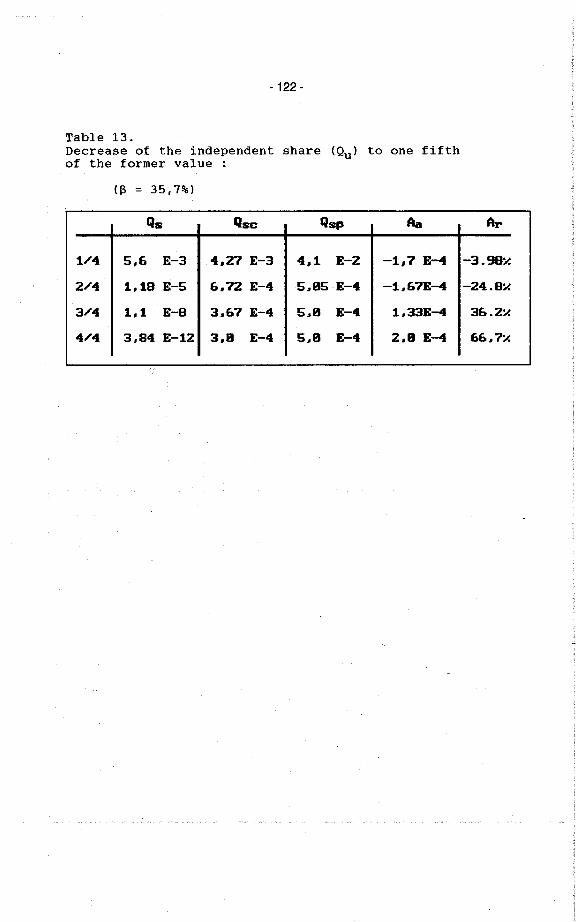
- 122-
Table 13.Decrease of the independent share (Qu) to one fifthof the former value
(13 = 35,7%)
Qs Qsc Qsp Aa Ar
1/4 5,6 E-3 4,27 E-3 4,1 E-2 -1,7 E-4 -3.98:1
2/4 1,18 E-5 6,72 E-4 5,85 E-4 -1, 67E-4 -24.8:1
3/4 1,1 E-8 3,&7 E-4 5,8 E-4 1,33E-4 36.2:1
4/4 3,84 E-12 3,8 E-4 5.8 E-4 2,8 E-4 66.7:1
- 123-
Session B-A:Ays ofDendncs
CSNI WORKHOP ON SPECI ISSUE OF LEl PSA
Cologn,Gcy 27th-29 May 1991
Evaluation Criteria of SafetySystem Unavaiabilities for
Nuc1ear Power Plants
Hide MUSingo ODA
Takhi SATOMaak MATSUMOTOSatoshi MI
(Iokyo Elcec Power Compay)(Htahi Engieeg CoLtd)(Iòshi Coon)(Htahi,L)(Htahi Engieeg Co.Lt)
AbstrNuclea power plants have ben intaed a numbe of saety systems to mak a saely
shutdown unde the postulated designg basis acdents. Such a kid of safety systemhas ben designed to ichieve a highly reliabity and to get a Iage icund. Even if amultiple faiur of safety systems taes plae in sae tie, the safety systems have a
possibilty to avoi a Iage cor daage acnt.Prabilstic saety assessments(pSAs) have ben develope as an analytca mçthod
to evaIuate the safety abilty of nuclear power plants, quantitatively. Also, theimprovement ites far plat safety would be presente dug the evauation prss.
From the level 1 PSA, in which core daage fruencies were evaluated, theimprovements bas on prevention approach were assessed But, the conclusions werehighly depende on the hyptheses on unavaiabilty evaluation of safety systems ar onthe relibilty of bas da
In this paper, the results of level 1 PSA peñoned in Japanese hoilng water retor(BWR) industr grup were presente And, the evaluation crtea and expenence dataof safety system unavaiabilties were assessed. Espeally, TB sequence, which wascause by the loss of,al AC power, was analyzed, beuse the TB sequence was highlydcpendc on the Japanse data
1.Results of BWR level 1 PSA in Japan
1.1 OutIe of tyical BWR plants
Figu-1 shows the companson of safety system confgutions ofBWR-3,. 4 and. S.
In Japan, four tys of BWR(BWR-2, -3, -4 and -5) ar opetig. And, two tyes
of pnar contanment vessel(Mark-I and -ll wer presente In the level 1 PSA,BWR.3 with Mark-I, BWR-4 with Mak-I and BWR-S with Mark-B wer selecte astyical BWR plants. Because, the ty of pnmar contaent vessel(pV) is lesseffect far the results of level 1 PSA, and the dcsigng of BWR.2 is aIost sae as thatofBWR-3.
Featu of tyica BWR plants ar dcscbe as foUows.
(1) BWR-3 platSafety systems of BWR-3 ar constrcted with two diesel generto(D/Gs) for
..... ..~emergericýpöwersüpplý;ã.türbiriedrverihigtipressuicötinjectiöñsýsfem(HCI);
- 124-
two motor drven cor spray systems(CSs) and two isolation condenser(lCs) for corecooling. Alo. two shutdown heat cooling sysiems(SHCs) and two contanment cooling
sysiems(CCs) ar intaed for deay heat removaL.
(2) BWR-4 platSafety sysiems of BWR-4 ar constrcted with two D/Os. an HPCI, two CSs. two
motor drven low prssur core injection systems(LPCIs. two pumps pe each system)and a tuine drven reactor ar isolation cooling sysiem(RCIC). Also. two residual heat
removal systems(RHRs) are instalied. The pumps of RHR and LPCI ar held incommon.
(3) BWR-5 plantSafety systems of BWR-S ar constrcted with thre 0/0. a motor drven high
pressure core spray system(HPCS). a motor drven low pressure core spraysystem(LS). th LPCI(one pump per each system) and a RCIC. Also. two RHsar instaed. The pump of RH and LPCI ar held in common.
1.2 Categorizing of accident se uences
A large number of accident sequences ar descrbed as a combination of initiatingevents and failurs of safety systems. But, these accident seuences ar categorize intosome tyical accdent seuences with same thennal-hydrulic trsient. Typical accident
seuences ar defined as follows. .
(l) TC sequence: Trasients or WCA with failur of reaevityconO'ol
(2) TB sequence: Trasients with loss of AC power supply(Station blackout)
(3) AE.SIE.S2E: LOCAs without make-up waterseuences (A:Large LOCA. SI:Intennedate LOA.
S2:Smal LOCA)(4) TQUV seuence: Transients with faiur of high and low
pressur core cooling systems
(5) TQUX seuence: Trasients with failures of high prssurcore cooling systems and depressurzationsystems
(6) lW sequence: Trasients or LOCAs with failur of deay heatremoval
1.3 Comparson between BWR-3. -4 and-5
Figure-2 shows the comparson of core daage fruencies of BWR-3. -4 and -5.
Co daage was defined over 1200 °c . due to the maltiailurs of saety systems.Core daage fruencies ofBWR-3. -4 and -5 were below i.oxio-6/r.y.
(r.y.:reactor year). From the comparson of fruencies among each accident seuences,the accident seuences caused by LOAs Wer dominant for BWR-3 plant Because anumber of cor cooling system in BWR-3 was less than that in BWR-S. While. theaccident seuences caused by trsients were dominant for BWR-4 and -5. BecauseBWR-4 and 5 had only two high pressure rore cooling systems, but BWR.3 had thee(anHPCI and two ICs).
The.coredamageJrequel'cies.J:!y:TC..AE....SlE,S~EangTQl1YscqlJçllces..\Veremainly depended on the safety system unavailabilties calculate with fault tre analysis.
-125 -
So, the result of abve scuenees should have some eonseatsm, beause eomponentfaiur rates applied for fault tr analysis were ba on the data frm genera industr.Tbe co daage fruencies frm TW an TQUX scuences wer maiy depende onthe human er or human crts. So, the resut of TW and TQUX scuences shouldhave some uneenty. Fmaly, the co daage frueneies frm TB seuenees wasmaiy depende on the data fr Iapanse" opg cxnce. Tb anua frueneyof offsite power loss, and failur rates of Dia and offsite power reovery weredetermined by the Iapanese data In foUowig setiOD, th reliabilty of offsite powerbas on Iapanse oprag expcenc woul bc discusse
2.Reliilty of otrsite powe in Iapa
2.1 Fetu oftwo physcay separte trsmission ii uip
Opting experienees of two physiealy separte trsmission line(over 187 kVnominal voltage) uip were analyze with the data frm sta of operate to 1987, due todefine the reliabilty of offsite power in Iapan. 163 of two physieally separtedttsmission lie uip had ocUJ unti11987. Fr this da, the fruency of twophysiealy separte trsmssion ii uip was obtacd to abut 7.3 Xio-2/100kmyea.
(1) Causes of trmission lie trpFigu-3 shows the acdent eauses of offsite power loss.Dominant eaus was thunderblt(82%of al). Alost of them was reove within
5 minutes. Because, the trsmission line uip causcd by thundelt was temporlyevent, and was reovere in a shon time. On the other hand, the two physicalyseparte trmission lie uip causcd by snowfal or tyhoon was in low fruency, butcontinued in a long tie.
(2) Topogrphy of trsmission line uip oceur.Figu-4 shows the topogrphies occur offsite power loss.Dominant topogrphy was mountas(77% of al). Almost of them was reovere
with in 10 minutes. In mountas, the trsmission lie trp cause by snowfall or
tyhoon was in low frueney, but was reuir long time to reover.
(3) Tune dependencyFigu-5 shows the fruencies of two physicaly separte trsmission line trp.In the eay tie of operation, about 1.0/100 km/yea of trsmission line uip was
occur But, decrase after 1962. Recently, the transmission line uip has beendecrascd to about 5X1o-2/100 kmyear, beause of the improvement to thunderbolt orthe applieation of rapid relosing system.
2.2 Reliabilty and reovery profie of offsite power in Iapan
(1) Defution of offsite power lossFigu-6 shows the power supplyig system of nuclea power plants.A loss of offsite power is defied as the event in which there is no way to supply the
power to safety system,except diesel generator. This is the event with the losses ofoffsite power and of prferr power.
The offsite power was lost by the faiur of extemal or intern al equipment, and thepreferrd power was avoided with the failure of swítchover to sta-up or auxilartrsfonner.
The frquency of offsite power loss defined above was 1.4X10⁻²/r.y. for BWR.There were 2 experiences of offsite power loss within 153.8 reactor year for BWR, Inthese...cases, .0/0 ..suppUed...powerJO.. i:mergenc:ybus~i:s,..and.theoffsiJe.....powerwiisreover with in 30 minutes, aetualy.
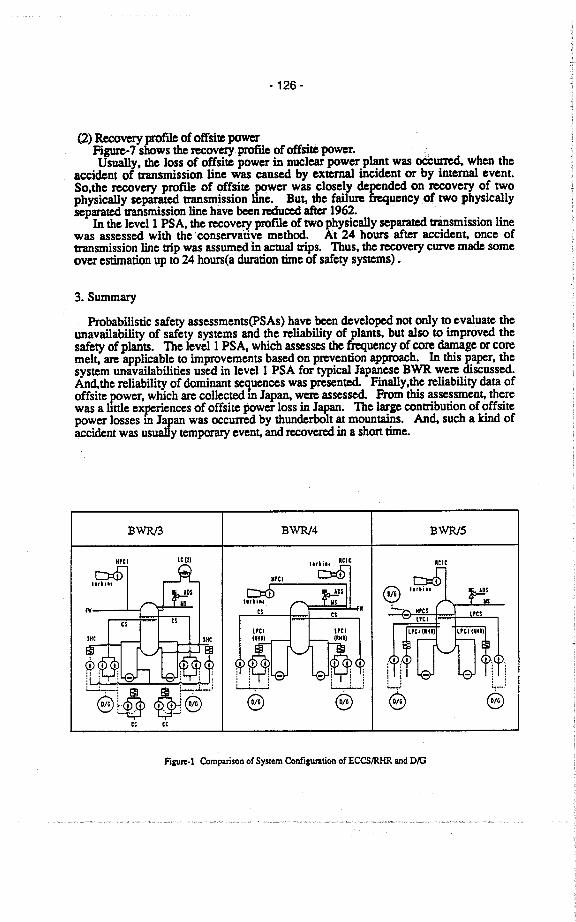
- 126-
(2) Reve prfùe of offsite poweFigu-7 shows the reovery prfie of offsite power.Usuay, the loss of offsite power in nuclea power plant was occi. when the
accident of trsmission line was caused by extema incident or by internal event.SO,the reover profie of offsite power was closely depended on reovery of twophysicaly separted trsmission lie. But, the faHme fruency oftwo physicallyseparte trsmssion lie have ben reuce af 1962.
In the level 1 PSA, the reovery profie of two physicay separte trsmission linewas assessed with the 'conservative method. At 24 hours after accident, once oftrsmission lie trp was assumed ìn aeal trps. Tbus, th revery cure Mad someover estiation up to 24 hour(a dution tie of safety systems) .
3. Summar
Prbabilstic safety assessments(pSAs) have ben develope not only to evaluate theunavaiabilty of safety systems and the reliabilty of plants, but also to improved thesafety of plats. Tbe level 1 PSA, which assesses the fruency of co daage or coremelt, ar applicable to improvements basd on prvention apprach. In ths paper, thesystem unavailabilties used in level 1 PSA fer tyical Japanese BWR were discussed.And,the reliabilty of dominant sequences was presente Finaly,the relibilty data of
offsite power, which ar collecte in Japan, were assesse From ths assessment, therewas a litte experiences of offsite power loss in Japan. Tbe lage c:ntrbution of offsitepower losses in Japan was ocuid by thunderbolt at mountas. Anti such a kind ofaccident was usualy tempor event, and reovere in a shon tie.
BWR BWR4 BWR5NPCI rcm ICC
111 ~...
i"
L~.~ ê ê i-.i. : ¡ .eLi...... '..1...8
cc cce 8 8 8
Figi-l Comparson or System Confguration or ECCSIR and DIG
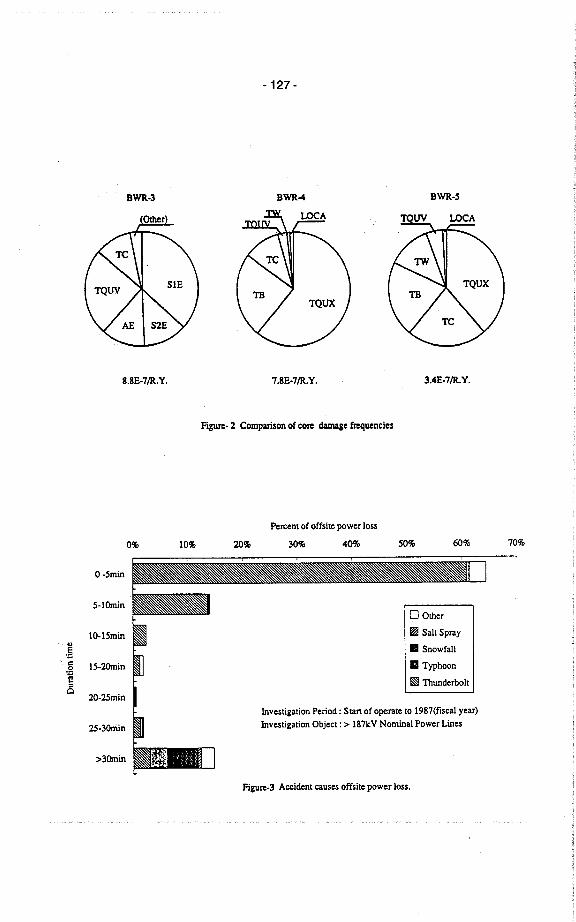
-127 -
BWR-3 BWR-4
0%
o -5min
5-IOmin
10-15min.,.§c 15-2Omin.2ë"c
2C-2Smin
2S-3Omin
::3Oi
8.8E-7/R.Y. 7.8E.7/R.Y.
Figi. 2 Comparson of COI' dage fruencies
Percnt of offsiie power loss
10% 20% 30%
BWR.5
3.4E-7/R.Y.
40% 50% 60%
o Other
~ SaltSpray
11 Snowfall
11 Typhoon
~ Thunderbolt
Investigation Period: Sian of operate to 1987(fiscal year)
Investigation Object : ;. 187kV Nominal Power Lines
Figi.3 Accident causes offsite power loss.
70%
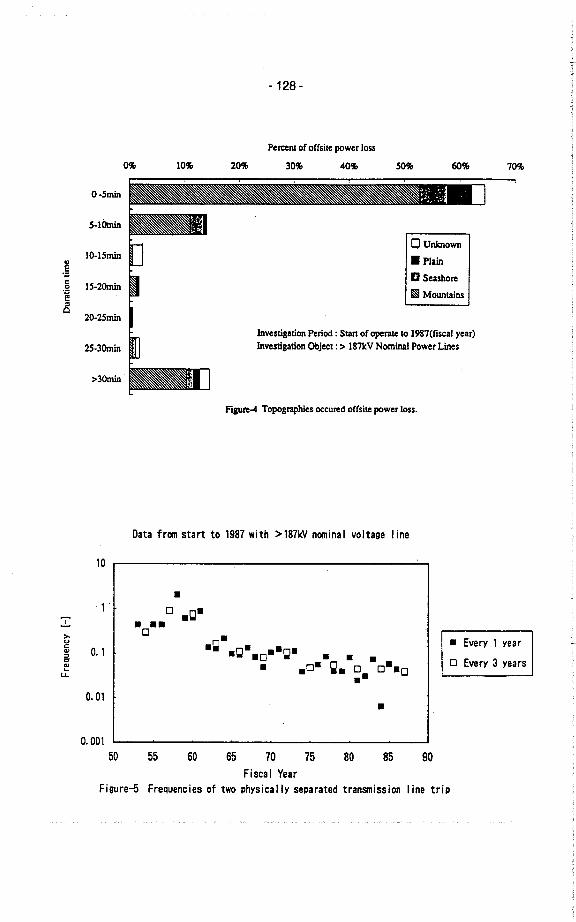
0%
o -Smi
S-lOl
10.lSmiIl.~c IS-2Om.9ë:i
Cl20.2Smi
2S.3Om
::3Om .
::)...i:
0.1Cl:ic-Eu.
0.01
0.001
50
- 128-
Percni of offsiie power loss
10% 20% 30% 40% SO% 6O 70%
(J Unlown. Plain
D Seashore
i§ Mountans
Investigation Period : Sta of oprate 10 1987(fiscal year)
Investigation Objeci : :: l87lcV Nominl Power Lines
Figu-4 Topographies occured offsite power loss.
Data from start to 1987 with ::187kV nominal voltage I ine
10
. Every 1 year
o Every 3 years
85 90
.o .~.. ..
o ..~ .n- .-n_..0. - - .
- _0- ~_ O. O._Q-
Fiseal Year
Figure-5 Frequeneies of two physieally separated transmission I ine trip
.
55 60 65 70 75 80
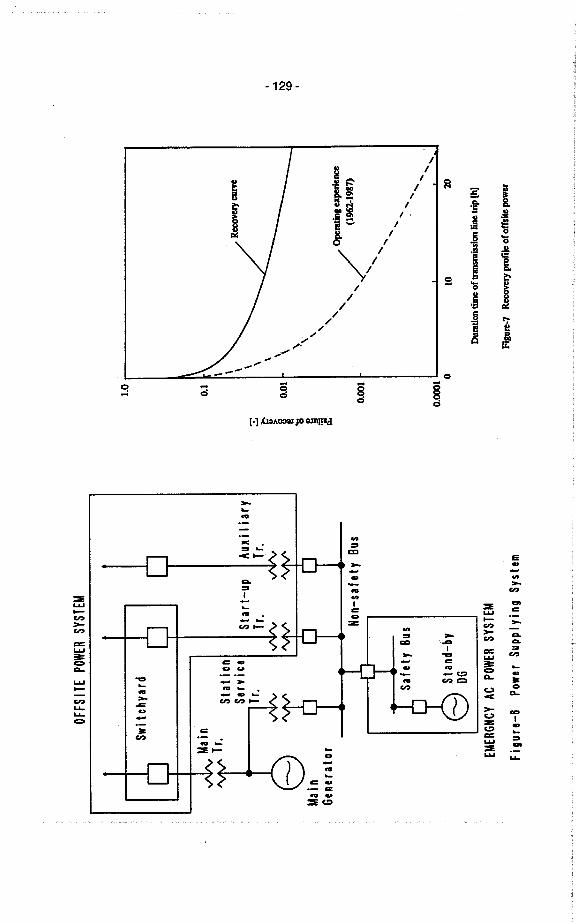
OF
FS
I T
E P
OW
ER
SY
ST
EM
Swi tchyard
Aux
iliar
yT
r.
EMERGNCY AC POWER SYSTEM
Figure-6 Power Supplying System
1.0
0.1
.. I\ co
::
\ \ \ \ \ \ \ "\ "' , ,
, , .
" / Opratill experl
'.. . (1962-1987)
....
...., ,
, ,..
.., ..
..
I 'C ~ ~.
0.01
0.00
1
0.00
1o
1020
Dui
ion
ti of
trm
isio
n lin
e tr
(hl
Fig
u.7
Rev
eiy
prof
ile o
f offs
iie p
ower
-130 -
SIEMENS
OECD/BMU - Workshop
Special Issues of Level 1 PSA
Cologne, FRG
27th - 29th May 1991
PSA Convoy
Influence and Modellng of Common Cause Failures
A.Feigel,J.WenzelSiemens AG,KWU
ErlangenFRG
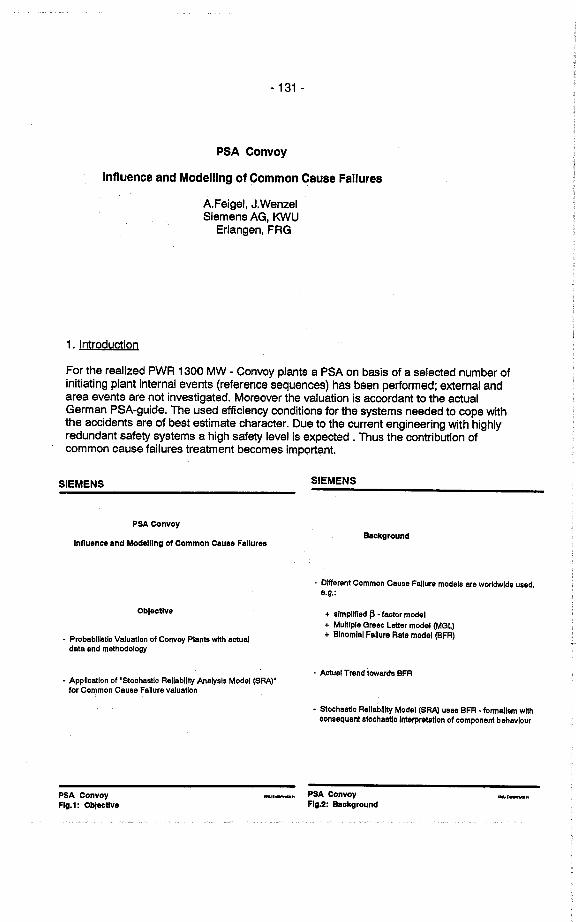
- 131 -
PSA Convoy
Influence and Modellng of Common Cause Fallures
AFeigel, J.Wenzel
Siemens AG, KWUErlangen, FRG
1. Introduetion
For the realized PWR 1300 MW - Convoy plants a PSA on basis of a seleeted number ofinitiating plant internal events (reference sequences) has been performed; external andarea events are not investigated. Moreover the valuation is accordant to the actualGerman PSA-guide. The used efciency conditions for the systems needed to cope withthe accidents are of best estimate character. Due to the current engineering with highlyredundant safety systems a high safet level is expeeted . Thus the contribution ofcommon cause failures treatment becomes important.
SIEMENS
PSA Convoy
Infuence end Modellng of Common Cluse Fallures
Oblectlve
. Probablllslic Valuatlon of Convoy Plants w~h aetualdata and mathodology
. Appllcatlon of 'Slochastlc RelIabIlIt Analysis Model (SAA)'for Common Cause Fallure valuallon
PSA ConvoyFlg.1: Oblecllve
SIEMENS
Background
. Diferent Common Cause Fallure models are worldwlde used,e.g.:
+ slmpllfed ß . factor model+ Mu~lple Graec leter model (MGL)
+ BInomlai Fallure Rate model (BFR)
- Actual Trend lowards BFR
. Slechastlc Rallabilit Model (SAA uses BFR . formallsm wltconsequent slochasllc Interpretation of component behavlour
PSA ConvoyFlg.2: Background
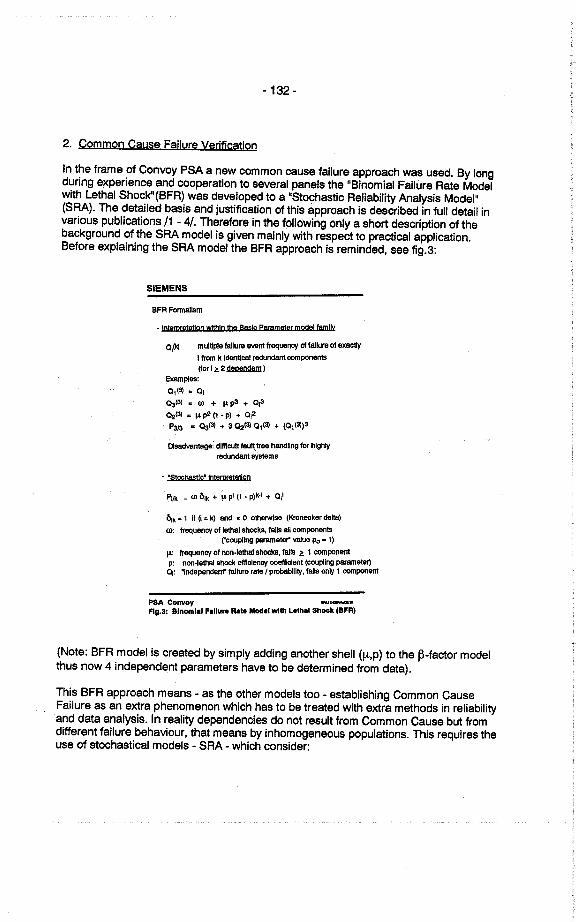
-132 -
2. Gommon Gause Fajlure Verificatjon
In the frame of Gonvoy PSA a new common cause fajlure approach was used. By longduring experience end cooperation to several panels the "Binomial Fajlure Rate Modelwith Lethai Shock"(BFR) was developed to a "Stochastic Reliabilty Analysis Model"(SRA). The detailed basis and justification of this approach is described in full detail invarious publications /1 - 4/. Therefore in the foiiowing only a short description of thebackground of the SRA model is given mainly with respect to practical application.Before explaining the SRA model the BFR approach is reminded, see fig.3:
SIEMENS
BFR FonnBllsm
. lntmreUoo wlbln tbe BM!Ç ppmmB1er modl famlly
0i(k mul~ple fsllure ewnt fTeque 01 fallure 01 exctlI frm k Idenca reund copona(for I.. 2 ii)
Exples:01(3) .0103(3) . II + 1'p3 .. 013
0:(3) . I' p2 (1 - p) + 012P313 . 03(3) + 3 0:(3) 01(3) .. (01(3))3
OI98dv: dlfcun faun.tree haling for hlghlyredundan systems
- .Stotic- ImBrpet00
Pi/ _ II ÔIK .. I' pi (I - p)K-1 .. Oil
ÔIK . 1 JI ø . k) and . 0 otterwls (Kronecker dell)ll: fruency of IeBl shoks, falls Bli componl
rcoulng paametr" vaue Po . 1)
1': fTeqency of non-ieial sho, falls .. 1 coponenp: non~eth shock efency coenl (coupllng paetr)
O¡: 'Indepenl fallure rale I prollt, fals only 1 copo
PSA Convoy IIfiI~F1g.3: BInomlai F.llu.. Ral. Modal w1th Lelh.1 Shock (BFR)
(Note: BFR model is created by simply adding another shell (I-,p) to the ß-factor modelthus now 4 independent parameters have to be determined from data).
This BFR approach means - as the other models too - establishing Gommon Gau seFailure as an extra phenomenon which has to be treated with extra methods in reliabilityand data analysis. In reality dependencies do not result from Common Cause but tromdifferent fajlure behaviour, that means by inhomogeneous populations. This requires theuse of stochastical models - SRA - which consider:
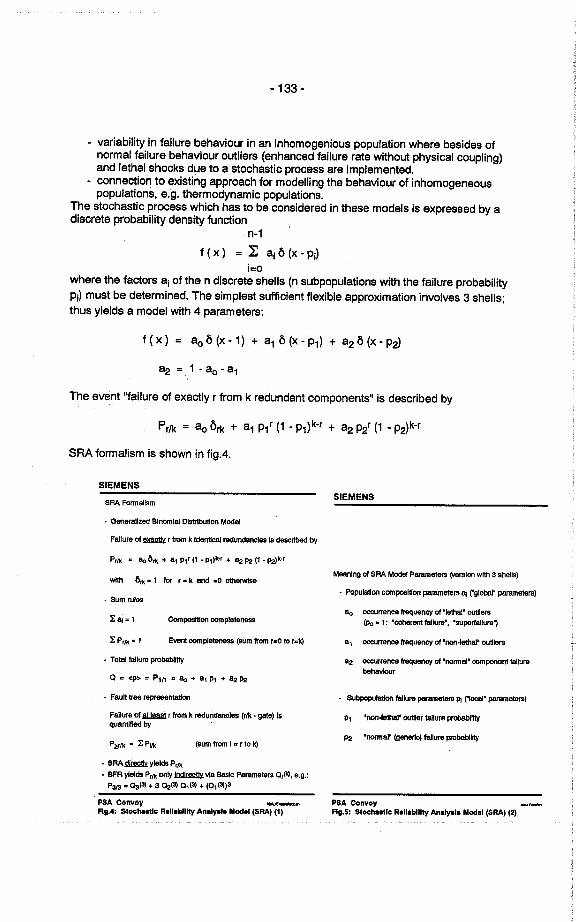
- 133-
- variability in failure behaviour in an inhomogenious population where besides ofnormal failure behaviour outliers (enhanced failure rate without physical coupling)and lethai shocks due to a stochastic process are implemented.
- connection to existing approach for modellng the behaviour of inhomogeneouspopulations, e.g. thermodynamic populations.
The stochastic process which has to be considered in these models is expressed by adiscrete probabilty density function
n-1
f ( x) = 1: ai Ô (x - Pi)
i=owhere the factors Si of the n discrete shells (n subpopulations with the fsilure probability
Pi) must be determined. The simplest sufcient flexible approximation involves 3 shells;thus yields s model with 4 parameters:
a2 = 1 - ao. a1
f (x) = So Ô (x - 1) + a1 Ô (x - Pi) + a2 Ô (x - pi)
The event "failure of exactly r from k redundant components" is described by
SRA formalism is shown in figA.
Pr/k = ao Ôrk + ai Pir (1 - Pi)k-r + a2 P2r (1 - P2)k-r
SIEMENS
SRA FormaIlsm
. Generalzed BInomlaI OIbuon Modl
Fallure cf ~ r fi k Iden1ca rednd is desrlbe by
Pr/k . "0 Ôi1 + 81 Pir (1 . pdk.r + "" P2 (1 . P2k-r
wt Ôi1' 1 lor r. k end .0 otlse
- Sum rules
1:aj'l CopolIon copletnes
1:Pr/k'l E\I coplet (sum fi r-o 10 r.k)
. Tolalallure prball1
o = cp~ . PI/1 = 80 + 81 Pl + 82 P2
. F8U~ tree repraoenon
Fallure cf ii r fi k raundenes (rlk . gae) Isquan by
P"r/k . 1: Pi/ (sum !rom 1= rlO k)
. SRA~yleIdPr/k
. BFR ylelds Pr/k only ~ li Baic Paretrs 0r(I, e.g.:
Pm = 03(3) + 3 0:(3) 01 (3) + (01 (3))3
PSA Convoy _f_~Flg.4: Slocheotlc Riiiiblilt An.lyl. Modil (SRA) (1)
SIEMENS
Mealng cf SRA Moel Pareter (vrsion wlt 3 shells)
. PoplaUon compoilIon paetrs a¡ ('globa' paameters)
80 ocrrnc lruecy cf 'Iethel oulersÚ' . 1: 'core lalure' . 'superlallure')
81 ocrr !reque cf 'no-lal' oulers
82 ocrrenc lrue cf 'normal' copoent lalureberSubpla lalure paet PI ("Io' paetrs)
Pi 'no-l' ouler lalure prolll1
P2 'naal' (generl) lalure pilll1
PSA ConvoyFlg.5: Sloche.llc Riii.b111t Analyi. Modil (SRA) (2)
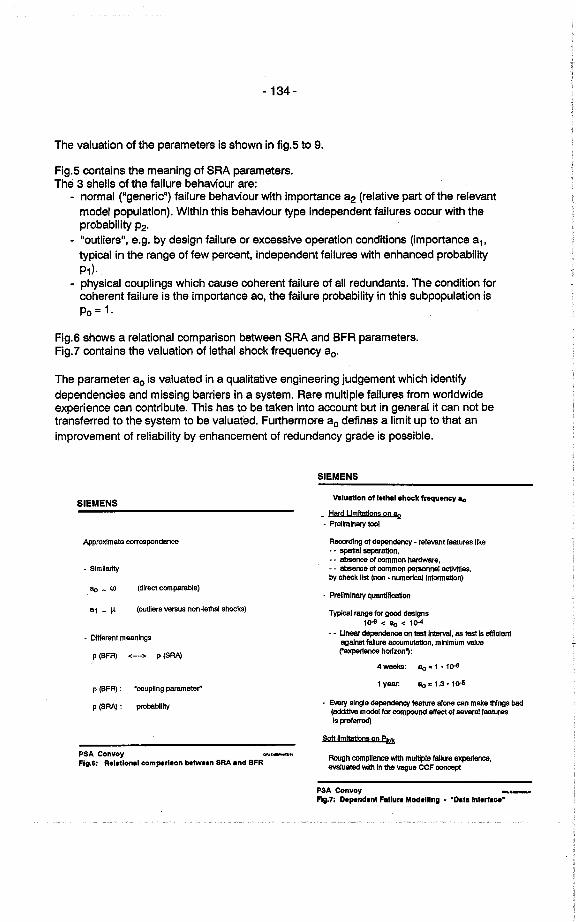
-134 -
The valuation of the parameters is shown in fig.5 to 9.
Fig.5 contains the meaning of SRA parameters.The 3 shells of the failure behaviour are:
normal ("generic") failure behaviour with importance a2 (relative part of the relevantmodel population). Within this behaviour type independent failures occur with theprobabilty P2'
"outliers", e.g. by design failure or excessive operation conditions (importance a1.
typical in the range of few percent, independent failures with enhanced probabiltyP1)'physical couplings which cause coherent failure of all redundants. The condition forcoherent failure is the importance ao, the failure probabilty in this subpopulation isPo = 1.
Fig.6 shows a relational comparison between SRA and BFR parameters.Fig.7 contains the valuation of lethaI shock frequency ao'
The parameter ao is valuated in a qualitative engineering judgement which identifydependencies and missing barriers in a system. Rare multiple failures from worldwideexperience can contribute. This has to be taken into account but in general it can not betransferred to the system to be valuated. Furthermore ao defines a limit up to that animprovement of reliabilty by enhancement of redundancy grade is possible.
SIEMENS
SIEMENSValuallon of leIhai ahock frequency 11
_ Hard Umlts on Q¡
- Prellmlna to
Rerdlng 01 dependency , relevI feeures IIke- - spaal sepa81on.. - eb 01 comon hae,. - abence 01 common peninel aC1ties,by chk IIst (no - numerI Infor81on)
- Prellmlnaiy quenflcaon
Typl ran ler go designs
1() c 11 c 10-
.. Unear depeanc on taiimer, es le is elclentagalns lalure acmula, minimum vaue("exp~en hoizon'):
4 weks: "0.1' 1()
1 yaa "0.1.3. 1()
Approxlmata correspondance
. Slmliar
"0 _ Ol (dlrec compaable)
a, - '" (outlers versus non4ethal shocks)
- Diferent meanlngs
P (BFR) c---' P (SRA
P (BFR) : 'coupllng paameter"
p (SRA : prbaIlIt. Eveiy single dend fere BIen ca make things ba(addlU model fo copond eIec 01 sealleturesIs pralered
So IImltQns on Pi
PSA ConvoyFlg.6: Relellonal comperleon belWeen SRA and BFR
Rogh coplla wl multple lalure exprt.evuated wl In th vaue CCF cocept
PSA ConvoyFlg.7: Dopendent Fallu," Mocellng . .Data Inlerfce"
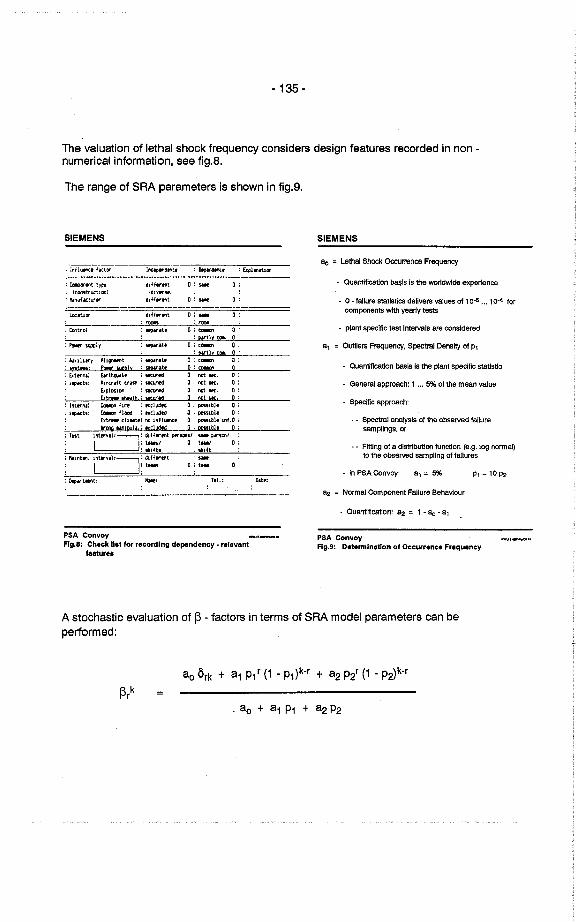
- 135 -
The valuation of lethai shock frequency considers design features recorded in non -numerical information, see fig.8.
The range of SRA parameters is shown in fig.9.
SIEMENS
: ;nlluee flCtor : !ndf\tfllf(C' : Dltn. ; úpil1.hon
: toO't t)~t; lCO'structionl:..niibcturfl
0: $M 0:: diHlItntlllivø'Y; 0:.. ~ :: dlHf"tnt
._-----_..._- ..
:C¡trol
:IiIUIf,.l; rOO: SlV.tl
0:0: WM: Lo.tion:rpoO:ci- 0:
: pytly ce.. 0:0:(01 0::wtltCQI.O:A¡i~t : MØ.r.tl 0 : Ci. :I :
PC wpiY : Mpilt. 0 : Ce- 0 :Elthlli.' : IilIed 0 : no st. 0 ;Aircr.ft cr'll' ; MCurld 0: not 1t. 0 :Eip1OSIOt : SI.a 0 : ni wc. 0 :ütr..llth.: lfur!! 0: not.. 0:
: ¡nlernd eo fir, : IJtlud 0 ; pO'llbl' 0:; iiiictl: cc f100 : llclud 0 : poiiibl. 0:
Extr..cli..t.:noinfllll O:posibl.inf.O:armg iinipul..; flc1ud 0 : DOiibl. 0:
: Tut Int"'...I:--: diU.,tnl p.wlii: u. PMSCI :l~::~ o~~~~ 0:
:lilntl!.lnttryli:~:dillfllIt :s.~ I ~:tNM o:t... 0:: Di.,t-et: /i: T.1.:
:_""1' : lI.t.: t.uluryl.~::ú:tern.1; 1~.ct!5:
Dit,:
PSA ConvoyFlg.8: Check lIet tor recordlng dependency. relevant
feature.
SIEMENS
"0 . l.al Shock Ocurrnce Frequency
- Quanfication bals is the wo~dwde expertence
- 0 - tallure sttistcs dellvers vaues ot 10" ... 1 Q- torcompoents wlt yee~y test
. plant spelfc testlnters ere consldered
e, . Outlers Freuency, Speti Denslt 01 p,
- Quantlcation bals Is the plant speclfc statistic
- General approch: 1 ,.. 5% 01 the meen value
. Speffc approach:
- - Speal analsis cf the observ failuresam pllngs, or
- - Fitng of a dlstrbuton tuneton (e.g. log normal)to the observd sapllng of fallures
- In PSA Convoy: a, . 5% p, .10P2
a2 = Normal Component Fallure Behevlour
. Quantification: a2 . 1 - "0 - 8,
PSA ConvoyFig.9: Determlnatfon 01 Ocçurrence Frequency
A stochastic evaluation of ß - factors in terms of SRA model parameters can beperformed:
ßrk
ao Ôrk + a1 P1r (1 - P1)k-r + a2 P2r (1 . Pvk.r
. ao + a1 P1 + a2 P2
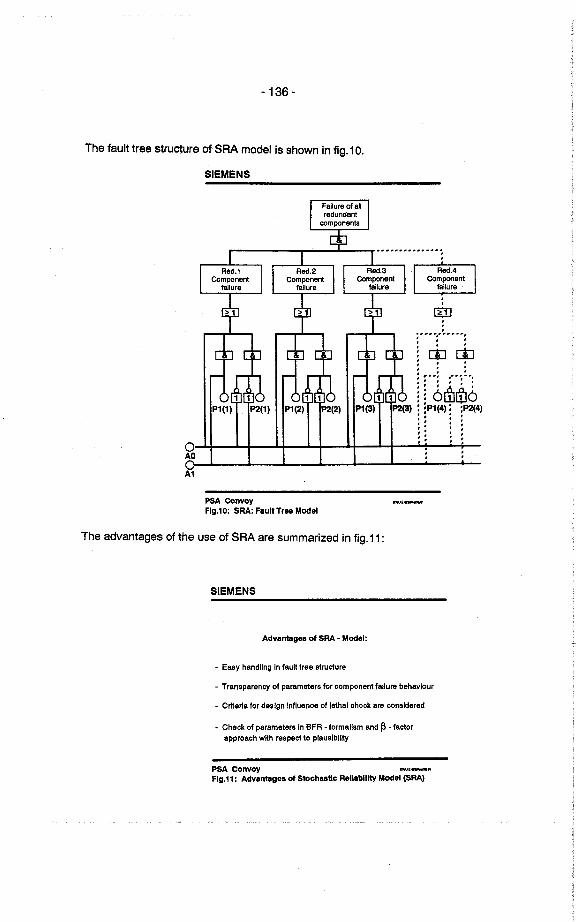
-136 -
The fault tree structure of SRA model is shown in fig.1 O.
SIEMENS
1
P2(2)
.
.
iu..;,.".,......,
¡ dJ eb. . .: : :
1 ¡r6~~6P2(3) : :P1(4): :P2(4)'. .'. .'. .'. .'. .. .o
AO
A1
PSA ConvoyFlg.10: SRA: FaultTree Model
The advantages of the useof SRA are summarized in fig.11 :
SIEMENS
Advantges of SAA . Model:
. Easy handling In fau" Iree slructure
. Transparency of parameters for componenl fallure behavlour
. Crlerla for design Influence of lethai shock ara consldered
. Check of parameIers In BFR . formallsm and ß . factorapproach w"h respect 10 plauslblilt
PSA ConvoyFlg.11: Advantages cf S10chaatlc Rallabllit Model (SAA)
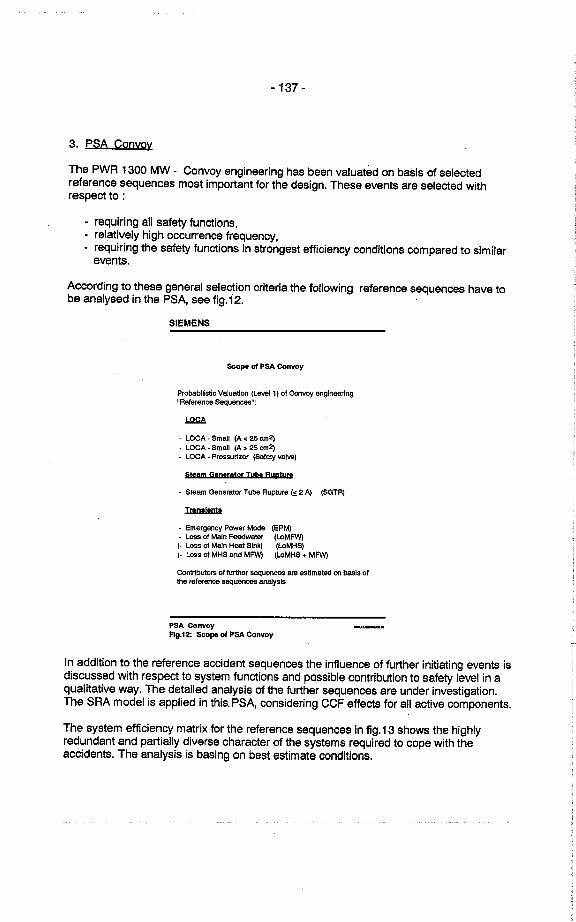
- 137-
3. PSA Conyoy
The PWR 1300 MW - Convoy engineering has been valuated on basis of selectedreference sequences most important for the design. These events are selected withrespeetto:
- requiring all safety funetions,
- relatively high occurrence frequency,- requiring the safety funetions in strongest efficiency conditions compared to similar
events.
According to these general seleetion criteria the following reference sequences have tobe analysed in the PSA, see fig.12.
SIEMENS
SCope ol PSA Convoy
Probabllstc Valuation (Level 1 ) 01 Convoy englneerlng"Aeference 8euencesM:
im- LOCA - Small (A ~ 25 cm2J- LOCA - Small (A. 25 cm2J- LOCA - Presurlzer (SBlat va)
St,om G'Dlrotor Tu" Ryptur,
- Sleam Generaor Tube Rupture (, 2 ~ (SGTR)Iw- Emergency Powr Mode (EPM)- Los of Maln Feewar (LoMFW(- Las of Maln Hea Sink) (LoMHS)(- Loss 01 MHS end MFW (LoMHS + MFW
Contrbutors 01 furter seuences ar estimated on bais of1he reference sequence analsis
PSA ConvoyFig.12: Scope ol PSA Convoy
In addition to the reference accident sequences the influence of further initiating events isdiscussed with respeet to system funetions and possible contribution to safety level in aqualitative way. The detailed analysis of the further sequences are under investigation.The SRA model is applied in this. PSA, considering CCF effeets for all active components.
The system effciency matrix for the reference sequences in fig.13 shows the highlyredundant and partially diverse charaeter of the systems required to cope with theaccidents. The analysis is basing on best estimate conditions.
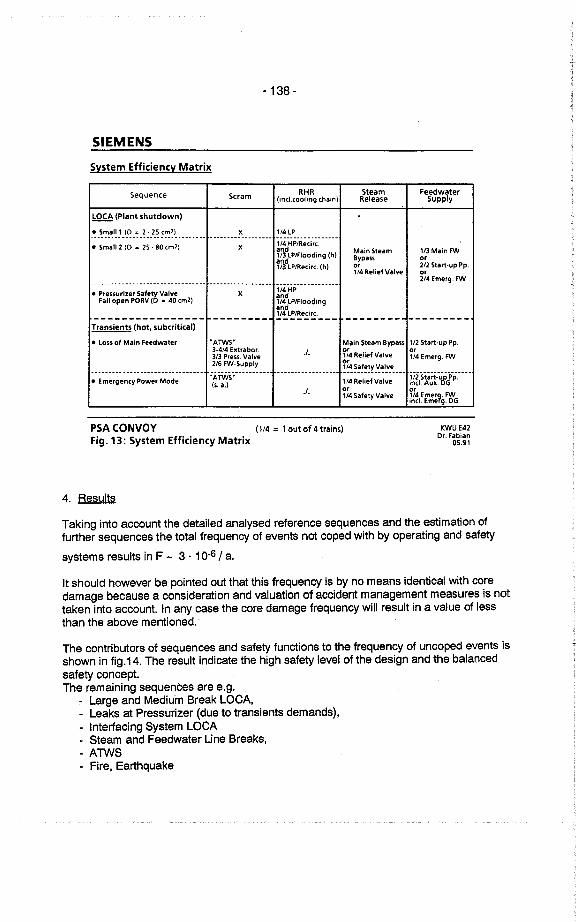
- 138-
SIEMENS
System Efficiency Matrix
Sequence Scram RHR Steam Feedwater. (ind.cooling chain) Release Supply
~ (Plant shutdown)
_~ .~'!_~I! J _ (~_:: _~: _2_~ ~~~)_ _ ___ _ _ __ X 1/4 LP------------------ ------------------. Small2 (0 = 2S. 80 em2J X
1/4 HP/Redr"and MainSteam 1/3 Main FW1/3 LP/FJooding (h) Bypass orand113 lP/Reeirc. (h) or 212 Start.up Pp.
1/4 Relief Valve or---.----------------------------- ------------------ ------------------ 2/4 Emerg. FW
. Pressurizer Safety Valve X1/4HPand
Fa¡1 open PORV CO = 40 cm2) 114 LPlFloodingand--- - --------- --- -------- '14 lPlRecirc.--------- -------- ---------
Transients (hot, subcritical)
. lOSS 01 Mai" Feedwater .ATWS. Main Steam Bypass 112 Start.up Pp.3.4/4 Extrabor. J. or or3/3 Press. Valve 1/4 Relief Valve 114 Emerg. FW2/6 FW.Supply or
---------_._--------------------"ÃTWS-.---------.
------------------ ~~'!~~!!~~_~~~v:____
~~i~~~fifl-p.----. Emergeney Power Mode(s. a.)
1/4 Relief Valve
.I. or or1/4 Safety Valve 1/4 Emerg. FW
¡ncL Emerg. DG
PSA CONVOY (1/4 = 1 out of 4 trains)Fig. 13: System Efficiency Matrix
KWU E42Dr. Fabian
05.91
4. Results
Taking into account the detailed analysed reference sequences and the estimation offurther sequences the total frequency of events not coped with by operating and safety
systems results in F - 3. 1 0-6 / a.
It should however be pointed out that this frequency is by no means identical with coredamage because a consideration and valuation of accident management measures is nottaken into account. In any case the core damage frequency wil result in a value of lessthan the above mentioned.
The contributors of sequences and safety functions to the frequency of uncoped events isshown in fig.14. The result indicate the high safety level of the design and the balancedsafety concept.The remaining sequences are e.g.
- Large and Medium Break LOCA,- Leaks at Pressurizer (due to transients demands),- lnterfacing System LOCA- Steam and Feedwater Une Breaks,
- ATWS- Fire, Earthquake
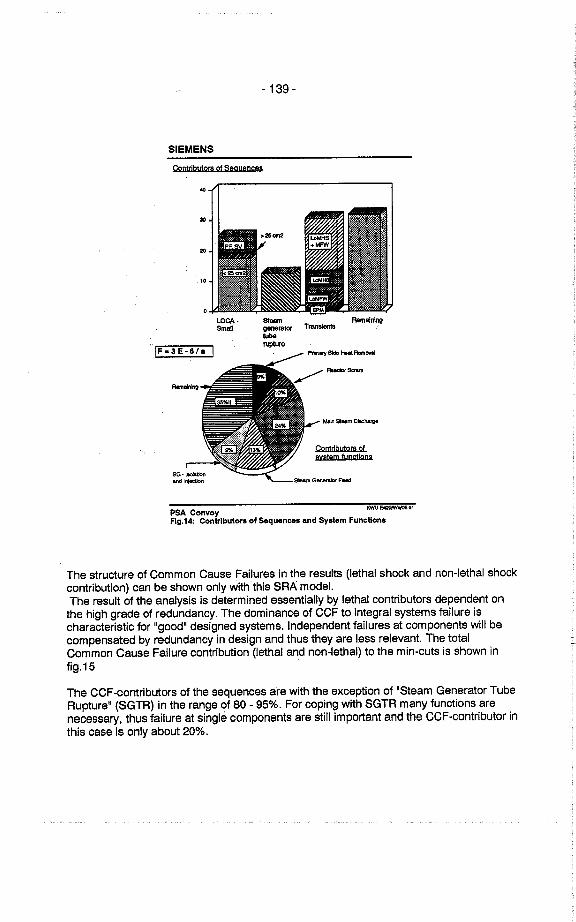
- 139-
SIEMENS
ContrlbytgrA pt Sogyence9
..
*'
..
,.
LOCA.SmaD
_ Remølnlngenraor Trs9ienituniro
!F=3E-6/e
Ma ae oatwe
Contdbytm ofay3lem fynçtlons
K. EØJ-i.81PSA ConvoyFlg.14: Conlrlbutors of Sequence end Syelem Funcllons
The structure of Common Cause Failures in the results (lethai shock and non-Iethal shockcontribution) can be shown only with this SRA modeL.The result of the analysis is determined essentially by lethai contributors dependent on
the high grade of redundancy. The dominance of CCF to integral systems failure ischaracteristic for "good" designed systems. Independent failures at components will becompensated by redundancy in design and thus they are less relevant. The totalCommon Cause Failure contribution (lethai and non-Iethal) to the min-cuts is shown infig.15
The CCF-contributors of the sequences are with the exception of "Steam Generator TubeRupture" (SGTR) in the range of 80 - 95%. For coping with SGTR many functions arenecessary, thus failure at single components are stil important and the CCF-contributor inthis case is only about 20%.
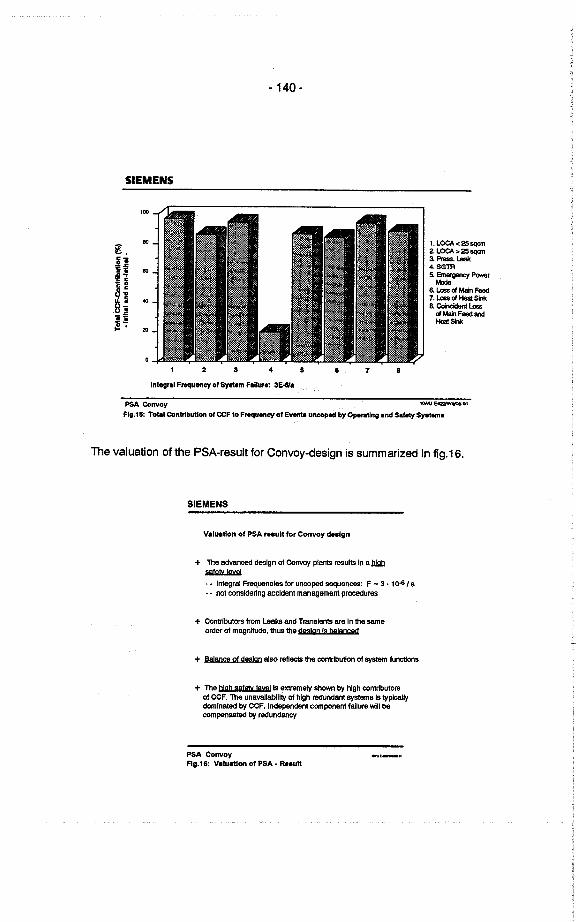
-140 -
SIEMENS
.. 1. LOC . 25 sq2. LOCA ~ 25 sq3.Pr~4.SGTR5. Emer Powr
Mo6. La d Mi Fe7. La d He Si6. Co LadMaFeanHeSi
'00
Lli .¡
i~E C
c; !.ai:n~ .
..
'"
'"
2 3 4 5 5 7
Integral Fnquancy of ~em Fallure: 3E-5a
PSA Convoy KW E4~1Flg.15: Totl Contrlbutlon of CCF to Fnquancy of Evete uncoud by Operating end SHfet Syetem"
The valuation of the PSA-result for Convoy-design is summarized in fig.16.
SIEMENS
ValuaUon of PSA r..ull for Convoy deeiiin
+ The advace d99lgn of Convo plai reults In a ii~.. Integral Frequeele tor uncope sequece: F - 3. 10-/ a.. not conslde~ng accldent management procures
+ Contbutrs tram Le end Trasient are In th saeorder 01 magnitue. ttus th deign 19 balanc
+ Balanc ot desgn also reec tte contbU1 01 sy funcons
+ Th high safll 1!liis extemel sbo by high contiburs
01 CCF. Th unavalabll!t 01 high reundan systemsis Iyplcallydomlnat by CCF. Indepent compoan lalure WILL becopesaed by redundancy
PSA ConvoyAii.ie: ValuaUon of PSA . Reeull
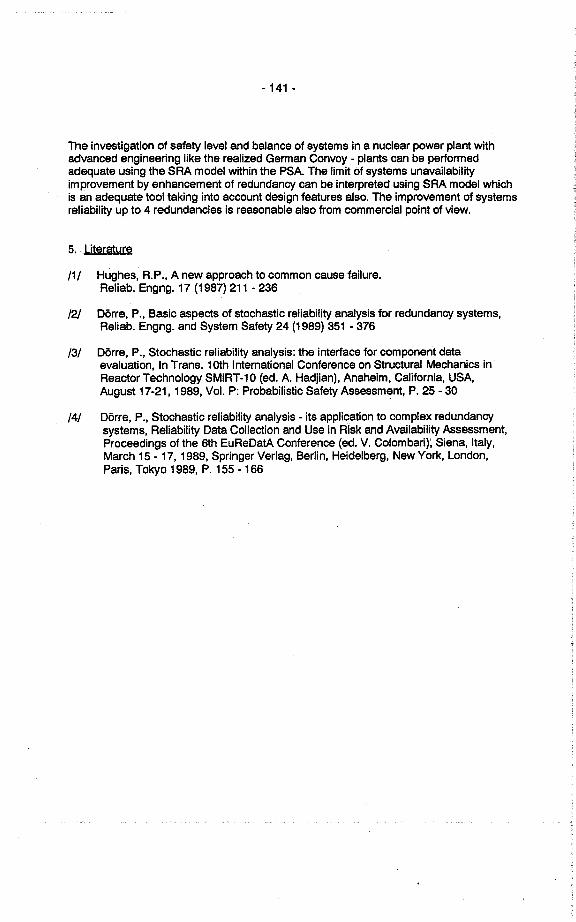
- 141 -
The investigation of safety level and balance of systems in a nuclear power plant withadvanced engineenng Iike the realized German Convoy - plants can be performedadequate using the SRA model within the PSA. The limit of systems unavailabilityimprovement by enhancement of redundancy can be interpreted using SRA model whichis an adequate tool taking into account design features also. The improvement of systemsreliabilty up to 4 redundancies is reasonable also trom commercial point of view.
5. Literaure
/1/ Hughes, R.P., A new approach to common cause failure.Reliab. Engng. 17 (1987) 211 - 236
/2/ Dörre, P., Basic aspects of stochastic reliabilty analysis for redundancy systems,
Reliab. Engng. and System Safety 24 (1989) 351 - 376
/3/ Dörre, P., Stochastic reliabilty analysis: the interface for component data
evaluation, In Trans. 10th Intemational Conference on Structural Mechanics inReactor Technology SMiRT-10 (ed. A. Hadjian), Anaheim, California, USA,August 17-21, 1989, Vol. P: Probabilstic Safety AssessmE,nt, P. 25 - 30
/4/ Dörre, P., Stochastic reliabilty analysis - ¡ts application to complex redundancy
systems, Reliabilty Data Collection and Use in Risk and Availabilty Assessment,Proceedings of the 6th EuReDatA Conference (ed. V. Colomban); Siena, Italy,March 15 - 17, 1989, Springer Verlag, Berlin, Heidelberg, New York, London,Paris, Tokyo 1989, P. 155 -166

- 142-
Time Dependent PhenomenalUncertainties
Chairman: H. Pulkinnen
-143 -
UNCERTAINTY ANALYSISAn issue paper to be presented at
OECD /BMU Workshop on "Special Issues of Level-l PSA"May 27th - 20th, Cologne, Gerrnany
Urho Pulkkinen
Technical Research Centre of Finland VTT
1 Problem description
The uncertainties of PSA are inherited from to several sources. Apart of theuncertainty originates from the randorn phenornena and rnechanisms of thecomponent failures. The other uncertainties are due to simplifying assurnptions
and incornplete understanding of the phenornena and the nuclear power plantunder analysis.
The basic types of uncertainty are usually divided in to two gategories:
- uncertainty due to stochastic variability of the quantity of interest
- uncertainty due to lack of knowledge on phenornena rnodelled in PSA
The objectives of an uncertainty analysis in PSA are:
- to identify the uncertain assumptions, modellng principles and
parameters applied in the PSA model
- to evaluate the signifigance of the identified uncertainties in the results
of PSA
-144 -
- to provide quantitative and qualitative information and proper
interpretation on the impact of uncertainties
- to measure the credibility of the results of PSA
- to provide methods for decreasing the uncertainty and to give basis fordecision making.
The problems of uncertainty analyses connected to the above issues are both
methodological and philosophical. The latter are closely related to the
interpretation of the results of the uncertainty analyses and the concept ofprobabilty. The methodological problems are related to the quantification ofuncertainty contribution, selection of uncertainty distributions and identificationof uncertain issues in the PSA-model.
2. Docents stating the state of the ar
In the following some references dealing the uncertainty analyses in PSA arelisted. The list is not intented to be complete, and some important references may
be missing. The references listed here are selected mainly form the practical point
of view. The references are listed in alphabetical order.
LIST OF DOCUMENTS
1. Analysis of Core Damage Frequency: Internal Events Methodology. (1990)
NUREG/CR-4550, vol. 1, Rev. 1. U.S. Regulatory Commission,
Washington, DC, January 1990.
- 145-
2. Apostolakis, G.E. (1989) Uncertainty in Probabilistic Safety Assessernent.
Nuclear Engineering and Design, 115, pp. 173-179, North-Holland,
Arnsterdarn, 1989.
3. Chhibber, S., Apostolakis, G., Okrent, D. (1991) On the Quantification of
Model Uncertainty. Proceedings of the International Conference onProbabilstic Safety Assessment and Management (PSAM), Beverly Hils,CA, U.S.A. pp. 1483-1488. February, 1991.
4. Hirshberg, S., Jacobsson, P., Pulkkinen, U., Pörn, K. (1989). Nordic
Reference Study on Uncertainty and Sensitivity Analysis. PSA'89 -International Topical Meeting on probability, Reliabilty and Safety
Assessment, Pittsburgh, Pensylvania, U.S.A,. April 2-7, 1989.
5. Iman, R.L., Helton, J.C. (1985) A cornparison of Uncertainty and
Sensitivity Analysis Techniques for Computer Models. NUREG/CR-3904,SAND84-1461. Sandia National Laboratories, Albuquerque, NM, U.S.A.,1985.
6. Iman, R.L., Hora, S.C. (1990) A Robust Measure of .Uncertainty
Importance for Use in Fault Tree System Analysis. Risk Analysis, Vol. 10,
No. 3, pp. 401-206.
7. Iman, R.L., Shortencarrier, M.J. (1984), Fortran 77 Program and User's
Giide for the Generation 0'£ the 'Latin Hypercube and Random Sampies for
the Use with Computer Models. NUREG/CR-3624, Sand83-2365, SandiaNational Laboratories, NM, March 1984.
8. Iman, R.L., Shortencarrier, M.J. (1986) A User's Guide for the Top Event
Matrix Analysis Code (TEMAC), NUREG/CR-4598, SAND86-o960,Sandia National Laboraratories, Albuquerque, NM, August 1986.
-146 -
9. Oconee PRA (1984) A Probabilistic Risk Assessment of Oconee Unit 3.NSAC-ôO. The Nuclear Safety Analysis Centre, Electric Power ResearchInstitute, California and Duke Power Company. 1984.
10. Oyster Creek Probabilstic Safety Analysis (1982). Plant Analysis update.
PLG-D253. Pickard, Lowe and Garrick, inc. 1982
11. PRA Procedures Guide. (1983) NUREG-2300, U.S. RegulatoryCommission, Washington, DC, January 1983.
12. Reactor Risk Reference Document. (1987) NUREG-1150, U.S. Regulatory
Commission, Washington, DC, February 1987.
13. Seabrook Station Probabilistic Safety Assessment (1983) Pickard, Lowe
and Garrick, Inc. Rev. 2~
3. Area with wel established and valdated methodology
In the following the areas with well established and validated methodology arelisted.
the methods for uncertainty propagation and sensitivity analyses, including
computer tools
the statistical methods for determining the uncertainty distributions forfailure model parameters (failure rates, failure probabiliies per demand)
The development of uncertainty analysis methods was started first for the abovementioned issues. The recent methods are rat her user friendly and several
computer codes exist for these areas.
-147 -
4. Area where improvements are necessar
The traditional uncertainty analysis consisted merely on the propagation ofuncertainties. However, the uncertainty analysis can be seen from a broader
perspective, which reveals some need for further develoment. In the following the
most important areas are listed:
the methods for identification of uncertain assumptions of PSA
the evaluation of incompletenesses of PSA
the analysis of modellng uncertainties
the determination of uncertainty distributions for dependent basic events
(including the most .complex knowledge dependencies and the methods forexpert judgements (for example in human error analysis)
the uncertainty analyses in living PSA
the interpretation and presentation of the uncertainty analysis results
the use of "uncertain" PSA in safety related decision making
the uncertainty importance analyses
In the above mentioned ares lot of research has been performed. The results arestil in rather impractical and theoretical form. Further work is needed in order tomake practical applications possible.
- 148-
Uncertainty study in probabilistic riskassessment ror TVO 1/11 nuclear power plant
Jan HolmbergTechnieal Rearch Centre oe Finland
Laboratory oe Eleetrieal Engineering and Automation TechnologyOtakaari 7 B, SF-01250 Espoo, Finland
Risto HimanenTeollsuuden Voima Oy, SF-27160 Olkiluoto, Finland
ABSTRACT
The level 1 probabili$tic ri$1c a"$eument (PRA) for the TVO 1/11 nuclear powerunit. i" a utility driven effort to identifyand prioritize accident "equence" that canlead to a core damage. The main report of the level 1 P RA con.i&ting of a $tudy ofinternal initiator$ Wti $ubmitted to the Finnish regulatory body for review in theend of 1989. It included a $tudy of uncertaintie$ of ri"Tc model$ and method". The
objective of the uncertainty $tudy wa" to identify the major uncertainties, to a""e""their importance$, and to demon.trate their impact in re$ult.. The methodology ofthe uncertainty $tudy mainly btied on earlier uncertainty $tudie$ in PRA".
Uncertaintie" were "tudied both qualitatively and quantitatively. In the quali-tative $tudy the uncertaintie" were identified and cla$$ified following the hierarchy
of the PRA model". The qualitative mapping out of the uncertainty factor$ turnedout to be a u"efvl way to plan effective quantitative dudie$. It al"o $erved as aninternal review of the a.Mumption" made in the PRA.
In the quantitative $tudy the importance of the mO$t $ignificant uncertaintie"
were verified by "en"itivity calculation". The impact of $tatistical uncertainties wa"demon"trated by performing uneertainty range propagation for core melt frequen-eie$ in all initiator cla""e" a" well a" for the total core melt frqueney. The M onteCarlo mtthod wa" eho"en a" the propagation method.
The mO$t $ignifieant uneertaintie$ were related to the modelling of humaninteraction", dependencie" and common eau"e failure", 10"" of coolant aecident
frequeneie" and containtment re"pon"e. H owever, given the boundary condition"
and limititatian" of the PRA, no major i""ue dominated a" an uneertainty saureebeeau"e of the great detailne"" of the TVO '" model".
jJIIl'erto bel'resentedlit.thepSJlI",orkshop()n~peeililJssuesoLl:evel:11'ßJi. .f7: f9 . .Hay1991, Cologne, Gemiany
-149 -
1 Introduction
The Olkiluoto nuclear power plant, located on the western coast of Finland, is oper-ated by Teollsuuden Voima Oy. The plant consists of two identical ASEA-ATOM
(nowadays ABB-ATOM) BWR units, TVO I and TVO 11. The net electrical powerof a single unit is 710 MW.
TVO 1/11 PRA was initiated in 1984 by the utility. The main report con-taining level 1 PRA study for internal initiators was submitted to the Finnishregulatory body (STUK) for review in spring 1989. It was completed with anuncertainty study by the end of 1989. Identification and prioritization of thosehuman interactions and dependences which are most important to the core meltprob ability were among the main goals of the PRA study. In the uncertainty studythese topics were proved to have most significat sources of uncertainty, too.
As apart of the PRA-project uncertainties of risk models and methods weresystematically studied in order
. to identify uncertainties in models and parameters,
. to assess their importances, and
. to demonstrate their impact in results.
Uncertainties originate from limitations of methods and models in PRA asweH as from the subjectivity in the estimation of basic probabilities aid initiatingevent frequencies. Therefore uncertainties are usually divided in completeness,
modelling, and parametric uncertainties. In our uncertainty study we have con-
sidered completeness uncertainties to be modellng uncertainties and interpretedthem as boundary conditions of the models.
The methodology of the uncertainty study was based on earlier uncertaintystudies in PRAs (1-71 and on a retrospective study of the methodology made byU. Pulkkinen, K. Kuhakoski and T. Mankamo (81. Uncertainties were studied bothqualitatively and quantitatively. We put much effort in the qualitative phase sincewe considered it more instructive and fruitful than mere evaluations of uncertaintymeasures.
The qualitative study which was the preliminary phase of the uncertaintystudy contained identification of uncertainties and qualitative assessments of theirimportance. The PRA was introduced and identified assumptions and uncertain-ties behind the models were documented. Meanwhile, the most significant uncer-
tainties were selected by importance measures or other calculations based on thePRA's models for further quantitative studies.
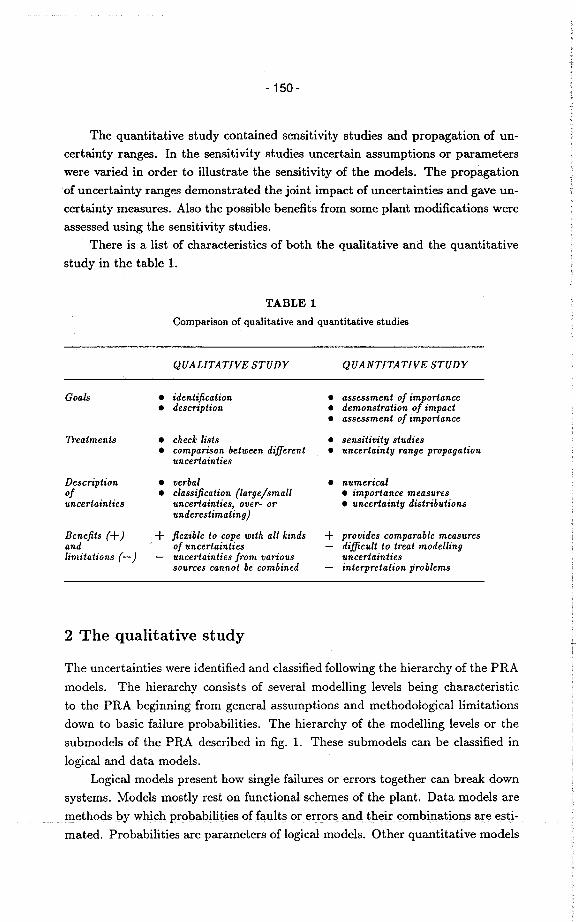
- 150-
The quantitative study contained sensitivity studies and propagation of un-certainty ranges. In the sensitivity studies uncertain assumptions or parameterswere vaied in order to ilustrate the sensitivity of the models. The propagation.of uncertainty ranges demonstrated the joint. impact of uncertainties and gave un-
certainty measures. Also the possible benefits from some plant modifications were
assessed using the sensitivity studies.There is a list of characteristics of both the qualitative and the quantitative
study in the table 1.
TABLE iComparison of qualitative and quantitative studies
QUALITATIVE STUDY QUANTITATIVE STUDY
Goals . ideniification . assessment 01 importance. description . demonstration 01 impact. assessment of importance
Treatments . check lists . sensitivity studies. comparison between different . uncertainty range propagation
uncertainties
Description . verbal . numericalof . classification (largelsma/l . importance measuresuncertainties uncertainties, over- or . uncertainty distributions
underestimating)
Benefits (+) + flexible to cope with all kinds + provides comparable measuresand of uncertainties diffcult to treat modellinglimitations (-) uncertainties from various uncertainties
sources cannot be combined interpretation problems
2 The qualitative study
The uncertainties were identified and c1assified following the hierarchy of the PRAmodels. The hierarchy consists of several modellng levels being characteristicto the PRA beginning from general assumptions and methodological limitationsdown to basic failure probabilities. The hierarchy of the modelling levels or thesub models of the PRA described in fig. 1. These submodels can be c1assified inlogical and data models.
Logical models present how single failures or errors together can break down
systems. Models mostly rest on functional schemes of the plant. Data models are
.JIetliogs I:iy\Vlii ch pr()lJaJ:iilitiesgfJl'iilts()reI"l"()rsl'Ilgtlieirç()IllJiIll'ti()Ils..l're.esti-mated. Probabilities are parameters of logical models. Other quantitative models
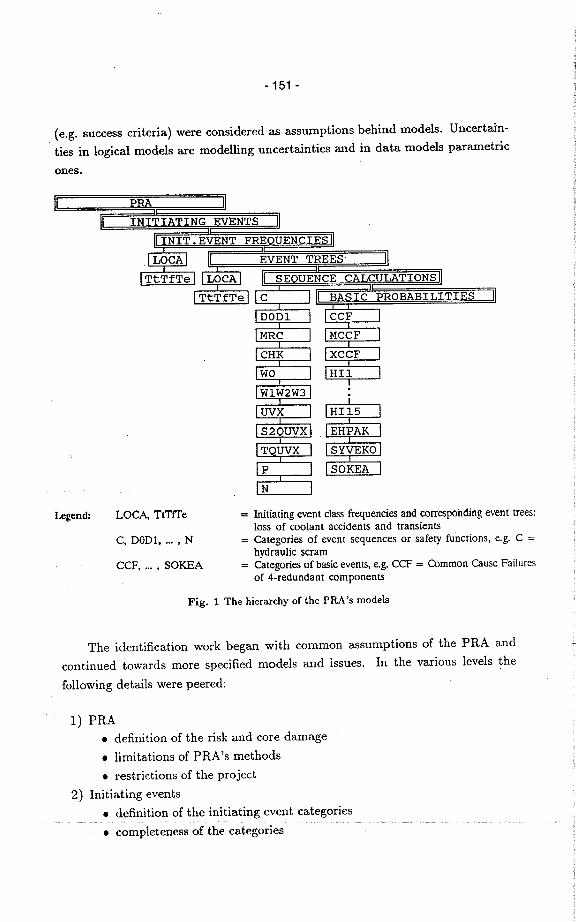
- 151 -
(e.g. success criteria) were considered as assumptions behind models. Uncertain-ties in logical models are modellng uncertainties and in data models parametrieones.
Leend: LOCA, TtTITe Initiating event dass frequencies and correspohding event trees:loss of coolant accidents and transients
= Categories of event sequences or safety fu'nctions, e.g. C =hydraulic scram
= Categones of basic events, e.g. CCF = Common Cause Failuresof 4-redundant components
Fig. i The hierarchy of the PRA's models
C, DODl,..., N
CCF,..., SOKEA
The identification work began with common assumptions of the PRA andcontinued towards more specified models and issues. In the various levels thefol1owing details were peered:
1) PRA. definition of the risk and core damage. limitations of PRA's methods. restrictions of the project
2) Initiating events
. definition of the initiating event categories
. completeness of the categories
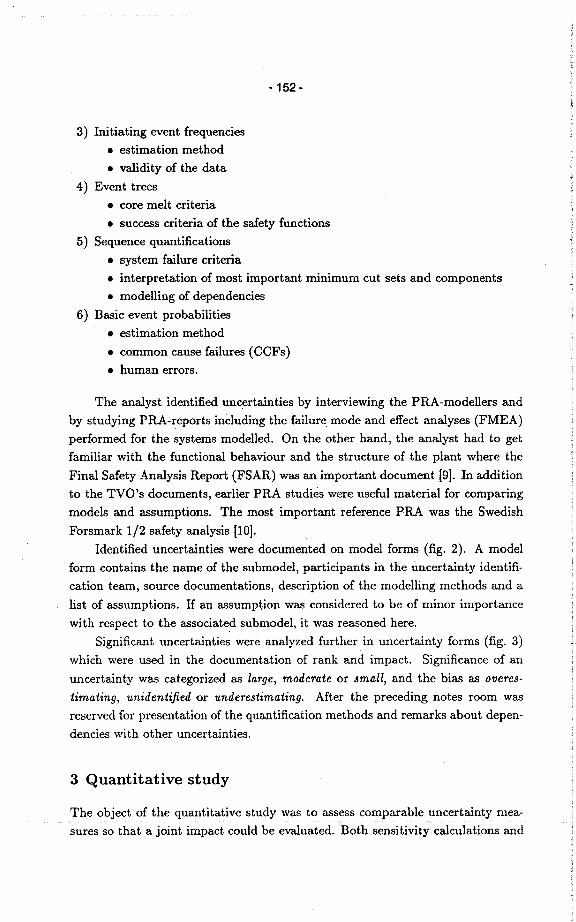
- 152-
3) Initiating event frequencies
. estimation method
. vaidity of the data
4) Event trees. core melt criteria
. success criteria of the safety functions
5) Sequence quantifications. system failure criteria. interpretation of most important minimum cut sets and components. modellng of dependencies
6) Basic event probabilities. estimation method
. common cause failures (CCFs)
. human errors.
The analyst identified uncertainties by interviewing the PRA-modellers andby studying PRA-reports including the failure modeand effect analyses (FMEA)performed for the systems modelled. On the other hand, the analyst had to getfamiliar with the functional behaviour and the strUcture of the plant where theFinal Safety Analysis Report (FSAR) was an important document (91. In additionto the TVO's documents, earlier PRA studies were useful material for comparingmodels and assumptions. The most important reference PRA was the SwedishForsmark 1/2 safety analysis (101.
Identified uncertainties were documented on model forms (fig. 2). A modelform contains the name of the submodel, participants in the uncertainty identifi-cation team, source documentations, description of the modellng methods and alist of assumptions. If an assumption was considered to be of minor importancewith respect to the associated submodel, it was reasoned here.
Signifìcant uncertainties were analyzed further in uncertainty forms (fig. 3)which were used in the documentation of rank and impact. Significance of anuncertainty was categorized as Zarge, moderate or small, and the bias as overes-
timating, unidentified or underestimating. After the preceding notes room wasreserved for presentation of the quantification methods and remarks about depen-deneies with other uncertainties.
3 Quantitative study
The of the quantitative study was to assess comparable uncertainty mea-sures so that a joint impact could be evauated. Both sensitivity calculations and
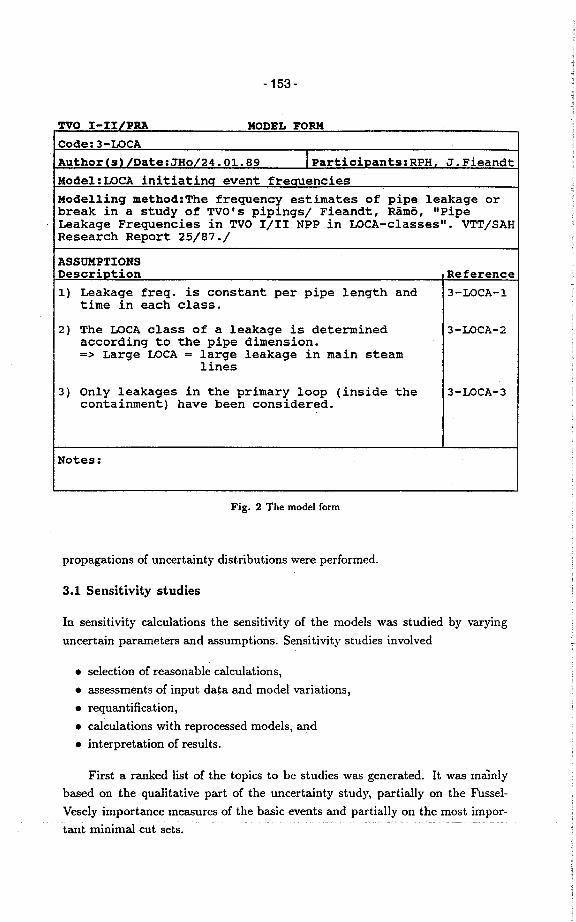
-153 -
TVO I-II/PRA MODEL FORM
Code: 3 - LOCA
Author (s) /Date:JHo/24. 01. 89 I ParticiDants:RPH J . FieandtModel:LOCA initiatina event freauencies
Modellinq method:The frequency estimates of pipe leakage orbreak in a study of TVO' s pipingsl Fieandt, Rämö, "PipeLeakage Frequencies in TVO I/II NPP in LOCA-classes". VTT/SAHResearch Report 25/87.1
ASSUMPTIONSDescriDtion Reference1) Leakage freg. is constant per pipe length and 3-LOCA-l
time in each class.
2) The LOCA class of a leakage is determined 3-LOCA-2according to the pipe dimension.=;: Large LOCA = large leakage in main steam
lines3 ) Only leakages in the primary loop (inside the 3-LOCA-3
containment) have been considered.
Notes:
Fig. 2 The model form
propagations of uncertainty distributions were performed.
3.1 Sensitivity studies
In sensitivity calculations the sensitivity of the models was studied by vayinguncertain parameters and assumptions. Sensitivity studies involved
. selection of reasonable calculations,
. assessments of input data and model variations,
. requantification,
. calculations with reprocessed models, and
. interpretation of results.
First a ranked list of the topics to be studies was generated. It was maìnlybased on the qualitative part of the uncertainty study, partiallyon the Fussel-
Vesely importance measures of the basic events and partially on the most impor-tant cut sets.
- 154-
'!O I-II/PRA UNCERTAINTY FORM
Code: 3-LOCA-1AuthorCs) /Date:JHo/14. 03.1989
Model: LOCA ini tiatinq event frecienciesUncertainty: Pipe leakage frequency is constant per pipelenqth and time in each leakaqe class.
contribution Impact:small - Bias: overestimati~gmoderate underestimating -- -larqe x not identified x
Description of the contribution:Pipe aging, inspections, servicing andrestorations are ignored.
- The most likely leakage places are pipe joints andcomponents in pipings. Constant existence ratio is assumedfor these places.- Data reference plants are older.- Only frequencies per time and piping are given inmost of the references.
- There is a great variation between estimates of the usedreferences.
Quantitative treatment:- Uncertainties will be treated in the uncertaintydistribution propagation
- The uncertainty distribution for each cl ass will beassessed according to estimates in other PRA i s . See3-LOCA-2
Dependencies wi th other uncertainties:3-LOCA-2
Fig. 3 Uncertainty form
The needs for data and model variations were identified in the qualitative partof the study. In addition to the realistic vaiation range of model and data, alsorisk increase and decrease were studied for the basic event probabilties i and 0,
respectively. This variation showed the maximun benefit gained if the basic eventis removed and the maximum risk increase if it always occurs.
The calculations were simple and straightforward. Three methods were used:
. the Fussel- Vesely importance measure,
. of a basic and
. model vaiations.
- 155-
The relative impact of the change of the probability of a basic e~ent on thecore melt probability was simply estimated based on the Fussel- Vesely importancemeasure: ~ftCM) ~P~~)
fnom(CM) = Ir-v(X¡), Pr(X¡) ,(1)
where Pr(X¡)
~Pr(Xi)= nominal probability of event Xi,= variation of the probability of event Xi,= Prvaried(Xi) - Pr(Xi),
Ir-v(Xi) = Fussel-Vesely importance measure of event Xi on the,
nominal probability Pr(Xi),
= L Pr(min cut sets containing Xi)/ L Pr(all min cut sets),fnom(CM) = the nominal frequency of Core Meltfnew(CM) = the vaied frequency of Core Melt~f(CM) = fnew(CM) - fnom(CM).
The impact of uncertain phenomena included in a basic event probabilitywas estimated by removing/adding the frequency of conservatively/optimisticallyestimated phenomena from the initating event frequencies. The relative impacton the core melt frequency is estimated as the ratio of fnew to fnom. Event treeswere modified in cases where the propagation of an event sequence was uncertain.In these cases complete event trees had to be requantified.
3.2 Uncertainty range propagation
The impact of the statistical uncertainties of the basic event parameters weredemonstrated by the uncertainty range propagation. In this treatment the un-certainties are described with probability distributions (fig. 4). A fractie of a
distribution characterize to which confidence we believe the parameter value tobe below the fractile. The 0.05- and 0.95-fractiles are often used for describingthe range of uncertainty. A common measure is the error factor (EF) originatingfrom logarithmic normal distribution. Thè fraction of the upper fractie and themedian of a logarithmic normal distribution equals the fraction of the median andlower fractie and it is called the error factor
),50 = ),95 = EF),05 ),50 ' (2)
where ),95 = 0.95-fractile, Pr(),50 :: ),) = 0.95,).50 = median,).05 = 0.05-fractile.
Uncertainty ranges were propagated by Monte Carlo simulations like in theForsmark 1/2safety...analysis (Sj..ßecause.the.dI:VQ's Ja:ult tree .modelscontain
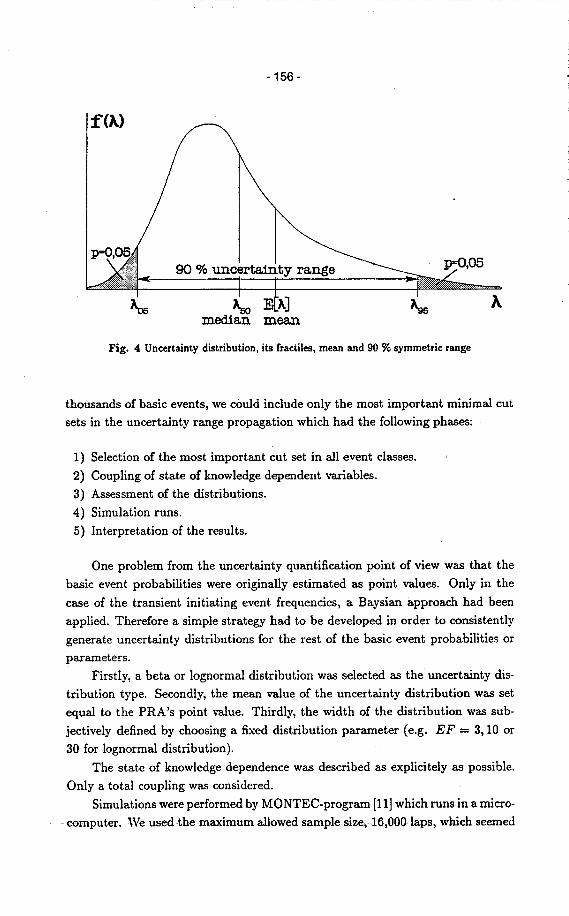
- 156-
f(A)
P"-o,0590 % uncertaty range
"0 "r AJmedan meaA~
Fig. 4 Uneertainty distribution, its fraetiles, mean and 90 % symmetrie range
thousands of basic events, we could include only the most important minimal cutsets in the uncertainty range propagation which had the following phases:
1) Selection of the most important cut set in all event classes.2) Coupling of state oÎ knowledge dependent vaables.
3) Assessment oÎ the distributions.4) Simulation runs.
5) Interpretation of the results.
One problem from the uncertainty quantification point of view was that thebasic event probabilties were originally estimated as point vaues. Only in thecase of the transient initiating event frequencies, a Baysian approach had beenapplied. Therefore a simple strategy had to be developed in order to consistently
generate uncertainty distributions for the rest of the basic event probabilties orparameters.
Firstly, a beta or lognormal distribution was selected as the uncertainty dis-tribution type. Secondly, the mean vaue of the uncertainty distribution was setequal to the PRA's point vaue. Thirdly, the width of the distribution was sub-jectively defined by choosing a fixed distribution parameter (e.g. EF = 3,10 or30 for lognormal distribution).
The state of knowledge dependence was described as explicitely as possible.Only a total coupling was considered.
Simulations were performed by MONTEC-program (l1j which runs in a micro-computer.We used the maximumallowed sampIe size,16,000 laps, which seemed
-157 -
to be enough at least for estimating the fractiles.
The modellng uncertainties studied individually by means of the sensitivitystudy were simulated as independent uncertainties, too. The following equationfor the core melt frequency simulation was generated on the basis of the followingequation
f(GM) = fDom(GM). rr Ei(assumption ij), (3)
where Ei = fDew (assumption i j)/ fDom is the random vaiable getting the vauesgenerated by the equation (1). The probability of each value of Ei is determinedby the confidence Pr(assumption ij) which were assessed subjectively.
The resulting frequency in the equation (3) might be strongly biased due tothe fact that the values of EiS are dependent on each others. The dependency ofimportance measures on each other can be reduced by introducing the iniportancemeasures of component groups. However, in the case of complete event tree re-quantifications one should evaluate the vaied event trees separately in order toproperly treat their effect on the equation (3).
The aim of the simulation of the modellng uncertainties was mainly to obtain
a coarse view of their impact in the total core melt frequency. As a consequenceof very detailed fault and event tree models, explicit use of vaious minimal cutset equations would have exceeded the capacity of the simulation program with-out strong simplifications in the equations. Therefore, an approach based on thesimulation of the equation (3) was adopted.
According to our experiences, the sensitivity studies provided the most useful
information of the impact of identified uncertainties. Even though the uncertainty
range propagations seem to be an attractive way to demonstrate the joint impactof the uncertainties, the diffculties to express the uncertainties coherently andexhaustively leave a lot of room for interpretation. Table 2 summarizes the benefits
and limitations of the quantitative treatments of uncertainties.
4 Results
The sensitivity studies showed items in the procedures, where the assumed level ofoperator performance is adequate, but any reduction would lead to catastrophicincrease of the core melt frequency. One example is the additional water to theA uxiliary Feed Water system (AFW) after the water in the containers has depleted.
If the additional water supply always wouldsucceed, thecoremelt probability
- 158-
TADLE 2
8enefits and limitations of the quantitative treatments
TREATMENT BENEFITS LIMITATIONS
Sensitivitystudies
+ simple+ natural extension of
qualitative study
suits only for studying single
uncertaintiesnot necessarily based on estimationof upper and lower limits
distribution is hard to understandfor uncertainties are not onlgcaused bg randomness;distributions have both frequentist
and subjectivist interpretationdiffcult to model state of
know/edge dependencg
Uncertaintyrangepropagation
+ attempts to display the jointimpact of uncertainties
+ obeys the ru/es of probabilitycalcu/us and statistic$ whichmakes it disciplinary
would decrease only by 6 per cent. However, if the operators would never succeed,the core melt probability would increae by factor of several hundreds.
The estimatioii of the distribution of the modellng uncertainties allowed usto study the effect of conservative assumptions. Small probabilities were assessedto the normally conservative Final Safety Analysis success criteria as. opposite tothe success criteria used in PRA study. The resulting distribution was bimodal,since most of the distributions were discrete..
Although the results from the uncertainty range propagation showed that theuncertainty in e.g. the LOCA frequences and in core melt after a LOCA was high- error factor even 100 - the final error factor due to statistical uncertaintiesfor the core melt frequency was only 4. On the other hand the error factor dueto modellng uncertainties was stil smaller, less than 2. All in all, no major issuedominated as an uncertainty source because of the great detailness of the TVO'sfault tree models.
5 Conclusions
The qualitative mapping out of the uncertainty factors turned out to be an effectiveway to generate a plan for an effective quantitative uncertainty analysis. At thesame time it served as an internal review of the assumptions made in the PRAstudy. When performed for the almost finalized study it helped to correct coarsemodellng errors and it forced the analysts to check the base of the assumptionsand simplifications. The sensitivity studies wereperhaps themost advatageous
- 159-
part of the quantitative uncertainty analysis, because they allowed an individualanalysis for the effect of each of the uncertainty sources identified.
The most significant uncertainties were those involved in modellng humaninteractions, dependencies and common cause failures (CCFs), loss of coolant ac-cident (LOCA) frequencies and containtment response. Common background forthese models is the use of expert knowledge and subjective estimates due to alack of proper data and plant experiences. The qualitative study of uncertaintiesgave a picture that statistical uncertainties would be negligible compared withuncertainties originated from modellng assumptions and the lack of knowledge.However, the number of those having significant impact on core melt frequencywas very limited and it was possibe to assess them by means of sensitivity studies.In the same context sensitivity study was used to compare alternatives of systemmodifications. A coarse simulation of the modellng uncertainties produced a morenarrow distribution than that simulated from the statistical uncertainties.
Uncertainty study was found to be a suitable tool for a systematic and crit-ical method of assessing uncertainties in a risk analysis. The usefulness of thisstudy depends on the decision-maker (power company) since uncertainty study isprimarily made to support decision making under uncertainty.
6 References
(1) Reactor Saiety Study: An Assessment of Accident Risks in U.S. CommereialNuclear Power Plants, Rep. WASH-1400, NUREG-75/014, U.S. Nuclear Reg-
ulatory Comission, Offce of Nuclear Regulatory Research,Washington D.C.
(1975) App. II, pp. 39-47.
(2) PRA Procedures Guide: A Guide to the Performance of Probabilistic RiskAssessments for Nuclear Power Plants, Final Report NUREG/CR-2300, D.S.Nuclear Regulatory Comission, Offce of Nuclear Regulatory Research, Wash-ington D.C. (1983) Ch. 12.
(3) Reactor Risk Reference Document, Rep. NUREG-1l50, U.S. Nuclear Regu-latory Comission, Offce of Nuclear Regulatory Research, Washington D.C.
(1987) App. K.
(4) Seabrook Station Probabilistie Safety Assessment,Rep. PLG-0300, Pickard,Lowe, Garrick, Ine., Rev. 2 (1983) Ch. 6 and App. A.
(5) Oconee PRA: A Probabilistie Risk Assessment of Oconee Unit 3, Rep. NSAC-60, The Nuclear Analysis Centre, Eleetric Power Research Institute, Californiaand Duke Power Company 4
- 160-
(6J PÖRN, K, Analysis of Parametric Uncertainty in the PSA of Forsmark 1/2,Rep. Studsvik NP-88/46, App. G of the Forsmark 1/2 Probabilstic SafetyAssessment, Vattenfall (1988) (In Swedish).
(7) HIRSCHBERG, S., et.al., A Comparative Uncertainty and Sensitivity Analy-sis of an Accident Sequence, Reliability Achievement: The Commerciallncen-tive, ed. T. Aven (Proc. of the Symp. of the Society of Reliability Engineers,Scadinavian Chapter, Stavager, Norway, 1989), Elsevier Applied Science,London (1989) 111-125.
(8J PULKKINEN, U., KUHAKOSKI, K, MANKAMO, T., Treatment of Uncer-tainties: Development of the Methodology fo TVO 1/11 PRA, Research Re-port VTT /SAH 14/88, Technical Research Centre of Finland, Espoo (1988)
(In Finnish).
(9) Final Safety Analysis Report (FSAR), Teollsuuden Voima Oy (TVO), Olki-luoto (1976, revised 1988) (unpublished).
(lOJ Forsmark 1/2 Probabilistic Safety Assessment, Vattenfall (1988) (In Swedish).(11) KUHAKOSKI, K, PULKKINEN, U., MONTEC Reference Manual, Research
Report VTT/SAH 1/89, Technical Research Centre ofFinland, Espoo (1989).
- 161 -
H. Pamme. RWE Energie AG, Essen
Graphleal tools for deteetlon and modellng of time dependent
agelng behavlour In eomponent data
OECD/BMU Workshop on aSpeelal Issues of Level 1 PSA"
Köln 27.-29.5.91
-162 -
H. PameRWE Energie AG, Essen
Graphical tools for detection and modelling of time dependent
ageing behaviour in camponent data
1. Introduction
The "classical" approach within the PSA framework is toassume exponential i . e. constant ageing behaviour for basicevents in fault or event tree analyses. The requiredstatistical input da ta . for these basic events are oftenderived from operating experience. These "raw.data" however
are mostly not analysed in depth concerning potential ageing
informations. This step to check the validi ty ofexponentiality is mostly (and often intentionally) neglected
because the exponential model is easy in its application toestimate failure rates and to quantify fault or event treestructures.
This paper will describe a mainly graphical approach of life-
time data analyses wi th the main aim to reveal non-constant
ageing trends in data. This graphical approach is chosen be-
cause it allows a quick and comprehensive insight in data
informations not only for the statistician but especially for
the engineer as main user of statistical resul ts .
2. Impacts of ageing effects
It is a trivial fact for engineers that a constant failure
rate must be an oversimpli£ication of the real failure
beha~lc:!1:r 0 f . .i:.cllPc::rli:rt~~.~~Tliëlt ..):E:i:.cJ1li!lLëltJ,liël!l~~lllpll~ltly)
- 163-
obvious if engineers e.g. talk about "preventive maîntenance
or exchange activities", "problems with component wear out",
"detection of material fatigue effects" , "burn-in ofelectronic components before use in operation" or "increased
spare parts prov~s~oning due to observed higher partconsumptions". All these problem areas would be irrelevant if
the failure rates of affected parts were really constant.
Therefore the engineer using statistics (especially for
safety predictions within the PSA-framework) or the involved
statistician should somehow try to at least find a weak
justification for exponentiali ty in da ta . The "classical"
argument that the bathtub-shaped failure rate model isgenerally accepted but that only the flat part of the bathtub
can be observed in (nuclear) operation is a weak hypothesis
which can easily be disproved by many available data sets
(see e.g. discussions in /1/ or /2/).
Beside the technical and economic aspects of ageing it must
also be asked how a more realistic modelling of ageing
behaviour might influence PSA-results. The exponential model
will either over- or underestimate the real non-constant
failure rate at a certain time point. The overall error in
PSA-results however can be large (see e.g. /2/ for propaga-
tions of errors in fault tree quantifications).
3. Description of ageing properties
In technical applications the statistical ageing behaviour is
mostly described by ~he failure rate h(t) = f(t)/R(t) as
qoutient between distribution densi ty f (t) and survi valfunction R(t). h(t) dt describes the conditional probability
that a component which has survived until twill fail in the
time interval t+dt.
For the ..~:iP~riElri1:~~l distributionli(1:J
value.becomes a constant
-164 -
Increasing failure rates (IFR) can for.lly be described by
the differential condition d h(t) I dt ~ 0, decreasingfailure rates (DFR) respectively by d h(t) / dt ~ 0 (see 1eft
side of figures I or 2).
"Trend changes" in the
failure rates with (atinterval 0 ~ t ~ 00.
ageing behaviour are represented by
least) one local extreme in the time
For example a bathtub-shaped failure rate can be charac-
terized by one local minimum on 0 ~ t ~ 00 which describes the
trend change from a strictly decreasing to an increasing
failurerate.
It i8 the task of a statistical analysis to estimate the
failure rate function (or any other measure statistically
describing the informations contained in da ta ) .
4. Graphical tools for ageing -analysis
The use of graphical representations in data analyses are
beside the documentation function a valuable way of"communication" between statistician and engineer. Therefore
it is meaningful to derive ageing informations not only by
relatively abstract statistical methods (e.g. maximum-
likehood-estimatíon of distribution parameters and "proof" of
fit by the Kolmogoroff-Smirnov-test).
This chapter shortly introduces some graphical represen-
tations which are useful to analyse the validi ty of or
departure from the exponential model. These representations
can _ be easily genera ted and allow a very quick andcomprehensible assessment of the ageing informations in da ta .
- 165-
A "naive" estimator h(t)'" for the failure rate could e.g. be.defined by
h(t) '" f(t)'" IR(t)'" f(t)"'1 n(t) I n J= =
= n(t)-i (n(t) - n(t + St) J I St
where n(t) denotes the numer of components which survived t
(wi th n ( 0) = n) and St denotes a small time interval .
A graphical representation of h (t) '" over t however does notallow a profound analysis of the ageing trend as h (t) '" is aunsteady step function at each failure time tj. Between
successi ve failure times h (t) '" is constant.
Therefore other graphical representations which also allow
the assessment of the ageing behaviour (and thus implici tlythe failure rate) should be used for data analyses.
4.1 Empirical plot of cumulative distribution function
The empirical(CDF-plot) isrepresentation3) .
plot of
widelyof a data
the cumulative distribution function
used as one (and often only)set (example of CDF-plot in figure
Let ti , ... tn be an ordered sample of failure times of size
n from a lifetime distribution F(t). Then the graphical
representation of F.~p. (t)
E (tj S t)F.snp. (t)
nj=l,...,n
- 166-
is called empirical CDF-plot. Here "E" denotes the numer of
of failure times tj less than or equal to t. Femp. (t) is a
step-function wi th jumps over the j' th ordered value of thesampie . Very often however i t is not represented as a step
function, especially when the sampie size i5 large.
The empirical CDF-plot provides an exhausti ve graphicalrepresentation of a lifetime data set. For large sampies
F _~p . (t) converges towards the true but unknown F (t ), the CDFof the underlying distribution.
The major advantages of the empirical CDF-plot are:
- the empirical CDF-plot is very easy to produce and gives an
comprehensive overview . concerning location and spread of
data,
i t does not depend upon assumptions concerning anunderlying parametrie distribution model.
If the sample is sufficiently large (at least n ~ 10)
- it mayclasses in
a rough informtion concerningset~ IFR-data will show an S-shape
whereas DFR-data will show a
ageingin the
providea data
empirical CDF-plot
shape,concave
- it serves as a sensitive goodness-of-fit representation of
F_~p. (t) versus an assumed F(t).
Some disadvantages are:
- the empirical CDF-plot does not allow a profound identi-
fication of parametrie models (including the exponential
distribution ,
- 167-
- because of the monotonically increasing behaviour of the
empirical CDF-plot local variations in a da ta structure (e. 9 .trend changes in ageing) will tend to be masked,
- the informality rapidly decreases with small sample sizes.
Thus the empirical CDF-plot must
qualitative tool for documentation
of the resul ts of an analysis
representation.
be regarded as a morepurposes of a data set and
within a goodness-of-fit
4.2 Probabili ty plots
In practice it is often difficult to judge subjectively the
goodness-of-fit between the (above described) empirical CDF-
plot and a hypothesized distribution due to the shape of both
curves. The probability plots trans form this problem to ajudgement concerning the deviation of a data set from a
straight line. By sui tably transforming (at least) thevertical scale of the empirical CDF-plot wi th respect to a
hypothesized distribution, the da ta set will produce astraight line if it is a sample out of this distribution.
Within life time data analysis especially the probability
plots based on the Weibull- and lognormal- distribution arewidely spread.
Wi thin these probabili ty
straight) da ta "cloud 11 is
of a distribution. Thusparameter estimation of the
and the scale parameter (via
plots the slope of a (more or less
a function of the shape parameter
these probability plots allow
shape parameter (via the slope)
quantiles of F _mp. (t) ) .
-168 .
4.2. 1 Probabili ty plot of the Weibull distribution
The Weibull-distribution wi th shape parameter ß and scaleparameter a has a CDF
F ( t) = 1 - exp ( - ( at ) ø ) OSt S m (*)
and a failure rate
h(t) = ß aß tß-1
Obviously the exponential distribution is a special case of
the Weibull-distribution for ß = 1.
The probability plot of the Weibull-distribution is based on
the following transformations:
Taking twice the logari thm of (*) provides:
ln ln (1 I ( l-F ( t ) )) ß In (l/a)ß ln t
Let
y = ln ln (1 I ( l-F (t) )) c = - ß ln (1 la)x = ln t
then the linear relation
y ß x + C
is obtained. Here the shape parameter ß becomes the slope of
the line. The time transformation x ln t forms thehorizontal axis of the probability plot.
- 169 -
To construct the vertical axis of the plot F (t) is replacedby F._p. (tj) which is e.g. estimated by
F.lfp. (tj) (j - 0.3) I(n + 0.4) j=l,..,nFor further details (ranking theory) concerning the plotting
position of F.lfpo (t) see e.g. 13/, 14/.
To estimate the scale parameter a in (*) the relation
F ( t A) = 1 - exp (-1) = O. 632
with all tA is used. So an estimator of 1 1 acan befound on the logari thmic abscissa below the crossing of theda ta cloud (respectively the fitted line) with the horizontal
axis of the 0.6 32-quantile. The fitting of straight lines can
be done "manually" but also e. g. by using simple least
squares regression.
The estimator of ß can be found by defining a suitablevertical scale with a slope indication.
The Weibull-distributionis a very flexible distributionmodelling IFR- (DFR-) behaviour for ß ~ 1 (ß ~ 1). For ß = 1
the Weibull-distribution models the exponential distribution
with constant failure rate a. Thus Weibull probability plots
are widely spread in technical applications as they serve asa sensitive tool in discriminating between constant (exponen-
tial) and IFR- (respecti vely DFR-) ageing.
Convex shapes in a Weibull probability plot might indicate an
underlying distribution with a trend change from DFR- to IFR-
behaviour (bathtub-shaped failure rates). Concave shapes in a
Weibull probability plot might indicate an underlyingdistribution wi th a trend change from IFR- to DFR-behaviour
(inverse bathtub-shaped failure rates e.g. modelled by the. iognormaidistribution). ... . .. . . ... ~..
-170 -
The major advantage of probability plots is the option for
model identification by a relatively simple vispal assessment
whether a da ta set provides a linear trend in the. correspon-
ding plot. The identification i8 however restricted to one
parametric distribution model in a plot. After identification
of a sui table model the parameter estimation can be easily
performed either by manually fittig a straight line or
performing a regression analysis. Care must however be takento avoid misidentifications due to the logarithmc scaling ofthe plots. It must be realized that the probability plots
contain a graphical representation of the empirical CDF which
is in general monotonically increasing. This increasing shape
often "pretends" to be also linear on logarithmic paper. To
reduce the risk of misidentifications especially thelinearity of a data c19ud at the left tail should be checked.
4.3 Mean residual life plots
The term "mean residual life" met) describes the rernining
life time expectation after survival up to the age t.Formally it can be written as the conditional expectation
met) = E (X-t I X ~ t)
The mean residual life plot is achieved by plotting
nm(t~) L tj / (n-i) - t~~-.;+i
over t~, where t~ denotes the i-th failure
n-l. m( 0) is the li fe expectation of a
further details see e.g. /5/ and /6/.
wi th i = 0, 1,...,
new component. For
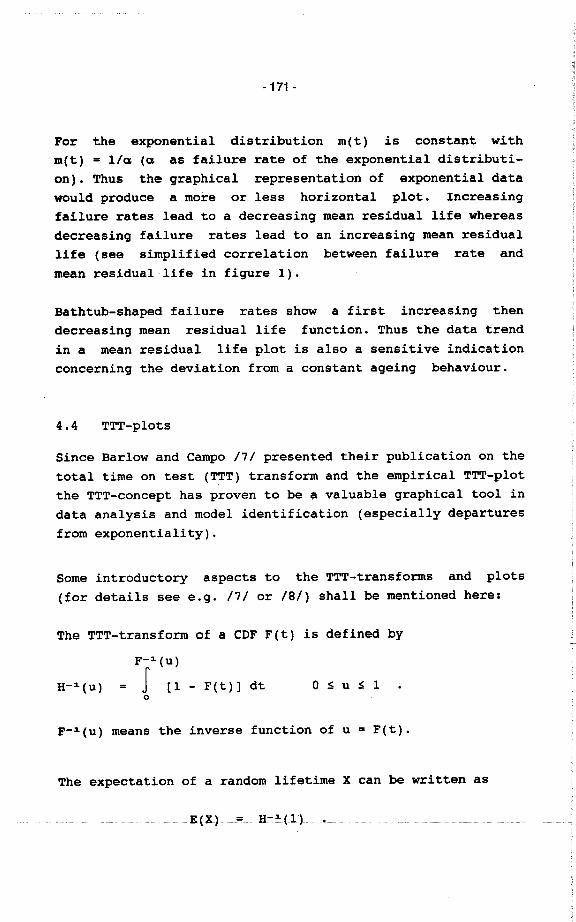
- 171 -
For the exponential distribution met) is constant withmet) = lla (a as failure rate of the exponential distributi-
on). Thus the graphical representation of exponential data
would produce a more or less horizontal plot. Increasing
failure rates lead to a decreasing mean residual life whereas
decreasing failure rates lead to an increasing mean residual
li fe (see simplified correlation between failure rate and
mean residual li fe in figure i).
Bathtub-shaped failure rates show a first increasing then
decreasing mean residual life function. Thus the da ta trend
in a mean residual life plot is also a sensitive indicationconcerning the deviation from a constant ageing behavíour.
4 .4 TTT-plots
Since Barlow and Campo 171 presented their publication on the
total time on test (TTT) transform and the empirical TTT-plot
the TTT-concept has proven to be ~ valuable graphical tool in
data analysis and model identification (especially departures
from exponentiality).
Some introductory aspects to the TTT-transforms and plots
(for details see e.g. 171 or /8/) shall be mentioned here:
The TTT-transform of a CDF F(t) is defined by
F-i (u)
r (i - F (t)) dto
H-i(u) o ~ u ~ 1
F- i (u) means the inverse function of u F(t) .
The expectation of a random lifetime X can be written as
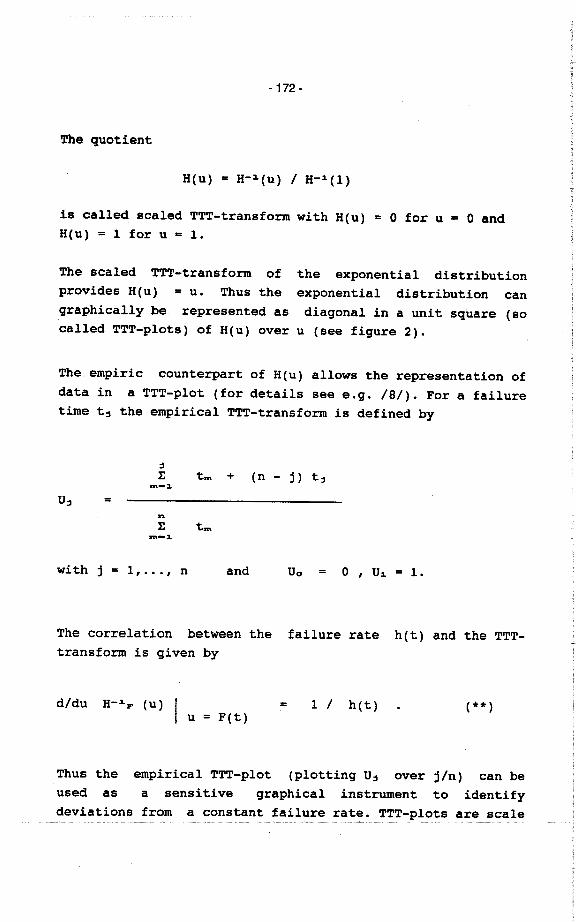
-172 -
The quotient
H(u) = H-1(u) I H-1(1)
is called scaled TTT-transform with H(u)
H(u) = 1 for u = 1.o for u = 0 and
The scaled TTT-transform of
provides H(u) = u. Thus the
graphically be represented as
called TTT-plots) of H (u) over
the exponential distributionexponential distribution can
diagonal in a uni t square ( sou (see figure 2).
The empiric counterpart of H(u) allows the representation ofdata in a TTT-plot (for details see e.g. 18/). For a failuretime t~ the empirical TTT-transform is defined by
~1: tzn + (n - j) t~
zn-1U~ =
n1: tzn
zn-1
with j 1, . . . , n and Ua 0 , U1 1.
The correlation between the failure rate h(t) and the TTT-
transforr is given by
d/du H-1p (u) I u = 1 I h(t) (** )=F(t)
Thus the empirical TTT-plot (plotting U~ over
used as a sensi ti ve graphical instrumentdeviations from a constant failure rate.
j/n) can beto identify
are scale
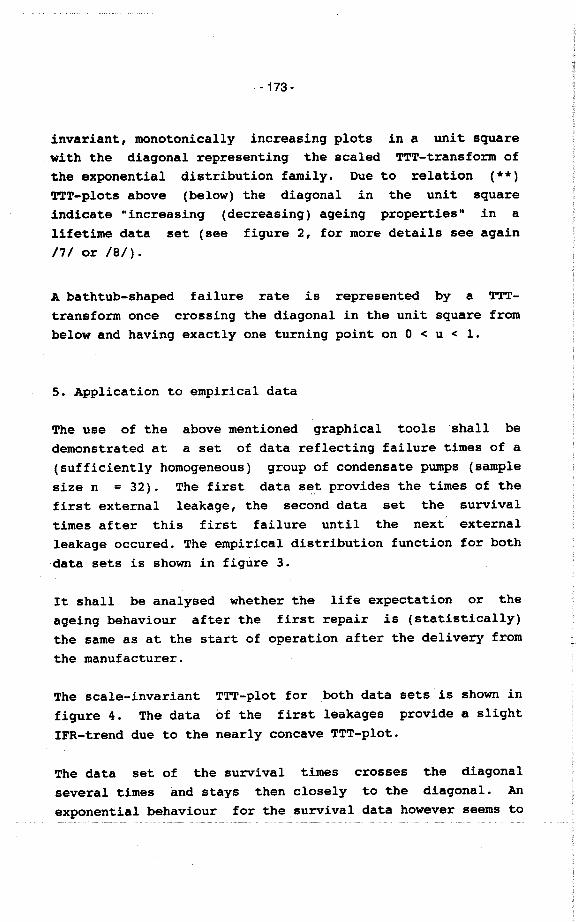
- 173-
invariant, monotonically increasing plots in a unit square
. with the diagonal representing the scaled TTT-transform of
the exponential distribution family. Oue to relation (**)
TT-plots above (below) the diagonal in the unit square
indicate 11 increasing (decreasing) ageing properties" in alifetime da ta set (see figure 2, for more details see again
/7/ or /8/).
A bathtub-shaped failure rate is represented by a TTT-
trans form once erossing the diagonal in the unit square from
below and having exactly one turning point on 0 ~ u ~ i.
5. Applieation to empirieal data
The use of the above mentioned graphieal tools shall be
demonstrated at a set of data reflecting failure times of a
(sufficiently homogeneous) group of eondensate pumps (samplesize n = 32). The first data s~~ provides the times of the
first external leakage, the second data set the survival
times after this first failure until the next externalleakage oeeured. The empirieal distribution funetion for both
da ta sets is shown in figùre 3.
It shall be analysed whether the life expeetation or the
ageing behaviour after the first repair is (statistieally)
the same as at the start of operation after the delivery from
the manufaeturer.
The seale-invariant
figure 4. The da taIFR-trend due to the
TTT-plot for both data sets is
of the first leakages provide
nearly eoncave TTT-plot.
shown in
a slight
The da ta set of the survival
several times and stays then
exponential behaviour for the
times crosses the diagonal
elosely to the diagonal. An
survival data however seems to
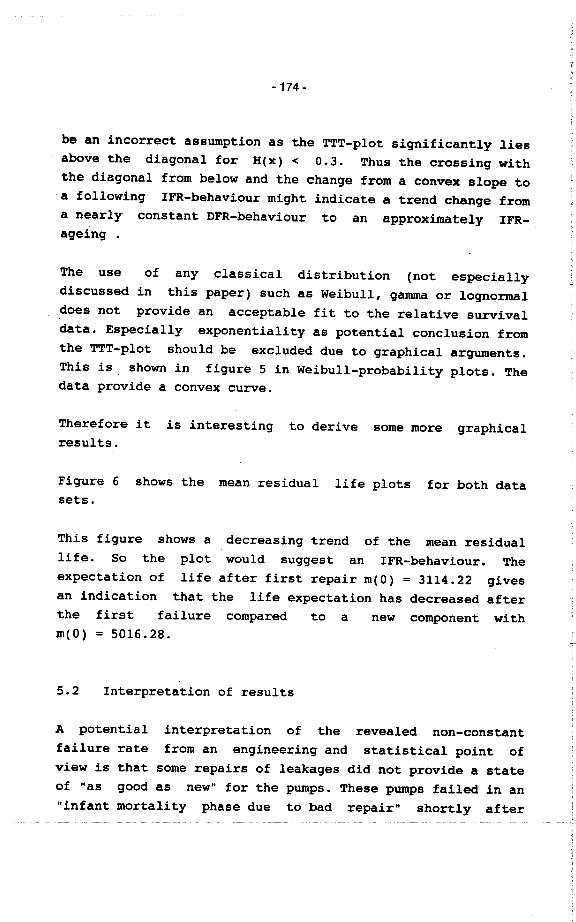
-174 -
be an incorrect assumption as the TTT-plot significantly lies
above the diagonal for H(x) ~ 0.3. Thus the crossing with
the diagonal from below and the change from a convex slope to
a following IFR-behaviour might indicate a trend change from
a nearly constant DFR-behaviour to an approximately IFR-
ageing .
The use of any classical distribution (not especiallydiscussed in this paper) such as Weibull, gama or lognorml
does not provide an acceptable fit to the relative survivaldata. Especially exponentiali ty as potential conclusion from
the TTT-plot should be excluded due to graphical arguments.
This is shown in figure 5 in Weibull-probability plots. Theda ta provide a convex curve.
Therefore i t is interesting to deri ve Borne more graphical
results.
Figure 6 shows the mean residual life plots for both data
sets.
This figure shows a decreasing trend of the mean residual
life. So the plot would suggest an IFR~behaviour. Theexpectation of life after first repair m( 0) = 3114.22 gives
an indication that the life expectation has decreased after
the first failure compared to a new component withm(O) = 5016.28.
5.2 Interpretation of resul ts
A potential interpretation of the revealed non-constant
failure rate from an engineering and statistical point of
view is that some repairs of leakages did not provide astate
of "as good as new" for the pumps. These pumps failed in an
"infant mortality phase due to bad repair" shortly after
- 175-
restart of operation providing a DFR-trend of the failure
rate. Those pumps which were repaired successfully returnedto their .. inherent " ageing behaviour which is of IFR-character.
6. Sumary and conclusion
The exponential ageing model plays a dominant statistical
role in the PSA-framework. The experience with many data
analyses however shows that the arbitrary and uncontrolled
acceptance of this model might produce strongly biassed oreven meaninglless statistical results (e.g. in fault tree
quantifications). Therefore this paper has recommended some
graphical "checks" which as weIl provide a data documentation
and a validity assessment concerning constant ageing. The
practical construction and interpretation of these graphical
representations do not require a large amount of statistical
theory. Therefore they can serve at least as basic analysesfor further investigations and" decisions if significant
ageing' properties were detected.
RWE intends to incorporate these graphical analysis options
wi thin a statistical software package for da ta analyses.
These tools shall support the data analyses in PSA-studies
and shall also serve as adecision support concerningtechnical or logistic activities.
-176.
7. Li terature
/1/ Safety aspects of nuclear power plant ageingIAE-TECDOC-540, Vienna 1990
/2/ Vesely W.E.Risk evaluations of aging phenomena: the linearaging reliability model and extensionsNUREG/CR-4769, April 1987
/3/ Lawless, J.F.Statistical Models and Methods for Lifetime DataWiley, New York, 1977
14/ Härtler, G.Statistische Methoden für die ZuverlässigkeitsanalyseVEB Verlag Technik, Berlin, 1983
15/ Hall, W.J., Wellner, J.A.Mean residual lifein: Statistics and Related TopicsCsörgö, M. et al.. (Eds.)North-Holland Publishing Company, 1981
16/ Guess, F., Hollander, M. Proschan, F.Testing exponentiality versus a trend changein mean residual lifeThe Annals of Sta tistics, Vol. 11,No. 1, S. 1388-1398, 1986
17/ Barlow R.E., Campo R.Total time on test processes and applicationsto failure da ta analysisin: Reliability and Fault Tree AnalysisSIAM, Philadelphia, S.45L-48L
18/ Bergman, B., Klefsjö, B.The Total Time on Test Concept and Its Use inReliabili ty TheoryOperations Research, Vol. 32, Nr. 3, 1984
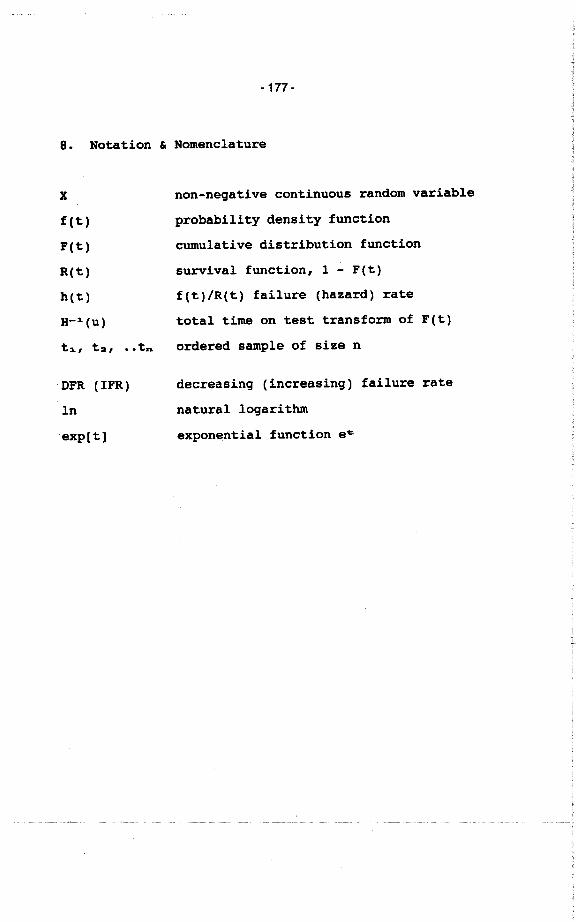
-177 -
8. Notation & Nomenclature
X
f(t)F(t)R(t)h(t)H-:i(u)
ti, t2, . .tn
DFR (IFR)
In
exp(t)
non-negative continuous random variable
probabili ty densi ty functioncumulative distribution function
survival function, 1 - F(t)f(t)/R(t) failure (hazard) rate
total time on test transform of F (t)ordered sampIe of size n
decreasing (increasing) failure rate
natural logarithm
exponential function e~
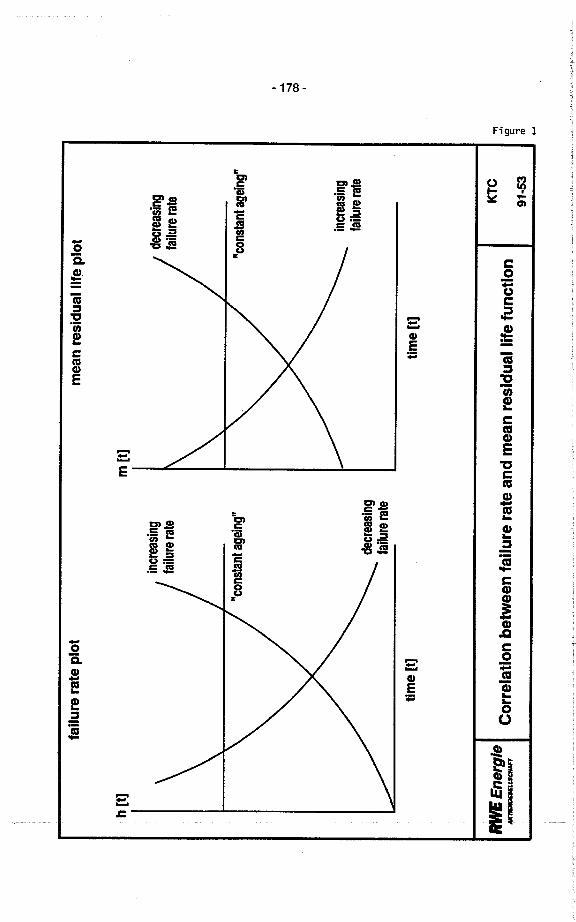
failu
re r
ate
plot
h (t
l
incr
easi
ngfa
ilure
rat
e
"constant ageing"
decr
easi
ngfa
ilure
rat
e
time
(tl
mea
n re
sidu
allif
e pl
ot
m (
tl
decr
easi
ngfa
ilure
rat
e
"con
stan
t age
ing"
incr
easi
ngfa
ilure
rat
e
time
(tl
ØW
Ene
rgle
ÁI_
USC
HK
TC
Cor
rela
tlon
betw
een
failu
re r
ate
and
mea
n re
sidu
allif
e fu
nctio
n91
.53
, .. ~ ,
." ... '" c: ñJ ..
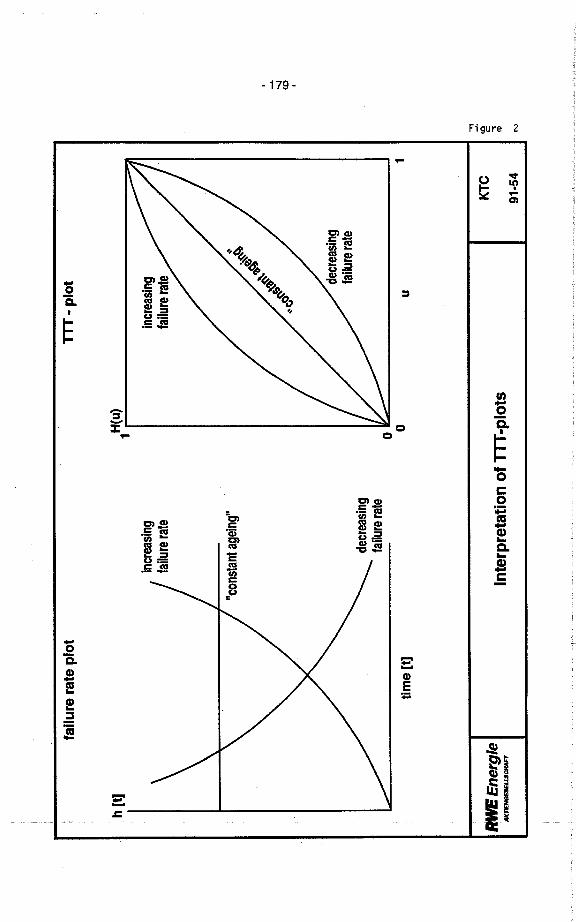
ÕiS
i
l:
Õë.S!!.2:e
- 179-
..
::
os:t..
~s-ëñ I!cu CD~ ..u .2CD .-'i J!
E
CIE;:
E
.i
Figure
~ein..Øl
~.2c.
~õco:;!c...S.5
.S:
~iil i...
IJ
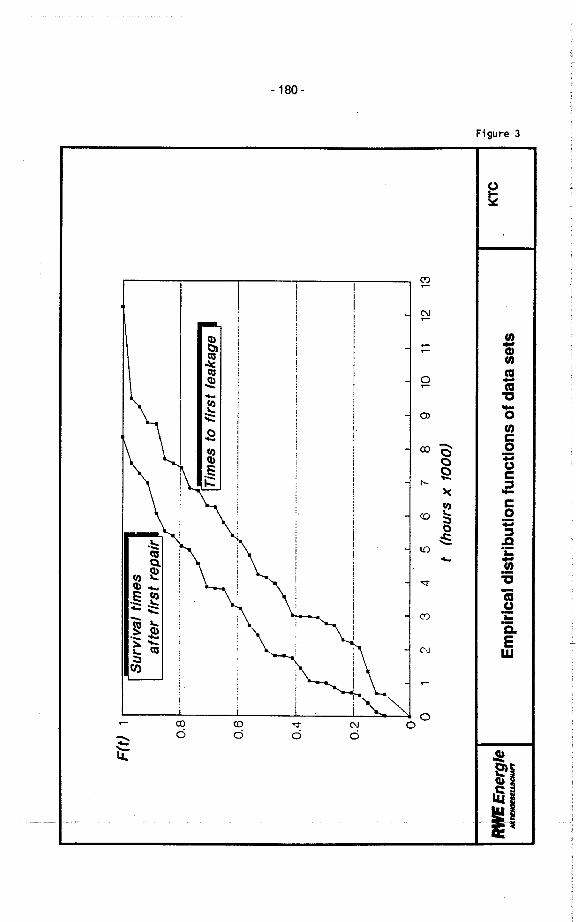
F(t) 1
Surv
ival
fir
nes
afte
r fi
rst r
epai
r
0.8 --------------
0.6
0.4
----
----
.-~.
__...
_.__
._.._
.. ._
._ _
_._.
._._
__.._
_._w
..__
____
_._.
._ -
--I
2 3 4 5 6 7 8 9 10 11 12 13
t (hours x 1000)
RW
Ene
rgle
NfJ
J_K
TC
Em
piric
al d
istr
ibut
ion
func
tions
of d
ata
sets
I .. o: o ,
~ co c: ~ w
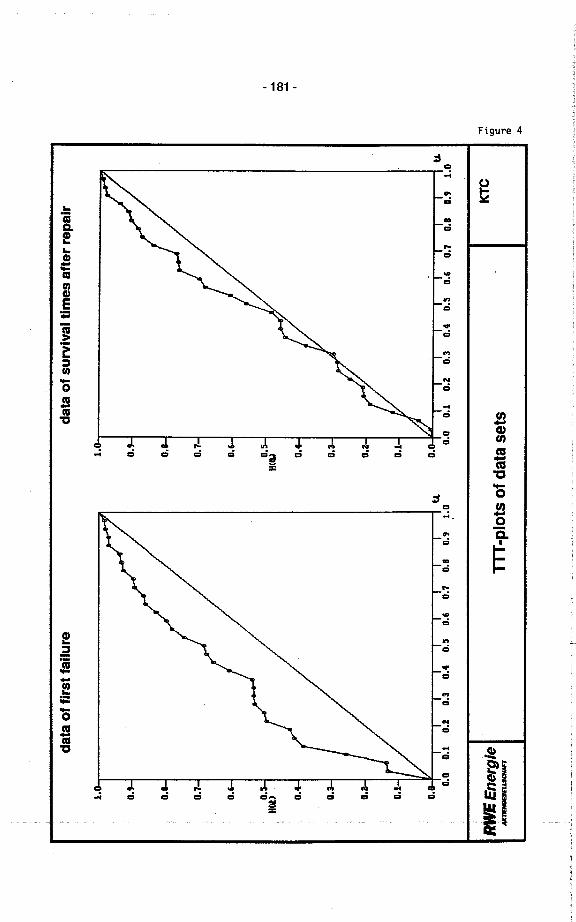
data
of
firs
t fai
lure
data
of
surv
ival
lim
es a
fter
rep
alr
1. O.
HIt
) O.I I
I I I
I I I
I0.
0 0.
1 0.
2 0.
3 0.
4 0.
5 0.
6 0.
7 0.
8 0.
't.
1:0
KT
CR
WE
nerg
ie-1
J1
1. O.
HllU
O. i 0.
00.1 0.2 0.3 0.4 0.5 0.6 0.7 0.8
u.0:' i:
TT
-pl
ots
of d
ata
sets
, .. (X ..
3! ca c: ;i .i
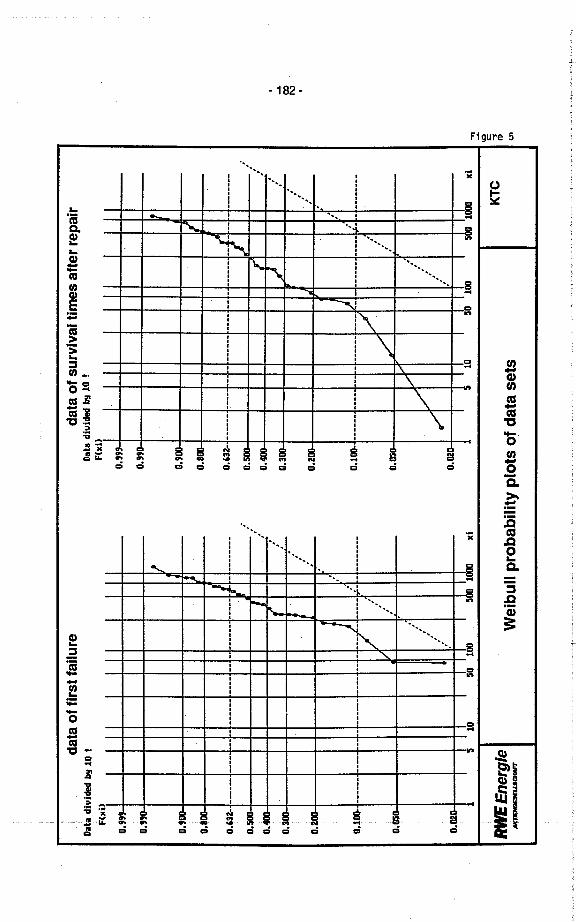
data
of
firs
t fai
lure
data
of
surv
ival
tim
es a
fter
rep
air
Dat~ divide Ii 10 !
Dala divide ii 10 !
"(xU
F(xU
0"""
0.".
O",
'A0.
"",
I'
0.9"
"4
0.'''
0.8"
")
0.8"
"I
0.63
2---
----
----
-- -
----
----
----
.. --
----
._--
-l..
----
----
0.63
2---
----
----
-- -
----
----
---- -
----
--f-
- -
----
----
0.5"
"0.
5""
.
/,l
.:
O.~
"".
0.."
".
l'.
.;.
.
o.~"
".
0.3"
"
..
o.~-
.0.
2""
..
).:
0.11
1--
----
----
-- -
----
----
---- -
----
-.;-
.. --
----
--0.
111
---.
._..
----
--..
----
_..
;;J.
.. --
----
----
-.;:
.. ...
....._
---
..
.
/.
/.
.0.
05"
.0.
0:"
.
".:
,/.
/. .
:.
r'.
0.02
".
O.O
iA
1050 111
511
100
xi10
5011
151
1 10
0xl
RV
Ene
rgle
KT
C
ilCH
Wei
bull
prob
abilt
y pl
ots
of d
ata
sets
.. ~
3! 10 i: ;i U1
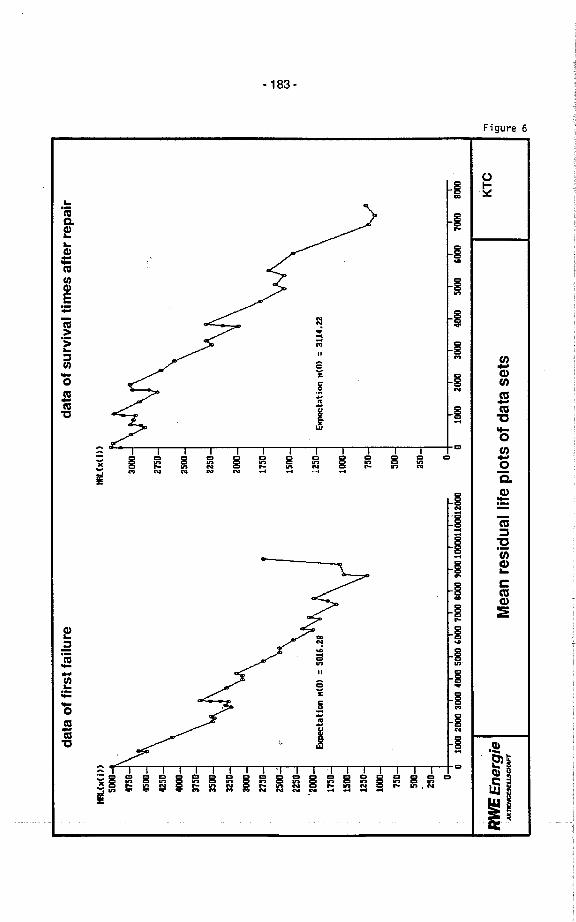
data
of f
irst f
ailu
re
ii(x( j)
5l1
4750
4500
4250
4l1
3750
3500
3250
3l1
2750
2500
.
220
'2l1
1750
1500
1250 ll1 750
500
250 o i I I I I I I I I I I I,
o ll1 2l1 31J 4l1 5l1 '00 7l1 8l1 9l111111l112l1
Extation "(0) = 5016.28
data
of
surv
ival
tim
es a
fter
rep
air
1I(K
(I))
300
270
2500
220
211
1750
1500
1250
Extation "(0) = 3114.22
oÒ
1ii
2ii 3
ii 4i
i 5ii
,ii 7
ii 8i
i
RW
EE
nerg
ieA
lnE
SEL
UlC
HFT
Mea
n re
sidu
al li
fe p
lots
of d
ata
sets
100
750
500
250
KT
C
.. o: CA
~ ui c .. In '"
-184 -
SKiSTATESS KÄ'õKRISSPEKTJOSs.dJh Sueloar Powor I""poetoralo
SKA PROMEMORI SR. 91:3 SKJA.PM 91:3I\"KSIK-I (91)6
April 2, 1991
Gunnar Johanson, Swedish Nuc1ear Power Inspectorate (Consultant)
DRL\IT REPORT FOR COMMENTS:
NKS/SIK.l PROJECT REPORT:
TIME DEPENDENCIES IN LPSA MODELS
The Nordic research project "Safety Evaluation, NKSJSIK-1" (1990-93),Project re port NKS/SIK-I (91)6.
DistributionlDRA FOR COMMENTS:Bo LtAn SKI. Lonnrt CarlsMln SK., Chrltor karl.son SKI, Jao Holmborg VT/S.Ül. Ka La VTIS J SadstedtRokon. 1: BERG Roleoo, llk Slomtlä sn:ii La Gu."11 Valloorall Yogo FIIn Vatii Toma EIo SydkM.ur1Z Gärdiogo OKG. ~Ilktl Landtliu. OKG. Kurt Pöro StucJ.Ik. Tuomas ~lanmoA'..pla

- 185-
ABSTRCT:
The objectives with this report are to describe the basic principles cf time dependent modellingin LPSA Practical reeommendations has been genera ted on what to inc1ude in the models andhow to avoid unnecessarymodel expansions. It is possible that detailed tjme dependencyanlyes require too much resourees to be inc1uded in the standard PSA Some of whieh are
1yica for Iivig PSA applieations and must be inc1uded. It is foreseen that a LPSA modelmust treat time dependencies in a much more complete way than a eonventional PSA modelused for risk verification. Many important aspects on plant risk are time dependent. If theLPSA failure models are eompatible with the operating experienee this leads to a greater eon.fidence of PSA results.
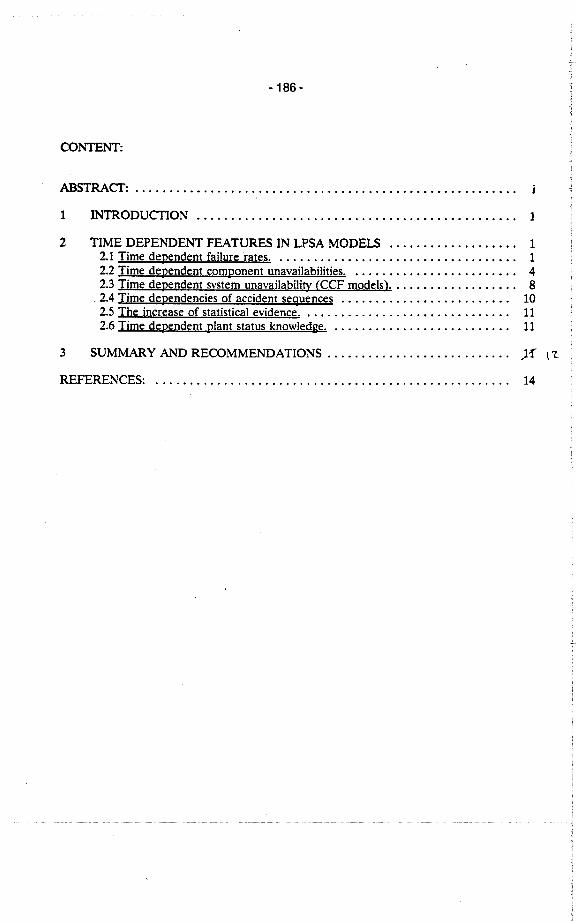
- 186-
CONTNT:
ABSTRCT: ........................................ ........ ........
1 INTRODUCTION. . . . . . . . . . . . . . . . . . . . . . . . . . . . . . . . . . . . . . . . . . . . . .. i
2 TIME DEPENDENT FEATURES IN LPSA MODELS ................... i2.1 Time dependent failure rates. ................................... i
2.2 Time dependent component unavailabilities. ........................ 4
2.3 Time dependent system unavailability (CCF models) . . . . . . . . . . . . . . . . .. 8. 2.4 Time dependencies of accident seguences ......................... 10
2.5 The increase of statistical evidence. .............................. 11
2.6 Time dependent plant status knowledge. .......................... 11
3 SUMMARY AND RECOMMENDATIONS . . . . . . . . . . . . . . . . . . . . . . . . . .. )1' \ 1.
REFERENCES: .................................................... 14
-187 -
TIME DEPENDENCIES IN LPSA MODELS
1 INODUCriON
The objectives with this report are to describe the basic principles oftime dependentmodeJlng in LPSA. Further, practical recommendations has been generated on what toinclude in the models and how to avoid unnecessary model expansions.
A LPSA model must treat time dependencies in a much more complete way than aeonventional PSA model used for risk verification. Many important aspects on plant riskare time dependent therefore is it necessary to incJude these aspects when developingthe LPSA model to enable a more flexible use. If the failure models are compatible withthe operating experience this leads to a greater confidence of PSA results.
The recommendations in this report discuss different development aspects, for modelsand codes, for further development in the SIK-l project.
2 TIME DEPENDENT FEATURES IN LPSA MODELS
The basic features in LPSA models has been generated through a survey of a numberof references dealing with this. subject. The overall outJine for this section is based onwork done within the RAS-470 project (ref. 1). The outJine has been expandedto take additional time related aspects into account. In Table 1 the overall outJine issummarized.
2.1 Time dependent failure rates.
Time dependent failure rates has effects on the component failure probability and initia-ting event frequency.
Usually the time dependency of failure rates of individual components does not have avery strang impact on the core damage frequency, but the failure rates of a set ofeomponents may increase simultaneously which might strongly affect the final result.
The ageing mechanism (and the learning mechanism)can be monitored for componentswith short mein time between failures. Other components , e.g. piping, have rather JODSlife length is much harder or impossible to monitor because the operational failure eventexperience is missing.
.Diferent mechanisms can be identified in operation al data analysis the main problemis to identify deteriorating components as early as possible.
Ageing.
The ageing process is slow (years) compared to other tyes of time dependencies in theLPSA. Operating experience and data trend analysis must be used to identify the failure
~ .. .mechanism.ltis..noLne~c.essaryJoJr~.ealJhisjnJheLpSA~()the!Jhallt()..gi",e~P!i()ritiesto
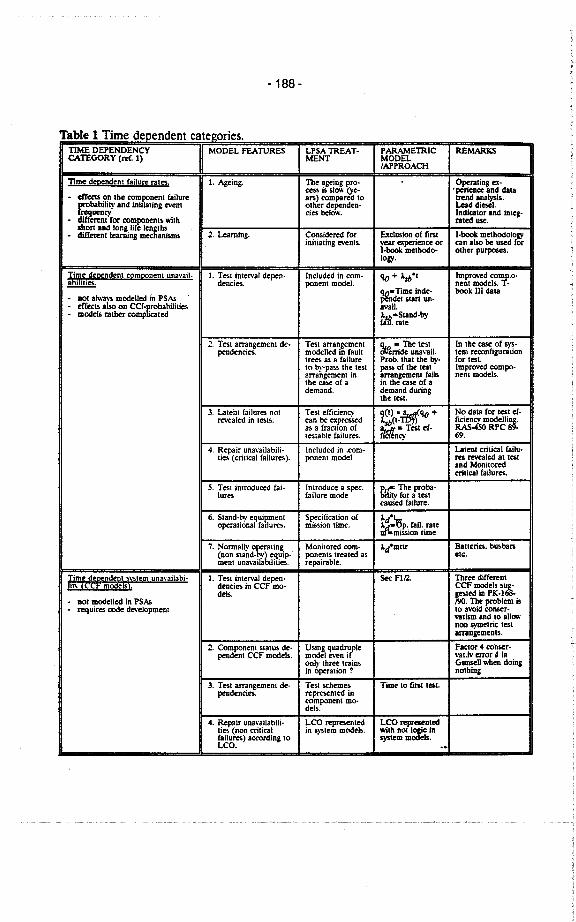
- 188-
'1 bl 1 T d da e ime eDen ent categories.
TIME DEPENDENCY MODEL FEllRES LPSA lREAT. PARElRlC REMACATEGORY (tef. 1) MENT MODEL
¡APPROACH
Time dopndeni faiJure rales. 1. Ageing, The .geing pro- Opraling Cl-
effec on ihe componeni faiJurece. i. .10.. O'e. . peence .nd c1ia- ...) cornpared 10 irend in. lyis.
5babil~' ind inilialing ."eni
oiher dependen- Led diesl.llCDev cies bei",'. IndiCllor and inieg.. dU erlfor comirneii. lTiih iaied 11.
sbon ind long li e lenglhs2, Leming. Considered for Exclu.ion of Ci..1 ~~~i,m~h='r
. dicrnl lcaing mee .nismsinitiaiing evcnls. vcr exence or
l.bok meihodo- oiher pur.logy,
Time dependent tomponent unavail- 1. T esl inier"al depen. Included in corn- 'l + 1.b.1 ~~li~e~ml.0'abilities. dencies. poneni modeL.'l- Time inde. bok ii diia
- nol il\'I'S modelIed in PSAs pendei sian uno- effeei. ils on CCf,crobabililies lvaiL.. modls 13ther cap 'caied~'r~::nd-by
2. Test arrangemeni deo Tesi .rr.ngemeni:w';d~:n~~i1,
In ihe case of S)'S.pendeneies. modelIed in f.ult ier renriguratiOn
tr~ 85 a Cailure Prob, ihai ihe by. foriesi.10 by-pass Ihe lesl Jl of ihe lesl Improvd campo.arrngement In imngemeni fails nent models.thc ca~e of a in ihe case of idemand. demind durng
Ihe iesl.
3, Laieni laiJure not T esl emeiene\' q(i) ';f'l + No diia for lesl er.revcaled in tests. ean be exresd 1.b(l' ~.z8'Ri~i~:a. a fmeiion of
~&l oe Tesl ef.testable failures. i ncy 69.
4, Repair una\'ailabil. lncluded in .com- Laieni .riiical failu.lies (eritieal failures). poneni model re reealed allesi
ind Moniioredmikal failure.
S, Test inirodueed fai- Introduce 8 spec.Clf lo~ ."~~i:-lures failure modecaušd failure.
6. Stand-by equip'meni Speciliealion of ld.1operaiional fatlure. mission time. ld-6p" fail. .13110
m-mission i,me
7. NormalI" o~rating Moniiore com- ld.miir Baiieri... bllba..(non siand- .'~ equip- ponent5 treated 85 eie.ment unavaila iliies. repairable.
Time del;ndent svstem unavailabi- 1. Tesi inie,,'a) depen. Se Fia. Th.. differeiht\ (ce mõdels i. den eies in CCF mo- CCFmodelss~
deh, ~ted in PK.1 .. noi modeJled in PSAs . The problem is-
reuire coe d",..lopmenl 10 avoid consr-viiism and 10 .lIownon syeirie leslarrngemcnl$.
2. Component status de. V.ing qu.druple Fac:or 4 rollser.pendeni CCF models. model even if ''BI.iv err á la
onl\' thr~ trains GuiiU wben doin¡in óperation ? noihing
3. T esl arrangemeni de- Test ..hemos Time 10 MIlesi.
pendencies. reprenled incomponent mo-dels.
4. Repair una\'aiJabili. LCO repreled LCO reledlies (non mikal in 5)'Slem models. wiih not ~e infailure) .ecording 10 syiem m els.LCO. ..
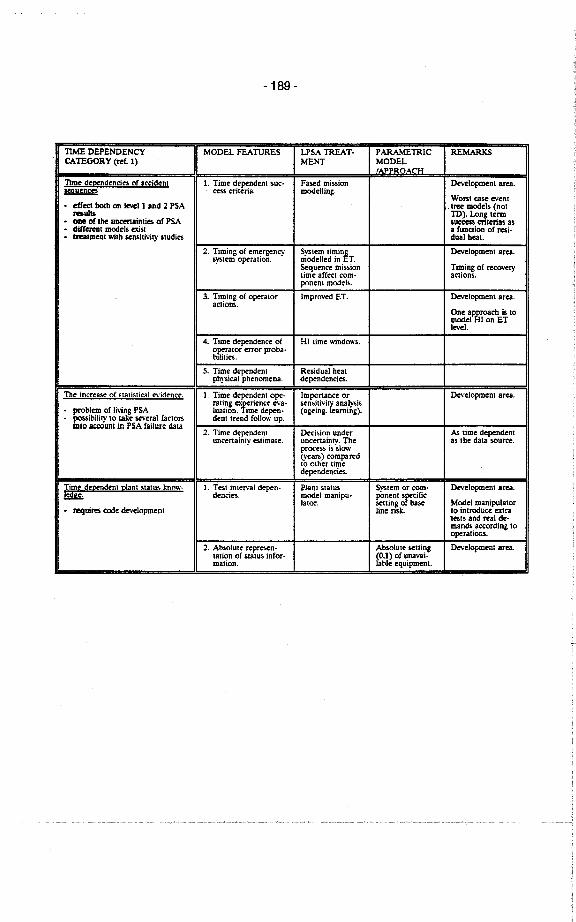
-189 -
TIME DEPENDENCY MODEL FETIRES LPSA lREAT. PARElRIC REMAKSCATEGORY (ref. 1) MENT MODEL
/APPROACH
Dme depndenciei of 8ccideni 1. ~~e~~;:~ent $UC. Fased mission Deelopmeni are.seuence modellng.
Wont case evenl. efec ,"ih on levl 1 and 2 PSA .1.. modei. (noire.. lD). Lons ierm. Ol of IM uDemainti.. of PSA succ enlenas as. differt models exSI a funciion of rej... tnimcai witb 5eitiv~' siudies dual h..t.
2. Timing of em~rgency~~~~e~~~nh
Delopmeni are.sytem operauon.
Seuence mi~ion Timing of recoerytime affeci ('orn- actions.ponem model..
3. Timing of operaior lmproved ET. Delopmeni ar...actions.
~oâe~PÅ~~hE~ tolevel.
4. Time dependence of HI time windO\'S.0P.raior eror proba.bilities.
S. Time dependeni Residual h..tphysical phenomena. dependencl...
The ¡n('rease of staiistical t"idence. 1. Time dependem ope. Imponance or Developmeni are.rating exfirience e'V8- sen!iitivitv 8nal~js
. prblem of livng PSA IU8lion. ¡me depen. (ageing. iearniñg).poibilty 10 take seeral faciors deni irend follow up.1D0 aauni in PSA failure data
2. Time dependem Deci!iion under k. iime dependemuncenainiy estimate. uncenainty. Tbe IS the dal8 source.
procss 15 5100'
(Yean.) compa red.10 other timedependencies.
Time -deoendtnt plant Maiu~ knO\'. 1. Tesi inte,..al depen- Blaßt status Svstem cr com. Deelopment ar...& dendes. model manipu- pOnent S~C:ifClatar. ..t1in~ 0 base Model manipulaior
. reui~ coe dC\..lopmenl line nsk. 10 introu.. exralests and real de.mands. acc:ording tooperations.
2. Amolutt reproen. Abslute ..t1ing Deelopment are.tation of stallß in!or. (0.1) of unavai-mation. lable equipmeni.
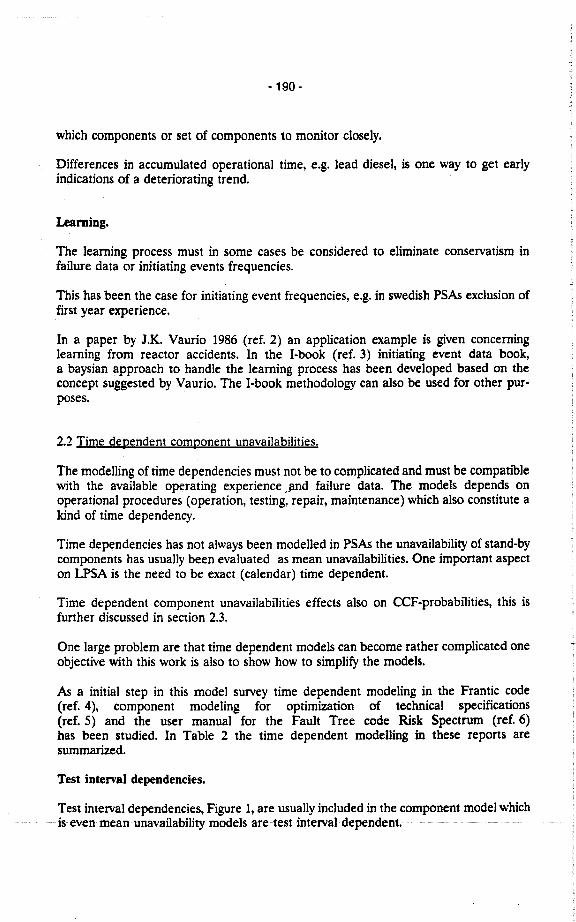
- 190-
which components or set of components to monitor closely.
Differences in accumulated operational time, e.g. lead diesel, is one way to get earlyindications of a deteriorating trend.
Leming.
The learning process must in some cases be considered to eliminate conservatism infailuTe data or initiating events frequencies.
This has been the case for initiating event frequencies, e.g. in swedish PSAs exclusion offirst year experienee.
In a paper by J.K. Vaurio 1986 (ref. 2) an application example is given concerning
learning from reaetor accidents. In the I.book (ref. 3) initiating event data book,a baysian approach to handle the learning process has been developed based on theconcept suggested by Vaurio. The I-book methodology can also be used for other pur-poses.
2.2 Time dependent component unavailabilties.
The modellng of time dependencies must not be to complicated and must be compatiblewith the available operating experience Jlnd failure data. The models depends onoperational procedures (operation, testing, repair, maintenance) which also constitute akind of time dependency.
Time dependencies has not always been modelled in PSAs the unavailabilty of stand-bycomponents has usually been evaluated as mean unavailabilties. One important aspecton LPSA is the need to be exact (calendar) time dependent.
Time dependent component unavailabilities effects also on CCF-probabilties, this isfurther discussed in section 2.3.
One large problem are that time dependent models can become rather complicated oneobjective with this work is also to show how to simplify the models.
As a initial step in this model survey time dependent modeling in the Frantic code(ref. 4), component modeling for optimization of technical specifications(ref. 5) and the user manual for the Fault Tree code Risk Spectrum (ref. 6)has been studied. In Table 2 the time dependent modelling in these reports aresummarized.
Test interval dependencies.
Test interval dependencies, Figure 1, are usually included in the component model whichis~evenmeanunavailabiltymodelsaretestintervaldependent; ... ~ .~ -~~
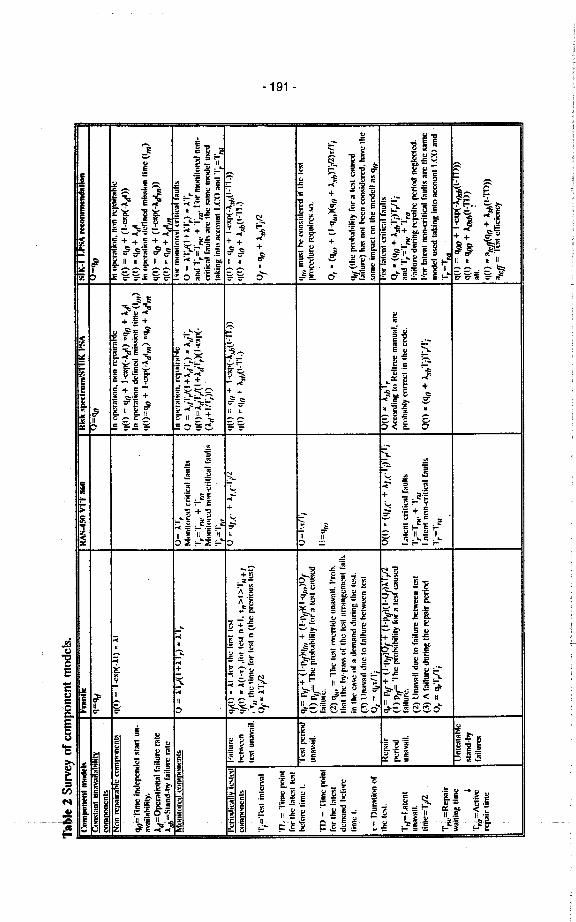
Tab
le 2
Sui
vey
of c
ompo
nent
mod
els.
(:op
niw
nl m
nhtn
inlk
KAS454 Vl" lI
KI,k '..lru""i"liK l'1I
SIK
.I 1.
l'1I m
",..
I
(iita
nt u
naai
a'IV
q-qd
I U. '111
IQ~q
oco
tnpo
ncls
IJn
t'Mlrn
hlc
co(X
nt~
q(i)
- 1-
C,l'
p.i)
= À
II n
(lJ
lrntln
n~ n
un r
epal
Nll1
lCI
In n
"ern
lio. n
n rc
"",r
i
qof
11m
e ¡n
depe
l .la
l1 u
n-'1
(1)
~ q
ii +
l-cp
(-l,¡
) .q
o +
l,¡
q(i)
= '1
11 +
(I-
cp(-
l,¡))
In n
pern
linn
defi
ned
mi"
,ion
lime
(Im
)'1
(1)
. qo
+ l,
¡""
il.lti
lily.
'1(1
)='1
0 +
1-C
p(-À
Jm)
.'1 +
ÀJm
In n
"erd
linn
defin
c m
..Ñ'"
Iime
(Im
)
ld:= Opciiol laUure rate
q(i)
= '1
+ (
1-cp
(-lJ
m))
ls6=
Slnn
d-11
r.il
"'"
rnle
q(l)
. qii
+ l.
..MMÜmlnreil c.:nml'N)ncnls
QÀ
ll( I
H'I~
) . À
'I~0
ÀT
,in
(lll
\'r..t
lOn~
rC
I'31r
ill'C
!'nr
num
il"'."
C"I
"'A
1 I'.
ii.M
cmiln
re c
ritÏlJ
lI rn
uli!'
o =
À¡"
,J(
I H'¡I
~)
. "tÍl
~°
~ À
'lt(1
H'I~
) . "
'I~'I~~T"" + '1",
'1(1
)=1'
¡1',J
( I
+ lt
Íl~)
( I,
,'xp(
-:m
d 1~
~T""
+ l~
Q' "
or m
tinilo
n...
non.
MC
lßill
lll:,j
Otll
-crit
ical
faul
ts(À
,¡+
Ifl
~)i)
crili
enl I
nuII.
are
Ilte
..m
c nu
"'el u
s1~
~1~"
iaki
n¡: i
nln
...."
"nl I
.CO
nnd
'I~
~T
_
Ilci
"(K
fic_
llly
1l~1
t.'t
I !',
illir
e(1
ft) il
11
.tur
l~lC
lirs
l (c:
sl .
.!)
= 'I
'.e +
1U
.T¡l
l'1
(1)
- '1
11 +
1""
I'-À
.1.,\
I-T
I.))
'1(1
) --
'111
+ 1
.."1'
\ -À
.,b(I
-TI.
))l't
iinllu
ncnt
st"
CIW
t'Cß
'ílI)
. 1(
1-.)
.1'"
1''5
1 n+
l. ',,
::1::1
,,+1
,1(1
) =
'111
+ 1
.",(
1.'1
1.)
'1(1
) . '
10 +
1,,,
(1-'1
1.)
lc;t
lInav
ßil.
. '"
Ihe
lime
Inr
1''5
1 n
(Ihc
,,":
"inu
. les
l)l¡=T",1 inieivai
°1.1
1/2
01. '10 + 1.",1'2
'11;
= 'l
íme
ponl
r", l
he la
l.'51
lesl
i.lor lime i.
"'51
pe""
"'1
1 "'1
+ (
I-I'i
rl'i",
+ (
1-1"
1)(
I-(I
''')!)
io oE.ri¡
'1'0
mu.
1 i.
".n.
ider
c ir
ihe
1"'1
un;iv
ail.
(I)
P,l"
Thc
I'rn
h"lti
lily
rnr
a Il
'5l c
""""
I'met
:dii"
, n.'l
uirc
sn.
'n? ~ '(ïme poinl
failu
re.
1:.=
(1",
rn~
Ihe
lal"
'l(2
) qi
" ~
'Ibe
1''5
1 ""
emde
un.
vail.
I'",
it.0,
. (q
i" +
(1-
l1,,)
(qll
+ À
,rb)
'I¡f2
).,I'
;dd
nand
hcf
orc
IImt l
ltc lt
,I'''''
s nr
Ihc
lesl
"rr
"nge
mcn
l r"il
,li~
cl.
in ih
t' i'a
sc u
r a
dcm
and
durin
g th
c Ii~
t.'li
f (1I
1e p
rnba
hilii
y ru
r n
1''5
1 ''A
o...'
'(:
) \ln
""il
diie
10
lailu
re "
"Iw
,:en
1"'1
r.t1
ure)
ha.
nol
lt c
on.il
en."
', h"
" Ih
et ~
flur
niio
n or
0, ~ '1,,"';
""m
e im
""ct
nn
Ihe
mod
ell n
. qi~
ihe
"'51.
I(C
""ir
'Ir 1
"1 +
(1-
1'11
)1)1
+ (
1-1'
11)(
1-~
)l'I'
,_0(
1) =
('I/
.e +
AU
'l¡)i
¡I¡
O(l). A.lbl~
'ur
..IeR
t enl
ic.il
fau
I15
T'¡~
I.al
enl
perì
'"(I
) P
il" .1
be
I'"w
"lti;i
y rn
r a
I""
''AU
''''A
cmnl
ing
In R
eltn
:e m
anua
l, nr
e0r . (ao + À.",T;)T,II¡
un3V
dil.
rnilu
re.
l.ale
ni m
lical
.rau
lI.
"",I
t"ltl
y ".
rrl i
n Ih
e co
e..n
d 'I~
~'I~
, + 'I
;"un
ail.
(2)
U""
U d
"e 1
0 rn
ilure
i.iw
en 1
.,1'I~
=T
I"' +
'I~
"...
ilure
diir
ing
",,,i
re p
erio
d ne
lccd
.lii
n~T
il2(~
) A
fai
lure
dur
ing
Ihe
",,,i
r pe
ri'''
1.11
enl n
on.c
rilic
al la
iilt.
0(1)
. (q
n +
l"b
'';)'1
,11'
;"'
ii la
ieni
non
-cri
lïcl l
ault.
nre
Ihe
..m
e
T,J
~Rep
ir0r
~ a
,",.i
¡l~
~l~a
mol
""
Inki
ng in
io ll
lInl
I.C
O a
odT
.~T
_W
iilin
g Ii
me
lJnl
csln
me
,1(1
)aOO + 1-Cp(-À/l(lf1))
i ..la
nd.1
1q(l) . aOO + lQr(I-ri))
T'¡=
Acl
ivra
ilu..
nll.
rcpa
ir tim
e'1
(1)
. n1r
Jqli
+ "
,,,(1
-11)
))ai
elf =
'1''5
1 ef
fcie
ncy
.. CO ..
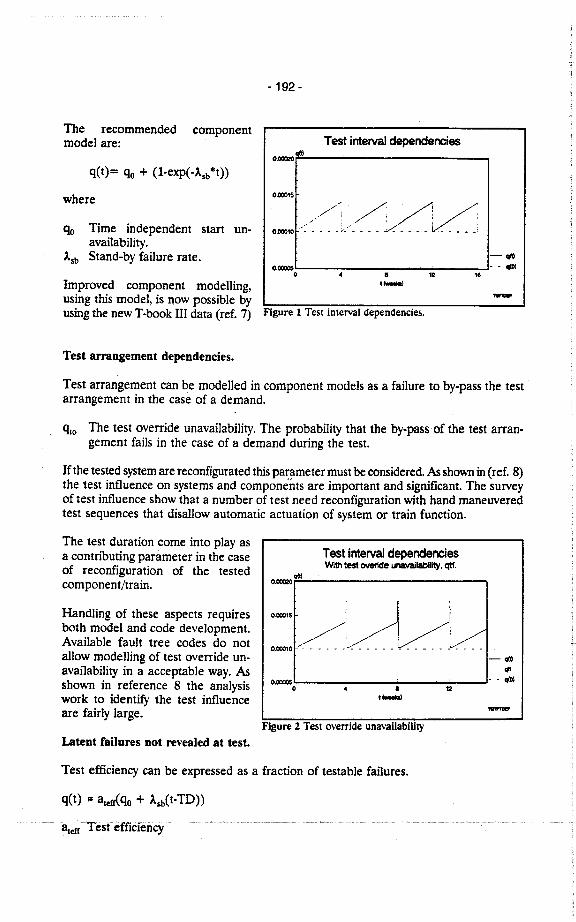
The recommended componentmodel are:
a(t)= aO + (l-exp(-Åsb "'t))
where
ao Time independent start un-availabilty.
Åsb Stand-by failure rate.
Improved component modellng,using this model, is now possible byusing the new T-book II data (ref. 7)
Test arrngement dependencies.
- 192-
Test interv depncenceso.oq!
0.00'5 ? /'./V,/¡ /':/: :0.0'0 .~'~. . . . ,...' ~ - - - ./ - _.. - :. . . . . ¡
0._o
-q(.. fI).,- 12 11 -
Figure i Test interval dependencies.
Test arrangement can be madelIed in companent models as a faHure to by-pass the testarrangement in the case of a demand.
qio The test override unavailabilty. The probabilty that the by-pass of the test arran-gement fails in the case of a demand during the test.
H the tested system are reconfgurated this parameter must be considered. As shown in (ref. 8)the test inf1uence on systems and camponénts are important and significant. The surveyof test inf1uence show that a number of test need reconfiguration with hand maneuveredtest sequenees that disallow automatie actuation of system or train funetion.
The test duration come into playasa contributing parameter in the caseof reconfiguration of the tested
component/train.
Handling of these aspects requiresboth model and code development.
Available fault tree codes da notallow modellng of test override unoavailabilty in a acceptable way. Assho\\'I in reference 8 the analysis
work to identify the test inf1uenee
are fairly large.
Latent Cailures not revealed at test.
Test interv depencencesWit les ove unlalit. qt.
o.oq!
0.0015
. r. '. liv'//1 :/~....'.._...:.._.../Q,0010
0._o
-q(.,
. . fØ.,- 12
--Figure Z Test override unavailabilty
Test efficiency can be expressed as a fraction of testable failures.
q(t) #; aieriqo + Åsb(t.TD))
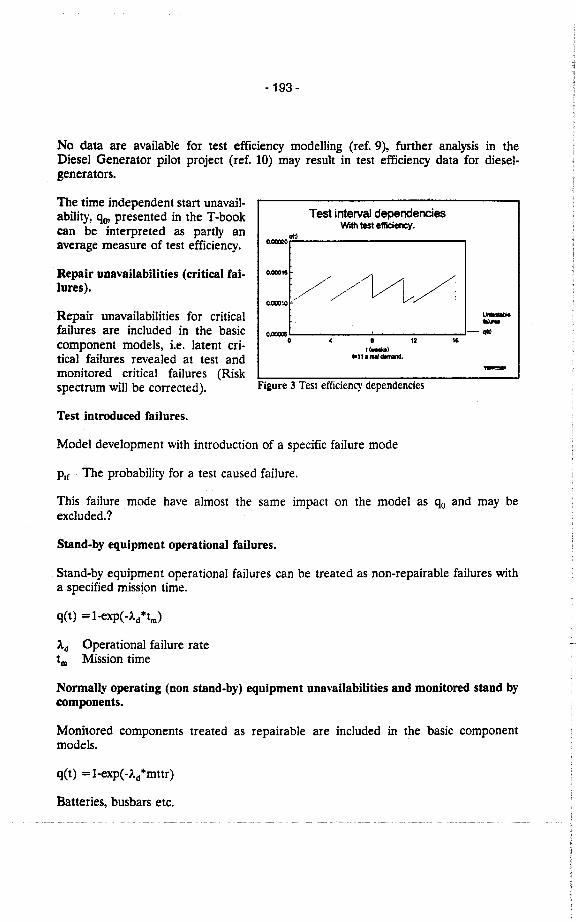
-193 -
No data are available for test effciency modelJng (ref. 9), further analysis in theDiesel Generator pilot project (ref. 10) may result in test efficiency data for diesel-
generators.
The time independent start unavaiJ-abilty, q() presented in the T-bookcan be interpreted as partly anaverage measure of test effciency.
Test interval dependencesWi tet etlen.
O.l q()
Repair unavailabilties (critical fai.lures).
0.0015
///////~/ti///0.0'0
Repair unavailabiJties for criticalfailures are incJuded in the basiccomponent models, i.e. latent cri-tieal failures revealed at test andmonitored eritieal failures (Riskspectrum will be corrected).
u-ti..qlO0.0C
o . '2,(-)"'''0II_.11 -
Figure 3 Test efficiency dependencies
Test introuced failures.
Model development with introduction of a specific failure mode
Pif The probability for a test caused faiJure.
This faiJure mode have alm ost the same impact on the model as qo and may beexcJuded.?
Stand-by equipment operational failures.
Stand-by equipment operational failures can be treated as non-repairable failures witha specified mission time.
q(t) =l-exp(-Âd*tm)
Âd Operational failure ratetm Mission time
Normally operating (non stand-by) equipment unavailabilties and monitore stand bycomponents.
Monitored components treated as repairable are incJuded in the basic componentmodels.
q(t) = l-exp(-Â/mttr)
Batteries, busbars etc.
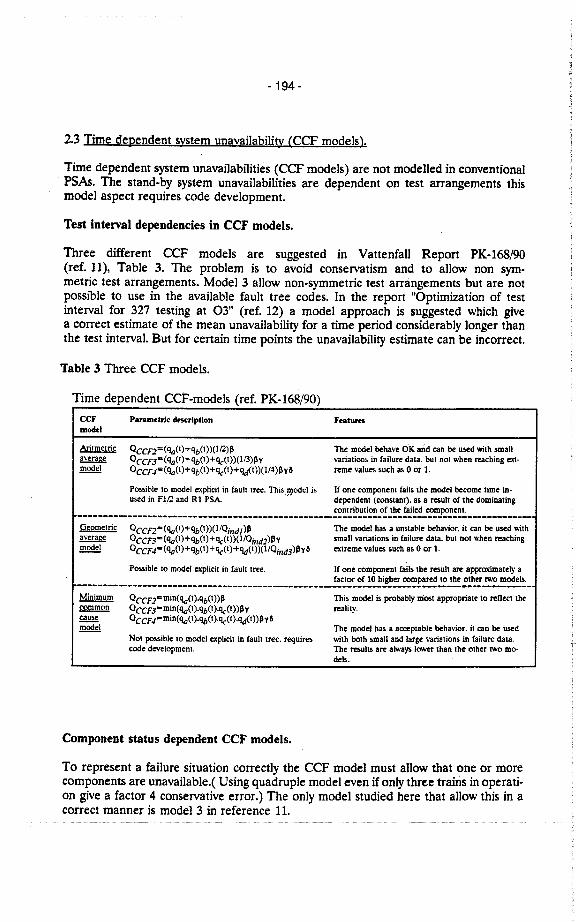
- 194-
2.3 Time dependent system unavaiIabilty (CCF models).
Time dependent system unavailabilties (CCF models) are not modelIed in eonventionalPSAs. The stand-by system unavailabilities are dependent on test arrangements thismodel aspeet requires code development.
Test interval dependencies in CCF models.
Three different CCF models are suggested in Vattenfall Report PK-168/90
(ref. 11), Table 3. The problem is to avoid eonservatism and to allow non sym-metrie test arrangements. Model 3 allow non-symmetrie test arrangements but are notpossible to use in the available fault tree codes. In the report "Optimization of testinterval for 327 testing at 03" (ref. 12) a model approach is suggested whieh givea eorreet estimate of the mean unavailabilty for a time period eonsiderably longer thanthe test intervaI. But for eertain time points the unavailabilty estimate ean be ineorreet.
Table 3 Three CCF models.
Time dependent CCF-models (ref. PK-168/90)
CCF"'00.1
Param.trle eiripllon Fealll~averagell QCCFi= ('I(I)+'l(1 ))(112)11
Q CCF3= ('i(I) +qb(I)+ 'l(t) )(1 /3)lly0CCU= ('i(I) + qb(I)+ 'l(t )+q,t) )(1/4)lly &
The model behave OK and can be ii wiih small
variaiion. in failure daia. but not when reaching ex-reme values such as 0 or 1.
Posible 10 model explicit in fault Iree. Thi. model ¡" Jf one component faUs ihe model hecome lime in-used in Flf. and Rl PSA ,,- dependeni (constani). as a reul1 of the dominaling
________..____.__.________________________._..__.__~~~ri!2~2~~!~~~!~~~_~~~~;~:_________.___~averagell 0CCFi=('I(t)+qb(t))(lIQilidJ )11
0CCF3= ('i(1 )+qb(t) +'l(t) )(1iOilidi)1l yQCCF'¡= ('i(1 )+qb(l) + 'l(t)+q,t) )(1/Oilid3 )Ily &
The model ha. a unsiable behavior. il can he use ..iihsmall variaiions in failure data. but noi when rechingextreme values such as 0 or 1.
Posible to model exlicit in fault iree. If one component faUs ihe reul1 are appraxmaiely a
-------------.---______._.___.___._________________!~~~~~~~~~~~;~~~l~:~~2~~~2~~~~~~~~~_Minimum
mm~~0CCFi= mine 'I(t).qb(t))110CCF3= mine 'I(t ).qb(t )''l(I) )IlyQccu= mine 'I(t ).'l(I)''l(t ).lJt) )Ilv &
This model is probably Diost appropriie 10 reDetI Iherelity.
The model has a accpiable beh3\ior. il can be usd..iih bolh small and !arge variations in failure data.The reults ire ilway lowr than the oiher two mo.deI..
Noi Jlible 10 model explicit in fault ITe. requir..coe development.
Component status dependent ceF models.
To represent a failure situation eorreetly the CCF model must allow that one or moreeomponents are unavailable.( Using quadruple model even if only three trains in operati-on give a faetor 4 eonservative error.) The only model studied here that allow this in aeorreet manner is model 3 in reference 11.
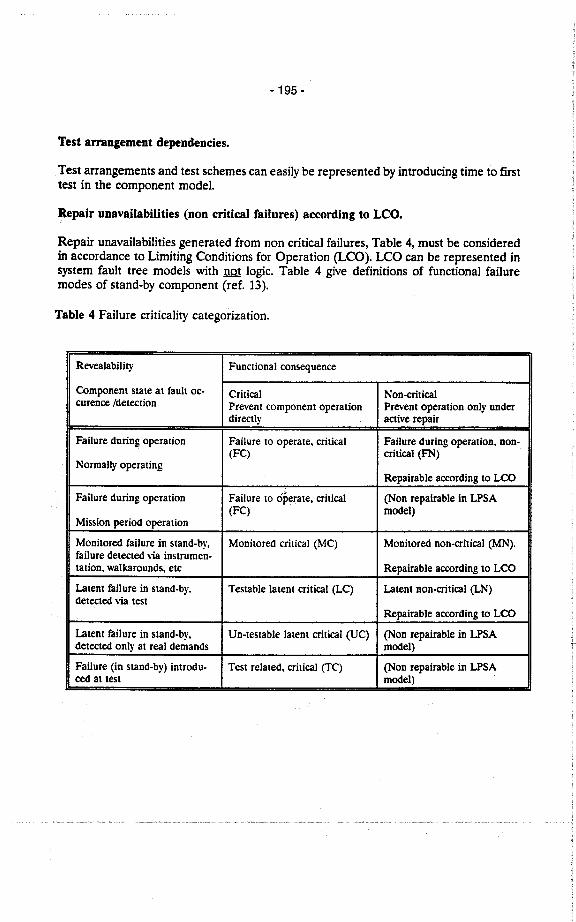
- 195 -
Test arrngement dependencies.
Test arrangements and test schemes can easily be represented by introducing time to firsttest in the component modeL.
Repair unavailabilties (non cntical failures) accortling to LCO.
Repair unavailabilties genera ted from non critical failures, Table 4, must be consideredin accordance to Limiting Conditions for Operation (LCO). LCO can be represented insystem fault tree models with not logic. Table 4 give definitions of functional failuremodes of stand-by component (ref. 13).
Table 4 Failure criticaJity categorization.
Revealability Funciional eonsequence
Component staie ai fault oe. Critical Non.crticaleurenre /deteetion Prevent eomponent operation Prevent operation only under
direetly aetive repair
Failure du ring operation Failure to operate, eritical Failure during operation. non-(FC) eritical (FN)
Normally operating. Repairable acerding to LC
Failure during operation Failure to óperate. critical (Non repairable in LPSA(FC) model)
Mission period operation
Monitored failure in stand-by, Monitored eritieal (MC) Monitored non-critical (MN).failure detected \1a instrumen-tation. walkarounds, etc Repairable aecording to LCO
Latent failure in stand.by. Testable latent critical (LC) Latent non.eritical (LN)detected vi test
Repairable aceording to LCO
Latent failure in stand-by. Un.testable latent critical (UC) (Non repairable in LPSAdetected only at real demands model)
Failure (in stand-by) introdu. Test related. critical (TC) (Non repairable in LPSAred at test model)
-196 -
2.4 Time dependencies of accident seguences
Currently worst case event tree models, not time dependent, are presented in the PSAs.Treatment of success criteria as a time dependent function of residual heat generationare only considered in a simplistic manner. This effects both level 1 and 2 PSA resultsand contribute both to the uncertainties and to the conservatism of a PSA. Sensitivity stu-dies has been used to estimate the impact of these limitations and to identify areas formodel improvements.
Time dependent success criteria.
Phased mission modelIng, Mankamo 86 (ref. 14), discuss various approachesin which also operational decisions can be included. Further, some quantificationapproaches are suggested based on conditional unavailabilties or projected unavaila-bilties.
Lang term success criteria as a time dependent function of residual heat generation areonly considered in a simplistic manner. This tye of time dependency are considered asa development area and wil be further analyzed within the SIK-1 project.
Timing oe emergency system operation.
System timing are modelIed in event trees but are dependent on the degree of detail inthe event trees. A model improvement within this area are related to phased missionmodellng, to enable a more detailed sequeJJe modeL. Sequence mission time affect com.
ponent models and are today handled by mission time specification within the componentmodel, but in the case of a sequence dependent variation of the mission time the modelsuse are not dynamic enough.
Timing oe operator actions.
Different conditions for operator action during accident scenarios can be defined morec1early by improved event tree modeling. One approach are to develop event trees thatonly use operator objectives/actions in the event tree headings and consider hardwareevent only as support to the operator objectives/actions. Tbis tye of development shouldrequire extensive model work but should address the operator situation much better, e.g.timing of recovery actions.
Time dependence of operator errr probabilties.
Tbe operator error probabilties are dependent on the time available for the operatorto understand the situation and take necessary measures. In PSA this is handled bydefinition of human interaction time windows which are evaluated using time-reliabiltyeurves and so ealled cognitive reliabilty models.
Time dependent physical phenomena.
Phenomena that come into account are those how can aggavate the situation after a. . eertain...time..oraftereertain.conditions ...are.....fulflledóOne~example.is....the....back.flush...
operation in older ABB BWR design.
-197 -
2.5 Tbe increase of statistical evidence.
A problem and use of LPSA is to give a support in decision making using relevant back-ground data and experience, The LPSA allow the possibilty to take severalfactors intoaccount such as failure experience, plant operations, design e.t.c.. Tbis experiencechange/grow as time pass on and this time dependency must be treated to a eertainextent. The process is slow (years) compared to other time dependencies but many smallchanges can aceumulate and become significant.
Time dependent operating experience evaluation. Time dependent trend follow up.
As suggested in section 2.1 operating experience and data trend analysis must be usedtO identify time dependent failure meehanism. It is not neeessary model these meehanismexplicit in the LPSA but to give priorites to which components or set of components tomonitor using importance or sensitivity analysis.
Time dependent uneertinty estimate.
It is essential to structure a given decision situation by identifyng decision alternativesand modellimitations at the same time. With a relevant decision model available¡decisionmaking under uncertainty is possible. With this as a background the decision model willalso emphasy the most significant limitations in models and data,and time dependentuneertainty estimates will come into account.
2.6 Time dependent plant status knowledge.
Failure modes ean be categorized into a few c1asses which are treated differentlydepending on our knowledge (ref. 15). In eurrent PSAs the plant status is repre-sen ted by probabilities and test intervals. By using these para-meter one ean express an average risk for mainly risk verifea-tion purposes. When trying to expand the PSA model into riskfollow up and risk monitoring the need for an more flexible wayto represent plant status increase, e.g. due to the fact that youjust know that a component works after performing an extratest.
Knowledge caie-gones:
. evdent
. hidden
Tbe main categories are evident and hidden events. Tbe stateof an evident event are known but the state for a hidden eventcould be uncertain and represent what we usually model as
basic events in PSA.
events.
Test ÌDterval dependencies.
A plant model manipulator that allow system or component specific settings of extra testsand real demands aeeording to operations.
-198 -
Absolute representation of status information.
Absolute setting (0,1) of evident events, available or unavailable equipment.
.SUMMARY AND RECOMMENDATIONS
It is possible that detailed time dependency analyses require too much resources to beincJuded in the standard PSA However, a detailed review of PSAs can lead torecommendation to incJude time dependency analyses of some specific issues. Some ofwhich are tyieal for Living PSA applications. A LPSA model must treat timedependencies in a much more complete way than a conventional PSA model used forrisk verification. Many important aspects on plant risk are time dependent. if the failuremodels are compatible with the operating experience this leads to a greater confidenceof PSA results.
Different mechanisms can be identified in operational data analysis the main problemis to identify deteriorating components as early as possible. Differences in accumulatedoperational time, e.g. lead diesel, is one way to get early indications of a deterioratingtrend. In the I-book initiatiiig event data book, a baysian approach to handle the learningprocess has been developed based on the concept suggested by Vaurio. The I-book
methodology can also be used far other purposes.
Test interval dependent component modellng is possible by using the new T.book IIdata. Test arrangement can be model1ed in"component models as a failure to by.pass thetest arrangement in the case of a demand.
The time independent start unavailabilty, ao, presented in the T .book can be interpretedas partly an average measure of test efficiency.
The probabilty for a test caused failure, Plf, have almost the same impact on the modelas qo and may be excluded.
To model test interval dependencies in CCF models, the problem is to avoid conser-vatism and to allow non symmetrie test arrangements. Model 3 allow non-symmetrie testarrangements but are not possible to use in the available fault tree codes.
Component status dependent CCF models are reauired to represent a failure situationcorrect1y and must aIIow that one or more components are unavailable.
Umiting Conditions for Operation can be represented in system fault tree models using!! logic in the system modellng.
Time dependent success criteria can be modeIIed using phased mission modellng variousapproaches can be used in whieh also operation al decisions can be included. Timing ofemergency system operation reauires model improvements that arè.related to phasedmission modellng.
- 199 -
Timing of operator actions can be defined more c1early by improved event tree modeJing,
by developing event trees that only use operator objectives/actions in the event treeheadings and consider hardware event only as support to the operator objectives/actions.
Time dependent uncertainty estimate. With a relevant decision model a:vailable decisionmaking under uncertainty is possible. Such model will also reveal the most signifieantlimitations in models and data and time dependent uncertainty estimates will come intoaccount.
Treatment of time dependent plant status knowledge requires that failure modes can beeategorized into c1asses which are treated differently, i.e. evident and hidden events. Thestate of an evident event are known but the state for a hidden event could be uncertain.A plant model manipulator are required to allow system or component specific settingsof extra tests and real demands according to operations. Further, this manipulator mustallow absolute setting (0,1) of the evident events, i.e. the test outcome (available orunavailable equipment).
- 200-
REFERENCES:
1. S. Hirschberg et. al.. Dependencies, Human Interaction and Vncenainties in probabi-
listic Safety Assessment. NKA-470, April 1990.
2. Vaurio, 1.K.. Application of a New Reliabilty Growth Model that Fits Data. Scan-
dinavian Reliability Engineers Symposium, Otaniemi, Finland, October 14-16, 1986.
3. Blomquist R., Pörn K.. Initiating Event Data Book. Studsvik, To be Published.
4. US NRC. The FRAIC Code Manual. NVREG-0193. Mars 1977.
S. Laakso K.et aL. Optimization of Technical Specifications by use of ProbabilsticMethods. NKA RA450, 1990.
6. Berg V. Risk Speetrum user Manual. Relcon. To be Published.
7. Pörn K., Skagerman S.. T-Book II . Reliabilty Data Book for Components in
Swedish and Finish Nuclear Power Plants, third edition. To be published 1991.
8. Schwartz F.. Verifiering av säkerhetsfunktioner för 03, Steg 1. OKG, 3.710/90,
901102.
9. Knochenhauer M.. Development of a Time Dependent Failure Model for Motor
Operated Valves Based on Analysis of Failure Data and Testing. ABB.Atom, RPC89-69, 890920.
10. Björe S., et. al. Defences against CCF and Generation of CCF Data, Pilot Study for
Diesel Generators. SKI Research Program, To be published.
11. Erhardsson V-K. Test av nâgra tidsberoende CCF-modeller. Vattenfall, PK-168/90,901123.
12. Landelius M..Optimering av provningsintervall för 327-pumprovning i 03. OKG, 3-
518/89, 891116.
Landelius M.. English translation, Letter Report. Time Dependent ComponentModelling Including Common Cause Failures for Components subject to StaggeredTesting. 910301.
13. Mankamo T., Pulkkinen u.. Test interval of standby equipment, V1 892, September1988.
14. Mankamo T.. Phased Mission Reliability - A New Approach Based on Event Se-quence Modellng. Scandinavian Relibilty Engineering Symposium, Otaniemi, Finland,October 14-16 1986.
15. Holmberg 1. Principles of the Risk Assessment of Operating Exrience by PSAV1ISÄH, Finland, NKSISIK-1(91)2, 910123, Draft re port.

- 201 -
Human Error
Chairman: J. Mertens
- 202-
KFA-Forschungszentru Jülich GmbHInstitut für Sicherheitsforschung und Reaktortechnik (ISR)Dr. J. Mertens 27.03.1991
ISSUE PAPER
Subject: Humn Errors
1) Problem description
The safety of Nuclear Power Plants is influenced by human
errors in various manner, as operating experiences and real
accidents have shown. Therefore an adequate consideration ofhuman errors in Probabilistic Safety Analyses (PSA) is essen-
tial. On the other side the specific possibilities of the
operators - compared to safety systems - cause specific PSA-
problems, as well regarding completeness as in respect to
quant i tati ve assessement.
2) Documents stating the state of the art
Comparison and Application of Quantitative Human Reliability
Analysis Methods for the Risk Program (RMIEP)
NUEG/CR 4835, 1989
A.D. Swain
Comparative Evaluation of Methods for Human ReliabilityAnalysisGRS-7l, April 1989, ISBN 3-293875 21-5
Models and Data Requirements for Human Reliability Analysis
lAEA-Tecdoc-499, 1989
P. Humphreys ( Edi tor)Human Reliability Assessors
Oct. 1988
SRD, RTS-88/95 Q,Guide,
Poucet, A.
Human Factors Reliability Benchmark Exercise (HF-RBE), Final
Report I¡ sumary of results and conclusions
. P..E.R. 1482188; COmIission of theEYroPean ComIYni.ti.e5,Joint Research Cent re Ispra, 21020 Ispra (Va), Italy, 1988
- 203-
Reliability Engineering and System Safety (Special Issue on
Human Reliability Analysis)
Voi. 29, No. 3, 1990
3) Areas with weH established and validated methodology
Strictly spoken there is no PSA-relevant area concerning human
factors for which the methods are established and validated
(compared for instance wi th the methodology of failure trees).In respect to both the qualitative and quantitative assessment
of operator actions, the identification of possible human
failures in the course of planned actions (that means during
normal plant operation and accident control) seems to be rela-
tively practicable. Indications of such error-likely situations
are essentially a result of the systematic procedures which a
PSA generally makes use of.
4) Areas where iiprovements are necessary
Compared with the identificationof error-likely situations in
the course of planned operator actions the frequency quantifi-
cation of operator errors is less validated. Even the great
numer of operator models is a clear indication of methodologi-
cal deficiencies. Often these models include only partialaspects of human reliabili ty, and none of the models covers all
of them. On the other side there is a lack of sufficientlyvalidated reliability data regarding to operator actions. Even
though basic data are available, there is still the problem to
quantify so-called performance shaping factors which depend on
specific situations. These deficiencies cannot be redressed
easily by simulator experiments; the main reason is that simu-
lators not reflect thè real world conditions, and the raw da ta
from training siumlators have to be modified. Another method,
expert judgernent, has often a relative characteristic and needs
calibrations using 'hard' data. Therefore it is necessary to
collect such data furthermore (at the best by evaluation of
operating experiences) and to develop criteria for comparison
andtranSference;
- 204-
An additional and essential problem lies in the subjectivity of
the analysists using operator models. The related uncertainty
margins are in the same order of magnitude than those caused by
the application of different models. Possibly this.. situationcan be improved by using expert systems which standardize the
model application and make the decision process verifiable.
Analyses of beyond-design accident sequences (including acci-dent management measures) have shown substantial deficiencies
regarding the assessment of necessary operator actions. These
problems of qualitative quantitative assessment are caused
mainly by the unsufficient knowledge about the specific acci-
dent situation. Therefore the operating crew has to recognize
and decide in a stronger extent than in the course of exactly
planned action. In addition there may exist possibilities of
diverging goals. In such cases the range of action which have
to be identified and assessed is relatively wide, and there is
a need to develop criteria for identification of risk-relevant
si tuations, to formulate performance shaping factors and to
quantify such factors. This seems not possible without using
psychological approaches.
In view of the need for improvements the following issues
should be discussed:
How can operating experiences used to provide a better data
base?
How can rough data from training simulators be modified to
reflect real accident situations?
What is the best way to deminish the subjectivity of analy-
sists?If current operator models do not sufficiently address the
cognitive and psychological aspects specific to human opera-
tors, what is a practicable way to get improvements?
- 205-
Annex 1
Problem Description
The safety of nuclear power plants depends in various ways on
the human factors related to plant design, construction and
operation. During operation human errors can influence the
plant safety
as initiators of unwanted events
as an incorrect accident control action
by turning a trivial sequence into one with
serious consequences
latent as errors during maintenance of stand-by
components, surveillance tests and calibrations.
Therefore human errors have to be concidered in Probabilistic
Safety Analyses, and from previous experience human errors
contribute essentially to the unavailability of systems and to
the overall plant risk.Related to the quantitative assessment, failure during design
and construction are included in reliability da ta of- components
and system".
Concerning the identification and quantitative assessment of
operator action during operation, a classification into, planned' and ' unplanned' seems to be useful. Planned actionsare expected to be carried out by the operators during safe
operation and in the course of accident control; thereforeplanned actions have been written down (such as test- and
maintenance procedures or measurements during design basis
accidents). Planned aetions are associated with rule- or skill-
based behaviour.
In opposition to this, a desired human action can be called
, unplanned', if there is a need peculiar for cogni tion and
decision making in the case of an accident (knowledge-based
- 206-
Regarding to the quantitative assessment of human errors needed
in PSA' s, the knowledge of all relevant influences on human re-
liabili ty is important. Tyical ' performance shaping factors'
are training, control room quali ty and design, stress, avail-
able time, personal redundancy, dependencies between different
tasks and personal dependencies.
There are several models for human reliability analysis (HRA)
which have been used in PSA/PRA mainly concerning planned
actions. Such HRA methods provide useful techniques to idendify
the potential for important human errors and to design complex
systems considering human factors.
In view of the quantification of error probabili ties the uncer-
tainties are still extensive, and the possibilities to consider
all relevant aspects of human behaviour (especially the cogni-
ti ve and psychological aspects) are under discussion.
- 207-
Annex 2
. References
Swain, A.D., Accident sequence evaluation progra'i reliabi-lity analysis procedure. US Nuclear Regulatory Commission,Washington, DC, 1987.
Comer, M.K., Seaver, D.A., Stillwell, W.G.& Gaddy, C.D.,Generating human reliability estimates using expert judge-ment, Vol. 1, Main Report. NUREG/CR-3688, US Nuclear Regula-tory Commission, Washington, DC, 1984.
Hannaman, G. W., Spurgin , A. J. & Lukic,
reliabili ty model for PRA analysis.Corp., San Diego, CA, 1984.
Y .D., Human cognitiveDraft NUS-4531, NUS
Kopstein, F.F.& wolf, J.J., Maintenance personnel perfor-mance simulation (MAPS) model: User' s manual.NUREG/CR-3634, US Nuclear Regulatory Commission, Washington,DC, 1985.
Wreathall, J., Operator Action Trees: An Approach to Quanti-fying Operator Error Probability During Accident Sequences.NUS-4l59, NUS Corp., Gaithersburg, MD, 1982.
Dougherty, Jr, E.M.& Fragola, J.R., Human Reliability Analy-sis: A Systems Engineering Approach with Nuclear Power PlantApplications, Wiley, NY, 1988.
Hannaman, G.W.& Spurgin, A.J., Systematic Human Action Reli-ability Procedures (SHAP), EPRI NP-3583, Electric Power Re-search Inst., .Palo Alto, CA, 1984.
Embrey, D. E ., Humphreys , P., Rosa, E . A., Kirwan, B. & Rea,K., SLIM-MAUD: An Approach to Assessing Human ErrorProbabilities Using Structured Expert Judgement. Vol. I:Overview of SLIM-MAUD, NUREG/CR-3S18, US Nuclear RegulatoryCommission, Washington, DC, 1984.
Swain, A.D. & Guttman, H.E., Handbook of Human ReliabilityAnalysis with Emphasis on Nuclear Power Plant Applications.NUREG/CR-1278, US Nuclear Regulatory Commission, Washington,DC, 1983.
Reliability Engineering and System Safety (Special Volume on
.~'Aççigent.Seqi.eriçe.. .I1Qgelirig.:...ll\li3Jl..AçtlQris., .SysteiiResPC)ri!ìe,Intelligent Decision Support), Vol. 22, Nos. 1-4, 1988.
.208 -
Dougherty, E.M.; Fragola, J .R.: Human Reliability Analysis,New York, Wiley, 1988.
Seaver, D.A.; Stillwell, w.G.; Procedures for Using ExpertJudgement NUREG/CR-2743, 1983.
Hannaman, G.W.; Spurgin, A.J.; Lukic, Y.D.; Human CognitiveReliability Model for PRA Analysis, Draft Report NUS-4531,EPRI Project RP2l70-3, Electric Power Research Institute,Palo Alto, CA, 1984.
Weston , L . M. ; Whi tehead, D. W . ; Graves, N . L . ; Recovery
Actions in PRA for the Risk Methods Integration and Evalua-tion Program (RMIEP), Volume 1: Development of the Data-Based Method, NUREG/CR-4834, Volume 1, US Nuclear RegulatoryComrission, Washington, DC, 1987.
Whitehead, O.W.; Recovery Actions in PRA for the RiskMethods Integration andEvaluation Program (RMIEP), Vol. 2:Application of the Oata-Based Method, NUREG-4834, Vol. 2: USNuclear Regulatory Comrission, Washington, DC, 1987
Beare, A.N.; Oorris, R.E.; Kozinsky, E.J.; Manning, J.J.;Haas, P.M.; Criteria for Safety-Related Nuclear Power PlantOperator Actions: Initial Simulator to Field Data Calibra-tion, General Physics Corporation and Oak Ridge NationalLaboratory, NUREG/CR-3092, US Nuclear Regulatory Comrission,Washington, OC, 1983
Swain, A.O.Accident Sequence Evaluation Program Human Reliability Ana-lysis Procedure NUREG/CR-4772, Sand 86-1996, Febr. 1987
Rasmus sen, J.
Information Processing and Human-Machine Interaction.: AnApproach to Cognitive Engineering, North-Holland, New York,1986
- 209-
SÄTEILYTURVAKESKUSI STUK) - Slr6lSó~erhelscenlrolen
. Finni.h Cenlre lor Radiolion on. Nucleor Soleiy - He.¡nl¡ Finlond
Lasse Reimen
OECD/CSNI Workshopon Special Issuesof Level 1 PSACologne, May 1991
A SLIM-BASED APPROACH IN ANALYZING OPERATOR COGNITIVE ACTIONS
1 Introduction
i . i A pre-study
A study is in progress in STUK to analyze most important human
actions identified in level 1 PSAs. A pre-study was first made
to prepare for the actual analysis. It included a review of
the existing methods used in HRA. Another part of the pre-
study was an interview of six shift supervisors from both the
TVO and Loviisa nuclear power plants aiming at recognizing
the most contributing factors to the behavior of control room
operators in disturbance and accident situations. Other issues
deal t wi th in the pre-study are described in Ref. 1.
1 . 2 Selection of methods
A wide range of techniques exists for quanti tati ve human
reliabili ty assessment. The validi ty and the quali tati veusefulness of the method were considered the most important
criteria in evaluating the methods. Qualitative usefulness
was rated high because of the large uncertainties still
present in quantitative results and also because qualitative
resul ts can be used to further enhance the safety of theplant. The effective use of resources was not regarded
er1 t1eal beeause. only seleeted operator actions are studied.Instead, in eomparing different methods based on expert
judgment the acceptability to the experts was regarded an
important factor.
Because of the sparsity of relevant empirical data, expert
.. 'opinion . is'frequentlyused 'in'HRA~toassess.frequencies.......o.f
- 210-
human failures. The use of expert judgment in probability
assessment has been widely studied. In Ref. 2 a thorough
review of subjective probability assessment and psychological
scaling methods is presented. One recommendation is that the
event to be judged must be completely defined..and structu-red. Also training of experts is stressed. The study presen-
ted in Ref. 3 critically reviews several representative
applications of expert opinion in the field of risk analysis.
One of the key findings is that when unaided by formal
'methods, people are poor processors of information. In spite
of many negative findings, the authors state that they have
found several efforts confirming that expert opinion can in
fact be used well in practical settings.
Based on review and comparison of methods i t was decided touse SLIM- and TRC-based methods in the quantitative part of
the analysis. This paper deals wi th the analysis of operator
cognitive actions at TVO plant using a SLIM-based approach.
A detailed description of the methods. used and the resul ts
is presented in Ref. 4.
2 SLIM-based analysis
2. 1 Success Likelihood Index Methodology
Multi-Attribute Util1ty Theory (MAUT) provides 8 formal basis
for Success Likelihood Index Methodology (SLIM). The rationale
underlying SLIM is that the likelihood of an error occurring
in a particular situation depends on the combined effects of
a relatively small set of performance shaping factors (PSF).
SLIM assumes that the Success Likelihood Index is a sum of
the products of the normalized PSF weights and ratings /5/.
2. 2 Selection and training of experts
Four experts were chosen for the first session. Two of them
were from STUK, one from the VTT and one from the utility.
Different fields of expertise were covered. All the experts
- 211 -
have a long working experience on nuclear field and are well-
known specialist on ~heir own fields. In ~he second session
three experts from STUR took part.
The Success Likelihood Index Method was described ~o the
exper~s at the beginning of ~he session using some earlier
studies as examples. A procedure had been prepared and given
to the experts earlier in which ~he scales of weight and
rating assessments were explained and guidance was given
concerning the use of these scoles. The definitions of PSFs
were also presented in the procedure.
A number of biases have been observed in the expert judgments.
Training of the experts has in some studies been observed to
improve the quality of the judgments. For this purpose a
summary of different types of errors affecting subjective
judgments was prepared and presented at the beginning of the
session. The summary was based on References 6 and 7. For
example, to avoid overconfidence in their judgments, the
experts were asked to try to actively search for evidence
contrary to their original opinion.
One of the most difficul t issues in analyzing operator actions
in an accident situation is the evaluationof stress and i tseffects on operator behavior. Only very few studies exist
concerning the stress in particular of nuclear power plant
operators in emergency situation. At the beginning of the
first session the chairman (the author) presented abrief
review of eh. 17 of the Handbook /8/ which deals with stress.
Also, a summary of References 9 and 10 was presented.
2.3 Qualitative analysis
A very important part of the analysis is a thorough quali ta-
tive analysis of the operator actions in question. This was
done by first studying the plant behavior based on accident
analysis. In some cases new analyses had to be done. The
operator actions were preliminary modelled based on plant
- 212 -
behavior and symptom-based EOPs of the plant. Descriptions
of event sequences were wri tten where main plant parameters
and supposed operator actions were presented.
These event sequences were then discussed wi:th six shift
supervisors of the plant. This was done in oonnection with
the pre-study interviews described in eh. 1.1. Each shift
supervisor evaluated the sequences using a talk-through and
a walk-through method. For some actions an execution time
was measured for quantification purposes.
2. 4 Selection of PSFs
In this study the human factors analyst made a preliminary
selection of the PSFs based on a literature review and the
pre-study. A detailed definition of each factor was formula-
ted. In the session this selection was presented to the
experts who accepted i t for use in the assessment. In the
second session two least important factors were left out for
practical purposes. The factors used in the second session
were quali ty of information,.on plant state, diagnosis comple-xity, decision making burden, stress, training/experience and
emergency operating procedures. The two additional factors
in the first session were task complexi ty and organizational
factors.
2. 5 Expert session
The first expert session was held at the power plant. After
the training described earlier, the session chairman described
the accident sequence and the particular operator action to
be evaluated. The related EOPs were then presented and discus-
sed. The accident sequence and the execution of all the
related operator actions was then demonstrated to the experta
in the main control room. The positions of different measuring
and control equipment were also shown to the experts. Diffe-
rent error possibilities were discussed during this walk-
- 213-
through. The assessment of this particular operator action
was done right after this demonstration.
Nominal Groups Technique (NGT) was adopted for the first
session. When the first estimates of weights and.:ratings were
drawn up, each expert briefly went through his essessment
giving some basis for it. After that the experts had a
possibili ty to make questions to each other. Finally, the
assessments were revised wi thout any subsequent discussion.
2. 6 Weight assessment by AHP
In the first session weights were determined using the
original method of SLIM. It is stated in Ref. 11 that the
decomposed weights are relatively uniformly distributed across
the attributes, whereas the optimal statistical weights are
much more heavily concentrated on but e few fectors. A
subjective evaluation of the results of the first session
indicates that possibly too much weight had been g:Lven to some
less important PSFs in some cases.
New methods to evaluate weights were searched to .improve the
weight assessment end the Analytic Hierarchy Process (AHP )
of Saaty was taken in use in the second session. The AHP is
a pairwise comparison method developed for modelling unstruc-
tured problems in the economic, social end management scien-
ces. A sca1e of numbers from 1 to 9 is introduced wi thquali tative explanations for pairwise comparisons /12/.
If we denote by wi,..., wn the weights of the factors the
pairwise comparisons may be represented by a matrix which
has positive entries a1j . wdwj. If A is a nxm matrix of
pairwise comper.isons, in order to find the priority vector,
we must find e vector w which satisfies Aw. À".. w, where,À".. is the largest eigenvelue of the matr:Lx A. A i8 consistentif and only if Àa.. . n. Since small chenges in a1j imply a
small change :Ln À...., the deviation of the latter from n is
- 214-
a measure of consistency. The consistency index is definedas ( ~-n)/(n-1).
In the second session three experts from STUK evaluated, using
AHP for weight assessment, the same operator actions that had
earlier been evaluated with the original SLIM. Two of the
experts had taken part also in the first session. The third
expert was the human factors analyst, who had also made the
assessments using the original SLIM, but not presented them
in the session. The results obtained by of these three experts
were compared when using these two methods and this comparison
is presented in eh. 3.2.
2.7 Conversion of SLIs to Probabili ties
The SLls generated in SLlM-session are relative measures of
the likelihood of success of each task considered in the
session. In order to trans form these to human error probabili-
ties, it is necessary to calibrate the SLI scale for the tasks
considered. In SLlM the dalibration is based on a logari thmic
relationship between SLls and human error probabili ties. In"
this study concerning the TVO plant the calibration was done
using the HCR/ORE correlation /13/, Swain screening model or
by expert judgment in the cases of high stress. Al though the
calibration is gui te essential in SLIM i t is not dealt wi th
in detail because the main focus of this paper is on the
method used to produce the SLI estimates.
3 Evaluation of assessment procedure
3.1 Group assessment methods
SLIM was found a practical method to analyze nuclear power
plant operator actions. It was used to analyze the cognitive
actions in six accident seguences at the TVO plant. Only four
of these seguences were totally separate from each other and
the resul ts presented are based only on those four. The
- 215-
average SLI values wi th their standard errors produced in the
two sessions are presented in Table 1.
In aggregating individual judgments a NGT tye interaction
was used. Bome experts expressed afterwards satisfaction
with the methode The effect of this group process was to
improve the consistency of the weight assessments as is
discussed in eh. 3.2. Also some important qualitative observa-
tions came up in th1s phase. In the second session aDelphitype interaction was used.
Based on this study a group interaction l1ke the NGT seems
to be useful but time consuming. Bome way .to gather qualitati-
ve findings of the experts should be organized, 1f this kind
of method is not used.
3.2 The assessment of weights and ratings
In the second session the AHP was used in weight assessment
as described earlier. For each matrix the largest eigenva-
lue, the consistency index and the consistency ratio were
calculated. The largest consistency ratio produced in this
study was 0.10. According to Ref. 12 this value is still
acceptable.
To compare the two ways of assessing weights, the Kendall
coefficient of concordance W was calculated for different
cases. To calculate the coefficient the va lues of different
variables are replaced wi th their ranks. The value of W can
be calculated from the formula presented in Ref. 14.
In the first session all the values of Ware significant at
least at the 5 per cent confidence level showing that the
judges are applying essentially the same standard in ranking
the objects. In the second session all the values of Wexcept
for tqe case 3 are also significant at the 5 per cent level.
The Kendall coefficient of concordance W was also calculated
for the first session wi thout the two least important factors
- 216-
thet were left out in the second session. In this ca se the
va lues of the second session are clearly higher except for
the ce se 4.
The Kendell cofficient of concordance can also be used to
see how the consistency of weight assessments improved when
using the NGT method in the first session. In Table 2 the
values of Ware shown for the first end second estimates of
weights for different ceses. The effect of the structured
group process can be clearly observed in the first three
cases.
In some studies the weights have been essessed only once and
used for all the operetor actions anelyzed. Looking at the
average weights across experts clearly shows that weights
should be evaluated for each case separately.
To compare the SLI-values achieved by the two methods Table
3 was produced. It shows the SLIs of the three experts, who
used both methods in all the four ca ses . It is interesting
to note that differences between the highest and lowest
values are slightly larger while using the AHP. The distincti-
on is, however, not statistically significant.
3.3 Interjudge consistency
The consistency across experts was examined also by a two-
way analysis of variance (ANOVA). An ANOVA was conducted for
the SLI-values of the two sessions. The results of these
analyses are presented in Table 4. In both sessions, the
effects of both events end judges ere significent when the
ANOVA is conducted for SLI-values, but at different levels
of confidence.
It is suggested in Ref. 15 that the interjudge consistenc~
should be evaluated by carrying out an ANOVA using the
individual log HEPs as the dependent variable. This was also
- 217-
done for the results of both sessions, end the results
indiceted thet the effect for judges was not significent.
4 Some quantitative results
The first cognitive action analyzed was an ATWS-situation
related wi th e loss of condenser transient. The feilure of
the reactor hydraulic scram was postulated to be caused by
a common-mode failure of relays in the reactor protection
system. In this situation the operators have the possibili-
ty to trip the reactor by ini tiating the hydraulic scram by
some manual actions at the relay cabinets. The total available
time is 5 min and the manipulation time" 2 min provided that
the actions in the relay cabinets are done be fore the "actuati-
on of the boron system (or simul taneously) .
The second operator action was a refilling of the tank from
where the auxiliary feedwater system takes i ts suction.This is necessary in some medium LOCA sequences, where ei ther
reactor depressurization is not possible or the low pressure
emergency cooling system is not available. After the low
level alarm of the tank there is about one hour i stirne to
ini tiate the refilling, which is done by the fire brigade
using the fire fighting system.
The third action analyzed was the initiation of manual reactor
depressurization. In the accident sequence that was analyzed
in the SLIM session one of the safety relief valves of the
reactor was stuck open (case 3.1). The SLI values obtained
this way were used also in the base case where all safety
relief valves function as designed (case 3). The initiator
of the accident sequence was a loss of all the main feedwa-
ter pumps because of a low suction pressure. A common-mode
failure in the auxiliary feedwater system prevented i ts use.
The times available for the initiation of manual depressuriza-
tion are 37 min and 25 min in the two cases, respectively.
They are based on analyses made in STUK using a RELAP code
/16/ .
- 218-
The manual depressurization of the reactor was later tested
at the simulator by the utili ty and the times of initiation
were measured for all crews. On the basis of these measure-
ments, no changes were necessary in themanipulation times
assessed in the qualitative analysis. Onlya small correction
was made in the diagnosis time based on expert judgment.
The fourth operator action analyzed is related to astation
black-out sequence, where none of the diesel generators have
started but at the neighbouring unitat least three of them
are running. In this situation there is a possibili ty to, loan i one of the diesel generators of the other uni t.
In all these four cases only the cognitive part of operator
action was analyzed. Operator failure probabilities based on
the first session are presented in Table 5. The resul ts are
ealculated as a geometrie me an of human error probabili ties
based on SLI values of each expert.
In Ref. 15 uncertainty boupds are determined based on the
variances of the log HEP estimates across judges. In this
study % 2 s.e. uncertainty bounds were given to SLI values
and an EF . 10 was assumed for the boundary condi tions usedin the calibration. The results indicatethat the uncertainty
is to large extent caused by the uncertainties ~elated wi th
the boundary conditions of the ealibration.
6 References
1. L. Reiman. Analyzing acti vi ties of nuclear power plant
operators. A pre-study. (Draft). Finnish Centre for Radiati-
on and Nuc1ear Safety. Helsinki. 2. 5. 1991 .
2. W.G.Stillwell, D.A.Seaver, J.P.Schwartz. Expert Estima-tion of Human Error Probabili ties in Nuclear Power Plant
Operations: A Review of Probability Assessment and Scaling.
NUREG/CR-2255. Deeision Science Consortium, Inc., May 1982.
- 219-
3. A.Mosleh, V.M.Bier,"G.Apostolakis. Methods for the Elicita-
tion and Use of Expert Opinion in Risk Assessment. NUREG/CR-
4962. Pickard Lowe end Garrick, Inc., August 1987.
4. L.Reiman. Analysis of operator cognitive actions at TVO
nuclear power plant using a SLIM-based approach. (Draft).
Finnish Centre for Radiation and Nuclear Safety, 6. 5 . 1991 .
5. D.E.Embrey, P.Humphreys, E.A.Rosa, B.Kirvan, K.Rea. SLIM-
MAUD, An Approach to Assessing Human Error Probabili ties
Using Structured Expert Judgement. Vol. 1 . Overview of
SLIM-MAUD. NUG/CR-3518. Brookhaven National Laboratory,March 1984.
"6. A.Tversky, D.Kahnemann. Judgement under uncertainty:Heuristics and biases. Science, 185, 1974.
7. D. von Winterfeldt. Some sources of incoherent judgments
in decision analysis. Decision Science Consortium, Inc.,
November 1980.
8. A.D.Swain, H.E.Guttman. Handbook of Human Re1iabilityAnalysis wi th Emphasis on Nuclear Power Plant Applications.
NUEG/CR-1278. Scàndia National Laboratories, August 1983.
9. S.Baker, E.Marshall. Stress and Control Room OperatorPerformance - A Summarised Literature Review. HPR-332,
December 1987.
10. D.I.Gertman, L.N.Haney, J.P.Jenkins, H.S.Blackman. Opera-
tional Decisionmaking end Action Selection Under Psychologi-
cal Stress in Nuclear Power Plants. NUREG/CR-4040. Idaho
National Engineering Laboratory, May 1985.
11. G.W.Fischer. Experimental Applications of Multi-Attribute
Uti.lity Models. In: Utility, Probability and Human Decision
Making, D. Reidel Publishing Company, 1975.
- 220-
12. T.L.Saaty. The Analytic Hierarchy Prosess. McGraw-Hill,
1980.
13. P.Moieni, G.W.Parry, S.J.Spurgin. A. Human ReliabilityAnalysis Approach Using Measurements for Individual Plant
Examination. NUS-5191, E1ectric Power Research Institute,
Ju1y 1989.
14. S. SiegeL. Nonparametric statistics for the behaviora1
sciences. Book COmpany, Inc., Tokyo, 1956.
15. D.E.Embrey, P.Humphreys, E.A.Rosa, B.Kirvan, K.Rea. SLIM-
MAUD: An Approach to Assessing Human Error Probabi1ities
. Using Structured Expert Judgement. Vol. II. Detailed
Analysis of the Technical Issues. NUREG/CR-35l8~ Brookhaven
National Laboratory, March 1984.
16. J. Hyvärinen. RELAP 5 analysis for a stuck-open safetyrelief valve in ca se .of a total loss of feedwater at TVO
plant (in Finnish). Finnish Centre for Radiation and Nuclear
Safety. 9.5.1990.
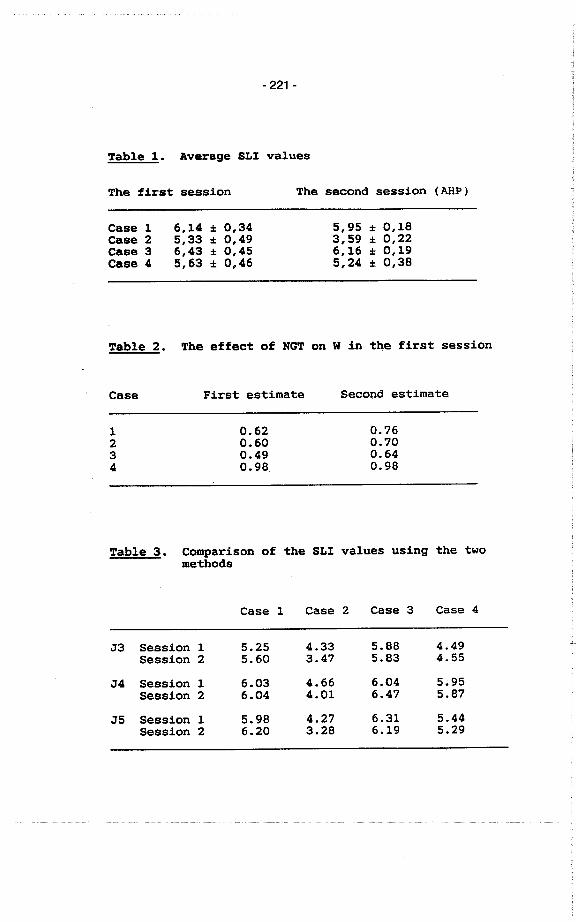
- 221 -
'table.l. Average SLI values
'the first session The second session (AHP)
Case 1 6,14 % 0,34 5,95 % 0,18Case 2 5,33 % 0,49 3,59 % 0,22Case 3 6,43 % 0,45 6,16 % 0,19Case 4 5,63 % 0,46 5,24 % 0,38
'table 2. 'the effect of NGT on W in tQe first session
Case First estimate Secood estirnate
i 0.62 0.762 0.60 0.703 0.49 0.644 0.98 0.98
Table 3. Comparison of the SLI values using the twomethods
Case 1 Case 2 Case 3 Case 4
J3 Session 1 5.25 4.33 5.88 4.49Session 2 5.60 3.47 5.83 4.55
J4 Session 1 6.03 4.66 6.04 5;95Session 2 6.04 4.01 6.47 5.87
J5 Session 1 5.98 4.27 6.31 5.44Session 2 6.20 3.28 6.19 5.29
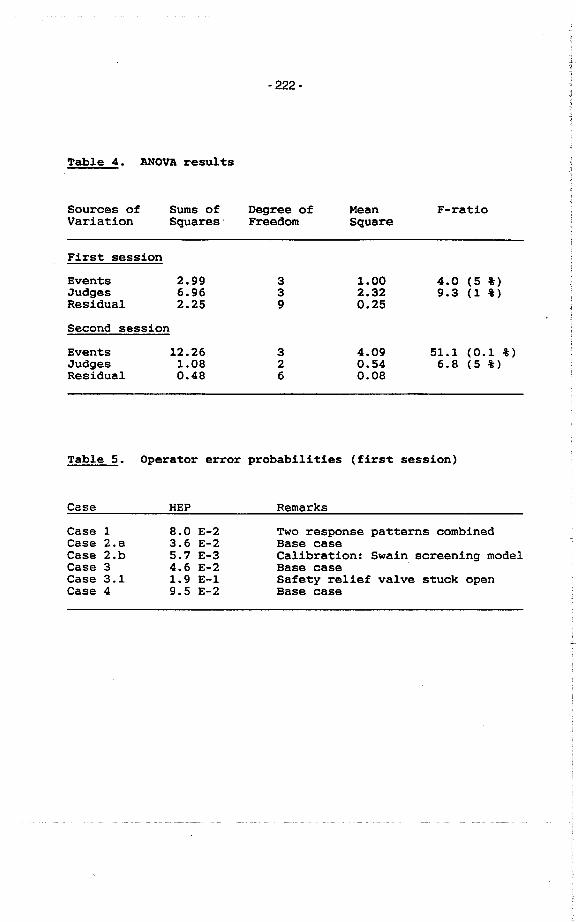
- 222-
Table 4. ANOVA resul1:s
Sources of Sums of Degree of Mean F-ratioVariation Squares. Freedom Square
First session
Events 2.99 3 1.00 4.0 (5 l)Judges 6.96 3 2.32 9.3 (1 l)Residual 2.25 9 0.25
Second sessionEvents 12.26 3 4.09 51.1 (0.1 l)Judges 1.08 2 0.54 6.8 (5 l)Residual 0.48 6 0.08
Table 5. Opera1:or error probabili 1:ies (firs1: session)
Case HEP Remarks
Case 1 8.0 E-2 Two response patterns combinedease 2.a 3.6 E-2 Base caseCase 2.b 5.7 E-3 Calibration: Swain. screening modelCase 3 4.6 E-2 Base caseCase 3.1 1.9 E-l Safety relief val ve stuck openCase 4 9.5 E-2 Base ease
- 223-
Al APPROACH 'r TB ADYSZS 01' OPBRATZIIG
CR RBSPOlISBS VSZIIG SDITOR BDRCZSBS
:rR VSB Z. PSAs
by
Gareth W. ParryHalliburton NOS Environmental Corporation
910 Clopper RoadGaithersburg, Haryland 20877
USA
Avtar SinghElectric Power Research Institute
3412 Hillview AvenuePalo Alto, California 94303
USA
Anthony Spurgin and Parviz HoieniAccident Prevention Group
16980 Via TazonSan Diego, California 92127
USA
Arthur BeareGeneral Physics Corporation
6700 Alexander BellColumbia, HD 21046
Pr..ente4 at the OBCD/BKU Workshop onspecial Z..u.s of Level 1 PSA,
cologne, I'RG
May 28th, 1"1
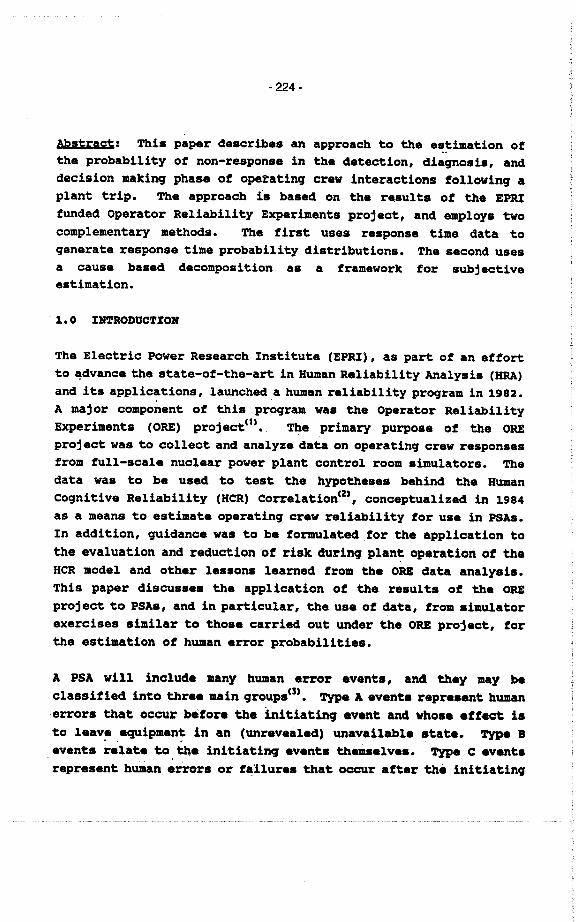
- 224-
Abstract: This paper describes an approach to the e~~imation otthe probability ot non-response in the detection, diaqnosis, and
decision makinq phase of ope~atinq crew interactions followinq a
plant trip. Tbe approach 1's based on the resul ts of the EPR
funded Operator Reliability Experiments project, and employs two
complementary methods. The first uses response time data togenerate response time probability distributions. The second uses
a causa based decomposition as a tramework tor subjectiveestimation.
. 1.0 IHTRODUCTIOH
The Electric Power Research Institute (EPRI), as part of an etfort
to ~dvance the state-of-the-art in Human Reliability Analysis (HR)
and its applications, launched a human raliability program in 1982.
A major component ot this program was the Operator Reliability
Experiments (ORE) project(1.. The primary purpose of the ORE
project was to collect and analyze data on operating crew responses
from full-scale nuclear power plant control room simulators. The
data was to be used to test the hypothese. behind the Humn
Cognitive Reliability (HCR) correlation(Z), conceptualized in 1984
as a means to estimate operating crew reliability for use in PSAs.
In addition, guidance was to be formulatedfor the application to
the evaluation and reduction of risk dudnq plant operation of the
HCR model and other lessons learned from the ORB data analysi..
This paper discussas the application of the results of the ORB
project to PSAs, and in particular, the usa of data, from simulator
exercises similar to those carried out under the ORB project, for
the estimation of human error probabilities.
A PSA will includa many human error .vents, an4 they may be
classified into three main groups(3) . Tye A avent. repre.ent human
error. that oceur befor. the initiatinq .v.nt an4 whos. arr.et i.
to Ieav. equipment in an (uneveai.d) unavailabl. etat.. Ty. B
. events ~elata to.~. initiatinq evant. thei.alve.. Ty. C .v.nt.
represent humn. error. or f~llure. that ocr after the initiatinq
- 225-
event. Motivated by the differences in approach to quantification,
Reference 3 furter subivided them into two groups7 type CP,
which represent failures in procedure quided actions, and type CR,
which represent failures to per form scenario specific, non-
procedure driven innovative recovery actions. since simulator
exereises are primarily foeused on in-control room procedure based
operator aetions, ~e domain of applicability to a PSA of the data
that can be eollected is the modeling of operating crew responses
following a plant disturbance, or the type CP events. Other
aspects, such a. the analysis of ex-control room action.,maintenanee errors, and the integration of an HR into the PSA, are
addressed elsewhere in the EPRI proqram.
The paper discusses the approach, formulated on the basis of the
results of the ORE proqram, for using simulator data to quantify
human error probabilities. There are two complementary methods.
The first relies on curve fitting to represent the distribution of
crew response times and using this tit to evaluate non-response in
a specified time. While this approach has some appealinqproperties, it is elear that it is not, in itself, sufficient,
sinee it relies heavily on an extrapolation technique; ~hich eannot
have unlimited applicability. Theretore, a complementary approach
is proposed, to identity the possibility, and estimate the
probability, on a scenario specific basis, of railure to initiate
correct responses that resul t from causes that are expeeted to
oceur rather infrequently. Tbis approach is stronqly influenced by
the analysis of errors detected in the ORB program, and eonsist.of
. identifyinq various modes and causes or error, and construetinq,
for each mode, adecision tree that identifies the factors that
influenc. the likeUhood of that error mode. Becausa of the lack
of applicabl. data, the estimation process is nece.sarily.ubjectiv.. Tberafore, the approach is tailored to provide
structur. to the proeess and provide .. means of docuentinq the
assumptions made.
- 226-
Simulator exereises can provide much more informatia~ than mere
numerical results. For example, in addition to measurinq crew
response times, the ORE program, as indicated above, also eollected
observations on crew errors, their impacts, and their causes. In
this way, simulator exercises can help in the identitieation of
potential weaknesses with EOPs from both the structural point ot
view and from the point of view ot their ea.e of interpretation,
and can point to potential improvements in traininq, human faetors
and man-machine interface aspeets. Consequently, i t is strongly
believed that the wort of simulator exercises should not be
measured on the basis ot providing the response time data alone.
An overView of the approach to the e.timation ot type CP event
probabilities is presented in Section 2. Section 3 deseribes the
method tor usinq simulator d~ta, and Section 4, the complimentary
methode Section 5 is a sumary.
2.0 OVZRVIBW O~ AN APPROACH TO QUANI~ICATIOHO~ TYP. CP BVNT PROBABILITIB8
This section presents an overview of the approach to the quantifi-
eation of type CP logie model HI event probabilities. turrent PSA
praetice is generally to construct tbe plant loqie model in such a
way that accident sequences are developed to represent theconsequenees of performing a type CP interaction correetly, and
also tbe eonsequenees of not pertorminq it at all. However, what
the crew miqht have done instead, i.e., an error of eommission, is
not~ otten modeled. Hence, type CP HI lO9ic model events generallyare modeled .s ir they were errors of omission. However, their
probabilities are taken to include all tbe ways in vhich the crew
miqht fail to perform the required tunction and this include. both
true errors of omission and all errora ot commis.ion, and tbus may
be. charaeterized as probabilities of incorrect response.
Because its major objective was to validate the HRC eorrelation(2,
the focus of the ORE proqam vas on the coqitive aspect .of the
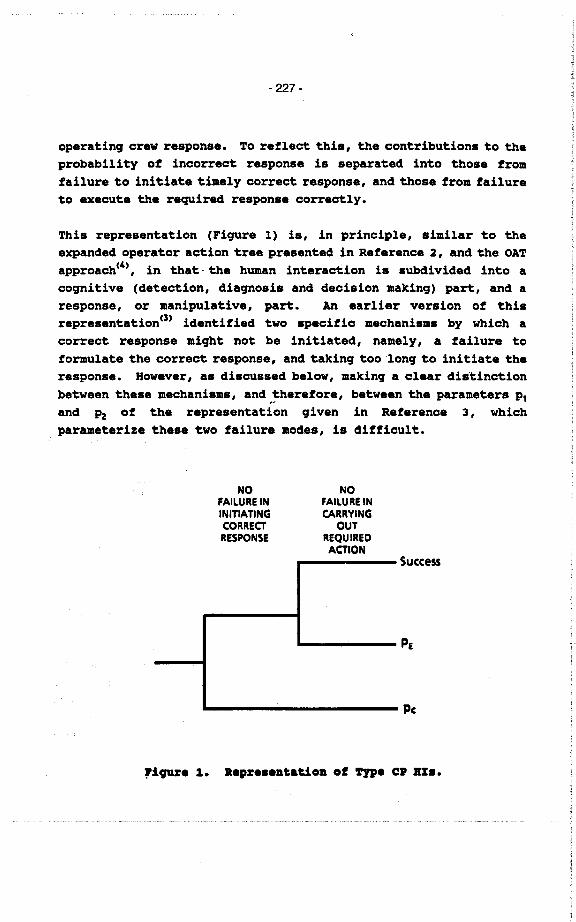
- 227-
operating crew response. To retleet this, the contributions to the
probability of incerreet response is separated into those from
failure to initiate timely correct response, and these trom failure
to execute the required response correctly.
Thi. representation(Fiqure 1) is, in principle, similar to the
expanded operator action tree presented in Reference 2, and the OAT
approach(4), in that. the human interaction is subdivided into a
cognitive (detection, diagnosis and deeision making) part, and a
response, or manipulative, part. An earlier version ot this
representation(3 identified two .pecitic mechanisms by whieh a
correct response miqht not be initiated, namely, a tailure to
formulate the eorreet response, and taking too .long to initiate the
response. However, as discussed below, making a el.ar distinction
between these mechanisms, and ,~erefore, between the parameters p,
and Pz of the representation given in Reterenee 3, whichparameterize these two failure modes, i& ditticult.
NOFAllURE ININITIATINGCORRECTRESPONSE
NOFAllURE INCARRYING
OUTREQUIRED
ACTIONSuccess
PE
Pe
'igue 1. Repr..eatatioa of Tye C. BI..
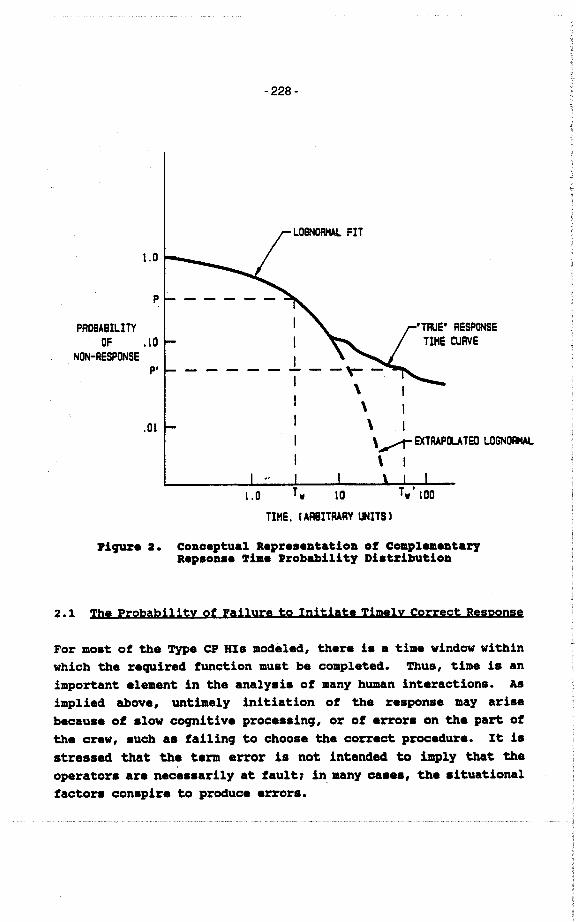
- 228-
1.0
P
PROBABILITY
OF .\0NON-RESPONSE
I
I
I- - - --I
I
I
I
I
P'
.0\
'TAUE' RESPONSE
TIME CURVE
-r-\\\ i'/1 EXRAPIUTEO LOGNOIl\ I
1.0 \0TIME. UABITRAAY UNITS)
~i9Ure Z. CODceptual R.pre..DtatioD of ComplemeDtaryRep.oD.. Time probability Di.tributioD
2.1 Tbe Probability of Failure to Initiate Timely Correct Response
For most of the Tye CP HIs modeled, there is a time window within
which the required funetion must be eompleted. Thus, time is an
important element in the analysis of many human interaetions. AB
implied above, untimely initiation of the response may arise
becaus. of .low coqitive proce.sinq, or of errors on the part ofthe crew, such as faUinq to ehoose th. correct proeedure. It is
stressed that the term error i& not intended to imly tbat the
operators are nece..arily at fault, in. many case., the .ituational
factors eonspire to produce error&.
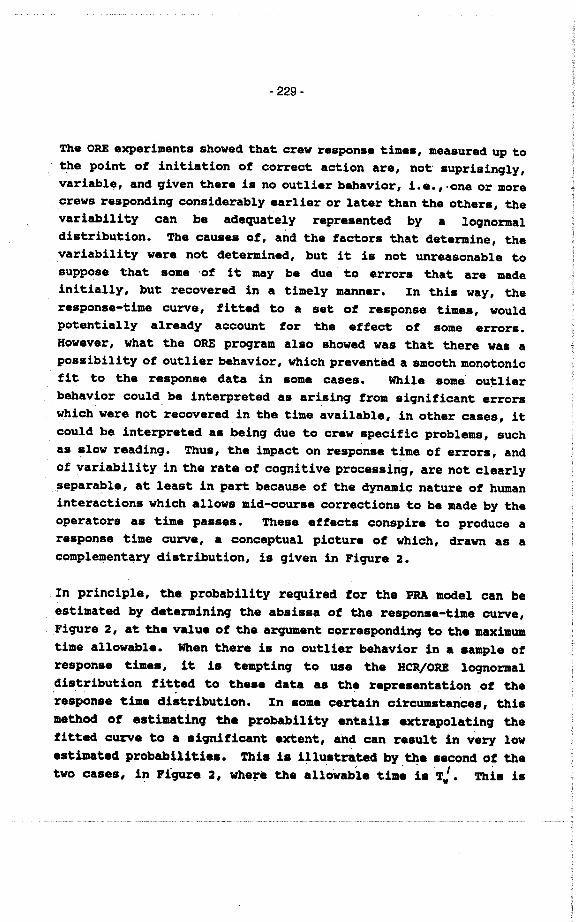
- 229-
The ORE experiments showed that crew response times, measured up to
the point ot initiation of correct action are, not suprisingly,
variable, and given there i& no outlier behavior, i.e., .one or more
crews responding considerably earlier or later than the others, the
variability ean be adequately represented by a loqnormaldistribution. The eauses of, and the factors that determine, the
variability were not determined, but it is not unreasonable to
suppose that some .of i t may be due to errors that are made
initially, but recovered in a timely manner. In this way, the
response-time curve, fitted to a set of response times, would
potentially already aceount tor the effect of some errors.
However, what the ORE proqram also showed was that there was a
possibility of outlier behavior, which prevented a smooth monotonie
fit to the response data in some cases. While some outlier
behavior could. be interpreted as arising from significant errors
whieh were not recovered in the time available, in other eases, it
could be interpreted as being due to crew speeific problems, such
as slow reading. Thus, the impact on response time of errors, and
of variability in the rate of coqnitive processinq, are not clearly
separable, at least in part because of the dynamic nature of human
interactions which allows mid-course correetions to be made by the
operators as time pa.ses. These eftects conspire to produce a
response time curve, a eonceptual pieture of which, drawn as a
eomplementary distribution, is qiven in Figure 2.
In principle, tbe probability required for the PRA model can be
estimated by determining the absissa ot tbe response-time curve,
Figure 2, at the value ot the arguent eorresponding to the maximum
time allowable. When tbere is no outlier behavior in a .ample ot
response times, i1: is temptinq to use the HCR/ORB loqormal
distribution fitted to tbese data as the representationof the.. . ~ .response time distribution. In some eertain circustance., this
method of ..timatinq the probabiUty entails exrapolatinq the
fitted curve to a siqnificant extent, and ean result in very low
estimateet probabiUties. Tbi. is illustrated by the ..conet or the. ... . I .two eases, in Pigure 2, where the allowabl. tim. is Tii. Thi. i.
- 230-
to be contrasted with the first case where the time window is Tw.
However, as discussed above, there exists the possibility that some
response times could be very long, albeit at 'å low enoughprobability, that in the small sample obtained, .they have not been
observed. In this ease, the extrapolation using the lognormal
curve could be extremely optimistic as illustrated by the ca se otthe time window T: in Figure 2. Therefore, while the main thrust
of the EPRI approach is to use fitted response time curves (the
HCR/ORE eorrelations) to estimate the probability of tailure to
initiate response, it is supplemented by the complementary. approach, described in Section 4.
In keeping with standard PRA methodoloq, the parameter Pe is
intended to predict the · averaqe' crew behavior. In the same way
that PRA methods are not intended to identify poor performance tor
a speeific pump in a population ot like pumps, the method diseussed
here is not intended to ideJ1tify crew speeitic problems. AB
discussed elsewhere(1), the use ot simulator exercises, however,
does facilitate this and is, perhaps, as strong a motivation for
performinq these exercises as is their usetulness for PR purposes.
2.2 Tbe Probability of Failure to Execute tbe Reguired Response
The seeond parameter of the representation of Figure 1, PE'
represent. the probability that the crew makes an error in
execution whiçh is not reeovered in the available time. The ORE
program did not addres. thi. issue in detail. Approaches such as
THERP(6) are proposed for its evaluation. Tbere is an important
eonsideration that directly impacts the estimation of Pe' however,
and that is that if the time needed to ex.cute the response is
siqnifieant, it will impact the time available for the deteetion,
diaqnosi., and deeision making phase, which is a critical
parameter.
- 231 -
3.0 BS'I%K'ItO. 01' 'l l'aDTZR Pe V8t.(J 8tKU'la DA'IA
In R.t.r.nc. 2, th. HCR corr.lation was propo..d .. a way ot
eharaetarizinq tha oparator re.ponse tim. distribution. Th. HCR
corr.lation was .xpr....d a. a tunction ot normaliz.d tim., a
dim.n.ionl... unit whieh i. th. ratio of r.al tim. to th. m.dian
cr.w respon.. tim.. . Th. form ot th. eorr.lation was cho..n to b.
a Weibull, with th. .hap. param.ter b.inq a funetion ot wh.th.r th.
type ot coqni~iv. proe...inq could b. cla..itied a. b.inq .kill,
rul., or knowl.dg. ba..d, and oth.r p.rformanc. .haping tactora
were a..um.d to modity th. m.dian r..pon.. tim., but not th. ahape
paramet.r.
As di.cu..ad in Ret.renee 1, the ORE proqram did not support th.
oriqinal HCR hypoth..i. that normaliz.d tim. r..pon.. curv.. t.ll
into on. of tha.a thra. cat.qoria.. .How.var, it was damonstratad
that tor individual human int.raetion., th. r..pon.. tim. data
eould b. titted by a loqormal distribution, which ha. twopara..t.r., T,n' tb. m.dian re.pon.. tim., and ø, tb. lO9arithmie
.tandard d.viation ot normaliz.d tima. Witb th... two param.t.r.,
th. probabili~y of cr.w non-r..pon.a in a timeT is qivan a.:
L "'(T,,".. i'. .,,. (2','2' v) . i - . . -1
wh.r. . (.) is .tandard normal cuulativa di.tribution, Tv i. tha
allowabl. tim. windov, and 'I, i. th. tim. of r..ponii.. Thi. curv.
will b. r.fuenc8d to hencatorth as the HeROU corr.lation. Tbeappropriate tiae vindov, 'Iv . i. th. ~ime vindov for d.t.ction,
d1aCJnoais, and uJd,nei a daci8ion. It vill, thuafora, qenarally be
ditrar.nt fro. a tim. vindov ba.ad on therml hy4raulic.c:onaideraUon vhic: vill inc:iude the ti.e to both id.nUfy and
parfon the action.
As vith tha oriqinal HCR tonuiation, it vas felt that lt vouid be
advantaq.ous if tha c:orraiations for the different HI& could be
- 232-
grouped in some way, so that a small numer of eorrelations eould
be established, with the different HIs within eaeh..group being
distinguished by variations in the T"z parameter. An approach
based on the cue-response _tructure(3 showed some" systematic
differences between the averaqe a values tor tbe ditterent cue-
response types; but with eonsiderable overlap ot the distribution
of a within a type. It would appear, therefore, that while one
tactor in determininq aha. been identified, there are other, HI
specitic factors, which have not. In the absence of suchpredictability, it is strongly recommended tbat HI specitie data be
gathered whenever possible.
3. i Estimation of the Parameters T"z' g of the HeR/ORE Correlation
Three different approaches are proposed in order ot preference.
The first is the use ot simulator exereises to gather data on
response times. This has th~.,major advantage that tbe impact otmany ot the principal performance shaping factors will be implieit
in the eolleeted response times. In addition, by desiqninq the
simulator exercise, the analysts can obtain data whieh matches as
elosely as pos_ible the scenario developed in the PRA.
In situations where. it is not possible, or convenient, to pertorm
the necessary experiments, struetured interviews with instructors,
operators, and other knowledgeable persons ean be a valuable
alternative to obtaininq estimates ot T"z and a. The purpose of
performinq the interviews is to qet either direct or indireet
estimates ot ranqes of response times. It is unlikely that, except
tor a tew prompt actions, such as placinq the mode switch in
shutdown, plant personnel will have a reliable feel tor the time
taken dir.ctly~ However, it is likely that, tor one or two key
plant parameter., they may have a very qood idea of tbe ranqe ot
va lues within which they might act. Tbis will probably beparticularly true of training personnel who are focu.ed on these
key parameter.. Tbe ranqes ot values can be converted into ranqes
- 233-
ot times usinq tbe same thermo-hydraulie calculational tools that
were used to estlmate the time windows.
The third alternative is to use a generie data compilation. The
ORE projeet has collected data on more than 40 scenarios, resulting
in about 1,100 data points associated with more tban 100 HIs. Thatis an average ot &bout 10 data points per HI. The data can be used
in several different. ways. The most appropriate way is to choose
a data set that most closely matches the scenario specification and
HI definition of interest. Another factor of importance is tbat,
to be completely compatible, the plant desiqn and operational
practices should also match as closely as possible. It is possible
to determine the former from the information in the ORE report(1.
It may not, however, be so easy to compare deslgns, or particularly
operational practices, particularly as the plants from which the
data are eolleeted are not identified. An alternative then is to
use aqqreqated data as discussed in Reterence 3.
4.0 A COKl'LBHTARY CAUSB-BASBD Al'l'ROACB TC TB BSTIKATIOH 01' Pe
The approach involves the identifieation of situation-speeitic
error eonducive factors, and was guided by an analysi~ of errors
observed . in the ORE and elsewhere. Tbe approach is one ofdecomposition, eonsistinq of identifyinq potential error-eausinq
mechanismsand, tor eaeh mechanism, evaluatinq the impact oteertain performance shapinq faetors on an HI-specific basis, and
also allowing for potential recovery mechanisms. This isessentially an analytical approach, as opposed to tbe empirical
approach represented by the use of HCR/ORE curves. AvaUable time
is considered primarily in the applieation of the recovery factors,
whose impact is considered to be time dependent.
- 234-
4. i Decomosition
To faeilitate the identitieation of tbe potential cau~es of error,
a decomposition ia first made into two high-level failure modes
which ean be characterized aa:
1 - Errors assoeiated with the plant intormation-operator, and
2 - Errors associated with the operator-procedure intertaee.
Each ot the high-level failure modea may, in turn, be deeomposed
into contributions from several distinct error-cauaing meehanism.s.
The way in which this deeomposition is made is clearly aubjective
and to. some extend, arbitrary. It depends on the analyst'a
experience and biases as to what he thinks are the most important
mechanisms. The deeomposition developed by the authors ot this
report ia aumarized below.
Failure Mode 1: Failures of the Plant Information-Operotor
Interface: Four meehanisms are identitied for thia failure mode.
pca. The required data are phyaically not available to theeontrol room operators.
pe;. The data are available, but are not attended to.
pcc. The data are available,miseommunieated.but are misread or
Pcd. The available information ia misleadinq.
Failure Moe 2: Failure in the Ergcedure-Crew Interface: Given
that tbe exiatenee of a posaible eue atate haB been recoqized,
four waya have been identified in which the crew may fail to reaeh
the correct interpretation (for Tye CP BI., "correctinterpretation" meana execute an action or proceed to the next
appropriate instruction a. eontingent on the eue atate).
pce.. Tberelevant .tep in the procedure ia akipped.
Pef. An error ia made in interpretinq tbe inatruetion.
- 235-
pcq. An error 1s made in interpreting the diagnostic logic(this is a subset of Pct, but i& treated separately forconvenience) .
pch. Tbe crew decides to deliberately violate the procedure.
This partieular deeomposition is based on an assumption that the
procedures are, in their intent, correct. However, incorrect
procedures eould clearly be a eause for failure.
The approach proposed for the evaluation of Pc 1s, for eaeh failure
mechanism, to construct adecision tree, whieh incorporates
questions eoneerning the principal tactors that are felt toinfluence its probability of occurrence. Tvo example trees that
were eonstructed as part of the work reported here are presented in
Figures 3 and 4.
The decision trees presented here are not intended to bedefinitive, either in the ehoice of branch points or in the
probabilities used. They are provided as a demonstration of the
application of the thought process. Individual analysts are
encouraged to bring their own judgement to bear on what are the
important issues, and how to assess the probabilities. Ht)wever, it
should be stressed that the establishment of the trees and the
elemental probabilities must be done at tbe outset of the HR, so
that all the type CP HI events are evaluated eonsistently.
Given that an initial estimate of the probabilities of eaeh
mechanism has been obtained, the possibility ot recovering from
that mechanism, within the time allowable (Ty) is allowed for by
eorrectinq tbe initial estimates of tbe Pca throuqh pch.
4.2 Recoyery Analysis
The failUre mechanisms emodied in the deeision trees can bepartitioned into two eateqories on the basis of tbe predominant
levels of coqitive processinq thatintluenee the outcomes.
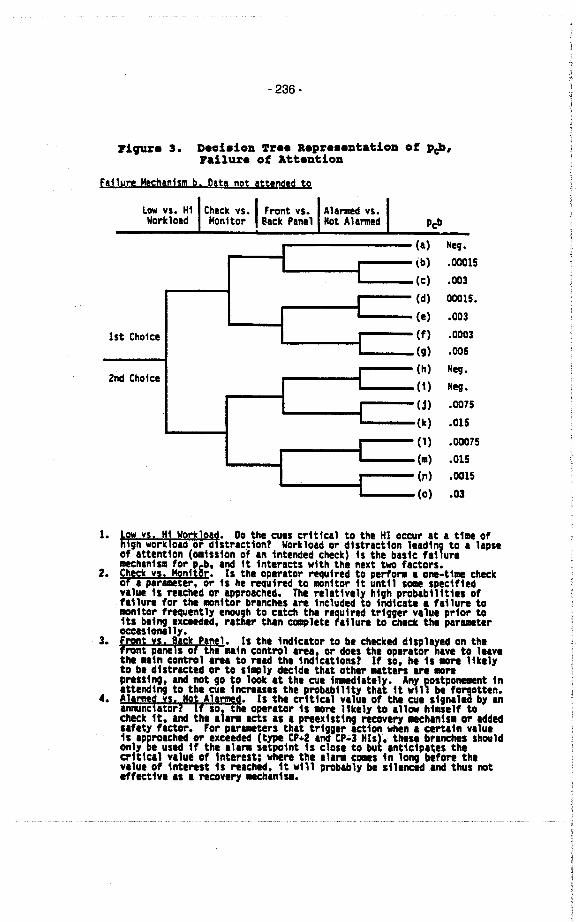
- 236-
I'igure 3. Deci.ion ~ree Repre.entation of pCb,Pailure ot Attention
Fillure Mechinism b. Diti not Itten~
Low vs. H1 Check vs. I Front vs.Workloid Monitor 81ck Pine1
i1
i
I
1st Cho1ce I
i
2nd Choicei
Ii
I
i
Ii
I i
Pçb
(i)(b)
(c)
(d)
(e)
(f)(g)
(h)
(1 )
(j)(k)
(1 )
(11)
(11)
(0)
Heg.
.00015
.003
00015.
.003
.0003
.006
Heg.
Neg.
.0075
.015
.00075
.015
.0015
.03
1. ~~ vs. H1 Worklold. 00 the CUIS cr1tical to the HI occur at a time of9ft workload or dlstract1on? Workload or d1strlct1on lead1ng to i lapse
of attention (0i1s110n of an 1ntended check) is the bll1c fa11uremehan1sl1 for p b. and lt 1nteracts with the next two factors.
2. Check vs. Monftär. 11 the operator requ1red to perlol' i one-t1me check0' a paramter, or 11 he reired to iinitor 1t unt11 SOl spec1f1edvilue 11 reaehed or approached. The relat1vely h1gh probab111t1es offa11ure for thi ionftor brinches ire fncluded to 1nd1cati i fii lure toIin1tor freently enogh to catch the requfred trigger va1ue prior to1ts being exee. ritbr than camlete fl1lure to check thi paramteroeas ionlly.
3. Frot ys. 'ack Pl~. 11 thi 1nd1cator to bi checked d1Sp1ayed on thifront pan i of e .1n controlirei, or das thi operitor hive to liivetti .iin controlirei to relC the 1nd1cat1ons? If so. he 1s iore Hkelyto bl d1ltrleted or to s1ialy dec1dl thit other .tters ire iorepress1ng. ind not go to look it thi cue 1iitltll)'. Any postpoiint tnittenctng to thi CUi tnereases thi probabtltt)' thit tt wtll bl fo"!otten.
4. ~. Is tti er1ttell vilul of thi CUi s1gnlleèl by an~e operator 1s iire Hkely to l110w MIISllf tocheck 1t. ind the iti,. iets 1i I preextsttng l'covel' .ctiintSl or iddedsifet)' 'ietor. For piramters that tr1gger ietton when i certitn vilul11 ipproached or exeeeded (type CP.Z ind CP.3 HIsl. thiie brinches shouldonl)' be usld tf the 1111' setpoint ti elos1 to but Int1etpites thetritteil valui of tnterest; wtiere the 111,. eeis in long before th.vilue of 1nterest 15 reiehed, 1t w111 probably be sl1ena an ttis noteffective is I reeovel' .clniSl.
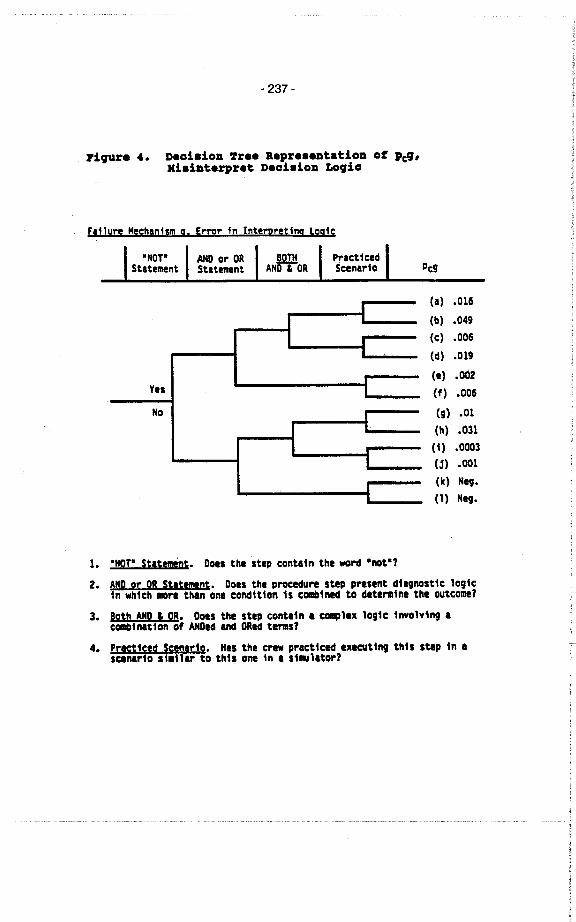
- 237-
Figur. 4. Deaision Tree Repre.entation of pcq,Xi.interpret Deai.ion Logia
Pcg
i
I
I
Yes
No
Ii
I
i
i
(i) .016
(b) .049
(e) .006
(d) .019
(i) .OÓ2
(f) .006
(g) .01
(h) .031
(1) .0003
(j) .001
(k) Neg.
(1) Nig.
1. 'NOT' Stitemnt. Dois the Stip contl1n thi word 'not'?
2. ANO or OR Stitemnt. Dois thi proedure Stip presint d1lgnost1c 10g1cin wh1ch iire than OM cond1t1on 1s coi1ne to ditel"ine the outcome?
3. 80th AND . QR. Ooes the Stip conti in. comlex 10g1c 1nvolving icoi1l1t1on of AHDec ind ORec tems?
4. Praçt1çld Scenariq. His the cr prieiicec execting this step in .sceiirio st.11lr to th1s one in I SilUlltor?
- 238-
Failure mechanisms a, d, f, and gare strongly intluenced by the
operators' training (specific knowledge) and his ability to draw on
it to solve problems, whereas mechanisms b, c, an.e: e are more
completely determined by easily observable physical as~~cts ot the
situation with whieh he is dealing, and the errors involved may be
categorized as slips or lapses rather than errors of understanding
or intention. Deliberate violations ot tbe procedure, p~, do not
fall into either of the above categories, but are assumed to be
recoverable if the crew so chooses.
For both kinds of errors, the basic recovery mechanism isrevisitation, either by the individual who committed the error, or
by a second party. For the individual, this mechanism is much more
effective in the ease of slips than it is in the case of failures
of' interpretation or memory, larqely because the latter reflect a
characteristic of the individual instead of a more or less random
oecurrence that is potentiatedby situational charaeteristics that
may bemomentary (e.g., worklead or distraetion).
Examination of the recovery factors identified makes it clear that
recovery potential is also a function ot time, because the factors
proposed require time to come into play. In this way, the value of
Pe is not tixed at its initial value, but is itself a decreasing
function of time, providinq a different slope (or a stair-stepslope) to the eurve deseribinq the probability. of non-suceess,
rather than a elearly demareated asymptotie value.
4.3 Synthesis
The probability of non-response, taking all this into account, may
be written a.:
Pe = 2¡,,1,2 2jP¡¡pÎ';~2
- 239-
Where PfJ i. the probability Of mechanism j of the mode i occurring
initially for the HI, and the PnrJt is the probability of non-
recovery from mechanism j in mode i. Tbis formalism recognizes the
fact that different error meehanisms may have different recovery or
eompensatinq tactors. The formula, representing the value of Pe as
the Ji of the probabilities ot an error resulting trom eaeh of the
eonstituent meehanisms implies that the mechanisms are considered
to be independent. This 1s a eonservative assumption.
5.0 8UHY
This paper has presented an approach to the estimation of the
probability of failure of an operating crew to make a timely,
correet response as required by emergency or abnormal operatingprocedures. The work reported here has coneentrated on thedetection, diaqnosis, and decision makinq phase of the response
rather than the execution 'phase. This is largely for thehistorieal reason that the current work has grown out of the ORE
project, where the foeus was on that first phase of response. To
accommodate this, the failure mode is split into two contributions,
the failure of the operators to initiate eorrect, timely re~ponse,
and the failure to execute the response correctly, as discussed in
section 2.
The use of simulator exereises to provide both qualitative and
quantitative data on operating crew response is reeommended. Inthis way, as lonq as the simulator is a faithful representation ot
the control room and provides a faithful representation of the
plant response, many of the important pertormance shapinq faetors
are implicitly addressed. Of course there can be argents aboutwhether th. stress in the simulator is comparable to that in areal
accident. However, tbe us. of simulators. undoubtedly provides a
basis for as..ssment that is more firmly anehored in reality than
arbi trary theoretical models.
- 240-
A type of time reliability correlation, called the HCR/OREcorrelation is proposed to use response time data tor theevaluation of the probability of failure to initiate timely action.
The use of plant specifie data to calibrate the eorrelation data is
elearly to be preferred, but as an alternative, tbe data eollected
in the ORE project(1 can be used.
The use of the time-reliability curves to .stimate the probability
of untimely response requires in many cases that the HCR/ORE
correlation be extrapolated into a reqion far beyond where response
. time data was collected. In this ease, sinee there is notheoretical basis for the functional form of the response time
curve, exrapolation is suspeet. Furthermore, the approach does
not immediately lend itself to identifyinq the eauses of failure,
whieh may be important it eorrective actions are warranted as a
result of the PSA evaluation. Therefore, an alternateeomplementa approach to the evaluation of the probabiUty is
proposed. The approach proposed is based on identifyingsiqnifieant failure mechanisms, and, for each failure mechanism,
constructing adecision tree whose branches represent the most
important influenee factors, to help subjectively assign failure
probabi1ities. Recovery is also allowed as the scenario permits.
While an example decomposition is presented in this paper, it
should be realized that this is only one of many possibledecompositions, and is almost eertainly not complete. For example,
while the particular deeomposition may help identify the potential
for outlier bebavior that results trom situational or procedural
factors, it will not, in its present form, identify specific crew
behavioral problems nor indeed is it intended to , as discussed in
Seetion 2.
The approach is, however, an ideal formt tor representinq the
basis. for an. HR anaiýst's assessment8, making the assumptions
visible in .suc~: a waythat tbe analysis can .be easily reviewed.

- 241 -
Thi. approach also enforces a degree of self consistency which
would not be so easy to achieve with less formal or less systematic
approaches.
RBPBRBHCBS
1. Spurgin, A.J. et. al., operation Reliability Experiments UsingPower Plant Simulations, EPRI NP-6937, Volume 1, ExecutiveSumary July 1990, Volume 2, Technical Report, July 1990,Volume 3, Appendices, Oecember 1990.
2. Hannaman, G.W., A.J. spurgin, and y.o. Lukic, Human Cognitiye.Reliability Model for PR Analysis, NUS-4531, Electric PowerResearch Institute, 1984a.
3. Moieni, P., G.W. Parry, A.J. spurgin, A. Singh, The Use ofsimulator Data in Human Reliability Analysis; Results fromtbe EPRI Operator Reliability Experiments Program,"proceedings ot Probabilistic Safety Assessment andManagement", Beverly Hi~ls, CA, February 1991, Elsevier.
4. Hall, R.E., J.R. Fragola, and J. Wreathall, Post Eyent HumanDecision Errors; Operator Action Tree/Time ReliabilityCorrelation, NUG/CR-3010 USNRC, 1982.
5. Beare, A., C.D. Gaddy, G.W. Parry and A. Singh, An Approachfor Assessment of the Reliability of Cognitiye Response forNuclear Power Plant Operating Crews, "Proceedings ofProbabilistic Safety. and Management", Beverly Hills, CA,February 1991, Elsevier.
6. Swain, A.D., and H.B. Guttmann, Handbook of Human ReliabilityAnalysis with Emhasis on Nuclear Power Plant Applications,NUG/CR-1278, SAN080-0200, 1983.
- 242-
An Assessment of the Risk Significanceof Human Errors in Selected PSAs
and Operating Events
Robert L. Palla, Jr.Ade 1 El-Bass i oni
Risk Applications BranchOffice of Nuclear Reactor RegulationU.S. Nuclear Regulatory Commission
James HigginsDepartment ofNuclear Energy
Brookhaven National Laboratory
ABSTRACT
Sensitivity studies based on Probabilistic Safety Assessments (PSAs) for apressurized water reactor and a boiling water reactor are described. In eachcase, human errors modeled in the PSAs. were categorized according to such factorsas error type, location, timing, and plant personnel involved. Sensitivitystudies were then conducted by varying the error rates in each category andevaluating the corresponding change in total core damage frequency and accidentsequence frequency. Insights obtained are discussed and reasons for differencesin risk sensitivity between plants are explored. A separateinvestjgation intothe role of human error in risk-important operating events is also described.This investigation involved the analysis of data from the U.S. Nuclear RegulatoryCommission (NRC) Accident Sequence Precursor program to determin~ the effect ofoperator-initiated events on accident precursor trends, and to determine whetherimproved training can be correlated to current trends. The findings of thisstudy are also presented.
INTRODUCTION
In recent years it has become increasingly clear that the risk associated withnuclear power is strongly influenced by human performance. Although human errorshave contributed heavily to the two core melt events that have occurred at powerreactors, effective performance during an event can also prevent a degradedsituation from progressing to a more serious accident, as repeatedly shown inthe U.S. operating experience. Two studies were sponsored by the NRC over thelast three years in an attempt to quantify the potential impact of humanperformance on risk and to derive insights on how to limit risk. The first studyinvestigated the sensitivity of risk to human error using the probabilisticsafety assessments for severa 1 nuc 1 ear power p 1 ants. The second study i nvo 1 vedan analysis..of re cent risk-significant operating events in U.S. reactors todetermine the role of human error in these events and to identify wh etherimproved training can be correlated to current safety trends. The results ofthese studies are the subject of this paper. While significantly different incharacter, the findings of both studies confirm the importance of human error,and support a regulatory strategy of reducing human errors and improving thelikelihood of success for recoveryactions through increased emphasis on emer-gency operating procedures, accident management preparation, and operatortrai ni ng.

- 243-
SENSITIVITY STUOIES
Background
In 1980, Brookhaven National Laboratory performed a study for the NRC on thesensitivity of risk parameters to human error rates using the WASH-1400 model forthe Surry plant (Westin9house pressurized water reactor). This model includedtreatment of approximately 100 human errors, most of which were pre-accidenterrors, e.g., calibration errors and failure to properly reposition valves. Thestudy confirmed the risk significance of human error and provided additionalinsights into risk important sequences and categories of human actions at Surry
(Reference 1).
The insights from the Surry study were considered by the NRC to be of potentialvalue in guiding licensing and inspection activities. The results, however, wereplant-specific and influenced by assumptions and level of.detail in the humanreliability analysis (HRA). Notably, this early PSA did not model operatòrrecovery actions. Accordingly, an effort was initiated in 1987 to update andexpand the insights from the original study to reflect advances in HRA techniquesand additional nuclear steam supply system designs. The program involved theconduct of extensive analyses of the sensitivity of risk to human error based onthe PSA for a pressurized water re ac tor (PWR), followed by similar analyses usinga PSA for a boiling water reactor (BWR). These studies are described in detailin References 2 and 3, respectively. Most recently, similar sensitivity analyseshavealso been performed by the NRC for several of the plants studied in NUREG-llS0.These ana lyses are not di scussed in thi s paper.
Approach
The level 1 portions of the PSAs for Oconee, Unit 3 (Babcock & Wilcox PWR) andLaSalle, Unit 1 (General Electric BWR/S) were selected as the basis for detailedsensitivity studies. The Oconee PSA was performed by the E1ectric Power ResearchInstitute for Oconee, Unit 3 and published as NSAC-60 in 1984 (Reference 4).Thi s PSA was se lected because i t i nc 1 uded the most detai 1 ed treatment of humanerror in a PWR study at that time. As an example, the Oconee PSA includes overSOO individual human errors, of which over 200 remained after truncation. TheLaSalle PSA used was a 1988 the NRC Risk Methods Integration and EvaluationProgram. The LaSalle study was selected for analysis because it was consideredto be a state-of-the~art BWR study and unique in its extensive use of simulator-based human error rate data.
A human errar categorization scheme was developed to allow insights to be drawnfrom the sensitivity studies. Human errors modelled in the respective PSAs werethen categori zed accordi ng to such factors as timi ng (pre-accident or duri ng-accident), location (inside or outside control room), and personne1 involved
(e.g., 1 icensed reactor operator, non-1 icensed operator, and maintenance personnel).A profile of the types of human errors in each PSA is presented in Figure 1. Majordifferences are (1) a 1arger number of human errors in the Oconee PSA, due in partto the representation of numerous individual human errors in the LaSalle study by"generic" errors, and (2) the presence of only a limited number of pre-accident
- 244-
errors in the screened cutsets of the LaSalle PSA in contrast to a nearly equalnumber of pre-accident and during-accident errors in Oconee.
Sensitivity calculations were conducted by varying the human error probabilities
(HEPs) for all errors and for individual categories of errors, and investigatingthe corresponding changes in total core damage frequency (COF) and accidentsequence frequency. HEPs were generally varied by multiplicative factors overranges which depended on the type of error. The largest range extended from 1/30up to 30 times the base case value of the HEP (without exceeding a maximum HEP of1.0). Such variations in HEPs on a global basis are considered hypothetical, andfor pract i ca 1 purposes , sma 11 er vari ati ons around the base case probabi 1 i ties maybe of more interest. A summary of the more significant results are providèd below.
Sensitivity of Total Core Oamage Frequency
Total core damage frequency for both Oconee and LaSalle was found to vary signifi-cantly as. all HEPs were varied simultaneously over their full range (Figure 2).The Oconee COF variation is over four orders of magnitude, compared to less thantwo orders of magnitude for LaSalle. For both plants, the bulk of the change inCOF occurs within a factor of 3 to 10 from the base case.
The large difference in sensitivity between Oconee and LaSalle was investigatedand was found to be due to a combination of factors, the most important of whichinclude: (1) the presence of multiple HEs in cutsets of the dominant sequencesof Oconee, (2) a larger number of HEs in the Oconee PSA, and (3) higher basecase HEPs in the LaSalle PSA. Both plant design differences (S4ch as a StandbyShutdown Facility and an Emergency Feedwater System at Oconee which requiremanua 1 act ions) and PSA/HRA modell i ng differences (such as a deci s ion to not
include calibration errors in the LaSalle PSA) contribute to these factors.The significance of multiple human errors in the dominant cutsets is illustratedin Figure 3, which shows that by only doubling the HEPs, cutsets with multiplehuman errors begin to dominate the risk profile.
Sensitivity of Accident Sequence Frequency
Certain sequences are dominated by cutsets involving multiple human errors andexhibit strong sensitivity to changes in HEPs. An example for Oconee is the lossof instrument air sequence which includes a failure to provide feedwater within30 minutes combined with a failure to recover instrument air in one hour. Othersequences are hardware domi nated and 1 ess sens i ti ve to changes inhuman errorrates, such as large break LOCAs that progress rapidly and provide little oppor-tunity for operator intervention. The sensitivity of the dominant sequences forOconee is depicted in Figure 4. The curve for total core damage frequency isinfluenced by different sequences at each extreme. As HEPs are increased,sequences dominated by human actions define the curve, whereas when HEPs arereduced, the curve i s defi ned by hardware-domi nated sequences.
- 245-
Pre-Accident Versus During-Accident Errors
Sensitivity analyses for both Oconee and LaSalle suggest that actions taken duringthe course of an accident (e.g., operator errors and recovery actions) have fargreater impact on risk than errors made prior to an event (e.g., failure torestore a valve to the proper position after maintenance). Results for Oconeeare shown in Figure 5 and are similar to those for LaSalle. While consistentwith intuition, these results should be interpreted cautiously, recognizing thatPSAs do not offer a complete treatment of pre-accident activities and errors,and that the sensitivity analysis did not explore the impact of human error oninitiating event frequenèy. Nevertheless, the sensitivity evaluation highlightsthe importance of emergency oper at i ng procedures and trai ni ng in mi t igati ngimportant acc ident sequences.
Personne 1 Type
Calculations were also performed to investigate the sensitivity of core damagefrequency to errors committed by various categories of personnel. Results ofthese evaluations indicate that core damage frequency is most sensitive toactivities (and associated errors) which are the primary responsibility of the1 icensed reactor operator. Due to the si gnificance of duri ng-accident errorsand the licensed reactor operator, additional evaluations were conducted forthose acti ons i nvo 1 vi ng coordi nat i on between the 1 icensed reactor operator andother personnel, and those actions carried out solely by the reactor operator.Results of these analyses (Figure 6) indicate that actions involving coordinationbetween the 1 icensed reactor operator and non-l icensed operator have a greaterinfluence on core damage frequency than actions involving any other categoriesof personnel. These results point out the importance of communications, teamtrai ni ng, and the non- 1 i censed operators themse 1 ves.
Simul ator-Based Human Error Probabi 1 ities
Approximately 70 percent of the human errors represented in the LaSalle PSA werequantified using data collected on the LaSalle plant-specific full scope simu-lator. This included essentially all of the errors associated with activitiesin the control room. As shown in Figure 7, despite the extensive use of simulatordata, "simul ator-based" human errors did not have a domi nant effect on core damagefrequency. Instead, core damage frequency for LaSalle was found to be most stronglyinfluenced by human actions/errors which would be taken outside the control room andwhich could not be readily simulated. In particular, these errors were associatedwith recovery of offsite AC power and repair of the emergency diesel generator.This sensitivity evaluation illustrates that not all important human actions can besimulated in a standard control room simulator, and that for such errors alternativetypes of training may be beneficial. The potential role of training in reducing theincidence of human error was investigated in aseparate study as discussed below.
ROLE OF HUMAN ERROR AND TRAINING IN RECENT OPERATING EVENTS
Background
The Accident Sequence Precursor (ASP) program at the NRC is an ongoing activityin which operational events that occur at light water reactors are screened for
- 246-
precursors to more significant accidents based on risk significance. The resultsfrom the ASP program, including estimated conditional core damage probabilitiesfor accident sequences of interest, are used to identify potential problem areasand emerging trends in the incidence and severity of precursor events.
In 1990, the NRC undertook a study of the ASP data to determine the effect ofoperator-initiated events on the general trends identified in the ASP program,and in particular, to identify whether improved training can be correlated to thecurrent improvi ng trends in the ri sk s ignificance of precursor events. A summaryof the approach and findings is provided below.
Approach
The NRC staff, supported by Brookhaven National Laboratory, reviewed the licenseeevent reports (LERs) for all precursor events during 1984 through 1989 andidentified and characterized human errors that occurred in these events.Recognizing that the classification of a human action as an error can involvea significant amount of jud9ment, the validity of this assessment was confirmedby comparison with the human error classifications reported in the annual ASPstatus reports (Reference 5). To provide additional verification, a human errorident ifi cat ion protoco 1 was app 1 ied to precursor events for 1989. Thi s protoco 1is currently undergoing further development for systematically searching thecomputer i zed nuc 1 ear documents database (NUDOCS) for LERs i nvo 1 vi ng human error.
Each identified human error was evaluated by a three-member panel to determinewhether nuclear power plant training programs should be effective in preventingthe error. Specifically, for each error the panel determined whéther "trainin9,as it exists today in the nuclear industry and as it would reasonably be expectedto develop over the next few years, could be effective in preventing the error."However, while the panel may have determined that training could oe effective inpreventing a specific error, such adetermination does not indicate that trainingwould absolutely prevent an error from occurring. Many factors can contribute toan error, and training is but one.
Finally, this additional information was sorted in various ways to identify anycorrelations between improving trends in the ASP data and major improvements inindustry training programs implemented over the6-year period; specifically, theINPO-managed accreditation of utility training programs and implementation ofplant-specific or plant-referenced control room simulators required by 10 CFR55.45(b).
Results
Of the 184 precursor events rev i ewed, 93 i nvo 1 ved one or more human errors. The93 LERs wi th human errors had a total of 165 human errors; about half of theseerrors occurred prior to the event, about 25% initiated the event, and theremaining 25% occurred during the response to the event. Of the 93 eventsinvolving human error, 57 (slightly more than half) were judged to be affectedby training programs. (A precursor event was considered to be affected bytraining if at least one of the human errors occurring in the event was judgedto be affected by training.)
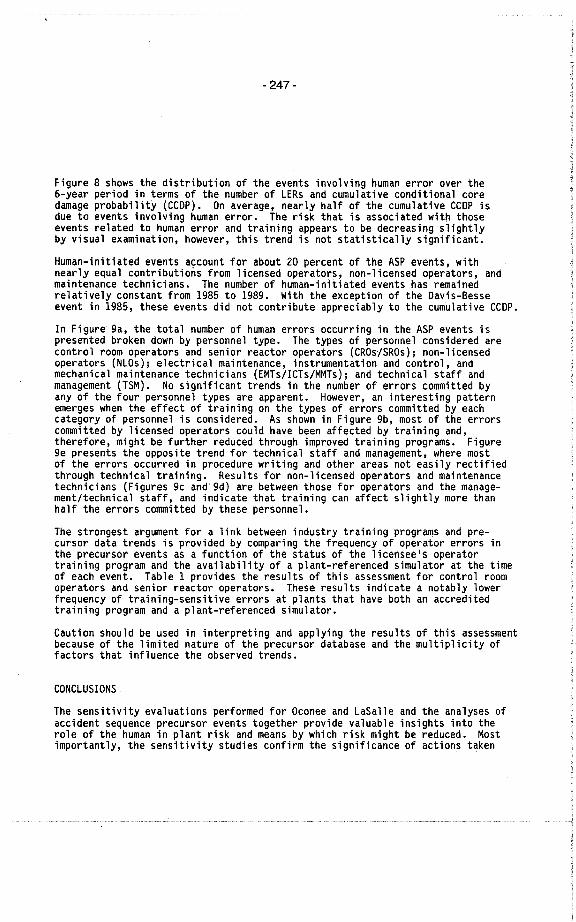
- 247-
Figure 8 shows the distribution of the events involving human error over the6-year period in terms of the number of LERs and cumulative conditional coredamage probability (CCDP). On average, nearly half of the cumulative CCDP isdue to events involving human error. The risk that is associated witn thoseevents related to human error and training appears to be decreasing slightlyby visual examination, however, this trend is not statistically significant.
Human-initiated events account for about 20 percent of the ASP events, withnearly equa 1 contri buti ons from 1 i censed operators, non- 1 i censed operators, andmaintenance technicians. The number of human-initiated events has remainedrelatively constant from 1985 to 1989. With the exception of the Davis-Besseevent in 1985, these events did not contribute appreciably to the cumulative CCDP.
In Figure 9a, the total number of human errors occurring in the ASP events ispresented broken down by personnel type. The types of personnel considered arecontro 1 room operators and seni or reactor operators (CROs/SROs); non-l i censedoperators (NLOs); electrica 1 mai ntenance, instrumentation and control, andmechanical maintenance technicîans (EMTs/ICTs/MMTs); and technical staff andmanagement (TSM). No significant trends in the number of errors committed byany of the four personnel types are apparent. However, an interesting patternemerges when the effect of training on the types of errors committed by eachcategory of personnel is considered. As shown in Figure 9b, most of the errorscommitted by licensed operators could have been affected by training and,therefore, might be further reduced through improved training programs. Figurege presents the opposite trend for technical staff and management, where mostof the errors occurred in procedure writing and other areas not easily rectifiedthrough technical training. Results for non-licensed operators and maintenancetechnicians (Figures 9c and.9d) are between those for operators and the manage-ment/technical staff, and indicate that training can affect sl ightly more thanhalf the errors committed by these personnel.
The strongest argument for a link between industry training programs and pre-cursor data trends is provided by comparing the frequency of operator errors inthe precursor events as a function of the status of the licensee's operatortraining program and the availability of a plant-referenced simulator at the timeof each event. Table 1 provides the results of this assessment for control roomoperators and senior reactor operators. These results indicate a notably lowerfrequency of trai ni ng-sens i t i ve errors at p 1 ants that have both an accredi tedtraining program and a plant-referenced simulator.
Caution should be used in interpreting and applying the results of this assessmentbecause of the limited nature of the precursor database and the multiplicity offactors that influence the observed trends.
CONCLUSIONS -
The sensitivity evaluations performed for Oconee and LaSalle and the analyses ofaccident sequence precursor events together provide valuable insights into therole of the human in plant risk and means by which risk might be reduced. Mostimportantly, the sensitivity studies confirm the significance of actions taken
- 248-
by operators in response to an event, and the importance of activities whichinvolve coordination between licensed reactor operators (inside the control room)and non-l icensed operators outside the control room. These. findings support aregulatory strategy of reducing human errors and improving the likelihood ofsuccess for recoveryactions through continued emphasis on emergency operatingprocedures, accident management preparation, and operator training.
The reduced frequency of operator errors at plants with both accredited trainingprograms and plant simulators provides evidence that training may reduce theincidence of error and that this strategy is already paying off. As the sensi-tivity evaluations indicate, however, control room simulation cannot address allimportant events and recovery actions, and training for certain actions may needto be accomplished through other means. Accordingly, this is an area that willbe specifically addressed in future activities under the accident managementprogram.
REFERENCES
1. NUREG/CR-1879, "Sensitivity of Risk Parameters to Human Errors in ReactorSafety Study for a PWR", Brookhaven National Laboratory, January 1981
2. NUREG/CR-5319, "Risk Sensitivity to Human Error", Brookhaven NationalLaboratory, Apri 1 1989
3. NUREG/CR-5527, "Risk Sensitivity to Human Error in the LaSalle PRA",Brookhaven National Laboratory, March 1990 .
4. NSAC-60, "Oconee PRA: A Probabilistic Risk Assessment of Oconee Unit 3",NSAC-EPRI, June 1984
5. NUREG/CR-4674, "Precursors to Potential Severe Core Damage Accidents",Oak Ridge National Laboratory
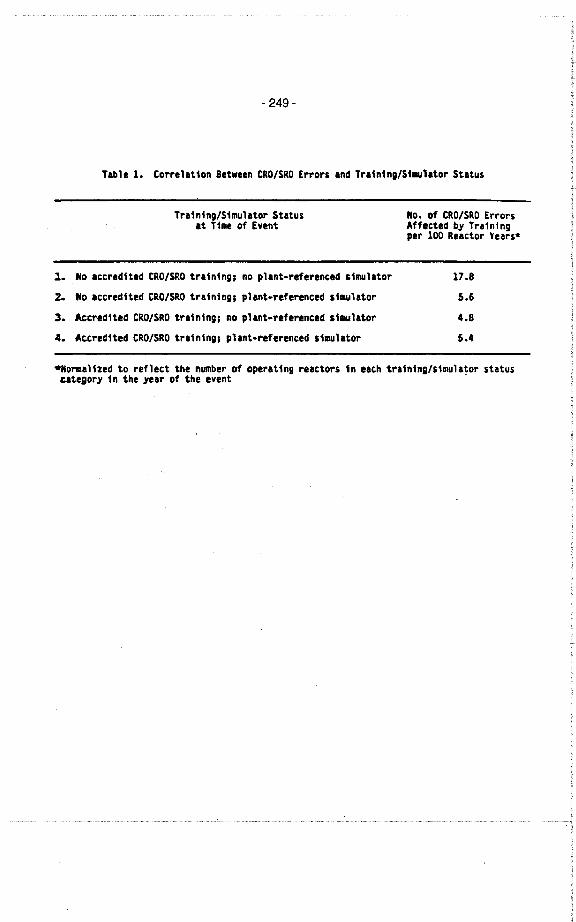
- 249-
Table 1. Correlat1on 8etween CRO/SRO Errors and Tra1n1ng/S1~lator Status
Training/Simulator Status No. of CRO/SRO Errorsat Time of Event Affected by Train1ng
per 100 Reactor Years*
J. No accred1ted CRO/SRO training, no plant-referenced simulator 17.8
2. No accredited CRO/SRO training, plant-referenced simulator 5.6
3. Accredited CRO/SRO training; no plant-referenced simulator 4.8
.. Accredited CRO/SRO training; plant-referenced simulator 5.4
-Wormalized to reflect the number of operating re ac tors in each training/simulator status£itegory in the year of the event .
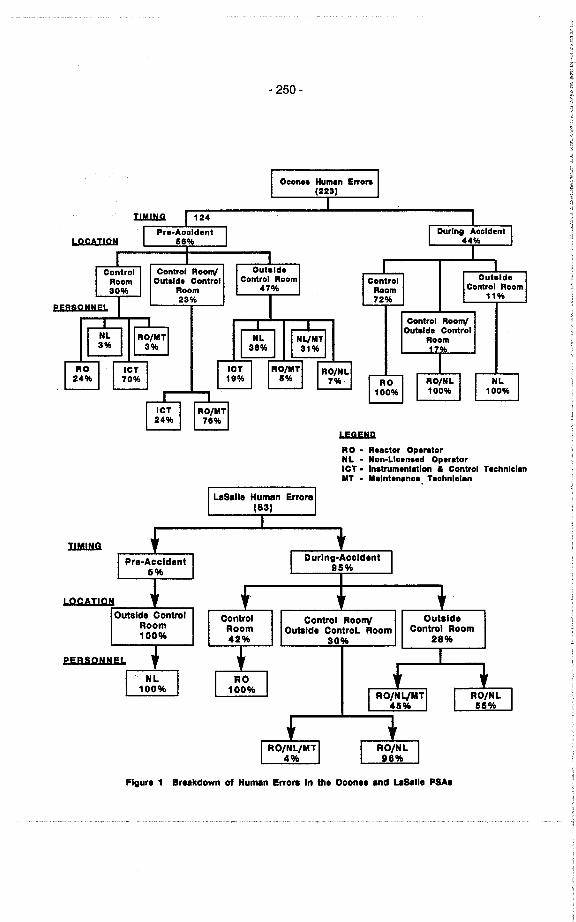
- 250-
II
R 0 . Reeetor OperetorNL . Non-L1een..d OperetorICT. Inatrumentatlon . Control TeehnlclanMT . Malntenanee. Teehnlelan
Figura 1 Br.ekdown of Human Errora In the Ocon.. end uSaUe PSAe
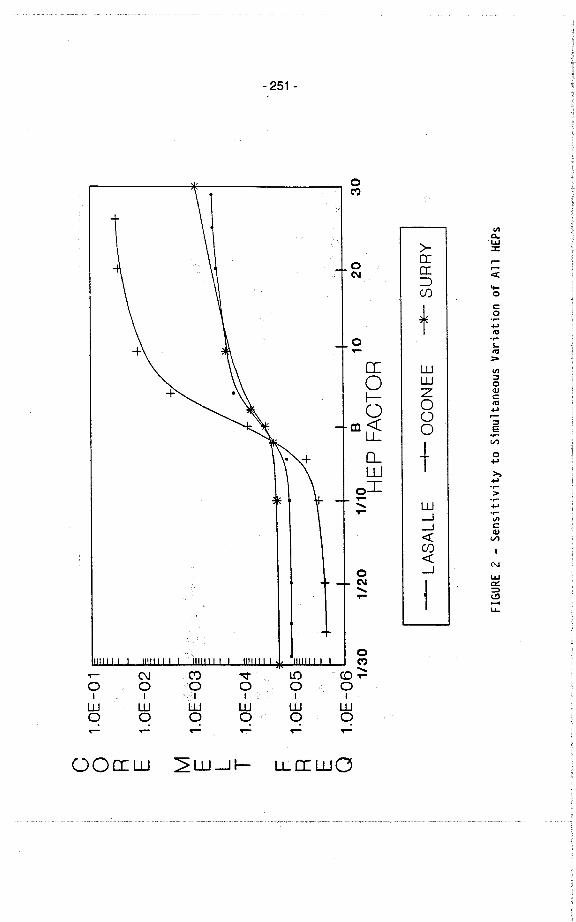
C1.0E -0 1
0 R E1.
0E-0
2
M1.
0E"'
03E L T
1.0E
-04
F1.
0E-0
5R E Q
1.0E
-06
1/30
1120
, I\ c. ..
1/10 B 10
HEP FACTOR
2030
I ~ LASALLE -+ OCONEE -- SURRY I
FIGURE 2 - Sensitivity to Simultaneous Variation of All HEPs
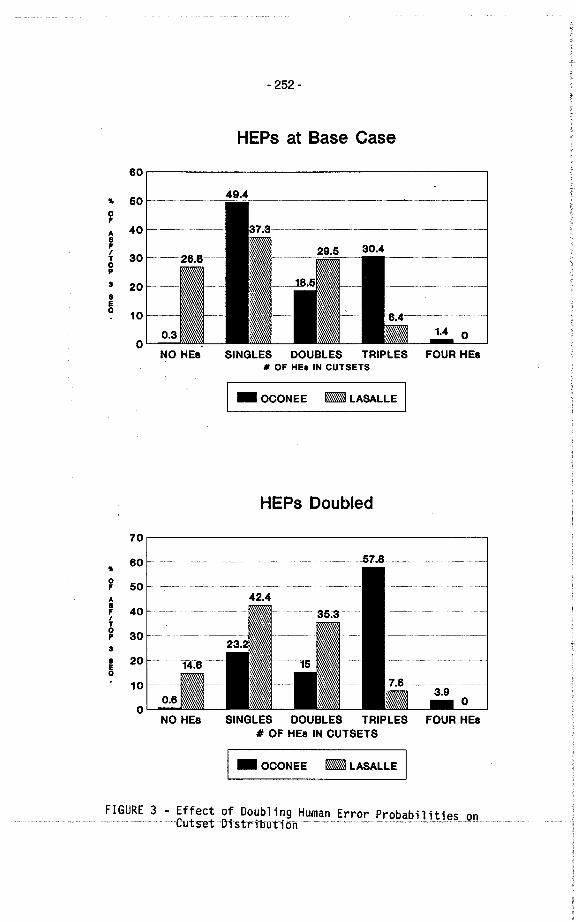
- 252-
HEPs at Base Case
80
.. 500F
A 408FI 30T0P
S 208EQ 10
0NO HEa SINGLES DOUBLES TRIPLES FOUR HEa
11 OF HE. IN CUTSETS
I - OCONEE - LASALLE I
70
.. 800 50F
A8 40FIT0
30p
3
8 20EQ
10
0NO HEs
....................57.8..
HEPs Doubled
o
SINGLES DOUBLES TRIPLES FOUR HEs# OF HEs IN CUTSETS
I - OCONEE - LASALLE I
FIGURE 3 - Effect of Doubling Human Error Probabilities..Cutset.Di..stribat.iöli................................................................................................................................................. 01)
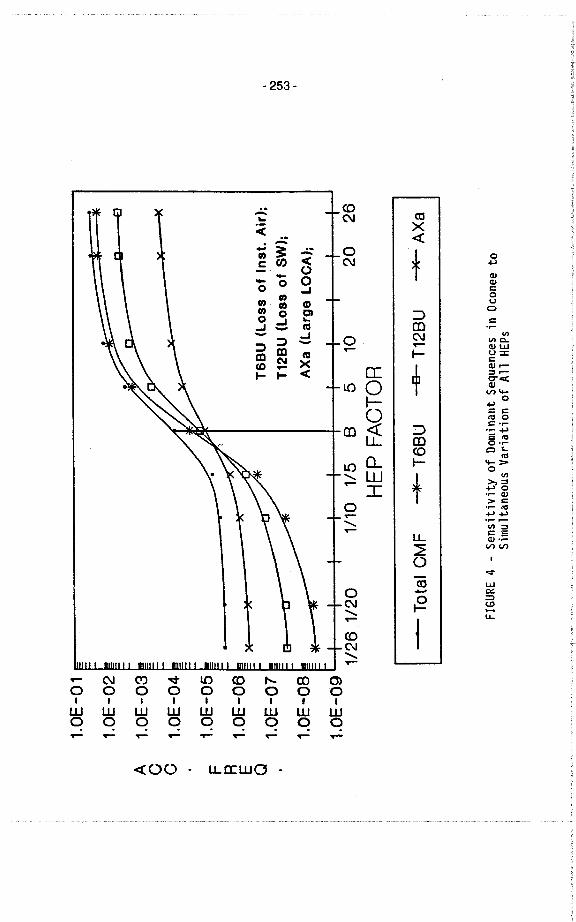
1.0E
-01
1.0E
-02
A1.
0E-0
3C G
1.0E
-04
F1.
0E-0
5R
tOE
-06
E Q1.0E-07 ~
~/*
I
T6B
U (
Los
s 01
Ins
l. A
ir),
I. I\
T12
BU
(Lo
ss o
f SW
);c. tù ,
1.0E
-08~
~I
AXa (Large LOCA);
tOE
-09
1/26
1/2
0 1/
10 1
/5 B
5 1
0 20
26
HEP FACTOR
1- Total CMF -- T6BU -Ð T12BU -* AXa I
FIGURE 4 - Sensitivity of Dominant Sequences in Oconee to
Simultaneous Variation of All HEPs
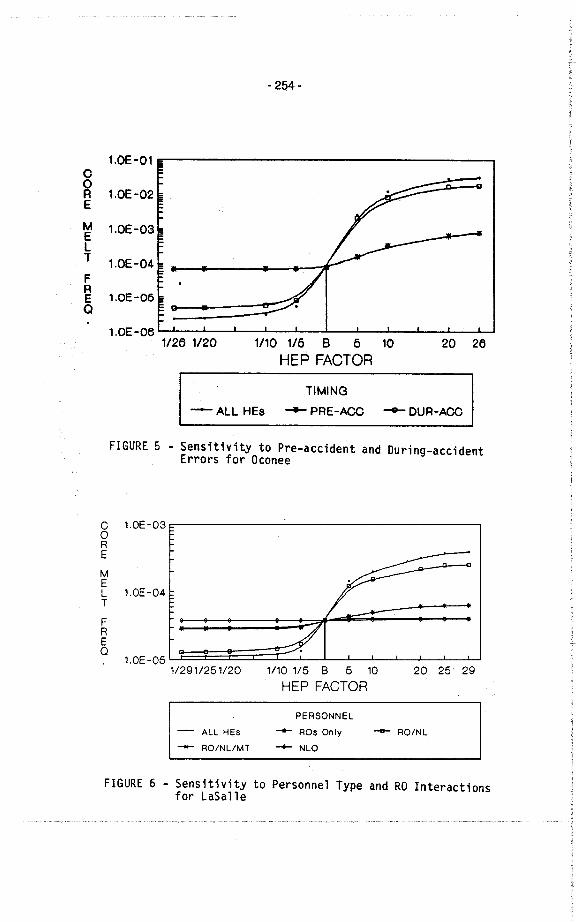
- 254.-
1.0E-01coR 1.0E-02E
MELT
FREa
1.DE-oe1126 1120 1110 116 B 6 10
HEP FACTOR20 26
TIMING
- ALL HEs -+ PRE-ACC -- DUR-AC
FIGURE 5 - Sensitivity to Pre-accident and During-accidentErrors for Oconee
C 1.0E-03oRE
MELT
FREQ
1.0E-051/291/251/20 1/10 1/5 B 5 10
HEP FACTOR20 25 29
- ALL HEs
-- ROINL/MT
PERSONNEL
-+ ROs Only
-- NLO
-e RO/NL
FIGURE 6 - Sensitivity to Personnel Type and RO Interactionsfor LaSalle
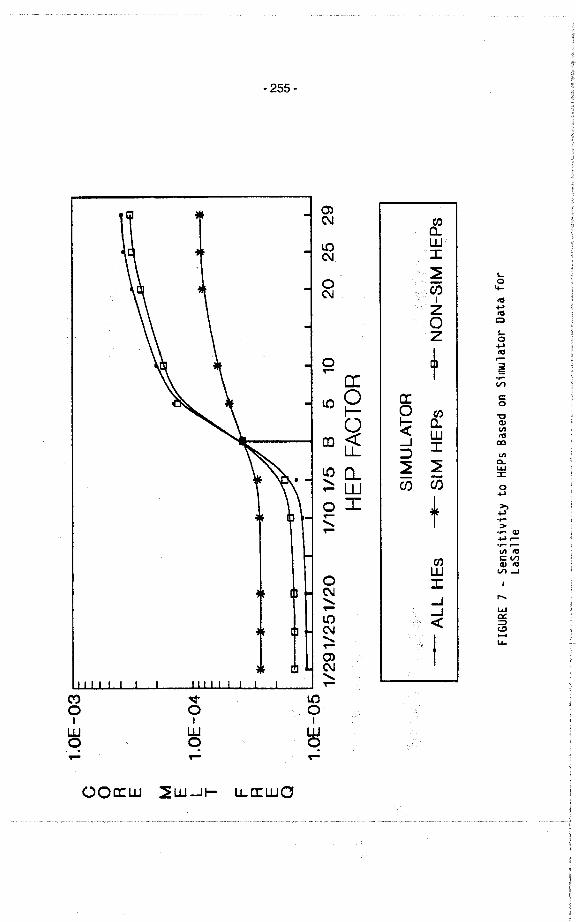
1.0E
-03
c o R E M E L T F R E Q
1.0E
-04
, I\ 01 01 ,
1.0E
-05
112
91/2
51/2
01110 1/5 B 5 10
HEP FACTOR
20 25 29
SIM
UL
AT
OR
- ALL HEs -- SIM HEPs -a NON-SIM HEPs
FIGURE 7 - Sensitivity to HEPs Based on Simulator Data for
LaS
alle
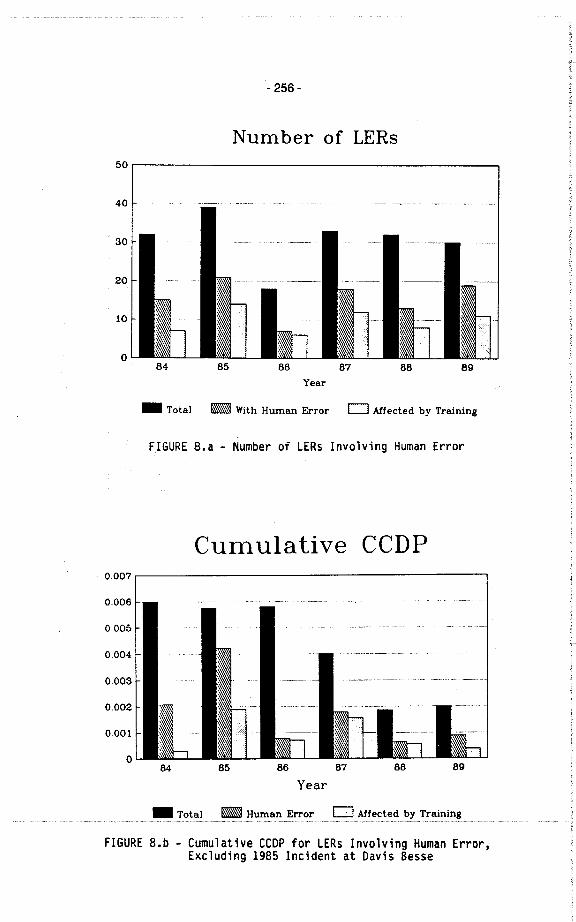
- 256-
Number of LERs50
10
40
30
20
o84 85 86 87 88 89
Year
- Total _ With Human Error 0 Mfected by Training
F lGURE 8. a - Number of LERs lnvo 1 vi ng Human Error
Cumulative CCDP0.007
0.006
0.005
0.004
0.003
0.002
0.001
08984 85 86 87 88
Year
_ Total _ Human Error 0 Affected Training
FIGURE 8.b - Cumulative CCOP for LERs lnvolving Human Error,Excluding 1985 lncident at Oavis Besse
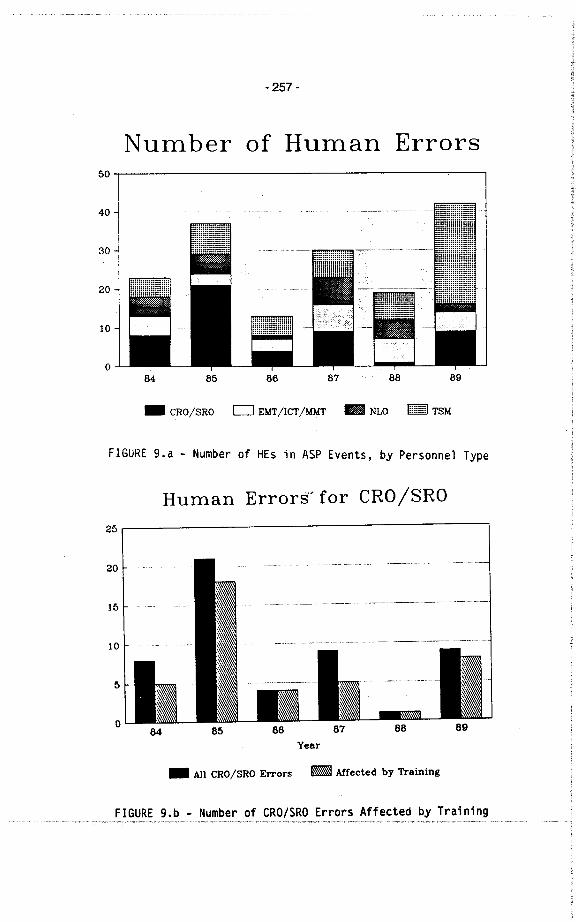
- 257-
Number of Human Errors
10
50
40
30
20
o84 85 86 87 88 89
_ CRO/SRO 0 EMT/ICT/MMT _ NLO ii TSM
FIGURE 9.a - Number of HEs in ASP Events, by Personnel Type
Human Errorš' for eRG /SRO25
5
20
o
15
10
84 85 86 87 88 89
Year
_ All CRO/SRO Errors _ Affected by Training
FIGURE 9.b - Number of CRO/SRO Errors Affected by Training
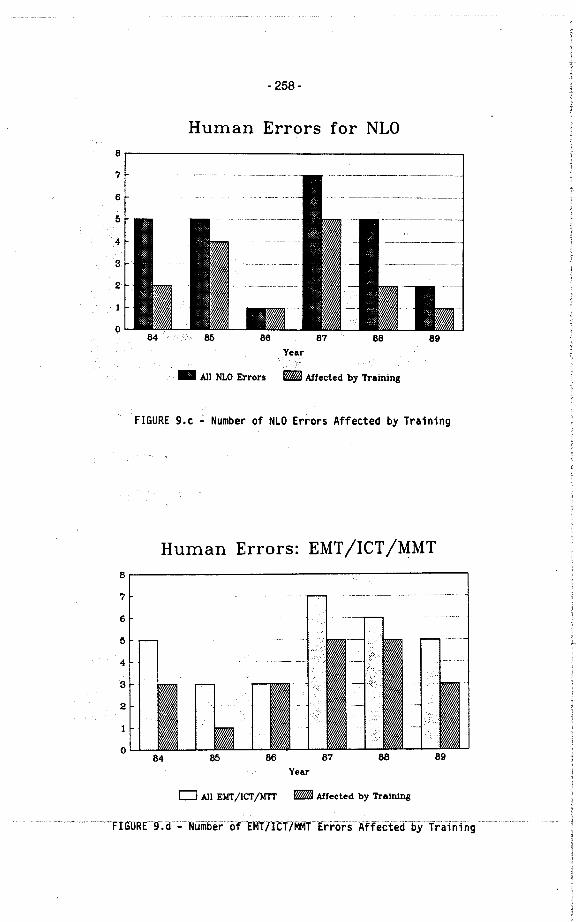
- 258-
Human Errors for NLO8
84 85 86 87 88 89Year
_ All NLO Errars _ Affected by Training
FIGURE 9.c - Number of NLO Errors Affected by Training
Human Errors: EMT /leT /MMT8
7
6
5
4
3
2
84 85 86 87 88 89o
Year
o All EId/icr/MT _ Affected by Training
F.i.GURE....9:ô....:..NUii6é¡;õfEI.\T1CT7f.T....Errors..Äffecteir..byTrai"ing
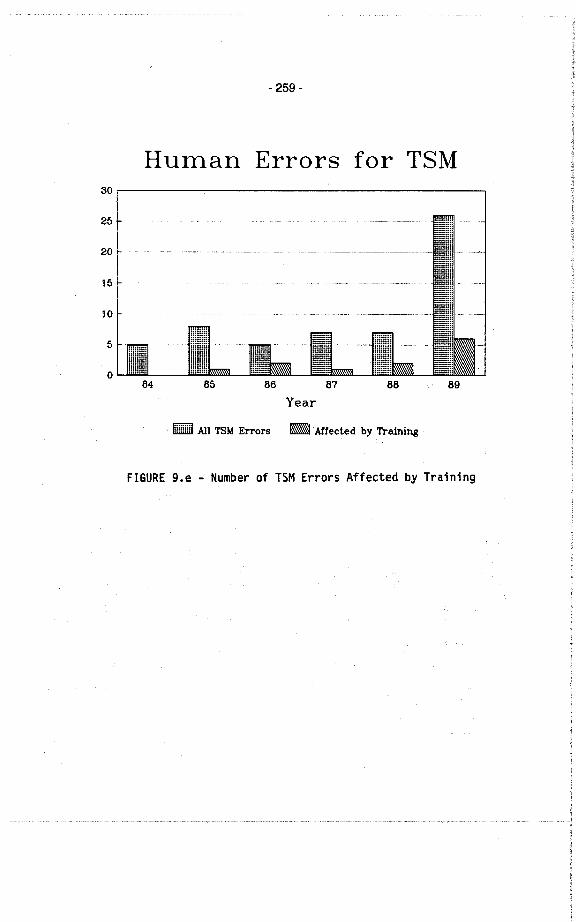
- 259-
Human Errars far T8M
25
20
15
10
5
o
30
84Ili
85
~ All T8M Errors . Affected by Training
Year
FIGURE 9.e - Number of T5M Errors Affected by Training
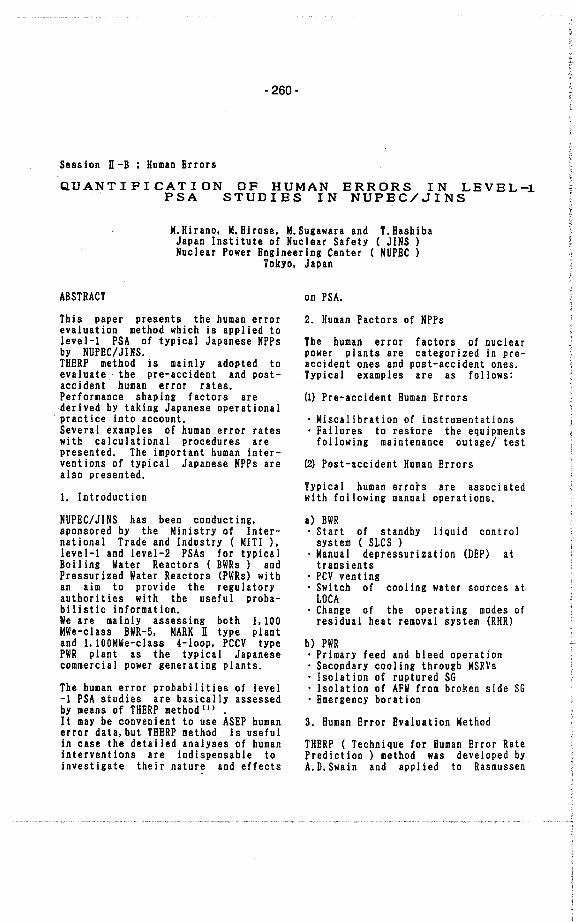
Session n -B ; Human Errors
- 260-
QUANTIFICATION OF HUMAN ERRORS IN LEVEL~PSA STUDIES IN NUPEC/JINS
M.Hirano. M.Hirose. M.Sugawara and T.HashibaJapan Institute of Nuclear Safety ( JINS )Nuclear Power Engineering Center ( NUPEC )
Tokyo. Japan
ABSTRACT
This paper presents the human errorevaluation method which is applied tolevel-I PSA of typical Japanese NPPsby NUPEC/ JINS.THERP method is mainly adopted toeva i ua te the pre-acc i dent and pos t-accident. human error rates.Performance shap ing factors arederived by taking Japanese operationalpractice into account.Several examples of human error rateswith calculational procedures arepresented. The important human inter-ventions of typical Japanese NPPs arealso presented.
1. Introduction
NUPBC/ JINS has been conduct ing.sponsored by the Ministry of Inter-national Trade and Industry ( MITI ).level-l and level-2 PSAs for typicalBoi I ing Water Reactors ( BWRs) andPressurized Water Reactors (PWRs) withan aim to provide the regulatoryauthorities with the useful proba-bilistic information.We are mainly assessing both 1.100MWe-class BWR-5. MARK n type plantand 1.100MWe-class (-Ioop, PCCV typePWR plant as the typical Japanesecommercial power generating plants.
The human error probabilities of level-1 PSA studies are basically assessedby means of THBRP method (i) .I t may be conven i en t to use ASBP humanerror data. but THERP method is usefulin case the detai led analyses of humaninterventions are indispensable toinvestigate their nature and effects
on PSA.
2. Human Factors of NPPs
The human error factors of nuclearpower p i an ts are ca tegor i zed in pre-accident ones and post-accident ones.Typical examples are as foliows:
Ul Pre-accident Human Brrors
. Miscalibration of instrumentations
. Failures to restore the equipmentsfollowing maintenance outage/ test
~) Post-accident Human Brrors
Typical human errors are associatedwith following manual operations.
a) BWR. Start of standby liquid controlsystem ( SLCS I
. Manual depressurization (DEPI attransients
. PCV vent ing
. Switch of cooling water sources atLOCA
. Change of the operating modes ofresidual heat removal system (RHRI
b) PWR. Primary feed and bleed operation. Secondary coo 1 ing through MSRVs. Isolation of ruptured SG. Isolation of AFW from broken side SG. Bmergency boration
3. Human Brror Evaluation Method
THBRP ( Technique for Human Brror RatePrediction ) method was developed byA. D. Swain and appl ied to Rasmussen
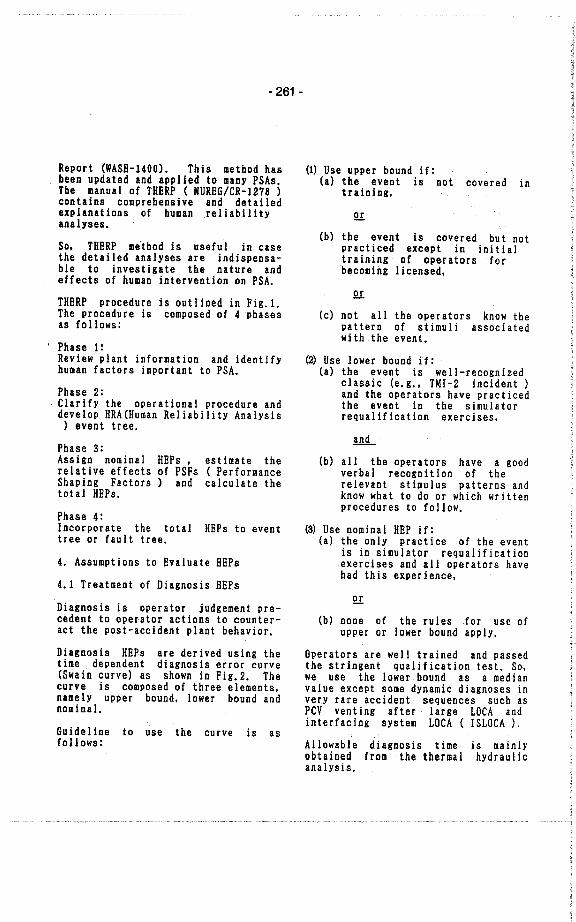
Report (WASR-1400). This method hasbeen updated and appl ied to many PSAs.The manual of TRERP ( NUREG/CR-1278 )eontains eomprehensive and detai ledexplanations of human reliabilityanalyses.
So. TRERP me.thod is usefu I in easethe detailed analyses are indispensa-ble to investigate the nature andeffeets of human intervention on PSA.
THBRP proeedure is outl ined in Fig.l.The proeedure is eomposed of 4 phasesas foliows:
Phase I:Review plant information and identifyhuman faetors important to PSA.
Phase 2:Clarify the operational proeedure anddevelop HRA(Human Reliability Analysis) event tree.
Phase 3:Assign nominalrelative effeetsShaping Factorstotal HEPs.
Phase 4:Incorporate the total HEPs to eventtree or faul t tree.
RBPs. estimate theof PSFs ( Performance) and calculate the
4. Assumpt ions to Eva i ua te REPs
4.1 Treatment of Diagnosis REPs
Diagnosis is operator judgement pre-cedent to operator actions to eounter-act the post-accident plant behavior.
Diagnosis REPs are derived using thetime dependent diagnosis error curve(Swain curve) as shown in Fig.2. Theeurve is composed of three elements.namely upper bound. lower bound andnominaL.
GuidelinefolIows:
theto use curve is
- 261 -
U) Use upper bound i f:(a) the event is not eovered in
training,
!l(b) the event is eovered but not
praetieed except in initialtraining of operators forbecoming i icensed.
!l(c) not all the operators know the
pattern of stimuli associatedwi th the event.
~) Use lower bound if:(a) the event is well-recognized
classic (e. g.. TMI-2 incident)and the operators havepracticedthe event in the simulatorrequalification exercises.
and
(b) all the operators have a goodverbal recognition of therelevant stimulus patterns andknow what to do or which writtenprocedures to follow.
~) Use nominal HEP if:(a) the only practice of the event
is in simulator requalificationexercises and all operators havehad th i sexper i ence.
or
(b) none of the rules for use ofupper or i ower bound apply.
Operators are weIl trained and passedthe stringent qualifieation test. S~we use the i ower bound as a med i anvalue except some dynamic diagnoses invery rare accident sequences such asPCV venting after large LOCA andinterfacing system LOCA ( ISLOCA ).
asAllowable diagnosis timeobtained from the thermalanalysis.
is mainlyhydraulic
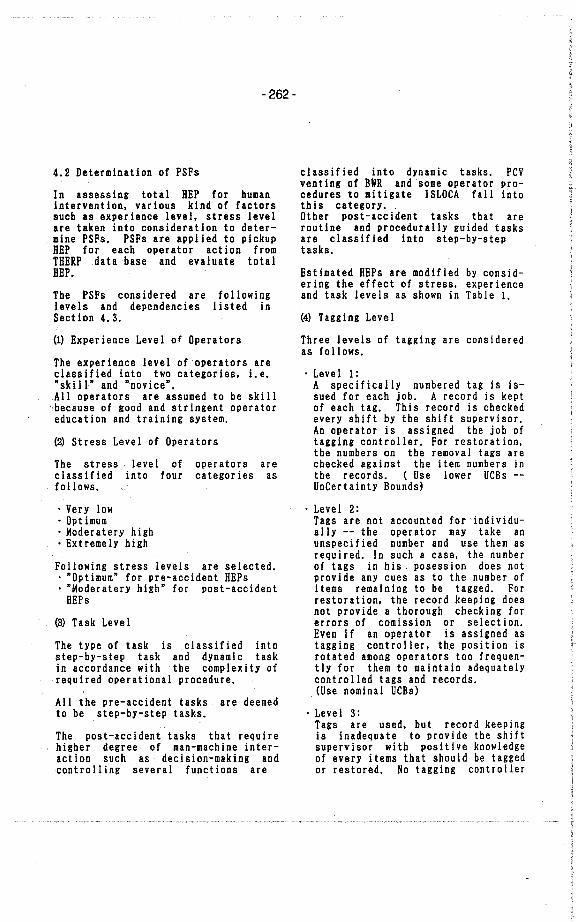
4.2 Determination of PSFs
In assessing total RBP for humanintervention. various kind of factorssuch as experience level, stress levelare taken into consideration to deter-mine PSFs. PSFs are appl ied to pickupRBP for each operator action fromTHERP data base and evaluate totalREP.
The PSFs considered are followinglevels and dependencies listed inSect ion 4.3.
(U Bxperience Level 0' Operators
The experience level of operators areclassified into two categories. i. e."skili" and "novice".All operators are assumed to be skillbecause of good and stringent operatoreducation and training system.
(~ Stress Level of Operators
The stress I~vel of operators areclassified into four categories asfolIows.
. Very low
. Opt imum
. Moderatery high
. Extremely high
Following stress levels are selected.. "Optimum" for pre-accident REPs. "Moderatery high" for post-accident
HEPs
(8) TaskLeve I
The type of task is classified intostep-by-step task and dynamic taskin accordance withthe complexity ofrequired operational procedure.
All the pre-accident tasks are deemedto be step-by-step tasks.
The post-accident tasks that requirehigher degree of man-machine inter-action such as decision-making andcontrolling several functions are
- 262-
classified into dynamic tasks. PCVventing of BWR andsome operator pro-cedures to mitigate ISLOCA fall intothis category.Other post-accident tasks that areroutine and procedurally guided tasksare classified into step-by-steptasks.
Estimated HEPs are modified by consid-er i ng the eff ect of stress. exper i enceand task levels as shown in Table 1.
~) Tagging Level
Three levels of tagging are consideredas folIows.
. Leve i 1:
A specifically numbered tag is is-sued for each job. Arecord is keptof each tag. This record is checkedevery shift bythe shift supervisor.An operator is assigned the job oftagging controller. For restoration.the numbers on the removal tags arechecked against the i tem numbers inthe records. (Use lower UCBs--UnCertainty Boundsl
. Level 2:Tags are not accou~ted for individu-ally -- the operator may take anunspecified number and use them asrequired. In such a case. the numberof tags in his. posession does notprov i de any cues as to the number ofi tems remaining to be tagged. Forrestoration. the record keeping doesnot provide a thorough checking forerrors of comission or selection.Even if an operator is assigned astagging controller. th.e posi tion isrotated among operators too frèquen-tly for thern to maintain adequatelycontrolled tags and records.(Use nominal UCBs)
. Level 3:Tags are used. but record keepingis inadequate to provide the shiftsupervisor with positive knowledgeof every i tems that should be taggedor restored. No tagging controller
is ass i gned.
(Use upper UCBs)
We assess that the tagging level islevel-I because of good operation andmaintenance management. The lower UCBsare used as median values.
4.3 Treatment of Dependencies
(1) Dependencies Within OperatingPersonne I
The level of dependencies withinoperating personnel are classifiedinto 5 levels and the conditionalfailure equations 'On Task "N", giventhe failure (HEP) on previous Task"N-I" are presented as folIows:
. ZD Zero DependenceF = HEP
. LD Low DependenceF = ( 1 + 19 x HEP ) /20
. MD Moderate DependenceF = ( 1 + 6 x HEP ) / 7
. HD High DependenceF = ( 1 + HEP ) / 2
. CD : Comp I ete DependenceF = 1. 0
A shift supervisor, an assistant shiftsupervisor and several operators arenecessary to operate the plant in thecontrol room. Each operator is usuallyassigned specific tasks. There is nohierarchy wi thin them. So. the depend-encies are limited within a shiftsupervisor, an assistant shiftsuper-visor and an operator. We assessedthe level of dependencies wi thin themas folIows:
. HD between operator and assistantshift supervisor:
The cooperation between them areroutine. So. HD is assumed.
. MD between shift supervisor and
- 263-
operator/assistant shift supervisor:
The shift supervisor involves inoperation only when abnormal situa-ti on occu r s. So, MD i s assumed.
~) Dependencies wi thin Tasks
The level of dependencies within tasksare classified into 5 levels. which isjust the same as those wi thin opera-ting personnel.We assessed the dependencies wi thintasks as folIows:
(a) Pre-accident Human Error
. MD within Miscalibration of Redun-dant Instrumentations:
Thenature of task is to calibratethe sensors that measure the sameprocess var iables and are used forthe same purposes. The task isperformed by one maintainer or onegroup of maintainers. The miscali-bratoin HEP of first sensor isindependent from other task. Themiscalibratoin HfiPs of remainingsensors depend upon the miscalibra-tion HEP of the first sensor. Thetask is step-by-step- in accordancewith the calibration manual underopt imum stress leveL. So. thedependencies are assessed to be MD.
. ZD for Failure to Restore AfterMaintenance/Test:
The typical task is represented asto re-open the pump inlet and out letvalves that were previously closed.Both valves should successfully berestored. So, ZD is assumed forconse rv a ti ve pu r pose.
(b) Post-accident Human Error
Post-accident human interventions areclassified into the task performed inseries and the task performed in par-alleL. Success criteria of the taskperformed in series is "AI I the tasksshould be accomplished to attain the
objeetives'. Suecess eriteria of thetask performed in parallel is 'Atleast one of the redundant tasksshould be aeeomplished to attain theobj eet i ves' .
We eonservatively assume ZD withinthe tasks performed in series. Most ofall tasks fall into this eategory.
The dependeneies wi thin the tasksperformed in paralell are assumed tobe CD. The tasks that fall into thiseategory is the diagnosis to start thesystems manually that are simultane-ously failed to start automatieallydue to the fai lure of the commoninitiating signal.
Typieal example for BWR is the diag-nosis to manuaiiy start the highpressure core spray system (HPCS) andreactor core isolation cooling system(RCI C) when reactor wa ter low (L2)signal failed to generate.
Typical example for PWR is the diag-nosis to manually start the highpressure injection system (HPI) andlow pressure injection system (LPI)when safety injecton(SI) signal failedto aetuate these systems.
4.4 Recovery of Human Error
Even if an operator fails to operate,recovery act ions by other operat ingpersonnel in the control room can beexpected. (Note tha t the recovery ofdiagnosis error is not applicable,because the time dependent diagnosiserror curve--Swain curve-- representsthe diagnosis error of all the operat-ing personnel in the control room.)
(1) Recovery of Pre-accident HumanError
The recovery model by the inspectionchecker is appl ied. The inspectionitems and activities are as foliows:. Miscalibration of Instrumentation:Functional tests are performed afterthe calibration in order to detect
- 264-
miscal ibration.
. Fai lure to Restore After Maintenance!TestThe status ~f equipments such asval ves are examined by achecker.
~) Recovery of Post-accident OperatingAction Error
The recovery of operator action errorby an assistant shift supervisor and ashift supervisor is considered.The recovery model (condi tional equa-tion ) is the same as that descrivedin dependence model.
4.5 Derivation of HEP Mean Values andError Factors (EFs)
The HEP data in THERP hand book aremedian. So, mean va lues are derived byconsidering corresponding EFs.We obtain point estimate total HEPmean va lues firstly, then obtaincorresponding EFs by referring toTable 2.
5. Typical HEP Values
Pre-accident HEPS and post-accidentHEPs are der i ved by applying above-mentioned method and assumptions.Typical pre-accident and post-accidentHEPs are shown in Table 3 and Table 4.
The detailed calculational procedureof the following HEPs are presentedin the calculation sheet.
Instrument calibration error (BWR)Failure to initiate reactor depres-surization at transient events (BWR)Failure to initiate primary feed andbleed operation (PWR)
6. Important Human Interventions
PSA results show that following humaninterventions are important tominimimize co re damage frequencies.
BWR (1, 100 MWe ! Mark n PCV
. Reactor depressurization at tran-sient events.
This human error causes the fail-ure of core cool ing by low pressureECCS.
! Initiation of residuaJ heat removal
system. PCV vent ing
PWR 0.100 MWe, 4-100p ! PCCV )
. Calibration of RWSP(Refueling WaterStorage Pit) level sensors.
This human error causes the fai lureto transfer from the emergency corecooling injection mode to therecirculation mode.
. .Isolation of auxiliary feedwaterto the broken side SG.
. Primary feed and bleed.
7. Conclusion
Human error probabilities are derivedbased on THERP by taking Japaneseoperational practice into account.Typical examples are presented. Alsopresented are important human inter-ventions to minimize co re damagefrequencies for typical BWR and PWR.
HRAs of important human interventionswith THERP method provide us withuseful informations regarding to thefollowing items.
(a) Pre-accident Human Intervent ion.
Importance and effects of the error bythe maintainer. recovery by the check-er and the operator.
(b) Post-accident Human Intervention.
Importance and effects of diagnosiserror. operation error and recoveryby the assistant shift supervisor and
- 265-
the shi ft supervisor.
These informations are useful for themaintenance management and operatortraining.
Both governmental research instituteand nuclear power industry are con-ducting human factor research. We aregoing to update our PSA by applyingthese outputs in a timely manner.
REFERENCES
(1) A. D. Swain. et al. ! "Handbook ofhuman Reliability Analysis withemphasis on Nuclear Power PlantApplications", Sandi.. NationalLaboratories. NUREG/CR-1278. August1983.
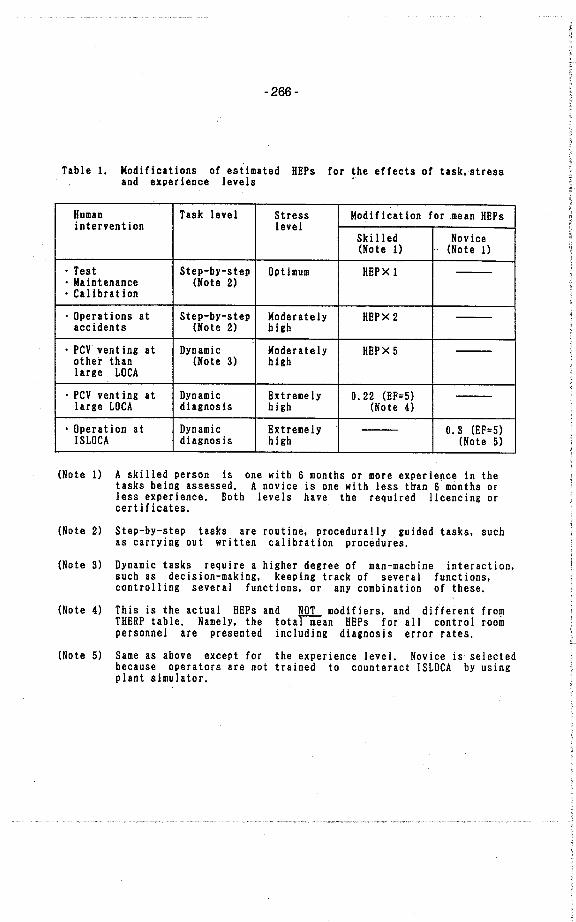
- 266-
Table 1. Modifications of estimated HBPs for the effects of task. stressand exper ience levels
Human Task level Stress Modification formean HBPsintervention level
Ski i led Novice(Note 1) .. (Note 1)
. Test Step-by-step Opt imum HBPX 1 -
. Maintenance (Note 2)
. Calibration
. Operations at Step-by-step Moderately HBPX 2 -accidents (Note 2) high
. PCV vent ing at Dynamic Moderately HBPX 5 -other than (Note 3) highlarge LOCA
. PCV vent ing at Dynamic Extremely 0.22 (EF=5) -large LOCA d iagnos is high (Note 4)
. Operation at Dynamic Extremely - 0.3 (EF=5)I SLOCA diagnosis high (Note 5)
(Note 1) A skilied person ist asks be ing assessed.less exper ience. Bothcertificates.
(Note 2) Step-by-step tasks are routine. procedurally guided tasks. suchas carrying out written calibration procedures.
one with 6 months or more experience in theA novice is one wi th less trran 6 months orlevels have the required licencing or
(Note 3) Dynamic tasks require a higher degree of man-machinesuch as decision-making. keeping track of severalcontrolling several functions. or any combination
interaction.functions.of these.
(Note 4) This is the actual HEPs and NOT modifiers. and different fromTHERP table. Namely, the total me an HEPs for a11 control rooÍDpersonnel are presented including diagnosis error rates.Same as above except f or the exper i ence i eve i. Nov i ce i s se i ect edbecause operators are not trained to counteract ISLOCA by usingplant simulator.
(Note 5)
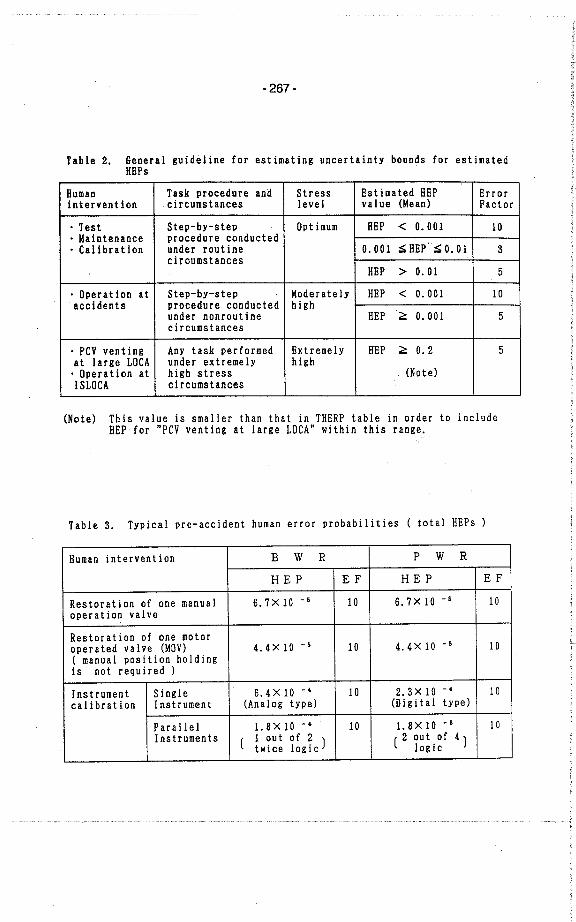
- 267-
Table 2. General guideline for estimating uncertainty bounds for estimatedHEPs
Human Task procedure and Stress Estima ted HEP Errorintervention circumstances level va 1 ue (Me an) Factor
. Test Step-by-step Optimum HEP ~ 0.001 10
. Maintenance procedure conducted
. Calibration under routine 0.001 ;:HEp.;: O. 01 3circumstances
HEP ;: 0.01 5
. Operation at Step-by-step Moderately HEP ~ 0.001 10accidents procedure conducted high
under nonrout ine HEP ;: 0.001 5circumstances
. PCV vent ing Any task performed Extremely HEP ;: 0.2 5at large LOCA under extremely high. Operation at high stress (Note)I SLOCA ci rcumstances
(Note) This value is smaller than that in THERP table in order to includeHEP for "PCV venting at large LOCA" wi thin this range.
Table 3. Typical pre-accident human error probabilities ( total HEPs )
Human intervention B W R P W R
HE P E F HE P E F
Restoration of one manual 6.7 X 10 - 5 10 6.7X10 - 5 10
operation valve
Restoration of one motoroperated valve (MOV) 4.4x 10 -5 10 4.4x 10 -5 10
( manual position holdingis not required )
Ins trumen t Single 6.4X 10 -4 10 2.3 X 10- 4 10
calibration Instrument (Analog type) (Digi tal type)
Parallel Lax 10 -4 10 1. a X 10 - 5 10
Instruments(
1 ou t 0 f 2 ) ( 2 ou t .of 4)twice logic logic
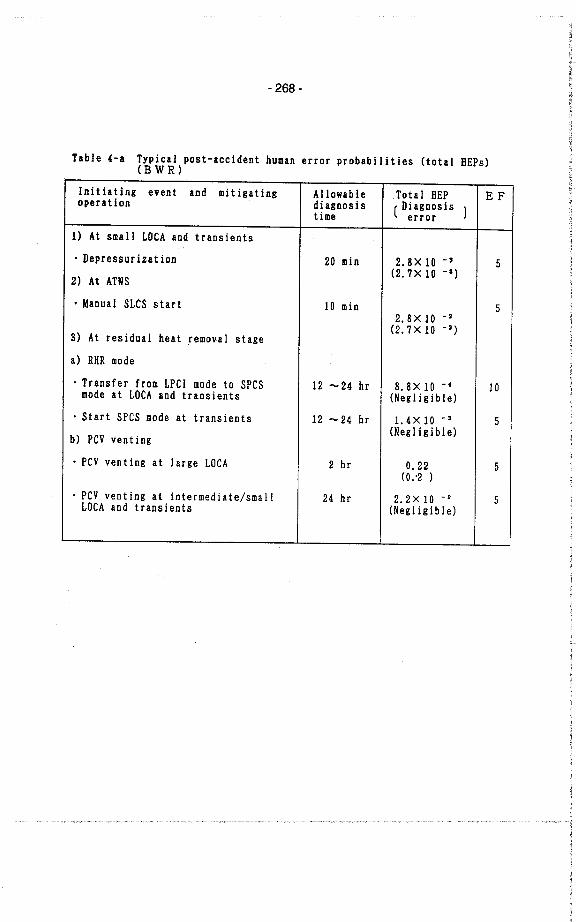
- 268-
Table (-a Typical post-accident human error probabilities (total HEPs)(B W R)
Initiating event and mitigatingoperation
Allowable .Total HEP E Fdiagnosis
( Diagnosis )time error
20 min 2.8XlO - i5
(2.7X10 - i)
10 min 52.8X10 - 2
(2.7x10 - 2)
1) At small LOCA and transients
. Depressurization
2) At ATWS
. Manual SLCS start
3) At residual heat removal stage
a) RHR mode
. Transfer from LPCI mode to SPCSmode at LOCA and transients
. Start SPCS mode at transients
12 -24 hr 8.8XlO-f 10(Negl igible)
12 -24 hr L.4x10-i 5
(Negl igible)
2 hr 0.22 5(0.'2 )
2( hr 2.2x10 - 25
(Negligible)
b) PCV venting
. PCV venting at large LOCA
. PCV venting at intermediate/smallLOCA and transients
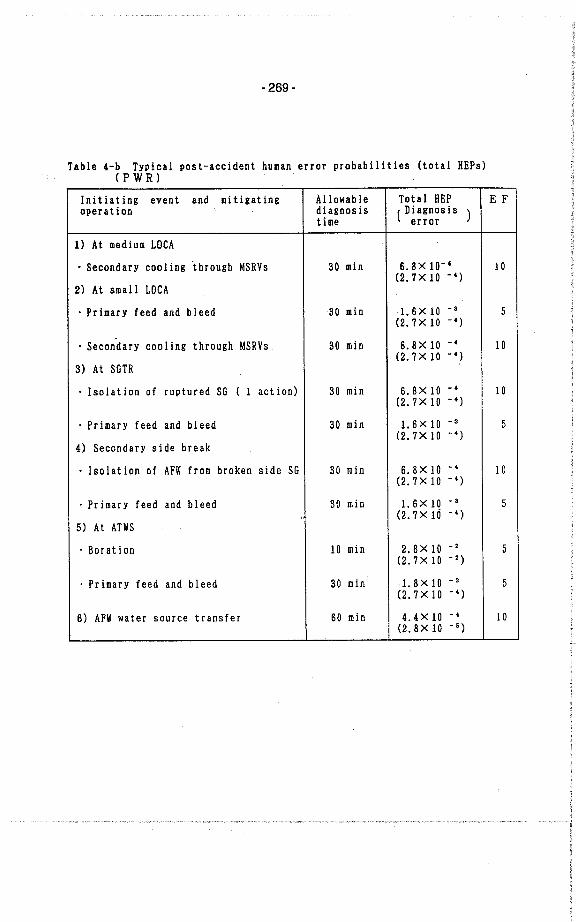
- 269-
Table 4-b Typical post-accident human error probabi I i ties (total HEPs)(P WR)
Initiat ing event aod mitigating Allowable Total HEP E Foperati on diagnosis
( Diagnosis )time error
1) At medium LOCA
. Secondary cool ing through MSRVs 30 min 6.8XI0-l 10(2. 7X 10 -l)
2) At small LOCA
. Primary feed and bl eed 30 min 1.6XI0 - 3 5
(2.7XI0 - l)
. Secondary coel ing through MSRVs 30 min 6.8 X 10- l 10
(2.7xI0 - l)
3) At SGTR
. Isolation of ruptured SG ( 1 acti on) 30 min 6.8 X 10- l 10
(2.7XI0 - l)
. Primary feed and bl eed 30 min 1. 6 X 10 - 3 5
(2.7xI0 - l)4) Secondary si de break
. Isolation of AFW from broken s ide SG 30 min 6.8 X 10⁻⁴ 10
(2.7XI0 - l)
. Primary feed and bleed 30 min 1. 6 X 10 - 3 5
, . (2.7XIÓ - l)5) At ATWS
. Beratien 10 min 2.8 X 10- 2
5
(2.7XI0 - 2)
. Primary feed and bleed 30 min 1. 8 X 10 - 3 5
(2.7XI0 - l)
6) AFW water source transfer 60 mio 4.4xI0 - l 10(2.8XI0 - 5)
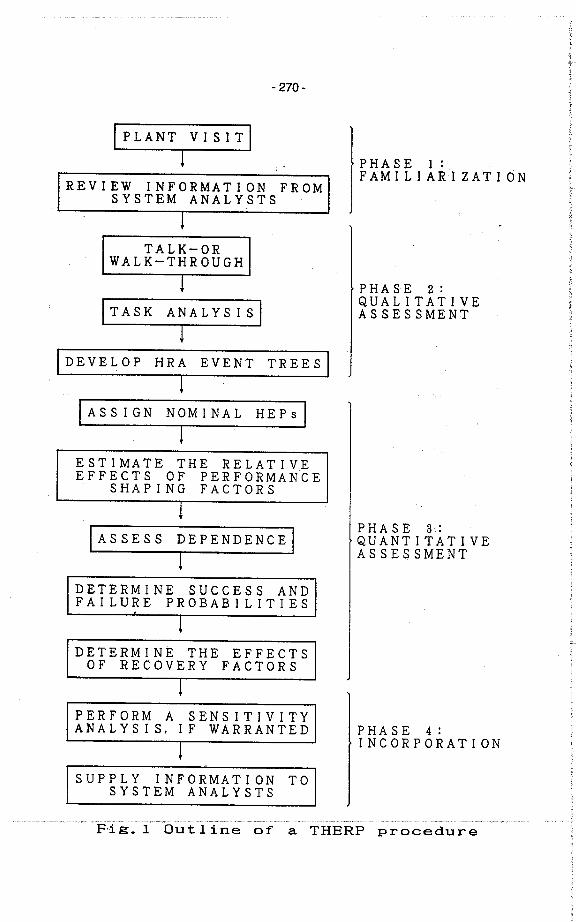
- 270-
IPLANT VISITI1
R EV lEW I N F 0 R M AT ION F ROM ISYSTEM ANALYSTS
l
TALK-ORWALK-THROUGH
l
I TASK ANALYS I Si1
I DEVELOP HRA EVENT TREES I1 .IASSIGN NOMINAL HEPsl
1
ESTIMATE THE RELATIVEEFFECTS OF PERFORMANCE
SHAPING FACTORS
l
IASSESS DEPENDENCEI1
DETERMINE SUCCESS ANDFAllURE PROBABILITIES
l
DETERMINE THE EFFECTSOF RECOVERY FACTORS
PERFORM A SENSITIVITYANALYSIS, IF WARRANTED
l
SUPPLY INFORMATION TOSYSTEM ANALYSTS
PHASE i:F AMI L I AR I Z AT I Ö N
PHASE 2:QUALITATIVEASSESSMENT
PHASE 3:QUANT I TAT I VEASSESSMENT
PHASE 4:I NCORPORAT ION
t i ine of a THERP procedure
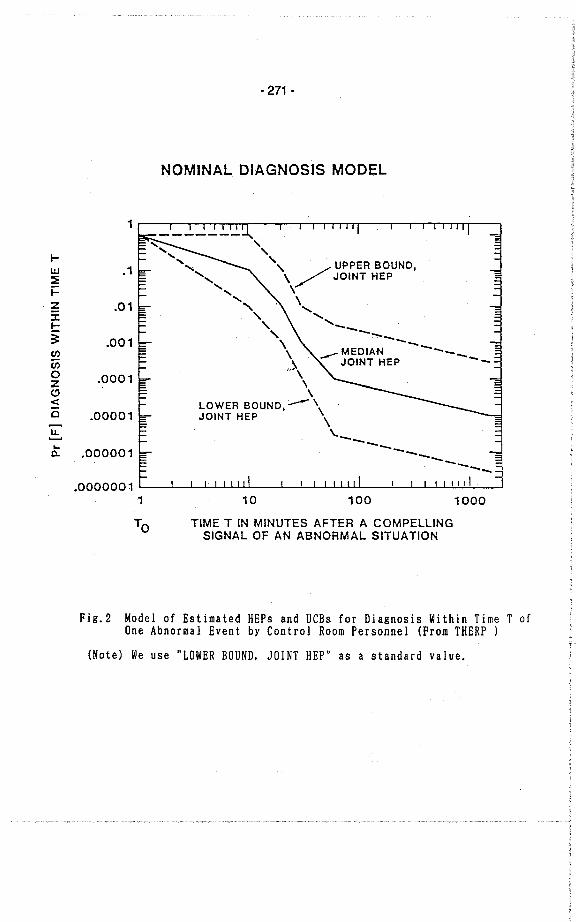
1
i-UJ .1:Et=
~ .01:ii-3 .001CfCf0 .0001ZClct0 .00001u...0.
- 271 -
NOMINAL DIAGNOSJS MODEL
TO
,,," ./ UPPER SOUND,\( JOINT HEP j'" ~'- ------
MEDIAN --__-- JOINT HEP --
""..'.. ..,,""",\\
"\\\LOWER SOUND,"- \JOINT HEP \ ~'\- j----------
I i i!iid i 11111111-I I I I I i 11
10 100 1000
TIME T IN MINUTES AFTER A COMPELLINGSIGNAL OF AN ABNORMAL SITUATION
Fig.2 Model of Est imated HEPs and UCBs for Diagnosis Wi thin Time T ofOne Abnormal Event by Control Room Personnel (From THERP )
(Note) We use "LOWER BOUND. JOINT HEP" as a standard vaIue.
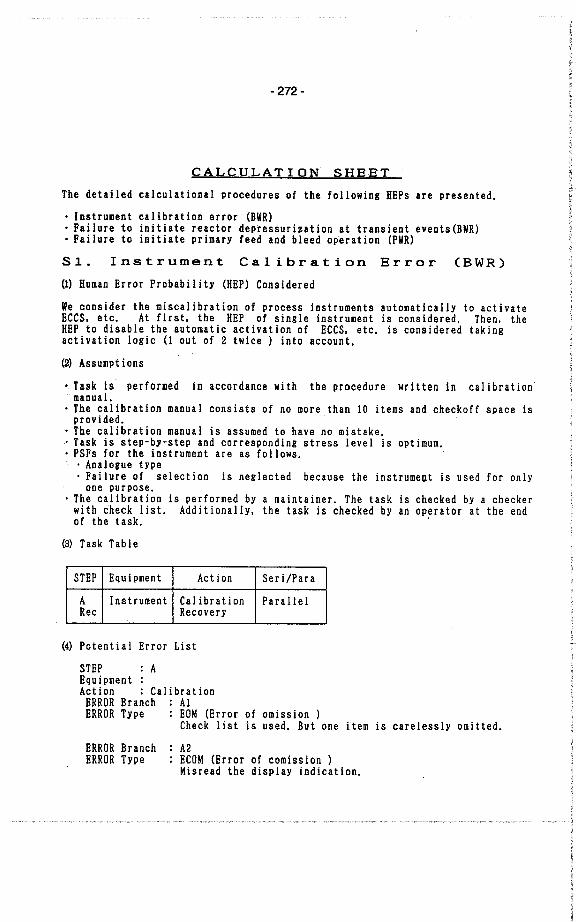
- 272-
CALCULAT I ON SHEETThe detailed calculational procedures of the following HEPs are presented.
. Instrument calibration error (BWR)
. Failure to initiate reactor depressurization at transient events(BWR)
. Failure to initiate primary feed and bleed operation (PWR)
S i. Instrument Calibration Error (BWR)Ú) Human Error Probabi I i ty (HEP) Considered
We consider the miscalibration of process instruments automatically to activateECCS. etc. At first. the HEP of single instrument is considered. Then. theHEP to disable the automatic activation of ECCS. etc. is considered takingactivation logic (1 out of 2 twice ) into account.
(2) Assumpt ions
. Task is. performed in accordance with the procedure written in cal ibration.manuaL.
. The calibration manual consists of no more than 10 items and checkoff space isprovided.
. The calibration manual is assumed to have no mi stake.
. Task is step-by-step and corresponding stress level is optimum.
. PSFs for the instrument are as folIows.. Ana I ogue type. Fai lure of selection is neglected because the instrument is used for only
one purpose.. The cal ibration is performed by a maintainer. The task is checked by acheckerwith check list. Additionally. the task is checked by an operator at the endof the task.
(3) Task Table
STEP Equipment Action Seri/Para
A Instrument Cal ibration ParallelRec Recovery
U) Potential Error List
STEP : AEqu i pmentAction : CalERROR BranchERROR Type
brat ionAlEOM (Error of omission)Check list is used. But one item is carelessly omitted.
ERROR BranchERROR Type
A2
ECOM (Error of comission )Misread the display indication.
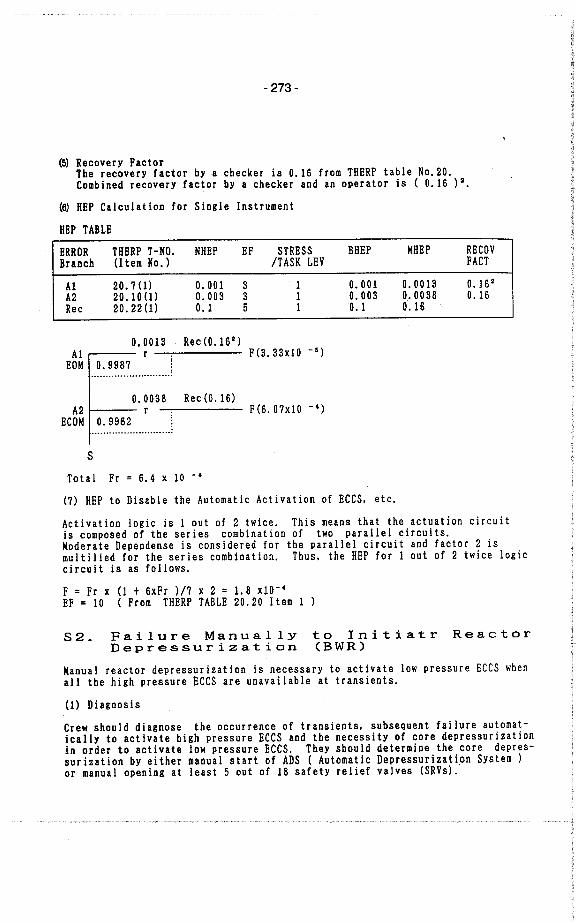
- 273-
(~ Recovery FactorThe recovery factor by achecker is 0.16 from THERP table NO.20.Combined recovery factor by achecker and an operator is ( 0.16 ) 8.
(~ HEP Calculation for Single Instrument
HEP TABLE
BRROR THERP T-NO. NHEP EF STRESS BHEP MHEP RECOV
Braneh (I tem No.) /TASK LEV FACT
Al 20.7 (l 0.001 3 0.001 0.0013 0.162A2 20.10(1 0.003 3 0.003 0.0038 0.16Rec 20.22(1 0.1 5 0.1 0.16
0.0013 Ree(0.162)Al r F(3.33x10 -5)EOM 0.9987
.....-......................
0.0038 Ree (0.16)A2 r F(6.07x10 -.)EeOM 0.9962
-_........-.................
s
Total Fr = 6.4 x 10 -.
(7) HEP to Disable the Automatic Activation of ECeS. ete.
Aetivation logic is 1 out of 2 twice. This means that the actuatíon circui tis composed of the series combination of two parallel circui ts.Moderate Dependense is considered for the parallel circuit and faetor 2 ismultilied for the series combination. Thus. the HEP for 1 out of 2 twice logiccircuit is as folIows.
F = Fr x (1 + 6xFr )/7 x 2 = 1.8 x10-.EF = 10 (From THERP TAßLE 20.20 I tem
S2. Failure Manually to Initiatr ReactorDepressurization (BWR)
Manual reactor depressurization is necessary to activate low pressure EeeS whenall the high pressure EeCS are unavailable at transients.
(1) Diagnosis
Crew should diagnose the occurrence of transients. subsequent failure automat-icaIly to activate high pressure ECCS and the neeessity of core depressurizationin order to activate low pressure ECCS. They should determine the core depres-surization by either manual start of ADS ( Automatie Depressurization System)or manual opening at least 5 out of 18 safety relief valves (SRVs)..
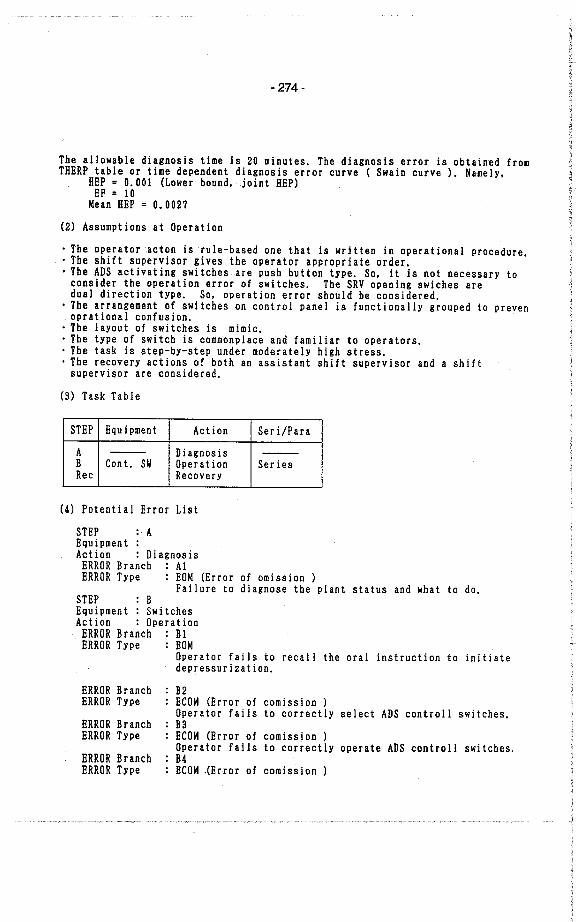
- 274-
The allowable diagnosis time is 20 minutes. The diagnosis error is obtained fromTHERP table or time dependent diagnosis error curve ( Swain curve ). Namely,
HEP = 0.001 (Lower bound, joint HEP)EF = 10Mean HEP = 0.0027
(2) Assumptions at Operation
. The operator ~cton isrule-based one that 15 written in operational procedure.
. The shift supervisor gives the operator appropriate order.
. The ADS activating swi tches are push button type. So, it is not necessary toconsider the operation error of switches. The SRV opening swiches aredual direction type. So, operation error should be considered.
. The arrangement of switches on control panel is functionally grouped to prevenoprational confusion.
. The 1 ayout of swi tches is mimic.
. The type of swi tch is commonplace and fami liar to operators.
. The task is step-by-step under moderately high stress.
. The recoveryactions of both an assistant shift supervisor and a shiftsupervisor are considered.
(3) Task Table
STEP Eauipment Ac ti on Ser i/Para
A - Diagnosis -B Con 1. SW Oper ati on SeriesRec Recovery
(4) Potential Errar List
STEP : AEauipment :Action : DiagnosisERROR Branch AlERROR Type : EOM (Error of omission)
Failure to diagnose the plant status and what to do.STEP BEquipment Swi tchesAction OperationERROR B ranch BIERROR Type EOM
Operator fails to recall the oral instruction to initiatedepr essu r i za ti on.
ERROR B ranchERROR Type
ERROR BranchERROR Type
ERROR B ranchERROR Type
B2ECOM (Error of comission )Operator fai is to correctly select ADS control i swi tches.B3ECOM (Error of comission )Operator fails to correctly operate ADS controll switehes.B4ECOM ~Error of comission )
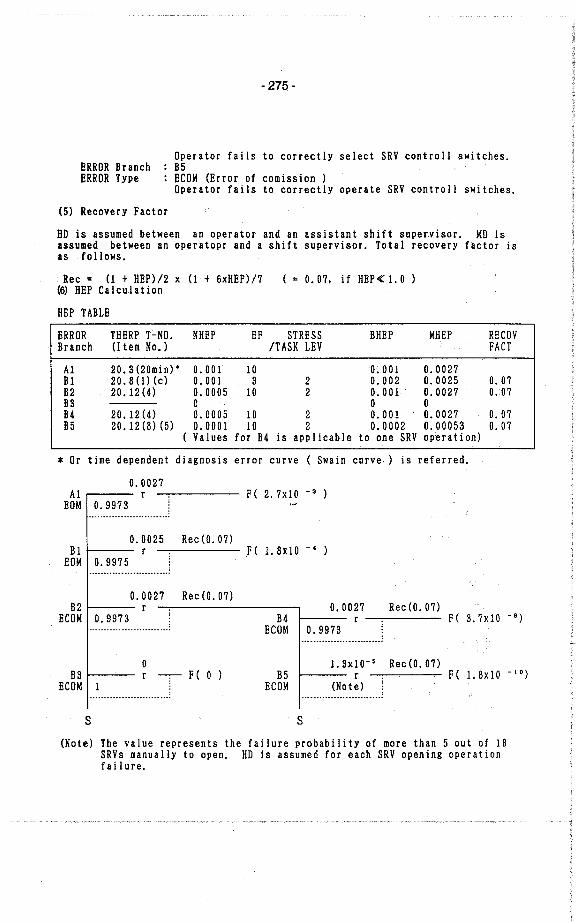
- 275-
ERROR BranchERROR Type
Operator fails to correctly select SRV controll. switches.B5ECOM (Error of comission )Operator fai Is to correctly operate SRV control I swi tches.
(5) Recovery Factor
HD is assumed between an operator and an assistant shift supervisor. MD isassumed between an operatopr and a shift supervisor. Total recovery factor isas folIows.
Re~ = (1 + HEP)/2 x (1 + 6xHEP)/7(~ HEP Calculation
( = O. 07. if HEP ~ 1. 0
HEP TABLE
ERROR THERP T:"NO. NHEP EF STRESS BHEP MHEP RECOV
Branch (J tem No.) /TASK LEV FACT
Al 20.3 (20min) · 0.001 10 0.001 0.0027BI 20.S(I)(c) 0.001 3 2 0.002 0.0025 0.07B2 20.12(4 0.0005 10 2 0.001 0.0027 0.07B3 0 0 0B4 20.12(4 0.0005 10 2 0.001 0.0027 0.07B5 20.12(S)(5) 0.0001 10 2 0.0002 0.00053 0.07
( Values for B4 i s app I icable to one SRV operation)
* Or time dependent diagnosis error curve ( Swain curve) is referred.
0.0027Al rEOM 0.9973
............................
F( 2.7xl0 -3 )
0.0025 Rec (0.07)BI r F(I.Sxl0-4)EOM 0.9975
............................
0.0027 Rec (0.07)B2 rECOM 0.9973
..........._................
Rec (0. 07)0.0027B4 rECOM 0.9973
F( 3.7xl0 -8)
oB3 r F ( 0 )ECOM
............................
1.3xlO-5 Rec(0.07)B5 r F(1.8xl0-10)ECOM (Note)
............................
s s
(Note) The value represents the failure probability of more than 5 out of 18SRVs manually to open. HD is assumed for each SRV opening operationfailure.
- 276-
Total F 2.8 x 10 -3EF 5 (From THERP TABLE 20.20 I tem 5 )
S 3_ Failure to Initiateand Bleed Operation
Pr imàry(PWR)
Feed
This operation is necessary to cool the core when both main feedwater system andauxiliary feedwater system are unavailable at small LOCA, SGTR and secondaryside break.After confirming that high pressure injection system (HPI) pump is operating, aoperator opens the pressurizer relief valves to depressurize the primar~ system.in order to inject the coolant into the core by HPI.
0) Diagnosis
Crew should diagnose the occurrence of ini tiating events and subsequent announc-iators to notify the failure of main feedwater system and auxiliary feedwatersystem. They should decide to depressurize the primary system by opening thepressurizer relief valves ( 2 out of 2 valves).Allowable diagnosis time is 30 minutes after the announciation of feedwater andauxiliary feedwater system pump trip or 10 minutes after the announciation oflow SG water level status.
The allowable diagnosis time is assumed to be 30 minutes only. The latterannounciation is conservatively neglected as a backup information. The diagnosiserror is obtained from THERP table or time dependent diagnisis error curve( Swain curve L.
HEP = 0.0001 ( Lower bound ,joint HEP )Ef = 10Mean HEP = 0.00027
(2) Assumptions at Operation
Operator is assumed to operate under the directions of shift supervisor. In thiscase. HPI is assumed to be successfully operating. So. the confirmation of HPIstatus is not the critical action. Operator action to open the pressurizerrel ief valves ( 2 out of 2 valves) is considered to be one set of action.Assumptions related to this action are as folIows.
. The task is step-by-step under high stress.
. Operator is enough experienced and skillful.
. The shift supervisor appropriately order the operator to open rel ief valves.
. The PSFs of relief valve controll switches are as folIows..The switches are dual direction type. So. the operation is easily performed
by one action.. There exists no operational inconvenience caused by stereotipical defects.. The layout of switches is mimic.
. The recoveryactions of both assistant shift supervisor and shift supervisorare considered.
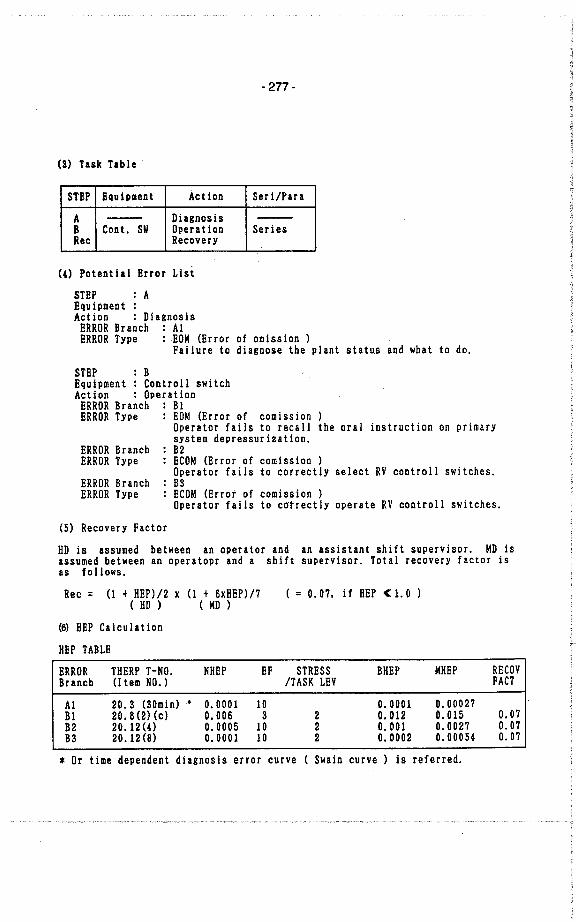
- 277-
(3) Task Table
STHP Equ ipment Act ion Ser i/Para
A - Diagnosis -B Cont. S\I Operat ion Ser i esRec Recovery
(4) Potential Error List
STHP : AEqu ipment :Action : DiagnosisERROR Branch AlERROR Type 10M (Error of omission)
Failure to diagnose the plant status and what to do.
STHP : BEquipment : Controll switchAction : OperationERROR Branch BIERROR Type HOM (Error of comission)
Operator fails to recall the oral instruction on primarysystem depressur iza ti on.
ERROR Branch B2ERROR Type ECOM (Error of comission )
Operator fai ls to eorreetly seleet RV eontrol I swi tehes.ERROR Branch B3ERROR Type ECOM (Error of comission )
Operator fails to catrectly operate RV controll switches.
(5) Recovery Factor
HD is assumed between an operator ind an issistant shift supervisor. MD isassumed between an operatopr and a shift supervisor. Total recovery factor isas follows.
Rec = (1 + HEP) /2 x (1 + 6xHEP) /7( HD ) ( MD )
(=0.07, ifHEPC:i.O)
~) HEP Cilculation
HEP TABLE
ERROR THERP T-NO. NHEP EF STRESS BHEP MHEP RECOV
Branch (I tem NO.) /TASK LEV FACT
Al 20.3 (30min). 0.0001 10 0.0001 0.00027BI 20.8 (2) (c) 0.006 3 2 0.012 0.015 0.07B2 20.12(4 0.0005 10 2 0.001 0.0027 0.07B3 20.12(8) 0.0001 10 2 0.0002 0.00054 0.07
* Or time dependent diagnosis error curve ( Swain curve ) is referred.
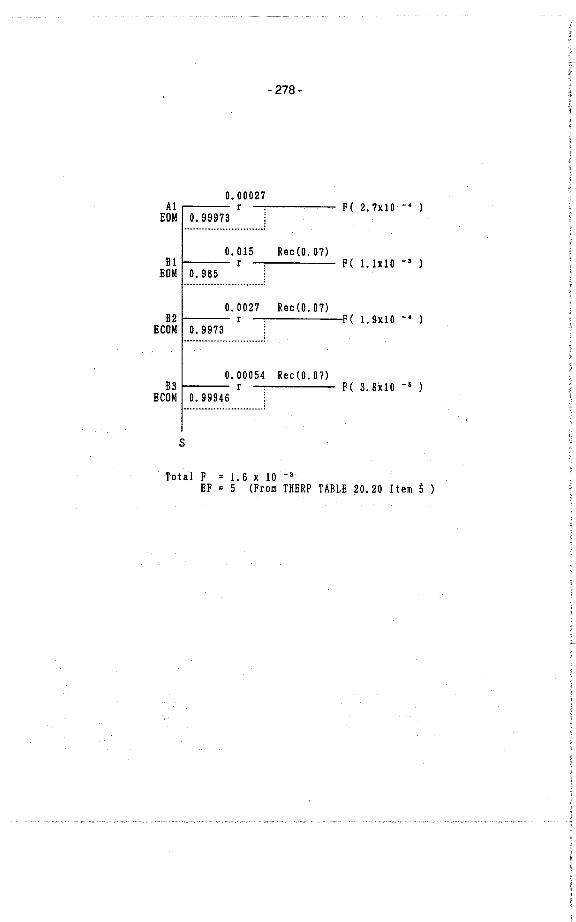
- 278-
0.00027Al rEOM 0.99973 :
......-.....................
F( 2.7xlO -4 )
0.015 Rec(0.07)BI r F( 1.lx10 -3 )ROM 0.985
.............................
0.0027 Rec (0.07)B2 r F( 1.9xIO -4 )ECOM 0.9973
.............._...-..........
0.00054 Rec (0.07)B3 r F(3.8xlO-$)ECOM 0.99946
.........................-..
s
To t a i F = 1. 6 x 10 - 3
EF = 5 (From THERP TABLE 20.20 Item ~ )
.279 -
IMPROVEDMAIN CONTROL BOARD WITHA BETIER MAN-MACHINE INTERFACE
TOSHIHIRO OSHIBE
NUCLEAR POWER PROJECTS OEPARTHENT
THE KASAI ELECTRIC ilOWER CO., INC.
Conventional HCB is composed of
reactor control board and T/G
(turbine/generator) control board.
This division is made in accordance
with the location of plant faciliticc.
As compared wi th this, the improved
HCB is partitioned by its function, in
other words, by the operational mode
for which each board is used. This
functional partition gives the
configuration that is divided into main
control board, reaetor auxiliarycontrolboard and T/G auxiliary controlboard.
At the same time, we also adopted
extensive use of CRT and the operator
can moni tor mainly by CRTs.
These two improvements achieved thereduction of the operator i s workload
and human errors, because the operator
can monitor the whole related
parameters and can manipulate from thesame place almost everytime.
Hain control board is used for
monitoring and control during the plant
.condition between HSO (Hot Shut Down)
and HFP (Hot Full Power). This board
is also used to get the trigger to move
to the operational mode of transient or
accident.The other two boards are used during
the plant condi tion between HSO and CSD
(Coló.ShutOown)¡and.....forthe...peculiar..
Abstract
operation in post-trasient/accident.
It has confirmed quantitatively
using THERP (Techniques for Human Error
Rate Prediction) that this partition
and extensive use of CRT realizes the
reduction of operator i s workload and
human errors by comparison with that of
the conventional HCB.
The primary function of alarm system
misgiving a trigger to decide the next
action, so an presentation form with
which the operator can grasp the
condi tion at a grance is very useful.
For this reason, we adopted the
dynamic priorities alarm system, which
can indicate the time-variant
importance of each alarm by the color
of alarm window. This system uses
three colors, red, yellow, and green,
for the alarm windows, Red alarm is
used as "alarm information", yellow as
"caution information" and green as
"normal status information". The
operator can select the sui tableoperation only with the "red- and
"yellow" alarms, and the total number
of the red and yellow alarms taken
place is reóuced to about one-fifth of
that of the conventional system. I t isconfirmed that this alarm system can
greatly reduce the human errors at an
abnormal plant condition.
- 280-
1. INTRODUCTION
In Japan, 18 PWRs are now in operation and 5 others are under
construction. The operating p1ants are keeping re1atively high
availabi1ity factor and low unplanned outage rate. This is
attributable to high operation and maintenance quality in. addition
to high equipment re1iabi1ity. On the other hand, those under
construction have been developed for achieving the optimum
functional al1ocation, which enables the man and the machine to
play their maximum roles, and to enhance plant reliabili ty and
safety. And such plants incorporate a broad consideration of
human factors into plant operation and maintenance as well as
upgrading the reliabili ty of equipment.
In this paper, the designs adopted to OHI uni t 3 and 4 (1180MWe)
which are under construction are sumrized. In addition, Advanced
PWR (1350MWe) plant under p1anning is presented.
2. MAIN DESIGN FEATURES
2.1 Improvement of Main Control Roo);n (1 J
It is necessary to provide a comfortable working space to the
operators in order to reduce their stress, thereby a1lowing them to
constantly exhibit their maximum ability: From this point of view,
the shape, color coordination and illumination of the main control
room were optimized, in addition to the improvement of the main
control board which play the main role of man-machine interface.
First, the fanorite images of experienced operators were extracted.
Then, several alternative designs ware evaluated by a quantitative
evaluation method using .the sn method which is used to evaluate
subjective feelings. The final design was determined as follows.
* Shape : Convex type The ceiling is higher on thecenter portion than on the peripheral
portion* Color Coordination : Warm natural (use beige as a basic color)
* Illumination : The combination of the louver illumination
and the spotlights illumination
- 281 -
2.2 Reduetion in the Operator's Workload
2.2.1 Functional Partition of Control Board
The conventional control board was composed of reactor and
turbine/generator boards. The control swi tches and m~ni tor ing
indicators on each board were laid out by the system to which the
relevant pieces of equipment belong. While the new type control
board is divided into main control board and auxiliary control
board. The main control board is used for monitoring and operation
dur ing normal operation mode, while auxiliary control board is used
for start-up, shutdown and post transient/accident operations.
Wi th this control board layout, the operator need not to move
around control boards in order to verify the plant status before
and after the control actions. Therefore, the workload of
operators has been largely reduced. The shape and function of each
control board are shown in Fig .1.Switches and indicators are arranged by the system to which they
belong, and are coded by shape and color in addition to labels.
They are furthermore designed from the viewpoint of ergonomics
(e. g., height, viewing angle).
2.2.2 Automation
(1) Extent ofThe Limits of Automation
One of the aims of automation is to enhance the plant
reliabili ty and safety by reducing operatior i s workload and human
errors, in which the machine (computers) works what it is good at.
Automation system is designed for facilitating frequent monitoring
and control actions, urgent control actions and diversified control
actions. The operation dur ing the per iod from 15% power up to full
power have already been automated.
The following items related to the start-up and shutdown
operations in which frequent monitoring and control tasks are
required, have been newly automated in recent design by inttoducing
digital control system extensively.
( 1) ReS hea t up and cool down(2) Main turbine/generator start-up (rolling-up, on~grid and load-
- 282-
(3) Main turbine turning
(4) Feedwater pump turbine start-up
(5) HP turbine steam extraction for cutting in HP heaters
It has already been eonfirmed that the frequency of monitoring
and eontrol actions has been largely reduced by the automation
systems mentioned above.
(2) Consideration in Designing Automation System
In designing the automation system,it is important to minimize
any effect on the plant caused by the single system failure" and
to be able to be rectified easily. The~efore the eontrol system
should be construeted to be dispersed, hierarchal and redundant.
Anotherimportant point is to give every consideration to theoperators. Breakpoint and sequence monitoring systems are
incorporated so that the operators may not excessively rely on the
automation system, such systems allow the operators to verify the
plant status and make their own judgmentsbefore proceeding to the
next step, and thereby keep maintaining the operator i s competence
as well as preventing the aliena~ion of man from the' machine
(automation system). In addition, a countermeas.ure against the so-
called blackbox problem inherent to the automation system is
adopted. It is a system, in which the operators can be informed of
the on-going automation process being displayed on CRTs, plus voice
announcement. The operators can always monitor the on-going statusof automation process with these systems (Fig.2).
2.3 Improved System for Information Presentation to Operators
2.3.1 Utilzation of CRT
CRTs are designed to improve the information display format,
whieh helps the operators to easily recognize the on-90in9 plant
statusas well as to form an adequate judgment on plant control.
The operators can easily select a display format commensurate to
his work from this CRT system. For example, the relevant
parameters can be integrated and presented as a function of time in
addition to discrete values. This function ~s partieularly useful
when an alarm oceurs.
- 283-
During the post trip operation period, the operator has to
survey much information for grasping the plant status, the computer
surveys the plant status and a~normal components are displayed with
red color on CRT. For example, the status of components designed
to be automatieally activated in the case of plant trip is
displayed on one CRT, and failed eomponents which should ~e star tedare indicated wi th flashing for the purpose of ealling. for theoperator attention.
Such improved information display method will be significantly
reduced human error rate.
2.3.2 lmproved Alarm System (2)
The primary function of the alarm system is to inform the
operators of abnormal conditions quickly and exactly. The maximum
of about 100 alarms may occur at a time of accident. In order to
easily grasp the plant status in such an occasion, a system adopted
is capable of changing the color of alarm windows to one of three
colors (i. e., red, yellow and green) in accordance wi th the
importance ofalarms. This dynamic categorization is earl' ied outby prioritization logie which is based upon a simple physieal
and/or logieal rules. The operators ean easily identify' the
important alarms even in unexpeeted transients .Three categories and required operational aetions are as
follows.(1) RED : "Alarm Information"
The most important information at a given time, indicating
the oecurrenee of process anomalies 01' component/system
failures. When the "Alarm information" is given, the
operator is required to eertain operational deeision that
normally lead to operator i s interventions.(2) YELLOW: "Caution Information"
Information indieating that an automatie component/system
action i5 demanded. When the "Caution Information" is
given, the operators have to check the relevant
component/system.(3) GRREN : "Normal Status Information"
The least important information at a given time to which the
system does not need to attract operator i sattention but
........whichoperator5may.monitor.voluntarily. ..
- 284-
It appeared from adynamie verification test using areal-time
plant simulator that a total number of red and yellow alarms was
reduced to about one-fifth of the conventional alarms (Fig.3).
Operators can respond to transient and accident conditions,
focusing their attention on the red and yellow alarms. Human
errors will then be reduced.
2.4 Improvement of Maintainabilty
2.4.1 Redundancy and the Self-diagnostic Function of Reactor Control System
A large number of micro computers are adopted to control the
system. Each control system is redundant and swi tched over from a
normal system to a back-up system by the self-diagnostic function
of micro computers. And, the plant is designed such that when both
normal and back-up systems are failed, the operation is
automatically transfer red from automatie control mode to manual
control one. The introduction of these systems has. achieved highly
reliable control system. When a print card is failed, the failure
mode and the card address are di~played on a plasma display in the
control cabinet. The trouble shooting and repair can be done
easily within a short period of time.
2.4.2 Introduction of Visual Maintenance Tool
Visual maintenance tool .is prepared for the maintenance of
digital control system (Fig.4). For example, the confirmation of
data and program processing or the correction of the program can be
performed by using this tool. The logic of program displayed on
CRT is formatted exactly the same as the I&C block-diagram.
Therefore i the contents of processing of analog and sequence
operation can beconfirmed wi th the same feeling as theconventional I&C engineering. And maintenance staff need not to
read and translate the program wi th the programming language and
symbol.
2.4.3 Improvement of Reàctor Protection System
In order to avoid unnecessary plant trip dur ing the in-service§l,.ryel11~!1çe..J;esj;içQmplete~4::çhannel~and.....4.::.tr.ai.n....system....and
- 285-
automatie bypass control logie are adopted. The reaetor trip logie
is based on 2 out 4 logies dur ing normal operation. When one
ehannel is in bypass mode for repair or test, the reactor trip
logic eonsists of 2 out of 3. Unnecessary reaetor trip during the
test can be protected by this improvement and the trip rate is
greatly reduced.
The introduction of automatie test equipment largely saves a
time for testing I&C .equipment during the annual inspection outage,
in addition to monthly surveillance test, with resultant in the
well improvement of maintainabili ty.
3. STEPS TAKEN FOR lNTRODUCING lMPROVED CONTROl SYSTEM
In order to ensure the operating experiences feedback into the
design engineering of such automatic control systems, many well-
experienced operating and maintenance staffs eontributed at each
stage of development, design and verification/validation (Fig.5).
These improvements have .been made by the following steps.
(1) In development stage, needs were identified by interviewing
with well-experienced operating and maintenance staffs and the
evaluation of effects on plant operation and maintenance after
the design change was perfo~~ed for the purpose of reflecting
the operation experiences.
(2) In design stage, the evaluation of equipment reliabili ty,
failure effects and the effects after the design change was
performed.(3) In ver ification/validation stage, new control system and main
control board were connected to a real-time plant simulator at
a factory and the .function and performance were confirmed by
well-experienced operating and maintenance staffs.
4. THE FUTURE TRENDS OF DEVElOPMENT
Human factors considerations for the plants under construction
are summar ized above. Much more improvements of man-machine
interface for advanced PWR are under way.
The advanceä and fully computer ized main control board is one of
many improvements being made. Almost all the conventional
instruments (e.g. switches, lamps) are planned to be replaced by a
s.of.t.........contr.ol.......syst.em.....bJi7ut.il.izi.ng......CRTs.......and....o..the.r...compu.t.e.r..::dr..iiien
-~6-
interface devices. This will allow more compact contr~l board and
closer interaction between monitoring and control tasks and
resul tant reduction in human errors.
In addition, knowledge-based operator guidance. system (3) is
baing developed. This operator guidance system supports the
operators in monitoring, judging and making decisions during
abnormal transient and accident. In this system, a dedioated
computer stores the knowledges about operation and machine,
diagnoses the cause of abnormal symptoms with these knowledges and
displays the guide for operation.
The automation of the control rod control at lower power is
being studied for field application.
To keep enhancing the plant reliability and safety, we will make
best efforts to improve the man-machine interface continuously.
REFERENCES
(1) MATSUSITA,K., et al. , "Improvement of PWR Control Room
Design", International Conference on Man-Machine Interface in
the Nuclear industry Tokyo, Japan, February 1988.
(2) FUJITA,Y., et al. , "Improved Annunciator System. for Japanese
PWRs : Its Function and Evaluation", International Conference
on Man-Machine Interface in the Nuclear Industry, Tokyo Japan,
February 1988.
(3) MIZUMOTO,T., et al. , "Development of Knowledge-Based Opera tor
Support System for Japanese PWRs", International Conference on
Man-Machine Interface in the Nuclear Industry, Tokyo Japan,
February 1988.
(4) NITTA,T., et al. , "Design Concept for Human Factor in Recent
Japanese PWRs", IAEA International symposium on Balancing
Automation and Human Action in Nuclear Power Plants, Munieh,
Germany, July 1990.
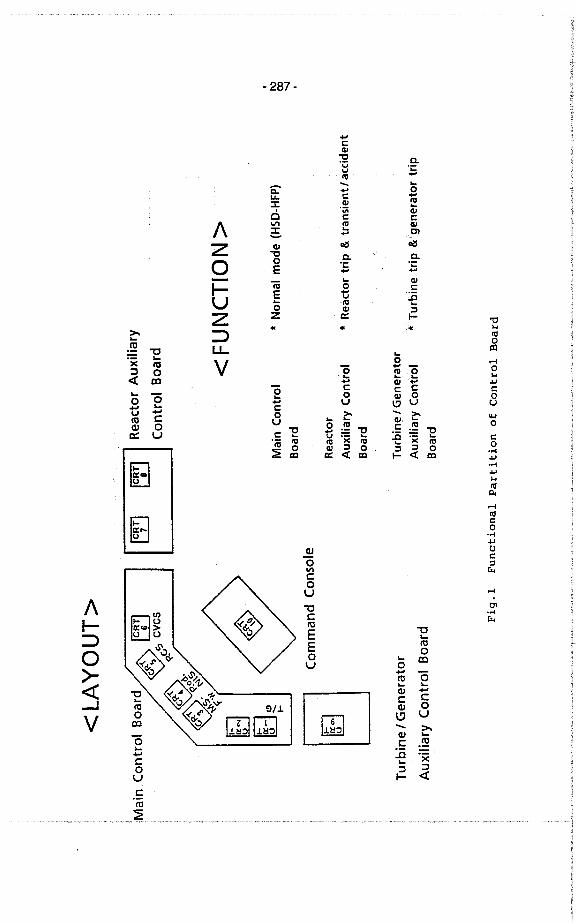
c: L
AY
OU
T~
IC~T
I IC
~TI
I R
eact
or A
uxila
ryControl Board
c: F
UN
CT
ION
~
Mai
n C
ontr
olB
oard
* Normal mode (HSD-HFP)
. I\ CD -- i
~C
omm
and
Con
sole
Rea
ctor
Auxilary Control
Boa
rd
* R
eact
or tr
ip &
tran
sien
t I a
ccid
ent
Tur
bine
I G
ener
ator
Aux
iliar
y C
ontr
at B
oard
Tur
bine
I G
ener
ator
Auxiliary Control * Turbine trip &
gene
rato
r tr
ip
Boa
rd
Fig.l Functional Partition of Contro! Board
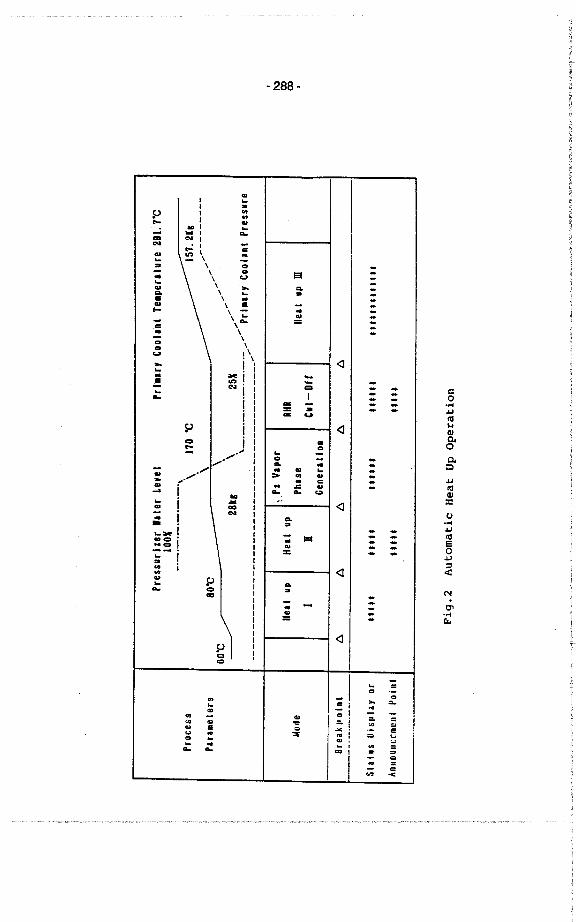
-288 -
IIII..i
.. I.. I
.. I
~ \\\
\\ .,.\ ..\ ..\ .\ -;
\..\\
\\'.iIII/IIIIIIIII/
./
p....CI..cu........cuco.cu..I:........,..........
cu~cu~..cu
pQ..-
poco
:oonIN
Ol....IN
poCC
cu....'"'"cu....I:........ a
--=I-....
=
I:..
....cuI:cug
(l
()
()
()
()
-------
---....-----
....
..::
..=..
......
.. cu~ '"..N .&.. ..
....-
..cu=
....
..::
-..----
..-....-..--..-
-----
'"'"cu........
cu.........
'"..cu
cu~..:I
-'I: i
-; i=. ¡
: ¡.. ,.. i
I
.... I:....,.
..:. -
=¡'"u
:.'"= ..
..I:I:"''"
co.....ia..GI
8'0.::..iaGI:io.....ia
~..~o:
N0-...r.
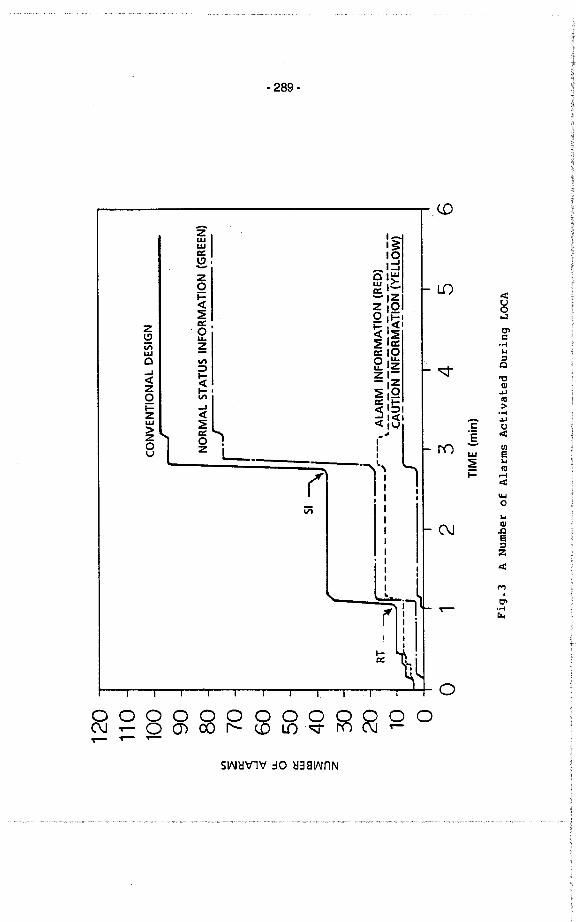
VI 2 ix ~ ct U- o ix w lX ~ ;: z
120
110
-10
0 -
90 -
80 -
70 -
60 -
50 -
40 -
~ -
i
20 RT_" f.-n~-_u_:-u~--' ALARM INFORMATION (RED)
10 ______. ~e~Q"TiOÑiÑFÕRM~IiõÑ(yËi:Lõw)
_-1 -. -l
O .-
-. -
-i
1 2 3 4 5
6
CO
NV
EN
TIO
NA
L D
ESI
GN
,. NO
RM
AL
ST
AT
US
INFO
RM
AT
ION
(G
RE
EN
)
r_r-
- .
, '" (X co ,
(
oT
IME
(m
in)
Fig.3 A Number of Alarms Activated During LOCA
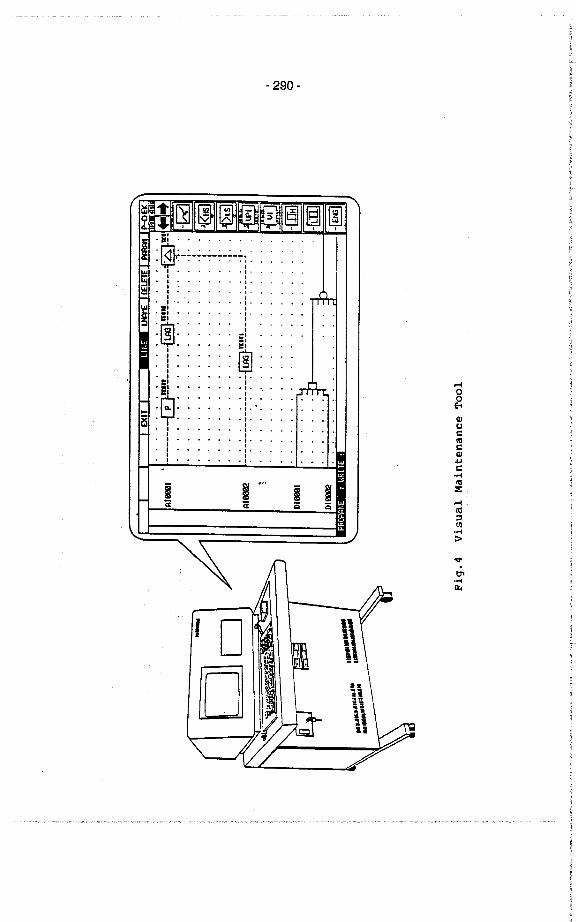
.-00E1
CICJCl\CCI.lC
'.-." l\
i ~ i ; ::.-ã: ã: ¡; ¡; l\='in. ..-::
-..
0"..-i:
.290 -
, D
D
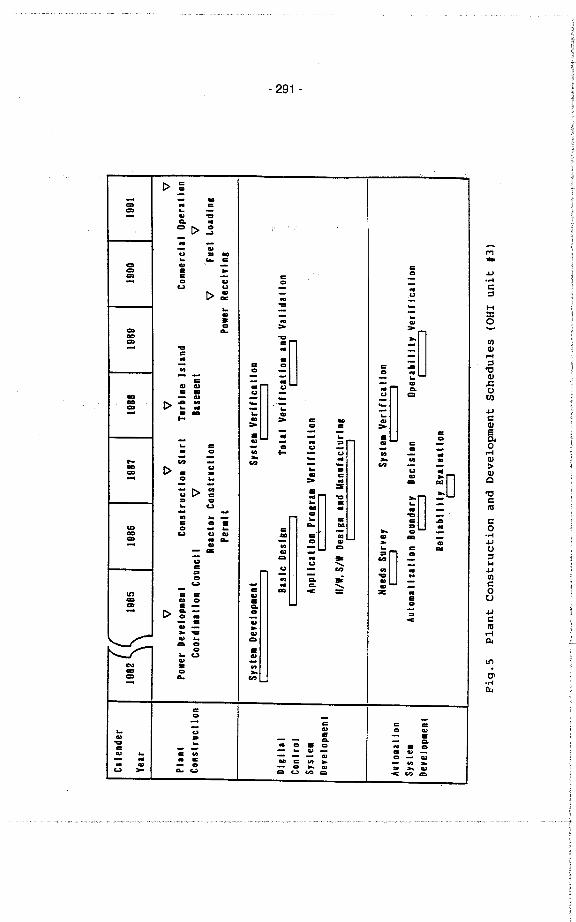
- 291 -
¡; =
I
e-- - .... .. =.. .. -- '" ..Co ..= ¡; e..-.. -- '".. D .... ... == '" - =.. . ~ e.. .. - = -- e '" e -e. .. - ..
¡; GO - .... oe -.. .... - -GO - ... oe GOe ..
i~
.. ....
~~
..- ..=..
= =-.: .! e- - ..c:
l~ l~
GOGO .. .. Cl= . =.. - .. .... ¡; .. .... .. .. ..- .. .. GO.. .. c: ..Cl =- - - =.. - .. e- GO - .. .= GO = -.. c: - e .. -; e -.. e .. .. - .. - ..- - ~ .. .. .. .. .... .. - .. - .. .. - -.. ¡; .. .. .. .. .... = . GO c: GO
:0- e ... .. .. =- ::-
¡; ..
l~
.. c: ..
l~-.. Cl = -.. e. .. -- ..
r- -.. .. - c: .Cc: Cl . li ..ce Cl - .. = - ~ Cl -.. e. .. .. .. .. GO .. -.. .. .. - GO ~ GO- GO .. = .. c: ..- .. GO
~~
Cl- = .. . -.. .. .. -c: .. - .. .... - - ,; ..Cl .. Cl -e. - .. Cl .. GO -- c: .. oe = z: oelt = '" .. .... '" Cl . e.. . - Cl --¡; Cl - e ..Cl .. - ..- c: ..
GO - ~~ ~ .. ..GO .. == Cl0 ... e. ..GO -N . .... Cl ~
CD .. ..-=Cl - -- = = c:- GO e GO.. .. . - .GO .. - - Cl - Cl.. .. .. e . e .. . 0c: - - - .. .. - .. .. -GO .. .. .. - - - '" e - GO- .. .. '" .. = .. ~ - .. ~.. GO - Cl - Cl ~ '" .. "- GO.. =- "- e. = e. '" .: .. .. =
M.......c::..:ioinQl.-::
'0Ql.coCI
..i:Ql
~.-Ql::QlQ'0C"'
Co.....o::....rJCoU~i:"'.-ii
in
0'...r.

-292 -
External Events
Chairman: C. Zaffiro
- 293-
CSNI WORKSHOP ON "SPECIAL ISSUES OF LEVEL 1 PSA METHODOLOGY"
Co 1 ogne, FRG, May 27th - 29th 1991
Issue paper on "External Events"
(CSNI/PWG5 subtask 9.4)
prepared by
Carl0 Zaffiro, ENEA/DISP, Rome, Italy
1. Problem description.
In PRA studi es for nuc 1 ear power p 16nts, externa 1 events are those
potential accident initiators that are produced on site by naturalphenomena or by hazardous activities in the nearness. These events have
the common characteri st i c to threaten in the same time both the plant
structura 1 i ntegri ty and system operabi 1 i ty. Therefore, because of thei rcommon cause effect, they might significantly contribute to the estimated
ri sk, bei ng the contri buti on stri ctly dependent on the nature andstrength of the involved phenomena and also on the plant response topossible consequent accidents.
Methods for assessi ng acci dent sequences i niti ated by externa 1 eventshave been attempted si nce the WASH-1400 Reactor Safety Study. Inpractical applications, however, they have resulted of difficultinterpretation in the outcomes, due to the uncertainties of the analysis.
Uncertai nti es exi st for both the not exhausti ve understandi ng of thephysi ca 1 phenomena associ ated wi th the events and the 1 ack of experi ence
on the plant behavior during. the accidents.
The past experience on PRAs has shown that, whatever acci dent i ni ti atorshave been cons i dered (i nterna 1 or externa 1 events), core me 1 t frequenc i es
are less sensitive to uncertainties than other probabilistic indicators
(such as those referred to contai nment fai lure, 1 arge releases, externa 1
sani tary consequences and damage to property). However uncertai nti es aregenera lly 1 arger for externa 1 events than for interna 1 events. Thatrequires much attention be paid when considering the importance of the
externa 1 events contributi on to the assessed core me 1 t frequenci es.
Estimates of the external events contribution to the frequency of core
me 1 t acci dents are current ly made in Leve 1 1 PSAs. The methods ofanalysis , in principle, are similar for all events. They requireinvestigations to determine the on site hazard to the plant, as well as
several specific analyses to develop data bases and success criteria for
as sessi ng the plant vul nerabi 1 i ty and quantifyi ng the probabil iti es ofcore me 1 t acci dents provoked by the events.Indeed, because of the uncertai nti es in the ana lys i s, the treatment of
externa 1 events in Level 1 PSA i s not as comp 1 ete nor as defi ni ti ve as in.th e...t reatmentofjnternaLevents..e~~Inaddition.the~current~stud:ies and.research programmes on the physi ca 1 phenomena to be exami ned for the
- 294-
vari ous events have not reached the same development status, and arestill in progress. Therefore differences exist in data banks and methods
of analysis depending on both the severity and recurrence period of the
concerned event. In order to exploit at best the available knowledge inthis fie1d, recent app1ications have used a structured and forma1izede1icitation process of expert opinion, 1ike in the analysis for the 1ess
known severe accidents phenomena. Uncertai nty ana lyses us i n9 stochasti ctechniques (like the Monte Carlo methods and the Latin Hypercube Samp1ing
al gori thm) were also made for assessi ng the degree of the core me 1 t
frequency vari abi 1 i ty generated by the uncertai nti es of both the useddata and as sumpt ions adopted in the models.
At present an attempt to revi ew the status of the art on the treatment
of externa 1 events i n Level 1 PSAs i s bei ng carri ed out in theambit ofthe CSNI!PWG5 activities. As result of the work performed so far, apre 1 imi nary report has been drafted. The report exami nes the methodscurrent ly used for the sei smi c, the fl oodi ng and the fi re events, that in
past PRAs were treated more extensi ve ly than other events (i nterna 1fires are usually considered in PRAs as external events because of their
simi 1 ar characteri sti c to provoke common cause effects).The present "issues paper" briefly summarizes the main conclusions of
the CSNI/PGW5 report. It al so addresses the areas that need of morei nvest i gati ons.
2. Documents stating the status of the art.
In the CSNI!PGW5 draft report on the "Status of the Art of Level 1 PSA"
concerni ng "Externa 1 Events"references are made to documents that areavail ab le in the 1 iter¡iture. The references are subdi vi ded accordi ng to
the fo 11 owi ng three topi cs:
- the seismic analysis;
- the ana lysi s of acci dents resul ti ng from externa 1 fl oods;
- the fi re ri sk ana lysi s.
The long list of documents indicated in the above mentioned report,
shows that the externa 1 events have been matter of i nterest for iianystudies and PRA appl ications. However, the most complete and updated
analysis, inc1uding an extended uncertainty analysis, is the onecontai ned in the NUREG 1150 fi na 1 report. The reference document of thi s
report i s:- NUREG 1150 "Severe Accidents Risk: An Assessment For Five U.S. Nuclear
Power Plants". VoL.l, Final Summary Report, and VoL.2 .Appendices A, B
and C; U.S. Nuclear Regulatory Commission, December 1990.
A detail ed descri pti on of the procedures used in thi s report for theexternal events analysis is contained in the following document:
- NUREG/CR 4840 - SAND88 3102 "Procedures for the Externa1 Event Core
Damage Frequency for NUREG 1150" by M.P.Bohn and J.A. Lambright;~SarrdiaNationalMtaboratortes;.~.~.November1990~;~'... .The fi na 1 versi on of the NUREG 1150 report fo 11 ows the pub 1 i cati on of
- 295-
two previ ous drafts and i ncorporates comments of two peer revi ew groups,
sponsored by the U. S. Nucl ear Regul atory Commi ssi on and the Ameri can
Nuclear Society respectively. Some comments, in particular, are dedicated
to sei smi c events and are reported in the fo 11 owi ng document:
- NUREG 1420 "Speci al Revi ew Commi ttee of the Nuc 1 ear Regul atoryCommission on the Severe Accident Report (NUREG 1150)" U.S. NuclearRegulatory Commission, August 1990.
A complete risk analysis from fires, always limited to the above plants,
isa 1 so i nc 1 uded in the NUREG 1150 report, whereas the ana lysi s ofaccidents induced by externa1 f100ds has been considered on1y on aqua 1 itati ve basi s through boundi ng eva 1 uati ons. However, the best statusof the art on thi s topi c may prob ab ly be found in thefo 11 owi ng document:
- NUREG/CR 5042 - UICD 21233 "Eval uati on of Externa1 Hazards to Nuc1 earPower Plants in United States" by C,V. Kimura and R. J. Budnitz;Lawrence Li vermore Nati ona 1 Laboratory, December 1987.In that report a revi ew i s made on methods to. assess the reference
design basis and to estimate the frequencies of the major .accidentsi nduced by externa 1 events, as performed in some exi sti ng PRAs.
3. Issues on the seismic analysis.
3.1 Status of the art.
Chapter 1 of the CSNI!PGW5 draft report on extern al events contains ashort revi ew of the basi c approach to determi ne the core me lt frequency
of acci dents provoked by earthquakes. Here fo 11 owi ng are summari zed some
considerations made in that report on the status of the art of theanalysi s.
i) Hazard evaluation.
The seismic hazard is a curve correlating the intensity of theearthquakes, expressed in terms ofon si te peak acce 1 erati ons, wi th thei rfrequency of occurrence. Usua 11y the hazard i s determi ned through a
stati sti ca 1 treatment of the avail ab 1 e data supported bygeo-sei smotectoni c i nvesti gati ons and theoreti ca 1 studi es. The ana lys i si s affected by consi derab 1 e uncertai nti es si nce the avai 1 ab 1 e data and
i nformati on are not suffi ci ent for fully understandi ng the physi ca 1
phenomena i nvo 1 ved duri ng earthquakes and thus for deve 1 opi ng re li ab 1 emodel s. In thi s regard expert judgments are often used, if necessary, topostul ate hypotheses and assi gn probabi 1 i ti es. Large uncertai nti es coul dmake the results of difficult interpretation and possible misuse. Less
uncertainties, however, exist and more valid results are obtained for
si tes located in regi ons wi th more sei smi c data, especi a lly if data are
referred to longer peri ods of the sei smi c hi story.Accounting for the uncertainties, various values of the on site peak
".,acceJerat.ionsare~obta.ined,"e"speci.,al,l"y.i.n....thefi.e.l.d....~.of.l"argeearthqu.ake.s;Thus fami 1 i es of hazard curves maybe produced. That i s the case of the
- 296-
NUREG 1150 report whi ch cons i ders two famil i es of curves, provi ded by
the LLNL and EPRI respectively (see ref.11 and 12 in chapt.l of the
CSNI/PGW5 draft report l. The 1 arge spreadi ng of the probabil ity val ues in
the lower part of these curves underlines the difficulties to assess the
hazard from very strong earthquakes.
The review of methods to assess the on site seismic hazard points out
that low probabi 1 i ty numbers associ ated wi th 1 arge earthquakes might notbe signifieant. The meaningfulness level, however, should not. be the same
in various regions of the world with different seismicity, since theavailable seismic data and information could have a differentconsistency. For instance, because of the brevity of historical records,
the probability of large earthquakes in U.S. could be judged to be not
significant below values of the order of 10-3+10-4 per year, whereas in
some European countries (e.g. Italyl the meaningfulness level of the
est imated probabi 1 i ti es could be extended down to val ues of about10-4+ 1 0-5 per year. In general the events associ ated to the lowest but
still significant probability values are considered in the regulationsfor defi ning the Safe Shutdown Earthquake (SSE).
ii) Fragility analysis.
The seismie fragility analysis provides the failure probabilityfuneti ons for the pl ant structures, systems and components under var;ous
seismic loads. In such analysis the seismic loads are usually expressed
as peak ground acceleration, and fragility data represent the medium
values of the acceleration capaeity to withstand the loads. Fragilityfuncti ons, therefore, account for the vari abi 1 i ty of the sei smi c responsein a gi yen structure, system or component, due to the uncertai nties on
how the ground moti on appears at the pl ant basemat and pro pagates from
the subsoi 1 to the various part of the pl ant.Fragi 1 i ty functi ons are usua lly deve 1 oped through the treatment of dataand information obtained from:
- observati ons duri ng earthquakes;- seismic qualification tests according to usual standards;
- tests on shaking tables simulating actual or theoretical earthquakes;
- calculations with theoretical models.
The treatment i s in general a stati sti ca 1 combi nati on of the above dataand i nformati on supported, i f necessary, by expert opi nions.Fragility data have been developed and collected in the past by several
scientific organizations, as documented in the available literature (see
the ref .13, 14,16 and 17 in chapt.l of the CSNI!PGW5 draft report).Generi e data, used in some past PRAs, are in parti cul ar provi ded in theNRC document "PRA Procedure Gui des" (see ref. 2 in chapt. 1 of theCSNI!PGW5 draft reportl. An updated list is contained in the NUREG/CR4840 report mentioned in par.2.
iii L System analysis.
The seismic system analysis calculates the frequencies of accident
sequenees, plant damage states and core melt at various ground motion..""le.vel"sselected..from..thesiteseismi.c"..harard.,The..methodi..s..coneeptually
identieal to the traditional and well established method of the fault
- 297-
trees and event trees analysis used for interna1 events. There are,however, some differences due to the features of the seismic events that
act as common causes of fai lure of the various part of the plant, to be
combi ned sometime wi th other non sei smi c fail ures.
In the system ana lysi s the fail ure modes and probabil i stic fail urecriteri a for important safety systems, structures and components, are
most1y determi ned usi ng the current faul t tree techniques and fragi 1 i tydata. The p1 ant response to the site ground moti on isa 1 so assessed in
order to determi ne the sei smi c loads in the vari ous part of the plant
where the above syst~ms, structures and components are 10cated. The used
models shou1d represent the seismic structura1 behavior of the plant,inc1uding the soil structura1 interactions. Iterative ca1cu1ations at
various levels of the ground motion intensity are usua11y made, imp1ying
increasing and high variable resu1ts for the highest 1ess probableva1ues. The variabi1ity of resu1ts mainly comes from the uncertainties in
the hazard ana1ysi sand in the fai 1 ure (sei smi c and non sei smi c I ratedata, inc1uding human errors. Sensitivity studies and uncertaintiesana 1yses are made at 1 ast to identify domi nant contri butors. to the
estimated core me lt frequenci es and assess the vari abil i ty range of thefinal results.
Results from some past PRAs have shown that the sei smi c core me ltfrequenci es mi ght represent a si gni fi cant contri buti on to the global coreme 1 t frequency (see tab1 e 1 and fi g. 5 in chapt. 1 of the CSNI/PGW5 draft
reportl. In addition the uncertainties in the estimated values areconsi derab ly 1 arge and over 1 ap the uncertai nty range of resu1 ts from the
internal events analysis.
3.2 Areas where improvements are necessary.
The revi ew of the status of the art confi rmed that much work i s sti 11
needed for decreasi ng the uncertai nti es of the sei smi c ana 1ysi s,especially in the fie1d of the hazard evaluation. Here following are
mentioned the main areas to be investigated for improving the confidence
level of the final resu1ts.
i) Hazard evaluation.
Current methods for determi ni ng the site sei smi c hazard shou1 d be
improved in the fo11owing areas:
- identification of the seismic sources and determination of therecurrence frequenci es for strong earthquakes;
- assessment of the propagati on phenomena from the sei smi c sources to thesite for deve10ping rea1istic and update re1ationships between site. ground moti on and re 1 evant earthquake parameters (e. g. peakacce1erations vs hypocentra1 distance, magnitude, etc. I;
- evaluation of the site ground motion features that are relevant to the
plant response analysis (time histories, response spectra etc.).
Instrumental data and observations shou1d be extensive1y co11ectedd~rin9ëlctua1eëlrtnquak~sin order
to iniprove and conva 1 i date theoreti ca 1vñ1ódef s. arid. em¡Íi rica 1corre ìaÜõns. .. .. . .... ....... . . ..~.. ...
- 298-
i) Determination of the flooding frequencies:
Methods for determi ni ng frequenci es of vari ous on si te fl oodi ng 1 eve 15re lyon the deve 1 opment of the Probabl e Maximum Preci pitati on (PMP),
gi yen that, in general, a severe 1 oca 1 preci pi tati on i 5 the controll i ngevent on all the concerned sites (see ref. 1 in chapt. 2 of the CSNI/PGW5
draft report). For the rari ty of the events, however, PMP can berealistically evaluated within the range of the available historicalrecords. A peri od of about 100 years, correspondi ng to a frequency va 1 ue
of about 0.01 %, i 5 the return peri od generally used if data areconsi stent. For 1 arger return peri ods ca lcul ati ons become diffi cul t anduncertain, especially when, during the flooding, a number of rarephenomena are expected to affect the si te and must be correl atedtogether. . Stati sti ca 1 methodsmay be used to treat the avai 1 ab le data andi nfprmation, and expert judgements are often needed to support theana lysi s. Currently, boundi ng ca 1 cul ati ans based on conservati ve modelsand hypotheses that are judged to be acceptab 1 e by the experts, are used
for quantifying defensible frequency values. Moreover, some methodology
is available to perform calculations in a formal sense (see ref. 13 in
chapt.2 of the CSNI/PGW5 draft report). All analyses, however, do notavoid the uncertainties due to the lack of data and correlations among
the i nvo 1 ved phenomena.Si te fl oodi ng mi ght also occur because of upstream dam fai lures.
Al though real i stic dam fai 1 ure probabi 1 i ti es in extreme condi ti ans cannotbe easi ly determi ned (for the di ffi cul ty of accounti ng of all thei nvo 1 ved factors, such as dam 1 ocati on, constructi on, desi gn capabi 1 i ty,etc, . ), data on dam fai 1 ures that are avai 1 ab 1 ein the 1 i terature coul d
on ly justi fy val ues not grater than 10-3 per year (see ref. 12 in chapt. 2of the CSNI/PGW5 draft report). Li ttl e credit, however,. i 5 in general
gi yen to fai 1 ures of modern and well-engi neered dams.From the above considerations it results that at present methods to
assess the frequency of on site high flooding levels are valuable only in
the range of historical data. These methods are also used in theregul ati ans to determi ne the Desi gn Basi 5 Fl oodi ng Level (DBFL).
ii) Plant system analysis.
The pl ant system ana lysi s i ntends to estimate the probabil i ty that,
gi yen a fl oodi ng event 1 arge enough to cause a damage on the pl ant, coredamage acci dents wi 11 occur. To thi 5 purpose the ana lysi 5 requi res the
development of plant event trees with the use of probabilistic failure
data for relevant plant safety functions at various flooding levels. In
practical applications these data, also referred as to floodingfragility data, cannot be easily obtained, since at present a realistic
world data base does not exist, nor theoretical models are available for
assessi ng the system and component behavi or duríng excepti ona 1inundations. In place of theoretical calculations, expert judgements may
be used for making conservative assumptions in bounding analyses, and for
estimating prob abi lities as well.
In the PRA 1 i terature there are a few cases in whi ch co re me 1 t acc; dents
.. proguce(tJ:iy.exter.nal......flo.ods.....h..av.e.....been......extensively.treat.ed........mostJy..........i.n..........a
- 299-
Particular care should be taken when estimating probabilities .for largeearthquakes, wi 11 i ng to ascertai n to what extent these unl i ke ly events
maybe considered still conceivable, without impairing the meaningfulness
of the ana lysi s.
ii) Fragility analysis.
The effort to co 11 ect further and updated fragi 1 i ty data should conti nueespecially in the field of the high accelerations, taking also intoaccount relevant ground moti on parameters (soi 1 features, frequency
spectra, etc.) The airn i s to make avail ab 1 e an enl arged and exhausti ve
1 i st of generi c data to be used in PRAs. Current methods, in parti cul ar,should provide improved failure data on :
- e 1 ectri c components (i ncludi ng re 1 ay chatter and ci rcui t breaker trip);
- piping at various plant locations;
- interbuilding piping (caused in particular by soil failures and1 iquefacti on).
Methods shoul d provi de the uncertai nty range wi thi n whi eh data have beenactua lly deve 1 oped.
i i i) System analysi s.System ana lysi s shoul d be improved in the determi nati on of the sei smi c
fai 1 ures modes of structures and components for vari ous ground moti onlevels. At the present status of the art the following areas need of more
investigation:- soil structures interactions;
- dampi ng 1 eve 1 s beyond des i gn bas i s;- models for specific seismic events (different time histories and
response spectra etc.);
- combi nati on of fail ure modes (cascadi ng fail ures of pi pi ng supports,s imul taneous fai 1 ures due to corre 1 ated responses, i nduced fi resetc.) ;
- human behavi or duri ng earthquakes.
Research shoul d provi de updated methods for generati ng real i sti c andbest est imate val ues of the sei smic loads in vari ous parts of the pl ant
where relevant systems, structures and components are located. The loads
shoul d represent all aspects of i nterest for the fail ure modes of such
systems and components or supporti ng structures, accounti ng for the
uncertai nti es.
4. Issues on the flooding analysis.
4.1 Status of the art.
In chapter 2 of the CSNI/PGW5 draft report on external events a short
review i s made on the probabi 1 i sti c methods to assess the core. melt"f.re.91JeIlc;Y.QL"c!c;.c;tQe.l!!sc;cl1JseQh...e)(!ei:Ilcll......!!QQs!ing..~.....~ei:e...!QllQ\t~n.9 . ... aresome considerations on the status of the art regarding this analysis.
- 300-
boundi ng way. The resul ts have shown that the assessed core me 1 tfrequencies are in general very low and sometimes insignificant (see
table 1 in chapt.2 of the CSNI!PGWS draft reportl. These applications,
however, do not contai n uncertai nty ana lysi s. Uncertai nties, mostlycoming from the on site flooding hazard, could be consistently high and
coul d cause doubtful resul ts, especi a lly if used for compari son purposes
on different sites.
4.2 Areas where improvements are necessary.
Al though past PRAs have shown that the contri buti on to core me 1 tfrequency from fl oodi ng events i s very 1 ow, some addi ti ona 1investigations could be still needed, especially in the field of the more
complex and rare natural phenomena. Here following are reported some
consi derations regardi ng the areas of concern.
i L Determi nati on of the fl oodi ng frequenci es.
In general all exceptional natural phenomena that may provoke high site
flooding levels (severe precipitations accompanied by water run- off from
ri vers and 1 akes, storms, strong wi nds ti des, etc. l, are surveyed bynational and worldwide meteorological. organizations. Expert panelsusua lly revi ew the status of knowl edge on the above phenomena, andsuggest studies for previsional models. For PRA applications, therefore,
expert judgements are conti nuous ly updated by these ongoi n'g acti viti es.Additional investigations could be requested only in some specific case
because of the features of the concerned si te.
i i L Pl ant system analysi s.The limited applications of the approach to calculate. the core melt
probabil ity in case of excepti ona 1 site fl oodi ng (beyond DBFL L do not
a 11 ow to i denti fy parti cul ar areas of i nvesti gati on. On the other handboundi ng ca 1 cul ati ons have demonstrated that enough capacity to achi evesafe shutdown conditions could be still available also in case of thetota 1 loss of equi pment and structures threatened by a severe i nundati on.With the exception, perhaps, of some particular case, at the moment no
additional investigations seem to be necessary.
5 Issues on the fire risk analysis.
5.1 Status of the art.
Chapter 3 of the CSNI/PGWS draft report on extern al events, contains arevi ew of methods currently used to assess the contri buti on of fi reevents to both the core me lt frequency and the contai nment fail urepr:obability....He.re.fDJ...l..ow.i...ng~.......are...summari..zedsome,cons~i.derations....onwthestatus of the art of the analysis,
- 301 -
i) Identification of relevant fire zones and determination of firefrequenci es.
Relevant plant areas that are sensitive to fire, and existing barriers
separati ng vari ous plant rooms and compartments, are usua lly identifi edon the ba si s of a comprehensi ve exami nati on of pl ant 1 ayout drawi ngs
validated by specific plant visits. Fire areas of concern are those which
have ei ther safety re 1 ated equi pment or power and cab 1 es for that
equipment.In past PRAs fi re frequenci es were determi ned from data that are
avai 1 ab 1 e from the òperati ng experi ence on nuc lear p 1 ants. The fewavailable data were reviewed and treated with current statisticaltechniques. Fi re frequenci es in speci fic areas and small rooms contai ned
in 1 arge compartments were obtai ned through partiti oni ng methods of theavai 1 ab 1 e fi re frequenci es of the compartments. Theoreti ca 1 models onfi re propagati ans and Bayesan estimati ons were used to support theanalysis and assess the uncertainties (see ref.5 a.nd 6 in chapt. 3 of
the CSNI/PGW5 draft report).
Generi c fi re frequenci es in important rooms and compartments of LWRs
plants were provided by Kazarian and Apostolakis (see ref.7 in chapt.3 of
the CSNI!PGW5 draft report). Some past PRAs produced different fi re
frequency values because of the special features of each plant (seeref.9,11 and 12, and tables 2,3 and 4 in chapt.3 of the CSNI/PGW5 draft
report). An extensive fire analysis was also performed in the ambit of
the risk studies for the NUREG 1150 report. The event data table reported
in the NUREG 4840 report (menti oned in par. 2) i s an exhausti ve 1 i st ofTi re events used in that report.
ii) Fire accident analysis.
In general, current regulations on fire protection have niade available
suitab le techniques and equi pment for exti ngui shi ng fi res in nuc 1 earpower plants.
In PRAs studi es specifi c ana lyses are performed for pl ant rooms andzones where relevant safety systems and e 1 ectri ca 1 supporti ng equi pmentare located. The aim is to clarify which kind of fire can develop andpropagate in a dangerous way so to provoke acci dent sequences potent i a lly1 eadi ng to core damage. The ana lysi s i 5 very plant specifi e, dependi ng onvarious eireumstanees ineluding fire place, duration, propagation and
exti ngui shi n9 modal i ti es. Current faul t tree and event tree teehniquesare used to assess relevant failures and identify various firepropagati on paths. In thi s regard data on the in pl ant fi re barri ersfailure rate are also needed for determining the failure rate forspecifi c equi pment or eomponents. Probabi 1 i ti es of acei dent sequences arecalculated with the available PRA methods (for instanee the one of the
SET computer program) in whi ch fi res are regarded as eommon cause offai 1 ure. A lternati ve methods i ne lude dependenci es between fi re andcomponents, room i nterconneeti ons, loeati on of eab 1 es and other pl ant
features that are relevant to the analysis (see ref. 3, 4 and 12 inehapt.2 of the CSNI/PGW5 draft report).
........Ffre...rñaîîCedcorédãíiageTreqUéií¿féswerêcãlcUiãfêdirilhèfi.rèfi.sk
- 302-
ana 1ysi s of the NUREG 1150 report. In thi s report the resu1 ts arepresented wi th the uncertai nty range and compared wi th resu1 ts estimated
for other events (see fig.3 and 4 in chapt. 1 of the CSNI/PGW5 draftreport). The comparison confirmed that uncertainties may be significant,
as also poi nted out by some previ ous PRAs (see ref. 20 and fi g5 inchapt.1 of the CSNI/PGW5 draft report).
iii) Fire development analysis.
In the fire deve10pment analysis best estimate methods are used to
assess the fi re growth, the damage on relevant structures and equipment,
and the effects of fi re exti ngui shi ng acti ons (see ref. 13 in chapt. 3 of
the CSNI/PGW5 draftreport). The aim is to éstimate the f1ashover time
that i s important to most fi re preventi on and mi ti gati on measures
(f1ashover time is the time when all flammab1e surfaces catch fire in the
who1e area that has been considered and temperatures reach nearly steady
state va1ues determined by the oxygen f10w into the area). These measures
have a hi gh probabi 1 i ty of success before f1 ashover condi ti ons arereached, and after f1 ashover must be addressed to 1 i mit the fi respreading since all the content of the concerned area is lost.
Vari ous s imu1 ati ng methods have been deve 1 oped to perform the ana1ysi s.This requires that a barrier failure analysis be also performed todetermi ne fi re vu 1 nerabi 1 i ty data and damage ti mes of plant fi re barri ers(such as fi re doors, securi ty doors, water ti ght doors, penetrati on seals
and so on). Vu1nerability data shou1d inc1ude the effects of firepropagat ion and of heath and smokes transport on the barri ers. Inaddition a recovery analysis is also required to estimate times to detect
and suppress fires through the avai1ab1e in plant fire fighting measures.
In this regard, data on fire suppression as function of the time are
avai 1 ab1 ein the 1 i terature for estimati ng, in conjuncti on wi th
ca 1 cu1 ati ons, the prob abi 1 i ty that fi res are suppressed before fl ashover.Numeri ca 1 computer codes usi ng determi ni sti c, stochasti c or empi ri ca 1techniques are avai1ab1e to make ca1cu1ations (see the list of tab1e 5 in
chapt.3 of the CSNI/PGW5 draft report).
5.2 Areas where more i nvest i gati ons are needed.
The frequency uncertai nty range that has been assessed for the fi re
i nduced core me 1t acci dents, under1 i nes the need of more i nvest i gati ansto reduce the uncertai nti es. Uncertai nties are mai n 1y generated from thefi re deve 1 opment ana 1ysi s because of the unknowns in the understandi ngthe fi re growth phenomena and the plant response to fi re occurrences and
recovery acti ons.Here fo110wing are mentioned some areas of major concern.
i) Determination of the fire frequencies.
The process to assess the fire frequencies is strict1y dependent onthe
avail ab 1 e data on in p1 ant fi re events, and must also re lyon thec êlEêl~.i1..~..ty..()f.....th.E!.....ySE!.c1. Pêlr:tit;()riirigiietli()C:StQ..êlccgyxrtfçfal1.........factQrS(such as the amount of e1ectrica1 components and cab1es, .fire 10ading,
~,".'t'
- 303-
fire zones occupation, and so on) that are relevant to the fire .ignition
and propagation in small rooms or buildings from large compartments.
Computer codes used to parti ti on fi re frequency wi thi n a parti cul ar fi rezone shoul d therefore be improved in order to i ncrease such capa bi 1 i ty.
ii) Fire development analysis.
Computer codes used to simul ate the processes of the fi re deve 1 opment
and propagati on from an enc losure to relevant areas of the plant (such as
the vari ous versi ons of the COMPBURN code) shoul d be improved so to
reduce errors and conservati ve assumpti ons usua lly made in the ana lysi s.In thi s regard typi ca 1 areas to be more i nvesti gated are:
- models to predict hot gases layer temperature;
- radiative heath transfer to targets above the flame;
- convect i ve heath transfer for objects engul fed in the fl ame;
- heath conducti on of objects in the fl ame and thermal response ofbarriers;
- mass burning rate of burning objects;
- ignition of insulation cables and damage failure criteria;
- manual fire fighting effectiveness (including smokes control);
- equipment survival in fire environment;
- contro 1 systems i nteracti ons.The improvements in the above areas should i ncrease the code capabi 1 i tyto predict the time to ignition or damage for critical cables andcomponents, as well as of times to fire suppression through available
fire fighting means (including the intervention of fire brigades).
- 304-
EX1ERNAL EVENTS ASSESSMENT FOR AN LMFR PLAN
K. Aizawa, R. Nakai and A. Yaraguchi
Power Reactor and Nuclear Fuel Development Corporation
Sankaido Bldg., 9-13, l-Chome, Akasaka, Minato-ku, Tokyo, Japan
ABSTRCl
Extemal events assessment was conducted for a typical loop-type liquid metal cooledfast breeder reactor (LMFBR).
The quantitative screening analyses which identify dominant sequences on thefollowing location-dependent failures were conducted: leak of water/steam/freon,
leak of sodium, inadvertent actuation of water sprinkler system, high energy line
break causing pipe whip. HV AC fan missile. and flre. The result. which is obtainedfrom conservative evaluation under the assumption that the susceptible components
fail, indicates the effect of fire is the largest among those extemal . events.
The quantitative seismic event analysis has also been conducted. Seismic hazard
curves and spectral shape have been evaluated using the seismic activity dataaround the LMFBR site. The design analysis and the testing ç1ata for design basisseismic events were used to quantify seismic fragilities of the structures andcomponents. Generic fragilty curves were also evaluated based on the fragiltieswhich were used in the precedent seismic probabilistic safety assessments (PSAs).Parametric studies for the probability of seismic failure on the plant level were
conducted using site-specific seismic hazard and fragilty curves. Several seismic
event trees were developed by systems analysis for seismic event. The component
failures due to a seismic event were modeled using a Boolean transformation
equation technique. Then the seismic induced core damage prob ability from
representative sequences was quantified and the critical components for
earthquakes were identifled.
- 305-
i. lNODUcrION
The Power Reactor and Nuclear Fuel Development Corporation (PNC) is constructinga prototype LMFBR. Monju. In support of its development effort. a probabilisticsafety study has been performed since November 1982. The objective of this study isto construct a probabilstic model to be used in evaluating the overall safety of theLMFBR plant. The resull of this PSA study wil provide an optimum allocation oflimited resources to various safety research programs and basic information useful
for the development of a basic policy for safety design and evaluation of futurecommercial LMFBRs.
The level-3 PSA with respect to intemal events was compièted in 1990. The level-1PSA with respect to external events is being conducted for Monj~(l).(2). Aquantitative location-dependent failures analysis and a preliminary seismic risk
analysis were conducted. In order to evaluate efficiently the effect of the extern al
events for an LMFBR plant. PNC has been developing an systems analysis codenetwork. As for the location-dependent failure analysis. the SETS code(3) is utilzedas a main code. Analysis codes have also been developed for the evaluation ofseismic fragilty and commOn cause failure of the redundant system considering thepartial correlation.
The plant studied is a loop-type LMFBR plant. Cooling of the nuclear reactor coreduring normal operation is accomplished by three heat transport system loops. Eachheat transport loop consists of a primary heat transport system (PHTS) loop, an
intermediate heat transport system loop. and a water and steam system loop.Maintenance of the reactor sodium level is necessary to ensure coolant circulationpaths. which transport decay heat away from the core. This function isaccomplished by the overflow/makeup system and the PHTS guard vessels. Decayheat removal in this plant is accomplished by either the intermediate reaClOr
auxiliary cooling system (lRACS) or the direct reactor auxilary cooling system
(DRACS). The IRACS can remove decay heat successfully through one-Ioop operationimmediately by either forced or natural circulation following a reactor shutdown.
The DRACS can successfully remove decay heat following a reactor shutdown.Reactor power reduction is required to make the reactor subcritical and reduce thepower generated in the core to decay heat levels. This function is accomplished by
the reactor protection system.
- 306-
2. LOCATION-DEPENDENT FAIURE ANALYSIS
2.1 QUANTITATIVE SCRENING ANALYSIS
A location-dependent failure is defined as an event in which two or morecomponents fail either as a result of some harsh environments or because one
component failure results in a harsh environment which causes other components
to fail. The types of dependent failures of interest in an LMFBR are those which
affect system redundancies or diversities. A comprehensive list of potential harshenvironments was first prepared considering the characteristics of LMFBR. In orderto limit the location-dependent failure task to a manageable and yet significant level,it was decided to concentrate on the harsh environments deemed potentially most
significani. Available sources on historical dependent failures and events which
were identified as having had the potential for dependent failures were reviewed.
Over 4000 events(4),(5) were screened; 235 events were selected as actual or potential
dependent failure events. The types of location-dependent failure events applicable
to an LMFBR are summarized as folIows:
(1) Leak of water/steam/freon
(2) Leak of sodium
(3) Inadvenent actuation of water sprinkler fire suppression system
(4) High energy line break causing pipe whip
(5) HVAC fan missile(6) Fire
The SETS(3) location transformation analysis technique is used to solve accidentsequence cutsets in terms of combinations of random failures and zones. Theresultant accident sequence cutsets are analyzed further to identify exactly which
components within the zones must faH. The first pan of the SETS analysis, solvingfor accident sequence cutsets in terms of random failures and zones, is termed the
critical zone analysis. The second part of the SETS analysis, determining the basic
event cutsets within the critical zones, is termed the underlying cutset analysis.
- 307-
In the SETS critical zone analysis, each basic event in a fault tree is transformed intoboth a random failure and a zone representing the location of the component. if Arepresents the basie event~ then the transformation equation is the following:
A = AX + /Zl,
whereAX = transformed representation for the random failure/Zl = zone in which the event A is located
(l )
The "X" is used to avoid circular definitions, which the "j" is used so that randomfailures (AX in the example) and zones (Zl) may be distinguished. Such distinction isrequired in order to be able to truncate cutsets both by the number of random eventsand by the nu mb er of zones. Transforming all applicable basic events ¡nto random
and zone contributions and resolving the accident sequences with SETS, cutsetsinvolving random failures and rooms may be obtained. A cutset involving a singlezone indicates that there are components within the zones which, if failed, would
result in core damage. Similarly, a cutset involving a single random and a singlezone indicates that there are components within the zone which, if failed and
combined with the single random failure, would result in core damage.
Once the critical zone cutsets have been identified with the SETS code, - the analysis ofunderlying eutsets can be performed. For each critical zone identified, the basicevents within a loeation only were transformed in the following fashion:
A=/AX (2)
The events are eomplemented to identify that they are within the location ofinterest.
The methodology for evaluation of potential location-dependent failures resultingfrom each initiator involves four steps:
( 1) Identification and quantification of harsh environment sources(2) Screening analysis for initiator as an initiating event(3) Screening analysis assuming initiator during the mission time(4) Refined underlying cutset analysis as required
- 308-
The quantitative screening analysis is performed under the assumption that all thesusceptible components in the location fail. The screening process attempts to rule
out cenain sequences and certain critical zone cutsets without detailed analyses ofharsh environment effects on components. The result indicales that the effect offire is the largest among the above external events and the funher fire analysis isrequired.
2.2 FIRE ANALYSIS
The methodology used in an LMFBR probabilstic fire event analysis consists of threeseparate tasks:
(i) Identification of all potential fire-initiated sequences (both sodium andnonsodium) inducing failure of the decay heat removal system
- plant systems analysis
(2) Identification of critical areas containing the decay heat removal systemcomponents - fire-hazard analysis(3) Determination of core damage frequency as a result of fire-initiated failure of
the decay heat removal system - fire-propagation analysis
Compared with light water reactor (LWR). fire-induced loss of coolant accidents areextremely unlikely in an LMFBR design and are not analyzed. A fire can potentiallyinduce any of the random transients. The most likely transient would be a manual
scram initiated because of presence of the fire. Such a fire-induced transient isimponant to risk only if it also fails mitigating system equipment. Therefore. for an
LMFBR fire study. a fire involving the decay heat removal systems or their supportsystems is assumed to result in at least a manual reactor shutdown.
The identification of critical plant areas is accomplished using the SETS location
transformation analysis described before. The resultant critical area to fire event is
a room which includes electrical equipment and related cables for actuation and/orcontrol of the decay heat removal system.
Potential fire scenarios in the LMFBR are modeled using fire event trees. The eventtrees consists of the Jollowing headings: ignition. detection. suppression.
- 309-
propagation. and recovery. The branches of the tree and their associatedprobabilties represent a possible outcomes of the fire scenario.
The frequencies of fires are obtained by the analysis of historical data. Because ofthe lack of information on fire occurrences in LMFBRs and Japanese LWRs, the V.S.LWRs data(6) is used in this study. The failure probabilties of the fire detection areprepared for smoke / heat detector and detection by the plant personnel depending
on the location. The propagation of the fire is dependent on the characteristics ofthe fire area. Fire growth and propagation analysis are performed using the
COMPBRN-III code(7). The thermal response of various targets in the fire scenario ismodeled to predict the threshold of the propagation in the fire size and the amount oftime required for the fire to damage or ignite critical equipment. The probability of
propagation is estimated based on the resuIts of COMPBRN-lll code. Recovery istreated in a similar fashion as in the intemal event analysis. The human reliabilityanalysis provides the probabilty of recovery based on the type of recovery and
grace time.
Dominant contributors to loss of the decay heat removal system are combinations of
the electrical component failures within the electrical panels due to hot gas layer.
3. SEISMIC EVENT ANALYSIS
3.1 SEISMIC HAZAR ANALYSIS
Seismic hazard curves and spectral shape have been evaluated using the seismic
activity data around the plant site. Two different methods are adopted for estimating
the seismic hazard curves. One is based on Gutenberg-Richter's (G-R) relationobtained from historical earthquake data and the other on the earthquake fault
activity from active fauIt data.
To utilze the historical earthquake data, six seismotectonic zones are identified
around the plant site. One can obtain the probabilty density function ofhypocentral distance, fXk(X) for each zone k. Annual frequency of earthquake
occurrence (Vk) with the magnitude Mi or above is calculated with the G-R relationas follows:
- 310-
logvk = a - bMI(3 )
where a and bare empirical parameters in the G-R relation and are determinedbased on the historical record of earthquakes. Upper magnitude M u and 10wer
magnitude M I are defined to evaluate of the parameters a and b. Mi is based on theminimum earthquake recorded in the history which caused any damage. Potentiallymaximum magnitude can be predicted from either the historical earthquake or thecharacteristics of active fault. The greater value of them is assumed to be M u foreach seismic zone. The probability density function of magnitude IM k (m) is also
calculated using the G-R relation.
Attenuation of the peak ground acceleration (PGA) a is evaluated based on the
observation of the historical earthquakes in Japan. Six empirical equations out ofeighteen are selected to be appropriate for the rock site and the average value is
used in this study. However, in the phenomenological process of propagation and
attenuation of the seismic wave, PGA observed at the site is subject to uncertainty.Thus a is regarded as a random variable having lognormal distribution, IA (a) withthe logarithmic standard deviation ß.
Combining these quantities. one obtains expected annual number of earthquakes
wh ich PGA is equal to or greater than a, as folIows:
v(a) = L J f vifA(alm .x)IMk(m )/Xk(x)dmdxk x m (4)where k relates to the summation with regard to the seismic zones.
Next, a method to establish the hazard curves based on the active fault data isdescribed. More than 300 active faults are investigated which are located within 150km distance from the site. The relations between the magnitude and active fault
length Land magnitude and slippage d caused by each earthquake are given by:
logL = 0.6m - 2.9 (5 )
logd = 0.6m- 4.0(6 )
respectively. Vk is evaluated using the annual mean slippage S. i.e. Vk=S/d.
Therefore, v( a) is calculated by:
- 311 -
v(a) = Lf4. vl:!A(alm,x)dlk 0 I(7 )
where Lk is the length of the k-th active fault and the summation is performed in
terms of the number of active fault.
Now, assuming Poisson's process, one evaluates the annual probability of exceedance
(the probability that the PGA of an earthquake is greater than a specific value a), asfol1ows:
P(a) = 1 - exp( -v(a) L(8 )
where P( a) is the annual probabilty that PGA of an earthquake exceeds a.
Imponant points in the discussion are the maximum PGA (that is upper cut-offvalue) and the uncertainty of the PGA attenuation in terms of logarithmic standard
deviation ß. Since the research regarding this topics is under way and it is difficultto make a judgement for point estimation presently, sensitivity analysis is to beemployed. In other words, lwo values for ß (=0.5 and 0.7) and A max (=1,000 gal and
infinite) each are assumed. The value of A max is determined based on bothphenomenological and empirical investigation. ß is based on the results of the paststatistical ana1yses of PGA data observed in Japan. The sensitivity of the parametersto the final results (such as annual frequency of core damage or systems failure) is10 be investigated by the systems analysis as described in section 3.3.
It is a matter of course that neither data sets reflect the complete seismic sources.
However, what is important in the viewpoint of seismic PSA is 10 derive the bestestimate hazard curves and to employ the sensitivity calculation in the area wherethe physical models and the parameters are subject to uncertainties. In the present
study, i.t has been found that both hazard curves are in agreement with each other.As long as both approaches give similar results, one may consider the hazard curvesanalyzed are the best estimate on the basis of the current state-of-the-art.
The spectral shape S a (T) as a function of period T is defined as the acceleration
response spectrum normalized by the PGA value. Assuming that the probabilitydensity function of SafT) is lognormal, the median and logarithmic standard
- 312-
deviation are to be evaluated. 5inee S a (T) is dependent on m and x, the following
equation was proposed:
InSø(T) = a(T)m - b(T)x + c(T) (9)
where arT), b(T) and c(T) are obtained by regression analysis of earthquake motions
observed in Japan. Joint probabilty density funetion of x and m,f(m,x/a), when PGAis given, ean be obtained usingfMk(m) and fXk(X). Therefore, the median and the
logarithmie standard deviation of the speetral shape are obtained by:
InS(Tla) = f. f. InS(Tlm ,x)f(m ,xla)dmdx(10)
ß2(Tla) = J. f. (InS(Tlm ,x)-lnS(Tla)) 2f(m ,xla)dmdx
(11 )
3.2 FRAGILITY EVALUATION
The entire fragility eurves, whieh represent seismieaIly-indueed failure
probabilties at eaeh ground aeeeleration level, are developed for the major
buildings and equipment of the plant based on the safety faetor method.(8) The
ground aeeeleration eapaeity A is given by:
A=AmEREU (12)
where Amis the best estimate of the median ground aeeeleration eapaeity. ER and EU
are random variables with unit medians representing the inherent randomness
about the median and the uneertainty in the median value, respeetively. The safetyfaetor F on PGA eapaeity above the referenee level earthquake speeified for thedesign (52 earthquake) is expressed as:
A=FAs2 (13)
. where A S2 is the PGA level for the 52 earthquake.
For struetures, the safety faetor ean be modeled as the produet of three randomvariables:
F=FsFp.FRS (14)
- 313-
where F s is strength factor. F ¡i is inelastic energy absorption factor. and F RS isstructural response factor. For equipment and other components. the safety factor
is composed of capacity factor Fe. structural response factor F RS and equipmentresponse factor FRE. Thus.
F=FcFREFRS (15)
The seismic fragility of s.tructure or equipment is defined as failure probability oncondition that an earthquake occurs. The fragilty is a function of the intensity ofthe earthquake and our degree of belief. Q. regarding median capacity . Am. Thedouble logarithmic normal distribution model is widely used to describe the seismic
fragility curves. Using the PGA a as the intensity parameter. the seismic fragility isexpressed as the following equation:
Pr(a;,AIQ) = ii.. n/ a )~-lßR \Amexp( -ßuø'I(Q)) ~ (16)
where ß Rand ß u are variabilities of the fragility associated with randomness (eR)and uncertainty (eu). respectively. ø (.) is the cumulative normal distribution
function and ø-l(o) is its inverse function. Q lies between 0 and 1.
Selected buildings for the structural fragility evaluation are the reactor buildingwhere most of the he at transport system components are involved. the auxiliarybuilding where decay heat removal system and support systems are installed. thediesel generator building. the containment vessel and the screen pump room whichprovides the support cooling systems with the sea water as the ultimate heat sink.The standard deviations of the floor response spectra are also calculated using Monte
Carlo simulation. The results are used in the seismic fragility (structural responsefactor) analysis of the equipment.
Since the systems in the LMFBR plant differ significantly from those in LWRs. thedominant contributors to seismic risk may not be typical of those most common forLWRs. So the design analysis and the testing data for design basis earthquake wereused to quantify plant-specific seismic fragilities of the structures and equipment.
The numerous components are relating to the safety functions and are included inthe systems analysis modeL. Hence it is not practical to evaluate the plant-specific
- 314-
fragilty for every component. Generic fragility curves are evaluated based on thefragility parameters which were used in the precedent seismic PSAs. For theequipment with less importance and/or common to that in LWRs. the g.eneric
fragilities are used in principle. For some dominant contributors to the results.
however. fragility parameters were modified using a Bayesian methodology(9). This
approach is based on seismic experiences in non-nuclear industry or engineering
judgement derived from the comparison of the same equipment class of the LMFBRand LWRs sited in high seismic zone.
In the LMFBR plant under seismic circumstances. it is noted that decay heat can beremoved by natural circulation if no boundary failure takes place. In the naturalcirculation mode for decay heat removal. support systems such as AC power supplyand HVAC systems are not necessary except DC battery which supplies power to opensodium valve and vane and damper of dumped heat exchanger when they are ondemand. Therefore. the fragility of the coolant boundaries which compose decay
heat rem oval systems were focused on.
From this viewpoint, a methodology to consider the importance of multiple coolantloop failures was developed by assessing the partial failure correlation betweenthree heat transport loops .(10) The resultant failure probability and the fraction ofthe common mode failure at various acceleration levels which have been evaluatedare used as input for systems analysis to quantify the seismic risk.
Sensitivity studies for the annual frequency of seismically induced failures on theplant or system level were conducted using the site-specific seismic hazard curvesand generic and plant-specific fragilities. From this simplified sensitivity study. theimportant equipment is identified for which the fragility estimation is to be updated.
Based on the sensitivity study. equipment that needs further refinement ofstructural response analysis and fragility evaluation has been identified. It has
been found that some structural components consisting the coolant boundaries anddecay he at removal system and electrical equipment such as batteries and electricalpanel are relatively sensitive. In accordance with the recommendations, current
efforts are centered on the stochastic structural response analysis and fragil ityevaluation of the functional failure of such equipment.
- 315-
3.3 SYSTEMS ANALYSIS
Seismic event trees are constructed taking into consideration for plant responses
given large earthquakes which exceed design-basis earthquake. In addition an
event which does not require the event tree is considered because it leads to coredamage directly. Such an event includes reactor vessel failure or core supportstructure failure. The resultant event trees are reactor trips assuming loss of off-sitepower, PHTS leakage within guard vessel, PHTS leakage outside of guard vessel, andDRACS leakage. The event tree headings consist of essential safety features whichachieve the safety functions of the reactor power reduction, decay heat removal and
maintenance of sodium leveL.
The fault trees developed for the internal events analysis are used diiecdy with
seismic transformation equation. If A represents the basic event, the
transformation equation is the following:
A=AX+AS, (17)
whereAX = transformed representation for the random failureAS = seismic induced failure
For an electrical component within elecirical panel, the seismically induced failuresare modeled by the panel failure as well as the component failure. In addition astructure or building failure event may be added as a seismic specific event, ifneeded.
The probability of AS varies with the PGA. Sequence minimal cutsets are solved foreach acceleration level based on the system combinations identified event trees. The
quantification of accident sequences for each acceleration level is performed using
component fragility data. These accident sequences are the function of the PGA andare de-conditioned by integrating each accident sequence over the hazard curve.
Recovery by the plant personneJ is only taken into account for non-seismic failureevents.
- 316-
The experiences show that inclusion of system success .is essential, since theprobability of system success decreases substantially as the PGA increases. In anLMFBR the decay heat can be removed by natural circulation even in the sequenceof total blackout Therefore the integrity of reactor coolant boundary and the safety
function for the maintenance of sodium level become more important.
4. CONO-USION
A comprehensive extemal events analysis for the LMFBR plant has been conducted
in constructing probabilistic models in order to evaluate the overall. plant safety.The quantitative screening analyses which identify dominant sequences on thefollowing location-dependent failures were conducted: leak of water/steam/freon,
leak of sodium, inadvertent actuation of water sprinkler system, high energy linebreak causing pipe whip, and fire. The seismic hazard analysis, the floor responsespectra analysis, the seismic fragility evaluation for LMFBR-specific
structures/equipment as well as the one for various types of structures/equipment
important to. safety and seismically induced systems analysis were also conducted.
Useful insights are obtained from those analyses and wil be utilized to establishrationalized safety design policy for LMFBRs and optimized allocation of limitedresources (man power and fund) to various safety research programs.
PNC is continuing to improve modeling for evaluation of the effects of the externalevents as well as 10 develop the relating database in order to reduce the uncertaìnties
in the analyses. Those efforts to minimize the uncertainties will enable betterutilization of the full scope PSA in the various areas.
RERENCE(I) Aizawa, k., Kani, Y., Nakai, R., Hioki, K., Sakuma, T., Ohshiro, S., Okazaki, S. and
Tokunaga, T., "Parameter and Model-Uncertainty in PSA for an LMFBR Plant,"Technical Committee Meeting on Advances in Nuclear Power Plant RiskAnalysis, Vienna, Austria, September 1986.
- 317-
(2) Yamaguchi, A., Nakai, R., Kani, Y. and Aizawa, K., "Current Status of Seismic PSA
Study on LMFBR at PNC," International Post-SMiRT 10 Seminar #9, Irvine, USA,August 1989.
(3) WorreIl, R. B., "SETS Reference Manual," NUREG/CR-4213, 1985.
(4) Murphy, G. A., "Survey and Evaluation of System Interaction Events andSources," NUREG/CR-3922, 1985.
(5) Acey, D. L., Chapman, J. R., and LydeIl, B. O. Y., "Classification and Analysis ofReactor Operating Experience Involving Dependent Events," EPRI NP-3967,
1985.
(6) Bohn, M. P., Lambright, J. A., "Procedures for the Extemal Event Core Damage
Frequency Analyses for NUREG-1150," NUREG/CR-4840, 1990.
(7) Ho, V., Siu, N., Apostolakis, G., and Flanagan, G. F., "COMPBRN-II - A ComputerCode for Modeling Compartment Fires," NUREG/CR-4566, 1986.
(8) PRA Procedures Guide: "A Guide to the Performance of Probabilistic RiskAssessment for Nuclear Power Plants," NUREG/CR-2300, January, 1983.
(9) Yamaguchi, A., et al., "Bayesian Methodology for Generic Seismic Fragility
Evaluation of Components in Nuclear Power Plants," to be published in Proc. ofSMiRT-ll, Paper M4/3, Tokyo, August, 1991.
(10) Yamaguchi, A., "Seismic Fragility Analysis of the Heat Transport System ofLMFBR Considering Partial Correlation of Multiple Failure Modes," to bepublished in Proc. of SMiRT-ll, Paper M4/Z, Tokyo, August, 1991.
- 318-
POSSIBILITIES AND LIMITATIONS OF PROBABILISTIC FIRE SAFETYANALYSES ILLUSTRATED BY ANALYSES IN THE GERMAN RISKSTUDY
by H. Liemersdorf
Gesellschaft für Reaktorsicherheit (GRS) mbH
Cologne, Federal Republic of Germany
To be presented at the OECD/BMU Workshop on "Special Issues ofLevel 1 PSA", Cologne (FRG) May 27th til 29th, 1991
- 319-
Possibilties and Limitations of Probabilstic Fire Safety
Analyses iIustrated by Analyses in the German Risk Study
1 Introductions and Background
Actually in Germany and abroad a uniformed and harmonized approach tor probabilstic tire
safety analyses tor nuclear power plants is not available. For that reason the GermanPSA-Procedure-Guide does not have any descnption tor tire events. Due to this tact German
PSA-Studies carned out systematically do not include fire safety analysis up to now.
However, nsk studies for nuclear power plants in USA show that the risk contribution due to an
internat tire can be of importance. Theretore, probabilstic tire satety analyses are necessary
within the scope of PSA-Studies on principle. But there is a need tor discussions to come to
an agreement tor the procedure.
It is the aim of this paper to give a review about the problems in connectíon with probabilistic
tire safety analyses illustrated by analyses carried out in the German nsk study /1/. Referring
to that possibilities and !imitations of probabilisticJire safety anaylses should be indicated.
2 Approach of the Risk Analysis.
The effects of fires in a nucleai' power plant may range from the usual conventionat
consequences such as 1055 of production and 1055 of property to the release of radioactive
substances from auxilary equipment to a core meltdown. Within the scope of Phase B of the
German Risk Study, only such fires are investigated as can initiate a core meltdown. As
compared with such events, it is possible to neglect the risk contntbutions resultíng from tires
involving radioactively contaminated materials at the nuclear power plant.
For that reason it is to be suffcient for PSA-Studies to analyse only tires being relevant for the
reactor safety.
Furthermore, only tires with overlaping consequences tor systems and redundancies can be
regarded.significant. .ThatmeansthataJocaIJirewhichis...bounderedtoasinglecomponent,
- 320-
e.g. a smouldering tire at an electrical engin, has not to be considered. Such local fires are
implicated in the reliabilty analyses by the components failure rates.
When analyzing the eflects 01 fires. the first step is to determine the compartment areas where
major fire loads and safety-related systems are located. Apart trom the actual firecompartment, the determination also includes adjacent compartments if the fire may encroach
upon these.
For the compartments selected, the course of the fire is investigated by means of a fire specific
event tree analysis. For reducing the amount of analyses an additional reduction of the number
01 compartments is necessary. With respect to this. qualitative or quantitative procedures are
possible. In the German risk study both have been done.
For the fire specilic event tree analyses, Fig. 1 shows a simplilied event tree diagram. Based
on the consequential fire damage determined to have been caused to the salety-related
systems, and also based on the respective frequencies, the system-specific event tree
analysis is performed.
Because 01 the Iimited database available for the plant investigated, generic data were used
tor the determination 01 the fire occurrence Irequencies. In this context, statements conceming
the frequency 01 li res in nuclear power plants are available as mean fire occurrence Irequency
per plant and year and as compartment and building-specific fire occurence frequencies.
From a comparision 01 US lierature on the mean fire occurence frequency per year and plant,
a mean of 0.17 fires per year and plant is derived for US light water reactors /21.
Special data for nuclear power plants in the Federal Republic of Germany are not available to
a similar extent because of the smaller number 01 plant operating years as compared with the
United States. However. the evaluation 01 the data available /3/ permits the conclusion that
there is not major diflerence in fire occurence frequencies in nuclear power plants in the
Federal Republic 01 Germany and the United States.
The Study used the lire occurrence Irequency 01 0.17 fires per plant and year which had been
determined. Furthermore, it was assumend that it wil be possible to use the US
compartment-specific data lor nuclear power plants in the Federal Republic 01 Germany,
¡:r()~~i£l~£IJ~~r~is~ri()rr~j2!..Qifl~r~rig~~~~t'!~i:!l!t:i:J?LIJlclirifts¿inC:.QL~~Q.mp~i:rii:r:t§.~§~l~LJ:iS
- 321 -
their funetions and iayouts, the types and quantities of eombustible materials and the potential
ignition sourees are coneemed.
The fire-speeific event tree analysis distinguishes between a pre-flashover phase and a
post-flashover phase. The intensity which a fire develops is determinded by the quantity, the
arrangement and the properties of the eombustible materials as weil as by the size .and
ventilation conditons of the fire compartment. The ventiation conditions, in tum, depend on
the position of the ventiation and/or fire dampers and on fire doors at the beginning and in the
coures of a fire and on their fire proteetion quality (ventiation and eompartment isolation).
The deeisive faetor for the aetual development of a fire is the point in time at wich the fire is
deteeted by the operating personnel and/or by fire detection equipment in the fire compartment
(direet fire alarm) and. the point in time at whieh it is fought by active fire .extinguishing
measures (direet fire fighting). Even if the fire is afready extinguished during the pre-f1ashover
phase, systems aceommodated in the fire eompartment may fail. This will always be the ease if
parts of a system are involved in the fire, or if the temperature limits to be adhered to by
system are exceeded.
A fire alarm mayaiso be effected by fire detection systems in adjacent compartments or by the
deteetion of system failures (indirect fire alann). However, this ean only be antieipated during
the post-f1ashover phase. The active fire fighting measure during the post-f1ashover phase
mainly aim the prevention of a further propagation of the fire and at the protection of vulnerable
systems in adjaeent compartments (indirect fire fighting). Whether or not systems in adjacent
compartments wil also fail mainly depends on the fire protection quality of the eompartments
during a fire and on whether they wil function proper1y (fire zone limitation). If eompartment
and/or ventiation isolations such as a fire door are open, or if the fire restistance rating of
these struetures is insuffieient, the fire may eneroach upon adjaeent compartments if fire
fighting does not start in time.
The failure probabilties to be inserted at the various fire-specific branehes of the event tree
diagram may depend on the time and on the course of the fire itself. The main aspects in this
context are the development of the temperatures in the respective eompartmentareas where
the safety-related systems are located and the temperatures whieh have 10 be expected there.
In this eontext, Fig. 2 is a schematic representation of the compartment temperature time
~i~ti:l).il~~t~~fir~~!õi:~ifi~~y~rlt..~~9~~~~~:....
- 322-
Depending on the sueeessfully isolation of the ventialtion (elosing of dampers in the ventilation
system or of fire doors) at the time ~. two fire sequenees land 11 are possible. Fire fighting may
start at different times. Tk means the eritieal temperature of the safety related equipment.
The sehematie representation of the fire sequenees in Fig. 2 may be more eomplex in reality.
For this representation. the temperature inerease and the expeeted temperature level in the
respeetive eompartment areas have to be determined.
For that reason expensive eodes with a more eomplicated fire modeling are necessary in
general. Depending on the variation of the possible boundery eonditions (e.g. type, amount
and loeation of the fire load and the ventilation) the results of the calculations are different
temperature-time-histories with different eonsequences for safety related equipments. In
general. a correlation between the oceurenee frequeney for a partieulartemperature-time-history and the oceurence frequeney of a fire determined statistieally can not
be found. Therefore the probabiliies for the different temperature-time-histones have to be
estimated. The uncertainties of these determinations can vary.
With respeet to the fire effeets ealculated, it should be examinded, whether an inlluence on
the failure behavior of the respective safety-related systems has to be ånticipated and, thus,
whether failure probabiliies which depend on the fire sequence have to be taken into
consideration. Finally, the result of the fire-specitic event tree analysis is the frequencies 01
consequential fire damage involving a failure of safety-realted systems. In Fig. 1, the
consequentail fire damage is marked 1, 2 and 3.
Thefollowing event tree analysis in terms of systems engineenng analyzes the influence of the
fire-related system failures onthe overall behavior of the existing safety systems. In this
context, system failures which are independent of the fire are taken into consideration provided
the contribution to be anticipated eannot be neglected. This is the case. for example. if due to
fire-related failures there is only a single redundancy available of a system whieh is important
in terms 01 safety.
In general, failures of components due to a fire lead to transients which wil be usually
lnvestigated in PSA-Studies. Therelore. the same event tree or fault tree diagrams can olten
be used. However, has to be considered, that, due to the fire sequence a lot of components of
different systems and redundancies can faU and that these failures are correlated with the lire
~~qlJ~l1ce.
- 323-
For components and systems outside the fire areas, no fire-related influence, e.g. bycorrosion or temperature is postulated in the analyses of the German risk study. In particular
cases such influences could be important.
3 Results of the fire risk analysis for the NPP Biblis B
The results are:
· Frequency for plant condition not coped with by design safety systems (accidentmanagement measures not considered) due to an intemal fire:
1,7E-7/a
The figure 1,7 E-7/a represents a contibution of less than 1 % to the total frequency of such
plant conditions analyses in the study (2,9 E-5/a over all events)
· Under consideration of accident management measure the core melt frequency due to an
internal fire is estimate to:
high pressure conditions: 1 E-8/a
(represents a contribution of less than 2% of the total core melt frequency under this
conditions)
low pressure conditions: 1 E.7/a
(represents a contribution of 4 % of the total core melt frequency under this conditions)
4 Findings for possibilties and limitations of probabilstic fire safety
analyses
· Delimitation of fire areas have to be investigated in detail
It is necessary and convenient to reduce the amount of investigations in detail. Therefore,
an approach has to be made reducing the number of fire areas or fire compartments which
have to be analysed as far as possible.
In a first step qualitative criteriacan be used:
- 324-
amount of fire load
importance of the safety of the equipment
number of redundant systems and their
physical separation for fire
quality of fire protection
Findings from detenninistic safety analyses are also helpful in this context.
The number of fire areas or compartments selected in that way can be reduced once more
in a second step by using representative areas for a lot of areas with simular fire
sequences and similar consequences on safety related equipments. However, in. this
cases the number of the simular areas must be considered in the total evaluation.
In third step (or in case with start of the analysis) of reducing the numbers of fire areas
quantitative procedures are available (e.g. in /4/). Usually, that means simplified, rough
probabilstic analyses for the detennination of fire spreading with simple estimalions for the
fire effects and the reliabilty of fire protections measures.
. Detennination of the fire occurence frequency
For the analyses in detail, compartment-reláfed data wil be needed in general. In some
cases there is a need for plant specific data to evaluate a particular fire scenario inside a
compartment. In practice, plant specific data are not available (due to the low number of
fire incidents). Compartment-related data are available on the basis of generic data. These
data can be used in general, sometimes however a modification is necessary.
If there is a need for a fire occurence frequency for a particular fire scenario inside a
compartment. e.g. an oil fire depending on the volume of a oil leakgage, generic data can
be problematic. In this case an estimation by modeling the situation In the plant is better
for getting realistic data. But it is difficult to evaluate the uncertainty of such an estimalion.
. Detennination of fire effects
On principle time.dependent values of
temperature
pressure
- 325-
concentration of corrosive
or toxie fire products
are necessary for the fire compartment or in case for adjaeent compartments. But in
general, thermal effects cause the equipment failure. For that reason, the knowledge about
the possible temperarture-time-histories has to be mostly sufficient. For the probabilstic
evaluation it is important to evaluate the probabilty of the different possible
temperatu re-time-histories.
The expense beeing necessary for the theoretical determiation of fire effeets depends on
the kind of consequences. For a lot of fire events only the possibilty for a fire spreading to
the next compartment is important. Therefore in general a. calculation with a relatively
simple "single-room postflashover fire model" is suffieient. If the fire speading or the loeal
distribution of temperature inside a compartment (e.g. cable spreading room below the
control room) or between rooms whieh are not separated (e.g. containment) are important
a more complex "multiple-zone or multiple-room fire model" is necessary. Such models
have to describe the preflashover phase of a fire, too. To some extent codes are still
under development.
· Reliabilty data for fire proteetion measures
It is to differentiate between
structural fire precaution measures, e.g. walls, fire doors, dampers in ventiation systems
and cable or pipe penetrations through fire barriers,
Technical fire protection measures, e.g. fire detection systems, stationary fire fighting
systems and systems for water supply and
operational fire protection measures, e.g. manual fire fighting by plant personel or a fire
bngarde.
For the struetural fire precaution measures statistical data for the fire resistance are
available resulting form standard fire experiments. With these data, the failure probaility for
reaching the nominal fire resistance can be determined. In the PSA the caleulated
temperature-time-curves have to be transfered to the results form standard fire
experiments. Therefore one possibilty is the transfer of the "time-integral", of the real
temperature-curve to the standard-fire-curve for the determination of an "equivalent fire
resistaneed:.
- 326-
For fire doors and fire dampers is to be considered that the reliabilty is also influenced by
other criteria (technical failures or human factors).
The reliability of technical fire protection measures can be determined by a special
fault-tree-analysis. An example is shown in Fig. 3. If no data from nuclear power plants are
available (e.g. only form conventional industry) the reliabilty wil be estimated too low in
general. To some extend plant specific data determined by the evaluation of results of
systematical checks of fire protection measures are available.
If stationary fire fighting systems wil be actuated manually the reliabilty of the actuation
and the time delay from the fire detection time unti the time of actuation mainly influence
the total reliability.
For the effectivity and the reliability of the manual fire lighting in nuclear power plant no
certain databasis is given up to now. However, operational experiences show that a lot of
fires have been fighted succesfully in the ignition phase by the plant personel or in a later
phase by the fire brigade. On the basis of US data /31 the non-availabilty of manual fire
fighting have been estimated with a value not bette~ :'", 3 E-1 per demand depending on
the time delay between fire detection and fire fighting oy the fire brigade.
. Failure criteria of safety-related equipments
It is to differentiate between
electrical equipments (e.g. cables, switchgears, instrumentations, electrical engines and
electronics) and
mechanical equipments (e.g. tanks, pipes, pumps, valves)
and for the mechanical equipments also between integrity and function. In German studies
11 ,31 the component temperatures have been used as a failure criterion. (Fig. 4). The
failure temperatures as shown in Fig. 4 are only rough values with many uncertainities. But
the experiences of the studies have shown that in most cases the component
temperatures determined differ from the failure temperature (above or below) of a large
difference. In these cases the uncertainty of the failure temperature does not have any
influence on the results. In other cases, where the distance between the component
temperature and the failure temperature is very smalI, the uncertainty can be reduced bya
specific investigation of the component
- 327-
REFERENCES
/1/ Gesellschaft tür Reaktorsicherteit (GRS) mbH,
Deutsche Risikostudie Kemkrafterke Phase B,
ISBN: 3-88585-809-6, Verlag TUV-Rheinland,
Köln,1990
/21 G- Apostolakis, M. Kazarians,
Fire Risk Analysis tor Nuclear Power Plants,
NUREG/CR-2258, Sept. 1981
/31 Gesellschaft für Reaktorsicherteit (GRS) mbH,
Optimierung von Brandschutzmaßnahmen und Qualitätskontrollen
in Kernkraftwerken,
ISBN 3-92387-10-X, GRS-62, Sept. 1985
141 Nuclear Power Plant Fire Protection
Fire Hazard Analysis -
NUREG/CR-0654, Spet. 1979
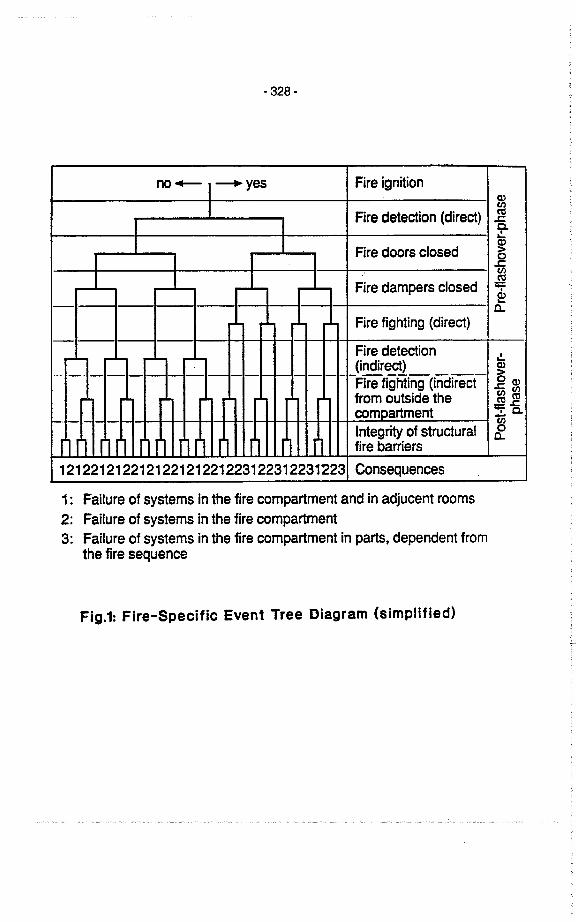
- 328-
nO~I~yes Fire ignition
Cl
IlJ
Fire detection (direct) ~I I
~c.I I
~Fire doors closed gz
I I I I0~
I I r. r. lJ~Fire dampers closed ;;
è1 L J. 1
~Fire fighting (direct)
i. i. Fire detection i
(indirect)"-Cl
--- _. -- ---1---- -- ::- Fire figiiing (indirect- o Cl
~ lJfrom outside the lJ ~
l2 .J
compartment .. c.- - -1- ëiIntegri of structural
0
r r 1 r 111 r 1 11 (1 i 1 r1 r
c.fire barriers
121221212212122121221223122312231223 Consequences
1: Failure of systems in the fire compartment and in adjucent rooms2: Failure of systems in the fire compartment3: Failure of systems in the fire compartment in parts, dependent from
the fire sequence
Fig.1: Fire-Specific Event Tree Diagram (simplified)
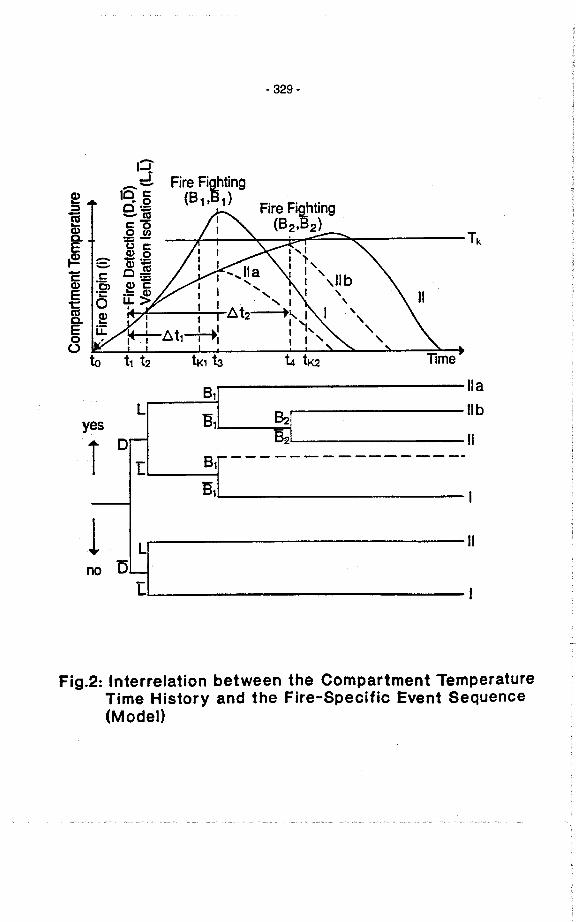
- 329-
I:r.. Fire Fiihting--e 10 c: (81, 1)- 0
Fire Fi~hting~ 0;;ë - a:c: - i
(82, 2)Cl o ß 1C. 13 ë TkE~ Cl 0
E: ëi :.- o.~c:e 'ECl
E ._ Cl1: U. ~ 1 I " iCI . i 1 t: t2--i- i Ic.E i I I i "0 ~ t: t 1--1ü
tK1 'b 4 tK2
81L
es 131 ~I0- 821
I 81.. - - - - - - - - - - - - - - --
'S1
L
0 n_i
lIa
IIb
11
y
T
1 11
n
Fig.2: Interrelation between the Compartment TemperatureTime History and the Fire-Specific Event Sequence(Model)
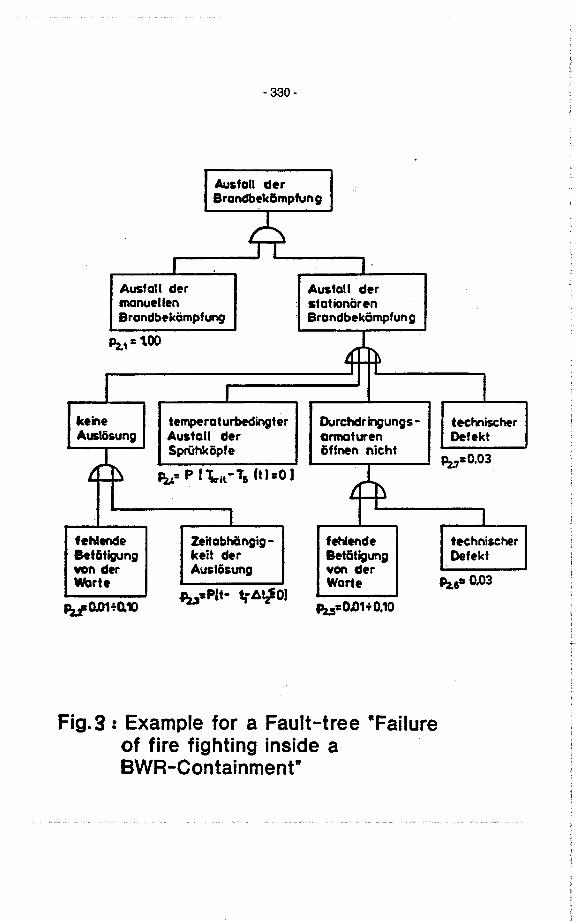
- 330-
Ausfall derBrandbekömptung
4rI
Ausfall der Ausfall dermanuellen stationärenBrandbekämpfun Brandbekämpfung
~,=1004 ~
I II
keine te~ratu~~ter Durchdr inungs- technisherAusöwng Ausfall der armturen Defekt
L:Spruhköpfe öffnen nicht
Pz,=0.03~ Pi= P l\rii-T, (tJ=O i L~
i I
fehlene Zeitabhängig - fehende technischerBetätigng keit der Betätigung Defektvon der Auslösung van derWarte Warte Pii= 0.03
-PU- -l: ~o)~o.1+o.1) lU t¡ y
PutiO.oH 0,10
Fig. 9 : Example tor a Fault-tree -Failureot fire fighting inside a
BWR-Containment"
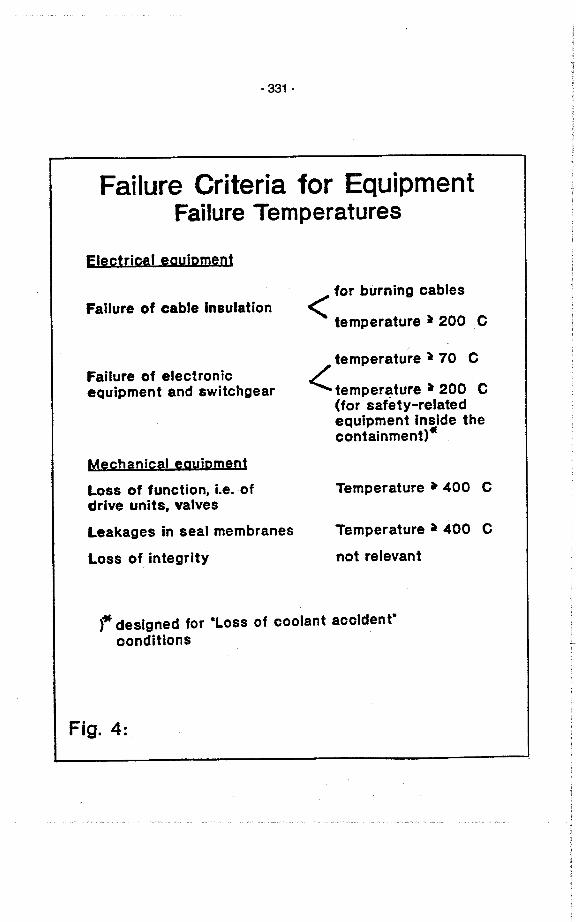
- 331 -
Failure Criteria for EquipmentFailure Temperatures
Eleetrjoat egujpment
Failure 01 cable Insutation
Failure of eleetronieequipment and switehgear
Meehanieal egujpment
Loss of function, te. ofdrive units, valves
Leakages in seal membranes
Loss of integrity
c( for burning cablestemperature ~ 200 C
temperature ~ 70 C
~ temperature ~ 200 C(for safety-relatedequipment inside thecontainment)-
Temperature . 400 C
Temperature . 400 C
not relevant
)* deslgned for -Loss of coolant accldentWconditlons
Fig. 4:

- 332-
SEISMIC ASSESSMENT FOR N.P.P. ACCORDING TO ITALIAN PRACTICE
S. O'Ofzi1, L Magri2, F. Muzzi2
1 ENEL, Rom21SMES S.p.a. Roma
The definition of design seismic ground motions for antiseismic design can beschematically subdivded into naturalistic aspects and engineering aspect.
At the base of the naturalistic aspects, which are essentially geological and seismological,
there are the following postulates, generally accepted by the scientific community andpresent in all standards, technical guides and recommendations:
earthquakes are the mainly due to the tectonic activît;
the tectonic regime aeting in a specific area does not change during the life time of a
nuclear power plant;
the probabilit of the creation of a new seismogenetic structure or of seismic
reactvation of a dead structure in an area with no seismicit, without neotectonic
effects and not in agreement with the general kinematic model is so low that such
events are not taken ¡nto consideration.
A good characterition of the geologicaljseismological aspects can enable us to makedecisions of great importance, such as the exclusion of a particular area or the identification
of seismogenetic zones, even if it is not able yet to supply by itself numerical parameters
which can be used immediately by the engineer for design purpose.
As far as it concerns the engineering aspects, either the process of antiseismic design oranalysis or check out of a structure, natural and artificial slopes, foundation materials, isfairly consolidated in it praxis, or to be more exaet, the meanings of the varioushypotheses of schematization or of the levels of conservativism innate in each of them and
in the design process as a whole are quite weil known.
Thus the most critcal point in the process is the translation of the design earthquakesdefined in geological and seismological ter~s into engineering parameters.
One of the main diffculties lies in the fact that when the design seismic ground motion is
transformed ¡nto engineering terms, as it must be, the design process, which proceeds
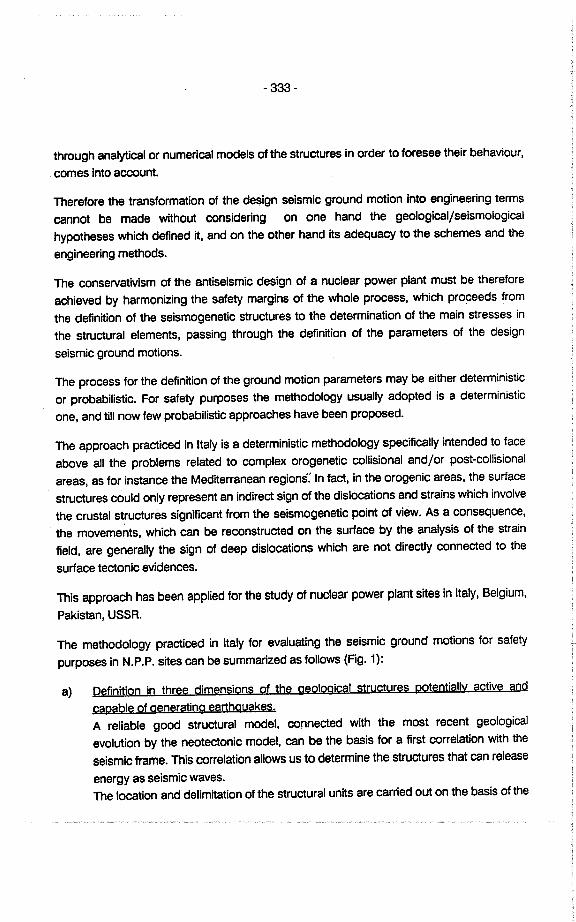
- 333-
through analytcal or numerical models of the struetures in order to foresee their behaviour,comes into accunt.
Therefore the transformation of the design seismic ground motion into engineering termscannot be made without considering on one hand the geological/seismologicalhypotheses which defined it, and on the other hand its adequacy to the schemes and theengineering methods.
The conservativism of the antiseismic design of a nuclear power plant must be therefore
achieved by harmonizing the safety margins of the whole process, which pro~eeds fromthe definition of the seismogenetic struetures to the determination of the main stresses inthe struetural elements, passing through the definition of the parameters of the designseismic ground motions.
The process for the definition of the ground motion parameters may be either deterministic
or probabilstic. For safety purposes the methodology usually adopted is a deterministicone, and til now few probabilstic approaches have been proposed.
The approach praeticed in Italy is a deterministic methodology specifically intended to face
above all the problems related to complex orogenetic collsional and/or post-collsionalareas, as for instance the Mediterranean regions: In fact, in the orogenie areas, the surface
struetures could only represent an indirect sign of the dislocations and strains which involve
the crustal structures signifcant trom the seismogenetic point of view. As a consequence,the movements, which can be reconstructed on the surface by the analysis of the strainfield, are generally the sign of deep dislocations which are not directly connected to the
surface tectonic evidences.
This approach has been applied for the study of nuclear power plant sites in Italy, Belgium,
Pakistan, USSR.
The methodology practiced in Italy for evaluating the seismic ground motions for safetypurposes in N.P.P. sites can be summarized as follows (Fig. 1):
a) Definition in three dimensions of the geological structures potentially active and
capable of generating earthguakes.
A reliable good structural model, corinected with the most recent geological
evolution by the neotectonic model, can be the basis for a first correlation with the
seismic trame. This correlation allows us to determine the structures that can release
energy as seismic waves.
The location and delimittion of the structural unit are carried out on the basis of the

- 334-
study of: satellite imageries as far as it concerns the surface trend of the differentstruetures; geophysical studies (gravimetry, refleetion and refracton methods, heat
f1ow, magnetometry, etc.) for the definition of the deep trends of the struetures;geological studies to reconstruet the teetonic evoluton of the area and to define the
rheological features of the involved rocks.
The neoteetonics permits to relate the elements of the defined struetural model with
the recent teetonic aetivit and to charaeterize its stress field.Moreover, the definition of the kinematic model allows to define and delineate the
single elements of the system and to describe the trend of the movement during a
significant span of time, in order to foresee where the earthquakes may occur (even
with incomplete seismic catalogues), which are the spatiallimits of the sources and
which is the seismic potential, and to give information ab out the stress field thatcauses the earthquakes and about the source rupture mechanism.
b) Definition of the seismological setting, carried out by the historical research on past
seismic events, by the assessment of the macroseismic parameters, and by theevaluation of the instrumental data, including those from local microseismic
networks, in order to compile a complete and reliable seismic catalogue, that is thebasis for the charaeterization of the seismicit in space and time.
c) Definition of the seismogenetic zones, on the basis of the structural and kinematic
geological models and of the seismological setting, that is of the zones whoseseismogenetic aetivity can cause signifcant vibratory ground motions at the N.P.P.site.
Each zone is charaeterized by:
name and reference to kinematic model;
geometry, kind of kinematism and, if possible, velocity of the presentmovements and nature or rheology ofthe rocks involved;
maximum historical epicentral intensity and/or maximum magnitudedescribed in the seismic catalogue;
maximum potential seismicit consistent with the kinematic model and, ifavailable, with nature or rheology of the rocks;
average and minimum distance trom the site;
maximum historical intensit feit at the site;

- 335-
maxmum macroseismic intensit computed at the site by the attenuation lawsand the maximum epicentral intensit;
potential intensit computed at the site by using the attenuation laws and themaximum potential seismicity.
d) Computation of the tree-field surface peak ground motion parameters, on the basisof the seismogenetic zonation, and applying the correlations available in literature
among magnitude; distance and accleration and those between intensity andacceleration, for each of the abÐve outlined seismogenetic situations.
e) Definition of the design geotechnical profile, by detailed local geological survey and
geotechnical investigation, necessary for the study of the seismic response at the
site. This profile takes ¡nto account the soil charaeteristics and the geomorphological
conditions at the ground surface or near the ground surface.
Cross-hole and laboratory tests allow to obtain the variabilit of the shear modulusand of the damping as a funetion of the shear strain.
f) Definition of the site specific response speetra for each seismogenetic zone, on the
basis of the seismogenetic zonation and of the design soil profile, considering themaximum historical effeet and the maximum potential ones, respeetively used to
establish the operating earthquake and the design earthquake at tree-field surface
conditions and at foundations leveL.
The representative strong motion acclerograms recorded worldwide in conditions
as much as possible similar to those considered to define operating and designearthquakes are seleeted, the corresponding response speetra are computed and at
last smoothed site specifc response speetra are evaluated by statistical analysis of
the speetral ordinates.
Our experience indicates that this step considerably improves the evaluation of the
vibratory ground motion at the site with respeet to the use of the general purpose
correlations among seismological parameters and engineering vibratory groundmotion parameters available in the literature.
Of course, the more accurately the charaeteristics of the signifcat seismogenetic zonesend the attenuation conditions between these end the site, end the N.P.P. site responseare defined, the less wil be the conservative assumptions required by the procss.
In Fig. 2, a schematic f10w chart of a probabilstic seismíc assessment is shown. The whole
process may be briefly described as folIows:
- 336-
geological and seimological studies lead to the definition of a seismotectonic
zonation, generally expressed in terms of seismic regions or provinces; theseismotectonic zonation so obtained is usually performed at a larger scalecompared wit the one necessary for a deterministic approach, that is seismicregions so defined extend to very wide areas;
for each defined seismic region the fundamental seismic parameters (occurencerate, probabilit densit functon of magnitude or epicentral intensity, and maximumpotential magnitude or intensit) are evaluated;
an attenuation model is assessed, using seismic data Iike intensity maps,isoseismals, accelerograms;
the seismicit at the site is at last computed, by combining at the site the probabiliiesof occrrence of seismic events trom every seismic region, attenuated by the
attenuation laws. The seismicit at the site is usually computed in terms ofrecurrence mean times of intensit or acceleration at the site, or as hazard curves,that is curves representing maximum horizontal acceleration at the site vs probabilty
of exeeeding.
It is worthwhile noting that for a safety assessment the required probabilit levels are verylow, often of the order of 10~. One of the most important consequences, is that the seismic
regions defined for a probabilstic assessment must be large enough to include a sufcientnumber of earthquakes to perform reliable statistical analyses. Therefore all the detailedinformation provided by an aceurate geologie study eould not be properly taken intoaccunt.
The main reason is related above all to the difculty in evaluating reliable parameters for theseismicit of small areas. In faet, for instance, the nearly exponential shape of the
probabilit densit funetion for magnitude or epicentral intensit imposes a very precise
determination. in order to avoid glaring errors in the high magnitude range, to which therequired low level probabilities correspond. A good definition of an exponential densityfunetion needs a large sampling, namely provided by the earthquakes occurred in a large
areas during a long span of time. Similar considerations may be proposed for theevaluation of the other seismic parameters. Moreover, as far as the occrence rate is
concemed, non-sttionary processes in time should be taken into accunt for very longperiod statistical analysis.
An other crucial point in the probabilistic process is related to the definition of theattenuation modeL. In partieular, for the evaluation of low probabilit values, the distribution

- 337-
of the statistical errors around a mean attenuation law, usually obtained by least-squarefiing method, is of fundamental importnce. In fact, low probabilities of exceeding specific
accelerations or intensities just correspond to the outliers in the attenuation modeL. In thestandard practice the statistical errors are assumed to be lognormally distributed, basically
due simply to an evident asymmetry of the recorded data around the fiing line. Thisassumption may be considered enough reliable at most up to one or perhaps two standard
deviations, but can lead to unpredictable results for more unlikely events.
Due mainly to these problems, even if the computtional theory for the evaluation of theprobabilities at the site is a weil established matter, in our opinion the present state of the
art of the probabilistic seismic assessment cannot be considered sufcient for safetypurposes, and particularly for N.P.P. sites. and further studies are necessary.
The deterministic approach based upon the above described methodology is to beconsidered more reUable due to the fact that the seismoteetonic model is the result of theagreement among a considerable amount of data namely geology, geophysics,seismology, geotechnics.
The present level of knowledge,on the contrary, recommends the use of the probabilistic
studies for assessing the seimicit expected durlng the operational life of a structure, andanyway for periods of time comparable with the duration of the complete part of the seismic
catalogues.
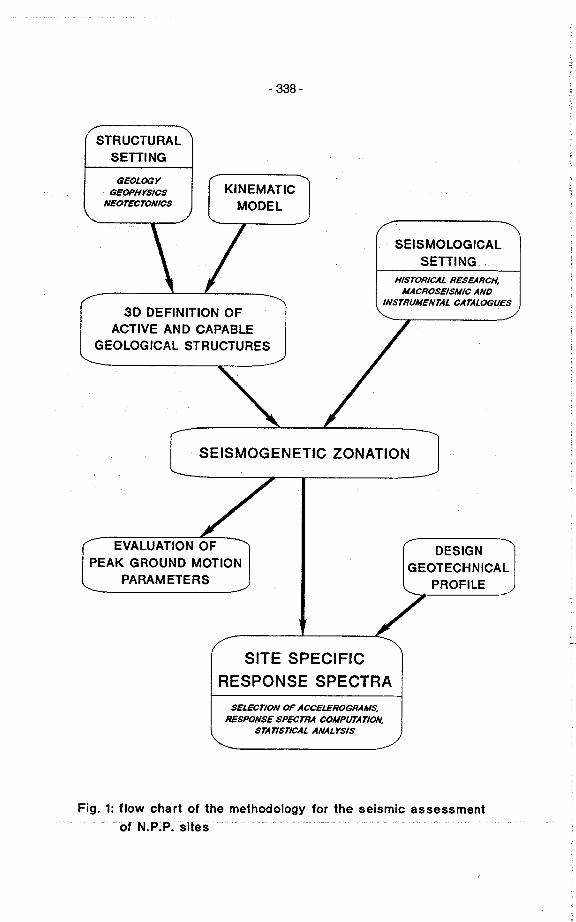
- 338-
STRUCTURALSETTING
GEOLOGYGEOPHYSICS
NEOTECTONICS
KINEMATICMODEL
HISTORICAL RESEARCH.MACROSEISMIC AND
INSTRUMENTAL CATALOGUES
SEISMOLOGICALSETTING
3D DEFINITION OFACTIVE AND CAPABLE
GEOLOGICAL STRUCTURES
SEISMOGENETIC ZONATION
EVALUATION OFPEAK GROUND MOTION
PARAMETERS
DESIGNGEOTECHNICAL
PROFILE
SITE SPECIFICRESPONSE SPECTRA
SELECTION OF ACCELEROGRAM$,RESPONSE SPECTRA COMPUTATION.
STATISTICAL ANALYSIS
Fig. 1: flow chart of the methodology for the seismic assessment. .ofN:P:P:sites
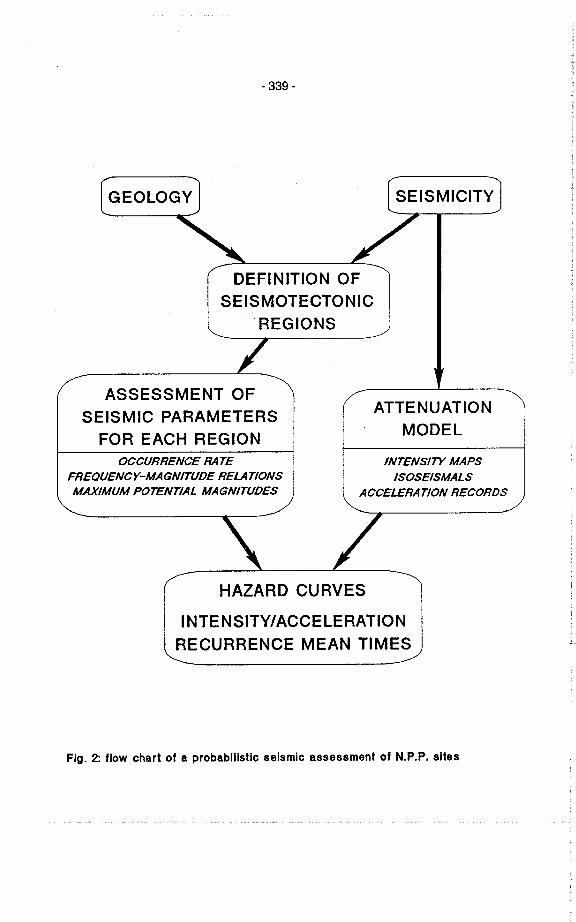
- 339-
GEOLOGY
DEFINITION OFSEISMOTECTONIC
REGIONS
ASSESSMENT OFSEISMIC PARAMETERSFOR EACH REGION
OCCURRENCE RATEFREOUENCY-MAGNITUDE RELATIONSMAXIMUM POTENTIAL MAGNITUDES
ATTENUATIONMODEL
INTENSITY MAPSISOSEISMALS
ACCELERATION RECORDS
HAZARD CURVES
I NTE NSITYI ACCE LERATION
RECURRENCE MEAN TIMES
Fig. 2: flow chart of a probabilstlc selsmlc assessment of N.P.P. sltes
-~-
CSNI WORKSHOP ON SPECIAL ISSUES OF LEVEL-l PSA
27/29 HAY. 1991 - COLOGNI OIRHANY
IXPIRIINCI OAINID IN lTALY ON TH! PROBABILISTIC ANALYSIS
OF
ACCIDENTS INITIATED BY SIISMIC lVINTS
A. POOLllSI A. VALlai C. ZArrll0ENEA DISP - ITALY
a: \ haz2.wrt
- 341 -
UTJOÐUCT i 0..
In the licensing of the past generation NPPs ENEA requestedfor all operating and under eonstruetion NPPs the performanceof Proòaòilistic Safety Studies finalized to show theeomplianee wi tb estaòlished Safety Goals. The current ENEAgoals were:a) Core Damage Frequency (CDF) in the range lE-6 - lE-5 ev/yb) High Releases Frequeney (HRF) in the range 5E-8 - 5E-7 ev/yHigh Releases means ex-plant release of I-Cs ) 0.1% of thecore inventory.For two of the NPPs ( Caorso and Al to Lazio BWRs ) the PSS(1,2) included also the evaluation of seismie contriòution ofthe LOOSP, whieh in current PRAs usually represents a dominantevent for Co re Damage occurrence and external fission productreleases likelyhoods. This paper describes the experiencegained for the Carso Plant. being the application to Al toLazio conceptually similar.TH£ PRA FRAMEThe resul ts of the first Caorso PSS review showed òoth CDF andHRF were do~inateà by the LOOS? event, but while the CDF metthe probabilistic goal (6. 42E-6), the HRF resul ted higher thanthe reference goal for the ex-plant releases (1.1E-6). Theinterpretation of the resul ts allowed the individuation ofspecific i terns where design and procedure modifications couldallow the reduction of the HRF. Speeifically the contributiono! the LOOS? was important for both the CDF value and HFF; theLOOSP, in turn, resul ted dominated òy the seismically induced1055 of external grid for 24 h: the importance of the seismieLOOSP was 27% on CDF and 34% on HRF.It is known the fragili ty of i) electrical insulators loeatedat ground level in the plant swi tchyard and ii) ceramieinsulators of power trasmission lines, expressed in terms ofthe median aeceleration capaeity to withstand seismie l~ads,is rather low, let say the median value of sueh capacity isabout 0.2 g. Consequently i t was assumed in the PSS that anearthquake with a PGA (Peak Ground Aceeleration) greater than0.2 g as capable to induee a aeneralized failure on theexternal grid, i. e. LOOSP, in the Caorso si te.The cumulative frequency of the earthquakes capable to damagethe external grid (PGA ) 0.2 a ) was roughly estimated as 2E-3ev/y from the available seismic data of the whole PianuraPadana. The recovery time of 24 hr was realistically assumedon the base the experience gained during past Italiandestructive earthquakes, like the Friuli 1976 earthquake.As £ar as the Caorso si te 15 concerned, i t has been recognizedby .y.p~rt5 ~h.~ ~h. .i~.. .v&n i£ pl.e.d inside the PianuraFadana i has a sp.ei£ie t.etonie behaviour and the frequency ofFGA ) 0.2 . could potentially resul t subtantially lower than
- 342-
~he mean value applicable ~o ~hole area ( ~he value used was2E-3). So ~he a realistie seismie hazard analysis on the si te- not available at that ~ime - was eonsidered neeessary inorder ~o support lower figures. This work has been done byENEA 1n ~he frame of i ts aeti vi ty on PRA review, using the inhouse available expertise on seismie analysis.The situation for Al to Lazio plant is similar to the Caorsosituation, i.e. a too high value of frequeney for PGA ) 0.2 gwas assumed while the loeal seismiei ty could promise asubstantially lower frequeney estimates.In the next paragraph 1 t 1s explained the approeh used toessess the seismie hazard for the two above mentioned Italiansites, whieh allo~ed ~he use of four times lower values, i.e.5E-4 for the Caorso Plant. Some eonservati ve assumptions madein the analysis provided a high level of eonfidence toresul ts, useful ~o proteet the deeisional aetions against theuneertainties associated wi th the basic data and themethodology. The values can be compared with those derivedfrom the hazard eurves used in NUREG 1150. The medianfrequencies for th~ same event (PGA ) 0.2 g) are; i) about4E-5 in LLNL Surry Hazard curve ii) about 2E-5 in EPRI SurryHazard eurve ( see respeetively Fig. 3.3 and Fig. 3.4 of (3)).The effects of the reassessed val ue on the PSS resul ts ~ere:i) a 20% reduction on CDF (5. 14E-6)ii) a 25% reduetion on HRF (8. 20E-7) .The new seismic LOOSP value ~as not suffieient to meet theSafety Goal; other hardware and procedure modifications ~erenecessary to further reduce the CDF and to push the HRF valuewi thin the 5E-S -5E-7 range. But the figures reduction comingfrom the seismic LOOSP reassessment was of great relativeimportance.
HAZARD ANALYSISThe Seismie Hazard Analysis (SHA) provides estimates of theprobabili ty of future levels of the ground motion, usingearthquake hazard models whieh express assumptions regardingthe timing and size of events on the base of the physicalunderstanding of all earthquake processes and wi th the supportof a statistiea1 treatment of the available data. SHA generalprocedures involve the following steps:- delineation of the source of earthquakes and estimatesof their ac~ivity rates
- description of the ecti vi ty by a recurrence relationship- description of the attenuation of ground motion wi th
distanoe from ~he earthquake source- evaluation of probability of exoeedence for various levels
of ground motion at e si te .Following the above approach the seismic hazard for the twoItalian NPPS si tes (Caorso and Al to Lazio) was determined. Asfirst analysis step the seismic source zones ~ere 1dentified.The Italian earthquake catalog 1s lengthy; the CNR-PFGcatalog (4), that spans over almost 1000 years, reports about27000 events, and historieal manuscripts report even on
- 343-
B. C. destructi ve eerthquakes. On the other hand the complextectonic ~etting of the Italian region does not allow toestablish a elear relationship between geologie structuresand earthquakes. The seismie sources zones used in thePSHAs are then areas that share eommon tectonic and geologieattribute~. Areas boundaries were evaluated not only byepicentral loeations of historieal seismiei ty but on geologieevidenee as weIl.In figures 1 1~ reported the map of Italy wi th the 1ndicationof historical epicenters taken from the catalogue; theloeation of the Caorso and Al to Lazio si tes are also shown inthe map. Figure 2 shows e map that indicates the boundaries ofthe ~elected seismic areas for ~he Caorso si te, end thehistorical epicenters eontained therein. As far as theCaorsosi te is concerned, for each seismic area i t was assumed thatthe spatial occurrence of earthquakes is uniform end theyearly number of the expected earthQuakes decreasesexponentially vi th increasing magni tudes. The assessment ofsouree seismici ty mainly depended on the events taken from theCNR-FFG catalogue for the areas under investigation. Thisdatabase was analyzed in order to identify the time intervalswhere i t can be eonsidered complete. Statistical analyses wereperformed on the seleeted events to estimate variables ofearthquake magnitude reeurrenee model; available empiricalrelationships were used to estimate the magni tude ofhistorieal events. The probabili~y distribution of earthquakesize was represented wi th a so called double-truneatedexponential distribution. The upper bound magnitude (ml) ofeaoh source was defined when ~ possible relying on geologieinformation. Otherwise m1 was defined as the magnitude toat.in a linear Gutenberg & Richter oeeurrence relationship , has aprobabili ty of exeeedence lower than 10-3. Earthquakes wi thmagni tude belov 4.0 were excluded from SHA. sinee smallearthquakes .have little effects on engineered structures.The seleetion of a sui table attenuation relationship is one ofthe most cri tical elements in any assessment of ground motionhazard. Attenuation model translates the hypothesis aboutboundaries and se; smici ty of a seismic source into estimatesof probabili ty of exceeding a gi ven intensi ty of groundmotion. Generally speaking, appropriate attenuation modelshould be developed by strong motion records obtained in thearea under investigation or in comparable geologie,seismologieal and local si te condi tions. Since 1976. manyearthquakes have triggered the Italian national strong-motionnetvork but very few accelerograms have been recorded in theinvestigated region. Then the attenuation of ground motion hadto be estimated using relationships based on ei ther nationalor vorldwide strong motion data.Al though response spectral va lues may be the most useful ofthe parameters describing ground motion, most of the availableattenuation relationships deal wi th peak horizontalaccelera~ion. This parameter was the most important one incarrying out PRA, es i ts goal was to assess the seismicprobabili ty failure of electrieal insulators located at ground
-~-
level in the plant switchyard, and so the probabilty failureof the external grid inducing LOOSP in plant accident.At that time available attenuation relationships vere mainly
developed using strong motion data recorded in vestern Uni tedStates, most of which in California. along the S.Andrea~faul t. The most important relationships vere developedassembling vi th care a sui table database in order to avoidun1ntentional biases such those arising from reeordinginstruments, record processing and multiple recordings fromone event.Many problems arise in selecting the attenuation relationshipto be used in the SHA, mainly because of different parametersused by authors in defining earthquake size, propagation andsi te effects.Referring to the earthquake size parameter the most commonlyused is magnitude and particularly the Richter local magnitudeMl, the surface magnitude Ms and the moment magnitude M, thisbeing, more then others, a very measure of the earthquakesize.The parameter commonly used to character1ze the attenuationof ground motion. as i t travels from source to s1 te, is thedistance sour ce to recording station. Among the distancemeasures adopted in developing attenuation relat1onsh1p, theepicentral and hypocentral distances are the most read11yavai1able for earthquakes. Some authors prefer distancemeasure~ such as closest d1stance to rupture zone and closestdistance to surface projection of rupture zone as they claimthat si te ground motion is mainly affected by the nearest partof the fault rupture. In any ca se the attenuation relationsshould be able to aceount for 10eal geologieal effects thathas been reeognized greatly amplify the motion in selectedfreQuency range. At that time the relationship proposed byJoyner and Boor (JB), (5) seemed to be the best choice but thedistanee measure. Because of methodo1ogy used in definingseis~ic sourees these shou1d be better considered as 10ei offuture epicentra1 10eation. Usins data recorded by the Italianstrong motion network, re1ationships were developed usins bothepicentra1 distanee (SP _e) end, mere1y for eomparison purpose ,the closest distanee to the surface projection of rupture zone(SP _f); the complete deseription of method can be foundelsewhere (6).FiS. 3 shows two attenuation re1ationships using faul tdistanee. Comparing the above relations i t is evident that JBalways estimates hisher va1ues of aeceleration for distancesup to i 00 km, wi th hisher va1ue at short distances, let saybelow i 5 km. Considering magnitude less than 6.5 there is thatthe differenee is even mueh hisher . Moreover the JB standarddeviation is higher than SP _f ones. All these aspects have agreat influence on estimated si te hazard: at Caorso, using JBwe have predicted aoceleration values that on the average areup to three times those obtained wi th SP _f relationship. A sohigh ratio value can be also explained considering that, inseleeting the seismic sources , one of them, let say the lesscredib1e one, was located at less than 10 km far away from the
- 345-
site. Looking at the hazard results it was evident thatplotting numbers of expeeted events versus aeceleration, thoseeurves do not show any tendency to saturate even for numbersof event less than 10-8 suggesting that likely the soureesupper bound magnitude ml would heve been overestimeted.Fig. 4 shows resul ts of the hazard analysis for Caorso usingSP _e attenuation relationship . that for the consideretion madeabove seems to be more realistic than others. The same generaleonsideration applies when using sP_e relation. the curveseems not to saturate, even if the estimated peak values are a1i ttle bit higher than those estimated using SP _f.The same approach was followed for estimating the Al to Laziohazard, except for using only the SP _e attenuationrelationship. eare was used in including seismic sources inPS HA and in selecting the m1 megni tude values. sensi ti vi tyanalyses were earried out also to estimate the amount ofhazard that belongs to earthquakes having size greater thanthe source historieal maximum one. The resul ts show thatappropriate selection of ml va lues greatly contribute to avoidanomalous hazard estimation characterized by non-saturationtrend.CONCLODING aIMA.KSThe seismie hazard curve for the Caorso si te shown in Fg. 4indicates that the frequency of PGA ) 0.2 g is about 5E-4.This value was obtained using a realistic assessment of the:i te ground motion. but using conservative assuroptions for thestrongest earthquakes. This conservati vism was judged to besufficient for encoropassing the uncertainties of the analysis.Introducing in the PSS a set of modifications the HRF resul tedwithin the range set in Safety Goal (1.1E-7) and the relativecontribution coroing from the seismic LOOSP reassessment hadan important role.Also the CDF even already inside the Safety Goal range -benefi ted from the new analyses.On the other hand the review of of the Caorso PSS was aimed atreducing the probability of the LOOSP sequences (including theseismic ini tiated ones) that are dominant in the assessroent ofthe global CDF and HRF. No other seismic failures. therefore.were considered to be significant for investigating otheraccident sequences (as for instance LOCAs due to failures ofsupporting structures, or transients due to equipmentmulfunctions genera ted by seismic events) . The uncertaintiesaffecting the whole process of generation and propagation ofthe earthquakes to the si te, and the plant response to thesi te ground motion at the subsoil level, are so high that noreliable predietions ean be made for the seismic loads actingon the various structures and safety systems of the plant. Theaeismie failure rates for such structures and equipment aredetermined wi th large uncertainties that eould be alsoquantified through available stochastic techniques. That leadsto conclude that the limi ted applieation for the Caorso PSS isvaluable for assessing the actual CDF and HRF values formaking decisions on the plant safety. Other resul ts from a
- 346-
more complete seismic risk analysis could be wrongly1nterpreted and not properly used for making decisions.
111111NOl8
(1 J
(2)
(3J
(4J
(5)
CAORSO PSS - Report NO. ENEL DeO 401. V040. VR001; revl-June1988ALTO LAZIO PSS - Report NO. ENEL AZ1.0040.RRXP.3561.01-Sept 1986NUREG/CR-4840 - SAND 88-31102 Procedures for theExternal Event Core Damage Frequency for NUREG-1150CNR-PFG - Catalogo dei Terremoti Ita11ani dall' anno 1000al 1980 - 1980Joyner, W.B. and D.M. Boore - Peak Horizontal Accelerationand Velocity from Strong Motion Records Including Recordsfrom the~ 1979 Imperial Valley. California. EarthQuakeBull. Seism. Soc. Am. 71,2011-2038 -1981Sabetta, F. end A. Puglieee Attenuetion of PeakHorizontal Acceleration and Velocity from Italian 5trong-~otion Records Eull. Seism. Soc. Am. 77, 1491-15131987
( 6)
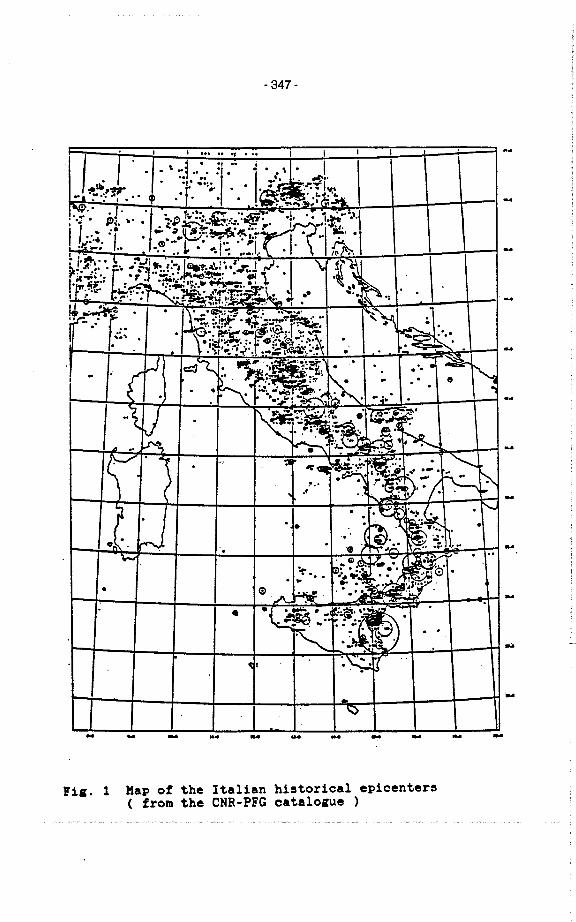
- 347-
I I. ./' . \ ..j .. :... ;¡.:: ..; . . \ I. ¡. . . 1:1. .~..I I .... ~I '1 ~.
..it,#, r '.. . . ~.. ~.--:"C'ly...¡ -..... .' 11 .. ~~ . :.~.'=.. : . l' T' .... -:~... ;. r;~
.:'. . ,. .1. ". ... -~ ....c... i ~.:, I¡ ì . .. ~i' .. . .;l:~ ø~~i:r.m.' .r".~ .'i'e: ..,¿~: I. . .(9._'" '.: ¡:. :.¡l, i.", ,. .¡i . - .. ... ~ i -: .... oe' I ir. ft
lj:r-~..r~.. ..=:::~.ill~.!:.,I~.,.~'.¡...'.-.I,.. J \ ~'~,. . .. . .. . i' .- .-'.I.;(li;.:: .. ~ ~;""'i:':l:- t.1.' . ~r"ie: ~,:..~...,~. 11' . .~'~~1 "u. !.. . .... . ~,. "":r~..~: .. .'.l '., .' . -. ~'li:t.~.:.~... ~ er . -~ I:I. ~. . ~..':CI.:": 10; '~,:.' ì;" .
r- : r. ~.. ::i7 . ~;~:;,..f-~" " ~ ~. .:' .' . .: '~'~.~lL~"I:" . _C" - '.
iL ..... . '\ : r.~ ~.,...ll! ." ~~ "Ç;õ . ... .riL........;.. :~~.1.":..'. . ~"
., (~. ~~l~~'~~~~l~~~.... : '- ... .' ~~, - . .L ~..fJ.~..~ 1'. : .... .. . F X ...:;;..~t~~. ".¡.- .
I ..~ J. ~~~~::.~ ~y;:;:Ã.:.. .. ~ '~~-'.' . "~ip . ) . '; ~ e_~...,'::' ~:: . '-" ..;~ ";. .....';:',: - "\ ~..;., ~. .. I, --,.,I .e . '? /.. ..~ . . . .t~...,.~. . '-I . · ...1\ .~~ ...1 .. rJ. . ...~) ~;.' ~ 1. . .''- T... ';," G.e ..~. ;....OI'~.~':'' .:' i'" ,0.
. . .. ~ ...-: ~.. ..ii... .Gl.A ~ .'. ...
· .f ~ · :". ;:~~~ît::: '. -: .~.~... ........ ... .'... .
~\:
. \
. ..
.
~ I
.I;
.. .. .. .. ...
FiS. 1 Map cf the Italian hi~tcrical epicenter~( from the CNR-PFG catalosue )
...
..
..
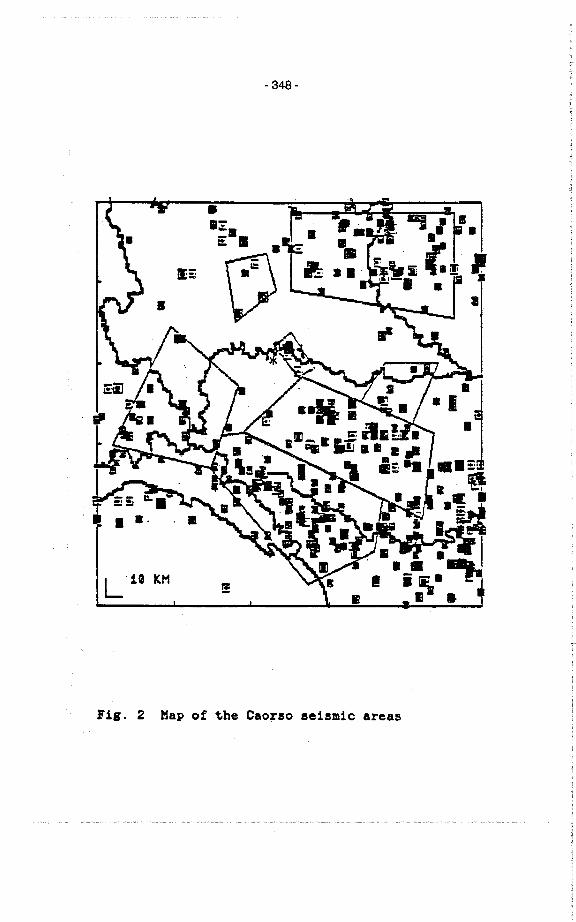
- 348-
I
. a.
LU KM æ
F1g. 2 Map of the Caorso se1sm1c areas
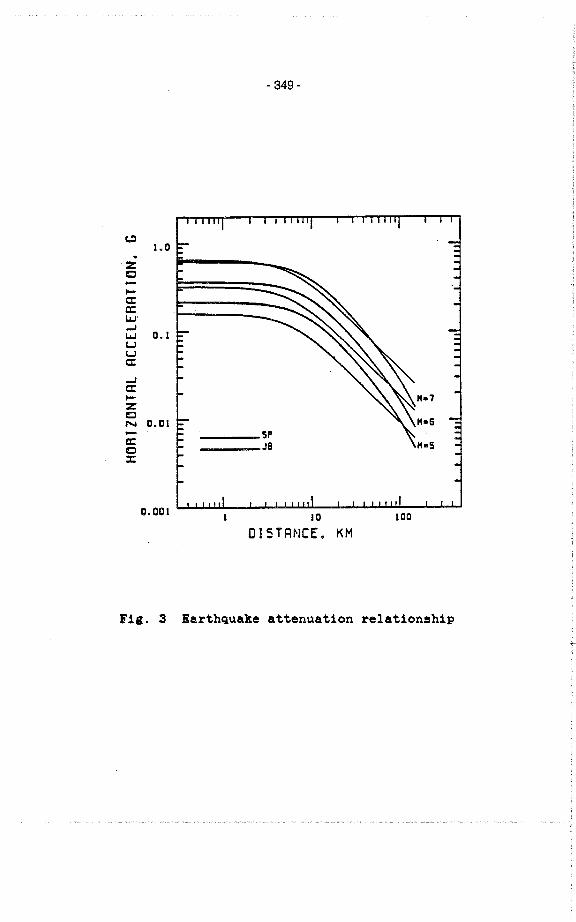
c.1.0.
ZC~era:i."..i. 0.1UUer..er..zCN 0.01
a:C:i
- 349-
0.001 10010
OISTRNCE. KM
FiS. 3 Earthquake attenuatlon relatlon~hlp
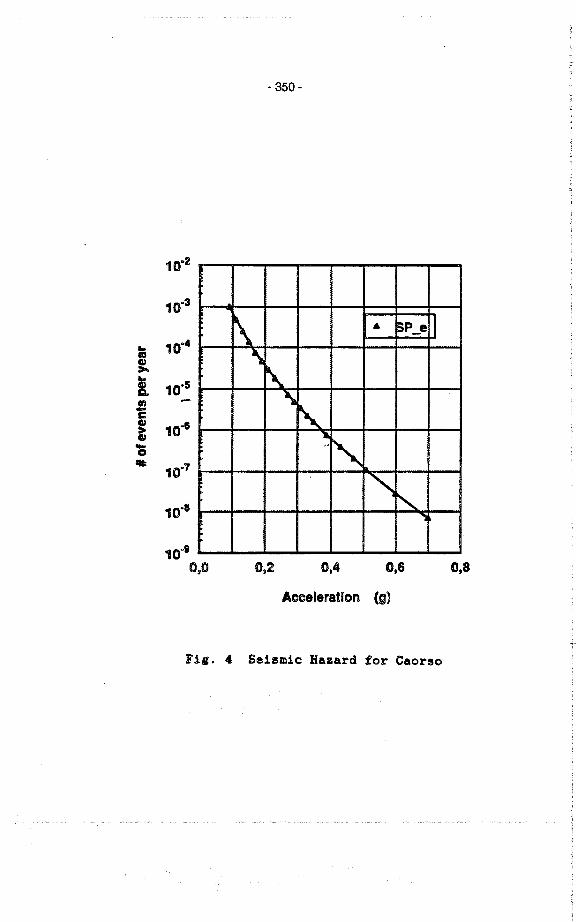
11,)2
10.3
.. 10-4CDCD~..
10.5!.Cl-CCD
10.6~CD
Õ.,10.7
10.8
- 350-
\ & SP e I
\\.
.,,~~ "
'"
10.90,0 0,2 0,4 0,6 0,8
Acceleratlon (g)
Fia. 4 Seismic Hazard for Caorso

- 351 -
Special Topics
Chairman: R. Stück
- 352-
H. Pamme, L. Seyfarth, RWE Energie AG, Essen
Experlences wlth data collectlon, retrleval and Interpretation for PSA purposes
OECD/BMU Workshop on "Special Issues of Level 1 PSA"
Köln 27.-29.5.91
- 353-
H. Pamm, L. Seyffarth, RWE Energie AG, Essen
Experiences with data collection, retrieval and interpretation for PSA pur-
poses
1. Introduct ion
One main activity within the PSA framework is the collection of plant specific
availabilityand reliability data. In the past however most nuclear power
plants had not focussed their technical data collecting activities directly
towards the generation of statistical reliablility data. Thus only "alterna-
tive" data banks are available which e.g. have stored technical data for
logistic, maintenance or management purposes. In order not to loose the
historic experience (beside significant events which are welldocumented) these
data sources must be analysed to revear the "hidden" informations for the data
generation task in probabilistic assessments.
This paper intends to demonstrate this data retrieval and analysis procedure
within RWE nuclear power plants (RWE-NPP). The available technical da tasources and the combined use of various data banks wi 1 1 be described. One
example will show the retrieval, analysis and interpretation of failure
events.
2. Data flow and data bank structures at RWE-NPP
Figure 1 provides an overview of different data sources and data banks with
potential relevance for the generation ~f probabilistic data. The data banks
are decentralized and available at each. RWE-NPP in the same structure. The
vertical axis shows the time points of the (realized or intended) instal-
lations.
- 354-
The most important basic informations concerning failure events is contained
in the work orders. These work orders (as form sheets) are required for all
technical activities on all components within the plants. Their main purpose
however is up to now not the detailed description of failure events but the
planning, control.and documentation of maintenance and repair activities. The
work orders are correlated to components by the use of a plant codification
system. Short text informations can generally be added to describe the failure
or deficiency.
Most informations of work orders are collected in the ISIS-data bank (ISIS =
"Instandha ltungs-Steuerungs- und Informations-System" = ma intenance contro 1and information system).
The AES-data bank (AES = "Anlagen-Erfassungs-System" = plant inventory system)
contains component data and descriptigps with a mainly logistic orientation
(e. g. manuf acturers, parts 1 i sts) .
The NOVA-system (NOVA = "Nachweis des ordnungsgemäßen Verhaltens der Anlage" =
documentation of regular plant behaviour) was originally installed as an
analytic tool to check and document the regular starting procedures and
sequences of safety systems after test and demands (e.g. transients). It
contains mainly binary signals of specific electronic limit switches, sensors
and breakers from the process computer.
The FRAU-data bank (FRAU = "Frei schaltungen und Aufträge" .. system isolation
releases) contains all informations concerning system or component isolation
activities (e.g. to allow repair or maintenance activities on safety systems)
within the plant. The release form sheets together with references to the
correspond i ng work orders serve as input i nformat ions to the FRAU-data bank.
- 355-
The ASS-3-data bank (ASS = "Anlagen-Schadensstatistik" = plant related failure
statistics) contains "improved" informations of failure events for . components
of important operationaland safety systems. The ISIS-data for these compo-
nents are supplemented by codifications (e.g. concerning failure causes) and
further background informations of the fa i lure event. These supp lements are
prepared within the technica 1 departments of the plant. The ASS-3-data bank
was installed as an information source mainly to optimize the availability of
the plants.
These described data sources must be combined to derive "task-specific"reliability parameters. The term "task-specific" here refers to a clear
definition and description of what has to be quantified (e.g. failure
probability for a sudden failure per demand or event rate for a specific
external leakage). It is obvious that the ASS-data-structure and the available
depth of informat ion provides the eaS1est approach to start an engineering
analysis of failure events.
3. Requirements for the statistical derivation of reliability data
The "task-specific" derivation of statistical reliabil ity parameters requires
the definition of event conditions which caused ~ specific failure. Thus the
set of available component and event based informations from the different
data sources must be manually "filtered" until a remaining subset of suitable
events is revealed. This subset forms the "sample" for the further statistical
treatment.
With a combined use of the available data banks at RWE-NPP the "environment"
. and conditions of a failure event can be reconstructed. The following tablegives some examples which informations can be derived from the various banks:
- 356-
Oata bank: AES ASS-3 ISIS NOVA FRAU
Parameter:Event descriptions X 0
Time point of eve~t X X 0
Unavailability times X 0 0
Repair times X 0
Repair activities 0 X
Startup-frequencies X 0
Operating times X 0
Component life times X 0
Reactor status X 0
"Sample size" X
System unavailabilities X
The "X" shall indicate that the corresponding information is mostly available
in a good quality, the "0" indicates that a detailed analysis of raw data is
required to derive the "true" information.
4. Example
The available amount of historie information in the various data banks with
relevance for the generation of probabilistic data shall be discussed in the
following example.
The "global task" was the analysis of failure events of high pressure trans-
ducers (within the reactor protection. system) which indicate the reactor
pressure. The IIspecific task" was the analysis of events which led to a (more
or less) sudden loss of apressure signal during operation. The aim should be
the estimation of a failure rate for the sudden loss of apressure signal inthe reactor protection system. The component boundary for the transducers was
the component housing including the electrical and pipework connections.
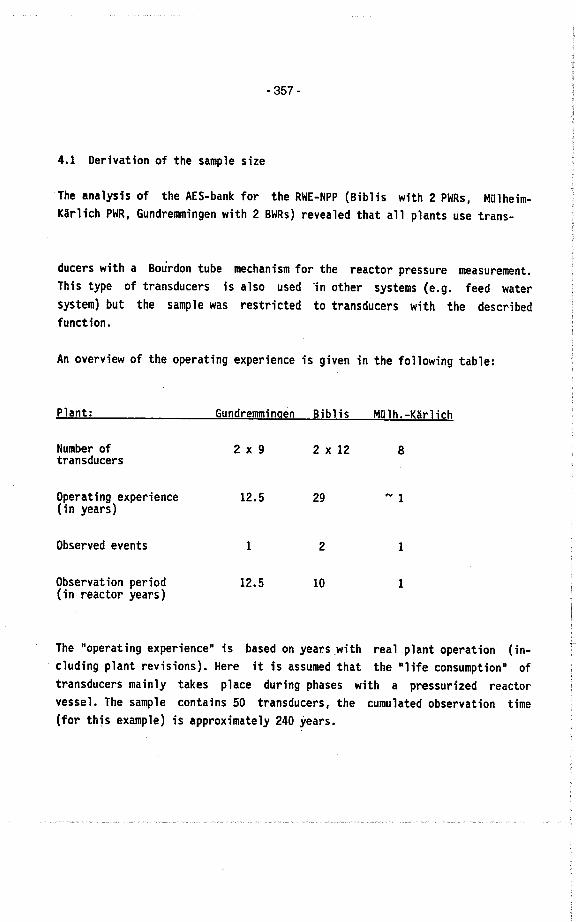
- 357-
4.1 Derivation of the sample size
The analysis of the AES-bank for the RWE-NPP (Biblis with 2 PWRs, Mülheim-
Kärlich PWR, Gundremmingen with 2 BWRs) revealed that all plants use trans-
ducers with a Boúrdon tube mechanism for. the reactor pressure measurement.
This type of transducers is also used in other systems (e.g. feed water
system) but the sample was restricted to transducers with the described
function.
An overview of the operating experience is given in the following table:
Plant: Gundremmi ngen Biblis Mülh.-Kärlich
Number of 2 x 9 2 x 12 8transducers
Operating experience 12.5 29 .. 1
(in years)
Observed events 1 2 1
Observat ion period 12.5 10 1
( in reactor years)
The "operating experience" is based on year.s .with real plant operation (in-
cluding plant revisions). Here it is assumed that the "life consumption" of
transducers mainly takes place during phases with a pressurized reactor
vessel. The sample contains 50 transducers, the cumulated observation time
(for this example) is approximately 240 years.
- 358-
4.2 Event analysis
The observed 4 events with a (nearly) sudden loss of funetion were found
within 310 ISIS data bank entries. Most of these entries only doeument . pe-
riodie testing aetivities. This kind of transdueers is up to now not ineluded
in the ASS-3-data bank. One example of an ISIS-data set is shown in figure 2.
1t beeomes obvious that the deteetion and analysis of these data sets is a
neeessary engineering task and effort.
Furthermore the experienee has shown that pure data bank inquiries whieh are
only based on th~ use of eodified informations ean lead to ineomplete or
irrelevant events in samples. Only a suffieiently "intelligent" aeeess to a
data bank ean reveal also those relevant informations whieh are available but
stored at a "partially wrong" plaee (e.g. produeed by eodifieation errors or
non-exelusive eodifieation options).
The deteeted relevant events are shortly deseribed in figure 3. Obviously the
failures with a sudden charaeter are very quiekly detected by the voting logie
of the reaetor proteet ion system.
Event number 4 is often eited in the German "nuelear community" as the "elas-
sieal" eommon mode failure (CMF) for transdueers. 1t must however be notieed
that this event with multiple failures did not influenee the funetion of the
meehanieal and eleetronic parts of the transdueers under normal operatingconditions. Only a coincident LOCA-eventmight lead. to humidity or wateringress into the transdueers and thus lead to potential malfunetions. However
due to the use of diverse eomponents (2 groups of 2 transducers) within one
reactor protection redundaney (here 2 out of 4 voting logie) even these
multiple failure events under LOCA-conditions would not lead to an erroneous
pressure output signal of the reaetor p~oteetion system.
Another interesting result of this event analysis was that also ineipient
failures (within the toleranee of the voting logie) mostly had their origin in
the eleetrie/electronic parts of the transdueers (e.g. drift of resistors).
These ineipient failures were all revealed within periodie tests.
- 359-
4.3 Quantitative assessment
The ana lys is showed that sudden fa i lures of transducers were not observed upto now coincidently with reactor trips (e.g. transients). Failures are de-
tected very quickly after their appearence (e.g. wrong calibrations within
revisions detected during warm-up phase) or failures are "self-annunciating"
due to the voting logic of the reactor protection system.
Due to this experience the failure rate for sudden fai1ures of transducers is
estimated to be "around" 10-6 Ihour (assuming the exponential model). The
potential event rate for multiple coincident failures (CMFs) of transducers is
estimated to be significantly smaller.
4.4 Data limitations
The above discussed data bank structure and the example showed that the
historic experience since N 1982 can be revealed with an at least satisfactory
information quality.
The quantification however must mostly be correlated to (estimated) cumulated
operating times of a whole samp1e. Individuai lifetimes of components or parts
of components which are not contained in the ASS-3-data bank are very often
not available. Thus potential ageing effects of components can only (if at
all) indirectly be detected e.g. due to increased spare parts consumptions.
Additionally the "life cycle" (consisting ~f subsequent operation and repair
phases) of many individual components within the plant cannot be traced back.
These disadvantages will be solved for "PSA-relevant" components by the
development of a relationa1 data bank system which is especia11y designed to
reduce the manual effort of data analyses (as still shown in the example
above). Furthermore extens ions in the ASS-3-bank wi 11 improve the data qual ityand quant i ty.
- 360-
5. Conclusions
The available data bank structure which was originally not designed for the
derivation of reliability parameters allows the retrieval and analysis of
failure event data and operational data. Due to the varying quality and
quantity of raw data informations with respect to special reliability or
avai labi 1 ity quest ions engineering and combinatoria 1 effort is required to
reveal the partially hidden event history.
It also became obvious that not all data bank entries entitled as "failures"
(with given failure modes) are relevant with respect to a specific probabi-
listic question. This fact also emphasises the necessity for individual data
analyses which gain more insight in a component failure behaviour than the
simple acceptance of "generic" and abstract .data from literature.
Thus a global complaint concerning the .lack or scarcity of reliability data
(i.e. either failure or "success" data in case of no failures) is no longer
justified. This statement seems to be valid also for other utilities because
comparable data collections are also available at other nulear power plants.
RWE has started a project to ease the combined access to the various data
banks at RWE-NPP. The result will be a relational data bank system which will
allowa centralized analysis of the component history. Additionally the
statistical treatment of qualitative analysis results will be possible.
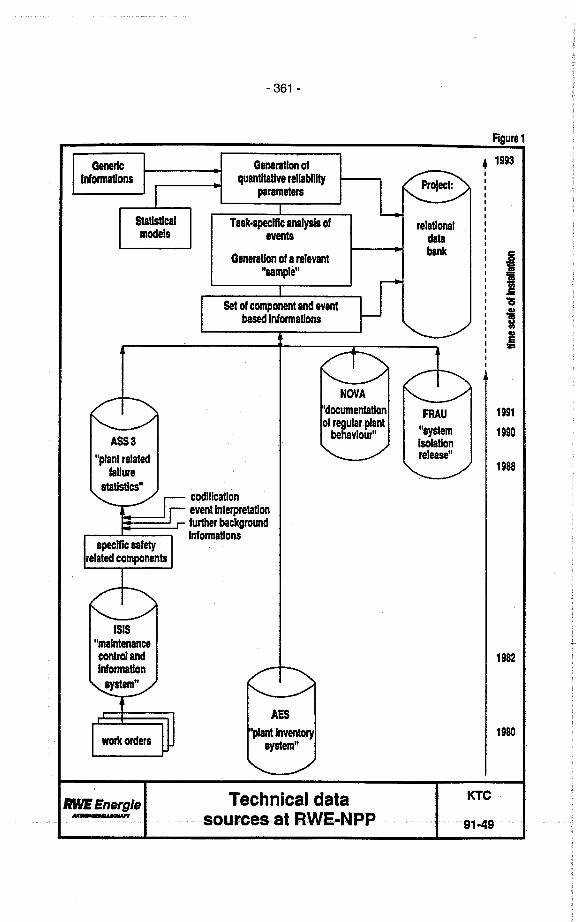
GencInonnatons
- 361 -
Generation ofquantitative rellabilit
parameters
SttIstcaimodels
Task-speclfc analysis ofevents
Generation of a relevant"simple"
set of component and eventbase Inforations
codificatlonevent Interpretationfuer background
Infonnatlons
RWEnergle.M c'.."
relatlonaldatabank
Technical data
so.u.rcesat~RWE.N.PP
Agure1
l 1993
ïiõD
!
1991
1990
1988
1982
1980
KTC
91.49
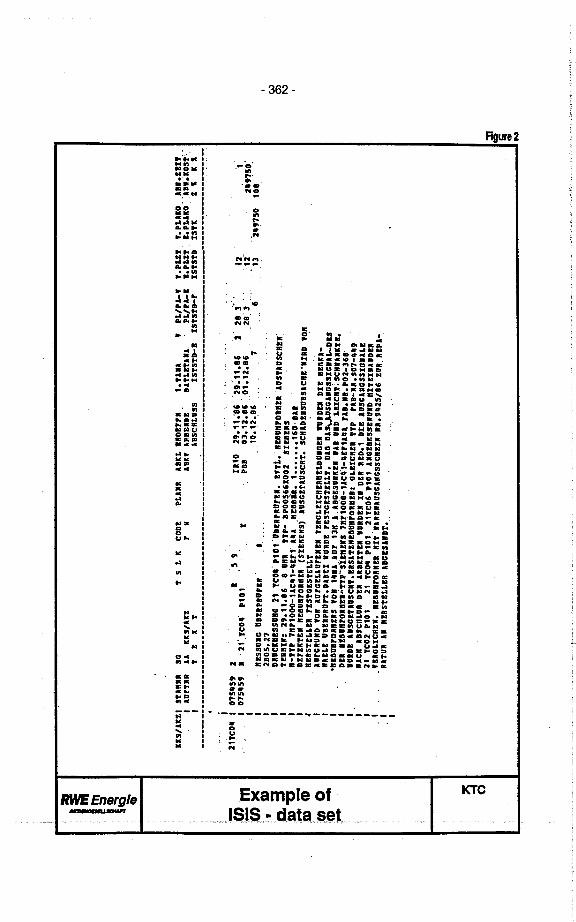
11fC ëj i-IIS/IIZ, S'IRIR sc , S L I COOL PLIIR laKL IROlrrl 1.'111 'PL/PI.' '.PLZT '.PLIIO lal.ZIIT
I lorTlR Al KU/lU r 11 IBU UBIIOI OITLET..I PL/Pl-I I.PLU. I.PLlKO. ...I.IOST'..'
.__.
_-_!
_._.
_....
~..~
..~_.
~_._
.._--
----
---_
.__.
_---
--~-
----
~~~~
~~~~
.--~
~~~~
~~~~
~~~~
--.~
~..~
~~~.
--.~
.~_.
~.~-
-. . ... .
1- icnm
lüi )
(I. m
ia. 3
Im "'
i--
im CD
IUJ
01(1 -
1-
21fC
"07
5'59
2 R
075'59 . I 21. tCO'. .,01
5 9
IIR
10PB
a29.11;16 29.11.86
03.1
2.86
. 01
.12.
8610. 12~16 .. 7
221 3
2813
6
'2 12"
13
. 1
2'97
50'
. .2'
9750
108
. .
l I I , I I I I I , I
RIS
SUIC
OB
IIPR
Orl
"2B
05.2
7ORUCKRISSOIC 21 tCOI. .,0, .081IPRUrii. I'TL. RI8U"rOI"IR .IUSTIUSCRII.
TlRRIR: 29.1'.86 8 UHR TYP- ap0056U002 SIIRIIIS .
R-TTP 7Rr1000-llC'I-,ir1. 1'1 .REBaàR. 1.......160. aAR
olrlKTEII RI8URroRRII (SIIRIIS) IUSCITIUSCRT. SCHIOlIISUISICHI '1110 'OR
RIISTILLIR rESTGESTILLT . . . . .
iurCRUIO '0" iurCILlurEIIII 'IRGLIICHIRRILOUIIGIII .,UROII OLL REBKI-
RilL
E u
allP
Rur
T. O
IBE
I IU
RO
I rE
STC
IST
ILL
T, 0
10 O
I~SG
IIIG
lSIC
IlL
~DIS
'RIBURroIRIIS '0" "RI iur 13R I. IBCESUIIKIII III .UIO. LIICHT; SCRIIIKTI.
OLL R!IU"rOIRII~TTp.SÏI"IIS 7"r1000~llcai.llril,1 ria.III. '02-368.
IUIO
I IU
SGIT
IUSC
IT.I
ISIT
ZR
IBU
R;O
Rnl
li G
LII
CR
IR T
TP
rl&
-IIR
.S07
-'"IIICR IISCRLU8 OLL IRBIITEI IUROII 11 OLL RIO.1 Oll lUSGIRCSSICIIILI
21 TC02 Pl0l 21 TCO' .,01 21'C06 PL0L IIGIRr.SSEIUIO RITIIIIIOIR
'IRG
LIC
HlI
. RII
UR
rOR
IIR
RIT
.IIR
I"IU
SCII
CSS
CR
III
IIR
; 9.2
5/86
ZU
R R
IPI-
IITUR lI HIISTELLER 18GISI.OT. . . .
I.
c. ~
~~ c ¡: N
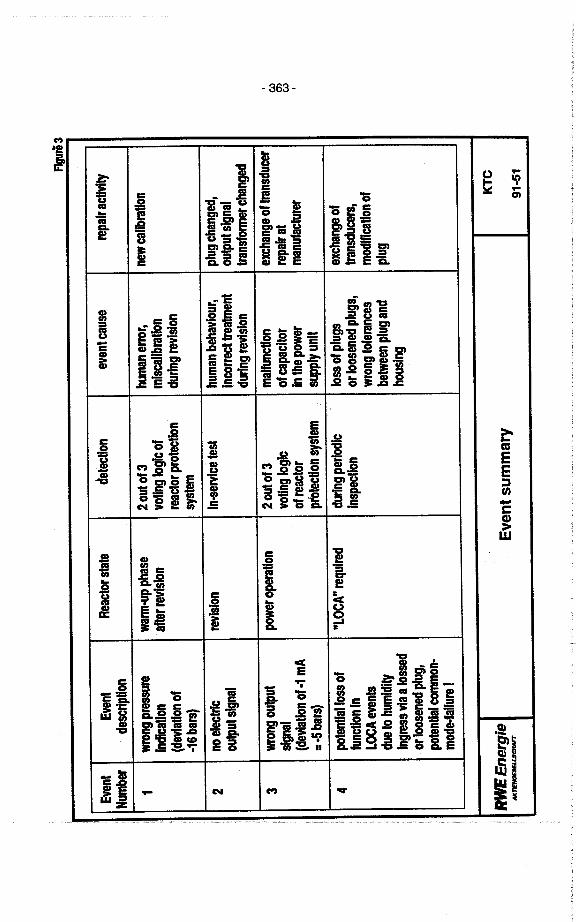
Ftgu
3
Eve
ntE
vent
Rea
ctor
sta
lede
tect
lon
even
tcau
sere
alr
actll
tyN
umbe
rde
srlp
tlon
1w
rng
pres
sur
wann-up phase
20ut
of3
human errr,
new
cal
Ibra
tIon
Indl
catlo
nafr reision
votln
g lo
glc
ofm
lscl
lbra
tlon
(deiation of
reac
lor
prot
ectlo
ndu
rlng
rev
isio
n
-16
bars
) sy
stem
2no
elec
trre
isio
nIn
-srv
lce
test
hum
an b
ehav
lour
,pl
ug c
hang
ed,
ouut
sig
nal
Incorrt treatment
outp
ut s
igna
ldu
rlng
rev
isio
ntrnsfonner changed
3w
rng
outp
utpower operation
2 ou
t of
3 m
alfn
ctlo
nexchange of trnsucer
sign
alvo
ting
logl
cof
cap
aclto
rre
alra
t(d
evia
tion
of.1
mA
ofre
acto
rIn
th
e po
wer
m
anuf
actu
rer
:.5
bars
) pr
otec
Uon
sys
tem
supp
lyun
lt
4po
tent
lallo
ss o
f"LOCA" relre
durl
ng p
erlo
dlc
loss
of p
lugs
exch
ange
of
func
Uon
lnIn
spet
lon
or lo
osen
ed p
lugs
,tr
nsdu
cers
LO
CA
even
tsw
rong
tole
ranc
esm
odlfc
atlo
n of
du to
hul
dlty
betw
een
plug
and
plug
Ingr
es v
ia a
loss
hous
lng
or I
oose
ned
plug
,
pote
ntia
l com
mon
-m
ode-
fallu
re I
RW
Ene
rgie
KT
C
Eve
nt s
umm
ary
NC
CH
91-5
1
, úJ 0) úJ ,
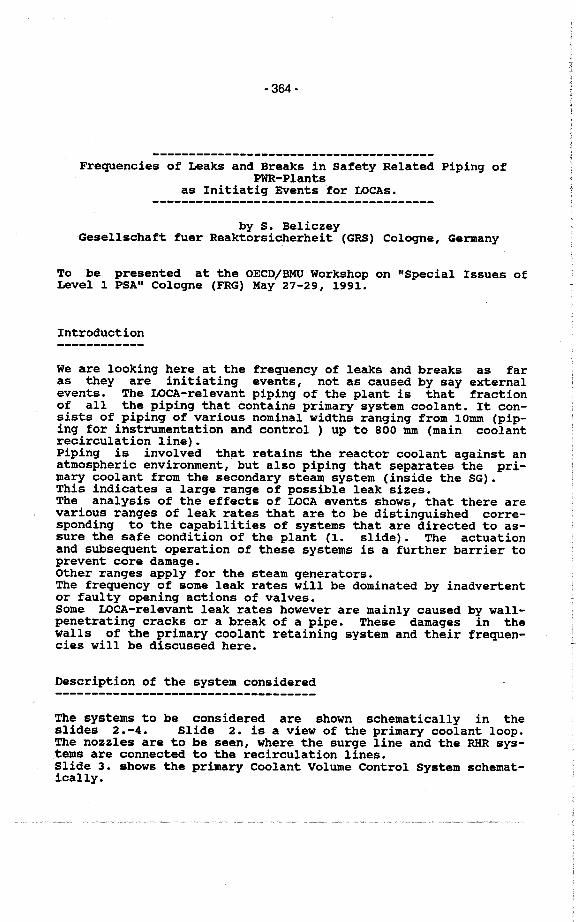
- 364-
Frequencies of Leaks and Breaks in Safety Related Piping ofPW-Plants
as Initiatig Events for LOCAs.
by S. BeliczeyGesellschaft fuer Reaktorsicherheit (GRS) Cologne, Germany
To be presented at the OECD/BMU Workshop on "Special Issues ofLevel 1 PSA" Cologne (FRG) May 27-29, 1991.
Introduction
We are looking here at the frequency of leaks and breaks as faras they are ini tiating events, not as caused by say externalevents. The LOCA-relevant piping of the plant is that fractionof all the piping that contains primary system coolant. It con-sists of piping of various nominal widths ranging from 10mm (pip-ing for instrumentation and control ) up to 800 mm (main coolantrecirculation line).Piping is involved that retains the reactor coolant against anatmospheric environment, but also piping that separates the pri-mary coolant from the secondary steam system (inside the SG).This indicates a large range of possible leak sizes.The analysis of the effects of LOCA events shows, that there arevarious ranges of leak rates that are to be distinguished corre-sponding to the capabilities of systems that are directed to as-sure the safe condition of the plant (1. slide). The actuationand subsequent operation of these systems is a further barrier toprevent core damage.Other ranges apply for the steam generators.The frequency of some leak rates will be dominated by inadvertentor faulty opening actions of valves.Some LOCA-relevant leak rates however are mainly causedpenetrating cracks or a break of a pipe. These damageswalls of the primary coolant retaining system and theirci es will be discussed here.
by wall-in the
frequen-
Description of the system considered
The systems to be considered are shown schematically in theslides 2. -4 . Slide 2. is a view of the primary coolant loop.The nozzles are to be seen, where the surge line and the RH sys-tems are connected to the recirculation lines.Slide 3. shows the primary Coolant Volume Control System schemat-ically.
-~-
Finally, slide 4 shows the Residual Heat Removal System. Thissystem is operated at pressure levels different from the pressureat normal power operation.In addition, leaks or breaks of the primary coolant retainingsystem inside the steam generators, i.e. of the SG-tubes, are tobe considered.
Distinctions are to be made with respect to the location of theleak for at least two reasons:To make a probabilistic statement on a LOCA it is necessary toknow whether the leak can be shut off from the reactor circui t.If yes, there is an additional barrier existing be fore a LOCA.The effect of a leak is not necessarily confined to the loss ofthe coolant. In some compartments it can cause the flooding ofequipment that is necessary for the actuation or operation ofimportant machinery.
Methodology
Now the question arises, how operating experience and theoret~calconsiderations can be used to determine frequencies of variousleak rates in various sections of the piping to be considered.
First, structures have to be identified that are liable to fail-ures. Experience shows, that cracks occur mainly at the vicinityof discontinuities such as wall thickness changes, branchings,junctions and turns. Usually such structures are manufactured byapplying welds. The frequency of failures in straight pipesections can be neglected in comparison with failures in thestructures just mentioned.Using these ideas, we come to the conclusion, that the frequencyof failures is not determined by the length of the piping, butrather by the numer of structures liable to failures. We callsuch structures risk relevant (or leak relevant) structures.Thus, operating experience and the statistics drawn from it isnot being related to a plant or a group of plants, but to theamount of risk relevant structures of various sizes that arepresent in all plants that are considered as da ta basis.
Now some remarks on the possible sizes of leaks: For piping de-signed and manufactured to the very stringent standards of theprimary system of a PWR and at the stress level given in such apiping, fracture mechanics considerations show, that the maximumleak size to be reasonably taken into account apart from atotal break of the guillotine type - is at about 2 per cent ofthe pipe total cross section. ( slide 5 ). This slide displaysall cross sections to be taken into account in the primary cir-cuit. .Slide 6 shows the amount of leak relevant structures.
- 366-
To use statistical evidence, not obtained but from operating ex-perience with the plant considered, can lead to an extremely pes-simistic estimation of frequencies and even to contradictions.Even additional experience with similar plants does not improvethe situation satisfactorily.For safety related piping in a PWR not only the number of leakand break occurences is low, but also the amount of operating ex-perience compared with that of other technical systems. The sta-tistics that can be drawn from this situation yields very largeuncertainties with respect to the frequencies that should be as-signed to leak and break occurrences. Further if no additionalmathematieal models were used, a zero occurences statistics forboth a leaking crack and a break within the same diameter cate-gory would mean the same frequency for both kinds of failure, ofcourse within the uncertainties given by such a statistics.
I am taking an example:The statistical evidence "In 100 years of operating experience nooccurrence of a break of a main coolant recirculation line."would lead to an interval estimation of the frequency:The 95% quantile of the frequency distribution of a break of sucha line is ït,s-== A.~)dO-~/rear
the mean value being ìi = SA.A~-"3lý-eCtv
This uncertainty in knowledge is rather useless!
Another example:The statistical evidence: "In 100 years no occurrence of even asmallest leak in a line of nominal width in the range DN 100-150. .. would yield the same estimate for the frequency of a leakas found in the previous example for a break.Engineering judqment would suqqest that the frequency of such asmall leak in a piping of less stringent quality assurance mustbe much larger than that of a break. in a 800 nominal width pip-ing!The resul ts of the two statistics mentioned, do not contradict tothis statement, though they cannot confirm it because of thegreat uncertainties involved.So what is to be done in such a situation?If zero occurrences (faults) statistics apply for an event, aprecursor of the event should be identified if possible.The statistics of this precursor may consist of more occurrences,or may still be based on zero occurrences.Anyway, the frequency of e. g. a break couldfrom the statistics of aprecursor e. g . of anyby the conditional probability that a leak isgiven that any leak has occurred.Though a representative distribution of the numer and the sizeof flaws and a statistics of the activation of crack generatingmechanisms is not known, a rough estimation of the ratio of thefrequency of a break to that of any leak fla I)~ has been tried.
then be estimatedleak, multipliedcaused by a break
- 367-
Considerations made at the estimation of this ratio are displayedon slide 8.operating experience with PWR primary circuit piping shows thatfor ON 25 piping (ON .. . nominal diameter in mm), taking ?8/~ =0. iis of the right order of magnitude. ~Probabilistic fracture mechanics calculations for large diameterPWR-piping e.q. /1/ (ON350 -800) show n~ -values that are byabout six orders of magnitude less than the corresponding
1i.-values. For BWR-piping AI3 differs from ?t. by three er moreorders of magnitude. However the assumptions cf these .calcu-lations are not satisfactory, the flaw distributions being takenfrom weld samples too little.Thes~ considerations and the intention of being conservative withtbe Jß/'L -values led us to a simple ansatz for the dependencyof/ on the nominal diameter of the piping considered.We take the relationship: / _ 2,~
Ì1 ß fit - ON'valid for the diameter range 25 to 200 mm.
In primary circuit piping in the range of ON 80 to ON 150 therehad been no occurrences of leaks even of the smallest size. Forpiping ON 50 three small leaks have been experienced. There havebeen no breaks.
Now we face the difficulty of having some piping of nominal widththat is present only in a very small amount. Applying zero faul tstatistics to such small amounts would again lead to results con-tradictory to the values obtained from piping of a similar butnot the same nominal width, but of a greater amount.For piping in the range ON 50 - ON 150 it was desirable thereforeto regard them as a common sample, to avoid too small referencesamples for zero leak occurrences. Though the diameters are dif-fering, the potential leak causing mechanisms are quite similardue to similar loadings and manufacturing criteria.
Considerations on the conditioning of leak-frequency on pipingsize /2/ yield relations shown on slide 9. The relation:
": C L.O1lL.'= '7is applicable if the stress level is kept konstant.L can be interpreted as the length of the piping as has been donein some statistics, or as the numer of risk relevant spots, aswe have done i tt is the wall thicknessC a factor of proportionality that can be determined from theoverall statistics.The exponent x can be determined on the basis of different hy-potheses but also from failure statistics of extended piping sys-tems.In our study the oft-ratio of the piping in the range of ON 50 -ON 150 has been constant O/t=10. The exponent was chosen 2, basedon /2/.
- 368-
The weighting of the piping of different diameters for the leakfrequency from statistics has been performed with formula (2(slide 9)).Piping with nominal width equal or greater 250 mm within the pri-mary circuit meets the break exclusion considerations.
The description of the conditions needed for break exclusionwould need some more time than available now.
However if statements in terms of probabilities are needed, wecannot set the frequency of a break zero.Worldwide probabilistic fraeture meehanics calculations show re-sul ts for the frequency of a break of such piping that are muchbelow 10**-9/year.Because of some reservat ions with respect to the assumptions ofthose studies we restrict our statements to:"The frequency of breaks of a piping of nominal width equal orgreater 250 mm is less than 10**-7/year."We regard this as a conservative statement.Now let me outline the considerations that have been made to de-termine the frequency of leaks in the steam generator:
Different ranges of leak rates are to be distinguished here ascompared to the piping considered so far. The reason ~s, thatprimary coolant leaking out through the steam generators 1S get-ting outside the containment and therefore lost for emergencycore cool ing .Experience with SG-tube deteriorations shows that no mechanism isto be expected that causes the break of more than one tube simul-taneously, except for the impact of the break of one tube on oneof i ts neighbors. Thus the break of one tube can be regarded asaprecursor of a multiple break. The probability of a breakingtube to cause the break of a neighboring one is considered to belittle, but of course not zero.For the frequency estimation of the break of a single SG-tube, azero faults statistics, derived from the experience with KW-typePWRs has been used. The statistics is based on an experience ofabout 90 years of operation.The frequency of a simultaneous break of two SG-tubes has beencalculated by a Monte Carlo simulation of the impact of a break-ing tube on its neighbors.
Before showing the results, some general remarks on the method todetermine the frequencies should be made.The results are distributions that say what we currently knowabout the frequency of the events we are interested in (e.g. abreak) .We try to find some generic data, to form a prior probabilitydistribution for the unknown failure frequency. This distributionis to be updated or specialized by specific statistical evidenceusing Bayes' theorem.To get generic da ta turned out to be difficult owing to the veryspecific operation conditions of the primary system of a PWR.
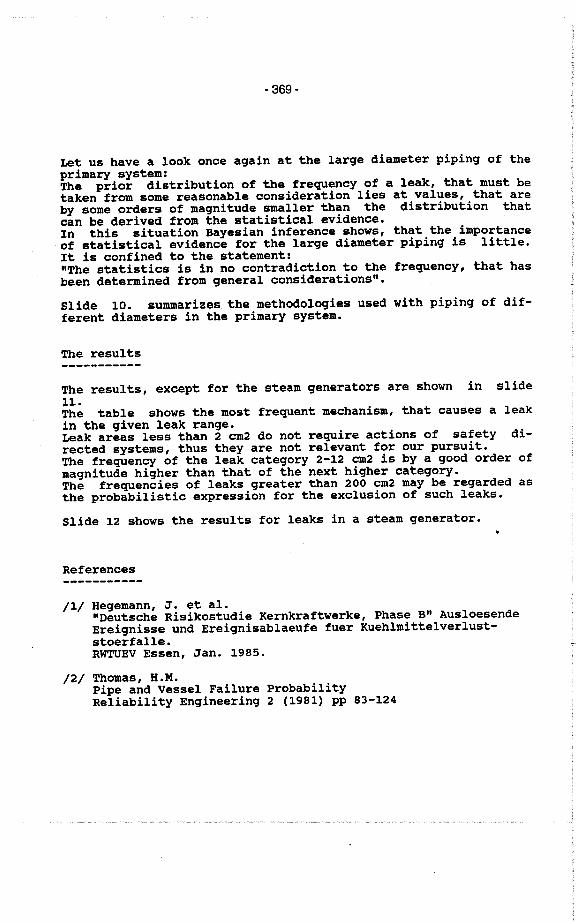
- 369-
Let us have a look once again at the large diameter piping of theprimary system:The prior distribution of the frequency of a leak, that must betaken from some reasonable consideration lies at va
lues , that are
by some orders of magnitude smaller than the distribution thatcan be derived from the statistical evidence.In this situation Bayesian inference shows, that the importanceof statistical evidence for the large diameter piping is little.It is confined to the statement:"The statistics is in no contradiction to the frequency, that hasbeen determined from general considerations".
Slide 10. summarizes the methodoloqies used with pipinq of dif-ferent diameters in the primary system.
The results
The results, except for the steam generators are shown in slide11.The table shows the most frequent mechanism, that causes a leakin the qiven leak range.Leak areas less than 2 cm2 do not require actions of safety di-rected systems, thus they are not relevant for our pursuit.The frequency of the leak category 2-12 cm2 is by a good order ofmagnitude higher than that of the next higher category.The frequencies of leaks greater than 200 cm2 may be regarded asthe probabilistic expression for the exclusion of such leaks.
Slide 12 shows the results for leaks in a steam generator.
References
/1/ Hegemann , J. et al."Deutsche Risikostudie Kernkraftwerke, Phase B" AusloesendeEreignisse und Ereignisablaeufe fuer Kuehlmi ttel verlust-stoerfalle.RWTEV Essen, Jan. 1985.
/2/ Thomas, H.M.Pipe and Vessel Failure ProbabilityReliability Engineering 2 (1981) pp 83-124
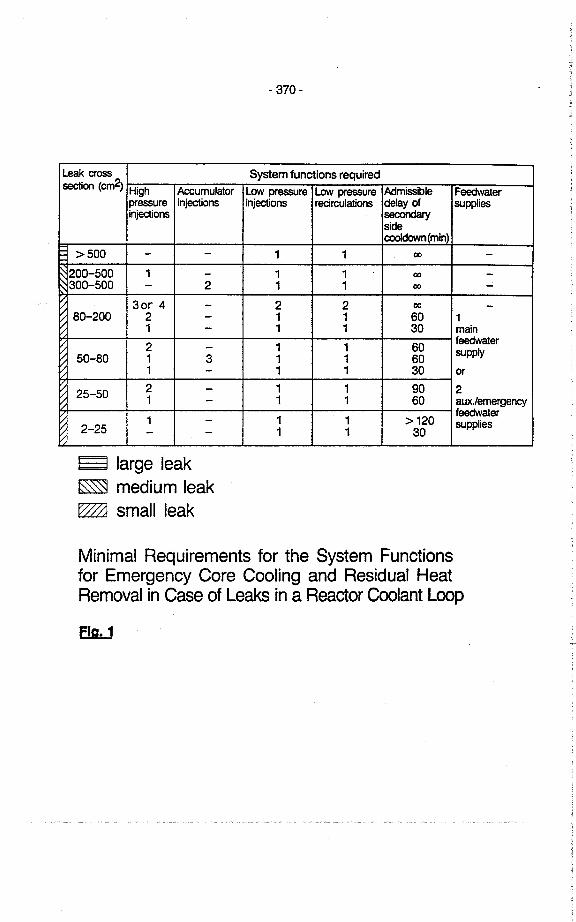
- 370-
Leak cro System funetions requiredseion (cm2) High Acumulator Lo presure Lo presure Admisible Feeter
presure injecons injecons recrculations delay of suppliesinjeons se
sielcodo(min)
::500 - - 1 1 00 -200-500 1 - 1 1 00 -300-500 - 2 1 1 00 -
30r 4 - 2 2 00 -80-200 2 - 1 1 60 1
1 - 1 1 30 main
2 1 1 60feeter-supply50-80 1 3 1 1 60
1 - 1 1 30 or
25-50 2 - 1 1 90 21 - 1 1 60 auxJemergncy
1 1 1 ::120feater-supplies2-25 - - 1 1 30
E1 large leak~ medium leak
Wj small leak
Minimal Requirements for the System Functionsfor Emergency Core Cooling and Residual HeatRemoval in Case of Leaks in a Reactor Coolant Loop
El
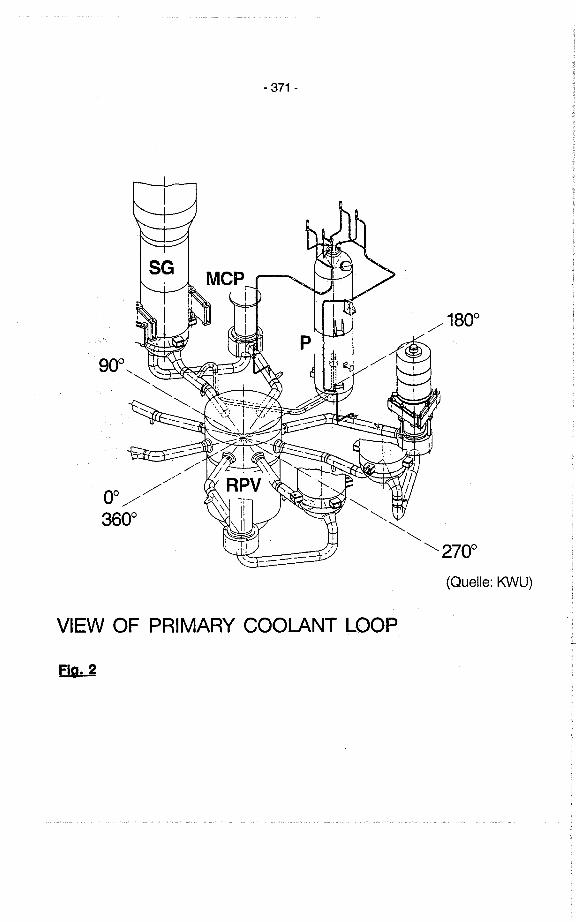
- 371 -
1800/'
~""
"" """"270°
(Quelle: KWU)
VIEW OF PRIMARY COOLANT LOOP
Flg.2
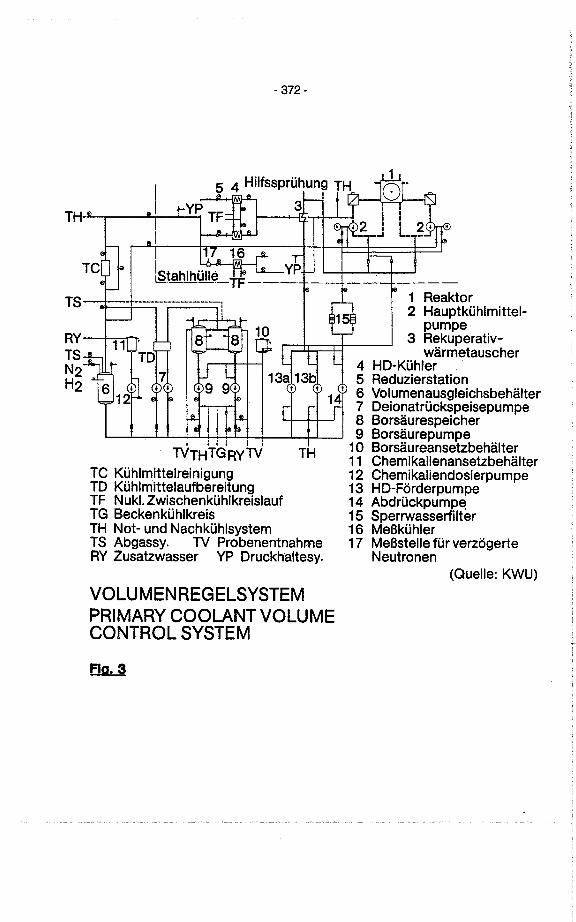
.372.
TH-
T8
RYT8N2H2
i i l l f lTVTHTGRYTV TH
TC KühlmittelreinigungTO KühlmittelaufbereitungTF Nukl. ZwischenkühlkreislaufTG BeckenkühlkreisTH Not- und NachkühlsystemT8 Abgassy. TV ProbenentnahmeRY Zusatzwasser YP Oruckhaltesy.
VOLUMENREGELSYSTEMPRIMARY COOLANT VOLUMECONTROL SYSTEM
Rg. S
1 Reaktor2 Hauptkühlmittel-
pumpe3 Rekuperativ-
wärmetauseher4 HO-Kühler5 Reduzierstation6 Volumenausgleichsbehälter7 Oeionatrückspeisepumpe8 Borsäurespeicher9 Borsäurepumpe10 Borsäureansetzbehälter11 Chemikalienansetzbehälter12 Chemikaliendosierpumpe13 HD-Förderpumpe14 Abdrückpumpe15 8perrwasserfilter16 Meßkühler17 Meßstelle für verzögerte
Neutronen(Quelle: KWU)
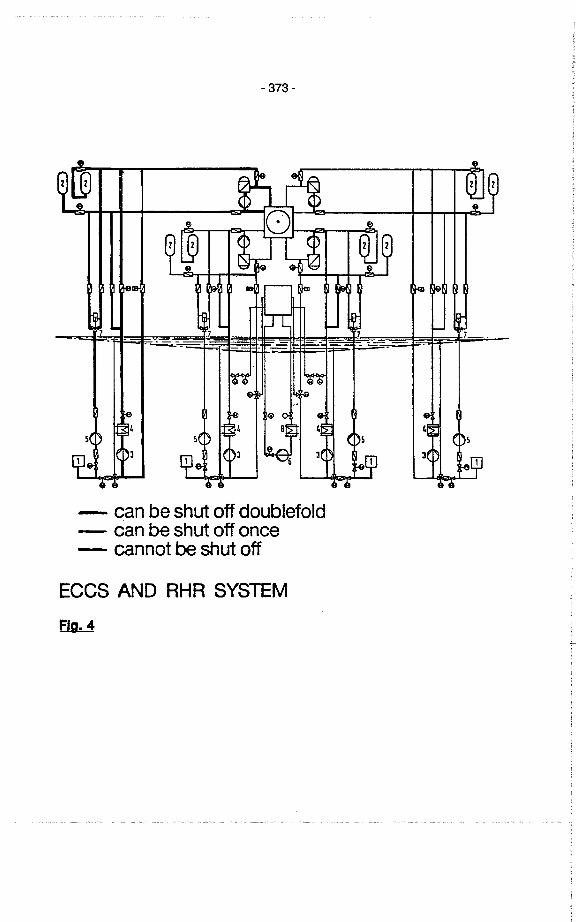
- 373-
1._- -.~': - - -;.-
- can be shut off doublefold- can be shut off once- cannot be shut off
ECCS AND RHR SYSTEM
El
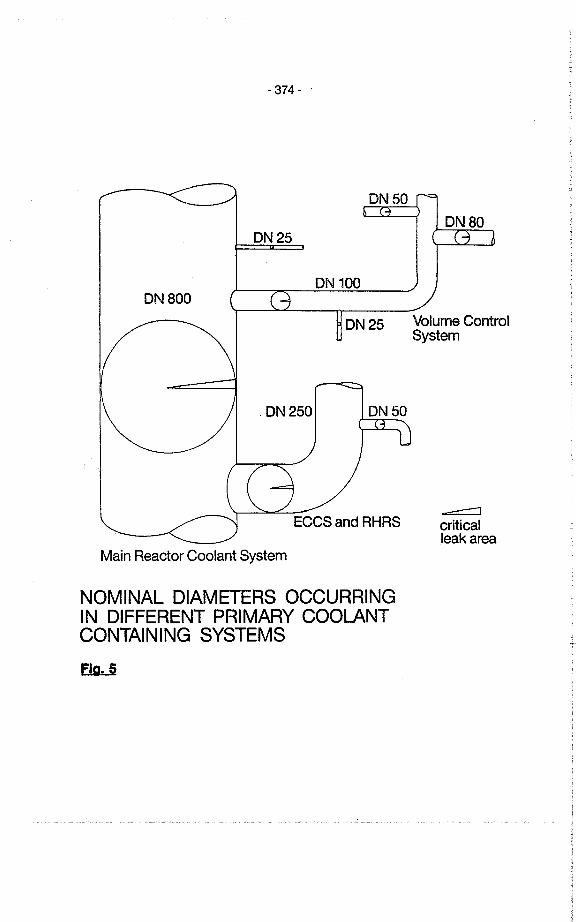
- 374 - .
DN50
DN25
DN 100DN800
DN25
. DN250
Main Reactor Coolant System
NOMINAL DIAMETERS OCCURRINGIN DIFFERENT PRIMARY COOLANTCONTAINING SYSTEMS
Flg.5
Volume ControlSystem
-=criticalleakarea
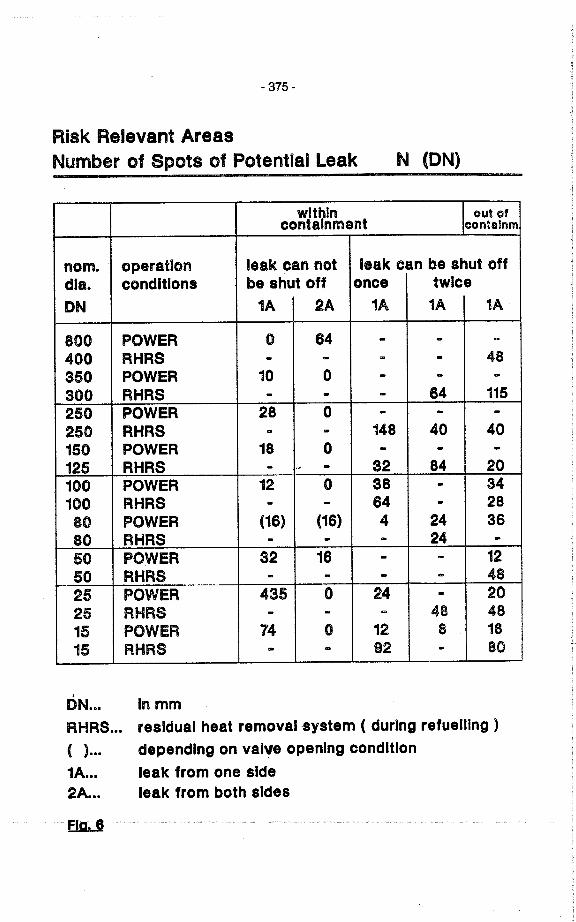
- 375-
Risk Relevant AreasNumber of Spots of Potential Leak N (ON)
wlthln out ofcontainment contalnm
nom. operation leak can not leak can be shut offdia. condltlons be shut off once twlceON 1A 2A 1A 1A 1A
800 POWER 0 64 - - -
400 RHRS - - - - 48350 POWER 10 0 - - -
300 RHRS - - - 64 115
250 POWER 28 0 - - -
250 RHRS - - 148 40 40150 POWER 18 0 - - -125 RHRS - -' - 32 84 20100 POWER 12 0 38 - 34100 RHRS - - 64 - 2880 POWER (16) (16) 4 24 3680 RHRS - - - 24 -
50 POWER 32 16 - - 12
50 RHRS .. - - - 4825 POWER 435 0 24 - 2025 RHRS - - ~ 48 4815 POWER 74 0 12 8 18
15 RHRS OB - 92 .. 80
.
ON...
RHRS...
( )...1A...2A...
lnmmresidual heat removalsystem ( durlng refuellng )dependlng on valve openlng condltlonleak from one sldeleak from both sldes
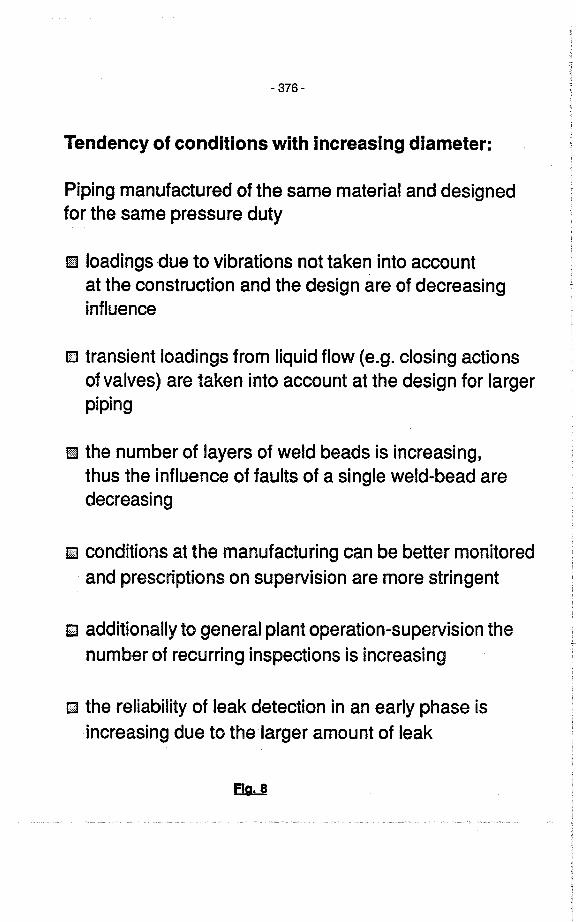
- 376-
Tendency of conditions with increasing diameter:
Piping manufactured of the same material and designedfor the same pressure duty
lI loadings due to vibrations not taken into accountat the construction and the design are of decreasinginfluence
li transient loadings from liquid flow (e.g. closing actions
ofvalves) are taken into account at the design for largerpiping
11 the number of layers of weid beads is increasing,thus the influence of faults of a single weld-bead aredecreasing
ii conditions at the manufacturing can be better monitoredand prescriptions on supervision are more stringent
li additionally to general plant operation-supervision thenumber of recurring inspections is increasing
EI the reliabilty of leak detection in an early phase isincreasing due to the larger amount of leak
El
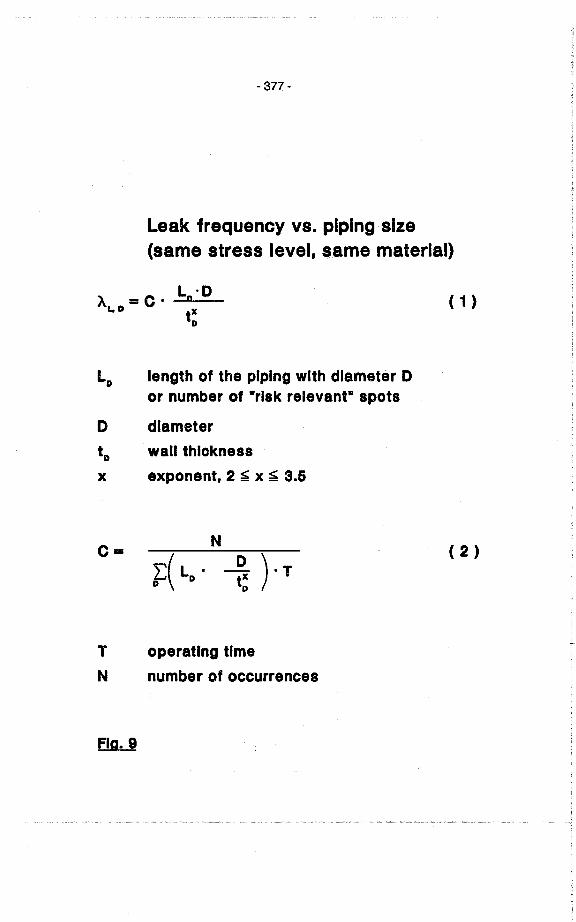
- 377-
Leak frequency vs. plplng slze(same stress level, same material)
l -0À = C. 0L, D tXD
( 1 )
lD length of the plplng wlth diameter 0or number of -rlsk relevant- spots
o diametertD wall thlcknessx exponent. 2 ~ x ~ 3.6
c= o--D ) . T
( 2 )
T operating timeN number of occurrences
Flg.9
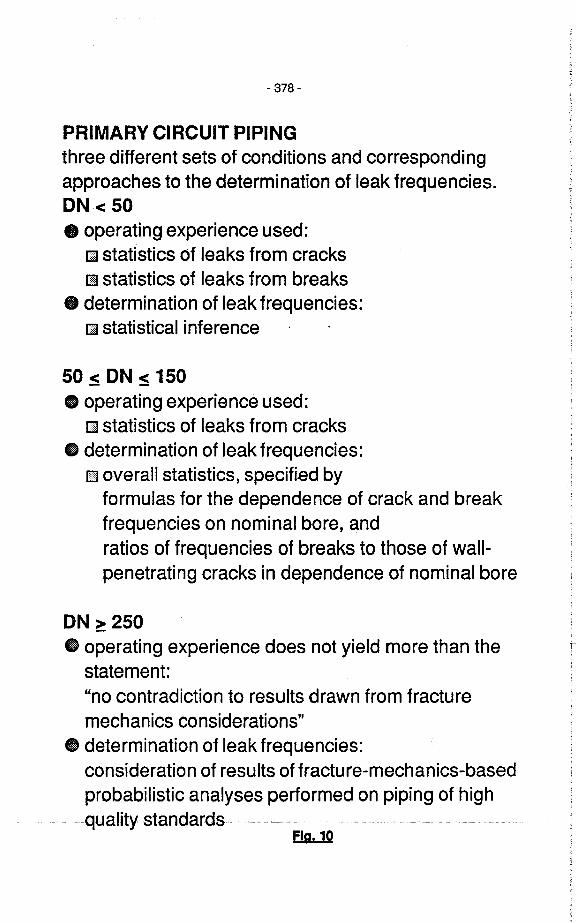
- 378-
PRIMARY CIRCUIT PIPINGthree different sets of conditions and correspondingapproach es to the determination of leak frequencies.ON c: 50. operating experience used:
IE statistics of leaks from cracksIm statistics of leaks from breaks
. determination of leak frequencies:
IË statistical inference
50 c: ON :s 150. operating experience used:
üi statistics of leaks from cracksGD determination of leak frequencies:
IE overall statistics, specified byformulas for the dependence of crack and breakfrequencies on nominal bore, andratios of frequencies of breaks to those of wall-penetrating cracks in dependence of nominal bore
ON ~ 250. operating experience does not yield more than the
statement:"no contradiction to results drawn from fracturemechanics considerations"
. determination of leak frequencies:
consideration of results of fracture-mechanics-basedprobabilistic analyses performed on piping of high
.....qualitystal"dards .. ... .... .........E!
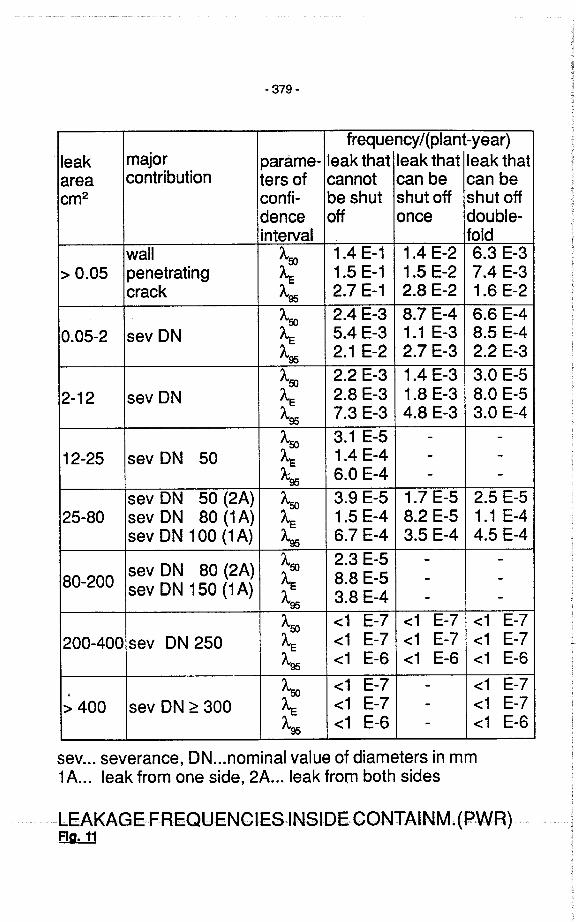
- 379-
frequency / (plant -year)
leak major parame- leakthat leak that leak thatarea contribution ters of cannot can be can becm2 confi- be shut shut off shut off
dence off once double-interval fold
wall À5) 1.4 E-1 1.4 E-2 6.3 E-3
~ 0.05 penetrating Àe 1.5 E-1 1.5 E-2 7.4 E-3
crack À95 2.7 E-1 2.8 E-2 1.6 E-2
À5) 2.4 E-3 8.7 E-4 6.6 E-4
0.05-2 sevON Àe 5.4 E-3 1.1 E-3 8.5 E-4
À95 2.1 E-2 2.7 E-3 2.2 E-3
À5) 2.2 E-3 1.4 E-3 3.0 E-5
2-12 sev ON Àe 2.8 E-3 1.8 E-3 8.0 E-5
À95 7.3 E-3 4.8 E-3 3.0 E-4
À5) 3.1 E-5 - -
12-25 sev ON 50 Àe 1.4 E-4 - -
Â: 6.0 E-4 - -95
sev ON 50 (2A) À5) 3.9 E-5 1.7 E-5 2.5 E-5
25-80 sev ON 80 (1 A) Àe 1.5 E-4 8.2 E-5 1.1 E-4sev ON 100 (1A) À95 6.7 E-4 3.5 E-4 4.5 E-4
À5) 2.3 E-5 - -sev ON 80 (2A)
80-200 sev ON 150 (1A) Àe 8.8 E-5 - -
À95 3.8 E-4 - -
À5) ~1 E-7 ~1 E-7 ~1 E-7
200-400 sev ON 250 ÀE ~1 E-7 ~1 E-7 ~1 E-7À95 ~1 E-6 ~1 E-6 ~1 E-6
À50 ~1 E-7 - ~1 E-7.
~ 400 sev ON ~ 300 Àe ~1 E-7 - ~1 E-7À95 ~1 E-6 - ~1 E-6
sev... severance, DN...nominal value of diameters in mm1 A... leak from one side, 2A... leak fram both sides
~..bEAKAG..E....¡;R..6QU.ENGI..6SI.NSID6COWTAI.N.M~òf~Wfl)...~..Flg.11
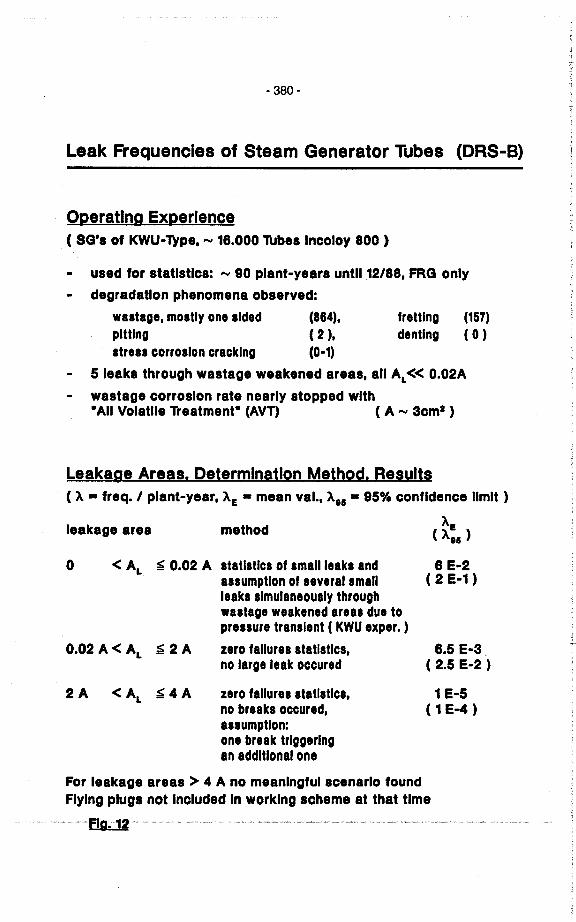
- 380-
Leak Frequencles of Steam Generator Tubes (DRS-B)
Operating Experlence( SG'. 01 KWU- Type, "" 18.000 Tubes Ineoloy 800 )
used lor atatlstles: "" 90 plant-yeara untll ~2/88, FRG only
degradation phenomena observed:waitage, moitly one ilded (864),plttlng ( 2 ),itre.. corroilon cracklng (0-1)
5 leaka through wastage weakened areai, all AL oioi 0.02A
waitage eorroslon rate nearly itopped wlth-All Volatlle Treatment- (AVT) ( A "" 3em2 )
frettlngdentlng
(157)
( 0 )
Leakage Areai. Determination Method. Results( A · Ireq. I plant-year, AE · mean val., Ais · 95% eonfldenee limit)
AE
( Ais )leakage area method
o oi AL ~ 0.02 A itatlitlci 01 imailleaki andiiiumption 01 ieveralimall
leaki ilmulaneouily through
wiitage weakened areii due topreiiure tranilent ( KWU exper. )
zero fallurei itatlitlci,
no large leak occured0.02 A oi AL ~ 2 A
2 A oi AL ~ 4 A zero fallurei itatlitlci,
no breaki occured,
iiiumptlon:one break trlggerlngan addItional one
For leakage area. ~ 4 A no meanlngful scenario lound
Flylng pluga not Ineluded In worklng seheme at that tIme
8 E-2( 2 E-1 )
8.5 E-3.( 2.5 E-2 )
1 E-5( 1 E-4 )
- 381 -
CSNI WORKSHOP ON
SPECIAL ISSUES OF LEVEL.1 PSA
Colone, Germny
27th.29th May 1991
Evaluation of Low Power and Shutdown Events in German PWRs
byM.Simon
Gesellshaft fuer Reaktorsicherheit
- 382-
1. Introduction
The safety of nuclear power plants du ring shutdown and low power operation is an
area of concem in nuclear business today. Regulatory bodies and other responsible
organizations all over the world show a high interest in the investigation of the
shutdown risk after first preliminary results of U.S. and French studies. DecaY.heat
rem oval must be ensured during any operation mode, but the requirements on the
respective systems are often reduced in the shutdown modes. Some of the safety
systems or their components may be inactivated for inspection and maintenance,
automatie interlocks wil be switched off. However, the time available after an event to
perform manual recovery actions is comparatively long. Results from former PSA
cannot be fully applied to shutdown mode because of the different status of significant
safety systems during power operation and the time available for recovery actions.
The operation of PWRs with reduced inventory in the reactor coolant system (RCS)
was perceived as a particularly sensitive condition by operating experience. Another
area of concern is the unintentional criticality du ring shutdown. In PWRs unintentional
criticality can bccur as a consequence of boron dilution in the RCS.
The results of the French PSA back the need for a careful and detailed evaluation of
plant safety during low power operation and shutdown. The core damage frequency
during these operation modes contributes substantialy to the overall core damage
frequency in French PWRs.
Althoughoperating modes Iike reduced inventory in the RCS or boration and dilution
of the RCS are specific for PWRs, there are other areas which can affect both PWRs
and BWRs, such as complete loss of AC power or loss of coolant du ring shutdown.
2. GRS . Study on Shutdown Risk
2.1 Scope ofthe Study
The results of the French PSA initiated a study for German PWRs (sponsored by
BMU) which is performed by GRS. Our study shall investigate the applicabilty of the
French findings on German PWRs. The reference plant the study was Unit
- 383-
B, because this plant was also the reference plant for the German risk study. The
study which is performed in co-operation with the utilty is divided into two parts:
In phase one a qualiative assessment of the applicabilty of results of the French
PSA and of foreign events related to non-power operation should be performed.
This phase of the study includes the investigation of existing measures (hardware,
design, administrative) to prevent such events and to cope with them,respectively. The possible consequences of those events should be assessed.
Finally, relevant sequences should be selected for an indepth analysis in phase
two of the study. In addition the assessment should show whether there are event
sequences, which require short term corrective actions.
In phase two of the study. selected event sequencesfrom phase one wil beinvestigated more detailed using both PSA methods to assess the contnbution to
core damage frequency as weil as thermal-hydraulic and neutron-kinetic codes to
evaluate the consequences of such events. Phase two shall providerecommendations for possible improvements if necessary.
Phase one of the study was finished in Apnl 1991. The following event sequences
were investigated:
loss of decay heat rem oval
loss of coolant
inadvertent dilution
loss of vital AC power.
Following the qualitative assessment two of these events were evaluated in more
detail: loss of decay heat removal and inadvertent dilution. These events will be
discussed in this paper.
To assess the impact of these events on plant safety, the existing countermeasures
have to be taken into account. These include the prevention of the initiating event and
the abilty to cope with the event if it has occurred (recovery actions). The
countermeasures contain hardware measures Iike interlocks, instrumentation and
control as weil as administrative measures. The adminstrative measures include e.g.
requirements on the availabilty of RHRS-trains in different plant operation modes and
- 384-
proeedures in the operating manuaL. Additionally, feasible aeeident management (AM)
measures have been eonsidered.
2.2 Loss of Decay Heat Removal During Mid.Loop Operation
As the eoolant inventoiy in the RCS is rather small in mid-Ioop operation, a loss of
decy heatremoval may result in a fast inerease in temperature up to boilng in the
core depending on the time period sinee shutdown. Two sequenees may result in a
loss of shutdown eooling in this mode:
loss of Residual Heat Removal (RHR) funetion beeause of air binding of the RHR
pumps (figure 1)
loss of RHR funetion beeause of eomponent unavailabilty.
For these two scenarios the probabilty of a loss of deeay heat rem oval during
mid-Ioop operation was estimated for the referenee plant. With respeet to loss of RHR
because of air binding the proeedure for lowering the RCS level from full to mid-Ioop,
the existing level monitoring, the automatie measures to prevent pump eavitation and
the recovery aetions after possible loss of RHR pumps were evaluated. Figure 2
shows the mid-Ioop level monitoring of the referenee plant. It eonsists of two level
transmitters with different measuring ranges. The mid-Ioop level monitoring deviee is
permanently installed, but it is not aetive during power operation. Before lowering the
level in the RCS the level monitoring has to be taken into service by manual aetions.
The provisions to prevent a loss of RHR at mid-Ioop operation because of air binding
can be summarized as folIows:
redundant loop level instrumentation,
exaet proeedure to take the loop level instrumentation into service and to verify its
proper operation,
exaet proeedure for level reduetion in the RCS,
automatie reduetion of RHR pump f10w before entering the redueed level
operation,
automatie isolation of letdown flow if loop level deereases below mid-Ioop,
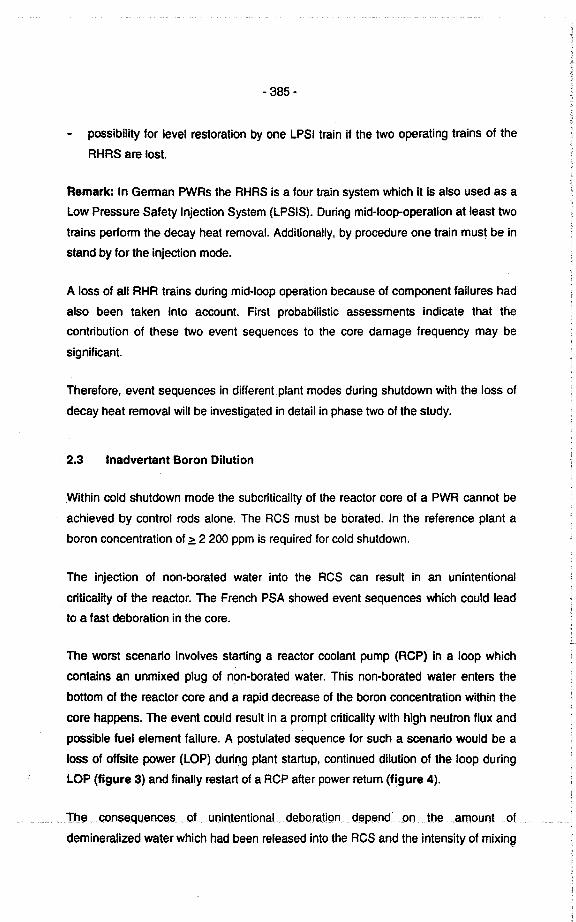
- 385-
possibilty for level restoration by one LPSI train if the two operating trains of the
RHRS are lost.
Remark: In German PWAs the RHAS is a four train system whieh it is also used as a
Low Press ure Safety Injeetion System (LPSIS). During mid-Ioop-operation at least two
trains perform the deeay heat rem ovaL. Additionally, by proeedure one train must be in
stand by for the injeetion mode.
A lass of all AHA trains during mid-Ioop operation beeause of eomponent failures had
also been taken into aeeount. First probabilstic assessments indicate that theeontribution of these two event sequences to the core damage frequeney may be
signifieant.
Therefore, event sequenees in different plant modes during shutdown with the loss of
decay heat removal wil be investigated in detail in phase two of the study.
2.3 Inadvertant Boron Dilution
Within cold shutdown mode the subcriticality of the reaetor core of a PWR cannot be
achieved by contral rads alone. The RCS must be bòrated. In the reference plant a
boron coneentration of ~ 2 200 ppm is required for cold shutdown.
The injeetionof non-borated water into the RCS can result in an unintentional
criticality of the reactor. The French PSA showed event sequences which could lead
to a fast deboration in the core.
The worst scenario involves starting a reactor coolant pump (RCP) in a lcop which
contains an unmixed plug of non.borated water. This non.borated water enters the
bottom of the reactor core and a rapid decrease of the boron concentration within the
core happens. The event could result in a prompt criticality with high neutron flux and
possible fuel element failure. A postulated sequence for such a scenario would be a
loss of offsite power (LOP) during plant startup, continued dilution of the loop du ring
LOP (figure 3) and finally restart of a RCP after power retum (figure 4).
.. .... .IhEtConsequencesot..unintentionat.deboratioO.depeodontheamount.otdemineralized water which had been released into the RCS and the intensity of mixin9
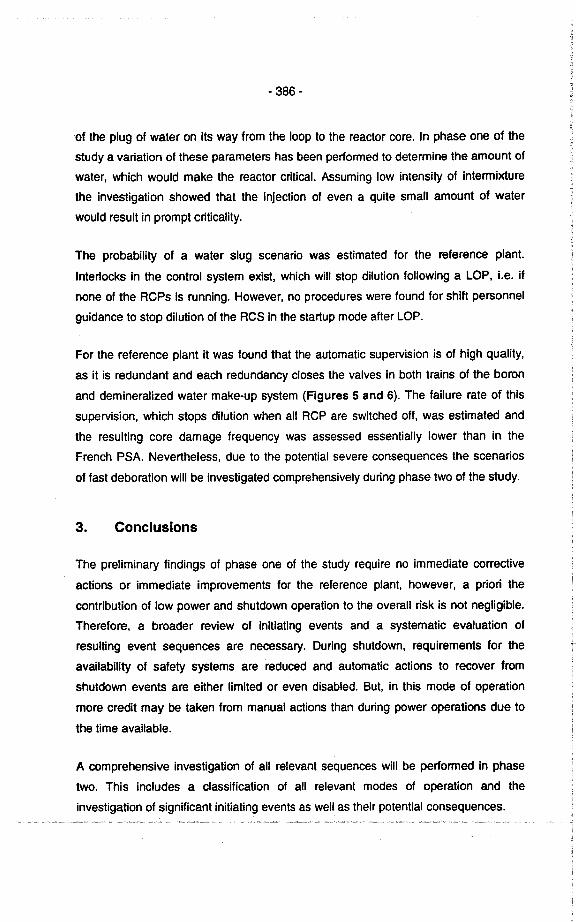
- 386-
of the plug of water on its way from the loop to the reactor core. In phase one of the
study a variation of these parameters has been performed to determine the amount of
water, which would make the reactor critical. Assuming low intensity of intermixture
the investigation showed that the injection of even a quite sm all amount of water
would result in prompt criticaliy.
The probabilty of a water slug scenario was estimated for the reference plant.
Inter10cks in the control system exist, which wil stop dilution following a LOP, Le. if
none of the RCPs is running. However, no procedures were found for shift personnel
guidance to stop dilution of the RCS in the startup mode after LOP.
For the reference plant it was found that the automatie supervision is of high qualiy,
as it is redundant and each redundancy closes the valves in both trains of the boron
and demineralized water make-up system (Figures 5 and 6). The failure rate of this
supervision, wh ich stops dilution when all RCP are switched off, was estimated and
the resulting core damage frequency was assessed essentially lower than in the
French PSA. Nevertheless, due to the potential severe consequences the scenarios
of fast deboration will be investigated comprehensively during phase two of the study.
3. Conclusions
The preliminary findings of phase one of the study require no immediate corrective
actions or immediate improvements for the reference plant, however, a prioii the
contribution of low power and shutdown operation to the overall risk is not negligible.
Therefore, a broader review of initiating events and a systematie evaluation of
resulting event sequenees are neeessary. Ouring shutdown, requirements for the
availabilty of safety systems are redueed and automatie actions to recover from
shutdown events are either Iimited or even disabled. But, in this mode of operation
more eredit may be taken from manual aetions than during power operations due to
the time available.
A eomprehensive investigation of all relevant sequenees wil be performed in phase
two. This ineludes a classifieation of all relevant modes of operation and theinvestigation of significant initiating events as weil as their potential eonsequences.
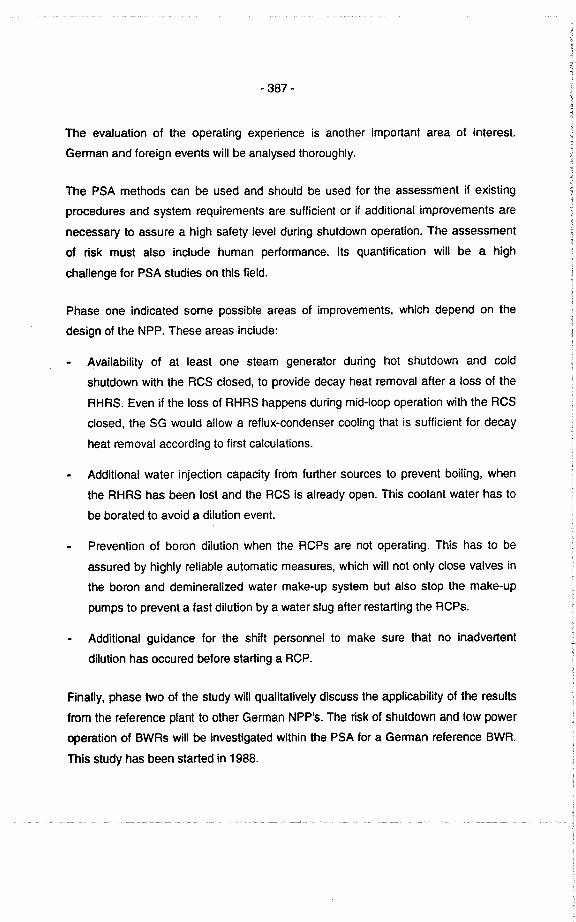
- 387-
The evaluation of the operating experience is another important area of interest.
Gennan and foreign events will be analysed thoroughly.
The PSA methods can be used and should be used for the assessment if existing
procedures and system requirements are suffcient or if additional improvements are
necessary to assure a high safety level during shutdown operation. The assessment
of risk must also include human performance. Ils quantification will be a high
challenge for PSA studies on this field.
Phase one indicated some possible areas of improvements. which depend on the
design of the NPP. These areas include:
Availability of at least one steam generator during hot shutdown and cold
shutdown with the RCS closed, to provide decay heat removal after a 1055 of the
RHRS. Even if the 1055 of RHRS happens during mid-Ioop operation with the RCS
closed, the SG would allow a reflux-condenser cooling that is suffcient for decay
heat removal according to first calculations.
Additional water injection capacity from further sources to prevent boiling, when
the RHRS has been lost and the RCS is already open. This coolant water has to
be borated to avoid a dilution event.
Prevention of boron dilution when the RCPs are not operating. This has to be
assured by highly reliable automatie measures, which will not only e10se valves in
the boron and demineralized water make-up system but also stop the make-up
pumps to prevent a fast dilution by a water slug after restarting the RCPs.
Additional guidance for the shift personnel to make sure that no inadvertent
dilution has occured before starting a RCP.
Finally, phase two of the study wil qualitatively discuss the applicability of the results
fram the reference plant to other German NPP's. The nsk of shutdown and low power
operation of BWRs wil be investigated within the PSA for a German reference BWR.
This study has been started in 1988.
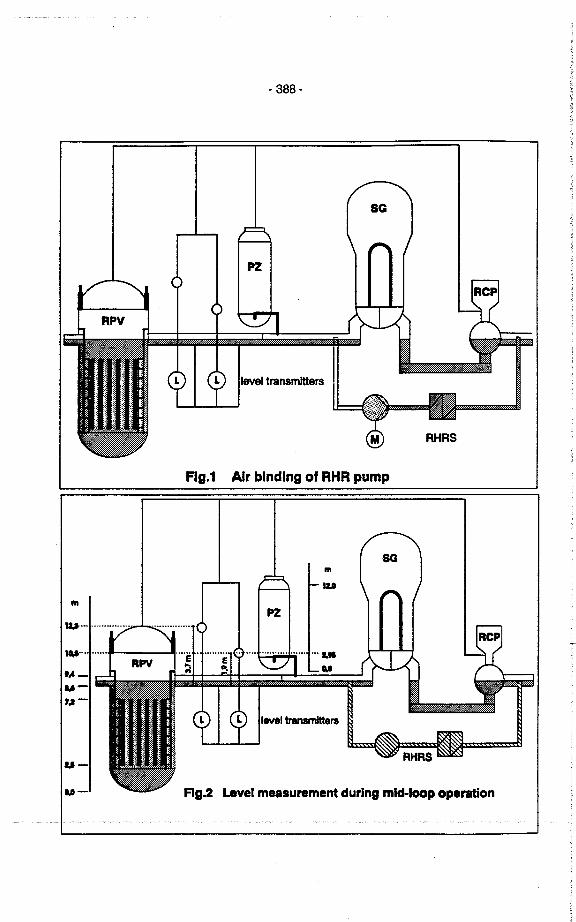
- 388-
SG
PZ
Flg.1 Air binding of RHR pump
11
Wl
11
PZ
...........
u-1,- F1g.2 Level measurement durlng mld-loop operaon
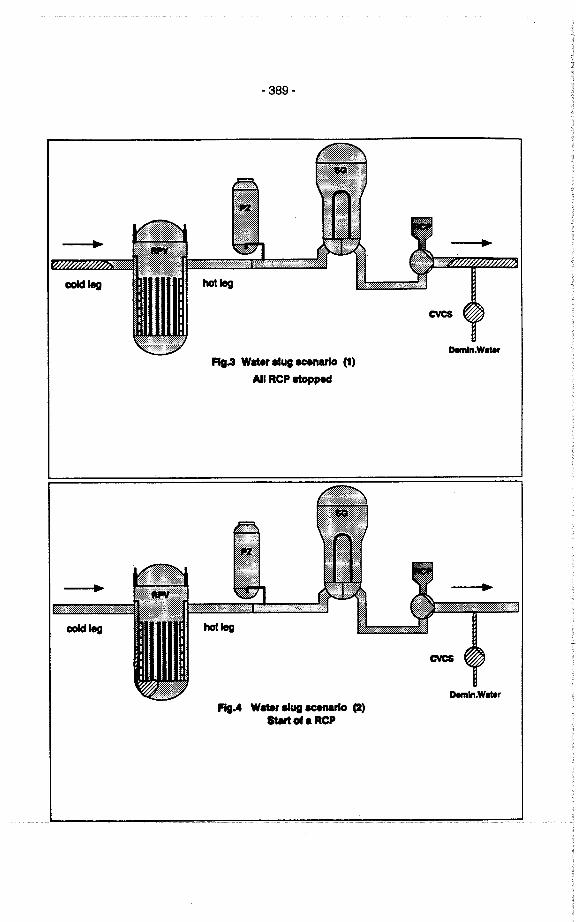
--co le
--co le
- 389-
~
::::~:~ø::"
Den.WairFI.3 Widr a1ull acnaro (1)
All RCP atppe
;=:;:=:j:j:j:¡;tj:
FlA Wli a1US acño (2)swotaRCP
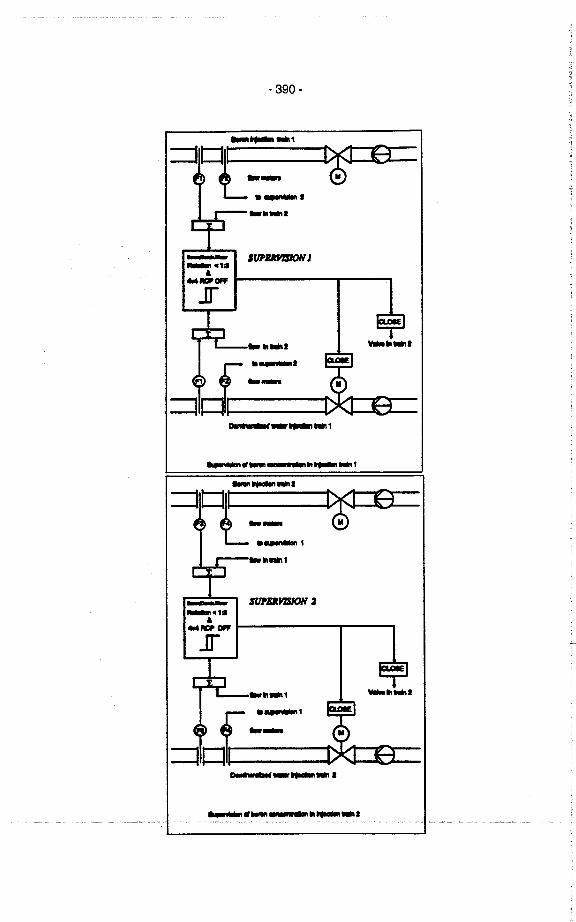
.390 -
-..-I
- ,UPUJ J_e1a.'-1I0f.I
ri
~ ...1--:: i:
DI_.... 1
__.._I
..----....-,:: t:=:'-'L...,
_.._,
'UPDYI 2
~ ...,..-
:: i: Di.__~_1
ri
__.._I
..____...._1
- 391 -
CSNI WORKSHOP ON SPECIAL 1S50E5 OF LEVEL-l PSA
27/29 ~AY, 1991 - COLOGNE GERMANY
LIVING P5S USED TO SUPPORT THE DEVELOPMENT OF A NEW
GENERATION OF BWR
V. CAVICCHIA - E. TRAINI
INEL - 1TALY
L. MATTEOCCI - A. VALERI
ENEA D1SP -ITALY
- 392-
INTRODUCTION
In 1988 the Italian Government established to postpone anydecision on nuclear power use until 1993; in the meantimeNational Organizations eoncerned wi th Nuclear Power, arecommi tted wi th the study of the new generation of reactors(whose safety is based on more intrinsic and passive safetyfeatures) to be proposed for a future resumption of nuclearpower. Investigations are addressed to passive andsimplified reactors wi th enhanced containment eapabili ty.Beference Cri teria are still in discussion but the trend istoward very stringent requirements, in order to get PlanteLicenseable wi th no need of a Preplanned Evacuation EmergencyFlan. Plant! presently under study are:. Simplified Boiling Water Reactor (SBWR) - General Electric. AF600 - Westinghouse. pius - ASEA Brown Boveri.This paper describes the experience gained by some ltalianOrganizations wi th PSS living use in support of SBWR designèevelop~~nt .General Electric is currently developing the design of e new600 MWE BWR. based on the use of simplified and passivesystems and ahle to cope with" severe accident situationswithout Operator Actions for 72 h.The economic effort for the design development is supportedby DOE and EPRI and the balance is supplied. in terms ofmanpower and testing of new equipments, by an internationalTeam of Japanese. Itali an and Dutch Organi tations . In thisframe two Italian contributors are involved in PS5acti vi ties: i) ENEL l the Italian Power Generating Board. iseo~~i tted in the PSS implementation end ii) ENEA DISP, theItalian Regulatory Body, performs the PSS Peer Review. Phasei PSS has been completed and reviewed, while a Phase 2 PSS iscurrently under way. A basic requirement of the PSSmethodology must be 1 ts ability to 1nteract, in an almostreal time, wi th the design while i t progresses. To meet thisrequirement the model must be easily accessed and modified inorder to follow the frequent design updates.Li ving PSS approach was used, based on the practical groundon a fast interacti ve workstation. Software used forimplementation and review was installed on pes (1).After the PSS Phase i. done by ENEL (2), iNEA DISP peer-rev1ewed the study to assess the methodolo¡y adequacy (3 J ;the integration of these activi ties proved a good interactionwi th the design.
- 393-
PROBABILISTIC SAFETY GOALS rOR PASSIVE SAFETY PLANTS
Qualitative Safety ¡oals for a new pa~sive BWR plant arebased on the followin¡ eoncepts:- a safety expressed in a way more understandable to the
publ1c- a safety less dependent upon operator behaviour_ preventive and mi ti¡ative design such that a Preplanned
Emergency Evacuation Plan is not necessary.Quantitative Safety Goals definition to support Qualitativerequirements are still not frozen; possible Goals could be:_ cumulati ve frequency of event sequences leading to a
population dose exceerting the EPA PAG limit in short term( 24 or 36 hr ) lower than a small value
- core damage aequences wi th sud den catastrofic failure ofthe containment should be avoided by design or theiroccurrence should be negligi ble.
_ Land contamination frequency must be negligible.
STUDY PHASE 1 IMPLEMENTATION
The Phase i PSS was conducted by ENEL at GE USA offices inthe second half of 1989.ENEL has a long standing experience in PRA implementation.see (4.5).The SB~R PSS case has some peculiari ties affecting themethodology:a) need to demonstrate low consequences wi th low frequency
of occurenceb) presence of specific design features. wi th a lower
dependency upon support systemsc) data uncertainty for some new technology componentsd) need to demonstrate that the plant safety level is less
dependent on Operator Actions than current plants.This implies greater methodology effort than past generationPSS in the following areas:a) completeness of ini tiating event set, including i)
peculiar initiators of the new design. ii) all Plantstates, low power condi tions included and iii) externalevents
b) extensive Common Cause Failure treatment also amongidentical eomponents in different systems
c) systematic consideration of errors of Commission in HumanReliabilty and Risk Sensitivity calculations with nocredi t for Operator Actions
d) evaluation of aequences without core melting, potentiallyleading to doses ¡reater than the PAG limit, as in thecases of LOCA wi th a failure in the containment isolation.
In aeneral terms the compliance wi th very low figures forSafety Goals imposes additional effort, beoause deeperanalyses are neoessary to discover low pr~babili ty couplingevents, which could be negligible if the CDF goal 1s 1E-4 butnot in the ease of a smaller frequency Goal. As the SBWR
- 394-
design is under development, the living PSS is articulated insuccessi ve phases. The Phase 1 was performed in the earlydesign phase when only the conceptual design was evailableend without systematic dedicated supporting analyses in rnanyareas (thermal-hYdraulic analyses, external releases..).One of the purposes of phase 1 was the identification of thethermal hydraulie analyses needed to support the final PSS.Suceess cri teria were based on engineering Judgement andextrapolation of a few preliminary analyses. The designdetails needed to perform the analyses but not yet includedin the design documents were assumed by. the design engineers.The software used for the study was based on a workstation(1) 1nstalled on PCs which allowed fast interact10n for theeurrent updating of the model.Main study results showed the perspective to meet the safetygoals wi th some design modifications and supporting analysesin specific areas identified by the PSS.At the prevention level, the contributions of the internalevents to the CDF was assessed very low except for thefailure of the overpressure protection in ATWS.For the mi tigati ve espects the containment effecti veness toprevent doses greater than EPA PAG limits could be enhancedi£ 1mprovernents Were made on;i) long term cooling function failureii) pressure suppression function bypassi1i) ATWS (overpressure protection and failure to manually
inject boron).For the i terns listed ebove, the PSS suggested the followingmodifications able to satisfy t~~ safety goals;a) increese the number of Safety Relief Valves (whieh work
also in spring mode)
this makes negligible the eontributionfailure in ATWS to the CDF
b) dediceted components for short term end long terrn passivecooling funetions both funetions were perfomed by theIsolation Condenser; this modification enhances thereliabil ty of the long term containment cooling
e) 10gie eards di versifieation; this makes negligi ble thecontainment isolation failure
d) Boron Injeetion automatie actuation - this makes reactorshutdown function more relieble than past manual actuation
e) automatie Feed Water Runbaek to limit reactor power inATWS
from overpressure
b), c), d) and e) heve the potential to make negligi blethe probability of a containment failure.
The PSS showed with specific sensitivity ealculations -also the potential fullfillment of the established SafetyGoal wi thout Opera tor Actions for 72 hr.
- 395-
The above suggestions were recognized sound by the designerand were 1) d1rectly transferred 1n the des1gn or 11) assumedas basis for systems modifieation.Al so a seismic level 1 P5S was performed. The resul t 1s that1ncreas1ng the abi11 ty of the Isolation Condenser and of theReactivity Control System to withstand high Peak GroundAccelerations in a seismic event and the using a realist1csi te specific Seismic Hazard Curve, the contribution of theSeismic event to CDF will be negligible.
STODY PHSI 1 IIVIIW
The Phase 1 PSS rev1ew was performed by ENEA DISP in 1990.ENEA DISP possesses experience in PRA review gained in pastlieensing acti vi ties.The review objecti ves were to assess:- the adequacy of the methodology- the Study usability in the Regulatory Process (10CFR52)and to suggest design modifications
- give suggestions to the SBWR design.For this review DISP worked on the original model - magneticsupport - using the same workstation software; this can beeonsidered sound because the computer code has been widelyvalidated by DI5P in past uses. In positive terms thisapproach gave the possi bili ty to reach low level P5S i ternsand also allowed rnany sensi ti vi ty reQuantifioations. Thisfact gave effectiveness to the review because usuallyreQuantifications are outside th~ scopes of a Peer Review.No sistematic Fault Tree independent reQuant1ficat1ons weremade.
~ review findings. comments An =uggestions
Overall ComrentsSBWB Phase 1 P55 ean be eonsidered a good piece of work asfar as methodology is concerned.In some areas the extent and the quali ty of the analyses caneven be eonsidered as an improvement of the present practice,specifically in its interactive and living usability.As the Phase 1 P55 was eonducted on the basis of someassumptions based on engineering judgement due to the lack ofsupporting analyses. some uncertainties are present in thequanti tati ve resul ts . .The quanti tati ve effecti veness of the suggested designehanges should be measured with more aecuracy in thesuccessive Phases of the study; nevertheless the proposedmodificat10ns ean be considered sound on engineering andqualitative bases.
- 396-
Detailed commentsLow level comments were addressed in the review; moresicnif1eant ones are listed below:1) The acc1dent prevention is based on i) Power Conversion
system. i1) Passive Safety arade systems, ii1) Active nonSafety .rade systems and 1 v) Operator Actions (OA). Toshow Plant safety level adequacy without operator, the PSScontains a sensitiv1ty to no reliance on OA for 72 hours.Systemat1c importanee analyses were performed forindi v1dual non-safety system/components, such es dieselgenerators.A sensi ti v1 ty to no rellance at all on not safety gradesystems should also be done in order to show how much safeis the Plant w1 thout the active systems operation.
2) Transients and LOOSP eontributlon to CDF 1s small 1fcompared wl th the resul ts of the past PRAs. In the PSSthls low contri butlon is explalned wi th i) the passl veIsolation Condenser effectlveness. 11) the designrequirement for low Transients Ini tlating EventsFrequencies, 111) the Feed Water pumps equipped wi thelectrical motors and Iv) the low dependency on Supportsystems.If the1r low contribution could be just1fied by theIsolation Condenser design, a very low value needs a moreeareful attention to discover potential couplings amongredundant systems.
3) CDF 1s dominated by LOeAs Contribution ( about 90% ); thisresul t is different from past PRAs where often Transientsand LOOSP events dominate. The frequency of a transientevent has less uncertainty than LOCA event because i t isderived by more extensive operating experienee. Asens i ti vi ty or uneertainty analysis eould gi ve moreeonfidenee on upper bound ( 95% ) values.
4) Level 1 PSS part (Core Damage Mode l) appears more accuratethan level 2 & 3 parts ( Mi tigations & Consequences ) asthe severe accident and radiologieal analyse! were planneddownstream of the phase 1; consequently the suggestions tothe design given in PSS can be considered more valid whenaddressed on 1 tems affecting CDF or i tems regardingcontainment bypass due to system failure.
CONCLODING RIMARKS
The whole proeess of PSS 1mplementation and review showed tobe effeetive in producing a well balanced Study.
A more accurate assessment of the benefi ts eomin. from theauagested modifications - now lncorporated in the design -will also be possible in the in progress Phase 2 of PSS,which 1s based on more detailed design 1nforma~lon and onspecific supporting analyses for Success Cri teria, SevereAceidents and External Releases.
- 397-
The euthors like to stress the key role played by the livingapproach. allowing easy and fast model updating which is animportant feature in aeneral terms, but becomes essentialwhen applied to a new design development where things areoften changed.
The ability of living PSS to aive an integrated picture ofthe plant will help to get more confidence on the Plantsaafety level.
PSS world and SBWR systems designershelp of the living study feature i.e.reductions obtainable upgrading
The eommunications amongwere effecti ve wi th theshowing potential riskspecific design i terns.Some software enhancements are possi ble: workstation are nowpowerful and accessible in cost terms; RISC based computersare faster in calculations and allows the management of largeblocks of memory.
Living PSS based on powerful workstation will play animportant role in the development of next generationNPPS wi th enhanced safety (preventi ve and mi tigati ve) .
REFIRENCIS
(1 J
(2J
NUS-5218 NUPRA 1.2 Users Manual The NUS ProbabilisticRisk Assessment Workstation - November 1989 P. J . FulfordGE Nuclear Energy NEDC-31790P ENEL DSR/VDN C03. V1 06Preliminary SBWR PSS December 1989 (ProprietaryDocument)ENEA/DISP SBWR 91-001 - Review of SBWR Phase 1 PSSNEDE-30090 - Al to Lazio Station Reliabili ty AnalysisDecember 1984ENEL DeO 401. V040. VR 001 NUS 4954 - PSS Caorso NPP -June 1988
(3J(4J
(5)

- 398-
Summary of Discussions
Chairman: R. Virolainen
- 399-
Summary of.discussions
· Analysis of dependencies
There was general agreement that the treatment of functional and secondary de-
pendencies poses no major problems. Common cause failures, however, are a con-
cern. Data are so scarce that plant-specific common cause failure rates can hardly
be expected to be obtained. For this reason all possibly available data sources, Le.
chiefly licensee events reports and reliabilty data acquisition projects must be made
use of. A procedural framework for the interpretation of such information should be
developed bearing in mind that it has to cater for the specific aspects of the different
sources. Single failures considered on technical grounds to be potential common
cause candidates should be included in the data base. Engineering judgement was
consicered an unavoidable element in the preparation of common cause data. The.
refore the possibility of establishing a framework which would lead to a more consi-
stent exercise of such judgement should be explored. 80th activities aim at ensuring
a maximum of clarity about the genisis of common cause data.
A controversial discussion referred to the subject of the use of Markov methods. So-
me advantages were claimed for its application. On the other hand, the vast number
of equations resulting even for relatively small systems was considered a serious
drawback.
. Time dependent phenomenalUncertalntles
- Time dependence
More attention should be paid in preparing PSAs to the possibilty that there may be
components whose failure rates are affected by "aging" or "Iearning". There is evi-
dence that at least in some cases this effect may be noticeable. However, it must be
kept in mind that the possible influence varies with the type of component and its
- 400-
funetion inside the plant (e.g. operational or safety system) as weil as the mainte-
nanee regime. Therefore a plant-speeifie evaluation is indispensable.
- Uncertainty
Qualitative uneertainty analysis, Le. the identifieation of uneertain assumptions and
parameters was eonsidered an important task. Coneerning the subsequent task, that
of quantifying uneertainties, there. was general agreement that the uncertainties af-
feeting reliability data eould be treated satisfaetorily. However, eonsiderable wea-
knesses in the handling of modellng uneertainties were reeognized. An exploration
of the potential of possibilty theory for treating uneertainties was deemed desirable.
· Human Error
In general, in PSA only errors of omission are assessed and to some extent errors
of eommission. It is recognized that there is an urgent need for progress with re-
spect to knowledge based actions. This is especially so because the eontemplation
of non-full power states and accident management measures requires more and
more complex human interventions to be quantified. Another important case for the
modelling of human interventions is the isolation LOCA. Despite quantification pro-
blems already the qualitative assessment of the conditions under which human in-
terventions have to be performed has considerable merits in that it generally shows
design and procedural weaknesses which can then be removed.
A very important aspect is the evaluation of operating experience and simulator ex-
periments for obtaining human error probabilities. The problem of transferring simu-
lator experience to real situations was believed to be solved to a large extent by
using experience gathered in examination situations.
The lack of data may be compensated to a certain extent by varying the probabilties
used for human error and assessing the impact on the PSA results. Expert judge-
ment is believed to also give good results in this context. Human error is stil eonsi-
.. .. ..dere(fÕñeofiheareas-which.req.ufres.researchiñ.õrder iõ arrive.ãtmõre. .reliable
- 401 -
PSA results. In the meantime, doubts about the quality 01 human error assessrnent
should be catered 10r by using larger erfor bounds on the data 01 Swain than those
given by hirn.
· External Events
The presentations addressed the treatment of earthquakes and fires. It was general-
ly 1elt that the methods for analysing external events are not so mature as those
used in other areas of analysis involved in PSA contributions. Contributions from
many different disciplines are required. Uncerainties 01 results are stil substantial.
For analysing the plant response to seismic loads a lot 01 expert judgernent is stil
needed. Conservative assumptions are usually madesothat earthquakes larger
than those assumed 10r the analysis are virtually impossible.
The view was held that the analyses should be limited to the loss 01 power induced
by earthquakes as an initiating event; on the other hand, there was some concern
that 1ires caused by earthquakes are generally not addressed.
Thtreatment of externa! events should be included in aPSA even if the analysis
ware to be only qualitative, since it directs attention to possible weaknesses 01 the
plant. Due to tlie large uncertainties associated with the analysis 01 external events
in Japan different sa1ety goals 10r plant interna i and plant external events are used.
· Special Toplcs
The session covered a variety 01 different topics, viz.:
- reliability data acquisition
- determination 01 the 1requency 01 leaks and breaks in pipes
. low power and shut-down events
- 402-
. Iiving PSA
It was considered desirable to establish generalized criteria for the acquisition of re-
Iiabilty data including topics like e.g. the component definition. If these criteria were
adopted internationally an intercomparison of data might become possible and there
would be a better guarantee that generic data, wh ich have to be used in some cases
would really apply to the components under consideration. It was recommended to
place more emphasis on the acquisition of data on human error.
However, it was generally recognized, that "grey areas" are unavoidable in the field
of reliability data, whatever the effort invested in their acquisition.
The difficulties in generating reasonable reliabilty data for passive components were
recognized.
Given the preliminary results of the French PSA on risk contributions from non.full
power operation it was believed that this topic wil be addressed in most future
PSAs. The belief was expressed that the French results are perhaps overly pessimi-
stic, a view which was somewhat supported by the preliminary investigation of the
Biblis-B plant. It should be kept in mind, however, that results on non-full power ope-
ration are even more plant-specific than those for full power operation. The possibili-
ty of problems from an excessive number of alarms complicating operation actions
in non-full power conditions was pointed out.

I
Gesellschaft für Reaktorsicherheit (GRS) mbH
Schwertnergasse 1
5000 Köln 1
Forschungsgelände8046 Garehing
ISBN 3 - 923875 - 36 - 3
e.


