Embed Size (px)
Citation preview

i
SRI LANKA FORUM OF UNIVERSITY ECONOMISTS
SRI LANKA ECONOMIC RESEARCH CONFERENCE (SLERC) 2020
PROCEEDINGS
Volume IX
Editorial Board
Editor in Chief
Dr. P.H.T. Kumara
Co-Editors
Dr. R.A.P.I.S. Dharmadasa
Dr. R.P.D. Gunathilaka
Dr. M.W.A.C.S. Wijetunga
Dr. R.M.S.D. Rathnayaka
Mr. G.H. Abeyweera
Mr. N.P.R. Deshapriya
Editorial Assistants
Ms. M.M.S.C. Senevirathne
Mr. A.S.G.S. Bandara

ii
Uva Wellassa University of Sri Lanka, Badulla,
Sri Lanka.
21 – 22 January 2021
Copyright © January 2021
Sri Lanka Forum of University Economists
National Library of Sri Lanka – Cataloguing-In-Publication Data
Proceedings of the Sri Lanka Economics Research Conference 2020
ISSN 2279-2406
Published by Sri Lanka Forum of University Economists (SLFUE)
Uva Wellassa University of Sri Lanka,
Sri Lanka.
Tel: +94 55 222 6168
Web: www.slfue.org
All rights reserved. No Part of this publication may be reproduced, stored in a retrieval
system or transmitted by any means, electronic, mechanical, photocopying, recording or
otherwise, without the written permission of the publisher.
Printed by
Indesign Advertising
Lower King Street, Badulla
900000
Sri Lanka
Telephone: 0552225600
This publication is sponsored by

iii
Message of the Vice Chancellor
Uva Wellassa University of Sri Lanka
It is with great pleasure; I am sending this
message on the occasion of the 9th International
Research Conference of the Sri Lanka Forum of
University Economists (SLFUE). Indeed, it is a
very special occasion, and the Uva Wellassa
University (UWU) is honoured to host this
conference amidst the COVID-19 pandemic.
While the health professionals are trying their best
to curb the pandemic, I do hope that this event would help the university
economists to deliver their share in the economic recovery. I strongly feel
that the theme of this year’s conference, Restoring Economic Growth and
Prosperity of Sri Lanka: Options and Strategies, is well matched with the
current situation of the country. It is high time that we all get together and
find the solutions for the socio-economic problems generated by the
COVID-19 pandemic. Further, the theme of the panel discussion, Post
COVID Revival of MSME Sector of Sri Lanka, is also a timely one and
well suited to the Uva Wellassa region.
Undoubtedly, the presence of Deshamanya, Professor Emeritus W.D.
Lakshaman, the Governor of the Central Bank as well as a renowned
economist of the country, will brighten the conference. The launch of the
Sri Lanka Journal of Economic Research Volume 8 (1) signifies that role
of the SLFUE in disseminating economic research is not only limited to
the conference.
I wish to express my sincere gratitude to the current Chairman and the
members of the SLFUE, and all the members of UWU Family for their
untiring efforts to make the 9th International Research Conference of the
SLFUE a success. Finally, I wish all the participants and presenters to have
a pleasant and productive experience during these two days at the UWU.
Professor Jayantha Lal Ratnasekera
Vice Chancellor
Uva Wellassa University

iv
Message of the Chief Guest
Sri Lanka Economic Research Conference (SLERC) 2020
To witness the holding of the 9th International
Research Conference of the Sri Lanka Forum
of University Economists (SLFUE) is, for me,
a greatly satisfying experience as I have been
associated in numerous ways with the
establishment and development of this Forum
from its inception in 2012. After small
beginnings it appears to have now expanded to
encompass teachers in economics associated
with the bulk of the university system in Sri Lanka. Pressing issues,
theoretical and practical, related to economic analysis and policy have
been taken up for critical review by SLFUE over the years. I take this
opportunity to wish the Annual Conference of SLFUE to be held in the
premises of Uva-Wellassa University every success. The theme selected
for this year’s Research Conference of SLFUE “Restoring Economic
Growth and Prosperity” perhaps indicates the concern of the conference
organisers have about how the economy could be moved out of severity of
the stresses caused by the two-stage outbreak of the COVID-19 pandemic
of 2020-1.
COVID-19 related global impacts have been multi-faceted. Lives of
millions of people around the globe were disrupted due to the pandemic,
which is by far the most complex and acute global crisis after World War
II. Large numbers have been hospitalized and many died. Jobs have been
lost, businesses have gone bankrupt, schools have been closed, and
educational and training processes disrupted, health systems have become
stressed and people’s livelihoods disrupted in many ways.
Domestic economies of most countries have been battered, while fear and
uncertainty have become dominant elements in the lives of people
everywhere. Policy responses to this multi-faceted crisis, however, have
been largely two-pronged. On the one hand, these responses have been
related to issues of public health and medical facilities. On the other hand,
they have focused on addressing dominantly economic, monetary and
financial issues. The issues raised on the question of how normal living

v
conditions can be restored and social progress revived also tend to revolve
round largely economic and financial matters.
Addressing largely the economics fraternity, I am tempted to turn from
policies to revive from COVID-19 crisis to policies and strategies required
for the achievement of socio-economic development in general. Thinking
around this subject also has been informed largely by ‘economic analysis’,
or that sub-discipline of economics called ‘development economics. After
the end of World War II, in scores of developing countries, development
was planned, and development policies worked out in accordance with
dominant ‘development economics’ perspectives. There were, however,
extensive failures of this development effort all round the world. In the
deliberations in your Annual Conference too, it is imperative that you
understand the limitations of economic analysis when it comes to guiding
of development policy and practice. Enhanced interest needs to be paid, I
believe, to what other disciplines can offer toward understanding and
management of development.
Economic revival and growth require a collaborative approach involving
all segments and stakeholders of the economy. This university economists’
Forum could be used as the launching pad to co-ordinate efforts of
resource personnel from different relevant fields, and effectively make use
of their different perspectives about manoeuvring the socio-economic
processes in these difficult times. My best wishes again for every success
of the SLFUE conference of January 2021 and I hope it would herald the
beginning of a series of dialogues that will truly be helpful in restoring
prospects of economic growth and prosperity in Sri Lanka.
Deshamanya Prof. W D Lakshman
Governor
Central Bank of Sri Lanka

vi
Message of the Chairman
Sri Lanka Forum of University Economists 2020
I am very much pleased to forward this message on
the International Research Conference of our forum
“Sri Lanka Economic Research Conference 2020”.
This is the consecutive 9th international conference
of the forum after establishing in 2012. This is a
historic event for the forum as this is the first time in
the history of the forum, that we organize our
flagship event both physically as well as an online.
This year’s theme of the conference is “Restoring Economic Growth and
Prosperity of Sri Lanka: Options and Strategies” which is much aptly
theme with the current situation of the country as well as the globe. While
the country as well as the whole world is struggling to cope with the new
normal conditions created by the Pandemic, as university economists we
are strenuously making a platform for policy debate on the economic
restructuring of Sri Lanka. Thereby, as the forum, we aimed to contribute
to the post COVID reconstruction debate of the country.
I congratulate and wish all the presenters who submitted their papers,
participating in the event physically or online. I thank Chief Guest
Deshamanya Professor Emeritus W.D. Lakshman, who eagerly accepted
our invitation and all the members of the panels and technical sessions and
our sponsors BOC and Chrysalis. Also, I thank all the members of the
forum and all the members of the organizing committee for making
SLERC 2020 is a success in the midst of the COVID Pandemic.
Sri Lanka Forum of University Economists wishes you all a very fruitful
SLERC 2020 and believe that you will be able to disclose, discuss, debate
and agreed on your findings and contribute for a speedy recovery of the
Sri Lankan economy.
Dr. P. H. T. Kumara
Chairman/Sri Lanka Forum of University Economists 2020
Faculty of Management
Uva Wellassa University of Sri Lanka

vii
Keynote Address
Restoring Economic Growth and Prosperity of Sri Lanka: Options
and Strategies
Thripitakacharya Dharma Keerthi Sri Sumangala
Rathanapala Dhammarakkhitha Most Venerable
Bengamuwe Sri Dhammadinna Nayake Thero,
Chancellor of Uva Wellassa University, Prof. Jayantha
Lal Ratnasekera, Vice Chancellor, Conference
Participants, Former Colleagues, Friends, ladies, and
gentlemen, Preliminaries
A very good evening to you all! This is my second visit
to Uva-Wellassa. The first visit was some 20 years ago during the formative years
of the University. My visit was as a member of a team of senior academics
appointed by the UGC to examine the progress and performance of the
University. On this occasion, I cannot avoid recalling my good friend, Dr.
Chandra Embuldeniya – your pioneering and innovative Vice Chancellor. In
addition to being a great host, Chandra deserves my appreciation for his
experimentation with a unique concept and a model of an “entrepreneurial
University” for Uva Wellassa. How far he succeeded in this venture is worth
looking into.
If I recall right, I had the privilege of chairing the very first International Research
Conference of SLFUE held at the University of Colombo. This is indeed a Forum
in the development of which, I was involved, I hope positively, in various
important, as well as trivial ways. I am extremely glad to see that the Forum has
got so well-established covering almost the entire university system. All my
interventions in SLFUE activities were in response to requests of one person,
requests which I found difficult to decline. It is not inappropriate on my part
therefore, to appreciate, with gratitude, the contribution made by my good friend
Prof. Lalithasiri Gunaruwan, in the progress of the Forum, so far. I am very glad
indeed for opening doors a few decades ago for the mathematician turned
economist or should I say political economist, into the world of university
economics.
I take pleasure in the opportunity offered to me to be here with you today
delivering the Keynote Address at this 9th International Research Conference of
the SLFUE, and to share with you some of my thoughts on the theme of the

viii
Conference, i.e., “Restoring Economic Growth and Prosperity of Sri Lanka:
Options and Strategies”. Most of the time during this hour or so, I will be
speaking to you as the Governor of the Central Bank of Sri Lanka. But as the
argument demands, occasionally, the academic in me also might come out.
This International Research Conference, today, intended to promote economic
and development research is, I understand, enriched by some 40 research papers,
accepted after a process of refereeing. Congratulations to organizers for their
effort in collecting so many research papers for a symposium. Restrictions on
movement which prevailed due to COVID-19 must have been a factor making
many researchers in economics contribute papers to the conference. I hope these
papers do real justice to the extremely heterogeneous and rich subject called
economics or political economy.
It was after 40-odd years of an academic career that I took up this entirely
different position of responsibility. As an undergraduate in Peradeniya, a doctoral
student at Oxford, and later in my university teaching career, I studied, researched
and taught things which I come across daily in my Central Bank life – gross
domestic product, economic growth, general price level, inflation, interest rates,
commercial banks and bank credit, exchange rates, balance of payments, fiscal
policy, monetary policy, trade policy, import restrictions, industrialization,
agricultural policy, financial institutional structure, etc. etc. to list out only a few
items, randomly selected with no particular order.
I decided to accept the CB Governor position, when it was unexpectedly offered
to me, thinking that I am fairly well conversant, at least theoretically, about what
has to be done in the Bank, namely the conduct of monetary policy and
implementation of measures to keep the domestic price level and financial
institutional structures stable, thereby facilitating the overall objectives of a
country’s economic policy – promotion of development, employment and social
well-being.
What one finds common in what is learnt in books and lecture rooms, and what
is practiced in the real world are probably limited to words and theoretical
propositions. When it comes to the level of policy and practice, even a person
who has extensive knowledge in any particular subject area, will have to spend
considerable time and effort to learning the intricacies of real-world practice and
the interface between book knowledge and the socio-political realities affecting
policy making. I saw the need also to unlearn many things which I have carried
into this position from the academic world.

ix
Encouraging research in general, I need to in this forum also highlight the
importance of policy relevance of research. This is needed for research results to
be able to facilitate real-world processes and policies towards improving people’s
living conditions. We have seen over decades, extensive research activity on
policies and practices of development, but we continue to remain under-
developed or “developing”. We ought to be ashamed of being called
“developing” for as long as the last three quarters of a century after the Second
World War, while observing many postcolonial countries moving out of that
derogatory label. As students in economics we must indeed make a vow that we
will work hard to guide the nation’s journey out of being “developing” or
“underdeveloped”. The Uva Wellassa University is an ideal place to make that
vow remembering the human sacrifices made by those who gave leadership and
those who participated in the great freedom struggle, which was to the British the
Uva Wellassa Rebellion (1817–1818).
Restoring and Reviving COVID-19 Affected Economy
The chosen theme for this conference is “restoring” economic growth and
prosperity, hinting that conference organizers were interested in focusing on the
last few years, may be from 2015 onwards. Without going that far into the past,
I will take just two years, 2020 and 2021, in my address. The year 2020 was a
time most of us would like to forget in a hurry, primarily because of the
horrendous impact, which the coronavirus pandemic has had over humanity
throughout the world. This pandemic related crisis that we are still experiencing
is by far the most severe global crisis since the end of World War II. Throughout
the last ten-odd months of 2020-1, all we heard was news of disease, misery,
deaths, anxiety, and fear. Our lives have taken a massive shock and we still do
not know when we will be able to get back to normalcy again.
The performance of the economy in 2020 was, as expected, lackluster and during
the second quarter in particular, truly dismal. This was caused by the
unprecedentedly hostile environment created by the pandemic. As per the GDP
estimates of the Department of Census and Statistics (DCS), the Sri Lankan
economy had experienced negative rates of growth of 1.7 per cent and 16.3 per
cent respectively in the first and second quarters of 2020. The economy
rebounded in the third quarter recording a positive growth of 1.5 per cent.
However, the onset of the second wave of COVID-19 seems to have dampened
the momentum in the fourth quarter of 2020. Accordingly, the economy is
projected to have contracted, according to Central Bank predictions, by around
3.9 per cent in the full year, 2020. It may be noted, however, that some

x
international agencies have predicted for Sri Lanka somewhat higher rates of
contraction in 2020 than the rates indicated by CBSL projections.
Nevertheless, the economy is well poised to rebound in 2021, supported by the
unprecedented measures of policy stimulus introduced by the Government and
the Central Bank, improved domestic economic sentiments, alongside the
improving prospects of the global economy. Globally the invention and
commercial production of several anti-corona virus vaccines are strengthening
2021 growth prospects. Locally, in addition to other developments, I should make
a special note of the improving conditions of the country’s tourist industry. From
prevailing conditions there can only be improvement as we have reached the
bottom at the end of 2020.
The external sector was severely affected at the initial stages of the pandemic, but
marked a notable rebound by mid-2020. Proactive measures introduced to restrict
non-essential merchandise imports and foreign exchange outflows for purposes
of investment, lower global petroleum prices as well as larger than expected
remittances from migrant workers helped contain the pressure on the exchange
rate and challenges in the external sector to a great extent. The trade deficit
contracted notably, contributing to strengthening the external current account
balance. Low earnings were recorded from tourism, and other services exports
due to the impact of the pandemic. Partly cushioning the impact, a notable
rebound in workers’ remittances was observed, despite various challenges faced
by migrant workers. The pandemic affected cross border financial flows notably.
Foreign direct investment (FDI) inflows were low, as in the case of all emerging
economies, while outflows were recorded from the rupee denominated
Government securities and equity markets, although the Colombo Stock
Exchange performed notably well with active participation of domestic investors.
However, gross official reserves remained at adequate levels, while the Sri Lanka
rupee remained resilient.
Post-2019 Sri Lanka is operating on a development model that is different from
the preceding period. The vision for this new model comes from the electoral
manifesto turned policy document, “Vistas of Prosperity & Splendour” of
President Gothabhaya Rajapakse. Budget 2021 approved in Parliament in
December 2020, guided as it was by this policy document, has become the current
implementation plan of the above Presidential vision.
The overall policy approach is one of state-guided market economy like in a
“developmental state”. This descriptive title for a distinctive policy approach has

xi
been coined by Chalmers Johnson in his analysis of the Japanese development
model of the post-war decades. Broadly similar policy frameworks had helped
not only Japan, but also the so-called East Asian Tigers and later some South East
Asian countries to achieve high and sustained development. The “developmental
state” model as one of state-guided market economy has a lot to offer to Sri Lanka
in its going forward looking for rapid growth and development in the medium
and long terms, provided the policies concerned are properly and consistently
applied.
The COVID-19 pandemic, in addition to being devastating in socio-economic
impacts, has also offered us opportunities to think out of the box and address
some of the long-standing structural weaknesses of the economy. The following
are some of these structural weaknesses: relative neglect of domestic production,
excessive product and market concentration of exports, exports of products
without moving up on value chains, heavily import-dependent consumption and
production, prevalence of poverty pockets and economically vulnerable social
groups, the so-called dual deficit (in the budget as well as on the external current
account), and the over-reliance on foreign debt. The production-driven economy,
through domestic, as well as foreign investment, is now being promoted, along
with a more rational view about openness in external trade. The boost received
by agricultural production and related higher value chain activities has been
substantial. The opportunities opened up by COVID-19 to rethink our economic
policy of the last half-century also are substantial.
I do not have the time here to talk about the entire government policy. Instead let
me take up part of it – some elements of the monetary and financial aspects of
the development programme that is largely under the stewardship of the Central
Bank. Policies and measures in these subjects are having their impacts on
progress or otherwise of numerous sectors of the real economy, either acting
directly or working through various intermediary agencies. I will take up three
subjects for discussion in the rest of my address: (i) the low interest rate regime;
(ii) measures to ease stresses in the external sector; and (iii) financial sector
stabilisation policies.
Low interest rate regime
The role of the interest rate in a market economy is differently interpreted. It is
clearly a double-edged weapon. A reduction of interest rates encourages
investments but at the same time discourages savings. Prior to 1977 we had a
system of relatively low interest rates. The argument against such low interest

xii
rates at the time, was that it led to shallow financial depth and the
recommendation was for “financial deepening”. Interest rates were made to rise,
sometimes to very high levels since the end – 1970s. TB rates went up to 18 –
20% levels. Upper margin of lending rate ranges rose to as high levels as 30%.
This was considered necessary to improve domestic savings and to address high
inflation rates at the time.
The government policy of encouraging domestic production activity since 2019
led to the adoption of the present low interest rate regime. Low levels of inflation
and stable inflation expectations have helped in the implementation of this policy.
Accordingly, policy interest rates and the Statutory Reserve Ratio (SRR) were
reduced by the Central Bank to their lowest levels in history and special lending
schemes were initiated at concessionary rates. Another measure adopted was to
introduce interest rate caps on selected loan products to expedite the monetary
policy transmission process. These monetary easing measures have brought
market interest rates down significantly, with most interest rates reaching
historically low levels. Lending rates, which were at double digit levels, came
down substantially, often to single digit levels. As a follow up of these measures,
one witnesses a gradual increase in credit extended to the private sector. COVID
– 19 necessitated a rise in credit to the public sector to extraordinary levels, and
the low interest rates regime enabled the Government to gain from the consequent
low cost of public debt financing. There was a 3 per cent reduction in the cost of
financing Treasury bills and bonds in 2020, compared to 2019 – a reduction of
government expenditure by Rs. 200 billion. The availability of low-cost funding
on a sustainable basis would encourage businesses, including start-ups, to venture
into new industries and sectors that have high growth potential. In the meantime,
there is the need to introduce methods to help social groups, such as fixed income
earners, particularly senior citizens depending on retirement pensions, affected
by low deposit interest rates. The sustainable solution to this problem lies in long-
term income growth and institutional developments involving mutual funds,
insurance and annuity, pension, and superannuation schemes.
Low lending rates and adequate levels of liquidity in the market would help
channel funds to the private sector in the form of low-cost loans. The Central
Bank expects credit to the private sector to expand by around 14.0 per cent in
2021 and at least by around 12.0-12.5 per cent annually over the medium-term,
thereby supporting the envisaged growth of the economy. Directed or targeted
lending has been part of industrial policy of “developmental state” regimes in
East and South east Asian countries. Sri Lanka has had some limited practice of

xiii
directed lending. In order to make low interest rate policy effective in respect of
investment and growth promotion, the existing policy of directed lending is will
be refined and extended to cover new areas, according to Central Bank
announcements.
Measures to stabilize External Sector.
For the sustainability of the low interest rate structure, it is essential that foreign
exchange leakages into non-essential imports and for outward investment
purposes are minimised, thereby allowing the domestic production economy to
reap the intended benefits from easy monetary conditions. Overall, while working
within a framework of market economy, the performance of the open economy
policies introduced from 1977 are being reviewed vigorously, so that the
country’s economic agents could follow a focused approach to make Sri Lanka
truly an industrial economy.
A policy framework with such long-term objectives would generate greater
macroeconomic benefits than being driven by short-term vicissitudes in the
market and unbridled desire for short-term financial gains. In accordance with
the policy framework outlined in the “Vistas of Prosperity and Splendour” and
the Budget 2021, the Government has provided policy support to improve
domestic production, particularly in agriculture, fisheries, livestock,
manufacturing industry and information technology sectors.
Domestic supply improvements in turn would enhance Sri Lanka’s external
competitiveness and export potential, as well as actual export earnings, while also
reducing seasonal volatilities in domestic inflation to a great extent. These
features of the new macroeconomic policy framework would ensure a
coordinated approach to pushing the country on to a rapid growth path and
sustained prosperity.
Such a policy to operate without hiccups, there should be careful planning and
stabilization of the external sector. What happens to trade, current account and
other balances in the country’s balance of payments, and external reserve position
and finally, on what happens to the rate of exchange of the currency all depend
on overall external inflows and outflows and their composition.
These would include goods and services; income account inflows and outflows
(primary and secondary income), financial account inflows and outflows (direct
and portfolio investments, loans, trade credits) etc. Sum of these (netting out
credits and debits) is the addition/reduction of external reserves. The volume of

xiv
reserves, in an economy open to the world, takes an extremely important position
in policy terms.
The current account has recorded a surplus in the third Quarter of 2020. The
Gross official reserves were around USD 5.6 billion by end December 2020.
Workers’ remittances are estimated to have exceeded USD 7 billion. It is
expected that higher remittances will follow the new policy measure offering an
additional Rs 2 per US dollar so remitted.
In the meantime, several measures have been adopted to preserve/ increase the
reserve position. These would cover the whole gamut of policies adopted to
increase inflows and to reduce outflows. It is not correct to take merely the
financial account flows of the BOP. The latter, i.e., investments, loans, loan
repayments, various currency exchange arrangements called SWAPs, are what
most people talk about. This may be because these are amenable to policy action
in the short term. Arrangements are in place for roll over of previously taken
loans - new loans taken from multilateral agencies, foreign banks and market
borrowings, swap arrangements and Special Deposit Accounts scheme.
In our present situation, there are several important policy measures affecting the
real sector or real sector related activities. The implementation of these policies,
in the areas of rationalisation of imports, improving domestic production and
exports, improving proportion of export proceeds brought in, promoting workers’
remittances, careful opening of country for tourist traffic, and promoting FDI into
such projects as the recently opened tyre factory, Port City Project investment
etc. Yet, foreign exchange related activities in a small country are rather difficult
to guide and regulate. Market sentiments become very important in this subject
area of policy making and regulation. One finds market participants often being
able to find ways and means of circumventing the regulator.
In 2020, we encountered an extremely challenging external environment and
therefore strict policy measures were introduced to rationalise on non-essential
merchandise imports, while encouraging foreign exchange flows into the
country. These measures helped contain the pressure on the exchange rate
without depleting foreign reserves. Although the argument that market forces
must be given a relatively free hand in the determination of the exchange rate and
foreign exchange flows is widely heard, such market fundamentalism could
hardly co-exist with the overall “developmental state” framework of policy.
Market manipulations by a few for undue personal gain during difficult times, at
the expense of the masses, do often happen. The exchange rate acts as a shock

xv
absorber to alleviate the impact of external developments on the domestic
economy, but the Central Bank has to, within the current policy framework,
intervene in the domestic foreign exchange market to reduce undue volatilities in
the exchange rate, as well as to build up international reserves as appropriate.
This has been done fairly effectively in 2020. The Central Bank trusts that the
envisaged real sector developments will help maintain exchange rate stability. It
is worth recalling that 2020 data show that a planned reduction of the trade deficit,
perhaps the more intractable one in the twin deficits referred to, is feasible. It has
been possible during this year to repay external debts on time while also
maintaining the external reserve at acceptable levels. Properly designed and
implemented regulations work and indeed produce expected results.
We are traversing through challenging times. It is important to closely monitor
domestic as well as global monetary and macroeconomic developments to be able
to effectively deal with renewed and impending challenges. The pandemic and
its wide-ranging impacts have urged all of us to rethink our economic strategies.
In the past, we borrowed rather freely from international markets and multilateral
agencies to develop the nation, and as a result, our foreign debt had increased
notably and rather menacingly. Foreign commercial borrowing, commencing
from 2009, remained in the initial years at subdued levels with total International
Sovereign Bonds (ISBs) issued in the initial six years, 2009-2014, remaining at
US dollars 5,000 million. ISBs issued in the next five years from 2015-2019 rose
to US dollars 12,050 million, pushing up the country’s foreign debt from
commercial sources substantially. The current policy is to move into domestic
financing sources to fund the development projects. To support these initiatives,
the financial markets need to be proactive, maximising domestic funding sources
for growth-oriented endeavours of the public as well as the private sectors.
Financial Sector Stabilization Policies
The year 2020 has been, and this year is going to be, extremely difficult times.
The first wave COVID -19 began in March 2020 and went strong until about June
that year. The revival, during third quarter was subsequently interrupted in the
fourth quarter 2020, with the second wave of COVID-19. To help protect
livelihoods and businesses the Government and the Central Bank had to step in
with a series of measures such as hand-outs, moratoria, liquidity support, and low
interest loans. Loans to the Government from Central Bank through various
instruments went a long way to provide the financial resources to meet
government’s anti-COVID-19 expenses. All these measures addressing issues
faced by the general public, have worked through banks and other regulated

xvi
financial institutions. However, we should not forget the fact that these
extraordinary measures have affected the bottom lines of banks and financial
institutions. The regulator was concerned about this. Various measures were
implemented to monitor, regulate and supervise banks and financial institutions
to ensure their resilience and robustness, while also introducing measures to ease
their burden. These included relaxation of existing regulatory requirements, and
maintenance of large volumes of liquidity in the market. These were challenges
before the Central Bank. To be flexible, as well as being firm and allowing banks
and financial institutions to see out-of-the box solutions while being stable were
the needs of the hour. It is encouraging that banks anyway remain strong.
However, problems of instability were seen in the non-bank sector of financial
institutions. A categorization of non-bank financial institutions into 3 groups -
strong, moderately strong, and weak – has been made. You may recall the
unpleasant episodes of failing and closure of finance companies. There were, for
example, the 06 distressed finance companies, namely ETI Finance Limited,
Swarnamahal Financial Services PLC, The Finance Company PLC, Central
Investment and Finance Limited, Standard Credit Finance Limited and TKS
Finance Limited. To create a strong and resilient non-bank financial sector, the
Central Bank is in the process of implementing a Master Plan for consolidation
and merger among these institutions.
In the medium to long- term, there are plans to develop certain administrative or
regulatory frameworks. A new Banking Act and amendments to the Finance
Business Act are on the cards. There will also be a review of existing directions
to financial institutions to make them fall in line with changing regulatory
methodologies and market developments.
The other Central Bank activities helping to strengthen and promote the financial
sector would include digitalization work, following trends in the rest of the world.
In this regard, much has been done by the Central Bank over the recent past to
facilitate the growth of financial technology. The LANKAQR system introduced
in 2018, has become extremely popular. The objective of this is a “less cash
society”. The conversion to digital technologies helps enhance efficiency and
formalize transactions. Digitalization of transactions would facilitate financial
system stability while promoting economic growth. There are various measures
and training programmes undertaken by the Central Bank to improve financial
literacy in the country, as well. This is of significance in the move toward a stable
system of financial institutions.

xvii
The Central Bank and the Government will continue to pursue a coordinated
approach in steering the economy through these challenging times. The
implementation of the medium-term fiscal framework of the Government will
provide the needed fiscal space and to attain the targeted goal of a budget deficit
of 4 per cent of GDP by 2025. This would be of immense use in the envisaged
programme of sustained stable growth with price stability. It appears however,
that there are huge challenges to be overcome if these declared policy objectives
were to be achieved. The Central Bank will work jointly with the Government to
introduce and implement essential structural changes that are required to drive
the economy along the envisaged growth path. The implementation of these
structural changes, along with the picking up of Government revenues and
rationalisation of Government expenditures, should ensure sustainability and
easy management of public debt in the period ahead.
Meanwhile, the Government has created a conducive environment for investment
through necessary tax reforms as well as legislative reforms, thereby making Sri
Lanka a destination of promise for investment, domestic and foreign alike. The
Colombo Port City Special Economic Zone is coming up, offering positive
messages as an attractive business gateway linking markets in the East and the
West. Plans to promote Colombo and Hambantota ports as commodity trading
hubs, and to establish a modern investment zone for local and foreign private
investors under the Strategic Development Act, are expected to entice a sizable
flow of foreign capital into the country in the period ahead. The “developmental
state” envisages indeed a coalition among three forms of capital - domestic
private capital, foreign private capital, and state capital.
As mentioned at the beginning I have briefly indicated certain critical policies
and strategies that are being followed to restore economic growth and prosperity
in the country. Most of my address is shaped by the hat I was wearing, i.e. that of
the Governor of the Central Bank. Occasionally only the academic in me came
out. I am sure, some of you researchers would be undertaking research on these
policy issues. Your critiques and new ideas you might be coming up with would
serve a useful purpose if these are made available to us soon. Most important are
the new ideas, if possible, out-of-the box.
I am confident research Conferences like these produce relevant knowledge on
the local economy, and its problems of shared growth. Shared growth is indeed
what we must try to achieve. Over the next one and a half days, I encourage you

xviii
to develop your ideas and insights about pressing matters I mentioned, as well as
other critical issues you yourselves would pick up for investigation.
I wish you have a fruitful and constructive two days of presentations and
discussions, which in addition to academic advancement, will also help build up
lasting social bonds.
Thank you!
Deshamanya Prof. W D Lakshman
Governor
Central Bank of Sri Lanka

xix
9th International Conference of the
Sri Lanka Forum of University Economists
Organized by
Uva Wellassa University of Sri Lanka
Organizing Committee
Professor J.L. Ratnasekera (Chair SLERC 2020)
Dr. P.H.T. Kumara (Chair SLFUE 2020)
Dr. R.A.P.I.S. Dharmadasa (National Cordinator SLFUE 2020)
Mr. N.P.R. Deshapriya (Secreatry SLFUE 2020)
Professor P.I.N. Fernando (Cordinator SLERC 2020)
Dr. R.P.D. Gunathilaka (Co-secretary SLERC 2020)
Dr. M.W.A.C.S. Wijetunga (Co-secreatry SLERC 2020)
Dr. J.P.R.C. Ranasingha
Dr. R.M.S.D. Rathnayaka
Ms. A.C.I.D. Karunarathna
Mr. A.M.D.B. Nawarathna
Ms.T.G.A.H.C. Amarawansha
Ms. M.M.S.C. Senevirathne
Mr. A.S.G.S. Bandara

xx
Panel of Reviewers
Prof. A. K. Uthumange Faculty of Management Studies and Commerce, University of Sri Jayewardenepura, Sri
Lanka
Prof. H.M.S. Priyanath Department of Economics and Statistics, Sabaragamuwa University of Sri Lanka
Prof. P.I.N. Fernando Deparment of Management Sciences, Uva Wellassa University of Sri Lanka
Prof. J.M. A. Jayawickrama Postgraduate Institute of Humanities and Social Sciences, University of Peradeniya, Sri
Lanka
Prof. J. Weerahewa Department of Agricultural Economics and Business Management, University of
Peradeniya
Prof. P.A.P.S. Kumara Department of Marketing, University of Ruhuna, Sri Lanka
Prof. R. Ranasinghe. Department of Banking and Finance, Wayamba University of Sri Lanka
Prof. S.B. Ranathunga Department of Economics, University of Kelaniya, Sri Lanka
Prof. T.L. Gunaruwan Deparment of Economics, University of Colombo, Sri Lanka
Dr. C. Jayawardena Department of Agricultural Extension, University of Peradeniya, Sri Lanka
Dr. C. Gunasinghe Department of Economics, University of Ruhuna, Sri Lanka
Dr. G. Tilakaratna Institute of Policy Studies of Sri Lanka, Sri Lanka
Dr. P. M. B. Jayathilake Department of Business and Management, Rajarata University of Sri Lanka
Dr. S. Perera Department of Business Economics, University of Sri Jayawardenapura, Sri Lanka

xxi
Dr. W. Premarathne Department of Management and Finance, Sir John Kotelawala Defence University, Sri
Lanka
Dr. A. Kalyanaratne Department of Economics, University of Sri Jayewardenepura, Sri Lanka
Dr. A. Perera Department of Accountancy, Wayamba University of Sri Lanka
Dr. A.D.H.K. Kankanamge Department of Economics and Statistics, University of Peradeniya, Sri Lanka
Dr. B.M. Sumanaratne
Department of Economics, University of Ruhuna, Sri Lanka
Dr. C. Wijetunga Department of Export Agriculture, Uva Wellassa University of Sri Lanka
Dr. D. Gunathilaka Department of Export agriculture, Uva Wellassa University of Sri Lanka
Dr. H.R. N. Peiris Department of Public Administration, Uva Wellassa University of Sri Lanka
Dr. J. Fernando Department of Business Economics, University of Sri Jayewardenepura, Sri Lanka
Dr.J.P.R.C. Ranasinghe Department of Tourism Management, Uva Wellassa University of Sri Lanka
Dr. J. Siyambalapitiya Department of Management Sciences, Uva Wellassa University of Sri Lanka
Dr. K. Jayawardhana Department of Management Sciences, Uva Wellassa University of Sri Lanka
Dr. M. Kulathunga Department of Management Sciences, Uva Wellassa University of Sri Lanka
Dr. M. Samarathunga, Department of Tourism & Hospitality Management, Rajarata University of Sri Lanka
Dr. M.M.D.R. Deegahawature Department of Industrial Management, Wayamba University of Sri Lanka
Dr. N.C. Jayasinghe Department of Management Sciences, Uva Wellassa University of Ssri Lanka

xxii
Dr. N. Keembiyahetti
Deparment of Economics, University of Ruhuna, Sri Lanka
Dr. P. Weligamage Faculty of Agriculture, University of Peradeniya, Sri Lanka
Dr. P. Mahindarathna Department of Export Agriculture, Uva Wellassa University of Sri Lanka
Dr. P. Dunusinghe Department of Economics, University of Colombo, Sri Lanka
Dr. R.A.P.I.S. Dharmadasa, Department of Export Agriculture, Uva Wellassa University of Sri Lanka
Dr. R.P.I.R. Prasanna, Department of Economics, Rajarata University of Sri Lanka
Dr. R. Jayathilaka SLIIT Business School, Sri Lanka Institute for Information Technology, Sri Lanka
Dr. S.K.N. Gamage Department of Economics, Rajarata University of Sri Lanka
Dr. S.N. Kumari Deparment of Sscience and Technonology, Uva Wellassa University of Sri Lanka
Dr. S. D. Rathnayaka Department of Export Agriculture, Uva Wellassa University of Sri Lanka
Dr. S. Dissanayake Department of Agricultural Systems, Rajarata University of Sri Lanka
Dr. T. Kumara Deparment of Public Administration, Uva Wellassa University of Sri Lanka
Dr. Y. M. S. Bandara Department of Transport and Logistics Management, University of Moratuwa
Mr. I. Tennakoon Deparment of Public Aadministration, Uva Wellassa University of Sri Lanka
Mr. R. Deyshappriya Deparment of Managemnt Scinces, Uva Wellassa University of Sri Lanka
Mrs. K.L.B.G. Dharmaratne Department of Business Management, Sabaragamuwa University of Sri Lanka

xxiii
Ms. A. Damunupola Department of Tourism Studies, Uva Wellassa University of Sri Lanka
Ms. S.F. Fasana Department of Management Sciences, Uva Wellassa University of Sri Lanka
Ms. Y.M.C. Gunaratne Department of Management Sciences, Uva Wellassa University of Sri Lanka

xxiv
Table of Content
Special Session on COVID Research
Effect of COVID-19 Pandemic on Agri-Food Supply Chains in Sri Lanka.........01
Hemachandra D., Weerahewa J., Roy D.
Restructuring Tourism Economies to Face the ‘New Normal’: COVID-19
Alternative Tourism…….….…………………………………….………….…15
Samathunga W.H.M.S.
COVID-19: The Socio-Economic Impact on Sri Lanka….................................27
Kandewatta K., Kurukulasooriya N., Keembiyahetti N.
Decent Livelihood and Well-being
Challenges & Prospects for Economic Empowerment of Persons with Visual
Impairment & Blindness Engaged in Self-Employed Ventures………..……....41
Dunuwila, V.R., Suraweera, T., Jayathilaka, R., Thelijjagoda, S.
Interrelationship between Decent Work Improvement and Penetration into
Global Supply Chain: A Deep-Dive into Literature Pertaining to Apparel
Industry………………………………………………………………………...47
Gunaruwan, T.L. and Hansamali, H.G.C.
In a Quest for ‘What They Value the Most’: Persons with Visual Impairment and
Blindness in a Clustered Community in Sri Lanka…………………………….55
Attale D.S.C., Sudusinghe D.R., Abeyrathna H.A.P.I., De Seram S.S.H., Jayathilaka R.,
Suraweera T., Thelijjagoda S.
Impact of Income Diversification on Household Welfare in Sri Lanka………...61
Senevirathne, M.M.S.C., Dharmadasa, R.A.P.I.S. and Senaratne A.
Livelihood Security and Income Diversification of Tea Smallholders; Evidence
from Galle District………….…………………………………………….........71
Mudalige, T.M., Dharmadasa, R.A.P.I.S.
Employee Perceptions of Workplace Wellness: A Case Study in ICT Industry Sri
Lanka…………………..………………………………………………………83
Yasoda, V.G.K.

xxv
Chronic Youth Unemployment and Policy Options for Sri Lanka......................89
Wijikumar K.
Disciplined, Dynamic Financial Strategies
Significance of Black-Scholes Model: With Reference to Nifty-50 Index Call
Options……………………..…………………………………………………..99
Hewamana H.M.R.R.
E-Trust, Innovation and Use of Fintech Driven Banking Products and Services
amongst the University Students………………………….………..……........110
Nayanajith, D. A. G.
Contribution of Lottery Industry on Sri Lankan Economy……………….…...110
Kurundukumbura, K.T.A., Dunusinghe, P.
Forecasting Exchange Rate and Modelling the Relationship between Exchange
Rate and Currency in Circulation in Sri Lanka………………….……….........118
Perera D.F.S.N., Lakshika B.H.H., Sanjeewani D.S., Chanika P.A.L., Chandrasekara
N.V.
Growth of Industrial Clusters and Access to Finance in Sri Lanka……………123
Fernando, P.J.S., Rathnayake, R.M.A.K., Chandrarathne, S.G.U.S., Rajapakshe, D.P.,
Jayasundara, J.M.D.P.
Impact of Macroeconomic Variables on Stock Market and Sector Returns:
Multivariate Time Series Approach……………………………….………….131
Sanjeewani, M. H. T. and Peiris, T. S. G. D.
Happiness and Prosperity Hybrid
Happiness and Prosperity Is it a “Chicken & Egg” Problem?...........................139
Hewage, T. U.
A Study of the District Quota System Based University Entrance Procedure of
the 1970s and it’s Effects on Contemporary Sri Lankan Society – A Historical
Analysis………………………….…………………………………………...144
Gamage G.C.L., Amarasingha S.

xxvi
Relationship between Utility of Driving, Socio-Economic Characteristics and
Risk Behavior of Drivers…………………………………..………………….149
Shaja, M.M.M., Bandara, Y.M.
Fading before They Bloom’: Child Mortality in Sri Lanka in
Householders………………………………………………………………....156
Liyanage, R., Adikari, H., Wanigarathna, N., Udalagama, R., Jayathilaka, R.
Impact of the Grade Five Scholarship Examination Achievements on the
Performance of Secondary School Education in Sri Lanka…………...………162
Keembiyahetti N.
Estimation of the Out-Of-Pocket Expenditure during Early Pregnancy: Evidence
from Rajarata Pregnancy Cohort, Anuradhapura……………………….….…168
Gunarathne, S.P.,Wickramasinghe, N.D.,Agampodi, T.C.,Prasanna, R.P.I.R., Agampodi,
S.B.
Age – Poverty Nexus: Is it Non-Linear? Evidence from Sri Lanka…………...178
Deyshappriya N.P.R., Gunarathne Y.M.C., Kulathilaka C.J.P., Gamachchige N.T.S.G.
Transferring Agricultural Technology
Opportunities Available and Constraints Faced By Paddy Farmers to Use Eco-
Friendly Technologies Developed Against the Chemical Fertilizer……….….187
Silva A. P., Jayasinghe-Mudalige U. K., Dharmakeerthi R. S., Dandeniya W. S.,
Balasooriya B. L. W. K.
Agri-Technology Adoption in the Context of Sri Lanka: A Relational Study...192
Nayanajith, D. A. G.
Stakeholder Preferences on Promotional Instruments to Produce and Utilize
Organic Fertilizer.…………………………………………………………….199
Jayakodi, J.A.S.N.S., Jayasinghe-Mudalige, U. K., Jayathilake, H.A.C.K.
Tech-Innovation Knowledge and Acquisition Extent Gaps of Technological
Innovation by the Internationalized Tech- Based Tea Smes in Nuwara Eliya
District of Sri Lanka…………………………………………….........….........204
Fernando W.M.S.N., Dasanayaka S.W.S.B., Mudalige D.

xxvii
Farmers’ Attitude towards Chemical Leasing for Sustainability and
Environmental Protection……..……………………………………...………213
Weerakkody M.P., Sivashankar P., Edirisinghe L.G.L.M., Malkanthi S.H.P.
Reorienting Sri Lankan Agriculture
Forecasting Weekly and Monthly Open Market Average Retail Prices of Green
Chilies in Colombo…………………………………………………….……..221
Kushan, M. A. K., Basnayake, B. R. P. M., Kaushalya, K. D., Wickramarathne, R. H. M.,
Chandrasekara, N. V.
An Analysis of Colombo Open Market Average Retail Prices of Big Onions in
Sri Lanka Using Time Series Forecasting Techniques………………………..229
Wickramarathne, R. H. M., Chandrasekara, N. V.
Economies of Scale in Paddy Farming in the Major Settlement Schemes in Sri
Lanka: A Case of Huruluwewa Agriculture Colonization Scheme…………...237
Abeyrathne, G.A.K.N.J., Prasanna, R.P.I.R.
Policy Support for Paddy and other Food Crops in Sri Lanka: How Large are the
Transfers to Farm Producers?............................................................................244
Sahibzada, S. and Weerahewa, J.
Improving Worker Safety in Agro-Processing: A Behavioral Economics
Approach through Nudging………………………………………....…..........251
Yashodara B.L.D.G., Sivashankar P.
Strategic Investment for Future
An Evaluation on the Economic Productivity and Risk Margin of the Energy
Transition to Clean Energy for Effective Strategic Investment……………….259
Pallege O.M.
Sri Lankan Construction Industry and its Domestic Footprint…………….….265
Gunaruwan, T. L., Jayasekara, C.G.
Urban Residents’ Willingness-to-Pay for “Green Spaces” in the Colombo
Metropolitan Area…………………………………………..………………...273
Udalamaththa U. G. K. O., Jayasinghe-Mudalige U. K., Dasanayake D. M. W.

xxviii
Public Investment Productivity as a Path for Sri Lanka to Escape from Middle
Income Trap: Reflections from Analyses of Transport Sector Projects……….278
Gunaruwan, T.L., Jayasekara, C. G.
Impact of Government Expenditure on Private Investment in Sri Lanka……...285
Rathnasiri R.A., Soysa J.S.V.N.T.
Foreign Relations and International Economic Repositioning
Non-Economic Factors that Influence Productivity in the Apparel Industry….295
Weerawansa, S.R.S.D.K.
Repositioning Sri Lankan Economy - An International Political Economic
Perspective……………………………………………..……………………..302
Moramudali U., Naidoo, J.
Public Opinion Assessment on International Trade Agreements: Reflections in
the Context of COVID-19…………………..………………………………...310
Gunaruwan, T.L., Yasoda V.G.K., and Hansamali H.G.C.
Does MCC Grant Promote Economic Growth And Development? Evidence from
a Cross-Country Study……………………………………………...………...317
Dunusinghe P.
Sri Lanka’s External Debt: Trend, Ownership, and Dynamics…….………….328
Dunusinghe, P.
The Effectiveness of Millennium Challenge Cooperation Grants in Growth
Stimulation: An Empirical Deep-Dive…………….………………………….336
Gunaruwan, T. L., Indeewari, G. K. D.
Relationship between Restaurant Demographics and Revpash; Evidence from
Registered Tourist Restaurants in Colombo District…………….……………342
Bandara, D.G.G.P.S., Karunarathne, A.C.I.D., Deshpriya N.P.R.
Strategic Marketing for Growth
Effects of Consumer Perceptions on Green Marketing Mix in Consumer Purchase
Intention of Fast-Moving Consumer Goods…………………………….…….351
Sivashanker R.

xxix
Determinants of Demand for Skill Level Based Labour Migration in Sri
Lanka…............................................................................................................357
Rathnayaka, I.W., Dilrukshi, M.H.S.
Impact of Green Supply Chain Management Practices on Operational
Performance of Apparel Exporters in Sri Lanka………………………………362
Ranasinghe, R.A.S.N., Cooray, N.H.K.
3PL Index: Measuring the Satisfaction of 3PL Customers in Sri Lanka………367
Premarathne, W., Gunaruwan, L., Weerawardane, T.L.
The Impact of Chocolate Brand Romance on Brand Loyalty (With Special
Reference to Chocolate Consumption in Seeduwa Area)……………………..374
Wijesinghe U.M.D.L, Sivashankar P., Mahaliyanaarachchi R.P.
Consumer Willingness to Adopt Online Grocery Shopping: Evidence from
Kandy District………………………..……………………………………….379
Hettige A.S, Sivashankar. P., Mahaliyanaarachchi R.P.
Social Marketing Concept within the Social Entrepreneurship Research Context:
A Systematic Literature Review………………………………………..……..385
Fernando, P.I.N., Jayawardhana, K., Siyambalapitiya, J.

xxx

Special Session on COVID Research

Sri Lanka Economic Research Conference 2020

Special Session on COVID Research
1
EFFECT OF COVID-19 PANDEMIC ON AGRI-FOOD SUPPLY
CHAINS IN SRI LANKA
Hemachandra D*., Weerahewa J., Roy D. University of Peradeniya, Sri Lanka.
Introduction
Following in-country’s diagnosis of the first Sri Lankan with COVID-19 on
March 11, 2020, the government of Sri Lanka implemented control measures
that were perhaps the most stringent a country has experienced during the
pandemic. Starting March 20, 2020, a 24-hour curfew was imposed on the 22
million people, relaxed only in low-risk districts twice a week for a few hours.
The curfew was partially lifted on April 20, then re-imposed intermittently
until May 10. This stringent disease management strategy however came
with economic disruption and costs, leaving a large number of people,
particularly in the informal sector vulnerable which contributes to about
59.8% of the total employment and 86.3% of the employment in the
agriculture sector (ADB, 2017).
In addition to its impact on public health, COVID-19 pandemic and
government policy responses have caused a major economic shake up in a
way that has led to dramatic changes and varied behavioural responses in
businesses and among consumers. Further, the COVID-19 outbreak and the
control measures forced many businesses to close, leading to an
unprecedented disruption of commerce in most sectors of the economy.
Many supply chain actors faced a range of challenges, such as those related
to health and safety, supply chain disruptions, the workforce, cash flow,
consumer demand, sales, and marketing.
With this background, the study was designed to identify the nature of the
effect of COVID-19 pandemic on business activities of the actors in food
supply chain and how they mitigate the challenges which occurred due to
prevailing conditions in Sri Lanka and elsewhere. The overall objective of
this study is to showcase the effect of the immediate measures implemented
on the agri-food supply chains in Sri Lanka with emphasis on the
microentrepreneurs. The paper is organized as follows. The next section
provides an overview on food supply chains of Sri Lanka. An account on
agri-food policy response to the COVID-19 pandemic is presented next. The

Sri Lanka Economic Research Conference 2020
2
following section presents findings from food supply chain survey with
emphasis on producers, households, and intermediaries.
Overview of Food Supply in Sri Lanka
Agricultural exports and food imports
Sri Lanka is self-sufficient in the production of rice, and nearly self-sufficient
in the production of other important food items such as meat, fish, eggs,
vegetables, and fruits. However, the country imports many of its essential
food commodities. In 2019, Sri Lanka imported LKR 410.3 billion of food
and beverages which accounts for 11.9% of the total imports (Department of
Census and Statistics, 2020). Imports as a share of the total requirement was
30% of cereals, 96% of pulses, 93% of sugar, 95% of vegtable oils, 57% of
spices. (Department of Census and Statistics, 2019). The country’s key
agricultural exports include tea, spices, fresh vegetables, fruits, and fish.
Agricultural production
Food production in Sri Lanka is carried by many scattered small holders.
Seeds of paddy and Other Field Crops (OFCs) are locally produced. Seeds of
exotic vegetables, particularly for production in the green houses, and the
other agricultural inputs (fertilizer, pesticides, fuel, machinery.) are largely
imported. Livestock production is also carried out mostly by the small-holder
farmers. Except for dairy, Sri Lanka is self-sufficient in other livestock
products. The export crops tea, rubber, and coconut are cultivated as
plantations and as well by smallholders. Other export crops, spices such as
cinnamon, ginger, and pepper are mainly cultivated by small-scale farmers.
The collective action (in the form of cooperatives or other organizations)
among farmers working as groups is weak that undermines their bargaining
power. Village level suppliers supply inputs to farmers mainly on credit and
a significant share of produce (mainly rice) are bought back by them (because
of the linked markets due to missing markets for credit and insurance).
Food processing, Distribution and Marketing
Food processing is a growing sector in Sri Lanka with a huge potential. The
sector comprises a few large dominant players in particular commodity
groups and many micro and small entrepreneurs. Poor value chain
governance leads to opportunistic behaviour for both the farmers and the
integrators i.e. reflected in poor commitments to contractual agreements. This

Special Session on COVID Research
3
could have hindered vertical integration and insufficient growth in
contractual arrangements, which slowed down linking of smallholder farmers
to the markets.
Most consumers (except those based in agricultural areas) depend on markets
for their food needs. The quantities channelled through supermarket supply
chains, compared to traditional retail outlets, with respect to fresh vegetable
are small. Urban and medium/high income consumers largely rely on
supermarkets and for this segment the role played by the small retailers and
wet markets has been declining over time. However, small retailers and wet
markets still play a significant role in the rural markets. A few leading
supermarkets buy directly from farmers mostly through their collection
centres. Furthermore, studies have revealed that supermarkets tend to buy
their vegetables from traditional wholesale markets especially during periods
of surplus production (glut). Commercial production of vegetables, tuber
crops and fruits are channelled through the Dedicated Economics Centres
(Dambulla, Thambuththegama) for island wide distribution.
Effect of COVID-19 on Food Distribution in Sri Lanka
Sampling and Data Collection Method
Primary surveys were designed to collect data from supply chain actors in
food supply chains in Sri Lanka. During to movement restrictions-
telephonic surveys were conducted as the best alternative for gathering data.
There is no sampling frame to derive a representative sample from. Hence,
the research team collected data from food chain actors via snowballing.
During the lockdown, food retailers came to doorsteps of the households.
They were interviewed and the next supply chain actor of the supply chain
was tracked down with the information provided by the retailer and so on all
the way down to the producer. The data collection thus followed actors in
specific supply chains. The sample comprised 250 respondents covering all
9 provinces and 13 districts in Sri Lanka.
Findings
The study investigated 147 different food supply chains which operated in
the study area. Figures 1, 2, 3 and Table 1 depict the composition of the
supply chain actors in terms of food categories, roles played, number of
supply chain activities performed and the interphases operated.

Sri Lanka Economic Research Conference 2020
4
Source: Authors’ illustration
30%
14%
9%10%
8%
4%
10%
10%
2% 3%Vegetables
Fruits
Dry products (Rice, Dhal,Dry Fish, Onion etc)Meat
Fish
Milk & Dairy Products
Eggs
Coconut
Figure 2: Composition of respondents’ involvements in different
supply chain roles
Figure 3:Nature of respondents’ involvements in different supply
chain roles
Figure 1: Diversity of surveyed food supply chains

Special Session on COVID Research
5
Source: Authors’ estimation
Effect of COVID-19 on Routine Business Activities
Around 90% of the food chain actors believe that their routine business
activities were affected during the period compared to pre-COVID period.
Seventeen percent of them believe that the pandemic affected them positively
while 65% believe that it affected them negatively (See table below).
Moreover, on average, respondents had to close their businesses temporarily
for 36 days.
Table 2: Perception on the Overall Effect of the COVID-19 Pandemic
Statement Strongly
disagree
Disagree Neither
Agree nor
disagree
Agree Strongly
Agree
This situation was
positively affected by my
regular business activities
30% 30% 23% 14% 3%
This situation was
negatively affected by my
regular business activities
2% 15% 18% 37% 28%
Source: Authors’ estimation

Sri Lanka Economic Research Conference 2020
6
There is variation in the percentage of food chain actors affected by scale of
operation where smaller scale operators seem to have been affected more
(Figure 4). Further, changes have happened differentially more in the input
markets (Table 3). In terms of response, majority changed their previous
supplier (25%) for some inputs due to movement restrictions, availability of
stocks with suppliers, and the intensity of the bargaining power of the
respondents. The entrepreneurs decreased all/some of the quantities of
material inputs that they bought compared to the pre COVID period.
Moreover, they changed some of the material inputs (15%) to match with the
prevailing market conditions (Table 4). Also, respondents have faced
reduction of working capital. As per table 5, majority have faced a 10 to 30
percent reduction in working capital during the pandemic period. Source:
Authors’ illustration
Figure 4: Ability to conduct routine business activities as normal by Scale
90% 90% 83%67%
10% 10% 17%33%
0%
50%
100%
0 < 5 >5-10 >10
Based on scale
No Yes
Table 5: Changes to Material Inputs
Changes occurred with regard to material inputs Frequency %
Change the supplier of all previous inputs 17 4%
Change the supplier of some inputs 97 25%
Change all the material inputs 11 3%
Change some of material inputs 59 15%
Increased the bought quantities of all previous inputs 14 4%
Increased the bought quantities of some of previous inputs 51 13%
Decreased the bought quantities of all previous inputs 71 18%
Decreased the bought quantities of some of previous inputs 72 18%

Special Session on COVID Research
7
Source: Authors’ estimation
The Table 7 below summarizes the changes that occurred in average input
price and quantity, average output price and quantity and average profit
margin.
Table 7: Summary statistics of average input price change, input
quantity change, output price change, output quantity change, and
profit margin change
Change Occurred Observation Mean Standard
Deviation
Min Max
Average input price change 235 -0.24 0.51 -1.00 2.03
Average input quantity
change 232 -0.15 1.26 -1.00 9.00
Average output price change 244 -0.16 0.47 -1.00 3.09
Average output quantity
change 241 0.04 1.83 -1.00 19.50
Average profit margin change 232 0.13 3.28 -15.00 24.33
Source: Authors’ estimation
Table6; % Experienced Reduction in
Working Capital
% Reduction of working capital
during the pandemic period
Frequency %
< 10 6 4%
>10-30 92 59%
>30-50 48 31%
>50-70 6 4%
>70 -90 3 2%

Sri Lanka Economic Research Conference 2020
8
Adoption of mitigation practices
Some respondents tended to rely on loans to overcome the economic
instability during the pandemic period. As a percentage, 15% of the
respondents obtained loans during the pandemic. To maintain supply of
labor, some owners tended to provide transport facilities to laborers during
the pandemic period. Table 8 below presents the perception of the effects of
COVID-19 on business activities, and behavioral changes.
Table 8: Perceived effect of COVID-19 on business activities and
behavioral changes
Statement Strongly
disagree
Disagree Neither
Agree nor
disagree
Agree Strongly
Agree
I had to change my role/functions in the food
supply chain
11% 31% 19% 32% 7%
I have shifted into a new food supply chain 13% 48% 18% 18% 3%
I found some new business opportunities 9% 36% 23% 27% 5%
This situation motivated me to think about
innovative ways to overcome
7% 22% 22% 45% 4%
This situation motivated me to utilize existing
social networks for resource mobilization
6% 16% 21% 49% 8%
This situation motivated me to expand the
existing business and/social networks
7% 20% 19% 48% 6%
I looked for alternative income sources (eg.
Agricultural activities, selling sanitizer and face
masks)
7% 39% 16% 32% 5%
This situation was positively affected by my
regular business activities
30% 30% 23% 14% 3%
This situation was negatively affected by my
regular business activities
2% 15% 18% 37% 28%
Even after the pandemic, I wish to continue
businesses/business practices I started during
the pandemic
3% 15% 34% 36% 12%
Source: Authors’ estimation
Intermediaries in the sample responded that COVID-19 pandemic negatively
affected their business (65% respondents agreed on this statement) and few
(21%) shifted into new food supply chains and some found new business
opportunities and engaged with alternative income-generating activities such
as agricultural work and activities from the surge sector, selling sanitizer and
face masks. Importantly, apart from that, COVID-19 pandemic motivated

Special Session on COVID Research
9
them to think more innovatively to conduct their businesses, to utilize
existing social networks for resource mobilization and to expand the existing
business and/social networks. Further, from the majority of entrepreneurs
who have started new businesses or/and altered their previous businesses are
willing to continue those activities even after the pandemic period.
Effect of COVID-19 pandemic on the Producers
A sample of 250 farmers from 7 districts representing different agro-
ecological zones of the country were interviewed to understand the effects of
COVID-19 pandemic on their production activities. The agricultural
production activities have not been significantly impacted even though as
Pandemic hit at post-harvest or at the harvesting stage of the crop in the Maha
cultivation season. However, since the markets were disrupted, fresh produce
farmers (e.g. vegetables and fruits) faced greater difficulty in selling their
produce. Even though the government launched a public procurement
programme, there was no proper structure in place. Most fresh produce
farmers reported selling their produce at substantively lower price.
Effect of COVID-19 pandemic on Consumers
An online survey was conducted comprising a sample of 300 households
representing the 25 districts of Sri Lanka. A self-administered questionnaire
was distributed among all undergraduate students enrolled in BSc degree
programs in Faculties of Agriculture in University of Peradeniya, Rajarata
University of Sri Lanka, and the Uva-Wellassa University. The questionnaire
was circulated in September 2020 and it was left open until 300 students
responded. The students were requested to provide information on socio-
economic characteristics of the household, and its food buying behavior and
food consumption pattern before and after the first wave of COVID-19
disruptions. The socio-economic characteristics of the sample indicate that
over 60% of the sample was from middle class and majority of the parents
work in the formal sector (only 10% of the parents work as casual laborers).
The average distance to the nearest grocery store and town, which provides
a proxy for connectedness to markets, were 1km and 6.5km, respectively.
The results revealed some changes in the food buying behavior owing to
COVID-19 disruptions. Reductions in in-person shopping, tendency to
purchase more at one go when shopping, used comparatively less busy stores
for shopping, buying larger quantities than previous and starting to rely on
food delivery systems were the most frequent changes occurred (Table 9).

Sri Lanka Economic Research Conference 2020
10
Table 9: Changes in shopping habits
Shopping Habits Frequency Percentage
Shop in-person less often 110 14%
Purchase more groceries when shopping 102 13%
Shop-in-person in less busy stores 105 13%
Purchase more frozen food 14 2%
Purchasing more packaged foods 65 8%
Started grocery delivery 66 8%
Purchasing less fresh (perishable) produce 48 6%
More attention to food packaging 38 5%
Increased frequency of grocery delivery 21 3%
Purchase fewer groceries when the shop 17 2%
Buying larger quantities than usual 72 9%
Buying cheaper or less preferred foods than usual 42 5%
Going to different grocery stores 34 4%
Shopping habits have not changed 22 3%
I don’t shop for groceries 27 3%
Not sure 16 2%
Source: Authors’ estimation
The perceptions of the households on safety of food had also changed due to
COVID-19 disruptions. The majority highlighted that they were not 100%
confident about the safety of the food they consumed during the COVID
period, but they have somewhat faith (around 50% confident) regarding the
safety of the food they consumed during the COVID period (table 10).
The findings on food consumption pattern revealed that availability of rice,
the staple, at the household level was not adversely affected in majority of
the households. By the time that the disruptions commenced, paddy
harvesting operations were concluded in most regions of the country. As most

Special Session on COVID Research
11
of the paddy farmers are semi-subsistence, sufficient stocks of rice was
available at the household level. Also, during the disruptions, the government
imposed a ceiling price on rice and facilitated paddy procurement through
government agencies to ensure smooth distribution of rice among the
consumers and safe-guard producers. In addition, an increase in consumption
of items extracted from food tree crops, such as jackfruits and breadfruits,
was observed.
Table 10: Confidence in the safety of food bought for consumption
Statement Frequency %
Yes, I am very confident that the food I am buying is
safe to consume 56 19%
Yes, I am somewhat confident that the food I am buying
is safe to consume 162 55%
No, I am not at all confident that the food I am buying
is safe to consume 35 12%
No idea 44 15%
Source: Authors’ estimation
The ceiling prices imposed on canned fish and dhal by the Consumer Affairs
Authority seems to have ensured accessibility to the essential ingredients in
typical middle-class Sri Lankan food consumption. Egg prices had decreased
during the times of COVID as small-scale producers started releasing stocks
of eggs among the households. In terms of market price behavior, no price
change was observed in wheat flour, bread, dairy products, and sugar as most
of these food items are subjected to price regulations. The survey results
indicate that quantities of consumption of such items have either not changed
or even increased during COVID-19 disruptions as tendencies for stocking
and bulk purchases went up.
The respondents however perceived a general rise in food prices relative to
non-food. Price increases in condiments, pulses, vegetables, coconut, fish,
dried fish, and fruits were felt by the majority of consumers. Consequently,
a decrease in consumption of vegetables, leafy vegetable, fruits, dried fish,
eggs, milk, fish, and meat like food was observed.

Sri Lanka Economic Research Conference 2020
12
The changes in household income could further exacerbate lack of food
affordability. More than half of the sample have agreed on having changes in
household income as in figure 5.
Source: Authors’ illustration
Figure 5: Change in household income due to COVID-19 disruptions
And they have identified loss of jobs/reduction in salary during the COVID-
19 period as the main factor which have led to change the household income
(figure 6).
Source: Authors’ illustration
Figure 6: Main reasons for changing household income
35%
65%
Change in household income due to COVID-19
disruptions
No
Yes

Special Session on COVID Research
13
At a summary level, a change in food habits could also be seen toward
subjectively assessed healthier options and a tendency for a healthier
lifestyle. The survey results indicate that people ate home food whenever
possible, drank more herbal, nutritious drink more frequently, and tried to
have a sufficient and balanced meal during the times of disruptions. Proper
washing of vegetables, fruits, meat and fish before preparation and heating
of food for a longer duration were also observed.
Table 11 presents the changes in eating habits during the COVID period,
accordingly households have tended to eat only from home (22%), to eat
more healthy and nutritious foods (18%), to eat enough amount (14%), to
switch from tea to herbal drinks (14%) and to drink herbal drink more
frequently (13%) during the COVID period. Increase in home-garden
cultivation was another change in response to the incentives provided by the
government for cultivation in home-gardens. A resulting increase in
consumption of home-grown food, healthier life styles, provision of more
care for vulnerable groups, and spending more time on social-networking
were also visible in survey results.
Table 11: Changes in eating habits
Source: Authors’ estimation
Eating habits Frequency Percentage
Towards eating more healthy and nutritious food 149 18%
Skipping meals 20 2%
Eating only a few varieties of food 70 9%
Eating less than earlier 36 4%
Eating enough 111 14%
Eating not enough 9 1%
Hungry but did not eat 12 1%
Ran out of meals 13 2%
Eating only home-cooked food 184 22%
Switch from tea to herbal drinks (koththamalli,
paspanduwa, etc.) 111 14%
Drink herbal drinks more frequently 106 13%

Sri Lanka Economic Research Conference 2020
14
Conclusions
The COVID-19 pandemic and the government-imposed movement
restrictions were expected to have had mostly negatively affected the food
supply chain actors. Due to inefficiencies in the food marketing channels,
while the fresh produce farmers suffered from lack of a market for their
produce, the consumers found less availability of fresh food. What was least
disrupted were the non-perishable cereals. More than the supply, it was the
supply chain issues that were comparatively affected. The intermediaries in
the supply chain faced difficulties in accessing produce for resale. Even
though some concessions were given by the government e.g. low interest loan
facticity, debt moratorium not many intermediaries availed of these This is
partly a reflection of the lack of integration of small entrepreneurs with the
financial markets. However, the micro and small entrepreneurs in the food
supply chain depicts a high flexibility in quickly adjusting to the market
needs which may be due to the low fixed to variable cost ratio of small
businesses. The low fixed cost to variable cost ratios and their small size
provides them resilience even when they are most adversely affected with a
correlated shock like COVID 19.
References
Asian Development Bank (2017). The Sri Lankan Economy Charting a New Course.
Ed. Athukorala, P., Ginting, E., Hill, H, and U. Kumar.
Department of Census and Statistics, 2019, Food Balance Sheet. Available at
http://www.statistics.gov.lk/Agriculture/StaticalInformation/Foodbalance_sh
eet/SummaryofFoodBalanceSheet2019.
Department of Census and Statistics (2020) Statistical Pocket Book, Available at
http://www.statistics.gov.lk/pocket%20book/

Special Session on COVID Research
15
RESTRUCTURING TOURISM ECONOMIES TO FACE THE
‘NEW NORMAL’: COVID 19 ALTERNATIVE TOURIM
Samathunga W.H.M.S.
Rajarata University of Sri Lanka
Introduction
The world did not anticipate the impact of COVID19 to be this magnitude. It
has been around a year since the first COVID19 patient had been reported
from Wuhan, P.R. China. The novel pandemic has brought the entire world
to its knees. The industrial and service sectors have come to a screeching halt
and the agriculture sector is still surviving despite of many challenges. Both
public and private sector institutions are searching for alternative strategies
to resume and run their operations and the government’s hands are tight with
many financial constraints. The schools and universities are turning in to
online, with poor or no 3G, 4G coverage in the peripherals. The food and
beverages, vegetables, medicine and other orders are placed online and the
supply channel is still half the mile. The opening times of the shops are
getting limited, so as the items to be sold. The flights are grounded and the
ships are anchored. The share market, the back born of nation’s economic
infrastructure, was shut down for a few months for the first time in its history.
The importations are controlled to save the foreign currency and the limelight
is on local economies. At this onset, COVID19 has exhibited much things
that were realistic only in fictions and the show is yet to continue. Thus, the
purpose of this working paper is to make an assessment of impact of
COVID19 on Sri Lanka tourism and to propose strategies to face the ‘new
normal’ through alternative tourism.
The latest statistics issued from World Health Organization (WHO) indicates
that COVID19 is still at a growing phase. The daily record of COVID19 cases
has doubled from 300,000 in early September to 600,000 in early December
2020. To date (December, 11), 70 million COVID cases have been reported
globally including approximately 1.6 million deaths. The growth curve is still
upward trending and the virus lives well with the winter. The situation in Sri
Lanka is also alarming since Sri Lanka exceeded the land mark of 30,000
cases on 9th December 2020 with 144 deaths (see Figure 1).

Sri Lanka Economic Research Conference 2020
16
According to United Nation World Tourism Organization (UNWTO)
statistics international tourist arrivals has declined by 70% in January-August
2020 over the same period in 2019 due to various reasons (UNWTO, 2020).
They include: travel bans, suspension of flights, curfew regulations, high cost
of travel, safety concerns of the potential travelers, and change of attitude of
hosts towards the guests (Samarathunga, 2020). The UNWTO further
estimates 75 million job losses worldwide and a plunge of US$ 1 trillion in
international tourism receipt. The airlines industry, in particular, has suffered
a loss of US$ 390 billion and aviation-supported jobs has fallen by 43%
(IATA, 2020). International tourism could recover the levels of 2019 in a
period of 2.5 to 4 years based on a variety of factors including: 1) travel
restrictions; 2) slow virus containment; 3) Low consumer confidence; 4)
prevailing economic conditions; 5) lack of coordinated response among
countries; 6) slow flight resumption according to UNWTO (2020). This is by
far the worst result in the historical series of international tourism since 1950
and puts an abrupt end to a 10-year period of sustained growth since the 2009
financial crisis.
Source: Worldometer (2020)
Figure 1: Spread of COVID19 in Sri Lanka
Sri Lanka economy and tourism
Since the end of the terrorist struggle, Sri Lanka kept much faith on the
tourism industry by introducing conducive tourism policies to uplift Sri
Lankan economy. As a result two mid-term tourism plans were produced by
Sri Lanka Tourism Development Authority namely: Tourism Development
Strategy (2011 – 2016), Sri Lanka Tourism Strategic Plan (2017 – 2020).

Special Session on COVID Research
17
Both plans aimed at increasing the employment opportunities for local
residents, earning foreign exchange, attracting Foreign Direct Investments
(FDI’s), increasing the number of hotel rooms in Sri Lanka and thereby to
contribute to the Sri Lankan economy. Table 1 summarizes the growth of Sri
Lanka tourism since 2009.
Table 1: Value & volume of Sri Lanka tourism
Year Tourist
Arrivals
Foreign
exchange
earnings
(US$ mil.)
Employment
opportunities
created (direct and
indirect)
Hotel Rooms
(SLTDA registered
and unregistered)
2009 447,890 349.3 124,970 14,461
2010 654,476 575.9 132,055 14,710
2011 855,975 838.9 138,685 14,653
2012 1,005,605 1,038.3 162,869 15,510
2013 1,274,593 1,715.5 270,150 16,223
2014 1,527,153 2,431.1 299,890 18,510
2015 1,798,380 2,980.6 319, 436 19,376
2016 2,050,832 3,518.5 335,659 22,336
2017 2,116,407 3,924.9 359,215 35,986
2018 2,329,294 4,380.6 388,487 38,214
2019 1,913,702 3,606.9 402,607 40,365
2020 (Q1) 507,311 - - -
Source: SLTDA Annual Reports (2009 – 2019)
Sri Lanka tourism industry is the third biggest Foreign Exchange (FE) earner
with a total earning of $ 4.4 billion in 2018 and $ 3.7 billion in 2019 (SLTDA,
2020) that has got the worst hit among other top FE earners: foreign
remittances, textile and apparel, and tea. The apparel and tea sectors will also
continue to record a declined FE earnings due to the impact of COVID-19 on
source markets. Although Sri Lanka has formulated strategies to attract six
million tourists by 2025 and earn $ 10 billion income, it is highly unlikely
that those goals will turn into realistic figures. Additionally, the target of
achieving 3.5-4 million tourists and earning US$ 5 billion in 2020 has already
turned to a day dream.
According to SLTDA statistics in 2018, 173,592 and 229,015 people were
employed as direct and indirect employees respectively by the tourism
industry (SLTDA, 2020). As of now, a vast majority of these workers are
temporarily unemployed due to the closure of hotels and restaurants, airlines,

Sri Lanka Economic Research Conference 2020
18
travel agencies, tourist shops etc. This has made a significance impact on the
families who were totally depending on tourism. On the other hand, tourism
investors are facing a financial crisis without being able to maintain a
sufficient cash flow to pay back the debts, to pay the salaries and for other
essential maintenance works at the properties. At this back drop issuing a
debt moratorium, stop charging hotel and tour guide’s renewal fee, and
exemption of VAT and TDL from the industry for a shorter period can be
identified as an attempt to protect the industry.
The tourism industry is an integrated industry networked with many other
sectors in the economy including hotel, community level operations,
education, financial, agriculture, medical, travel and transportation,
construction, real estate, retail etc. There are number of service providers
such as accommodation Suppliers, Travel Agencies, Event Coordinators, and
Transportation service providers etc. The current situation has halted all the
income sources to those service providers. Therefore, it is important to
protect these sectors and make them cater future tourism demand of the
country. Otherwise, this may lead to reallocation of resources to other
industries leaving the tourism industry unattended.
Cruises are particularly susceptible to epidemics that put the cruise
passengers at a great risk. The case of Diamond Princess Cruise has exhibited
the vulnerability of cruises to pandemics. Thus, ‘cruise calls’ have been
called-off. The impact to Sri Lankan tour guides is eye opening. Tour guides,
that include National Tour Guides, Chauffeur Tour Guides, Area Guides, Site
Guides and Informal (unlicensed) Guides are totally unemployed, who make
a total of 5,424 (SLTDA, 2019). It is further important to note that currently
there are no bookings for 2020 winter season and the green light for Summer
2020 is yet to come.
Sri Lanka’s popular national parks have been closed since March, 2020 in
response to the COVID-19 pandemic. It has made a huge impact on tour
guides, jeep drivers, guesthouse owners, and many others dependent on the
tourism industry. While some are eligible for government programs,
including a stay on jeep repayments, others such as campsite owners and
whale-watching boat operators have little recourse for a return on their
investments. There are calls for affected workers to be temporarily employed
as maintenance workers in the closed parks, pending the eventual reopening
of the tourism industry. The employees and owners of small guesthouses,

Special Session on COVID Research
19
bungalows and camping sites closer to the national parks are few other groups
affected by the current situation. Although combatting COVID19 become
successful, it is not sure how fast the airlines, cruise lines, hotels and
restaurants, destinations and other tourism related service establishments can
prepare themselves to run their operations due to the post-COVID19
challenges.
When analyzing the impact of COVID19 on Sri Lanka tourism, it is vital to
assess the impact to Sri Lankan source markets (see Table 2). Recording
355,002 tourist traffic to Sri Lanka in year 2019 India was the highest tourist
generator to Sri Lanka. As of 9th December, 2020, India reports 9,762,326
COVID-19 cases which is currently increasing by around 26,351 new cases
per day. United Kingdom, the second major source of tourist traffic to Sri
Lanka, which recorded 198,776 arrivals in 2019 (SLTDA, 2020) hit badly by
the coronavirus recording 1,766,819 cases as on 10th December 2020. The
outbreak is not controlled yet as recorded numbers daily increase by around
16,578 new cases per day in UK. The fourth main source market, Germany,
records average 23,873 new COVID-19 cases with a total of 1,242,198 cases
in the country. China, surprisingly, stood tall despite of global COVID-19
blow with their own controlling mechanisms and experimental vaccines.
Most of the countries listed in Table 2 have imposed international travel
restrictions against their residents as explained earlier in this article. As
supply side factors: 1) closure of Sri Lankan international airports; 2)
mandatory Polymerase Chain Reaction (PCR) for international travelers; 3)
mandatory 14 days quarantine period; 4) poor attitude among the general
public towards foreigners; 5) standardizing the tourist hotels according to
new health guidelines; 6) closure or suspension of operations of hotels and
travel agencies discourage international travelers to visit Sri Lanka. At this
backdrop it is important to understand alternative measures to protect Sri
Lanka tourism industry.
Restructuring the Tourism Economies
Alternative tourism potentials in Sri Lanka
Sri Lanka has around 22 national parks, 36 lagoons around the island, and
around 240,000 of plants, out of which 3368 species are flowing plants. Sri
Lanka is also home for 512 species of birds, 245 species of butterflies, 5 out
of 8 species of turtles in the world, 93 species of fish, 116 species of

Sri Lanka Economic Research Conference 2020
20
Amphibians, 65 species of dragon flies (Gurusinghe, 2020). Sri Lanka is also
blessed with 33% of forest cover and about 50% of green cover (UN, 2020).
As a result International Union for Conservation of Nature declared Sri
Lanka as one of the 36 bio-diversity hotspots in the world (IUCN, 2020).
Table 2: Top 10 source markets to Sri Lanka tourism and the impact of
COVID19
# Source Market % share of total
traffic
Impact of COVID19 (as on 10 DEC 2020)
Total No. of
cases
Total No. of
Deaths
Mortality Rate
(%)
1 India 18.6 9,762,326 141,735 1.451857
2 England 10.4 1,766,819 62,566 3.541166
3 China 8.8 86,661 4,634 5.347273
4 German 7.0 1,242,198 20,704 1.666723
5 France 4.6 2,324,216 56,648 2.437295
6 Australia 4.8 27,993 908 3.243668
7 Russia 4.5 2,541,199 44,718 1.759721
8 United States 3.6 15,784,967 296,072 1.875658
9 Maldives 3.1 13,274 47 0.354076
10 Canada 2.5 433,242 12,954 2.990015
Total 68.0 33,982,895 640,986 1.886202
Source: SLTDA (2020) Worldometer (2020)
Apart from that, Sri Lanka is blessed with incomparable tangible and
intangible attractions (Ministry of Tourism and Christian Religiou Affairs,
2017; Samarathunga, 2019; Weerathunga et al., 2020). However, both
natural and cultural attractions in Sri Lanka are highly underutilized
(Liyanage and Jayawardena, 2013). Even to date, there is no comprehensive
document to analyze the value of alternative tourism in Sri Lanka and the
annual survey conducted by Sri Lanka Tourism Development Authority also
do no pay sufficient attention towards alternative tourism.
However, few non-profit organizations including Sri Lanka Eco-tourism
Foundation, continue to promote alternative tourism in Sri Lanka despite of
many challenges. The subsequent sections will explain the importance of
promoting alternative tourism in Sri Lanka and few alternative tourism
concepts that can be easily implemented in Sri Lanka as an alternate to
unsustainable mass tourism.

Special Session on COVID Research
21
Promoting Alternative tourism
Mass tourism can be identified as the most famous form of tourism in the
world that involves movement of large number of tourists (usually tens of
thousands) to the same destination at the same time of year (Cooper et al.,
2005). Mass tourism is very popular due to low cost and standard services,
especially on ‘All Inclusive’ packages. Due to constant and overwhelming
demand, the tour operators, destination management companies (DMC’s),
hotels, airlines, cruise lines and other service providers make large scale
economies and provide tourism products and services at a cheaper price.
Despite significant positive impacts of mass tourism, it simultaneously brings
irreversible negative consequences to the destinations (Samarathunga and
Gnanapala, 2016). However, the present social distance measures and travel
restrictions has paused mass tourism with the fear of tourists visiting crowded
places. This alarming situation has grabbed the attention of the national
tourism organization, investors, employees and other stakeholders.
Therefore, it is expected to develop ‘alternative tourism’ during the post-
COVID19 revival phase. The importance of alternative tourism is that it can
play a pivotal role to utilize underutilized tourism resources and to promote
sustainable tourism in the long run (McGehee, 2002).
Alternative tourism takes the tourists away from their comfort zones and
gives them an exotic experience which is close to the nature, culture, history
or even the religion of the country that they visited. Different facets of
alternative tourism are: ‘Health and Wellness Tourism’, ‘Rural Tourism’,
‘Agro-tourism’, ‘Eco-tourism’, ‘Back-packing Tourism’, ‘Community-
based Tourism’, Pro-poor Tourism’, ‘Volunteer Tourism’, ‘Spiritual
Tourism’ etc. (Novelli, 2005). For the tourism investors and entrepreneurs
this is a good market to earn big by serving to fewer and elite groups. Sri
Lanka’s diverse landscapes, rich natural and cultural heritage, and traditional
knowledge can lay a breeding ground for the promotion of alternative tourism
within the country. Out of many, we propose following niche tourism
concepts to introduce by means of alternative tourism to promote Sri Lanka
as a primeval destination to visit:
Health, Wellness, Ayurveda and Spiritual Tourism
Movements of three quarters of the world population is now limited to their
own walls or fence. All these people will look at different ways of
rejuvenating to get away from the stress and haunting experience of their
lives. Many European countries have already established 24 hours help lines

Sri Lanka Economic Research Conference 2020
22
to attend to the grievances of such people. As a result, we can forecast an
increased demand for health and wellness tourism, and spiritual tourism
among the Western tourists in the months to come. Rest and recuperation,
spiritual healing and understanding, physical and mental wellbeing,
Ayurveda and Yoga, meditation, and understanding the reality of life will be
key search terms among in the tourism search engines during the revival of
tourism. Sri Lanka has a comparative advantage to grab this market
associated with deep rooted Buddhism and Hinduism philosophies and
Ayurveda in Sri Lanka. The Western institutions including hospitals, police,
military, and other first respondents will select Eastern destinations like Sri
Lanka to send their first line operational staff for distress and rejuvenation.
The traditional Ayurveda herbal medicines and the medicinal process
improve the immune system of the human body. A research-based promotion
will be able to get the attention of the potential clients towards Sri Lanka.
Rural Tourism and Agro Tourism
‘Rural tourism’ and ‘Agro tourism’ can be identified as one of most famous
niche tourism trends in the world (Novelli, 2005). Lots of urban dwellers
around the world are searching for rural and agricultural experiences during
their vacations as a method of enhancing their knowledge and adding some
life skills. The COVID19 made the people to think back about their lives and
skills of survival during their time at condominiums. As a result, the parents
will think of equipping their children with basic life skills that include
agriculture and farming to survive during unprecedented challenges of life.
As a result, it is postulated an increased demand for agro-tourism in the future
where people can learn simple ways of life, planting, gardening and
understanding the environment around them. Therefore, we need to clearly
identify what farms, what paddy fields and what Chenas are suitable to
promote agro-tourism and make necessary developments to attract and retain
the tourists.
Tea Tourism
Many researches have proved the herbal value of tea to increase the immunity
of the human body. Sri Lanka as one of the best tea producers in the world
already has a reputation for its incomparable ‘Ceylon Tea’. Since some of
our traditional international tea importers including Russia, Iran, and Turkey
are badly affected by the virus, the demand for tea will be fluctuated in the
short-run. However, to keep the tea estates running and to employ thousands
of workers we can think of introducing experienced based tea tourism to the

Special Session on COVID Research
23
world. Tea tourism need to be developed around the entire process of tea
production including tea planting, estate maintenance, tea plucking, tea
processing, tea packing and most importantly tea tasting. However, if we are
to promote tea tourism, tourists should be given unique and innovative
experience in the tea estates that solely reflect the tea culture. The simple
daily activities happening in tea estates can turn into tourism activities easily
with proper planning and product development. The cost involved in this
entire process is minimum. It is further important to narrated songs, play
dramas about it and even to plan some cities with the ‘Tea’ theme to add a
touristic value to tea tourism.
Eco-tourism and Community Based Tourism
Sri Lanka being a bio-diversity hot-spot in the world has a huge upside
potential to promote eco-tourism. The 22 national parks, numerous rivers,
tanks, and waterfalls, different weather zones and geographical zones, marine
environment, endemic flora and fauna are not effectively touched by Sri
Lanka tourism. A very low number of eco-tourists are visiting Sri Lanka get
a real eco-tourism experience since most of tour eco-tourism products are
largely concentrated to commercialized camping, jeep safaris chasing the
animals and boat rides scaring the fish and other aquatic animals. Proper
tourism product developments need to be done with the mediation of the eco-
tourism experts either regionally or nationally. Trekking and tracking, bird-
watching, whale and dolphin watching, turtle watching, nature photography
in particular can be promoted as eco-tourism products in Sri Lanka while
delivering benefits to the rural communities through community-based
tourism. However, without merely restricting the tourists’ visits to ‘gazing’
an active participation with ‘performing’ is recommended to promote these
events among the tourists (Perkins and Thorns, 2001). Having said that, we
should adhere to eco-tourism principles introduced by The International
Ecotourism Society (TIES) when developing eco-tourism products.
Alternative markets
Due to increased health risks future travels will show signs of regional
travels. As a result, the potential tourists will find it more comfortable to
travel to short-haul destinations. Since the international traveling will be
limited to particular regions of the world during the first recovery phase of
COVID 19, it is important to pay the prime attention on regional markets at
the beginning. Accordingly, China, Australia, Maldives, Singapore, South
Korea, Thailand, Taiwan, and Hong Kong should be our greatest concern

Sri Lanka Economic Research Conference 2020
24
since the COVID19 impact to such generating countries are relatively low
compared to other top markets. Table 3 exhibits potential markets to Sri
Lanka for destination promotion immediately after combatting COVID19.
Table 3: Potential alternative markets to Sri Lanka
Country No. of
COVID
cases
(2020.12.10)
No. of
Deaths
Outbound
Travel in
2018 (mil.)
Arrivals
to Sri
Lanka
(2018)
Arrivals
to Sri
Lanka
China 86,661 4,634 150 265,965 0.17%
Australia 27,993 908 11.2 110,928 1.00%
Maldives 13,274 47 N/A 76,108 -
Singapore 58,291 29 8 19,861 0.24%
South Korea 39,432 556 28.7 15,748 0.05%
New
Zealand
2,088 25 3 14,595 4..86%
Thailand 4,151 60 10 9,178 0.09%
Taiwan 720 7 16.6 8,187 0.04%
Cyprus 13,286 68 N/A 672 -
Hong Kong 7,180 113 7.4 25 0.0003%
Source: UNWTO (2020), SLTDA (2020)
Even though China believed to be the country where the virus first began
spreading, they have successfully managed to control COVID19. On the
other hand, China is one of the top source markets to Sri Lanka for a
considerable time and one of the top tourists generating countries in the world
as well. The unique outbound market in Hong Kong provides a perfect
breeding ground to enrich the tourism industry in Sri Lanka. According to
UNWTO, Hong Kong ranked 11th in the world in terms of international
tourism expenditure. However, Sri Lanka has failed to grab this elegant
market which is in the same region and only 0.0003% of Hong Kong tourists
visit Sri Lanka. South Korea is another promising market for Sri Lanka
tourism after the COVID 19 epidemic. South Korea is highly urbanized
country with the 12th biggest economies in the world. Sri Lanka and South
Korea enjoy an abiding and friendly relationship which goes back to the 5th
century AD. Currently South Korean investment has more than 75 companies
based in Sri Lanka generating over 18,000 job opportunities in the country.

Special Session on COVID Research
25
Additionally, more than 28,000 Sri Lankan contractual employees are
engaged in the manufacturing, construction and fishery sectors under the
Employment Permit System (EPS) in the Republic of Korea. This situation
lays a firm foundation for enhancing tourism in Sri Lanka under VFR and
Business category. Therefore, a promising potential is there in Sri Lanka to
attract South Korean tourists which is still not addressed effectively.
Conclusion
As mentioned earlier it is not possible to resume mass tourism in near future
since mass gatherings are risky until a vaccine is developed to fight with
COVID19. Now the challenge lies ahead is to re-brand Sri Lanka as a ‘Niche
Tourism Destination’ after identification of correct alternative tourism
products and concepts. The concept of ‘quantity’ is failing and the ‘quality’
is emerging during the post-pandemic tourism phase. Alternative tourism
will protect the people, environment and economy while empowering the
rural communities to increase their living standards. Further, it will support
the industry to overcome the heath barriers imposed by COVID19 virus. A
learning based active experience will be a definite value addition for the
promotion of alternative tourism development in Sri Lanka while using
correct platforms to market our products. Research based innovative methods
will give birth to ‘Creative Tourism’ that will position Sri Lanka as a pristine
niche tourism destination in the world while securing the well-being of
people, planet, and sustainable profit.
References
Cooper, C. (2005) Tourism: Principles and practice. London: Pearson Education.
Gurusinghe, P. (2020) Eco-tourism in Sri Lanka. Available at:
http://www.srilankaecotourism.org/index.php (Accessed: 10 December
2020).
IATA (2020) The impact of COVID-19 on aviation. London: International Air
Transportation Association.
IUCN (2020) Sri Lanka’s National Biodiversity Strategy and Action Plan. Available
at: https://www.iucn.org/ (Accessed: 10 December 2020).
Liyanage, U. and Jayawardena, C. (Chandi) (2013) ‘Towards a positioning strategy
for tourism in post-war Sri Lanka’, Worldwide Hospitality and Tourism
Themes, 5(5), pp. 477–485. doi: 10.1108/WHATT-05-2013-0029.

Sri Lanka Economic Research Conference 2020
26
McGehee, N. G. (2002) ‘Alternative tourism and social movements’, Annals of
Tourism Research, 29(1), pp. 124–143.
Ministry of Tourism and Christian Religiou Affairs (2017) Sri Lanka Tourism
Strategic Plan 2017 - 2020. Colombo.
Novelli, M. (2005) Niche tourism: Contemporary issues, trends and cases. London:
Routledge.
Perkins, H. C. and Thorns, D. C. (2001) ‘Gazing or performing? Introduction: the
tourist performance’, International Sociology, 16(2), pp. 185–204.
Samarathunga, W. (2019) ‘Research on the intangible ethnic tourism development
after the civil war, based on stakeholder perspective: the case of Jaffna, Sri
Lanka’, International Journal of Tourism Anthropology, 7(3/4), pp. 218–240.
doi: DOI: 10.1504/IJTA.2019.107317.
Samarathunga, W. (2020) ‘Post-COVID19 Challenges and Way Forward for Sri
Lanka Tourism’, ResearchGate (Preprints), pp. 1–12. doi:
10.13140/RG.2.2.32337.89443.
Samarathunga, W. and Gnanapala, W. K. A. C. (2016) ‘Impact of All-inclusive Tour
Packages with Special Reference to Bentota tourist Resort’, in Aslam, M. et al.
(eds) Sustainable Tourism in the Global South: Communities, Environments and
Management. Cambridge: Cambridge Scholars Publishing.
SLTDA (2019) Annual Statistical Report 2018. Colombo: Sri Lanka Tourism
Development Authority.
SLTDA (2020) Annual Statistical Report 2019. Colombo: Sri Lanka Tourism
Development Authority.
UN (2020) Global Forest Resources Assessment 2020. Rome: Food and Agricuture
Organization for the United Nation.
UNWTO (2020) UNWTO World Tourism Barometer. Madrid: United Nation World
Tourism Organization.
Weerathunga, P. et al. (2020) ‘The Relative Effect of Growth of Economy , Industry
Expansion , and Firm-Specific Factors on Corporate Hotel Performance in Sri
Lanka’, SAGE Open, pp. 1–21. doi: 10.1177/2158244020914633.
Worldometer (2020) COVID-19 CORONAVIRUS PANDEMIC. Available at:
https://www.worldometers.info/coronavirus/ (Accessed: 19 April 2020).

Special Session on COVID Research
27
COVID-19: THE SOCIO-ECONOMIC IMPACT ON
SRI LANKA
Kandewatta K., Kurukulasooriya N., Keembiyahetti N.*
University of Ruhuna, Sri Lanka1
Introduction
The world is going through the most destructive pandemic in the 21st century
so far; the Corona Virus Disease (aka COVID-19). Since the initial reporting
of the infections from Wuhan city in China; the human-to-human infection
of the disease ensured it to be escalated into a global pandemic. The extensive
nature of the virus spread over global economic activities were extensively
affected following the health shock. The health shock of the pandemic
combined with the economic shock generated far reaching complications to
individual economies as well as to the global economy.
Sri Lanka is not an exception of this global trend where the economic cost of
health shock itself resulted in economic losses and was intensified through
the extreme prevention methods imposed initially in the country.
While the health shock impacted each spectrum of the society in a uniform
manner, the economic shock is felt unequally through each segment of the
society (Stiglitz, 2020). The people who are in the lower spectrum of the
income distribution witnessed the most difficult time dealing with the
situation and in fact were faced with a dilemma of dealing with the economic
shock while following the health guidelines issued control the spread of the
virus.
1 Following researchers are acknowledged for their extensive contribution forthis
research: Dr A.J.M. Chandradasa, Mr H.K. Sarath, Mrs W.P.S Rajapakshe, Mr L.K.
Kapila Peiris, Mr W.A.N.D. Wijesinghe, Mrs Anne Jithma Jayasekara, Ms I.G.
Sulakkana Kumari, Mrs Anuradha Gamage, Mrs S.S. Langappuli, Mrs B.W.M.N.M.
De Silva, Ms A.N. Nirikshani Mendis

Sri Lanka Economic Research Conference 2020
28
Even after the second wave of the virus in the country the health cost in Sri
Lanka remains very low with more than 25 000 recorded cases and a
mortality rate of 0.48 per cent which is considerably impressive in
comparative sense according to official data published by the Ministry of
Health. However, it is completely irrational to predict a fixed future and these
data can undergo dramatic change within matter of few weeks. Given this
back drop it is completely impossible to predict the 100 per cent accurate
depiction on the economic implications of the future rather can be made
attempts to generate general picture on likely economic complications based
on different situations.
The research was conducted on this motive to investigate the economic shock
resulting from the health shock. In order to investigate this relationship, the
study focused on the economic shock at both household level and
macroeconomic level to identify the economic complications arising from
the pandemic at each level of the economy.
Objectives and scope of the study
A study of this magnitude needs establishing broader boundaries to capture
the overall economic implications generated by the ongoing pandemic. Thus,
the entire research process of collection and analysis of data is entirely
depending on the research objectives spectrum of the research. The study
formulated based the motive to investigate the existing economic challenges
imposed by the pandemic and to propose policy options to overcome such
challenges. Based on this backdrop the prime objective of the study is to
investigate and assess the immediate economic impacts of the COVID19
pandemic on Sri Lankan economy. It is obvious that all the economies at a
global level; are affected by the COVID19 pandemic and the assessment of
the impact of the pandemic that quantify the likely magnitudes of the effects
must be evaluated within a range of scenarios for the formation of policy
strategies for regaining the economies affected by the pandemic.
Accordingly, the prime objective of the study is dedicated in this regard.
However, in order to formulate a comprehensive analysis; specific objectives
are also incorporated to the study. The COVID-19 outbreak has an
unprecedented effect on the entire spectrum of economic activities in Sri
Lanka. The economic shock would result in a decline of household
consumption and private sector economic activities which also generate
significant implications on investment activities as well.

Special Session on COVID Research
29
Notwithstanding with the temporary decline of some economic activities; the
pandemic may lead too far reaching long run economic costs to the national
economy at large. For instant, the direct impact of disruption to business
activities in front-runners of the Sri Lankan economy in the recent past such
as the tourism, construction and textile industry would deepen the economic
cost to the country. In order to evaluate these sectorial level economic
implications of the pandemic a set of specific objectives are also incorporated
to the study.
First the study will investigate the COVID-19 impact on various economic
activities in Sri Lankan households. Moving into national level; the pandemic
impact on selected economic sectors will also be investigated in order to
generate an overall picture about the economic cost of the pandemic. Finally,
based on the findings emerging from the above sub-objectives prudent policy
measures are suggested to mitigate the negative economic implications and
to reach a V-shaped economic recovery in Sri Lanka.
Methodology
Therefore, the study aimed at investigating the economic impacts of the
COVID-19 pandemic amalgamating both quantitative and qualitative
approaches to achieve the objectives mentioned above. The impact of the
pandemic felt at each level of the Sri Lankan economy and therefore a
consideration on every dimensions of the economy must be studied.
Therefore, both primary and secondary data were collected for this research
to provide a meaningful insights and policy implications.
Since this research was a rapid assessment of the immediate impact of the
pandemic the data collection was carried out at a time where the entire
country was locked down as a transmission prevention mechanism. As a
result, the online questionnaire method and in-depth interviews by means of
telephone interviews were conducted for gathering of the relevant primary
data.
The survey questionnaire contained forty-three questions to cover various
aspects of the economic shock on household level of the economy. A sample
of 1500 households were chosen and finally 1087 usable responses were
received covering 22 administrative districts in Sri Lanka. The reference
period for the data collection was from 20th April 2020 to 20th May 2020.

Sri Lanka Economic Research Conference 2020
30
In order to identify the economic cost in key economic sectors the experts
and practitioners in different sectors of the economy were interviewed2 by
the research team and their views were instrumented with secondary data
obtained from Central Bank of Sri Lanka, Tourism Development Board, the
Chamber of Commerce and World Bank World Development Indicators.
Findings
This section consists of two sub-sections where the first section will be
discussing about the findings of the online survey carried out to investigate
the household level impact of the pandemic and the section following will
discuss the economic-bearing of the pandemic on the selected economic
sectors.
The Household level impact
The findings of the online survey conducted to investigate the household
level impact will be compiled considering pandemic implications on three
main economic variables such as the household Income, expenditure, and
indebtedness of the household.
The income sources of 64 per cent of the households have been affected while
7 per cent lost their entire income. It should be noted here that the overall
household income was taken into account for this purpose rather than the
individual income status of the participant of the research. There is no
association between change of income and change of job status after the
COVID-19 outbreak which reflect that the loss of household income will be
temporary loss of their jobs and other income sources. However, 3% of
households lost their entire livelihood due to the pandemic. The daily wage
earners are the most vulnerable spectrum of the society where due to the lack
of savings their resilient to long term disruptions to livelihood would put
them in a very disadvantageous position. While admitting that most of the
daily wage earners are employed in the informal sector and their access to
internet and computer literacy limit the ability of collecting data,
approximately 82per cent of households were resilient to the crisis since they
were fixed income earners.
2 The in-depth interviews were conducted following the ethical guidelines.

Special Session on COVID Research
31
Changes of expenditure and savings patterns are provisional. Education,
transport, entertainment expenditure, medicine and loan repayment
expenditure significantly declined, and it can be assumed that all these
changes are provisional and thus people will be on the pre-pandemic
conditions in the post-COVID-19 period. Electricity bills, internet cost and
donations have noticeably increased. Two per cent of households
experienced net losses instead of savings and the loss was estimated to be
LKR 60,000 per household on average per month during the period of the
economic lockdown. Fifteen per cent of households reported no losses or no
savings. Average savings amounted to LKR 70,000 while the median savings
per household amounted to LKR 20,000.
Meanwhile, people have changed their attitudes and practices towards daily
living during lockdown period at the Post COVID 19 period. Nearly 75 per
cent of households are ready to continue the activities initiated during the
post-COVID- 19 period, including home gardening. Forty-six per cent of
households have understood that they are wasting foods and consumables.
However, it was revealed that smoking and alcohol consumption patterns
have not been changed significantly and the likelihood of changing them is
very minimum.
During the study period no change in debt liabilities was reported in 79 per
cent of the households whereas only 6 per cent of the household has fallen to
indebtedness due to the COVID-19 outbreak. The COVID-19 has not created
a debt trap for many of the households in Sri Lankan economy. Five to ten
per cent of the households borrowed on loan repayments and daily
consumption needs while a very small percentage of households borrowed
for medical treatment and bill payments. Just 8 per cent of households are
seeking support for repayments of loans borrowed during the pandemic.
The government-imposed relief measures on debt repayment to ease out the
pressure on debt repayment. However, more than 50 per cent of households
stated they are not in a need of financial assistance while around 45 per cent
of households are seeking financial support for loan repayment, redeeming
mortgaged items, paying outstanding credit card balances and other bill
payments. The current debt moratorium introduced by the Central Bank for
three months will provide only a cushion, the liabilities will be accumulated
and both borrower and the lending institution will be in trouble after three
months, unless the borrower’s income sources are regained.

Sri Lanka Economic Research Conference 2020
32
Finally, we investigated the expectation of the household on any kind of
assistance needed from third party to deal with this situation. About 55 per
cent of the households refused any kind of technical assistance since they
have no permanent damage due to COVID-19. Forty-five per cent of
households are expecting some type of advice for their betterment and thus
government intervention is important. Formal or informal arrangements
within societies for promoting mutual assistance proved to be improving
resilience of the lower income earners in a time of unexpected economic
shock. Therefore, 78 per cent of the households have opted to form such
social capital in the neighborhood for mutual assistance among communities.
The National-level Impact
The next section will be investigating the macroeconomic-level implications
of the pandemic by selecting key contributing sectors to Gross Domestic
Product (GDP) of the country on average in the recent past.
The Travel and Tourism industry was one of the driving forces of the Sri
Lankan economy in the post war era. Sri Lanka regaining its status as an
international tourist hotspot resulted in an influx of tourist arrivals to the
country which exceeded 2 million tourist arrivals annually by 2018. The
transmission prevention measures such as travel bans, mobility restrictions,
lockdowns and border closures disrupted global travel and tourism industry
for which Sri Lanka was not an exception. While international tourist arrivals
reached bottom line; domestic tourism also hindered with internal travel
restrictions. As a result, the industry faced a dramatic shift from a most
lucrative industry to a severely disrupted industry due to the pandemic. This
unexpected change resulted in the layoff of temporary and casual employees,
while permanent employees are also in high risk of job loss with the current
salary freeze. Approximately twenty per cent of indirect employees lost their
earning sources. Zero income created a financial distress to investors as well
and were trapped by indebtedness despite the loan moratorium granted for a
few months. Investors are likely to leave the industry though there are no
threats on mortgaged property to foreclose. Stakeholders will indeed be
relieved in 2021 if there are no more disasters. Regaining tourism entirely
depends on the source markets’ recovery and on the safety brand of Sri
Lanka. Thus, Sri Lanka has to harness new avenues in tourism.
Meanwhile the Banking and Finance sector is expected to play a dual role of
cushioning the other sectors of the economy while maintaining the financial

Special Session on COVID Research
33
soundness. While the assets quality of the banking sector is expected to go
down, the credit demand would adversely affect in near terms responding to
disrupted economic activities. Non-Performing Loans (NPLs) are expected
to go up in the short and medium terms, which can be risky. Even though
various regulatory measures have already been taken by the Central Bank to
give a positive shock to economic activities, the effectiveness of such policies
in reaching the expected outcomes to stimulate productive sectors of the
economy remain questionable.
Further, far-reaching consequences are expected on Sri Lanka’s stock
market. The COVID-19 pandemic has kept investors in suspense since
February, placing markets in high levels of volatility, and flight into “safer
haven assets”. Similar to other economies, uncertainty over economic
slowdown in Sri Lanka, led to a sell-off in the financial market and capital
outflows. Market analysts expect this situation to continue until the market
settles down as both local and foreign investors are looking at exiting from
risky assets due to the global pandemic. The foreign investors must have
taken into consideration the fact that Sri Lanka has been downgraded by
international credit rating agencies as well. Despite the foreign selling
pressure, the CSE turned up and showed a little improvement after 12th May.
This implies that investor sentiments are becoming positive gradually.
The export sector prospects remain gloomy in the short and medium term
which is intensified through lack of diversification on export basket of the
country. The leading export item, the textiles and garments recorded USD
5.6 billion of export earnings in 2019. The estimated losses of the industry
for the 2 months’ period from 15th March to 15th May round up to USD
1,400 million. The most alarming signal is that 45 per cent of the Sri Lankan
export market depends on the USA, which is the most COVID-19 affected
country in the world, followed by UK (14 per cent), Italy (8 per cent),
Germany (6 per cent), the second most severely COVID-19-hit countries.
Demand contractions could result in a reduction of apparel exports by an
additional 30 – 40 per cent after June, due to mass cancellations of orders by
buyers and problems in the purchasing of necessary raw materials. These
circumstances, coupled with delayed shipments, forced discounts, and
currency depreciation, have led to working capital problems across the
industry. On the other hand, some export products indicate promising sings
such as exports of personal safety equipment’s and exports of heavy duty
tyres. However, sustaining such gains in the long run is crucial.

Sri Lanka Economic Research Conference 2020
34
The productive activities related to production and employment of most of
Micro, Small and Medium-Scale Enterprises (MSMEs) are also significantly
hit by the COVID-19 pandemic. Approximately 80 per cent of enterprises
were exposed to suffer a production and employment drop. More than 80 per
cent of the MSMEs declined their sales due to delayed or cancellation of
orders by domestic and foreign buyers. The most severely affected
enterprises were the "accommodation and foodservice sector” which is a
major part of the tourism industry. Approximately 10 per cent of MSMEs in
the apparel and textiles industry in Sri Lanka have shifted their production
towards protective clothing such as face masks under the pandemic
environment. Nearly 15 per cent of MSMEs have benefited under the current
crisis. Retail and wholesale trade, Ayuravedic medicine activities, and
computer sales have been continuing their business without a significant drop
in sales.
The construction sector was one of the key contributors to the national
economy in the recent past. However, even before the pandemic started the
construction sector was already suffering from delayed payments for
government financed projects and lower demand for certain segments such
as high-end condominium developments. On this backdrop the construction
sector would face constraints in meeting contractual agreements on
completion dates and costs, while the labour and related issues would also
affect the performance of the construction sector in the short run due to health
standards. Raw material-related issues are also expected with the imposition
of import controls.
Conclusion and Policy implications
The impact of the COVID-19 pandemic and the economic disruptions that
followed were felt on almost every household in the country however, it was
intensified among the daily wage-earning households. Despite most of them
are employed in the informal sector of the economy policy interventions of
the government need to contain instruments to deal with the short-term cash
transfers to medium and long-term actions to protect their livelihood
activities. Although the government has implemented a cash relief package
for such groups it is necessary to ensure the benefit reach the people in need
and continuation of the programme until they are able to return to their
economic activities.

Special Session on COVID Research
35
In terms of overall economy, the sectors that are depending on global
economy have little hope in returning to normalcy even if the conditions in
the country improve. The prospects remain gloomy for the exports sector as
many leading export markets have been severely affected. However, the
adverse implications of the pandemic can be mitigated with demand
simulation policies as short-term remedial measures. In this direction,
utilization of both expansionary fiscal and monetary policy proposes options
to increase the aggregate demand. However, with the current fiscal sentiment
of the country adaptation of the expansionary fiscal policy for long period of
time would result in further fiscal distress. On the other hand, the long-term
economic gains would be highly sensitive to supply side policies where
incentive driven production promotion and safeguard measure needed
specially for MSMEs where economic distress has generated long lasting
negative implications.
References
Asian Development Bank (2014). Asia SME finance monitor 2013. Philippines:
Asian Development Bank.
Bernard, H.R. (2011). Research Methods in Anthropology. 5th Ed. Ney York, Alta
Mira Press
Bryman, A., & Bell, E. (2007). Business Research Methods. 2nd Ed. New York:
Oxford University Press.
Central Bank of Sri Lanka (2019). Annual Report. Colombo: Sri Lanka
CLEAR, (2006). Country-Level Effectiveness and Accountability Review.
Colombo, Sri Lanka.
COVID-19: Live Situational Analysis Dashboard of Sri Lanka,
https://hpb.health.gov.lk/covid19-dashboard/ Accessed on 5th June 2020.
Department of Census and Statistics (2015). Non-Agricultural Economic Activities
in Sri Lanka Economic, Census 2013/2014, Colombo: Department of Census
and Statistics.
Department of Census and Statistics (2020, May 25). Quarterly report of the Sri
Lanka labour force survey.
http://www.statistics.gov.lk/page.asp?page=Labour%20Force . Accessed on
5th June 2020.

Sri Lanka Economic Research Conference 2020
36
Department of Census and Statistics (2020, May 26). Survey of Construction
Industries. http://www.statistics.gov.lk/industry/SCI_Final_Report_2017-
2018.pdf. Accessed on 6th June 2020.
Department of Census and Statistics, (2019). Sri Lanka Labour Force survey annual.
Colombo: Department of Census and Statistics.
Department of Sri Lanka Inland Revenue (2020, June 1). Tax Calendar.
http://www.ird.gov.lk/en/publications/SitePages/Tax%20Calendar.aspx?men
uid=1405#discount. Accessed on 15th June 2020.
Fitchratings.com (2020, June 14). Rating Action Commentary. [Online] Available
at: https://www.fitchratings.com/research/banks/fitch-revises-ratings-on-11-
sri-lankan-financial-institutions-on-national-scale-recalibration-10-06-2020.
Goddard, W. & Melville, S. (2004). Research Methodology: An Introduction, 2nd
Ed., New York: Blackwell Publishing.
Gunadasa, S (2020). Mired in debt, Sri Lankan government vows to avoid default,
World Socialist Web.
https://www.wsws.org/en/articles/2020/05/06/slecm06.html Accessed on
19th July 2020
Gunawardana, D. P., (2020). The Impact of COVID19 on the MSME Sector in Sri
Lanka. UN DESA/DSDG, May, 2020.
Inland Revenue Department of Sri Lanka (2018). Performance Report. Inland
Revenue Department of Sri Lanka, pp.33-50.
IPS. Institute of Policy Studies, (2018). Sri Lanka: State of the Economy 2018,
Colombo.
KMPG (2020, April, 8). Impact on COVID-19 on the Sri Lankan Economy.
https://home.kpmg/lk/en/home/insights/2020/04/impact-on-COVID-19-on-
the-sri-lankan-economy.html.
Ministry of Industry and Commerce (2015). National Policy Framework for Small
& Medium Enterprise (SME) Development. Colombo.
Ministry of Industry and Commerce (2016). National Policy Framework for Small
& Medium Enterprise (SME) Development ACTION PLAN, Colombo.

Special Session on COVID Research
37
Resnick, D. B. (2015). What is Ethics in Research and Why is it Important? List
adapted from Shamoo A and Resnik D. 2015. Responsible Conduct of
Research, 3rd Ed., New York: Oxford University Press.
Saunders, M., Lewis, P., & Thornhill, A. (2009). Research Methods for Business
Students. Harlow: Pearson Education Limited.
The Government of Sri Lanka and the Millennium Challenge Corporation, 2017. Sri
Lanka Constraints Analysis Report, Harvard University’s Center for
International Development, for the Development of a Millennium Challenge
Compact, United States of America, https://assets.mcc.gov/content
United Nations, 2019. COMTRADE database on international trade.
UNWTO, (2020, May 31). COVID-19 vulnerable groups.
https://www.unwto.org/COVID-19-inclusive-response-vulnerable-groups.
UNWTO, (2020, May 31). First global das board for tourism insights.
https://www.unwto.org/unwto-tourism-dashboard.
UNWTO, (2020, May 31). News updates. https://www.unwto.org/news/COVID-19-
international-tourist-numbers-could-fall-60-80-in-2020.
World Bank (2007). Sri Lanka Development Forum: The Economy, Regional
Disparities, and Global Opportunities, Poverty Reduction and Economic
Management Sector Unit, South Asia Region.
World Bank (2020). https://blogs.worldbank.org/opendata/new-world-bankcountry-
classifications-income-level-2020-
2021#:~:text=The%20World%20Bank%20assigns%20the,i.e.%202019%20i
n%20this%20c

Sri Lanka Economic Research Conference 2020
38

39
Decent Livelihood and Well-being

40

Decent Livelihood and Well-being
41
CHALLENGES & PROSPECTS FOR ECONOMIC
EMPOWERMENT OF PERSONS WITH VISUAL
IMPAIRMENT & BLINDNESS ENGAGED IN SELF-
EMPLOYED VENTURES
Dunuwila*, V.R., Suraweera, T., Jayathilaka, R., Thelijjagoda, S. SLIIT Business School, Sri Lanka Institute of Information Technology, Malabe,
Sri Lanka *Corresponding author: [email protected]
Introduction
People with disabilities experience numerous barriers with regard to securing
employment, thus, they are more likely to work for low wages, informally and
precariously. Besides, some of them are entitled for a disability benefit which is
often inadequate to cover their daily expenses (Global Disability Summit, 2018).
Economic empowerment can be defined as a way of ensuring income security for
people with disabilities to achieve income security, advance economically, enrich
themselves through empowerment and autonomy to make economic decisions
within and outside the home (Global Disability Summit, 2018). Self-employment
is perceived as a viable option for empowering disabled individuals that
facilitates achieving a balance between disability status and work life (Kitching,
2014; Pagán, 2009; Adams, et al., 2019). Pagán (2009) indicated the presence of
a strong relationship between disability status and self-employment; thus, self-
employment rates were higher among people with disabilities compared to those
who report no limitation in daily activities (Kitching, 2014; Pagán, 2009; Adams,
et al., 2019).
The Global Disability Summit (2018) indicates that obstacles to economic
empowerment experienced by people with disabilities can vary depending on the
nature of an individual’s impairment, their gender, socioeconomic status and the
context in which they live. Adams, et al., (2019) further indicate that the decision
to enter into self-employment for most disabled individuals were influenced by
the ‘push’ factors such as lack of alternative employment opportunities, rather
than the ‘pull’ factors such as passion or interest in a particular field, or the desire
to work for themselves (Kitching, 2014; Adams, et al., 2019).

Sri Lanka Economic Research Conference 2020
42
Past research reveals that the disabled self-employed face significant problems in
sustaining the business due to reasons such as consumer discrimination,
inadequate training, poor access to information, absence of appropriate business
support and challenges in accessing finance (Adams, et al., 2019; Kitching, 2014;
Pagán, 2009; Vaziri, Schreiber, Wieching, & Wulf, 2014).
Research Problem
People with visual impairment and blindness (VI&B) represent the majority of
the differently abled population in most communities (WHO, 2011), including
Sri Lanka where 996,939 persons with VI&B have been reported (Department of
Census and Statistics, 2012). In order to be sustained, people with VI&B must be
economically independent as the mainstream. The research problem emanates
from the fact that although self-employment is a viable option for the differently
abled, no systematic investigation has been carried out to determine the
challenges experienced by persons with VI&B, nor previous evidence of self-
employed people with disabilities are available in the Sri Lankan context. Thus,
this study contributes to this empirical gap of understanding self-employment and
its challenges, experienced by persons with VI&B in Sri Lanka.
Objective
The objective of this study is to explore the extent to which persons with VI&B
are engaged in self-employment ventures and to determine the key challenges
they run into.
Methodology
A mixed methodology consisting of qualitative and quantitative approaches were
adopted where the study population comprised of 61 persons with VI&B which
nearly accounted to the total VI&B population of the Hambantota District. This
was accomplished with the involvement of the authors at the ‘White Cane Day’
function of the Hambanthota district held on 12th December 2019. Thus, the
sampling methods of selection of ‘subjects’ could be described as a mix of
volunteer and convenient sampling. The sample consisted of 24 (28-66 years old)
self-employed individuals with VI&B with a generally lower educational
background engaging in self-employment as they had no other alternative. In-
depth face-to-face interviews were conducted with the sample based on a pre-
determined interview protocol which focused on factors related to general well-
being, education and employment. Each interview lasted for 20-30 minutes and
the proceedings were recorded and transcribed. Using pattern matching and
thematic analysis techniques, the data were analyzed to elucidate the key

Decent Livelihood and Well-being
43
challenges of self-employment for persons with VI&B. Descriptive statistics
were also used to analyze the demographics of the total VI&B population of the
Hambanthota district.
Results and Discussion
Descriptive Statistics:
Results claim that a majority of 43.6% of the total VI&B population of
Hambanthota were totally blind. Further, 35.9% were only able to see light while
the rest were only able to see shadows. Genetic issues and neurological disorders
have been the main cause for VI&B for the majority amounting to 52.3% of the
sample, while others experienced the condition due to accidents and
consequences of health conditions such as diabetes, thalassemia and glaucoma.
Twenty nine out of these 61 persons were born blind while others became blind
later in life. A majority of 47.5% were married and lived with their spouse while
40% were unmarried and 12.5% lived away from spouse. In considering the
educational background, 39% were early school drop-outs and 34% managed to
pass GCE (O/L); 12% have reached GCE (A/L) level while there were only six
graduates. It was significant that the school drop-outs were mainly due to poverty
and the fact that the majority (54.3%) had to attend regular schools with no
special facilities for VI&B. Approximately 61.5% of the total VI&B population
of Hambanthota were Samurdhi recipients while 12 others received a disability
benefit of Rs. 5,000 monthly. Four persons were reported as recipients of both
the Samurdhi and disability assistance.
Source: Authors’ estimation
Figure 1: Distribution of employement among persons with VI&B
19
4
15
9
5
9
02468101214161820
Unemployed Employed in the services
sector
Self-employed
No
. o
f P
erso
ns
Male Female

Sri Lanka Economic Research Conference 2020
44
Figure 1 above illustrates the distribution of employment among persons with
VI&B in Hambanthota. The employed VI&B consisted of school teachers and
government servants while the self-employed consisted of painters, cultivators,
shopkeepers, ayurveda therapists, choir weavers and those who produce incense
sticks, bricks, eakle brooms.
Economic and Social Challenges:
In considering the educational background, 39% were early school drop-outs and
34% managed to pass GCE (O/L); 12% have reached GCE (A/L) level while
there were only six graduates. It was significant that the school drop-outs were
mainly due to poverty and the fact that the majority (54.3%) had to attend regular
schools with no special facilities for VI&B. Approximately 61.5% of the total
VI&B population of Hambanthota were Samurdhi recipients while 12 others
received a disability benefit of Rs. 5,000 monthly. Four persons were reported as
recipients of both the Samurdhi and disability assistance.
Figure 1 illustrates the distribution of employment among persons with VI&B in
Hambanthota. The employed VI&B consisted of school teachers and government
servants while the self-employed consisted of painters, cultivators, shopkeepers,
ayurveda therapists, choir weavers and those who produce incense sticks, bricks,
eakle brooms.
The analysis of in-depth interviews revealed five challenges of self-employment
experienced by persons with VI&B.
• Difficulty in obtaining raw materials – Most of the self-employed persons
with VI&B had to travel long distances to obtain raw materials such as choir
and fertilizer which made them to use public transport, with its inherent
difficulties.
• Lack of financial support – In certain instances, persons with VI&B had to
cease self-employment ventures or stop business temporarily due to
unavailability of financial resources to continue, particularly, working
capital. This is attributed to lack or inability to access information and
absence of special schemes for providing such financial support.
• Inadequate infrastructure – Although most of the respondents within the
sample had the required skills, resources and facilities were inadequate,
which limited their opportunity for expansion.

Decent Livelihood and Well-being
45
• Consumer discrimination – Most of the consumers were often reluctant to
purchase products manufactured by persons with VI&B assuming they were
unhygienic or not of good quality. Thus, in many situations, they were
compelled to market their products by other costly means.
• Inadequate training - Only 29.4% of the self-employed persons have
received training at rehabilitation centers which included candle making,
weaving choir ropes/rugs/chairs and ayurveda massage therapy. They had to
undergo training on various disciplines which end with a range of skills
without mastering a single.
Thus, it is evident that there is a considerable need for additional support for
VI&B involved with self-employment. Initiatives aimed at providing financial
and non-financial support such as access to concessionary grants and loans
providing working capital, technical advice, access to markets, mentoring and
training on small businesses would improve their economic independence.
Effective job training initiatives could be introduced to overall unemployed/self-
employed persons with VI&B aimed at improving quality, encouraging jobs that
match their potential and preferences. Thus, availability of effective social
protection systems could promote income security of the self-employed VI&B
through removal of barriers.
Conclusion
This study highlights five challenges of self-employment experienced by persons
with VI&B which includes difficulty in obtaining raw materials, lack of financial
support, inadequate infrastructure, consumer discrimination and inadequate
training. In addition, the study also presented demographic statistics of the VI&B
population of the Hambanthota district. Limitations of the study include
considering only one district for data collection, thus, as future research, the
authors aim to test the findings against a large population. Findings of the study
revealed, initiatives aimed at providing financial and non-financial support,
effective training and deployment of a disabled-friendly business model would
facilitate economic empowerment of self-employed persons with VI&B.
Empowering persons with VI&B would enhance their financial independence,
thus, enabling them to contribute to the country’s economy at large.
Acknowledgements
Authors acknowledge contribution of the World Bank assisted AHEAD
(Accelerating Higher Education Expansion and Development) Research project

Sri Lanka Economic Research Conference 2020
46
on ‘Quality of Life and Employability potential of Persons with Visual
Impairment and Blindness (VI&B) in Sri Lanka’ and the SLIIT Business School
for support extended in relation to data collection and guidance.
Keywords: Economic empowerment; self-employment; visual impairment and
blindness
References
Adams, L., Cartmell, B., Foster, R., Foxwell, M., Holker, L., Pearson, A., Kitching, J.
(2019). Understanding self-employment for people with disabilities and health
conditions. London: Department for Work & Pensions.
Department of Census and Statistics. (2012). Characteristics of the Disabled Persons
Census Of Population and Housing.
Global Disability Summit. (2018). Routes to economic empowerment. London:
International Disability Alliance.
Kitching, J. (2014). Entrepreneurship and self-employment by people with disabilities.
London: OECD Publications.
Pagán, R. (2009). Self‐employment among people with disabilities: Evidence for Europe.
Disability & Society, 217-229.
Vaziri, D., Schreiber, D., Wieching, R., & Wulf, V. (2014). Disabled entrepreneurship
and self-employment: The role of technology and policy building. London:
OECD Publication.
WHO. (2011). World report on disability.World Health Organization, Geneva ,
Switzerland.

Decent Livelihood and Well-being
47
INTERRELATIONSHIP BETWEEN DECENT WORK
IMPROVEMENT AND PENETRATION INTO GLOBAL
SUPPLY CHAIN: A Deep-dive into Literature pertaining to
Apparel Industry
Gunaruwan, T.L. and Hansamali, H.G.C*. Department of Economics, University of Colombo, Sri Lanka
*Corresponding author: [email protected]
Introduction
Emphasizing labor issues in the apparel industry has become crucial in the
present context. This is mainly due to the increasing awareness of poor working
conditions among workers and high labour dissatisfaction all over the world
(Asadullah & Talukder, 2018). Decent work conditions are key elements to
accomplish reasonable and harmonious employment relations. However, this is
not always witnessed in the Global Supply Chain (GSC) within the apparel
industry (Goto, 2011) The distinct growth during the past 25 years within the
apparel industry does not signify its many problems, including those related to
the work practices and the work environment (Gnanayudam & Dharmasiri, 2008)
and this has resulted in the industry being castigated as "slave driven". Therefore,
the social aspect of sustainability, including decent work conditions and labour
rights in the global production network within the apparel industry receive
increasing attention among academics, researchers, and professionals in the field.
As per Anker, Chernyshev, Egger, Mehran, and Ritter (2003), the word “decent”
indicates the need for workers to have “acceptable” or “adequate” work and
working conditions. International Labour Organization (ILO) has identified four
main pillars which support the objectives of decent work, including (a)
employment creation, (b) rights at work, (c) social protection, and (d) social
dialogue. In the context of Sustainable Development Goals (SDGs), inclusive
growth and decent work for all men and women constitute the social dimension
of SDG 8.
According to the Charted Institute of Procurement and Supply (www.cips.org),
GSC is a vigorous universal network when a company procures or uses goods or
services from overseas. It involves people, information, processes, and resources
in the production, handling and distribution of materials and finished products or

Sri Lanka Economic Research Conference 2020
48
providing a service to customers. Participation in GSC allows local industries to
attract investments, achieve technological capabilities, and increase economic
growth (Goto, 2011). Therefore, it is always advantageous for manufacturers in
the developing world to attempt penetrate into GSC.
The penetration into GSC could be expected to be supported by decent work
practices in the sense those could help companies enhancing their productivity,
employee satisfaction, employee retention, and the mental health of employees
(Goto, 2011). However, at the same time, such practices could imply high costs
of production resulting in lesser international competitiveness, thereby
constraining the potential of penetration into GSC. In apparel industry across the
world, this deterrent tendency would be much accentuated in so far as it produces
highly standardized products, and also are to be sold at extremely competitive
prices. This induces companies seeking entrance to GSC to resort to cost
minimizing practices; in which conjuncture, social aspects relating to working
conditions could suffer. The present research focused on this challenging tradeoff
the producers seeking entry to GSC are confronted with.
Research Problem and Objectives
Apparel industry, being the world’s largest non-resource-based economic activity
(Goto, 2011), allows developing countries an opportunity to penetrate into the
GSC. However, at the same time, there is a likelihood that attempts to achieve
decent work conditions could adversely affect price competitiveness of suppliers.
In this regard, the present study was conducted to appraise scientific literature, in
view of (a) unearthing deterrent factors of decent work promotion in the apparel
industry, and (b) identifying possible impacts of promoting decent work practices
on GSC penetration. Based on the outcomes, development of an appropriate
index to reflect the “decent work push” for GSC penetration pertaining to the
apparel industry was also pursued.
Methodology
The study was based on a comprehensive review of literature in the subject
domain. It aimed at analyzing and classifying prevailing knowledge and
understanding on decent work and associated GSC penetration issues. Thorough
literature review was thus conducted, focusing on previous research published in
recognized Journals, in view of ensuring the quality of the analysis. In this
context, the Australian Business Deans Council (ABDC) 2019 ranking was used,
which has identified indexed journals publishing research in the field of decent

Decent Livelihood and Well-being
49
work and GSC. The study was able to gather 42 research papers including reports
of the International Labour Organization (ILO), covering the 20-year period from
2000 to 2019. Selected research papers were analyzed in-depth and their findings
were grouped into three categories; namely, (a) constraints acting against
improving decent work conditions, (b) factors reflecting the importance of
promoting decent work, and (c) impacts of decent work improvements on GSC
penetration. Number of citations and their respective shares were computed to
reflect the relative importance of each of such variables.
Examination of positive and negative impacts of decent work on GSC
penetration, as reflected in literature, was subsequently used to develop an index
to represent the influence decent work has had on GSC penetration around the
world.
Results and discussion
Through review of literature, the study managed to identify 13 different
dimensions which reflect the level of decent work conditions in the global apparel
industry (Table 1). It became evident when perusing through previous studies
that, except for 4 factors, namely, verbal and physical abuse, sexual harassment,
lack of training to use equipment, and child labour, all others have been cited by
over 10 percent of researchers. Most frequently cited were excessive working
hours, underpay, unsafe conditions in the workplace, poor working conditions
and gender discrimination, which, together constituted approximately 67 per cent
of the total citations examined. Even though no single factor has been cited by
over 40 per cent of the researchers, this reveals there could be constraints to
decent work present in the apparel industry. It may be noteworthy that Asadullah
and Talukder (2019) have found that decent work conditions are poor in apparel
manufacturing companies in the developing world.
Secondly, the literature revelations on the purpose as to why decent work
environment may be desired within the apparel manufacturing companies were
examined (Table 2). Out of total citations on this aspect, 81 per cent was
represented by just four purposes, namely, (a) to reduce high labour turnover, (b)
to increase satisfaction, (c) to reduce stress and increase mental health, and (d) to
reduce injuries at the workplace. Approximately 61 per cent of researchers have
highlighted the necessity to reduce ‘injuries’ as the most prominent purpose,
possibly reflecting the gravity of this issue in the apparel industry. Risk of
accidents is high even though safety equipment is available within factory
premises (Islam & Stringer, 2018), may be because only a basic training had been

Sri Lanka Economic Research Conference 2020
50
provided for employees due to high costs involved. Notably, only a few
researchers have cited the factors of increasing productivity and government
requirements as decent work inviting objectives. It is only expected that increased
productivity may not emerge as a frequently cited purpose if the “interviewees”
in these researches were largely the employees, as that would not be their interest.
However, employers would be interested in achieving high productivity levels.
Table 1: Level of decent work
Source: Developed by authors
Au
tho
r
Ex
cess
ive
wo
rkin
g h
ou
rs w
hil
e ex
plo
itin
g
labour
Un
der
pay
(lo
wer
ho
url
y p
ay)
unsa
fe c
ondit
ions
in w
ork
pla
ce
Res
tric
tio
ns
for
unio
niz
atio
n
Lac
k o
f w
ork
ers'
rig
hts
Poor
work
ing c
ondit
ions
Lac
k o
f le
gal
and s
oci
al p
rote
ctio
n
Gen
der
dis
crim
inat
ion (
Wag
e gap
s,
posi
tions,
do n
ot
pro
vid
e m
ater
nit
y l
eaves
)
Ver
bal
and p
hysi
cal
abuse
Sex
ual
har
assm
ent
Lac
k o
f tr
ainin
g t
o u
se e
quip
men
t
Hea
lth r
elat
ed i
ssues
Chil
d l
abour
Anker, Chernyshev, Egger, Mehran, and Ritter (2003) x
Ghai (2003) x x x
ILO (2019) x x x
Nova and Wegemer (2016) x x
Anner (2019) x x x
Gereffi and Memedovuc (2003) x
BGMEA (2018) x x
Elbert et al (2016) x x
Islam and Stringer (2018) x x x x x x x x x x x
Cowgill and Huynh (2016) x
Barrientos (2007) x x
Hancock, Carastathis, Georgiou and Oliveira (2015)
Madurawela (2017) x x x
Seashore (1974)
Burchell et al (2013) x
Goto (2011) x x x
Paul-Majumdar and Begum (2000) x
Kurpad (2014) x x x x x x x
Delautre (2019) x x x
Milberg and Amengual (2008) x
ILO (2017) x
Asadullah and Talukder (2019) x x x x
Feldman (2009) x
Huynh (2016) x
Taslim and Haque (2011) x
Chowdhury et al (2012) x x
Hossain and Akter (2010) x x x
Muhammed (2011) x x x
ILO (2012) x x
Robinson and Falconer (2013) x x
Nurhayati, Taylor, Rusmin, Tower and Chatterjee (2016) x x x
Yperen (2006) x
Nordås (2004) x x x
Gnanayudam and Dharmasiri (2008) x
Ian Taplin, Winterton and Winterton (2003) x
Pagell et al (2005) x
Starmanns (2017) x

Decent Livelihood and Well-being
51
Yet, they may be pursuing that objective by inducing (or even forcing) their
employees to work harder or excessive hours, which could go against decent
work objectives, and even could amount to exploitation (in Marxian
terminology). Thus, it is evident that the possible “productivity push” effect of
decent work, has not yet successfully caught attention of “employers”, and decent
work still is largely an “employee concern”. When addressing the interrelation of
decent work improvements and GSC penetration in the apparel industry, this
study came across six factors referred to in literature which either positively or
negatively impact on penetrating into the GSC (Table 3).
Table 2: Importance of improving decent work
Source: Developed by authors
Aut
hor
To
redu
ce la
bour
turn
over
To
incr
ease
pro
duct
ivity
To
com
ply
with
inte
rnat
iona
l
requ
irem
ents
To
ente
r G
SC
To
mee
t gov
ernm
ent r
equi
rem
ents
To
incr
ease
job
satia
fact
ion
To
redu
ce s
tres
s an
d in
crea
se m
enta
l
heal
th
To
redu
ce in
juri
es a
t wor
kpla
ce
Elbert et al (2016) x x x x
Burchell et al (2013) x x
Delautre (2019) x x
Islam and Stringer (2018) x x x
Seashore (1974) x
Milberg and Amengual (2008) x
Madurawela (2017) x
Kurpad (2014) x
Ghai (2003) x
Anner (2019) x
BGMEA (2018) x
Asadullah and Talukder (2019) x x
Akhter et al. (2017) x
Chowdhury et al. (2012) x
Ghai (2003) x
Anner (2019) x
BGMEA (2018) x
Madurawela (2017) x
Kurpad (2014) x
Asadullah and Talukder (2019) x
Muhammed (2011) x
ILO (2012) x
Nurhayati, Taylor, Rusmin, Tower and Chatterjee (2016) x
Nordås (2004) x
Gnanayudam and Dharmasiri (2008) x x
Phusavat (2001) x
Warr (2006) x
Ian Taplin, Winterton and Winterton (2003) x

Sri Lanka Economic Research Conference 2020
52
Out of 29 such citations found in literature, only 21 per cent have reported
positive effects on GSC penetration by enhancing decent work conditions. The
remaining 79 per cent have revealed that promoting decent work could bear
negative impact on GSC penetration. Most of them have emphasized that
improvements in decent work result in higher cost of production and such would
create adverse effects on competitiveness in seeking entry to the GSC while
shrinking their market share. Out of all citations, only 4 per cent have revealed
possibility of securing price advantage and an increased competitiveness
facilitating entry into GSC that could be secured through improving decent work
conditions.
Finally, the study went into developing an “index” to reflect the degree of
facilitation of access to GSC through improvements in decent work conditions,
based on the above findings of analysis of previous studies referred to so far. It
was constructed by presuming equal weightage to each “factor”, while assigning
+1 for “conducive effects”, and -1 for “deterrent effects”.
Table 3: Relationship between decent work improvements and GSC
penetration
Source: Developed by authors
Aut
hor
Incr
ease
cou
ntry
imag
e
Incr
ease
pro
duct
ivity
Pric
e ad
vant
age
and
incr
ease
com
petit
iven
ess
Incf
ease
cos
t of
prod
uctio
n
Dec
reas
e co
mpe
titiv
enes
s
Red
uce
glob
al m
arke
tsha
re
Anner (2019) x x
Blasi and Bair (2019) x x
ILO (2019) x x x
Elbert et al (2016) x
Nadvi and Thoburn (2004) x
Jin and Moon (2006) x x
Kurpad (2014) x x
Delautre (2019) x x x
Milberg and Winkler (2011) x
Gereffi, Bamber, and Fernandez-Stark (2016) x x x
Egels-Zanden (2014) x
Elbert et al (2016) x x
Islam and Stringer (2018) x
Kurpad (2014) x x
Muhammed (2011) x
Anner (2019) x
Merk (2009) x

Decent Livelihood and Well-being
53
The overall “index” was computed by taking the sum of weighted averages of
positive and negative findings, expressing the index as a ratio ranging between -
1 and +1. The index so constructed to reflect “decent work push for GSC
penetration” pertaining to the apparel industry, as revealed through literature,
worked out to be approximately -0.58.
This brings suggestive evidence to indicate that improvements of decent work
conditions in apparel manufacturing companies could induce a retarding net
effect on their capacity to penetrate into GSC. Therefore, though the apparel
industry is a source of employment in which there is opportunity to improve well-
being of factory workers, the overall tendency could be towards employers
compromising labour standards in the pursuit of GSC entry or sustaining and/or
further advancing their position in the GSC. In other words, the business interest
of GSC penetration is likely to over-ride any desire to improve the quality of
working environment. It also leads to infer that pursuance of decent work has not
been conducive towards adequately inducing productivity at work. Had it been,
the resultant industrial cost-effectiveness could have enhanced market
competitiveness, naturally incentivizing employers to pursue decent work,
enabling successful surmounting of this apparent tradeoff.
Conclusion
The apparel industry is one of the biggest work heavens for employees in
developing countries. But, as revealed through literature, employment in apparel
manufacturing companies is highly exploitative because of excessive working
hours and inadequate pay. Furthermore, it is reported that unsafe and poor
working conditions and gender discrimination also figure among the most
prominent constraints in improving decent work conditions. Thus, these factors
are worth addressing with priority; as alleviating such causes have the potential
of bringing in the greatest possible improvement in decent work conditions.
Literature also indicate that an enhancement of decent work practices would
enable employee satisfaction, their mental health, and could mitigate high labour
turnover and reduce injuries at workplaces.
This research also enabled perceiving that there could be an inverse relationship
between decent work improvement effort and penetrating into GSC, mainly
because the GSC is highly competitive and any attempt to improve work
conditions, in most circumstances, would tend to increase costs of production,
thereby constituting a constraint vis-à-vis price competitiveness. If decent work
strategies that induce a greater degree of productivity supporting industrial cost

Sri Lanka Economic Research Conference 2020
54
effectiveness could be invented only that the apparel industry would be able to
successfully overcome this apparent tradeoff. If not, companies are likely to
compromise labour standards and decent work conditions to survive in the GSC.
Key words: Apparel industry; Decent work; Productivity; Competitiveness; GSC
penetration
References
Anker, R., Chernyshev, I., Egger, P., Mehran, F. & Ritter, J. (2003). Measuring decent
work with statistical indicator: Statistical and Analysis Group Working Paper No.
2, Policy Integration Department. Geneva: ILO.
Asadullah, M. N., & Talukder, F. (2019). The paradox of the contended female worker.
International journal of manpower, 40(4), 800-814.
Charted Institute of Procurement and Supply (2020). Supply Chain Management
Retrieved from https://www.cips.org/knowledge/procurement-topics-and-
skills/supply-chain-management/
Goto, K. (2011). Competitiveness and decent work in Global value Chains:
substitutionary or complementary? Development in Practice, 21(7), 943-958.
Gnanayudam, J., & Dharmasiri, A. (2008). The Influence of Quality of Work-life on
Organizational Commitment: A Study of the Apparel Industry, Sri Lankan Journal
of Management, 13(1 & 2), 117-140.

Decent Livelihood and Well-being
55
IN A QUEST FOR ‘WHAT THEY VALUE THE MOST’:
PERSONS WITH VISUAL IMPAIRMENT AND BLINDNESS
IN A CLUSTERED COMMUNITY IN SRI LANKA
Attale D.S.C.*, Sudusinghe D.R., Abeyrathna H.A.P.I., De Seram S.S.H.,
Jayathilaka R., Suraweera T., Thelijjagoda S. Department of Business Management, SLIIT Business School,
Sri Lanka Institute of Information Technology,
Malabe, Sri Lanka *Corresponding author: [email protected]
Introduction
The community engagement and the resource requirements of a community
would vary on the nature of the community. If one would broadly recognize
persons with visual impairment and blindness (VI&B) as community per se, it is
expected that their needs, resource requirements and the activities they engaged-
in would differ from the rest of the population in general. This research aims to
explore the nature of resource requirements and the activities commonly
engaged-in by a ‘community’ of persons with VI&B, in a ‘clustered village’ in
Southern Sri Lanka.
Though sociologists interpret the term community in various ways, this study
adopts the definition of Sylvia Dale, (1990); “Community is a body of people
living in the same locality…Alternatively, a sense of identity and belonging
shared among people living in the same locality, Also, the set of social relations
found in a particular bounded area” (Dale, 1990, p. 562). Accordingly, the
‘Siyanethugama’ 55th model village was developed by the National Housing
Authority in 2018, where 27 families having at least one person in each with
VI&B, would very well be embraced as a “community”. Each family is allocated
a 10 perch land with a basic one-bedroom house.
Visual impairment or vision impairment, is the degree of reduced vision level
from low vision to total blindness that impedes a person’s ability to function at
certain or many tasks. As at 2018, among the Sri Lankan population of 21 million
(worldometer, 2020), considerably 1.7% of individuals carry a visual impairment
(Devapriya, 2020).
A study is yet be performed in the Sri Lankan context based on the theme
“Resources and activities that VI&B people value the most in their lives”. The

Sri Lanka Economic Research Conference 2020
56
preference of an individual’s resources and activities may vary according to their
demographic characteristics.
This empirical study focuses on deriving what types of resources and activities
the VI&B people ascertain the most in their lives, and how the demographic
characteristics affect their lives based on their visual impairment type. This study
contributes to draw attention from the government towards the VI&B people and
types of actions the government can take, to improve the lifestyle of VI&B people
in Sri Lanka.
Research Problem
Thus, to date no broad investigations conducted in a Sri Lankan context on the
types of resources and the activities that VI&B people value the most, as well as
the impact of demographic characteristics on their lives. Hence, this research
signifies the findings to this empirical gap.
Objective
The main purpose of this research is to ascertain the types of resources and
activities that VI&B people value the most in their lives and how demographic
characteristics affect their lives.
Methodology
A two-day data collection camp was conducted at “Siyanethugama” model
village in the Hambantota District during 09-11 December 2019. Purposive
sample technique was used for selecting the sample. One to one interviews were
held with the persons with VI&B and the family members totaling 41
respondents, lasted for 30 - 40 minutes. The discussions focused on resource and
diverse activity areas like demography, education, resource requirements,
education, health facilities and transportation. Main resources were segregated
into six: the government funds, vocational trainings, infrastructure facilities,
types of news media, private and public transportation; Similarly, activities into
five: outdoor activities, shopping for goods, preparing meals, doing homework
and taking care of themselves. Measures of variance calculated and graphically
represented.
Results and Discussion
Table 1 shows demographic characteristics of VI&B people.

Decent Livelihood and Well-being
57
Table 1: Demographic characteristics of VI&B people
Frequency (%)
Blind Visually Impaired
n =19 (46.34%) n=22 (53.66%)
Gender
Male 10 (52.63%) 16 (72.73%)
Female 9 (47.37%) 6 (27.27%)
Age
20-39 1 (05.26%) 6 (27.27%)
40-59 17 (89.47%) 12 (54.55%)
60-80 1 (05.26%) 4 (18.18%)
Marital Status
Married 10 (52.63%) 14 (63.64%)
Bachelor 9 (47.37%) 8 (36.36%)
Education Level
No schooling 2 (10.53%) 1 (04.55%)
Grade 1 - 8 3 (15.79%) 3 (13.64%)
Passed Grade 8 4 (21.05%) 6 (27.27%)
Passed GCE O/L 4 (21.05%) 7 (31.82%)
Passed GCE A/L 3 (15.79%) 2 (09.09%)
Graduate 3 (15.79%) 3 (13.64%)
Source: Authors' calculation based on the primary data.
Among the 41 interviewed, 19 blind and 22 visually impaired represent 46.34%
and 53.66% respectively, of the total sample population. Male population is 26
of the total sample, where 10 are blind, representing 52.63% of the total blind
population. The remaining 16 visually impaired make up 72.73% of the total
visually impaired population. Female popualtion is 15 of the total sample, where
9 being blind represent 47.37% of the total blind population. The other 6 are
visually impaired, representing 27.27% of the total visually impaired population
(Table 1).

Sri Lanka Economic Research Conference 2020
58
Most of the VI&B people tend to be older, where majority were between the ages
of 40 to 59 years. Accordingly, 17 blind people consist 89.47% of the total blind
population. Twelve people from the visually impaired sample between age group
of 40-59 carry 54.55% of the visually impaired population (Table 1).
Most of the visually impaired are married, with 14 in the sample population, thus,
representing 63.64% of the visually impaired population. Most of those blind are
bachelors, with 9 in the sample population, forming 47.37% of the blind
population (Table 1).
Most of the blind people were educated. Consisting 21.05% each of the blind
population were GCE O/L qualified and those passed Grade 8 (4). Among the
visually impaired, 31.82% were GCE O/L qualified (Table 1).
A majority of interviewees were males (26) and the rest being females (15) with
63% and 37%, respectively. Additionally, 24 were married and 16 were single.
Seventeen are totally blind and 20 with a visual impairment. Respondents were
in the age category of 33-66 years. Despite their visual impairment, some blind
people have their own source of income, some are painters, carpenters and
making bricks. Also, 78% of the people were not using spectacles while 22%
were using spectacles.
Source: Authors’ illustration based on the primary data.
Figure 1: Results of activities that VI&B people engage in the most
47%
42%
32%
47%
58%
64%
55%
41%
59%
82%
Outdoor Activities
Shopping for Goods
Prepairing Meals
Doing House Work
Taking Care of Themselves
% of Visually Impaired & Blind People
Act
ivit
y T
yp
e
Visually Impaired % Blind %

Decent Livelihood and Well-being
59
The least number of visually impaired (9) preparing meals consist 41% of
respondents. The highest number of blind (11) taking care of themselves is 58%,
while the least number (6 people) prepare meals by themselves.
Here, 82% of visually impaired (18) and 58% of blind (11) taking care of
themselves means that they can manage their own daily tasks including washing,
cutting nails & hair, toileting, dressing & undressing, eating & drinking etc. In
addition, 59% of visually impaired (13) and 47% of blind (9) managing
household tasks - cleaning and washing (dishes and laundry) depict the ability
and effort to perform their tasks themselves. Additionally, 55% of visually
impaired (12) and 42% of blind (8) can do shopping to buy goods. About 64% of
visually impaired (14) and 47% of blind (9) are engaged in sports, handicrafts,
entertaining activities, religious activities, cultivation etc., are identified as the
main activities that they engage with.
Source: Authors’ illustration based on the primary data.
Figure 2: Results of resource types that VI&B people value the most
Six major resource types that VI&B people value the most (under Methodology)
indicate the highest number of people (19 visually impaired and 17 blind people)
use public transportation, where 86% visually impaired and 89% blind. Figure 2
signifies the least number of visually impaired people (3) enriched with
vocational trainings as 14%, while the blind population shows the least in using
private transportation (4) as 21%. Furthermore, 36% (8 visually impaired people)
travel by their private transportation methods, and 68% (15 visually impaired and
89%
21%
68%
74%
26%
47%
86%
36%
68%
64%
14%
55%
Public Transportation
Private Transportation
Use of News Media
Infrastructure Facilities
Vocational Trainings
Government Funds
% of Visually Impaired & Blind People
Res
ou
rce T
yp
e
Visually Impaired % Blind %

Sri Lanka Economic Research Conference 2020
60
13 blind people) use media sources like television, radio and mobile phones etc.,
to access daily information; 64% of visually impaired and 74% of blind (14
people in each category) have proper infrastructure facilities with a mode of
satisfaction; 26% (5 blind) enhanced their ability by undergoing vocational
trainings; 55% visually impaired and 47% blind (12 visually impaired and 9
blind) receive government grants like “Samurdhi” & “Jeewanadhara”.
Conclusion
A high number of visually impaired people take care of themselves, while the
least number prepare meals themselves (activities). The majority of people (19
visually impaired and 17 blind) use public transportation (resources). The
majority of VI&B people between 40 to 59 years age categories tend to be older.
Of the total sample population, 89.47% blind peoples are between 40 to 59 ages
(17). In addition, this represents 54.55% visually impaired and it includes 12
people. This research assists the government and the society to implement
facilities for inclusion of VI&B people into the society.
Keywords: Demographic Characteristics; Resources & Activities; Visually
Impaired & Blind People (VI&B people)
Acknowledgement
Authors acknowledge the SLIIT Business School for guidance provided,
including the AHEAD research project targeting the VI&B people. Gratitude
extends towards the citizens of “Siyanethugama” village for data provided.
References
Dale, S. (1990). Controversies in Sociology. A Canadian Introduction. Toronto: Copp,
Clark and Pitman.
Devapriya, U. (2020, 1 Januay 2019). Schooling the visually impaired in Sri lanka. Daily
MIrror (online). Retrieved from http://www.dailymirror.lk/article/Schooling-the-
visually-impaired-in-Sri-lanka-160491.html
worldometer. (2020). Sri Lanka Population (LIVE). Retrieved from
https://www.worldometers.info/world-population/sri-lanka-population/

Decent Livelihood and Well-being
61
IMPACT OF INCOME DIVERSIFICATION ON
HOUSEHOLD WELFARE IN SRI LANKA
Senevirathne, M.M.S.C.1*, Dharmadasa, R.A.P.I.S.1 and Senaratne A.2 1Department of Export Agriculture, Uva Wellassa University Sri Lanka
2Institute of Policy Studies Sri Lanka *Corresponding author: [email protected]
Introduction
Income risk is a central feature of households in developing countries. How well
households can mitigate these adverse effects on their welfare is the major topic
in development economics (Alderman and Paxson, 1992). Income diversification
is referred to as a process whereby households adopt multiple income sources
(Nghiem, 2010). According to Minot (2006), rural households adopt multiple
income-generating activities to manage risk, to satisfy household consumption
needs, to take advantage of positive externalities among activities, and to respond
to diseconomies of scale.
Sri Lanka is an upper- middle income developing country with around 80% of
people live in rural areas. Income sources in Sri Lankan households have unique
characteristics due to differences in topography, agro-climatic conditions, and
socio-economic features. Sri Lankan economy also is at a transitional stage where
a predominantly rural-based economy changes towards a more urbanized
economy oriented around manufacturing and services. According to Dissanayaka
and Weeratunga (2017), employment in the service sector will continue to grow
during the next 14 years period while the trend for the industrial sector would
grow at a slower pace. The employed population in the agriculture sector will
continue to decline.
Problem statement
Globally higher attention is given to the income diversification strategies. Few
studies were conducted regarding income diversification in Sri Lanka
(Dharmadasa and Polkotuwa, 2016; Jayamanna et al., 2015, Hewavitharana and
Dharmadasa, 2016). Previous studies mainly focused on identifying the patterns
and the determinants of income diversification in Sri Lanka, especially in
agriculture-related households. Though there are unique features with the
structural changes in the economy in the Sri Lankan context, to the best of our
knowledge, no study has examined the impact of income diversification on

Sri Lanka Economic Research Conference 2020
62
household welfare in Sri Lanka. Akahakol and Aye (2014) state that most
researchers simply consider the impact of diversification on welfare without
examining the factors affecting the households to diversify while others consider
only the latter. This study examines the impact of income diversification on
household welfare while evaluating the factors affecting the decision of
households to diversify.
According to UNICEF (2012), in recent years the use of asset-based wealth
indices as an alternative metric measure of welfare has become increasingly
prominent while little attention was given in the Sri Lankan context. There is
significant merit in moving the process of poverty measurement away from
expenditure-based indicators toward a more asset-based focus (Sahn and Stifel,
2003). Therefore, this study used money metric measures as well as the asset
index to measure household welfare.
There is a wealth of literature that discusses diversification strategies of rural
households while little attention has been given to diversification in the urban
sector. Therefore, we attempted to analyze the impact of income diversification
on household welfare considering all three economic sectors (Rural, Urban and
Estate) in Sri Lanka. Specifically, the study focused on finding the determinants
of income diversification and household welfare. Furthermore, understanding the
nature of the income diversification in Sri Lanka along with its impact on
household welfare would give rise to policy formulation as to how social welfare
measure could be changed with changing household characteristics and income
earning strategies.
Methodology
Data for the study were derived from Household and Expenditure Survey 2016
(HIES) conducted by the Department of Census and Statistics. The data set
comprised 21,756 households and this research considers the whole data set for
the analysis representing all three sectors. Data were analyzed using descriptive
statistics, Probit regression, and Ordinary Least Square (OLS) Regression. If a
household receives income from more than one income source from following,
the household was considered as a household with diversified income
1. Income from Wages and salaries (Employment)
2. Income from Agriculture (Seasonal Crops)
3. Income from other Agriculture (Non-Seasonal Crops and livestock)

Decent Livelihood and Well-being
63
4. Income from Non-Agriculture ( Mining and Quarrying, Manufacturing,
construction, trade, transport, Guesthouse, Restaurants Bars, Other
services, etc
5. Income from other cash receipts (such as pensions, dividends, rents,
remittance, local and foreign and transfers)
In analyzing the data, first a probit regression was run to find the determinants of
income diversification by considering the characteristics of household head, other
household characteristics as explanatory variables. We include regional dummies
to check the impact of regional differences in income diversification. Next we
regressed the annual per capita expenditure by incorporating a dummy variable
to show if the household has diversified its income as the income data is believed
to be less reliable than consumption data (Ranathunga and Gibson, 2014).
We further analyzed the impact of income diversification on household welfare
using asset index strategy. The independent variables (characteristics of
household head, other household characteristics) were selected based on the
availability of data in HIES (2016) and previous studies such as Ranthunga and
Gibson (2014), Dharmadasa, and Polkotuwa (2016), and Deyshappriya and
Minuwanthi (2020).
The OLS Model for this study specified as following (Akaakohol and Aye, 2014)
𝑌𝑖 = 𝛼0 + 𝛼1 𝑋𝑖1 + ⋯ … … … … … … … . 𝛼𝑛 𝑋𝑖𝑛 + 휀
Where 𝑌𝑖 = Log of Annual household consumption per capita or Aggregate asset
index and 𝑋𝑖1 − 𝑋𝑖𝑛 = Explanatory variables. 𝛼 − 𝛼𝑛= Coefficients, 휀 = error
term
Asset Indices are calculated from variables of household’s ownership of assets.
Consumer asset index, productive asset index, and aggregate asset index were
created using asset ownership variables (Ajaero et al., 2017). Asset Indices
according to Filmer and Scott (2008) are of the basic form:
𝐴𝑖 = 𝑏1. 𝑎1𝑖 + 𝑏2. 𝑎2𝑖+. . . + 𝑏𝑘. 𝑎𝑘𝑖
𝐴𝑖 = Asset index of household “𝑖”
𝑎1𝑖 , 𝑎2𝑖,…𝑎𝑘𝑖 = k indicators of asset ownership variables (such as radio,
television)

Sri Lanka Economic Research Conference 2020
64
𝑏1.𝑏2, 𝑏3= Weights to be used in aggregating the asset indicators into an index
In calculating each of the asset indices, the study used the principal component
analysis (PCA) to determine the weights as a factor score for each asset variable.
In this study, the scoring factors of the first principal components (efficient
components) were used for constructing the asset indices using the asset indices
formula by Filmer and Scott (2008).
Results and discussion
This section presents the results of the study and discusses them. First, we present
the results related to determinants of income diversification followed by the
results related to welfare and income diversification.
Our results suggest that more than half (61%) of the households in Sri Lanka have
diversified their income. More specifically, income diversification in the rural
sector is higher than that of rural and estate sector. Household members that are
permanent employees are less likely to be diversify their income portfolio as they
receive sufficient income from their employment. Results further suggest that
households having more members tend to move towards diversifying their
income confirming the findings of previous studies of Barrett et al. (2001);
Dharmadasa and Polkotuwa (2016).
Table 1: Results of the probit regression (Marginal effects after the probit
regression)
Variables dy/dx Standard error t p>t
Education years of household head -0.0076*** 0.0010 -7.23 0.000
Age of household head 0.0108*** 0.0016 7.01 0.000
Age2 of the household head -0.0001*** 0.0000 -6.78 0.000
Gender of household head 0.0223** 0.0107 2.08 0.038
Marital status of household head -0.0270** 0.0118 -2.29 0.022
Household head from ethnicity majority 0.0921*** 0.0090 10.19 0.000
Household Size 0.0955*** 0.0039 26.57 0.000
Number of younger dependents -0.0709*** 0.0054 -13.10 0.000
Number of old dependents 0.0309*** 0.0052 5.89 0.000
Urban Sector household -0.1556*** 0.0102 -15.02 0.000
Estate Sector household -0.0490** 0.0191 -2.57 0.010
Source: HIES data 2016
The p-value of the regression analysis was 0.0000; it was less than 0.05 so the
model is fitted with the data. Pseudo R Squared value is estimated at 6%. Old

Decent Livelihood and Well-being
65
household heads are having high tendency to diversity in to different income
sources since, they are having more experiences and more awareness on the
livelihood strategies and income sources. It is a fact that higher education levels
of individuals assure better income opportunities either in the government sector
or the private sector. Once, they are employed in these sectors based on their
education levels, they are fully dedicated to those employments so that they do
not seek alternative income sources. We used two dummies to denote regional
differences in urban and estate sectors with respect to income diversification and
household welfare. Accordingly, income diversification in the rural sector is
higher than that of other two sectors. Households from major ethnicities also can
have a significant impact on diversification. Surprisingly, our results suggest that
married household heads are less likely to diversify their income and having
young dependents reduces diversifying their income into different sources
although having young dependents tends to increase income diversification. This
may be due to the fact that the household members may not have extra time to
engage in other income generating activities when they have more young
dependents as they have to be very well taken care of. On the other hand, having
old dependents means the family could be a nucleus family and many members
live in the same household and they too have to be taken care of and more mouths
are to be fed. Therefore, it could be expected that these households tend to
diversify their income portfolio.
Results of the OLS Regression (Dependent variable: Annual Log per capita
Expenditure)
We used two different indicators to measure the household welfare namely per
capita income and aggregate asset index. We regressed these two variables with
several household characteristics and two regional dummies. Our estimated
results suggest that the household welfare increases when households diversify
their income portfolio. According to the results, it is clear that income
diversification can have a positive impact on Annual per capital Expenditure at a
5% level significant level. Therefore, the null hypothesis that income
diversification has no significant effect on household welfare in terms of log per
capita annual expenditure is rejected. Sri Lankan society is a male dominating
one and in most cases the household head is therefore a male. On the other hand,
most of them are educated to a certain level. Our results show that educated male
households contributes to increase the household welfare while it is decreased by
having more people and more young dependents in the household. It implies
when the number of younger dependents increases a considerable amount of
money has to allocate to their Education, Health & Safety, etc. Theoretically, high

Sri Lanka Economic Research Conference 2020
66
educational attainment is strongly associated with the standard of living. Results
revealed that completed any level of educational qualification increases the per
capita expenditure of a household. It implies that Education creates better
employment opportunities which essentially determine household income. In the
other hand, education enhances social networks and human capital. Ranathunga
and Gibson (2014) have also demonstrated that the incremental value to
household welfare indicated that a distinct jump for an extra year of education at
the levels where the national exams are completed reduces poverty.
Table 2: Effect of income diversification on household welfare (Dependent
variable; log per capita expenditure)
Prob>f =0.0000
R-Squared = 0.2374
Root MSE = 0.5845
P*<0.1 , P**<0.5 , P***<0.01
Variables CoefficientRobust t p>t
Log Annual expenditure per capital Standard error
Income Diversification 0.0252** 0.0088 2.85 0.004
Age of household head -0.0011** 0.0004 -2.71 0.007
Gender of household head 0.0460*** 0.0136 3.37 0.001
Marital status of household head -0.0137 0.0143 -0.95 0.340
Education level of household head
Primary education -0.1335***0.0209 -6.36 0.000
Secondary education 0.5043*** 0.0208 24.25 0.000
Tertiary education 0.7901*** 0.0319 24.79 0.000
Household Size -0.0854***0.0038 -22.44 0.000
Number of younger dependents -0.0613***0.0062 -9.75 0.000
Number of old dependents 0.0262*** 0.0058 4.52 0.000
Female adult ratio 0.1565*** 0.0214 7.31 0.000
Urban Sector household 0.2821*** 0.0121 2.29 0.000
Estate Sector household -0.1302***0.0167 -7.78 0.000
Constant 11.824 0.0297 396.99 0.000
Source: HIES data 2016
According to the results, the number of old dependents positively and
significantly contributes to household welfare in Sri Lanka. It may be due to the
old aged benefits such as pensions and other types of incomes they receive either
from government or donors. The female adult ratio also acts as a positive
determinant to increase the welfare of the households. Despite geographical
variables, compared to living in an urban area, living in the other two sectors
generates negative effects on household consumption expenditure. This might be

Decent Livelihood and Well-being
67
due to the regional disparities in Sri Lanka in terms of economic and social
factors.
OLS Regression (Dependent Variable: Aggregate Asset Index)
Table 3: Impact of income diversification on household welfare (Dependent
variable: Aggregate asset index)
Prob> F =0.0000
R-squared =0.3628
Root MSE =0.7287
P*<0.1 , P**<0.5 , P***<0.01
Variables coefficient Standard error t p>t
Aggregate Asset Index Robust
Income Diversification 0.0299** 0.1122 2.67 0.008
Age of household head 0.0055*** 0.0005 10.96 0.000
Education years of household head 0.1137*** 0.0015 74.58 0.000
Ethnicity of household head -0.0313 0.0174 -0.18 0.857
Marital status of household head 0.09731 0.0142 6.84 0.000
Number of Young dependents -0.1090***0.0074 -14.65 0.000
Number of Elder dependents 0.0483*** 0.0070 6.81 0.000
Household size 0.1449*** 000482 30.05 0.000
Urban Sector household 0.20270***0.0163 12.42 0.000
Estate Sector household -0.1846***0.2650 -6.97 0.000
Western Province 0.4939*** 0.0230 21.46 0.000
Central province 0.2426*** 0.0240 10.09 0.000
Southern Province 0.2430*** 0.0229 10.60 0.000
Eastern province 0.0405 0.0272 1.49 0.136
Northern Provine -0.1760***0.0304 -5.80 0.000
Northwestern Province 0.3084 0.0252 6.39 0.000
Northcentral Province 0.2850*** 0.0276 10.36 0.000
Sabaragamuwa Province 0.1612*** 0.0254 6.39 0.000
Constant -2.0492 0.04158 -49.28 0.000
Source: HIES data
The study used the aggregate asset Index (Both Productive and Consumer assets)
which have received comparatively low attention in previous studies. Results
revealed that income diversification has a significant and positive impact on the
Household asset index at a 5% significant level implying that more livelihood
diversified households can have higher welfare in terms of the Asset Index.
Household size also affects positively on the asset index implying that when
household size increases the need for consumer assets might increase and
productive assets also will increase as savings to the members. When the number

Sri Lanka Economic Research Conference 2020
68
of elder dependents increases, they also might own some productive assets which
can include in the household assets. However, when there are younger dependents
in a family the money allocation for them is increasing. It will lead to save less
and to gain more assets. Regional disparities can be seen when looking into
geographical variables. Estate sector households are more likely to have less
household welfare in Sri Lanka because most of the Estate sector households
depend on tea plantations and those lands are owned by respective plantation
companies, not by them.
Conclusion and recommendation
According to the results, income diversification can be considered as the most
important and significant strategy for raising household welfare in Sri Lanka in
terms of per capita expenditure, per capita income, and Aggregate asset index.
Results also depict that the major determinants of household welfare and income
diversification decision in Sri Lanka are human capital-related factors and the
regional characteristics of the household.
The study identified the regional disparities among sectors in Sri Lanka.
Households in the urban sector are well off rather than households in the rural
sector. In terms of income diversification, households in urban areas have the
least tendency to diversify income portfolio. Most of them who have not
diversified their income are wage or salary earners. Encouraging them to start
medium or small-scale enterprises, concepts like flexible working hours will lead
to attracting them in to adopt different income sources and it will ultimately help
to upgrade their household welfare. For increasing the extent of income
diversification in the rural and estate sector, it is necessary to provide incentives
for entrepreneurial development, encourage small-scale businesses in the rural
area, expansion of the existing credit market, development of infrastructure, and
improvement of information facilities are needed. The government can enhance
the awareness or opportunities on income sources for the households. The
government can enhance education status, for instance, by giving scholarships
for higher education, subsidized primary and secondary education, developing
skills in working place, policies that facilitate investment in education, etc.
Income diversification is low in female-headed households. The government can
also encourage females by women empowerment programs and by making
entrepreneurial opportunities. According to the results, most of the households
which are having agricultural lands do not gain income from it especially in the
urban sector. Agriculture landholders have to promote policy implementations to
make them gain income from their lands by making lands productive lands. In

Decent Livelihood and Well-being
69
conclusion, this study has shown that income diversification has important effects
on household welfare, as depicted in ownership of consumer and durable assets
of households, per capita expenditure, and per capita income.
Keywords: Household welfare; Income diversification; OLS regression; Probit
regression.
References
Ajaero, C. K., Nzeadibe, C. T., Obisie-Nmehielle, N., & Ike, C. C. (2018). The linkages
between international migration, remittances and household welfare in
Nigeria. Migration and Development, 7(1), 40-54.
Akaakohol, M. A., & Aye, G. C. (2014). Diversification and farm household welfare in
Makurdi, Benue State, Nigeria. Development Studies Research. An Open Access
Journal, 1(1), 168-175.
Alderman, H., & Paxson, C. H. (1992). Do the poor insure?: a synthesis of the literature
on risk and consumption in developing countries (Vol. 164). World Bank
Publications.
Barrett, C. B., Reardon, T., & Webb, P. (2001). Nonfarm income diversification and
household livelihood strategies in rural Africa: concepts, dynamics, and policy
implications. Food policy, 26(4), 315-331.
Department of Census and Statistics. (2016a). Household Income and Expenditure
Survey. In statistics.gov.lk. Retrieved from Department of Census and Statistics
website:
http://www.statistics.gov.lk/HIES/HIES2016/HIES2016_FinalReport.pdf
Deyshappriya, N. R., & Minuwanthi, R. W. W. K. (2020). Determinants of Poverty: Is
Age Non-Linearly Related with Poverty? Evidence from Sri Lanka. International
Journal of Asian Social Science, 10(4), 181-192.
Dharmadasa, R. A. P. I. S., & Polkotuwa, P. W. T. P. (2016). Income Diversification of
Estate Sector in Sri Lanka. Journal of Business Studies, 3(2).
Dissanayake, L., & Weeratunga, M. (2017). Changing Nature of the Labour Force in Sri
Lanka: Predicting Occupational Structures of Major Industry
Groups. International Journal Advanced Research and Review, 3(2), 16-26.
Filmer, D., & Scott, K. (2008). Assessing asset indices. The World Bank.

Sri Lanka Economic Research Conference 2020
70
Jayamanna, G. G. M. D. T., Dharmadasa, R. A. P. I. S., Abeysekara, N. N. R., &
Ekanayake, E. M. J. B. Determinants of income diversification of flue cured
tobacco barn owners in Sri Lanka.
Hewavitharana, M. K., & Dharmadasa, R. A. P. I. S. Determinants of income
diversification in Tea estates households in Badulla district. Technical Session-Tea
Technology and Value Addition, 63.
KUMARA, P. H. T. (2015). An Analysis Poverty in Sri Lanka: the Causes of Poverty
Reduction between 2007 and 2010 (Doctoral dissertation, 神戸大学).
Minot, N. (Ed.). (2006). Income diversification and poverty in the Northern Uplands of
Vietnam (Vol. 145). Intl Food Policy Res Inst.
Nghiem, L. T. (2010). Activity and Income Diversification: Trends, Determinants and
Effects on Poverty Reduction. The Case of the Mekong River.
Ranathunga, S., & Gibson, J. (2014). Determinants of household poverty in the rural
sector in Sri Lanka: 1990-2010. Economics, 3(3), 43-49.
Sahn, D. E., & Stifel, D. (2003). Exploring alternative measures of welfare in the absence
of expenditure data. Review of income and wealth, 49(4), 463-489.
United Nations Children’s Fund (2012) Measuring household welfare, Short versus long
consumption modules (online). (Accessed on: 20th November 2019) Available at:
https://www.unicefirc.org/publications/pdf/iwp_2012_04.pdf

Decent Livelihood and Well-being
71
LIVELIHOOD SECURITY AND INCOME
DIVERSIFICATION OF TEA SMALLHOLDERS;
EVIDENCE FROM GALLE DISTRICT
Mudalige, T.M.*, Dharmadasa, R.A.P.I.S. Department of Export Agriculture, Uva Wellassa University Sri Lanka
*Corresponding author: [email protected]
Introduction
Total tea production in Sri Lanka is acquired by two sectors. They are regional
plantation companies and tea smallholding sector. Among these two sectors tea
small holding sector become major contributor to the country’s tea production.
Often following a multi-crop model on land holdings of less than ten acres are
considered as the tea smallholders. Tea small holders contribute to the 74.5% of
total tea production and also more than 393420 number of small holders have
121967-hectare land capacity which are contributed to increase tea production.
Tea Small holding land extent in Galle district is 27427 hectares (Tea Small
Holdings Development Authority, 2016). Total green leaf production and tea
production produced by Galle district are respectively 199.016 mn.kg and 42.799
mn.kg (SLTB, 2016).
Livelihood security of tea small holders basically depends on their ability to gain
profitable income through their cultivation and ability to manage their cultivation,
income and resources for that. Livelihood security consist with different
components such as economic security, educational security, food security,
habitat security, health security (include water and sanitation), social network
security (Frankenberger et al, 2002). Negative effect to the livelihood security
condition will lead tea smallholders to make decisions about continuity or change
their current livelihood effecting total tea production.
Problem statement
Tea small holders are one of subset in tea industry that can make significant
impact on total tea production (Bandula et al, 2016). Therefore it is essential to
identify how the household level economic status, health condition, education
level, social participation and the infrastructure facilities effect to the overall
household livelihood security level and how the livelihood security level effect
on tea small holding household heads decision to diversify their income sources.
It is essential to understand the correlation between level of household livelihood

Sri Lanka Economic Research Conference 2020
72
security and their production capabilities which is highly depend on labour factor,
income received and contribution of the tea land owner. Therefore it’s important
to find the triggering factors that led tea smallholders to diversify their income in
to the various income sources while reducing concern about tea cultivation and
management practices to secure the futurity of the field.
Objectives
• Assessment of the components of livelihood security of tea small
holders while identifying the factors effecting to the livelihood security
of rural tea smallholders
• Identification of the significance of the factors that effects on household
livelihood security level while understanding their magnitudes of the
impact.
• Identification of the relationship between household livelihood security
level and income diversification strategy of tea smallholders.
Methodology
Data
Primary data relating to various parameters of Income Diversification and
Livelihood security were gathered through pre tested questionnaire which was
filled with randomly selected small holders of Hingaloya/Hiniduma sub office
which contain most number of tea smallholders in Galle district (24225).Total
sample size 200 tea smallholding families. Income received for each tea
smallholder from the tea factory and the loans achieved from Dellawa tea factory
was compared with answered questionnaire and confirm the values referring
ledgers and bills of Dellawa tea factory as the secondary data.
Data analysis
Data were analyzed using descriptive statistics, Tabular techniques, and Linear
Regression model.
Construction of indices
Livelihood security index (LSI)
Each indicator was ranked on a five point ordinal scale. Livelihood security
indices such as food, economic, health, education, habitat, and empowerment
security were computed by aggregating all the scores of the selected indicators.
The mean of these indicators were calculated and taken as a weightage of that

Decent Livelihood and Well-being
73
specific indicator. Standardized indicator value calculated using following
equation.
Z indj =Indicator j – Min j
Max j − Min j
Where,
Zindj = standardized indicator j
Max j and Min j = maximum and minimum value of indicator j
Household Livelihood Security Index for each indicator of the entire households
was calculated by using the formula given as below:
HLSi =Σ Zindj
𝑁
Where,
HLSi = Household Livelihood Security for one indicator
Σ Zindj = summated standardized score of all households for of an indicator
N= Number of households cover in the study
After HLS index for one indicator was constructed, the compound overall
Livelihood Security (LS) Index was calculated by using the formula given as
below:
LSi =Σ Wi HLSi
Σ Wi
Where,
LSi = Livelihood Security
HLSi = Household Livelihood Security
ΣWi = summated value of weightage of all indicators
(Adopted from Akter & Rahman, 2012)

Sri Lanka Economic Research Conference 2020
74
Six different livelihood outcomes namely food security, economic security,
education security, health security, habitat security and social network security
were measured using following indicators.
Regression analysis
To identify the determinants of household livelihood security and its interaction
with income diversification linear regression analysis was conducted using
STATA 14.0 version.
𝐘 = 𝛃𝟎 +
𝛃𝟏 𝐱𝟏 + 𝛃𝟐𝐱𝟐 + 𝛃𝟑𝐱𝟑 + 𝛃𝟒𝐱𝟒 + 𝛃𝟓𝐱𝟓 + 𝛃𝟔𝐱𝟔 + 𝛃𝟕𝐱𝟕 + 𝛆
Where, Y= Household Livelihood Security, X1 = Diversified or Not, X2=
Gender
of Household head, X3=
Household size, X4=
Civil status, X5=
10 years or more
educated household head, X6=
Number of dependants, X7=
ATISPOT=Allocated
total income share percentage on tea cultivation
Results and discussion
Descriptive statistics
There are 62.5 percent household heads diversified their income sources while
37.5 percent of them are only rely on tea cultivation. Most of household heads
those who hadn’t diversified their income source have support of other
economically active family members financial contribution to the essential
household activities. And also there is significant outflow from tea small holding
sector can be found among the young male and female household heads or family
members those who in young ages due to the improvement of education facilities,
changing of the social thinking, and competitiveness among people. Only 14.92
percent of young population choose tea cultivation as their livelihood while rest
of 85.08 percent choose different livelihood paths.
Livelihood Security Outcomes
There are six different livelihood outcomes namely food security, economic
security, education security, health security, habitat security and social network
security.
Food Security
Achieving food security requires that food supplies are sufficient and the
household has adequate access to food, either from own production or through

Decent Livelihood and Well-being
75
the market or some other sources. In this context considered two main indicators
for assessing food security of tea small holders. Household wise previous day
food intake was collected in grams and it was converted into calories by using
food calorie value table and average food calorie intake was calculated. Gender
wise and age wise daily recommended nutrient allowances were calculated. The
ratio between calorie intake and daily recommended nutrient allowance which
was known as calorie adequacy ratio (CAR) was calculated using calorie
adequacy ratio equation for each tea smallholder household. If CAR is equal to
one then the family is taking the recommended calorie level. Five score was given
when CAR is equal one or more than one. If CAR was less than one, it means
those families are taking less than the recommended calorie level. According to
the five point ordinal scale, relevant scores from one to four were given to them
and calculated mean value of the relevant scores of 200 households. For this study
household food consumption was collected by using the previous 24- hours as a
reference period (24 hours recall method). By using five point ordinal scale score,
selected nine food categories were divided into five food groups and score were
given according to the relevant scores for the food groups and calculated mean
value of the scores to generate overall diet diversity among them.
According to these two methods Calorie adequacy ratios showed 4.69 value and
diet diversity showed 4.97 value among population. Aggregately indicated
overall food security at 4.83 value. It confirmed food security was in higher score
range according to the standardized score range of livelihood outcomes
(Shyamalie, 2013).
Economic Security
Per capita monthly income, per capita monthly savings and Proportion of 15-59
employed members are used to measure the overall economic security among the
population. Ratio between total household monthly income and the total number
of family members is consider as per capita monthly income of relevant
household. According to the Household Income and Expenditure Survey 2016,
mean per capita income per household is Rs 16,866 in Galle. Under this
assumption of people who earn income higher than per capita income in rural
sector are wealth, they were given 5 scores. Rest of the people was divided in to
four categories according to ordinal scale and they were given relevant scores
from one to four. Aggregated mean score was calculated by dividing the
summation of all the individual scores by total no of sample members and it was
indicated as 4.22 among them. Per capita monthly saving was calculated by
dividing total household monthly saving by total number of family members.

Sri Lanka Economic Research Conference 2020
76
Relevant scores from one to five by using fivepoint ordinal scales was given to
determine per capita monthly savings and aggregated mean score was calculated
by dividing summation of all individual scores by total no of sample members
and it was indicated as 2.45 among the population. Proportion of 15-59
employment which showed 1.65 value and it was also determined according to
the five point ordinal scale which is built based on the number of the adults
employees except household head. These three values aggregately considered to
calculate mean value of them and it’s considered as overall economic security
among the population and it was indicated as 2.7 higher range.
Health Security
Accessibility to the health services, Quality of sanitation facilities, per person
days of sickness are the indicators that applied to the population and mean value
of these indicators considered as the overall health security. Accessibility to
health services was measured as distance (Km) to the primary health care centre
or government hospital. Distances were noted and the relevant scores from one
to five were given by using fivepoint ordinal scale. Lowest distance was given 5
score and highest distance was given 1 score. Aggregated mean score was
calculated by dividing the summation of all the individual scores by total no of
sample members and it indicated as 2.70. Developed the score system to measure
the quality of sanitation facilities using fivepoint ordinal scale based on the
quality of latrines. Five score was given to the water sealed sanitary latrines and
one score is given to the households those who used open field as their latrine
facility. Aggregated mean score was calculated by dividing the summation of all
the individual scores by total no of sample members and it was 4.18 among the
population.
Total number of sick days of family members within month was divided by
number of family members to calculate per person days of sickness value. If that
value is 5 or more 1 score is given to the household, if that value 1 or less than
one, 5 scores given to that households. Aggregated mean score was calculated by
dividing the summation of all the individual scores by total no of sample members
and it was calculated as 4.81 among the sample population.Aggregately these
three values showed 3.90 mean value as overall health security among them.
Education Security
Accessibility to schools, dropout rate and number of 10 years or more educated
members are used to measure the overall education security. Accessibility to
school was measured by giving relevant scores from one to five using five point

Decent Livelihood and Well-being
77
ordinal scale.it was developed considering distance (Km) to the primary school
or secondary school from the tea smallholders house. Lowest distance was given
5 score and highest distance was given 1 score. Aggregated mean score was
calculated by dividing the summation of all the individual scores by total no of
sample members.it was indicated as 3.16.
Proportion of students who stop their school attending without completing their
school education (5-19 year period students were considered) are considered in
dropout ratio. Within the evaluation period, the students who were attending to
the school (no dropout) were given 5 scores. And dropouts’ students were divided
into four group considering the following criteria. If the dropouts were primary
educated (grade 1-5) they were given 1 score, If the dropouts were middle
educated (grade 6-8) they were given 2 score, If the dropouts were metric
educated (grade 9-10) they were given 3 score and if the dropouts were secondary
educated (grade 11-13) they were given 4 score. Aggregated mean score was
calculated by dividing the summation of all the individual scores by total no of
sample members and it was showed as 4.73.
Relevant scores from one to five were given by using five point ordinal scale
prepared according to the number of family members those who educated more
than 10 years of formal education. Aggregated mean score was calculated by
dividing summation of all individual scores by total no of sample members and
it was recorded as 2.16. Mean values of these three indicators which is consider
as an overall education security of population is 3.41.
Habitat Security
Five point ordinal scale scores were given based on the wealth ranking system
developed for the quality of houses and Aggregated mean score was calculated
by dividing the summation of all the individual scores by total no of sample
members. Floor quality (3.79), wall quality (3.95), roof quality (3.68), Space of
house (3.53), road quality around the household (2.87) are the five indictors used
to measure overall habitat security. Aggregately they indicate 3.56 higher value
as overall habitat security.
Empowerment Security
Capacity of individuals to maintain and participate in social networks was
measured by using five point ordinal scale developed considering number of
societies and social organizations that household head participated. Five score is
offered if household head participated all the social support organization

Sri Lanka Economic Research Conference 2020
78
mentioned in questionnaire and One score is given if household head participated
only for one social organization. Aggregated mean score was calculated by
dividing the summation of all the individual scores by total no of sample
members. Empowerment security measured through level of support that tea
smallholding families received by active community participation (2.54). It
indicate higher value according to the standardized score range but less valued
compared to other five livelihood components.
Household level livelihood security was calculated for each household
considering the equation used in Akter & Rahman, 2012 and also the overall
livelihood security was calculated by dividing the summation of each
household’s livelihood security values from number of households. It was
indicated as 3.6 among the population. According to the overall results it can be
observed that tea small holders in Galle district had high levels of health security,
habitat security, Education security, Economic security and food security while
empowerment security among population shows low value compared to the other
components. There is significant improvement can be find in food security and
the health security among tea small holders of Galle district. Overall Livelihood
security of tea small holders in Galle district 3.6 had higher value. This
emphasized the less vulnerability of overall livelihood security of tea
smallholders in Galle district. It’s important to understand what are the triggering
factors and their magnitude of the impact on household level livelihood security
to emphasize how the overall livelihood security is in high range (3.6) while tea
smallholders faced many constrained specially in past five years.
Source: Author’s estimations
Figure 1: Livelihood Outcomes of tea small holders in Galle district
4.83
2.77 3.41
2.54
3.56 3.9 3.6
0
1
2
3
4
5
6

Decent Livelihood and Well-being
79
Regression Analysis Results
Table 01: Parameters estimated for linear regression
Household Livelihood Security Coefficient Standard error
P>|t|
Diversified or Not 0.09544948* 0.0575131 0.09
Gender of Household head 0.3071884* 0.1674959 0.06
Household Size 0.1450915*** 0.0375183 0.00
Civil status -0.1181391 0.1844893 0.52
10 years or more educated Household head
0.1262678** 0. 061697 0.04
Number of Dependents -0.109178** 0.0385075 0.005
ATISPOT (Allocated total income share on tea)
0.0056473** 0.0027826 0.04
Constant 2.868184 0.1548199 0.000
Note: Significant levels denoted as *** p<0.01(99%) ** p<0.05(95%) *p<0.1(90%)
Source: Author’s estimations
The estimated model showed that income diversification, Gender, Household
size, 10 years or more educated Household head, Total income share on tea
cultivation, Number of dependents had significant impact on household
livelihood security. Number of dependent and civil status have negative impact
on household livelihood security while other five variables have positive impact
on livelihood security. Among them Income Diversification and Gender showed
significantly positive relationship at 10% probability level while 10 years or more
educated Household head, Number of dependent, Total income share on tea
showed significantly positive relationship at 5% probability level. Household size
showed significantly positive relationship at 1% probability level. When consider
about income diversification, it showed 0.09544948* value correspondent to the
dependent variable and it can be interpreted as, if household head make decision
to extend his income sources to other income generating activities that
household’s livelihood security is increase with respect to the level of income
diversification which was determine by the Number of income generating
activities.
Gender of household head was significantly and positive effect on household
livelihood security with 0.3071884* value. It can be interpreted as male headed
household have better livelihood security than the female headed households.
That outcome confirms the common ideology within the rural society. Being a

Sri Lanka Economic Research Conference 2020
80
female household head limit the options and opportunities that can take to secure
their livelihoods.
But gender became less valued factor if household head was educated one up to
10 years or more formal education. It was improving the household livelihood
security and generate significantly positive impact on it at 5% probability level
with 0.1262678** value. This value emphasizes the capability of education level
of household head to overcome the barriers and limits of the modern job market
and expand the livelihood options. Household size indicated 0.1450915*** value
with significantly positive impact on household livelihood security and it
confirmed the household which contain more family members have higher
livelihood security with compared to the household which have less family
members among population. Number of dependents shows negative relationship
with -0.109178** value and generated significant impact on the household
livelihood security. That means if tea smallholding household have a greater
number of people which are not economically independence it reduces the
household livelihood security because they rely on the main income earner.
Mostly main income earner is household head. This condition reduces his
economic capability towards other family needs.
Total income share percentage on tea cultivation showed 0.0056473**value
indicating significantly positive relationship with household livelihood security
index. That number confirmed, when consider household which was invest
considerable share of total income on tea cultivation and its maintenance
practices their household livelihood security level was high because well
maintained tea field can give good income more than the other diversified income
sources.
Above main factors effect on tea smallholder’s livelihood condition to maintain
it in higher range. Tea cultivation and the industry faced lots of constraints as
discuss before especially in previous five year because of the poor decision
making and inefficient implementation of government policies. Coping with this
all the difficulties they faced tea smallholders secure their livelihood for the sake
of the futurity of their following generations and Ceylon tea brand with the
assistance of income diversification strategies. Therefore, 62 percent of
household heads choose more than one livelihood other than tea cultivation.
Household heads education level improve the household’s overall education
security. Health security was in higher range. Per person days of sickness is very
low due to the good health condition of the sample population during past month

Decent Livelihood and Well-being
81
considered. Accessibility to the health services was in moderate level while
sanitation facilities are in higher conditions. That confirm the positive
relationship between higher sanitation facilities and the household level health
condition. Habitat security of tea smallholders was also in the higher range. There
were no temporary built houses found among the sample populations and 100
percent households are having electricity for their houses. But they need
assistance to improve their road facilities of area. Diet diversity also in higher
range as well as the calorie adequacy ratio. 73.5 percent households received
required calorie amount per day and other 25.5 percent received less than it. 89
percent of household having more than 6 food groups per day indicating higher
diet diversity. That confirm the rapid changes occur in the urban food
consumption pattern still didn’t affect to the traditional rural consumption pattern.
Empowerment security level was in the higher level. But compared to the other
components of livelihood security it was the lowest value. Lack of time to
participate to community organizations, lack of knowledge about benefits that
can received through the community organizations leads to this condition of
empowerment security among the sample population. Income diversification,
Household size, Education level of the household head, gender of the household
head, allocated share from total income on the tea cultivation, significantly and
positively effect on household livelihood security condition while Number of
dependents showed negative significant impact on it. Uncertainty belongs to the
agricultural products, unstable government and their rapidly changing policies
toward agriculture and foreign affairs, adverse weather conditions, Labor
shortages, increased cost of living are the common constraints faced by the tea
smallholders. But they coping up the situation through the adoption of livelihood
diversification strategies.
Conclusion
According to the final results of the regression analysis and the livelihood
security indices scores, overall livelihood security of sample populations was in
higher range. Positive and significant relationship between household livelihood
security and income diversification emphasize the reason for the higher
livelihood security indicating uncertainty of tea cultivation as the single source
of income. Male headed tea smallholding families more secure in economic
condition with compared to the female headed households. Education level of the
tea small holder household head and the other adults of the family determine the
extent of income diversification of household. Households which contain more
members including more economically independent adults have lowest
vulnerability to the livelihood security and it improve the ability to allocate

Sri Lanka Economic Research Conference 2020
82
significant percentage of total income on tea cultivation and management.
Therefore, it’s important to disseminate new technologies and the findings among
the tea smallholders through a formal adult learning programs and education
security must improve among the tea smallholder households by providing
required infrastructure facilities on behalf of the futurity of the tea smallholding
sector.
Keywords: Calorie Adequacy Ratio; Diet Diversity; Income diversification;
Livelihood security;
References
Akter, S., & Rahman, S. (2012). Investigating livelihood security in poor settlements in
Bangladesh (No. 354-2016-18156).
Bandula, G. G., Abeywickrama, L. M., & De Zoysa, M. (2016). Tea small
holders’perceptions and experience with tea small holdings development societies
(tshds) in matara district of Sri Lanka. Tropical Agricultural Research and
Extension, 19(2).
Frankenberger, T. R., Luther, K., Becht, J., & McCaston, M. K. (2002). Household
Livelihood Security Assessments: A Toolkit for Practitioners, Prepared for the
PHLS Unit by: TANGO International Inc., Tucson, Arizona 2002.
Parliament.lk. 2016. Sri Lanka Tea Board Annual Report. [Online] Available at:
<https://www.parliament.lk/uploads/documents/paperspresented/annual-report-
srilanka-tea-board-2016.pdf> [Accessed 25 November 2019].
Shyamalie, H. W. (2013). Socio economic status and livelihood security of women
comparative study of hills of India and Sri Lanka.
Tshda.gov.lk. 2016. Tea Small Holdings Development Authority Annual Report.
[Online] Available at:
<http://www.tshda.gov.lk/web/index.php?option=com_content&view=article&id
=69&Itemid=73&lang=en> [Accessed 10 November 2019].

Decent Livelihood and Well-being
83
EMPLOYEE PERCEPTIONS OF WORKPLACE
WELLNESS: A CASE STUDY IN ICT INDUSTRY SRI
LANKA
Yasoda, V.G.K. Department of Economics, University of Colombo, Sri Lanka
Introduction
Wellness is defined as the pursuit of activities, choices, and lifestyles that lead to
a state of holistic health (Global Wellness Economy Monitor, 2018). Wellness
economy contains industries that facilitate consumers to integrate wellness
activities and lifestyles into their daily lives. Workplace Wellness is emerging as
a major component of welfare in the global wellness economy. Workplace
Wellness is not a single industry but refers to a variety of services, products and
platforms that a worksite might offer to prevent disease, mitigate stress, improve
work-life balance, enhance engagement, and to improve workplace culture and
management structures within firms. For instance, wellness initiatives include
encouraging physical exercise, incentivizing wellness, health screening,
diagnostic tests, socializing programs, counseling services, etc.
Nevertheless, each year work related accidents, occupational diseases, and other
work-related health problems cause 4–6 per cent economic loss in the global GDP
(Global Wellness Institute, 2016). In addition, various research studies have
estimated the costs of work-related stress to be significant in every part of the
world [see inter alia European Risk Observatory (2014)]. Many researchers (for
instance Kaspin et al. (2013) and Berry et al (2010)) have concluded that work
related accidents, stress and psychosocial issues lead to increased absenteeism
and staff turnover rates, and make employees less productive and efficient. Over
time the economic cost of unwell employees has increased and therefore,
workplace wellness programs are aiming to lower healthcare costs; improve
morale, retention, and recruitment; and increase productivity and
competitiveness.
However, work place wellness is still not a widespread concept in the Sri Lankan
context. Though some, Sri Lankan companies have begun the process of
promoting workplace wellness. This is particularly significant because Sri Lanka
is currently facing two transitional phases. First, Demographic transition also

Sri Lanka Economic Research Conference 2020
84
known as the ageing population phenomenon, where population aged 60 and
above are increasing as a fraction of the population, with Sri Lanka identified as
one of the fastest aging countries in the world. By 2030 one of every five Sri
Lankans will be aged 60 or above so that, the working age population will shrink
in the long run leading to decrease in national output. Secondly, epidemiological
transition is in effect with Non communicable diseases being more prevalent than
communicable diseases. The government therefore faces significant financial
issues due to both these forces regarding its health budget. In such contexts it
becomes important to maintain the existing labour force in a healthier condition
and to shift a part of the healthcare expenditure (albeit preventive healthcare
expenditure) on to employers. In conclusion, both these objectives could be
achieved through workplace wellness programs.
Although workplace wellness is becoming a major concern in the country at
present, it is evident that hardly any research has been carried out. Therefore, the
research problem of this study is identifying the workplace wellness programs in
Sri Lanka. As there are no research has been done on this subject matter this
research is exploratory in nature.
Research Objectives
This study attempts to explore the status of workplace wellness in Sri Lanka,
using the Information and Communication Technology (ICT) industry as a case
study. The specific objectives of the study are
• Identifying existing workplace wellness activities in the context of the
Sri Lankan ICT industry.
• Examining the perceived satisfaction with these wellness programs.
I have chosen to focus on the ICT firms, for the reason that this industry, being
strongly influenced by international trends: given that some of these companies
have foreign principals while others transact mainly with foreign company
clientele has been the forerunner in incorporating this concept into their
worksites.
Methodology
First, as there is no empirical literature on this issue for Sri Lanka, Key Person
Interviews (KPIs) were carried out to identify the type of activities adopted under
the concept of Workplace Wellness and the rationales for doing so. This led to
conducting this research as a case study of the ICT industry as mentioned before.
According to the views of the KPI respondents, initiatives relating to workplace

Decent Livelihood and Well-being
85
wellness are in progress in this industry as a result of global influence. This
industry is significant in the economy as well given its current earnings and
expansion potential.
This study then uses primary data collected through a survey using structured
questionnaires. The sample comprises 363 ICT professionals from different
private ICT companies. ICT workforce in Sri Lanka comprises of ICT companies,
Business Processing Management (BPM) companies, ICT training organizations,
Non-ICT companies and government organizations. However, this research only
investigates the wellness initiatives of private sector ICT companies. And due to
practical difficulties, the sample of respondents was selected on a convenience
basis.
Results and Discussion
The survey data revealed a number of workplace wellness programs initiated by
IT companies. These programs can be categorized into three groups; emotional
wellness, physical wellness and social wellness programs (See figure 01). It is
important to note that certain programs can encompass more than one of these
three objectives.
Source: Author categorization based on the questionnaire and KPI interviews
Figure 1: Classification of workplace wellness programs
3 According to the National IT-BPM workforce survey-2019 there are 600 ICT companies
in Sri Lanka. The survey includes only one respondent from one ICT companies. Hence,
the sample represents nearly 6 percent of the total ICT companies.

Sri Lanka Economic Research Conference 2020
86
Graph 01 reflecting worker responses shows that the, most common wellness
activity tool is team outings, where team members go out for meals once a week
or month with the cost being borne by the company. The second most common
program is movie nights, during which the company screens a popular movie in
the company premises, while providing snacks and soft drinks to enhance the
experience by making the atmosphere similar to that of a film hall. Due to their
work mode most IT professionals tend to work in isolation and therefore such
programs can lead to more collaboration and communication, resulting in a
healthier work environment and more job satisfaction. They also work to tight
deadlines and under stress hence making it important to give them an opportunity
to relax.
Source: Author constructed using survey data
Graph 01: Prevalence of workplace wellness programs
Moreover, it is can be noted that many firms’ offer physical wellness programs
such as onsite fitness centers, gym memberships and discounted meals. IT
professionals have higher health risks due to their sedentary work practices, being
mainly in constrained postures and inappropriate ergonomics. A large number of
respondents reported eye-strain (56.7%), backache (50.0%) and stiff necks
(43.3%), all conditions known to be accentuated by working in the IT field.
According to the Sharma et al (2009) musculoskeletal disorders, backache, stiff
neck and joint pains are most prevalent among IT professionals. Hence, the above
physical wellness programs may be offered as a response to reduce the above
health risks. Furthermore, one fifth of the respondent reported depression.
According to Rao and Chandraiah (2012) such occupational risks are high among
IT professional due to overload of work, personal responsibilities and
0.0 20.0 40.0 60.0 80.0 100.0
On-site fitness centres
Discounts on Gym memberships
Discounted meals/ Free meals
Incentives for healthy meals
Yoga and Zumba
Nap Pods
Wellness/Fitness challenges
Community service activities
Team outings
Movie Nights
Stress management sessions
as a percentage of total citations
Wel
lnes
s P
rogra
ms

Decent Livelihood and Well-being
87
expectations. Yet, only a few firms seem to have offered emotional or mental
wellness programs such as stress management sessions.
According to the survey over 90 percent of the sample believed that wellness
programs increase their mental and social health. This may be due to the high
prevalence of movie nights and team outings which lead to social and emotional
wellness. The responses in this context can be summarized as follows:
Source: Author constructed using survey data
Graph 02: Perception of satisfaction regarding wellness programs
Conclusion
Briefly the above study concludes that the IT industry is working to create
workplace wellness, through different strategies, focusing on the areas of
physical, mental and social wellbeing, a feature that is understood and
appreciated to an extent by its staff. The recommendation would then be to
popularize this corporate culture across other industries as well, and to further
strengthen the understanding of the workplace wellness objective within the ICT
industry too. This would improve the health status of the workforce and decrease
the health financing burden on the government. In addition, this would be
complement achieving the 3rd (Good health and well-being) and 8th (Decent work
and Economic Growth) Sustainable Development Goals (SDGs).
KeyWords: IT industry; Wellbeing; Wellness Economy; Workplace Wellness
0.0
10.0
20.0
30.0
40.0
50.0
60.0
70.0
80.0
90.0
100.0
Mental health Social health Physical health Do not have an
impact

Sri Lanka Economic Research Conference 2020
88
References
Berry, L. L., Mirabito, A. M., & Baun, W. B. (2010). What's the hard return on employee
wellness programs?. Harvard business review, 88(12), 104–142.
European Risk Observatory (2014). Calculating the cost of work-related stress and
psychosocial risk, European Agency for Safety and Health at Work, Luxembourg.
doi: 10.2802/20493
Global Wellness Institute. (2016). The Future of Wellness at Work.
https://globalwellnessinstitute.org/industry-research/the-future-of-wellness-at-
work/
Global Wellness Institute. (2018). Global Wellness Economy Monitor: Asia Pacific.
https://globalwellnessinstitute.org/industry-research/asia-pacific-wellness-
economy/
Information and Communication Technology Agency of Sri Lanka. (2019). National IT-
BPM workforce survey, 2019
Kaspin, L. C., Gorman, K. M., & Miller, R. M. (2013). Systematic review of employer-
sponsored wellness strategies and their economic and health-related
outcomes. Population health management, 16(1), 14–21.
https://doi.org/10.1089/pop.2012.0006
Rao, J. V., & Chandraiah, K. (2012). Occupational stress, mental health and coping
among information technology professionals. Indian journal of occupational and
environmental medicine, 16(1), 22–26. https://doi.org/10.4103/0019-5278.99686
Sharma, AK., Khera, S and Khandekar, J. (2006), Computer related health problems
among information technology professionals in Delhi, India Journal of
Community Medicine, 31(1), 36-38, https://doi.org/10.4103/0970-0218.54936

Decent Livelihood and Well-being
89
CHRONIC YOUTH UNEMPLOYMENT AND POLICY
OPTIONS FOR SRI LANKA
Wijikumar K. Human Resources Division, Uva Wellassa University of Sri Lanka
Introduction
Unemployment is a state of an individual who is not engaged with gainful
occupations. Since an adequate wage rate became critical to individuals' survival
to purchase goods, they start looking for and depend on occupations, which they
could not provide for themselves. Consequently, unemployment has become a
significant life problem affects individuals both economically and
psychologically (Gunathilaka 2013). Youth unemployment can be defined as the
rate of unemployed population in the age group 15 – 24 years to the currently
“economically active population” in the same age group (Department of Census
and Statistics, 2019).
According to the labour force survey, the general unemployment rate indicates a
significant positive turn since the 1970s (Munasinghe, 2016). The unemployment
rate dropped from 18% in the 1970s to 9.5% in 1998 and further dropped to 4.4
in 2018. According to the age group, youth (age 15-24) show highest
unemployment rate 21.4%, which is followed by an adult (age 25-29) 10.4%.
Youth unemployment was almost five times as high as the overall rate. This rate
is higher among the youths with G.C.E.(A/L) & above educational qualifications.
In addition, the proportion of youth unemployment is 53% in total unemployment
which indicates that half of unemployment population in Sri Lanka is youth.
Further, the Not in Employment, Education or Training (NEET) rate of Sri Lanka
which is an indicator illustrate the share of young people who are not in
employment, education or training as a percentage of the total number of young
people, displays that approximately one out of every five youths belong to the
NEET group (Department of Census and Statistics, 2019). Even though the age
category for youth is given 15-24, among them, only 33% enter into the labour
market, and among them, 22% remain employed (Munasinghe 2016).
Especially, the high unemployment rate among youths and the nature of its
continuation has multifaceted effects on the socio-economic structure in the Sri

Sri Lanka Economic Research Conference 2020
90
Lankan economy. At first, it shows the weak government operation as it fails to
utilise the productive human capital up to their fullest productive potential
decelerating the economic growth of the country.
Fig.1: A Framework to address youth unemployment
Secondly, it aggravates the intergenerational- poverty and amplifies to the
generations to come pestering poverty conditions of people. Thirdly, it causes the
loss of cultural and societal values, public safety and social capital due to
widening gap between the education and prospects for employment. Finally, it
may lead to inter-generational conflicts as young people discouraged by being
unemployed even after obtaining better formal qualifications than adults those
who have job permanency and have more wealth and better living conditions
(Hopenhayn, 2002). Hence, unemployment challenges policymakers to find a
sustainable solution for youth unemployment. Therefore, this paper is aimed at
analysing the state of unemployment in Sri Lanka and discusses the appropriate
policies and interventions to address this issue.

Decent Livelihood and Well-being
91
Research Problem
As illustrated by the Figure 01 above, a strategic approach to understand and
address the youth unemployment issue can be divided into two dimensions;
'supply-side' and 'demand-side'. While 'supply-side' approach focusses on the
individual causal factors including social networks, education and training
providers, Government, agencies and employers, 'Demand-side' approach
focuses on structural factors
targeted to intervene in the labour market, such as labour market opportunities at
entry-level, several apprenticeships and training, public sector jobs (Skattebol et
al. 2015).
Therefore, the major research question of this study is how demand driven and
supply driven interventions for reducing youth unemployment in Sri Lanka
formulated.
Objectives
As explained previously, it is important to address the youth unemployment
problem efficiently and effectively to take the economy into a sustainable
development path. As individual and structural factors effect on the level of youth
unemployment, a general solution will not make satisfactory reduction in the
youth unemployment. Therefore, policy interventions should be focused on both
supply side and demand side interventions. Hence, the major objective of this
study was to identify the major interventions to curb the higher youth
unemployment rate in Sri Lanka while analysing the individual and structural
factors of youth unemployment.
Methodology
This study provides an integrated approach of preventive and curative measure
by understanding two major undelaying causal factors of youth unemployment,
individual factors and structural factors, respectively. Further, the framework
focuses on two interventions; supply-driven and demand-driven approaches of
interventions.
The study is descriptive in nature thus detailed literature review was conducted
while graphs, charts and figures were employed in identifying the better
programmes for Sri Lankan context. Data for the study were mainly drawn from
various labour force surveys of Department of Census and Statistics.

Sri Lanka Economic Research Conference 2020
92
Results and Discussion
Its is important to show the behaviour of youth unemployment before discussing
the major policies and programme available for curbing it. According to the
Labour Force Survey Data of the Department of Census and Statistics, Sri Lanka
is recording a significantly lower rate of unemployment in the recent years
(Department of Census and Statistics, 2019). However, Figure 02 shows that the
youth unemployment rate is five times higher than the total unemployment rate
throughout the years.
Source: Department of Census and Statistics of Sri Lanka
Fig. 2: Youth Unemployment rate by gender (2010 – 2019)
Further, female youth unemployment rate is always greater than males.
Moreover, figure 02 shows that even though the unemployment rate is quite
stable in recent years, both male and female youth unemployment rates are
slightly increasing between 2011 and 2019.
Furthermore, Table 01 portrays that around one out of every four youths belong
to the NEET group in Sri Lanka. This increases up to one out of third for female
youth. NEET rate is significantly higher for female than male in recent Sri Lanka.
4.9 4 4 4.4 4.3 4.7 4.4 4.2 4.4 4.8
16.312.8 14 15.6 16.1 16.6 17.1
14.916.8 17.6
24.725 23.5
25.327.5 27.4 29.2
24.5
30 28.7
19.4
17.2 17.2
19.220.3 20.8
21.6
18.5
21.4 21.5
2010 2011 2012 2013 2014 2015 2016 2017 2018 2019
Unemplyment Rate Youth Unemployment Male
Youth Unemployment Female Youth Unemployment Total

Decent Livelihood and Well-being
93
Table 01: NEET rate (NEET group as a percentage to total youth) by gender,
2011-2019
Source: Department of Census and Statistics of Sri Lanka
There is no documented universal policy or intervention found in this case of
increasing demand for labour. However, countries individually attempt various
measures such as, recognising dominant potential sector and encourage them in
line with vibrant schemes including, policies on interest rates, exchange rates,
wage rates, taxation, that would have a significant impact on the growth of the
sector and labour demand. Further redirecting regulations over industries,
especially labour market deregulation, would have a significant impact over
labour demand. Most effective policies and interventions should be able to focus
on both supply and demand-side elements simultaneously.
Information on jobs and employers is essential to respond to the job market
failures. Establishing connections between young unemployed and employers
with updated information would be valid for the graduates. Nevertheless, this will
not have much impact over disadvantaged young who have not completed formal
education, and a more effective and sustained policy approach is needed.
There are several major actions taken by different economies as a remedial
measure for chronic youth unemployment which are discussed in detail in the
following sections.
Technical and Vocational Education programs
Vocational training education have had a significant impact on reducing
unemployment among youths (Zimmermann et al, 2013). Establishment of the
vocational and technological universities, technical schools and vocational
training centres have improved the attractiveness of vocational learning.
Nevertheless, to enhance the popularity and the effectiveness of the outcome of
these programmes, there should be shift in the Government role. The experience
of other economies shows that government should bring in the private sector to
deliver the training programmes rather than the government itself directly
delivering those vocational educational programmes. Students have to be given
Gender 2011 2012 2013 2014 2015 2016 2017 2018 2019
Male 13 12.7 17 17.6 16.3 17 14.8 14.4 13.3
Female 33.4 34.7 35.5 37.7 34.6 34.5 30.2 29 29
Overall 23.5 23.9 26.6 27.8 25.8 26.1 22.7 21.8 21.2

Sri Lanka Economic Research Conference 2020
94
access to these industry-led vocational courses and support them by providing
quality assurance and accreditation. Industry-led vocational and training courses
will satisfy the needs of the industry and will have a substantial impact over
employability. Similarly, regional Technical and Vocational Education and
Training (TVET) centres need to be connected with the local industries, which
will also have positive impacts on youth employment (UNDP, 2014)
The Proven Vocational training program in Uruguay is one of the successful
programs in this context. The program was supported by the Occupational
Training Fund, which was contributed by employers and workers as well as
partially by the government. Since both Government and employers managed the
program, training was well-liked the demand of the labour market (Godfrey,
2003). However, providing the responsibility to local authorities is important in
this situation, which would primarily reinforce to get formal jobs by
disadvantaged youths.
Levy –grant system
Levy-grant system is a successful intervention in the youth unemployment
reduction globally. In this system, job providers organise the training and pay for
training through a payroll tax. Industries can reimburse the expenses of the
training from the fund made-up with levied tax (Godfrey 2003). Unlike other
government subsidy program, which is uncertain with the change of the
government. The levy grant system (Skill development fund) prevailed in
Singapore, which is an industry-driven training fund program. Industries are
encouraged to have plans for training in skills with their requirements.
Nevertheless, with the introduction of these type of programmes there is a
tendency of using low skilled with lower salaries. However, through the fund
monitoring, industries that are found using low skilled workers in the low-wage
category for a long time have been penalised (Godfrey 2003). Hence, the two
essential needs of youths; skills development as well as wage regularisation have
been fulfilled simultaneously under this approach. However, these types of
progrmmes have been successful in United Kingdom, Japan and South Korea.
Training and development
Training systems repeatedly fail in reducing the unemployment in most of the
economies because of following two reasons. Firstly, young unemployed and
employed people do not have a proper idea on which skills to acquire and no
means of the financial source to pay for such training. Secondly, employers also
worry about the uncertainty of the return of the training they provide (World

Decent Livelihood and Well-being
95
Bank, 2007). However, providing a voucher for training to anyone who is
identified to be eligible for training is another policy recommendation for many
economies This system empowers disadvantaged youths to purchase training
from the open pool of resources and enhances the public and private competition
among training providers and thereby enhances the diversity of the field of
training providing at various levels of difficulty (Godfrey 2003). However, in this
situation the government should ensure that the content of the training match with
the current labour market.
Encouraging Self-employment (Entrepreneurship)
Many economies have implemented various programs to enhance the self-
employment as a remedy for youth unemployment. Those programs aim to
motivate youths to start self-employment in small scale and make aware them on
available financial support schemes (Caponiy 2014). However, the Governments
should focus on facilitating the growth of the production sector and wage
employment, which is a powerful mean to make structural change in the labour
market.
Conclusion
According to the literature, there are multiple interest parties in the private and
non-governmental sectors implementing numerous initiatives to address the
unemployment issue, which do not get highlighted and failed to make any
significant impact because of duplication and overlapping of programs. Hence, it
is important to bring the structural changes in the system by establishing a
network among public, private and regional actors. Government of Sri Lanka has
published many policy documents, including the National Action Plan for youth
employment, proposed various reforms strategies in the education sector.
Therefore, rather than repeating those policies here, it is better to urge the
government to implement those policy programs effectively and minimise the
disparity in implementation based on gender, ethnicity, and religion.
Furthermore, the primary attention for policy measures should be given to
enhance the demand for labour and ensure that youths acquire required
knowledge, literacy and skills.
For this, leavy grant system can be recommended as one of the best solutions for
curbing the chronic youth unemployment in Sri Lanka as this will provide the
industry needed trainings and skills to the young workers and the provision of the
training is both demand and supply driven. A Vocational Training Fund should
be established via a training tax imposed on established industrial organizations

Sri Lanka Economic Research Conference 2020
96
and this money should be directly linked to the Vocational Training Fund.
However, it is important to note here that precautionary measures should be taken
to avoid using the leavy grant system as a way to law wage employment scheme.
References
Caponiy, V. (2014) Public Employment Policies and Regional
Unemployment Differences, Regional Science and Urban Science, 63, 1-13.
Department of Census and Statistics. (2019). Sri Lanka Labour Force Survey Annual
Report – 2018, Deparment of Census and Statiscs, Colombo, Sri Lanka.
Godfrey, M. 2003. Youth Employment Policy in Developing and Transition Countries –
Prevention as well as Cure. World Bank, Washinton DC.
Government of Sri Lanka. 2012. The National Human Resources and Employment Policy
for Sri Lanka. Secretariat for Senior Ministers, Government of Sri Lanka,
Colombo, Sri Lanka
Gunathilaka, R. 2013. Women's Participation in Sri Lanka's Labour Force: Trends,
Drivers and Constraints. International Labor Organization, Colombo, Sri Lanka.
Hopenhayn, M. 2002. Youth and Employment in Latin America and the Caribbean:
Problems, Prospects and Options. In Youth Employment Summit, 10. Alexandria,
Egypt,: Economic Commission for Latin America and the Caribbean (ECLAC)
Munasinghe, D. G. S. G. 2016. Annual Report of the Sri Lanka Labour Force Survey,
2016. In Sri Lanka Labour Force Survey, Department of Census and Statistics,
Colombo, Sri Lanka.
Skattebol, J., T. Hill, A. Griffiths & M. Wong. 2015. Unpacking Youth Unemployment.
Social Policy Research Centre, Ssydney, Australia.
UNDP, 2014, Sri Lanka National Human Development Report 2014. Sri Lanka: United
Nations Development Programme, Colombo, Sri Lanka.
World Bank. (2007). International experience on youth employment interventions: The
youth employment inventory. World Bank, Washington DC.
Zimmermann, K. F., Biavaschi, C., Eichhorst, W., Giulietti, C., Kendzia, M. J.,
Muravyev, A., Pieters, J., Rodr´ıguez-Planas, N. and Schmidl R. (2013)., Youth
Unemployment and Vocational Training, Foundations and Trends in
Microeconomics, Vol. 9, Nos. 1–2, IZA.org

97
Disciplined, Dynamic Financial
Strategies

Sri Lanka Economic Research Conference 2020
98

Disciplined, Dynamic Financial Strategies
99
SIGNIFICANCE OF BLACK-SCHOLES MODEL: WITH
REFERENCE TO NIFTY-50 INDEX CALL OPTIONS
Hewamana H.M.R.R.
Department of Banking and Finance, Wayamba University of Sri Lanka
Introduction
An effective security trading market provides three principal opportunities;
trading equities, debt securities and derivative products (Kumar & Agrawal,
2017). Derivatives become popular financial instrument due to the development
of the financial sector. Currently, derivatives are worth 600 trillion in the entire
world.
“Derivatives are Financial Instruments whose returns are derives from those of
other Financial Instruments” (Chance & Brooks, 2015). This “Other Instrument”
is called as an underline asset. Underline asset can be either a Real Asset
(Agricultural Commodities/ Metals/ Source of Energy) or a Financial Asset
(Stock/ Currencies/ Bonds/ Loans).
If a derivative instrument has financial underlining asset, it is called as a Financial
Derivative. There are different types of financial derivatives such as Options,
Forwards, Futures, SWAPS and etc. Among them options are very popular
financial derivative. “An option is a contract between two parties, a buyer and a
seller that gives the buyer the right, but not the obligation to purchase or sell
something at a later date at a price agreed upon today” (Chance & Brooks, 2015).
There are two basic types of options, call options and put options. In a call option
buyer has the right to purchase the underline on a future date at a price agreed
upon today. Call options are popular instrument for Risk Managing & Return
Generation due to the lower initial investment than traditional investments.
Option traders seek correct information with regarding to the securities and
market. The price of the option is playing a major information role in investment
decision making. But the problem is that the option price base on the future
uncertain cash flows. The performance of a derivative trader heavily depends on
the level of the accuracy of the future outcomes and the selection of the correct
model to predict the future price. Therefore, correct intrinsic value provides major

Sri Lanka Economic Research Conference 2020
100
information for better investment. Binomial and Black-Scholes Model (BSM) are
popular valuation methods among the investors and traders.
The NIFTY 50 is a diversified 50 stock index accounting for 12 sectors of the
economy in the India. It is used for a verity of purposes, such as benchmarking
fund portfolios, index-based derivatives and index funds. NIFTY 50 is an ideal
index for derivatives trading. This study tries to find the relevancy of BSM
valuation model in NIFTY 50 index call options.
Research Problem
Without having the correct intrinsic value of an option contract, it is hard to use
for trading or risk management decisions. Most of traders are using quantitative
methods, like BSM and Binomial model. Sometimes there may have several
qualitative methods as well (Subjective decisions based on traders’ experience).
There is no any universal accepted method for valuing on options contracts.
Choice of selecting a valuation method is upon the investor or trader knowledge
& experience.
The Binomial Model and the Black Scholes Model are the popular methods that
are used to solve the option pricing problems. Binomial Model is a simple
statistical method and Black Scholes model requires a solution of a stochastic
differential equation.
Fischer Black and Myron Scholes (1973) stated that the actual options prices
deviate in certain systematic ways from the values predicted by the formula.
Option buyers pay prices that are consistently higher than those predicted by the
formula. Option writers, however, receive prices that are at about the level of
predicted by the formula. There are large transaction costs in the option market,
all of which are effectively paid by option buyers. The difference between the
price paid by option buyers and the value given by the formula is greater for
options on low-risk stocks than the options on high-risk stocks.
However, some researches show that discrepancies between the market option
prices and prices calculated under the Black-Scholes model are not large enough
to be exploited. LauterBach and Schultz (2012) on pricing warrants, Jordan and
Seale (1986) and Blomeyer and Boyd (1988) on futures options written on
treasury bond have suggested that there is a very little difference between the
market actual price and the Black-Scholes predicted price. Bailey (1987) studied
on future option written on gold, Shastri and Tandon (1986) on Future (American
options), and Jordan, Seale, McCabe and Kenyon (1987) on futures options

Disciplined, Dynamic Financial Strategies
101
written on soyabean have found discrepancies are not enough in the model
predicted. Therefore, it is important to identify the efficiency of the BSM model
for predicting the option intrinsic price. Because proper valuation will result the
expected outcome at the end of the investment horizon.
Methodology
This study uses time series secondary data, which are spanning from 31/01/2020
to 18/03/2020. It was removed all non-trading option data by considering the
turnover value of respective days. The day end “Settle Price” has been considered
as the proxy for “Trading Price” of each contract. The trading price was compared
with the calculated intrinsic price by using the “Person’s Correlation” test.
Accordingly, the researcher analyzed and refined the research problem in to the
following model framework.
Figure 1: Conceptual Framework
The core function of this research is the calculation of intrinsic price. Basically,
it was calculated the intrinsic price without dividend yield and with the dividend
yield. Therefore, following basic formulas has been taken for without dividend
yield price.
𝑑1 =𝑙𝑛 (
𝑆0𝑋 ) + 𝑡 (𝑟 +
𝜎2
2 )
𝜎√𝑡
𝑑2 = 𝑑1 − 𝜎√𝑡
𝐶 = 𝑆0 ∗ 𝑁(𝑑1) − 𝑋𝑒−𝑟𝑡 ∗ 𝑁(𝑑2)
Conversely, only “𝑑1” and “𝐶” value have an impact from the dividend yield of
the underlying asset.
Theoretical call option
price generated from
the BSM
Market price of call
option in NIFTY 50
Index

Sri Lanka Economic Research Conference 2020
102
𝑑1 =𝑙𝑛 (
𝑆0𝑋
) + 𝑡 (𝑟 − 𝑞 +𝜎2
2)
𝜎√𝑡
𝐶 = 𝑆0𝑒−𝑞𝑡 ∗ 𝑁(𝑑1) − 𝑋𝑒−𝑟𝑡 ∗ 𝑁(𝑑2)
The Mumbai Inter-Bank Offer Rate (MIBOR) was considered as a proxy for risk-
free rate. Because MIBOR represents the average lending rate of the Indian
Financial System.
To calculate the index volatility, the daily volatility rate was taken after convert
it into an annual rate. This annualized Standard Deviation has been computed
based on the historical price of the Nifty-50 for the 30 days immediately
preceding the day of the selection of an option. Moreover, researcher tried to find
the impact on the compounding frequency of the volatility rate of the underlying
asset by considering the continues and annual compounding frequency.
Findings
Following table shows the correlation coefficient values of three types of
calculated intrinsic prices with respect to the market price.
Table 1: Results of Correlation Analysis
Intrinsic Price
without
Dividend Yield
Intrinsic Price
with Dividend
Yield
Intrinsic
Price with
Continues
STD
Market
Price
Pearson’s
Correlation 0.939314 0.939858 0.979516
Source: Authors’ estimation
It can be clearly seen that the dividend yield has a less impact on the accuracy of
the option valuation base on BSM model. But continues compounding volatility
rate has a significant impact on the accuracy rate. However, all three calculated
methods show that the BSM model significantly provides the correct market price
at the rate of more than 90%.

Disciplined, Dynamic Financial Strategies
103
Conclusion
According to this study, option traders and participants can use the BSM as a
good valuation model to forecast the price of the call options in Nifty 50 Index.
But researcher recommends that not totally depend on a single valuation model.
Rather than it is recommended to use the BSM model with some subjective
adjustments base on the trader’s experience on underling asset. Dividend yield
has a less impact on the accuracy of BSM outcome in Nifty 50 Index call options.
Among the input variables in BSM, continues compounding volatility plays a
vital role to provide more accurate price predictions.
Apart from the basic research problem, the researcher has observed that there is
a price anomaly in Nifty 50 Index call options. Because, there were higher no of
tradings occurred during the first two or three days of each month. But that was
just an observation and future researchers should be conducted to test that
anomaly.
Keywords: Call Options; Option Pricing Models; Black-Scholes Model; Index
Options; Nifty-50 Index
References
Black, F. and Scholes, M. (1973) “The pricing of options and corporate liabilities”,
Journal of Political Economy, Vol. 81, No. 3, pp.637–659.
Sudhakar A. and Srikanth P. (2016), “Analysis of The Efficacy of Black scholes Model -
An Empirical Evidence from Call Options on Nifty-50 Index”, Pacific Business
Review International, Vol. , No. 5, pp.94–102.
Srivastava, A. and Shastri, M. (2018), “A study of relevance of Black-Scholes model on
option prices of Indian stock market”, Int. J. Governance and Financial
Intermediation, Vol. 1, No. 1, pp.82–104.

Sri Lanka Economic Research Conference 2020
104
E-TRUST, INNOVATION AND USE OF FINTECH DRIVEN
BANKING PRODUCTS AND SERVICES AMONGST THE
UNIVERSITY STUDENTS
Nayanajith, D. A. G.
University of Kelaniy, Sri Lanka.
Introduction
E-banking services are vulnerable to disruption owing to continuous innovative
technological advancements. However, in the long run, fintech developments
have the potential for cost optimization and risk mitigation. Artificial Intelligence
(AI), big data, Robotic Process Automation (RPA), open banking applications
and blockchain technology usage is frequent in the financial services industry,
recently. AI is used to provide insights on customer behavioral patterns and
accommodates banking and financial institutions to understand evolving
customer necessities enabling to cater them proactively. Chatbots are another AI-
driven sophisticated fintech tool that banks have commenced to use to uplift the
status of e-customer service. Big data is being used to predict client investments,
market changes and supports the creation of novel strategies and portfolios
specially in investment banking operations. RPA is used to replace performing of
manual tasks that often are repetitive and completed as routine functions.
Alongside many fintech developments, blockchain was developed for finance
purposes and thus has direct nexus to financial institutions. Banking regulator of
Sri Lanka has already initiated fintech regulatory sandbox operations in view of
promoting fintech banking services and maintaining regulatory standards,
simultaneously (CBSL, 2019).
Research Problem
Most of the leading commercial banks are providing chatbot services, open
banking facilities and introduced blockchain based financial products
(Commercial Bank PLC, 2020; HNB PLC, 2020; Sampath Bank PLC, 2020).
However, acceptance of e-commerce and such innovative digital financial
products and services, is not at a higher degree, although banks have addressed
e-security and privacy concerns satisfactorily to retain public trust on e-services
(CBSL, 2020; Hootsuite, 2020). Therefore, this study mainly pursues to analyze

Disciplined, Dynamic Financial Strategies
105
the effect of e-trust (ET) and innovation (INNOV) towards use of fintech driven
banking products and services (UFBPS).
Objectives
Primarily, to identify the effect of ET towards UFBPS. Secondly, to examine the
effect of INNOV on UFBPS. Finally, to identify the interaction effect of, INNOV
and Motivation (M) towards INNOV on UFBPS (as demonstrated below,
perceived ease of use and perceived usefulness were used as motivators towards
INNOV since those two have been identified as determinants towards adoption
of innovative services such as fintech driven baking services).
The conceptual model was formulated as an adapted model relating to the
Technology Acceptance Model (TAM), Diffusion of Innovation (DOI) and
Commitment Trust Theory (CTT).
Figure 1: Conceptual model
Trustworthiness, Perceived Ease of Use (PEOU) and Perceived Usefulness (PU)
are several influential factors that explain the e-banking adoption and diffusion
of the e-services (Al-Sharafi et al., 2016; Nayanajith et al., 2019). Similarly,
constructs of innovation aspect such as relative advantage, compatibility
simplicity etc. have been identified as significant towards the acceptance of
innovative financial services (Ewe et al., 2015; Nayanajith et al., 2019).
Researches on the adoption of blockchain technology from business managers’
perspective and online banking adoption have used PU, PEOU and innovation
variables. Several studies on mobile banking and cloud computing contexts, have

Sri Lanka Economic Research Conference 2020
106
examined the role of PU, PEOU on technology adoption (Alalwan et al., 2017;
Asadi et al., 2017; Lou & Li, 2017). In view of the aforementioned facts following
hypotheses were proposed,
H1-ET predicts UFBPS
H2-INNOV predicts UFBPS
H3- Interaction of INNOV and Motivation (M) towards INNOV, predicts UFBPS
Methodology
Deductive methodology and quantitative methods were used aligning to the
ontological and epistemological stances. Respondents of this present research
were the students of the University of Kelaniya (UoK) whom are patronizing
fintech related banking products and services offered by the selected private
commercial banks. Respondents were selected on random sampling method as
per registration numbers. 287 duly completed returned questionnaires were
considered for the final data analysis. Ensured reliability and necessary steps
were taken to address concerns on validity of the questionnaire, prior to finalizing
the questionnaire.
Results and Discussion
The socio-demographic characteristic such as age, gender, income, education
factors of the sample replicates the population (for the purpose of generalization
of research findings) as per the initial data analysis of the study that was
commenced using the IBM SPSS 20 package.
Results of Hierarchical Linear Model (HLM) with level 2 variable which is the
bank, considers the covariation within banks by including the hierarchical data
structure and assumes that intercepts vary across banks. Chi-square change (-2LL
change) = -4.83 - -69.97 = 65.14, df change = 5-4 = 1, chi-square critical values
with 1 df is 3.84 (p < .05) and 6.63 (p < .01); Therefore, noted that the intercepts
for the relationships between INNOV and UFBPS (controlling for ET) vary
significantly across the different banks.
Subsequently, random intercept was included to the model and it has changed
log-likelihood significantly; fit of the model has significantly improved,
considering 5 percent significance level

Disciplined, Dynamic Financial Strategies
107
Consequently, check to identify whether the slopes and intercepts are correlated
(or covary) and results shown that Chi-square change is significant and model fit
has been improved, at 5 percent significance level.
Subsequent HLM analysis with the addition of M and interaction (M*INNOV)
demonstrated that, Chi-square change is significant at both 1% and 5% levels; fit
has been improved, at this stage INNOV is significant, p = .03, ET is also
significant, p = .00, M significant, p = .04, INNOV x M also significant, p = .00,
regression coefficient of INNOV = .43, All predict UFBPS supporting all the
three hypotheses of the research. The interaction term is important, as it shows
the effect of M for INNOV, taking account of whether or not the respondent had
INNOV concern (Table 1).
Table 1: HLM with the addition of motive and interaction
Parameter Estimate Std. Error df t Sig. 95% CI
LB UB
Intercept 1.877 .2611 17.90 7.19 .000 1.3289 2.4267
INNOV .4258 .1489 5.13 2.85 .034 .0461 .8055
ET .5716 .0241 283.43 23.66 .000 .5241 .6192
M .1532 .0776 280.25 1.97 .049 .0004 .3060
INNOV* -.219 .0455 280.08 -4.83 .000 -.3095 -.1303
Source: Nayanajith (2020)
Enabling thorough understanding of interaction effect further for practical
application (in addition to the empirical evidences in support of hypothesis three),
following was observed as per the Table 2. For the respondents those with
INNOV concern considering PEOU, INNOV did not predict UFBPS
significantly, b = .11, p =.42. The positive gradient showed that in such persons,
UFBPS is higher after the INNOV compared to the control group. For those who
had INNOV aspect considering PU also, INNOV did not predict UFBPS, b = -
.06, p =.83 in this particular research context. However, the slope was negative,
indicating that individuals who had INNOV considering PU, scored lower on
UFBPS, than the ones who did not have INNOV concerns (although this is not
significant). The interaction effect, reflects the difference in slopes for INNOV
as a predictor of UFBPS in those who had INNOV considering PEOU (a slight
positive slope) and those who had INNOV considering PU (a slight negative
slope). In conclusion it could be noted that UFBPS, after controlling for ET, was

Sri Lanka Economic Research Conference 2020
108
lower for those who demonstrates INNOV consideration in view of PU than those
who displaying INNOV aspect considering PEOU. For those who had INNOV
concerns considering PEOU, the use of innovation has perhaps added ease of use
and their usage increase while those who had innovation considering PU, would
have understood that usefulness was not the cause for them, and their respective
UFBPS is comparatively lower.
Table 2: HLM rerun results separately for 2 different Ms
INNOV considering PEOU
Parameter Estimate Std.
Error
df t Sig. 95% CI
LB UB
Intercept 2.323 .2386 9.99 9.73 .000 1.7917 2.8551
INNOV .1138 .1258 3.94 .90 .417 -.2373 .4649
ET .5258 .0276 187.69 19.02 .000 .4713 .5804
INNOV considering PU
Intercept 3.188 .3639 27751.58 8.76 .000 2.4751 3.9016
INNOV -.063 .2906 27095.49 -.21 .828 -.6326 .5065
ET .3277 .0089 91.127 36.71 .000 .3099 .3454
Source: Nayanajith (2020)
Conclusion
Empirical findings have supported all the three hypotheses aligning to findings
of previous studies conducted in different contexts (Asadi et al., 2017; Meyliana
& Fernando, 2019; Stewart & Jürjens, 2018). Study was restrained only to UoK
students and it is a limitation of the research. Nevertheless, findings of the
research could be used by the commercial banks and fintech application
developers in view of enhancing the fintech banking use in Sri Lankan context.
Banks can facilitate workshops on usage of fintech products and services, with
special reference to relative advantages, simplicity, e-security, and privacy,
enabling to strengthening the customers’ perceptions on e-trust and innovation
expectations that will positively influence acceptance of such products and
services for a mutually rewarding relationship. Originality of the research is
application of particular hierarchical/multilevel linear model analysis and
incorporation of the technology acceptance model, diffusion of innovation and
commitment trust theory in a consolidated framework. Seeking diverse findings
in different contexts, researchers could adopt different models and perspectives
to address particular research problems in relation to fintech banking.
Keywords: Banking; E-Trust; Fintech; Innovation; Sri Lanka

Disciplined, Dynamic Financial Strategies
109
References
Alalwan, A. A., Dwivedi, Y. K., & Rana, N. P. (2017). Factors influencing adoption of
mobile banking by Jordanian bank customers: Extending UTAUT2 with
trust. International Journal of Information Management, 37(3), 99-110.
Asadi, S., Nilashi, M., Husin, A. R. C., & Yadegaridehkordi, E. (2017). Customers
perspectives on adoption of cloud computing in banking sector. Information
Technology and Management, 18(4), 305-330.
Central Bank of Sri Lanka. (2020). Road Map: Monetary and Financial Sector Policies
for 2020 and Beyond. Retrieved from
https://www.cbsl.gov.lk/en/Press/Media/Speeches
Ewe, S. Y., Yap, S. F., & Lee, C. K. C. (2015). Network externalities and the perception
of innovation characteristics: mobile banking. Marketing Intelligence &
Planning, 33(4), 592-611.
Gayan Nayanajith, D. A., Weerasiri, R. A. S. & Damunupola, K.A. (2019). “A Review
on E-Banking Adoption in the Context of E-Service Quality.”, Sri Lanka Journal
of Marketing, 5(2), 25-52.
Lou, A. T., & Li, E. Y. (2017, December). Integrating Innovation Diffusion Theory and
the Technology Acceptance Model: The adoption of blockchain technology from
business managers’ perspective. In International Conference on Electronic
Business (Vol. 12, No. 4, pp. 299-302).
Meyliana, M., & Fernando, E. (2019). The Influence of Perceived Risk and Trust in
Adoption of FinTech Services in Indonesia. CommIT (Communication and
Information Technology) Journal, 13(1), 31-37.
Nayanajith, G., Damunupola, K. A., & Ventayen, R. J. (2019). User Intentions and
Actions Towards Adoption of Technology Based Self-Service Banking Services:
A MANOVA Analysis. Southeast Asian Journal of Science and Technology, 4(1),
81-88.

Sri Lanka Economic Research Conference 2020
110
CONTRIBUTION OF LOTTERY INDUSTRY ON
SRI LANKAN ECONOMY
Kurundukumbura, K.T.A.*, Dunusinghe, P.
Department of Economics, University of Colombo, Sri Lanka *Corresponding author: [email protected]
Introduction
Lotteries are the oldest and most common form of gambling that has a long
history. Lotteries appeared in Han Dynasty of China in 02nd century mainly as a
means to raise public finance for the state. Major state projects like “Great Wall
of China” has developed by the help of lottery finance (Perez, & Humphreys,
2012). The ‘Gymkhana Lottery’ which was based in Galle area is considered to
be the origin of lotteries in Sri Lanka. However, it was not an initiative under the
auspices of the Government. The first lottery in Sri Lanka is considered to be the
‘Hospital Lottery’ which was launched under the “Hospital Lottery” Act No 04
of 1955.
Lotteries are exceptional for variety of reasons. First, lotteries represent formal
economic contribution such as important source of government revenue
generation, taxation, some effects of economic growth, gross domestic products
and formal employment opportunities. Second, lotteries represent informal
economic contribution that poverty reduction, generation of informal
employments and create livelihood to people in larger extend in Sri Lanka.
As an important source of government revenue in all over the world, lotteries
have been broadly investigated by the public finance researchers targeting
basically on the revenue potential and beneficial as a method of taxation. Further,
lotteries are unlikely to be able to contribute some percentage to the national
government revenue (Humphreys & Matheson, 2012; but see, Grote & Matheson,
2011) and it generally exceed the tax collection of tobacco and alcohol (Grote &
Matheson, 2011).
Lotteries are the largest livelihood development activity for the vulnerable groups
in society in Sri Lanka and contribute to overall economic growth. The lottery
industry has been an integral part of the livelihood development in Sri Lanka for
over 50 years. It had been a sunset industry in Sri Lanka, which was transformed
from helpless, vulnerable and differently able people to social accepted self-
employment opportunities. With the global community entering a new era in

Disciplined, Dynamic Financial Strategies
111
terms of growth prospects through sustainable development goals. The
differently able people are now receiving attention.
In present a heterogeneous group of people involve as lottery agents, sellers and
sub-sellers. It could almost conceptual like as pyramid where top most represent
the government and the Lotteries Boards. The bottom consists a divergent group
of people finally sell lotteries to the customers In addition to achieve sustainable
development goals and employment opportunities, the contribution of lottery
sellers towards the Sri Lankan economy is significant in areas such as poverty
reduction, business promotion and rural and socio economic development.
Developing livelihood of lottery sellers can help to generate financial prospective
and achieve sustainable development goals through lottery industry.
Lotteries are generating public revenue which consists one third of the total
revenue and allocated near half of the revenue for prizes which represent upper
segment of the pyramid. Finally, contribution for lower segment of the pyramid
consists one fifth of the total revenue. Government is in a position to collect
money from the public through lotteries and distribute through treasury for the
public welfare perspective. Evidence suggests that there is an expansion and
popularity of government lotteries due to several objectives of the government
such as lottery gambling as entertainment, create jobs, and generate revenues and
economic development (Bjelde, Chromy & Pankow, 2008).
Lottery sellers are played very important role for economic development of the
country. It was not investigated properly so far. The proposed study is focused
on this existing vacuum in the literature. The present study will investigate and
highlight the economic contribution of lotteries. Some researchers that have been
done related the economics of lotteries and, informal economy and street vendors,
but it is not significantly seen the effectiveness of lotteries to improve the
economic development an empirical context as well as it has not been examined
in depth in previous researches. So, the problem of this study is to “What is the
contribution of lottery industry on Sri Lankan economy?
Objective of the study
The main objective of this study is to evaluate the contribution of lottery industry
on Sri Lankan economy. Further, it attempts at exploring future research
directions.

Sri Lanka Economic Research Conference 2020
112
Literature Review
Lottery is a game, a form of gambling, often organized by the state or charity in
order to make money, in which tickets with random numbers, to determine the
winner of a prize (Perez, & Humphreys, 2013). But John (1998), argued that
lotteries have some unique features and different from other gambling products
which lottery players spend a small amount of money to win a large supper prize.
According to the literature, efficiency of lottery generate revenue is arguable.
Firstly, the lottery participation is voluntary and it is some different form of
taxation and the government actually produce a consumption good and then
taxed. The production of consumption good develop welfare even if dead- weight
loss is generated when the product is taxed (Farrell & Walker, 1997; but see,
Grote & Matheson, 2011). According to the Livernois (1986) lottery participation
is totally voluntary activity since lottery expenditure substitute for spending
elsewhere in the economy. So, generation of untaxed lotteries create welfare and
taxation levels of lotteries directly reduce the welfare compared to other taxation
methods (Rodgers & Stuart, 1995).
Aside from create government revenue as tax, there is high dead- weight loss of
lottery tax because of the high administrative cost (Mikesell & Zorn, 1988) and
advertising cost (Heberling, 2002). Generally administrative expenses are
comparatively high in lottery industry. So, the industry experiencing economies
of scale and, the administrative cost can be reduced by increasing sales and
resource allocations (Johnson & Mixon, 1995). However, the lottery revenue has
changed in a larger extend year by year, so the variation of lottery revenue is
negative relationship with changes of other revenue sources of government.
Because lottery revenue is part of the government tax system but it reduces the
volatility of government incomes (Humphreys & Matheson, 2012).
While governments enhance the lottery system to encourage the lottery buyers
(Landry & Price, 2007) and continuously generate profits from lotteries.
According to the Grote and Matheson (2008), U.S. lotteries in a larger extend and
specially U.K. lottery, earmarked full or part of the revenue for specific projects
such as education programs. Fungibility of lotteries have centered an educational
spending find that the government lottery increases total educational purpose
spending by less than the value of the new earmarked lottery revenue, proposing
at least some percentage of fungibility is accept when reserves are earmarked for
specific programs (Grote & Matheson, 2011).

Disciplined, Dynamic Financial Strategies
113
According to the findings of several studies done by the Borg & Mason (1990),
Garret (2001), education purpose spending in governments that acquire
earmarked lotteries for education purpose fails to improve in educational purpose
spending even with other lottery savings. Further, lottery reserves earmarking to
education purpose have a crucially bottom level of spending per person.
Therefore, researcher found that lotteries play significant role of revenue to
education, but lawmakers should redirect common fund resources away from
institutions and leading to a secondary indication of fungability (Borg, Mason &
Shapiro (1991) but see: Grote & Matheson 2011).
However, Land and Alsikafi (1999) identified that government allocation to
educational purposes in some of the governments drop after the introduction of
earmarked lotteries. Erekson et al (2002), in their study on “Fungibility of lottery
revenues and support of public education” identified that educational expenses as
a percentage of general revenue go down as per capita of lottery revenues rise,
experiencing the fungibility. For instance, there is a drop of nearly 1- 1.5. Percent
of education purpose savings available from every 1 $ per capita in lottery
revenues created as funding for a government. Further, Forrest & Simmons
(2003) identified that earmarked lottery reserves for development of sports U.K.
increase whole spending on sports purpose but marginally decease other state
spending on athletics (Evans & Zhang, 2007).
Figure1. Conceptual framework
According to the conceptual model built at the end of literature review following
hypothesizes were derived.
Government
Revenue
Gross Domestic
Products
- Social class
Employment
Opportunities
Lottery Revenue

Sri Lanka Economic Research Conference 2020
114
H1: Lottery Revenue has a significant impact on Government Revenue.
H2: Lottery Revenue has a significant impact on Gross Domestic Products.
H3: Lottery Revenue has a significant impact on Employment Opportunities.
In order to test above hypothesis, it was decided to perform Regression Analysis
which helps to understand whether Government Revenue (Y) can be predicted
based on Lottery Revenue (X), Lottery Revenue (X) effects to the Gross
Domestic Products (Y) and Lottery Revenue(X) directly influence to the
Employment Opportunities (Y) using the last ten years set of data. It was also
required to determine the variance explained of the model and relative
contribution of each of the predictors to the total variance explained.
Suggested model was
Lottery Revenue = 𝛽0 + 𝛽1 Government Revenue + 𝛽2 Gross domestic Products
+ 𝛽3 Employment Opportunities.
It was required to estimate the parameters 𝛽0, 𝛽1 , 𝛽2 and 𝛽3 using the available
data set.
This study is based on the secondary data which gathered analyzing existing
literature in terms of published journal articles and books, conference papers,
government publications, annual reports, internal reports of Lotteries Boards and
other publications available in the internet.
Results and discussion
In Sri Lankan lotteries industry is comprised only with two players; National
Lotteries Board (NLB) and Development Lotteries Board (DLB). Hence, the
market becomes duopoly and amidst dynamics in micro and macro environments
these two entities have been remain competitive by fulfilling their reason to the
establishment of raising funds for the socio-economic development.
Accordingly, following table clearly depicts that, lottery industry generates
considerable amount of revenue from the year 2011 and it has continuously
increased with the government revenue. Further, lottery contribution as a
percentage of government revenue had increased in year 2012 (0.37%) and
continuously decline to year 2017 (0.14%) and then it has increased to 0.26
percent in year 2019.

Disciplined, Dynamic Financial Strategies
115
Table 01 Lottery Revenue and Contribution as a % of Government Revenue Year 2011 2012 2013 2014 2015 2016 2017 2018 2019
Gov. Rev.(Rs
Bn)
983 1067.5 1153 1204 1460 1694 1840 1932 1899
Lottery Rev.
(Rs Bn)
16.47 20.58 24.36 24.64 28.65 34.35 30.08 35.84 39.88
Lottery Rev. as
a % of Gov.
Rev.
1.68% 1.93% 2.11% 2.05% 1.96% 2.03% 1.63% 1.86% 2.10%
Lottery contb
_n (Rs Bn)
2.72 3.92 3.72 3.82 3.61 3.92 2.52 4.61 5.06
Lottery cont. as
a % of Govt.
Rev.
0.28% 0.37% 0.32% 0.32% 0.25% 0.23% 0.14% 0.24% 0.26%
Source: Central Bank Reports (2011-2019) and Annual Reports (2011- 2019), Ministry
of Finance
When considering the lottery revenue as a percentage of GDP, it has continuously
depicted Between, 0.25 percent to 0.28 percent in last nine years. Because lottery
revenue has increased year by year compared to GDP. Further value addition as
a percentage of GDP also depicts nearly value of 0.05% in last nine years. That
means lottery industry has continuously add value compared to the GDP year by
year.
Source: Central Bank Reports (2011-2019) and Annual reports (2011-2019), Ministry
of Finance
Figure 2: Lottery Revenue & Value Addition as a percentage of GDP
0.00
0.05
0.10
0.15
0.20
0.25
0.30
0.35
Lottery Revenueas a % of GDP
Value additionas a % of GDP

Sri Lanka Economic Research Conference 2020
116
Employment opportunities
A sizable number of workers engage in lottery selling activities in the labour
market partly due to lack of educational and experience qualifications. Among
the informal sector street vending activities are one of the major components in
the informal economic activities. As a result, in large extend the vulnerable
groups are engaging street vending activities such as lottery selling.
Lottery sellers have combined as a part of urban economics in majority of the
countries and it provides employment opportunities for vulnerable people in rural
areas. Poor people engage in lottery selling and struggle to solve their problems
and survive the dependent family members through limited available resources
rather than other group of the society who demand for the government to create
employees for them or not engage in begging or any anti- social practices.
Lotteries are going on long period of time but still livelihood of lottery sellers are
no one valued so far. In year 2020, there were 17,000 lottery retailers, 3,062
lottery agents and 80 district dealers with in the country other than the 800
lotteries Board’s employees.
Conclusion
This research study evaluates the contribution of the lottery industry on Sri
Lankan economy. Also, it provides an insight of how lottery revenue contributes
to national economy, lottery revenue as a percentage of government revenue and
GDP, value addition of lottery industry as a percentage of GDP, and employment
opportunities. NLB has been continuously facing declining market share whilst
the DLB has been gradually increasing the market share. That means, from year
2014 onwards DLB has been strategically attacking to capture the market while
the process has been expedited in year 2017 marginal drop down in year 2018.
Hence, from year 2014 onwards it is clearly seeing DLB takes upward trajectory
on its market share. By year 2014, Lottery industry had been able to keep abreast
with the industry growth or to be almost par with it. However, in year 2017 the
industry experienced a decline the market growth mainly due to price increment
for lottery ticket in twenty rupees to thirty rupees. In year 2018 NLB, it has been
able to record a highest net profit for the last five years. Further NLB had been
able to achieve a significant net profit in year 2017 and, which almost a doubled
net profit is with compared to the DLB.
Keywords: Contribution; Economy; Lottery

Disciplined, Dynamic Financial Strategies
117
References
Bellringer, M., & Abbott. M. (2008). Lotteries literature review: Final report. Paper
prepared for New Zealand Lotteries Commission. Retrieved on 11th February,
2017, from https://nip hmhr. aut.ac.nz/__ data/assets/pdf_file/0019/7570/final_
report_ January_ 2008. Pdf
Central bank of Sri Lanka. (2019). 2019 annual report of the Central Bank of Sri Lanka.
Retrieved from https://www.cbsl.gov.lk/en/publications/economic-and-financial-
reports/annual-reports/annual-report-2019
Grote, K., & Matheson, V. A. (2011). The Economics of Lotteries: A Survey of the
Literature. Faculty Research Series, College of Holy Cross, 11, 9. Retrieved form
file:///C:/Users/USER/AppData/Local/Temp/The_Economics_of_Lotteries_A_S
urvey_of_the_Literat.pdf
Ministry of Finance Sri Lanka. (2019). 2019 annual report of the Ministry of Finance.
Retrieved from
https://oldportal.treasury.gov.lk/documents/10181/12870/Annual+Report+2019
Perez, L. & Humphreys, B. (2012). The ‘who and why’ of Lottery: empirical highlights
from the seminal economic literature. Journal economic survey. 27 (5), 915-940.

Sri Lanka Economic Research Conference 2020
118
FORECASTING EXCHANGE RATE AND MODELLING
THE RELATIONSHIP BETWEEN EXCHANGE RATE AND
CURRENCY IN CIRCULATION IN SRI LANKA
Perera D.F.S.N.*, Lakshika B.H.H., Sanjeewani D.S., Chanika P.A.L.,
Chandrasekara N.V.
Department of Statistics & Computer Science, University of Kelaniya, Sri Lanka
*Corresponding author: [email protected]
Introduction
The currency value of a country with respect to another country can be considered
as an exchange rate and higher valued currency leads imports to be less
expensive. The currency in circulation refers to the money issued by the monetary
authorities by excluding the money that has been removed from the circulation.
This is an important component when determining the economic behavior of a
country. Furthermore, exchange rates have an impact on the production decision
of companies, on the allocation of portfolios, and the prices of country and
economic competitiveness. Therefore, it is really important to have reliable
models to identify the current behavior and evolution of exchange rates as well
as predict the future level of exchange rates, especially in times of uncertainty
(Abbate & Marcellino, 2014) . According to economic theories, the exchange rate
can be determined using the fundamental variables, such as money supply,
interest rates, and prices (Engel & West). Since Sri Lanka is a developing country
Exchange rate plays a vital role in Sri Lanka’s level of trade. Yet, there is no
single indicator that exactly illustrates the reason for the volatility in exchange
rates. Hence, it would be interesting to explore the factors of exchange rate
volatility in Sri Lanka.
Research Problem
There are many studies based on the relationship between exchange rates with
macro-economic indicators. This study focused on forecasting US dollar
exchange rates and modeling the relationship between US dollar exchange rates
and currency in circulation in Sri Lanka.
Objectives
● To identify the relationship between exchange rates and currency in
circulation at the Sri Lankan context

Disciplined, Dynamic Financial Strategies
119
● To forecast the US dollar exchange rate
● To provide insights on the exposed risk in the international business
environment
Methodology
Monthly data of US Dollar exchange rate and currency in circulation, from
January 2009 to July 2019 were considered in the study. Data was collected from
the data library of the Central Bank of Sri Lanka. The data set is divided into two
sets called the training set (January 2009 to January 2019) and remaining as the
testing set. Initially, the original series was checked for the existence of the
stationarity using the Augmented Dickey Fuller (ADF) test, Phillip-Perron (PP)
test, and Kwiatkowski-Phillip-Schmidt-Shin (KPSS) test. A univariate time
series model Autoregressive Integrated Moving Average (ARIMA) was fitted for
the US dollar exchange rate data and the Akaike Information Criterion (AIC) was
used to select the best model. Finally, performed the JarqueBera test, Ljung box
test, and ARCH to check the model diagnostics: Normality, autocorrelation, and
constant variance of the residuals respectively. The existence of correlation and
co-integration between the US dollar exchange rate and the currency were
determined using Pearson correlation coefficient and Johansen cointegration test
(Asari, et al., 2011). Causality between two variables was identified based on the
Granger Causality test (Bratu, 2012). Finally, a Vector Autoregressive Model
(VAR) was constructed to identify the relationship between US dollar exchange
rates and currency in circulation in Sri Lanka.
Results and Discussion
Figure 1 shows fluctuations in the US dollar exchange rate.
Source: Authors’s illustration
Figure 1: Fluctuations in the exchange rate
100.0110.0120.0130.0140.0150.0160.0170.0180.0190.0
Jan
uar
y-0
9
July
-09
Jan
uar
y-1
0
July
-10
Jan
uar
y-1
1
July
-11
Jan
uar
y-1
2
July
-12
Jan
uar
y-1
3
July
-13
Jan
uar
y-1
4
July
-14
Jan
uar
y-1
5
July
-15
Jan
uar
y-1
6
July
-16
Jan
uar
y-1
7
July
-17
Jan
uar
y-1
8
July
-18
Jan
uar
y-1
9
July
-19
Exch
ange
Rat
e(LK
R)

Sri Lanka Economic Research Conference 2020
120
According to the figure 1 it is evident that there exists a variation in the US dollar
exchange rates for the considered time period. The increment in the trend pattern
tends to raise the concern on the depreciation in the currency value, yet, there is
no significant indication of the existence of a seasonal pattern.
A univariate ARIMA model was fitted to predict the US dollar exchange rates
for an upcoming period, but the dynamic nature of the driving factors (Sen, Kaya,
Kaptan, & Comert, 2019) tends to make it difficult to precise forecasts on the US
dollar exchange rates. Furthermore, the dependency of the considered variables;
US dollar exchange rate, and the currency was checked using the fitted
multivariate VAR model.
Univariate Time Series Analysis
Since the original series of US dollar exchange rates was not stationary; the
difference transformation of the series was considered for modeling. According
to visual inspection of ACF and PACF plots, ARIMA (1,1,1), ARIMA (1,1,0),
ARIMA (0,1,1), ARIMA (1,1,2) and ARIMA (0,1,2) were fitted. Based on the
values of Akaike information criteria, the validity of the assumption and
forecasting performance ARIMA (1,1,0) was selected as the suitable model with
a minimum AIC value of 4.056. The significance of the fitted model was tested
using the F- statistic. The test confirmed the 0.05 level of significance of the
model with 0.008 F-statistic.
The Ljung-Box Test on Residuals confirmed no autocorrelation in the residuals
with p-values greater than 0.05. The assumption of the constant variance of
residuals was tested by using the Ljung-Box Test on squared Residuals. It
confirmed the constant variance of residuals with p-values greater than 0.05. The
Jarque-Bera test on Residuals not confirmed the normality of the residuals with
p-values<0.0001. Residuals satisfy the most important autocorrelation and
constant variance assumptions while violating normality assumption at 0.05 level
of significance.
The mean absolute percentage error (MAPE) calculated for the test set was
approximately 0.96%, which is significantly lesser value. The ARIMA (1,1,0)
was selected as a suitable model for forecast the exchange rate and the model is
𝑌𝑡 = 0.741547456857 + 0.403928 𝑌𝒕−1 + 휀𝑡
Where yt: US $ exchange rate at time t, Yt: yt − yt−1 and εt: Residual at time t

Disciplined, Dynamic Financial Strategies
121
Multivariate Time Series Analysis
This study employed a VAR model to check the relationship between the US
dollar exchange rate and currency and improve the forecasting process. Currency
is one of the macroeconomic factors related to the US dollar exchange rate. Linear
correlation between currency and the exchange was measured by using the
Pearson correlation coefficient. It is 0.9099 which provides better awareness
about the relationship between the variables.
The first difference in the US dollar exchange rate data was stationary according
to the result of univariate analysis. Also, the first differenced series of currency
was stationary based on the unit root tests. The Johansen cointegration test results
implied that there is no co-integration among the US dollar exchange rate and
currency. The Granger causality test was confirmed currency does Granger cause
the US dollar exchange rate with p-value 0.0199 which is less than 0.05.
Based on the co-integration and Granger causality tests result, it can be concluded
that the better multivariate model is the VAR model for the checking relationship
of the variables and improve the forecasting process.Then, the order of the VAR
model was selected by using four criteria that are AIC (Akaike information
criteria), HQ (Hannan-Quinn information criteria), SIC (Schwarz information
criteria) and FPE (Forecast prediction error). All the criteria are proposed order
2. Based on the validity of the assumption and the forecasting performance,
model VAR (2) was selected as the better model which is given below
D(ExchangeRate) = 0.3355 + 0.2665 × D(ExchangeRate(−1))
where D(ExchangeRate): First difference of US dollar exchange rate and
ExchangeRate(−1): US dollar exchange rate lag 1. The significance of the fitted
model was tested by using the F- statistic. It confirmed the significance of the
model with a p-value of 0.0115 which is less than 0.05. The Breusch-Godfrey
Serial Correlation LM test on Residuals confirmed no serial autocorrelation in
the residuals with a p-value of 0.1025 which is greater than 0.05. The assumption
of the constant variance of residuals was tested by using Breusch-Pagan-Godfrey
Test on Residuals. It confirmed the constant variance of residuals with p-value
0.0823 which is greater than 0.05. The Jarque-Bera test on Residuals not
confirmed the normality of the residuals with a p-value of 0.000. Residuals satisfy
the most important autocorrelation and constant variance assumptions while
violating normality assumption. The fitted VAR (2) model has approximately
0.9503%, MAPE calculated for the test set.

Sri Lanka Economic Research Conference 2020
122
Conclusion
There is a strong positive relationship between the US dollar exchange rate and
currency in circulation in Sri Lanka. The findings of the study indicate a short-
term relationship between the US dollar exchange rate and currency in circulation
for the considered period. According to the obtained results, changes that occur
in the currency in circulation tend to cause changes in US dollar exchange rates
but not vice versa. Amidst the built models; the ARIMA model and the VAR
model, the VAR model can be identified as the most suitable model with its
significant indication of lower MAPE value. For future studies, the forecasting
process could be improved by considering the relationship between the exchange
rate and more other macro-economic factors such as Interest rates and Inflation.
Moreover, data mining techniques can be employed for the same data set for more
suitable models.
Keywords: ARIMA; Causality; Cointegration; US dollar exchange rates; VAR
References
Abbate, A., & Marcellino, M. (2014, April 7). Modeling and forecasing exchange rates
with time varying parameter models.
Asari, F. F., Baharuddin, N. S., Jusoh, N., Mohamad, Z., Shamsudin, N., Jusoff, K., &
Baharuddin, N. S. (2011). A Vector Error Correction Model(VECM) Approach in
Explaining the Relationship Between Interesr Rate and Inflation Towards
Exchange Rate Volatility in Malaysia. World Applied Science journal.
Bratu, M. (2012, May). Econometric Models For Determining The Exchange Rate.
Revista De Statistica.
Engel, C., & West, k. (n.d.). Exchange Rates and Fundamentals. Journal of Political
Economy.
Sen, H., Kaya, A., Kaptan, S., & Comert, M. (2019, May 25). Interest rates, Inflation and
exchange rates in fragile EMEs:A fresh look at the long-run interrelationship.
HAL.

Disciplined, Dynamic Financial Strategies
123
GROWTH OF INDUSTRIAL CLUSTERS AND ACCESS TO
FINANCE IN SRI LANKA
Fernando, P.J.S.*, Rathnayake, R.M.A.K.,
Chandrarathne, S.G.U.S., Rajapakshe, D.P., Jayasundara, J.M.D.P.
Department of Business Economics, University of Sri Jayewardenepura, Sri Lanka *Corresponding author: [email protected]
Introduction
The industrial sector of Sri Lanka achieved a rapid growth after the economic
liberalization in 1977 and the subsequent implementation of the Export Oriented
Industrialization policy (Kelegama, 2006). Currently, industrial sector accounts
for 27.4 percent as a share of GDP, while industrial exports account for 78.9
percent of the total exports (Central Bank of Sri Lanka, 2019). However,
industrial exports are very much lopsided with heavy concentration on textile and
garments, which represents 46.9 percent of industrial exports.
Cluster-based industrialization, which has been successfully promoted in many
developed and developing countries (Sonobe & Otsuka, 2010; Delgado, Porter &
Stern, 2014), has not gained much attention among the Sri Lankan policy makers
to diversify its industrial sector. However, a large number of diverse and
traditional Cluster-based Industries (CBIs) such as weaving, pottery, and
gemming are functioning all over the island (Jayawardena, 2000). In addition,
furniture, cane, brassware and copper, and mask art industries are well-known
CBIs in Sri Lanka.
Furniture industrial cluster in Moratuwa in Colombo district has a significant
growth potential in the local and global markets (Export Development Board,
2010). This is the third largest manufacturing sector in Sri Lanka and it generates
eight percent of the employment opportunities in the manufacturing sector. Cane
industrial cluster in Wewaldeniya in Gampaha district is famous for its unique
designs and environmentally friendly products. Brassware and copper industry in
Pilimatalawa in Kandy district contributes significantly to the employment
generation in the country (Chanjief et al., 2015). The traditional mask art industry
in Ambalangoda in Galle district has become commercialized and endures mainly
because of the cultural tourism (Handapangoda et al., 2016).

Sri Lanka Economic Research Conference 2020
124
Research Problem
One of the main obstacles to facilitate the growth of SMEs in developing
countries is the finance gap, which is equivalent to an unmet financing need of
US$ 5.2 trillion in a year (World Bank, 2020). In contrast, ADB (2017) argues
that CBIs have an easier access to finance than isolated SMEs. However, the cost
of borrowing remains high in some clusters as most of the sources are informal.
For instance, manufacturers in furniture cluster in Moratuwa pay over 60%
annual interest rate for informal borrowing (Fernando, 2006). Therefore, it is
interesting to analyze the financing methods and its impact on firm growth in
industrial clusters.
Objectives
The objective of this study is to investigate the impacts of different sources of
financing, i.e., formal and informal financing sources, on the growth of the firms
in traditional CBIs with special reference to furniture, cane, brassware and
copper, and mask art industries in Sri Lanka.
Literature Review
Geographical proximity and interdependence among the firms are identified as
key dimensions of industrial clusters (Martin & Sunley, 2003; Otsuka & Sonobe,
2010). Accordingly, an industrial cluster can be defined as the concentration of
enterprises producing similar and related products in a geographical area. Among
many types, artisanal-rural clusters, which largely cater to the domestic market,
are commonly seen in developing countries.
The cluster-based industrialization has many merits due to the higher degree of
networking that facilitates transferring technology, know-how, business support
services, qualification and information on market requirements. Consequently,
the policy makers pay their attention to increase the horizontal linkage among
small and medium enterprises in order to form clusters (Dasanayaka & Sardana,
2015). According to Kalaipriya (2018), the access to finance affects business
growth while the access to finance is moderated by financial literacy. However,
the Small-Scale Enterprises (SSEs) face difficulties in accessing formal financing
sources mainly because of the limited competition across financial institutions
outside of mainstream areas, higher transaction cost, underdeveloped capital
markets, absence of credit guarantee schemes and limited access to collaterals
(Asian Development Bank, 2017). Even though the informal financing sources
are characterized by low transaction cost, easy and quick access, trust and control,

Disciplined, Dynamic Financial Strategies
125
and often disbursed without collateral, it also has repercussions like higher
interest cost rates (Berensmann et al., 2002).
Methodology
A survey was conducted in January 2020 to gather data from 944 establishments.
Sample selection procedure followed in this study is explained below. A sample
frame cannot be established for the present study since a formal identification of
the cluster-based industries has not been undertaken in Sri Lanka. However,
according to the Ministry of Finance and Planning of Sri Lanka (2010), a large
number of industrial clusters, which are mostly based on natural resource
endowment scattered around the country. It is apparent that the industries, such
as furniture (in Moratuwa), cane (Wewaldeniya), brassware and copper
(Pilimatalawa), masks (Ambalangoda), gem (Ratnapura), clay products
(Panduwasnuwara), palmyra (Mannar), and leather products (Pahala-
Kadugannawa and Uthuwankanda) are organized as clusters in Sri Lanka.
Therefore, at the first clustering stage, four industries, namely, furniture, cane,
brassware and copper, and mark art industries were selected randomly.
Secondly, all the establishments were surveyed in the cane industry (in
Wewaldeniya), brassware and copper industry (Pilimatalawa), and mask art
industry (Ambalangoda), gathering data from 181, 190 and 203 establishments,
respectively, excluding non-respondents. However, only 370 establishments
from the furniture industry in Moratuwa were randomly covered out of 1000 plus
establishments in order to ensure a representative sample.
The basic model for empirical estimation is specified as follows.
ln (Size of Establishment) = ƒ {Source of Financing, Other Firm Specific
Variables, Owner Specific Variables}
Impacts of financing sources (Levy, 1993; Keasey & Watson, 1994; Beck &
Demirguc-Kunt 2006; Abor & Biekpe, 2007; Kinyua, 2014, Elston, Chen &
Weidinger, 2015; Mungiru & Njeru, 2015; Pandula, 2015; Nguyen & Canh,
2020) on SMEs have been studied in several studies. Other firm specific variables
include, capital consumption of the establishment, use of e-commerce in business
activities (Raymond, & Bergeron, 2008; Bayo-Moriones, Billón, & Lera-López,
2013; Abebe, 2014; Kossaï, & Piget, 2014; Savrul, Incekara & Sener 2014), prior
affiliations to the industry (Mottaleb & Sonobe, 2011; Kinyua, 2014) and the
controlling dummies for each industry cluster. Gender (Kalleberg, & Leicht,
1991; Rosa, Carter & Hamilton, 1996; Du Rietz & Henrekson, 2000; Coleman,

Sri Lanka Economic Research Conference 2020
126
2000; Bird, Sapp & Lee, 2001; Watson, 2002; Inmyxai & Takahashi, 2010) and
education level (Kangasharju, & Pekkala, 2002; Chiliya, & Roberts-Lombard,
2012; Soriano, & Castrogiovanni, 2012; Amarteifio, & Agbeblewu, 2017) of the
owner are incorporated as the owner specific variables. Descriptions and
descriptive statistics of the variables are presented in Table 1.
Table 1: Descriptions and Descriptive Statistics of Variables
Ab
bre
via
tio
n
Variable Measurement Mean
Sta
nd
ard
Dev
iati
on
Min
imu
m
Max
imu
m
Dependent Variable
S Size of
Establishment
Natural logarithm of total
number of workers
(Mottaleb & Sonobe, 2011)
4.145 5.923 1 100
Independent Variables
SF
1
Source of
Financing
SF1 (1 = the owner has
financed through a formal
source within the last 5
years, 0 = otherwise)
0.388 0.487 0 1
SF
2
SF2 (1 = the owner has
financed through an
informal source within the
last 5 years, 0 = otherwise )
0.075 0.264 0 1
K Capital
Consumption
Electricity bill (LKR) 1729.99
3872.38 0
50,
000
E Use of E-
commerce
1 = use, 0 = do not use 0.273 0.448 0 1
A Prior
Affiliations
1 = yes, 0 = no 0.459 0.498 0 1
C1
Dummies for
Industry
Clusters
1 = furniture industry, 0 =
otherwise
C2 1 = cane industry, 0 =
otherwise
C3 1 = brassware and copper
industry, 0 = otherwise
G Gender 1 = male, 0 = female 0.894 0.308 0 1
ED
U
Education
Level
Years of schooling 11.112 2.360 0 19
Source: Compiled by the authors

Disciplined, Dynamic Financial Strategies
127
Results and Discussion
Six regression models were estimated by employing the ordinary least square
technique. Model 1 and 2 is based on all industrial clusters, whereas Model 3 to
6 were estimated separately for each industrial cluster. The results are presented
in Table 2 after rectifying the heteroscedasticity problem. Further, the models
were free from the multicollinearity problem as suggested by the variance
inflation factor. The establishments in the total sample (Model 1) and particularly
in the mask art industry tend to grow when they use formal sources of financing.
In contrast, the establishments using informal sources thrive as evident in the total
sample and particularly in brassware and copper industry. This finding related to
the brassware and copper industry is in line with Berensmann et al. (2002).
Overall, the above findings reveal that, compared to the establishments which
have not borrowed from any financing source, the formal financing sources
promote firms’ growth while informal sources hinder the growth. This
phenomenon can be attributed to the information asymmetries. According to
Nguyen and Canh (2020), formal and informal lenders serve distinctive groups
of establishments. Also, they identify that the borrowers choose informal
financing not only because of the constraints of the formal sources, but also due
to several entrepreneur-related, firm-related and institutional factors.
In order to overcome the moral hazard and adverse selection problems caused by
the asymmetric information, formal lenders ration the borrowers based on their
financial strength. Formal lenders exclude the firms which fail to prove its
repayment ability through collaterals, guarantors, or social capital (links between
the lender and borrower). Consequently, those excluded firms are forced to
choose informal sources which are speedy and free from collateral requirements,
but carry a higher interest rate (Carreira & Silva, 2010). On contrary, formal
sources take a considerable duration to grant the loan although they charge a
lower interest rate. Therefore, it suggests that the establishments receiving
finance from the formal sources are financially strong whereas those who depend
on informal sources are financially weak. The above explanation justifies that the
firms which choose informal sources are more likely to fail while the firms which
take loans from formal sources are stronger enough to grow.
In all the models, a growth in capital consumption is found to have positive, but
very small impacts on the growth of establishments. Moreover, the use of e-
commerce also expands the scale of clusters in the whole sample and this is
especially visible in furniture and mask art industries.

Sri Lanka Economic Research Conference 2020
128
Table 2: Determinants of Firm Growth
Model 1 Model 2 Model 3 Model 4 Model 5 Model 6
Variables All
Clusters
All Clusters
with Industry
Dummies
Furniture
Industry
Cluster
Cane
Industry
Cluster
Brassware
and Copper
Industry
Mask Art
Industry
Cluster
SF1 0.256*** 0.170*** 0.131 0.147 0.0969 0.376***
(4.436) (2.937) (1.486) (0.927) (0.859) (2.645)
SF2 -0.209** -0.0788 -0.0450 0.158 -0.557** -0.291
(-2.203) (-0.842) (-0.285) (0.663) (-2.296) (-1.519)
K 0.00006**
*
0.00005*** 0.00004*
**
0.00007*** 0.0002*** 0.00004**
*
(4.454) (4.238) (3.138) (4.683) (4.509) (3.583)
E 0.301*** 0.314*** 0.333*** 0.312 0.0389 0.435***
(4.900) (5.239) (3.568) (1.303) (0.318) (3.766)
A 0.144*** 0.0837 0.0546 0.143 0.00808 0.167
(2.852) (1.627) (0.682) (1.126) (0.0736) (1.495)
C1 - 0.508***
(7.515)
- - - -
C2 - 0.130
(1.610)
- - - -
C3 - 0.304***
(4.014)
- - - -
G 0.276*** 0.182** 0.0731 0.372*** 0.282 -0.143
(3.562) (2.166) (0.367) (3.468) (1.132) (-0.728)
EDU 0.038*** 0.046*** 0.049** 0.026 0.027 0.071***
(3.268) (4.121) (2.396) (1.173) (1.309) (2.878)
Constant 0.0163 -0.210 0.406 -0.0500 0.185 -0.308
(0.110) (-1.310) (1.282) (-0.201) (0.551) (-0.885)
Observations 944 944 370 181 190 203
F Statistic
(Probability)
0.0000 0.0000 0.0000 0.0000 0.0002 0.0000
R-squared 0.201 0.250 0.164 0.193 0.180 0.247
Note: t-statistics in parentheses and *** p<0.01, ** p<0.05, * p<0.1
Source: Compiled by the authors based on the results of the regression models
Having prior affiliations for the establishments in CBIs contributes positively for
the growth of firms. However, this is apparent only in the aggregate sample.
Surprisingly, it is found that the growth of CBIs is gender biased. Accordingly,
the owner of the firm being male, drives the growth of the total sample and
specifically in the cane industry. An increase in education level of the owner
contributes to the growth of CBIs which was prominent in furniture and mask art

Disciplined, Dynamic Financial Strategies
129
industries. This finding is similar to Mottaleb and Sonobe (2011).
Conclusions
The results identify that the use of formal financing sources contributes positively
for the growth of firms in CBIs, while informal sources hinder the growth. This
can be a reason for the stagnation of most of the CBIs in Sri Lanka. Therefore,
promoting accessibility to formal financing sources coupled with better financial
literacy is recommended to promote traditional CBIs in Sri Lanka. Moreover, the
CBIs should be empowered with the required knowledge and skills to enhance
their financial strength making resilient to different forms of shocks.
Keywords: Cluster-based Industries; Formal Sources of Financing; Industrial-
growth; Informal Sources of Financing; Sri Lanka
References
Asian Development Bank. (2017). Sector Assessment (Summary): Finance (Small And
Medium-Sized Enterprises Financing). Asian Development Bank.
Berensmann, K., Bartels, K., Höffler, H., Hölscher, K., Losse, K. & Majewski, J. (2002).
Informal financing of small-scale enterprises in Sri Lanka. Reports and working
papers 10/2002 of German Development Institute. Retrieved from
https://www.files.ethz.ch/isn/27905/2002-10.pdf
Dasanayaka, S., & Sardana, G. (2015). Development of small and medium enterprises
through clusters and networking: A comparative study of India, Pakistan and Sri
Lanka. International Journal in Economics and Business Administration, 2, 84-
108.
Fernando, J. (2006). How far drawbacks in informal financial sector have led to
inefficiencies in the furniture industry: A case study in Moratuwa, Sri Lanka. An
undergraduate independent study submitted to the Department of Business
Economics, University of Sri Jayewardenepura, Sri Lanka.
Mottaleb, K., & Sonobe, T. (2011). An Inquiry into the Rapid Growth of the Garment
Industry in Bangladesh. Economic Development and Cultural Change, 67-89.
Otsuka, K., & Sonobe, T. (2010). The community mechanism of contract enforcement:
What are the differences between rural communities and industrial clusters? In K.
Otsuka & K. Kalirajan (Ed.). Community, market and state in development (pp.
211-223). Palgrave Macmillan, London.

Sri Lanka Economic Research Conference 2020
130
Sonobe, T., & Otsuka, K. (2010). Cluster-based industrial development: A comparative
study of Asia and Africa. Springer.
The World Bank. (2020). Small and Medium Enterprises (SMEs) Finance. Retrieved May
20, 2020, from https://www.worldbank.org/en/topic/smefinance

Disciplined, Dynamic Financial Strategies
131
IMPACT OF MACROECONOMIC VARIABLES ON STOCK
MARKET AND SECTOR RETURNS: MULTIVARIATE
TIME SERIES APPROACH
Sanjeewani, M. H. T.* and Peiris, T. S. G. D. Department of Mathematics, University of Moratuwa, Moratuwa, Sri Lanka
*Corresponding author: [email protected]
Introduction
The stock market return is an important economic indicator that reflects the
economic environment of the country. In addition, different sector returns move
differently to the changes in the macroeconomic environment and thus the study
on impact of different macroeconomic variables on the stock market and sector
returns has an immense benefit for investors and decision-makers.
Several types of research were performed on the impact of macroeconomic
variables on the stock market and sector returns in the developed economies (Paul
& Mallik, 2003; Hess, 2003). However, research on this area in the developing
world is less and most of the studies were done in the recent past (Menike L. M.,
2006; Kalyanaraman, 2015; Pyeman & Ahmad, 2017; Jambotkar & Raju, 2018).
Nevertheless, the results in both developed and developing markets are diverse
and have not reached any consensus related to the impact of macroeconomic
variables on the stock market and sector returns. An extensive review on this
subject found that there is not much research has been carried out on the impact
of macroeconomics variables on the stock market and sector returns in Sri Lanka.
Decision-makers, investors and other individuals in Sri Lanka seek up to date
information on impact analysis on the stock market and sector returns for decision
making. Similarly, investors, policymakers, and other individuals and institutions
may seek what are the nature of short term and long-term relationships between
the stock market returns and macroeconomic variables.
Research Problem
On view of the above, the research problem is: “what are the nature of short term
and long-term relationships between the stock market and sector returns with
macroeconomic variables in Sri Lanka”.

Sri Lanka Economic Research Conference 2020
132
Objectives of the Study
(i) Examine the short term and long-term relationship between the
stock market return and macroeconomic variables.
(ii) Examine the short term and long-term relationships between sector
returns and macroeconomic variables.
Secondary Data
The All-Share Price Index (ASPI) was taken as the proxy variable for stock
market return. Even though there are twenty business sectors in the Colombo
Stock Exchange (CSE) currently, data on four business sectors were not available
from 1996. Therefore, sixteen business sectors indexes that have data for the
period Q1:1996 to Q4:2018 were selected from the database of the CSE.
Proxy variables selected for sector returns are: Bank Finance and Insurance
(BFI), Beverage Food and Tobacco (BFT), Chemicals and Pharmaceuticals
(C&P), Construction and Engineering (C&E), Diversified Holdings (DIV),
Footwear and Textile (F&T), Hotels and Travels (H&T), Investment Trusts
(INV), Land and Property (L&P), Manufacturing (MFG), Motors (MTR), Oil
Palms (OIL), Plantations (PLT), Service (SRV), Stores Supplies (S&S), and
Trading (TRD).
The proxy variables considered to represent the macroeconomic environment
are: (i) Inflation - CCPI (Colombo Consumer Price Index), (ii) Exchange rate –
ER (Average exchange rate of Sri Lankan Rupees to United States Dollar (USD),
(iii) Economic growth – GDP (Growth of Gross Domestic Product), (iv) Interest
rate – IR (weighted average yield rates on primary market operation of Treasury
bill, 364 day), (v) Money Supply - MS (Broad definition of money supply, M2),
and (vi) International Crude Oil Price - ICOP (to represent the international
commodity prices).
Statistical Analysis
Augmented Dickey-Fuller (ADF) Phillips-Perron (PP) tests were applied to
check whether the series follow stationary. Since most of the economic variables
are non-stationary and non-homogenous, log transformation was used to reduce
the heteroscedasticity of variables and the first difference of the log series were
used to make series stationary. The co-integration test is developed to test the
long-term equilibrium relationships (Johanson & Juselius, 1990). VEC models
were developed to find the short-term dynamics between stock market returns
and macroeconomic variables when they are co-integrated.

Disciplined, Dynamic Financial Strategies
133
Results and Discussions
ASPI and the sector indices such as BFI, BFT, H&T, INV, L&P, MTR, OIL,
S&S, SRV, and TRD showed a downward trend from 1996 to 2000 and from
2001 to 2017 those indices shown an upward trend. Both the ADF and PP tests
were confirmed that all log-transformed series are integrated at first difference.
Therefore, the cointegration test was selected as the method of empirical analysis.
Six information criteria are used to find the most appropriate lag length to
perform cointegration tests.
The Relationship between Macroeconomic Variables and ASPI
More criteria selected lag four as maximum lag length and it used to perform the
Johansen cointegration test. Trace statistic found at most five cointegration
equations, meanwhile, the maximum Eigen value found one cointegration
equations. Therefore, it can be concluded that macroeconomic variables and
ASPI are cointegrated and have a long-term equilibrium relationship with one
cointegration equation.
Table 1: Cointegration Equation on Macroeconomic Variables and ASPI
Variables 𝛃′ t-stat Decision
Inflation -2.493 0.842 Confirmed H0
Exchange rate 1.946 -1.079 Confirmed H0
Economic growth -8.079 2.009 Not Confirmed H0
Interest rate 8.277 -2.247 Not Confirmed H0
Money supply -0.792 0.663 Confirmed H0
Oil Price -0.535 1.337 Confirmed H0
Source: Author’s estimations
The results indicate that economic growth and interest rate are significantly
different from zero. Therefore, the results confirmed that, in the long term, the
interest rate has a significant positive relationship, while economic growth has a
significant negative relationship, with ASPI. Inflation, exchange rate, money
supply and international crude oil price have no significant relationship with
ASPI in the long term. Based on the results in Table 1, the fitted model can be
written as:
ASPIt−1 = 85.886 − (2.493 ∗ Inflationt−1) + (1.946 ∗ exchange ratet−1) −
(8.079 ∗ economic growth ratet−1) + (8.277 ∗ interest ratet−1) − (0.792 ∗
money supplyt−1) − (0.535 ∗ oil pricet) + et−1 (1)

Sri Lanka Economic Research Conference 2020
134
According to the results of VECM, ECT (-0.088) has the expected negative sign
and is significant. The inverse value of absolute ECT is close to 12
(1/0.088=11.36). Accordingly, market participants take 12 quarters to learn and
fully adjust the forecasting error. The results of Wald test show that no variable
is significant in explaining ASPI in the short term.
The Relationship between Macroeconomic Variables and Sector Returns
Table 2: Summary Results of the Cointegration Tests and VECM
Co
inte
gra
tio
n
rela
tio
nsh
ip
Infl
ati
on
Ex
cha
ng
e ra
te
Eco
no
mic
Gro
wth
Inte
rest
ra
te
Mo
ney
Su
pp
ly
Oil
pri
ce
Ex
pec
ted
EC
T V
alu
e
Mo
del
Fit
nes
s
Sig
nif
ica
nt
Va
riab
les
(sh
ort
ter
m)
ASPI Yes N N S(-) S+ N N Yes No -
BFI Yes S(-) N S(-) S+ N N No No -
BFT Yes S+ N N S(-) S+ S+ No No -
C&E Yes S(-) S(-) N S+ S(-) N No No -
C&P Yes S(-) S(-) S(-) S+ S(-) N No No -
DIV Yes S+ N N S(-) N S+ No Yes -
F&T Yes S+ N N S(-) S+ N No Yes IR
H&T Yes S+ S(-) N S(-) S+ S+ No Yes GDP, IR,
MS,
ICOP
INV Yes S+ S(-) S(-) N N S+ No No -
L&P Yes S+ N N S(-) S+ S+ No No -
MFG Yes N S(-) S(-) S+ S+ N No No -
MTR Yes N S(-) S(-) S+ S(-) N Yes No -
OIL Yes N S(-) N S+ S(-) S+ Yes Yes IR, ICOP
PLT Yes S(-) N N S+ S(-) S(-) No No -
S&S Yes S+ S(-) S(-) S(-) S+ S+ No No -
SRV Yes S+ N N S(-) S+ S+ No No IR
TRD Yes S(-) N N S+ S(-) S(-) No Yes IR
S = Significant, N = Not Significant
Macroeconomic variables and each sector return are cointegrated and have long
term equilibrium relationships. In most of the instances, macroeconomic
variables are significant in explaining sector returns in the long term; however, it
is not same in the short term and the results are shown in Table 2.

Disciplined, Dynamic Financial Strategies
135
Conclusions
▪ Macroeconomic variables and stock market return are cointegrated and
have a long-term equilibrium relationship.
▪ Interest rate has a significant positive and economic growth has a
significant negative relationship with ASPI, in the long term.
▪ Macroeconomic variables and each sector return are cointegrated and have
long term equilibrium relationships.
▪ Most of the macroeconomic variables are significant in explaining sector
returns in the long term. On the other hand, very few variables are
significant in explaining sector returns in the short term.
▪ The results of this research are useful for the investors, to improve the value
of equity investment decisions, to decide investment promotions locally and
internationally, to identify how the stock market and each sector of the
economy react to the changes in the macroeconomic environment, and to
get an understanding as to how macroeconomic variables have an impact on
the stock market and sector returns.
Keywords: Cointegration; macroeconomic variables; stock market return; sector
returns; VECM
References
Hess, M. K. (2003). Sector Specific Impacts of Macroeconnomic Fundamentals on the
Swiss Stock Market. 1-16.
Jambotkar, M., & Raju, G. A. (2018). Impact of macroeconomic variables on the selected
Indian sectoral indices: An empirical analysis. International Journal of Academic
Research and Development, 3(2), 450 - 456.
Johanson, S., & Juselius, K. (1990). Maximum Likelihood Estimation and Inference on
Cointegration - with Applications to the Demand for money. Oxford Bulletin of
Economics and Statistics, 52(2), 169-210.
Kalyanaraman, D. L. (2015). Long-run and Short-run Relationship between
Macroeconomic Factors and Returns on Sectoral Indices in Saudi Arabia: An
Empirical Analysis. Mediterranean Journal of Social Sciences, 6(2), 333-344.

Sri Lanka Economic Research Conference 2020
136
Menike, L. (2006). The Effect of Macroeconomic Variables on Stock Prices in Emerging
Sri Lankan Stock Market. Sabaragamuwa University Journal, 6(1), 50-67.
Paul, S., & Mallik, G. (2003). Macroeconomic factors and bank and finance stock prices:
The Australian experinece. Economic Analysis & Policy, 33(1), 23 - 30.
Pyeman, J., & Ahmad, I. (2017). Cointegration Between Macroeconomic Variables and
Sectoral Indices Movement in Bursa Malaysia. GJAT, 7(1), 19-27.

137
Happiness and Prosperity Hybrid

Sri Lanka Economic Research Conference 2020
138

Happyness and Prosperity Hybrid
139
HAPPINESS AND PROSPERITY IS IT A “CHICKEN &
EGG” PROBLEM?
Hewage, T. U.
Department of Mathematics, University of Colombo, Sri Lanka.
Introduction
The age-old question “Which came first, the Chicken or the Egg?” is a paradox
that has been used over the years to describe similar situations where it is hard to
decide what to do first or what should come first out of two possible things or
actions with one feeding on the other. The most interesting quality of this
paradox is that once the ball starts rolling, it certainly will be a self-propelled
process where the chicken will keep giving eggs and the eggs will be giving
chicks as long as the environment is suitable for hatching. Modern-day online
businesses such as Ebay and Airbnb are good examples where the sellers would
use the site only if they see a significant number of buyers using the site but the
buyers will use it only if they can see quite a few sellers offering competitive
prices and more choices. Therefore, which group would you get on board first
and how? Of course, a study of the history of such businesses will show that
starting small, offering irresistible deals to one group first and perseverance are
some of the key ingredients of their success. That means the business owner only
has to make sure that the environment is suitable for reproduction of sellers and
buyers both. For the owner of the site, there is no difference between the two
groups. They are all his customers using the services of his business, which is
facilitating the interaction between the two groups. A buyer at one point may
very well be a seller at a different point and vice-versa.
At this juncture, which is perhaps the most important after WWII, we are faced
with the gruesome task of resuscitating the economic activities of the world. After
virtually being in an economic coma for several months, understanding what to
do first in terms of bringing happiness and prosperity back to people’s lives is of
paramount importance. Though it may look like these two aspects of life go
hand-in-hand, it is not an easy task to start with either one when we do not have
access to both of them. Therefore, this is an attempt to analyze the philosophical
aspects of the “Post COVID-19 Economic Revival” under the assumption that
the goal of the revival is to bring “Happiness and Prosperity” to all (Joshanloo,
Jovanovic & Taylor, 2019)

Sri Lanka Economic Research Conference 2020
140
Research Problem
This research will address the problem of prioritizing different aspects of the
revival process of the post-crisis economy while keeping the happiness and
prosperity as the two main focus areas. Then the main question we should be
asking ourselves is: “Does ‘Happiness’ come after ‘Prosperity’ or vice-versa?”
Objective
The main objective of the research is to find key areas of focus in an efficient and
sustainable economic revival plan that will lead the country to prosperity while
preserving or increasing (as needed) the happiness of its citizens.
Methodology
The methodology used is the systematic review of existing research findings
using libraries such as Elsevier, Oxford, JSTOR and Research Gate. Happiness
of a human being has been a subject of interest of philosophers, psychologists,
economists and leaders of nations going back even beyond 500 BC. The two
main identifiable categories of happiness, hedonism (short-term pleasure) and
eudemonism (long-term well-being through actions based on ethics and moral
principles) described in the Necomachean Ethics by Aristotle still remain as the
two aspects even the philosophers and economists from Jeremy Bentham to
Amartya Sen and Angus Deaton would consider when they analyze the
correlation between happiness and prosperity (Graham, 2005). Is it prosperity
that leads to happiness? Looking at the existing evidence in searching for an
answer to this question, it is hard to avoid the Easterlin Paradox which says that
even though one may see a positive correlation or a direct proportionality
between prosperity and happiness at lower measures of each, the happiness
doesn’t seem to improve beyond a certain level irrespective of the growth of the
level of prosperity (Easterlin, 1974) (see Figure 1). This research consists of a
systematic review of the recent research articles on the interdependency of
happiness and prosperity. A systematic review is a process where the literature
is reviewed based on pre-defined measures to filter the most appropriate and up-
to-date research findings. Then the information is evaluated and analyzed based
on deductive themes amalgamating the findings relevant to the objectives
identified. A substantial conclusion addressing the stated research problem and/or
the hypothesis will then be supported by the evidence collected.
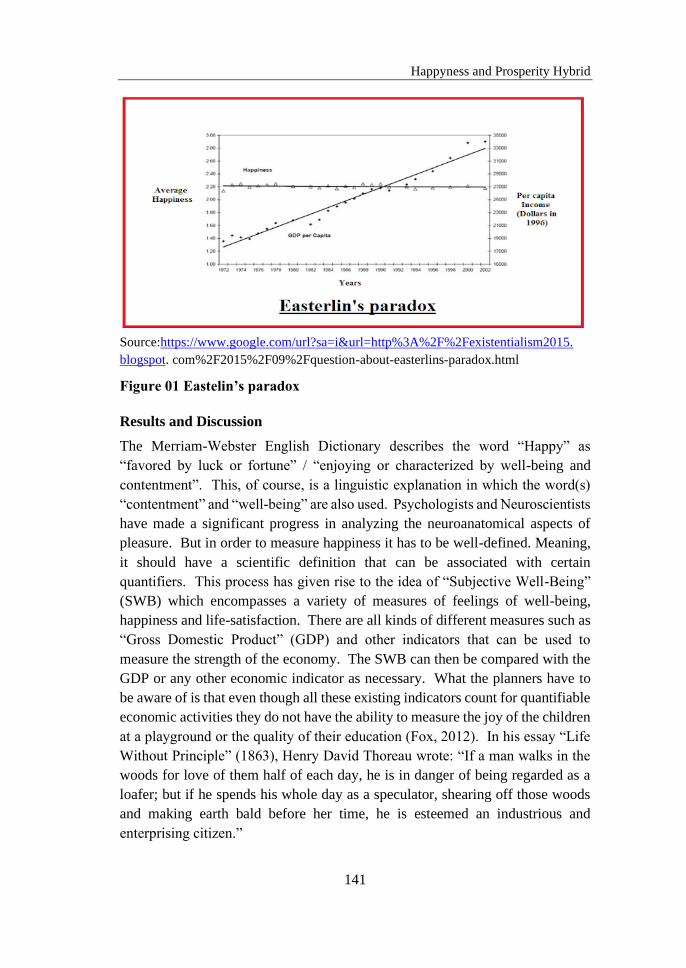
Happyness and Prosperity Hybrid
141
Source:https://www.google.com/url?sa=i&url=http%3A%2F%2Fexistentialism2015.
blogspot. com%2F2015%2F09%2Fquestion-about-easterlins-paradox.html
Figure 01 Eastelin’s paradox
Results and Discussion
The Merriam-Webster English Dictionary describes the word “Happy” as
“favored by luck or fortune” / “enjoying or characterized by well-being and
contentment”. This, of course, is a linguistic explanation in which the word(s)
“contentment” and “well-being” are also used. Psychologists and Neuroscientists
have made a significant progress in analyzing the neuroanatomical aspects of
pleasure. But in order to measure happiness it has to be well-defined. Meaning,
it should have a scientific definition that can be associated with certain
quantifiers. This process has given rise to the idea of “Subjective Well-Being”
(SWB) which encompasses a variety of measures of feelings of well-being,
happiness and life-satisfaction. There are all kinds of different measures such as
“Gross Domestic Product” (GDP) and other indicators that can be used to
measure the strength of the economy. The SWB can then be compared with the
GDP or any other economic indicator as necessary. What the planners have to
be aware of is that even though all these existing indicators count for quantifiable
economic activities they do not have the ability to measure the joy of the children
at a playground or the quality of their education (Fox, 2012). In his essay “Life
Without Principle” (1863), Henry David Thoreau wrote: “If a man walks in the
woods for love of them half of each day, he is in danger of being regarded as a
loafer; but if he spends his whole day as a speculator, shearing off those woods
and making earth bald before her time, he is esteemed an industrious and
enterprising citizen.”

Sri Lanka Economic Research Conference 2020
142
There certainly should be a paradigm shift in planning the post-COVID-19
economy. Instead of using the same measuring sticks as GDP and other
traditional indicators, we will have to develop our own creative indicators which
can clearly measure the progress of our economy towards the goals we have set
(not what others set for us) with our own justifiable and meaningful definitions
of “happiness” and “prosperity”. The idea of creating alternatives for GDP to
take “capabilities” as well as “commodities” into account was first introduced in
1980 by Amartya Sen. The first “Human Development Index” (HDI) published
in 1990 put the USA in the 10th place (though it was far ahead of the top 9
countries in terms of GDP) while recognizing a few countries like Sri Lanka and
Vietnam having exceptionally high living standards compared to their GDP
rankings (Fox, 2012). While the policies of the creative economy support this
paradigm shift and facilitate the framework for new investments in human
resource development, it is very important to introduce an efficient and
transparent structure for fund management including the introduction of new tax
structures. Most of the foreign aid comes with conditions that would put
constraints on the receiver in such a way that the receiving nation will not have
any choice of building their own creative economy. In addition to that, most of
the money will again go back to contributing nations through multinational
corporations that have to be given the contracts to perform the work generated by
their aid programs (Loewenstein, 2015).
Conclusion
Though most of the strategies of economic revival would focus on happiness and
prosperity in a hybrid form, it will be more sustainable and meaningful to
prioritize “happiness” over “prosperity” with justifiable and meaningful
definitions of both words.
A “Creative Economy” would be a better antidote to low or zero growth and/or
post-disaster economy. In this creative economy, the idea of “Growth” itself may
have to be redefined and the indicators do not necessarily have to be the same as
what they used to be. Avoid promoting certain sectors just for the sake of growth
purely to avoid the economic stagnation, but promote “creative growth” which
will require a significant investment in raising the level of independent analytical
and creative thinking of the general population to a higher level.
Invest heavily on Human Resource Development focusing not only on the
development of skills but also the personal and spiritual development of
individuals. This will facilitate opportunities to elect or appoint qualified,

Happyness and Prosperity Hybrid
143
capable, efficient and honest human beings to decision making positions, from
principals of schools, governing boards, fund managers and administrative
officers all the way to members of the parliament and the leader of the country.
Use the funds generated in the country and all the aid coming from other countries
wisely in a complete transparent manner with the sole intention of bringing
happiness and prosperity to all the people in the country.
Keywords: Happiness; Prosperity; Economy
References
Banks, M. (2018). Creative economies of tomorrow? Limits to growth and the uncertain
future. Cultural Trends, 27:5, 367-380, DOI: 10.1080/09548963.2018.1534720
Dan, H. (2011). Happiness. The Stanford Encyclopedia of Philosophy (Winter 2019
Edition), Retrieved from https://plato.stanford.edu/archives/win2019/entries/
happiness
Easterlin, R.A. (1974). Does Economic Growth Improve the Human Lot? Some
Empirical Evidence, P.A. David, M.W. Reder. Nations and Households in
Economic Growth, 89-125, Cambridge, MA, USA: Academic Press.
Fox, J. (2012). The Economics of Well-Being. Harvard Business Review, Jan-Feb-2012.
Retrieved from https://hbr.org/2012/01/the-economics-of-well-being
Graham, C. (2005). The Economics of Happiness: Insight on globalization from a novel
approach. World Economics - Vol 6 – No 3 (Jul – Sep-2005), 41-55. Retrieved
from https://www.researchgate.net/publication/237809673_The_Economics_of_
Happiness
Joshanloo, M., Jovanović, V., Taylor, T. (2019). A multidimensional understanding of
prosperity and well-being at country level: Data-driven explorations. PLoS ONE,
14(10): e0223221. Retrieved from https://doi.org/10.1371/journal.pone.0223221
Keyes, C.L.M. & Annas, J. (2009). Feeling good and functioning well: distinctive
concepts in ancient philosophy and contemporary science. The Journal of Positive
Psychology, 4:3, 197-201, DOI: 10.1080/17439760902844228
Loewenstein, A. (2015). Disaster Capitalism: Making a Killing out of Catastrophe,
Brooklyn, NY, USA: Verso.

Sri Lanka Economic Research Conference 2020
144
A STUDY OF THE DISTRICT QUOTA SYSTEM BASED
UNIVERSITY ENTRANCE PROCEDURE OF THE 1970s
AND ITS EFFECTS ON CONTEMPORARY SRI LANKAN
SOCIETY – A HISTORICAL ANALYSIS
Gamage G.C.L1*., Amarasingha S.2
1Department of History & Archaeology, University of Ruhuna, Matara 2Department of Sociology, University of Ruhuna, Matara
Corresponding author: [email protected]
Introduction
Following the free education policy introduced in the 1940s and the social
welfare policies ushered in by the Sri Lankan government during the post-
independence period, educational opportunities opened up for all levels of
students in Sri Lanka. However, educational benefits and privileges were
distributed in a geographically inequitable manner across the country during the
post-independence period. For example, English language teaching facilities and
laboratory facilities considered essential for the Advanced Level Science based
courses were not adequately established in most of the rural areas of Sri Lanka
even by the 1970s. Because of that, most students from the rural areas were
unable to qualify for the science disciplines and were able to enter only the Arts
faculties (Wickramasinghe, 2012, p. 83). For example, it was noticed that in
1974, thirteen out of twenty-two districts did not produce a significant number of
students for the Medical and Engineering faculties (Herath et al., 1997, p. 437).
The science and medical faculties were predominantly represented by students
from the Western and Northern provinces as these were the main regions in which
educational facilities were properly established. For example, youth from the
Northern Province accounted for 27.5% of the Science based courses, though the
province was home to only 7% of the total population of the country. Much the
same situation prevailed in the Western Province, with a representation of 67.5%
in Science based courses in 1969, in comparison to its population percentage of
26% (Heenpela, 2017). This situation caused problems in the 1970s when vast
numbers of Arts graduates who were released into the society sought
employment. With a crumbling socialist economy, the government found itself
unable to provide adequate work opportunities for such a huge number of Arts
students who had only limited skills. But in spite of the poor state of the country’s
economy, most of the Science graduates were able to enter the prestigious
professions. Nevertheless, intense competition prevailed among job aspirants for

Happyness and Prosperity Hybrid
145
the limited number of jobs available in the country. The competition prevailed
within groups, classes and ethnicities. The government then attempted to reduce
the geographical imbalance that existed in the representation of students in the
faculties by implementing the District Quota system for admission to the state
universities in the 1970s. By this means the government expected to reduce the
existing youth unrest. The government hoped to make special efforts and provide
chances to students from the less developed districts to enter the science faculties
of the universities.
Research Problem
Some researchers have investigated the educational policy implementations of
the 1970s in Sri Lanka. Among their observations only very few direct analyses
are found regarding the District Quota system. The researches of Bandarage
(2009), de Silva (1978), Siddeek (2016), and Wickramasinghe (2012) are the
important ones among these. All of them who studied the nature of the District
Quota system found that it resulted in changes to the ethnic composition of
university students. But this research is mainly focused on investigating the other
types of changes caused by the District Quota System in the universities and their
society-wise impacts.
Objective
The main objective of this research is to study the consequences of the District
Quota System for university admission during the 1970s in Sri Lanka.
Methodology
The research intends to do this by performing a content analysis. Data were
collected using two primary methods. First of all, a literature survey was
performed. Books, research papers, and theses were used for this purpose.
Additionally, contemporary newspapers, Hansards, and some original reports
published by the Ministry of Higher Education were reviewed. Further, a field
survey was conducted, for which 35 respondents were selected to participate as
key informants. They were selected from diverse geographical areas across the
island after ascertaining they all had real life experiences regarding the issues that
prevailed in the 1970s in Sri Lanka. Key informants were selected from the three
major ethnic groups, which comprised Sinhalese, Tamils and Muslims.
Results and Discussion
After implementing the District Quota system of selection to the universities, a
large number of rural students were able to access university education. However,

Sri Lanka Economic Research Conference 2020
146
students from the really backward areas like Hambantota, Polonnaruwa and
Monaragala were not able to secure sufficient places in the Science faculties even
after these measures were introduced. But overall, students from the majority
Sinhalese community were able to establish their position firmly in the university
faculties. For instance, they made up 75.4% of the Science faculties, 78% of
Engineering faculties and 70.0% of Medical faculties in 1974. The percentage of
Sinhala students who entered university increased in 1975 to 78.0% for the
Science faculties, 83.4% for the Engineering faculties and 78.9% for the Medical
faculties.
They held a very prominent place in the Arts faculties too, at 85% in 1975 (De
Silva, 1978, p. 93). Some communities like the Kandyans and Muslims were also
able to establish their position in the Science faculties of the universities. The
percentage of Muslims in the Science faculties doubled between 1970 and 1975.
They had only the minimum of opportunities to enter those faculties before the
introduction of the District Quota system. Therefore, Muslims who were not able
to enter the prestigious professions previously had chosen to engage in trade,
business, cultivation, fishing, and so on. But now they were fortunate enough to
become doctors, engineers, accountants or lawyers. In the meanwhile, Tamil
representation in the universities declined sharply. Presence of Tamils in the
Science faculties had dropped to 20.9% in 1974 from 25.9% in 1973 and 35.3%
in 1970. Likewise, their representation in the Engineering and Medical faculties
had decreased to 16.3% and 25.5%, respectively. In 1973, about 337 Tamil
students qualified to enter the science faculties of universities. In 1974, that
number had decreased to 294. This situation worsened in 1975. Their percentages
in the Science and Medical faculties too decreased to 14.2% and 17.4%,
respectively, in that year. Their overall representation in all Science disciplines
had decreased to 19% in the same year (De Silva, 1978, p. 93).
University admission procedure that was introduced by the Sri Lankan
government in the 1970s had the direct effect of reducing the percentage of Tamil
students gaining university entrance. However, as the researcher ascertained
through field interviews, even among the Tamil students it was predominantly
the Vellalar (high caste Tamils living mostly in Jaffna) who accounted for the
highest number of places in the faculties. Vellalar Tamils had maintained a high
level of representation in the prestigious professions even during the colonial
period. The reason was that the colonial rulers and Catholic organizations had
established quite a number of high-quality English schools in the Jaffna
peninsula. With this educational grounding the Vellalar Tamils entered the
prestigious professions and dominated the science and medical faculties of the

Happyness and Prosperity Hybrid
147
universities. The Sinhalese, though they were the majority community in the
country, constituted only a low percentage in the higher professions, even in the
1970s. Vellalar Tamils continued to maintain a significant position in the higher
professions even in the 1970s, which was disproportionately high when compared
to their ethnic ratio (Bandarage, 2009, p. 54). Therefore, according to my field
data, the domination of Vellalar Tamils in the Science faculties was challenged
by the District Quota system in the 1970s. Due to caste barriers, Tamil people of
the lower castes in Jaffna were rather handicapped, with far fewer opportunities
to enter the prestigious faculties in the Universities. But there is evidence that
some non-Vellalar Tamil youths from remote areas were able to enter universities
under the District Quota System. For example, this system benefited Tamil
students from the Vanni, Batticaloa, Trincomalee and Ampara. Even a few
students from Kilinochchi had entered university under the District Quota system.
Upcountry Tamil students too enjoyed the privilege of gaining entrance to the
Science faculties. Therefore, most of the depressed caste Tamils had a positive
view of the District Quota system as a policy based on democratic principles.
However, the Vellalar leaders did not appreciate the positive aspects of the
District Quota system. Instead, they kept complaining and worrying about the
reduction in the benefits they had been enjoying all these days. By way of protest,
they arranged a number of anti-government demonstrations in Jaffna against the
university entrance procedures in the 1970s. Further, they perceived not only the
Sinhalese domination but also the increase in the number of Muslims entering the
university as a threat to their hegemony. Jaffna Tamils did not recognize the
District Quota system as a positive development.
Conclusions
The District Quota system can be identified as a progressive development that
introduces radical but democratic changes to Sri Lankan society. Less privileged
social groups are able to enjoy upward social mobility through this policy.
However, this policy can also be identified as one of the significant developments
that contributed to the escalation of the ethnic dispute among Sri Lankan
communities.
Keywords: District Quota, Education, Science, Sinhalese, Tamils
References
Bandarage, A. (2009). The Separatist Conflict in Sri Lanka, Terrorism, Ethnicity,
Political Economy, New York,USA: iUniverse ,Ink ,Bloomington.

Sri Lanka Economic Research Conference 2020
148
De, Silva, C, R. (1978). The Politics of University Admissions: A Review of Some
Aspects of University Admissions Policy in Sri Lanka, 1971 – 1978, Sri Lanka
Journal of Social Sciences, 1(2), Colombo: National Science Foundation.
Heenpella ,A.(2017). The District Quota System: A Relic of the Past? ,
http://www.pulse.lk/everythingelse/district-quota-system-relic-past/
Herath ,P., Liyanage,K .,Ushiogi, M.,Muta,H .(1997). Analysis of policies for allocating
university resources in heterogeneous social systems: a case study of university
admissions in Sri Lanka, Higher Education, 34, pp.437-457, Netherlands: Kluwer
Academic Publishers.
Siddeek ,M,Y,M .(2016) The Myth About The University Admissions Criteria, Colombo
Telegraph , https://www.colombotelegraph.com/index.php/the-myth-about-the-
university-admissions-criteria/
Wickramasinghe,N. (2012). Democracy and Entitlements in Sri Lanka: The 1970s Crisis
over University Admission, South Asian History and Culture,3 ( 1) ,pp.81-96,UK:
Routledge.

Happyness and Prosperity Hybrid
149
RELATIONSHIP BETWEEN UTILITY OF DRIVING, SOCIO-
ECONOMIC CHARACTERISTICS AND RISK BEHAVIOR OF
DRIVERS
Shaja, M.M.M. , Bandara, Y.M.* Department of Transport and Logistics Management, University of Moratuwa,
Sri Lanka
*Corresponding author: [email protected]
Introduction
Private vehicle ownership and the per capita income are positively correlated and, in
developing countries, the growth of private ownership of motor vehicles along with
economic growth tends to have a higher level of saturation (Medlock & Soligo, 2002).
Further, the individual choice for car driving is mainly driven by motives such as
minimizing journey time, avoiding negative effects related to the journey, minimising
physical and psychological effort, creating personal space and minimising financial cost
(Gardner & Abraham, 2007). As a result, road traffic congestion, the level of urban
pollution, and road traffic crashes have become crucial issues in urban cities. The cost of
accidents generates a significant loss to the economies in terms of lives and damage to
vehicles and property. Approximately 1.35 million people die each year due to road
accidents around the world (WHO, 2018). Road traffic crashes cost most countries 3%
of their Gross Domestic Product. Vehicle accidents in Sri Lanka have become one of the
major concerns at present. Deaths due to road accidents in the country reached 3,554
people which accounted for 2.8% of the total deaths in Sri Lanka in 2017 (WHO, 2020).
One of the main reasons for the accident is the driving behaviour which leads to incorrect
decisions. While driving, drivers get into a dilemma zone in time within which they are
unable to make quick decisions on the steering of the vehicle, and the resulting errors
lead to accidents (Biswas & Ghosh 2018). Therefore, it is vital to identify the factors
influencing the driver decisions to reduce accident level which in turn reduces both direct
costs such as hospitals, emergency care, transportation and indirect costs such as police,
insurance administration, property damage, and loss of production (Garcia-Altés & Pérez,
2007).
Decision making is a cognitive process in human beings (Wang, Mao, Jin, Wang, & Guo,
2011). Drivers make decisions on the road in various situations (Muttart, 2014). Some
decisions drivers make result in major accidents and fatalities. Identifying the factors
which influence the decisions of the drivers is crucial in terms of reducing the cost of
accidents and ensuring sustainable living and a healthier economy of a country.

Sri Lanka Economic Research Conference 2020
150
Therefore, this research focuses on identifying the relationship between the utility of
driving (the satisfaction level of driving a car than travelling on other modes of transport),
socio-economic characteristics of the drivers, and the decisions making behaviour of the
drivers.
Research Questions and Objectives
Some drivers are risk-takers and some are risk-averse drivers (Breuer, Riesener, &
Juliane, 2014). The first research question of this paper deals with the relationship
between the utility of driving and driver behaviour. The second question inquiries into
the relationship between the socio-economic characteristics of drivers and driver
behaviour. Thus, the main research objective of the paper is to identify the relationship
between the utility of driving and driver behaviour and its variation across driver’s socio-
economic characteristics.
Methodology
Sampling and Data Collection
A questionnaire was designed and distributed among randomly selected 210 (Male = 186,
Female = 24) car drivers within Moratuwa Divisional Secretariat. The responses of
drivers on their utility of driving based on travel time, travel cost, safety, convenience,
privacy, socio-economic characteristics such as gender, age, driving experience, monthly
income, and working hours per week were collected. The decisions of the drivers for
selected five circumstances (dependent variables) which help identify whether the driver
is a risk-taker or risk-averse driver were also collected. The circumstances are listed
below:
(a) The driver stops at a traffic light and hears the incoming message/call receiving
tone. Under these conditions, whether the driver reads the text / attends the call
immediately (Y1).
(b) The driver drives at night and the amber lights were flashing at an intersection.
Under these conditions, whether the driver reduces the speed of the car while
crossing the intersection (Y2).
(c) The driver drives in a high traffic condition while the vehicle was in the mid of
the vehicle platoon. Whether the driver maintains the proper distance between
the vehicles while driving (Y3).
(d) The driver drives on a rainy day and the driver sees a pedestrian crossing the
street and he/she has already in the last few steps of the crossing. Under these
conditions, whether the driver does not stop the car until the pedestrian finish
crossing the road (Y4).

Happyness and Prosperity Hybrid
151
(e) The driver rushes to reach a place, and become annoyed with a slow driver in
the outer lane. Under these conditions, whether the driver overtakes the front
car through the inside lane (Y5).
Data Analysis Model Framework
Since the driver is a risk-taker or a risk-averse driver, and to predict the probability of
making a riskier decision, the independent variables and the dependent variables were
modelled with a binary logistics regression. In this model, the probability of making risky
decisions was predicted. The functional relationship can be represented by the model
given below (Elliot, 2008):
𝑃(𝑌𝑖) =𝑒(𝛽0+ ∑ 𝛽𝑖𝑋𝑖)
1 + 𝑒(𝛽0+ ∑ 𝛽𝑖𝑋𝑖)
P(Yi) = Probability of Yi occurring where i equals to 1 to 5
e = Natural logarithm base
β0 = Interception at y-axis
βi =Regression coefficient for each X
X = Independent variable
Since the relationship is non-linear, the probability cannot be taken directly in the model.
But that relationship can be changed to linear through converting the probabilities to “log
odds” values which are the natural logarithm of odds value. Then the exponential of the
log odds was taken to identify the odd ratio. Odds are a ratio of probabilities.
According to Formular 02, Odd Ratio between event A and B is explained as a ratio of
the probability of event A to the probability of event B. For example, the ratio of the
probability of male drivers who use a mobile phone while driving to the probability of
female drivers who use a mobile phone while driving.
Results and Discussion
The analysis results presented in Table 1 show the results of the binary logistics
regression (log-odds values).
𝑂𝑑𝑑𝑠 =𝑃(𝐴)
𝑃(𝐵)

Sri Lanka Economic Research Conference 2020
152
Table 1: Summary of binary logistics regression analysis of log odd value
Independent Variables Y1 Y2 Y3 Y4 Y5
Gender (Male) 5.8*** 3.2*** 1.9*** 2.8*** 7.3
Age(18 to 25) ** * * ** ***
26 to 35 years 2.4 -2.1* -1.5** -1.7** 6.4***
36 to 45 years -1.7*** -3.1** -0.7** -0.9* 3.3*
46 to 55 years 0.4 -1.5* 0.1 -0.1 5.7**
Above 55 years -10.3** -2.4** -0.4* -3.1** -20.8*
Driving Experience (< 3 years) *** * *** *** **
3 to 6 years 4.7*** 0.5* -0.5* -2.2** -1.8*
6 to 9 years 8.0*** -1.2* -
2.6*** -2.1*** -3.8**
9 to 12 years -0.1* -1.9 -2.1** -3.1*** -3.6
More than 12 years -5.5 -1.9* -0.8* -3.5*** -0.9
Monthly Income (<50,000) - - - - ***
50,000 to 75,000 3.7** -0.9 0.9 1.1 6.2***
75,000 to 100,000 1.2 -2.2 0.9 -0.1 4.1***
100,000 to 150,000 4.8* -2.3 0.2 1.2 4.1
150,000 to 250,000 -22.9 -1.5 0.6 0.9 2.3
> 250,000 -22.5 -1.5 -0.1 -1.2 1.3
Working hours (0 to 20 hours) *** ** ** - ***
21 to 30 hours 0.6 0.7** 0.8* 0.1 -2.1
31 to 40 hours 7.6*** 1.5* 1.4** -0.5 -4.3***
41 to 50 hours 5.4*** 1.8* 1.3 1.1* 4.7***
More than 50 hours 4.6*** 1.6* 1.5** 0.3 2.1*
Utility based on Travel time -1.8*** -1.2** -0.2* -0.2* -0.1*
Utility based on Travel cost 1.5 -0.5 0.1 -0.1 -0.7
Utility based on Safety -0.2*** 0.1 -0.6** -0.2* -0.1**
Utility based on Convenience -0.1 -0.1* -0.1** -0.8** -1.8*
Utility based on Privacy 1.7** -0.1 1.1 0.1 0.6
Source: Author’s Estimations
The results of Table 1 above indicates that the relationship between the independent
variable ‘gender’ and the dependent variable ‘mobile usage intention while driving’ (Y1)
has a log odd value of 5.8 8 (Beta=5.8, p – value <0.01), where the independent variables
are coded as 0 = “Female” and 1 = “Male”. Beta value for male is given with refence to
female (Beta values shows the comparison between the actual category and the reference
category).. This positive highly significant value means that the risk-taking intention is

Happyness and Prosperity Hybrid
153
high among male drivers than female drivers. Further the estimated exponential of log
odd value is Exp (5.8) = 330.29 (p<0.01).
The value indicates that male drivers are nearly 330 times more likely to use a mobile
phone while driving than female drivers. In the same manner, the other log odd values of
the independent variables can be interpreted for all the relationships of dependent and
independent variables. The independent variables which have a significant log odds ratio
in more circumstances (more than 4 circumstances out of 5) show that those independent
variables have a significant relationship with the behavioural intentions of the driver.
Under circumstance Y5, gender is insignificant implying that overtaking from the left side
is against the road traffic rules and most drivers in the sample chosen follow it.
In comparison with the drivers aged 18 to 25, risk taking intention is reducing with aging.
This shows most of the young drivers make riskier decisions than the aged drivers.
Concerning gender and age group, the results of the present study are aligned with the
previous study by Leadbeater, Foran, & Grove-white (2008) who found major injuries
and fatalities in a collision are high among male youths who drives under the influence
of alcohol or any other similar substances. Compared to less experienced drivers
(experience less than 3 years), the drivers who have more than 3 years’ experience are
less inclined to make risky decisions. The findings also confirmed the results of a
previous study that claim less experienced drivers have more intention to unsafe driving
behaviors (Atombo et.al, 2016). Moreover, the decisions of drivers are significantly
correlated with working hours of drivers. The results indicate that the risk-taking
intention of drivers increases when the working hours of drivers increase. The finding of
the current study is useful for the design of vehicle insurance policies based on the age
and the year of driving experience of the drivers.
The results further show that the risk-taking intention is significantly related to the utility
of driving (satisfaction level of driving a car than travelling on other modes of transport)
based on travel time, safety, and convenience. The results show that the drivers who
satisfied with driving a car based on travel time are less prone to take risky decisions. The
drivers who feel safe while driving is less likely to make risky decisions. Further, the
drivers who feel convenient while driving are satisfied with driving a car, and the
satisfaction leads them to be risk adverse drivers. Based on the above finding,
countervailing traffic and demand management policies can be designed and
implemented to reduce motor traffic accidents.
330.29 =𝑃(𝑀𝑜𝑏𝑖𝑙𝑒 𝑝ℎ𝑜𝑛𝑒 𝑢𝑠𝑎𝑔𝑒 𝑖𝑛𝑡𝑒𝑛𝑡𝑖𝑜𝑛 𝑜𝑓 𝑀𝑎𝑙𝑒 𝑑𝑟𝑖𝑣𝑒𝑟𝑠)
𝑃(𝑀𝑜𝑏𝑖𝑙𝑒 𝑝ℎ𝑜𝑛𝑒 𝑢𝑠𝑎𝑔𝑒 𝑖𝑛𝑡𝑒𝑛𝑡𝑖𝑜𝑛 𝑜𝑓 𝐹𝑒𝑚𝑎𝑙𝑒 𝑑𝑟𝑖𝑣𝑒𝑟𝑠)

Sri Lanka Economic Research Conference 2020
154
Conclusion
This paper shows that there is a significant relationship between the drivers’ decision-
making behaviour with age, gender, driving experience, and working hours per week of
the driver. Further the results indicated that the utility based on travel time, safety and
convenience have a significant relationship with the risk-taking intention of drivers.
Moreover, the risk-taking drivers are found to be male while young drivers are more
inclined to make risky decisions. Further the drivers who work more hours are more likely
to make risky decisions. Further the drivers who spend less time in travelling and feeling
safer and more convenient are less likely to make risky decisions. The research findings
are found to be supporting the conclusions of some of the results of previous research.
Keywords: Decision making; risk aversion; socio-economic characteristics; utility of
driving
References
Atombo, C., Wu, C., Zhong, M., & Zhang, H. (2016). Investigating the motivational factors
influencing drivers' intentions to unsafe driving behaviours : Speeding and overtaking
violations. Transportation Research Part F: Psychology and Behaviour, 43, 104–121.
https://doi.org/10.1016/j.trf.2016.09.029
Benjamin Gardner, Charles Abraham, 2007, What drives car use? A grounded theory analysis of
commuters’ reasons for driving, Transportation Research Part F: Traffic
Psychology and Behaviour, Volume 10, Issue 3
Biswas, S., Ghosh, I. (2018) Modeling of the Drivers’ Decision-Making Behavior During Yellow
Phase. KSCE J Civ Eng 22, 4602–4614. https://doi.org/10.1007/s12205-018-0666-6
Breuer, W., Riesener, M., & Juliane, A. (2014). Risk Aversion vs . Individualism : What Drives
Risk Taking in Household Risk aversion vs . individualism : What drives risk taking in
household finance ?, (May), 0–29. https://doi.org/10.1080/1351847X.2012.714792
Elliot, M. (2008). Binary Logistic Regression Mark Tranmer.
Garcia-Altés, A., & Pérez, K. (2007). The economic cost of road traffic crashes in an urban setting.
Injury Prevention, 13(1), 65–68. https://doi.org/10.1136/ip.2006.012732
Kenneth B. Medlock & Ronald Soligo, 2002. "Car Ownership and Economic Development with
Forecasts to the Year 2015," Journal of Transport Economics and Policy, University of
Bath, vol. 36(2), pages 163-188, May.
Leadbeater, B. J., Foran, K., & Grove-white, A. (2008). How much can you drink before driving ?
The influence of riding with impaired adults and peers on the driving behaviors of urban

Happyness and Prosperity Hybrid
155
and rural youth, 629–637. https://doi.org/10.1111/j.1360-0443.2008.02139.x
Muttart, J. W. (2014). Factors that Influence Drivers ’ Response Choice, (May).
https://doi.org/10.4271/2005-01-0426
Wang, W., Mao, Y., Jin, J., Wang, X., & Guo, H. (2011). Driver’s various information process
and multi-ruled decision-making mechanism : a fundamental of intelligent driving shaping
model Received : 25-01-2011 Accepted : 20-04-2011, 4(3), 297–305.

Sri Lanka Economic Research Conference 2020
156
‘FADING BEFORE THEY BLOOM’: CHILD MORTALITY IN SRI
LANKA IN HOUSEHOLDERS
Liyanage, R.*, Adikari, H., Wanigarathna, N., Udalagama, R., Jayathilaka, R. Faculty of Business, Sri Lanka Institute of Information Technology, Sri Lanka
*Corresponding author: [email protected]
Introduction
The future human capital of any country is “children”. Hence, every child in this world
has a right to have a good quality life. Children are a valuable investment in a country. In
1990, 12.6 million child deaths have taken place but in 2016, it drops to 5.6 million.
Basically, universal child mortality rate has declined by over half between 1990 and 2016
(Rodriguez 2016). This progress in child survival indicates the development of global
health. However, at present, globally approximately 15,000 under five-year old deaths
occur per day and 5.3 million annually. Majority occur in Sub-Saharan Africa and South
Asia. Moreover, the Department of Census and Statistics (2016) highlighted that infant
mortality or early childhood mortality is a measure of socioeconomic development of a
country; also, it’s a good measure of the quality of life. Many rigorous studies on child
mortality regarding household income and expenditure, household wealth and also
socioeconomic determinants of child mortality have been conducted especially in the
developing countries in Asian and African regions (Nyamuranga and Shin 2019), but
limited scale in Sri Lanka.
Research Problem
Hence, research studies on infant and child mortality are limited in a Sri Lankan context.
Thus, a research gap exists regarding this subject. During the recent past, there are hardly
found research papers in Sri Lankan context which has focused on socioeconomic and
demographic characteristics on child mortality (Trussell and Hammerslough 1983). Thus,
this study focuses to identify socioeconomic and demographic characteristics of the
households on child death. Research question of the study is “what are the socioeconomic
and demographic characteristics of the households affecting child death?”.
This research conducted in local context is of immense value to policy makers of Sri
Lanka, as a low-middle income country especially due its developing economy. This is a
opportunity to address how location of residence is related to child mortality in Sri Lanka.
The following advantages can be gained from this research.
1. Government and Health sector of Sri Lanka can identify the general physical
health status of the country and potential areas to further develop health

Happyness and Prosperity Hybrid
157
policies based on new findings.
2. Government, public and private organizations can collaborate and mutually
develop health facilities in remote areas, through governmental subsidy
programs and welfare benefits.
Objective
To investigate the socioeconomic and demographic characteristic of householders
affecting child mortality.
Methodology
In this study, the quantitative approach is adopted based on data of the ‘Household
Income and Expenditure Survey’ (HIES) conducted in 2016, by the DCS in Sri Lanka.
This study is about how many households have experienced on child mortality in each
province and their socioeconomic and demographic characteristics. The ‘STATA’
statistical software has been used to measure outcomes and generate results on gathered
data. With the use of Pearson’s Chi-Square test, this study can identify any significant
association among the socioeconomic and demographic variables.
Pearson’s Chi-Square formula:
𝑐2 = Σ
(𝑂𝑖−𝐸𝑖)2
𝐸𝑖
O = The observed (actual) value
E = The expected value
Results and Discussion
According to the HIES survey, out of the 21,756 households, 147 child deaths (0.68%
of the total sample population) were reported in 2016 in Sri Lanka. According to
Pearson’s Chi-Square test, P-value has been considered on each variable and identified
that the provinces where P-value is less than the significant level. Hence, it is closely
related with child mortality. Further, it illustrates that out of the total population of
households that have experienced child deaths, most of them were from the ‘Eastern
Province’ which is 1.23 and the least number of child deaths have been taken place in
the ‘Western Province’ with 0.36. Apart from this, ‘North Central and Uva’ are also
leading provinces which have faced many child deaths cases. This finding is completely
against with the findings of Rajindrajith et al. (2009) which has found western province
is the leading province for child mortality in Sri Lanka. However, sufficient evidence is
unavailable to conclude that ‘sectors of the country’ is associated with child mortality;

Sri Lanka Economic Research Conference 2020
158
hence, the P-value is greater than the significant level.
Table 1: Variation of child mortality on sectors and provinces of Sri Lanka
Sector and Province-
wise
Child Death Status Total
Child Death – Yes
%
Child Death – No
%
%
Sector-wise comparison
Urban 0.58 99.42 100
Rural 0.68 99.32 100
Estate 0.86 99.14 100
*Province-wise comparison
Western 0.36 99.64 100
Central 0.72 99.28 100
Southern 0.60 99.40 100
Northern 0.60 99.40 100
Eastern 1.23 98.77 100
North Western 0.48 99.52 100
North Central 1.17 98.94 100
Uva 1.06 98.94 100
Sabaragamuwa 0.67 99.33 100
Note: * Differences are statistically significant at α=0.05 levels Pearson’s Chi-Square.
Source: Authors’ illustration based on the HIES 2019
Table 02 demonstrates the affected and non-affected households from child deaths based
on different socioeconomic and demographic characteristics. According to the Chi-
Square test, P-value has been considered on each variable and identified that the
religion, ethnicity and age of the head P-values are less than the significant level; hence,
these factors are closely related with child mortality. P-value of household head’s sex,
household head’s education and household head’s employment are greater than the
significant level, and sufficient evidence is unavailable to conclude that these variables
are associated with child mortality. There is a high possibility to have experienced child
mortality among the households where the head’s age is below 30 years. Sri Lankan
Moors and Islam population have the highest possibility of child deaths. This would be
due to maintaining higher level of fertility rate than the case of other ethnic group.

Happyness and Prosperity Hybrid
159
Table 2: Demographic characteristics related to child mortality
Demographic-wise
Child Death Status Total
Child Death –
Yes %
Child Death
– No %
%
Household head’s sex
Male 0.63 99.37 100
Female 0.82 99.18 100
Household head’s employment level
Gov. and semi gov. 0.30 99.70 100
Private 0.74 99.26 100
Own account worker 0.73 99.27 100
Household head’s education
No schooling 0.00 100.00 100
Grade 1-11 0.73 99.27 100
O/L and A/L 0.39 99.61 100
Above degree 0.74 99.26 100
*Ethnicity
Sinhalese 0.56 99.44 100
Sri Lankan/Indian
Tamil
0.79 99.21 100
Sri Lankan Moors 1.43 98.57 100
Malay/Burgher/Other 0.0 100 100
*Religion
Buddhist 0.58 99.42 100
Hindu 0.81 99.19 100
Islam 1.39 98.61 100
Roman
Catholic/Other
0.49 99.51 100
*Household head’s age
Category 01 (<30) 1.16 99.84 100
Category 02 (31-60) 0.66 99.34 100
Category 03 (61-99) 0.64 99.36 100
Total 0.68 99.32 100
Note: * Differences are statistically significant at α=0.05 levels Pearson’s Chi-Square.
Source: Authors’ illustration based on the HIES 2019

Sri Lanka Economic Research Conference 2020
160
Conclusions
This study investigates the socioeconomic and demographic characteristics of
households affected by child mortality. Findings of this study demonstrate that a person
living in the Eastern Province has a high probability of experiencing child mortality.
Significant relationships exist among the variables - religion, ethnicity and age of the
head with child mortality. Nevertheless, province wise significant relationships were
noted with regard to child mortality, mostly in the ‘Eastern Province’ which is 1.23 and
the least number of child deaths have been taken place in the ‘Western Province’, which
is 0.36. Sectors of the country, household head’s sex, household head’s education and
household head’s employment do not have a significant effect on child mortality.
Therefore, this research study provides insights to both the government and policy
makers to investigate on public health and well-being for all people in Sri Lanka.
Additionally, it is recommended to improve the health facilities specially among the
estate population and identified provinces that can pose a high-risk on child mortality.
Keywords: Child mortality; Child survival; HIES, Householders; Under-five mortality
References
Clark, S., & Hamplova, D. (2013). Single Motherhood and Child Mortality in Sub-Saharan Africa:
A Life Course Perspective. Demography, 50. doi:10.1007/s13524-013-0220-6 [Accessed:
05th January 2020]
Durkin, M. S., Davidson, L. L., Kuhn, L., O'connor, P. & Barlow, B. (1994). Low-income
neighborhoods and the risk of severe pediatric injury: a small-area analysis in northern
Manhattan. American Journal of Public Health [Online], pp.84, 587-592. [Accessed: 09th
January 2020]
Ezeh, O., Agho, K., Dibley, M., Hall, J. & Page, A. (2015). Risk factors for postneonatal, infant,
child and under-5 mortality in Nigeria: A pooled cross-sectional analysis. BMJ open
[Online], pp.5, e006779. [Accessed: 18th January 2020]
Hossain, K. & Mondal, N. J. A. J. M. S. (2009). A study on the health factors of infant and child
mortality in Rajshahi, Bangladesh. [Online] pp.1, 82-87. [Accessed: 14th January 2020]
Iram, U. & Butt Muhammad, S. (2008). Socioeconomic determinants of child mortality in
Pakistan: Evidence from sequential probit model. International Journal of Social
Economics [Online], pp.35, 63-76. [Accessed: 18th January 2020]
Kaberuka, W., Mugarura, A., Tindyebwa, J. & Bishop, D. (2017). Factors determining child
mortality in Uganda. International Journal of Social Economics [Online], pp.44, 633-
642. [Accessed: 11th January 2020]

Happyness and Prosperity Hybrid
161
Mogford, L. (2004). Structural determinants of child mortality in sub-Saharan Africa: A cross-
national study of economic and social influences from 1970 to 1997. Social biology, 51,
94-120. doi:10.1080/19485565.2004.9989089 [Accessed: 17th January 2020]
Nyamuranga, Chamunorwa, and Jaeun Shin. 2019. "Public health expenditure and child
mortality in Southern Africa." International Journal of Social Economics 46 (9):1137-
54.
Rajindrajith, Shaman, Sachith Mettananda, Deshan Adihetti, Ruwan Goonawardana, and
Niranga Devanarayana. 2009. "Neonatal mortality in Sri Lanka: Timing, causes and
distribution." 22:791-6. doi: 10.3109/14767050902994549.
Rodriguez, D. "Children: Improving Survival and well-being." https://www.who.int/news-
room/fact-sheets/detail/children-reducing-mortality.
Trussell, James, and Charles Hammerslough. 1983. "A hazards-Model analysis of the covariates
of infant and child mortality in Sri Lanka." Demography 20 (1):1-26. doi:
10.2307/2060898.

Sri Lanka Economic Research Conference 2020
162
IMPACT OF THE GRADE FIVE SCHOLARSHIP EXAMINATION
ACHIEVEMENTS ON THE PERFORMANCE OF SECONDARY
SCHOOL EDUCATION IN SRI LANKA
Keembiyahetti N. Department of Economics, University of Ruhuna, Sri Lanka
Introduction
The Grade Five Scholarship Examination (G5) is a highly competitive examination
conducted by the Department of Examinations of Sri Lanka for the students in the final
year of primary school. (Usually ages 9–10). The G5 scholarship examination, introduced
in 1948, aimed to meet two objectives, namely, admitting talented students to popular
schools; and providing bursaries to brilliant but economically disadvantaged students. In
recent years the examination has deviated from its prime objectives creating unnecessary
stiff competition and it has also observed that in most schools, all students are being
pressurized in to upgrade Grade Five Scholarship Examination results irrespective of the
delivery or cognitive development of students. (Circular, 08/2019) At present the exam
is taken by students in both privileged and underprivileged schools, as well as across
high- and low-income groups, regardless of its original objectives. The Ministry of
Education issued a circular (08/2019) stating that the Grade 5 scholarship examination is
no longer mandatory and all students except for the underprivileged will not be forced to
face the Grade 05 scholarship examination.
This research is intended to examine the impact of G5 examination achievements on the
performance of secondary education of the child. The finding will be useful for the policy
makers to decide whether the G5 examination to be continued or not, which has been a
critical policy debate under educational reforms of the country.
Research Problem
It has been found that the pass rate of high-income families is higher than that of low
income families. (See, figure 1) According to the statistics of the Department of
Examinations, only about 10% of the children who sit for the examination qualify for
bursaries, or gain entry into prestigious schools. For example, it was only 9.5% in 2016
and 9.46% in 2017.
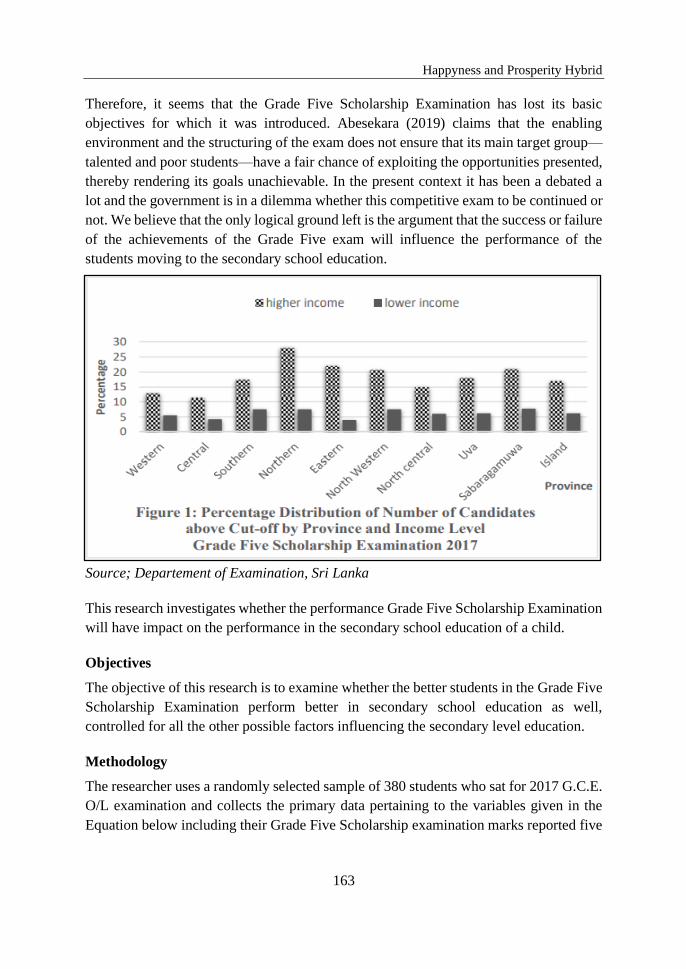
Happyness and Prosperity Hybrid
163
Therefore, it seems that the Grade Five Scholarship Examination has lost its basic
objectives for which it was introduced. Abesekara (2019) claims that the enabling
environment and the structuring of the exam does not ensure that its main target group—
talented and poor students—have a fair chance of exploiting the opportunities presented,
thereby rendering its goals unachievable. In the present context it has been a debated a
lot and the government is in a dilemma whether this competitive exam to be continued or
not. We believe that the only logical ground left is the argument that the success or failure
of the achievements of the Grade Five exam will influence the performance of the
students moving to the secondary school education.
Source; Departement of Examination, Sri Lanka
This research investigates whether the performance Grade Five Scholarship Examination
will have impact on the performance in the secondary school education of a child.
Objectives
The objective of this research is to examine whether the better students in the Grade Five
Scholarship Examination perform better in secondary school education as well,
controlled for all the other possible factors influencing the secondary level education.
Methodology
The researcher uses a randomly selected sample of 380 students who sat for 2017 G.C.E.
O/L examination and collects the primary data pertaining to the variables given in the
Equation below including their Grade Five Scholarship examination marks reported five

Sri Lanka Economic Research Conference 2020
164
years back in 2011. Sample comprises of nearly 72% of G.C.E O/L passed students and
nearly 45% of the G5 scholarship examination passed students.
𝑂𝐿𝑛 = 𝐶 + ∑ 𝛽𝑛15𝑛=1 𝑋𝑛 + 𝑒
where,
OL Results
index varying from 0 to36, which is the sum of A=4, B=3, C=2,
S=1, W=0
C C Intercept
X1 SEX 1 If male, 0 Otherwise
X2 TUTION Private tuition supported number of subject
X3 FJOB 1 if related to Education, 0 otherwise
X4 MJOB 1 if related to Education, 0 otherwise
X5 FED 1-12 Numbers assigned by UGC- SLQF (SLQL / NVQL)
X6 MED 1-12 Numbers assigned by UGC- SLQF (SLQL / NVQL)
X7 INCOME Family income/month
X8 FSIZE Number of defendants excluding child
X9 SPORT Average number of hours spent for sports per week
X10 PARTS Average number of hours spent for performing arts per week
X11 GROUP 1 if has a study group, 0 otherwise
X12 CSIZE Number of students in OL Class
X13 MEDIUM 1 if English, 0 Otherwise
X14 NATIONAL 1 if National school, 0 Otherwise
X15 G5 Grade 5 scholarship exam marks
The secondary data sources include the annual School Census of government schools
published by the Ministry of Education for the year 2017, and the datasets on 2011 G5
scholarship exam performance. The secondary school performance of each student was
measured by his/her G.C.E. O/L results converted to an index. For the cross-sectional
data, the following multiple regression equation was defined incorporating the other
possible variables that influence O/L performance.
Results and discussions
Table 1 contains the estimated marginal effects of each explanatory variable to the
variation in the dependent variable.

Happyness and Prosperity Hybrid
165
Table 1: Estimated Results of Multiple Regressions for Equation 1
Dependent Variable: OL Method: Least Squares Sample: 1 3814, Included observations: 380
Variable Coefficient t-Statistic rob.
C 6.940 2.491 0.013 **
SEX -1.673 -2.104 0.036 **
TUTION 2.444 1.669 0.096 *
FJOB -1.558 -1.726 0.085 *
MJOB 0.916 0.870 0.385 FED 0.034 0.099 0.921 MED 0.991 2.863 0.004 ***
INCOME 0.000 0.468 0.640 FSIZE -0.171 -0.617 0.538 SPORT -1.424 -5.570 0.000 ***
PARTS 1.201 1.512 0.131 GROUP -0.003 -0.060 0.952 CSIZE 0.013 0.326 0.745 MEDIUM 2.693 1.920 0.056 *
NATIONAL 0.582 0.637 0.525 G5 0.112 8.167 0.000 ***
R-squared 0.643
Adjusted R-squared 0.515 S.E. of regression 5.715 F-statistic 12.098 Prob(F-statistic) 0.000
Source: Authors’ estimations
The regression results reveal that mother’s occupation, fathers’ education level, family
income, family size, class size, involvement in performance arts, being connected to a
study group, school type will have no significant influence on the secondary level
educational achievement measured by O/L results. However, mother’s education level,
attending private tuition, and doing in English medium have significantly positive impact
on the secondary level educational achievements. On contrary, student’s involvement in

Sri Lanka Economic Research Conference 2020
166
sports will have a significant negative influence on the secondary education. More
importantly, the G5 Scholarship exam performance captured by student’s total marks has
statistically significant influence on the secondary level educational achievement
measured by O/L results. More precisely, one additional mark obtained in G5
examination will be reflected as a raise in the O/L index value by 0.112 meaning that 10
additional marks in G5 examination will be reflected as a shift of one grade above for one
subject in O/L results, i.e., for example the B-pass will be lifted to A-pass.
Conclusion
This study was done on the null hypothesis that the G5 examination results of the child
will have no influence on his/her achievements in the secondary education. The null
hypothesis is rejected at 1% significant level favoring the alternative that the Grade Five
scholarship examination has a significant impact on the child’s secondary education.
More precisely, controlled for all the other variables concerned, one additional mark
obtained in G5 examination will be translated to raise the O/L index value by 0.112
meaning that 10 additional marks in G5 examination will be reflected as a shift of one
grade above for one subject in O/L results. Therefore, despite the fact that G5 has now
lost its original goals, this research strongly recommends the existence of G5 scholarship
examination would be useful to improve the secondary school level academic
achievements of the child. This is in contrast opposite to the Education Ministry Circular
08/2019 and to the President has made headlines in early 2020 declaring an intention by
the Government to abolish the Grade Five Scholarship examination.
However, the educational policy makers and parents need to be well aware of the negative
side of the excess pressure putting on children to make them motivated to pass the G5.
Also, if G5 continues, the government needs to address the disparities among primary
schools in physical and human resource facilities and the unequal access to educational
possibilities in the city vs. suburbs.
Keywords: Grade five Scholarship, OL examinations, Secondary education, Primary
education
References
Abayasekara, A. (2019). Sri Lanka’s Grade Five Scholarship Examination: An Evaluation of its
Effectiveness and Relevance Left Behind in Sri Lanka - Colombo: Institute of Policy
Studies of Sri Lanka.
Circular 08/2019, Grade Five Scholarship Examination, Ministry of Education, Sri Lanka

Happyness and Prosperity Hybrid
167
Ministry of Education of Sri Lanka. (2017). School census – 2017 June Battaramulla: Ministry of
Education of Sri Lanka.
Ministry of Education of Sri Lanka. (2018). Examination results of 2008 and 2017 grade five
scholarship examination top scorers

Sri Lanka Economic Research Conference 2020
168
ESTIMATION OF THE OUT-OF-POCKET EXPENDITURE
DURING EARLY PREGNANCY: EVIDENCE FROM RAJARATA
PREGNANCY COHORT, ANURADHAPURA
Gunarathne, S.P.1*, Wickramasinghe, N.D.1, Agampodi, T.C.1, Prasanna, R.P.I.R.2,
Agampodi, S.B.1
1Department of Community Medicine, Rajrata University of Sri Lanka 2Department of Economics, Humanities, Rajarata University of Sri Lanka,
*Corresponding author: [email protected]
Introduction and Research Background
The cost of illness studies or burden of illness studies in health economics describe three
major types of economic cost which relate to health care; the direct cost, the indirect cost,
and the intangible cost (Chaikledkaew, 2011; Chandrakar et al., 2017; Yousefi et al.,
2014). The direct cost can be defined as all the monetary expenses or out-of-pocket
expenditure (OOPE) that occurred as a result of disease or any other health care seeking
(Chandrakar et al., 2017). According to the World Health Organization (WHO), the
OOPE is defined as “any direct payout by households, including gratuities and in-kind
payments, to health care providers of pharmaceuticals, therapeutic appliances, and other
goods and services whose primary intent is to contribute to the restoration or
enhancement of the health status of individuals or population groups”.
The direct cost component is identified as an important type as it contains all the monetary
payments that creates huge economic burden over household budget, leading people into
poverty and indebtedness, changing the consumption pattern, misuse of health care
resources and creates a barrier to access health care facilities for lower-income people
(Leone et al., 2013). The direct cost or the OOPE over medical care can be divided into
two groups; direct medical expenses and direct non-medical expenses. Direct medical
OOPE includes the cost of the consultation, laboratory tests, treatments, drugs, and
consumables. (Leone et al., 2013). Direct non-medical OOPE is comprised of the cost of
traveling, food and lodging of the patient or family members/accompanying person
(Acharya, 2016; Chandrakar et al., 2017; Leone et al., 2013). Evidence suggests that most
of the countries with a free health care policy also have a high-level of OOPE (Acharya,
2016).
Sri Lanka exerts free government health services from the early 1900s (De Silva et al.,
2016). It accommodates free health services by allocating an annual average budget of

Happyness and Prosperity Hybrid
169
around 163,079.6 million rupees during the last three years, which accounted for 1.6% of
the GDP in 2019 (Central Bank of Sri Lanka, 2019).
There is a lack of evidence in Sri Lanka focusing on the comprehensive analysis of OOPE
in pregnancy. It is reported that most pregnant mothers seek specialized care even in the
absence of a clear clinical indication, especially in the private health sector at least once
in their pregnancy (Agampodi et al., 2017). In Sri Lanka, for maternal care and life-
threatening complications, people do not care much about the cost while seeking medical
care. However, the literature suggests that due to financial difficulties pregnant mothers
from low socio-economic backgrounds are unable to consult private medical care even if
they intend to (Agampodi et al., 2017).
In this background, a main question remained unanswered in the Sri Lankan health care
sector is whether pregnant mothers have OOPE despite having access to free health care
system; thus, this resserach was conducted to explore this issue.
Objective/s
The aim of this study was to determine the OOPE of pregnant mothers during the first
trimester and the study focused on the following specific objectives.
(I) To estimate the OOPE during early pregnancy
(II) To determinethe associated factors of OOPE during early pregnancy
(III) To identify the sources of financing for OOPE
Methodology
The study was carried out as a part of a large cohort study; the Rajarata Pregnancy Cohort
(RaPCo) in all 22 Medical Officer of Health (MOH) areas in Anuradhapura district.
Pregnant mothers in the first trimester (n=1283) registered in the field antenatal clinics
were recruited to this study as a part of the RaPCo.
The study used the first part of the survey and the findings are limited to the data related
to the first trimester pregnant mothers. When compared to the other two trimesters of
pregnancy, the first trimester (or the early pregnancy period) has unique health care
expenses such as the cost for pregnancy identification/confirmation and the cost for the
booking visit (the first clinic visits in which a number of investigations are carried out).
A pre-tested, self-administered questionnaire was used to collect data on pre-pregnancy
household income and expenditure as well as the pregnancy cost during the first trimester.

Sri Lanka Economic Research Conference 2020
170
Under the pregnancy cost, the data was gathered as direct medical and direct non-medical
cost. Cost for consultation, cost for medicines, cost for laboratory investigations and
hospital charges were considered as direct health expenses.
Travelling cost, cost for food and refreshment, cost for accompanying persons and other
cost were considered as the direct non-medical cost. In the first trimester, all these direct
and indirect cost were associated with pregnancy identification/confirmation, booking
visit and maternal morbidities.
Data analysis was done by using the IBM SPSS Version 23 software. Descriptive
statistics with mean (SD), median (IQR) was used to present the OOPE. Mann-Whitney
U test and Spearman rank correlation were employed to assess the statistical significance
of associated factors of OOPE.
Result and Discussion
Sample characteristics
The mean (SD) age of the pregnant mothers was 28.2 (5.6) years. Among the study
sample, only 14.9% (n=191) of mothers were employed and most of them (56.0%, n=
107) were employed in the government sector. The mean (SD) and the median (IQR)
monthly income of the employed mothers were LKR 31,534.08 (18,730.50) and LKR
32,000.00 (20,000.00-36,000.00) respectively.
The mean (SD) and median (IQR) of monthly household income of the sample were LKR
51,808.11 (42,882.91) and LKR 40,000.00 (30,000.00-58,000.00) respectively. In
addition, the mean (SD) and median (IQR) of monthly expenditure of the household were
LKR 31,882.48 (20,628.65) and LKR 28,200.00 (19,380.00-40,000.00) respectively.
OOPE in the First Trimester
Table 1 shows the mean (SD) and the median (IQR) expenses that mothers had to bear
during the first trimester of pregnancy and the breakdowns for the expenses are
summarized.
The total pregnancy cost during the first trimester over total household income is 4.8%.
In addition, the total pregnancy cost over total household income for different income
groups (lower income quintile one to higher income quintile five) are 11.4%, 8.8%, 5.1%,
4.7% and 2.7% respectively.

Happyness and Prosperity Hybrid
171
Table 1: Out-of-pocket expenditure during the first trimester and the breakdown of
expenses
Source: Authors’ estimations
Figure 1 further illustrates the share of OOPE for direct medical and direct non-medical
costs. It shows that the direct medical cost; consultation cost, cost for medicine, cost for
laboratory investigation and the hospital charges were higher than the direct non-medical
cost; travelling cost, cost for food and refreshments, cost for accompanying person/s and
other cost, which accounted for 73.7% of cost; travelling cost, cost for food and
refreshments, cost for accompanying person/s and other cost, which accounted for 73.7%
of the OOPE.
Cla
ssif
ica
tio
ns
Reasons for seeking health care
and the breakdown for
expenses
Number of
mothers
(% of the sample)
Expenses (LKR)
Mean (SD) Median (IQR)
OO
PE
d
urin
g
the
early
preg
na
ncy
(Cla
ssif
ica
tio
n I
)
Pregnancy
identification/confirmation 1,283 (100.0%)
1,016.31
(2,095.9)
190.00
(50.00-850.00)
Booking Visit 1,283 (100.0%) 1,835.26
(3,147.26)
500.00
(200.00-2,650.00)
Maternal morbidities: for health
care seeking 316 (24.6%)
2,308.03
(3,402.57)
1,074.50
(500.00-3,000.00)
Maternal morbidities: for
hospitalization 103 (8.0%)
5,834.2
(7,505.39)
4,000.00
(1,835.00-5,975.00)
Brea
kd
ow
n o
f ex
pen
ses(
Cla
ssif
ica
tio
n I
I)
Dir
ect
med
ica
l co
st
Cost for consultation 356 (27.7%) 2,882.35
(3,516.12)
2,600.00
(1,500.00-3,000.00)
Cost for medicines 478 (37.3%) 1,512.30
(2,214.33)
665.00
(200.00-2,000.00)
Cost for laboratory
investigations 563 (43.9%)
1,275.77
(1,914.81)
400.00
(160.00-2,500.00)
Hospital charges 10 (0.8%) 1,210.00
(952.72)
1,000.00
(500.00-1,200.00)
Dir
ect
no
n-m
ed
ical
co
st Cost for travelling 923 (71.9%)
710.64
(1,265.43)
300.00
(150.00-700.00)
Cost for food 741 (57.8%) 661.42
(1,484.60)
300.00
(150.00-550.00)
Cost for companions 393 (30.6%) 721.96
(1,494.94)
200.00
(100.00-500.00)
Other cost 917 (71.5%) 361.33
(913.35)
60.00
(30.00-150.00)
Total out-of-pocket expenditure during first
trimester 1,283 (100%)
2,495.58
(3,909.71)
940.00
(300.00-3,250.00)

Sri Lanka Economic Research Conference 2020
172
Source: Authors’ illustration
Figure 1: Share of expenses of out-of-pocket expenditure duringthe first trimester
in pregannat mothers in the sample
Associated Factors of OOPE during early pregnancy
We performed the Kolmogorov-Smirnov test to assess the distribution of the variable ‘the
total pregnancy cost’. The test result showed that the data are not normally distributed
(p<0.05). Therefore, we used the Mann-Whitney U test, a non-parametric test to assess
the statistical significance of associations.
The results show that mothers who are employed, mothers who had maternal morbidities
and mothers who were in their first pregnancy had statitscally significant higher OOPE
than their counterpats. However, the results suggest that there was no statistically
significant association between OOPE and poverty.

Happyness and Prosperity Hybrid
173
Table 2: Associations of OOPE during early pregnancy
Test Hypothesis Mean (SD) [LKR]
Median
(IQR)
[LKR]
Mann-
Whitney
Statistics
(p Value)
There is a deference between
OOPE in employed mothers
and others*
Employed
(n1=191)
2,871.32
(3,537.54)
1,250.00
(390.00-
4,375.00) 95336.5
(0.058) Not employed
(n2=1092)
2,429.86
(3,969.07)
905.00
(300.00-
3,000.00)
There is a deference in
OOPE between first
pregnancy mothers and
others**
First pregnancy
(n1=470)
3,039.33
(4,042.22)
1,522.50
(500.00-
4,185.00) 153004.5
(0.001) 2ndpregnancy or
above (n2=813)
2,181.24
(3,798.15)
730.00
(250.00-
2,600.00)
There is a deference in
OOPE between mothers who
had maternal morbidities and
others**
With maternal
morbidities
(n1=1070)
2,588.60
(3,998.36)
985.00
(335.00-
3,600.00) 97026.5
(0.001) Without
maternal
morbidities
(n2=213)
2,028.32
(3,399.98)
700.00
(150.00-
2,170.00)
There is a deference in
OOPE between mothers who
are above the national
poverty line (USD 2.6 per
day) and others
Below poverty
line (n1=9)
2,693.89
(3,104.23)
1,120.00
(600.00-
6,350.00) 5180.5
(0.618) Above poverty
line (n2=1274)
2,494.18
(3,915.75)
937.50
(300.00-
3,250.00)
There is a deference in
OOPE between mothers who
are above the upper middle
income countries’ poverty
line (USD 5.5 per day) and
others
Below poverty
line (n1=48)
3,003.54
(3,959.26
995.00
(290.00-
4,255.00) 28524
(0.658) Above poverty
line (n2=1235)
2,475.84
(3,908.06)
935.00
(300.00-
3,235.00)
*significant under the 0.1 level of confidence, **Significantunder the 0.01 level of confidence
Source: Authors’ estimations

Sri Lanka Economic Research Conference 2020
174
Employed mothers have high ability to spend while others are depending on the
household. Evidence reported that the people with higher socio-economic status demand
better and quality health care services and they prefer to go for the private health facility
rather than public hospitals (Chandrakar et al., 2017; Reichmann and Kirkbride, 2008;
Wagstaff, 2002; Van et al., 2007).
In addition, the OOPE of having maternal morbidities (nausea and vomiting, anemia,
infections, hypertension, diabetes during pregnancy, mental health conditions, and
hyperemesis gravidarum etc.) seems to be unavoidable since preventive strategies
generate a higher cost, and the cost can be transferred from individuals to public or private
health care service providers as a direct payment. (Dereure, 2000; Reichmann and
Kirkbride, 2008; Raitanen, 2012; Chen, 2009; Ciani, 2013).
Furthermore, mothers who are in their first pregnancy have high expenses than others. It
could be assumed that with the experience of the previous pregnancies, mothers may be
able to adapt easures to reduce their OOPE.
Spearman rank correlation test showed that there was a positive, yet statitcally not
significant correlation between total monthly household income and the OOPE in the first
trimester (r=0.011, p=0.704). However, the correlation between monthly household
expenditure and the OOPE was also positive and statistically significant (r=0.059,
p=0.034).
Sources of Financing for Health Expenses
During the first trimester of pregnancy, mothers and the family have to bear health costs
due to clinic visits and unexpected expenses for major health issues and emergencies.
Following table shows the sources of money and the amounts allocated for out-of-pocket
health expenses
Most of mothers draw money from the money alloacated for day-to-day transactions and
from their savings. Some mothers have to move money from investments, sell their assets
(eg; gold), and from insuarance. In addition, some mothers have to depend from others;
by getting informal loans, aids and from the employer.

Happyness and Prosperity Hybrid
175
Table 3: Sources of financing for health expenses
Source/allocation of money
Number
of
mothers
(%)
Amount (LKR)
Mean (SD) Median (IQR)
From transcation allocation (kept
for day-to-day transactions)
323
(25.2%)
4,297.69
(7,314.43)
2,500.00
(1,000.00-
5,000.00)
From savings (kept for
emergencies)
181
(14.1%)
4,951.10
(7,673.23)
2,500.00
(1,000.00-
5,000.00)
From investment allocation (kept
for invesiting in businesses)
16
(1.2%)
10,443.75
(13,165.26)
5,000.00
(3,000.00-
13,500.00)
From informal loans 15
(1.2%)
12,035.71
(22,953.52)
5,000.00
(3,000.00-
10,000.00)
From financial aids 10
(0.8%)
1,833.33
(661.44)
2,000.00
(1,500.00-
2,000.00)
By selling assets 7 (0.5%) 16,166.67
(18,540.95)
8,000.00
(5,000.00-
25,000.00)
From employer 8 (0.6%) 12,228.57
(17,325.29)
5,000.00
(2,800.00-
12,000.00)
By covering insuarance 1 (0.1%) - -
Source: Authors’ estimations
Conclusion
Among the study sample, approximately one sixth of the mothers are employed and most
of them are employed in the government sector. The mean OOPE during the fisrt
trimenster is LKR 2,495.58, which accounts for 4.8% of the monthy household income.
Among the deferent income groups, the lower income groups has higher share (11.4%)

Sri Lanka Economic Research Conference 2020
176
of OOPE over household income than others. According to the OOPE classification,
direct health care cost has a higher portion than the direct non-medical cost during the
early pregnancy. Employment status, having maternal morbidities and the first
pregnancy are identified as significant associated factors of high OOPE during the early
pregnancy (p<0.1). Further, monthly household expenditure is significantly associated
with early pregnancy OOPE (p<0.05). The source of money comes from different
allocations of the household; from transaction, savings, investments, and by selling
assets.
Hence, the study findings highlight that even in the background of a free health care
policy in Sri Lanka; OOPE during early pregnancy is high. Thus, further exploratory
studies are needed to identify reasons for OOPE associated with maternal health care to
further improve the maternal health service provision in Sri Lanka.
Keywords: Anuradhapura, Cost, Early Pregnancy, Free Health, Out-of-pocket
Expenditure
Acknowledgement
This research was supported by the Accelerating Higher Education Expansionand
Development (AHEAD) Operation of the Ministry of Higher Education, SriLanka funded
by the World Bank.
References
Acharya, J. (2016). Are Free Maternity Services Completely Free of Costs? Osong Public Health
and Research Perspectives, 7(1), 26–31. https://doi.org/10.1016/j.phrp.2015.11.002
Agampodi, T. C., Rheinländer, T., Agampodi, S. B., & Glozier, N. (2017). Social capital and
health during pregnancy ; an in-depth exploration from rural Sri Lanka. 1–19.
https://doi.org/10.1186/s12978-017-0349-7
Central Bank of Sri Lanka 2019 Key Social Indicator vol I
Chaikledkaew, U. (2011). Cost Assessment. In Cost Assessment of Health Intervention and
Technology Assessment Program. https://doi.org/10.1002/9781118015490.ch7
Chandrakar, A., Soni, G. P., Sinha, A. K., Jain, K., Panda, P. S., & Pradhan, S. K. (2017).
Estimation of Out of Pocket Expenditure Under Janani Shishu Suraksha Karayakram (
JSSK ) in Rural Block of Chhattisgarh : A Community Based Cross-Sectional Study. 8(2),
84–89.
Chen Y, Quick W W, Yang W, Zhang Y, Baldwin A, Moran J, Moore V, Sahai N and Dall T M

Happyness and Prosperity Hybrid
177
2009 Cost of gestational diabetes mellitus in the united states in 2007 Popul. Health Manag.
12 165–71
Ciani O, Grassi D and Tarricone R 2013 An economic perspective on urinary tract infection: The
“costs of resignation” Clin. Drug Investig. 33 255–61
De Silva, A., Ranasinghe, T., & Abeykoon, P. (2016). Universal health coverage and the health
Sustainable Development Goal: achievements and challenges for Sri Lanka. WHO South-
East Asia Journal of Public Health, 5(2), 82–88. https://doi.org/10.4103/2224-
3151.206257
Galtier-Dereure F, Boegner C and Bringer J 2000 Obesity and pregnancy: Complications and cost
Am. J. Clin. Nutr. 71 1242–8
Kolu P, Raitanen J, Rissanen P and Luoto R 2012 Health care costs associated with gestational
diabetes mellitus among high-risk women - results from a randomised trial BMC Pregnancy
Childbirth 12
Leone, T., James, K. S., & Padmadas, S. S. (2013). The burden of maternal health care expenditure
in India: Multilevel analysis of national data. Maternal and Child Health Journal, 17(9),
1622–1630. https://doi.org/10.1007/s10995-012-1174-9
Reichmann J P and Kirkbride M S 2008 Nausea and vomiting of pregnancy: Cost effective
pharmacologic treatments Manag. Care 17 41–5
Van D, O O, ER R, A S, SE A and C G 2007 Catastrophic Payments for Health Care in Asia
Health Econ. 16 1159–84
Wagstaff A 2002 Poverty and health sector inequalities vol 80
Yousefi, M., Assari Arani, A., Sahabi, B., Kazemnejad, A., & Fazaeli, S. (2014). Household health
costs: Direct, indirect and intangible. Iranian Journal of Public Health, 43(2), 202–209.

Sri Lanka Economic Research Conference 2020
178
AGE – POVERTY NEXUS: IS IT NON-LINEAR? EVIDENCE
FROM SRI LANKA
Deyshappriya N.P.R. *1, Gunarathne Y.M.C1., Kulathilaka C.J.P.1, Gamachchige
N.T.S.G.2
Department of Management Sciences, Uva Wellassa University, Sri Lanka
Department of Science and Technology, Uva Wellassa University, Sri Lanka
*Corresponding author: [email protected]
Introduction
Poverty defined as pronounced deprivation in well-being, where well-being can be
measured by an individual’s possession of income, health, nutrition, education, assets,
housing, and certain rights in a society such as freedom of speech (World Bank, 2000),
has been recognized as one of the key development issues especially in developing
countries. Sri Lanka is one the South Asian countries widely appreciated because of
declining poverty rates, especially during last two decades. According to the Department
of Census and Statistics of Sri Lanka, the poverty headcount index declined from 28.8%
in 1996/96 to 4.1% by 2016. Moreover, in 2002, approximately 3,841,000 people were
in poverty. In 2016, this had decreased 843,913. However, regional poverty disparity is
significantly higher in Sri Lanka as estate and rural sectors account for remarkably higher
poverty incidence compared to urban sector.
Objectives of the Study
Studies such as Coulombe & McKay (1996), Amarasinghe et al. (2005), Gunewardena
(2007), Ranathunga (2010), Sinnathurai & Březinová (2012), Ranathunga & Gibson
(2014) and Jayathilaka et al. (2016) have examined the determinants of poverty in the
context of Sri Lanka. However, they have assumed that there is a linear relationship
between age and poverty. The linear relationship between age and poverty is not realistic
most of the time. Moreover, empirical evidences on the link between age and poverty are
mixed and inconclusive. Therefore, the current study aims to recognize the nature of
association between age of the head of household and probability of being income poor
and multidimensional poor in the context of Sri Lanka. Apart from that, other household
determinants of poverty are also expected to recognize.
Methodology
The analysis utilises HIES (2016) data from DCS Sri Lanka. HIES (2016) is the most
comprehensive survey in Sri Lanka conducted every three years and HIES (2016)
surveyed 21,756 households. Table 01 below indicates the explanation of variables.

Happyness and Prosperity Hybrid
179
Table 01. Explanation on Independent Variables
Name of Independent Variables Explanation Type of
variable
Categories of
Categorical
Variables
Age Age of the head of
household
Continuous -
Age^2 Square of the age
of the head of
household
Continuous -
HH Size Number of
members of the
household
Continuous
Gender Gender of the
head of household
Dummy 1 – Male
0 – Female
Ethnicity Ethnicity of the
head of household
Dummy 0 – Sinhalese
1- Sri Lanka Tamil
2 – Indian Tamil
3 – Sri Lanka
Moors
4 – Burgher
Civil Status Civil status of the
head of household
Dummy 0 – Unmarried
1 – Married
2 – Widowed
3 – Divorced
4 – Separated
Education Level of
education of the
head of household
Dummy 0 – No Schooling
1 – Primary
2 – Secondary
3 – Tertiary
4 – Degree of
above
Employment Status Employment
status of the head
of household
Dummy 0 – Unemployed
1 – Government
2 – Semi-
government
3 – Private
4 – Employer
5 – Self-employed
6 – Family worker
Have Agri_Land Whether the
household has
agricultural lands
Dummy 1 – Yes
0 – No

Sri Lanka Economic Research Conference 2020
180
Source: Created by authors
A Probit model was employed to examine the correlates of both income and
multidimensional poverty given the binary dependent variables. The general model that
is estimated is:
𝑌 (𝑦 = 1 𝑜𝑟 𝑦 = 0)𝑖 = 𝛽0 + 𝛽1𝑋𝑖 + 𝑈𝑖
If 𝑌𝑖 is the poverty variable which takes the value of 1 if a household is deemed poor
and zero otherwise. 𝑋𝑖 is a vector of independent variables. The above equation was
econometrically estimated to recognize determinants of both income and
multidimensional poverty. Dependent variable related to income poverty was constructed
by considering the Official Poverty Line (OPL) related to 2016 HIES (Rs. 4166). If
monthly expenditure of any person is less than Rs. 4166, then that household is
considered as a poor household. In contrast, multidimensional poor were recognized
based on the Multidimensional Poverty Index (MPI) which has three dimensions (Health,
Education and Living Standard) and ten indicators. People who experience deprivation
in at least one third of these weighted indicators fall into the category of
multidimensionally poor. r
The determinants of income and multidimensional poverty were also examined by
increasing the Official Poverty Line (OPL) and the deprivation score by 25% in order to
check the robustness of the determinants of poverty.
Disable Whether head of
the household is
disable
Dummy 1 – Yes
0 – No
Have Remittances Whether
household receive
remittances
Dummy 1 – Yes
0 – No
Sector Geographic sector
of the household
located
Dummy 0 – Urban
1 – Rural
2 - Estate
Survey Year Dummy Year of the survey
conducted
Dummy 0 – 2012/13
1 – 2016
Province Province of the
household located
Dummy 0 – Western
1 – Central
2 – Southern
3 – Northern
4 – Eastern
5 – North-western
6 – North-central
7 – Uva
8 – Sabaragamuwa

Happyness and Prosperity Hybrid
181
Determinants
Poor
(2016)
Poor
(+25%)
(2016)
Multidimensiona
l Poor
(2016)
Multidimensiona
l Poor (+25%)
(2016)
dy/dx dy/dx dy/dx dy/dx
Age -0.0018***
(0.0006)
-0.0036***
(0.0008)
-0.0015***
(0.0004)
-0.0006***
(0.0002)
(Age)2 0.000013*
*
(0.0000)
0.000029**
*
(0.0000)
0.000011**
(0.0000) 0.0000047**
(0.0000)
Household Size 0.0134***
(0.0008)
0.0285***
0.0011)
-0.0083***
(0.0007)
-0.0022***
(0.0004)
Gender (Female is the reference group)
Male -0.0096**
(0.0044)
-0.0149**
(0.0062)
0.0035
(0.0031)
0.0019
(0.0015)
Ethnicity (Sinhalese is the reference group)
Sri Lanka Tamil 0.0259***
(0.0031)
0.0495***
(0.0047)
0.0104***
(0.0028)
0.0020
(0.0014)
India Tamil 0.0146*
(0.0076)
0.0273**
(0.0115)
0.0116**
(0.0116)
0.0018
(0.0026)
Sri Lanka Moors -0.0005
(0.0048)
0.0051
(0.0069)
0.0145***
(0.0036)
0.0015
(0.0020)
Burgher Omitted
Omitted
0.0177
(0.0234) Omitted
Civil Status (Never Married is the reference group)
Married -0.0101**
(0.0050)
-0.0239*
(0.0144)
-0.0121**
(0.0054)
-0.0017
(0.0023)
Widowed -0.0229** -0.0348**
(0.0150)
-0.0102*
(0.0056)
-0.0020
(0.0025)
Divorced -0.0451 -0.0722**
(0.0352)
0.0032
(0.0112)
0.0034
(0.0045)
Separated -0.0029 0.0030
(0.0175)
0.0021
(0.0067)
-0.0008
(0.0033)
Education (No Schooling is the reference group)
Primary -0.0158*** -
0.0436***
(0.0076)
-0.0133***
(0.0029) -0.0037***
(0.0013)
Secondary -0.0439*** -0.1004***
(0.0076)
-0.0522***
(0.0036)
-0.0136***
(0.0021)
Tertiary -0.0951*** -0.1876***
(0.0115)
-0.0645***
(0.0078) Omitted
Degree or above Omitted -0.1997***
(0.0263)
Omitted
Omitted
Employment Status (Unemployed is the reference group)
Government -0.0247***
(0.0091)
-0.0605***
(0.0127)
Omitted
Omitted
Semi-government -0.0196*
(0.0119)
-0.0423**
(0.0165)
-0.0074
(0.0105)
0.0020
(0.0045)
Private 0.0064
(0.0041)
0.0181**
(0.0060)
0.0002
(0.0035)
0.0002
(0.0022)

Sri Lanka Economic Research Conference 2020
182
Employer Omitted -0.1697***
(0.0368)
Omitted
Omitted
Self-Employment -0.0086**
(0.0043)
-0.0063
(0.0061)
-0.0045
(0.0039)
-0.0029
(0.0028)
Family Worker 0.0012
(0.0165)
0.0127
(0.0236)
Omitted
Omitted
Having Agriculture Lands (Not Having is the reference group)
Have Agri land 0.0023**
(0.0000)
0.00001**
(0.0000)
-0.0000321**
(0.0000)
0.0000
(0.0000)
Disability (None of Household Member is Disable is the reference group)
Disable 0.0124**
(0.0049)
0.0185**
(0.0073)
0.0665***
(0.0034)
0.0153***
(0.0024)
Remittances (No Remittances is the reference group)
receive
Remittances
-0.0264***
(0.0059)
-0.0512***
(0.0081)
-0.0146***
(0.0045)
-0.0039
(0.0027)
Sector (Urban is the reference group)
Rural 0.0324***
(0.0049)
0.0802***
(0.0070)
0.0073**
(0.0036)
0.0038
(0.0024)
Estate 0.0211***
(0.0082)
0.0772***
(0.0121)
0.0175***
(0.0058)
0.0045
(0.0032)
Prob > chi2 0.0000 0.0000
0.0000 0.0000
Pseudo R2 0.1465 0.1556
0.4123 0.3990
Number of
Observations
21,756 21,756 21,756 21,756
Source: Calculated by authors based on HIES (2016).
Results and Discussion
Table 02 above indicates that age of the head of household is an important
correlate of household poverty. Moreover, considering column two and four, a
non-linear relationship between age and income and multidimensional poverty is
observed respectively since the estimated coefficients on both the ‘Age’ and
‘(Age)2’ variables are statistically significant. It implies that households’
probability of being poor decreases up to some extent with age of the head of
household and thereafter increases with the age.
This finding is consistent with the findings of Coulombe & McKay (1996) and
De Silva (2008) in the context of Mauritania and Sri Lanka, respectively. As
figure 01 depicts, the probability of being both income and multidimensional
poverty increase with age after age-thresholds 69.23 and 68.18 years respectively.

Happyness and Prosperity Hybrid
183
Note: X-axis in the graph indicates age of the head of household.
Source: Created by authors based estimated Probit Regression
Figure 01: Non-linear Relationship between Age and Poverty
Specifically, it implies that the probabilities of being income poor and
multidimensionally poor decrease with age till 69.23 years and 68.18 years
respectively and increase after that. In fact, older people are more likely to suffer
from health issues and are less likely to engage with the workforce. Specifically,
Sri Lanka’s retirement age is generally 60-65 years.
In addition to age, factors such as household size, household with members with
a disability and having a female-headed household, ethnicity, education,
employment status, having agricultural lands, receiving remittances, disability
nature of the head of household and location of living are also recognized as key
determinants of household poverty in Sri Lanka. These findings are consistent
with De Silva (2008), Gunatilaka et al. (2010), Deepawansa et al. (2011),
Ranathunga & Gibson (2014) and Jayathilaka et al. (2016). Moreover, the
estimated models are overly statistically significant and also have considerably
higher pseudo R2 values.
Conclusions and Recommendations
The results clearly indicates that there is a non-linear relationship between the
age of head of household and the probabilities of being income and
multidimensional poverty in Sri Lanka. Moreover, the study determines that the
probabilities of being income poor and multidimensionally poor decrease with
age till 69.23 years and 68.18 years respectively and increase after that. Hence,
the households which headed by the people over 68 years have higher probability
of being poor. Apart from that age, other households factors such as size of

Sri Lanka Economic Research Conference 2020
184
household, education, ethnicity, employment status, marital status, sector of
living (urban, rural and estate), disability nature of the head of household, having
agricultural lands and receiving remittances are also recognized as crucial drivers
of both income and multidimensional poverty in Sri Lanka. The study strongly
recommends implementing appropriate policies and safety net programs which
focus on the households which are headed by elderly people.
References
Amarasinghe, U., Samad, M., & Anputhas, M. (2005). Spatial clustering of rural poverty
and food insecurity in Sri Lanka. Food Policy, 30(5-6), 493-509.
Anyanwu, J. C. (2005). Rural poverty in Nigeria: profile, determinants and exit
paths. African Development Review, 17(3), 435-460.
Coulombe, H., & McKay, A. (1996). Modeling determinants of poverty in
Mauritania. World development, 24(6), 1015-1031.
De Silva, I. (2008). Micro‐level determinants of poverty reduction in Sri Lanka: a
multivariate approach. International Journal of Social Economics.
Deepawansa, M. D. D. D., Sooriyarachchi, M. R., & Wickremasinghe, W. N. (2011).
Determinants of Poverty in Sri Lanka.
Gunatilaka, R., Wan, G., & Chatterjee, S. (2010). Poverty and Human Development in
Sri Lanka. Asian Development Bank.
Gunewardena, D. (2007). Consumption Poverty in Sri Lanka 1985-2002. Centre for
Poverty Analysis.
Household Income & Expenditure Survey (HIES). (2016). Household Income &
Expenditure Survey Report. Department of Census & Statistics of Sri Lanka.
Ranathunga, S., & Gibson, J. (2014). Determinants of household poverty in the rural
sector in Sri Lanka: 1990-2010. Economics, 3(3), 43-49.
Ranathunga, S. P. (2010). The determinants of household poverty in Sri Lanka:
2006/2007.
Sinnathurai, V., & Březinová, O. (2012). Poverty Incidence and its determinants in the
estate sector of Sri Lanka. Journal of Competitiveness.
World Bank. (2000). Handbook of Poverty and Inequality. The World Bank.

185
Transferring Agricultural Technology

Sri Lanka Economic Research Conference 2020
186

Transfering Agricultural Technology
187
OPPORTUNITIES AVAILABLE AND CONSTRAINTS
FACED BY PADDY FARMERS TO USE ECO-FRIENDLY
TECHNOLOGIES DEVELOPED AGAINST THE
CHEMICAL FERTILIZER
Silva A. P.*1, Jayasinghe-Mudalige U. K.1, Dharmakeerthi R. S.2,
Dandeniya W. S.2, Balasooriya B. L. W. K.3 1Department of Agribusiness Management, Wayamba University of Sri Lanka
2Department of Soil Science, University of Peradeniya, Sri Lanka 3Department of Biotechnology, Wayamba University of Sri Lanka
*Corresponding author: [email protected]
Introduction
Sri Lanka is facing serious socio-economic and environment-ecology related
problems pertaining to the use of chemical fertilizer (CF). For example, from one
hand, these reduce the soil fertility drastically as farmers use to apply CF in
excessive amounts in agricultural lands. Not only that but also foreign expenses
occur in Rs. multimillions to import CF into the country every year, on the other
hand. In fact, a large percentage of CF imported has been used in the paddy
farming (Herath et al., 2015).All these stresses the importance of transforming to
an “organic culture” in farming. This study reveals the outcome of a farmer
perception analysis with regard to the use of two specific Eco-Friendly
Technologies (EFTs) developed for paddy farming in order to minimize the usage
of inorganic fertilizer, including “Bio-fertilizer” (BF) and “Bio-char” (BC). The
former was formulated using microbial inoculants that improve nutrient
availability in soils and the latter was produced from rice husk using simple
pyrolysis technique (Dharmakeerthi, 2015).
Research problem
Introducing those EFTs produced to the market so that they can perform better
over and above the CF can be considered as a crucial decision to make. In addition
to those chemical and physical analyses, conducting of complete socio-economic
assessments on the opportunities available for and the constraints faced by
farmers and other key stakeholders using these products is of paramount
importance. In the light of this, this study attempted to fulfil that gap in the
literature.

Sri Lanka Economic Research Conference 2020
188
Objectives
The main objective of this study was to assess the perceptions of paddy farmers
who are currently engaged with the adoption of certain EFTs, including the ‘Bio-
fertilizer’ - developed utilizing Plant Growth Promoting Rhizobacteria to
stimulate nutrient accumulation, and ‘Bio-char’ - used to produce slow release
Nitrogen fertilizer to improve soil fertility and reduce CF usage, where the
opportunities available for (i.e. “potential benefits”) and constraints faced by
those adopters in replace of chemical fertilizers were of special interest.
Methodology
Table 1. Attitudinal Statements Classified Under the Six Criteria Criteria Notation Statement MIS
(1) Regulation
(REG)
REG1 Guidance and advice needed in handling the product package (ex-
through agrarian service centers, agriculture instructors) 2.57
REG2 Need of prior knowledge and acceptance of regulatory bodies on
field conditions and technology -3.44
(2) Cost of
Application
(CST)
CST1 Management of the workload associated with the use of EFTs 3.35
CST2 Labor requirement and management 3.53
CST3 Need of using heavy machinery to support the procedure of
applying EFTs in the field 2.40
CST4 Storage cost and space requirement for the EFTs 2.35
CST5 Wastage/ over utilization of resources 3.83
CST6 Expenses related to soil treatments to maintain soil health and
fertility 3.85
(3) Effect on
the
Environme
nt (ENV)
ENV1 Potential damage to the surrounding environment 3.57
ENV2 Possible human wellbeing and safety matters resulted by the use
of EFTs 3.66
ENV3 Priority given to the eco system safety and sustainability 3.60
ENV4 Disposal of waste materials after use of EFTs 3.19
(4) Expected
Performanc
e (PER)
PER1 Possibility of improving productivity of paddy fields 3.53
PER2 Chances of enhancing predictability of paddy production 3.49
PER3 Ability to be integrated with other technologies in paddy farming 3.10
PER4 Capability of forecasting the optimum fertilizer recommendations
for paddy fields based on external conditions. (rain, temperature) 3.25
(5) Availability
of Related
Services
(SER)
SER1 Requirement of external services to get information on whether to
decide on EFT application -3.54
SER2 Need of abundance in technology with the related farmer
communities to apply EFTs 2.55
(6) Level of
Acceptance
(ACP)
ACP1 Risk level of diminishing the current yield 2.90
ACP2 Durability of EFTs after opening the package 3.33
Source: Author’s estimation

Transfering Agricultural Technology
189
Identification of key areas on which the farmer perceptions to be examined was
based on “Expert Perception Analysis” carried out by Chandrasiri et al. (2018).
There were 20 attitudinal statements derived to represent six major criteria given
in Column (1) of Table 1 above.
Results and Discussion
Descriptive Statistics of the Sample
The majority of farmers were males (71%) between the ages of 35 to 65 years.
Almost two thirds (64%) of them had experience over 20 years in paddy farming
and the use of fertilizers and other agronomic practices. The highest education
level for most of them (40%) was the GCE (O/L) and the majority of farmers own
and operate with 2 to 5 acres of land.
Identification of opportunities and constraints
The MIS values derived for 20 statements were reported in last column in Table
1. The Aggregate MIS for 6 Criteria in concern were illustrated in Figure 1.
Source: Authors’ illustration
Figure 1. Aggregate Mean Importance Score
As the values of MIS taken into account individually, the five key areas in
concern include expenses required to maintain soil health (CST6), reducing
wastage of materials (CST5), better conditions on human and environmental
well-being (ENV2), priority given to the eco-systems (ENV3) and controlling
-0.44
3.22 3.51 3.34
-0.50
3.12
-1.00
-0.50
0.00
0.50
1.00
1.50
2.00
2.50
3.00
3.50
4.00
(REG) (CST) (ENV) (PER) (SER) (ACP)
Aggre
gate
d M
IS
Criteria of Attitudinal Statements

Sri Lanka Economic Research Conference 2020
190
potential damage to the surroundings (ENV1). It highlights that the farmers
consider those positive and negative effects of EFTs vs. CF on Environment
(ENV) in the first place (i.e. 3.51). In fact, they have recognized the EFTs as an
opportunity to minimize the damages arising from CF to the environment. The
expected Performance (PER) was taken as the next most important criterion,
where the respondents, in general, valued EFTs over and above the CF (3.34).
Cost (CST) has also considered important (3.22), and they believed that EFTs
would be able to reduce the cost of applications of fertilizer significantly, unless
‘subsidies’ and other incentives alter the markets. Two criteria were considered
poorly perform with regard to the use of EFTs, i.e. Regulation (REG) (– 0.44)
and related Services (SER) (-0.50) highlighting that they are “in favour of” CF at
present.
Conclusions
The outcome of the analysis, which uses the perceptions of paddy farmers on
opportunities available and contraints faced in terms of the use of EFTs against
the CF, highlights the fact that they “truly value the good side of” those EFTs,
especially their positive effects on the environment and performance. Yet, they
are clearly concerned about the economic aspects associated with moving into
the adoption of such technologies, because, at present, they judged that the
existing regulatory and facilitative policy environment to adopt those EFTs is not
encouraging. In the light of this, it is important that public regulatory institutions
and others stand for EFTs should generate both short-term and direct private and
market-based incentives, over and above their counterpart, for farmers to shift
into those EFTs.
Keywords: Chemical fertilizer, Constraints; Eco-Friendly Technologies;
Perceptions, Paddy Farming
Acknowledgement
The National Research Council (NRC) of Sri Lanka for financial assistance under
the project: ‘Development of Eco-Friendly Farming Technologies to Minimize
Inorganic Fertilizer Usage While Maintaining Adequate Productivity and
Improving Soil Fertility’ (NRC-TO 16–07) and all the respondents for their
valuable contribution to provide data/information.

Transfering Agricultural Technology
191
References
Chandrasiri, N. A. K. R. D., Jayasinghe-Mudalige, U. K., Dharmakeerthi, R. S.,
Dandeniya, W. S., & Samarasinghe, D. V. S. S. (2019). Adoption of Eco-Friendly
Technologies to Reduce Chemical Fertilizer Usage in Paddy Farming in Sri Lanka:
An Expert Perception Analysis.
Dharmakeerthi, R.S. (2015). Countering soil fertility decline through biochar application:
Joachim Memorial Lecture – 2013. Journal of Soil Science Society of Sri Lanka,
25
Herath, H. M. K. V., Gunawardena, E. R. N., & Wickramasinghe, W. M. A. D. B. (2015).
The impact of “Kethata Aruna” fertilizer subsidy programme on fertilizer use and
paddy production in Sri Lanka. Tropical Agricultural Research, 25(1).
Jayasinghe-Mudalige, U. K., & Henson, S. (2006). Use of confirmatory factor analysis
techniques to overcome the problems of subjectivity & unobservability of
incentives. Sri Lankan Journal of Applied Statistics, 7, 71-89.

Sri Lanka Economic Research Conference 2020
192
AGRI-TECHNOLOGY ADOPTION IN THE CONTEXT OF
SRI LANKA: A RELATIONAL STUDY
Nayanajith, D. A. G.
University of Kelaniya, Sri Lanka
Introduction
Non adherence to timely structural reforms is one of the causes for the economic
stagnation of the country. In order to circumvent the middle-income trap and
achieve high income status, it is essential to expedite the necessary reforms whilst
focusing on improving productivity and efficiency. During the 2018/2019 period,
the growth of agriculture related economic activities recorded only 0.4 percent
and contribution to the country’s GDP was stagnant around Rs.170Bn, whereas
the Sri Lanka prosperity index has been increased to 0.783 in 2018 (CBSL,
2020a; CBSL 2020b). Although the production of several agricultural crops
including paddy were increased in 2018; tea, rubber, fisheries and sugar
production were declined while the agricultural sector accounted for one fourth
of the employed population of the country (CBSL, 2019). Therefore, the
necessity of high labor requirement could be addressed whilst improving
productivity with a higher level of adoption of agri-technology (AAT).
Research Problem
Numerous research studies have highlighted that in the Sri Lankan context, AAT
is considerably low (Athambawa et al., 2011 & 2017). Nevertheless, there had
been the introduction of various production technologies and management
techniques time to time (Athambawa et al., 2017; Beevi et al., 2017). Hence, this
study postulated to identify primarily the effect of innovation (INO) and
perceived ease of use (PEOU) on the adoption of agri-technology (AAT).
Objectives
To identify the effect of INO on AAT
To evaluate the influence of PEOU on AAT
To identify any differences/similarities in AAT, considering different income
categories of agriculturalists.
To evaluate the moderation effect of age in between relationship of INO & AAT.

Transfering Agricultural Technology
193
Technology acceptance model (TAM) has been used to explain technology
adoption in different sectors such as e-banking, education, tourism, healthcare,
agricultural and etc. in which there are two main variables namely, PU and PEOU
(Bagozzi, Davis & Warshaw 1992). Several researches supported the prevalence
of a positive relationship between PEOU and the adoption of technology in
different fields including agriculture (Nayanajith et al., 2020; Verma & Sinha,
2016). Compatibility, relative advantage and simplicity constructs indicated a
positive relationship towards technology adoption (Moghaddam & Salehi, 2010;
Tornatzky & Klein, 1982). The attributes related to demographic factors such as:
gender, age, educational level, and monthly income were significantly influential
variables on the acceptance of innovative services (Gayan Nayanajith et al.,
2019). There are moderating effects of demographic variables such as
respondents’ age towards the adoption of technology with regard to e-services
(Yu, 2012; Yoon & Occeña, 2015). Accordingly following hypotheses were
proposed,
H11- PEOU and AAT are positively related
H12- INO and AAT are positively related
H13- AAT between lower income category agriculturalists and higher income
category agriculturalists, is different.
H14- Age moderates the relationship of INO and AAT.
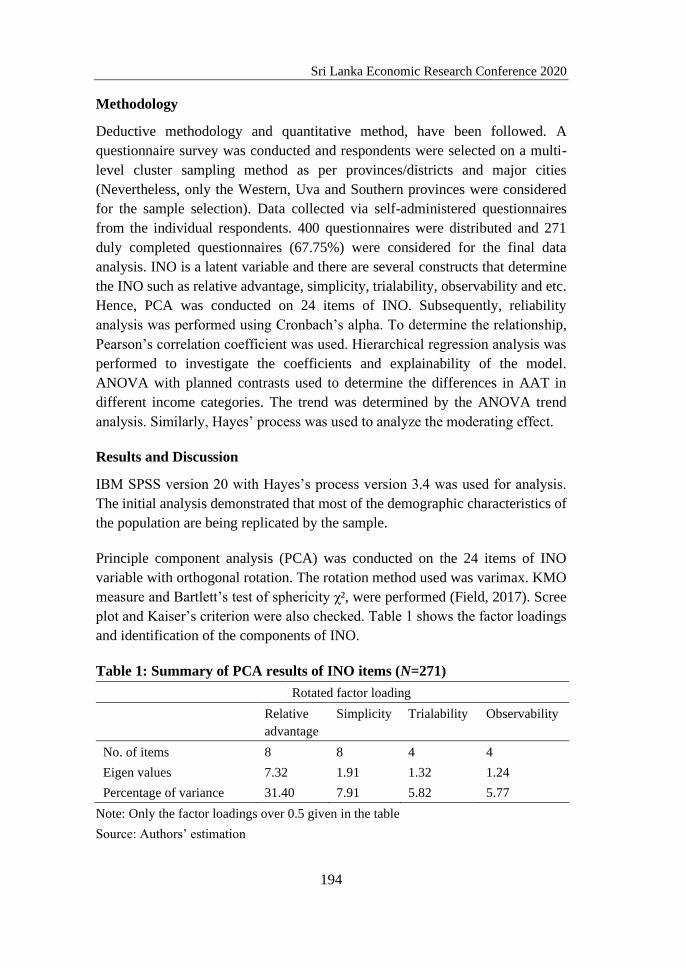
Sri Lanka Economic Research Conference 2020
194
Methodology
Deductive methodology and quantitative method, have been followed. A
questionnaire survey was conducted and respondents were selected on a multi-
level cluster sampling method as per provinces/districts and major cities
(Nevertheless, only the Western, Uva and Southern provinces were considered
for the sample selection). Data collected via self-administered questionnaires
from the individual respondents. 400 questionnaires were distributed and 271
duly completed questionnaires (67.75%) were considered for the final data
analysis. INO is a latent variable and there are several constructs that determine
the INO such as relative advantage, simplicity, trialability, observability and etc.
Hence, PCA was conducted on 24 items of INO. Subsequently, reliability
analysis was performed using Cronbach’s alpha. To determine the relationship,
Pearson’s correlation coefficient was used. Hierarchical regression analysis was
performed to investigate the coefficients and explainability of the model.
ANOVA with planned contrasts used to determine the differences in AAT in
different income categories. The trend was determined by the ANOVA trend
analysis. Similarly, Hayes’ process was used to analyze the moderating effect.
Results and Discussion
IBM SPSS version 20 with Hayes’s process version 3.4 was used for analysis.
The initial analysis demonstrated that most of the demographic characteristics of
the population are being replicated by the sample.
Principle component analysis (PCA) was conducted on the 24 items of INO
variable with orthogonal rotation. The rotation method used was varimax. KMO
measure and Bartlett’s test of sphericity χ², were performed (Field, 2017). Scree
plot and Kaiser’s criterion were also checked. Table 1 shows the factor loadings
and identification of the components of INO.
Table 1: Summary of PCA results of INO items (N=271)
Rotated factor loading
Relative
advantage
Simplicity Trialability Observability
No. of items 8 8 4 4
Eigen values 7.32 1.91 1.32 1.24
Percentage of variance 31.40 7.91 5.82 5.77
Note: Only the factor loadings over 0.5 given in the table
Source: Authors’ estimation

Transfering Agricultural Technology
195
Cronbach’s alpha values were higher than 0.7 for INO, PEOU and AAT.
Subsequent, Pearson correlation analysis revealed that AAT indicates a positive
relationship with both INO (r = 0.875) and PEOU (r = 0.916) variables whilst
both the relationships were significant at .01 level (1-tailed).
Afterwards, a multiple regression analysis was conducted using a hierarchical
method to predict the degree to which independent variables; PEOU and INO
affect AAT (Table 2). In accordance with model 1, the overall variance of AAT
explained by INO is 76.2% as per the adjusted R square figure and model 1 is
statistically significant.
In accordance with model 2, the overall variance of AAT explained by INO and
PEOU is 87.4% and model 2 is also statistically significant. To determine the
cases which are influencing the regression model, case-wise diagnostics were
checked and are in order.
In line with the correlation findings, regression results also supported the
significant positive relationship of INO and PEOU on AAT in the present
research context, as per the significant beta values shown in the table supporting
both the first and second hypotheses.
Table 2: Regression output
t Sig. F
Change
df Sig. F
Chang
e
Adj. R2
Model 1
(Constant)
INO
26.29
29.68
0.000
0.000
2.108
0.621
881.14 1 0.000 0.765
Model 2
(Constant)
INO
PEOU
17.29
08.62
15.24
0.000
0.000
0.000
1.339
0.249
0.496
232.27 1 0.000 0.874
Dependent variable: AAT
Source: Author’s estimation
In order to examine the third hypothesis, one-way ANOVA with planned
contrasts was performed. There was a significant effect of income on AAT, F (2,
268) = 244.01, p < 0.05, ω = 0.80.

Sri Lanka Economic Research Conference 2020
196
Secondly, there was a significant linear trend as well, F (1, 268) = 459.97, p <
0.01, ω = 0.78, indicating that as the income increases AAT also increases
proportionately. Finally, planned contrasts revealed that having a higher income
(middle and high-income levels) significantly increased AAT compared to
having a lower income, t (268) = 21.80, p < 0.05 (1-tailed), r = 0.80, and that
having a high income significantly increased AAT compared to having a middle-
income, t (268) = 10.53, p < 0.05 (1-tailed), r = 0.54 (lower income group; income
less than Rs.50,000/-, higher income group contains both the middle-income
group-Rs.50,000/- to Rs.100,000/- and high-income group-above Rs.100,000/-).
Moderation analysis has demonstrated a moderation effect attributable to the
significant interaction of INO and age, and the interaction is highly significant, b
= -0.23, 95% confidence interval (CI) (-0.32, -0.14), t = -5.09, p< 0.01, indicating
that the relationship between INO and AAT is moderated by age whilst
supporting the fourth hypothesis. Elaborating that the relatively younger
agriculturalists (aged less than 25 years), there is a significantly higher positive
relationship exists between INO and AAT, b = 0.77, 95% CI (0.69, 0.85), t =
19.32, p < 0.01.
Conclusion
The significance of the research is that the contribution to practical aspects of
AAT, particularly in the developing country’s perspective by incorporating
interrelated models on technology adoption and innovation. Data analysis
supported the hypotheses. Hence, as suggested by the findings which are in line
with the previous researches, it could be noted that in order to facilitate a higher
level of adoption in agri-technology, it is paramount to concentrate more on
uplifting the perceived ease of use feature among the agriculturalists in tandem
with innovation aspect concurrently, whilst a particular emphasis is being given
to relative advantage, simplicity, trialability and observability concerns of the
agriculturalists (Tsai et al., 2018). Therefore, it is recommended to the marketers
of agri-technology service providers, to capitalize on agriculturalists’ awareness
on PEOU in conjunction with innovation characteristics such as relative
advantage, in particular. Research findings are beneficial for the agri-technology
service providers to execute segmenting, targeting and profiling their customers
with the assistance of previously discussed factors alongside differentiation on
demographic characteristics. Due to time and resource constraints, research is
limited to a cross-sectional, quantitative study. Finally, it is proposed to conduct
qualitative studies for in depth analysis of the discussed aspects in search of novel
findings.

Transfering Agricultural Technology
197
Keywords: Agriculture; Income, Innovation; Sri Lanka; Technology
References
Athambawa, S. B., Pushpakumara, C., & Wickramarachi, A. R. P. (2011). Strategic
technology adoption and its current state implications on agri business for making
sustainable development in Eastern province of Sri Lanka.
Athambawa, S., Wickramarachchi, A. P. R., & Puspakumara, C. (2017). Business
transformation through technology adoption: Special reference to rice millers in
Eastern Province, Sri Lanka. International Research Symposium on Pure and
Applied Sciences, 2017 Faculty of Science, University of Kelaniya, Sri Lanka.
Bagozzi, R. P., Davis, F. D., & Warshaw, P. R. (1992). Development and test of a theory
of technological learning and usage. Human relations, 45(7), 659-686.
Central Bank of Sri Lanka, 2019. Annual Report, 2018.
Central Bank of Sri Lanka, 2020. “Monthly Economic Indicators, February, 2020”.
Central Bank of Sri Lanka, 2020. “Sri Lanka Prosperity Index 2018”.
Field, A. (2017). Discovering statistics using IBM SPSS statistics: North American
edition. Sage.
Gayan Nayanajith, D. A., Weerasiri, R. A. S. & Damunupola, K.A. (2019) “A Review on
E-Banking Adoption in the Context of E-Service Quality”, Sri Lanka Journal of
Marketing, Vol. 5 Issue: 2, pp. 25-52.
Nayanajith, G., Damunupola, K. A., & Pastor, C. K. (2020). Telebanking Adoption
Intentions, Actions and Subjective Norms in the Context of Sri Lankan Private
Commercial Banks. Southeast Asian Journal of Science and Technology, 5(1).
Rezaei-Moghaddam, K., & Salehi, S. (2010). Agricultural specialists’ intention toward
precision agriculture technologies: Integrating innovation characteristics to
technology acceptance model. African Journal of Agricultural Research, 5(11),
1191-1199.
Sulaiha Beevi, A., Wickramarachchi, A. P. R., & Puspakumara, C. (2017). Towards
technology components adoption: how government role can enhance rice miller’s
success: special reference to Eastern province of Sri Lanka.

Sri Lanka Economic Research Conference 2020
198
Tornatzky, L. G., & Klein, K. J. (1982). Innovation characteristics and innovation
adoption-implementation: A meta-analysis of findings. IEEE Transactions on
engineering management, (1), 28-45.
Tsai, H. T., Hong, J. T., Yeh, S. P., & Wu, T. J. (2014). Consumers’ acceptance model
for Taiwan agriculture and food traceability system. The Anthropologist, 17(3),
845-856.
Verma, P., & Sinha, N. (2016). Technology acceptance model revisited for mobile based
agricultural extension services in India. Management Research & Practice, 8(4).
Yoon, H. S., & Occeña, L. G. (2015). Influencing factors of trust in consumer-to-
consumer electronic commerce with gender and age. International Journal of
Information Management, 35(3), 352-363.
Yu, C. S. (2012). Factors affecting individuals to adopt mobile banking: Empirical
evidence from the UTAUT model. Journal of electronic commerce
research, 13(2), 104.

Transfering Agricultural Technology
199
STAKEHOLDER PREFERENCES ON PROMOTIONAL
INSTRUMENTS TO PRODUCE AND UTILIZE
ORGANIC FERTILIZER
Jayakodi, J.A.S.N.S.1*, Jayasinghe-Mudalige, U. K.1, Jayathilake,
H.A.C.K.2 1Deparment of Agribusiness Management, Wayamba University of Sri Lanka
2ICT Center, Faculty of Agriculture & Plantation Management,
Wayamba University of Sri Lanka *Corresponding author: [email protected]
Introduction
Negative impacts associated with high and indiscriminate use of chemical
fertilizer in agriculture, in particularly on the environment are reported in the
recent years. Further, cost of imports of chemical fertilizer has become a huge
burden to the government. For example, the total import bill for importing
chemical fertilizer to Sri Lanka in 2018 was US$ 262 million (Annual Report of
Ministry of Finance, 2018).
Globally, the production and marketing of organic food and agricultural inputs
have been expanded remarkably over the past years. The common term of
‘organic fertilizer’ is predominantly in use to demarcate one of the key inputs
utilized in organic systems and with the concepts like smart agriculture. The use
of organic fertilizers as a key input has become increasingly popular among the
farming communities. This is considered as a result of changes to the perceptions
of stakeholders in the agri-food value chains over and above that for chemical
fertilizers.
Revealing of factors that trigger or constraint the transformation from ‘chemical
fertilizer’ to a culture of production and utilization of ‘organic fertilizer’ is
warranted, because a better understanding of stakeholder perceptions on
promotional instruments.
This is important in any attempt to promote the production and use of organic
fertilizer profitably and sustainably. Further, such understanding can foster a
better discussion of the reasons that currently constraint the production of a
‘standardized organic fertilizer’, and to formulate an appropriate policy
environment facilitating such action.

Sri Lanka Economic Research Conference 2020
200
Research Problem
Continuous use of chemical fertilizers causes numerous adverse effects to the
environment. Accepting new agricultural technologies that support shifting from
the chemical fertilizer-based agriculture to an organic agriculture system can be
considered as an answer to mitigate significant negative impacts associated with
current practices. In this regard, there exists a gap about the most preferred
promotional instruments by stakeholders in the organic fertilizer value chain, and
this study attempted to fulfil that gap in the literature.
Objectives
The objective of this study was to assess the perceptions of stakeholders along
the organic fertilizer value chain for identifying the most preferred promotional
instruments in the production and use of standard organic fertilizer.
Methodology
The first step towards empirical analysis was to select a comprehensive list of
promotional instruments and include them into an appropriate theoretical
framework. A systematic review of literature from both local and global point of
view was carried out in this connection.
A structured questionnaire was formulated and personal interviews were
conducted with 140 key stakeholders associated with the organic fertilizer value
chain covering the Western and North-Western provinces in Sri Lanka. In this
process, an emphasize was paid to deal with ‘information-rich cases’, and to
fulfill this requirement, the purposive sampling techniques were adopted to select
the respondents. In addition to the structured questions on demographic and other
vital information on characteristics of organic fertilizer and different agricultural
practices, the questionnaire was supplemented with 20 attitudinal statements
explaining various promotional instruments work in this connection. Each
statement was evaluated against a 10-point Likert scale ranging from ‘extremely
unimportant’ (0) to ‘extremely important’ (10).
The data from all respondents on these statements (i.e. 140 x 20 matrix) were
subjected to the Confirmatory Factor Analysis techniques, including the tests of
‘Scale Reliability’ and the ‘Unidimensionality’ (Jayasinghe-Mudalige and
Henson, 2006) to test for their ‘Validity’ and ‘Reliability’. Once they were
established, the responses were used to derive a Mean Opinion Score (MOS) for
each statement.

Transfering Agricultural Technology
201
Results and Discussion
Descriptive Statistics of the Sample
Eight two percent of respondents were Males. Over 35 years of age and studied
up to GCE (A/L) were the majority recording 85% and 36% respectively. Out of
the seven types of stakeholders (Producer, value addition, storage, wholesaler,
retailer, farmer, extension service) in the sample , 29 percent of them hold two or
more positions in the organic fertilizer value chain and 53% percent of
respondents have been engaged in the practices over 10 years.
Outcome of Exploratory Factor Analysis
The output of Scale Reliability Analysis reveal that the Cronbach’s Alpha value
was 0.9. This reflects the fact that those scales were “internally consistent”, since
this value was greater than 0.7 to make that claim (Nunnally, 1978). The value
from Kaiser-Meyer-Olkin (KMO) test was 0.85 (i.e. ≥0.5) and it confirmed that
the sample is adequate. The Bartlett’s Test of Sphericity with significant level of
p<0.005 confirms that the variables have “patterned relationship”.
Based on the Eigen values (≥1) and an outcome of Scree Plot, there were four
significant factors which explained 81.4% of the variance of promotional
instruments (Table 1).
Outcome of Mean Opinion Scores (MOS)
When considering the MOS values without separating data into the types of
stakeholders, ‘Capacity building / Training’ (8.74) was the most preferred
promotional instrument by stakeholders. This was followed by ‘Better
communication on research findings in farmer- friendly language’ (8.59) and
‘Information on market / price conditions’ (8.56).
Based on the Aggregated Mean Score values of promotional instruments,
Producers (8.02), Wholesalers (8.90), Retailers (8.73), Farmers (7.88) and
Extension service providers (8.49) showed their highest preference for those
promotional instruments oriented from the ‘Government’ (Figure 1).
Nevertheless, those stakeholders in the value addition sector, especially at the
higher orders, highly favored on ‘Market’ oriented promotional instruments
(8.75) and those very much concern on the storage facilities were highly focused
on ‘Self’ oriented promotional instruments (8.15).

Sri Lanka Economic Research Conference 2020
202
Table 1. Outcome of exploratory factor analysis
Source: Authors’ estimation
Statement Factor
Number Eigenvalue Label
Factor
Loading
1. Information on weather/
climate
conditions
1 1.96 Self 0.64
2. Storage facilities 0.63
3. Waste disposal mechanism 0.57
4. Processing facilities 0.56
5. Investment in knowledge
acquisition
0.55
6. Information on market/price
conditions
2 1.49 Market 0.54
7. Price volatility 0.53
8. Establish supply management
system/boards
0.51
9. System for better communication
among the supply chain
0.50
10. Information on variety of
inputs
3 7.15 Government 0.71
11. Extension services 0.70
12. Capacity building/training 0.70
13. Agricultural credit 0.69
14. Subsidy mechanism based
on
organic fertilizer
0.68
15. Output price guarantee 0.67
16. Government regulations 0.66
17. Product insurance 0.64
18. Better communication on
research
findings in farmer-friendly
language
0.60
19. Provide assistance to
mitigate risk
0.59
20. Release land use restrictions 4 1.22 Judiciary 0.58

Transfering Agricultural Technology
203
Source: Authors’ estimation
Figure 1. Aggregated mean opinion score values of promotional instruments
Conclusions
The majority of people involved with the organic fertilizer business show their
preference on ‘government’ oriented promotional instruments. In the light of this,
we may propose that a valid and reliable national institution-based regulatory
approach should be established to safeguard their wishes, however, with a
minimum burden to the taxpayers. To make sure that happens, a combination of
both regulatory and facilitative mechanism and tools must be placed. Therefore,
it is recommended that the provision of information through private-public
partnerships, and then setting up of most needed quality standards with incentive-
based voluntary participation to quality assurance mechanisms. Beyond that for
those who do not comply, certain mandatory regulatory standards must be
established as such safeguard the soil, environment and human health protection
standards.
Keywords: Organic fertilizer; Promotional instruments, Stakeholder preferences
References
Annual Report (2018). Ministry of Finance, Sri Lanka.
Jayasinghe-Mudalige, U. K., & Henson, S. (2006). Use of confirmatory factor analysis
techniques to overcome the problems of subjectivity & unobservability of
incentives. Sri Lankan Journal of Applied Statistics, 7, 71-89.
Nunnally, J.C. (1978). Psychometric Theory. Mc-Grow Hill, New York, USA.
0.00
5.00
10.00
Producer Value
Addition
Storage Wholesal
er
Retailer Farmer Extensio
n Service
Self 7.95 8.43 8.15 8.68 8.42 7.87 8.03
Market 7.65 8.75 7.78 8.65 7.68 7.71 8.10
Government 8.02 8.40 7.56 8.90 8.73 7.88 8.49
Judiciary 7.50 7.57 6.67 8.23 8.23 6.55 6.50
Aggre
gat
ed M
ean S
core
s o
f
Pro
mo
tio
nal
Inst
rum
ents

Sri Lanka Economic Research Conference 2020
204
TECH-INNOVATION KNOWLEDGE AND ACQUISITION
EXTENT GAPS OF TECHNOLOGICAL INNOVATION BY
THE INTERNATIONALIZED TECH- BASED TEA SMES IN
NUWARA ELIYA DISTRICT OF SRI LANKA
Fernando W.M.S.N*., Dasanayaka S.W.S.B., Mudalige D. Department of Management of Technology, University of Moratuwa,
*Corresponding author: [email protected]
Introduction
At present, more rapid phase of technological innovation drive is on the surface
where there is a huge demand from the tech based corporate and small-scale tea
enterprises in Sri Lanka as well as in the world through extension services. In Sri
Lanka's context, the Tea Research Institute (TRI) undertakes research and
development activities on all the aspects of tea cultivation, tech-innovation
development and transfer procedures plus delivers extension services for the tea
sector in Sri Lanka. By being the main body, the TRI is serving as the primary
source of technical information provider to the industry where responsible for
disseminating scientific info, tech info and know-how, tech-innovation and
transfer to the sector.
These things are done through the extension wing of the TRI where lots of
documented particulars are existed. Though these things are existed, the level of
tech-innovation knowledge and the acquisition extent of these agricultural tech-
innovation by the Tech- based Tea SMEs category is proportionately low hence
the Nuwara Eliya District is being highly victimized as more Tech- based Tea
SMEs are situated in this district (Agricultural Activities in Sri Lanka, 2018).
This research study was conducted with the main objective of assessing the Tech-
Innovation knowledge and Acquisition extents and gaps of recommended
agricultural tech-innovation of the Tech based Tea SMEs in Nuwara Eliya
District of Sri Lanka.
Main Objective
Assessing the Tech-Innovation knowledge and acquisition extents and gaps of
recommended agricultural tech-innovation of the Tech based Tea SMEs in
Nuwara Eliya District of Sri Lanka.

Transfering Agricultural Technology
205
Methodology
The up-country tea growing region has the highest percentage (39%) of Tech
based Tea SMEs hence the major proportion (48%) of the tea extent among the
four regions (Up Country, Mid Country, Uva and Low Country). Due to this, the
study selected the 'Up Country' category where Nuwara Eliya District comes
under the main district under the 'Up Country' category where higher more
concentration on tech-based Tea SMEs. Sample survey was adopted for the study.
Out of the total number of 125 internationalized tech-based Tea SMEs in Nuwara
Eliya District, 72 were selected. Initially, the population was stratified into two
as high yielding and low yielding estates hence 27 high yielding and 40 low
yielding estates were finally selected for data collection based on proportionate
random sampling method. Primary and Secondary data were collected.
Conceptual Framework
Source: Author developed
Measurement of Tech-Innovation Knowledge and Acquisition Extent
Tech-Innovation Knowledge
Tech-Innovation Knowledge is defined as those behaviors and test situations that
emphasized the remembering either by recognition or recall of ideas, materials or
phenomena. Tech-innovation knowledge is one of the important components of
behavior and it plays a vital role in the acquisition extent of improved practices
(Bloom et al 1985). The tech-innovation knowledge index of a respondent was
calculated using the following formula
Tech-Innovation Knowledge Index = (Score Obtained by the Respondent /
Possible maximum score) * 100
Tech-
Innovation
Knowledge GAP
Tech-
Innovation
Acquisition
Extent

Sri Lanka Economic Research Conference 2020
206
Based on the scores, respondents were classified into low, medium and high in
their tech-innovation knowledge level by using the cumulative frequency method
based on mean and standard error. The tech-innovation knowledge levels of
respondents on individual technologies were also analyzed. The agricultural tech-
innovation disseminated through the extension service was used for the tech-
innovation knowledge test.
Acquisition Extent
'The utilization and the practical application of tech-innovation/practices by the
internationalized tech-based Tea SMEs during the last cropping year' is
operationalized under the acquisition extent. The extent of acquisition refers to
the hectares in which a particular technological innovation/practice is acquired in
a particular tea small or medium scale estate out of the potential extent (hectares)
(Bhutia, 1975)
Extent of Acquisition = (Actual Acquisition Extent / Potential Extent for
Acquisition) * 100
Based on the field realities of the small and medium scale tea plantations,
acquisition extents of tech- innovation/practices were classified into four
categories and assigned a score accordingly as follows.
Table 1: Acquisition extents of tech- innovation/practices and assigned
scores
SI No Acquisition extent
Category
Extent of
Acquisition
Score
1 Full Acquisition >60% 4
2 Partial Acquisition 20-60% 3
3 Less Acquisition <20% 2
4 Nil Acquisition 0% 1
Source: Author developed
The acquisition extent index for individual respondents was calculated using the
following formula
Acquisition Index =(Score Obtained by the Respondent/Possible maximum
score) * 100

Transfering Agricultural Technology
207
The acquisition extent of individual technologies was analyzed to identify using
a percentage analysis. Acquisition extent mean scores were also calculated for
individual technologies in order to further distinguish and compare acquisition
extent of individual technologies.
Data Analysis
Data collected from the respondents were coded and assigned scores wherever
required in order to make the data meaningful and were subjected to analyze
using the following analytical procedures using SPSS 25.0. Confidence interval
method was used to work out cut off points for classifying the respondents into
three categories as high, medium and low with respect to their tech-innovation
knowledge and acquisition extents. This was done based on mean (X) + or - 1.9
SE (Standard Error) as suggested by Fisher (2002) and categorized the
respondents as follows:
Low Group = Below X - 1.96 SE
Medium Group = Between X - 1.96 SE and X + 1.96 SE
High Group = Above X + 1.96 SE
Cumulative Frequency Distribution and Percentage Analysis were used to
quantify low, medium and high groups and to calculate index for tech-innovation
knowledge and acquisition.
An independent’t’ test was performed to study the variation/compare tech-
innovation knowledge and acquisition extents between Owners and Workers.
Ranking method was used to prioritize constraints based on mean
scores/percentages, suggestions and other aspects studied with respect to
opportunities for private extension.
Results and Discussion
Overall tech-innovation knowledge level of internationalized tech based Tea
SME Owners and Workers
The Table 1 depicts that 46% of internationalized tech-based Tea SME Owners
and 32% of the Workers were in the high tech-innovation knowledge category
whereas 21% and 33% of the Owners and Workers were in the medium level of
tech-innovation knowledge, respectively. Similarly, 33% and 42% of the Owners

Sri Lanka Economic Research Conference 2020
208
and Workers were in the low tech-innovation knowledge level category
respectively.
Table 1: Distribution of Owners and Workers according to the overall tech-
innovation knowledge level on Technological Innovation
SI.No Category Owners
Percentage
Workers
Percentage
1 Low 33 35
2. Medium 21 33
3. High 46 32
Total 100 100
Mean Awareness
Index
77.84 52.09
Mean
difference(GAP)
26.87
't' Value 2.869*
Source: Derived through the analysis
The mean tech-innovation knowledge index of internationalized tech-based Tea
SME Owners (77.84) was higher than that of Workers (52.09) with a difference
of 25.75.
The’t’ test value being significant at 1% level indicating that the tech-innovation
knowledge level of Owners on Technological Innovation was higher than that of
the Workers with a gap of about 26%.
Technological Innovation wise Tech-innovation knowledge level
The Technological Innovation wise Tech-innovation knowledge level of
internationalized tech based Tea SME Owners and Workers were analyzed and
the percentage results are presented in Figure 2.

Transfering Agricultural Technology
209
Source: Derived through the analysis
Figure 1. Technological Innovation wise Knowledge levels of
internationalized tech-based Tea SME Owners and Workers
Overall Acquisition Extents of Technological Innovation
The Table 2 demonstrates that greater proportion 43% of the internationalized
tech- based Tea SMEs had low acquisition extent while 39% had high level of
acquisition extent. Medium level of acquisition extent was evident in 22% of the
estates. Further, it shows that the mean acquisition extent index (55.00) was in
the higher side resulted technology acquisition extent gap of 45%.
Table 2: Distribution of overall Acquisition extents of internationalized tech
based Tea SMEs
Acquisition Extents Percentage of estates adopted
Low 43
Medium 22
High 35
Total 100
Mean acquisition extent index 55.00
Technology acquisition extent gaps 45.00
Source: Source: Derived through the analysis
43%
50%
27%
56%
78%
27%
75%
78%
45%
61%
41%
32%
12%
2%
46%
17%
38%
38%
18%
27%
0% 50% 100%
Sunshine duration based…
Larvae conut based chemical…
Alternative nursery media
Site specific fertilizer
TRI tea harvesting shear
TRI 3000 and 4000 series…
VP/UM and ST/UM Fertilizers
Root starch testing before…
Archis pintoi-ground cover…
Nursery fumigation using…
Workers
Owners

Sri Lanka Economic Research Conference 2020
210
Extent of Acquisition of Technological Innovation
Source: Authors’ estimation
Figure 2: Acquisition extents of the ten technological innovation by the
Internationalized tech-based Tea SMEs
The results show a wide variation among technological innovation with respect
to their acquisition extents. Furthermore, mean scores for acquisition extent of
the ten technological innovation were calculated in order to distinguish and
compare the acquisition extent between technologies.
The acquisition extent mean was calculated for each of the technological
innovation and they are arranged in the descending order of their mean scores
hence presented in Figure 3.
Average mean score of the ten technological innovation was 2.23. It can be
concluded that the acquisition extents of five technological innovation out of ten,
i.e. TRI tea harvesting shear, site specific fertilizers, soil substitutes for tea
nurseries, tortrix counting method to schedule spraying and Sunshine based
blister blight disease control schedule were below the average.
0.0% 20.0% 40.0% 60.0% 80.0%100.0%120.0%
Sunshine duration based spraying…
Larvae conut based chemical…
Alternative nursery media
Site specific fertilizer
TRI tea harvesting shear
TRI 3000 and 4000 series cultivars
VP/UM and ST/UM Fertilizers
Root starch testing before pruning
Archis pintoi-ground cover crop
Nursery fumigation using Basamid
2.5%
0.0%
2.5%
7.5%
5.0%
25.0%
42.5%
35.0%
27.5%
75.0%
5.0%
12.5%
12.5%
17.5%
15.0%
20.0%
5.0%
27.5%
12.5%
10.0%
7.5%
12.5%
27.5%
10.0%
27.5%
20.0%
2.5%
20.0%
20.0%
0.0%
85.0%
75.0%
57.5%
65.0%
52.5%
35.0%
50.0%
18.0%
37.5%
15.0%
Full
Acquisitio
n
Partial
Acquisitio
n

Transfering Agricultural Technology
211
Source: Derived through the analysis
Figure 3: Distributions of technological innovation according to the
Acquisition mean scores of internationalized tech-based Tea SMEs
Reasons for less and non-acquisition extent of technological innovation
The exploration of the reasons for less/not adopting the technological innovation
from the perspectives of Internationalized tech based Tea SME Owners and
Workers revealed that, among the many reasons for less/nil acquisition extent of
technological innovation, the lack of awareness and interest on the technologies
by the clientele system, poor performance of the technologies in field conditions,
concurrent socio-economic situation, complex nature of some technologies,
recommended technologies not being within the policies of plantation companies,
lack of skill and expertise to implement technologies at field level and
unavailability of materials/equipment were the major reasons were the major
reasons.
Conclusion and Policy Implications
Findings of the study reveal that there is a wide gap between Internationalized
tech- based Tea SME Owners and and Workers in Nuwara Eliya District in terms
tech-innovation knowledge on Technological Innovation. The Technological
Innovation acquisition extent in the sector is 55% which means that there is a
45% gap in technology acquisition extent in internationalized tech-based Tea
SMEs in Nuwara Eliya District of Sri Lanka.
1.2 1.3 1.41.58 1.6
2.16 2.2 2.3 2.3
3.02
0
0.5
1
1.5
2
2.5
3
3.5Acquisition Mean Scores of ten technological Innovation

Sri Lanka Economic Research Conference 2020
212
The findings inference the need of improving the present extension and
dissemination system to enhance tech-innovation knowledge and acquisition
extent of both the Owners and workers of the internationalized tech-based Tea
SMEs in Nuwara Eliya District in order to exploit the real advantages of the up-
to-date Technological Innovation. In the view to meet the increasing technology
needs of the sector, there is an urgent need of energizing the TRI and its extension
approaches. Recommended tech-innovation dissemination models can be
executed in a more practical manner
Keywords: Tech-Innovation Knowledge Gap, Acquisition Gap, Tea Tech- SMEs
References
Anon. (2003), Agriculture profile of Corporate Tea Sector. Tea Research Institute of Sri
Lanka, Talawakkelle
Central Bank of Sri Lanka (2018), Agricultural Activities in Sri Lanka, Colombo
Bhutia, P. (1975). A study on factors associated with Differential acquisition extent of
HYV of paddy farmers of Sikkim. Unpub. Ph.D Thesis: Division of Agricultural
Extension, IARI, New Delhi.
Bloom, M., Egalhalt, M., E., Hill, W. and Karathwool, P.R.(1985). Taxonomy of
education objectives. The cognitive domain, Longmans Green and Company, New
York.
Fisher, R.A. (1935). The Design of Experiments. Edinberg: Oliver and Beyd.
Suganthi, N. S. (2004). Technological Gap in Cashew Production. A Critical Analysis.
Unpub. Msc Thesis, TNAU, Coimbatore. pp.42-43
Tea Research Statistics (2018), Tea Research Institute Sri Lanka
Venkattakumar, R. (1997). Socio-Economic Analysis of Commercial Coconut Growers.
Unpub. M.Sc. Thesis, TNAU, Coimbatore

Transfering Agricultural Technology
213
FARMERS’ ATTITUDE TOWARDS CHEMICAL LEASING
FOR SUSTAINABILITY AND ENVIRONMENTAL
PROTECTION
Weerakkody M.P.1, Sivashankar P.1, Edirisinghe L.G.L.M.2,
Malkanthi S.H.P.1 1Department of Agribusiness Management, Sabaragamuwa University, Sri Lanka.
2National Cleaner Production Centre, Sri Lanka.
Corresponding author: [email protected]
Introduction
Agrochemicals are known to be causing complications to both environment and
human health (Wimalawansa & Wimalawansa, 2014). Chemical leasing (ChL)
models are being proposed to reduce this damage. ChL is “a service-oriented
business model, that shifts the focus from increasing sales volume of chemicals
towards a value-added approach.” Here, responsibilities of the producer and
service provider are captured in the entire life cycle (UNIDO, 2019).
Research Problem
Current business models of chemicals are where the producers, want to sell
higher volumes of produce while buyers expect lesser chemicals in the produce
they buy (Jakl & Schwager, 2008; Schwager et al., 2017). This model triggers
greater applications of agrochemicals, which is harmful.
Agricultural ChL can improve farmers' efficiency and decrease their ecological
impacts (Akkaya et al., 2020). Chemical provider and the user can gain cost
savings by adopting this concept (Jakl & Schwager, 2008; Lozanoa et al., 2013).
But, ChL is still a novel concept for Sri Lankan Agriculture. But if practiced,
farmers would reap the benefits in terms of reduced cost and less damage to the
environment. If farmers are preferring this concept, then this could be applied as
a business model, benefitting all. Thus, measuring the farmers’ attitudes towards
ChL is important.
The literature does not adequately cover ChL and agriculture. The purposes of
this research are to determine the farmer’s willingness to adopt chemical leasing
and to suggest a suitable model for agrochemical leasing for farmers in Sri Lanka.

Sri Lanka Economic Research Conference 2020
214
Methodology
The research is focused on conventional paddy farmers. As this is a pilot project
for examine the farmers perspective of the ChL concept, 100 paddy farmers in
Homagama DS Division from 4 Grama Niladhari Divisions were randomly
selected. The study used a deductive approach with survey strategy to collect
data during July-August, 2020 with a pretested interviewer administered
questionnaire.
Willingness to adopt ChL
The factors for the willingness to adopt were obtained through a Likert scale. Liu
& Zhang, (2011) has mentioned the factors of willingness to adopt (WTA)
alongside with the new technology adoption (9 attributes) using factor analysis.
WTA = β1 X1 + β2 X2+ β3 X3 + e1
𝑥 variables are determined from the principal component analysis. ꞵ’s are the
parameter estimates.
Sustainability of ChL approach
According to Schwager, et al., (2017) in order to demonstrate the sustainability
approach of ChL, five sustainability standards were created in 2009. Their
fundamental objectives were to make ecological and financial enhancements
quantifiable, and to secure the positive picture of ChL and preventing the misuse
of the term ChL for example for non-sufficient exercises. Equation for the
sustainability approach (SA) of the chemical leasing:
SA = β1 X1+ β2 X2 + β3 X3 + β4 X4 + e2
(In the equation Environment friendliness - X1, Cost effectiveness - X2,
Profitability - X3, Cost reduction - X4)
Environment protection of ChL approach
The aspects mentioned in the UNIDO's SIRM approach are used to build up the
environment protection attributes. Equation for the environment protection
approach (EPA) in chemical leasing:
EPA = β1 X1 + β2 X2+ β3 X3+ β4 X4+ β5 X5 + e3

Transfering Agricultural Technology
215
(X1: Using overdoses; X2: Threats to public health; X3: Pollution of ground water;
X4: Solution to the pollution; X5: Health concerns of farmers: these were
measured with lickert scales)
Results and Discussion
General Information Regarding the Consumption of Agrochemicals
All the sampled farmers use Agrochemicals. Herbicides and insecticides were
used by majority of them. Fungicides were used by 17.1% of farmers.
Agrochemicals were mostly brought from regional shops (69.7%).
Agrochemicals were applied 14 days after planting seeds by 52.6% of the
farmers. When there were few pests seen in the field 86.6% of farmers decided
to apply agrochemicals. Suitability for the crop is considered mostly (37%) by
the farmers when purchasing agrochemicals. Agrochemicals are applied to the
field after 14 days of laying the seeds even there is no sign of a pest. This practice
was followed by majority of the farmers (65.8%). Connected to the above
practice, agrochemicals are applied at the young age of the crop by majority of
farmers (72%).
Willingness to Adopt
There were 11 factors, analysed using principal component analysis and yielded
3 factors for the equation (1) is displayed in the Table 1. They explain a total of
63.54% of the variance for the considered variables.
Table 1: Extracted Components for WTA
Component
Number
Variable Label Variance
explained
Component 1 X1 Cost and quality 38.744%
Component 2 X2 Environmental
concern
16.430%
Component 3 X3 Handling
chemicals
8.359%
Source: Authors’ estimation
In order to analyse the relationship with willingness to adopt with the above
factors Structural Equation Modelling (SEM) was used. A path analysis was
done. Willingness to adopt ChL is mainly governed by the farmers’ environment
concern according to the analysis. Cost and quality factor have 0.06 impact on

Sri Lanka Economic Research Conference 2020
216
the willingness to adopt (Gallagher et al., 2008). This suggest that the current
cost and the quality of the yield are somewhat acceptable for the farmers.
Handling of chemicals has near to none impact on the willingness to adopt ChL.
Farmers are depending on the experience they got; they do not see any harm from
the practices they are doing.
Contribution of Chemical Leasing in the Approach of Sustainability
SEM analysis reveals, when sustainability changes by 1 standard deviation (SD),
environment friendliness changes in 0.30 SD and the cost effectiveness changes
in 0.27 SD. Profitability had only 0.07 changes in SD and cost reduction had 0.10
changes in SD for the sustainability approach. Sustainability of the current
model is mainly determined by the environment friendliness and the cost
effectiveness of the model. Profitability and cost reduction factors do not have a
considerable impact on the sustainability approach of the farmers. This result is
somewhat similar to Tatlidil et al., (2009) and Atteh, (1984) but contradictory to
Wei et al., (2007).
Contribution of Chemical Leasing for Environmental Protection – Farmers’
Perspectives
SEM reveals, using overdoses had -0.12 changes in SD on environmental
protection when the environment friendliness is determined by the pollution of
the ground water; Solution to the pollution had -0.08 changes in SD; Health
concerns of the farmer had 0.13 changes in SD; Threating public health had 0.58
changes in SD, and pollution of ground water had 0.35 changes in SD on the
environmental protection.
Conclusions
Agrochemicals have become a necessity for the paddy farming at the cost of
environment. ChL will reduce the over usage of agrochemicals. All most all
conventional paddy farmers use agrochemicals. Majority of them buys
agrochemicals from regional shops. If there is a new situation in the field, they
consult agricultural extension officer or the peer farmers. At the same time
majority of the farmers are highly dependent on the recommendation, seller
provides.
In sustainability approach, farmers are more interested in being cost effective and
to increase their profit. Addressing those two aspects would give better
implementation ability to the concept agrochemical leasing. Considering

Transfering Agricultural Technology
217
environmental protection approach, farmers are most enthusiastic on reducing
the ground water pollution caused by the agrochemicals. Since they have less
awareness on the reading toxicity levels and disposal methods, farmers are
willing to go for a different model of using agrochemicals. Most importantly,
most of them are subsistence farmers they are willing to reduce agrochemical
consumption because they have the idea that agrochemicals might deteriorate
their health.
Keywords: Agrochemicals, Chemical leasing, Environmental protection,
Sustainability, Willingness to adopt
References
Atteh, O.D., 1984. Nigerian farmers’ perception of pests and pesticides. International
Journal of Tropical Insect Science, 5(3), pp.213-220.
Gallagher, D., Ting, L., & Palmer, A. (2008). A journey into the unknown; taking the
fear out of structural equation modeling with AMOS for the first-time user. The
Marketing Review, 8(3), pp.255–275.
https://doi.org/10.1362/146934708x337672
Lozano, R., Carpenter, A., & Satric, V. (2013). Fostering green chemistry through a
collaborative business model:A Chemical Leasing case study from Serbia.
Resources, Conservation and Recycling, pp.136-144.
Schwager, P., Dunjic, B. and Kaltenegger, I., 2017. Success and failure of the Chemical
Leasing model in addressing sustainability challenges: Evidence from
practice. Current Opinion in Green and Sustainable Chemistry, 8, pp.14-17.
Tatlidil, F., Boz, I., & Tatlidil, H. (2009). Farmers’ perception of sustainable agriculture
and its determinants: A case study in Kahramanmaras province of Turkey.
Environment, Development and Sustainability, 11(6), pp.1091–1106.
UNIDO. (2019). Chemical Leasing. Retrieved June 4, 2020, from
https://chemicalleasing.org/what-chemical-leasing
Wei, Y. P., White, R. E., Chen, D., Davidson, B. A., & Zhang, J. B. (2007). Farmers’
perception of sustainability for crop production on the North China plain. Journal
of Sustainable Agriculture, 30(3), pp.129–147.
Wimalawansa, S. A., & Wimalawansa, S. J. (2014). Impact of changing agricultural
practices on human health: Chronic kidney disease of multi-factorial origin in Sri
Lanka . Wudpecker Journal of Agricultural Research , 110-124.

Sri Lanka Economic Research Conference 2020
218

219
Reorienting Sri Lankan Agriculture

Sri Lanka Economic Research Conference 2020
220

Reorienting Sri Lankan Agriculture
221
FORECASTING WEEKLY AND MONTHLY OPEN
MARKET AVERAGE RETAIL PRICES OF GREEN
CHILIES IN COLOMBO
Kushan, M. A. K.*, Basnayake, B. R. P. M., Kaushalya, K. D.,
Wickramarathne, R. H. M., Chandrasekara, N. V.
Department of Statistics & Computer Science,
University of Kelaniya, Sri Lanka.
*Corresponding Author: [email protected]
Introduction
The cultivation of green chili in Sri Lanka is playing a major role in the
agriculture industry. According to the Department of Agriculture, the potential
yield of green chili is low mainly due to many environmental changes. It has been
a reason for observing the high prices of this crop during the adverse seasons.
Therefore, such uncertainties in the price behavior need to be discussed through
proper statistical analysis. This study has been focused on the fluctuation of open
market average retail prices of green chili in Colombo, Sri Lanka. Many
researchers have predicted various commodity prices including Luo et al (2013),
who has considered the seasonal variations in monthly prices of cucumber in
wholesale China’s market. The results indicated that the Seasonal Autoregressive
Integrated Moving Average (SARIMA), ARIMA (1,0,1)(1,1,1)[12] model fitted
the cucumber market prices with an average fitting error of 0.17. Rathnayake et
al (2016) has conducted a comparative study of monthly wholesale prices of
green-chili and tomato in Sri Lanka, using time series analysis. The results
indicated that the quadratic model is the best trend model for both series with the
lowest Mean Absolute Percentage Error (MAPE), Mean Absolute Deviation
(MAD) and Mean Squared Deviation (MSD) values compared to growth curve
and linear trend. However, this study has been conducted considering weekly
prices for closely monitoring the price variations. It will provide rewards for all
the parties who are interested in the price fluctuations of green chili.
Research problem
According to the review done by Hector Kobbekaduwa Agrarian Research
Institute (2018), supply from major green chili production areas have decreased
during November 2018. The target extent of green chili cultivation in Yala was
10703 hectares. However, at the end of November, the actual cultivation was 42%
of the expected extent. Hence, the retail price of green chili was increased by 53%

Sri Lanka Economic Research Conference 2020
222
compared to the same period of the previous year. Furthermore, high retail price
fluctuations can be observed every year. Therefore, this study focuses on
identifying and forecasting the behavior of the green chili prices to overcome the
aforementioned dilemma.
Objective
The objective of this study is to identify the behavior of price variations,
modeling and forecasting weekly and monthly open market average retail prices
of green chili in Colombo, Sri Lanka using appropriate univariate time series
models.
Methodology
Green chili prices were obtained from the official web site of the Department of
Census and Statistics, Sri Lanka. Monthly average retail prices of green chili were
collected from January 2009 to December 2018, and weekly average retail prices
of green chili were collected from 1st week of January 2011 to the 4th week of
December 2018. The first 80% in both datasets were used for fitting the models
and the remaining 20% were used for testing the fitted models separately. A
descriptive analysis was done to identify the nature of the original datasets. There
were no missing values in both datasets and the original datasets of monthly and
weekly prices were used for modeling. Two separate models have been fitted for
monthly and weekly datasets. Augmented Dickey-Fuller
(ADF) test, Kwiatkowski-Phillips-Schmidt-Shin (KPSS) test, and Phillips–
Perron (PP) tests were used to determine the stationarity of the series and the
stationarity of the residuals was identified using the Ljung-Box Q statistic test.
Furthermore, transformations and differencing techniques were applied to
convert series into stationary. Several models were fitted by considering the lags
obtained from Autocorrelation Function (ACF) and Partial Autocorrelation
Function (PACF) for both series. Models that had the minimum Akaike
Information Criterion (AIC) were selected as the best models separately for both
datasets. Assumptions of heteroscedasticity, autocorrelation, and normality were
tested by using Autoregressive Conditional Heteroscedasticity (ARCH) test,
correlogram of residuals, and Jarque-Bera test respectively. Selected two models
have been used for forecasting the monthly and weekly average retail prices of
green chili. Performances of the forecasted values were evaluated by using Root
Mean Squared Error (RMSE) and MAPE.

Reorienting Sri Lankan Agriculture
223
Results and Discussion
The Mean value of both monthly and weekly green chili prices is Rs.320.67 per
kg and the maximum and minimum weekly prices are Rs.964.36 per kg and
Rs.116.71 per kg respectively.
• Time series model to forecast monthly green chilies prices
From available 120 observations, the first 96 were used to develop the model.
The remaining 24 observations were allocated to check the accuracy of the fitted
model.
As a preliminary step in determining whether a series is stationary or not, three
basic unit-root tests were performed. The results of the above three tests showed
that the series was not stationary at the 5% level of significance. Therefore, the
logarithm of the first differed monthly price series [d(log(price))] was considered
and the stationarity of the series was re-examined. The results of the above three
tests showed that d(log(price)) series is stationary at a 5% level of significance.
The ACF and PACF of d (log (price)) showed that the 1st, 2nd, 3rd, and 4th lags in
both plots are significant and that there is no seasonal pattern. Hence, different
Autoregressive Integrated Moving Average (ARIMA) models were fitted for the
d(log(price)) series and AIC values of each model were examined.
Among all candidate models, ARIMA (2,1,2) was selected as the better model
with the minimum AIC value of 0.1554 and a coefficient of determination (R2)
value of 54.34%.
The adequacy of the fitted model was evaluated using the recent 20% of data.
The p-value of the ARCH test was 0.9125 which is greater than 0.05. Therefore,
residuals did not violate the assumption of heteroscedasticity at a 5% level of
significance. According to the Ljung-Box test, p-values were greater than 0.05
which indicated there was no autocorrelation at a 5% level of significance.
Moreover, it was evidenced that the residuals followed a white noise distribution
(i.e. stationary). Jarque-Bera test for the normality of residuals indicated that the
p-value (0.1967) was greater than 0.05 which implies error terms were normally
distributed. Hence, the ARIMA (2,1,2) model was used to predict green chilies
prices for the remaining dataset. The MAPE of the model is 26.2588, while the
RMSE and MAE of the model are 128.8443 and 101.1879 respectively.
Table 1 illustrates few instances of actual and forecasted values for monthly
prices, while Figure 1 illustrates the behavior of actual versus fitted values of

Sri Lanka Economic Research Conference 2020
224
green chilies prices for the testing dataset and it indicates that the fitted model
captures the behavior of the test data.
Table 1: Actual and forecasted values of monthly prices for the first five
months of the test data set
Month Actual value (Price
in Rupees per kg)
Forecasted value
(Price in Rupees per
kg)
January 2017 317.71 270.83
February 2017 355.69 487.25
March 2017 315.74 353.64
April 2017 274.96 315.83
May 2017 406.71 296.43
Source: Author’s estimation
Source: Author’s estimation
Figure 1: Actual value (Price) Vs Fitted value (PRICEF) graph for monthly
green chilies prices

Reorienting Sri Lankan Agriculture
225
• Time series model to forecast weekly green chilies prices
From available 384 observations of green chilies prices, the first 307 records (first
80%) of the weekly average retail prices were used for fitting the model and the
remaining 77 records were used for testing the fitted model.
Results from the three unit-root tests showed that the series was not stationary at
the 5% level of significance. There was a slight upward trend, non-constant
variability and a clear seasonal pattern in the original dataset. Therefore, the
logarithm of the first differed weekly price series [d(log(price))] was considered
and the stationarity of the series was re-examined. The results of the above three
tests showed that d(log(price)) series is stationary at a 5% level of significance.
Furthermore, ACF, PACF and WO tests were used to identify the seasonality as
24. The first seasonal difference of the d(log(price)) series was applied and
rechecked the stationary. The series was identified as stationary and the following
results can be seen in the correlogram,The ACF sector lags 24,48 as seasonally
and lags 1,2,3 identified as Non-seasonal lags.The PACF sector lags 24,48,72 as
seasonally and lag 1 identified as Non-seasonal lag. Among all candidate models,
ARIMA (1,1,3)(1,1,1)[24] was selected as the better model with the minimum
AIC value of -0.9671 and R2 value of 45.18%.
Fitted ARIMA (1,1,3)(1,1,1)[24] model was evaluated for the model adequacy.
The assumption of heteroscedasticity was not violated with the p-value of 0.9699
from the ARCH test at a 5% level of significance. As the p values were greater
than 0.05 in the Ljung-Box test, it indicated the absence of autocorrelation in
residuals. Meanwhile, it implied the presence of white noise behavior of error
terms. Even though the assumption of normality of error terms is violated (p
value=0.0001) for high volatile data, the fitted model can be used in forecasting
(Aryani et al., 2018). Therefore, this model was used to predict green chilies
prices of the remaining dataset. The model exhibits 13.8721, 108.1580 and
63.8518 of MAPE, RMSE and MAE respectively.
Table 2 illustrates a few instances of actual and forecasted values for weekly
prices. The behavior of actual versus fitted values of green chilies prices for the
testing dataset is illustrated in Figure 2 and it represents that the fitted model
explains the fluctuations of the test data.

Sri Lanka Economic Research Conference 2020
226
Table 2: Actual and forecasted values of weekly prices for the first five weeks
of the test data set
Week Actual value (Price in
Rupees per kg)
Forecasted value (Price
in Rupees per kg)
Week 4 May 2017 733.33 325.82
Week 1 June 2017 668.06 878.80
Week 2 June 2017 673.61 753.57
Week 3 June 2017 649.51 783.54
Week 4 June 2017 522.36 621.63
Source: Authors’ estimation
Source: Authors’s estimation
Figure 2: Actual value (Price) Vs Fitted value (PRICEF) graph for weekly
prices of green chilies
Conclusion
ARIMA (2,1,2) model was identified as the better model with minimum AIC
value among the candidate models to forecast monthly average retail prices of
green chilies in Sri Lanka. The RMSE and MAPE values of this model were
128.84 and 26.26 respectively. This model satisfied all three assumptions of
heteroscedasticity, autocorrelation, and normality of the residuals. Moreover, the
assumption of the stationarity of the residuals was satisfied. To increase the

Reorienting Sri Lankan Agriculture
227
accuracy of the forecasted values, another model was assumed using weekly
average retail prices.
To predict weekly average retail prices of green chilies in Sri Lanka, ARIMA
(1,1,3)(1,1,1)[24] was selected as the better model with a minimum AIC value
among the candidate models. Furthermore, this model has the minimum RMSE
and MAPE values over the model fitted for monthly average retail prices, which
were 108.1580 and 13.8721 respectively. Contrarily, though only the assumption
of the normal distribution of the residuals was violated in this model, the
stationary assumption of the residuals which was tested using the Ljung-Box test
was not violated.
Practically, forecasting retail prices of green chilies on a monthly and weekly
basis provides a more precise idea about the price variations than forecasting over
extended periods. From the consumers’ point of view, forecasting of weekly
prices is more sensible as green chili is a perishable agricultural crop whereas
forecasting of monthly prices is more advantageous in monitoring and decision
making on retail prices. As future studies, machine learning techniques such as
artificial neural network models are supposed to be used in achieving more
accurate forecasting models.
Keywords: Akaike Information Criterion (AIC); Autoregressive Integrated
Moving Average (ARIMA); Mean Absolute Percentage Error (MAE); Seasonal
Autoregressive Integrated Moving Average (SARIMA)
References
Aryani, S., Aidi, M. N., & Syafitri, U. D. (2018). Analysis of The Profitability of Islamic
Banking Using Arimax Model and Regression with Arima Errors Model.
Gathondu, E. K. (2014). Modeling of wholesale prices for selected vegetables using time
series models in Kenya (Doctoral dissertation, Doctoral dissertation, University of
Nairobi).
Hector Kobbekaduwa Agrarian Research and Training Institute. (2018). FOOD
INFORMATION BULLETIN (Report No. 11). Retrieved from
http://www.harti.gov.lk/images/download/market_information/monthly_price_lis
t/November_0002018.pdf
Luo, C. S., Zhou, L. Y., & Wei, Q. F. (2013). Application of SARIMA model in cucumber
price forecast. In Applied Mechanics and Materials (Vol. 373, pp. 1686-1690).
Trans Tech Publications Ltd.

Sri Lanka Economic Research Conference 2020
228
Rathnayake, R. M. Y. L., Razmy, A. M., & Alibuhtto, M. C. (2016). A comparison of
price fluctuations for the green chilli and tomato in Dambulla dedicated economic
center in Sri Lanka.
Shukla, M., & Jharkharia, S. (2013). Applicability of ARIMA models in wholesale
vegetable market: an investigation. International Journal of Information Systems
and Supply Chain Management (IJISSCM), 6(3), 105-119.
Steiner, F. M., Seifert, B., Grasso, D. A., Le Moli, F., Arthofer, W., Stauffer, C., ... &
Schlick-Steiner, B. C. (2011). Mixed colonies and hybridisation of Messor
harvester ant species (Hymenoptera: Formicidae). Organisms Diversity &
Evolution, 11(2), 107.

Reorienting Sri Lankan Agriculture
229
AN ANALYSIS OF COLOMBO OPEN MARKET AVERAGE
RETAIL PRICES OF BIG ONIONS IN SRI LANKA USING
TIME SERIES FORECASTING TECHNIQUES
Wickramarathne, R. H. M.*, Chandrasekara, N. V. Department of Statistics & Computer Science, University of Kelaniya, Sri Lanka
*Corresponding author: [email protected]
Introduction
The cultivation of vegetable crops plays a key role in the Sri Lankan economy because
it provides a large scale of opportunities for farmers who are in rural areas. Along
with the other vegetable crops, big onion has become a prominent cash crop among
the farmers in Sri Lanka due to high profitability and high returns within a short
period. Currently, the local big onion production manages only 20% of the total
consumption of the country. The annual requirement of big onion is 280,000 MT.
According to the Sri Lanka Customs data, 232,318 MT are of this total requirement
is imported because the domestic production is not enough to meet the total demand
for big onions in the country. A comparative study is very important to identify the
price fluctuations in big onion. In Sri Lanka, no published researches were found on
forecasting Colombo open market average retail prices of big onion nevertheless
many researchers have forecast various commodity prices. This study has attempted
to forecast the average retail prices of big onion at Colombo open market, Sri Lanka
using the Seasonal Autoregressive Integrated Moving Average (SARIMA) approach.
Rathnayake et al., (2016) and Luo et al., (2013) have recommended that the SARIMA
models are found to be better for univariate time series modeling when the series
shows a seasonal pattern. Moreover, Abdul-Rahim & Zariyawati, (2011) and Arshad,
Awad, & Hameed, (2012) have suggested Autoregressive Distributed Lag (ARDL)
models as another preferable approach to investigate the long-run and short-run
relationships among the variables.
Research problem
Ministry of Finance, Sri Lanka has announced that the special commodity tax on
imported big onions has been increased by twenty rupees with effect from May 2019.
Ministry has decided to increase levies on big onion to enable the local farmers to get
a better price for their products and as a step to protect the local farmers. As a result,
the local big onion market has gained a high price as imports decreased. Big onion
market prices have been increased rapidly even though the local big onion

Sri Lanka Economic Research Conference 2020
230
productions are being received into the local market. This study is focused on
forecasting the monthly Colombo open market average retail prices of big onion
which helps to identify price fluctuations sooner.
The objective of the study is to find a proper forecasting model to identify the price
fluctuations and the behavior of monthly Colombo open market average retail prices
of big onions using both univariate and multivariate time series analysis techniques.
Methodology
For the study, time series data on monthly Colombo open market average retail prices
of big onion and red onion from December 2006 to June 2019 were obtained from the
official website of the Department of Census and Statistics, Sri Lanka. Exchange rates
were obtained from the official website of the Central Bank, Sri Lanka. A preliminary
analysis was done to identify the nature of the original data. First 85% of the data
from December 2006 to July 2017 were used for fitting the models and the remaining
15% of the data from August 2017 to June 2019 were used for testing the fitted model.
151 of total observations were considered for the analysis. The unit root tests were
applied to check the stationary of the series. A differencing technique was applied to
convert the non-stationary series into stationary. Several models were fitted using
both univariate and multivariate time series analysis techniques. The models which
had the minimum Akaike Information Criterion (AIC) was selected as the best models
separately for both univariate and multivariate time series models. The assumptions
of heteroscedasticity, autocorrelation, and normality were checked after fitting the
model by using the Autoregressive Conditional Heteroscedasticity (ARCH) test,
correlogram of residuals, and Jarque-Bera test respectively. In the multivariate
approach, model adequacy was tested using the above-mentioned model adequacy
tests along with additional tests which use to identify the structural stability of the
fitted model. The selected model has been used for forecasting and performances of
the forecasted values were evaluated using the Mean Absolute Percentage Error
(MAPE) and the Root Mean Squared Error (RMSE).
Results and Discussion
Summary statistics from the preliminary analysis provide information about the data.
Minimum and the maximum monthly Colombo open market average retail prices of
big onion are 50.59 rupees per kilogram and 172.69 rupees per kilogram respectively.
Time series modeling was developed under the assumption of stationary. Therefore,
monthly average retail prices of big onions were tested using unit root tests such as
Augmented Dicky-Fuller (ADF) test, Phillips-Perron (PP) test, and Kwiatkowski-
Phillips-Schmidt-Shin (KPSS) test. Among the three tests, only the KPSS test was

Reorienting Sri Lankan Agriculture
231
indicated that the level series is not stationary at 5% level of significance. The ACF
plot provided evidence of the presence of seasonal variation. Therefore, the first
seasonal difference was applied and reexamined for the stationary using the
aforementioned unit root tests. All tests indicated that the first seasonal differenced
series is stationary at 5% level of significance.
According to the ACF plot, lag 1, 2, and 3 are significant at 5% level of significance.
Therefore, those have been used as the order of non-seasonal moving average terms.
PACF plot showed that lag 1 as the only non-seasonal autoregressive lag which is
significant at 5% level of significance. In both ACF and PACF plots, the 12th seasonal
lag is significant at 5% level of significance and it has been used for both seasonal
autoregressive term and seasonal moving average term. The SARIMA models were
fitted and AIC values of every model were examined. Among all models in Table 1,
ARIMA (1, 0, 1) (1, 1, 1)[12] was selected as the best model which has the minimum
AIC value and its coefficient of determination (R2) is 75.95%.
The selected model was then subjected to diagnostic checking to validate the
adequacy of the estimated model before carrying out forecasting. The fitted model
was undertaken with the ARCH test, correlogram of residuals, and Jarque-Bera test
to evaluate the adequacy. The model satisfied all the assumptions except normality.
According to Aryani et al., (2018), the normality assumption is violated in most of
the time series models but forecasting can be done considering the fitted model. Table
1 contains a few instances of actual values and forecasted values of monthly Colombo
open market average retail prices of big onions.
Table 1: Actual values and forecasted values of monthly Colombo open market
average retail prices of big onion using ARIMA (1,0,1) (1,1,1)[12] model
p
Actual value
(Price in Rupees per kg)
Forecasted value
(Price in Rupees per kg)
Aug-17 123.81 109.45
Sep-17 128.87 114.57
Oct-17 138.73 122.70
Nov-17 172.92 147.72
Dec-17 170.99 155.32
Jan-18 145.99 137.76
Feb-18 112.85 123.46
Source: Authors’ estimation

Sri Lanka Economic Research Conference 2020
232
In Figure 1, actual and forecasted values of big onion prices have been visualized for
the testing dataset. The RMSE of the fitted model is 12.0215 while MAPE is 9.1384.
Source: Authors’ estimations
Figure 1: Actual values (BOnion_P) vs. forecasted values (B_Onion_PF) graph
for ARIMA (1, 0, 1) (1, 1, 1) [12] model
Secondly, a multivariate time series analysis was carried out. Exchange rate and
monthly average retail prices of red onion had the highest correlation with monthly
average retail prices of big onions. Table 2 contains the correlation matrix of the
selected variables for the analysis.
Table 2: Correlation matrix of the selected variables
Big Onion Price Exchange Rate Red Onion Price
Big Onion Price 1 0.5149 0.6699
Exchange Rate 0.5149 1 0.4557
Red Onion Price 0.6699 0.4557 1
Source: Authors’ estimation
The stationary of the series was tested using unit root tests. Table 3 contains the
summary of the stationary test outputs for the variables.

Reorienting Sri Lankan Agriculture
233
Table 3: Results of the unit root tests
ADF Test PP Test KPSS Test
Level
Series
1st
differenc
e
Rema
rks
Level
Series
1st
differenc
e
Rema
rks
Level
Series
1st
differenc
e
Rema
rks
Exchange
rate 0.9720 0.0000 I(1) 0.9730 0.0000 I(1) 1.2591 0.1421 I(1)
Red onion
price 0.0422 0.0000 I(1) 0.0599 0.0000 I(1) 0.5778 0.2817 I(1)
*Represent stationary at 5 percent level for ADF test and PP test while 0.4630 for KPSS test
respectively.
Source: Author’s estimation
According to the tests, all the variables are stationary in order 1 at 5% level of
significance. Log transformations of all selected series have been considered for the
analysis to meet the assumptions of inferential statistics. According to Pesaran,
Hashem & Shin, Yongcheol. (1995), ARDL model has an additional advantage of
yielding consistent estimates of the long-run coefficients that are irrespective of
whether the underlying regressors are I(1) or I(0). Therefore, an ARDL model has
been fitted as the next approach.
According to the bound test, the null hypothesis of no long-run relationship was
rejected at 5% level of significance because of the computed F-statistic (9.9097) is
greater than the upper bound of F-statistic. It implies that there is a long-run
relationship between the variables. The ARDL (1, 0, 3) has been selected as the best
model.
According to the long-run coefficients, exchange rate is the most significant factor
and its effect is significant at 5% level of significance. Coefficient (1.0889) of the
exchange rate shows that when increasing the exchange rate form 1 unit, it increases
the big onion monthly average retail price by 1.0889 in the long-run. Coefficients of
the variables in the error correction representation show the short-run elasticity. The
coefficient of error correction term (– 0.3576) is significant at 5% level. A highly
significant negative sign of the error correction term emphasizes the existence of a
long-run relationship among the variables. Nevertheless, the speed of adjustment
from the previous year’s disequilibrium is only 35.76%.
The stability of the model was tested using the cumulative sum of recursive residuals
(CUSUM) and the cumulative sum of squares of recursive residuals (CUSUMSQ)
tests. The model is structurally stable since both plots are within the critical limit of

Sri Lanka Economic Research Conference 2020
234
5% level of significance. The model was satisfied with the aforementioned basic
assumptions of time series analysis except normality. According to the experts (Giles,
2013), forecasting can be done using ARDL models even though the normality
assumption is violated. Table 2 contains a few of actual values and forecasted values
of monthly Colombo open market average retail prices of big onions using the fitted
model.
Table 4: Actual values and forecasted values of monthly Colombo open market
average retail prices of big onion using ARDL (1, 0, 3) model
Actual value
(Price in Rupees per kg)
Forecasted value
(Price in Rupees per kg)
Aug-17 123.81 90.26
Sep-17 128.87 132.25
Oct-17 138.73 105.92
Nov-17 172.92 145.89
Dec-17 170.99 144.75
Jan-18 145.99 136.42
Feb-18 112.85 111.94
Source: Authors’ estimation
Source: Authors’ estimation
Figure 2: Actual values (BOnion_P) vs. forecasted values (B_Onion_PFF) graph
for ARDL (1, 0, 3) model

Reorienting Sri Lankan Agriculture
235
The behavior of actual and forecasted values of big onion prices is visualized for the
test dataset in Figure 2. RMSE and MAPE of the fitted model are 15.5622 and
11.2504 respectively.
Conclusion
The fitted models were used for forecasting monthly Colombo open market average
retail prices of big onion in Sri Lanka. The ARIMA (1, 0, 1) (1, 1, 1) [12] model was
identified as the best model which had the minimum AIC value. The RMSE and
MAPE values of this model were 12.0215 while 9.1384 respectively. The RMSE and
MAPE of fitted ARDL (1, 0, 3) is 15.5622 and 11.2504 respectively. Both models
were satisfied all the assumptions except the normality of the residuals. According to
the measures of the forecasting error, it implies that the SARIMA model provides
more accurate predictions than selected ARDL model due to the minimum error but
the performance of the ARDL model can be improved using some other correlated
variables. As future proceedings, Feed-forward neural network which is the most
widely used model for time series forecasting can be implemented to achieve more
accurate models.
Keywords: Autoregressive Distributed Lag (ARDL); Seasonal Autoregressive
Integrated Moving Average (SARIMA); Time Series Analysis (TSA); Root Mean
Squared Error (RMSE)
References
Abdul-Rahim, A. S., & Zariyawati, M. A. (2011). Causal effects of world crude oil prices on
the prices of rice and soybean oil: An ardl approach. Pertanika Journal Social Science
and Humanities, 19(1), 123-130.
Arshad, F. M., & Hameed, A. A. A. (2012). Crude oil, palm oil stock and prices: How they
link. Review of Economics and Finance, 48-57.
Aryani, S., Aidi, M. N., &Syafitri, U. D. (2018). Analysis of The Profitability of Islamic
Banking Using Arimax Model and Regression with Arima Errors Model.
Giles, D. (2013). ARDL Models - Part II - Bounds Tests [Blog]. Retrieved 18 October 2020,
from https://davegiles.blogspot.com/2013/06/ardl-models-part-ii-bounds-tests.html.
Karantininis, K., Katrakylidis, K., &Persson, M. (2011). Price transmission in the Swedish
pork chain: Asymmetric non linear ARDL (No. 726-2016-49995, pp. 1-11).

Sri Lanka Economic Research Conference 2020
236
Luo, C. S., Zhou, L. Y., & Wei, Q. F. (2013). Application of SARIMA model in cucumber
price forecast. In Applied Mechanics and Materials (Vol. 373, pp. 1686-1690). Trans
Tech Publications Ltd.
Pesaran, H., & Shin, Y. (1995). An Autoregressive Distributed Lag Modeling Approach to
Co-integration AnalysisEconometncs and Economic Theory in the 20st Century: The
Ragnar Frisch Centennial Symposium, 31.
Rathnayake, R. M. Y. L., Razmy, A. M., & Alibuhtto, M. C. (2016). A comparison of price
fluctuations for the green chilli and tomato in Dambulla dedicated economic center in
Sri Lanka.

Reorienting Sri Lankan Agriculture
237
ECONOMIES OF SCALE IN PADDY FARMING IN THE
MAJOR SETTLEMENT SCHEMES IN SRI LANKA: A CASE
OF HURULUWEWA AGRICULTURE COLONIZATION
SCHEME
Abeyrathne, G.A.K.N.J.*, Prasanna, R.P.I.R. Department of Economics, Rajarata University of Sri Lanka.
*Corresponding author: [email protected]
Introduction
In terms of agriculture, ‘economies of scale’ refer to the ability of a farmer to increase
production by expanding the farm size with a fixed or relatively low increase in
production costs. In Sri Lankan agriculture, reducing the production cost and
increasing farm size is a debatable topic due to the constant nature of the land
resources devoted to agriculture at the aggregate level and structural rigidities or
inflexibility in the land market (Samaratunga, 2010). Also, informal land
fragmentation is one of the issues in agriculture colonization schemes.
Weerahewa (2004), and Thibbotuwawa and Weerahewa (2004) confirmed the
positive relationship between the scale of cultivation, and productivity and
competitiveness in paddy farming. Bandara (2008) emphasized the cost of production
difference between small-scale and large-scale farming, noting the capital-intensive
nature of large-scale farming. Studying economies of scale in agriculture,
Samaratunga (2010) noted the small size of the farm as a cause of low agricultural
income of farm households. This research evidence justifies large scale farming in
the country as it generates economies of scale and thereby support to generate
adequate agricultural income (Wickramaarachchi and Weerahewa, 2018; Sheng et
al., 2019; Bhatt and Bhat, 2014). Further, such findings support the agricultural land
market liberalization. In this backdrop, one topical subject which recently gained
interest among scholars to address the issue of the economic viability of paddy
farming is the scale of economies. Accordingly, this paper aims to test the hypothesis
that large paddy farms generate economies of scale in terms of paddy farming in the
agriculture colonization schemes.
Methodology
The ‘Huruluwewa Agriculture Colonization Scheme (HACS)’ was chosen as a study
setting to generate primary data for quantitative analysis. Data was primarily drawn
from an empirical survey covering 145 farm households by giving equal probabilities

Sri Lanka Economic Research Conference 2020
238
to all farm households to be in the sample. The secondary data for the study is drawn
from available reports in the irrigation department at the scheme and published
research articles on the subject.
The study uses the Quintile Regression Model (QRM) as expressed by Koenker and
Bassett (1978) and applied by Savastano and Scandizzo (2017), to study the
relationship between farm size and acreage production of paddy farming.
𝑦𝑖 = 𝛽0𝑞
+ 𝛽1𝑞
𝑥𝑖 + 𝛽2𝑞
𝑥𝑖2 + 𝛾𝑞𝑍𝑖 + 𝑢𝑖
Where 𝑦𝑖 is the paddy production of 𝑖𝑡ℎ farm, 𝑥𝑖 is the size of the 𝑖𝑡ℎ farm, 𝑍𝑖 is the
set of other scale variables, and 𝑢𝑖 is the random disturbance term. The parameters
𝛽0𝑞, 𝛽1
𝑞, 𝛽2
𝑞 and 𝛾𝑞 are in 𝑞𝑡ℎ quantile of acreage production.
Minimization of the sum of absolute deviations from an arbitrarily chosen quantiles
of farm productivity across different paddy farms gives the parameter vector
|𝛽0𝑞
𝛽1𝑞
𝛽2𝑞
𝛾𝑞|. This sum of absolute deviations can be presented as follows:
𝑀𝑖𝑛𝑖𝑚𝑖𝑧𝑒 ∑ 𝑖 |𝑦𝑖𝑞
− [ 𝛽0𝑞
+ 𝛽1𝑞
𝑥𝑖 + 𝛽2𝑞
𝑥𝑖2 + ∑ 𝛾𝑗
𝑞𝑧𝑖𝑗 ]
𝑗|
Where 𝑦𝑖𝑞 is the acreage productivity of paddy farm i at quantile q, (i=1,2,…,n); 𝑥𝑖 is
farm size, and 𝑧𝑖𝑗 is the covariate j for farm i (j = 1,2,……,k).
The solution for the above equation can be found by reviewing the equation as a linear
programming problem over the entire sample (Chamberlain, 1994), and solving for
values of the parameters and each quantile. Those parameters show the direction of
the effects of farm size on productivity, and the largeness of that effect compared to
different quantiles.
Results and discussion
Quantile regression was performed for 0.1, 0.2, 0.3, …, 0.9 quantiles in this study,
and we obtained the output as in Table 1.
Here, the impact of other scale variables (Z) was distinguished as Z1 (Labor
expenditure) and Z2 (Capital expenditure). The most interesting results are the
coefficients Z1 and Z2. The magnitude of the impact of Z1 on acreage paddy
production has decreased as the acreage paddy production moves from 0.8 quantile
to those in the 0.9 quantile. Z1 is more significant in 0.9 quantile than 0.8. The

Reorienting Sri Lankan Agriculture
239
magnitude of the impact of Z2 on the dependent variable increased when acreage
paddy production moved from the 0.6 quantile to 0.9 quantile. Same as the Z1, Z2 is
more significant in 0.9 quantile than the lower quantiles.
Table 1: Slope equality test result for the determinants of acreage production
Test summary Chi-Sq. Statistic Chi-Sq. d.f. Prob.
Wald Test 57.28870 32 0.0039
Source: Author’s estimation based on field survey data
Table 2 presents the results of the slope equality test for the determinants of acreage
productions. The Chi-quire statistics value of 57.288 is statistically significant at the
0.95 confidence level. The test results conclude that the coefficients differ across
quantile values.
Table 2: Quantile analysis: Dependent variable acreage paddy production
0.1 0.2 0.3 0.4 0.5 0.6 0.7 0.8 0.9
Constant 1083.734 2009.482 2037.567 2502.075 2544.351 2567.888 2718 2697.411 2659.4
(0.003)* (0.000)* (0.000)* (0.000)* (0.000)* (0.000)* (0.000)* (0.000)* (0.000)*
Farm Size -369.626 -881.663 -912.614 -1106.02 -1130.33 -1154.97 -1204.82 -1163.17 -817.476
(0.153) (0.000)* (0.000)* (0.000)* (0.000)* (0.000)* (0.000)* (0.000)* (0.090)
Farm Size2 32.51574 103.5837 105.3565 129.2652 129.2553 128.9047 136.1803 120.0795 52.61627
(0.441) (0.003)* (0.003)* (0.000)* (0.000)* (0.000)* (0.000)* (0.000)* (0.507)
Z1 (Labor) -0.00225 -5.16E-05 -0.00415 -0.00072 -0.00505 -0.00603 -0.00861 -0.01154 -0.02369
(0.692) (0.992) (0.466) (0.898) (0.344) (0.262) (0.098) (0.039)** (0.004)*
Z2 (Capital) 0.005631 0.004104 0.00762 0.00539 0.008368 0.011025 0.012453 0.015493 0.021179
(0.288) (0.426) (0.125) (0.276) (0.062) (0.024)** (0.031)** (0.079) (0.000)*
Note: Parentheses are P values, * Significant at 1% level, ** Significant at 5% level
Source: Author’s estimation based on field survey data
The QRM outputs support us in discussing the heterogeneity nature of acreage
production with farm size. The government reduced the size of the plot allocated to
farmers with the time by considering the less efficiency of land use due to the
incapability of managing a large plot by a single farmer. However, all settlers were
given the equal size of land in the agricultural settlement schemes in the dry zone.
Nevertheless, heterogeneity in the variable of land size arose due to the informal land

Sri Lanka Economic Research Conference 2020
240
fragmentation in the schemes. The Land Development Ordinance of 1935 established
regulatory provisions with limitations, preventing transfer, mortgage, sale, or sub-
division of holdings. The provision of the minimum-subdivision of holdings has
resulted in informal land fragmentation in the scheme due to the pressure of second
and third generations of the scheme.
Particularly, until the 7th quantile, the conditional mean value of farm size gets worst,
and then it improves, indicating the potentiality in large size farms in improving
acreage production. The field interviews with farmers revealed that informality in
land ownership had created a series of issues in farm management such as water
management at the farm level, agriculture subsidy related matters, and pest and
disease control. They reported farmer conflicts due to informal land fragmentation
and lower cost-effectiveness of the use of farm machinery by the farmers. Thus,
possible reasons for the worsening status of the conditional mean value of farm size
until the 7th quantile may be due to the informal land fragmentation since the
conditional mean value of farm size until the 7th quantile improves the condition.
Mostly, farmers in the 7th, 8th, and 9th quantiles are relatively large-scale farmers with
better ability in farm resource management due to relatively low or no informality in
land ownership.
Thus, informality in the land ownership in the lower quantiles is the main reason for
worsening conditions of farm size and acreage production relationships. Thapa
(2007), Sundqvist and Andersson (2006), and Ahmad and Qureshi (1999) have cited
the ability of intensive use of farm inputs with small size.
Second, how do we interpret the negative conditional mean value of variable Z1
(labor expenditure) and the positive value of variable Z2 (capital expenditure)?
It shows that until the 7th quantile, the coefficient of variable Z1 is not significant,
but, from the 7th quantile, it is significant, though the impact on acreage production is
negative. This indicates the need to deviate from the labor-intensive nature of farming
to capital intensive nature – more mechanization - to derive higher productivity in
paddy farming. The quantile results on variable Z2 – capital expenditure – further
supported this explanation. It shows that the coefficient of variable Z2 is significant
with positive and in an improving status from the 5th quantile upward, indicating the
need for capital intensive nature of farming to derive higher farm productivity.
Moreover, these findings can relate to quantile results of variable farm size as many
works of literature have noted the effectiveness of extending the farm mechanization
with a large farm.

Reorienting Sri Lankan Agriculture
241
Conclusion
The results of quantile regression revealed a negative relationship
between farm size and acreage production in paddy farms in the
scheme in all quantiles. Still, the condition improves from the 7th
quantile and the negative conditional mean value of variables labor
and capital, but significant since 7th and 5th quantiles, respectively.
The study identified less productivity of land use in the lower
quantiles due to the informality in land ownership. Because the
informality of land ownership creates a series of issues in farm
management such as water management at the farm level, agriculture
subsidy related matters, and pest and disease control. This is
contradicting to some findings of other works that indicate high
intensity in the use of resources at small farm settings.
Further, the study confirmed resource use inefficiency in informal
small farm settings and decreasing trend of returns when the farm
size decline from the initially recognized optimum level. Thus, the
investigation first concludes that informal land fragmentation into
small farm sizes has negatively affected the derivation of the scale of
economies in paddy farming in the agriculture colonization schemes.
The second conclusion is that the labor-intensive nature of the paddy
farm is less effective at the upper quantiles, and thus, capital
intensive farming – farm mechanization – is encouraged. Thus, the
policies should be formulated to address the informality in the land
ownership and issues created by the informal land fragmentations in
the colonization schemes.
Keywords: Agriculture colonization schemes; Cost of production;
Economies of scale; Informal land fragmentation; Productivity
References
Ahmad, M., & Qureshi, S. K. (1999). Recent evidence on farm size and land
productivity: implications for public policy. The Pakistan
Development Review, 1135-1153.

Sri Lanka Economic Research Conference 2020
242
Bandara, M. (2008). Country Report - Sri Lanka, s.l.:
http://www.unapcaem.org/Activities%20Files/A09105thTC/PPT/lk
-doc.pdf.
Bhatt, M. S., & Bhat, S. A. (2014). Technical efficiency and farm size
productivity-micro level evidence from Jammu and Kashmir.
International Journal of Food and Agricultural Economics, 27-49.
Chamberlain, G. (1994). Quantile regression, censoring, and the structure
of wages. In: C. S. (ed), ed. Advances in Econometrics, Sixth World
Congress, Volume 1. Cambridge: Cambridge Univerity Press.
Koenker, R., & Bassett, G. (1978). Regression Quantiles. Econometrica,
33-50.
Samaratunga, P. (2010). Achieving economic efficiency and equitable
distribution of land use through reforms and/or market discipline.
Buddhadasa Hewavitharana Felicitation , Volume 2.
Savastano, S., & Scnadizzo, P. L. (2017). Farms size and productivity : a
“direct-inverse-direct” relationship, Rome: World Bank Group.
Sheng, Y., Ding, J., & Huang, J. (2019). The relationship between farm size
and productivity in agriculture: evidence from maize production in
Northern China. American Journal of Agricultural Economics, 790-
806.
Sundqvist, P., & Andersson, L.(2006). A study of the impacts of land
fragmentation on agricultural productivity in Northern Vietnam,
Vietnam: Uppsala Univerity.
Thapa, S. (2007). The Relationship between Farm Size and Productivity:
Empirical Evidence from the Nepalese Mid-Hills, Trento: CIFREM.
Thibbotuwawa, R. M., & Weerahewa, J. (2004). Policy options for
sustainable paddy farming: Scope for land consolidation in Sri
Lanka., Peradeniya: Proceedings of the annual research sessions,
University of Peradeniya.
Weerahewa, J. (2004). Impact of Trade Liberalization and Market Reforms
on the Paddy/Rice Sector in Sri Lanka, Washinton DC: International
Food Policy Research Institute .

Reorienting Sri Lankan Agriculture
243
Wickramaarachchi, N., & Weerahewa, J. (2018). Relationship between land
size and productivity: empirical evidence from paddy farms in
irrigation settlements of Sri Lanka. Sri Lanka Journal of Economic
Research, 125-142.

Sri Lanka Economic Research Conference 2020
244
POLICY SUPPORT FOR PADDY AND OTHER
FOOD CROPS IN SRI LANKA: HOW LARGE ARE
THE TRANSFERS TO FARM PRODUCERS?
Sahibzada, S1* and Weerahewa, J.2 1Postgraduate Institute of Agriculture, University of Peradeniya, Sri
Lanka 2Department of Agricultural Economics and Business Management,
University of Peradeniya, Sri Lanka *Corresponding author: [email protected]
Introduction
COVID-19 is a pressing global concern and its economic
repercussions began impacting Sri Lanka at all levels in March 2020.
Agriculture has been least affected by the COVID-19 outbreak in the
world, the most impacts likely were larger on labor-intensive food
crops including fruits, vegetables, dairy products, and meat
processing (Kim et al, 2020). The same pattern, according to van
Buitenlandse Zaken, (2020), is visible in Sri Lanka too. It is
inevitable that to achieve success during the post-COVID-19 era,
production and distribution of agri-food in the local, regional,
national, and international supply chain levels need to be supported
(Hossain, 2020). The government of Sri Lanka speed up the
implementation of its National Food Production (NFP) program to
increase the production of paddy and other food crops in the period
following COVID-19 as a part of its support package. Since food
production is distorted in Sri Lanka through a myriad of input and
output taxes and subsidies, decisions to expand food crop cultivation
could have some significant implications on the taxpayers. The
magnitude of such effects is dependent on the degree of protection
given to each sector.
A number of authors evaluated the degree of protection provided by
the government of Sri Lanka on the food crop sector and comparative
advantage of food crops. Shilpi (1996) computed Domestic Resource
Cost (DRC) for paddy and found that Sri Lanka does not have a

Reorienting Sri Lankan Agriculture
245
comparative advantage in paddy production. In contrast, Kikuchi et
al (2002) found that while the comparative advantage of rice
production is declining over time, it is a socially profitable activity
in major irrigation regimes. Weerahewa et al (2003) showed that
paddy cultivation in larger holdings is economically profitable. The
objective of this study is to analyze and compare the social returns of
paddy and six other food crops in Sri Lanka using a Policy Analysis
Matrix (PAM) framework.
Methods of Analyses
The PAM framework was introduced by Monke and Pearson (1989)
to measure social profitability and transfer from tax payers to a
production activity. The PAM is widely employed in policy research,
which enables the researcher to bring out the distortions and
inefficacies of a policy. The PAM framework is shown in Table 1.
Table 1. Framework of Policy Analysis Matrix (PAM)
Items Revenue
Cost Profit
Tradable
Inputs
Non-Tradable
Inputs
Market Price A B C D
Social Price E F G H
Divergence I J K L
Note: Private profit 𝐷 = 𝐴 − (𝐵 + 𝐶); Social profit 𝐻 = 𝐸 − (𝐹 + 𝐺);
Output transfer 𝐼 = 𝐴 − 𝐸; Input transfer 𝐽 = 𝐵 − 𝐹; Factor transfer 𝐾 =
𝐶 − 𝐺; Net transfer 𝐿 = 𝐷 − 𝐻 or 𝐿 = 𝐼 − 𝐽 − 𝐾; Domestic Resource Cost
𝐷𝑅𝐶 =𝐺
𝐸−𝐹; Nomial Protection Coefficient 𝑁𝑃𝐶 =
𝐴
𝐸; Effective Protection
Coefficient 𝐸𝑃𝐶 =(𝐴−𝐵)
(𝐸−𝐹) ; Tax Payer Cost 𝑇𝑃𝐶 = 𝐼 − 𝐽.
Source: Adopted from Monke and Pearson (1989)
The rows define profitability as the difference between income and
costs, whereas the columns measure the effects of the difference in
incomes, costs, and profits arising from distorting policies and
market failures. The indicators commonly extracted from PAM are
given below:

Sri Lanka Economic Research Conference 2020
246
Nominal Protection Coefficient (NPC) shows the divergence
between the market price and social price. NPC>1 shows that
producers are protected through output market distortions.
Effective Protection Coefficient (EPC) is the ratio of value-added in
world prices (A-B) to value-added in social prices (E-F). EPC>1
shows that producers are protected through output and input market
distortions.
Domestic Resource Cost (DRC) is the ratio of the social cost of non-
tradable inputs of producing a particular product to the net foreign
exchange earned by producing the good domestically. DRC < 1
shows comparative advantage in producing a product, and DRC > 1
demonstrates comparative disadvantage.
Tax Payer Cost (TPC) is the difference between the divergence of
revenue and divergence of tradable input costs. The positive value
shows taxpayers are transferring the amount equivalent to TPC to
produce a particular product.
Data Sources
It is noteworthy to state that among the seven crops chosen only
paddy, maize, potato and big onion are included in the NFP program
while bitter gourd, cabbage, and pole bean are not supported by the
NFP program and all seven crops used similar types of inputs for the
cultivation and hence increase in cultivations in one crop reduces the
resources available for the cultivation of another. For calculation,
two types of prices were needed: private and shadow or social.
Private price data needed for the study was obtained from the cost of
cultivation of agriculture crops (COC) database of the Department of
Agriculture (DOA), Sri Lanka for Yala 2018 in the major irrigated
area. The latest COC data was available for 2018. Seed, fertilizers,
pesticide and weedicide were taken as tradable inputs and land, labor
and capital were considered as non-tradable inputs. Free on Board
(FOB) price for bitter gourd, cabbage and pole bean, i.e., exportable,
and Cost Insurance and Freight (CIF) for paddy, maize, potato, and
big onion, i.e., the importable, were used as the social price of
outputs. Moreover, CIF price for fertilizers, pesticides, weedicides

Reorienting Sri Lankan Agriculture
247
and seeds were used as social prices. They were sourced from the
International Trade Center and the World Bank. In the case of non-
tradable inputs, 25 percent of revenue and shadow wage were
assumed as social costs of land and labor respectively and the
opportunity cost of capital was computed using Shadow Exchange
Rate Factor (SERF).
Results and Discussion
The results revealed that the cultivation of all seven food crops is
privately profitable, bitter gourd, and cabbage being higher, while
only production of paddy, bitter gourd, cabbage and pole bean were
socially profitable activity bitter gourd and cabbage being higher
because the social revenue of outputs was much higher than their
private revenue (Table 2).
Table 2: Divergence in revenue, costs and returns of paddy and
OFC Yala, 2018.
(Rs./ac) Paddy Maize Potato Big
onion
Bitter
gourd
Cabbage Pole
bean
Revenue
Private 88,948 93,933 563,596 414,050 678,634 532,224 405,350
Social 130,133 92,078 343,793 330,041 1,104,457 1,050,551 473,700
Cost of
tradable
inputs
Private 13,189 17,614 202,274 48,590 54,255 116,885 48,271
Social 42,101 22,103 284,058 59,391 50,695 114,532 84,767
Cost of
domestic
inputs
Private 29,865 56,082 157,836 176,833 165,567 130,271 135,510
Social 54,587 76,819 291,453 271,505 327,532 257,488 230,647
Total cost
Private 43,054 73,696 360,110 225,423 219,822 247,156 183,781
Social 96,688 98,922 575,512 330,895 378,228 372,020 315,415
Profitabili
ty
Private 45,894 20,237 203,486 188,627 458,812 285,068 221,569
Social 33,445 -6,844 -231,718 -855 726,229 678,531 158,286
TPC -12,273 6,344 301,587 94,810 -429,382 -520,680 -31,854
Source: Author calculations based on Cost of Cultivation of Agriculture
Crops database of the Department of Agriculture, Sri Lanka (2018).
However, the market prices of paddy, bitter gourd, cabbage, and pole
bean were lower compared to world market equivalent prices. This
illustrates that the measures taken by the government have been
protected buyers at the expense of producer. The prices of potato, big

Sri Lanka Economic Research Conference 2020
248
onion, and maize made a contrary case; it was found that the
government had subsidized producers by taxing consumers.
The results show that, EPCs was greater than NPCs for paddy, maize,
potato, big onion, and pole bean. The highest difference was
observed for potato. The difference between NPC and EPC for
paddy is due to the subsidy given to seed and fertilizer, and for maize,
potato, big onion, and pole bean, it is due to the subsidy given to
fertilizer highly in potato (Table 3). The analysis demonstrates that
the government has taxed seeds and fertilizers for bitter gourd and
cabbage producers.
Table 3: PAM results for paddy and OFC in Yala, 2018.
Indicators Paddy Maize Potato Big
onion
Cabbage Bitter
gourd
Pole
bean
NPC 0.68 1.02 1.64 1.25 0.61 0.51 0.86
EPC 0.86 1.09 6.05 1.35 0.59 0.44 0.92
DRC 0.62 1.10 4.88 1.00 0.31 0.28 0.59
Source: Author calculations based on the Cost of Cultivation of Agriculture
Crops database of the Department of Agriculture, Sri Lanka (2018).
The Domestic Resource Cost (DRC) ratio was lesser than one for
cabbage, bitter gourd, pole bean and paddy and greater than one for
maize, potato and big onion.
It shows that Sri Lanka has a comparative advantage in producing
cabbage, bitter gourd, pole bean and paddy, because producers
utilized scarce resources efficiently in the producing these crops, but
has comparative disadvantage in producing maize, potato, and big
onion.
Moreover, the analysis clearly indicates that taxpayers have
transferred large sums for the cultivation of potato, big onion, and
maize by subsiding fertilizer. The highest transfer was recorded for
potato followed by big onion (Table 2).

Reorienting Sri Lankan Agriculture
249
Conclusion
These results indicated that in order to expand the cultivation of
maize, potato, and big onion the taxpayer will have to bear costs
largely owing to the existing subsidies on fertilizers and seeds. In
contrast, the cultivation of cabbage, bitter gourd, and pole bean,
which currently are not included in the NFP program, provide some
benefits to the society when the cultivation of the same is expanded.
The inclusion of the later in the NFP program and providing market
intelligence to reach export markets are recommended.
Keywords: COVID-19; Domestic Resource Cost; National Food
Production program; Nominal Protection Cost; Social Profit
References:
Hossain. (2020). Impacts of COVID-19 on the Agri-food Sector: Food
Security Policies of Asian Productivity Organization Members. The
Journal of Agricultural Sciences. 15(2), p 116-132.
Kikuchi, M., Barker, R., Samad, M., & Weligamage, P. (2002).
Comparative advantage of rice production in Sri Lanka with special
reference to irrigation costs. Developments in the Asian Rice
Economy, 343-368.
Kim, K., Kim, S., and Park, C. Y. (2020). Food Security in Asia and the
Pacific amid the COVID-19 Pandemic. ADB BRIEFS NO. 139.
Monke, E. A., & Pearson, S. R. (1989). The policy analysis matrix for
agricultural development (Vol. 201). Ithaca: Cornell university
press.
Priyanka, P. A., Chandrasekaran, M., & Nandakumar, E. (2015). Policy
analysis matrix approach: Applications, strengths and
weaknesses. Agricultural Research Journal, 52(3), 11-18.
Shilpi, F. (1996), Policy Incentives, Diversification and Comparative
Advantage of Non Plantation Crops in Sri Lanka, Working paper
No.2, prepared for World Bank report, Sri Lanka: Non plantation
crop sector policy alternatives.

Sri Lanka Economic Research Conference 2020
250
van Buitenlandse Zaken, M. (2020). Impact of COVID19 on food supply
chains in Sri Lanka-News item-netherlandsandyou. nl.
Weerahewa, J., Gunatilake, H. M., & Pitigala, H. (2003). Future of paddy
farming in Sri Lanka: Scale, comparative advantage and rural
poverty. Sri Lanka Economic Journal, 3(2), 104-144

Reorienting Sri Lankan Agriculture
251
IMPROVING WORKER SAFETY IN AGRO-PROCESSING:
A BEHAVIORAL ECONOMICS APPROACH THROUGH
NUDGING
Yashodara B.L.D.G.*, Sivashankar P.
Department of Agribusiness Management, Sabaragamuwa University of Sri Lanka *Corresponding author: [email protected]
Introduction
Health and safety in agriculture is important. Farmers and laborers deal with
chemicals, machineries and involves in various dangerous operations agriculture
and processing. In food and agro based industries, many injuries occur due to
careless behavior. Many researches have been conducted on changing behaviors
of the workers through behavioral changes with immediate or delayed incentives.
Economic experiments help to identify psychological factors in decision making,
and are done in controlled environment (Hobbs & Mooney, 2016). Nudging
techniques is such a technique experimented to change behaviors. According to
Thaler and Sunstein (2008), nudge is “any aspect of the choice architecture that
alters people behavior in a predictable way without forbidding any options on
significantly changing their social and economic behavior.
The purpose of this study is to improve identified safety management practices
through nudging at the a agro-based processing plant. Specifically, to identify the
measures that are not been adopted by employees, to come up with the effective
nudging techniques to overcome the lapses and to design the study, and finally
measure the compliance rates after implementing the nudges.
Methodology
According to the Lindhout and Reniers (2017) suitable steps for nudging was
identified and based on Ly et al’s (2013) guidelines, the selected nudging
techniques were classified. According to Ly et al., (2013) nudges can be
classified into 4 dimensions according to their characteristics. There are a few
steps to use before and after applying nudging technique. The techniques used in
this study were selected based on the following criteria: Type of population (socio
demographic factors, attitudes, knowledge); Location where implement the
techniques; and Situation or certain behavior that intend to adopt. Nudging
techniques that were applied in this study are;

Sri Lanka Economic Research Conference 2020
252
1. Messenger: People are more likely to act on information when messenger
(person who provide information) has similar characteristics to themselves.
Supervisors and safety officers act as messengers to give information on safety
measures for workers.
2. Framing: In case of an issue expressed as a profit or loss, people prefer a
certain profit and take risk in the face of loss.
3. Priming: Display of an image or message on safety measures.
Figure 1: Nudging process (Lindhout and Reniers (2017)
Map the Context
Identify bottlenecks
Reluctant to wear safety
equipment’s
(Carelessness, Health
problems, less
motivation and
communication)
Select
suitable
nudge
Priming
Framing
Messenger
Identify
levers for
nudging
Modify
current
choices
New
technique
Cost
effective
Design and iterate
Select suitable types for
particular areas.
Machines-priming,
messenger
Compound- framing,
messenger
Latex- priming.
messenger
Evaluation
Questionnaire after
one month of
applying

Reorienting Sri Lankan Agriculture
253
Data Collection
Observations and discussions were used to collect data for first three objectives.
Discussions with supervisors and leaders in the plant were about the current
situation of safety measures and compliancy rate of safety policies. Observations
were done for the adoptability to safety measures. After recognizing the problems
on adoptability, solutions and strategies were identified with the ideas of
supervisors and leaders. After applying nudging techniques to the plant,
structured questionnaire was used collect data on 91 workers in a agro-processing
firm randomly. There was high level of internal consistency for all 3 values
(Cronbach’s α >0.7), indicating excellent reliability (compliance rate, safety
satisfaction, and effectiveness of nudging types).
Results and Discussion
Socio economic analysis
When considering socio demographic factors of employees 94.5% of employees
are males, because the plant has more heavy work. About 78% of employees are
from latex and 22% are in compound sections. Mean age of employees is 28.49
years and mean experience is 4.81 years. Most of employees are in age of 22.
Most of employees are included in worker level which contain 82.4% of
employees 9.9% of leaders and 7.7% of employees are machine operators.
Workers have to engage in more latex related works and are exposed to heat in
the machinery.
Safety measures that are not adopted by employees.
According to the collected data main reason for accidents is not wearing PPE.
Though PPE is mandatory in latex processing, many do not follow it. There are
higher percentage of eye related accidents due to avoiding goggles. Carelessness
of the employees is also considered to one of the main reasons (37.03%). Firm’s
accident record also highlights this issue. Reluctance and lesser experience are
also some factors for non-compliancy of safety standards (Elapatha and
Mahaliyanaarachchi, 2016).
Strategies and methods to overcome this problem
Reminding about safety measures to be followed is the main strategy proposed
by employees. When those advices/signs are visible to employees, they are being
nudged to follow those. Best way to make visible is to display sign boards and
pictures related to safety measures. Employees are motivated on safety measure

Sri Lanka Economic Research Conference 2020
254
when their subordinates and supervisors give instructions. There are four types
of sign boards in the plant. Two of them comes under priming and other two types
were framing. From that one sign board indicates positive and other indicate
negative framing. Sign boards had motivated the employees to adopt and follow
safety measures in plant. According to the Dolan et al., (2012); Lindhout and
Reniers (2017) mainly framing and priming have done positive impact on
behavioral changes.
Assessing the level of compliancy after applying nudging techniques.
Table 1 presents the compliance level to safety measures in the processing plant
after applying nudging techniques. Compliance level has measured under 8
criteria mentioned as Table 1. Compliance level of occupational health and safety
had been measured by this technique in Kadasah, (2015). In this study there is an
effectiveness from nudging techniques because there are high mean values in the
compliance level. Compliance on safety measure is investigated through 3
dimensions which are productivity, priority and adoptability on safety measure
(Table 1).
Table 1: Compliance level of employees after applying nudging techniques
Mean Std. Deviation Compliance
level
Increased efficiency 4.20 .600 Excellent
Timely completion 3.90 .651 Good
Understanding importance of safety 4.56 .499 Excellent
Increased use of PPE 4.68 .469 Excellent
Act as a reminder to adopt safety measures. 4.58 .496 Excellent
Understanding the bad effects when not adopting safety measures 4.56 .600 Excellent
Following safety standards in process has increased 4.09 .463 Good
Accident rate has decreased 3.99 .459 Good
Means of Compliancy
Productivity 3.8791 .62955
Adaptability 3.6264 .50878
Priority 4.4945 .52438
Comparison of Nudging techniques-means
Messenger 4.1795 .45625
Framing 4.5641 .39657
priming 4.4945 .43987
Source: Author’s estimation

Reorienting Sri Lankan Agriculture
255
Mean value of priority is the highest which indicate mean value of 4.49. Workers
have prioritized the safety measures after applying nudging techniques and they
had gained the knowledge of how importance of safety measures. When
employees give priority to safety measures productivity have increased. Second
large mean value indicate by the productivity. The last section of Table 1
indicates the mean values of each nudging techniques. This indicate workers’
attitudes on nudging techniques that were applied in the plant. When comparing
the means, highest mean value was for messenger (4.17) and the least was
priming (4.49) which has moderate effect on people. Emrich et al., (2017) have
used priming on food consumption as traffic light labels. In both studies priming
makes a positive effect on reducing unhealthy food. Correlation between food
consumption and food labels were evaluated in those studies.
Conclusion
This study looked into the application of selected nudging techniques to improve
worker safety at agro-based processing plant. Compliance level of safety
instruction improved to a satisfactory level applying nudging techniques,
including the usage of PPE. Since there are small differences in mean values,
framing can be considered as a effective nudging technique among applied 3
techniques. Further employers are more reliable on negative framing than
positive framing. This study provides evidence that even though the
improvements are subtle, but nudging can be effectively used to change identified
behaviours. This study was a pilot study using nudging concept in behavioural
economics, thus repeated studies should be performed using different nudges.
Since there is a limitation in randomization, better conclusion can be taken by
further and extended studies on nudging techniques.
Keywords: Agricultural Processing, Behavioral economics, Framing, Health
and safety, Labor, Messenger, Nudging, Priming
References
Dolan, P., Hallsworth, M., Halpern, D., King, D., Metcalfe, R., & Vlaev, I. (2012).
Influencing behaviour: The mindspace way. Journal of Economic
Psychology, 33(1), 264-277.
Elapatha M.S. and Mahaliyanaarachchi R.P. (2016). Evaluating the Occupational Health
and safety Performance: A Case study in a food and vegetable processing factory
in Sri Lanka, Abstract Submission, ISBN 978-955-644-052-2, Annual Research
Session (ARS)of Sabaragamuwa University of Sri Lanka.

Sri Lanka Economic Research Conference 2020
256
Emrich, T. E., Qi, Y., Lou, W. Y., & L’Abbe, M. R. (2017). Traffic-light labels could
reduce population intakes of calories, total fat, saturated fat, and sodium. PloS one,
12(2), e0171188.
Hobbs, J. E., & Mooney, S. (2016). Applications of behavioral and experimental
economics to decision making in the agricultural, food, and resource sectors: an
introduction. Canadian Journal of Agricultural Economics/Revue canadienne
d'agroeconomie, 64(4), 593-597.
Lindhout, P., & Reniers, G. (2017). What about nudges in the process industry? Exploring
a new safety management tool. Journal of Loss Prevention in the Process
Industries, 50, 243-256.
Ly, Kim and Mazar, Nina and Zhao, Min and Soman, Dilip, A Practitioner's Guide to
Nudging (March 15, 2013). Rotman School of Management Working Paper No.
2609347, Available at SSRN: https://ssrn.com/abstract=2609347 or
http://dx.doi.org/10.2139/ssrn.2609347
Thaler, Cass R. Sunstein, (2008) Nudge: Improving decisions about health, wealth, and
happiness. Yale University Press, New Haven, CT

257
Strategic Investment for Future

Sri Lanka Economic Research Conference 2020
258

Strategic Invetment for Future
259
AN EVALUATION ON THE ECONOMIC PRODUCTIVITY
AND RISK MARGIN OF THE ENERGY TRANSITION TO
CLEAN ENERGY FOR EFFECTIVE STRATEGIC
INVESTMENT
Pallege O.M.
University of Colombo, Sri Lanka,
Introduction Background
Global crude oil demand in 2019 stoked at 100.1 million barrels per day. More
than a 50 percent is consumed by OECD countries (Market Report Series: Oil
2019 – Analysis - IEA, 2020). Though comparatively Sri Lanka consumes a
minor proportion of the world energy still created 3226 million USD to outflow
for crude oil imports in 2017 (Sri Lanka Energy sustainable authority, 2017).
Most of the energy needs of the country are fulfilled by fossil fuel which emits a
higher proportion of carbon creating a climb in higher carbon dioxide levels in
the atmosphere. It traps sun’s heat accelerating greenhouse effect. Therefore,
extreme weather conditions are apparent. According to NASA, a higher
proportion of the scientific community believes that man-made impacts have
exacerbated climate change evoking physical threats of severe weather
conditions. All the hazards are neither equally spread nor everyone on the same
level of risk. Yet in fact, the world is going through all these environmental
hazards. Every individual, firms and governments are directly and indirectly
impacted due to these catastrophes.
At present, the world supply chains are intermingled. Addressing these climatic
changes are crucial. It is important to examine how businesses can handle these
different risks. Long-term climate changes are not being predicted and
incorporated into decision-making processes. Investors are not specifically
discussing the actual physical risk within the portfolios. Most of the time this may
be attributed to incomplete data collection. Considering any investor with
economic, social and governance (ESG) refers to three core factors that would
overlay those factors in assessing the sustainability and societal effect on
investment (Inderst & Stewart, 2018). Any physical catastrophe may easily
impact either the supply chain or the company's assets directly. This poses
enormous challenges, as well as massive opportunities for the global economy.

Sri Lanka Economic Research Conference 2020
260
Research Problem
The research problem is focused on assessing the risk the businesses could
undergo with the continued use of fossil fuel for energy generation and how could
we mitigate from the transition of the energy consumption towards cleaner
energy.
Objectives
The study was conducted
• To identify the main drivers of climate risk that have emerged in the
global context due to the higher consumption of fossil fuel-based
energy generation.
• Examine the risk arouse for business due to accelerating climatic
changes.
• Analyzing techniques to manage the transition risk from fossil fuel to
renewable energy sources.
• To investigate the future and sketch pathways for the transition to low
carbon for a more sustainable and inclusive global economy.
Methodology
The study was focused on analyzing comprehensive literature and classifying
prevailing researches on the economic productivity of the transformation of
energy grid towards renewables. There is a limited study focused on the analysis
the overall energy levels of the top performing countries in the market. Besides,
the study has generated analyzed results based on the climate risk assessment that
has mapped physical risks into their fiscal and economic indicators. A major issue
was that the physical risk is not yet identified as a concept throughout all the
investor portfolios. In incorporating these physical risks into financial modeling,
it is difficult to determine the future cost of climate risk, since it is an amorphous
term. Granulating them down to manageable levels like carbon risk, property
vulnerability to physical risks have incorporated important findings.
Results and Discussion
The study predominantly assesses the literature and concludes the level of risk in
continued use of non-renewable energy sources. The gap within the current
energy usage and the environment protection was dominantly identified in the
major country portfolios. The backwardness in incorporating this into the

Strategic Invetment for Future
261
investment decisions was commonly identified. The profit motive has replaced
the strategic investment behaviors. Important action to mitigate fossil fuel
consumption is to be resilient. Resilience in a world which is rapidly evolving
can improve productivity.
The gap discusses on the requirement of more attention on the investment flow.
Since, it defines the present and future rates of the economy. The best example is
China who introduced economies of scale in photovoltaic solar power generation
in 2017, installed in its own country, even above the world's aggregate solar
generation (Aalbu et al., 2020). Today, a few major European utilities are
struggling to withstand the infiltration of excessive cheap solar power into their
electric grids. This will affect all sectors, from big firms to small firms that make
up inputs to these firms. The transition risk draws business world's hyper-
competitiveness, people must navigate in changing an unfamiliar countryside.
Hence it is overly critical that investors are best placed.
In considering the literature, a common factor identified was that most of the
governments have been working the transition to a lower global carbon economy
for 20 years. This has generated a real risk for corporations because they could
strand the possessing assets. Ultimately, the useful life of those properties will
therefore be less than expected. This raises concerns for banks and other types of
investors who for 20 to 30 years of the future are effectively investing in those
properties. Following the decision of the G20 minister to follow the most recent
recommendation from the Climate Disclosure by the Task Force (Hansen,
Eckstein, Bals & Weischer, 2020).
In overall, it was identified that the pressure generated from continuous usage of
non-renewable energy sources could push companies and foreign banks and
institutions to disclose better financial risks. That is a stronger evolution. The
more they communicate, the more open they are about their governance structure,
policies, risk management framework and key performance indicators (KPI),
which gives the shareholders more trust on the governance systems, risk
management systems to express trust in the in-depth knowledge on client
strategies (Risk Management & Corporate Governance, 2016).
Many studies highlighted on the perception of climate risk in global investment.
The more concern has been focused could offer better long-term returns. Since,
this is not only an ecological concern but also an investment concern. The
regulations of some corporations create risk when they are unable to handle it in

Sri Lanka Economic Research Conference 2020
262
the new climate. Often, it can create stranded assets. That is a global problem.
The long-term climate risk investment could provide better yields.
Conclusion
During the past few years, the shift from fossil fuels to renewable energy has been
accelerating. Mainly, the cost of generating wind and solar based energy are
falling, even below new fossil fired plants cost. It is a shift from centralized to
decentralized energy grid. Sri Lanka has a combined total installed generating
capacity of 4,017 megawatts (MW) for localized energy supplies in 2016. At the
same time, rooftop solar photovoltaic and wind plants in Hambanthota, along
with a higher proportion mastered by hydroelectricity, play a considerable role in
electricity generation. It was a phenomenon worldwide. With the national goals
for electricity set in Europe. Germany's push for clean energies in target markets
has reduced the prices.
The prices of new renewable energies have also been smaller than those of fossil
fuel. Fundamental economics drive that. Renewable energy potentials are
enormous. Because of the global phenomenon, many countries suffering from
electricity shortage are in transit. The primary lever for energy system is the
decarbonization of the energy system. This is a potential situation. However, it
does not always happen instantly. Uncertainty is the main problem that stands
together with renewable energy.
Also, many other issues concerning market interconnection, transmission and
distribution are crucial to better use of energy storage and smart data for demand-
side management. Clearing these existing problems may establish existence for
renewable energy while phasing out the current high sources of carbon. The
guiding force is economics. Various countries can attain different levels. The
transition to clean energy does not happen overnight, the phenomenon in the
world is vulnerable. The most crucial is when businesses inform their investors
on their mechanism of handling the new trend; the kind of risk they will disclose.
This is crucial on climate related topics. There are a variety of businesses that are
beginning with pilot approach. Companies must have a strategy and adequate
capacity for risk management with rapidly changing world of energy.
Keywords: Climate Change; Energy transition; Fossil Fuel Transition;
Investment Risk; Strategic Investment, Clean Energy

Strategic Invetment for Future
263
References
Aalbu, K., Brown, L., Bruintjes, K., Davidsson, S., Line, M. and Louise, A., (2020).
Impact transforming business, changing the world the united nations global
compact impact transforming business, changing the world.
Sustainabledevelopment.un.org. Retrieved from
https://sustainabledevelopment.un.org/content/documents/2149Impact%20Tra
nsforming%20Business.pdf
Black, A., Sundin, C., Carson, D. and Droz, H., (2019). TCFD Pilot Project Report and
Investor Guide to Scenario-Based Climate Risk Assessment in Real Estate
Portfolios. Retrieved from https://www.unepfi.org/wordpress/wp-
content/uploads/2019/11/TCFD-Real-Estate-Web_final_28112019.pdf
Carbonpricingdashboard.worldbank.org, (2020) Carbon Pricing Dashboard, Retrieved
from https://carbonpricingdashboard.worldbank.org/what-carbon-pricing
Cbsl.gov.lk. (2016). Central Bank of Sri Lanka. Retrieved from
https://www.cbsl.gov.lk/sites/default/files/cbslweb_documents/publications/an
nual_report/2016/en/7_Chapter_03.pdf
Energy.gov.lk. 2020. [online] Available at:
<http://www.energy.gov.lk/images/resources/downloads/annual-report-2017-
eng.pdf>
Hansen, G., Eckstein, D., Bals, C. and Weischer, L., (2020). The Role of The G20 In
Making Financial Flows Consistent with Global Long-Term Climate Goals.
Retrieved from
https://germanwatch.org/sites/germanwatch.org/files/publication/17753.pdf
IEA. 2020. Market Report Series: Oil 2019 – Analysis - IEA. [online] Available at:
<https://www.iea.org/reports/oil-2019>
Inderst, G. and Stewart, F., (2018). Incorporating environmental, social and governance
(ESG) factors into fixed income investment. Retrieved from
http://documents.worldbank.org/curated/en/913961524150628959/pdf/125442-

Sri Lanka Economic Research Conference 2020
264
REPL-PUBLIC-Incorporating-ESG-Factors-into-Fixed-Income-Investment-
Final-April26-LowRes.pdf
Oecd.org. (2020). Risk Management and Corporate Governance. Retrieved from
http://www.oecd.org/daf/ca/risk-management-corporate-governance.pdf
Stecke, K. and Kumar, S., (2009). Sources of Supply Chain Disruptions, Factors That
Breed Vulnerability, and Mitigating Strategies. Journal of Marketing Channels,
16(3), 193-226.

Strategic Invetment for Future
265
SRI LANKAN CONSTRUCTION INDUSTRY AND ITS
DOMESTIC FOOTPRINT
Gunaruwan, T. L., Jayasekara, C.G.* Department of Economics, University of Colombo, Sri Lanaka
*Corresponding author: [email protected]
Introduction
The construction industry is an essential driver of an economy’s infrastructure
development, a pre-requisite for its productive capacity building. The influence
of the industry is on all other domains of economic activity, ranging from
residential constructions up to large scale social and economic infrastructure
projects; the development of such domains would depend on contributions and
outputs coming from construction activity (Ramachandra & Rameezdeen, 2006).
In this respect, construction activity contributes to the Gross Domestic Product
(GDP); both directly as an industry generating its value-added, and indirectly, as
a driver of value-added in other productive sectors by being an essential
component the economy’s Gross Domestic Capital Formation (GDCF). In 2018,
for instance, the construction sector’s contribution to the country’s GDP stood at
6.8%, while construction inputs in the GDCF were at 37.65%. Therefore, the
performance of the construction industry is vital for Sri Lanka’s economic
growth, while it also mirrors the pattern of the country’s development path.
The construction industry was traditionally known to be essentially a domestic
activity because of two main reasons: (a) the outputs of the activity were not
traded across the border and almost exclusively consumed (or used) locally, and
(b) the inputs, including material, labour, and entrepreneurship, were sourced
essentially from local suppliers. Thus, the development of construction activities
was not yielding significant implications on the nation’s Balance of Payments.
However, with the opening of the economy and more so with the advent of
neoliberal policies in international trade, capital, and finance flows, this
traditional status-quo gradually changed. While the “local usability” nature of
construction output largely remained unchanged, the input side gradually evolved
towards increased importation of inputs, not only construction material, but also
capital, entrepreneurship and even labour.

Sri Lanka Economic Research Conference 2020
266
Economic implications of this trend could be profound as it could induce
significant bearing on the nation’s external finance, as well as on the domestic
value-added and indigenous technological advancement; thus, is important to be
examined at length.
Objectives
This study was conducted to deep dive into the trends observed in the
construction industry of Sri Lanka during the recent years. It examined the
prevailing condition of the industry and its evolution, with particular focus on the
foreign input intensity of the economy’s construction value-added, and its
ramified implications.
Material and Methods
The construction sector is referred to as a “barometer” of economic development
(Wijerathne, 2019). Healthy functioning of the sector is important for the smooth
progress in the socio-economic development process. Sri Lankan construction
sector has shown signs of growth in the post-civil disturbance era; recent trends
of growth in the supply of locally produced as well as imported cement, a pre-
requisite for the sustenance of the construction sector, reflects this trend
(Gunawardhana & Jayalath, 2017). Many impediments that constrain Sri Lankan
construction sector growth impetus have been observed. First, the trends of the
economy itself (Weddikara & Devappriya, 2002), including Governmental policy
changes, particularly on taxation of imports (Wijerathne, 2019), and on its role
shifted from investor to facilitator (Weddikara & Devappriya, 2002), and also the
delays in payments to contractors (Karunaratne & Silva, 2020) have been
identified as notable constraints. Second, high construction costs driven by ever-
increasing prices of construction material and by skilled worker shortages
coupled with high labour wages, appeared a significant frictional factor
(Gunawardhana & Jayalath, 2017), (Wijerathne, 2019). Third, low construction
volume, technological lags, capital shortages have been found handicapping the
sector. In addition, socio-economic stress, institutional weaknesses, inadequate
resources, and investment plans, and various other sociological, economic, and
political constraints also have been cited.
Furthermore, the pressure exerted from foreign construction companies is another
challenge the Sri Lankan construction companies are confronted with. Lesser
costs these foreign firms appeared experiencing could have been enabled by
various incentives accorded by their mother countries (Wijerathne, 2019)
including concessionary working capital, and low-cost construction machinery,

Strategic Invetment for Future
267
resulting in unfair competition4. This has put local firms at a further disadvantage
when those have already been suffering from a deficiency in terms of technology,
management, finances, and quality of local inputs (Weddikara & Devappriya,
2002).
The situation appears to have been further aggravated (a) by low priced imports
to the country, enabled through tax or custom duty concessions accorded under
foreign investment promotion schemes or international trade agreements, (b) by
corruption and favours accorded to foreign firms at policy and economic
management levels, and (c) also by the soft power of foreign parties exerted
through foreign aid (Dailynews, 2019).
It is in this conjuncture that researchers have discussed the importance of
encouraging local construction companies through appropriate policy changes
(Weddikara & Devappriya, 2002). Some even suggest that a local preference in
contract accordance should be put in place to the tune of 30%-40% of the giant
projects to prevent the downfall of the local construction industry, and also have
suggested encouraging the local supply of inputs (Karunaratne & Silva, 2020),
(Dailynews, 2019).5
Though have not been explicit, what has been advocated in these strategic
suggestions appears to be a call for reduced foreign dependence of Sri Lanka’s
construction sector, or an enhanced “domestic foot-print” (Warwick, 2018). In
this perception, it becomes important to study macroeconomic and sectoral
parameters to mirror the sector’s import intensity, and also possible trends of
evolution over the years; for which purpose the present research was conducted.
4 , For instance, Chinese Government accord subsidies to their contractors bidding for
projects abroad (Themorning, 2018), and it is no surprise therefore that the Chinese
construction firms have been found with 30% lesser costs compared to local construction
companies, and thus, are always at an advantage to win bids for contracts (Wijerathne,
2019).
5 Approximately 35%-40% of the industry activity, both in volume and value, are under
the purview of Chinese contractors. Chinese labour and Chinese building material are
used by these contractors, exerting pressure on Sri Lankan currency. Most of the Sri
Lankan contractors are out- bid in most of the instances due to the subsidies accorded to
Chinese firms by the Chinese government. (Themorning, 2018). The ultimate motive
within the next three years is to increase their share of the Sri Lankan construction
industry (with their own inputs materials and labour) up to 70%. (TOI, 2018).

Sri Lanka Economic Research Conference 2020
268
Several indicators, including the share of total imports, its Balance of Trade
(BoT) ratio, and the Terms of Trade (ToT) ratio of construction services, were
estimated for the period from 1987 to 2018 in order to mirror “foreign
dependence” of the construction sector of the Sri Lankan economy. Data required
for the analysis were sourced from Annual Reports of the Central Bank of Sri
Lanka published for various years. Tabular and graphical methods were adopted
in analysing and presenting results.
Analysis and Results
At the outset, the most fundamental indicator, namely, the share of the
construction sector in Sri Lanka’s total imports in the post-conflict period was
analysed; results are depicted in Figure 1
Source: Authors’ estimation
Figure 1: Construction sector share of total imports of goods and services
It is clear from this pattern that the Construction goods and service imports have
been occupying an increasingly larger share in the economy’s total imports. This
indicates the increasing burden the country’s balance of payments is bearing
owing to construction sector developments.
The study focused next on the evolution of construction sector Terms of Trade
(ToT), represented by the following indicator:
Construction Sector ToT = 𝑋 𝑜𝑓 𝐶𝑜𝑛𝑠𝑡𝑟 𝐺𝑜𝑜𝑑𝑠 𝑎𝑛𝑑 𝑆𝑒𝑟𝑣𝑖𝑐𝑒𝑠 − 𝑀 𝑜𝑓 𝐶𝑜𝑛𝑠𝑡𝑟 𝐺𝑜𝑜𝑑𝑠 𝑎𝑛𝑑 𝑆𝑒𝑟𝑣𝑖𝑐𝑒𝑠
𝑋 𝑜𝑓 𝐶𝑜𝑛𝑠𝑡𝑟 𝐺𝑜𝑜𝑑𝑠 𝑎𝑛𝑑 𝑆𝑒𝑟𝑣𝑖𝑐𝑒𝑠 + 𝑀 𝑜𝑓 𝐶𝑜𝑛𝑠𝑡𝑟 𝐺𝑜𝑜𝑑𝑠 𝑎𝑛𝑑 𝑆𝑒𝑟𝑣𝑖𝑐𝑒𝑠
5%
6%
6%
7%
7%
2009 2010 2011 2012 2013 2014 2015 2016 2017 2018

Strategic Invetment for Future
269
Noteworthy in Figure 2 that the Terms of Trade of Construction sector goods and
services has been undergoing a persistent unhealthy evolution over the past two
decades. While the isolated up-turn in 2009 could possibly be attributed to the
end of civil disturbances, its reversal once again from 2010 onwards indicates a
general pattern of decline.
Source: Authors’ estimations
Figure 2: Evolution of the Construction sector Terms of Trade Ratio
The study attempted to understand how the import intensity of the sectoral
activities evolved, by examining total sectoral imports as a ratio of the sectoral
Gross Value Added, the results are depicted in Figure 3.
The fact that Sri Lanka’s construction sector has gradually become more “import
intensive” during the study period is evidenced through these patterns.
Particularly note worthy are the two distinctive “import intensity levels of GDP”
prevailed before and after 2013, while there has been a gradual decline in
Construction sector Terms of Trade during the past two decades. Construction
sectoral value-added has become more than twice import intensive after 2013
compared to the level prevailed before that year. While causes of this curious leap
need further investigation through future research, it could be hypothesised that
(a) the post-conflict infrastructure development drive of the Government,
executed largely through foreign contractors hired on bilateral credit where no
-95%
-90%
-85%
-80%
-75%
-70%
-65%
-60%
2000 2003 2006 2009 2012 2015 2018
Construction Sector ToT

Sri Lanka Economic Research Conference 2020
270
competitive bidding was permitted and (b) material had to be sourced from the
donor countries, could have been behind this unhealthy shift.
Source: Authors’ estimations
Figure 3: Total sectoral imports as a ratio of the sectoral Gross Value-Added
Conclusions and Recommendations
The results of the study indicates that the pattern of evolution of the Sri Lankan
construction industry has not been towards increased national self-reliance, but
in the direction of increased foreign dependence. Construction sector’s Terms of
Trade undergoing a decline and its imports as a ratio of the sector’s value-added
having had an upward leap indicate that the economy’s construction demand is
increasingly met by imported inputs, both in terms of material and construction
services.
While the causes behind this unhealthy trend, and micro-level reflections of their
impacts would have to be investigated through detailed and profound research, it
brings to light the fact that the national economy is being deprived of the
opportunity of deriving maximum benefits from construction sector activities. A
sector that possesses the potential of generating positive input-output effects on
other economic sectors (Ramachandra & Rameezdeen, 2006) appears to have not
been sufficiently geared to produce growth-pulling economic multiplier effects
within the national economy, as many such effects have got leaked out. For the
Keynesian multiplier to generate the maximum extent of domestic economic
fruits, the effective demand, pushed forward through investment, should accrue
0.0%
0.1%
0.2%
0.3%
0.4%
0.5%
0.6%
2008 2010 2012 2014 2016 2018

Strategic Invetment for Future
271
to Sri Lankan contractors and domestic material producers, and not to foreign
contractors and suppliers.
Thus, the research leads to a suggestive inference that trade policies pertaining to
construction sector has not been successful in generating sufficiently high
forward and backward linkages within the national economy, and has thereby not
been able to produce maximum investment productivity in terms of domestic
value-added. The resultant perils become further harmful as most of the large-
scale construction projects undertaken have been funded through borrowings in
foreign currency, and inadequate domestic value creation through such project
implementation would make the economic burden of such foreign debt on future
generations much heavier.
The outcomes of the research, therefore, enable recommendation that the policy
makers should review in detail the input-output relationships the construction
sector could have with the broader national economy, and stimulate such
domestic activities to reap maximum multiplier effect from construction sector
investment. This emphasises the importance of the sector’s “domestic foot-print”,
and calls for an appropriate policy shift towards national preference when
sourcing construction services and material inputs, while ensuring greatest
possible investment deployment efficacy sought through thorough appraisal of
development projects and effective process of procurement, particularly
concerning public investment.
Keywords: Sri Lanka’s Construction sector; Domestic Footprint; Foreign
Dependence; Terms of Trade; Value Addition
References
Dailynews. (2019, November 7). Forum with future president to discuss way forward for
construction industry. Retrieved from dailynews:
https://www.dailynews.lk/2019/11/07/finance/202203/forum-future-president-
discuss-way
Gunawardhana, T., & Jayalath, A. (2017, October). Towards Sustainable constructions:
Trends in Sri Lankan Construction Industry - A Review. Retrieved from
researchgate: https://www.researchgate.net/publication/320907730
Karunaratne, R., & Silva, R. d. (2020, March 12). plight of Sri Lanka's construction
industry. Retrieved from dailymirror:
http://www.dailymirror.lk/editorialbusiness/Plight

Sri Lanka Economic Research Conference 2020
272
Ramachandra, T., & Rameezdeen, R. (2006). Study of the relationship between
construction Study of the relationship between construction. Built environment Sri
Lanka, 51-56.
Themorning. (2018, October). The conundrum of construction. Retrieved from
themorning: http://www.themorning.lk/biz-pg-3-lead-the-conundrum-of-
construction/
Warwick, B. (2018). How a Firm’s Domestic Footprint and Domestic Environmental
Uncertainties Jointly Shape Added Cultural Distances: The Roles of Resource
Dependence and Headquarters Attention. Journal of Management studies, 8836-
909.
Weddikara , C., & DEVAPRIYA, K. (2002). The Sri-Lankan Construction Industry in
the New Millennium. Retrieved from irbnet:
https://www.google.com/url?sa=t&source=web&rct=j&url=https://www.irbnet.d
e/daten/iconda
Wijerathne, N. N. (2019, March 6). Construction industry in a crisis. Retrieved from ft:
http://www.ft.lk/opinion/Construction-industry-in-a-crisis/14-674025

Strategic Invetment for Future
273
URBAN RESIDENTS’ WILLINGNESS-TO-PAY FOR
“GREEN SPACES” IN THE COLOMBO METROPOLITAN
AREA
Udalamaththa U. G. K. O.1*, Jayasinghe-Mudalige U. K.1, Dasanayake D.
M. W.2
1Department. of Agribusiness Management, Wayamba University of Sri Lanka, 2Summit Engineering Services and Consultants (Pvt.) Ltd.; Sri Lanka
*Corresponding author: [email protected]
Introduction
Problems associated with the provision of accommodation with standard
facilities and proximity to the places those provide essential services such as
education and health and lack of suitable lands for urban development have,
amongst others, become critical issues for the administrative bodies in many
cities, or in other words, urban areas characterized by high population density, in
the world, and Colombo metropolitan area has no exception. Due to convenience
in accessing to the place of work and rich infrastructure connecting that with the
place one lives, the demand for urban living is increasing, and notably the demand
for those “high-rise apartments” has been increased incessantly. The people in
need and those administrative bodies in supply are now considered “vertical
living” as a remedy to overcome these issues (Samaratunga et al., 2014).
Recreation, social interaction, aesthetics, cultural heritage and ecological
functions are deliberated as important variables that determine the level of
sustainability in once attempt to develop urban areas. It has been proved that the
infill developments without proper planning for more public ‘green space’ can
decrease the standards of living (Haaland et al., 2015). Increasing the number of
apartment construction projects in the urban areas has led to minimize the
availability of “urban green spaces”, i.e., any vegetation found in an urban
environment, including parks, open spaces, residential gardens, or street trees etc.
Research Problem
Urban green space is linking with the health and well-being of a human. When
living in an apartment located in an urban area, increase in mental stress, health
conflicts due to physical inactivity and environmental consequences are raised.
Although the development of urban green spaces was documented as a solution
to mitigate those negative aspects, the attitudes and perceptions of residents

Sri Lanka Economic Research Conference 2020
274
towards this trend are largely unknown to the policymakers and general public.
In this shed of light, it has become a necessity to state the preferences of the urban
residents towards green spaces in an urban area.
Specific Objective
This study was aimed to examine empirically the Willingness-To-Pay (WTP) of
those residents in urban apartments that show the characteristics of ‘vertical
living’ to implement an appropriate process to establish “Green Spaces” close to
their place of living.
Methodology
Choice experiment (CE) techniques were selected to estimate the WTP of those
targeted respondents, which is a common method used under the Stated
Preference (SP) methods to deal with this type of economic problem. After a
thorough review of the literature on this technique, a “Choice Set” was developed
by the researcher with key Attributes and corresponding attribute Levels (Chau
et al., 2010) (Table 1).
Table 1. Attributes and levels, coefficients and corresponding p value
resulting from CE
Attributes Levels Coefficient P value
Knowledge on green spacing Low*
High
0.11 0.78
Availability of space for physical
activities
Greater than or equal 1.5m2
Less than 1.5m2*
0.79 0.05***
Indoor air quality and noise level Unacceptable*
Acceptable
-0.21 0.59
Distance to the nearest green
spaces
Less than or equal 1.5km
Greater than 1.5km*
1.34 0.00***
Designing new or development
of existing mechanism to
establish green spaces
By own*
By developer
0.02 0.95
Management fee Rs. 5,000
Rs. 6,000
-7.9*10-4 0.05***
Note: *Base level, ***significant at 95% confidence level
Source: Udalamaththa (2020)

Strategic Invetment for Future
275
Following the Full Factorial Design, 64 possible alternatives were derived to
represent 06 Attributes selected, and 02 attribute Levels were included for each
attribute. The choices were reduced into 16 possible combinations by way of
orthogonalization procedure to eliminate empirical issues associated with model
estimation. Those combinations were, in turn, blocked into 08 different versions
and 02 options were included under each technique.
The primary data to estimate WTP were collected from those permanent residents
living in apartments (n=88) established in the Colombo metropolitan area and
close to the capital city of Sri Jayewardenepura. Each respondent was interviewed
personally by using a structured questionnaire from July to September 2019,
where the respondent was provided with a “Choice Card” (i.e., 1 out of 8 cards
prepared with varied combinations). The Conditional Logistic Regression (CLR)
techniques were applied to obtain the estimates, and in turn, to calculate the
Marginal Willingness to Pay (MWTP).
Results and Discussion
Descriptive Statistics of the Sample
The majority of respondents were Males (56%) and between the Ages of 20 to 40
years. Almost two third (68%) of them were the owners of the residence. Nearly
75 percent of them were married and employed full-time and 50 percent of
respondents completed education up to University level.
The outcome of the choice experiment
Table 1 depicts the values of coefficients and corresponding ‘p’ values resulting
from Choice Experiment. It highlights that three out of six Attributes were
significant, i.e., those representing the facts that: “Management fee”;
“Availability of space for physical activity”, and “Distance to the nearest green
space”. It can be seen that four Attributes were positively affecting the preferred
choice, and the attribute affecting negatively include “Indoor air quality and noise
level”.
Figure 1 depicts that the highest value of WTP was recorded for the “Distance to
the nearest green space”, which was less than 1.5 km from the place they live.
The lowest value was obtained by “Air quality and noise level”. This elaborates
the fact that, currently, the respondents, in general, “accept” the level of noise
and indoor air quality, and they were willing to take the attribute, if it provides
free of charge only.

Sri Lanka Economic Research Conference 2020
276
Source: Udalamaththa (2020)
Figure 1: MWTP values of attributes
Conclusions
The analysis results suggest that the urban residents in the Colombo metropolitan
area who experience the highest population density and the lack of space for
leisure are willing to pay for establishing green space, if they were close to their
accommodation (i.e. easy accessibility) and which provides the taste of a natural
environment. Their attitudes toward the concept and practice of sustainable
development, and more specifically, to protect ‘green spaces’ of the city were
positive.
From a policy point of view, this underlines the fact that public authorities can
design and develop green spaces combining those urban apartments and the
residents of the area can be ‘taxed’ for which to cover up the cost in a well-
designed incentive-based regulatory mechanism.
Keywords: Choice experiment; Marginal Willingness- To- Pay (MWTP); Urban
green spacing, vertical living
High
Knowledge on
GS
Greater than or
equal 1.5m^2
Acceptable
indoor air
quality and
noise level
Distance to the
nearest green
space is less
than 1.5km
Design green
space
mechanism by
developer
MW
TP (
Rs.
)
Attribute levels
13
1000
-266
169
2

Strategic Invetment for Future
277
References
Chau, C. K., Tse, M. S., & Chung, K. Y. (2010). A choice experiment to estimate the
effect of green experience on preferences and willingness-to-pay for green
building attributes. Building and Environment, 45(11), 2553-2561.
Haaland, C., & van Den Bosch, C. K. (2015). Challenges and strategies for urban green-
space planning in cities undergoing densification: A review. Urban forestry &
urban greening, 14(4), 760-771.
Samaratunga, T. C., & O'Hare, D. (2014). ‘Sahaspura’: the first high-rise housing project
for low-income people in Colombo, Sri Lanka. Australian Planner, 51(3), 223-
231.

Sri Lanka Economic Research Conference 2020
278
PUBLIC INVESTMENT PRODUCTIVITY AS A PATH FOR
SRI LANKA TO ESCAPE FROM MIDDLE INCOME TRAP:
REFLECTIONS FROM ANALYSES OF TRANSPORT
SECTOR PROJECTS
Gunaruwan, T.L., Jayasekara, C. G.* Department of Economics, University of Colombo, Sri Lanka
*Corresponding author: [email protected]
Introduction
Development economists have identified that there is a tendency of “frictions”
being applied to the growth process when developing economies are within the
middle-income bracket (many definitions as to what the limits are). This tendency
of growth slow-down approaching the boundaries of the high-income level is
called middle income trap. Sri Lankan situ – durations taken to cross from low-
income to lower Middle-Income, and Lower Middle Income to High Middle
Income, demonstrating the country also faced with the same effect. Surmounting
this barrier therefore appears requiring a strategic approach, as conventional
growth pushing activities and policies look incapable of handling this problem,
as demonstrated by many international experiences. This paper presents findings
of a research conducted to examine what slowing-down effects that could
possibly have been active in the Sri Lankan growth process in the recent past, and
how those could possibly be addressed through a strategic approach, focusing its
attention on the aspect of investment, one of the important drivers of economic
growth, and particularly on public investment.
Research problem
Middle income trap is a situation in which a country’s income per capita stagnates
below a certain level (Eryılmaza & Eryılmaza, 2015). This “problem” has been
widely addressed in literature, and many scholars have identified “investment”
as key to surmounting it. Investing more in education, and research, in developing
industrial comparative advantage, in industrial upgrading, in diversifying
businesses, for instance, have been highlighted (Eryılmaza & Eryılmaza, 2015).
The main focus of these analyses appears to be “investing more”; but only a little
emphasis has been given to “productivity aspect” of those investments. This
stands a significant gap in the present development discourse, particularly when

Strategic Invetment for Future
279
large amounts of resources are spent on public investments seeking a Keynesian-
type growth push.
Objectives
The aforesaid significant gap in the prevailing development discourse has been
addressed in the present research, and this paper sheds light on this important
dimension of “Investment productivity”, regarding which, there appears to be a
vacuum in Sri Lankan literature. The research aimed at examining the investment
effect on growth, with particular focus on public investment in transport sector
projects, and studying the associated weaknesses in view of fathoming the extent
of “friction” that the inadequate investment productivity might have been causing
against the growth process in Sri Lanka.
Materials and Methods
Investment has been a focus of discussion among economists in almost all
ideological schools. For instance, “centrality of investment” in the growth
process could be found emphasized by both Keynes and Kalecki. The role played
by investment in determining effective demand, and thus national savings as well
as national output and income has been widely discussed in economic analytical
literature (LOÂPEZ & MOTT, 1999). Classical economists also recognise how
instrumental investment would be in determining output and in exerting pressure
on key aspects such as employment (Alexiou , Tsaliki , & Tsoulfidis, 2016). Neo-
classicalists also have advanced the concept that investment would be responsible
for creation of business cycles in a free market economy (Mukherjee, 2008). In
that light, the present research addressed the “investment productivity” aspect
focusing its analysis on the post-conflict Sri Lanka, and examined the capital
deployment efficacy in the public sector in view of fathoming the bearing it could
have on the growth of national product.
In this analysis, capital is considered an essential factor of value creation and how
productive capital as a factor of production in an economy would depend on the
efficacy of incremental investments which over the years build the capital stock.
Incremental Capital/Output Ratio (ICOR), a parameter related to the Harrod –
Domar growth model (Middlebury, 2012) and representing this relationship,
would be low when investment productivity is high, and vice-versa.
ICOR =1
𝐼𝑛𝑣𝑒𝑠𝑡𝑚𝑒𝑛𝑡 𝑃𝑟𝑜𝑑𝑢𝑐𝑡𝑖𝑣𝑖𝑡𝑦=
1𝑔
[ 𝐼/𝑌 ]⁄=
[ 𝐼 𝑌⁄ ]
𝑔

Sri Lanka Economic Research Conference 2020
280
(I/Y), in the above equation, represents the “Investment ratio” or the economy’s
Gross Domestic Capital Formation (or Investment) as a share of its Gross
Domestic Product, while “g” standing for GDP growth rate. Given a particular
level of ICOR, a rather stable parameter, this relationship establishes the extent
to which the “investment rate” in an economy could influence its “growth rate”,
possibly “trapped” in a given income level (Pettinger, 2019).
To empirically analyse “capital deployment efficacy” in public investment in Sri
Lanka during the post-Conflict decade (from 2009 to 2019), several transport
sector development projects were selected and “investment made” on those
projects, sourced from literature, were appraised to apprehend their
“reasonableness”. Any excessive capital deployment, over and above the capital
expenditure at which those capital assets could have been realised, was estimated.
Such over expenditure would reflect “high” ICOR (or low investment
productivity) than what actually prevails in the economy as estimated using
secondary data sourced from the annual Reports of the Central bank of Sri Lanka.
Next, a “shadow real ICOR” was estimated based on the true value of investment
ploughed into creating the capital assets, and based on which, the potential
growth impetus was worked out under the scenario that the total Government
capital expenditure made were “truly invested” without any over-expenditures,
wastages or leakages. Thus, the growth rate differential, foregone in the economy
owing to “capital deployment inefficacy”, could be estimated assuming scenarios
of different scales of capital deployment inefficacy prevailing in the overall
public investment portfolio in Sri Lanka.
Analysis, Results and Discussion
First, the study examined several large-scale infrastructure development projects
in the transport sector, particularly in highways and railways. In order to gather
information pertaining to the recorded expenditures as well as the levels of
expenditures at which those projects could have actually been realized.
Secondary data on alternative projects, proposals, and international and local
bench-marking based on similar projects, were used for this purpose.
Table 1 summarizes the results of this analysis, in which recorded as well as
realizable expenditures are compared.

Strategic Invetment for Future
281
Table 1: Capital expenditures incurred and costs of alternatives - Transport
Sector
Source: Authors’ estimations using information from secondary sources
The above analytical results indicate that Sri Lanka’s transport project costs could
have been at least 77% lower had the alternatives been properly examined and
competitive bid contract awarding been practiced. This implies that the same
projects could have been realized at one-fourth the capital expenditure that has
been incurred. Quite apart from secondary economics and multiplier effects that
could have been realized had the projects been locally executed by national
enterprises, the mere excess of capital expenditure itself of that substantial scale
becomes a waste and an added burden on public debt (as most have been executed
Project Expenditure
Incurred in the
project
(Country of
origin of the
Contractor)
Capital Expenditure on the best
alternative through which the capital
assets could have been generated
Estimated
Capital
Saving
(%) Cost
and Alternative
Possible
saving
Northern line Railway Signaling
(average per Station)
USD 3 Mn
(India)
USD 0.3 Mn (Charged
by Sub contractor) USD 2.7 Mn 90.0%
Matara-Beliatta Railway
Signaling
(Average per Station)
USD 3.5 Mn
(China)
USD 0.3 Mn
(At local cost at
Narahenpita)
USD 3.2 Mn
91.4%
Mannar Line Rail Track
Reconstruction
(Average per km)
USD 2.2 Mn
(India)
USD 0.5 Mn
(Local, Vavuniya to
Omantahi)
USD 1.7 Mn 77.3%
Omanthai-Pallai Rail Track
Reconstruction
(Average per km)
USD 1.9 Mn
(India)
USD 0.5 Mn
(Local,Vavuniya to
Omanthai)
USD 1.4 Mn 73.7%
Pallai-Kankasanthurai Rail
Track Reconstruction
(Average per km)
USD 2.6 Mn
(India)
USD 0.5 Mn
(Local, Vavuniya to
Omanthai)
USD 2.1 Mn 80.8%
Matara- Beliatta Railway new
construction
(Average per km)
USD 9.2 Mn
(China)
USD 4.8 Mn
(CECB Alt 4 & 6 for
Battaramulla Railway)
USD 4.3 Mn 47.0%
Road Construction – Surface
Technology : DBST (per m-km)
Rs 16 Mn
(Foreign, no bid
Competition)
Rs 2.6 Mn
(Local) Rs 13.4 Mn 83.8%
Road Construction – Surface
Technology: SBST (per m-km)
Rs 7.3 Mn
(Foreign, no bid
competition)
Rs 2.3 Mn
(Local) Rs 5.0 Mn 68.5%
Road Construction – Surface
Technology: Asphalt(per m-km)
Rs 15 Mn
(Foreign, no bid
competition)
Rs 5.0 Mn
(Local) Rs 10.0 Mn 66.7%
Source: Authors’ estimations using information from secondary sources

Sri Lanka Economic Research Conference 2020
282
on foreign borrowings). The adverse effect of this capital deployment inefficacy
on growth is likely to be significant.
To estimate this effect, the ICOR worked out on actual capital expenditure
records in public accounts was compared against an estimated “shadow real
ICOR” based on the true expenditure that would have really gone into generating
the capital assets on three different scenarios of “capital savings foregone”,
namely 75%, 50% and 25%. The supplementary growth impetus that could have
been realized on the “shadow real ICOR”, had the total capital expenditure
incurred been physically invested to create economic assets without going in
waste, was thus worked out; the results of which analysis are summarized in the
Table 2.
Table 2: Recorded ICOR, Estimated Shadow Real ICOR and Growth
Foregone
Source: Authors’ calculations
These results bring suggestive evidence to the effect that Sri Lanka during the
past decade would possibly have lost an otherwise realizable supplementary
growth impetus owing to over-expenditure of public investment; the excess
appears to have been wasted or leaked out. This potential supplementary impetus
could be substantial and figure from 0.71 per cent to 0.22 per cent, depending on
the level of wasteful expenditure ranging from 75 per cent to 25 per cent,
respectively, in the overall Government capital expenditure portfolio in general
over the past decade.
Scenario Scenario of Average Capital
Expenditure Savings Potential of the
Government
75% 50% 25%
Recorded ICOR (average for 10 years 2010 to 2019) 6.57 6.57 6.57
Recorded Investment Ratio 34.39% 34.39% 34.39%
Recorded Public Investment Ratio 5.43% 5.43% 5.43%
Shadow Real Public Investment Ratio 1.36% 2.72% 4.07%
Shadow Real Investment ratio 30.28% 31.64% 33.00%
Estimated Shadow Real ICOR 5.79 6.05 6.31
Growth rate feasible if total CapEx by Govt was physically
invested 5.94% 5.68% 5.45%
Recorded Growth rate 5.23% 5.23% 5.23%
Growth differential foregone owing to capital deployment
inefficacy 0.71% 0.45% 0.22%

Strategic Invetment for Future
283
Thus, it is clear that the inefficiencies present in public investment planning,
appraisal and implementation would represent a substantial constraint to growth.
Removal of such constraints would significantly reduce the economy’s ICOR
level (implying augmented investment productivity), and thereby facilitate the
nation’s economic progress towards early escape from the Middle-Income Trap.
Conclusion and recommendations
Investment process has inefficacies – high costs, leakages, inadequate domestic
effective demand creation - as reflected from transport sector projects in Sri
Lanka. While generalization of this inference to other sectors require further
research, such presence to some extent could possibly be behind unhealthy
pattern observed during the past 10 years with regard to ICOR, reflecting
worsening investment productivity. Analyses suggest that public investments
funded through bilateral foreign borrowings are much lesser productive than
locally funded projects. Economic leakages associated with such investments
appear significantly high, particularly because bilateral loans are usually “tied to
donor” through conditionality so no market competition advantage is made
available to the borrower country. To national value addition, this is worse than
facing international competition as advocated in Neoliberal policy prescriptions,
which at least permit fair competition opportunity for local firms. Therefore,
public investment financing through unsolicited offers should be avoided.
Complete overhaul is necessary to streamline public investment appraisal /
approval process, without which, Investment in Sri Lanka will largely be mere
book entries with no or little value adding effect. If that could not be addressed,
escaping from the Middle-Income Trap through investment spending will be
constrained for long periods into future.
Keywords: Economic growth; Middle Income Trap; Investment Productivity;
ICOR; Sri Lanka
References
Alexiou , C., Tsaliki , P., & Tsoulfidis, L. (2016). Classical theory of Investment - panel
conintegration evidences from 13 EU countries. contributions to political
economy, 39 - 56.
Eryılmaza, M. E., & Eryılmaza, F. (2015). A Discussion about the Possible Effect of
Middle Income Trap on. Retrieved from sciencedirect: www.sceincedirect.com
LOÂPEZ, J., & MOTT, T. (1999). Kalecki Versus Keynes on the determinants of
investment . Retrieved from researchgate:

Sri Lanka Economic Research Conference 2020
284
https://www.researchgate.net/publication/24088217_Kalecki_Versus_Keynes_on
_the_Determinants_of_Investment
Middlebury. (2012). Harrod-Domar Model. Retrieved from middlebury:
http://sites.middlebury.edu/econ0428/harrod-domar-model/
Mukherjee, S. (2008). The Neoclassical Theory of Investment. Retrieved from
economicsdiscussion:
https://www.economicsdiscussion.net/investment/neoclassical-theory/the-
neoclassical-theory-of-investment-with-diagram/10383
Pettinger, T. (2019). Harrod-Domar Model of Growth and its Limitations. Retrieved from
economicshelp: https://www.economicshelp.org/blog/498/economics/harod-
domar-model-of-growth-and-its-limitations/

Strategic Invetment for Future
285
IMPACT OF GOVERNMENT EXPENDITURE ON
PRIVATE INVESTMENT IN SRI LANKA
Rathnasiri R.A.1*, Soysa J.S.V.N.T.2 1Department of Banking and Finance, Wayamba University of Sri Lanka
2Institute of Human Resource Advancement, University of Colombo, Sri Lanka *Corresponding author: [email protected]
Introduction
The government sector performs an important role in economic management in
developing countries. The role of government in economic management is
performed through the implementation of fiscal and monetary policies. In this
context, fiscal policy actions are playing a vital role in promoting growth and
development particularly in developing countries. Theoretically, this is
confirmed by the new growth theory in which theory identified public spending
as a major fiscal policy instrument which promotes productivity and long-term
growth (Rathnasiri and Soysa 2020; Udoh,2011; Rathnasiri and
wijesinghe,2012). However, the impact of government expenditure on private
investment is controversial in the extensive literature (Ahmed and Miller 1999;
Tsung-wu Ho 2001; Nikiforos T. Laopodis 2001; Faik Bilgili 2003; Hussain et
al., 2009; Motlaleng, Nangula, and Moffat 2011). The majority of the previous
empirical literature are based on the two main theoretical strands; neoclassical
and Keynesian views. In this regard, the negative crowding- out effect of
government spending is postulated by neo classical school and the positive
crowding- in effect in the literature was formed by Keynesian theory.
Problem Statement
The previous empirical studies argued in support as well as against increases in
government expenditure on private investment. This explained an important
unresolved issue on the relationship between government expenditure and private
investment. In the previous empirical literature, some perceived increase in
government expenditure as a means of promoting economic activities through the
development of economic infrastructure that attract private investors to invest
heavily in the economy by lowering cost to the private sector (Hussain and Zafar,
2017, Muhammad et.al., 2012).
Some other studies confirmed the neo-classical theory where increasing
government expenditure crowding out private investment, that increases interest

Sri Lanka Economic Research Conference 2020
286
rates due to high demand for borrowing in the loanable fund market reduces the
available credit facilities to the private sector. Further, high demand for
borrowings increases money market interest rates and finally reduces the private
investment. This may distort the prices and leads to misallocation of resources
(Barro 1991; Folster and Henreckson, 2001).
On the other hand, some others argued based on the Keynesian view that
increasing government expenditure complements private investment with low
interest rate policy (Sinevičienė, 2015; Fujii et. al., 2013; Cooray, 2009; Ranjan
and Sharma, 2008). Expansionary fiscal policy actions stimulate aggregate
demand in view of the matter that underutilization of resources paying the way
to increase economic growth. Moreover, investigations carried out by Laopodis
(2001); Faik Bilgili (2003); Motlaleng, Nangula, and Moffat (2011); Hussain et
al., (2009) argued that there would be neither crowding-in, nor crowding out
effect of private investment due to increase in government expenditure. As a
result, private investment and government expenditure are considered to behave
independently. This view is based on the Recardian equivalence theorem (Sen
and Kaya, 2014).
Even though there are controversial ideas, this intended issue is very important
to analyze because private investment is one of the main growth drivers in the
long run. Yilanci and Aydin (2016) explained the role of private investment in
developing countries as main players in the growth process. Hence, growth
increases the productive capacity of the country. There were limited country
specific studies conducted to analyze the effects of government expenditure on
private investment in developing countries (Dilrukshini, 2009). It seems that a
time series country specific study is potentially more informative as such studies
captures country specific factors, although the findings cannot be generalized to
other countries. In Sri Lanka, the size of the government sector has increased with
the implementation of development projects and the expansion of economic
activities after 1977 with the focus on the more development orientation. The size
of the government which measures government expenditure as a percentage of
GDP has increased with the introduction of liberalized policy after 1977. For
instance, the above figure has increased at the end of 1970’s and the midst of
1980’s and 1990’s (CBSL 2018). Further, it has been noticed that private
investment considerably fluctuated during the study period 1977- 2019 and the
recorded period average was 27.5 percent of GDP. The limited empirical
literature confirmed the positive association between government expenditure

Strategic Invetment for Future
287
and private investment in Sri Lanka (Herath, S. 2010; Lahirushan and Gunasekara
2015; Thilanka and Sri Ranjith, 2018).
According to Sri Lankan data during the last few decades this matter has become
more controversial as the private investment fluctuates noticeably with the
moderate growth record in the pace of increasing government commitments in
economic activities. Hence, research questions of the study area as follows.
Firstly, what kind of relationship exists between government expenditure and
private investment in Sri Lanka? Secondly, is the public expenditure crowd- out
or crowd- in private investment in Sri Lanka? And finally, what component of
government expenditure is more important in promoting private investment and
growth?
Objectives of the Study
The main objective of this study is to identify the impact of government
expenditure on private investment in Sri Lanka during the period 1978 to
2019.The specific objectives of the study are as follows,
• To identify the short run and long run relationship between
government expenditure and private investment in Sri Lanka.
• To identify the impact of public current and capital expenditure on
promoting growth in Sri Lanka.
• To identify most significant factors which determined private
investment in Sri Lanka
Methodology
To examine the short run and long run relationship between government
expenditure and private investment, this study utilized the bound testing
procedure and Error correction methodology (ECM). Bound testing Technique
provides the long-term association among the variables and ECM provides short
run relationship between the variables in the long run model. According to the
literature, the relevant dependent variable and explanatory variables are identified
for the investigation and the study expresses the simple model as follows.
PRIVt = f (GREXt, GCEXt, RGDPt, RIRt, FTt, INFLt)
To find out the impact of government expenditure, this study adopts the main
disaggregate form of government expenditure, government recurrent expenditure
(GCEX) and government capital expenditure (GCEX) as the main explanatory

Sri Lanka Economic Research Conference 2020
288
variables. Further, study incorporates real GDP (RGDP), real interest rates (RIR),
proxy for openness variable as total trade to GDP (FT) and inflation rates (INFR)
as the main control variables to explain the private investment in Sri Lanka.
Linearizing equation can be explained as;
lnPRIVt = ß0 + ß1 lnGCEXt + ß2lnGCEXt + ß3 lnRGDPt + ß4 RIRt + ß5 INFR t +
Єt
This study uses a large time series data set spanning from 1977-2019.The relevant
data collected from central bank annual reports. All the variables converted to
real term except inflation rate to neutralize the impact of price changes at 1996
prices based on the GDP deflator. The natural logarithms of all the variables have
been utilized except inflation rate and real interest rate.
Results and Discussion
According to the ADF unit root tests, government recurrent expenditure as a
percentage of GDP, government capital expenditure as a percentage of GDP, real
GDP, real interest rate, Foreign trade to GDP and inflation rate (annual average
change in GDP Deflator) are non- stationary variables at level but at first
difference implying that they are I(I) variables while real private investment as a
percentage of GDP was stationary at levels meaning that is an I(0) variable.
Optimal lag length in the ARDL model was investigated by the standard criterion
and accordingly two lags selected for the model. After the lag selection, ARDL
bound test results and the coefficients based on the selected long run model:
ARDL(1, 0, 0, 2, 1, 1, 0) is given in Table 1 and 2.
Table 1: Bound F Test Results
Country F-Stat.
Value
Lag
length
Significance
Level
Bound Critical
Values
I(0) I(1)
Sri Lanka
5.462025
2
10% 2.12 3.23
5% 2.45 3.61
2.5% 2.75 3.99
1% 3.15 4.43
Source: Calculated by authors based on survey data

Strategic Invetment for Future
289
The bound test results reveal that F stat is greater than the upper bound critical
values. It shows that there exists a cointegration relationship among the variables.
The results of the long run model are summarized in table 2.
Table 2 ARDL Long Run Model
Dependent Variable D(PRIV)
Selected Model: ARDL (1, 0, 0, 2, 1, 1, 0)
Case 3: Unrestricted Constant and No Trend
Source: Calculated by authors based on survey data
The results of the short run error correction are given in table 3. The error
correction term is negative and significant, confirming the existence of a long run
relationship between variables in the model.
This indicates that following a shock, approximately 73% adjustment towards
long run equilibrium is furnished after one year. The short run dynamics of the
long run model indicates there is no short run relationship between government
expenditure and private investment. Further, real interest rate, real GDP and trade
openness have expected positive association with private investment in the short
run.
Variable Coefficient Std. Error t-Statistic
Prob.
LGREX -0.594256 0.232591 -2.554941 0.0163
LGCEX 0.264535 0.127422 2.076057 0.0472
RIR -0.000723 0.012528 -0.057716 0.9544
LRGDP 0.275538 0.131492 2.095473 0.0453
LFT 0.536989 0.170863 3.142809 0.0039
INFR 0.007057 0.013341 0.528986 0.6010
R-squared
Adjusted R-squared
F-statistic
Prob(F-statistic)
0.747218
0.646105
7.389937
0.000025

Sri Lanka Economic Research Conference 2020
290
Table 3 ARDL Error Correction Regression
Selected Model: ARDL(1, 0, 0, 1, 1, 1, 0)
Case 3: Unrestricted Constant and No Trend
Source: Calculated by authors based on survey data
Results of the study, indicates that government recurrent expenditure, and real
interest rates have negative impact on private investment in Sri Lanka and the
rest of the variables in the long run model indicates positive impact on private
investment. The government recurrent expenditure has significant negative
impact on private investment confirming crowding out effect for the period
analyzed while the government capital expenditure has positive impact
confirming crowding in effect on private investment and growth as mentioned in
the Keynesian theory. This is also in line with the previous literature (Thilanka
and Ranjith, 2018; Sen and Kaya, 2013; Basar et.al 2011). The negative crowding
out effect in this case is mostly explained by high government expenditure over
its revenue induced by public borrowings from the domestic market discouraging
private investment (Rathnasiri and Soysa, 2020).
Variable Coefficient Std. Error t-Statistic
Prob.
C -0.192209 0.032121 -5.983976 0.0000
D(RIR) 0.010998 0.002589 4.248136 0.0002
D(RIR(-1)) 0.006970 0.002634 2.645779 0.0132
D(LRGDP) 0.863773 0.404997 2.132787 0.0418
D(LFT) 0.809639 0.140122 5.778110 0.0000
CointEq(-1)* -0.727185 0.111565 -6.518064 0.0000
R-squared
Adjusted R-squared
F-statistic
Prob(F-statistic)
0.725694
0.685354
17.98980
0.000000

Strategic Invetment for Future
291
Real interest rate has a negative impact on private investment confirming the
theory but not statistically significant. This actually explained the financial
crowding out effect of government expenditure but it is not valid to justify at this
moment since the particular variable is statistically insignificant in the model.
This may be due to the fact that low interest elasticity of investment particularly
in developing countries. Among the other control variables in the model, real
GDP and trade openness variables have significant positive impact on private
investment confirming the previous literature (Levine and Renelt, 1992; Ahamed
and Miller, 1999). But the inflation rate which measures based on the annual
average change in implicit price index has shown positive impact on private
investment in the long run which denoted a more controversial outcome with the
previous literature.
Increased domestic output can lead to more capital accumulation in the private
sector as the higher income may encourage future savings and those savings are
mobilized for investment through the financial intermediation. Similarly, trade
promotion has a positive impact on private investment as there is an inducement
to the private sector to diversify the market and innovation of new products to
meet the competition. Ahmed and Miller(1999); Levine and Renault (1992)
confirmed the above finding.
Conclusion
Unlike most of the previous studies, this study, considered the basic component
of government spending, and accordingly, study reveals the effects of each
component of government spending on private investment instead of taking them
as a whole. Findings of the study concluded that recurrent expenditure crowds
out private investment whereas public capital expenditure crowed in private
investment in Sri Lanka. But, in the short run no impact on private investment
running from government expenditure. Among the macroeconomic factors real
GDP, interest rate, trade openness and inflation are important variables in
determining private investment in Sri Lanka.
The findings of the study reflect an important factor about the effects of
government expenditure on private investment in Sri Lanka. Private investment
in Developing countries like Sri Lanka typically depends on availability of credits
to the private sector and by nature the capital market is not well developed. In the
government expenditure profile, recurrent expenditure is more dominant and
more flexible by nature which may influence on more borrowing from the
domestic market by the government in line with the current move in Sri Lanka.

Sri Lanka Economic Research Conference 2020
292
Hence, the crowding-out effect of recurrent expenditure may have a significant
effect on private investment. Accordingly, more attention should be given to
achieving fiscal discipline by managing and controlling government recurrent
expenditure in order to promote the private investment in Sri Lanka.
Keywords: Government Expenditure; Private Investment; Bound Testing;
Crowding-Out Effect
References
Ahamed and Miller., (1999), Crowding-Out and Crowding-In Effects of the Components
of the Government Expenditure, Economics Working papers,
https://opencommons.uconn.edu/econ_wpapers/199902
Dilrukshini, W., 2009. Public Expenditure and Economic Growth in Sri Lanka:
Cointegration Analysis and Causality Testing. Staff Studies, 34(1), pp.51–68.
DOI: http://doi.org/10.4038/ss.v34i1.1239
Hussain, MI., and Zafar, T., (2017). The impact of Public Expenditure Components of
Economic Growth in Pakistan, European Online Journal of Natural and Social
Sciences, Vol. 6(3): 378-405.
Levine, Ross, and David Renelt (1992), "A Sensitivity Analysis of Cross-Country Growth
Regressions", American Economic Review, 82, 942-63.
Rathnasiri, R.A and Soysa J.S.V.N.T., (2020). Dynamics of Public Debt Sustainability
and Economic Growth: The Case of Sri Lanka, Journal of Applied Economics and
Business, Vol. 4(1)
Rathnasiri, R.A., Wijesinghe, T.C., (2012). Government Fiscal Operations Financial
Deepening in Sri Lanka, International Journal of Multidisciplinary Management
Studies, Vol. 2(2).
Sen, H., and Kaya, A., (2014). Crowding-out or Crowding-in? Analyzing the Effects of
Government Spending on private Investment in Turkey, Panoeconomcus, 6 631-
651, DOI: 10.2298/PAN1406631S
Thilanka, H., and Sri Ranjith, J.G., (2018). The Impact of Public Debt on Private
Investment: Sri Lankan Experience, International Journal of Business and Social
Research, 8(8)

293
Foreign Relations and International
Economic Repositioning

Sri Lanka Economic Research Conference 2020
294

Foreign Relations and International Economic Repositioning
295
NON-ECONOMIC FACTORS THAT INFLUENCE
PRODUCTIVITY IN THE APPAREL INDUSTRY
Weerawansa, S.R.S.D.K.
Department of Economics, University of Colombo, Sri Lanka
Introduction
Sri Lanka was amongst the only four countries outside East Asia to have
embarked on a clear policy shift from import-substitution based industrialisation
to export-oriented industrialisation. Given the decisive policy shift in 1977, and
the policy continuity during the ensuing years, Sri Lanka provided a test case for
the impact of a policy transition from inward orientation to outward orientation
based on industrial growth and adjustment (Atukorale and Rajapatirana, 2000, p
543).
The first round of reforms adopted in the late 1970s by Sri Lanka was primarily
focused on trade, with a whole package of incentives for export-oriented industry
expansion, financial reforms for greater financial intermediation, including high
real interest rates and a flexible exchange rate regime. It has to be said that the
first phase of trade policy was not directed at the apparel sector per se. However,
the policy shift lost momentum in the early 1980s, first because of an
‘unfortunate’ shift in policy priorities toward ‘politically appealing’ investment
projects and, subsequently, as a result of the onset of the ethnic conflict
(Atukorale and Rajapatirana, 2000p, 546).
Currently the industry is moving towards highly specialized areas focusing on a
wide range of fashionable and quality items, including some products under
leading international brands at competitive prices. Besides, the sector has moved
into computerization of areas such as inventory or stock control and even
attachment of smart devices to garments that help the wearer; these are some of
the significant factors which are assisting the rapid expansion of this industry in
Sri Lanka.
Apparel accounts for nearly 70 per cent of industrial exports while export
earnings from textiles and garments account for around 46 per cent of the total
export earnings and import of textile and textile articles only account for 12 per

Sri Lanka Economic Research Conference 2020
296
cent of total imports (CBSL, 2015). This means that the sector has developed
forward and backward linkages within the country as well as its competitiveness
by conforming to customer needs.
According to Samarasinghe et al. (2015) the apparel industry currently has a large
installed capacity. The high level of technical and managerial skills available in
the apparel industry, low-cost land and the skilled and literate workforce provide
the industry with a comparative advantage in the region.
The only meaningful measure of industrial competitiveness is productivity
(Khurana & Talbot, 1998) and hence this topic is widely discussed, especially in
the manufacturing sector, due to its vital link to the organizational profitability.
As productivity is the driving factor in enhancing the competitiveness of any
decision‐making entity (firm), a study of productivity and its sources can provide
vital inputs to a firm for improving its competitiveness. Further, the productivity
in the apparel sector could shed light on how the policies, strategies and
investments led to the creation of competitive advantage that could sustain the
industry to what it is at present.
The analysis of productivity the apparel industry has many minimal deterministic
factors. Amongst these factors one of the keys would be the transformations being
examined in detail, in particular, what aspects of productivity have been
identifiable with the apparel industry transformation and what specific factors
and parameters were influential, how they transmitted themselves within the
production and industrial structures, especially in the networking of the value
chain are of critical relevance. It may also of interest how the productivity of the
apparel sector managed to evolve viz-a-viz, other industry sectors that were
launched in parallel with the apparel sector but failed to realize reasonably
successful potential as key industries in Sri Lanka. It is noteworthy that the
apparel sector currently is the largest trade sector and remain so even after more
than three decades of its existence.
Research Problem
The post-1977 economic performance was centred on the success of one solitary
industry – the apparel exports. Having begun as a sector based on the comparative
advantage derived from cheap and an abundance of unskilled labour, the sector
faced many challenges both internally and externally. Despite the threats and
challenges, including the most serious of all, namely the abolition of export
quotas in 2005 of the buyer countries that provided the exclusive basis for apparel

Foreign Relations and International Economic Repositioning
297
exports, and GSP+ in 2009 the industry dramatically transformed itself through
production, structural and market reorganizations with export earnings of 5.3
billion USD. Therefore, it is important to understand that what made the apparel
sector perform differently from the other sectors and how it retransformed itself
into a sector that still survives after three decades of existence as the principal
manufacturing export sector.
Objective
The main objective of this study is to analyze the characteristics and the
determinants with specific focus on productivity as a principal explanatory
variable that could shed light on the historical trends, including the reported
resilience, displayed by the apparel industry. The study findings are expected to
provide industry insights that could be used in formulating policies for the growth
of the apparel industry to achieve the status as a principal value chain cluster in
South Asia.
Methodology
The research commences with the analysis of the profiles of the industrialists of
the top apparel companies and thereafter go on to the stages of thematic analysis
in detail. According to Braun and Clarke (2006), thematic analysis is the
identification and reporting of themes within the data set. It is a widely used
analysis technique which explains the minimally organized data in an enriched
format.
The thematic network is used as the tool for analysis of data collected from in-
depth interviews. The entire process of the thematic analysis consists of six steps
where each step falls under one of the three main stages namely; (a) reduction or
breakdown of the text; (b) the exploration of the text and (c) the integration of the
exploration.
A sample size of nine organizations was chosen for the study from the top apparel
companies where some of them are cluster companies who have been operating
for over twenty years employing a minimum of 3,000 workers. Each respondent
has work experience of over 15 years in the apparel sector though not necessarily
in the same organization. However, six of them have over twenty-five years of
apparel sector experience. Most of them have started their career at a lower
position and subsequently had come up the ladder to the topmost positions in
their respective organizations. Hence, they have wide-ranging experience in
every aspect of their organization as well as an in-depth knowledge of the

Sri Lanka Economic Research Conference 2020
298
industry. At least two individuals in strategic and tactical management level were
interviewed but taken as one individual in the overall profile, using a discussion
guide.
The discussion guide consists of questions covering the cost of production,
strategies, markets, organizational culture, the role of government, the role of
related bodies which attempt to gain certain insights into the technological
innovations in each organization covering multiple aspects to enhance
productivity.
Results and Discussions
According to the findings of Isaksson, (2007) education, health, infrastructure,
imports, institutions, openness, competition, financial development, geographical
predicaments and absorptive capacity (including capital intensity) appear to be
the most important factors for productivity growth while varied literature reveals
low productivity in the manufacturing sector of the South Asian region is
attributable to labour unrest, poor working attitudes, inefficient organizational
culture/management, etc. which are directly related to labour productivity. Also,
ineffective use of resources, poor information flow and non-productive activities
have been identified as the key factors which are hindering the productivity
prevalent in the Sri Lankan manufacturing industry (Vilasini et al. 2014).Thereby
it is imperative to analyze the contribution of each variable towards productivity.
Looking at the past of the apparel industry transformation from “sweatshop”
state to what it is now against many odds and predictions gives an idea of the
kind of authentic leadership qualities the industry leaders displayed and turned
disadvantages into advantages that established Sri Lankan apparel industry in the
global fashion spectrum. While this should be praised and highlighted it could be
exploited as a sixth sense of competitive advantage.
Clearly the individual and the collective leadership based strategic thinking of the
entrepreneurs made a difference between a perishing or prevailing state to a
more accurately persisting level. It can be suggested that this human quality could
be harnessed to create a further dimension of advantage for the industry
especially introducing new entrepreneurial blood into the industry. It can further
be highlighted that the market is so vast that new entrepreneurial inroads will
further enhance the country’s national competitive advantage to achieve new
vistas of success.

Foreign Relations and International Economic Repositioning
299
The qualitative segment of the study brings out that human resource
development is a key factor in maintaining the status-quo, minimally speaking,
and it is a key strategy in the expansion of the industry. It recognizes the
employees, not as tailoring girls but as a vital contributor to the economy.
Therefore it is easing the pressure of working mothers with flexible working days
(from 6 to 5 days), daycare facilities, doctor facilities, personal hygiene
workshops, beauty culture workshops, outward bound training, team building
exercises etc.
The study reveals factors such as buyer loyalty, quality of ancillary and
supporting services, worker attitudes, learning by doing, industry attitude
and social responses, ethical supply sourcing, good relationships which are
commonly referred to as non-economic factors, have a significant bearing on
productivity leading to enhanced competitive advantage. Qualitative information
proved further that large companies possess organizational competencies namely
multi skilled workers, technological know-how, superior quality raw
material, a worker friendly organizational culture, service levels,
compliance standards and effective communication which were widely
recognized by the respondents as enablers of productivity through which the
operational performance is enhanced.
Conclusion
Since the opening up of the Sri Lankan economy in 1977, its readymade garment
(RMG) industry has grown rapidly as a major sector of the economy in terms of
its contribution to industrial production, foreign exchange earnings, employment
generation and also its contribution to the alleviation of poverty in the country.
After the quota phase out, price competitiveness has become much more
important in determining the export success of the industry. As per Athukorala
and Ekanayake (2014) writings, procurement practices are no longer constrained
by country-specific quotas; buyers would demand many more attributes in
addition to prices, such as product variety, quality and timely delivery. This
means that there are no limits on the amount traded by a given country or a firm
and that there is freedom to enhance global competitiveness based on
differentiation of products to suit customer needs, supported by scale economies
or productivity. Hence, this study will facilitate the formulation of key policies
to enhance the productivity and competitiveness of apparel categories. Further,
the study has identified the important input categories for the apparel sector to

Sri Lanka Economic Research Conference 2020
300
determine areas, which should be focused on, for formulating a conducive policy
environment.
It should be particularly highlighted that the non-economics factors could be
enhanced through the sharing of individual experiences of industry leaders to
create an industry synergy. It could plausibly be argued that the industry should
look at themselves as one family of enterprises that could compete in the global
market by creating a national competitive advantage that could be made visible
globally. In other words, the industry should gear to create a common global
image as a high-end producer nation with the creation of widespread industry
standards. In order to create this the state and the apparel bodies could take a
common strategic viewpoint to promote the industry as a whole by sharing,
exploring and networking these non-economic factors such as image building,
sustainable, ethical manufacturing, manufacture of organic garments and
recycling of yarn and fabric waste.
Keywords: Non-Economic Factors; Productivity; Human Resource Development
References
Athukorala, P., & Ekanayake, R. (2017). Repositioning in the global apparel value chain
in the post-MFA era: Strategic issues and evidence from Sri Lanka. Development
Policy Review, 36. doi:10.1111/dpr.12226
Braun, V., & Clarke, V. (2006). Using thematic analysis in psychology. Qualitative
Research in Psychology, 3(2), 77-101. doi:10.1191/1478088706qp063oa
CBSL. (2015). Annual Report of Central Bank of Sri Lanka (Publication). Colombo, Sri
Lanka: Central Bank of Sri Lanka.
Isaksson, A. (2002). The importance of human capital for the trade growth link: Anders
Isaksson. Wien: Statistics and Information Networks Branch of UNIDO.
Khurana, A., & Talbot, B. (1998). The internationalization process model through the
lens of the global color picture tube industry. Journal of Operations Management,
16(2-3), 215-239. doi:10.1016/s0272-6963(97)00039-9
Morrison, B. M. (2002). Liberalization and Industrial Transformation: Sri Lanka in
International Perspective. By Prema-Chandra Athukorala and Sarath Rajapatirana.
New York: Oxford University Press, 2000. 248 pp. $35.00 (cloth). The Journal of
Asian Studies, 61(1), 283-284. doi:10.2307/2700256

Foreign Relations and International Economic Repositioning
301
Samarasinghe, N., Ariadurai, S., & Perera, M. (2015). Facing the Future Challenges of
the Sri Lankan Apparel Industry: An Approach based on Porter’s Diamond Model
for the Competitive Advantage of Nations. Journal of Engineering and
Technology of the Open University of Sri Lanka (JET-OUSL), 3(1). doi:ISSN
2279-2627

Sri Lanka Economic Research Conference 2020
302
REPOSITIONING SRI LANKAN ECONOMY - AN
INTERNATIONAL POLITICAL ECONOMIC
PERSPECTIVE
Moramudali U.*, Naidoo, J. Ceylon Chamber of Commerce, Sri Lanka and Department of Political Science,
University of Pretoria, South Africa *Corresponding author: [email protected]
Introduction
This paper aims to reposition Sri Lanka’s (SL) economy within the context of the
International Economic arena using a seminal theoretical framework within
International Political Economy (IPE). This repositioning has been further
complicated by the impact of the COVID-19 pandemic on global economies, with
many economies set to fall into economic hardship.
Pre-COVID-19, the SL economy was already grappling with deep structural
issues such as low growth, low tax revenue, foreign debt servicing cost and
sluggish export performances (World Bank, 2019). Thus, understanding and
shaping the future narrative around International Economic Repositioning (IER)
requires key stakeholders within the SL economy to understand the dynamics of
power and who holds market authority.
Significant research needs to be directed towards understanding power dynamics
in global markets which give a holistic analysis of what it takes to reposition the
SL economy.
Research Problem
Repositioning SL economy requires detailed understanding about structural
issues and power dynamics that impact the SL economy. Data indicates that
structural weaknesses have caused significant vulnerability of the external sector.
By the end of 2018, commercial borrowing portion of foreign loans has increased
to 54.9% of total foreign loans, indicating increased cost of borrowings (CBSL,
2019).

Foreign Relations and International Economic Repositioning
303
Source: Authors constructed based on CBSL data, 2020
Figure 1: Foreign debt dynamics in Sri Lanka
Furthermore, change of maturity structure of foreign debt, has resulted in
significant increase of foreign debt servicing cost. This is accompanied by
sluggish export performance of SL which is largely attributed to a heavy
concentration of a small export basket (Abeysinghe, 2017). Data shows that SL’s
exports as a percentage of GDP have declined from 33% in 2000 to 12.7% in
2017.
Source : Authors constructed based on World Bank data, 2020
Figure 2 : Sri Lanka’s Export Performances

Sri Lanka Economic Research Conference 2020
304
These issues resulted in the country experiencing a persistent Balance of
Payments (BOP) crisis (Weerakoon,2017), forcing them to seek support from
various international institutions and other actors. The SL state faces the
conundrum of balancing between national interests, political interests and the
interests of external actors. Thus, the IER of SL requires assessing power
dynamics between these interests.
Objectives
The objectives of this paper are to evaluate where and how power lies in the
global economic arena from the perspective of SL with the use of Strange’s
theory.
Methodology
The methodology of this study is based on the structural power of IPE theory by
Susan Strange. This theory fits into the research problem as it has the ability to
predict and explain how things related to each other, especially when dealing with
the social phenomena of power6 in global economies (Strange, 1988). Strange’s
framework consists of four pillars of power in IPE; security, production, finance
and knowledge (Strange, 1988).These four structures will be applied to the SL
case and thus, enable the repositioning of the SL economy.
“Heads of government are last to recognize that they and their ministers
have lost some authority over national societies and economies that they
used to have. Their command over outcomes is not what it used to be.
Politicians everywhere talks as though they have the answers to
economic and social problems, as if they really are in charge of their
countries destiny” (Strange, 1996)
The challenges within the broader idea of IER are that a state’s power and its
sovereignty have been in decay (Strange, 1996). This is as a result of
globalization, technology and the proliferation of non-state actors which are
removing power from the state and leaving them vulnerable to external conditions
(Strange, 1996). Based on these fundamentals, we attempt to identify the power
dynamics that influence and constrain the SL economy, and it’s IER.
6 For the sake of this paper, power is defined as the ability to influence an actor to do
something that they wouldn't normally do on their own through coercive or non-coercive
measures.

Foreign Relations and International Economic Repositioning
305
Results and Discussion
As opposed to conventional economic analysis, Strange believed that economic
policy decisions are often influenced by politics and power dynamics (Strange,
1988). Her theory largely refers to who holds power or market authority in the
global economy and to whose benefit. We argue that SL economic policies are
significantly influenced by international actors and those who have power. We
extended her theory to analyze the power dynamics in the SL economy.
Security
According to Strange “those who provide security acquire a certain kind of power
which lets them determine and limit the range of choices. The security structure
has an inevitable impact on who gets what in the economy”(Strange, 1988).
Strange is referring to the realist International Relations (IR) interpretation of
security, the security of the state being the most important (Strange, 1988).
However, this paper extends our understanding of security to include non-state
actors like Multinational Corporations (MNCs), terrorist organizations, and other
providers of security. We observe that security, as a power structure, has played
a major role in Sri Lanka as a result of domestic conflict. Approximately 8% of
total government expenditure in 20197 was spent on security, indicating the large
wealth allocated for security. More emphasis is put on security subsequent to the
Easter Attack and further power concentrated within the security structure.The
LTTE8, a terrorist group which was involved in the conflict with the SL army
held significant power over wealth and the economy during conflict, as they
controlled the taxation and sometimes the production (Stokke, 2006). These
actors who hold power in the security pillar are able to determine parts of the
architecture of the SL economy and complicate the matter of IER.
Production
This refers to generation of wealth, production of goods and services for the state.
Strange’s notes, “the production structure can be defined as the sum of all
arrangements that determine what is produced, by who and for whom, by what
7 Defence Ministry had the largest allocation for any ministry in 2019 budget, except the
Ministry of Finance which is responsible to pay loan installments. See more : Budget
Estimates, 2019
8 The Liberation Tigers of Tamil Eelam (LTTE) fought with the SL Army claiming a
separate land for Tamils live in Northern and Eastern part of Sri Lanka. Conflict ended
when SL Army defeated LTTE and killed their leader.

Sri Lanka Economic Research Conference 2020
306
method and on what terms”(Strange, 1988). The production structure has
undergone extensive changes from primarily being focused on domestic
consumption to focusing on domestic and international consumption (Strange,
1996). Understanding who holds power in SL production structure is vital to SL
IER and making its exports and trade competitive. This requires an understanding
of who controls domestic production, imports and exports. It is observed that the
SL government has significant control over fuel supply, transport, health and
education. However, the lack of export production in the presence of persistent
BOP deficits reduces the state power. Successive SL governments have changed
policies and adjusted regulations based on the interests and demands of investors.
Specific tax concessions granted for investors under the Strategic Development
Projects Act and the proposal to introduce a separate legal system to Colombo
International Financial City9 are identified as examples. We expand the power
pillar to analyze the role of institutions in relation to exports. Extensive domestic
Non-Tariff Barriers (NTBs) are identified as a major obstacle to promote exports,
and are seen as an indication of the power of public servants10.
Finance is “the power to create credit which is a power that allows or denies
people the possibility of spending today and paying back tomorrow” (Strange,
1988). The finance structure comprises of two aspects, being the ability to create
and provide credit and the means to create money and manage currency
exchanges (Strange, 1988). Finance is dominated by various actors in the global
economy and understanding power in the finance structure is vital to nations like
SL which suffer from BOP deficits and high debt servicing costs. Vulnerability
to the BOP crisis has reduced the SL government’s power significantly in
economic policy decision making pertaining to finance and trade.
Evidence suggests that subsequent to entering to international capital markets,
power has shifted to international actors, global financiers sand rating agencies
in terms of influencing the economic policies. SL policy sphere is influenced by
the International Monetary Fund (IMF), which insisted on state owned enterprise
(SOEs) reforms and taxation reforms as a part of the Extended Fund Facility
9 See more : https://www.theguardian.com/cities/2018/aug/02/sri-lanka-new-dubai-
chinese-city-colombo
10 Public servants has not been supportive enough of the implementation of national single
window to facilitate exports. Proposed amendments to Custom Ordinance were strongly opposed by officials.

Foreign Relations and International Economic Repositioning
307
(EFF) programme11 (IMF, 2016). SL faces constraints in implementing economic
policies due to the potential responses of the international capital markets12. The
power of the state is further reduced by rating agencies who often adjust the
country's credit ratings.
Source: CBSL Annual Report, Multiple years
Figure 3: External Debr Servicing of Sri Lanka
Source: ERD, 2019
Figure 4 : Foreign Debt in Sri Lanka
11 EFF is provided by IMF to countries to resolve BOP crisis in short term.
12 In 2007 SL entered to international capital markets
12.7 13.1 15.119
16.713.2
19.7
26.8
20.8
28.225.6 23.9
28.9 29.7
2006 2007 2008 2009 2010 2011 2012 2013 2014 2015 2016 2017 2018 2019
External Debt Servicing of Sri Lanka
External Debt Servicing Ratio
47%
10%
13%
10%
9%2%
9%
Foreign Debt in Sri Lanka - 2019
Market Borrowings
China
ADB
Japan
World Bank
India
Other

Sri Lanka Economic Research Conference 2020
308
Furthermore, EXIM Bank loans13 called for unsolicited bidding, indicating the
power of the lender country over Sri Lanka. Weakness of the external finances
had forced Sri Lanka to seek for avenues to expand trade through means such as
entering into FTAs which in turn influenzes the domestic trade policy.
Strange notes, “knowledge structure determines what knowledge is discovered,
how it is stored, and what communicates it by what means to whom and on what
terms'' (Strange, 1988). Importance of the knowledge pillar can be understood in
the context of ideologies and policy prescriptions dictated by various institutions
or individuals. Policy is likely to be dictated by the knowledge of those who have
power in the areas where decisions are made. Involvement of selected academics
in policy making and the influence of think tanks or international institutions over
SL’s economic policy making can be identified as power dynamics within the
knowledge pillar which results in only certain interests being advanced in IER of
SL economy.
Conclusion
Utilizing the power structure framework suggested by Strange, we assessed the
impact of power dynamics on the economy. Our analysis shows that the weak
external sector economy suffering from BOP issues has allowed international
actors to influence the SL economy and the power regarding finance has shifted
to international institutions, states, private creditors and rating agencies. The
inconsistency of SL government economic policies has also, further dispersed
power in the economy to other actors and further complicated the IER. Thus, the
task of repositioning involves a balancing of power, geopolitical interests and
domestic interests.
Keywords: BOP; Finance; International Political Economy; Power; Security
References
2020. Annual Report 2019. Annual Report. [online] Colombo: Central Bank of Sri Lanka,
pp.2-16,163-190. Available at:
<https://www.cbsl.gov.lk/en/publications/economic-and-financial-
reports/annual-reports/annual-report-2019> [Accessed 6 May 2020].
13 EXIM Bank loans refers to export credit which often provide the specific project
contract to a company in lending country. Ex : Hambantota port loan was obtained from
EXIM Bank of China and construction contract was carried out by the China Harbour
Engineering Company.

Foreign Relations and International Economic Repositioning
309
Abeysinghe, S., 2020. Sri Lanka’s Exports - Out of Sync with Global Demand. Sri Lanka
Journal Of Economic Research, 5(1), pp.53-60.
International Monetary Fund. Asia and Pacific Dept, 2019. Sixth Review Under The
Extended Arrangement Under The Extended Fund Facility And Requests For
Waiver Of Nonoberservance And Modification Of Performance Criterion. Country
Report No. 19/135. [online] International Monetary Fund, pp.2-24. Available at:
<https://www.imf.org/en/Publications/CR/Issues/2019/05/15/Sri-Lanka-Fifth-
Review-Under-the-Extended-Arrangement-Under-the-Extended-Fund-Facility-
46900> [Accessed 3 May 2020].
Strange, S. (1988).States and Markets.London. Continuum
Strange, S. (1996).The Retreat of the State: The Diffusion of Power in the World
Economy. London. Cambridge University Press
Weerakoon, D., 2017. Sri Lanka’s debt troubles in the new development finance
landscape. Third World Thematics: A TWQ Journal, 2(6), pp.744-761.
World Bank Group, 2019. Demographic Change In Sri Lanka. Sri Lanka Development
Update. [online] Colombo: World Bank Group, pp.2-15. Available at:
<https://openknowledge.worldbank.org/bitstream/handle/10986/31261/SLDU-
Feb2019.pdf?sequence=3&isAllowed=y> [Accessed 5 May 2020].

Sri Lanka Economic Research Conference 2020
310
PUBLIC OPINION ASSESSMENT ON INTERNATIONAL
TRADE AGREEMENTS: REFLECTIONS IN THE
CONTEXT OF COVID-19
Gunaruwan, T.L., Yasoda V.G.K., and Hansamali H.G.C.* Department of Economics, University of Colombo.
*Corresponding author: [email protected]
Introduction
International trade has become a subject of policy discussion more than ever
before, particularly in the context of Covid-19 pandemic in which not only
international movements but also demand and supply of goods and services are
disrupted (Felix et al, 2020). Developing economies around the globe are
compelled to search for alternative means of securing essential supplies for
consumption, many of which have hitherto been imported under increasingly
liberalized international trade. This is because they have run into foreign
exchange crisis; reduced consumption in the developed world has suppressed the
demand for their exports while their forex outflows, such as debt service
payments, have to be met regardless of current impacts on trade. Constrained
passenger movements bringing down to almost zero the income from tourism,
and the disturbances in the domain of foreign employment potentially impacting
on inward remittances, have further aggravated the situation. In such conditions,
countries tend to look for foreign exchange saving options, particularly for import
substitution and reduction of non-essential imports.
This strategic option is constrained by international trade agreements a country
has entered into. Such agreements, “contractually” committing to allow
concessionary tariffs on imports from another a country restricts a country’s
policy flexibility in managing foreign exchange reserves through controlling
outflows. In short, international trade agreements, could be viewed as a means of
self-abdicating trade policy making sovereignty of a nation.
Research Problem
This research is an attempt to deep-dive in search of whether the aspect of
“preserving policy amendment flexibility” has been adequately present or not, in
the minds of stake-holders of trade policy, when discussing factors they envisage
as important in considering and evaluating trade agreements, with particular
reference to Sri Lanka.

Foreign Relations and International Economic Repositioning
311
Sri Lanka has already signed several bilateral and multilateral trade agreements,
including India-Sri Lanka Free trade agreement (1998), Pakistan - Sri Lanka Free
Trade Agreement (2005) and more recently Sri Lanka Singapore Free trade
Agreement (2018). While benefits accrued to the country of such trade
agreements are questionable, it is a certainty that the country is bound by the
conditions therein, and would have to face costly legal repercussions if unilateral
alterations of tariff concessions granted through such agreements are attempted.
Objectives
The appropriateness of resorting to trade agreements as means of facilitating
inter-country or inter-regional trade therefore becomes debatable. When some
economists argue that trade agreements discriminate against fair competition
among suppliers, and thus are counter-productive to free trade (Athukorala and
Nasir, 2012), the necessity to exercise care and due diligence in preparing,
negotiating and entering into bilateral or multilateral trade agreements, is further
emphasized. This is because, once signed, exercising a nation’s policy flexibility
vis-à-vis trade and tariffs would be constrained.
The present research was conducted to examine whether the aspect of “policy
flexibility” has been adequately present in the perceptions of Sri Lankan stake-
holders of international trade. Its importance, possibly not adequately
emphasized in the preparation of trade agreements, could be vital and critical,
particularly if socio-political, environmental or economic exigencies call for
protective or import-substitutive strategies to ensure public welfare (Umana et al,
2013), and to maintain financial balance.
Data and Methodology
This research was conducted using secondary data sourced from the Interim
report of the Public Commission on National Policy for International Trade,
published by the Professionals’ National Movement, containing the opinions
expressed in 84 submissions by public, including 9 academics, 20 professionals,
26 entrepreneurs, 18 civil society representatives and 11 politicians.
First, each and every submission was scrupulously perused to extract 36 different
factors that had been brought to the notice of the Commission. Two point Likert-
scale analysis was adopted to represent the recognition (by assigning value 1) or
not (by giving the value 0) of each factor by each submitter, resulting in an 84 x
36 matrix (submitter in rows, and factor in columns). Those factors were
thereafter merged into 10 groups depending on their characteristics. The level of

Sri Lanka Economic Research Conference 2020
312
importance assigned to “policy flexibility” and “strategic withdrawal possibility”
by the stake-holders was thereby fathomed.
Frequency assessment of factor citations was the main methodology adopted.
Cross-tabulation and computing averages were used as techniques to derive
quantitative results. A comparative analysis of perceptions was conducted to
derive strategic inferences and conclusions.
Results and Discussion
As evidenced from the Table 1, which summarizes the results of the analysis,
interest to protect local business and industrial interests (PIBTI), policy
framework oriented towards national economic development (PFNED) and
standards and national accreditation mechanism (SNAPR) have emerged as the
most cited factors.
Table 1: Common Factors
Source: Authors’ estimations based on PNF’s Interim Report
Factor Description As a % of total
citations
Factor 06
(CPEUR)
Protecting local industrial, business and trade interests 16.5
Policy framework oriented towards national economic
development14.2
Standards and national accreditation mechanisms to prevent
quality and safety risks 14.2
Proper understanding of trade and economic conjuncture and
perspectives12.2
Contractual preparedness for unfavorable eventualities and for
remedial strategies4.3
Transparent and legislated process to formulate, appraisal and
approval and ratification 6.3
Improve national technological capabilities and industrial
competitiveness7.9
Safeguards to national professional and labour interests 9.8
Factor 02
(NTCIC)
Factor 08
(SNPLI)
Safeguards to national socio-cultural and environmental interests 6.7
Safeguards to national political defence and sovereignty interests 7.9
Factor 09
(SNSEI)
Factor 10
(SPDSI)
Factor 01
(PIBTI)
Factor 04
(PFNED)
Factor 05
(SNAPR)
Factor 03
(UTECP)
Factor 07
(TLPPI)

Foreign Relations and International Economic Repositioning
313
The least importance among all, as mirrored through these results, appears to be
the “contractual preparedness to face unfavorable eventualities and for remedial
strategies” (CPUER) with less than 5% share of factors cited. National concerns
such as implementation/legal aspects and safeguards to sovereignty, socio –
cultural and environmental aspects also have not been cited that frequently either.
It is curious that this overall assessment shows that the importance assigned to
“contractual flexibility” in the mindset of the concerned stake-holders is rather
weak. This may be a result of a general lacuna awareness of its importance, or a
particularly in one or more of the given professional categories; a finding which
warranted a more refined examination based on submitter category (particularly
because the sample appears inequitably shared among different categories).
Most prominent and frequently cited factors by each different respondent group
were thus examined, the results are summarized in the Table 2.
Table 2: Factor citations by each professional group
(In percentages of total citations for each group)
Source: Authors’ Estimations
According to results, there appears to be a common consensus among all types of
stake-holder groups that the protecting local business and industrial interests
(PIBTI) is of high importance. This appears the top priority among Business
Factor AllBusiness
CommunityCivil societies Academics Professionals Politicians
Factor 01
(PIBTI)
Factor 02
(NTCIC)
Factor 03
(UTECP)
Factor 04
(PFNED)
Factor 05
(SNAPR)
Factor 06
(CPUER)
Factor 07
(TLPPI)
Factor 08
(SNPLI)
Factor 09
(SNSEI)
Factor 10
(SPDSI)
14.3
12.5 8 11.9
6.7 2.2 7.4
7.9 4.3 5.6
0 10.2 7.1
9.8 4.3 13 8.3 9.1
4.2 5.7 11.9
4.3 2.2 1.9
6.3 4.3 5.6
4.2 6.8 4.8
16.7 10.2 14.3
12.2 13 9.3 12.5 14.8
7.9 10.9 5.6 8.3 4.5 14.3
14.2
20.8 17 7.1
9.5
15.2 22.2 12.5 13.6 4.8
16.5 26.1 20.4
14.2 17.4 9.3

Sri Lanka Economic Research Conference 2020
314
Community (26%), and Politicians (14%), while the second priority among Civil
Society (20%) and Academics (16.7%). Standards and national accreditation
mechanism to prevent quality and safety risks (SNAPR) emerged as the highest
concern (22%) of the Civil Society, while both Academics and Professionals have
prioritized (with 21% and 17% respectively) the need to orient the policy
framework towards national economic development (PFNED).
While it is not surprising that Business Community would be leased bothered,
with less than 5% of the expressed interests, to safeguard national cultural and
environmental interests (SNSEI) and political defense and sovereignty interests
(SPDSI), it is curious that Academics have expressed similar pattern of high
concern in business and industrial interests and only “zero” citations pertaining
to safeguarding cultural and environmental interests (SNSEI). It is the Political
and civil society groups that have expressed significant concerns (14% and 13%
respectively) to safeguard interests of national professionals and labour (SNPLI),
interestingly much more than the interest (9%) shown by professionals
themselves. Compared to all groups, professional have paid much attention on
the safeguards to national socio-cultural and environmental aspects (SNSEI).
Politicians appear to be the most “balanced” group having expressed concern into
almost all factors, whose spread ranges from a minimum of 5% (for SNAPR) to
a maximum of 14% (for PIBTI, NTCIC and SNPLI), when all other groups
showed skewer interests. It is also interesting to note that Politicians are one of
the two groups (other being Academics) showing over 10% concern of National
political defense and sovereignty interests (SPDSI).
These results, however, indicate that “preparedness for unavoidable eventualities
and for remedial strategies” (CPEUR), the focal concern in this research, figures
among the lowest of interests shown, the lowest (1.9%) in Civil Societies and the
highest (6.8%) found among Professionals. In no category of stake-holders this
concern appears to be substantially present. It is thus obvious that trade
agreements entered into by the nation would lack this vital aspect addressed,
preventing the decision makers exercising the greatest possible flexibility in
relation to adjusting trade policies under exigencies of economic conjunctures.
Conclusions
The outcome of this research mirrors that the Sri Lankan stake-holders of trade
policy are likely to be substantially preoccupied with business and industrial
profit-oriented interests, regardless of their profession. The concern to preserve
economic policy adjustment authority and flexibility, which should not be

Foreign Relations and International Economic Repositioning
315
compromised or alienated under any circumstance in a sovereign nation, appears
grossly inadequate. While reasons behind are not revealed through this research,
it could be hypothesized that insufficient awareness of the multitude of
parameters involved and their criticality, lack of strategic vision in regard to
possible exigencies along the development drive, or simple disinterest in
economic sovereignty as a national attribute, might be behind such a pattern.
The conclusion that stems from this analysis is that international trade agreements
signed by Sri Lanka are likely to be largely built on a shallow foundation of
business and industrial interest, and could lack necessary legal provisions to
preserve the Government’s strength to face policy exigencies emanating from a
given economic conjuncture. In such a circumstance, a nation could find its wings
clipped and being unable to freely take appropriate policy actions in view of
ensuring national economic health and public welfare.
Covid-19 is a case in point. Disabled policy flexibility of the Government would
imply foreign investors flexing muscle and seeking the “pound of flesh”. They
may even contemplate suing Governments against action taken in the interests of
the national economy and public, claiming that such action is in violation of
provisions in a trade agreement.
Italian Government’s emergency measures taken to safeguard citizens facing
Covid-19 implications, for instance, have been challenged by investors,
empowered by provisions in numerous trade agreements, claiming that such
measures have damaged their investments [(Corporate Europe Observatory,
2020), (Global Arbitration Review, 2020)]. In another example, trade and
investment agreements have curbed the New Zealand Government’s freedom to
use protectionist mechanisms (Kelsey, 2020).
The research outcomes thus call for urgent strategic reorientation of the
Government’s approach towards developing, negotiating, approving and
implementing international trade agreements. A new approach, preferably
stipulated by law is warranted, through which inalienable national policy making
sovereignty is preserved, and broader public participation is ensured, while
building public awareness on the necessity to uphold national interests.
Keywords: Covid-19; Policy Flexibility; Public Opinion; Trade Agreements; Sri
Lanka

Sri Lanka Economic Research Conference 2020
316
References
Athukorala, P.C. and Nasir, S. (2012), Global production sharing and South-South trade,
Background Paper No. RVC-1, UNCTAD,
https://unctad.org/en/PublicationsLibrary/ecidc2013misc1_bp1.pdf
Corporate Europe Observatory. (2020, May 18). Cashing in on the pandemic: how
lawyers are preparing to sue states over COVID-19 response measures. Corporate
Europe Observatory. https://corporateeurope.org/en/2020/05/cashing-pandemic-
how-lawyers-are-preparing-sue-states-over-covid-19-response-measures
Felix, I., Martin, A., Mehta, V., and Mueller. (2020, July 02). US food supply chain:
Disruptions and implications from COVID-19, McKinsey & Company.
https://www.mckinsey.com/industries/consumer-packaged-goods/our-insights/us-
food-supply-chain-disruptions-and-implications-from-covid-19#
Global Arbitration Review. (2020, March 26). Could COVID-19 emergency measures
give rise to investment claims? First reflections from Italy.
https://globalarbitrationreview.com/article/1222354/could-covid-19-emergency-
measures-give-rise-to-investment-claims-first-reflections-from-italy
Kelsey, J. (2020, May 19). Trade deals are a handbrake on New Zealand’s post-Covid
recovery. The Spinoff. https://thespinoff.co.nz/politics/19-05-2020/trade-deals-
are-a-handbrake-on-new-zealands-post-covid-recovery/
The Professional’s National Front. (2019), Interim Report – The Public Commission on
National Policy for International Trade
Umana, V., Bernauer, T., and Spiler, G., (2013). Natural Trading Partners? A Public
Opinion Perspective on Preferential Trade.
https://papers.ssrn.com/sol3/papers.cfm?abstract_id=2365728

Foreign Relations and International Economic Repositioning
317
DOES MCC GRANT PROMOTE ECONOMIC GROWTH
AND DEVELOPMENT? EVIDENCE FROM A CROSS-
COUNTRY STUDY
Dunusinghe P. Department of Economics, University of Colombo, Sri Lanka.
Introduction
The Millennium Challenge Corporation (MCC) was established by the US
Congress with an aim to deliver financial assistance to low and lower middle-
income countries (CRS, 2019). As envisaged in CRS(2019), the MCC grant
differs greatly from the donor agencies due to its competitive selection
process, requirement to generate country-led solutions and, country-led
implementations whilst being focused to results (CRS, 2019). The MCC
selection process for eligible countries is based on three major criteria; (i) ruling
justly—promoting good governance, fighting corruption, respecting human
rights, and adhering to the rule of law; (ii) investing in people—providing
adequate health care, education, and other opportunities promoting an educated
and healthy population; (iii) economic freedom—fostering enterprise and
entrepreneurship and promoting open markets and sustainable budgets14.
CRS (2019) articulates that “MCC is based on the premise that economic
development succeeds best if it is linked to free market economic and democratic
principles and policies and where governments are committed to implementing
reform measures to achieve such goals.” This mechanism guarantees that
countries with good policies receive financial assistance under the MCC
arrangement15. Burnside and Dollar (2000) empirically established that foreign
aid promotes growth in countries with good policies. Evidently,, their research
work largely impacted on the thinking and formulation of the MCC scheme. The
14 The MCC evaluates 20 indicators, representing above three areas, for selecting
countries and a country is considered eligible for a full grant when it has score 17 on the
indicators. 15 As mentioned above these include; (i) ruling justly—promoting good governance,
fighting corruption, respecting human rights, and adhering to the rule of law; (ii) investing
in people—providing adequate health care, education, and other opportunities promoting
an educated and healthy population; (iii) economic freedom—fostering enterprise and
entrepreneurship and promoting open markets and sustainable budgets.

Sri Lanka Economic Research Conference 2020
318
MCC has offered grants for around 30 low and lower middle income countries
by 2019 and a number of sectors such as transport, agriculture, energy, education,
infrastructure, water, land, and rural development have been targeted for financial
support., Out of the total disbursed funds of the MCC, Sub Saharan African
countries account for 63 per cent while MCC funds to Asian countries accounts
for 20 per cent. In terms of sectors, around 27 per cent of total MCC grants are
channeled into transport sector while that figure for agricultural sector and energy
is 16 per cent and 15 per cent respectively.
Objective of the study
The Main objective of this study is to examine the effect of the MCC grant on
economic growth and development of recipient countries. It is expected that there
are at least two broad channels through which MCC grant could enhance growth
and development performance in recipient countries. Firstly, as spelled-out in
MCC official documents, MCC grant aims at addressing key development
bottlenecks by financing projects which generate higher returns to recipient
countries. Secondly, eligibility for a MCC grant and its subsequent successful
implementation may have significantly improved the policy environment in the
recipient countries and that, in turn, may surge investments and improve
productivity. In this context, it is expected that the receipt of MCC further
enhances the policy environment partly due to the fact the government is required
to engage in policy reforms prior to the disbursement of certain aid components
attached to the overall MCC grant package. The impact of MCC selection criteria
on policy reforms, both in eligible and contender countries, is often referred as
‘MCC effect’ in the literature. For instance, Parks and Rice (2013), through a
global survey, concluded the presence of MCC effect, in particular, in the area of
controlling corruption and implementing prudent fiscal policies in eligible and
contender countries16.
Aid-Policies-Growth: A Brief Review of Literature
A number of studies have been conducted on investing the impact and
effectiveness of foreign aid on economic growth (Arndt, Jones, and Trap, 2010,
2015; Burnside and Dollar, 2000, Easterly, 2003; Hansen and Tarp, 2001;
16 According to Parks and Rice (2013), the ‘MCC effect’ is weak with respect to
democratic and human right related indicators.

Foreign Relations and International Economic Repositioning
319
Juselius, Moller, and Tarp, 2014; Rajan and Subramanian, 2008). Burnside and
Dollar (2000) initiated a new research direction, namely aid-policy-growth
association, and argued that impact and effectiveness of aid on growth depend on
quality of policy framework. According to authors, aid promotes growth in
countries with good policies. In subsequent years, aid-policy-growth hypothesis
was intensely debated and recently, Jia and Williamson (2019) revisited this
hypothesis and argued that there is weak evidence to suggest that aid promotes
growth in the presence of good policies17. Authors concluded that the
overwhelming majority of the results suggest aid conditional on policy is
ineffective. Nevertheless, in a recent study, Mekasha and Tarp (2019) turn to
meta-analysis to provide an overall assessment on effectiveness of aid and
concluded that empirical evidence confirms the increasing consensus about the
positive evidence of aid’s impact on growth. Highlighting the complexity of on-
going debate over aid effectiveness, Gisselquist and Tarp (2019) alerted readers
as follows; “It is well established in the literature that great care has to be
exercised in avoiding to overextend the use of insignificant statistical parameters
in aid debates. To be sure, an insignificant parameter reflects our lack of
evidence18”.
As discussed in Gisselquist and Tarp (2019), a possible reason for lack of
evidence of aid effectiveness is due to poor targeting towards the needs of
recipient countries though aid is commonly justified with reference to the needs
of recipient countries19.Moreover, Gisselquist and Tarp (2019) argue the lack of
domestic ownership of foreign aid programmes as one of the other reasons for
poor aid effectiveness. Despite the fact that local ownership is set out as a
fundamental principle for aid effectiveness in a number of conventions/agendas
(such as Paris Declaration, Accra Agenda for Action, and Busan Partnership), aid
17 The authors use new data for the same set of countries, which were covered by Burnside
and Dolloar (2000) study, over an extended period (1962-2013).
18 To support their argument further, the authors quoted Temple (2010), following way:
“an insignificant coefficient should usually be seen as absence of evidence, not evidence
of absence, at least until the economic implications of a confidence interval have been
explored.” 19 The authors cited Carment and Samy (2019) study and highlighted its key findings to
support their argument. Carment and Samy (2019) found, for a set of fragile and conflict-
affected states, aid is poorly targeted in fragile states. Further Carment and Samy (2019)
argue that aid’s impact would be improved through better targeting to address core
challenges of legitimacy and authority that are important to understanding why states are
fragile.

Sri Lanka Economic Research Conference 2020
320
continues to be disbursed by donors without proper coordination with national
institutional structures20. The MCC claims that aid recipient country involvement
in programme identification and development is central in its aid programmes
(CRS, 2019). Similarly, aid effectiveness could also be influenced by donor
motivation. Citing Reinsberg (2019) study, Gisselquist and Tarp (2019) conclude
that multi-bilateral aid is indeed used for geopolitical purposes. At the same time,
it is argued that development assistance is in many ways a political project by
donor countries and such motivation could have a negative impact on overall aid
effectiveness (Gisselquist and Tarp, 2019).
As briefly reviewed above, the impact of aid on growth has been investigated
directly as well as indirectly. Furthermore, possible factors influencing aid
effectiveness have also been investigated extensively in the literature.
Nevertheless, the debate on aid effectiveness is far from settled thereby requiring
additional research inputs. In particular, it is required to examine to what extent
aid programmes, which are partly aimed at promoting good policies, contribute
to economic growth in recipient countries.
Econometric Specification and Data
Econometric specification
In order to examine whether MCC grants make an impact on economic growth
empirically, we rely on the difference-in-difference-in-differences (DDD)
approach employed by Hannes and Axel (2011). Our identification strategy rests
on the observation that there can be no growth impact prior to when MCC was
signed. In other words, the forthcoming MCC aid programme makes no impact
on the economy, such as an increase in private sector investments, solely
encouraged by the news that the government enters into MCC agreement, during
the pre-MCC period. Moreover, we limit our sample to the countries which are
generally qualified for MCC support, i.e. low and lower middle income countries.
A simple approach to test for the potential effect of the MCC would be to use the
before-after approach which involves comparing the level of growth before
receiving and after receiving MCC support. The alternative with-without
approach would simply entail comparing the changes in growth in countries
which received MCC support against the countries that have not receiving MCC
20 The authors argue that conventional literature justified such practice with reference to
efficiency while recent justifications have shifted to refer to corruption and weak
implementation capacity.

Foreign Relations and International Economic Repositioning
321
support. Again, this would require a strong assumption that is unlikely to held,
namely that no other factors affect growth performance in MCC and non-MCC
recipient countries. In such as context, combining the‘before-after approach’with
the‘with-without approach’ has considerable merit for alleviating the problem.
By applying the DDD estimator, identification is based on the change in
economic growth between the treatment group and the control group that
occurred between the periods before and after receiving the MCC support. The
DDD estimator could be spelled out as follows;
𝐷𝐷𝐷 = ((𝑔2016𝑇 − 𝑔2012
𝑇 ) − (𝑔2004𝑇 − 𝑔2000
𝑇 ))
− ((𝑔2016𝐶 − 𝑔2012
𝐶 ) − (𝑔2004𝐶 − 𝑔2000
𝐶 ))
g stands for growth (GDP or GDP per capita) or per capita income (either in PPP
or constant US$ measured) while T and C denote Treatment and Control group,
respectively. Evidently, , treatment group includes all the countries who have
received MCC support from 2005-2010 while control group includes low and
lower middle income countries who did not receive MCC support from 2005-
2010.
Our sample does not include countries which received MCC support post-2010
period. Further, in order to avoid year-specific effect, we took the average of
neighboring years, for instance, instead of the GDP growth in 2000, we took the
average growth of 1999 and 2000. A similar approach was adopted for other years
as well. Our dependent variable is the change in growth (per capita income) in
the different periods. The following regression equation was estimated;
𝑌 = 𝛼 + 𝛽𝑇𝑟𝑒𝑎𝑡 + 𝛾2𝑛𝑑𝑝𝑒𝑟𝑖𝑜𝑑 + 𝛿𝑇𝑟𝑒𝑎𝑡 ∗ 2𝑛𝑑𝑝𝑒𝑟𝑖𝑜𝑑 + 𝜃𝐿𝑜𝑤𝑒𝑟𝑚 + 𝜋𝐴𝑓𝑟𝑖𝑐𝑎
+ 휀
where Y is our dependent variable and Treat is a dummy that takes 1 for countries
which received MCC support from 2005-2010 and zero otherwise. The dummy
variable 2nd_period takes 1 for 2012-2016 and zero otherwise. The interaction
term, Treat*2nd_period, is the DDD estimate. In addition, the regression model
was controlled for two more variables, namely Africa dummy (1= if anAfrican
country), and lower middle-income country (Lowerm) dummy (1=if a lower
middle-income country). The African dummy captures the growth dynamics, if
any, specific to African countries and Lowerm dummy takes into account lower
middle income country growth dynamics.

Sri Lanka Economic Research Conference 2020
322
Data and Data Sources
Data for the study was extracted from the World Development Indicator online
database. This study extracted data for GDP growth rate, GDP per capita growth
rate, GDP per capita income (constant US $, 2017), and GDP per capital income,
PPP, 2010). Our dataset consists of 62 low and lower middle-income countries.
Estimation and Discussion
Table 1 presents the difference of our selected outcome variables by country
group for the reference period. For instance, for treatmentgroup (who received
MCC grant during 2005-2010), average difference of GDP growth is 1.64 per
cent for 2004-2000 period. In other words, GDP growth rate in 2004, on average,
1.64 per cent higher than that of 2000. For the case of control group, GDP growth
rate in 2004 is 1.95 per cent higher than that in 2000. Nevertheless, for both
country groups, GDP grew at a slower rate in 2016 than in 2012. For instance,
GDP growth rate, on average, is 1.84 per cent lower in 2016 than that in 2012 for
treatment group, while in control group countries, growth rate is 1.65 per cent
lower in 2016 than that in 2012. A similar pattern could be identified for both
country groups when analyzing the GDP per capita growth rate. However, when
analyzing GDP per capita (measured in constant US$ and Constant Purchasing
Power Parity (PPP)) terms, expansion of GDP per capital is relatively higher in
after period (2016-2012) than that in the before period (2004-2000).
Table 1: Difference (D) by Country Group and Time Period
Source: Author’s calculation
Table 2 reports data related to difference-in-difference (DD) estimates. That is
the difference in average growth rate differences reported in before and after
periods, i.e. 𝐷𝐷 = 𝐷2016−12 − 𝐷2004−2000. Accordingly, control group

Foreign Relations and International Economic Repositioning
323
countries witnessed marginally higher growth slow-down compared to treatment
group countries. Similarly, in GDP per capita terms, treatment group countries
reported much better performance than controlgroup countries. For instance, DD
estimate of GDP per capita (constant) is US$ 82 for treatment group countries
while this figure for control group countries is US$ 33. This implies that addition
to per capita income is higher in treatment group countries, when comparing
before and after, than that in control group countries.
It seems that economic performance in treatmentgroup countries has been better
when compared to the control group countries during 2012-2016. This may be
partly due to the MCC grant. However, it is not quite clear to what extent this
performance differential is statistically significant and is attributed to the MCC
grant. Additionally, a regression model was constructed by combining the before-
after comparison with the with-without scenario.
Table 2: Difference-in-Difference (DD) by Country Groups
Source: Author’s calculation
The estimated results are reported in Table 3. We run four alternative models
where our dependent variables are; change in GDP growth, GDP per capita
growth, GDP per capita measured in constant US$ , and GDP per capita measured
in PPP constant. For instance, change in GDP growth rate for 2004-2000 is
calculated as;
∆𝑔𝑟𝑜𝑤𝑡ℎ 𝑟𝑎𝑡𝑒2004−2000 = 𝑔𝑟𝑜𝑤𝑡ℎ 𝑟𝑎𝑡𝑒2004 − 𝑔𝑟𝑜𝑤𝑡ℎ 𝑟𝑎𝑡𝑒2000
In our regression models, treat dummy variable captures any specific growth
dynamics which is unique for MCC recipient countries while 2nd period dummy
captures any specific growth dynamics which are common to all the countries in
the after period compared to before (base) period. The interaction terms aims at
capturing any growth dynamics which are common to MCC countries in the 2nd
period. It is expected that the impact of MCC grant on growth and development
could be captured through this dummy. If MCC grant is effective, it can be

Sri Lanka Economic Research Conference 2020
324
expected that change in growth in MCC recipient countries may be statistically
different from both 1st period as well as for non-MCC recipient countries (control
group countries). The estimated coefficient of the interaction terms is the DDD
estimate. The estimated coefficient of the interaction term is not statistically
significant in all four models. It implies that there is no statistically significant
evidence to suggest that MCC grant has made an impact on growth and
development in recipient countries though our descriptive analysis showed a
relatively better growth performance in recipient countries (treatment group
countries), it is modestly better when compared to control group countries.
Table 3: Effect of MCC Grant Scheme on Economic Growth and
Development
Dependent variable →
Change in
GDP
growth
Change in
GDP per
capita
growth
Change in GDP
per capita
(constant US $)
Change in GDP per
capita, PPP, constant
Constant 2.901** 3.259** 30.415 270.000**
(1.217) (1.161) (44.809) (118.266)
Treat (1=MCC recipient) -0.232 -0.245 28.372 68.987
(1.297) (1.238) (47.762) (120.161)
2nd Period (1=2012-2016
period) -3.598** -3.913*** 33.424 113.899
(1.013) (0.967) (37.310) (94.692)
Interaction term (Treat * 2nd
Period)=DDD 0.119 0.521 48.344 118.954
(1.831) (1.747) (67.398) (169.669)
Africa (1= if a African
country) -0.980 -1.292 -37.142 -289.977**
(0.955) (0.911) (35.182) (91.069)
LMIC (1= if a lower middle
income country) -0.651 -0.841 106.251** 214.497**
(0.986) (0.941) (36.317) (94.549)
R2 0.14 0.17 0.14 0.22
F-value 3.80 4.78 4.08 6.91
No of observations
(countries) 62 62 62 61
Note: ** denotes the estimated coefficients are statistically significant at 5 per cent or
lower level of significance. Estimated standard errors are reported in
parentheses. The estimate of DDD is highlighted.
Source: Authors’ estimation

Foreign Relations and International Economic Repositioning
325
Documenting evidence from 86 closeout MCC projects in different recipient
countries, Ospina and Block (2017) summarizes their findings as follows;
“(i) closeout ERRs have been produced for the majority of projects (63%) and
MCC funds (66%), (ii) closeout ERRs are on average above MCC’s 10 per cent
threshold (13.2%), (iii) more than one-third of closed projects have closeout
ERRs below MCC threshold, (iv) roughly three-fourths of project exhibit ERRs
that decease from the time the impact Enters Into Force” (pp. 2)21.
Above evidences show that in most cases, MCC funded projects have promoted
growth and development, nevertheless, our findings suggest that such micro-level
achievements are yet to be observable through macro-level indictors. This
absence of statistically significant evidence may be due to few reasons. Firstly, it
is possible that ‘MCC effect’ (MCC’s selection system is touted as an incentive
for countries to pursue policy reform in order to gain MCC eligibility, a
phenomenon nicknamed: the “MCC Effect may be relatively strong, and there
may be less difference, in terms of policy environment, between recipient
countries and eligible non-recipient countries” (Rose, 2013) 22. Secondly, MCC
grant, to a larger extent, may be driven by geo-political reasons rather than the
development needs of the countries. It is often argued that development
assistance is in many ways a political project by donor countries and such
motivation could have a negative impact on overall aid effectiveness (Gisselquist
and Tarp, 2019). Finally, it is also possible that it may require more time to
witness micro-level impacts through macro-indicators.
Conclusion
A majority of policy makers, politicians, as well as general public in cash-
strapped developing countries believe that foreign aid could enhance their growth
prospects and eradicate poverty. There is a long-standing debate over the impact
and effectiveness of foreign aid on economic growth and development. This
debate received a new impetus when Burnside and Dollar (2000) found that aid
effectiveness is conditional on good policies. In other words, aid works only if it
is channeled into countries that have good policies. Partly based on this new
21 These findings are based on 2016 Report on Closeout ERRs, as far as author knows,
this is the latest publication reporting project closeout ERRs and was published in 2017.
22 Rose (2013) defines MCC effect as an incentive for countries to pursue policy reform
in order to gain MCC eligibility, a phenomenon nicknamed: the “MCC Effect”.

Sri Lanka Economic Research Conference 2020
326
finding, USA re-designed their foreign assistance mechanism in setting up
Millennium Challenge Cooperation (MCC) to fund countries that have good
policies and are ready to reform institutions for guaranteeing free markets and
democratic principles.
This study aimed at investigating the impact of MCC grant on economic growth
and development. Our sample consisted of 62 low and lower middle income
countries who are either recipients of or eligiblefor MCC grant. This study
employed both descriptive as well as regression analysis in examining the impact
of MCC grant on economic growth and development in recipient countries. By
combining before-after analysis with with and without within a single framework,
Difference-in-Difference-in-Difference (DDD), we examined whether the growth
and development experience of recipient countries differ when compared to their
own past performance (before receiving MCC grant) and their fellow countries
who did not receive MCC assistance. Our descriptive analysis show that MCC
recipient countries performed better. Nevertheless, according to DDD estimate,
such growth and development differentials are not statistically significant
indicating absence of evidence that MCC grant is effective in promoting growth
and development in recipient countries.
Keywords: Cross-Country Study, Developing Countries, Economic Growth,
Foreign Aid
Reference
Arndt, C., S. Jones, and F. Tarp (2010) “Aid, Growth, and Development: Have We
Come Full Circle?” Journal of Globalization and Development, 1(2)
Arndt, C., S. Jones, and F. Tarp (2010), “What Is the Aggregate Economic Rate of Return
to Foreign Aid?” The World Bank Economic Review, 30(3), 2015, 446–74.
Burnside, C. and D. Dollar (2000), "Aid, Policies, and Growth", The American Economic
Review,Vol. 90(4), pp. 847-868
Congressional Research Service (CRS) (2019), "Millennium Challenge Corporation:
Overview and Issues", RL 32427, accessed via https://crsreports.congress.gov
Easterly, W. “Can Foreign Aid Buy Growth?” Journal of Economic Perspectives, 17(3),
2003, 23–48.
Gisselquist, R.M. and F. Tarp (2019), "Aid Impact and Effectiveness: Introduction and
Overview", Politics and Governance, Vol. 7(2), pp. 4

Foreign Relations and International Economic Repositioning
327
Hannes, O. and N.P.D. Axel (2011), "Does Conditionality Work? A Test for an Innovative
US Aid Scheme", CESinfo Working Paper. No 3454, Center for Economic Studies
and Ifo Institute (CESifo), Munich
Hansen, H., and F. Tarp (2001), “Aid and Growth Regressions.” Journal of Development
Economics, 64(2), pp. 547–70.
Jia S. and C.R. Williamson (2019), "Aid, Policies, and Growth: Why So Much
Confusion?", Contemporary Economic Policy, Vol. 37(4)
Juselius, K., N. F. Møller, and F. Tarp (2001), “The Long-Run Impact of Foreign Aid in
36 African Countries: Insights from Multivariate Time Series Analysis.” Oxford
Bulletin of Economics and Statistics, 76(2), 2014, 153–84.
Mekasha, T.J. and F. Tarp (2019), "A Meta-Analysis of Aid Effectiveness: Revisiting the
Evidence", Politics and Governance, Vol. 7(2), pp. 5-28
Ospina, S. and M. Block (2017), "2016 Report on Closeout ERRs", Millennium Challenge
Corporation
Parks, B.C. and Z.J. Rice (2013), "Does the "MCC Effect" Exist? Results from the 2012
MCA Stakeholder Survey", MCA Monitor, accessed via
https://www.cgdev.org/sites/default/files/1426969_file_MCC_Effects_FINAL.pdf
Rajan, R. G., and A. Subramanian. “Aid and Growth: What Does the Cross-Country
Evidence Really Show?” Review of Economics and Statistics, 90(4), 2008, pp.643–
65.
Rose, S. (2013), “Does the MCC Effect Exist”, Center for Global Development, accessed
via https://www.cgdev.org/blog/does-mcc-effect-exist

Sri Lanka Economic Research Conference 2020
328
SRI LANKA’S EXTERNAL DEBT: TREND, OWNERSHIP,
AND DYNAMICS
Dunusinghe, P. Department of Economics, University of Colombo, Sri Lanka
Introduction
The external debt stock of the central government, as a percentage of Gross
Domestic Product (GDP), grew from 37 per cent in 2010 to 67 per cent in 2019.
During the last decade, the growing external debt levels and concerns over
repayment capacities received greater publicity, nationally as well as
internationally. In particular, most international media stations carried out media
reports/research studies arguing that Sri Lanka’s growing debt burden is due to
Chinese loans. Nevertheless, there are a number of unanswered questions (or
research gaps) regarding Sri Lanka’s mounting external debt. For instance, what
are the changes in external debt dynamics? What has been happening to debt
ownership over the years? Whose loans may have possibly contributed to the
present crisis? Are costs comparable among lenders? These are some of the
questions which require answers when understanding Sri Lanka’s present debt
burden. Section two spells out the objective of the study, while section three
briefly reviews related literature. The fourth section deals with trends, magnitude,
and ownership of Sri Lanka’s external debt while the econometric specification
and data are presented in section five. Finally, section six presents and discusses
the estimated results followed by concluding remarks in the last section.
Objective of the study
The Main objective of this study is to examine the sources of Sri Lanka’s external
debt burden with special reference to post-liberalization period (i.e. 1978-2019).
Specific objectives include; (a) to identify the changes in the dynamics of external
debt stock of Sri Lanka, and (b) to identify possible sources for structural breaks
in Sri Lanka’s external debt growth
Brief literature survey
A number of studies have looked into public debt dynamics and its changes over
time (Jawadi and Sousa, 2012; Andrie and Minovic, 2018; Guestas and Regis,
2019; Campos and Cysne, 2019). The main purpose of the analysis was to

Foreign Relations and International Economic Repositioning
329
identify the changes in the dynamics of debt growth and relate such breaks with
possible sources. Jawadi and Sousa (2012) examined structural breaks and
nonlinearity in US and UK public debt. Using quarterly data, authors found that
US public debt series has witnessed eight structural changes during 1970:q1-
2009:q2 period while UK public debt stock has witnessed five structural breaks
during 1962:q4-2009:q2 period. The authors argued that factors such as economic
recessions, oil shocks and, financial and political instability could explain such
structural breaks. Similarly, Andrie and Minovic (2018) analyzed the dynamics
of public debt growth in Serbia for the period of 2004:q4 – 2017:q4 period and
their empirical estimates captured the upward shift in public debt growth from
the onset of the Great Recession as well as the policy response to curb the rising
public debt stock. In the context of China’s looming debt crisis, Guestas and
Regis (2018) examined the sustainability of China’s sovereign debt, paying
particular attention to changes in its dynamics. The authors found that there was
a clear upward trend from 2014 onward, related to the growth of public debt in
China and argued that urgent policy attention is required to address this
unsustainable path in the debt-to-GDP ratio. Campos and Cysne (2019) analyzed
the structural breaks in Brazilian public debt for the period of 1997-2018. The
aim of the study was to identify the precise date as of which the debt trajectory
became unsustainable. The authors found that until mid-2014, Brazilian public
debt growth path showed weak sustainability, however, from May of 2014
onwards, it experienced a transition towards an unsustainable regime. This is
largely due to enhanced spending at increasing rates, without a sufficient
offsetting of revenue. Interestingly, all of the above studies employed the Bai and
Perron (2003) methodology in identifying the changes in the dynamics of debt.
The structural break test is unable to establish causation with absolute certainty,
however, it is possible to either lend significant support to the case for causation
or raise significant doubts of a causal relationship. Moreover, structural beak
analysis can provide support for, or help to refute the period in which damages
were incurred and identify its contributors.
Trend and Ownership of Sri Lanka’s External Debt
Sri Lanka’s external debt stock grew rapidly during the post economic
liberalization period starting from 1978 till early 1990s (annual average growth
rate was 15 per cent). This was mainly due to the large-scale development
projects launched with the assistance of both bi-lateral and multi-lateral lenders.
During 1990-99, external debt stock grew at an average annual rate of 6 per cent.
In relative terms, as a % of GDP, Sri Lanka’s debt stock declined from 1993 to

Sri Lanka Economic Research Conference 2020
330
2010. The down-ward trend reversed from 2010 and the debt-to-GDP ratio which
was 37 per cent in 2010 rose to 67 per cent by 2019. It indicates that the present
debt burden is largely due to post-war period debt accumulation. Sri Lanka’s
external debt obligations shifted to new sources during the study period (see
Table 1). Less than a decade ago, Sri Lanka’s debt obligations to international
financial market and China have significantly increased. For instance, Sri
Lanka’s debt obligation to international financial market, as a % of total
outstanding external debt stock, increased from 30 per cent in 2010 to 52 per cent
by 2019, whereas China’s share in total debt stock increased from 2.8 per cent to
9.6 per cent between the two reference years. Sri Lanka’s debt obligation to China
increased further (around 16 per cent of total external public debt) when taking
into account project loans offered by the Export-Import Bank of China to State
Owned Enterprises (IMF, 2019).
Table 1: Changing Sri Lanka’s External Debt Ownership: 1980-2019
(as a % of total Central Government Debt Stock)
Source 1980 1990 1995 2000 2005 2010 2015 2019
Multilateral 40.4 40.8 41.8 46.1 55.9 33.3 28.1 23.0
World Bank 22.2 22.3 22.8 23.9 22.4 13.9 11.0 8.5
ADB 16.5 17.0 17.5 30.3 24.1 17.7 15.1 12.5
Bilateral 56.0 56.1 55.2 51.2 45.3 36.5 25.1 17.7
Japan 27.3 29.6 29.3 31.9 29.0 23.7 12.9 9.7
China(a) 0.4 0.2 0.2 0.4 0.4 2.8 8.8 9.6
Financial markets - - - - - 30.2 41.4 51.9
Total 100 100 100 100 100 100 100 100
Note: (a) Excluding outstanding project loans under State Owned Enterprises
Source: Annual Report of Central Bank (various years)
Econometric Specification and Data
Econometric Specification
Bai (1997) and Bai and Perror (1998, 2003a, 2003b) consider a multiple linear
regression model with T periods and m potential structural breaks, i.em+1
regimes. In particular, for the observation in the regime j, Bai (1997) and Bai and
Perron (1998, 2003a, 2003b) estimate the following least square regression:
𝑦𝑡 = 𝑋𝑡𝑇𝛽 + 𝑍𝑡
𝑇𝛿𝑗 + 휀𝑡

Foreign Relations and International Economic Repositioning
331
for the regimes j=0,1,2,…m, and white noise process 휀𝑡. The model (1) is
presented in its most general form as variables corresponding to the matrix do
not vary across regimes, while variables corresponding to matrix Z are allowed
to vary across regimes. For a specific sect of m breaks, Bai (1997) and Bai and
Perron (1998, 2003a, 2003b) minimize the following sum of squared residuals;
𝑆(𝛽, 𝛿|{𝑇}) = ∑ { ∑ 𝑦𝑡 − 𝑋𝑡𝑇𝛽 − 𝑍𝑡
𝑇𝛿𝑗
𝑇𝑗+1−1
𝑡=𝑇𝑗
}
2𝑚
𝑗=0
using standard least squares regression to obtain estimates (β, δ). The global m-
break optimizers are the set of breaks and corresponding coefficient estimates
that minimize sum of squared residuals across all possible sets of m-break
partitions (Bai and Perron 1998, 2003a, 2003b). Following Jawadi and Sousa
(2012), who apply described Bai-Perron testing procedure in the cases of US and
UK, the mean-shift model with m potential structural breaks (T1, T2,…Tm) is
estimated:
∆𝐸𝐷𝑡 = 𝜇𝑗 + 𝛿𝐽𝑡𝑟𝑒𝑛𝑑 + 휀𝑡
where∆𝐸𝐷𝑡 is the growth of external debt while 𝜇𝑗, 𝛿𝐽 and 휀𝑡 stand for the
intercept coefficients, slope coefficients, and error term respectively. Building on
Bai (1997), Bai and Perron (1998) have introduced several structural break tests.
The one that is employed in this study is the one proposed in Bai and Perron
(2003a, 2003b), where the authors proposed the following algorithm for
determining the overall number of structural breaks; (1) pre-specify the upper
bound for the number of breaks m by setting the value of trimming percentage,
(2) test the null hypothesis of no structural break against the alternative of a pre-
specified number of breaks defied in step (1) by using double maximum test of
Bai and Perron (1998) and, (3) if double maximum tests indicate the presence of
at least one structural break, proceed to next structural break, selecting M such
breaks.
Data and Data Sources
Data for the study are extracted from annual reports published by the Central
Bank of Sri Lanka and our main variable is the growth of external debt stock,
while the period of study is 1978-2019 (T=41). External debt, measured in US$,
was considered for the analysis to avoid any exchange rate depreciation effect.

Sri Lanka Economic Research Conference 2020
332
Our data contain external debt of the Central Government only since data for
external debt of State-Owned Enterprises are not publically available for the
study period.
Estimation and Discussion
The estimated results indicate that the change in the growth of external debt
dynamics had occurred in year 2007. Distinctively, mean value of growth of
external debt shifted upward in 2007. Our test results clearly indicate a presence
of a structural break in 2007. This shift is statistically significant (see test
statistics and information criteria values in Table 2&3) and there is only one such
structural break for the study period. The results are consistent for different
statistical tests.
This structural break states that Sri Lanka’s foreign borrowings rapidly increased
during the post-2007 compared to pre-2007 period. At the same time, it is also
possible that Sri Lanka borrowed at a higher cost prior to 2007. Hence, the
amount of borrowing as well as the costs of borrowings may have contributed to
increase Sri Lanka’s external debt obligations during the post-2007 (Weerakoon
and Jayasuriya, 2018).
Table 2: Structural Break Test: Growth of External Debt Stock –
1978/2019
(Multiple Structural Break Test – Global Informtion Criteria)
Breaks # ofCoefs. Sum of Sq.
Residuals
Log-L SchewarzCriterion* LWZ
Criterion
0 2 0.33 42.30 -4.4674 -4.5766
1 4 0.22 50.31 -4.8781 -4.6800
2 6 0.20 52.64 -4.8109 -4.5099
3 8 0.21 51.12 -4.5603 -4.1531
Schwarz criterion selected breaks 1
LWZ criterion selected breaks 1
Estimated break dates
1. 2007
2. 2007, 2013
3. 1988, 1995, 2013
* minimum information criterion values displayed with shading

Foreign Relations and International Economic Repositioning
333
Table 3: Structural Break Test: Growth of External Debt Stock – 1978-2019
(Multiple Structural Break Test – L+1 break vs. global L)
Break test F-statistic Scaled F-statistic Critical value**
0 vs. 1* 18.12 18.12 8.58
1 vs. 2 4.45 4.45 10.13
2 vs. 3 3.61 3.61 11.14
Estimated break dates
1. 2007
2. 2007, 2013
3. 1988, 1995, 2013
*significant at the 0.05 level
**Bai-Perron (Econometric Journal, 2003) critical values
The structural break in year 2007 could result due to various factors. Firslyt, in
2007, Sri Lanka issued international sovereign bonds for the first time and, as a
result Sri Lanka’s debt obligation increased by 54 billion rupees in 2007. In
addition, debt obligation to China increased from 5 billion rupees in 2006 to 22
billion rupees in 2007. Subsequently, Sri Lanka’s debt obligations to both these
sources jumped remarkably due to an increase in borrowing from both sources23.
Sri Lanka’s debt obligation under the international sovereign bond stood at 4 per
cent of total external debt stock in 2007 and it rose to 31 per cent by 2017.
Similarly, Sri Lanka’s debt obligation to China was 0.5 per cent, as a % of Sri
Lana’s total external debt obligation in 2006 and, it increased to 1.7 per cent in
the following year. By 2019, Sri Lanka’s debt obligation to China rose to 9.6 per
cent of the Sri Lanka’s total external debt obligation. Hence, growth of external
debt has been driven primarily by new debt sources than the traditional lenders.
An increase in external debt burden could be due to the relatively expensive new
sources of external funds (Morris et. al., 2019). A recent World Bank study
examined and compared costs of loans, in terms of interest costs, grace and
maturity periods, and grant component. It concluded that international financial
market and Chinese funds are relatively expensive than that of the World Bank
23Weerakon (2018) concluded that Chinese loans are clearly not the primary cause of Sri
Lanka’s debt imbroglio but have contributed to, and, possibly, aggravated the problem.

Sri Lanka Economic Research Conference 2020
334
for many developing countries including Sri Lanka. In the Sri Lankan context,
Weerakoon (2018) concluded that Chinese funds are less concessionary than
most other bilateral lenders, in particular Japanese funds are highly concessionary
than that of China.
Conclusion
Sri Lanka’s external debt growth path witnessed a structural break in year 2007.
It implies that external debt obligation grew at a faster rate in post-2007 in
comparison to the time period from 1978-2006. This change was largely
accompanied by new sources of external funding, namely from the international
financial market and China. The amount of debt may have increased due to two
factors; namely the amount of borrowings and costs of borrowings. Funds from
both sources were available at a higher cost than that of the traditional bilateral
and multilateral lenders. More importantly, post-2007, the share of Sri Lanka’s
debt obligation to traditional lenders, such as ADB, World Bank, and Japan
declined significantly. Hence, Sri Lanka’s debt burden is mainly due to its
increased borrowing at higher costs from sources such as international financial
markets and China. Hence, the debt burden is a recent phenomenon and it was
caused due to increased borrowing at a high cost from the new sources.
Reference
Andric, V. and J. Minovic (2018). Public Debt Growth, Great Resession and Fiscal
Consolidation-The Serbian Episode. Serbian Journal of Management. 13(2),
251-262
Bai, J. (1997). Estimation of a Change Point in Multiple Regression Models. The
Review of Economics and Statistics, 79(4), 551-563.
Bai, J., &Perron, P. (1998). Estimating and Testing Linear Models with Multiple
Structural Changes. Econometrica, 66(1), 47-78.
Bai, J., &Perron, P. (2003a). Computation and Analysis of Multiple Structural
Change Models. Journal of Applied Econometrics, 18(1), 1-22.
Bai, J., &Perron, P. (2003b). Critical values for multiple structural change tests.
Econometrics Journal, 6(1), 72-78.
Campos, E.L. and R.P. Cysne (2019). Sustainability of Brazilian Public debt:
Analysis of a possible structural break in the recent period.
Https://hdl.handle.net/10438/27643

Foreign Relations and International Economic Repositioning
335
Central Bank of Sri Lanka (various issues).Annual Report, Central Bank of Sri
Lanka: Colombo
Central Bank of Sri Lanka (various issues). Public Debt Management in Sri Lanka.
Central Bank of Sri Lanka. Colombo
Cuestas, J.C. and P.J.Regis (2018). On the Dynamics of Sovereign Debt in China:
Sustainability and Structural Change. Economic Modelling, Vol. 68. 356-359
Jawadi, F. and R.M. Sousa (2012). Structura Breaks and Nonlinearity in US and UK
Public Debt. Working Paper Series, NIPE WP 25/2012
Morris, S., Parks, B., and A. Gardner (2020). Chinese and World Bank Lending
Terms: A Systematic Comparison Across 157 Countries and 15 Years. Policy
Paper 170, Center for Global Development
Weerakoon, D. and S. Jayasuriya (2018).Sri Lanka’s debt problem isn’t made in
China. Access via
https://www.eastasiaforum.org/2019/02/28/sri-lankas-debt-problem-isnt-made-in-
china/

Sri Lanka Economic Research Conference 2020
336
THE EFFECTIVENESS OF MILLENNIUM CHALLENGE
COOPERATION GRANTS IN GROWTH STIMULATION:
AN EMPIRICAL DEEP-DIVE
Gunaruwan, T. L., Indeewari, G. K. D.* Department of Economics, University of Colombo, Sri Lanka
*Corresponding author: [email protected]
Introduction
The Millennium Challenge Corporation (MCC) is a United States’ agency, with
a novel structure, that provides international development assistance. It operates
with the stated objective of assisting the grant recipient countries in their attempts
to accelerate economic growth through poverty reduction, particularly by
identifying and removing the “binding constraints to growth” (Millennium
Challenge Corporation, 2020). The selection of recipient countries for the
programme is based on a set of qualifying criteria, among which figures the
countries being low-income countries (LICs) or lower-middle income countries
(LMICs). The MCC programme, established through the Millennium Challenge
Act of 2003, has so far granted 37 Compacts worth a total of USD 13.4 billion in
29 countries and 28 Threshold Programmes worth a total of USD 0.7 billion in
26 countries (perceived based on Millennium Challenge Corporation, 2020).
Research Problem
There is a wide criticism that the MCC has not been effective in reaching its stated
objective of assisting the grant recipient countries in accelerating economic
growth. Thus, the present study attempts to analyse whether the Millennium
Challenge grant is effective in stimulating growth in the recipient countries.
Objective
There is much debate over the extent to which the MCC programme is being
effective in realising its growth-supporting objective. A few studies have been
conducted in order to examine this aspect (Dunusinghe, 2020a, 2020b; Johnson
& Zajonc, 2006; Ospina, 2014; Ospina & Block, 2017). The present paper, being
another attempt to shed light on this issue, examines the growth performance in
the MCC grant recipient economies from a different angle.

Foreign Relations and International Economic Repositioning
337
Methodology
Macroeconomic data on 74 countries were fetched from the World Bank
database. The years in which the MCC grants were obtained by the recipient
countries were sourced from the MCC website. Initially, the annual average
Gross Domestic Product (GDP) per capita growth rates24 “before” and “after”
receiving the MCC grants were compared. Then, a regression model was
constructed based on the theoretical underpinning that the initial GDP per capita
and annual average gross capital formation as a percentage of GDP (or
“Investment Ratio”) could determine annual average GDP per capita growth
rates. The highest number of MCC grants obtained by countries was two (2).
Therefore, two (2) dummy variables were also introduced as regressors to
indicate whether a particular period considered is “before” or “after” the receipt
of the first or the second MCC grant. The period of 18 years from 2000 to 2017,
taken into consideration for the present analysis, was broken into two or three
depending on whether one (1) or two (2) MCC grants have been obtained by each
recipient country, while using the years in which the agreements were signed as
points of separation of periods. Countries that have not received MCC grants
were also considered in the analysis, in order to check the “with” and “without”
effect. Thirty-six such countries were subjected to analysis. Another variable was
introduced to represent the “length of the time period” since the duration of
periods become unequal owing to different points in time at which the MCC grant
facility had intervened. The full length of 18 years was considered for those
countries which had not received any MCC facility. It was intended that this
variable would capture any effect of duration on the annual average GDP per
capita growth rate. A dummy variable was introduced to indicate whether a
specific country belongs to Sub-Saharan Africa or not. It was intended that the
said dummy variable would capture growth dynamics, if any, specific to Sub-
Saharan Africa. Another dummy variable was included to indicate whether a
country was a LMIC in the starting year of the considered period.
Thus, the relationship between annual average GDP per capita growth rate and
its determinants was estimated by regressing the following equation:
Gi = β1 + β2PCIi + β3IRi + β4MCC1i + β5MCC2i + β6NYi +β7SSAi + β8LMICi + μi
24 The present study uses GDP per capita growth rate instead of GDP growth rate,
to set off against any possible impact of changes in population.

Sri Lanka Economic Research Conference 2020
338
Where,
G = Annual average GDP per capita growth rate for the considered
period
PCI = GDP per capita at the beginning of the period
IR = Annual average Gross Capital Formation as a percentage of GDP
(“Investment Ratio”)
MCC1 = First MCC grant dummy variable (1 if the first MCC grant has
been obtained in the considered period)
MCC2 = Second MCC grant dummy variable (1 if the second MCC
grant has been obtained in the considered period)
NY = Number of years in a given period of time
SSA = Sub-Saharan Africa dummy (1 if the country belongs to the
African continent)
LMIC = LMIC dummy variable (1 if the country is a LMIC)
By 2016, 40 countries around the world had signed MCC agreements for compact
and/or threshold programmes. However, Sao Tome and Principe’s gross capital
formation data were not available. Data on 36 comparable countries that had not
received MCC grants were also obtained. These were LICs and LMICs according
to the World Bank country classification by income level (World Bank, 2020).
Thus, data on 76 countries altogether were used in the analysis.
A cross-sectional analysis was thereby performed. No presence of
multicollinearity was found. Outliers were removed to ensure normal distribution
of the residuals. The normality of the residuals of each model was tested by the
Shapiro-Wilk test of normality. Breusch-Pagan / Cook-Weisberg test for
heteroskedasticity was conducted. STATA software package was deployed to
estimate the model.
Results and Discussion
Annual average GDP per capita growth rates before and after receiving a MCC
grant were examined, and were found not normally distributed. Thus, the

Foreign Relations and International Economic Repositioning
339
Wilcoxon signed-rank test was used to compare the paired means. The null
hypothesis that the median difference between the two variables is equal to zero
was rejected under 1% level of significance, indicating the presence of a
significant difference between annual average GDP per capita growth rates
before and after receiving the MCC grant.
Table 1 summarises results of the regression analysis, in which the Model-2
emerged as the best-fit model among the three different variants of models tested.
Table 1: Results from OLS Regression
Note: ***, ** and * indicate significance at 1%, 5% and 10% respectively. Robust
standard errors are reported in parentheses.
Source: Author’s estimation
The coefficient of the initial GDP per capita indicated a negative and significant
influence on the dependent variable, except in the Model-1 where the influence
did not emerge significant. The initial income level being higher makes it less
easy to grow further, and thus, such a negative direction of relationship indicated
in Models 2 and 3 are theoretically expected. The Investment Ratio emerged as a
positive and significant determinant, again a theoretically expected result, in all
the three models tested. The length of duration indicated a negative and
significant influence in all the models tested, while the dummy variable

Sri Lanka Economic Research Conference 2020
340
representing Sub-Saharan Africa became negative and significant in the two
models tested with it, indicating the presence of a slower growth rates
characteristic to the region. LMIC dummy variable, when introduced in the
Model-3, became negative though insignificant.
According to all the models, the coefficients of both MCC 1 and MCC 2 dummy
variables, standing for the first and the second intervention of a MCC grant
respectively, showed a negative and significant bearing on the dependent
variable. This brings suggestive evidence to infer that MCC grants would have
negatively affected the growth rates of the recipient countries.
Conclusion
It can be inferred from the present study that the MCC grant has not been
successful in accelerating the growth impetus in recipient nations. In fact, the
effect has been “detrimental” if one is to interpret it based on the above results.
The results of this study conform with that of Dunusinghe (2020a, 2020b), where
he also brought evidence towards MCC grant having been unable to fulfill its
explicit objectives. However, given the fact that the growth effect of any
investment activity is perceived only with a reasonable time lag, and that the
periods after obtaining MCC grants by many countries are relatively shorter,
these results may have to be reconfirmed through further investigation after
collecting data in a few more years in the future. Such future research could also
examine whether any inherent weaknesses or shortcomings in relation to
development and implementation of the MCC investment programmes (such as
in Constraints Analyses or in implementation mechanisms, which appear notably
peculiar to MCC grants and quite different from other international donor
programmes) have been behind this apparent failure, which is not an aspect dealt
with in the present study.
Keywords: Capital formation; Growth; International development assistance;
MCC grant; Per capita GDP
References
Dunusinghe, P. (2020a). Does MCC grant promote economic growth and development?
Evidence from a cross-country study. Unpublished manuscript.
Dunusinghe, P. (2020b, February 7). Millennium Challenge Corporation (MCC) compact
of Sri Lanka [Panel Discussion]. 33rd Meeting of the Sri Lanka Forum of
University Economists (SLFUE), Uva Wellassa University, Badulla, Sri Lanka.

Foreign Relations and International Economic Repositioning
341
Johnson, D., & Zajonc, T. (2006). Can foreign aid create an incentive for good
governance? Evidence from the Millennium Challenge Corporation. (Working
Papers: Center for International Development at Harvard University No. 11).
Cambridge: Center for International Development.
Millennium Challenge Corporation. (2020). MCC. https://www.mcc.gov/
Ospina, S. (2014). Background paper on inclusive growth concepts in the context of the
Millennium Challenge Corporation. Millennium Challenge Corporation.
https://www.mcc.gov/content/uploads/2017/05/Background-Paper-Inclusive-
Growth.pdf
Ospina, S. & Block, M. (2017). 2016 report on closeout ERRs. Millennium Challenge
Corporation. https://www.mcc.gov/resources/doc-pdf/report-2016-report-
closeout-errs
World Bank. (2020, May 22). World Bank Open Data. Retrieved from
https://data.worldbank.org/

Sri Lanka Economic Research Conference 2020
342
RELATIONSHIP BETWEEN RESTAURANT
DEMOGRAPHICS AND RevPASH; EVIDENCE FROM
REGISTERED TOURIST RESTAURANTS IN COLOMBO
DISTRICT
Bandara, D.G.G.P.S.1*, Karunarathne, A.C.I.D.1, Deshpriya N.P.R.2 1Department of Tourism Studies, Uva Wellassa University, Sri Lanka
2Department of Management Sciences, Uva Wellassa University, Sri Lanka *Corresponding author: [email protected]
Introduction
Revenue management was first developed in the mid-1980s and has been
successfully applied to the airline and hotel industries for many years, but has
only recently been applied to the restaurant industry. Revenue management is a
sophisticated form of supply and demand management. Its primary focus is
managing customer demand through the use of variable pricing and capacity
management to maximize profitability. The four strategic levers for yield
management are: calendar (reservations, bookings), clock (duration controls,
turnover rates), capacity (demand smoothing) and pricing (price fences,
discounts). Through the application of information technology, pricing strategy,
and service product/process design, revenue management helps companies to sell
the right product at the right time to the right customer for the right price. Revenue
management is particularly suited for the restaurant industry, with its relatively
finite capacity of available tables, perishable inventory, and micro-segmented
markets of restaurant guests (Karunarathne, 2020). In the restaurant industry,
Revenue Per Available Seat- Hour (RevPASH). The revenue per available time-
based inventory unit can be calculated by Total Revenue dividing Available seat
hours (Number of available Seat x Hours of seat availability). Tourist arrivals to
Sri Lanka during the year 2017 amounted to 2,116,407, registering a 3.2%
increase since 2016. Reported number of nights spent in 2017 by international
tourists was 23,068,000, showing an increase of 10.27%, with an average
duration of 10.9 nights (SLTDA 2019). At present, a lot of tourist restaurants are
established in Sri Lanka, because they have a good food and beverage market.
Competitiveness increases as the number of restaurants increase in the local
context. In Sri Lanka, Total number of registered restaurants with SLTDA is 498.
Among them, 399 (80%) restaurants are Grade A, while 99 (20%) are Grade B
restaurants as at end 2018. “Most hoteliers still not familiar with RevPAR concept
and using wrong determinants to determine RevPAR” as cited in

Foreign Relations and International Economic Repositioning
343
(Anastassopoulos et al.2009) it is similar to restaurant industry. Restaurant’s
managers and owners are still not familiar with RevPASH concept and using
wrong determinants to determine RevPASH.
This study aims to identify the relationship between restaurant demographics and
RevPASH of registered tourist restaurants in Colombo district.
Research Problem and Objective
Most of the researchers have presented diverse perspectives on various
determinants influence on a firm’s performance. In one hand, outside the firm,
researchers have pay attention on sectors and markets seeking to understand how
their structure influences productivity and inside of the firm, beholding for
determinants to set strategic decisions by evaluating performance metrics and
functional choices. Researchers have identified the Revenue Management as a
good method to improve performance of a service based organization with
limited capacity. Consequently, RevPASH is one of the best methods to evaluate
the performance of a restaurant, which is still under researched and rarely
practiced in many developing countries including Sri Lanka. Most restaurant
managers and owners are still not familiar with RevPASH concept and they fail
to select right determinants to determine RevPASH.
Hence, this research was intended to identify the relationship between restaurant
demographics and RevPASH in registered tourist restaurants in Colombo district,
Sri Lanka.
Methodology
The current study was conducted as a quantitative study and used a structured
questionnaire as the data collection technique. The questionnaire was subdued of
size, grade, age, services and facilities, location and RevPASH data. These data
measured over the period of last financial year (2018) for 75 registered
restaurants which were located in Colombo district. Restaurant size was
measured by the number of employees and number of covers, Age measured by
establishment year, Grade measured by A or B, services and facilities measured
by availability of security service, Wi-Fi facility, entertainment facility and
parking facility and location measured by centrality and distance to the main road.
Based on the research objective, target population of this study is all registered
tourist restaurants in Sri Lanka. Total of 75 SLTDA registered tourist restaurants
in Colombo district were selected as the study sample using convenient sampling

Sri Lanka Economic Research Conference 2020
344
technique. Descriptive statistics and correlation analysis were used to analyse
the data with the support of SPSS 22 version.
Results and Discussion
Nature of the Determinants of RevPASH
The determinants of RevPASH were identified under four elements as location,
age of the restaurant, grade of the restaurant, size of the restaurant as well as
facilities & services offered in the restaurant. Accordingly, the descriptive
statistics presented in table 1 explain the current level of those determinants.
Table 1: Descriptive Statistics for the Determinants of RevPASH of Tourist
Restaurants (N=75)
Source: Based on SPSS output of survey data in 2019
According to the results, out of total restaurants in the sample, 81.33 per cent
were ‘A’ grade and 18.67 per cent ‘B’ grade restaurants. Further, 5.33 per cent of
restaurants were started in 1970-1980, 4 per cent in 1981-1990, 16 per cent in
1991-2000, 36 per cent started in 2001-2010 and 38.67 percent of restaurants
were started in 2011-2019. Moreover, 49.33 per cent of restaurants were not
refurbished at all whereas 30.67 per cent were partially refurbished and 20 per
cent of restaurants were fully refurbished. Considered to the location of the
restaurant, 64 per cent of were located in urban area, 25.33 per cent in suburban
area and 10.67 per cent were in rural area. Further 66.67 per cent of restaurants
situated in zero distance to the main road (at road side with a very close
proximity), 21.33 per cent situated within less than 100m distance to the main
road, 8 per cent within 101m - 200m, 1.33 per cent within 301m - 400m from the
main road and 2.67 per cent of restaurants situated within 401m - 500m distance
from main road. 57.33 per cent of restaurants offer security service, Wi-Fi
facility, entertainment facility and parking facility, 25.33 per cent offer three
facilities out of four, 12 per cent of restaurants offer two services and facilities
out of four, 4 per cent of restaurants offer only one service and facility and rest
Determinants of RevPASH Mean SD
Distance to the main road (m) 43.80 104.023
Restaurant age (years) 13.28 10.184
Total covers 99.93 44.128
Total employees 16.40 7.552

Foreign Relations and International Economic Repositioning
345
of 1.33 percent of restaurant were not offering any services and facilities out of
four services and facilities.
Relationship between RevPASH and its Determinants
Karl Pearson coefficient of correlation analysis was utilized to measure the
strength of relationship between RevPASH and its determinants (size, grade, age,
services and facilities and location). Table 2 presents the results of correlation
test and has indicated a highly significant relationship between number of
employees of the restaurant and RevPASH, services & facilities and RevPASH,
as well as Centrality (locating the restaurant at a closer proximity to the center of
city) and RevPASH whereas the restaurant grade also indicated a relationship
between Grade of the Restaurant and RevPASH.
Table 2: Correlation between RevPASH and its determinants
Attributes Pearson
Correlation
P-value Nature of Relationship
with RevPASH
No of employees 0.448** 0.000 Weak Positive
Relationship
No of covers 0.187 0.108 No Significant
Relationship
Restaurant Grade -0.219 0.060 No Significant
Relationship
Established year 0.030 0.797 No Significant
Relationship
Refurbishment -0.047 0.688 No Significant
Relationship
Services and
facilities
0.285* 0.013 Weak Positive
Relationship
Centrality 0.278* 0.016 Weak Positive
Relationship
Distance to the main
road
-0.155 0.184 No Significant
Relationship
N= 75
Note: ** p < 0.01; * p < 0.05.
Source: Based on SPSS output of survey data in 2019

Sri Lanka Economic Research Conference 2020
346
Accordingly, correlation between no of employees and RevPASH is 0.448
(0.3<0.448>0.49), implies a moderately positive relationship with the P value of
0.000 < 0.01. Accordingly, when the number of employees is increased in the
restaurant, the Revenue per Available Seat per Hour or the RevPASH of the
restaurant seems to be increased at a moderate level. The reason behind this
situation can be the efficiency of service with sufficient number of work force
during the operational hours may leads to serve higher number of guests using
same resources. If the guests are receiving the service faster, they may leave the
restaurant after the meal sooner, so that same space can be utilized for another set
of guests. However, the efficiency of employees is not measured here although it
is an important element in this context.
However, the total no of covers, grade of the restaurant, establishment year of the
restaurant, recent refurbishment of the restaurant, and the distance to main road
from restaurant had indicated no significant relationship with RevPASH with P
values greater than 0.05.
Services and facilities offered in the restaurant and centrality of the restaurant
location has indicated a week positive relationship indicating 0.285 and 0.278
correlation value respectively whereas the grade of the restaurant has a week
negative relationship with PevPASH. Accordingly, when the restaurant is located
closer to the city center, the RevPASH may be getting higher due to the attraction
and better accessibility. Further, when the facilities are available more and more,
the guest willingness to visit the restaurant, as well as facilitating more guests
with the support of other ancillary staff and facilities may encourage visiting the
restaurant as well as make easier to serve more guests within the time period.
Conclusion
Restaurant owners and managers in registered tourist restaurants in Colombo
district should pay more attention on the total number of employees in restaurant,
services & facilities of restaurant and centrality of the restaurant corresponding
to the location to increase the RevPASH of their restaurant in order to enhance
the revenue. When we increase the total number of employees in restaurant, we
can provide a high-quality service within a short period of time. That will
automatically increase the customer satisfaction and number of returning
customers. It enhances the RevPASH of the restaurant. When we offer various
kinds of services & facilities to the customer such as Security service, WiFi
facility, Entertainment facility and parking facility, it will increase the customer
satisfaction and number of returning customers. It also enhances the RevPASH

Foreign Relations and International Economic Repositioning
347
of the restaurants. We have to consider the centrality of the restaurant
corresponding to the location. Being centralized in an urban area will be a good
opportunity to become more attractive among the customers because of the ease
of accessibility. It will also be helpful in promoting the restaurant among various
types of customers. It will also enhance the RevPASH of the restaurants.
Keywords: Restaurant industry; Revenue management; RevPASH; Performance
metric
References
Evidence from Greece. International Journal of Hospitality Management, 28(2), pp.185-
194
Sainaghi, R. (2011). RevPAR determinants of individual hotels. International Journal of
Contemporary Hospitality Management, 23(3), pp.297-311.
Hayes, D. and Miller, A. (2011). Revenue management for the hospitality industry.
Hoboken: J. Wiley & Sons.
Thompson, G. (2010). Restaurant Profitability Management. Cornell Hospitality
Quarterly, 51(3), pp.308-322.
Karunarathne, A.C.I.D. (2020). An empirical investigation on decisiveness and usage of
revenue management techniques in hotel industry in Sri Lanka. International
Journal in Management and Social Science. Volume 8. pp.52-80.
Kimes, S., Chase, R., Choi, S., Lee, P. and Ngonzi, E. (1998). Restaurant Revenue
Management. Cornell Hotel and Restaurant Administration Quarterly, 39(3),
pp.32-39.
Kimes, S. (2004). Restaurant Revenue Management. Cornell Hotel and Restaurant
Administration Quarterly, 45(1), pp.52-67.
Sltda.lk. (2019). Tourism Research and Statistics | Sri Lanka Tourism Development
Authority. [online] Available at: http://www.sltda.lk/statistics

Sri Lanka Economic Research Conference 2020
348

349
Strategic Marketing for Growth

Sri Lanka Economic Research Conference 2020
350

Strategic Marketing for Growth
351
EFFECTS OF CONSUMER PERCEPTIONS ON
GREEN MARKETING MIX IN CONSUMER PURCHASE
INTENTION OF FAST-MOVING CONSUMER GOODS
Sivashanker R. Sussex International College, Kiribathgoda, Sri Lanka.
Introduction
The business world encounters that environmental issues are becoming as severe
global issue. All most all the governments around the world have concerned
about green marketing activities that they have attempted to regulate. Green
marketing came into prominence in the late 1980s and early 1990s. It was first
discussed much earlier. The American Marketing Association (AMA) held the
first workshop on "Ecological Marketing" in 1975. When we consider the green
product it can be referred to as any products that are manufactured through green
technology and that caused no environmental hazards are called green products.
Like many Asian countries, Sri Lanka suffers from increasing levels of air toxic
waste, exposure to severe road traffic noise, high levels of garbage deposal and
rapidly lessening landfill space in most of the urban areas. Nearly 30% to 40%
increment seen in green trading growth in the Sri Lankan context. In deed this
can be a processing stage of the green revolution of Sri Lanka (Samarasinghe,
2012).
Specifically, in the Sri Lankan framework, there is a rise in green trade virtually
by 20 – 22% compared to the last five years in fast-moving consumer goods trade
(Wanniarachy, 2016). Green marketing mix influences groups of consumers
based on their differed perception of green knowledge. Consumers would act
differently due to their varied perception of green products, green price green
place and green promotion. At the same time, they would reflect from their
demographical factors such as sex, education, income, age, subjective norm,
attitude and perceived behaviour.
Research problem
Most of the retailing sectors are highly focused on green certification, green
promotions and labelling in order to fulfil the consumer demand. Voluminous
Consumers are intending to purchase environmentally friendly goods. To what

Sri Lanka Economic Research Conference 2020
352
extent green marketing mix influences on consumer perception towards their
purchasing intention.
Research questions
The basic research questions can be stated as
• Why retailers are concerning to display green labels and green brands of
their fast moving consumer goods?
• Do green place, green promotion and green price influences on consumer
perception on purchase intension of fast-moving items?
• How demographic factors such as age, sex, income, educational level and
green knowledge are influencing on Consumer Purchasing Intention on fast
moving consumer goods?
• Which is the most influential behavioural factor affecting to Intention on
purchasing?
The willingness of a customer to buy a certain product or a certain service is
known as purchase intention. Purchase intention is a dependent variable that
depends on several external and internal factors. The research investigates
whether the purchasing intention on FMCG is influenced by green marketing
tools as eco-labelling, eco-standards and certification, eco-branding and green
marketing mixtures and how the consumer perception functions towards purchase
intention.
Objective of the research
There are primary as well as secondary objectives to be expected as the
outcome of the research. The primary objectives of this research are
• To assess the positive and negative perception of green label, and green
brand of consumers’ purchase intention
• To identify the relationship of consumer perception on the green place
green price and green promotion for the purchase intension of fast-moving
goods.
• To identify the relationship between demographical factors such as age,
sex, income, educational level, green knowledge of consumers and purchase
intention

Strategic Marketing for Growth
353
• To investigate the most influencing factor in the theory of planned
behaviour such as attitudes, subjective norms and perceived behavioural control
for customers’ Intention of purchase
As the secondary objective, the identification of effective marketing tool and a
demographical factor can be an informative fact to the marketers, manufactures
and distributors as to influence green trading
Literature review
The coverage of green marketing on fast moving consumer goods is distinct in
present contemporary market. Understanding the green marketing implications
through researchers’ measures and identifying the literature gap can be resulted
as the expected outcome of this research. The study of consumer attraction on
green products (W.M.C.B. Wanninayake & Pradeep Randiwela, 2015) reveals
that the green products have substantial awareness among Sri Lankan customers
and they are willing to pay something more on green products. The majority of
customers considered that package is most important element of such products.
The study of factor analysis on green consumer goods (Prof.Siddharth Sriram,
2017) indicates that there is a stronger positive correlation among CSR and
consumer purchase intention.
The investigation of consumer purchase intention on fast-moving consumer
goods (Bansal, P. & Roth, K., 2000) identifies the interrelationship between the
consumer willingness and green products. The Findings of the study (Bryman, A.
&. B. E., 2011) show that, age and education have positive relation with Eco-
literacy. Socio demographic variables are not significantly related with green
purchase intention. Besides this Environmental advertisements, Price and
Ecological packaging were found to be attributes for Consumer buying
behaviour. (Berry,A, & Rondinelli, D , 1998). The influences of the subjective
norms and democratically factors on green consumer goods need to be focused
efficiently as to fill the research gap.
Methodology
Consumer purchasing intention has been linked with demographical and green
marketing factors in many ways (Brian bell 2014). The developed empirical
model has been used to build relationship between key variables of green
marketing tools green marketing mixture and green trust instruments
(independent variable, customer purchasing intention (dependent variable)

Sri Lanka Economic Research Conference 2020
354
demographical factors (intermediate variables). Data analysis includes
descriptive as well as inferential approaches.
Source: (Brian Bell, 2004)
Figure 01: Conceptual Framework
Location of the study
This study basically examines the green marketing implication in Negombo
Divisional secretariat. The area of Negombo is located in western province in Sri
Lanka under District of Gampaha, including the population approximately
142,136 with 68600 males and 73,536 females.
Sampling framework
Out of these 452 registered retailing outlets there are 90 outlets have been chosen
whereas 270 respondents will be testified for this analysis using “convenient
sampling” technique thorough disproportionate method is used.
Data collection
The research method used for this research was a cross-sectional research design
since the survey based analysis is being held in the retailing field. The
questionnaire includes 30 close- ended questions in order to testify the out.
Collected data were analyzed through descriptive and inferential approaches. The
statistical significance of relationships among the selected variables was
determined using the Fisher’s exact test.
Independent variable
• Green marketing instrumenrts
Intermediate variables
• Demographical factors
Dependent variables
• Consumer purchasing intention

Strategic Marketing for Growth
355
Data analysis and conclusion
Based on the above empirical findings, it is evident that in Negombo context,
consumer’s income, eco literacy education level is significant demographic
variables for green segments. The findings revealed the importance of promotion
through media as well as reference of peer groups has positive effects as we found
a relationship with the purchase intention of green products. Word of mouth as
through family and peer group really matters, in the responses of our
questionnaire we found that people pay much attention to the opinion of their
family and friends concerning green products as well as they recommend them
to others. Consumers concerned about the environment but as they have become
more sophisticated, they require clear information about how choosing one
product over another will benefit the environment. Consumer education results
in their empowerment. Empowered consumers choose environmentally
preferable products when all other factors are equal (table 01).
Table 01: Coefficients and correlations
Model variables Standardize
d coefficient
t- value P -value
(Constant) 0.368 1.612 0.108
Green labels 0.254 2.082 0.039
Green brand 0.097 1.267 0.020
Green price -0.318 -2.962 0.003
Green place 0.101 1.405 0.162
Green promotion 0.113 0.971 0.033
Age 0.540 0.618 0.538
Sex -0.084 -1.177 0.322
Education 0.169 2.091 0.038
Income 0.034 0.298 0.766
Green knowledge 0.036 0.438 0.036
Subjective norms -0.017 -0.231 0.818
Perceived behavioral
control
0.165 2.236 0.027
Attitude 0.031 0.425 0.067
Source: Author’s estimation

Sri Lanka Economic Research Conference 2020
356
Ultimately green marketing requires that consumers to think Green, think clean,
and Ecofriendly. Consumers prefer the eco-friendly products even at premium
price. The Marketers and retailers need to be more vigilant on introducing green
products and green trading practices as to influence and encourage green
purchase. When green awareness is inculcated in the society the sustainable
development would take place.
References
Robin Weng, H., Chen., & Chen, D. (2015). Effects of Green Innovation on
Environmental & Corporate performance.
Abrohamson, E., & Rosenkopf, L. (1993). Institutional and Competitive band wagons.
Using mathematical modeling as tool to explore innovation diffusion (pp. 487-
517).
Backer, L. (2007). Engaging stakeholders in corporate environmental governance
Bansal, P., & Roth, K.. (2000). Why companies go green. A model of ecological
responsiveness (Acad.Manag.pp. 717- 736).
Bernauer, T., Engel, S., Kammerer, D. & Sejas Nogareda, J. (2007). Explaining green
innovation. Ten years after Porter's win win proposition(study the effects of
regulation on corporate environmental innovation).
Wanniarachi,A. (2016). Effects of consumer perspectives for fast-moving consumer
goods.
Chen, Y. S., Groove,S. (2009). The positive effect of green intellectual capital on
competitive advantages of firms.
Siddharth S.S,.(2017). Factor analysis of consumer purchase intention.
Chious, T. Y., Chan, H. K., Lettice, F. & Chung, S. H.(2011). The influence of greening
the suppliers and green innovation on environmental performance and competitive
advantage in Taiwan (Online).

Strategic Marketing for Growth
357
DETERMINANTS OF DEMAND FOR SKILL LEVEL
BASED LABOUR MIGRATION IN SRI LANKA
Rathnayaka, I.W.*, Dilrukshi, M.H.S.
University of Colombo, Sri Lanka *Corresponding author: [email protected]
Introduction/Background
A demographic change with population ageing and a decline of the workforce,
and a fragmented labour market is characterised by high unemployment level for
low-skilled people and a simultaneous shortage of skilled workers. A large
number of policy makers consider that labour mobility creates an answer to reach
full employment level in several countries in the world. Theoretically, labour
mobility should enable workers to move from a country to another in order to
reduce unemployment in countries where high unemployment rates prevail, and
offer a new labour force where there is a lack of workers. The Demand for Labour
might be definite as the economic necessity of people able to work (Dolny, et all,
1998).
Sri Lanka has experienced varying forms of labour migration during the post-
independence era. After the three decades of’ civil conflict, Sri Lanka became
one of the contemporary world’s major emigration nations. According to the
United Nations (2013) 1.25 million of Sri Lankan–born persons living outside of
their country of birth and it was equivalent to 5.9 percent of the current Sri Lankan
resident population. Meanwhile more than one million Sri Lankan citizens are
estimated to have moved for targeting for a foreign employment opportunity.
Especially with the opening of the Sri Lankan economy, international labour
migration has increased during the last three decades gradually (Ramanayake and
Wijetunga,2018). Recent estimates suggest that over a million migrants work
abroad while the annual reported outflows are about 200,000 persons (Haas,
2011). Every year, substantial inflows of remittances were generated by foreign
employment and, represented as a safety valve for local unemployment.
Remittances now obviously play a significant role in terms of exports and share
of GDP and are vital for the economic health of the country. Consistent with
Siddique et al. (2012), found that migrant workers’ remittances significantly
support economic development in Sri Lanka. Greater amount of labour mobility
for workers in developing countries could have a more impact on economic

Sri Lanka Economic Research Conference 2020
358
development than any other policy intervention. Today, increasing mobility
levels of labour constitutes a challenge to the host country. Meanwhile if workers
were allowed to fill specific labour shortages, the host countries would be also
broadly benefitted. On the other hand, immigration and migration policies should
represent logical and rational strategic approaches to mitigate the complexities
among the countries. Therefore, it is an important factor in the study of demand
determinants of international labour mobility in Sri Lanka, because it looks at
how labor, one of the major factors of production, affects growth, production,
unemployment and world economic stability.
Further, the income differentials of countries create impacts on migrant flows.
When income differentials increase, it produces larger incentive to migrate to
beneficially country. The reverse holds true when income differentials decrease.
Therefore, income levels and income differences are naturally considered among
the most important determinants in the decision to migrate. Access to the benefits
system of host countries plus welfare benefits, state education, housing and health
care services create the positive impact on the migrate for a foreign employment.
Meantime, deference’s between labour demand between nations, in particular for
younger workers, to build new skills and qualifications and develop networks
also generate more attention.
Research Objectives
Main Objective
The main objective of this study is to empirically examine the strategic priority
factors that accountable for labour demand for international labour mobility of
2007 to 2016 in Sri Lanka.
Specific Objectives
1. Identify the dynamic response of Sri Lankan labour mobility to labour
demand shocks of host countries.
2. Examine the determinants of labour mobility and their impacts on Sri
Lankan skilled labour migration.
Research Methodology
Since the study mainly based on secondary data quantitative methods were used
by analyzing international labour mobility within the broader with the context of
all migrations from Sri Lanka to foreign countries. It may include official
statistics and draw upon relevant information developed by other international

Strategic Marketing for Growth
359
organizations and local stakeholders. This study is concerned with the
determinants of demand for skilled migration from Sri Lanka to the world
between 2010 and 2018. The dependent variable Wi is the number of skilled
migrants all over the world from Sri Lanka in year t.
The following data series were obtained for each origin country Wi, Skilled
labour migration from Sri Lanka to world at year t. GPC is GDP per capita of Sri
Lanka in year t, LR is the Literacy rate in Sri Lanka in year t, WKPP is the
working Population of Sri Lanka in year t. Further, UE is the Sri Lankan
Unemployment rate year t and εit is the error term.
Wit = β0 + β1GCP + β2LR+ β3WKPP + β4UE + εit
Findings and Discussion
Labourers in low-income countries like Sri Lanka are keen to earn a high amount
of income by employing quality and better job fields in different countries. Due
to this reason, approximately every economic situation of international labour
mobility incorporates income differentials and other economic factors in a given
period. Therefore, several key economic factors are creating push and pull impact
on international labour mobility.
Source: SLBFE, (2017)
Figure 01: Number of Job Orders (vacancies) and Departures though
registered Sources by Manpower Skilled Levels
020000
40000
60000
80000
100000120000
140000
160000
180000
Skile
d
Sem
i Ski
led
Un
skill
ed
Skile
d
Sem
i Ski
led
Un
skill
ed
Skile
d
Sem
i Ski
led
Un
skill
ed
Skile
d
Sem
i Ski
led
Un
skill
ed
Skile
d
Sem
i Ski
led
Un
skill
ed
2012 2013 2014 2015 2016
Job Orders Departures

Sri Lanka Economic Research Conference 2020
360
The above diagram illustrates the number of work positions (vacancies) and
departures through registered sources by skilled levels in Sri Lanka from 2012 to
2016. There is a significant mismatch between labour demand and supply in the
context of labour migration. It indicates that Sri Lanka was unable to absorb the
considerable amount of overseas job opportunities via filling the Sri Lankan
labours. This gap between labour demand and supply for skilled and unskilled
workers may arise due to various economic and social factors. The lack of
competence and knowledge of workers in the local labour market would be one
of the key sources for creating this gap. On the other hand, for some job categories
existing labour force was not adequate to meet even the need of the local labour
market can be another reason for that.
According to the foreign labour demand by manpower level, the skilled level job
categories sustained to continue as the highest labour demand category among all
manpower categories of migrant workforces. Further, the demand for unskilled
labor also provided a considerable amount of supply from 2012 to 2016.
The above data demonstrate that, as a developing country, Sri Lanka was unable
to address the demand for foreign job opportunities to a considerable level due to
a lack of competence and skills in manpower in the domestic labour market.
There is an overall shortage of migrant labours from Sri Lanka. Most of the time,
Sri Lankan migrants were often unskilled or not equipped with skill sets that are
in demand.
The unit root test: since the assumptions for the classical regression model require
that both variables be stationary and that errors have a zero mean and finite
variance. The unit root test is evaluated using the Augmented Dickey-Fuller
(ADF) test. logWit = 2.485 + 0.851GCP + 0.751LR+ 0.68WKPP + 0.689UE + εit
The OLS estimates that while the host country Per capita growth rate is a
significant determinant of skilled migration in Sri Lanka. The amount of working
population of Sri Lanka is also significant, as is the lagged dependent variable.
Change in the Sri Lankan unemployment rate has a positive coefficient and is
significant at 0.1 level. In addition to that, the literacy rate of Sri Lanka became
significant and has a positive coefficient for labour migration. The higher level
of literacy rate of Sri Lanka provided more skilled workers to the international
labour market.

Strategic Marketing for Growth
361
Conclusion and recommendations
The differences in demand for skilled migration flows in Sri Lanka tend to be
dominated by mainly economic conditions like per capita income of the host
country and human capital development, Unemployment rate, rise of the
working-age population in the home country are determined the demand for
international labour. On the other hand, keeping legislative and economic
stability, its good recruit aspects in the employment market also draws the skilled
migrants to high labour supply countries. However, the market requirement for
skilled migration from low-income countries needs to continue or increase the
number of skilled migrants to especially to developed and industrial countries.
Keywords: Labour Demand; Migration; Skilled Labour; Unemployment
Reference
Dolny E., Meller J., Wiśniewski Z., (1998), Popyt pracodawcy na rynku pracy wPolsce,
Toruńska Szkoła Zarządzania, Toruń.5.
Haas, H. (2011). The determinants ofinternational migration. University of Oxford.
Nations, U. (2013). International Migration Report. , New York: Department of
Economic and Social Affairs, United Nations.
Ramanayake, S. S., & Wijetunga, C. S. (2018). Sri Lanka’s Labour Migration Trends,
Remittances and Economic Growth. South Asia Research, 38(3_suppl), 61S-81S.
https://doi.org/10.1177/0262728018792088
Siddique,A., Selvanathan, E. A., Selvanathan, S. (2012) Remittancesand Economic
Growth: Empirical Evidence from Bangladesh, India and Sri Lanka, The Journal
of Development Studies, 48:8, 1045-1062, DOI: 10.1080/00220388.2012.663904
Sri Lanka Economic Research Conference 2020
362
IMPACT OF GREEN SUPPLY CHAIN MANAGEMENT
PRACTICES ON OPERATIONAL PERFORMANCE OF
APPAREL EXPORTERS IN SRI LANKA
Ranasinghe, R.A.S.N.*, Cooray, N.H.K.
Rajarata University of Sri Lanka, Mihintale, Sri Lanka. *Corresponding author: [email protected]
Introduction
In the Sri Lankan business context Green Supply Chain Management (GSCM)
practices and operational performance play a significant part as most of the
stakeholders highly concern about maintaining an eco-friendly environment
while increasing their organizational operational performance. Due to the
environmental issues that occurred in the process of delivering the products to
the end users, the concept of GSCM has become a hot topic among the
researchers today more than ever before. According to Tsenga et al. (2019) most
of the organizations are now trying to minimize environmental impact by
combining environmental concern into their supply chain operations.
Manufacturing sector has been more focused on this GSCM context than the
other business sectors, because most of the air, water, environmental pollution
can occur due to such sectors. When Sri Lankan context is considered, the
manufacturing industry plays a foremost part regarding the development of Sri
Lankan economy. Central Bank Of SriLanka (2019) stated that 44.7% of the
export composition in the Sri Lanka in 2018 is based on textile and garments.
According to the apparel sector in Sri Lankan economy is at a considerable
position and it should be focused more their attention on environmental and social
concepts to achieve sustainable development.
Research problem
Today the environmental thinking-based organizations are doing a massive
revolution in the business sector. As customers are more rational, they consider
the contribution which is given to the environment when manufacturing products.
And also, due to the increment of environmental issue, customers pay much
attention to what kind of product they are purchasing and from whom. So as a
solution GSCM has been introduced to different business sectors. Though the
business sector tries to use GSCM as a solution to reduce the environmental
issues, they have a problem regarding the impact which is emerged by GSCM
practices on organizational performance. According to the idea of Muthuka &

Strategic Marketing for Growth
363
Nyamwange (2015), the relationship between GSCM practices and operational
performance is not very clear and there is a shortage of consensus regarding the
impact of GSCM on organizational performance outcomes.
Objectives
The main objective of the study is identifying the impact of Green Supply Chain
Management practices on operational performance of apparel export
manufacturing companies in Western province in Sri Lanka.
Specific Objectives of the study are as follows;
Identify the different green supply chain management practices
Identify the level of impact of each Green Supply Chain Management
practices on operational performance
Identify the most significant Green Supply Chain Management practice
affects for the operational performance
Methodology
As the main objective of the research is to identify the impact of GSCM practices
on operational performance in the Sri Lankan apparel export manufacturing
industry, the population has been taken as the managers of apparel export
manufacturing companies who are practicing GSCM in Sri Lanka.
Though there are no clear statistics regarding the apparel manufacturing
companies who are practicing GSCM, under International Standard
Organization’s (ISO) statistics in 2015 there are 55 apparel manufacturing
companies in Sri Lanka, who certified under ISO 14001- Environmental
Management System. Therefore, it can be taken an idea about the apparel export
manufacturing companies who are practicing GSCM in Sri Lanka.
As the researcher has no idea about the number of managers in each and every
company and also about the companies who implement GSCM practices,
convenience sampling, which comes under the non-probability sampling
technique was used. Here researcher has taken only the Western province into
consideration as it is given a massive contribution to the apparel industry in Sri
Lanka. When selecting the sample size, the researcher has used 10 times rule
method. Under that, Kock (2018) said that 10 times rule is one of the most
commonly used method to estimate the minimum sample size of a research.10
times rule can be calculated by multiplying the maximum number of latent

Sri Lanka Economic Research Conference 2020
364
variables in the model from 10. As the maximum latent variables in this model is
5, the minimum sample size under 10 times rule can be estimated as 50.
Therefore, the sample size of this research study is 54 managers of apparel export
manufacturing companies in the Western province in Sri Lanka.
Primary and secondary data were utilized by the researcher and data for the study
was collected through a questionnaire developed by the researcher and the
questionnaire was distributed among the managers in apparel export
manufacturing companies which practice GSCM. The questionnaire adopted
five-point Likert scale (1= Strongly Disagree, 2= Disagree, 3= Neutral, 4= Agree,
5= Srongly Agree) as the rating scale.
Source: Ranasinghe (2020)
Figure 1. Conceptual framework
Results and Discussion
Cronbach’s alpha value was recorded beyond the 0.7 and all the variables are in
the acceptable region.
As the research hypothesis in this study is based on the type of impact and degree
of impact of each and every independent variables on dependent variable
separately, multiple regression analysis was used as the testing tool.
R2 of this study was 0.528 and it represents that if the operational performance of
apparel export manufacturing companies in Western province change from
100%, 52% of it changes due to the internal environmental management practice,

Strategic Marketing for Growth
365
green purchasing, cooperation with customers, eco-design and investment
recovery (independent variables).
As per the results, the estimated regression model can be developed as follows.
𝑂𝑃 = 𝛼 + 𝛽1𝐼𝐸𝑀 + 𝛽2𝐺𝑃 + 𝛽3𝐶𝑊𝐶 + 𝛽4𝐸𝐷 + 𝛽4𝐼𝑅
𝑂𝑃 = 1.371 − 0.224𝐼𝐸𝑀 + 0.457𝐺𝑃 + 0.226𝐶𝑊𝐶 − 0.035𝐸𝐷 + 0.192𝐼𝑅
According to the above multiple regression analysis, the hypotheses were tested
and out of five hypotheses only three were accepted and two were rejected. Under
that, it was found that three practices (green purchasing practice, cooperation with
customer practice and investment recovery practice) have a significant and
positive impact, while rest of the two practices (internal environmental
management practice and eco-design practice) are having a non-significant and
negative impact on operational performance.
Conclusion
Based on the above findings of this study it was revealed that green purchasing
has highest ability to impact on operational performance than the other practices.
Eco-labeling and ISO 14001 certification of suppliers, suppliers’ environmental
friendly practices highly concern for the increment of operational performance
through one of the GSCM practice, green purchasing.
In order to have a strenghtful operational performance, cooperation with a
customer also can be involved as it is positive and significant impact on
operational performance. As the customers are more rational with eco-friendly
OP = Operational Performance
𝛼 = Intercept
𝛽1 𝛽2 𝛽3 𝛽4 𝛽5 = Coefficient of Variables
IEM = Internal Environmental Management
GP = Green Purchasing
CWC = Cooperation with Customer
ED = Eco-Design
IR = Investment Recovery

Sri Lanka Economic Research Conference 2020
366
productions, interacting and retaining customers while practicing GSCM
practices is more important for the increment of operational performance.
Strong investment recovery is essential to achieve improvements in operational
performance under the implementation of GSCM practices. In order to that,
selling excess inventories, materials and equipment are more supportable for
operational performance of organizations.
This study was limited to the Western province in Sri Lanka and it is suggested
to carry out similar type of study in other provinces in order to further validation
of findings. Future research can be implemented by considering other industries
to gain much more understand about the impact of GSCM practices on
operational performance. In addition to that future researchers can conduct by
focusing on another organizational performance instead of operational
performance.
Keywords: Cooperation with customers; Eco-design; Green purchasing;
Internal Environment Management; Investment recovery; Operational
performance
References
Central Bank Of SriLanka. (2019). Annual Report 2019-External Sector Developments
and Policies 5 5.1.
Kock, N. (2018). Minimum sample size estimation in PLS-SEM : The inverse square root
and gamma-exponential methods. Journal of the Association for Information
Systems, 28(1), 227–261. https://doi.org/https://doi.org/10.1111/isj.12131
Muthuka, U. M., & Nyamwange, O. (2015). Green Supply Chain Management Practices
and Operational Performance of Commercial Bank In Kisumu.
Tsenga, M.-L., Islamb, M. S., Kariab, N., Fauzib, F. A., & Afrind, S. (2019). A literature
review on green supply chain management : Trends and future challenges
Resources , Conservation & Recycling A literature review on green supply chain
management : Trends and future challenges. Journal of Resources, Conservation
& Recycling, 141, 145–162. https://doi.org/10.1016/j.resconrec.2018.10.009

Strategic Marketing for Growth
367
3PL INDEX: MEASURING THE SATISFACTION OF 3PL
CUSTOMERS IN SRI LANKA
Premarathne, W1*., Gunaruwan2, L., Weerawardane, T.L.3 1Department of Management and Finance, Kotelawala Defence University, Sri Lanka
2Department of Economics, University of Colombo, Sri Lanka 3Alaris Lanka (Pvt.) Ltd., Sri Lanka
*Corresponding author: [email protected]
Introduction
Businesses operate in a more complex and highly dynamic environment and
customers are more knowledgeable and informative than before. Customers exert
immense pressure on the businesses by requiring quality products at affordable
prices. As a result, businesses must pay more attention to the production process
to develop quality products at low prices to satisfy customers. Therefore, most
businesses outsource their non-core activities to third party logistics providers
(3PLs). Outsourcing logistics activities to 3PL service providers mainly help to
reduce logistics costs and to improve focus on the production process and new
product development process. Outsourcing of logistics services has now been
around for over three decades. It has been experienced that outsourcing can
benefit an organization immensely (Harrington et al., 2004). However, this will
only be true if the correct activity is chosen for outsourcing, with a well-
maintained procedure, the right partner selected, performance and compliance
constantly monitored.
Capgemini Consulting (2009) identified openness, transparency, good
communication, personal relationships on an operational level, flexibility of 3PLs
to accommodate customers’ needs, effective partnering and collaboration
between customer and 3PLs, achieving target cost reductions, achieving
improvements in service levels, peer-to-peer relationship on executive level,
providing guidance and sponsorship, the capability of the 3PLs to provide
valuable ideas for supply chain improvement and innovation, willingness of 3PLs
to share risk, and financial arrangement for compensating as the expectations of
3PL customers form the 3PL providers. Georgia Tech & Capgemini Consulting
(2005) discovered that proven results and performance, trust, openness and
information sharing, solution innovation and relationship reinvention, ongoing
executive level support, service offering aligned with customer strategy and deep
industry knowledge are the expectations of 3PL customers from 3PL providers.

Sri Lanka Economic Research Conference 2020
368
The most important dimension in marketing is customer satisfaction. Companies
use customer satisfaction to evaluate their business performance and
effectiveness. Marketing managers intended to invest more funds to increase
customer satisfaction for their product or services. Customer satisfaction can be
identified as customer’s complete or global opinion concerning the level to which
the actual performance product or service tallies the pre-defined expectations
(Stank et al., 1999; Anderson & Sullivan 1993).
Bolton & Drew (1991) have elaborated that customers' evaluation of service
value can affect purchasing intentions and consumer behaviour. Furthermore, it
has been identified that there is a relationship between customer satisfaction and
future intentions (Bearden & Teel, 1983; Oliver, 1980). Consumers’ viewpoint
on substitute attractiveness and joy could be a conclusive factor for customers to
shift (Anton et al., 2007).
Anton et al. (2007) has stated that poor service quality influences customer
intention to withdraw from the relationship or to shift to alternatives. Rahman &
Azhar (2011) found that high switching activities of consumers are to be noted in
both developed and developing economies. Oliver (1981) and Walsh et al. (2006)
stated that customer satisfaction has a negative relationship with the intention to
switch. Langley et al. (2003) uncovered those customers who are satisfied with
their 3PL providers gave positive responses when they were questioned whether
they intended to use third party services over the next 3-to-5-year period.
Research Problem
The third-party logistics market in Sri Lanka is fragmented with few major local
players dominating the scene. Level of satisfaction and trust towards the service
providers are not considerably high in Sri Lanka (De Alwis, 2016). Cost, lack of
control, lack of coordination and lack of cooperation, lack of skills and
knowledge, lack of industry knowledge, and trade union activities are identified
as problematic areas in the 3PL market in Sri Lanka.
There is a service gap between customer expectations and what they are
experiencing in the 3PL market in Sri Lanka (Malkanthie & Jayamanna, 2016).
Premarathne (2012) highlighted that the 3PL providers are not responding well
to the expectations of 3PL customers in Sri Lanka. Further, no attempts can be
found in the literature on measuring the level of satisfaction of 3PL customers in
Sri Lanka. As a consequence, although the logistics outsourcing market has
developed up to 7PL in the world, Sri Lanka outsourcing market is still at the 3PL
stage.

Strategic Marketing for Growth
369
Objective
The objective of the study is to develop an index to measure the satisfaction level
of 3PL customers in Sri Lanka.
Methodology
The 3PL index to measure the level of satisfaction of the 3PL customers was
constructed based on selected nine variables: openness and transparency
(OPNTR), good communication (GDCOM), flexibility of 3PL to accommodate
customers’ needs (FLXCN), effective partnering and collaboration between
customer and 3PL provider (EFCOL), achieving target cost reductions and
improvements in service levels (ACTRG), customer relationship (CUSRL),
willingness of 3PL provider to share risks (WILSR), financial arrangements and
compensates (FACOM), and trust (TRUST). The variables were selected through
a comprehensive literature review. To obtain the 3PL index, the average
satisfaction score of each attribute (Ak) should be multiplied by the importance
weight of the attribute (Wk).
3𝑃𝐿 𝐼𝑛𝑑𝑒𝑥 = ∑ 𝐴𝑘𝑊𝑘
𝑚
𝑘=1
where,
Ak = satisfaction score for attribute k,
Wk = the importance weight (relative importance) for satisfaction attribute k,
m = number of satisfaction attributes,
After calculating the 3PL Index, the growth rate of customer satisfaction can be
calculated by utilizing the following formula.
3PL Index of the current year - 3PL Index of the last year Growth of Customer Satisfaction X 100
3PL Index of the last year=
A total of 200 leading companies (3PL customers) in Colombo district in Sri
Lanka participated in this survey. The sample of the study was selected randomly.
The five-point Likert scale developed by Likert (1932) has been used to gather
opinion for each question in the questionnaire and scores are given from strongly
disagree (1) to strongly agree (5). The reason for choosing a five-point Likert
scale was because research has shown that reliability in respondents’ perceptions
increases up to a level of five-points and then tapers off (Lissitz & Green, 1975).

Sri Lanka Economic Research Conference 2020
370
The target respondents typically hold the title of Senior Executive, Manager or
Director of the company. Steps have been taken to ensure the anonymous nature
of the questionnaire so that the responses are honest and unbiased. Interrater
reliability was assessed using Cronbach’s alpha (α).
Results and Discussion
Action diagram in figure 1 indicates the strong and the weak points of customer
satisfaction and define the required improvement efforts. The diagram is divided
into quadrants, according to performance (high/low) and importance (high/low)
that may be used to classify actions. The first action is Status quo (low
performance and low importance): Generally, no action is required. Action two
is Leverage opportunity (high performance/high importance): These areas can be
used as an advantage against competition. Action three is Transfer resources
(high performance/low importance): Company’s resources may be better used
elsewhere. And action four is Action opportunity (low performance/high
importance): These are the criteria that need attention.
PE
RF
OR
MA
NC
E
HIG
H
Transfer Resources
(high performance / low
importance)
Leverage Opportunity
(high performance / high
importance)
LO
W
Status Quo
(low performance / low
importance)
Action Opportunity
(low performance / high
importance)
LOW HIGH
IMPORTANCE
Source: Customers Satisfaction Council (1995)
Figure 1: Action diagram

Strategic Marketing for Growth
371
Figure 2 indicates the scatter diagram for the average importance and the
performance of the satisfaction levels of 3PL customers and the diagram was
divided into four quadrants based on the 50 percent average levels of performance
and importance.
Source: Survey data (2019)
Figure 2: Average importance and the performance of the satisfaction levels
of 3PL customers
Figur 2 highlights that financial arrangements and compensates (FACOM) and
the willingness of 3PL providers to share risks (WILSR) are shown just above
the border line of the Transfer Resources area (high performance / low
importance). According to the action diagram proposed by the Customers
Satisfaction Council (1995) company’s resources may be better used elsewhere.
However, all other variables are just above the borderline of the Leverage
Opportunity area (high performance / high importance). Those seven variables
can be used as an advantage against competition. As depicted in table 1, the
weighted degree of contribution to successful 3PLs experiences (satisfaction)
with providers (weighted expected experience) was multiplied by the actual
degree of contribution to successful 3PLs experiences with the main 3PLprovider
(perceived experience) to calculate the 3PL Customers’ Satisfaction Index (3PL
Index).
TRUSTOPNTR
ACTRGEFCOLCUSRLGDCOM
FLXCN
FACOM
WILSR
0
10
20
30
40
50
60
70
80
90
100
0 10 20 30 40 50 60 70 80 90 100 110Aver
age
Per
form
ance
(o
f sa
tisf
acti
on)
Average Importance (of satisfaction)

Sri Lanka Economic Research Conference 2020
372
Table 1: Calculation of the 3PL Index
Item of the
3PL Index
Weighted Importance/
Expectation (A)
(Percentage)
Perceived
Satisfaction
(B)
(percentage)
(A x B)
TRUST 16.42 52.50 8.62
OPNTR 15.81 50.40 7.97
ACTRG 15.44 52.70 8.13
EFCOL 13.23 54.00 7.15
CUSRL 9.64 54.70 5.27
GDCOM 9.21 56.80 5.23
FLXCN 8.97 51.50 4.62
FACOM 6.77 56.80 3.84
WILSR 4.52 51.70 2.33
Sum of (AxB) 53.18
3PL Index 53.18
Source: Survey data (2019)
According to the calculation in table 1, 3PL index for 2019 is 53.18%.
Conclusion
Trust (TRUST), openness and transparency (OPNTR), achieving target cost
reductions and improvements in service levels (ACTRG), and effective
partnering and collaboration between 3PL customer and provider (EFCOL) are
the significant contributing factors to the 3PL Index. The most important factor
was trust (TRUST). To improve the trust, 3PL providers should keep the
promises it makes to the firm, regardless of an oral agreement or written
contracts. The 3PL providers should ensure the confidentiality of the confidential
business information of the firm. The 3PL providers should practice sound
business ethics and follow its company code of ethics. The 3PL provider must
have a reputation for being honest, fair, reliable, and empathetic towards the
customers. The study shows that the proposed method can measure and analyse
customer satisfaction in a constructive way, and thus it may be integrated in 3PL

Strategic Marketing for Growth
373
customer’s total quality approach. The installation of a permanent customer
satisfaction barometer is considered necessary, given that it allows the
establishment of a benchmarking system (Edosomwan, 1993). Therefore, the
implementation of the 3PL Index method through a period can serve the concept
of continuous improvement.
Keywords: 3PL Index; Logistics Management; Outsourcing; Sri Lanka; Third
Party Logistics
References
Anderson, E. & Sullivan, M. (1993). The Antecedents and Consequences of Customer
Satisfaction for Firms. Management Science, 12 (2), 125-143
Bolton, R. N. & Drew, J. H. (1991). A Multistage Model of Customers’ Assessments of
Service Quality and Value. Journal of Consumer Research, 17 (4), 375-384
Capgemini Consulting (2009). The State of Logistics Outsourcing: 2009 Third Party
Logistics. Results and findings of the 14th Annual Study
Customers Satisfaction Council (1995). Customer Satisfaction Assessment Guide,
Motorola University Press
Edosomwan J. A. (1993). Customer and Market-driven Quality Management, ASQC
Quality Press, Milwaukee
Likert, R. (1932). A Technique for the Measurement of Attitudes. Archives of
Psychology, 22 (140), 1–55
Lissitz, R.W. & Green, S.B. (1975). Effect of the Number of Scale Points on Reliability:
A Monte Carlo Approach, Journal of Applied Psychology, 60, 619-27
Premarathne, W. (2012). Issues and Trends of Third Party Logistics (3PLs) Market in
Sri Lanka. Proceedings of the International Conference on Asian Studies (ICAS
2012), 26-27 July 2012, Negombo, Sri Lanka, ICRD

Sri Lanka Economic Research Conference 2020
374
THE IMPACT OF CHOCOLATE BRAND ROMANCE ON
BRAND LOYALTY (WITH SPECIAL REFERENCE TO
CHOCOLATE CONSUMPTION IN SEEDUWA AREA)
Wijesinghe U.M.D.L*, Sivashankar P., Mahaliyanaarachchi R.P.
Department of Agribusiness Management, Sabaragamuwa University of Sri Lanka *Corresponding author: [email protected]
Introduction
Modern-day consumers interact with thousands of brands during the lifetime;
however, they only develop solid attachments for few of them. Further, it is
important to note that, consumer emotions play a significant role behind these
attachments (Belaid & Temessek, 2011). The emotional bonds that consumers
foster with brands are important for marketers who want to establish long-term
relationships with their consumers (Patwardhan & Balasubramanian, 2011). The
current study is planning to explore more on new such concepts, Brand Romance
which reflects the deep emotional attachment customers have on brands which in
turn dominates customer cognition through the arousal of pleasure while using
the brand (Aron, Norman, & Aron, 1998). Patwardhan & Balasubramanian
(2011), Defines brand romance as an emotional bond on attachment; an attraction
yet to be developed into brand love and it can be explained by using three
underlying proportions, namely pleasure, arousal and dominance (Patwardhan &
Balasubramanian, 2011).
Despite the importance as far as authors’ knowledge is concerned, there are no
studies done in Sri Lanka enquiring the impact of brand emotions on repeat
purchase intention in FMCG food product brands. Therefore the main objective
in the current research is to investigating impact of brand romance on brand
loyalty. Here the study will also be planning to examine the impact of sub
variables of brand romance; namely brand arousal, brand pleasure and brand
dominance on brand loyalty.
Research problem
Brand romance concept in marketing, is industries getting to involve with the
emotional attachment with the consumers (Aydin & Zehir, 2017). Except for the
food industry, all the industry such as auto-mobile, cell phone used this tool to
increase their brand loyalty underlying three dimensions (Petzer, Mostert, &
Kruger, 2014). But in the food industry, they are not seeking very much on brand

Strategic Marketing for Growth
375
romance when they assessing brand loyalty. So this study illustrates whether that
underlying dimensions of brand romance impact on brand loyalty or not in
chocolate industry. And also this study focuses on three basic research questions
such as does the brand arousal, brand pleasure and brand dominance impact on
brand loyalty respectively.
Research Methods
As the research methodology, descriptive research method was selected and to
examine the objectives, survey was employed as the research instrument.
Because of the resources limitation and Covid-19 pandemic situation in country,
Undergraduates in universities were selected as the sample of the study. There
was no documentary evidence suggesting that geographical differences of buyers
influencing emotional perception on brands, thus authors do not believe that
selecting respondents from one area will impact the results (Vidhanapathirana &
Sirisena, 2019). Therefore 180 respondents who were 18 years and older
undergraduates were included and a convenience sampling technique was
selected. The primary data of the study collected using online self-administrated
questionnaire and data were analyzed via SPSS software version 21.0 and AMOS
software.
Research Hypothesis
We conceive brand romance using three underlying dimensions, namely brand
pleasure, brand arousal and brand dominance, according to our research. To be
verified by the analysis, we created the following hypothesis.
H1: Brand pleasure significantly impact the brand loyalty
H2: Brand arousal significantly impact the brand loyalty
H3: Brand dominance significantly impact the brand loyalty
Results and Discussion
A coefficient of 0.7 and higher indicates adequate reliability of internal
consistency that enables the measurement of an overall mean score for the
dimension (Pallant, 2007). In this study, all parameters displayed an alpha
coefficient of Cronbach greater than 0.7, indicating the durability of internal
consistency by all dimensions involved.

Sri Lanka Economic Research Conference 2020
376
With respect to age groups in study, 32.8% were in the age group of 18-25 years,
48.9% were between 26-35 ages category. The sample consisted of more males
representations (64.4%) than females (35.6%).
Table 1: Values of the variables in the path model
Variable β Mean R2 EV α Conclusion
Brand Pleasure
I love this brand
Using this brand gives me
great pleasure
0.88 2.18 1.130 0.24 *** Supported
0.87 2.28 1.105 0.26 **
*
Supported
I am really happy that this
brand is available
0.86 2.25 1.175 0.32 **
*
Supported
This brand do not
disappoints me
0.74 2.36 1.000 0.53 **
*
Supported
Brand Arousal
I am attracted to this brand 0.82 2.45 1.166 0.40 **
*
Supported
I desire this brand 0.86 2.31 1.084 0.26 **
*
Supported
I want this brand 0.87 2.38 1.103 0.25 **
*
Supported
I look forward to using this
brand
0.81 2.32 1.000 0.33 **
*
Supported
Brand Dominance
This brand often controls
my thoughts
0.59 2.98 0.816 0.86 **
*
Supported
This brand only brings
positive feelings into my
mind when making
purchase decisions
0.74 2.67 0.985 0.54 **
*
Supported
This always seems to be on
my mind
0.76 2.58 1.000 0.49 **
*
Supported
Brand Loyalty
I consider myself loyal to
this brand
0.63 2.50 0.866 0.45 **
*
Supported
Source: Authors (2020)
Notes: β=Standardized parameter estimates, R2= Regression weight EV= Error variance,
α=Statistical significance level, ***Path analysis is significant at the .001 level

Strategic Marketing for Growth
377
There are 161 respondents (89.4 %) in unmarried group and 19 respondents
(10.6 %) in married group in the sample, giving a total of 180 respondents. More
than half of the respondents represent (60%) below Rs.10,000 income as their
income group. The survey also shows that nearly half of the respondent’s most
preferred chocolate brand was Ritzbury (46.7%) and 35 (19.4%) respondents
liked Kandos as preferred chocolate brand.
Chi-square / degrees of freedom (χ2 /df), goodness-of - fit fit index (GFI),
adjusted goodness-of - fit index (AGFI), normed fit index (NFI), comparative fit
index (CFI), and root mean square of approximation ( RMSEA) were used to
determine SEM fitness. All effects of the structural model fitting indexes of the
model which shows that the associated model will match the research problem
according to the absolute, relative and simple fitting indexes. The standard
values, mean values, R2 values, and error variance of the parameters are shown
in Table 1 above. At the 0.05 level of significance, standardized regression
effects were significant.
Brand pleasure describes brand loyalty at a frequency of -0.52, brand arousal at
a frequency of 0.60 and brand dominance at a frequency of 0.68, as shown in
Table 1. The brand pleasure served as no relationships with brand loyalty (H1:
β =- 0.52, EV = 0.64, α >0.001). Brand arousal was not adequate to keep brand
loyalty in the mind of the customer. (H2: β = 0.60, EV = 0.62, α > 0.001), but
brand dominance was impacted on brand loyalty (H3: β= 0.68, EV=0.68, α <
0.001) consistent with (Aydin & Zehir, 2017). This outcome reveals the
predicted impacts of the variables found in the model that are substantially
accepted by H3 and rejected by H1 and H2. Rather than brand pleasure and brand
arousal, brand dominance is the only a factor that shows a positive impact on
brand loyalty (α < 0.001). Although brand pleasure and brand arousal do not
impact on brand loyalty, brand dominance of brand romance impact on brand
loyalty.
Conclusion
Fostering brand loyalty for chocolate brand marketers is a difficult job when
buyers have multiple brands of chocolate items to choose from. However, Study
indicate that consumers have strong relationship of consumer-brand engagement
or involvement. That means consumers point out that particular chocolate product
often controls their thoughts, particular brand only brings positive feelings into
their mind when they making purchase decisions and particular brand always
seems to be on their mind. As the brand dominance is the best predictor of brand

Sri Lanka Economic Research Conference 2020
378
loyalty, marketers in food industry must aim to improve the brand romance of
customers to build a loyal customer of the brand.
Keywords: Brand arousal; Brand dominance; Brand pleasure; Brand romance;
Chocolate brand
References
Aron, A., Norman, C. C., & Aron, E. N. (1998). The self-expansion model and motivation.
Representative Research in Social Psychology, 22, 1-13.
Aydin, H., & Zehir, C. (2017). What type relationship do we have with our brands? is the
name of this relationship brand romance? International Review of Management
and Marketing, 7, 272-283.
Belaid, S., & Temessek, B. A. (2011). The role of attachment in building consumer-
brand relationships; an empirical investigation in the utilitarian consumption
context. Journal of Product & Brand Management, 20(1), 37-47.
Depatment of Census. (2012). Census of Population and Housing of Sri Lanka,2012.
Retrieved September 01, 2020, from http://www.statistics.gov.lk
MacCallum, R. C., Browne, M. W., & Cai, L. (2006). Testing differences between nested
covariance structure models: power analysis and null hypotheses. PubMed,
11(1), 19-35.
Pallant, J. (2007). SPSS Survival Manual- A Step by Step Guide to Data Analysis using
SPSS for Windows (3rd ed.). New York: McGraw-Hill Education.
Patwardhan, H., & Balasubramanian, S. K. (2011). Brand romance: A complementary
approach to explain emotional attachment toward brands. Journal of Product and
Brand Management, 20(4), 297-308.
Petzer, D., Mostert, P., & Kruger, L.-m. (2014). The Dimensions of Brand Romance as
Predictors of Brand Loyalty Among Cell Phone Users. Economic and
Management Sciences, 4(17), 457-470.
Vidhanapathirana, L.P; Sirisena A.B. (2019). Is Brand Romance a Decent Predictor of
Brand Loyalty? Evidence form Sri Lankan Automobile Market. 8th International
Conference on Management and Economics (pp. 607-621). Matara: Faculty of
Management and Finance, University of Ruhuna.

Strategic Marketing for Growth
379
CONSUMER WILLINGNESS TO ADOPT ONLINE
GROCERY SHOPPING: EVIDENCE FROM KANDY
DISTRICT
Hettige A.S*, Sivashankar. P., Mahaliyanaarachchi R.P.
Department of Agribusiness Management, Sabaragamuwa University of Sri Lanka. *Corresponding author: [email protected]
Introduction
Grocery products include not only edible commodities such as perishable
products (examples: fruits, vegetables, meat) and durable eatables (examples:
canned and packaged food) but also non-food goods such as household
appliances that are purchased often or continuously, usually at regular intervals
of time. Groceries are different from many other products that are commonly
purchased online. Therefore, the buying decision of consumers regarding
groceries is greatly affected by the sense of touch, smell, and sight. Online
grocery shopping (OGS) looks promising when compared to other products
available online but it faces different challenges of its own for its buyers as well
as sellers. Some standardized goods are generally considered more successfully
sold on the Internet (e.g. clothes, computer appliances, books), whereas products
like groceries are still not widely popular among online consumers (Klepek et al.,
2020). Therefore, some concerns arose as to whether the Internet is a suitable
mode for purchasing all kinds of products. Worldwide, Internet grocery
purchases are still low compared to the general online sales such as clothes and
sports goods (Rishi et al., 2018).
Hence, for the development of online grocery, grocery retailers need to
understand what factors are influencing consumers to adopt and use the online
channel (Saleem et al., 2018). In the Sri Lankan context, consumers are actively
engaging with online shopping but the uptake of OGS has been slower than
anticipated. Even though online grocery shopping is a potent industry in Sri
Lanka, the uptake of online grocery shopping has been slower than anticipated.
Thus, to further facilitate the adoption of online grocery, it is crucial to explain
the factors that influence buyers towards the purchase of grocery products online
(Pauzi et al., 2017).
There is less attention has been given to the factors that influence customers’
willingness to adopt it. Therefore, it is timely important to study the customers’

Sri Lanka Economic Research Conference 2020
380
willingness to adopt online grocery shopping in Sri Lanka and the factors which
influence them. The problem, this research aims to investigate is the factors that
are affecting customers’ willingness to adopt online grocery shopping.
This research aims at identifying the key factors that affect the consumer’s
willingness to adopt online grocery shopping and what are their current attitudes
towards this concept. Furthermore, the research aims to identify the concerns of
consumers that need to be catered to increase online grocery shopping
adaptability. This study lays out consumer willingness towards online grocery
shopping and in practice; the findings of this study can be employed by online
retailers to formulate more effective strategies in encouraging consumers to adopt
online grocery shopping.
Research hypothesis
This study focuses on six major aspects: grocery price concessions, grocery
quality, web site quality, convenience, prior online shopping experience and
perceived risk. The two factors price concessions and grocery quality are
implicitly related to the key variable perceived usefulness, while the web quality
reflects the perceived ease of use in the TAM.
H1: Grocery price concessions have a positive impact on willingness to adopt
OGS.
H2: Grocery quality has a positive impact on willingness to adopt OGS.
H3: Website quality will positively affect the consumer’s willingness to adopt
OGS.
H4: Convenience has a positive impact on willingness to adopt OGS.
H5: Perceived risk will negatively affect consumers’ willingness to adopt
OGS.
H6: Prior online shopping experience has a positive impact on willingness to
adopt OGS.
Research Method
The research targeted the sample population of consumers drawn from Kandy
District, who may have or may not have any previous experience of online
grocery shopping. The sample size for the study was 120 individuals who are
aged 18 years or above. Data were collected primarily using questionnaire
technique in the form of a self-administered online (web-based) questionnaire.
The collected data was analyzed using the Statistical Package for the Social

Strategic Marketing for Growth
381
Sciences (SPSS). The causal and effect structure of the proposed conceptual
framework was tested using Structural Equation Modeling (SEM).
Findings
Assessing reliability of variables
To assess the internal consistency, the reliability of the scales was used to
measure the various dimensions of factors affecting consumer willingness
(Cronbach’s alpha = 0.935 for 24 items in total).
Structural model
SEM integrates a number of different multivariate techniques such as factor
analysis and regression, into one fitting framework. The fitness of the SEM was
assessed in according to Scott, 1995. According to the results degrees of freedom
(x2/df) of the model is 1.690 and root mean square of approximation (RMSEA)
is 0.076, so both are in the acceptable range.
Relative fitting indexes namely Normed Fit Index (NFI), Comparative Fit Index
(CFI), Incremental Fit Index (IFI), and Relative Fit Index (RFI) were also can be
accepted. Parsimony-Adjusted Measures Index (PNFI) is 0.681, which is also in
the acceptable range.
Table 1: Correlation analysis
Source: Authors’ estimation
Variable Correlation P Relationship
Price concessions → Product quality 0.70 *** Strong positive
Price concessions → Website quality -0.70 0.055 Strong negative
Price concessions → Convenience 0.70 *** Strong positive
Price concessions → Perceived risk 0.66 *** Moderately positive
Product quality → Website quality -0.89 0.042 Strong negative
Product quality → Convenience 0.86 *** Strong positive
Product quality → Perceived risk 0.82 *** Strong positive
Website quality → Convenience -0.86 0.034 Strong negative
Website quality → Perceived risk -0.86 0.035 Strong negative
Convenience → Perceived risk 0.76 *** Strong positive

Sri Lanka Economic Research Conference 2020
382
The correlation analysis is focused on analyzing the correlation between the latent
variables to provide a foundation for exploring the causal relationship in the
structural model. The casual relationship between the latent variables is
meaningful if the correlation is strong. As shown in Table 1 above, we can see
that the correlational relationship between all variables is more than 0.60. It
explained that the variables have strong relationships between them. These
quantitative results are highly consistent with the results presented with the SEM
technique.
As shown in Table 2, willingness to adopt was explained by price concessions at
a rate of 0.66, product quality at a rate of 0.89, web site quality at a rate of 0.47,
convenience at a rate of -0.05, perceived risk at a rate of 0.30 and prior experience
at a rate of 0.02. This result indicates the estimated influences of the variables
contained in the model. It is clear that no influences are significant; therefore, H1,
H2, H3, H4, H5 and H6 are rejected.
Table 2: Impact of difference factors on willingness to adopt
Variable β Mean R2 EV α Conclusion
H1 PC→
Willingness
-0.017 0.29 -0.029 0.29 0.924 Rejected
H2 PQ→
Willingness
-0.002 0.30 -0.004 0.30 0.995 Rejected
H3 WQ→
Willingness
0.470 0.05 1.969 0.05 0.304 Rejected
H4 Convenience
→ Willingness
-0.046 0.83 -0.047 0.83 0.859 Rejected
H5 PR→
Willingness
0.298 1.00 0.276 1.00 0.212 Rejected
H6 PE→
Willingness
0.025 1.11 0.073 0.10 0.781 Rejected
Notes: β=Standardized parameter estimates, EV= Error variance, α=Statistical
significance level, PC = Price concessions, PQ= Product quality, WQ= Web site
quality, PR= Perceived risk, PE= Prior experience, ** Path analysis is significant at
the .001 level
Source: Authors’ estimation

Strategic Marketing for Growth
383
Conclusion
The purpose of the paper was to investigate the factors that may affect consumer
willingness to adopt online grocery shopping. The findings of the study have
demonstrated the applicability of the Technology Acceptance Model and
Perceived Risk Theory in assessing the willingness to adopt online grocery
shopping in Sri Lanka. As can be summarized, this study tried to explore the
factors, which could possibly influence consumers’ online purchasing intention
in grocery the industry, and relevant factors are listed to be analyzed. Factors
include grocery price concessions, grocery quality, web site quality, perceived
risk, convenience, and prior online shopping experience combined with the
previous literature.
As the results showed, there is no significant relationship between consumer
willingness to adopt online grocery shopping and the above-mentioned factors. It
means those mentioned factors do not affect consumer willingness. The results
differed from previous research results that are conducted about online grocery
shopping. However, there is only a limited number of research on consumer
willingness to adopt online grocery shopping in Sri Lankan context. Therefore, it
is difficult to compare the results of this study with the previous studies. As
buying groceries online is a new and growing trend in Sri Lanka, this study can
be used as a basis for e-grocer retailers to replicate the findings on a large
population, and improve their business within online grocery.
Keywords: Online grocery shopping; Structural equation model; Technology
acceptance model
References
Klepek, M. and Bauerová, R., 2020. Why do retail customers hesitate for shopping
grocery online?. Technological and Economic Development of Economy, 26(6),
pp.1444-1462.
Pauzi, S.F.F., Thoo, A.C., Tan, L.C., Muharam, F.M. and Talib, N.A., 2017, June. Factors
influencing consumers intention for online grocery shopping–a proposed
framework. In IOP Conference Series: Materials Science and Engineering (Vol.
215, No. 1, p. 012013).
Rishi, B., Pradeep, H. and Vishwanathan, M., 2018. Hesitation to adoption in the e-
grocery retailing in an emerging market. International Journal of Business
Innovation and Research, 15(1), pp.99-118.

Sri Lanka Economic Research Conference 2020
384
Saleem, M., Khan, M.M., Ahmed, M.E., Neha Shah, S.A. and Surti, S.R., 2018. Online
grocery shopping and consumer perception: a case of Karachi market in Pakistan.
Journal of Internet and e-Business studies, 1, pp.1-13.
Scott, J., 1995. The measurement of information systems effectiveness. ACM SIGMIS
Database, 26(1), pp.43-61.

Strategic Marketing for Growth
385
SOCIAL MARKETING CONCEPT WITHIN THE SOCIAL
ENTREPRENEURSHIP RESEARCH CONTEXT: A
SYSTEMATIC LITERATURE REVIEW
Fernando, P.I.N.*, Jayawardhana, K., Siyambalapitiya, J.
Department of Management Sciences, Uva Wellassa University of Sri Lanka *Corresponding author: [email protected]
Introduction
Entrepreneurship is highly regarded as a significant basis for gaining competitive
advantage and one of the crucial factors in the economic development and the
contentment of societies. It’s about taking the first step which carries the whole
world into something revolutionary. However, social entrepreneurship that
centers on social value creation instead of merely focusing on financial value
creation has become an innovative and emerging concept under entrepreneurship.
In light of this, social entrepreneurship is a hybrid model that combines for -profit
and non-profit actions that bleared the traditional boundaries among the public,
private, and nonprofit categories while providing solutions for societal issues
with innovative solutions as a response exactly to the societal problems is the
social entrepreneur (Choi & Majumdar , 2014). Indeed, a social entrepreneur who
recognizes a business opportunity by providing an innovative way to overcome a
specific social issue is considered as a key to entrepreneurship. The package of
“charity and business” at same, will lead to social enterprises that become
prominent economic and social contributors towards the growth of the country.
Social entrepreneurship provides a framework for all businesses to have their way
of success while supporting the whole community. Moreover, generating job
opportunities, tackling poverty, sustaining social services, and resolving many
environmental issues are a few contributions of social entrepreneurship
(Gunawardena & Mudalige, 2019). The innovative ideas and new business
strategies motivate social entrepreneurs to resolve the problems namely; poverty,
corruption, limited access to education, clean water, finance, and health care
while getting the maximum use of scarce resources (Abeysekara, 2019). The use
of both entrepreneurial and business skills in reaching the double bottom line,
economic and social, are encouraged social entrepreneurs to be flourished within
the country. Thus, the motto of “do well by doing good” directs social
entrepreneurship towards “make the world a better place”.

Sri Lanka Economic Research Conference 2020
386
Most likely, social enterprises are limited in their marketing strategies to the
products and services which they offer. Nevertheless, the marketing framework
can be applied to address several social issues, and applications of marketing
principles for the good of society have led to emerging the concept of “social
marketing”. Consequently, social marketing plays a vital role in the success of
social entrepreneurship.
Social marketing gives its focus on changing the behaviors of the consumers to
the benefit of the consumer and/or to the community at large (Kotler & Lee,
2008). The application of marketing concepts to social problems which develops
a framework of building innovative answers to societal issues is social marketing
(Lefebvre, 2013). Social marketing surrounds all the activities of traditional
marketing which enable the process of exchange including customer focus,
situational analysis, market research, segmentation, target marketing, 4 Ps
strategies, and implementation of marketing strategies (Kotler & Lee, 2008).
Both commercial and social marketing is focused on the change in consumer
behavior but, commercial marketing concerns the change in consumer behavior
for the benefit of the company and stakeholders while social marketing concerns
the change in the consumer behavior in terms of benefitting both individual and
society (Kotler & Lee, 2008). Accordingly, commercial marketing targets the
increase in profits by encouraging the purchase of goods while social marketing
concerns the adoption of new behaviors by changing the existing behaviors which
will benefit both the individual and society. The ultimate target of social
marketing is working for the betterment of society rather than focusing only on
generating profits.
Marketing scholars have revealed social marketing is an effective and efficient
concept that influences consumer behavior and society (Beall et al., 2012).
Nevertheless, social marketing must concern the ultimate impact and the
processes of social marketing campaigns to fully realize the opportunities.
However, social marketers could able to influence the acceptability of social
ideas through developing, implementing, and controlling social marketing
programs with the involvement of 4Ps, and marketing research (Kotler &
Zaltman, 1971). The social marketing concept will offer benefits to the society,
environment, and businesses and it encourages the introduction of innovative
products that contribute towards the betterment of the whole society in the long
run while satisfying the consumers. Consequently, social entrepreneurship and
social marketing is closely link and social marketing would able to assist the
social entrepreneurs in becoming more successful.

Strategic Marketing for Growth
387
Research objective
Therefore, the principal objective of this paper has been to systemize and
organize the contemporary knowledge on social marketing from the social
enterprise research context to spot the knowledge spaces which will be
immeasurably sensible for future studies.
Research method
Researchers conduct a systemic literature review to achieve our aforementioned
objective (Gupta et al., 2020; Hota et al., 2019) since the approach led to observe
diverse themes within the social marketing concept and to reflect on the missing
links to future researchers. In that context; (a) Citation analysis, and (b) Thematic
analysis has been conducted to discover core themes within the context of social
marketing. Research articles were selected from well-reputed databases such as
Web of Science, Social Science Citation Index as well as Google Scholar
databases during the period of September-November 2020.
Findings and Discussion
Among the research database, 112 research articles have been analyzed
thematically based on the social marketing perspective within the social
entrepreneurship context. Thematic analysis was conducted to evaluate how the
research on social marketing has been evolved with the social entrepreneurship
context. Accordingly, identified that the concept has been intensively researched
and evolved based on 5 parent themes and sub-themes and illustrate in Table 1:
Table 1 : Thematic analysis
Parent Theme Sub-theme
Issues within the social marketing
context
Issues within the social marketing context
Social marketing and behavioural change
Social Marketing strategies Innovation and communication within social
marketing
Retail marketing and social response
Social marketing and organization Profit orientation and social marketing
Non-profit orientation and social marketing
Social enterprise dualities Role of the social marketing
Implications of the social marketing Practical implications within the social
marketing context
Source: Author’s estimation

Sri Lanka Economic Research Conference 2020
388
The identified five parent themes have been elaborated by the authors
comprehensively as follows;
Theme 1: Issues within the social marketing context
Social marketing with the issues, challenges and barriers has been immensely
studied by scholars (Deshapande, 2019; Pechmann, 2002; Bloom & Noveli,
1981) and the behavioral change has been addressed further by Gordon et al.
(2010) within the context , we identified several studies with a SWOT analysis
where the social marketing has identified deeply within the contemporary
challenges.
Theme 2: Social Marketing strategies
Among the research context, social marketing strategies recognized as a popular
segment whereas scholars identified different strategies, communicative,
innovative and market oriented within the social enterprises (Corner & Randall,
2011; Gordonet al., 2013; Brodie et al., 2008).
Theme 3 : Social marketing and organization
Organizational context within the social marketing could be considered as an
effective research area , where as many scholars enriched the literature by two
organizational context , both profit-oriented (Howard, et al., 2003; Peattie &
Peattie, 2009; Dinan & Sargeant, 2000) and Non-profit oriented (Smith et al.,
2010; Ling et al., 1992).
Theme 4 : Social enterprise dualities and Theme 5 : Implications of the social
marketing
Further, scholars have addressed the dual nature of the social enterprises
(Andreasen, 2002; Malibach, 1993) whereas the implications of the social
marketing were investigated (Shive & Morris, 2006). Within the context of social
marketing, both commercial and social objectives are focused on the change in
consumer behavior. Despite the focus, commercial marketing moreover concerns
the company and stakeholders’ benefits, while social marketing concerns both
the individual and society benefits (Kotler & Lee, 2008). Accordingly, social
marketing concerns the adoption of new behaviors by changing the existing
patterns within the organizational context, which benefits society in long run.
Therefore, the ultimate target of social marketing strives to achieve the objectives
of society and long run economic prosperity.

Strategic Marketing for Growth
389
Conclusion
At present socio-economic development, investigations on social enterprises are
getting popular among the business research agenda. Moreover, the concept of
Social marketing will offer benefits to the society, environment, and businesses
while encouraging an innovative approach to social enterprises. Therefore, the
paper intended to critically review the extant literature on social marketing within
social entrepreneurship, whereas 112 research papers were reviewed and
thematically analyzed. The authors identified five parent themes on which social
marketing has been researched in the social entrepreneurship context. Authors
intended to enrich the knowledge-base by exploring the themes through which
social marketing has been researched and identified gaps for future researchers.
As a summary, the identified parent themes and sub-themes will enrich the
knowledge-base of the social marketing context, as an emerging research area.
References
Abeysekara, R. (2019). Social Entrepreneurship: Concepts and Research Areas. Sri
Lanka Journal of Management Studies, 1(2), 29-42.
Andreasen, A. R. (2002). Social Marketing in the Social Change Marketplace. Journal
of Public Policy & Marketing, 21(1), 3-13.
Beall, T., Wayman, J., D’Agostino, H., Liang, A., & Perellis, C. (2012). Social
marketing at a critical turning point. Journal of Social Marketing, 2(2), 103-117.
Bloom, P. N., & Noveli, W. D. (1981). Problems and challenges in social marketing.
Journal of marketing, 45(2), 79-88.
Brodie, R., Brady, M., & Domegan, C. T. (2008). "Social marketing: implications for
contemporary marketing practices classification scheme. Journal of business &
industrial marketing, 23(2), 135-141.
Choi, N., & Majumdar , S. (2014). Social entrepreneurship as an essentially contested
concept: opening a new avenue for systematic future research. Research Gate,
29(3), 363-376
Corner, A., & Randall, A. (2011). Selling climate change? The limitations of social
marketing as a strategy for climate change public engagement. Global
environmental change, 21(3), 1005-1014.
Deshapande, S. (2019). Social Marketing’s Strengths, Weaknesses, Opportunities, and
Threats (SWOT): A Commentary. Social Marketing Quarterly, 25(4), 1-12.

Sri Lanka Economic Research Conference 2020
390
Dinan, C., & Sargeant. (2000). Social Marketing and Sustainable Tourism Ðis there a
Match? International Journal of Tourism Research, 2(1), 2-14.
Gordon, R., & Moodie, C. (2009). Dead cert or long shot: the utility of social marketing
in tackling problem gambling in the UK? International Journal of Nonprofit and
Voluntary Sector Marketing, 14(3), 243-253.
Gordon, R., Russell-Bennett, R., Wood, M., & Previte, J. (2013). Fresh ideas: services
thinking for social marketing. Journal of Social Marketing, 3(3) 1-19
Gunawardena, L. H., & Mudalige, D. M. (2019). Factors affecting for growth of the
social enterprises in western province, Sri Lanka. ICBR, 2(1), 133-140
Gupta, P., Chauhan, S., Paul, J. and Jaiswal, M.P., 2020. Social entrepreneurship
research: A review and future research agenda. Journal of Business Research,
15,12-14.
Hota, P.K., Subramanian, B. and Narayanamurthy, G., 2019. Mapping the intellectual
structure of social entrepreneurship research. Journal of Business Ethics, 23, 1-26
Howard, N., Chandramohan, D., Freeman , T., Shafi, A., Rafi, M., Enayatullah, S., &
Rowland, M. (2003). "Socio-economic factors associated with the purchasing of
insecticide-treated nets in Afghanistan and their implicationsfor social marketing.
Tropical Medicine & International Health, 8(12), 1043-1050.
Kotler, P., & Lee, N. (2008). Social Marketing: Influencing Behaviors for Good. Sage
Los Angeles.
Kotler, P., & Zaltman, G. (1971). Social Marketing: An Approach To Planned Social
Change. Journal of Marketing, 3(12), 3-12.
Lefebvre, R. C. (2013). Social marketing and social change: Strategies and tools for
improving health, well-being and the environment. San Francisco: WiIley.
Ling, J. C., Franklin, B. A., Lindsteadt, J. F., & Gearon, S. A. (1992). Social Marketing:
Its Place in Public Health. Annual review of public health, 13, 341-362.
Malibach, E. (1993). Social marketing for the environment: using information
campaigns to promote environmental awareness and behavior change. Health
promotion international, 5(8), 1-17.
Peattie, K., & Peattie, S. (2009). Social marketing: A pathway to consumption
reduction? Journal of Business Research, 62, 260-268.

Strategic Marketing for Growth
391
Pechmann, C. (2002). Overview of the special issues on social marketing initiative.
Journal of Public Policy & Marketing, 21(1).
Shive, S. E., & Morris, M. N. (2006). Evaluation of the Energize Your Life! Social
Marketing Campaign. Journal of American College Health, 55(1), 33-40.
Smith, B. R., Knapp, J., Barr, T. F., Stevens, C. E., & Cannatelli, B. L. (2010). Social
Enterprises and the Timing of Conception. Journal of Nonprofit & Public Sector
Marketing, 22(2), 108-134.


